Exhibit 99.1
UNAUDITED PRO FORMA CONSOLIDATED FINANCIAL INFORMATION
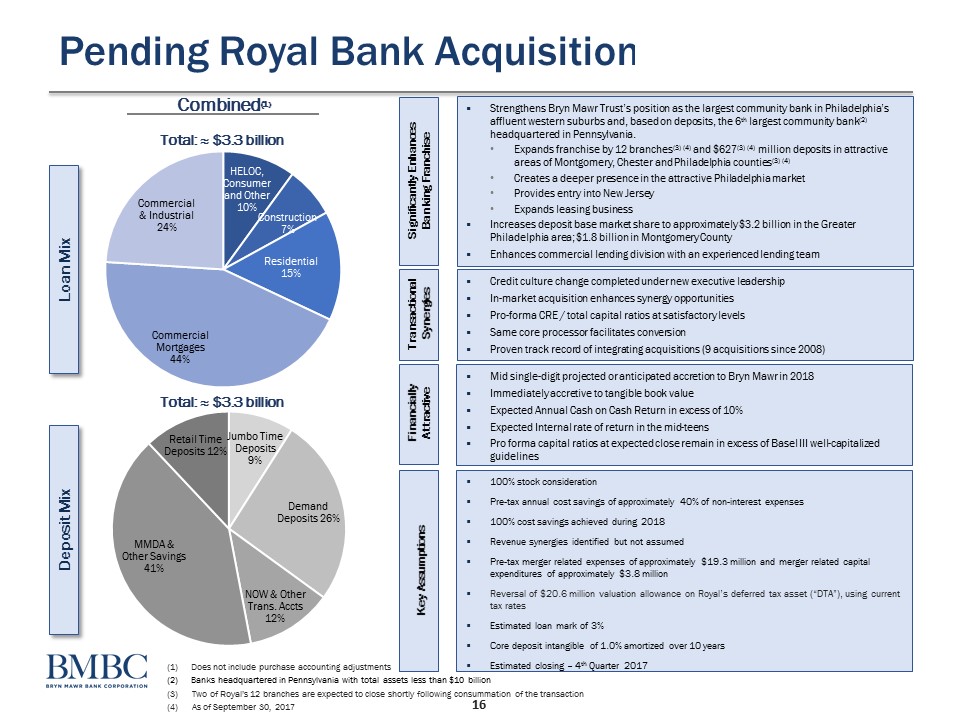
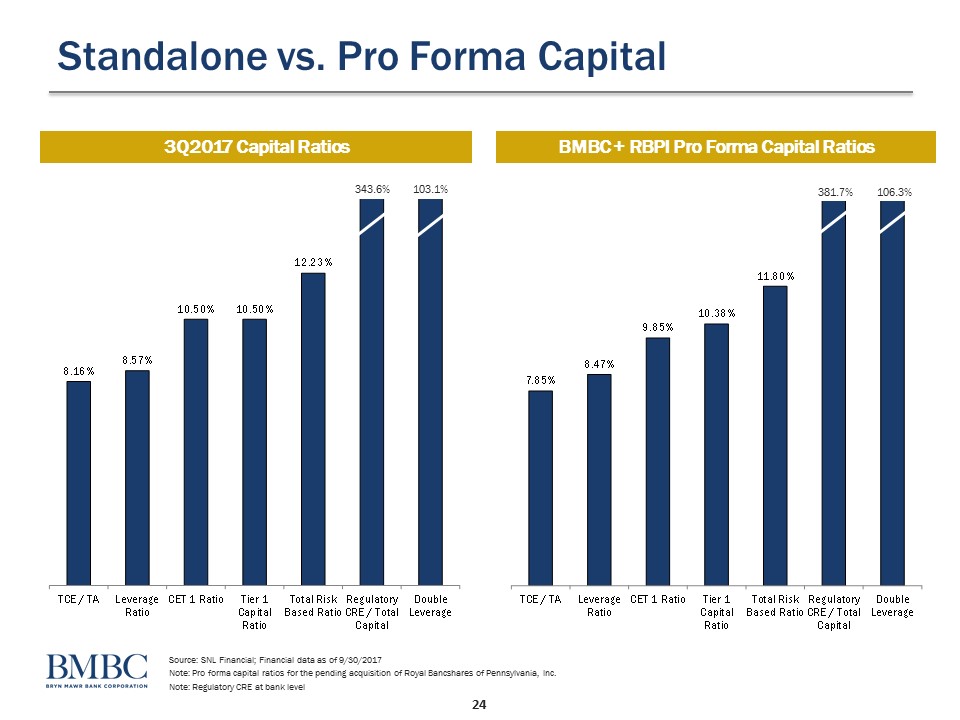
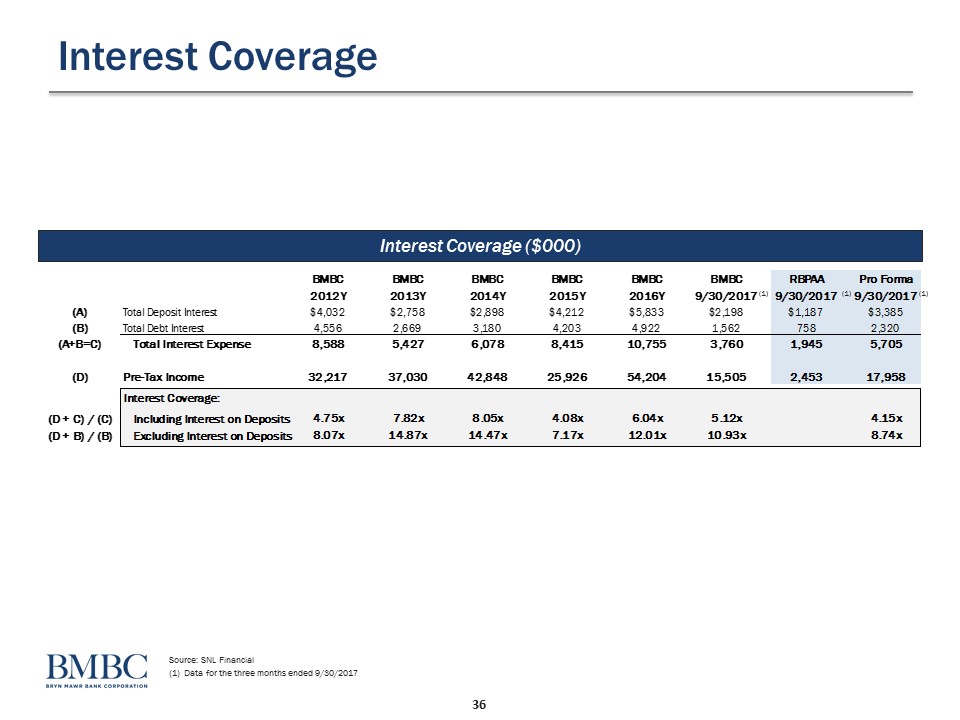
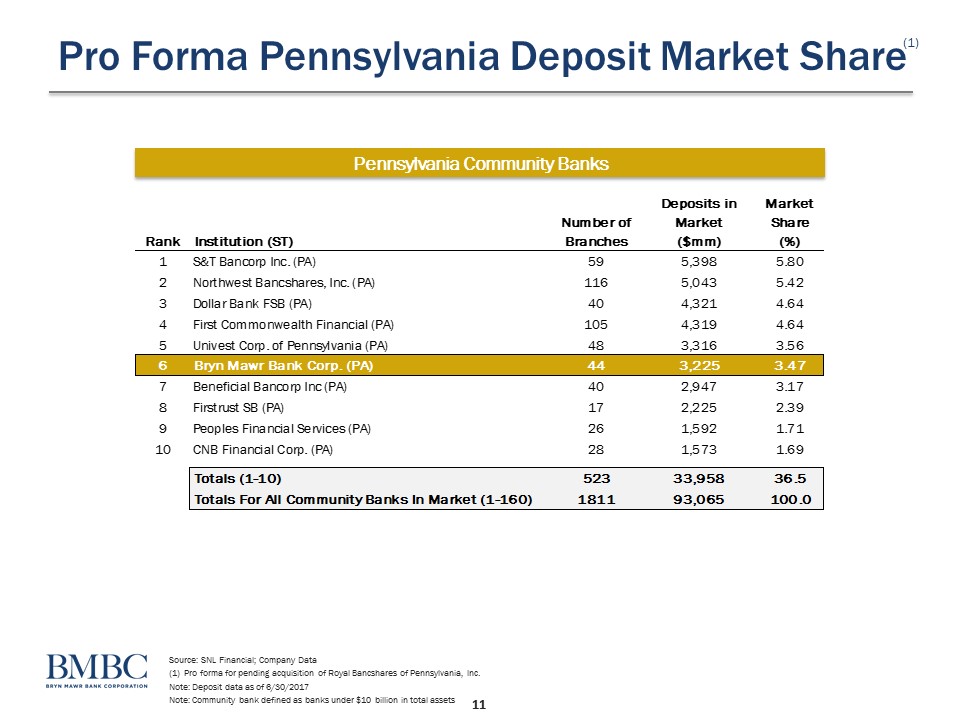
The following unaudited pro forma consolidated balance sheets combines the historical consolidated financial position of BMBC and its subsidiaries and of RBPI and its subsidiaries and as adjusted to reflect the acquisition by BMBC of RBPI using the acquisition method of accounting and giving effect to the related pro forma adjustments described in the accompanying notes. Under the acquisition method of accounting, the assets and liabilities of RBPI will be recorded by BMBC at their respective fair values as of the date the Merger is completed. The unaudited pro forma consolidated combined balance sheet gives effect to the Merger, as if the transaction had occurred on September 30, 2017.
The Merger was announced on January 31, 2017, and the Merger agreement provides that each outstanding share of RBPI Class A Stock and RBPI Class B Stock, other than shares of RBPI common stock that BMBC, its subsidiaries and RBPI’s subsidiaries hold and shares that RBPI holds as treasury shares, will become, by operation of law, the right to receive 0.1025 and 0.1179 shares of BMBC common stock, respectively. The unaudited pro forma consolidated financial information has been derived from and should be read in conjunction with the historical consolidated financial statements and the related notes of BMBC and RBPI, as filed with the SEC.
The unaudited pro forma consolidated balance sheets included herein are presented for informational purposes only and do not necessarily reflect the financial condition of the combined company had the companies actually been combined as of the date presented. The adjustments included in these unaudited pro forma consolidated balance sheets are preliminary and may be revised. The unaudited pro forma consolidated balance sheets and accompanying notes should be read in conjunction with and are qualified in their entirety by reference to the historical consolidated financial statements and related notes thereto of BMBC and RBPI, as filed with the SEC.
| | | CONSOLIDATED | | | BANK ONLY | |
(dollars in thousands) | | BMBC | | | RBPI | | | Merger Adjustment | | | Combined | | | BMT | | | RBA | | | Merger Adjustments | | | Combined | |
Assets: | | | | | | | | | | | | | | | | | | | | | | | | | | | | | | | | |
Interest-bearing deposits with banks (1) | | $ | 36,870 | | | $ | 13,333 | | | $ | (12,330 | ) | | $ | 37,873 | | | $ | 36,870 | | | $ | 13,333 | | | $ | (12,330 | ) | | $ | 37,873 | |
Investment securities - available for sale | | | 471,721 | | | | 159,794 | | | | — | | | | 631,515 | | | | 471,721 | | | | 158,787 | | | | — | | | | 630,508 | |
Investment securities - held to maturity | | | 6,255 | | | | — | | | | — | | | | 6,255 | | | | 6,255 | | | | — | | | | — | | | | 6,255 | |
Investment securities - trading | | | 4,423 | | | | — | | | | — | | | | 4,423 | | | | 3,989 | | | | — | | | | — | | | | 3,989 | |
Loans held for sale | | | 6,327 | | | | — | | | | — | | | | 6,327 | | | | 6,327 | | | | — | | | | — | | | | 6,327 | |
Portfolio Loans: | | | | | | | | | | | | | | | | | | | | | | | | | | | | | | | | |
Consumer | | | 31,306 | | | | 2,909 | | | | — | | | | 34,215 | | | | 31,306 | | | | 2,909 | | | | — | | | | 34,215 | |
Commercial and Industrial | | | 597,595 | | | | 110,861 | | | | — | | | | 708,456 | | | | 597,595 | | | | 110,861 | | | | — | | | | 708,456 | |
Commercial Mortgages | | | 1,224,571 | | | | 290,203 | | | | — | | | | 1,514,774 | | | | 1,224,571 | | | | 290,203 | | | | — | | | | 1,514,774 | |
Construction | | | 133,505 | | | | 78,389 | | | | — | | | | 211,894 | | | | 133,505 | | | | 78,389 | | | | — | | | | 211,894 | |
Tax Certificates | | | — | | | | 1,290 | | | | — | | | | 1,290 | | | | — | | | | 1,290 | | | | — | | | | 1,290 | |
Residential Mortgages | | | 422,524 | | | | 55,643 | | | | — | | | | 478,167 | | | | 422,524 | | | | 55,643 | | | | — | | | | 478,167 | |
Home equity loans & liens | | | 206,974 | | | | — | | | | — | | | | 206,974 | | | | 206,974 | | | | — | | | | — | | | | 206,974 | |
Leases | | | 60,870 | | | | 55,270 | | | | — | | | | 116,140 | | | | 60,870 | | | | 55,270 | | | | — | | | | 116,140 | |
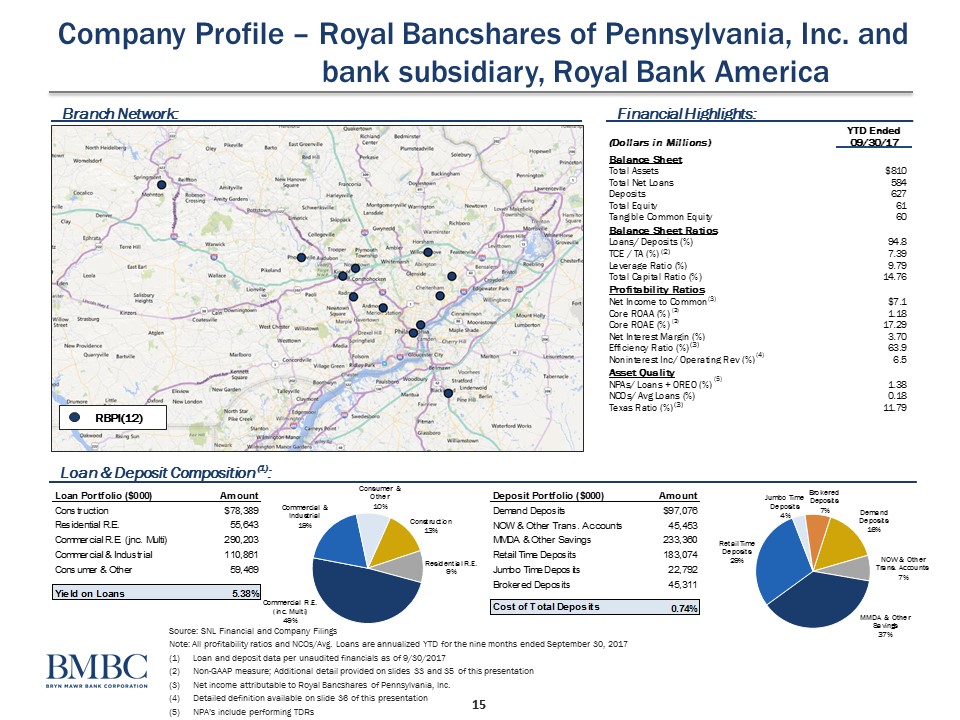
Total portfolio loans & leases (2) | | $ | 2,677,345 | | | $ | 594,565 | | | $ | (21,190 | ) | | $ | 3,250,720 | | | $ | 2,677,345 | | | $ | 594,565 | | | $ | (21,190 | ) | | $ | 3,250,720 | |
| | | | | | | | | | | | | | | | | | | | | | | | | | | | | | | | | |
Earning assets | | | 3,202,941 | | | | 767,692 | | | | (33,520 | ) | | | 3,937,113 | | | | 3,202,507 | | | | 766,685 | | | | (33,520 | ) | | | 3,935,672 | |
| | | | | | | | | | | | | | | | | | | | | | | | | | | | | | | | | |
Cash and due from banks (3) | | $ | 8,682 | | | $ | 11,775 | | | $ | (15,000 | ) | | $ | 5,457 | | | $ | 8,682 | | | $ | 7,997 | | | $ | (15,000 | ) | | $ | 1,679 | |
Allowance for loan and lease losses (4) | | | (17,004 | ) | | | (10,123 | ) | | | 10,123 | | | | (17,004 | ) | | | (17,004 | ) | | | (10,123 | ) | | | 10,123 | | | | (17,004 | ) |
Premises and equipment | | | 44,544 | | | | 4,748 | | | | — | | | | 49,292 | | | | 42,158 | | | | 4,748 | | | | — | | | | 46,906 | |
Accrued interest receivable | | | 9,287 | | | | 2,975 | | | | — | | | | 12,262 | | | | 9,287 | | | | 2,975 | | | | — | | | | 12,262 | |
Mortgage servicing rights | | | 5,732 | | | | — | | | | — | | | | 5,732 | | | | 5,732 | | | | — | | | | — | | | | 5,732 | |
Goodwill (5) | | | 107,127 | | | | — | | | | 67,647 | | | | 174,774 | | | | 97,036 | | | | — | | | | 67,647 | | | | 164,683 | |
Other intangible assets (6) | | | 21,407 | | | | — | | | | 3,863 | | | | 25,270 | | | | 24,672 | | | | — | | | | 3,863 | | | | 28,535 | |
BOLI | | | 39,881 | | | | 16,459 | | | | — | | | | 56,340 | | | | 39,881 | | | | 16,459 | | | | — | | | | 56,340 | |
FHLB stock | | | 16,248 | | | | — | | | | — | | | | 16,248 | | | | 16,248 | | | | — | | | | — | | | | 16,248 | |
Deferred income taxes (7) | | | 9,646 | | | | 7,426 | | | | 12,859 | | | | 29,931 | | | | 9,528 | | | | 7,426 | | | | 15,484 | | | | 32,438 | |
Other investments | | | 8,941 | | | | — | | | | — | | | | 8,941 | | | | 8,555 | | | | — | | | | — | | | | 8,555 | |
Other assets (8) | | | 19,389 | | | | 8,882 | | | | (1,000 | ) | | | 27,271 | | | | 12,715 | | | | 9,001 | | | | (1,000 | ) | | | 20,716 | |
Total assets | | $ | 3,476,821 | | | $ | 809,834 | | | $ | 44,972 | | | $ | 4,331,627 | | | $ | 3,459,997 | | | $ | 805,168 | | | $ | 47,597 | | | $ | 4,312,762 | |
| | | | | | | | | | | | | | | | | | | | | | | | | | | | | | | | | |
Liabilities and shareholder equity: | | | | | | | | | | | | | | | | | | | | | | | | | | | | | |
Interest-bearing deposits: | | | | | | | | | | | | | | | | | | | | | | | | | | | | | | | | |
Now and money market | | $ | 1,115,996 | | | $ | 196,999 | | | $ | — | | | $ | 1,312,995 | | | $ | 1,115,996 | | | $ | 196,999 | | | $ | — | | | $ | 1,312,995 | |
Savings deposits | | | 264,273 | | | | 81,814 | | | | — | | | | 346,087 | | | | 264,273 | | | | 81,814 | | | | — | | | | 346,087 | |
Wholesale non-maturity | | | 48,620 | | | | — | | | | — | | | | 48,620 | | | | 48,620 | | | | — | | | | — | | | | 48,620 | |
Wholesale time | | | 178,610 | | | | — | | | | — | | | | 178,610 | | | | 178,610 | | | | — | | | | — | | | | 178,610 | |
Retail time deposits (9) | | | 316,068 | | | | 251,177 | | | | 5,376 | | | | 572,621 | | | | 316,068 | | | | 251,177 | | | | 5,376 | | | | 572,621 | |
Total interest-bearing deposits | | $ | 1,923,567 | | | $ | 529,990 | | | $ | 5,376 | | | $ | 2,458,933 | | | $ | 1,923,567 | | | $ | 529,990 | | | $ | 5,376 | | | $ | 2,458,933 | |
Noninterest-bearing deposits | | | 760,614 | | | | 97,076 | | | | — | | | | 857,690 | | | | 779,853 | | | | 98,592 | | | | — | | | | 878,445 | |
Total deposits | | $ | 2,684,181 | | | $ | 627,066 | | | $ | 5,376 | | | $ | 3,316,623 | | | $ | 2,703,420 | | | $ | 628,582 | | | $ | 5,376 | | | $ | 3,337,378 | |
Short-term borrowings | | | 180,874 | | | | 15,000 | | | | — | | | | 195,874 | | | | 180,874 | | | | 15,000 | | | | — | | | | 195,874 | |
Long-term FHLB advances and other borrowings | | | 134,651 | | | | 60,000 | | | | — | | | | 194,651 | | | | 134,651 | | | | 60,000 | | | | — | | | | 194,651 | |
Subordinated notes (10) | | | 29,573 | | | | 25,774 | | | | (7,500 | ) | | | 47,847 | | | | — | | | | — | | | | — | | | | — | |
Other liabilities and Accrued Interest Payable (3) | | | 45,650 | | | | 21,419 | | | | (15,000 | ) | | | 52,069 | | | | 42,620 | | | | 21,195 | | | | (15,000 | ) | | | 48,815 | |
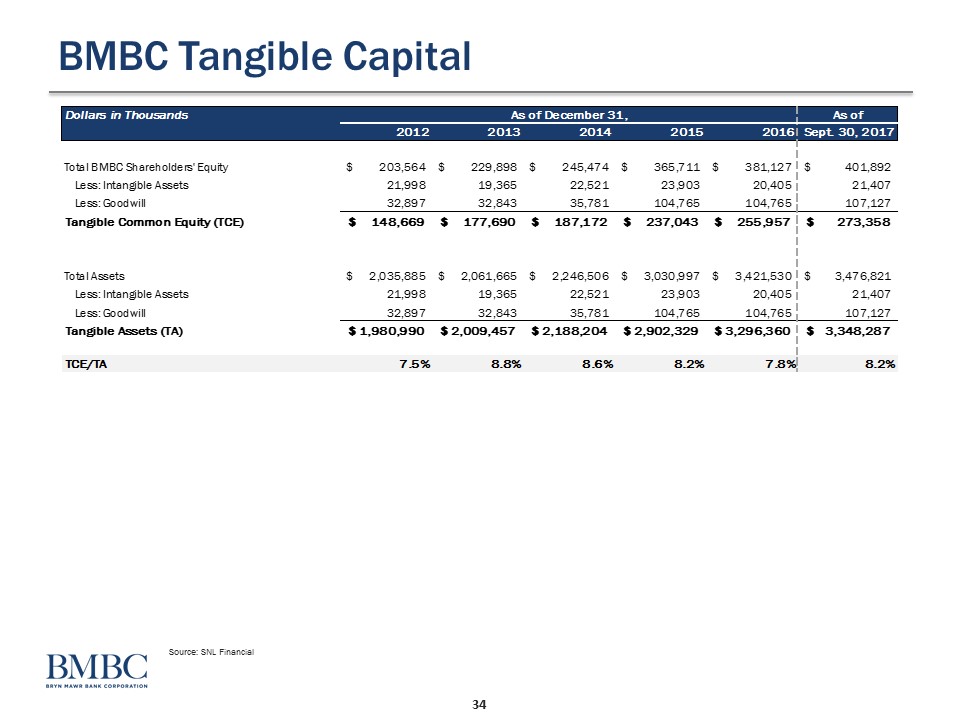
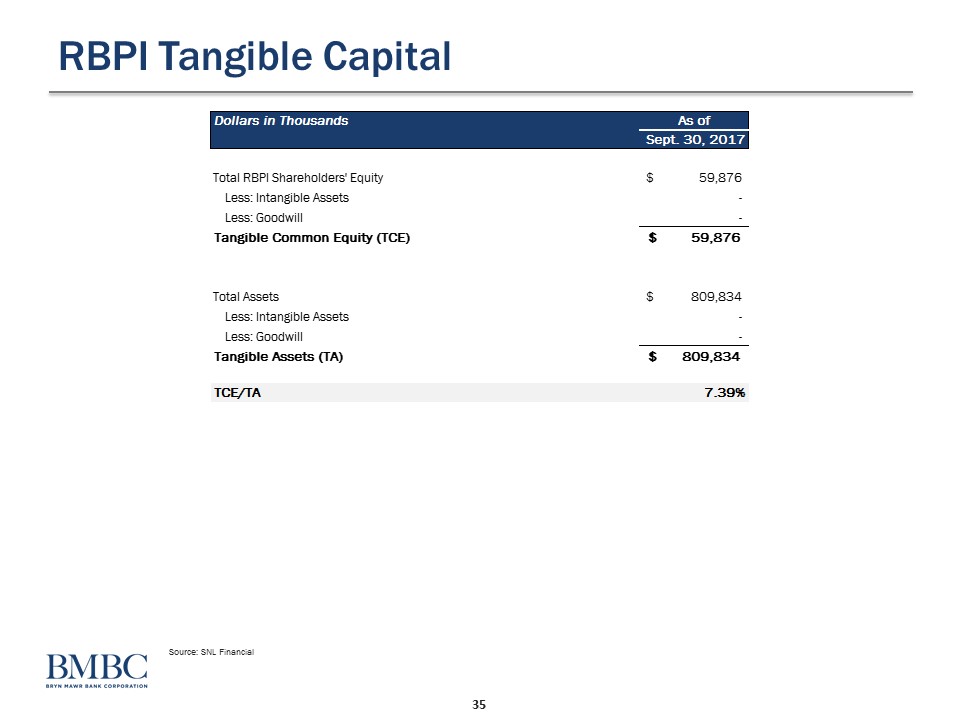
Shareholder equity (11) | | | 401,892 | | | | 59,876 | | | | 62,795 | | | | 524,563 | | | | 398,432 | | | | 79,692 | | | | 57,920 | | | | 536,044 | |
Non-controlling interest (12) | | | — | | | | 699 | | | | (699 | ) | | | — | | | | — | | | | 699 | | | | (699 | ) | | | — | |
Total liabilities and shareholder equity | | $ | 3,476,821 | | | $ | 809,834 | | | $ | 44,972 | | | $ | 4,331,627 | | | $ | 3,459,997 | | | $ | 805,168 | | | $ | 47,597 | | | $ | 4,312,762 | |
Footnote | | NOTES TO UNAUDITED PRO FORMA COMBINED BALANCE SHEETS | |
| | | |
(1) | | Adjustment reflects a $12.3 million estimate (net of income tax expense) of one-time merger costs. |
(2) | | The $21.2 million reduces the carrying value of acquired loans to their fair value. |
(3) | | Adjustment reflects a $15.0 million cash payment to fully fund and settle the Supplemental Executive Retirement Plan ("SERP") at closing. |
(4) | | In accordance with acquisition method of accounting, RBPI’s $10.1 million allowance for loan losses has been reversed. |
(5) | | The $67.6 million acquisition method accounting adjustment represents the difference between the fair value of all assets and liabilities acquired and the implied purchase consideration. |
(6) | | The $3.9 million adjustment is the establishment of a core deposit intangible ("CDI") which estimates the fair value of RBPI’s core deposit base, comprised of non-maturity deposits, and is amortized through the earnings over a ten-year period. |
(7) | | Adjustment represents the reversal of a portion of the reserve placed against a deferred tax asset associated with a net operating loss which will be partially realizable by BMBC and a net deferred tax asset related to fair value adjustments of loans, core deposit intangible, OREO, time deposits, borrowings, and subordinated debt. |
(8) | | The $1.0 million reduces the carrying value of acquired tax lien certificates to their fair value. |
(9) | | The $5.4 million acquisition method accounting adjustment on certificates of deposit adjusts their carrying value to fair value. This adjustment will be amortized through the income statement as a reduction of interest expense over the remaining term of these deposit. |
(10) | | The $7.5 million acquisition method accounting adjustment to subordinated debt, adjusts its carrying value to estimated fair value. This adjustment will be amortized through the income statement as an increase in interest expense over the remaining term of the debt. |
(11) | | These pro forma adjustments represent the net impact of the issuance of BMBC common stock in connection with the merger and the elimination of RBPI's stockholders' equity. |
(12) | | Adjustment eliminates the non-controlling interest which will no longer exist after the close of the transaction. |
