UNITED STATES
SECURITIES AND EXCHANGE COMMISSION
Washington, D.C. 20549
FORM N-CSR
CERTIFIED SHAREHOLDER REPORT OF REGISTERED
MANAGEMENT INVESTMENT COMPANIES
Investment Company Act file number | 811-04852 | |||||||
| ||||||||
Victory Portfolios | ||||||||
(Exact name of registrant as specified in charter) | ||||||||
| ||||||||
4900 Tiedeman Road, 4th Floor, Brooklyn, Ohio |
| 44144 | ||||||
(Address of principal executive offices) |
| (Zip code) | ||||||
| ||||||||
Citi Fund Services Ohio, Inc., 4400 Easton Commons, Suite 200, Columbus, OH 43219 | ||||||||
(Name and address of agent for service) | ||||||||
| ||||||||
Registrant’s telephone number, including area code: | 800-539-3863 |
| ||||||
| ||||||||
Date of fiscal year end: | October 31 |
| ||||||
| ||||||||
Date of reporting period: | October 31, 2019 |
| ||||||
Item 1. Reports to Stockholders.

October 31, 2019
Annual Report
Victory Diversified Stock Fund
Victory NewBridge Large Cap Growth Fund
Victory Special Value Fund
Victory Strategic Allocation Fund
Victory INCORE Fund for Income
Victory INCORE Investment Grade Convertible Fund
Beginning January 1, 2021, as permitted by regulations adopted by the Securities and Exchange Commission, paper copies of the Victory Funds' shareholder reports will no longer be sent by mail, unless you specifically request paper copies of the reports from the Victory Funds or from your financial intermediary, such as a broker-dealer or bank. Instead, the reports will be made available on www.VictoryFunds.com, and you will be notified by mail each time a report is posted and provided with a website link to access the report.
If you already elected to receive shareholder reports electronically, you will not be affected by this change; and you need not take any action. You may elect to receive shareholder reports and other communications from the Victory Funds or your financial intermediary electronically by notifying your financial intermediary directly or, if you are a direct investor, by calling 800-539-3863 or by sending an e-mail request to TA.Processing@FISGlobal.com.
You may elect to receive all future reports in paper free of charge. If you invest through a financial intermediary, you can contact your financial intermediary to request that you continue to receive paper copies of your reports. If you invest directly with the Victory Funds, you can call 800-539-3863 or send an e-mail request to TA.Processing@FISGlobal.com. Your election to receive reports in paper will apply to all Victory Funds you hold directly or through your financial intermediary.
www.vcm.com
News, Information And Education 24 Hours A Day, 7 Days A Week
The Victory Funds site gives fund shareholders, prospective shareholders, and investment professionals a convenient way to access fund information, get guidance, and track fund performance anywhere they can access the Internet. The site includes:
• Detailed performance records
• Daily share prices
• The latest fund news
• Investment resources to help you become a better investor
• A section dedicated to investment professionals
Whether you're a potential investor searching for the fund that matches your investment philosophy, a seasoned investor interested in planning tools, or an investment professional, www.vcm.com has what you seek. Visit us anytime. We're always open.
Victory Portfolios
Table of Contents
Shareholder Letter (unaudited) | 4 | ||||||
Fund Review and Commentary (unaudited) | 6 | ||||||
Financial Statements | |||||||
Victory Diversified Stock Fund | |||||||
Schedule of Portfolio Investments | 23 | ||||||
Statements of Assets and Liabilities | 37-38 | ||||||
Statements of Operations | 41 | ||||||
Statements of Changes in Net Assets | 43-45 | ||||||
Financial Highlights | 50-53 | ||||||
Victory NewBridge Large Cap Growth Fund | |||||||
Schedule of Portfolio Investments | 26 | ||||||
Statements of Assets and Liabilities | 37-38 | ||||||
Statements of Operations | 41 | ||||||
Statements of Changes in Net Assets | 43-45 | ||||||
Financial Highlights | 54-55 | ||||||
Victory Special Value Fund | |||||||
Schedule of Portfolio Investments | 28 | ||||||
Statements of Assets and Liabilities | 37-38 | ||||||
Statements of Operations | 41 | ||||||
Statements of Changes in Net Assets | 43-45 | ||||||
Financial Highlights | 56-57 | ||||||
Victory Strategic Allocation Fund | |||||||
Schedule of Portfolio Investments | 31 | ||||||
Statements of Assets and Liabilities | 39-40 | ||||||
Statements of Operations | 42 | ||||||
Statements of Changes in Net Assets | 46-48 | ||||||
Financial Highlights | 58-59 | ||||||
Victory INCORE Fund for Income | |||||||
Schedule of Portfolio Investments | 32 | ||||||
Statements of Assets and Liabilities | 39-40 | ||||||
Statements of Operations | 42 | ||||||
Statements of Changes in Net Assets | 46-48 | ||||||
Financial Highlights | 60-63 | ||||||
Victory INCORE Investment Grade Convertible Fund | |||||||
Schedule of Portfolio Investments | 34 | ||||||
Statements of Assets and Liabilities | 39-40 | ||||||
Statements of Operations | 42 | ||||||
Statements of Changes in Net Assets | 46-48 | ||||||
Financial Highlights | 64-65 | ||||||
Notes to Financial Statements | 66 | ||||||
| Report of Independent Registered Public Accounting Firm | 81 | ||||||
1
Supplemental Information | |||||||
Trustee and Officer Information | 82 | ||||||
Proxy Voting and Portfolio Holdings Information | 85 | ||||||
Expense Examples | 85 | ||||||
Additional Federal Income Tax Information | 87 | ||||||
Privacy Policy (inside back cover) | |||||||
The Funds are distributed by Victory Capital Advisers, Inc. Victory Capital Management Inc. is the investment adviser to the Funds and receives fees from the Funds for performing services for the Funds.
This report is not authorized for distribution to prospective investors unless preceded or accompanied by a current prospectus of the Victory Funds.
For additional information about any Victory Fund, including fees, expenses, and risks, view our prospectus online at vcm.com or call 800-539-3863. Read it carefully before you invest or send money.
The information in this annual report is based on data obtained from recognized services and sources and is believed to be reliable. Any opinions, projections, or recommendations in this report are subject to change without notice and are not intended as individual investment advice. Past investment performance of the Funds, markets or securities mentioned herein should not be considered to be indicative of future results.
• NOT FDIC INSURED • NO BANK GUARANTEE • MAY LOSE VALUE

Call Victory at:
800-539-FUND (800-539-3863)
Visit our website at:
www.vcm.com
2
This page is intentionally left blank.
3
Victory Funds Letter to Shareholders
Dear Shareholder,
The past year has been anything but dull for investors. On one hand there are numerous factors that could have (and still might) derail the longest-ever bull market in U.S. equities. Yet stocks remained resilient throughout the most recent annual reporting period ended October 31, 2019, and despite periods of tumult, the bull market has endured.
The S&P 500® Index managed to post impressive gains of nearly 14% for the 12-months ended October 31, 2019, bouncing back smartly after a precipitous drop late in 2018. The move higher supports the notion that underlying fundamentals of U.S. companies drive performance, rather than the political rancor and headline fears that often capture the attention of investors. As just one example, approximately three quarters of S&P 500 companies exceeded earnings expectations in the most recent quarter ended September 30, 2019, according to FactSet.
Perhaps we should not be surprised at the positive earnings news given that the domestic economy remains on solid footing. Robust job creation, near-record low unemployment, and steady consumer spending continue and offer reasons for further optimism. Meanwhile, inflation remains muted and the U.S. Federal Reserve (the "Fed") has taken an accommodative stance (ever since its abrupt pivot in late 2018). In fact, the Fed has cut interest rates by a total of 0.75% over the past three meetings in July, September, and October. There is evidence that the Fed may move further in its attempt to aid and extend the economic expansion, which is likely to be welcomed by equities.
Still, it is important to remember that it has not been smooth sailing for investors. In addition to a steep drawdown late last year, in August 2019 the yield on 10-year U.S. Treasuries fell below the 2-year yield. Such an inversion not only created challenges for fixed-income investors, but it caused quite the commotion since it is heralded as a possible harbinger for recession. Since then, however, the yield curve has returned to its more normal upward slope.
Another factor periodically roiling markets has been U.S. trade policy. As we approached the end of the Funds' annual reporting period, optimism abounded regarding a resolution to the trade dispute, and domestic stocks were again flirting with record highs. However, the recent trade turmoil is still a wildcard without a clear resolution, and any prolonged uncertainty could impact economic growth both domestically and globally.
So while the most recent annual reporting period was constructive for most stock markets, ample risks remain. Yet it is these very risks — these cross-currents — that create pricing dislocations. This is an environment in which we believe our Victory Capital independent investment franchises can thrive.
On the following pages, you will find information relating to your Victory Funds investment. If you have any questions, we encourage you to contact your financial advisor. Or, if you invest with us directly, you may call (800) 539-3863, or visit our website at www.vcm.com.
4
My colleagues and I sincerely appreciate the confidence you have placed in the Victory Funds, and we value the opportunity to help meet your investment goals.

Christopher K. Dyer, CFA
President,
Victory Funds
5
Victory Equity Funds (Unaudited)
Victory Diversified Stock Fund
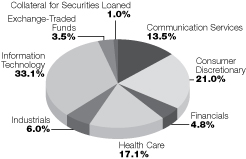
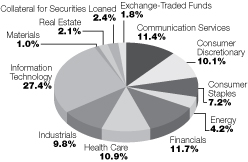
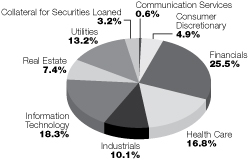
Portfolio Holdings
As a Percentage of Total Investments

Commentary
The Victory Diversified Stock Fund (the "Fund") seeks to provide long-term growth of capital. For the fiscal year ended October 31, 2019, the Fund delivered a total return of 12.27% (Class A Shares at net asset value), underperforming the S&P 500® Index (the "Index"), which had a return of 14.33%. Recent relative performance has shown improvement, and relative performance since the start of the second half of this fiscal year (since the end of April) has been slightly positive. For the fiscal year ended October 31, 2019, the Fund's smaller size, value-tilt, and positive beta/volatility exposure detracted from results, as did sector allocation (cash drag, overweight Financials, underweight Real Estate). Good stock selection in Consumer Discretionary, Energy, and Communication Services was offset by challenges in Health Care, Financials, and Industrials.
In Consumer Discretionary, the Fund's outperformance was mostly driven by its retail holdings, with Target Corporation, the U.S.-based general merchandise retailer with approximately 1,800 stores nationally, one of our top performers. We believe the company is one of the few winners in an otherwise tough retail environment, recently posting a strong beat-and-raise quarter highlighted by strong same-store-sales and double-digit EPS growth. In Energy, the Fund benefited both from its underweight positioning in exploration & production/equipment names as well as good performance from its positions in refiners Phillips 66 and Valero Energy Corp. Demand and prices for refined products have held up reasonably well in the United States, while cash flow and capital allocation stability also improve the attractiveness of the group relative to other Energy industries. At the same time, weakening global growth continues to weigh on the demand outlook for crude oil, while we have generally seen disappointing production results coupled with higher-than-expected capital expenditure spending within the exploration & production space. In Communication Services, the Fund's outperformance was driven by its holdings in Nexstar Broadcasting Group, Inc., ("Nexstar") one of the largest owners of broadcast television stations in the United States. Nexstar performed well last year on strong political ad spend and an accretive acquisition of Tribune Publishing Company. The Fund sold its shares in early May after a strong run up in the stock price.
In Health Care, the Fund had some industry headwinds, mostly from its overweight positioning in managed care and facilities names due to ongoing regulatory concerns heading into the 2020 election (i.e. "Medicare for All"). In Financials, performance was hampered by the Fund's overweight position in regional banks, investment banks, and asset management, none of which held up well as concerns manifested around economic growth and lower interest rates. Selection challenges in Industrials was mostly due to the Fund's position in Comfort Systems USA, Inc., a business services provider focused on HVAC, fire protection, electrical system, and plumbing. The company reported a disappointing quarter and reset revenue and gross margin expectations. Given the challenging manufacturing backdrop
6
Victory Equity Funds (Unaudited)
Victory Diversified Stock Fund (continued)
(largest end market) coupled with weak Architecture Billings Index (ABI) readings, we believe business momentum will be challenged over the near-term and exited our position in the company.
At period end, the Fund had overweight allocations to the Technology, Communication Services, and Industrials sectors. Within Technology, the Fund's largest active industry weights are in distribution, system software, and data processing. In Communication Services, the Fund had large overweight allocations in interactive media, wireless telecommunications, and cable & satellite. In Industrials, our biggest active weights are in construction & engineering and trading companies & distributors. The Fund maintained underweight allocations to the Utilities, Health Care, Materials, Financials, and Real Estate sectors. Overall, the style had positive exposure to growth, earnings yield, and highly profitable companies, with a smaller size bias.
7
Victory Equity Funds (Unaudited)
Victory Diversified Stock Fund (continued)
Average Annual Total Return
Year Ended October 31, 2019
Class A | Class C | Class I | Class R | Class R6 | Class Y | ||||||||||||||||||||||||||||||||||
INCEPTION DATE | 10/28/89 | 3/1/02 | 8/31/07 | 3/26/99 | 3/3/14 | 1/28/13 | |||||||||||||||||||||||||||||||||
| Net Asset Value | Maximum Offering Price | Net Asset Value | Contingent Deferred Charges | Net Asset Value | Net Asset Value | Net Asset Value | Net Asset Value | S&P 500 Index(1) | |||||||||||||||||||||||||||||||
One Year | 12.27 | % | 5.83 | % | 11.19 | % | 10.22 | % | 12.52 | % | 11.90 | % | 12.58 | % | 12.53 | % | 14.33 | % | |||||||||||||||||||||
Three Year | 11.84 | % | 9.65 | % | 10.87 | % | 10.87 | % | 12.12 | % | 11.53 | % | 12.17 | % | 12.08 | % | 14.91 | % | |||||||||||||||||||||
Five Year | 7.04 | % | 5.77 | % | 6.13 | % | 6.13 | % | 7.32 | % | 6.73 | % | 7.36 | % | 7.26 | % | 10.78 | % | |||||||||||||||||||||
Ten Year | 10.31 | % | 9.66 | % | 9.39 | % | 9.39 | % | 10.61 | % | 10.00 | % | N/A | N/A | 13.70 | % | |||||||||||||||||||||||
Since Inception | 9.85 | % | 9.63 | % | 5.86 | % | 5.86 | % | 6.25 | % | 6.24 | % | 7.98 | % | 10.15 | % | N/A | ||||||||||||||||||||||
Expense Ratios | |||||||||||||||||||||||||||||||||||||||
Gross | 1.05% | 1.89% | 0.79% | 1.34% | 1.21% | 1.13% | |||||||||||||||||||||||||||||||||
| With Applicable Waivers | 1.05% | 1.89% | 0.79% | 1.34% | 0.78% | 0.86% | |||||||||||||||||||||||||||||||||
Past performance is not indicative of future results. The performance data quoted represents past performance and current returns may be lower or higher. The investment return and principal value will fluctuate so that an investor's shares, when redeemed, may be worth more or less than the original cost. To obtain performance information current to the most recent month's end, please visit www.vcm.com. | |||||||||||||||||||||||||||||||||||||||
The above expense ratios are from the Fund's prospectus dated March 1, 2019, as may be supplemented. Additional information pertaining to the Fund's expense ratios as of October 31, 2019 can be found in the financial highlights.
The maximum offering price (MOP) reflects a maximum sales charge of 5.75% for Class A Shares. Class C Shares are not subject to an initial sales charge, but are subject to a deferred sales charge of 1.00% on shares redeemed within one year of purchase. NAV does not reflect sales charges.
The total return figures set forth above include all waivers of fees for various periods since inception. Without such fee waivers, the total returns would
have been lower. Some fee waivers are voluntary and may be modified or terminated at any time.
Victory Diversified Stock Fund — Growth of $10,000
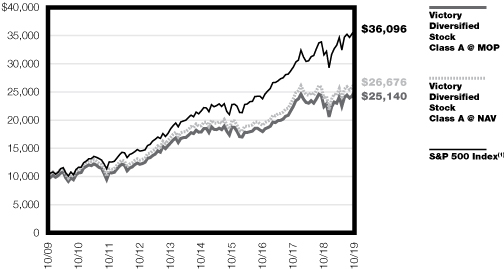
(1)The S&P 500 Index is an unmanaged index comprised of 500 domestically traded common stocks, is weighted according to the market value of each common stock in the index, and includes reinvestment of dividends. This index does not include the effect of sales charges and is not representative of the Fund. It is not possible to invest directly in an index.
The graph reflects investment of growth of a hypothetical $10,000 investment in Class A Shares of the Fund. The performance of other classes of the Fund's shares will be greater than or less than the line shown based on the differences in loads and fees paid by shareholders investing in the different classes. Past performance is no guarantee of future results.
The graph and table do not reflect the deduction of taxes that a shareholder would pay on Fund distributions or the redemption of Fund shares.
8
Victory Equity Funds (Unaudited)
Victory NewBridge Large Cap Growth Fund
Portfolio Holdings
As a Percentage of Total Investments
Commentary
For the fiscal year ended October 31, 2019, the Victory NewBridge Large Cap Growth Fund (the "Fund") had a return of 4.56% (Class A shares at net asset value) while the Russell 1000® Growth Index (the "Index"), the Fund's benchmark, returned 17.10%.
The U.S. equity market recovered admirably in 2019 following a significant sell-off in the fourth calendar quarter of 2018. The slide in equity securities that began in October 2018 persisted in November and December with the Index down another 8.91% in those two months. Concerns regarding tightening by the U.S. Federal Reserve ("Fed") and escalating trade tensions with China combined with a sharp decrease in liquidity fueled the biggest drawdown since the great financial crisis in 2008.
Thankfully, the Fed recognized the absence of inflation and, consequently, the need to pause future interest rate hikes. The more dovish stance was announced the day after Christmas, halting further declines in the performance of equity securities. From that point and through the first quarter of 2019, the market staged an almost symmetrical recovery.
Given the severity of 2018's year-end correction against an economic backdrop we believed was solid without any meaningful inflation, we made changes to the Fund's portfolio in early 2019 to take advantage of the indiscriminate sell-off by eliminating companies that we were less sure of and replaced them with those that we believed had better prospects and valuations that had become more attractive. The changes paid off as the market rebounded, and the Fund outperformed the Index in the first quarter of 2019.
Although the first quarter erased the short-term damage incurred at the end of 2018 and investors felt more comfortable with the path laid out by the Fed regarding interest rates, trade issues remained unresolved and tensions flared once more in May. Many investors began to fear that complicated and protracted negotiations increasingly pushed an already slowing economy towards recession. That growing view also further highlighted pockets of stretched valuations and created a treacherous environment for companies as they reported second quarter results during the months of August and September. During that period, the Fund underperformed as a greater than normal number of companies experienced dramatic declines after reporting results that were in-line or just shy of expectations. We know from experience that companies priced for perfection but report less than that are vulnerable. However, the outsized reactions were ultimately a foreshadowing of what was to ensue in the market later in the quarter. On September 9, the market saw the biggest factor reversal since 2009, as momentum stocks sold off almost as much as value stocks gained. At the end of the day, the market seemed largely unchanged but that masked the massive internal rotation that took place. The Index declined 0.82% that day while the Russell 1000 Value Index gained 0.80%. Although difficult to piece together at that time, trade tensions, weak economic metrics, declining yields, massive repurchase agreement activity by the Fed to
9
Victory Equity Funds (Unaudited)
Victory NewBridge Large Cap Growth Fund (continued)
prevent overnight funding problems as indices reached new highs on narrow breadth led to a violently fast risk-off environment. Companies, which exceeded expectations and offered sufficiently strong guidance, were spared and companies with any blemish or shortfalls suffered. Many newly listed companies were cut in half and several high-profile IPOs were postponed.
Following a difficult month for growth strategies in September, the Fund and its benchmark recovered throughout October as volatility receded. Having inverted in August, the yield curve improved as U.S. government debt yields rose from the low established September 3; and on October 30, the Fed cut interest rates for the third time in four months by lowering the target for its benchmark rate 0.25% to a range between 1.5% and 1.75%.
For the period between October 31, 2018, and October 31, 2019, Information Technology was the Fund's best performing sector and provided the biggest contribution to performance with the top performers and contributors being Keysight Technologies, Inc., ServiceNow, Inc., and Visa, Inc. All three companies continue to be held in the Fund's portfolio.
Consumer Discretionary was the third best performing sector, but second biggest contributor, as it represents a bigger portion of the Fund than it does for the Index. The best performing company in that sector for the Fund was Lululemon Athletica Inc., which was purchased in the Fund's portfolio in January of 2019 and Alibaba Group Holding Limited, which was purchased in the Fund's portfolio in 2018.
Health Care was the second biggest sector in the Fund but barely contributed any gain to the Fund. The sector was plagued by macro headwinds as the presidential election cycle and investor sentiment towards the sector weakens. Long-standing holdings Edwards Lifesciences Corporation and Zoetis Inc. were top contributors for the second consecutive year and were accompanied by strong returns from Veeva Systems Inc., purchased into the Fund's portfolio in early 2019. Their contributions, however, were almost completely offset by detractors Abiomed, Inc. and Canopy Growth Corporation, both of which had been strong performers in 2018 but stumbled in 2019.
The worst performing sectors were Industrials and Consumer Staples, neither of which are meaningful weights in the Fund. The biggest detractor in Industrials was XPO Logistics, Inc., which is no longer held in the portfolio. The Fund seeks to provide long-term capital appreciation.
10
Victory Equity Funds (Unaudited)
Victory NewBridge Large Cap Growth Fund (continued)
Average Annual Return
Year Ended October 31, 2019
Class A | Class C | Class I | Class Y | ||||||||||||||||||||||||||||
INCEPTION DATE | 12/31/03 | 12/31/03 | 3/1/11 | 1/28/13 | |||||||||||||||||||||||||||
| Net Asset Value | Maximum Offering Price | Net Asset Value | Contingent Deferred Charges | Net Asset Value | Net Asset Value | Russell 1000® Growth Index(1) | |||||||||||||||||||||||||
One Year | 4.56 | % | –1.40 | % | 3.92 | % | 3.43 | % | 5.11 | % | 5.06 | % | 17.10 | % | |||||||||||||||||
Three Year | 11.40 | % | 9.22 | % | 10.61 | % | 10.61 | % | 11.91 | % | 11.83 | % | 18.92 | % | |||||||||||||||||
Five Year | 7.66 | % | 6.39 | % | 6.84 | % | 6.84 | % | 8.09 | % | 8.01 | % | 13.43 | % | |||||||||||||||||
Ten Year | 11.13 | % | 10.48 | % | 10.25 | % | 10.25 | % | N/A | N/A | 15.41 | % | |||||||||||||||||||
Since Inception | 7.72 | % | 7.32 | % | 6.88 | % | 6.88 | % | 9.33 | % | 10.63 | % | N/A | ||||||||||||||||||
Expense Ratios | |||||||||||||||||||||||||||||||
Gross | 1.47% | 2.40% | 1.09% | 1.48% | |||||||||||||||||||||||||||
| With Applicable Waivers | 1.36% | 2.10% | 0.95% | 1.02% | |||||||||||||||||||||||||||
Past performance is not indicative of future results. The performance data quoted represents past performance and current returns may be lower or higher. The investment return and principal value will fluctuate so that an investor's shares, when redeemed, may be worth more or less than the original cost. To obtain performance information current to the most recent month's end, please visit www.vcm.com.
The above expense ratios are from the Fund's prospectus dated March 1, 2019, as may be supplemented. Additional information pertaining to the Fund's expense ratios as of October 31, 2019 can be found in the financial highlights.
The maximum offering price (MOP) reflects a maximum sales charge of 5.75% for Class A Shares. Class C Shares are not subject to an initial sales charge, but are subject to a deferred sales charge of 1.00% on shares redeemed within one year of purchase. NAV does not reflect sales charges.
The total return figures set forth above include all waivers of fees for various periods since inception. Without such fee waivers, the total returns would have been lower. Some fee waivers are voluntary and may be modified or terminated at any time.
Victory NewBridge Large Cap Growth Fund — Growth of $10,000

(1)The Russell 1000 Growth Index is an unmanaged index that measures the performance of those Russell 1000 companies with higher price-to-book ratios and higher forecasted growth values. This index does not include the effect of sales charges and is not representative of the Fund. It is not possible to invest directly in an index.
The graph reflects investment growth of a hypothetical $10,000 investment in Class A Shares of the Fund. The performance of other classes of the Fund's shares will be greater than or less than the line shown based on the differences in loads and fees paid by shareholders investing in the different classes. Past performance is no guarantee of future results.
The graph and table do not reflect the deduction of taxes that a shareholder would pay on Fund distributions or the redemption of Fund shares.
11
Victory Equity Funds (Unaudited)
Victory Special Value Fund
Portfolio Holdings
As a Percentage of Total Investments
Commentary
The Victory Special Value Fund (the "Fund") seeks to provide long-term growth of capital and dividend income. For the fiscal year ended October 31, 2019, the Fund delivered a total return of 11.32% (Class A Shares at net asset value), underperforming the S&P 500® Index (the "Index"), which had a return of 14.33%. Recent relative performance has shown improvement, and relative performance since the start of the second half of this fiscal year (since the end of April) has been slightly positive. For the fiscal year end, the Fund's smaller size, value-tilt, and positive beta/volatility exposure detracted from results, as did sector allocation (cash drag, overweight Financials, underweight Real Estate). Good stock selection in Consumer Discretionary, Energy and Communication Services was offset by challenges in Health Care, Financials and Industrials.
In Consumer Discretionary, the Fund's, outperformance was mostly driven by its retail holdings, with Target Corporation, the U.S. based general merchandise retailer with approximately 1,800 stores nationally, one of our top performers. We believe the company is one of the few winners in an otherwise tough retail environment, recently posting a strong beat-and-raise quarter highlighted by strong same-store-sales and double-digit EPS growth. In Energy, the Fund benefited both from its underweight positioning in exploration & production/equipment names as well as good performance from its positions in refiners Phillips 66 and Valero Energy. Demand and prices for refined products have held up reasonably well in the United States, while cash flow and capital allocation stability also improve the attractiveness of the group relative to other Energy industries. At the same time, weakening global growth continues to weigh on the demand outlook for crude oil, while we have generally seen disappointing production results coupled with higher-than-expected capital expenditure spending within the exploration & production space. In Communication Services, the Fund's outperformance was driven by its holdings in Nexstar Broadcasting Group, Inc. ("Nexstar") one of the largest owners of broadcast television stations in the United States. Nexstar performed well last year on strong political ad spend and an accretive acquisition of Tribune Publishing Company. The Fund sold its shares in early May after a strong run up in the stock price.
In Health Care, the Fund had some industry headwinds, mostly from its overweight positioning in managed care and facilities names due to ongoing regulatory concerns heading into the 2020 election (i.e. "Medicare for All"). In Financials, performance was hampered by the Fund's overweight position in regional banks, investment banks, and asset management, none of which held up well as concerns manifested around economic growth and lower interest rates. Selection challenges in Industrials was mostly due to the Fund's position in Comfort Systems USA, Inc., a business services provider focused on HVAC, fire protection, electrical system and plumbing. The company reported a disappointing quarter and reset revenue and gross
12
Victory Equity Funds (Unaudited)
Victory Special Value Fund (continued)
margin expectations. Given the challenging manufacturing backdrop (largest end market) coupled with weak Architecture Billings Index (ABI) readings, we believe business momentum will be challenged over the near-term and exited our position in the company.
At period end, the Fund had overweight allocations to the Technology, Communication Services, and Industrials sectors. Within Technology, the Fund's largest active industry weights are in distribution, system software, and data processing. In Communication Services, the fund had large overweight allocations in interactive media, wireless telecommunications, and cable & satellite. In Industrials, our biggest active weights are in construction & engineering and trading companies & distributors. The Fund maintained underweight allocations to the Utilities, Health Care, Materials, Financials, and Real Estate sectors. Overall, the style had positive exposure to growth, earnings yield, and highly profitable companies, with a smaller size bias.
13
Victory Equity Funds (Unaudited)
Victory Special Value Fund (continued)
Average Annual Return
Year Ended October 31, 2019
Class A | Class C | Class I | Class R | Class Y | |||||||||||||||||||||||||||||||
INCEPTION DATE | 12/3/93 | 3/1/03 | 8/31/07 | 12/21/99 | 1/28/13 | ||||||||||||||||||||||||||||||
| Net Asset Value | Maximum Offering Price | Net Asset Value | Contingent Deferred Charges | Net Asset Value | Net Asset Value | Net Asset Value | S&P 500 Index(1) | ||||||||||||||||||||||||||||
One Year | 11.32 | % | 4.93 | % | 10.34 | % | 9.37 | % | 11.52 | % | 11.03 | % | 11.57 | % | 14.33 | % | |||||||||||||||||||
Three Year | 11.14 | % | 8.97 | % | 10.11 | % | 10.11 | % | 11.26 | % | 10.81 | % | 11.38 | % | 14.91 | % | |||||||||||||||||||
Five Year | 6.38 | % | 5.14 | % | 5.43 | % | 5.43 | % | 6.54 | % | 6.08 | % | 6.64 | % | 10.78 | % | |||||||||||||||||||
Ten Year | 9.24 | % | 8.59 | % | 8.24 | % | 8.24 | % | 9.48 | % | 8.92 | % | N/A | 13.70 | % | ||||||||||||||||||||
Since Inception | 8.60 | % | 8.35 | % | 7.86 | % | 7.86 | % | 4.54 | % | 7.99 | % | 8.70 | % | N/A | ||||||||||||||||||||
Expense Ratios | |||||||||||||||||||||||||||||||||||
Gross | 1.27% | 2.27% | 1.16% | 1.56% | 2.82% | ||||||||||||||||||||||||||||||
| With Applicable Waivers | 1.27% | 2.20% | 1.15% | 1.56% | 1.10% | ||||||||||||||||||||||||||||||
Past performance is not indicative of future results. The performance data quoted represents past performance and current returns may be lower or higher. The investment return and principal value will fluctuate so that an investor's shares, when redeemed, may be worth more or less than the original cost. To obtain performance information current to the most recent month's end, please visit www.vcm.com.
The above expense ratios are from the Fund's prospectus dated March 1, 2019, as may be supplemented. Additional information pertaining to the Fund's expense ratios as of October 31, 2019 can be found in the financial highlights.
The maximum offering price (MOP) reflects a maximum sales charge of 5.75% for Class A Shares. Class C Shares are not subject to an initial sales charge, but are subject to a deferred sales charge of 1.00% on shares redeemed within one year of purchase. NAV does not reflect sales charges.
The total return figures set forth above include all waivers of fees for various periods since inception. Without such fee waivers, the total returns would have been lower. Some fee waivers are voluntary and may be modified or terminated at any time.
Victory Special Value Fund — Growth of $10,000
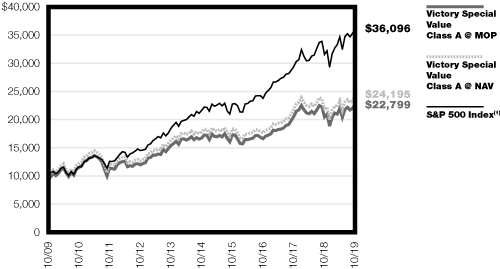
(1)The S&P 500 Index, an unmanaged index comprised of 500 domestically traded common stocks, is weighted according to the market value of each common stock in the index, and includes reinvestment of dividends. This index does not include the effect of sales charges and is not representative of the Fund. It is not possible to invest directly in an index.
The graph reflects investment growth of a hypothetical $10,000 investment in Class A Shares of the Fund. The performance of other classes of the Fund's shares will be greater than or less than the line shown based on the differences in loads and fees paid by shareholders investing in the different classes.
Past performance is no guarantee of future results.
The graph and table do not reflect the deduction of taxes that a shareholder would pay on Fund distributions or the redemption of Fund shares.
14
Victory Hybrid Funds (Unaudited)
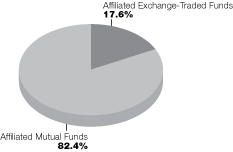
Victory Strategic Allocation Fund
Portfolio Holdings
As a Percentage of Total Investments
Commentary
The Victory Strategic Allocation Fund (the "Fund") seeks to provide income and long-term growth of capital. For the fiscal year ended October 31, 2019, the Fund had a total return of 10.37% (Class A Shares at net asset value). Its benchmark, the Custom Index (BloombergBarclays U.S. Aggregate Bond (40%) + MSCI AC World (60%)), had a total return of 12.52% over the same period.
Over the last year, the global capital markets generally were strong with the exception of the commodity-oriented equities. The U.S. equity markets were exceptionally strong in the area of growth-oriented stocks that have exhibited stretched valuations versus historical norms. Beyond global equity markets, global asset prices of fixed income surged over the year as interest rates plummeted to near all-time historic lows. Non-U.S. equities slightly trailed their U.S. equity counterparts primarily because of the continued concerns over economic growth, geo-political risk, and the negative impact to U.S. investors of a broadly appreciating U.S. dollar versus foreign currencies. The U.S. equity markets have received support from global investor sentiment as the "safest market" given the aforementioned global concerns.
The Fund was positioned throughout the year to provide more diversification by more equally weighting the U.S. and foreign equity markets when compared to the MSCI All Country World Index, which detracted from Fund performance versus its Custom Index. The valuation of equity markets abroad appears more compelling and commensurate with the risks facing those markets, in our view. This would have detracted from the Fund's return as those exposures did not keep pace with the strong U.S. equity markets, however, outperformance of the Fund's active equity strategies broadly offset this positioning. The Fund also continued to be positioned to exhibit less interest rate risk associated with the U.S. Treasury market versus its Custom Index by partially substituting an equity income-oriented strategy. This negatively impacted Fund performance as 30-year and 10-year U.S. Treasuries interest rates fell to near all-time historic lows.
Despite all the global risks, the economic backdrop remains largely constructive for global equities, but does not come without risks. In the United States, growth domestic product ("GDP") growth appears to be slowing from its second quarter 2018 peak of 3.2%. However, the labor market remains supportive, and a recession does not appear imminent. In China, monetary and fiscal stimulus (including tax cuts) are having a positive effect, as the Caixin China PMI rose to 51.4 in September. In Japan, significant economic stimulus is still robust and receives on-going support to push inflation there to its long-term target. As for Europe, economic data was largely disappointing. The September Manufacturing PMI slipped to 45.6 (below 50 indicates contraction), while the Services PMI slowed by 1.5 points to 52. Leading indicators such as new orders were particularly lackluster and suggest GDP may slow below 1% in the fourth quarter. However, valuations in the region are very attractive versus historical norms making this attractive versus these potential risks.
15
Victory Hybrid Funds (Unaudited)
Victory Strategic Allocation Fund (continued)
Although volatility has occasionally spiked in 2019, we remain bullish on global equity market valuations and long-term growth prospects. We continue to focus our investments on attractive relative valuations and powerful diversification benefits that exist globally.
16
Victory Hybrid Funds (Unaudited)
Victory Strategic Allocation Fund (continued)
Average Annual Return
Year Ended October 31, 2019
Class A | Class C | Class I | Class R | ||||||||||||||||||||||||||||||||
INCEPTION DATE | 12/10/93 | 3/1/03 | 8/31/07 | 12/15/99 | |||||||||||||||||||||||||||||||
| Net Asset Value | Maximum Offering Price | Net Asset Value | Contingent Deferred Charges | Net Asset Value | Net Asset Value | MSCI All Country World Index(1) | 60% MSCI All Country World Index/40% Barclays U.S. Aggregate Bond Index(1) | ||||||||||||||||||||||||||||
One Year | 10.37 | % | 4.04 | % | 9.53 | % | 8.53 | % | 10.63 | % | 10.08 | % | 12.59 | % | 12.52 | % | |||||||||||||||||||
Three Year | 6.94 | % | 4.86 | % | 6.15 | % | 6.15 | % | 7.20 | % | 6.66 | % | 11.33 | % | 8.24 | % | |||||||||||||||||||
Five Year | 4.88 | % | 3.64 | % | 4.12 | % | 4.12 | % | 5.14 | % | 4.59 | % | 7.08 | % | 5.72 | % | |||||||||||||||||||
Ten Year | 7.49 | % | 6.86 | % | 6.72 | % | 6.72 | % | 7.85 | % | 7.18 | % | 8.81 | % | 7.00 | % | |||||||||||||||||||
Since Inception | 6.71 | % | 6.46 | % | 5.71 | % | 5.71 | % | 5.23 | % | 4.47 | % | N/A | N/A | |||||||||||||||||||||
Expense Ratios | |||||||||||||||||||||||||||||||||||
Gross | 1.47% | 2.34% | 1.22% | 2.23% | |||||||||||||||||||||||||||||||
| With Applicable Waivers | 1.20% | 1.95% | 0.95% | 1.45% | |||||||||||||||||||||||||||||||
Past performance is not indicative of future results. The performance data quoted represents past performance and current returns may be lower or higher. The investment return and principal value will fluctuate so that an investor's shares, when redeemed, may be worth more or less than the original cost. To obtain performance information current to the most recent month's end, please visit www.vcm.com.
The above expense ratios are from the Fund's prospectus dated March 1, 2019, as may be supplemented. Additional information pertaining to the Fund's expense ratios as of October 31, 2019 can be found in the financial highlights.
The maximum offering price (MOP) reflects a maximum sales charge of 5.75% for Class A Shares. Class C Shares are not subject to an initial sales charge, but are subject to a deferred sales charge of 1.00% on shares redeemed within one year of purchase. NAV does not reflect sales charges.
The total return figures set forth above include all waivers of fees for various periods since inception. Without such fee waivers, the total returns would have been lower. Some fee waivers are voluntary and may be modified or terminated at any time.
Victory Strategic Allocation Fund — Growth of $10,000
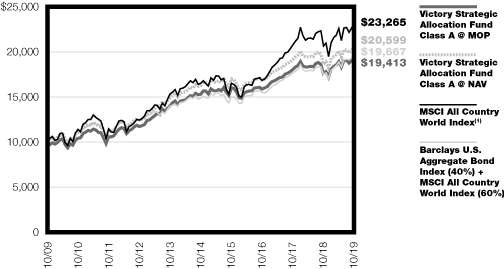
(1)The MSCI All Country World Index is a market capitalization weighted index designed to provide a broad measure of equity-market performance throughout the world. It is not possible to invest directly in an index.
(2)The Barclays U.S. Aggregate Bond Index is a broad-based flagship benchmark that measures the investment grade, U.S. dollar-denominated, fixed-rate taxable bond market. The index includes Treasuries, government-related and corporate securities, MBS (agency fixed-rate and hybrid ARM pass-throughs), ABS and CMBS (agency and nonagency). It is not possible to invest directly in an index.
The graph reflects investment growth of a hypothetical $10,000 investment in Class A Shares of the Fund. The performance of other classes of the Fund's shares will be greater than or less than the line shown based on the differences in loads and fees paid by shareholders investing in the different classes. Past performance is no guarantee of future results.
The graph and table do not reflect the deduction of taxes that a shareholder would pay on Fund distributions or the redemption of Fund shares.
17
Victory Taxable Fixed Income Fund (Unaudited)
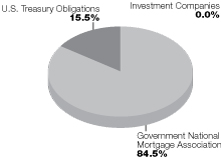
Victory INCORE Fund for Income
Portfolio Holdings
As a Percentage of Total Investments
Commentary
For the fiscal year ended October 31, 2019, the Victory INCORE Fund for Income (the "Fund") (Class A shares at net asset value) had a total return of 5.50%. The Fund's benchmark index, the Bloomberg Barclays U.S. Capital 1-5 Year U.S. Government Bond Index, had a total return of 5.89%. The Fund's objective is to deliver high, reliable income via securities backed by the 100% full faith and credit of the U.S. government. We continued to generate approximately 0.50% of interest income monthly, 4.5% per year. With the headwinds of eight interest rate hikes (2016-2018) turning to tailwinds from three interest rate cuts (2019), price improvement fell straight to the bottom line for our stakeholders at 5.5% total return for the A shares.
Equity markets were up on the year across the three major indices. Unlike last year, most bond prices rose (yields fell). The yield curve steepened. Prices move opposite yields. During the Fund's fiscal year, all sectors of the bond market outperformed duration neutral U.S. Treasury bonds. The Fund's outperformance was led by corporate bonds at 4.75%. Commercial mortgage-backed securities by 1.85%, agency debt by 1.60%, and asset-backed by 0.69%, while mortgage-backed led U.S. Treasury bonds by 5 0.05%. The U.S. Treasury market had a total return of 11.08%. Within the mortgage market, Freddie Mac led Fannie Mae, which in turn led Ginnie Mae ("GNMA").
The Fund's 1% allocation to GNMA multi-family and 5% allocation to GNMA structure led performance. The Fund's largest allocation to GNMA single family pools drove solid performance this year. The Fund's 12% allocation to U.S. Treasury bonds also contributed positively to performance. As the U.S. Federal Reserve (the "Fed") cut rates three times throughout the year, shorter GNMA bonds had trouble keeping pace with the price gains of short U.S. Treasury bonds, hence the Fund's strategy lagged its stated short government benchmark. In addition, when rates fall, refinance risk increases, and the average life of a mortgage decreases. Generally, this gives rise to the need for some investors to add longer mortgages to maintain their position on the yield curve. Lower coupons are perceived to have longer lives, and often, all else equal, this is true. Given the demand for lower coupons, higher coupons lagged the overall GNMA index. These outcomes are to be expected as the Fund's strategy tends to exhibit less price sensitivity, no matter the direction of interest rates.
We think U.S. growth will remain stuck on a shallow path, while Japan and Germany are likely to continue to struggle with sluggish economies that are at risk of rolling over. China's growth continues to decelerate. With lack of inflation pressure domestically and with slowing global growth, we run the risk of importing deflation from abroad. For these reasons, we think the Fed will remain vigilant to downside risks into 2020, while pausing to see how the economy progresses given the three cuts and persistent global growth headwinds. The goal of the Fund's strategy remains to deliver high, reliable income consistent with preservation of capital.
18
Victory Taxable Fixed Income Fund (Unaudited)
Victory INCORE Fund for Income (continued)
Average Annual Return
Year Ended October 31, 2019
Class A | Class C | Class I | Class R | Class R6 | Class Y | ||||||||||||||||||||||||||||||||||
INCEPTION DATE | 3/26/99 | 3/1/02 | 3/1/11 | 9/16/87 | 3/4/15 | 1/28/13 | |||||||||||||||||||||||||||||||||
| Net Asset Value | Maximum Offering Price | Net Asset Value | Contingent Deferred Charges | Net Asset Value | Net Asset Value | Net Asset Value | Net Asset Value | Bloomberg Barclays Capital 1-5 Year U.S. Gov't Bond Index(1) | |||||||||||||||||||||||||||||||
One Year | 5.50 | % | 3.44 | % | 4.72 | % | 3.72 | % | 5.79 | % | 5.37 | % | 5.68 | % | 5.72 | % | 5.89 | % | |||||||||||||||||||||
Three Year | 1.31 | % | 0.62 | % | 0.50 | % | 0.50 | % | 1.56 | % | 1.28 | % | 1.56 | % | 1.48 | % | 1.81 | % | |||||||||||||||||||||
Five Year | 1.49 | % | 1.08 | % | 0.70 | % | 0.70 | % | 1.77 | % | 1.47 | % | N/A | 1.70 | % | 1.66 | % | ||||||||||||||||||||||
Ten Year | 2.12 | % | 1.91 | % | 1.33 | % | 1.33 | % | N/A | 2.10 | % | N/A | N/A | 1.27 | % | ||||||||||||||||||||||||
Since Inception | 3.54 | % | 3.44 | % | 2.27 | % | 2.27 | % | 1.91 | % | 5.14 | % | 1.56 | % | 1.42 | % | N/A | ||||||||||||||||||||||
Expense Ratios | |||||||||||||||||||||||||||||||||||||||
Gross | 0.93% | 1.71% | 0.64% | 0.91% | 0.69% | 0.79% | |||||||||||||||||||||||||||||||||
| With Applicable Waivers | 0.91% | 1.71% | 0.64% | 0.91% | 0.63% | 0.71% | |||||||||||||||||||||||||||||||||
Past performance is not indicative of future results. The performance data quoted represents past performance and current returns may be lower or higher. The investment return and principal value will fluctuate so that an investor's shares, when redeemed, may be worth more or less than the original cost. To obtain performance information current to the most recent month's end, please visit www.vcm.com.
The above expense ratios are from the Fund's prospectus dated March 1, 2019, as may be supplemented. Additional information pertaining to the Fund's expense ratios as of October 31, 2019 can be found in the financial highlights.
The maximum offering price (MOP) figures reflect a maximum sales charge of 2.00% for Class A Shares. Class C Shares are not subject to an initial sales charge, but are subject to a deferred sales charge of 1.00% on shares redeemed within one year of purchase. NAV does not reflect sales charges.
The total return figures set forth above include all waivers of fees for various periods since inception. Without such fee waivers, the total returns would have been lower. Some fee waivers are voluntary and may be modified or terminated at any time.
Victory INCORE Fund for Income — Growth of $10,000
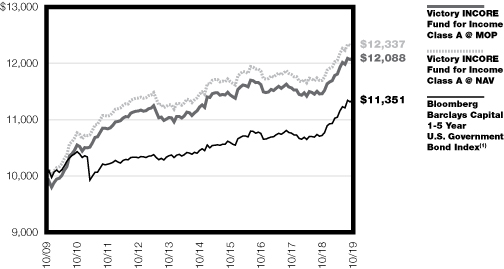
(1)Bloomberg Barclays Capital 1-5 Year U.S. Government Bond Index is a market-weighted index measuring the performance of Treasury and Agency securities issued by the United States Government with maturities of one to five years. The index does not include the effect of expenses of sales charges and is not representative of the Fund. It is not possible to invest directly in an index.
The graph reflects investment growth of a hypothetical $10,000 investment in Class A Shares of the Fund. The performance of other classes of the Fund's shares will be greater than or less than the line shown based on the differences in loads and fees paid by shareholders investing in the different classes. Past performance is no guarantee of future results.
The graph and table do not reflect the deduction of taxes that a shareholder would pay on Fund distributions or the redemption of Fund shares.
19
Victory Hybrid Funds (Unaudited)
Victory INCORE Investment Grade Convertible Fund
Portfolio Holdings
As a Percentage of Total Investments
Commentary
For the fiscal year ended October 31, 2019, the Victory INCORE Investment Grade Convertible Fund (the "Fund") had a return of 13.35% (Class A Shares at net asset value) compared to the 17.37% return of the ICE BofA ML All Investment Grade U.S. Convertible 5% Constrained Index (the "Index"). The Fund's performance placed it within the top third of the Morningstar Convertible Universe ranking during the fiscal year. The Fund seeks to provide a high level of current income together with long-term capital appreciation.
Markets produced strong returns in fiscal 2019 as stocks, bonds, and convertibles all saw double digit advances. The year was not without drama, however, as volatility early in the year transitioned into a bull market post a December stock correction. Market calming November election results greeted the new fiscal year triggering an early stock rally, which quickly fizzled as escalating trade tensions and other economic concerns dampened investor enthusiasm. A December to forget followed with the S&P 500® Index dropping nearly 15% by Christmas Eve as floundering trade talks, weak global growth, a flattening U.S. yield curve, and the arrest of a top Chinese tech executive frightened investors. An increase in the Fed Funds Rate, followed by a disappointing press conference by Chairman Powell, drove stocks further south. Stocks finally bottomed on Christmas Eve, before staging a fierce 5% rally during which the Dow Jones Industrial Average rose 1,086 on December 26, for its largest point gain in history. The stock market began the new calendar year in 2019 with its best January in 30 years, culminating in March with its best quarter since 2009, and its best first quarter since 1998. Investors were encouraged all quarter long by anticipation, followed by confirmation, that the U.S. Federal Reserve ("Fed") would put future rate hikes on hold. Signs of an improving economy pushed stocks higher still in April, but April flowers brought May showers, as volatility reemerged. The S&P 500® Index fell in excess of 6% in May as Chinese trades talks broke down, and President Trump threatened to impose escalating tariffs on Mexico. Stocks reversed again in June and July more than making up for June's decline. Potential for a trade war with China and weak global economies bounced stocks around in August as volatility reigned supreme.
During this topsy-turvy month, the S&P 500® Index posted 11 daily moves of at least one percent, and the Dow Jones industrial Average fell over 600 points on three separate occasions, including an 800-point drop on August 14. Stocks finished out the remaining portion of the fiscal year on an up note as positive news on the economy and trade, coupled with further Fed Funds rate cuts, cheered investors. After all the ups and downs, the S&P 500® Index returned 14.32% for the fiscal year. Investment-grade convertibles actually exceeded stock returns, producing an extraordinary 17.37% gain as measured by the Index. Bonds, as measured by the Bloomberg Barclays Aggregate Bond Index, also produced strong results with an 11.51% return.
20
Victory Hybrid Funds (Unaudited)
Victory INCORE Investment Grade Convertible Fund (continued)
Within the Fund, underweights in the interest rate sensitive Financials and Utilities sectors, which together make up 50% of the Index, were the primary cause of the Fund's underperformance. The Information Technology sector was by far the largest contributor to performance, delivering just over half of the Fund's return. Last fiscal year's worst performer, Lam Research, was this year's best performer in the Fund, as the semi-conductor capital equipment company nearly doubled in price. The Tech sector contained several other top Fund performers including, Intel Corp., Euronet Worldwide, Inc., and Red Hat, Inc., which was still benefitting from its takeover by IBM. The Financials sector was the next largest contributor, as Wells Fargo & Co. and Bank of America Corp. convertible preferred stocks reacted well to falling interest rates. Utilities also benefitted from lower rates to become the Fund's next best performing sector. While all the individual utility holdings were positive, NextEra Energy, Inc. provided the largest contribution. Up next was last year's best performing sector, Health Care, which was led by Danaher. Also enjoying the rate decline, the Real Estate sector provided solid results, as did the Industrials sector led by Stanley Black & Decker, Inc. Other than Energy, which registered a tiny loss for the year, all sectors provided positive results in fiscal year 2019.
In managing the Fund, we strive to invest in high-quality convertibles with attractive underlying common stocks. We structure the Fund by spreading out our holdings across the three types of convertibles: 1) equity-sensitive, high-delta convertibles; 2) total return, middle-of-the-road convertibles; and 3) defensive, fixed-income oriented convertibles. With this structure, we seek to provide a favorable balance between upside potential and downside exposure to equities. As of October 31, 2019, the Fund is overweight compared to the benchmark in the Health Care, and Information Technology sectors. It is underweight the Financials, and Utilities sectors. It is approximately equal weighted in the Consumer Discretionary, Industrials and Real Estate sectors. The Fund is broadly diversified amongst individual issues, economic sectors, credits, and convertible types.
21
Victory Hybrid Funds (Unaudited)
Victory INCORE Investment Grade Convertible Fund (continued)
Average Annual Return
Year Ending October 31, 2019
Class A | Class I | ||||||||||||||||||
INCEPTION DATE | 4/14/88 | 8/31/07 | |||||||||||||||||
| Net Asset Value | Maximum Offering Price | Net Asset Value | ICE BofAML All Investment Grade U.S. Convertible 5% Constrained Index(1) | ||||||||||||||||
One Year | 13.35 | % | 11.09 | % | 13.99 | % | 17.37 | % | |||||||||||
Three Year | 12.28 | % | 11.52 | % | 12.75 | % | 14.54 | % | |||||||||||
Five Year | 7.51 | % | 7.08 | % | 7.96 | % | 10.38 | % | |||||||||||
Ten Year | 8.75 | % | 8.53 | % | 9.20 | % | 10.11 | % | |||||||||||
Since Inception | 7.72 | % | 7.65 | % | 6.05 | % | N/A | ||||||||||||
Expense Ratios | |||||||||||||||||||
Gross | 1.27% | 0.94% | |||||||||||||||||
With Applicable Waivers | 1.27% | 0.94% | |||||||||||||||||
Past performance is not indicative of future results. The performance data quoted represents past performance and current returns may be lower or higher. The investment return and principal value will fluctuate so that an investor's shares, when redeemed, may be worth more or less than the original cost. To obtain performance information current to the most recent month's end, please visit www.vcm.com.
The above expense ratios are from the Fund's prospectus dated March 1, 2019, as may be supplemented. Additional information pertaining to the Fund's expense ratios as of October 31, 2019 can be found in the financial highlights.
The maximum offering price (MOP) figures reflect a maximum sales charge of 2.00% for Class A Shares. NAV does not reflect sales charges.
The total return figures set forth above include all waivers of fees for various periods since inception. Without such fee waivers, the total returns would have been lower. Some fee waivers are voluntary and may be modified or terminated at any time.
Victory INCORE Investment Grade Convertible Fund — Growth of $10,000

(1)ICE BofAML Investment Grade U.S. Convertible 5% Constrained Index is a market capitalization-weighted index of domestic corporate convertible securities. Bonds and preferred stocks must be convertible only to common stock, ADR's or cash equivalent and have a market value of at least $50 million. Composed of Coupon, OID, or zero coupon convertible bonds rated by Moody's and/or S&P with an average rating of Baa3/BBB- or higher. This Index does not include the effect of expenses, is not representative of any specific fund or product and cannot be invested in directly.
The graph reflects investment growth of a hypothetical $10,000 investment in Class A Shares of the Fund. The performance of other classes of the Fund's shares will be greater than or less than the line shown based on the differences in loads and fees paid by shareholders investing in the different classes. Past performance is no guarantee of future results.
The graph and table do not reflect the deduction of taxes that a shareholder would pay on Fund distributions or the redemption of Fund shares.
22
| Victory Portfolios Victory Diversified Stock Fund | Schedule of Portfolio Investments October 31, 2019 | ||||||
(Amounts in Thousands, Except for Shares)
Security Description | Shares | Value | |||||||||
Common Stocks (96.6%) | |||||||||||
Communication Services (11.4%): | |||||||||||
Alphabet, Inc., Class C (a) | 9,168 | $ | 11,553 | ||||||||
Comcast Corp., Class A | 151,340 | 6,783 | |||||||||
Facebook, Inc., Class A (a) | 37,081 | 7,107 | |||||||||
Nexstar Media Group, Inc., Class A | 17,200 | 1,673 | |||||||||
The Walt Disney Co. | 20,585 | 2,674 | |||||||||
T-Mobile US, Inc. (a) | 49,760 | 4,113 | |||||||||
33,903 | |||||||||||
Communications Equipment (1.4%): | |||||||||||
Cisco Systems, Inc. | 90,098 | 4,281 | |||||||||
Consumer Discretionary (10.2%): | |||||||||||
Aaron's, Inc. | 54,615 | 4,092 | |||||||||
Amazon.com, Inc. (a) | 4,548 | 8,080 | |||||||||
Dollar General Corp. | 10,550 | 1,692 | |||||||||
DR Horton, Inc. | 80,104 | 4,195 | |||||||||
Group 1 Automotive, Inc. | 20,535 | 2,042 | |||||||||
Skechers USA, Inc., Class A (a) | 47,262 | 1,766 | |||||||||
Target Corp. | 37,022 | 3,958 | |||||||||
The Home Depot, Inc. | 18,499 | 4,340 | |||||||||
30,165 | |||||||||||
Consumer Staples (7.3%): | |||||||||||
Medifast, Inc. (b) | 30,562 | 3,391 | |||||||||
PepsiCo, Inc. | 30,150 | 4,136 | |||||||||
The Coca-Cola Co. | 82,283 | 4,478 | |||||||||
The Procter & Gamble Co. | 49,505 | 6,164 | |||||||||
US Foods Holding Corp. (a) | 44,749 | 1,775 | |||||||||
Walmart, Inc. | 15,006 | 1,760 | |||||||||
21,704 | |||||||||||
Electronic Equipment, Instruments & Components (5.2%): | |||||||||||
CDW Corp. | 38,683 | 4,948 | |||||||||
Jabil, Inc. | 114,805 | 4,227 | |||||||||
Tech Data Corp. (a) | 36,934 | 4,487 | |||||||||
Zebra Technologies Corp. (a) | 7,873 | 1,873 | |||||||||
15,535 | |||||||||||
Energy (4.3%): | |||||||||||
Chevron Corp. | 25,497 | 2,961 | |||||||||
Exxon Mobil Corp. | 63,254 | 4,275 | |||||||||
Phillips 66 | 23,926 | 2,795 | |||||||||
Valero Energy Corp. | 27,299 | 2,647 | |||||||||
12,678 | |||||||||||
Financials (11.9%): | |||||||||||
Ally Financial, Inc. | 133,066 | 4,075 | |||||||||
Ameriprise Financial, Inc. | 27,405 | 4,135 | |||||||||
Credit Acceptance Corp. (a) | 7,723 | 3,381 | |||||||||
Discover Financial Services | 50,195 | 4,029 | |||||||||
See notes to financial statements.
23
| Victory Portfolios Victory Diversified Stock Fund | Schedule of Portfolio Investments — continued October 31, 2019 | ||||||
(Amounts in Thousands, Except for Shares)
Security Description | Shares | Value | |||||||||
Essent Group Ltd. | 81,789 | $ | 4,260 | ||||||||
LPL Financial Holdings, Inc. | 50,591 | 4,090 | |||||||||
NMI Holdings, Inc., Class A (a) | 100,565 | 2,942 | |||||||||
Primerica, Inc. | 33,291 | 4,201 | |||||||||
Western Alliance Bancorp | 85,588 | 4,222 | |||||||||
35,335 | |||||||||||
Health Care (11.0%): | |||||||||||
AbbVie, Inc. | 69,256 | 5,510 | |||||||||
Anthem, Inc. | 14,710 | 3,958 | |||||||||
Biogen, Inc. (a) | 12,953 | 3,869 | |||||||||
Bristol-Myers Squibb Co. (b) | 84,848 | 4,868 | |||||||||
CVS Health Corp. | 78,682 | 5,224 | |||||||||
HCA Healthcare, Inc. | 25,175 | 3,362 | |||||||||
Jazz Pharmaceuticals PLC (a) | 19,879 | 2,497 | |||||||||
Medtronic PLC | 12,194 | 1,328 | |||||||||
UnitedHealth Group, Inc. | 7,916 | 2,000 | |||||||||
32,616 | |||||||||||
Industrials (9.9%): | |||||||||||
Air Lease Corp. | 101,942 | 4,483 | |||||||||
EMCOR Group, Inc. | 47,865 | 4,198 | |||||||||
Federal Signal Corp. (b) | 59,874 | 1,942 | |||||||||
Herman Miller, Inc. | 68,456 | 3,183 | |||||||||
L3Harris Technologies, Inc. | 18,745 | 3,867 | |||||||||
Lockheed Martin Corp. | 13,142 | 4,951 | |||||||||
SkyWest, Inc. | 55,258 | 3,291 | |||||||||
Universal Forest Products, Inc. | 70,326 | 3,542 | |||||||||
29,457 | |||||||||||
IT Services (7.1%): | |||||||||||
Booz Allen Hamilton Holdings Corp. | 19,834 | 1,396 | |||||||||
EPAM Systems, Inc. (a) | 14,633 | 2,575 | |||||||||
Euronet Worldwide, Inc. (a) | 17,660 | 2,474 | |||||||||
Fiserv, Inc. (a) | 38,603 | 4,097 | |||||||||
Mastercard, Inc., Class A | 8,474 | 2,346 | |||||||||
Visa, Inc., Class A | 30,505 | 5,455 | |||||||||
WNS Holdings Ltd., ADR (a) | 45,644 | 2,823 | |||||||||
21,166 | |||||||||||
Materials (1.0%): | |||||||||||
Vulcan Materials Co. | 20,345 | 2,907 | |||||||||
Real Estate (2.1%): | |||||||||||
CBRE Group, Inc., Class A (a) | 74,500 | 3,989 | |||||||||
Rexford Industrial Realty, Inc. | 43,910 | 2,112 | |||||||||
6,101 | |||||||||||
Semiconductors & Semiconductor Equipment (1.0%): | |||||||||||
Broadcom, Inc. | 9,708 | 2,843 | |||||||||
See notes to financial statements.
24
| Victory Portfolios Victory Diversified Stock Fund | Schedule of Portfolio Investments — continued October 31, 2019 | ||||||
(Amounts in Thousands, Except for Shares)
Security Description | Shares | Value | |||||||||
Software (7.4%): | |||||||||||
Adobe, Inc. (a) | 7,169 | $ | 1,992 | ||||||||
Microsoft Corp. | 115,497 | 16,558 | |||||||||
Oracle Corp. | 64,161 | 3,496 | |||||||||
22,046 | |||||||||||
Technology Hardware, Storage & Peripherals (5.4%): | |||||||||||
Apple, Inc. | 64,840 | 16,130 | |||||||||
Total Common Stocks (Cost $234,500) | 286,867 | ||||||||||
Exchange-Traded Funds (2.5%) | |||||||||||
SPDR S&P 500 ETF Trust | 24,608 | 7,464 | |||||||||
Total Exchange-Traded Funds (Cost $7,112) | 7,464 | ||||||||||
Collateral for Securities Loaned^ (2.0%) | |||||||||||
BlackRock Liquidity Funds TempFund, Institutional Class, 1.92% (c) | 708,483 | 708 | |||||||||
| Fidelity Investments Money Market Government Portfolio, Institutional Class, 1.75% (c) | 1,681,316 | 1,682 | |||||||||
| Fidelity Investments Money Market Prime Money Market Portfolio, Institutional Class, 1.87% (c) | 50,773 | 51 | |||||||||
| Goldman Sachs Financial Square Prime Obligations Fund, Institutional Class, 1.99% (c) | 961,139 | 961 | |||||||||
JPMorgan Prime Money Market Fund, Capital Class, 1.93% (c) | 1,112,963 | 1,113 | |||||||||
| Morgan Stanley Institutional Liquidity Prime Portfolio, Institutional Class, 1.97% (c) | 1,542,961 | 1,543 | |||||||||
Total Collateral for Securities Loaned (Cost $6,058) | 6,058 | ||||||||||
Total Investments (Cost $247,670) — 101.1% | 300,389 | ||||||||||
Liabilities in excess of other assets — (1.1)% | (3,373 | ) | |||||||||
NET ASSETS — 100.00% | $ | 297,016 | |||||||||
^ Purchased with cash collateral from securities on loan.
(a) Non-income producing security.
(b) All or a portion of this security is on loan.
(c) Rate disclosed is the daily yield on October 31, 2019.
ADR — American Depositary Receipt
ETF — Exchange-Traded Fund
PLC — Public Limited Company
See notes to financial statements.
25
| Victory Portfolios Victory NewBridge Large Cap Growth Fund | Schedule of Portfolio Investments October 31, 2019 | ||||||
(Amounts in Thousands, Except for Shares)
Security Description | Shares | Value | |||||||||
Common Stocks (93.9%) | |||||||||||
Communication Services (13.3%): | |||||||||||
Activision Blizzard, Inc. | 10,191 | $ | 571 | ||||||||
Alphabet, Inc., Class C (a) | 614 | 774 | |||||||||
Facebook, Inc., Class A (a) | 4,125 | 790 | |||||||||
2,135 | |||||||||||
Consumer Discretionary (20.6%): | |||||||||||
Alibaba Group Holding Ltd., ADR (a) | 3,904 | 690 | |||||||||
Amazon.com, Inc. (a) | 610 | 1,084 | |||||||||
Burlington Stores, Inc. (a) | 2,972 | 571 | |||||||||
Lululemon Athletica, Inc. (a) | 3,533 | 722 | |||||||||
Ulta Salon, Cosmetics & Fragrance, Inc. (a) | 970 | 226 | |||||||||
3,293 | |||||||||||
Electronic Equipment, Instruments & Components (2.6%): | |||||||||||
Keysight Technologies, Inc. (a) | 4,062 | 410 | |||||||||
Financials (4.7%): | |||||||||||
CME Group, Inc. | 2,006 | 413 | |||||||||
MSCI, Inc. | 1,450 | 340 | |||||||||
753 | |||||||||||
Health Care (16.8%): | |||||||||||
Edwards Lifesciences Corp. (a) | 2,366 | 564 | |||||||||
Illumina, Inc. (a) | 1,033 | 305 | |||||||||
UnitedHealth Group, Inc. | 2,169 | 548 | |||||||||
Veeva Systems, Inc., Class A (a) | 3,973 | 563 | |||||||||
Zoetis, Inc. | 5,583 | 714 | |||||||||
2,694 | |||||||||||
Industrials (6.0%): | |||||||||||
CoStar Group, Inc. (a) | 1,048 | 576 | |||||||||
Union Pacific Corp. | 2,305 | 381 | |||||||||
957 | |||||||||||
IT Services (13.2%): | |||||||||||
EPAM Systems, Inc. (a) | 2,424 | 427 | |||||||||
PayPal Holdings, Inc. (a) | 5,490 | 571 | |||||||||
Visa, Inc., Class A | 6,310 | 1,128 | |||||||||
2,126 | |||||||||||
Semiconductors & Semiconductor Equipment (7.3%): | |||||||||||
KLA Corp. | 2,725 | 461 | |||||||||
Nvidia Corp. | 3,553 | 714 | |||||||||
1,175 | |||||||||||
See notes to financial statements.
26
| Victory Portfolios Victory NewBridge Large Cap Growth Fund | Schedule of Portfolio Investments — continued October 31, 2019 | ||||||
(Amounts in Thousands, Except for Shares)
Security Description | Shares | Value | |||||||||
Software (9.4%): | |||||||||||
Proofpoint, Inc. (a) (b) | 2,461 | $ | 284 | ||||||||
Salesforce.com, Inc. (a) | 3,072 | 481 | |||||||||
ServiceNow, Inc. (a) | 3,045 | 753 | |||||||||
1,518 | |||||||||||
Total Common Stocks (Cost $8,833) | 15,061 | ||||||||||
Exchange-Traded Funds (3.5%) | |||||||||||
iShares Russell 1000 Growth ETF | 3,409 | 560 | |||||||||
Total Exchange-Traded Funds (Cost $552) | 560 | ||||||||||
Collateral for Securities Loaned^ (1.0%) | |||||||||||
BlackRock Liquidity Funds TempFund, Institutional Class, 1.92% (c) | 18,426 | 19 | |||||||||
| Fidelity Investments Money Market Government Portfolio, Institutional Class, 1.75% (c) | 43,727 | 44 | |||||||||
| Fidelity Investments Money Market Prime Money Market Portfolio, Institutional Class, 1.87% (c) | 1,320 | 1 | |||||||||
| Goldman Sachs Financial Square Prime Obligations Fund, Institutional Class, 1.99% (c) | 24,997 | 25 | |||||||||
JPMorgan Prime Money Market Fund, Capital Class, 1.93% (c) | 28,945 | 29 | |||||||||
| Morgan Stanley Institutional Liquidity Prime Portfolio, Institutional Class, 1.97% (c) | 40,128 | 40 | |||||||||
Total Collateral for Securities Loaned (Cost $158) | 158 | ||||||||||
Total Investments (Cost $9,543) — 98.4% | 15,779 | ||||||||||
Other assets in excess of liabilities — 1.6% | 262 | ||||||||||
NET ASSETS — 100.00% | $ | 16,041 | |||||||||
^ Purchased with cash collateral from securities on loan.
(a) Non-income producing security.
(b) All or a portion of this security is on loan.
(c) Rate disclosed is the daily yield on October 31, 2019.
ADR — American Depositary Receipt
ETF — Exchange-Traded Fund
See notes to financial statements.
27
| Victory Portfolios Victory Special Value Fund | Schedule of Portfolio Investments October 31, 2019 | ||||||
(Amounts in Thousands, Except for Shares)
Security Description | Shares | Value | |||||||||
Common Stocks (97.2%) | |||||||||||
Communication Services (11.5%): | |||||||||||
Alphabet, Inc., Class C (a) | 1,684 | $ | 2,122 | ||||||||
Comcast Corp., Class A | 27,664 | 1,240 | |||||||||
Facebook, Inc., Class A (a) | 7,032 | 1,348 | |||||||||
Nexstar Media Group, Inc., Class A | 3,129 | 304 | |||||||||
The Walt Disney Co. | 3,783 | 491 | |||||||||
T-Mobile US, Inc. (a) | 8,732 | 722 | |||||||||
6,227 | |||||||||||
Communications Equipment (1.4%): | |||||||||||
Cisco Systems, Inc. | 16,424 | 780 | |||||||||
Consumer Discretionary (10.2%): | |||||||||||
Aaron's, Inc. | 9,913 | 743 | |||||||||
Amazon.com, Inc. (a) | 835 | 1,484 | |||||||||
Dollar General Corp. | 1,913 | 307 | |||||||||
DR Horton, Inc. | 14,652 | 767 | |||||||||
Group 1 Automotive, Inc. | 3,764 | 374 | |||||||||
Skechers USA, Inc., Class A (a) | 8,584 | 321 | |||||||||
Target Corp. | 6,772 | 724 | |||||||||
The Home Depot, Inc. | 3,381 | 793 | |||||||||
5,513 | |||||||||||
Consumer Staples (7.4%): | |||||||||||
Medifast, Inc. (b) | 5,602 | 621 | |||||||||
PepsiCo, Inc. | 5,530 | 759 | |||||||||
The Coca-Cola Co. | 15,050 | 819 | |||||||||
The Procter & Gamble Co. | 9,016 | 1,123 | |||||||||
US Foods Holding Corp. (a) | 8,140 | 323 | |||||||||
Walmart, Inc. | 2,733 | 320 | |||||||||
3,965 | |||||||||||
Electronic Equipment, Instruments & Components (5.3%): | |||||||||||
CDW Corp. | 7,085 | 907 | |||||||||
Jabil, Inc. | 20,960 | 772 | |||||||||
Tech Data Corp. (a) (b) | 6,744 | 819 | |||||||||
Zebra Technologies Corp. (a) | 1,443 | 343 | |||||||||
2,841 | |||||||||||
Energy (4.3%): | |||||||||||
Chevron Corp. | 4,670 | 542 | |||||||||
Exxon Mobil Corp. | 11,609 | 785 | |||||||||
Phillips 66 | 4,373 | 511 | |||||||||
Valero Energy Corp. | 4,775 | 463 | |||||||||
2,301 | |||||||||||
Financials (11.9%): | |||||||||||
Ally Financial, Inc. | 23,513 | 720 | |||||||||
Ameriprise Financial, Inc. | 5,030 | 759 | |||||||||
Credit Acceptance Corp. (a) | 1,404 | 615 | |||||||||
Discover Financial Services | 9,181 | 736 | |||||||||
See notes to financial statements.
28
| Victory Portfolios Victory Special Value Fund | Schedule of Portfolio Investments — continued October 31, 2019 | ||||||
(Amounts in Thousands, Except for Shares)
Security Description | Shares | Value | |||||||||
Essent Group Ltd. | 14,399 | $ | 750 | ||||||||
LPL Financial Holdings, Inc. | 9,174 | 742 | |||||||||
NMI Holdings, Inc., Class A (a) | 18,369 | 537 | |||||||||
Primerica, Inc. | 6,079 | 767 | |||||||||
Western Alliance Bancorp | 15,522 | 766 | |||||||||
6,392 | |||||||||||
Health Care (11.1%): | |||||||||||
AbbVie, Inc. | 12,601 | 1,003 | |||||||||
Anthem, Inc. | 2,688 | 723 | |||||||||
Biogen, Inc. (a) | 2,358 | 704 | |||||||||
Bristol-Myers Squibb Co. (b) | 15,576 | 893 | |||||||||
CVS Health Corp. | 14,367 | 955 | |||||||||
HCA Healthcare, Inc. | 4,629 | 618 | |||||||||
Jazz Pharmaceuticals PLC (a) | 3,636 | 457 | |||||||||
Medtronic PLC | 2,241 | 244 | |||||||||
UnitedHealth Group, Inc. | 1,445 | 365 | |||||||||
5,962 | |||||||||||
Industrials (10.0%): | |||||||||||
Air Lease Corp. | 18,450 | 811 | |||||||||
EMCOR Group, Inc. (b) | 8,726 | 765 | |||||||||
Federal Signal Corp. | 10,966 | 356 | |||||||||
Herman Miller, Inc. | 12,443 | 579 | |||||||||
L3Harris Technologies, Inc. | 3,428 | 707 | |||||||||
Lockheed Martin Corp. | 2,408 | 907 | |||||||||
SkyWest, Inc. | 10,123 | 603 | |||||||||
Universal Forest Products, Inc. | 12,773 | 643 | |||||||||
5,371 | |||||||||||
IT Services (7.1%): | |||||||||||
Booz Allen Hamilton Holdings Corp. | 3,644 | 256 | |||||||||
EPAM Systems, Inc. (a) | 2,673 | 470 | |||||||||
Euronet Worldwide, Inc. (a) | 3,236 | 453 | |||||||||
Fiserv, Inc. (a) | 7,048 | 748 | |||||||||
Mastercard, Inc., Class A | 1,502 | 416 | |||||||||
Visa, Inc., Class A | 5,573 | 998 | |||||||||
WNS Holdings Ltd., ADR (a) | 8,379 | 518 | |||||||||
3,859 | |||||||||||
Materials (1.0%): | |||||||||||
Vulcan Materials Co. | 3,695 | 528 | |||||||||
Real Estate (2.1%): | |||||||||||
CBRE Group, Inc., Class A (a) | 14,116 | 756 | |||||||||
Rexford Industrial Realty, Inc. | 8,062 | 388 | |||||||||
1,144 | |||||||||||
Semiconductors & Semiconductor Equipment (1.0%): | |||||||||||
Broadcom, Inc. | 1,767 | 517 | |||||||||
See notes to financial statements.
29
| Victory Portfolios Victory Special Value Fund | Schedule of Portfolio Investments — continued October 31, 2019 | ||||||
(Amounts in Thousands, Except for Shares)
Security Description | Shares | Value | |||||||||
Software (7.4%): | |||||||||||
Adobe, Inc. (a) | 1,359 | $ | 378 | ||||||||
Microsoft Corp. | 21,090 | 3,023 | |||||||||
Oracle Corp. | 11,779 | 642 | |||||||||
4,043 | |||||||||||
Technology Hardware, Storage & Peripherals (5.5%): | |||||||||||
Apple, Inc. | 11,906 | 2,962 | |||||||||
Total Common Stocks (Cost $43,817) | 52,405 | ||||||||||
Exchange-Traded Funds (1.8%) | |||||||||||
SPDR S&P 500 ETF Trust | 3,278 | 994 | |||||||||
Total Exchange-Traded Funds (Cost $963) | 994 | ||||||||||
Collateral for Securities Loaned^ (2.4%) | |||||||||||
BlackRock Liquidity Funds TempFund, Institutional Class, 1.92% (c) | 151,347 | 151 | |||||||||
| Fidelity Investments Money Market Government Portfolio, Institutional Class, 1.75% (c) | 359,165 | 359 | |||||||||
| Fidelity Investments Money Market Prime Money Market Portfolio, Institutional Class, 1.87% (c) | 10,846 | 11 | |||||||||
| Goldman Sachs Financial Square Prime Obligations Fund, Institutional Class, 1.99% (c) | 205,320 | 205 | |||||||||
JPMorgan Prime Money Market Fund, Capital Class, 1.93% (c) | 237,753 | 238 | |||||||||
| Morgan Stanley Institutional Liquidity Prime Portfolio, Institutional Class, 1.97% (c) | 329,609 | 330 | |||||||||
Total Collateral for Securities Loaned (Cost $1,294) | 1,294 | ||||||||||
Total Investments (Cost $46,074) — 101.4% | 54,693 | ||||||||||
Liabilities in excess of other assets — (1.4)% | (756 | ) | |||||||||
NET ASSETS — 100.00% | $ | 53,937 | |||||||||
^ Purchased with cash collateral from securities on loan.
(a) Non-income producing security.
(b) All or a portion of this security is on loan.
(c) Rate disclosed is the daily yield on October 31, 2019.
ADR — American Depositary Receipt
ETF — Exchange-Traded Fund
PLC — Public Limited Company
See notes to financial statements.
30
| Victory Portfolios Victory Strategic Allocation Fund | Schedule of Portfolio Investments October 31, 2019 | ||||||
(Amounts in Thousands, Except for Shares)
Security Description | Shares | Value | |||||||||
Affiliated Exchange-Traded Funds (17.6%) | |||||||||||
VictoryShares International Volatility Wtd ETF | 46,760 | $ | 1,807 | ||||||||
VictoryShares US Multi-Factor Minimum Volatility ETF | 56,070 | 1,802 | |||||||||
VictoryShares US Small Cap Volatility Wtd ETF | 18,886 | 889 | |||||||||
Total Affiliated Exchange-Traded Funds (Cost $3,628) | 4,498 | ||||||||||
Affiliated Mutual Funds (81.9%) | |||||||||||
Victory INCORE Total Return Bond Fund, Class R6 | 327,577 | 3,151 | |||||||||
Victory Integrity Discovery Fund, Class Y | 25,783 | 929 | |||||||||
Victory Market Neutral Income Fund, Class I | 566,374 | 5,437 | |||||||||
Victory RS Global Fund, Class Y (a) | 534,655 | 7,443 | |||||||||
Victory Sophus Emerging Markets Small Cap Fund, Class Y | 295,309 | 2,061 | |||||||||
Victory Trivalent Emerging Markets Small-Cap Fund, Class Y | 173,962 | 1,968 | |||||||||
Total Affiliated Mutual Funds (Cost $21,323) | 20,989 | ||||||||||
Total Investments (Cost $24,951) — 99.5% | 25,487 | ||||||||||
Other assets in excess of liabilities — 0.5% | 122 | ||||||||||
NET ASSETS — 100.00% | $ | 25,609 | |||||||||
(a) Represents investments greater than 25% of the Fund's net assets. Performance of the Fund may be adversely impacted by concentrated investments in securities. The financial statements and portfolio holdings for these securities can be found at www.sec.gov.
ETF — Exchange-Traded Fund
See notes to financial statements.
31
| Victory Portfolios Victory INCORE Fund for Income | Schedule of Portfolio Investments October 31, 2019 | ||||||
(Amounts in Thousands, Except for Shares)
Security Description | Principal Amount | Value | |||||||||
Government National Mortgage Association (84.2%) | |||||||||||
Multi-family (0.9%): | |||||||||||
Collateralized Mortgage Obligations (0.6%): | |||||||||||
Government National Mortgage Assoc. | |||||||||||
Series 2010-136, Class BH, 7.00%, 11/16/40 | $ | 29 | $ | 29 | |||||||
Series 2012-33, Class AB, 7.00%, 3/16/46 | 4,096 | 4,512 | |||||||||
Series 2012-67, Class AF, 7.00%, 4/16/44 | 138 | 138 | |||||||||
4,679 | |||||||||||
Pass-throughs (0.3%): | |||||||||||
Government National Mortgage Assoc. | |||||||||||
7.49%, 8/15/20 – 11/15/20 | 16 | 16 | |||||||||
7.50%, 8/15/21 | 8 | 9 | |||||||||
7.92%, 7/1/23 | 254 | 255 | |||||||||
8.00%, 1/15/31 – 11/15/33 | 1,164 | 1,164 | |||||||||
7.75%, 9/15/33 | 415 | 416 | |||||||||
1,860 | |||||||||||
Single Family (83.3%): | |||||||||||
Collateralized Mortgage Obligations (4.0%): | |||||||||||
Government National Mortgage Assoc. | |||||||||||
Series 1994-7, Class PQ, 6.50%, 10/16/24 | 137 | 137 | |||||||||
Series 1997-8, Class PN, 7.50%, 5/16/27 | 31 | 31 | |||||||||
Series 1999-4, Class ZB, 6.00%, 2/20/29 | 258 | 258 | |||||||||
Series 2001-10, Class PE, 6.50%, 3/16/31 | 195 | 195 | |||||||||
Series 2002-22, Class GF, 6.50%, 3/20/32 | 34 | 34 | |||||||||
Series 2002-33, Class ZJ, 6.50%, 5/20/32 | 97 | 112 | |||||||||
Series 2005-74, Class HB, 7.50%, 9/16/35 | 16 | 18 | |||||||||
Series 2005-74, Class HC, 7.50%, 9/16/35 | 76 | 88 | |||||||||
Series 2011-166, Class NT, 7.75%, 11/20/31 (a) | 1,133 | 1,304 | |||||||||
Series 2012-106, Class JM, 7.31%, 10/20/34 (a) | 896 | 1,029 | |||||||||
Series 2012-30, Class WB, 7.09%, 11/20/39 (a) | 3,622 | 4,107 | |||||||||
Series 2013-190, Class KT, 8.12%, 9/20/30 (a) | 657 | 723 | |||||||||
Series 2013-51, Class BL, 6.08%, 4/20/34 (a) | 2,476 | 2,800 | |||||||||
Series 2013-64, Class KY, 6.89%, 12/20/38 (a) | 1,503 | 1,742 | |||||||||
Series 2013-70, Class KP, 7.05%, 2/20/39 (a) | 1,281 | 1,479 | |||||||||
Series 2014-69, Class W, 7.23%, 11/20/34 (a) | 184 | 212 | |||||||||
Series 2014-74, Class PT, 7.77%, 5/16/44 (a) | 322 | 368 | |||||||||
Series 2015-55, Class PT, 7.81%, 6/20/39 (a) | 841 | 938 | |||||||||
Series 2019-22, Class PT, 7.91%, 2/20/49 (a) | 11,208 | 12,786 | |||||||||
28,361 | |||||||||||
See notes to financial statements.
32
| Victory Portfolios Victory INCORE Fund for Income | Schedule of Portfolio Investments — continued October 31, 2019 | ||||||
(Amounts in Thousands, Except for Shares)
Security Description | Shares or Principal Amount | Value | |||||||||
Pass-throughs (79.3%): | |||||||||||
Government National Mortgage Assoc. | |||||||||||
7.75%, 11/15/20 | $ | 54 | $ | 54 | |||||||
10.50%, 12/15/20 | — | (b) | — | (b) | |||||||
| 6.00%, 1/15/22 – 6/15/41 (c) | 43,145 | 49,371 | |||||||||
7.95%, 9/15/22 | 17 | 17 | |||||||||
7.13%, 3/15/23 – 7/15/25 | 859 | 889 | |||||||||
5.50%, 7/15/23 | 27 | 29 | |||||||||
6.50%, 8/20/23 – 2/20/41 (c) | 166,959 | 191,770 | |||||||||
| 7.00%, 12/15/23 – 1/15/39 | 122,158 | 141,409 | |||||||||
8.00%, 11/20/24 – 5/15/49 | 50,439 | 59,083 | |||||||||
10.00%, 4/15/25 – 2/15/26 | 144 | 146 | |||||||||
9.50%, 7/15/25 | — | (b) | — | (b) | |||||||
7.50%, 8/15/26 – 11/15/49 (c) | 97,133 | 111,615 | |||||||||
6.13%, 6/20/28 – 9/20/29 | 482 | 509 | |||||||||
6.28%, 10/20/28 – 10/20/29 | 886 | 958 | |||||||||
6.10%, 5/20/29 – 7/20/31 | 761 | 825 | |||||||||
7.30%, 4/20/30 – 2/20/31 | 359 | 376 | |||||||||
9.00%, 5/15/30 | 2,679 | 3,063 | |||||||||
6.49%, 5/20/31 – 3/20/32 | 1,139 | 1,244 | |||||||||
8.50%, 6/15/31 – 7/15/32 | 6,086 | 6,948 | |||||||||
568,306 | |||||||||||
Total Government National Mortgage Association (Cost $604,048) | 603,206 | ||||||||||
U.S. Treasury Obligations (15.5%) | |||||||||||
U.S. Treasury Bills, 1.53%, 3/26/20 (d) | 41,102 | 40,847 | |||||||||
U.S. Treasury Bonds, 8.00%, 11/15/21 | 62,256 | 70,232 | |||||||||
Total U.S. Treasury Obligations (Cost $111,245) | 111,079 | ||||||||||
Investment Companies (0.0%) (e) | |||||||||||
BlackRock Liquidity Funds Fedfund Portfolio, 1.85% | 100,001 | 100 | |||||||||
Total Investment Companies (Cost $100) | 100 | ||||||||||
Total Investments (Cost $715,393) — 99.7% | 714,385 | ||||||||||
Other assets in excess of liabilities — 0.3% | 1,871 | ||||||||||
NET ASSETS — 100.00% | $ | 716,256 | |||||||||
(a) The rate for certain asset-backed and mortgage backed securities may vary based on factors relating to the pool of assets underlying the security. The rate disclosed is the rate in effect at October 31, 2019.
(b) Rounds to less than $1.
(c) All or a portion of this security has been segregated as collateral for securities purchased on a when-issued basis.
(d) Rate represents the effective yield at October 31, 2019.
(e) Amount represents less than 0.05% of net assets.
See notes to financial statements.
33
| Victory Portfolios Victory INCORE Investment Grade Convertible Fund | Schedule of Portfolio Investments October 31, 2019 | ||||||
(Amounts in Thousands, Except for Shares)
Security Description | Principal Amount | Value | |||||||||
Convertible Corporate Bonds (68.2%) | |||||||||||
Communication Services (0.6%): | |||||||||||
Snap, Inc., 0.75%, 8/1/26 (a) | $ | 1,595 | $ | 1,616 | |||||||
Consumer Discretionary (4.8%): | |||||||||||
Booking Holdings, Inc., 0.90%, 9/15/21 (b) | 1,005 | 1,181 | |||||||||
The Priceline Group, Inc., Convertible Subordinated Notes, 0.35%, 6/15/20 | 7,920 | 12,337 | |||||||||
13,518 | |||||||||||
Financials (14.7%): | |||||||||||
Ares Capital Corp. | |||||||||||
3.75%, 2/1/22 | 7,085 | 7,324 | |||||||||
4.63%, 3/1/24 | 3,345 | 3,536 | |||||||||
BlackRock Capital Investment Corp., 5.00%, 6/15/22 | 3,712 | 3,707 | |||||||||
Blackstone Mortgage Trust, Inc., 4.75%, 3/15/23 | 1,500 | 1,583 | |||||||||
JPMorgan Chase Financial Co. LLC, 0.25%, 5/1/23 (a) | 9,355 | 9,525 | |||||||||
MGIC Investment Corp., 9.00%, 4/1/63 (a) | 4,127 | 5,591 | |||||||||
Prospect Capital Corp. | |||||||||||
4.75%, 4/15/20 | 1,494 | 1,504 | |||||||||
4.95%, 7/15/22, Callable 4/15/22 @ 100 (b) | 5,923 | 6,085 | |||||||||
TPG Specialty Lending, Inc., 4.50%, 8/1/22 | 2,285 | 2,406 | |||||||||
41,261 | |||||||||||
Health Care (15.7%): | |||||||||||
ALZA Corp., 7/28/20, Callable 11/21/19 @ 97.95 (c) | 3,916 | 7,119 | |||||||||
Anthem, Inc., 2.75%, 10/15/42 | 338 | 1,277 | |||||||||
| Bristol-Myers Squibb Co., Convertible Subordinated Notes, 1.62%(LIBOR03M-50bps), 9/15/23, Callable 12/6/19 @ 100 (d) (e) | 2,466 | 3,583 | |||||||||
| Danaher Corp., Convertible Subordinated Notes, 1/22/21, Callable 11/21/19 @ 97.26 (c) | 1,161 | 6,115 | |||||||||
Illumina, Inc., Convertible Subordinated Notes, 0.50%, 6/15/21 (b) | 8,800 | 11,412 | |||||||||
Teladoc Health, Inc., 3.00%, 12/15/22 | 500 | 938 | |||||||||
WellPoint, Inc., Convertible Subordinated Notes, 2.75%, 10/15/42 | 3,611 | 13,641 | |||||||||
44,085 | |||||||||||
Industrials (7.3%): | |||||||||||
Dycom Industries, Inc., 0.75%, 9/15/21 | 2,355 | 2,225 | |||||||||
Fortive Corp., 0.88%, 2/15/22 (a) | 12,280 | 12,107 | |||||||||
Macquarie Infrastructure, 2.00%, 10/1/23 | 6,441 | 6,063 | |||||||||
20,395 | |||||||||||
Information Technology (17.9%): | |||||||||||
Akamai Technologies, Inc., 0.13%, 5/1/25 | 2,645 | 2,961 | |||||||||
Euronet Worldwide, Inc., 0.75%, 3/15/49, Callable 3/20/25 @ 100 (a) (b) | 2,130 | 2,422 | |||||||||
Intel Corp., 3.25%, 8/1/39 (a) | 5,178 | 14,341 | |||||||||
Novellus Systems, Inc., Convertible Subordinated Notes, 2.63%, 5/15/41 | 1,910 | 16,090 | |||||||||
ON Semiconductor Corp., 1.00%, 12/1/20 | 1,825 | 2,215 | |||||||||
ON Semiconductor Corp., 1.63%, 10/15/23 | 660 | 821 | |||||||||
Palo Alto Networks. Inc., 0.75%, 7/1/23 | 1,365 | 1,499 | |||||||||
ServiceNow, Inc., 0.00%, 6/1/22 | 300 | 562 | |||||||||
Western Digital Corp., 1.50%, 2/1/24 | 9,489 | 9,037 | |||||||||
49,948 | |||||||||||
See notes to financial statements.
34
| Victory Portfolios Victory INCORE Investment Grade Convertible Fund | Schedule of Portfolio Investments — continued October 31, 2019 | ||||||
(Amounts in Thousands, Except for Shares)
| Shares or Security Description | Principal Amount | Value | |||||||||
Real Estate (7.2%): | |||||||||||
Spirit Realty Capital, Inc., 3.75%, 5/15/21 | $ | 9,175 | $ | 9,476 | |||||||
VEREIT, Inc., 3.75%, 12/15/20 | 10,652 | 10,798 | |||||||||
20,274 | |||||||||||
Total Convertible Corporate Bonds (Cost $171,424) | 191,097 | ||||||||||
Convertible Preferred Stocks (26.4%) | |||||||||||
Financials (10.1%): | |||||||||||
AMG Capital Trust II, 10/15/37 | 133,024 | 6,336 | |||||||||
Bank of America Corp., Series L, 0.02% | 3,805 | 5,771 | |||||||||
New York Community Capital Trust, 11/1/51 | 67,654 | 3,433 | |||||||||
Wells Fargo & Co., Series L, 0.12% | 8,524 | 12,867 | |||||||||
28,407 | |||||||||||
Health Care (0.7%): | |||||||||||
Becton, Dickinson and Co., Series A, 5/1/20 | 20,150 | 1,243 | |||||||||
Danaher Corp., Series A, 0.06%, 4/15/22 | 695 | 772 | |||||||||
2,015 | |||||||||||
Industrials (2.7%): | |||||||||||
Stanley Black & Decker, Inc., 2.62%, 5/15/20 | 73,195 | 7,461 | |||||||||
Utilities (12.9%): | |||||||||||
American Electric Power Co., Inc., 4.87%, 3/15/22 | 98,985 | 5,443 | |||||||||
CenterPoint Energy, Inc., 9/15/29 | 80,000 | 4,635 | |||||||||
Dominion Energy, Inc., Series A, 6/1/22 | 100,003 | 10,722 | |||||||||
DTE Energy Co., 7.96% | 39,130 | 1,987 | |||||||||
NextEra Energy, Inc., 9.83% | 97,870 | 4,978 | |||||||||
Southern Co., 4.59% | 158,445 | 8,422 | |||||||||
36,187 | |||||||||||
Total Convertible Preferred Stocks (Cost $70,118) | 74,070 | ||||||||||
Collateral for Securities Loaned^ (3.1%) | |||||||||||
BlackRock Liquidity Funds TempFund, Institutional Class, 1.92% (f) | 1,030,558 | 1,030 | |||||||||
| Fidelity Investments Money Market Prime Money Market Portfolio, Institutional Class, 1.87% (f) | 73,855 | 74 | |||||||||
| Fidelity Investments Money Market Government Portfolio, Institutional Shares, 1.75% (f) | 2,445,639 | 2,446 | |||||||||
| Goldman Sachs Financial Square Prime Obligations Fund, Institutional Class, 1.99% (f) | 1,398,070 | 1,398 | |||||||||
JPMorgan Prime Money Market Fund, Capital Class, 1.93% (f) | 1,618,914 | 1,619 | |||||||||
| Morgan Stanley Institutional Liquidity Prime Portfolio, Institutional Class, 1.97% (f) | 2,244,388 | 2,244 | |||||||||
Total Collateral for Securities Loaned (Cost $8,811) | 8,811 | ||||||||||
Total Investments (Cost $250,353) — 97.7% | 273,978 | ||||||||||
Other assets in excess of liabilities — 2.3% | 6,352 | ||||||||||
NET ASSETS — 100.00% | $ | 280,330 | |||||||||
See notes to financial statements.
35
| Victory Portfolios Victory INCORE Investment Grade Convertible Fund | Schedule of Portfolio Investments — continued October 31, 2019 | ||||||
(Amounts in Thousands, Except for Shares)
^ Purchased with cash collateral from securities on loan.
(a) Rule 144A security or other security that is restricted as to resale to institutional investors. The Fund's Adviser has deemed this security to be liquid based upon procedures approved by the Board of Trustees. As of October 31, 2019, the fair value of these securities was $45,602 (thousands) and amounted to 16.3% of net assets.
(b) All or a portion of this security is on loan.
(c) Continuously callable with 15 days notice.
(d) Variable or Floating-Rate Security. Rate disclosed is as of October 31, 2019.
(e) Continuously callable with 30 days notice.
(f) Rate disclosed is the daily yield on October 31, 2019.
bps — Basis points
LIBOR — London InterBank Offered Rate
LIBOR03M — 3 Month US Dollar LIBOR, rate disclosed as of October 31, 2019, based on the last reset date of the security
LLC — Limited Liability Company
See notes to financial statements.
36
Victory Portfolios | Statements of Assets and Liabilities October 31, 2019 | ||||||
(Amounts in Thousands, Except Per Share Amounts)
| Victory Diversified Stock Fund | Victory NewBridge Large Cap Growth Fund | Victory Special Value Fund | |||||||||||||
ASSETS: | |||||||||||||||
| Investments, at value (Cost $247,670, $9,543 and $46,074) | $ | 300,389 | (a) | $ | 15,779 | (b) | $ | 54,693 | (c) | ||||||
Cash and cash equivalents | 2,342 | 458 | 75 | ||||||||||||
Interest and dividends receivable | 232 | 2 | 42 | ||||||||||||
Receivable for capital shares issued | 18 | — | 185 | ||||||||||||
Receivable for investments sold | 1,021 | — | 561 | ||||||||||||
Receivable from Adviser | 10 | 28 | 16 | ||||||||||||
Prepaid expenses | 16 | 5 | 16 | ||||||||||||
Total Assets | 304,028 | 16,272 | 55,588 | ||||||||||||
LIABILITIES: | |||||||||||||||
Payables: | |||||||||||||||
Collateral received on loaned securities | 6,058 | 158 | 1,294 | ||||||||||||
Investments purchased | 205 | — | 37 | ||||||||||||
Capital shares redeemed | 473 | 47 | 248 | ||||||||||||
Accrued expenses and other payables: | |||||||||||||||
Investment advisory fees | 161 | 10 | 34 | ||||||||||||
Administration fees | 15 | 2 | 4 | ||||||||||||
Custodian fees | 2 | — | (d) | 1 | |||||||||||
Transfer agent fees | 39 | 3 | 14 | ||||||||||||
Chief Compliance Officer fees | — | (d) | — | (d) | — | (d) | |||||||||
Trustees' fees | 1 | — | (d) | — | (d) | ||||||||||
| 12b-1 fees | 35 | 1 | 8 | ||||||||||||
Other accrued expenses | 23 | 10 | 11 | ||||||||||||
Total Liabilities | 7,012 | 231 | 1,651 | ||||||||||||
NET ASSETS: | |||||||||||||||
Capital | 226,317 | 6,840 | 43,798 | ||||||||||||
Total distributable earnings/(loss) | 70,699 | 9,201 | 10,139 | ||||||||||||
Net Assets | $ | 297,016 | $ | 16,041 | $ | 53,937 | |||||||||
Net Assets | |||||||||||||||
Class A Shares | $ | 204,945 | $ | 5,732 | $ | 27,818 | |||||||||
Class C Shares | 5,909 | 1,768 | 1,241 | ||||||||||||
Class I Shares | 31,619 | 6,043 | 3,274 | ||||||||||||
Class R Shares | 47,981 | — | 21,084 | ||||||||||||
Class R6 Shares | 2,313 | — | — | ||||||||||||
Class Y Shares | 4,249 | 2,498 | 520 | ||||||||||||
Total | $ | 297,016 | $ | 16,041 | $ | 53,937 | |||||||||
| Shares (unlimited number of shares authorized with a par value of $0.001 per share): | |||||||||||||||
Class A Shares | 11,612 | 1,037 | 1,079 | ||||||||||||
Class C Shares | 359 | 728 | 55 | ||||||||||||
Class I Shares | 1,795 | 986 | 125 | ||||||||||||
Class R Shares | 2,776 | — | 859 | ||||||||||||
Class R6 Shares | 131 | — | — | ||||||||||||
Class Y Shares | 241 | 426 | 20 | ||||||||||||
Total | 16,914 | 3,177 | 2,138 | ||||||||||||
(continues on next page)
See notes to financial statements.
37
Victory Portfolios | Statements of Assets and Liabilities October 31, 2019 | ||||||
(Amounts in Thousands, Except Per Share Amounts) (continued)
| Victory Diversified Stock Fund | Victory NewBridge Large Cap Growth Fund | Victory Special Value Fund | |||||||||||||
| Net asset value, offering (except Class A Shares) and redemption price per share: (e) | |||||||||||||||
Class A Shares | $ | 17.65 | $ | 5.52 | $ | 25.78 | |||||||||
Class C Shares (f) | 16.46 | 2.43 | 22.54 | ||||||||||||
Class I Shares | 17.61 | 6.13 | 26.13 | ||||||||||||
Class R Shares | 17.29 | — | 24.55 | ||||||||||||
Class R6 Shares | 17.62 | — | — | ||||||||||||
Class Y Shares | 17.65 | 5.86 | 25.98 | ||||||||||||
Maximum Sales Charge — Class A Shares | 5.75 | % | 5.75 | % | 5.75 | % | |||||||||
| Maximum offering price (100%/(100%-maximum sales charge) of net asset value adjusted to the nearest cent) per share — Class A Shares | $ | 18.73 | $ | 5.86 | $ | 27.35 | |||||||||
(a) Includes $5,871of securities on loan.
(b) Includes $151 of securities on loan.
(c) Includes $1,224 of securities on loan.
(d) Rounds to less than $1.
(e) Per share amount may not recalculate due to rounding of net assets and/or shares outstanding.
(f) Redemption price per share varies by the length of time shares are held.
See notes to financial statements.
38
Victory Portfolios | Statements of Assets and Liabilities October 31, 2019 | ||||||
(Amounts in Thousands, Except Per Share Amounts)
| Victory Strategic Allocation Fund | Victory INCORE Fund for Income | Victory INCORE Investment Grade Convertible Fund | |||||||||||||
ASSETS: | |||||||||||||||
| Affiliated investments, at value (Cost $24,951, $— and $—) | $ | 25,487 | $ | — | $ | — | |||||||||
| Unaffiliated investments, at value (Cost $—, $715,393 and $250,353) | — | 714,385 | 273,978 | (a) | |||||||||||
Cash and cash equivalents | 86 | — | 14,237 | ||||||||||||
Interest and dividends receivable | — | (b) | 5,354 | 1,131 | |||||||||||
Receivable for capital shares issued | — | 2,064 | 716 | ||||||||||||
Receivable for investments sold | — | — | 3,598 | ||||||||||||
Receivable from Adviser | 35 | 38 | — | ||||||||||||
Prepaid expenses | 24 | 14 | 15 | ||||||||||||
Total Assets | 25,632 | 721,855 | 293,675 | ||||||||||||
LIABILITIES: | |||||||||||||||
Payables: | |||||||||||||||
Collateral received on loaned securities | — | — | 8,811 | ||||||||||||
Investments purchased | — | 4,641 | 3,946 | ||||||||||||
Capital shares redeemed | — | (b) | 461 | 335 | |||||||||||
Accrued expenses and other payables: | |||||||||||||||
Investment advisory fees | 2 | 290 | 170 | ||||||||||||
Administration fees | 2 | 36 | 14 | ||||||||||||
Custodian fees | — | (b) | 5 | 2 | |||||||||||
Transfer agent fees | 6 | 83 | 40 | ||||||||||||
Chief Compliance Officer fees | — | (b) | — | (b) | — | (b) | |||||||||
Trustees' fees | — | (b) | 2 | 1 | |||||||||||
| 12b-1 fees | 3 | 29 | 2 | ||||||||||||
Other accrued expenses | 10 | 52 | 24 | ||||||||||||
Total Liabilities | 23 | 5,599 | 13,345 | ||||||||||||
NET ASSETS: | |||||||||||||||
Capital | 24,684 | 1,019,992 | 248,466 | ||||||||||||
Total distributable earnings/(loss) | 925 | (303,736 | ) | 31,864 | |||||||||||
Net Assets | $ | 25,609 | $ | 716,256 | $ | 280,330 | |||||||||
Net Assets | |||||||||||||||
Class A Shares | $ | 15,365 | $ | 136,570 | $ | 16,349 | |||||||||
Class C Shares | 3,193 | 22,541 | — | ||||||||||||
Class I Shares | 5,743 | 447,735 | 263,981 | ||||||||||||
Class R Shares | 1,308 | 38,596 | — | ||||||||||||
Class R6 Shares | — | 15,864 | — | ||||||||||||
Class Y Shares | — | 54,950 | — | ||||||||||||
Total | $ | 25,609 | $ | 716,256 | $ | 280,330 | |||||||||
(continues on next page)
See notes to financial statements.
39
Victory Portfolios | Statements of Assets and Liabilities October 31, 2019 | ||||||
(Amounts in Thousands, Except Per Share Amounts) (continued)
| Victory Strategic Allocation Fund | Victory INCORE Fund for Income | Victory INCORE Investment Grade Convertible Fund | |||||||||||||
| Shares (unlimited number of shares authorized with a par value of $0.001 per share): | |||||||||||||||
Class A Shares | 933 | 15,961 | 933 | ||||||||||||
Class C Shares | 197 | 2,659 | — | ||||||||||||
Class I Shares | 347 | 52,354 | 15,084 | ||||||||||||
Class R Shares | 80 | 4,507 | — | ||||||||||||
Class R6 Shares | — | 1,857 | — | ||||||||||||
Class Y Shares | — | 6,421 | — | ||||||||||||
Total | 1,557 | 83,759 | 16,017 | ||||||||||||
| Net asset value, offering (except Class A Shares) and redemption price per share: (c) | |||||||||||||||
Class A Shares | $ | 16.47 | $ | 8.56 | $ | 17.51 | |||||||||
Class C Shares (d) | 16.18 | 8.48 | — | ||||||||||||
Class I Shares | 16.56 | 8.55 | 17.50 | ||||||||||||
Class R Shares | 16.43 | 8.56 | — | ||||||||||||
Class R6 Shares | — | 8.54 | — | ||||||||||||
Class Y Shares | — | 8.56 | — | ||||||||||||
Maximum Sales Charge — Class A Shares | 5.75 | % | 2.00 | % | 2.00 | % | |||||||||
| Maximum offering price (100%/(100%-maximum sales charge) of net asset value adjusted to the nearest cent) per share — Class A Shares | $ | 17.47 | $ | 8.73 | $ | 17.87 | |||||||||
(a) Includes $8,595 of securities on loan.
(b) Rounds to less than $1.
(c) Per share amount may not recalculate due to rounding of net assets and/or shares outstanding.
(d) Redemption price per share varies by the length of time shares are held.
See notes to financial statements.
40
Victory Portfolios | Statements of Operations For the Year Ended October 31, 2019 | ||||||
(Amounts in Thousands)
| Victory Diversified Stock Fund | Victory NewBridge Large Cap Growth Fund | Victory Special Value Fund | |||||||||||||
Investment Income: | |||||||||||||||
Dividends | $ | 5,127 | $ | 53 | $ | 933 | |||||||||
Interest | 77 | 9 | 17 | ||||||||||||
Securities lending (net of fees) | 9 | 11 | 1 | ||||||||||||
Total Income | 5,213 | 73 | 951 | ||||||||||||
Expenses: | |||||||||||||||
Investment advisory fees | 2,075 | 140 | 438 | ||||||||||||
Administration fees | 203 | 16 | 42 | ||||||||||||
12b-1 fees — Class A Shares | 546 | 14 | 74 | ||||||||||||
12b-1 fees — Class C Shares | 79 | 25 | 17 | ||||||||||||
12b-1 fees — Class R Shares | 248 | 1 | 116 | ||||||||||||
Custodian fees | 16 | 2 | 4 | ||||||||||||
Transfer agent fees — Class A Shares | 163 | 6 | 36 | ||||||||||||
Transfer agent fees — Class C Shares | 8 | 3 | 3 | ||||||||||||
Transfer agent fees — Class I Shares | 19 | 6 | 2 | ||||||||||||
Transfer agent fees — Class R Shares | 44 | — | (a) | 36 | |||||||||||
Transfer agent fees — Class R6 Shares | — | (a) | — | — | |||||||||||
Transfer agent fees — Class Y Shares | 7 | 3 | 1 | ||||||||||||
Trustees' fees | 29 | 3 | 6 | ||||||||||||
Chief Compliance Officer fees | 3 | — | (a) | — | (a) | ||||||||||
Legal and audit fees | 22 | 8 | 10 | ||||||||||||
State registration and filing fees | 89 | 70 | 73 | ||||||||||||
Interfund lending fees | 1 | — | (a) | — | (a) | ||||||||||
Other expenses | 46 | 12 | 17 | ||||||||||||
Total Expenses | 3,598 | 309 | 875 | ||||||||||||
Expenses waived/reimbursed by Adviser | (30 | ) | (76 | ) | (91 | ) | |||||||||
Net Expenses | 3,568 | 233 | 784 | ||||||||||||
Net Investment Income (Loss) | 1,645 | (160 | ) | 167 | |||||||||||
| Realized/Unrealized Gains (Losses) from Investment Transactions: | |||||||||||||||
Net realized gains (losses) from investment transactions | 18,632 | 3,860 | 1,560 | ||||||||||||
| Net change in unrealized appreciation/depreciation on investments | 13,132 | (2,906 | ) | 4,228 | |||||||||||
Net realized/unrealized gains (losses) on investments | 31,764 | 954 | 5,788 | ||||||||||||
Change in net assets resulting from operations | $ | 33,409 | $ | 794 | $ | 5,955 | |||||||||
(a) Rounds to less than $1.
See notes to financial statements.
41
Victory Portfolios | Statements of Operations For the Year Ended October 31, 2019 | ||||||
(Amounts in Thousands)
| Victory Strategic Allocation Fund | Victory INCORE Fund for Income | Victory INCORE Investment Grade Convertible Fund | |||||||||||||
Investment Income: | |||||||||||||||
Interest from non-affiliates | $ | 1 | $ | 17,498 | $ | 2,526 | |||||||||
Dividends from affiliates | 841 | — | — | ||||||||||||
Dividends from non-affiliates | — | 4 | 2,940 | ||||||||||||
Securities lending (net of fees) | — | — | (a) | 31 | |||||||||||
Total Income | 842 | 17,502 | 5,497 | ||||||||||||
Expenses: | |||||||||||||||
Investment advisory fees | 27 | 3,161 | 1,457 | ||||||||||||
Administration fees | 21 | 411 | 125 | ||||||||||||
12b-1 fees — Class A Shares | 40 | 373 | 37 | ||||||||||||
12b-1 fees — Class C Shares | 38 | 274 | — | ||||||||||||
12b-1 fees — Class R Shares | 7 | 101 | — | ||||||||||||
Custodian fees | 1 | 31 | 10 | ||||||||||||
Transfer agent fees — Class A Shares | 23 | 138 | 42 | ||||||||||||
Transfer agent fees — Class C Shares | 4 | 28 | — | ||||||||||||
Transfer agent fees — Class I Shares | 6 | 219 | 150 | ||||||||||||
Transfer agent fees — Class R Shares | 3 | 29 | — | ||||||||||||
Transfer agent fees — Class R6 Shares | — | 1 | — | ||||||||||||
Transfer agent fees — Class Y Shares | — | 67 | — | ||||||||||||
Trustees' fees | 4 | 56 | 17 | ||||||||||||
Chief Compliance Officer fees | — | (a) | 5 | 1 | |||||||||||
Legal and audit fees | 7 | 42 | 17 | ||||||||||||
State registration and filing fees | 57 | 110 | 47 | ||||||||||||
Interfund lending fees | 1 | 1 | — | ||||||||||||
Other expenses | 12 | 126 | 37 | ||||||||||||
Total Expenses | 251 | 5,173 | 1,940 | ||||||||||||
Expenses waived/reimbursed by Adviser | (124 | ) | (86 | ) | — | ||||||||||
Net Expenses | 127 | 5,087 | 1,940 | ||||||||||||
Net Investment Income (Loss) | 715 | 12,415 | 3,557 | ||||||||||||
| Realized/Unrealized Gains (Losses) from Investment Transactions: | |||||||||||||||
Net realized gains (losses) from affiliated securities transactions | (522 | ) | — | — | |||||||||||
Net realized gains (losses) from unaffiliated securities transactions | 140 | 37 | 9,776 | ||||||||||||
| Distributions of realized gains from affiliated underlying investment companies | 775 | — | — | ||||||||||||
| Net change in unrealized appreciation/depreciation on affiliated investments | 1,486 | — | — | ||||||||||||
| Net change in unrealized appreciation/depreciation on unaffiliated investments | — | 22,751 | 14,314 | ||||||||||||
Net realized/unrealized gains (losses) on investments | 1,879 | 22,788 | 24,090 | ||||||||||||
Change in net assets resulting from operations | $ | 2,594 | $ | 35,203 | $ | 27,647 | |||||||||
(a) Rounds to less than $1.
See notes to financial statements.
42
Victory Portfolios | Statements of Changes in Net Assets | ||||||
(Amounts in Thousands)
| Victory Diversified Stock Fund | Victory NewBridge Large Cap Growth Fund | Victory Special Value Fund | |||||||||||||||||||||||||
| Year Ended October 31, 2019 | Year Ended October 31, 2018 | Year Ended October 31, 2019 | Year Ended October 31, 2018 | Year Ended October 31, 2019 | Year Ended October 31, 2018 | ||||||||||||||||||||||
From Investment Activities: | |||||||||||||||||||||||||||
Operations: | |||||||||||||||||||||||||||
Net investment income (loss) | $ | 1,645 | $ | 1,248 | $ | (160 | ) | $ | (252 | ) | $ | 167 | $ | 20 | |||||||||||||
| Net realized gains (losses) from investment transactions | 18,632 | 39,245 | 3,860 | 7,641 | 1,560 | 6,484 | |||||||||||||||||||||
| Net change in unrealized appreciation (depreciation) on investments | 13,132 | (35,321 | ) | (2,906 | ) | (4,523 | ) | 4,228 | (6,058 | ) | |||||||||||||||||
| Change in net assets resulting from operations | 33,409 | 5,172 | 794 | 2,866 | 5,955 | 446 | |||||||||||||||||||||
Distributions to Shareholders: | |||||||||||||||||||||||||||
Class A Shares | (28,297 | ) | (60,154 | ) | (1,659 | ) | (2,173 | ) | (3,327 | ) | (140 | ) | |||||||||||||||
Class C Shares | (1,188 | ) | (7,099 | ) | (1,416 | ) | (1,562 | ) | (223 | ) | — | ||||||||||||||||
Class I Shares | (4,956 | ) | (14,623 | ) | (2,847 | ) | (4,022 | ) | (366 | ) | (48 | ) | |||||||||||||||
Class R Shares | (5,943 | ) | (12,733 | ) | (265 | ) | (334 | ) | (2,640 | ) | (62 | ) | |||||||||||||||
Class R6 Shares | (255 | ) | (493 | ) | — | — | — | — | |||||||||||||||||||
Class Y Shares | (476 | ) | (1,608 | ) | (957 | ) | (861 | ) | (47 | ) | (8 | ) | |||||||||||||||
| Change in net assets resulting from distributions to shareholders | (41,115 | ) | (96,710 | ) | (7,144 | ) | (8,952 | ) | (6,603 | ) | (258 | ) | |||||||||||||||
| Change in net assets resulting from capital transactions | (78,621 | ) | (24,421 | ) | (969 | ) | (1,618 | ) | (10,771 | ) | (18,961 | ) | |||||||||||||||
Change in net assets | (86,327 | ) | (115,959 | ) | (7,319 | ) | (7,704 | ) | (11,419 | ) | (18,773 | ) | |||||||||||||||
Net Assets: | |||||||||||||||||||||||||||
Beginning of period | 383,343 | 499,302 | 23,360 | 31,064 | 65,356 | 84,129 | |||||||||||||||||||||
End of period | $ | 297,016 | $ | 383,343 | $ | 16,041 | $ | 23,360 | $ | 53,937 | $ | 65,356 | |||||||||||||||
(continues on next page)
See notes to financial statements.
43
Victory Portfolios | Statements of Changes in Net Assets | ||||||
(Amounts in Thousands) (continued)
| Victory Diversified Stock Fund | Victory NewBridge Large Cap Growth Fund | Victory Special Value Fund | |||||||||||||||||||||||||
| Year Ended October 31, 2019 | Year Ended October 31, 2018 | Year Ended October 31, 2019 | Year Ended October 31, 2018 | Year Ended October 31, 2019 | Year Ended October 31, 2018 | ||||||||||||||||||||||
Capital Transactions: | |||||||||||||||||||||||||||
Class A Shares | |||||||||||||||||||||||||||
Proceeds from shares issued | $ | 10,469 | $ | 36,345 | $ | 1,642 | $ | 1,050 | $ | 2,878 | $ | 6,981 | |||||||||||||||
Distributions reinvested | 25,681 | 53,501 | 1,429 | 1,783 | 2,670 | 112 | |||||||||||||||||||||
Cost of shares redeemed | (90,032 | ) | (79,151 | ) | (1,465 | ) | (3,581 | ) | (9,989 | ) | (9,666 | ) | |||||||||||||||
Total Class A Shares | $ | (53,882 | ) | $ | 10,695 | $ | 1,606 | $ | (748 | ) | $ | (4,441 | ) | $ | (2,573 | ) | |||||||||||
Class C Shares | |||||||||||||||||||||||||||
Proceeds from shares issued | $ | 864 | $ | 1,225 | $ | 448 | $ | 415 | $ | 345 | $ | 416 | |||||||||||||||
Distributions reinvested | 962 | 6,287 | 1,198 | 1,401 | 134 | — | |||||||||||||||||||||
Cost of shares redeemed | (7,037 | ) | (25,557 | ) | (1,643 | ) | (1,772 | ) | (1,334 | ) | (5,711 | ) | |||||||||||||||
Total Class C Shares | $ | (5,211 | ) | $ | (18,045 | ) | $ | 3 | $ | 44 | $ | (855 | ) | $ | (5,295 | ) | |||||||||||
Class I Shares | |||||||||||||||||||||||||||
Proceeds from shares issued | $ | 3,181 | $ | 14,912 | $ | 557 | $ | 3,402 | $ | 588 | $ | 4,793 | |||||||||||||||
Distributions reinvested | 4,500 | 13,845 | 2,644 | 3,551 | 317 | 46 | |||||||||||||||||||||
Cost of shares redeemed | (21,038 | ) | (43,874 | ) | (5,198 | ) | (9,714 | ) | (1,283 | ) | (4,817 | ) | |||||||||||||||
Total Class I Shares | $ | (13,357 | ) | $ | (15,117 | ) | $ | (1,997 | ) | $ | (2,761 | ) | $ | (378 | ) | $ | 22 | ||||||||||
Class R Shares | |||||||||||||||||||||||||||
Proceeds from shares issued | $ | 1,997 | $ | 3,059 | $ | 84 | $ | 46 | $ | 2,963 | $ | 3,593 | |||||||||||||||
Distributions reinvested | 5,689 | 12,099 | 265 | 334 | 2,334 | 56 | |||||||||||||||||||||
Cost of shares redeemed | (13,852 | ) | (14,286 | ) | (814 | ) | (401 | ) | (10,470 | ) | (13,951 | ) | |||||||||||||||
Total Class R Shares | $ | (6,166 | ) | $ | 872 | $ | (465 | ) | $ | (21 | ) | $ | (5,173 | ) | $ | (10,302 | ) | ||||||||||
Class R6 Shares | |||||||||||||||||||||||||||
Proceeds from shares issued | $ | 180 | $ | 185 | $ | — | $ | — | $ | — | $ | — | |||||||||||||||
Distributions reinvested | 255 | 493 | — | — | — | — | |||||||||||||||||||||
Cost of shares redeemed | (314 | ) | (448 | ) | — | — | — | — | |||||||||||||||||||
Total Class R6 Shares | $ | 121 | $ | 230 | $ | — | $ | — | $ | — | $ | — | |||||||||||||||
Class Y Shares | |||||||||||||||||||||||||||
Proceeds from shares issued | $ | 867 | $ | 5,027 | $ | 554 | $ | 3,223 | $ | 144 | $ | 158 | |||||||||||||||
Distributions reinvested | 387 | 104 | 397 | 334 | 33 | 2 | |||||||||||||||||||||
Cost of shares redeemed | (1,380 | ) | (8,187 | ) | (1,067 | ) | (1,689 | ) | (101 | ) | (973 | ) | |||||||||||||||
Total Class Y Shares | $ | (126 | ) | $ | (3,056 | ) | $ | (116 | ) | $ | 1,868 | $ | 76 | $ | (813 | ) | |||||||||||
| Change in net assets resulting from capital transactions | $ | (78,621 | ) | $ | (24,421 | ) | $ | (969 | ) | $ | (1,618 | ) | $ | (10,771 | ) | $ | (18,961 | ) | |||||||||
(continues on next page)
See notes to financial statements.
44
Victory Portfolios | Statements of Changes in Net Assets | ||||||
(Amounts in Thousands) (continued)
| Victory Diversified Stock Fund | Victory NewBridge Large Cap Growth Fund | Victory Special Value Fund | |||||||||||||||||||||||||
| Year Ended October 31, 2019 | Year Ended October 31, 2018 | Year Ended October 31, 2019 | Year Ended October 31, 2018 | Year Ended October 31, 2019 | Year Ended October 31, 2018 | ||||||||||||||||||||||
Share Transactions: | |||||||||||||||||||||||||||
Class A Shares | |||||||||||||||||||||||||||
Issued | 648 | 1,904 | 295 | 134 | 121 | 256 | |||||||||||||||||||||
Reinvested | 1,778 | 2,797 | 297 | 239 | 126 | 4 | |||||||||||||||||||||
Redeemed | (5,576 | ) | (4,068 | ) | (254 | ) | (420 | ) | (416 | ) | (351 | ) | |||||||||||||||
Total Class A Shares | (3,150 | ) | 633 | 338 | (47 | ) | (169 | ) | (91 | ) | |||||||||||||||||
Class C Shares | |||||||||||||||||||||||||||
Issued | 60 | 67 | 203 | 81 | 17 | 17 | |||||||||||||||||||||
Reinvested | 71 | 347 | 562 | 297 | 7 | — | |||||||||||||||||||||
Redeemed | (458 | ) | (1,433 | ) | (645 | ) | (324 | ) | (61 | ) | (233 | ) | |||||||||||||||
Total Class C Shares | (327 | ) | (1,019 | ) | 120 | 54 | (37 | ) | (216 | ) | |||||||||||||||||
Class I Shares | |||||||||||||||||||||||||||
Issued | 194 | 766 | 87 | 342 | 23 | 175 | |||||||||||||||||||||
Reinvested | 311 | 725 | 497 | 447 | 15 | 2 | |||||||||||||||||||||
Redeemed | (1,291 | ) | (2,295 | ) | (850 | ) | (1,041 | ) | (52 | ) | (177 | ) | |||||||||||||||
Total Class I Shares | (786 | ) | (804 | ) | (266 | ) | (252 | ) | (14 | ) | — | (a) | |||||||||||||||
Class R Shares | |||||||||||||||||||||||||||
Issued | 126 | 161 | 13 | 7 | 130 | 135 | |||||||||||||||||||||
Reinvested | 403 | 644 | 72 | 53 | 116 | 2 | |||||||||||||||||||||
Redeemed | (869 | ) | (743 | ) | (194 | ) | (60 | ) | (447 | ) | (530 | ) | |||||||||||||||
Total Class R Shares | (340 | ) | 62 | (109 | ) | — | (a) | (201 | ) | (393 | ) | ||||||||||||||||
Class R6 Shares | |||||||||||||||||||||||||||
Issued | 11 | 9 | — | — | — | — | |||||||||||||||||||||
Reinvested | 18 | 26 | — | — | — | — | |||||||||||||||||||||
Redeemed | (20 | ) | (23 | ) | — | — | — | — | |||||||||||||||||||
Total Class R6 Shares | 9 | 12 | — | — | — | — | |||||||||||||||||||||
Class Y Shares | |||||||||||||||||||||||||||
Issued | 54 | 262 | 107 | 352 | 6 | 6 | |||||||||||||||||||||
Reinvested | 27 | 5 | 78 | 43 | 2 | — | (a) | ||||||||||||||||||||
Redeemed | (84 | ) | (425 | ) | (173 | ) | (184 | ) | (5 | ) | (35 | ) | |||||||||||||||
Total Class Y Shares | (3 | ) | (158 | ) | 12 | 211 | 3 | (29 | ) | ||||||||||||||||||
Change in Shares | (4,597 | ) | (1,274 | ) | 95 | (34 | ) | (418 | ) | (729 | ) | ||||||||||||||||
(a) Rounds to less than 1.
See notes to financial statements.
45
Victory Portfolios | Statements of Changes in Net Assets | ||||||
(Amounts in Thousands)
| Victory Strategic Allocation Fund | Victory INCORE Fund for Income | Victory INCORE Investment Grade Convertible Fund | |||||||||||||||||||||||||
| Year Ended October 31, 2019 | Year Ended October 31, 2018 | Year Ended October 31, 2019 | Year Ended October 31, 2018 | Year Ended October 31, 2019 | Year Ended October 31, 2018 | ||||||||||||||||||||||
From Investment Activities: | |||||||||||||||||||||||||||
Operations: | |||||||||||||||||||||||||||
Net investment income (loss) | $ | 715 | $ | 685 | $ | 12,415 | $ | 12,047 | (a) | $ | 3,557 | $ | 3,040 | ||||||||||||||
| Net realized gains (losses) from affiliated and unaffiliated investment transactions | 393 | 629 | 37 | (3,534 | )(a) | 9,776 | 4,521 | ||||||||||||||||||||
| Net change in unrealized appreciation (depreciation) on affiliated and unaffiliated investments | 1,486 | (2,110 | ) | 22,751 | (15,006 | ) | 14,314 | (6,291 | ) | ||||||||||||||||||
| Change in net assets resulting from operations | 2,594 | (796 | ) | 35,203 | (6,493 | ) | 27,647 | 1,270 | |||||||||||||||||||
Distributions to Shareholders: | |||||||||||||||||||||||||||
Class A Shares | (574 | ) | (588 | ) | (7,959 | ) | (9,021 | ) | (663 | ) | (1,250 | ) | |||||||||||||||
Class C Shares | (114 | ) | (260 | ) | (1,264 | ) | (1,730 | ) | — | — | |||||||||||||||||
Class I Shares | (231 | ) | (431 | ) | (21,576 | ) | (20,880 | ) | (7,328 | ) | (4,145 | ) | |||||||||||||||
Class R Shares | (44 | ) | (62 | ) | (2,160 | ) | (2,518 | ) | — | — | |||||||||||||||||
Class R6 Shares | — | — | (815 | ) | (630 | ) | — | — | |||||||||||||||||||
Class Y Shares | — | — | (2,348 | ) | (2,374 | ) | — | — | |||||||||||||||||||
| Change in net assets resulting from distributions to shareholders | (963 | ) | (1,341 | ) | (36,122 | ) | (37,153 | ) | (7,991 | ) | (5,395 | ) | |||||||||||||||
| Change in net assets resulting from capital transactions | (9,554 | ) | 990 | 111,166 | (276,137 | ) | 119,535 | 33,345 | |||||||||||||||||||
Change in net assets | (7,923 | ) | (1,147 | ) | 110,247 | (319,783 | ) | 139,191 | 29,220 | ||||||||||||||||||
Net Assets: | |||||||||||||||||||||||||||
Beginning of period | 33,532 | 34,679 | 606,009 | 925,792 | 141,139 | 111,919 | |||||||||||||||||||||
End of period | $ | 25,609 | $ | 33,532 | $ | 716,256 | $ | 606,009 | $ | 280,330 | $ | 141,139 | |||||||||||||||
(a) Net investment income (loss) and Net realized gains (losses) from affiliated and unaffiliated investment transactions have been restated for the year ended October 31, 2018. See Item 11 in the Notes to Financial Statements.
(continues on next page)
See notes to financial statements.
46
Victory Portfolios | Statements of Changes in Net Assets | ||||||
(Amounts in Thousands) (continued)
| Victory Strategic Allocation Fund | Victory INCORE Fund for Income | Victory INCORE Investment Grade Convertible Fund | |||||||||||||||||||||||||
| Year Ended October 31, 2019 | Year Ended October 31, 2018 | Year Ended October 31, 2019 | Year Ended October 31, 2018 | Year Ended October 31, 2019 | Year Ended October 31, 2018 | ||||||||||||||||||||||
Capital Transactions: | |||||||||||||||||||||||||||
Class A Shares | |||||||||||||||||||||||||||
Proceeds from shares issued | $ | 1,078 | $ | 8,204 | $ | 52,087 | $ | 37,903 | $ | 5,609 | $ | 9,823 | |||||||||||||||
Distributions reinvested | 546 | 541 | 6,231 | 7,053 | 531 | 1,121 | |||||||||||||||||||||
Cost of shares redeemed | (5,939 | ) | (3,708 | ) | (75,399 | ) | (105,462 | ) | (5,263 | ) | (28,804 | ) | |||||||||||||||
Total Class A Shares | $ | (4,315 | ) | $ | 5,037 | $ | (17,081 | ) | $ | (60,506 | ) | $ | 877 | $ | (17,860 | ) | |||||||||||
Class C Shares | |||||||||||||||||||||||||||
Proceeds from shares issued | $ | 281 | $ | 836 | $ | 3,731 | $ | 3,667 | $ | — | $ | — | |||||||||||||||
Distributions reinvested | 106 | 242 | 1,066 | 1,460 | — | — | |||||||||||||||||||||
Cost of shares redeemed | (1,868 | ) | (5,109 | ) | (14,281 | ) | (21,008 | ) | — | — | |||||||||||||||||
Total Class C Shares | $ | (1,481 | ) | $ | (4,031 | ) | $ | (9,484 | ) | $ | (15,881 | ) | $ | — | $ | — | |||||||||||
Class I Shares | |||||||||||||||||||||||||||
Proceeds from shares issued | $ | 673 | $ | 5,532 | $ | 212,608 | $ | 169,867 | $ | 188,612 | $ | 105,023 | |||||||||||||||
Distributions reinvested | 223 | 417 | 15,748 | 16,603 | 6,976 | 3,970 | |||||||||||||||||||||
Cost of shares redeemed | (4,348 | ) | (5,703 | ) | (111,040 | ) | (351,187 | ) | (76,930 | ) | (57,788 | ) | |||||||||||||||
Total Class I Shares | $ | (3,452 | ) | $ | 246 | $ | 117,316 | $ | (164,717 | ) | $ | 118,658 | $ | 51,205 | |||||||||||||
Class R Shares | |||||||||||||||||||||||||||
Proceeds from shares issued | $ | 90 | $ | 60 | $ | 5,048 | $ | 7,811 | $ | — | $ | — | |||||||||||||||
Distributions reinvested | 39 | 55 | 2,042 | 2,310 | — | — | |||||||||||||||||||||
Cost of shares redeemed | (435 | ) | (377 | ) | (11,905 | ) | (22,520 | ) | — | — | |||||||||||||||||
Total Class R Shares | $ | (306 | ) | $ | (262 | ) | $ | (4,815 | ) | $ | (12,399 | ) | $ | — | $ | — | |||||||||||
Class R6 Shares | |||||||||||||||||||||||||||
Proceeds from shares issued | $ | — | $ | — | $ | 8,367 | $ | 6,801 | $ | — | $ | — | |||||||||||||||
Distributions reinvested | — | — | 811 | 630 | — | — | |||||||||||||||||||||
Cost of shares redeemed | — | — | (7,027 | ) | (2,414 | ) | — | — | |||||||||||||||||||
Total Class R6 Shares | $ | — | $ | — | $ | 2,151 | $ | 5,017 | $ | — | $ | — | |||||||||||||||
Class Y Shares | |||||||||||||||||||||||||||
Proceeds from shares issued | $ | — | $ | — | $ | 44,007 | $ | 17,606 | $ | — | $ | — | |||||||||||||||
Distributions reinvested | — | — | 1,155 | 1,219 | — | — | |||||||||||||||||||||
Cost of shares redeemed | — | — | (22,083 | ) | (46,476 | ) | — | — | |||||||||||||||||||
Total Class Y Shares | $ | — | $ | — | $ | 23,079 | $ | (27,651 | ) | $ | — | $ | — | ||||||||||||||
| Change in net assets resulting from capital transactions | $ | (9,554 | ) | $ | 990 | $ | 111,166 | $ | (276,137 | ) | $ | 119,535 | $ | 33,345 | |||||||||||||
(continues on next page)
See notes to financial statements.
47
Victory Portfolios | Statements of Changes in Net Assets | ||||||
(Amounts in Thousands) (continued)
| Victory Strategic Allocation Fund | Victory INCORE Fund for Income | Victory INCORE Investment Grade Convertible Fund | |||||||||||||||||||||||||
| Year Ended October 31, 2019 | Year Ended October 31, 2018 | Year Ended October 31, 2019 | Year Ended October 31, 2018 | Year Ended October 31, 2019 | Year Ended October 31, 2018 | ||||||||||||||||||||||
Share Transactions: | |||||||||||||||||||||||||||
Class A Shares | |||||||||||||||||||||||||||
Issued | 69 | 506 | 6,053 | 4,291 | 345 | 592 | |||||||||||||||||||||
Reinvested | 37 | 33 | 727 | 803 | 34 | 69 | |||||||||||||||||||||
Redeemed | (387 | ) | (228 | ) | (8,762 | ) | (11,897 | ) | (326 | ) | (1,780 | ) | |||||||||||||||
Total Class A Shares | (281 | ) | 311 | (1,982 | ) | (6,803 | ) | 53 | (1,119 | ) | |||||||||||||||||
Class C Shares | |||||||||||||||||||||||||||
Issued | 18 | 52 | 438 | 418 | — | — | |||||||||||||||||||||
Reinvested | 7 | 15 | 125 | 168 | — | — | |||||||||||||||||||||
Redeemed | (121 | ) | (318 | ) | (1,674 | ) | (2,401 | ) | — | — | |||||||||||||||||
Total Class C Shares | (96 | ) | (251 | ) | (1,111 | ) | (1,815 | ) | — | — | |||||||||||||||||
Class I Shares | |||||||||||||||||||||||||||
Issued | 43 | 337 | 24,691 | 19,222 | 11,502 | 6,340 | |||||||||||||||||||||
Reinvested | 15 | 25 | 1,837 | 1,889 | 445 | 243 | |||||||||||||||||||||
Redeemed | (279 | ) | (349 | ) | (12,911 | ) | (39,658 | ) | (4,689 | ) | (3,531 | ) | |||||||||||||||
Total Class I Shares | (221 | ) | 13 | 13,617 | (18,547 | ) | 7,258 | 3,052 | |||||||||||||||||||
Class R Shares | |||||||||||||||||||||||||||
Issued | 6 | 4 | 586 | 877 | — | — | |||||||||||||||||||||
Reinvested | 3 | 3 | 238 | 263 | — | — | |||||||||||||||||||||
Redeemed | (28 | ) | (23 | ) | (1,384 | ) | (2,539 | ) | — | — | |||||||||||||||||
Total Class R Shares | (19 | ) | (16 | ) | (560 | ) | (1,399 | ) | — | — | |||||||||||||||||
Class R6 Shares | |||||||||||||||||||||||||||
Issued | — | — | 974 | 773 | — | — | |||||||||||||||||||||
Reinvested | — | — | 95 | 72 | — | — | |||||||||||||||||||||
Redeemed | — | — | (820 | ) | (274 | ) | — | — | |||||||||||||||||||
Total Class R6 Shares | — | — | 249 | 571 | — | — | |||||||||||||||||||||
Class Y Shares | |||||||||||||||||||||||||||
Issued | — | — | 5,117 | 1,994 | — | — | |||||||||||||||||||||
Reinvested | — | — | 135 | 139 | — | — | |||||||||||||||||||||
Redeemed | — | — | (2,567 | ) | (5,267 | ) | — | — | |||||||||||||||||||
Total Class Y Shares | — | — | 2,685 | (3,134 | ) | — | — | ||||||||||||||||||||
Change in Shares | (617 | ) | 57 | 12,898 | (31,127 | ) | 7,311 | 1,933 | |||||||||||||||||||
See notes to financial statements.
48
This page is intentionally left blank.
49
Victory Portfolios | Financial Highlights | ||||||
For a Share Outstanding Throughout Each Period
Investment Activities | Distributions to Shareholders From | ||||||||||||||||||||||||||
| Net Asset Value, Beginning of Period | Net Investment Income (Loss) | Net Realized and Unrealized Gains (Losses) on Investments | Total from Investment Activities | Net Investment Income | Net Realized Gains from Investments | ||||||||||||||||||||||
Victory Diversified Stock Fund | |||||||||||||||||||||||||||
Class A | |||||||||||||||||||||||||||
Year Ended 10/31/19 | $ | 17.90 | 0.09 | (b) | 1.65 | 1.74 | (0.08 | ) | (1.91 | ) | |||||||||||||||||
Year Ended 10/31/18 | $ | 22.03 | 0.06 | (b) | 0.17 | 0.23 | (0.06 | ) | (4.30 | ) | |||||||||||||||||
Year Ended 10/31/17 | $ | 18.01 | 0.13 | (b) | 4.28 | 4.41 | (0.17 | ) | (0.22 | ) | |||||||||||||||||
Year Ended 10/31/16 | $ | 20.80 | 0.20 | (b) | (1.04 | ) | (0.84 | ) | (0.19 | ) | (1.76 | ) | |||||||||||||||
Year Ended 10/31/15 | $ | 23.04 | 0.15 | 0.97 | 1.12 | (0.15 | ) | (3.21 | ) | ||||||||||||||||||
Class C | |||||||||||||||||||||||||||
Year Ended 10/31/19 | $ | 16.90 | (0.05 | )(b) | 1.52 | 1.47 | — | (1.91 | ) | ||||||||||||||||||
Year Ended 10/31/18 | $ | 21.12 | (0.10 | )(b) | 0.18 | 0.08 | — | (4.30 | ) | ||||||||||||||||||
Year Ended 10/31/17 | $ | 17.30 | (0.02 | )(b) | 4.10 | 4.08 | (0.04 | ) | (0.22 | ) | |||||||||||||||||
Year Ended 10/31/16 | $ | 20.07 | 0.04 | (b) | (1.00 | ) | (0.96 | ) | (0.05 | ) | (1.76 | ) | |||||||||||||||
Year Ended 10/31/15 | $ | 22.38 | (0.03 | ) | 0.95 | 0.92 | (0.02 | ) | (3.21 | ) | |||||||||||||||||
Class I | |||||||||||||||||||||||||||
Year Ended 10/31/19 | $ | 17.87 | 0.13 | (b) | 1.65 | 1.78 | (0.13 | ) | (1.91 | ) | |||||||||||||||||
Year Ended 10/31/18 | $ | 22.00 | 0.11 | (b) | 0.16 | 0.27 | (0.10 | ) | (4.30 | ) | |||||||||||||||||
Year Ended 10/31/17 | $ | 17.98 | 0.19 | (b) | 4.27 | 4.46 | (0.22 | ) | (0.22 | ) | |||||||||||||||||
Year Ended 10/31/16 | $ | 20.77 | 0.24 | (b) | (1.03 | ) | (0.79 | ) | (0.24 | ) | (1.76 | ) | |||||||||||||||
Year Ended 10/31/15 | $ | 23.01 | 0.20 | 0.98 | 1.18 | (0.21 | ) | (3.21 | ) | ||||||||||||||||||
Class R | |||||||||||||||||||||||||||
Year Ended 10/31/19 | $ | 17.58 | 0.04 | (b) | 1.62 | 1.66 | (0.04 | ) | (1.91 | ) | |||||||||||||||||
Year Ended 10/31/18 | $ | 21.71 | 0.01 | (b) | 0.16 | 0.17 | — | (d) | (4.30 | ) | |||||||||||||||||
Year Ended 10/31/17 | $ | 17.75 | 0.07 | (b) | 4.23 | 4.30 | (0.12 | ) | (0.22 | ) | |||||||||||||||||
Year Ended 10/31/16 | $ | 20.54 | 0.14 | (b) | (1.04 | ) | (0.90 | ) | (0.13 | ) | (1.76 | ) | |||||||||||||||
Year Ended 10/31/15 | $ | 22.79 | 0.08 | 0.97 | 1.05 | (0.09 | ) | (3.21 | ) | ||||||||||||||||||
(continues on next page)
(a) Portfolio turnover is calculated on the basis of the Fund as a whole without distinguishing between the classes of shares issued.
(b) Per share net investment income (loss) has been calculated using the average daily shares method.
(c) Portfolio turnover increase due to a change within the portfolio holdings during the year.
(d) Amount is less than $0.005 per share.
(e) During the period, certain fees were reduced and/or reimbursed. If such fee reductions and/or reimbursements had not occurred, the ratios would have been as indicated.
See notes to financial statements.
50
Victory Portfolios | Financial Highlights — continued | ||||||
For a Share Outstanding Throughout Each Period
Ratios to Average Net Assets | Supplemental Data | ||||||||||||||||||||||||||||||||||
| Total Distributions | Net Asset Value, End of Period | Total Return (Excludes Sales Charge) | Net Expenses | Net Investment Income (Loss) | Gross Expenses | Net Assets, End of Period (000's) | Portfolio Turnover(a) | ||||||||||||||||||||||||||||
Victory Diversified Stock Fund | |||||||||||||||||||||||||||||||||||
Class A | |||||||||||||||||||||||||||||||||||
Year Ended 10/31/19 | (1.99 | ) | $ | 17.65 | 12.27 | % | 1.08 | % | 0.55 | % | 1.08 | % | $ | 204,945 | 132 | % | |||||||||||||||||||
Year Ended 10/31/18 | (4.36 | ) | $ | 17.90 | (0.20 | )% | 1.05 | % | 0.32 | % | 1.05 | % | $ | 264,297 | 112 | % | |||||||||||||||||||
Year Ended 10/31/17 | (0.39 | ) | $ | 22.03 | 24.85 | % | 1.05 | % | 0.66 | % | 1.05 | % | $ | 311,255 | 133 | %(c) | |||||||||||||||||||
Year Ended 10/31/16 | (1.95 | ) | $ | 18.01 | (4.21 | )% | 1.07 | % | 1.06 | % | 1.07 | % | $ | 352,748 | 74 | % | |||||||||||||||||||
Year Ended 10/31/15 | (3.36 | ) | $ | 20.80 | 4.85 | % | 1.09 | % | 0.68 | % | 1.09 | % | $ | 532,180 | 74 | % | |||||||||||||||||||
Class C | |||||||||||||||||||||||||||||||||||
Year Ended 10/31/19 | (1.91 | ) | $ | 16.46 | 11.19 | % | 2.02 | % | (0.35 | )% | 2.02 | % | $ | 5,909 | 132 | % | |||||||||||||||||||
Year Ended 10/31/18 | (4.30 | ) | $ | 16.90 | (1.02 | )% | 1.89 | % | (0.53 | )% | 1.89 | % | $ | 11,586 | 112 | % | |||||||||||||||||||
Year Ended 10/31/17 | (0.26 | ) | $ | 21.12 | 23.82 | % | 1.87 | % | (0.12 | )% | 1.87 | % | $ | 36,001 | 133 | %(c) | |||||||||||||||||||
Year Ended 10/31/16 | (1.81 | ) | $ | 17.30 | (5.01 | )% | 1.90 | % | 0.23 | % | 1.90 | % | $ | 50,213 | 74 | % | |||||||||||||||||||
Year Ended 10/31/15 | (3.23 | ) | $ | 20.07 | 4.01 | % | 1.91 | % | (0.16 | )% | 1.91 | % | $ | 67,997 | 74 | % | |||||||||||||||||||
Class I | |||||||||||||||||||||||||||||||||||
Year Ended 10/31/19 | (2.04 | ) | $ | 17.61 | 12.52 | % | 0.84 | % | 0.81 | % | 0.84 | % | $ | 31,619 | 132 | % | |||||||||||||||||||
Year Ended 10/31/18 | (4.40 | ) | $ | 17.87 | 0.05 | % | 0.79 | % | 0.58 | % | 0.79 | % | $ | 46,122 | 112 | % | |||||||||||||||||||
Year Ended 10/31/17 | (0.44 | ) | $ | 22.00 | 25.21 | % | 0.80 | % | 0.99 | % | 0.80 | % | $ | 74,466 | 133 | %(c) | |||||||||||||||||||
Year Ended 10/31/16 | (2.00 | ) | $ | 17.98 | (3.96 | )% | 0.80 | % | 1.33 | % | 0.80 | % | $ | 162,923 | 74 | % | |||||||||||||||||||
Year Ended 10/31/15 | (3.42 | ) | $ | 20.77 | 5.16 | % | 0.81 | % | 0.94 | % | 0.81 | % | $ | 313,482 | 74 | % | |||||||||||||||||||
Class R | |||||||||||||||||||||||||||||||||||
Year Ended 10/31/19 | (1.95 | ) | $ | 17.29 | 11.90 | % | 1.37 | % | 0.26 | % | 1.37 | % | $ | 47,981 | 132 | % | |||||||||||||||||||
Year Ended 10/31/18 | (4.30 | ) | $ | 17.58 | (0.47 | )% | 1.34 | % | 0.03 | % | 1.34 | % | $ | 54,776 | 112 | % | |||||||||||||||||||
Year Ended 10/31/17 | (0.34 | ) | $ | 21.71 | 24.56 | % | 1.33 | % | 0.38 | % | 1.33 | % | $ | 66,310 | 133 | %(c) | |||||||||||||||||||
Year Ended 10/31/16 | (1.89 | ) | $ | 17.75 | (4.55 | )% | 1.36 | % | 0.77 | % | 1.36 | % | $ | 69,751 | 74 | % | |||||||||||||||||||
Year Ended 10/31/15 | (3.30 | ) | $ | 20.54 | 4.57 | % | 1.38 | % | 0.38 | % | 1.38 | % | $ | 89,949 | 74 | % | |||||||||||||||||||
See notes to financial statements.
51
Victory Portfolios | Financial Highlights | ||||||
For a Share Outstanding Throughout Each Period
Investment Activities | Distributions to Shareholders From | ||||||||||||||||||||||||||
| Net Asset Value, Beginning of Period | Net Investment Income (Loss) | Net Realized and Unrealized Gains (Losses) on Investments | Total from Investment Activities | Net Investment Income | Net Realized Gains from Investments | ||||||||||||||||||||||
Victory Diversified Stock Fund | |||||||||||||||||||||||||||
Class R6 | |||||||||||||||||||||||||||
Year Ended 10/31/19 | $ | 17.88 | 0.14 | (b) | 1.64 | 1.78 | (0.13 | ) | (1.91 | ) | |||||||||||||||||
Year Ended 10/31/18 | $ | 22.00 | 0.11 | (b) | 0.17 | 0.28 | (0.10 | ) | (4.30 | ) | |||||||||||||||||
Year Ended 10/31/17 | $ | 17.98 | 0.18 | (b) | 4.29 | 4.47 | (0.23 | ) | (0.22 | ) | |||||||||||||||||
Year Ended 10/31/16 | $ | 20.77 | 0.26 | (b) | (1.05 | ) | (0.79 | ) | (0.24 | ) | (1.76 | ) | |||||||||||||||
Year Ended 10/31/15 | $ | 23.01 | 0.19 | 0.99 | 1.18 | (0.21 | ) | (3.21 | ) | ||||||||||||||||||
Class Y | |||||||||||||||||||||||||||
Year Ended 10/31/19 | $ | 17.90 | 0.12 | (b) | 1.66 | 1.78 | (0.12 | ) | (1.91 | ) | |||||||||||||||||
Year Ended 10/31/18 | $ | 22.02 | 0.11 | (b) | 0.16 | 0.27 | (0.09 | ) | (4.30 | ) | |||||||||||||||||
Year Ended 10/31/17 | $ | 18.00 | 0.17 | (b) | 4.28 | 4.45 | (0.21 | ) | (0.22 | ) | |||||||||||||||||
Year Ended 10/31/16 | $ | 20.79 | 0.23 | (b) | (1.03 | ) | (0.80 | ) | (0.23 | ) | (1.76 | ) | |||||||||||||||
Year Ended 10/31/15 | $ | 23.04 | 0.19 | 0.97 | 1.16 | (0.20 | ) | (3.21 | ) | ||||||||||||||||||
(a) Portfolio turnover is calculated on the basis of the Fund as a whole without distinguishing between the classes of shares issued.
(b) Per share net investment income (loss) has been calculated using the average daily shares method.
(c) Portfolio turnover increase due to a change within the portfolio holdings during the year.
(d) Amount is less than $0.005 per share.
(e) During the period, certain fees were reduced and/or reimbursed. If such fee reductions and/or reimbursements had not occurred, the ratios would have been as indicated.
See notes to financial statements.
52
Victory Portfolios | Financial Highlights — continued | ||||||
For a Share Outstanding Throughout Each Period (continued)
Ratios to Average Net Assets | Supplemental Data | ||||||||||||||||||||||||||||||||||
| Total Distributions | Net Asset Value, End of Period | Total Return (Excludes Sales Charge) | Net Expenses | Net Investment Income (Loss) | Gross Expenses | Net Assets, End of Period (000's) | Portfolio Turnover(a) | ||||||||||||||||||||||||||||
Victory Diversified Stock Fund | |||||||||||||||||||||||||||||||||||
Class R6 | |||||||||||||||||||||||||||||||||||
Year Ended 10/31/19 | (2.04 | ) | $ | 17.62 | 12.58 | % | 0.78 | % | 0.83 | % | 1.24 | %(e) | $ | 2,313 | 132 | % | |||||||||||||||||||
Year Ended 10/31/18 | (4.40 | ) | $ | 17.88 | 0.10 | % | 0.78 | % | 0.58 | % | 1.21 | %(e) | $ | 2,189 | 112 | % | |||||||||||||||||||
Year Ended 10/31/17 | (0.45 | ) | $ | 22.00 | 25.24 | % | 0.78 | % | 0.94 | % | 1.29 | %(e) | $ | 2,427 | 133 | %(c) | |||||||||||||||||||
Year Ended 10/31/16 | (2.00 | ) | $ | 17.98 | (3.93 | )% | 0.78 | % | 1.40 | % | 0.92 | %(e) | $ | 2,332 | 74 | % | |||||||||||||||||||
Year Ended 10/31/15 | (3.42 | ) | $ | 20.77 | 5.19 | % | 0.78 | % | 0.78 | % | 2.01 | %(e) | $ | 5,447 | 74 | % | |||||||||||||||||||
Class Y | |||||||||||||||||||||||||||||||||||
Year Ended 10/31/19 | (2.03 | ) | $ | 17.65 | 12.53 | % | 0.86 | % | 0.76 | % | 1.33 | %(e) | $ | 4,249 | 132 | % | |||||||||||||||||||
Year Ended 10/31/18 | (4.39 | ) | $ | 17.90 | 0.01 | % | 0.86 | % | 0.54 | % | 1.13 | %(e) | $ | 4,373 | 112 | % | |||||||||||||||||||
Year Ended 10/31/17 | (0.43 | ) | $ | 22.02 | 25.11 | % | 0.86 | % | 0.88 | % | 0.94 | %(e) | $ | 8,843 | 133 | %(c) | |||||||||||||||||||
Year Ended 10/31/16 | (1.99 | ) | $ | 18.00 | (4.01 | )% | 0.86 | % | 1.27 | % | 0.96 | %(e) | $ | 11,907 | 74 | % | |||||||||||||||||||
Year Ended 10/31/15 | (3.41 | ) | $ | 20.79 | 5.06 | % | 0.86 | % | 0.90 | % | 0.98 | %(e) | $ | 18,526 | 74 | % | |||||||||||||||||||
See notes to financial statements.
53
Victory Portfolios | Financial Highlights | ||||||
For a Share Outstanding Throughout Each Period
Investment Activities | Distributions to Shareholders From | ||||||||||||||||||||||||||
| Net Asset Value, Beginning of Period | Net Investment Income (Loss) | Net Realized and Unrealized Gains (Losses) on Investments | Total from Investment Activities | Net Realized Gains from Investments | Total Distributions | ||||||||||||||||||||||
Victory NewBridge Large Cap Growth Fund | |||||||||||||||||||||||||||
Class A | |||||||||||||||||||||||||||
Year Ended 10/31/19 | $ | 7.94 | (0.05 | )(b) | 0.05 | (c) | — | (d) | (2.42 | ) | (2.42 | ) | |||||||||||||||
Year Ended 10/31/18 | $ | 10.23 | (0.09 | )(b) | 0.85 | 0.76 | (3.05 | ) | (3.05 | ) | |||||||||||||||||
Year Ended 10/31/17 | $ | 12.79 | (0.09 | )(b) | 1.82 | 1.73 | (4.29 | ) | (4.29 | ) | |||||||||||||||||
Year Ended 10/31/16 | $ | 19.17 | (0.11 | )(b) | (0.22 | ) | (0.33 | ) | (6.05 | ) | (6.05 | ) | |||||||||||||||
Year Ended 10/31/15 | $ | 19.38 | (0.20 | ) | 1.63 | 1.43 | (1.64 | ) | (1.64 | ) | |||||||||||||||||
Class C | |||||||||||||||||||||||||||
Year Ended 10/31/19 | $ | 5.00 | (0.06 | )(b) | (0.09 | )(c) | (0.15 | ) | (2.42 | ) | (2.42 | ) | |||||||||||||||
Year Ended 10/31/18 | $ | 7.59 | (0.10 | )(b) | 0.56 | 0.46 | (3.05 | ) | (3.05 | ) | |||||||||||||||||
Year Ended 10/31/17 | $ | 10.65 | (0.12 | )(b) | 1.35 | 1.23 | (4.29 | ) | (4.29 | ) | |||||||||||||||||
Year Ended 10/31/16 | $ | 17.06 | (0.18 | )(b) | (0.18 | ) | (0.36 | ) | (6.05 | ) | (6.05 | ) | |||||||||||||||
Year Ended 10/31/15 | $ | 17.56 | (0.29 | ) | 1.43 | 1.14 | (1.64 | ) | (1.64 | ) | |||||||||||||||||
Class I | |||||||||||||||||||||||||||
Year Ended 10/31/19 | $ | 8.49 | (0.04 | )(b) | 0.10 | (c) | 0.06 | (2.42 | ) | (2.42 | ) | ||||||||||||||||
Year Ended 10/31/18 | $ | 10.71 | (0.06 | )(b) | 0.89 | 0.83 | (3.05 | ) | (3.05 | ) | |||||||||||||||||
Year Ended 10/31/17 | $ | 13.13 | (0.05 | )(b) | 1.92 | 1.87 | (4.29 | ) | (4.29 | ) | |||||||||||||||||
Year Ended 10/31/16 | $ | 19.47 | (0.05 | )(b) | (0.24 | ) | (0.29 | ) | (6.05 | ) | (6.05 | ) | |||||||||||||||
Year Ended 10/31/15 | $ | 19.61 | (0.26 | ) | 1.76 | 1.50 | (1.64 | ) | (1.64 | ) | |||||||||||||||||
Class Y | |||||||||||||||||||||||||||
Year Ended 10/31/19 | $ | 8.24 | (0.04 | )(b) | 0.08 | (c) | 0.04 | (2.42 | ) | (2.42 | ) | ||||||||||||||||
Year Ended 10/31/18 | $ | 10.48 | (0.06 | )(b) | 0.87 | 0.81 | (3.05 | ) | (3.05 | ) | |||||||||||||||||
Year Ended 10/31/17 | $ | 12.96 | (0.06 | )(b) | 1.87 | 1.81 | (4.29 | ) | (4.29 | ) | |||||||||||||||||
Year Ended 10/31/16 | $ | 19.31 | (0.07 | )(b) | (0.23 | ) | (0.30 | ) | (6.05 | ) | (6.05 | ) | |||||||||||||||
Year Ended 10/31/15 | $ | 19.47 | (0.28 | ) | 1.76 | 1.48 | (1.64 | ) | (1.64 | ) | |||||||||||||||||
(a) Portfolio turnover is calculated on the basis of the Fund as a whole without distinguishing between the classes of shares issued.
(b) Per share net investment income (loss) has been calculated using the average daily shares method.
(c) The amount shown for a share outstanding throughout the period does not accord with the change in aggregate gains and losses in the portfolio of securities during the period because of timing of sales and purchases of fund shares in relation to fluctuating market values during the period.
(d) Amount is less than $0.005 per share.
(e) During the period, certain fees were reduced and/or reimbursed. If such fee reductions and/or reimbursements had not occurred, the ratios would have been as indicated.
See notes to financial statements.
54
Victory Portfolios | Financial Highlights — continued | ||||||
For a Share Outstanding Throughout Each Period
Ratios to Average Net Assets | Supplemental Data | ||||||||||||||||||||||||||||||
| Net Asset Value, End of Period | Total Return (Excludes Sales Charge) | Net Expenses | Net Investment Income (Loss) | Gross Expenses | Net Assets, End of Period (000's) | Portfolio Turnover(a) | |||||||||||||||||||||||||
Victory NewBridge Large Cap Growth Fund | |||||||||||||||||||||||||||||||
Class A | |||||||||||||||||||||||||||||||
Year Ended 10/31/19 | $ | 5.52 | 4.56 | % | 1.36 | % | (0.97 | )% | 1.60 | %(e) | $ | 5,732 | 62 | % | |||||||||||||||||
Year Ended 10/31/18 | $ | 7.94 | 9.41 | % | 1.36 | % | (1.05 | )% | 1.47 | %(e) | $ | 5,546 | 41 | % | |||||||||||||||||
Year Ended 10/31/17 | $ | 10.23 | 20.84 | % | 1.40 | % | (0.94 | )% | 1.40 | % | $ | 7,639 | 60 | % | |||||||||||||||||
Year Ended 10/31/16 | $ | 12.79 | (3.00 | )% | 1.30 | % | (0.79 | )% | 1.30 | % | $ | 11,700 | 52 | % | |||||||||||||||||
Year Ended 10/31/15 | $ | 19.17 | 7.86 | % | 1.26 | % | (0.73 | )% | 1.26 | % | $ | 20,207 | 55 | % | |||||||||||||||||
Class C | |||||||||||||||||||||||||||||||
Year Ended 10/31/19 | $ | 2.43 | 3.92 | % | 2.10 | % | (1.71 | )% | 2.70 | %(e) | $ | 1,768 | 62 | % | |||||||||||||||||
Year Ended 10/31/18 | $ | 5.00 | 8.47 | % | 2.10 | % | (1.78 | )% | 2.40 | %(e) | $ | 3,042 | 41 | % | |||||||||||||||||
Year Ended 10/31/17 | $ | 7.59 | 20.06 | % | 2.10 | % | (1.64 | )% | 2.27 | %(e) | $ | 4,201 | 60 | % | |||||||||||||||||
Year Ended 10/31/16 | $ | 10.65 | (3.79 | )% | 2.10 | % | (1.59 | )% | 2.15 | %(e) | $ | 6,321 | 52 | % | |||||||||||||||||
Year Ended 10/31/15 | $ | 17.06 | 6.94 | % | 2.10 | % | (1.58 | )% | 2.13 | %(e) | $ | 9,389 | 55 | % | |||||||||||||||||
Class I | |||||||||||||||||||||||||||||||
Year Ended 10/31/19 | $ | 6.13 | 5.11 | % | 0.95 | % | (0.56 | )% | 1.26 | %(e) | $ | 6,043 | 62 | % | |||||||||||||||||
Year Ended 10/31/18 | $ | 8.49 | �� | 9.74 | % | 0.95 | % | (0.63 | )% | 1.09 | %(e) | $ | 10,633 | 41 | % | ||||||||||||||||
Year Ended 10/31/17 | $ | 10.71 | 21.52 | % | 0.95 | % | (0.47 | )% | 1.01 | %(e) | $ | 16,103 | 60 | % | |||||||||||||||||
Year Ended 10/31/16 | $ | 13.13 | (2.67 | )% | 0.88 | % | (0.36 | )% | 0.88 | % | $ | 31,299 | 52 | % | |||||||||||||||||
Year Ended 10/31/15 | $ | 19.47 | 8.14 | % | 0.95 | % | (0.41 | )% | 1.04 | %(e) | $ | 63,569 | 55 | % | |||||||||||||||||
Class Y | |||||||||||||||||||||||||||||||
Year Ended 10/31/19 | $ | 5.86 | 5.06 | % | 1.02 | % | (0.63 | )% | 1.69 | %(e) | $ | 2,498 | 62 | % | |||||||||||||||||
Year Ended 10/31/18 | $ | 8.24 | 9.75 | % | 1.02 | % | (0.72 | )% | 1.48 | %(e) | $ | 3,411 | 41 | % | |||||||||||||||||
Year Ended 10/31/17 | $ | 10.48 | 21.30 | % | 1.02 | % | (0.55 | )% | 1.42 | %(e) | $ | 2,128 | 60 | % | |||||||||||||||||
Year Ended 10/31/16 | $ | 12.96 | (2.76 | )% | 1.02 | % | (0.50 | )% | 1.08 | %(e) | $ | 4,344 | 52 | % | |||||||||||||||||
Year Ended 10/31/15 | $ | 19.31 | 8.09 | % | 1.02 | % | (0.46 | )% | 1.04 | %(e) | $ | 12,141 | 55 | % | |||||||||||||||||
See notes to financial statements.
55
Victory Portfolios | Financial Highlights | ||||||
For a Share Outstanding Throughout Each Period
Investment Activities | Distributions to Shareholders From | ||||||||||||||||||||||||||
| Net Asset Value, Beginning of Period | Net Investment Income (Loss) | Net Realized and Unrealized Gains (Losses) on Investments | Total from Investment Activities | Net Investment Income | Net Realized Gains from Investments | ||||||||||||||||||||||
Victory Special Value Fund | |||||||||||||||||||||||||||
Class A | |||||||||||||||||||||||||||
Year Ended 10/31/19 | $ | 26.10 | 0.10 | (c) | 2.26 | 2.36 | (0.03 | ) | (2.65 | ) | |||||||||||||||||
Year Ended 10/31/18 | $ | 26.31 | 0.05 | (c) | (0.15 | )(d) | (0.10 | ) | (0.11 | ) | — | ||||||||||||||||
Year Ended 10/31/17 | $ | 21.48 | 0.13 | (c) | 4.95 | 5.08 | (0.25 | ) | — | ||||||||||||||||||
Year Ended 10/31/16 | $ | 22.46 | 0.20 | (c) | (1.11 | ) | (0.91 | ) | (0.07 | ) | — | ||||||||||||||||
Year Ended 10/31/15 | $ | 21.71 | 0.12 | 0.63 | 0.75 | — | — | ||||||||||||||||||||
Class C | |||||||||||||||||||||||||||
Year Ended 10/31/19 | $ | 23.34 | (0.09 | )(c) | 1.94 | 1.85 | — | (2.65 | ) | ||||||||||||||||||
Year Ended 10/31/18 | $ | 23.66 | (0.18 | )(c) | (0.14 | )(d) | (0.32 | ) | — | — | |||||||||||||||||
Year Ended 10/31/17 | $ | 19.34 | (0.08 | )(c) | 4.45 | 4.37 | (0.05 | ) | — | ||||||||||||||||||
Year Ended 10/31/16 | $ | 20.34 | 0.01 | (c) | (1.01 | ) | (1.00 | ) | — | — | |||||||||||||||||
Year Ended 10/31/15 | $ | 19.82 | (0.10 | ) | 0.62 | 0.52 | — | — | |||||||||||||||||||
Class I | |||||||||||||||||||||||||||
Year Ended 10/31/19 | $ | 26.39 | 0.14 | (c) | 2.30 | 2.44 | (0.05 | ) | (2.65 | ) | |||||||||||||||||
Year Ended 10/31/18 | $ | 26.62 | 0.09 | (c) | (0.15 | )(d) | (0.06 | ) | (0.17 | ) | — | ||||||||||||||||
Year Ended 10/31/17 | $ | 21.76 | 0.13 | (c) | 5.01 | 5.14 | (0.28 | ) | — | ||||||||||||||||||
Year Ended 10/31/16 | $ | 22.78 | 0.23 | (c) | (1.12 | ) | (0.89 | ) | (0.13 | ) | — | ||||||||||||||||
Year Ended 10/31/15 | $ | 21.96 | 0.19 | 0.63 | 0.82 | — | — | ||||||||||||||||||||
Class R | |||||||||||||||||||||||||||
Year Ended 10/31/19 | $ | 25.02 | 0.03 | (c) | 2.15 | 2.18 | — | (2.65 | ) | ||||||||||||||||||
Year Ended 10/31/18 | $ | 25.24 | (0.03 | )(c) | (0.15 | )(d) | (0.18 | ) | (0.04 | ) | — | ||||||||||||||||
Year Ended 10/31/17 | $ | 20.63 | 0.05 | (c) | 4.75 | 4.80 | (0.19 | ) | — | ||||||||||||||||||
Year Ended 10/31/16 | $ | 21.57 | 0.14 | (c) | (1.07 | ) | (0.93 | ) | (0.01 | ) | — | ||||||||||||||||
Year Ended 10/31/15 | $ | 20.91 | 0.04 | 0.62 | 0.66 | — | — | ||||||||||||||||||||
Class Y | |||||||||||||||||||||||||||
Year Ended 10/31/19 | $ | 26.25 | 0.15 | (c) | 2.28 | 2.43 | (0.05 | ) | (2.65 | ) | |||||||||||||||||
Year Ended 10/31/18 | $ | 26.47 | 0.12 | (c) | (0.17 | )(d) | (0.05 | ) | (0.17 | ) | — | ||||||||||||||||
Year Ended 10/31/17 | $ | 21.62 | 0.18 | (c) | 4.98 | 5.16 | (0.31 | ) | — | ||||||||||||||||||
Year Ended 10/31/16 | $ | 22.62 | 0.26 | (c) | (1.12 | ) | (0.86 | ) | (0.14 | ) | — | ||||||||||||||||
Year Ended 10/31/15 | $ | 21.80 | 0.18 | 0.64 | 0.82 | — | — | ||||||||||||||||||||
(a) During the period, certain fees were reduced and/or reimbursed. If such fee reductions and/or reimbursements had not occurred, the ratios would have been as indicated.
(b) Portfolio turnover is calculated on the basis of the Fund as a whole without distinguishing between the classes of shares issued.
(c) Per share net investment income (loss) has been calculated using the average daily shares method.
(d) The amount shown for a share outstanding throughout the period does not accord with the change in net assets resulting from operations during the period because of the timing of sales and purchases of fund shares in relation to fluctuating market values during the period.
See notes to financial statements.
56
Victory Portfolios | Financial Highlights — continued | ||||||
For a Share Outstanding Throughout Each Period
Ratios to Average Net Assets | Supplemental Data | ||||||||||||||||||||||||||||||||||
| Total Distributions | Net Asset Value, End of Period | Total Return (Excludes Sales Charge) | Net Expenses | Net Investment Income (Loss) | Gross Expenses(a) | Net Assets, End of Period (000's) | Portfolio Turnover(b) | ||||||||||||||||||||||||||||
Victory Special Value Fund | |||||||||||||||||||||||||||||||||||
Class A | |||||||||||||||||||||||||||||||||||
Year Ended 10/31/19 | (2.68 | ) | $ | 25.78 | 11.32 | % | 1.21 | % | 0.41 | % | 1.31 | % | $ | 27,818 | 126 | % | |||||||||||||||||||
Year Ended 10/31/18 | (0.11 | ) | $ | 26.10 | (0.42 | )% | 1.17 | % | 0.19 | % | 1.27 | % | $ | 32,565 | 113 | % | |||||||||||||||||||
Year Ended 10/31/17 | (0.25 | ) | $ | 26.31 | 23.84 | % | 1.17 | % | 0.53 | % | 1.27 | % | $ | 35,223 | 135 | % | |||||||||||||||||||
Year Ended 10/31/16 | (0.07 | ) | $ | 21.48 | (4.06 | )% | 1.20 | % | 0.93 | % | 1.30 | % | $ | 36,971 | 76 | % | |||||||||||||||||||
Year Ended 10/31/15 | — | $ | 22.46 | 3.45 | % | 1.28 | % | 0.52 | % | 1.35 | % | $ | 48,913 | 137 | % | ||||||||||||||||||||
Class C | |||||||||||||||||||||||||||||||||||
Year Ended 10/31/19 | (2.65 | ) | $ | 22.54 | 10.34 | % | 2.10 | % | (0.44 | )% | 2.79 | % | $ | 1,241 | 126 | % | |||||||||||||||||||
Year Ended 10/31/18 | — | $ | 23.34 | (1.35 | )% | 2.10 | % | (0.75 | )% | 2.27 | % | $ | 2,145 | 113 | % | ||||||||||||||||||||
Year Ended 10/31/17 | (0.05 | ) | $ | 23.66 | 22.65 | % | 2.10 | % | (0.38 | )% | 2.21 | % | $ | 7,296 | 135 | % | |||||||||||||||||||
Year Ended 10/31/16 | — | $ | 19.34 | (4.92 | )% | 2.09 | % | 0.04 | % | 2.19 | % | $ | 7,955 | 76 | % | ||||||||||||||||||||
Year Ended 10/31/15 | — | $ | 20.34 | 2.62 | % | 2.13 | % | (0.35 | )% | 2.21 | % | $ | 11,253 | 137 | % | ||||||||||||||||||||
Class I | |||||||||||||||||||||||||||||||||||
Year Ended 10/31/19 | (2.70 | ) | $ | 26.13 | 11.52 | % | 1.05 | % | 0.58 | % | 1.34 | % | $ | 3,274 | 126 | % | |||||||||||||||||||
Year Ended 10/31/18 | (0.17 | ) | $ | 26.39 | (0.28 | )% | 1.02 | % | 0.31 | % | 1.16 | % | $ | 3,678 | 113 | % | |||||||||||||||||||
Year Ended 10/31/17 | (0.28 | ) | $ | 26.62 | 23.86 | % | 1.15 | % | 0.56 | % | 1.25 | % | $ | 3,703 | 135 | % | |||||||||||||||||||
Year Ended 10/31/16 | (0.13 | ) | $ | 21.76 | (3.93 | )% | 1.05 | % | 1.07 | % | 1.15 | % | $ | 4,016 | 76 | % | |||||||||||||||||||
Year Ended 10/31/15 | — | $ | 22.78 | 3.73 | % | 1.02 | % | 0.78 | % | 1.09 | % | $ | 6,285 | 137 | % | ||||||||||||||||||||
Class R | |||||||||||||||||||||||||||||||||||
Year Ended 10/31/19 | (2.65 | ) | $ | 24.55 | 11.03 | % | 1.50 | % | 0.13 | % | 1.60 | % | $ | 21,084 | 126 | % | |||||||||||||||||||
Year Ended 10/31/18 | (0.04 | ) | $ | 25.02 | (0.71 | )% | 1.46 | % | (0.10 | )% | 1.56 | % | $ | 26,532 | 113 | % | |||||||||||||||||||
Year Ended 10/31/17 | (0.19 | ) | $ | 25.24 | 23.43 | % | 1.47 | % | 0.24 | % | 1.57 | % | $ | 36,688 | 135 | % | |||||||||||||||||||
Year Ended 10/31/16 | (0.01 | ) | $ | 20.63 | (4.29 | )% | 1.46 | % | 0.67 | % | 1.56 | % | $ | 34,784 | 76 | % | |||||||||||||||||||
Year Ended 10/31/15 | — | $ | 21.57 | 3.16 | % | 1.55 | % | 0.23 | % | 1.63 | % | $ | 46,357 | 137 | % | ||||||||||||||||||||
Class Y | |||||||||||||||||||||||||||||||||||
Year Ended 10/31/19 | (2.70 | ) | $ | 25.98 | 11.57 | % | 1.00 | % | 0.60 | % | 4.50 | % | $ | 520 | 126 | % | |||||||||||||||||||
Year Ended 10/31/18 | (0.17 | ) | $ | 26.25 | (0.21 | )% | 0.97 | % | 0.42 | % | 2.82 | % | $ | 436 | 113 | % | |||||||||||||||||||
Year Ended 10/31/17 | (0.31 | ) | $ | 26.47 | 24.12 | % | 0.93 | % | 0.77 | % | 2.07 | % | $ | 1,219 | 135 | % | |||||||||||||||||||
Year Ended 10/31/16 | (0.14 | ) | $ | 21.62 | (3.80 | )% | 0.93 | % | 1.20 | % | 1.75 | % | $ | 1,170 | 76 | % | |||||||||||||||||||
Year Ended 10/31/15 | — | $ | 22.62 | 3.76 | % | 1.00 | % | 0.78 | % | 1.58 | % | $ | 1,790 | 137 | % | ||||||||||||||||||||
See notes to financial statements.
57
Victory Portfolios | Financial Highlights | ||||||
For a Share Outstanding Throughout Each Period
Investment Activities | Distributions to Shareholders From | ||||||||||||||||||||||||||
| Net Asset Value, Beginning of Period | Net Investment Income (Loss) | Net Realized and Unrealized Gains (Losses) on Investments | Total from Investment Activities | Net Investment Income | Net Realized Gains from Investments | ||||||||||||||||||||||
Victory Strategic Allocation Fund | |||||||||||||||||||||||||||
Class A | |||||||||||||||||||||||||||
Year Ended 10/31/19 | $ | 15.44 | 0.43 | (d) | 1.12 | 1.55 | (0.39 | ) | (0.13 | ) | |||||||||||||||||
Year Ended 10/31/18 | $ | 16.41 | 0.29 | (d) | (0.68 | ) | (0.39 | ) | (0.39 | ) | (0.19 | ) | |||||||||||||||
Year Ended 10/31/17 | $ | 14.80 | 0.50 | (d) | 1.51 | 2.01 | (0.40 | ) | — | ||||||||||||||||||
Year Ended 10/31/16 | $ | 15.10 | 0.15 | (d) | (0.28 | ) | (0.13 | ) | (0.17 | ) | — | ||||||||||||||||
Year Ended 10/31/15 | $ | 15.69 | 0.14 | 0.57 | 0.71 | (0.30 | ) | (1.00 | ) | ||||||||||||||||||
Class C | |||||||||||||||||||||||||||
Year Ended 10/31/19 | $ | 15.19 | 0.30 | (d) | 1.10 | 1.40 | (0.28 | ) | (0.13 | ) | |||||||||||||||||
Year Ended 10/31/18 | $ | 16.19 | 0.21 | (d) | (0.71 | ) | (0.50 | ) | (0.31 | ) | (0.19 | ) | |||||||||||||||
Year Ended 10/31/17 | $ | 14.65 | 0.43 | (d) | 1.44 | 1.87 | (0.33 | ) | — | ||||||||||||||||||
Year Ended 10/31/16 | $ | 14.97 | 0.06 | (d) | (0.29 | ) | (0.23 | ) | (0.09 | ) | — | ||||||||||||||||
Year Ended 10/31/15 | $ | 15.57 | 0.01 | 0.59 | 0.60 | (0.20 | ) | (1.00 | ) | ||||||||||||||||||
Class I | |||||||||||||||||||||||||||
Year Ended 10/31/19 | $ | 15.52 | 0.46 | (d) | 1.13 | 1.59 | (0.42 | ) | (0.13 | ) | |||||||||||||||||
Year Ended 10/31/18 | $ | 16.48 | 0.35 | (d) | (0.70 | ) | (0.35 | ) | (0.42 | ) | (0.19 | ) | |||||||||||||||
Year Ended 10/31/17 | $ | 14.86 | 0.55 | (d) | 1.50 | 2.05 | (0.43 | ) | — | ||||||||||||||||||
Year Ended 10/31/16 | $ | 15.16 | 0.15 | (d) | (0.24 | ) | (0.09 | ) | (0.21 | ) | — | ||||||||||||||||
Year Ended 10/31/15 | $ | 15.74 | 0.29 | 0.47 | 0.76 | (0.34 | ) | (1.00 | ) | ||||||||||||||||||
Class R | |||||||||||||||||||||||||||
Year Ended 10/31/19 | $ | 15.41 | 0.36 | (d) | 1.14 | 1.50 | (0.35 | ) | (0.13 | ) | |||||||||||||||||
Year Ended 10/31/18 | $ | 16.38 | 0.27 | (d) | (0.70 | ) | (0.43 | ) | (0.35 | ) | (0.19 | ) | |||||||||||||||
Year Ended 10/31/17 | $ | 14.79 | 0.46 | (d) | 1.49 | 1.95 | (0.36 | ) | — | ||||||||||||||||||
Year Ended 10/31/16 | $ | 15.09 | 0.09 | (d) | (0.26 | ) | (0.17 | ) | (0.13 | ) | — | ||||||||||||||||
Year Ended 10/31/15 | $ | 15.68 | 0.08 | 0.59 | 0.67 | (0.26 | ) | (1.00 | ) | ||||||||||||||||||
(a) The expense ratios exclude the impact of expenses paid by each underlying fund.
(b) During the period, certain fees were reduced and/or reimbursed. If such fee reductions and/or reimbursements had not occurred, the ratios would have been as indicated.
(c) Portfolio turnover is calculated on the basis of the Fund as a whole without distinguishing between the classes of shares issued.
(d) Per share net investment income (loss) has been calculated using the average daily shares method.
(e) The amount includes a change in accounting estimate. Without this change in accounting estimate, the gross expense ratio would have been 0.67%, 1.54%, 0.42% and 1.43% for Class A, C, I and R, respectively.
(f) Effective with the December 30, 2015 strategy change, the Adviser began reimbursing expenses inclusive of acquired fund fee and expenses.
(g) Portfolio turnover increased due to a change in investment strategy.
See notes to financial statements.
58
Victory Portfolios | Financial Highlights — continued | ||||||
For a Share Outstanding Throughout Each Period
Ratios to Average Net Assets | Supplemental Data | ||||||||||||||||||||||||||||||||||
| Total Distributions | Net Asset Value, End of Period | Total Return (Excludes Sales Charge) | Net Expenses(a) | Net Investment Income (Loss) | Gross Expenses(a)(b) | Net Assets, End of Period (000's) | Portfolio Turnover(c) | ||||||||||||||||||||||||||||
Victory Strategic Allocation Fund | |||||||||||||||||||||||||||||||||||
Class A | |||||||||||||||||||||||||||||||||||
Year Ended 10/31/19 | (0.52 | ) | $ | 16.47 | 10.37 | % | 0.40 | % | 2.69 | % | 0.77 | % | $ | 15,365 | 5 | % | |||||||||||||||||||
Year Ended 10/31/18 | (0.58 | ) | $ | 15.44 | (2.56 | )% | 0.40 | % | 1.77 | % | 0.28 | %(e) | $ | 18,747 | 40 | % | |||||||||||||||||||
Year Ended 10/31/17 | (0.40 | ) | $ | 16.41 | 13.72 | % | 0.30 | % | 3.19 | % | 0.79 | % | $ | 14,820 | 51 | % | |||||||||||||||||||
Year Ended 10/31/16 | (0.17 | ) | $ | 14.80 | (0.87 | )% | 0.31 | %(f) | 0.99 | % | 1.69 | % | $ | 16,587 | 192 | %(g) | |||||||||||||||||||
Year Ended 10/31/15 | (1.30 | ) | $ | 15.10 | 4.66 | % | 1.15 | % | 0.82 | % | 1.40 | % | $ | 10,560 | 72 | % | |||||||||||||||||||
Class C | |||||||||||||||||||||||||||||||||||
Year Ended 10/31/19 | (0.41 | ) | $ | 16.18 | 9.53 | % | 1.15 | % | 1.94 | % | 1.72 | % | $ | 3,193 | 5 | % | |||||||||||||||||||
Year Ended 10/31/18 | (0.50 | ) | $ | 15.19 | (3.26 | )% | 1.15 | % | 1.30 | % | 1.08 | %(e) | $ | 4,445 | 40 | % | |||||||||||||||||||
Year Ended 10/31/17 | (0.33 | ) | $ | 16.19 | 12.88 | % | 1.03 | % | 2.78 | % | 1.58 | % | $ | 8,814 | 51 | % | |||||||||||||||||||
Year Ended 10/31/16 | (0.09 | ) | $ | 14.65 | (1.56 | )% | 0.95 | %(f) | 0.44 | % | 2.65 | % | $ | 9,724 | 192 | %(g) | |||||||||||||||||||
Year Ended 10/31/15 | (1.20 | ) | $ | 14.97 | 3.92 | % | 1.85 | % | 0.12 | % | 2.36 | % | $ | 2,725 | 72 | % | |||||||||||||||||||
Class I | |||||||||||||||||||||||||||||||||||
Year Ended 10/31/19 | (0.55 | ) | $ | 16.56 | 10.63 | % | 0.15 | % | 2.90 | % | 0.59 | % | $ | 5,743 | 5 | % | |||||||||||||||||||
Year Ended 10/31/18 | (0.61 | ) | $ | 15.52 | (2.29 | )% | 0.15 | % | 2.11 | % | 0.01 | %(e) | $ | 8,811 | 40 | % | |||||||||||||||||||
Year Ended 10/31/17 | (0.43 | ) | $ | 16.48 | 13.95 | % | 0.10 | % | 3.48 | % | 0.61 | % | $ | 9,153 | 51 | % | |||||||||||||||||||
Year Ended 10/31/16 | (0.21 | ) | $ | 14.86 | (0.61 | )% | 0.24 | %(f) | 1.04 | % | 2.64 | % | $ | 1,099 | 192 | %(g) | |||||||||||||||||||
Year Ended 10/31/15 | (1.34 | ) | $ | 15.16 | 4.96 | % | 0.90 | % | 0.93 | % | 4.15 | % | $ | 1,474 | 72 | % | |||||||||||||||||||
Class R | |||||||||||||||||||||||||||||||||||
Year Ended 10/31/19 | (0.48 | ) | $ | 16.43 | 10.08 | % | 0.65 | % | 2.30 | % | 1.87 | % | $ | 1,308 | 5 | % | |||||||||||||||||||
Year Ended 10/31/18 | (0.54 | ) | $ | 15.41 | (2.77 | )% | 0.65 | % | 1.63 | % | 1.01 | %(e) | $ | 1,529 | 40 | % | |||||||||||||||||||
Year Ended 10/31/17 | (0.36 | ) | $ | 16.38 | 13.36 | % | 0.56 | % | 2.96 | % | 1.80 | % | $ | 1,892 | 51 | % | |||||||||||||||||||
Year Ended 10/31/16 | (0.13 | ) | $ | 14.79 | (1.14 | )% | 0.62 | %(f) | 0.58 | % | 2.13 | % | $ | 1,702 | 192 | %(g) | |||||||||||||||||||
Year Ended 10/31/15 | (1.26 | ) | $ | 15.09 | 4.36 | % | 1.45 | % | 0.52 | % | 2.17 | % | $ | 1,875 | 72 | % | |||||||||||||||||||
See notes to financial statements.
59
Victory Portfolios | Financial Highlights | ||||||
For a Share Outstanding Throughout Each Period
Investment Activities | Distributions to Shareholders From | ||||||||||||||||||||||||||
| Net Asset Value, Beginning of Period | Net Investment Income (Loss) | Net Realized and Unrealized Gains (Losses) on Investments | Total from Investment Activities | Net Investment Income | Total Distributions | ||||||||||||||||||||||
Victory INCORE Fund for Income | |||||||||||||||||||||||||||
Class A | |||||||||||||||||||||||||||
Year Ended 10/31/19 | $ | 8.56 | 0.18 | (b) | 0.28 | 0.46 | (0.46 | ) | (0.46 | ) | |||||||||||||||||
Year Ended 10/31/18 | $ | 9.09 | 0.15 | (b)(d) | (0.23 | )(d) | (0.08 | ) | (0.45 | ) | (0.45 | ) | |||||||||||||||
Year Ended 10/31/17 | $ | 9.63 | 0.10 | (b) | (0.15 | ) | (0.05 | ) | (0.49 | ) | (0.49 | ) | |||||||||||||||
Year Ended 10/31/16 | $ | 9.96 | 0.11 | (b) | 0.05 | 0.16 | (0.49 | ) | (0.49 | ) | |||||||||||||||||
Year Ended 10/31/15 | $ | 10.27 | 0.15 | 0.04 | 0.19 | (0.50 | ) | (0.50 | ) | ||||||||||||||||||
Class C | |||||||||||||||||||||||||||
Year Ended 10/31/19 | $ | 8.48 | 0.13 | (b) | 0.26 | 0.39 | (0.39 | ) | (0.39 | ) | |||||||||||||||||
Year Ended 10/31/18 | $ | 9.01 | 0.08 | (b)(d) | (0.23 | )(d) | (0.15 | ) | (0.38 | ) | (0.38 | ) | |||||||||||||||
Year Ended 10/31/17 | $ | 9.56 | 0.03 | (b) | (0.16 | ) | (0.13 | ) | (0.42 | ) | (0.42 | ) | |||||||||||||||
Year Ended 10/31/16 | $ | 9.89 | 0.03 | (b) | 0.06 | 0.09 | (0.42 | ) | (0.42 | ) | |||||||||||||||||
Year Ended 10/31/15 | $ | 10.20 | 0.02 | 0.10 | 0.12 | (0.43 | ) | (0.43 | ) | ||||||||||||||||||
Class I | |||||||||||||||||||||||||||
Year Ended 10/31/19 | $ | 8.55 | 0.16 | (b) | 0.32 | 0.48 | (0.48 | ) | (0.48 | ) | |||||||||||||||||
Year Ended 10/31/18 | $ | 9.08 | 0.15 | (b)(d) | (0.21 | )(d) | (0.06 | ) | (0.47 | ) | (0.47 | ) | |||||||||||||||
Year Ended 10/31/17 | $ | 9.63 | 0.13 | (b) | (0.16 | ) | (0.03 | ) | (0.52 | ) | (0.52 | ) | |||||||||||||||
Year Ended 10/31/16 | $ | 9.96 | 0.13 | (b) | 0.06 | 0.19 | (0.52 | ) | (0.52 | ) | |||||||||||||||||
Year Ended 10/31/15 | $ | 10.26 | 0.16 | 0.07 | 0.23 | (0.53 | ) | (0.53 | ) | ||||||||||||||||||
Class R | |||||||||||||||||||||||||||
Year Ended 10/31/19 | $ | 8.57 | 0.18 | (b) | 0.27 | 0.45 | (0.46 | ) | (0.46 | ) | |||||||||||||||||
Year Ended 10/31/18 | $ | 9.09 | 0.15 | (b)(d) | (0.22 | )(d) | (0.07 | ) | (0.45 | ) | (0.45 | ) | |||||||||||||||
Year Ended 10/31/17 | $ | 9.64 | 0.10 | (b) | (0.16 | ) | (0.06 | ) | (0.49 | ) | (0.49 | ) | |||||||||||||||
Year Ended 10/31/16 | $ | 9.97 | 0.11 | (b) | 0.05 | 0.16 | (0.49 | ) | (0.49 | ) | |||||||||||||||||
Year Ended 10/31/15 | $ | 10.28 | 0.11 | 0.08 | 0.19 | (0.50 | ) | (0.50 | ) | ||||||||||||||||||
(continues on next page)
(a) Portfolio turnover is calculated on the basis of the Fund as a whole without distinguishing between the classes of shares issued.
(b) Per share net investment income (loss) has been calculated using the average daily shares method.
(c) During the period, certain fees were reduced and/or reimbursed. If such fee reductions and/or reimbursements had not occurred, the ratios would have been as indicated.
(d) Net Investment Income (Loss) per share, Net Realized and Unrealized Gains (Losses) on Investments and the Ratio of Net Investment Income (Loss) have been restated. See Item 11 in the Notes to Financial Statements.
(e) Commencement of operations.
(f) Annualized for periods less than one year.
(g) Not annualized for periods less than one year.
See notes to financial statements.
60
Victory Portfolios | Financial Highlights — continued | ||||||
For a Share Outstanding Throughout Each Period
Ratios to Average Net Assets | Supplemental Data | ||||||||||||||||||||||||||||||
| Net Asset Value, End of Period | Total Return (Excludes Sales Charge) | Net Expenses | Net Investment Income (Loss) | Gross Expenses | Net Assets, End of Period (000's) | Portfolio Turnover(a) | |||||||||||||||||||||||||
Victory INCORE Fund for Income | |||||||||||||||||||||||||||||||
Class A | |||||||||||||||||||||||||||||||
Year Ended 10/31/19 | $ | 8.56 | 5.50 | % | 0.92 | % | 2.12 | % | 0.94 | %(c) | $ | 136,570 | 29 | % | |||||||||||||||||
Year Ended 10/31/18 | $ | 8.56 | (0.91 | )% | 0.92 | % | 1.64 | %(d) | 0.93 | %(c) | $ | 153,574 | 27 | % | |||||||||||||||||
Year Ended 10/31/17 | $ | 9.09 | (0.51 | )% | 0.88 | % | 1.08 | % | 0.88 | % | $ | 224,822 | 30 | % | |||||||||||||||||
Year Ended 10/31/16 | $ | 9.63 | 1.62 | % | 0.91 | % | 1.10 | % | 0.91 | % | $ | 400,740 | 31 | % | |||||||||||||||||
Year Ended 10/31/15 | $ | 9.96 | 1.90 | % | 0.94 | % | 1.09 | % | 0.94 | % | $ | 349,571 | 44 | % | |||||||||||||||||
Class C | |||||||||||||||||||||||||||||||
Year Ended 10/31/19 | $ | 8.48 | 4.72 | % | 1.72 | % | 1.53 | % | 1.73 | %(c) | $ | 22,541 | 29 | % | |||||||||||||||||
Year Ended 10/31/18 | $ | 8.48 | (1.69 | )% | 1.70 | % | 0.94 | %(d) | 1.71 | %(c) | $ | 31,976 | 27 | % | |||||||||||||||||
Year Ended 10/31/17 | $ | 9.01 | (1.41 | )% | 1.67 | % | 0.29 | % | 1.67 | % | $ | 50,316 | 30 | % | |||||||||||||||||
Year Ended 10/31/16 | $ | 9.56 | 0.88 | % | 1.69 | % | 0.32 | % | 1.69 | % | $ | 72,958 | 31 | % | |||||||||||||||||
Year Ended 10/31/15 | $ | 9.89 | 1.14 | % | 1.72 | % | 0.31 | % | 1.72 | % | $ | 68,015 | 44 | % | |||||||||||||||||
Class I | |||||||||||||||||||||||||||||||
Year Ended 10/31/19 | $ | 8.55 | 5.79 | % | 0.64 | % | 1.84 | % | 0.65 | %(c) | $ | 447,735 | 29 | % | |||||||||||||||||
Year Ended 10/31/18 | $ | 8.55 | (0.64 | )% | 0.63 | % | 1.69 | %(d) | 0.63 | % | $ | 331,338 | 27 | % | |||||||||||||||||
Year Ended 10/31/17 | $ | 9.08 | (0.34 | )% | 0.61 | % | 1.34 | % | 0.61 | % | $ | 520,056 | 30 | % | |||||||||||||||||
Year Ended 10/31/16 | $ | 9.63 | 1.90 | % | 0.63 | % | 1.37 | % | 0.63 | % | $ | 547,322 | 31 | % | |||||||||||||||||
Year Ended 10/31/15 | $ | 9.96 | 2.28 | % | 0.65 | % | 1.37 | % | 0.65 | % | $ | 403,879 | 44 | % | |||||||||||||||||
Class R | |||||||||||||||||||||||||||||||
Year Ended 10/31/19 | $ | 8.56 | 5.37 | % | 0.92 | % | 2.04 | % | 0.94 | %(c) | $ | 38,596 | 29 | % | |||||||||||||||||
Year Ended 10/31/18 | $ | 8.57 | (0.79 | )% | 0.91 | % | 1.67 | %(d) | 0.91 | % | $ | 43,405 | 27 | % | |||||||||||||||||
Year Ended 10/31/17 | $ | 9.09 | (0.62 | )% | 0.88 | % | 1.08 | % | 0.88 | % | $ | 58,783 | 30 | % | |||||||||||||||||
Year Ended 10/31/16 | $ | 9.64 | 1.62 | % | 0.90 | % | 1.11 | % | 0.90 | % | $ | 85,195 | 31 | % | |||||||||||||||||
Year Ended 10/31/15 | $ | 9.97 | 1.88 | % | 0.95 | % | 1.07 | % | 0.95 | % | $ | 73,805 | 44 | % | |||||||||||||||||
See notes to financial statements.
61
Victory Portfolios | Financial Highlights | ||||||
For a Share Outstanding Throughout Each Period
Investment Activities | Distributions to Shareholders From | ||||||||||||||||||||||||||
| Net Asset Value, Beginning of Period | Net Investment Income (Loss) | Net Realized and Unrealized Gains (Losses) on Investments | Total from Investment Activities | Net Investment Income | Total Distributions | ||||||||||||||||||||||
Victory INCORE Fund for Income | |||||||||||||||||||||||||||
Class R6 | |||||||||||||||||||||||||||
Year Ended 10/31/19 | $ | 8.55 | 0.17 | (b) | 0.30 | 0.47 | (0.48 | ) | (0.48 | ) | |||||||||||||||||
Year Ended 10/31/18 | $ | 9.07 | 0.13 | (b)(d) | (0.18 | )(d) | (0.05 | ) | (0.47 | ) | (0.47 | ) | |||||||||||||||
Year Ended 10/31/17 | $ | 9.62 | 0.12 | (b) | (0.16 | ) | (0.04 | ) | (0.51 | ) | (0.51 | ) | |||||||||||||||
Year Ended 10/31/16 | $ | 9.95 | 0.13 | (b) | 0.06 | 0.19 | (0.52 | ) | (0.52 | ) | |||||||||||||||||
| March 4, 2015(e) through 10/31/15 | $ | 10.23 | 0.10 | (0.03 | ) | 0.07 | (0.35 | ) | (0.35 | ) | |||||||||||||||||
Class Y | |||||||||||||||||||||||||||
Year Ended 10/31/19 | $ | 8.56 | 0.13 | (b) | 0.35 | 0.48 | (0.48 | ) | (0.48 | ) | |||||||||||||||||
Year Ended 10/31/18 | $ | 9.08 | 0.19 | (b)(d) | (0.25 | )(d) | (0.06 | ) | (0.46 | ) | (0.46 | ) | |||||||||||||||
Year Ended 10/31/17 | $ | 9.64 | 0.10 | (b) | (0.15 | ) | (0.05 | ) | (0.51 | ) | (0.51 | ) | |||||||||||||||
Year Ended 10/31/16 | $ | 9.96 | 0.13 | (b) | 0.06 | 0.19 | (0.51 | ) | (0.51 | ) | |||||||||||||||||
Year Ended 10/31/15 | $ | 10.27 | 0.08 | 0.14 | 0.22 | (0.53 | ) | (0.53 | ) | ||||||||||||||||||
(a) Portfolio turnover is calculated on the basis of the Fund as a whole without distinguishing between the classes of shares issued.
(b) Per share net investment income (loss) has been calculated using the average daily shares method.
(c) During the period, certain fees were reduced and/or reimbursed. If such fee reductions and/or reimbursements had not occurred, the ratios would have been as indicated.
(d) Net Investment Income (Loss) per share, Net Realized and Unrealized Gains (Losses) on Investments and the Ratio of Net Investment Income (Loss) have been restated. See Item 11 in the Notes to Financial Statements.
(e) Commencement of operations.
(f) Annualized for periods less than one year.
(g) Not annualized for periods less than one year.
See notes to financial statements.
62
Victory Portfolios | Financial Highlights — continued | ||||||
For a Share Outstanding Throughout Each Period (continued)
Ratios to Average Net Assets | Supplemental Data | ||||||||||||||||||||||||||||||
| Net Asset Value, End of Period | Total Return (Excludes Sales Charge) | Net Expenses | Net Investment Income (Loss) | Gross Expenses | Net Assets, End of Period (000's) | Portfolio Turnover(a) | |||||||||||||||||||||||||
Victory INCORE Fund for Income | |||||||||||||||||||||||||||||||
Class R6 | |||||||||||||||||||||||||||||||
Year Ended 10/31/19 | $ | 8.54 | 5.68 | % | 0.63 | % | 2.00 | % | 0.66 | %(c) | $ | 15,864 | 29 | % | |||||||||||||||||
Year Ended 10/31/18 | $ | 8.55 | (0.52 | )% | 0.63 | % | 1.43 | %(d) | 0.69 | %(c) | $ | 13,741 | 27 | % | |||||||||||||||||
Year Ended 10/31/17 | $ | 9.07 | (0.36 | )% | 0.63 | % | 1.31 | % | 0.73 | %(c) | $ | 9,407 | 30 | % | |||||||||||||||||
Year Ended 10/31/16 | $ | 9.62 | 1.89 | % | 0.63 | % | 1.37 | % | 0.97 | %(c) | $ | 6,286 | 31 | % | |||||||||||||||||
| March 4, 2015(e) through 10/31/15 | $ | 9.95 | 0.70 | % | 0.63 | %(f) | 1.24 | %(f) | 0.99 | %(c)(f) | $ | 3,896 | 44 | %(g) | |||||||||||||||||
Class Y | |||||||||||||||||||||||||||||||
Year Ended 10/31/19 | $ | 8.56 | 5.72 | % | 0.71 | % | 1.48 | % | 0.79 | %(c) | $ | 54,950 | 29 | % | |||||||||||||||||
Year Ended 10/31/18 | $ | 8.56 | (0.61 | )% | 0.71 | % | 2.14 | %(d) | 0.79 | %(c) | $ | 31,975 | 27 | % | |||||||||||||||||
Year Ended 10/31/17 | $ | 9.08 | (0.53 | )% | 0.68 | % | 1.09 | % | 0.68 | % | $ | 62,408 | 30 | % | |||||||||||||||||
Year Ended 10/31/16 | $ | 9.64 | 1.92 | % | 0.71 | % | 1.30 | % | 0.89 | %(c) | $ | 8,119 | 31 | % | |||||||||||||||||
Year Ended 10/31/15 | $ | 9.96 | 2.12 | % | 0.71 | % | 1.32 | % | 0.90 | %(c) | $ | 5,093 | 44 | % | |||||||||||||||||
See notes to financial statements.
63
Victory Portfolios | Financial Highlights | ||||||
For a Share Outstanding Throughout Each Period
Investment Activities | Distributions to Shareholders From | ||||||||||||||||||||||||||
| Net Asset Value, Beginning of Period | Net Investment Income (Loss) | Net Realized and Unrealized Gains (Losses) on Investments | Total from Investment Activities | Net Investment Income | Net Realized Gains from Investments | ||||||||||||||||||||||
INCORE Investment Grade Convertible Fund | |||||||||||||||||||||||||||
Class A | |||||||||||||||||||||||||||
Year Ended 10/31/19 | $ | 16.22 | 0.21 | (b) | 1.84 | 2.05 | (0.28 | ) | (0.48 | ) | |||||||||||||||||
Year Ended 10/31/18 | $ | 16.53 | 0.30 | (b) | 0.01 | (c) | 0.31 | (0.53 | ) | (0.09 | ) | ||||||||||||||||
Year Ended 10/31/17 | $ | 13.72 | 0.17 | (b) | 2.89 | 3.06 | (0.25 | ) | — | ||||||||||||||||||
Year Ended 10/31/16 | $ | 14.00 | 0.11 | (b) | (0.07 | ) | 0.04 | (0.32 | ) | — | |||||||||||||||||
Year Ended 10/31/15 | $ | 14.10 | 0.14 | 0.03 | 0.17 | (0.27 | ) | — | |||||||||||||||||||
Class I | |||||||||||||||||||||||||||
Year Ended 10/31/19 | $ | 16.21 | 0.31 | (b) | 1.83 | 2.14 | (0.37 | ) | (0.48 | ) | |||||||||||||||||
Year Ended 10/31/18 | $ | 16.53 | 0.36 | (b) | (0.01 | )(c) | 0.35 | (0.58 | ) | (0.09 | ) | ||||||||||||||||
Year Ended 10/31/17 | $ | 13.71 | 0.22 | (b) | 2.90 | 3.12 | (0.30 | ) | — | ||||||||||||||||||
Year Ended 10/31/16 | $ | 13.98 | 0.17 | (b) | (0.07 | ) | 0.10 | (0.37 | ) | — | |||||||||||||||||
Year Ended 10/31/15 | $ | 14.09 | 0.18 | 0.03 | 0.21 | (0.32 | ) | — | |||||||||||||||||||
(a) Portfolio turnover is calculated on the basis of the Fund as a whole without distinguishing between the classes of shares issued.
(b) Per share net investment income (loss) has been calculated using the average daily shares method.
(c) The amount shown for a share outstanding throughout the period does not accord with the change in aggregate gains and losses in the portfolio of securities during the period because of timing of sales and purchases of fund shares in relation to fluctuating market values during the period.
(d) During the period, certain fees were reduced and/or reimbursed. If such fee reductions and/or reimbursements had not occurred, the ratios would have been as indicated.
See notes to financial statements.
64
Victory Portfolios | Financial Highlights — continued | ||||||
For a Share Outstanding Throughout Each Period
Ratios to Average Net Assets | Supplemental Data | ||||||||||||||||||||||||||||||||||
| Total Distributions | Net Asset Value, End of Period | Total Return (Excludes Sales Charge) | Net Expenses | Net Investment Income (Loss) | Gross Expenses | Net Assets, End of Period (000's) | Portfolio Turnover(a) | ||||||||||||||||||||||||||||
INCORE Investment Grade Convertible Fund | |||||||||||||||||||||||||||||||||||
Class A | |||||||||||||||||||||||||||||||||||
Year Ended 10/31/19 | (0.76 | ) | $ | 17.51 | 13.35 | % | 1.49 | % | 1.31 | % | 1.49 | % | $ | 16,349 | 35 | % | |||||||||||||||||||
Year Ended 10/31/18 | (0.62 | ) | $ | 16.22 | 1.87 | % | 1.27 | % | 1.79 | % | 1.27 | % | $ | 14,268 | 41 | % | |||||||||||||||||||
Year Ended 10/31/17 | (0.25 | ) | $ | 16.53 | 22.57 | % | 1.30 | % | 1.12 | % | 1.30 | % | $ | 33,040 | 39 | % | |||||||||||||||||||
Year Ended 10/31/16 | (0.32 | ) | $ | 13.72 | 0.29 | % | 1.48 | % | 0.80 | % | 1.48 | % | $ | 14,350 | 22 | % | |||||||||||||||||||
Year Ended 10/31/15 | (0.27 | ) | $ | 14.00 | 1.21 | % | 1.39 | % | 0.75 | % | 1.39 | % | $ | 10,396 | 32 | % | |||||||||||||||||||
Class I | |||||||||||||||||||||||||||||||||||
Year Ended 10/31/19 | (0.85 | ) | $ | 17.50 | 13.99 | % | 0.96 | % | 1.87 | % | 0.96 | % | $ | 263,981 | 35 | % | |||||||||||||||||||
Year Ended 10/31/18 | (0.67 | ) | $ | 16.21 | 2.16 | % | 0.94 | % | 2.17 | % | 0.94 | % | $ | 126,871 | 41 | % | |||||||||||||||||||
Year Ended 10/31/17 | (0.30 | ) | $ | 16.53 | 23.07 | % | 0.94 | % | 1.47 | % | 0.94 | % | $ | 78,879 | 39 | % | |||||||||||||||||||
Year Ended 10/31/16 | (0.37 | ) | $ | 13.71 | 0.77 | % | 0.99 | % | 1.26 | % | 0.99 | % | $ | 53,438 | 22 | % | |||||||||||||||||||
Year Ended 10/31/15 | (0.32 | ) | $ | 13.98 | 1.54 | % | 1.00 | % | 1.14 | % | 1.01 | %(d) | $ | 40,024 | 32 | % | |||||||||||||||||||
See notes to financial statements.
65
Victory Portfolios | Notes to Financial Statements October 31, 2019 | ||||||
1. Organization:
Victory Portfolios (the "Trust") was organized on December 6, 1995 as a Delaware statutory trust as a successor to a company named "The Victory Portfolios," which was organized as a Massachusetts business trust on February 5, 1986. The Trust is registered under the Investment Company Act of 1940, as amended (the "1940 Act"), as an open-end investment company. The Trust is comprised of 42 funds and is authorized to issue an unlimited number of shares, which are units of beneficial interest with a par value of $0.001 per share. Each Fund is classified as diversified under the 1940 Act.
The accompanying financial statements are those of the following six Funds (collectively, the "Funds" and individually, a "Fund").
Funds (Legal Name) | Funds (Short Name) | Investment Share Classes Offered | |||||||||
Victory Diversified Stock Fund | Diversified Stock Fund | Class A, C, I, R, R6, and Y | |||||||||
| Victory NewBridge Large Cap Growth Fund | NewBridge Large Cap Growth Fund | Class A, C, I and Y | |||||||||
Victory Special Value Fund | Special Value Fund | Class A, C, I, R and Y | |||||||||
Victory Strategic Allocation Fund | Strategic Allocation Fund | Class A, C, I and R | |||||||||
Victory INCORE Fund for Income | INCORE Fund for Income | Class A, C, I, R, R6 and Y | |||||||||
| Victory INCORE Investment Grade Convertible Fund | INCORE Investment Grade Convertible Fund | Class A and I | |||||||||
Each class of shares of a Fund has substantially identical rights and privileges except with respect to sales charges, fees paid under distribution plans, expenses allocable exclusively to each class of shares, voting rights on matters solely affecting a single class of shares, and the exchange privilege of each class of shares.
Under the Trust's organizational documents, its officers and trustees are indemnified against certain liabilities arising out of the performance of their duties to the Funds. In addition, in the normal course of business, the Funds enter into contracts with their vendors and others that provide for general indemnifications. The Funds' maximum exposure under these arrangements is unknown, as this would involve future claims that may be made against the Funds. However, based on experience, the Funds expect that risk of loss to be remote.
2. Significant Accounting Policies:
The following is a summary of significant accounting policies followed by the Trust in the preparation of its financial statements. The policies are in conformity with accounting principles generally accepted in the United States of America ("GAAP"). The preparation of financial statements in accordance with GAAP requires management to make estimates and assumptions that affect the reported amounts of assets and liabilities and disclosure of contingent assets and liabilities at the date of the financial statements and the reported amounts of income and expenses for the period. Actual results could differ from those estimates. The Funds follow the specialized accounting and reporting requirements under GAAP that are applicable to investment companies.
Investment Valuation:
The Funds record investments at fair value. Fair value is defined as the price that would be received to sell an asset or paid to transfer a liability in an orderly transaction between market participants at the measurement date.
The valuation techniques described below maximize the use of observable inputs and minimize the use of unobservable inputs in determining fair value. The inputs used for valuing the Funds' investments are summarized in the three broad levels listed below:
• Level 1 — quoted prices in active markets for identical securities
• Level 2 — other significant observable inputs (including quoted prices for similar securities or interest rates applicable to those securities, etc.)
66
Victory Portfolios | Notes to Financial Statements — continued October 31, 2019 | ||||||
• Level 3 — significant unobservable inputs (including the Funds' own assumptions in determining the fair value of investments)
Changes in valuation techniques may result in transfers in or out of an assigned level within the disclosure hierarchy. The inputs or methodologies used for valuation techniques are not necessarily an indication of the risk associated with entering into those investments.
Portfolio securities listed or traded on securities exchanges, including exchange-traded funds ("ETFs"), American Depositary Receipts ("ADRs") and Rights, are valued at the closing price on the exchange or system where the security is principally traded, if available, or at the Nasdaq Official Closing Price. If there have been no sales for that day on the exchange or system, then a security is valued at the last available bid quotation on the exchange or system where the security is principally traded. In each of these situations, valuations are typically categorized as Level 1 in the fair value hierarchy.
Investments in open-end investment companies are valued at net asset value. These valuations are typically categorized as Level 1 in the fair value hierarchy.
Debt securities of United States ("U.S.") issuers (other than short-term investments maturing in 60 days or less), including corporate and municipal securities, are valued on the basis of bid valuations provided by dealers or an independent pricing service approved by the Trust's Board of Trustees (the "Board"). Short-term investments maturing in 60 days or less may be valued at amortized cost, which approximates market value. Under the amortized cost method, premium or discount, if any, is amortized or accreted, respectively, on a constant basis to the maturity of the security. In each of these situations, valuations are typically categorized as Level 2 in the fair value hierarchy.
Investments for which there are no such quotations, or for which quotations do not appear reliable, are valued at fair value in accordance with procedures established by and under the general supervision and responsibility of the Board. These valuations are typically categorized as Level 2 or Level 3 in the fair value hierarchy, based on the observability of inputs used to determine the fair value.
A summary of the valuations as of October 31, 2019, based upon the three levels defined above, is included in the table below while the breakdown, by category, of investments is disclosed in the Schedules of Portfolio Investments (amounts in thousands):
| LEVEL 1 — Quoted Prices | LEVEL 2 — Other Significant Observable Inputs | Total | |||||||||||||
| Investments in Securities | Investments in Securities | Investments in Securities | |||||||||||||
Diversified Stock Fund | |||||||||||||||
Common Stocks | $ | 286,867 | $ | — | $ | 286,867 | |||||||||
Exchange-Traded Funds | 7,464 | — | 7,464 | ||||||||||||
Collateral for Securities Loaned | 6,058 | — | 6,058 | ||||||||||||
Total | 300,389 | — | 300,389 | ||||||||||||
NewBridge Large Cap Growth Fund | |||||||||||||||
Common Stocks | 15,061 | — | 15,061 | ||||||||||||
Exchange-Traded Funds | 560 | — | 560 | ||||||||||||
Collateral for Securities Loaned | 158 | — | 158 | ||||||||||||
Total | 15,779 | — | 15,779 | ||||||||||||
Special Value Fund | |||||||||||||||
Common Stocks | 52,405 | — | 52,405 | ||||||||||||
Exchange-Traded Funds | 994 | — | 994 | ||||||||||||
Collateral for Securities Loaned | 1,294 | — | 1,294 | ||||||||||||
Total | 54,693 | — | 54,693 | ||||||||||||
67
Victory Portfolios | Notes to Financial Statements — continued October 31, 2019 | ||||||
| LEVEL 1 — Quoted Prices | LEVEL 2 — Other Significant Observable Inputs | Total | |||||||||||||
| Investments in Securities | Investments in Securities | Investments in Securities | |||||||||||||
Strategic Allocation Fund | |||||||||||||||
Affiliated Exchange-Traded Funds | $ | 4,498 | $ | — | $ | 4,498 | |||||||||
Affiliated Mutual Funds | 20,989 | — | 20,989 | ||||||||||||
Total | 25,487 | — | 25,487 | ||||||||||||
INCORE Fund for Income | |||||||||||||||
Government National Mortgage Association | — | 603,206 | 603,206 | ||||||||||||
U.S. Treasury Obligations | — | 111,079 | 111,079 | ||||||||||||
Investment Companies | 100 | — | 100 | ||||||||||||
Total | 100 | 714,285 | 714,385 | ||||||||||||
INCORE Investment Grade Convertible Fund | |||||||||||||||
Convertible Corporate Bonds | — | 191,097 | 191,097 | ||||||||||||
Convertible Preferred Stocks | 63,099 | 10,971 | 74,070 | ||||||||||||
Collateral for Securities Loaned | 8,811 | — | 8,811 | ||||||||||||
Total | $ | 71,910 | $ | 202,068 | $ | 273,978 | |||||||||
For the year ended October 31, 2019, there were no Level 3 investments for which significant unobservable inputs were used to determine fair value.
Securities Purchased on a When-Issued Basis:
The Funds may purchase securities on a when-issued basis. When-issued securities are securities purchased for delivery beyond normal settlement periods at a stated price and/or yield, thereby involving the risk that the price and/or yield obtained may be more or less than those available in the market when delivery takes place. At the time a Fund makes the commitment to purchase a security on a when-issued basis, the Fund records the transaction and reflects the value of the security in determining net asset value. No interest accrues to the Fund until the transaction settles and payment takes place. Normally, the settlement date occurs within one month of the purchase. A segregated account is established and the Fund maintains cash and/or marketable securities at least equal in value to commitments for when-issued securities. If a Fund owns when-issued securities, these values are included in "Payable for investments purchased" on the accompanying Statements of Assets and Liabilities and the segregated assets are identified in the Schedules of Portfolio Investments.
Real Estate Investment Trusts ("REITS"):
The Funds may invest in REITS which report information on the source of their distributions annually. REITS are pooled investment vehicles that invest primarily in income producing real estate or real estate related loans or interests (such as mortgages). Certain distributions received from REITS during the year are recorded as realized gains or return of capital as estimated by the Funds or when such information becomes known.
Investment Companies:
Exchange-Traded Funds:
The Funds may invest in ETFs. ETFs are a type of index fund, the shares of which are bought and sold on a securities exchange. An ETF trades like common stock and represents a fixed portfolio of securities designed to track the performance and dividend yield of a particular domestic or foreign market index. A Fund may purchase shares of an ETF to temporarily gain exposure to a portion of the U.S. or a
68
Victory Portfolios | Notes to Financial Statements — continued October 31, 2019 | ||||||
foreign market while awaiting purchase of underlying securities. The risks of owning an ETF generally reflect the risks of owning the underlying securities they are designed to track, although the lack of liquidity of an ETF could result in it being more volatile. Additionally, ETFs have fees and expenses that reduce their value.
Open-End Funds:
The Funds may invest in portfolios of open-end investment companies. These investment companies value securities in their portfolios for which market quotations are readily available at their market values (generally the last reported sale price) and all other securities and assets at their fair value by the methods established by the board of directors of the underlying funds.
Investment Transactions and Related Income:
Changes in holdings of investments are accounted for no later than one business day following the trade date. For financial reporting purposes, however, investment transactions are accounted for on trade date on the last business day of the reporting period. Interest income is determined on the basis of coupon interest accrued using the effective interest method which adjusts, where applicable, the amortization of premiums or accretion of discounts. Dividend income is recorded on the ex-dividend date. Gains or losses realized on sales of securities are determined by comparing the identified cost of the security lot sold with the net sales proceeds. Pay-down gains or losses on applicable securities, if any, are recorded as components of interest income on the Statements of Operations.
Withholding taxes on interest, dividends and gains as a result of certain investments in ADRs by the Funds have been provided for in accordance with each investment's applicable country's tax rules and rates.
Securities Lending:
The Trust has entered into a Master Securities Lending Agreement ("MSLA") with Citibank, N.A. ("Citibank" or the "Agent"). Under the terms of the MSLA, the Funds may lend securities to certain broker-dealers and banks in exchange for collateral in the amount of at least 102% of the value of U.S. securities loaned or at least 105% of the value of non-U.S. securities loaned, marked-to-market daily. Any collateral shortfalls associated with increases in the valuation of the securities loaned are adjusted the next business day. The collateral can be received in the form of cash collateral and/or non-cash collateral. Non-cash collateral can include U.S. Government Securities, letters of credit and certificates of deposit. The cash collateral is invested in short-term instruments or cash equivalents, primarily open-end investment companies, as noted in the Funds' Schedules of Portfolio Investments. The Trust does not have effective control of the non-cash collateral and therefore it is not disclosed in the Funds' Schedules of Portfolio Investments. During the time portfolio securities are on loan, the borrower will pay the Funds any dividends or interest paid on such securities plus any fee negotiated between the parties to the lending agreement. The Funds also earn a return from the collateral. The Funds pay the Agent various fees in connection with the investment of cash collateral and fees based on the investment income received from securities lending activities. Securities lending income (net of these fees) is disclosed on the Statements of Operations. Although risk is mitigated by the collateral, the Funds could experience a delay in recovering their securities and possible loss of income or value if the borrower fails to return them.
Securities lending transactions are entered into by a Fund under the MSLA, which permits the Fund, under certain circumstances such as an event of default, to offset amounts payable by the Fund to the same counterparty against amounts receivable from the counterparty to create a net payment due to or from the Fund.
The following table (amounts in thousands) is a summary of the Funds' securities lending transactions which are subject to offset under the MSLA as of October 31, 2019. These transactions are accounted
69
Victory Portfolios | Notes to Financial Statements — continued October 31, 2019 | ||||||
for as secured borrowings with an overnight and continuous contractual maturity for cash collateral, and greater than overnight and continuous contractual maturity for non-cash collateral.
| Gross Amount of Recognized Assets (Value of | Value of Cash | Value of Non-cash Collateral Received by Maturity | |||||||||||||||||||||||||
| Securities on Loan) | Collateral Received* | <30 Days | Between 30 & 90 Days | >90 Days | Net Amount | ||||||||||||||||||||||
Diversified Stock Fund | $ | 5,871 | $ | 5,871 | $ | — | $ | — | $ | — | $ | — | |||||||||||||||
| NewBridge Large Cap Growth Fund | 151 | 151 | — | — | — | — | |||||||||||||||||||||
Special Value Fund | 1,224 | 1,224 | — | — | — | — | |||||||||||||||||||||
| INCORE Investment Grade Convertible Fund | 8,595 | 8,595 | — | — | — | — | |||||||||||||||||||||
* Collateral received in excess of the market value of securities on loan is not presented in this table. The total cash collateral received by each Fund is disclosed in the Statements of Assets and Liabilities.
Distributions to Shareholders:
Dividends from net investment income, if any, are declared and paid monthly for the INCORE Fund for Income Fund. Dividends from net investment income, if any, are declared and paid quarterly for the Diversified Stock Fund, Strategic Allocation Fund, and INCORE Investment Grade Convertible Fund. Dividends from net investment income, if any, are declared and paid annually for the NewBridge Large Cap Growth Fund and Special Value Fund. Distributable net realized gains, if any, are declared and distributed at least annually from each Fund.
The amounts of dividends from net investment income and distributions from net realized gains are determined in accordance with federal income tax regulations, which may differ from GAAP. To the extent these "book/tax" differences are permanent in nature (e.g., net operating loss and distribution reclassification), such amounts are reclassified within the components of net assets based on their federal tax-basis treatment; temporary differences (e.g., wash sales) do not require reclassification. To the extent dividends and distributions exceed net investment income and net realized gains for tax purposes, they are reported as distributions of capital. Net investment losses incurred by a Fund may be reclassified as an offset to capital on the accompanying Statements of Assets and Liabilities.
As of October 31, 2019, on the Statements of Assets and Liabilities, as a result of permanent book-to-tax difference, reclassification adjustments were as follows:
| Total Distributable Earnings/(Loss) | Capital | ||||||||||
NewBridge Large Cap Growth Fund | $ | (671 | ) | $ | 671 | ||||||
INCORE Fund for Income | 10,878 | (10,878 | ) | ||||||||
Federal Income Taxes:
It is the policy of each Fund to continue to qualify as a regulated investment company by complying with the provisions available to certain investment companies, as defined in applicable sections of the Internal Revenue Code, and to make distributions of net investment income and net realized gains sufficient to relieve it from all, or substantially all, federal income taxes. Accordingly, no provision for federal income taxes is required in the financial statements. The Funds have a tax year end of October 31.
70
Victory Portfolios | Notes to Financial Statements — continued October 31, 2019 | ||||||
Management of the Funds has reviewed tax positions taken in tax years that remain subject to examination by all major tax jurisdictions, including federal (i.e., the last four tax year ends and the interim tax period since then). Management believes that there is no tax liability resulting from unrecognized tax benefits related to uncertain tax positions taken.
Allocations:
Expenses directly attributable to a Fund are charged to the Fund, while expenses which are attributable to more than one fund in the Trust, or jointly with an affiliated trust, are allocated among the respective funds in the Trust and/or affiliated trust based upon net assets or another appropriate basis.
Income, expenses (other than class-specific expenses such as transfer agent fees, state registration fees, printing and 12b-1 fees), and realized and unrealized gains or losses on investments are allocated to each class of shares based on its relative net assets on the date income is earned or expenses and realized and unrealized gains and losses are incurred.
Cross-Trade Securities Transactions:
Pursuant to Rule 17a-7 under the 1940 Act, the Funds may engage in cross-trades which are securities transactions with affiliated investment companies and advisory accounts managed by the Adviser and any applicable sub-adviser. Any such purchase or sale transaction must be effected without brokerage commission or other remuneration, except for customary transfer fees. The transaction must be effected at the current market price, which is either the security's last sale price on an exchange or, if there are no transactions in the security that day, at the average of the highest bid and lowest asked price. For the year ended October 31, 2019, the Funds did not engage in any Rule 17a-7 transactions under the 1940 Act.
3. Purchases and Sales of Securities:
Purchases and sales of securities (excluding securities maturing less than one year from acquisition) for the fiscal year ended October 31, 2019 were as follows (amounts in thousands):
| Purchases (excluding U.S. Government Securities) | Sales (excluding U.S. Government Securities) | Purchases of U.S. Government Securities | Sales of U.S. Government Securities | ||||||||||||||||
Diversified Stock Fund | $ | 419,046 | $ | 534,358 | $ | — | $ | — | |||||||||||
NewBridge Large Cap Growth Fund | 11,401 | 19,695 | — | — | |||||||||||||||
Special Value Fund | 73,053 | 90,354 | — | — | |||||||||||||||
Strategic Allocation Fund | 1,501 | 9,992 | — | — | |||||||||||||||
INCORE Fund for Income | — | — | 255,512 | 181,414 | |||||||||||||||
| INCORE Investment Grade Convertible Fund | 165,447 | 65,807 | — | — | |||||||||||||||
4. Fees and Transactions with Affiliates and Related Parties:
Investment advisory services are provided to the Funds by Victory Capital Management Inc. ("VCM" or the "Adviser"), a New York corporation registered as an investment adviser with the Securities and Exchange Commission ("SEC"). The Adviser is a wholly-owned indirect subsidiary of Victory Capital Holdings, Inc., a publicly traded Delaware Corporation and a wholly-owned direct subsidiary of Victory Capital Operating, LLC.
Under the terms of the Investment Advisory Agreements, the Adviser is entitled to receive fees based on a percentage of the average daily net assets of each Fund. The rates at which the Adviser is paid by
71
Victory Portfolios | Notes to Financial Statements — continued October 31, 2019 | ||||||
each Fund are included in the table below. The Adviser may use its resources to assist with the Funds' distribution and marketing expenses.
Flat Rate | |||||||
Strategic Allocation Fund | 0.10 | % | |||||
| Adviser Fee Tier Rate | |||||||
Diversified Stock Fund | |||||||
Up to $800 million | 0.65 | % | |||||
$800 million — $2.4 billion | 0.60 | % | |||||
Over $2.4 billion | 0.55 | % | |||||
NewBridge Large Cap Growth Fund | |||||||
Up to $400 million | 0.75 | % | |||||
$400 million — $800 million | 0.65 | % | |||||
Over $800 million | 0.60 | % | |||||
Special Value Fund | |||||||
Up to $400 million | 0.75 | % | |||||
$400 million — $800 million | 0.65 | % | |||||
Over $800 million | 0.60 | % | |||||
INCORE Fund for Income | |||||||
Up to $400 million | 0.50 | % | |||||
$400 million — $800 million | 0.45 | % | |||||
Over $800 million | 0.40 | % | |||||
INCORE Investment Grade Convertible Fund | |||||||
Up to $400 million | 0.75 | % | |||||
$400 million — $800 million | 0.65 | % | |||||
Over $800 million | 0.60 | % | |||||
VCM also serves as the Funds' administrator and fund accountant. Under an Administration and Fund Accounting Agreement, VCM is paid for its services an annual fee at a rate of 0.08% of the first $15 billion in average daily net assets of the Trust, Victory Variable Insurance Funds and Victory Portfolios II (collectively, the "Victory Funds Complex"), 0.05% of the average daily net assets above $15 billion to $30 billion of the Victory Funds Complex and 0.04% of the average daily net assets over $30 billion of the Victory Funds Complex.
Citi Fund Services Ohio, Inc. ("Citi"), an affiliate of Citibank N.A., acts as sub-administrator and sub-fund accountant to the Funds pursuant to a Sub-Administration and Sub-Fund Accounting Services Agreement between VCM and Citi. VCM pays Citi a fee for providing these services. The Trusts reimburses VCM and Citi for all of their reasonable out-of-pocket expenses incurred in providing these services.
FIS Investor Services, LLC ("FIS") serves as the Funds' transfer agent. Under the Transfer Agent Agreement, the Trusts pays FIS a fee for its services and reimburses FIS for all of their reasonable out-of-pocket expenses incurred in providing these services.
The Chief Compliance Officer ("CCO") is an employee of the Adviser, which pays the compensation of the CCO and his support staff. The Trust has entered into an Agreement to provide compliance services with the Adviser, pursuant to which the Adviser furnishes its compliance personnel, including the services of the CCO, and other resources reasonably necessary to provide the Trust with compliance oversight services related to the design, administration and oversight of a compliance program for the Trust in accordance with Rule 38a-1 under the 1940 Act. The Victory Funds Complex compensates the Adviser for these services.
The Victory Funds Complex pays an annual retainer to each Independent Trustee, plus an additional annual retainer to the Chairman of the Board. The aggregate amount of the fees and expenses of the
72
Victory Portfolios | Notes to Financial Statements — continued October 31, 2019 | ||||||
Independent Trustees are allocated amongst all the funds in the Victory Funds Complex and are presented in the Statements of Operations.
Shearman & Sterling LLP provides legal services to the Trust.
Victory Capital Advisers, Inc. (the "Distributor"), an affiliate of the Adviser, serves as distributor for the continuous offering of the shares of the Funds pursuant to a Distribution Agreement between the Distributor and the Trust. Pursuant to the Distribution and Service Plans adopted in accordance with Rule 12b-1 under the 1940 Act, the Distributor may receive a monthly distribution and service fee, at an annual rate of up to 0.25% of the average daily net assets of Class A Shares, at an annual rate of up to 0.50% of the average daily net assets of Class R Shares of the Funds, except for INCORE Fund for Income, and 1.00% of the average daily net assets of Class C Shares of the Funds. The Distributor may receive a monthly distribution and service fee at an annual rate of up to 0.25% of the average daily net assets of Class R Shares of INCORE Fund for Income. The distribution and service fees paid to the Distributor may be used by the Distributor to pay for activities primarily intended to result in the sale of Class A, Class R or Class C Shares of the Funds.
In addition, the Distributor is entitled to receive commissions on sales of the Class A Shares of the Funds. For the fiscal year ended October 31, 2019, the Distributor received approximately $36 thousand from commissions earned on sales of Class A Shares of the Funds.
The Adviser has entered into expense limitation agreements with certain Funds. Under the terms of the agreements, the Adviser has agreed to waive fees or reimburse certain expenses to the extent that ordinary operating expenses incurred by certain classes of a Fund in any fiscal year exceed the expense limit for such classes of the Fund. Such excess amounts will be the liability of the Adviser. Interest, taxes, brokerage commissions, other expenditures which are capitalized in accordance with GAAP, and other extraordinary expenses not incurred in the ordinary course of a Fund's business are excluded from the expense limits. As of October 31, 2019, the expense limits (excluding voluntary waivers) are as follows:
In effect November 1, 2018 until February 29, 2020 | |||||||||||||||||||||||||||
| Class A Shares | Class C Shares | Class I Shares | Class R Shares | Class R6 Shares | Class Y Shares | ||||||||||||||||||||||
Diversified Stock Fund | N/A | N/A | N/A | N/A | 0.78 | % | 0.86 | % | |||||||||||||||||||
| NewBridge Large Cap Growth Fund | 1.36 | % | 2.10 | % | 0.95 | % | N/A | N/A | 1.02 | % | |||||||||||||||||
In effect November 1, 2018 until February 29, 2020 | |||||||||||||||||||||||||||
| Class A Shares | Class C Shares | Class I Shares | Class R Shares | Class R6 Shares | Class Y Shares | ||||||||||||||||||||||
Special Value Fund | N/A | 2.20 | % | 1.15 | % | N/A | N/A | 1.10 | % | ||||||||||||||||||
Strategic Allocation Fund | 0.40 | % | 1.15 | % | 0.15 | % | 0.65 | % | N/A | N/A | |||||||||||||||||
INCORE Fund for Income | 0.91 | %(a) | 1.71 | %(a) | 0.64 | %(a) | 0.91 | %(a) | 0.63 | % | 0.71 | % | |||||||||||||||
| INCORE Investment Grade Convertible Fund | N/A | N/A | N/A | N/A | N/A | N/A | |||||||||||||||||||||
(a) In effect from March 1, 2019 until at least February 29, 2020
Was in effect from November 1, 2018 until February 28, 2019 | |||||||||||||||||||||||||||
| Class A Shares | Class C Shares | Class I Shares | Class R Shares | Class R6 Shares | Class Y Shares | ||||||||||||||||||||||
INCORE Fund for Income | N/A | N/A | N/A | N/A | 0.63 | % | 0.71 | % | |||||||||||||||||||
The Funds (except Strategic Allocation Fund) have agreed to repay fees and expenses that were waived or reimbursed by the Adviser for a period up to three fiscal years after such waiver or reimbursement was made to the extent such payments or repayments would not cause the expenses of a class to exceed the original expense limitation in place at time of the waiver or reimbursement or any expense limitation agreement in place at the time of repayment. As of November 11, 2010, the Strategic Allocation Fund is no longer subject to repaying waived or reimbursed fees to the Adviser. Amounts repaid to the
73
Victory Portfolios | Notes to Financial Statements — continued October 31, 2019 | ||||||
Adviser during the year ended, if any, are reflected on the Statements of Operations as "Recoupment of prior expenses waived/reimbursed by Adviser."
As of October 31, 2019, the following amounts are available to be repaid to the Adviser (amounts in thousands).
| Expires 10/31/20 | Expires 10/31/21 | Expires 10/31/22 | Total | ||||||||||||||||
Diversified Stock Fund | $ | 20 | $ | 27 | $ | 30 | $ | 77 | |||||||||||
NewBridge Large Cap Growth Fund | 43 | 64 | 76 | 183 | |||||||||||||||
Special Value Fund | 12 | 21 | 33 | 66 | |||||||||||||||
INCORE Fund for Income | 8 | 42 | 86 | 136 | |||||||||||||||
The Adviser may voluntarily waive or reimburse additional fees to assist the Funds in maintaining competitive expense ratios. Voluntary waivers and reimbursements applicable to the Funds are not available to be recouped at a future time. The Adviser voluntarily waived $58 thousand and $27 thousand for the year ended October 31, 2019 for the Special Value Fund and Strategic Allocation Fund, respectively.
Certain officers and/or interested trustees of the Funds are also officers and/or employees of the Adviser, Administrator, Fund Accountant, Sub-Administrator, Sub-Fund Accountant, and Legal Counsel.
5. Risks:
Each Fund may be subject to other risks in addition to these identified risks.
An investment in the Funds' shares represents an indirect investment in the securities owned by the Funds, some of which will be traded on a national securities exchange or in the over-the-counter markets. The value of the securities in which the Funds invest, like other market investments, may move up or down, sometimes rapidly and unpredictably. The value of the securities in which the Funds invest may affect the value of the Funds' shares. An investment in the Funds' shares at any point in time may be worth less than the original investment, even after taking into account the reinvestment of the Funds' distributions.
The Funds will be subject to credit risk with respect to the amount each expects to receive from counterparties for financial instruments entered into by the Funds. The Funds may be negatively impacted if a counterparty becomes bankrupt or otherwise fails to perform its obligations due to financial difficulties. The Funds may experience significant delays in obtaining any recovery in bankruptcy or other reorganization proceeding and the Funds may obtain only limited recovery or may obtain no recovery in such circumstances. The Funds typically enter into transactions with counterparties whose credit ratings are investment grade, as determined by a nationally recognized statistical rating organization or, if unrated, judged by the Adviser to be of comparable quality.
The INCORE Fund for Income Fund and the INCORE Investment Grade Convertible Bond Fund are subject to credit and interest rate risk with respect to fixed income securities. Credit risk refers to the ability of an issuer to make timely payments of interest and principal. Interest rates may rise or the rate of inflation may increase, impacting the value of investments in fixed income securities. A debt issuers' credit quality may be downgraded or an issuer may default. Interest rates may fluctuate due to changes in governmental fiscal policy initiatives and resulting market reaction to those initiatives.
6. Borrowing and Interfund Lending:
Line of Credit:
Effective July 1, 2019, the Victory Funds Complex participates in a short-term, demand note "Line of Credit" agreement with Citibank. Under the agreement with Citibank, the Victory Funds Complex may borrow up to $600 million, of which $300 million is committed and $300 million is uncommitted. $40 million of the Line of Credit is reserved for use by the Victory Floating Rate Fund, another series of the
74
Victory Portfolios | Notes to Financial Statements — continued October 31, 2019 | ||||||
Victory Funds Complex, with that Fund paying the related commitment fees for that amount. The purpose of the agreement is to meet temporary or emergency cash needs, including redemption requests that might otherwise require the untimely disposition of securities. The current agreement was amended on June 28, 2019 with a new termination date of June 29, 2020. Citibank receives an annual commitment fee of 0.15% on $300 million for providing the Line of Credit. Each fund in the Victory Funds Complex pays a pro-rata portion of the commitment fees plus any interest (one month LIBOR plus one percent) on amounts borrowed. Interest charged to each Fund during the period is presented on the Statements of Operations under Line of credit fees. Prior to July 1, 2019. The Victory Funds Complex excluded the USAA Mutual Funds Trust and could borrow up to $250 million, of which $100 million was committed and $150 million was uncommitted. $40 million of the Line of Credit was reserved for use by the Victory Floating Rate Fund, with that Fund paying the related commitment fees for that amount. Citibank received an annual commitment fee of 0.15% on $100 million for providing the Line of Credit.
The Funds did not utilize the Line of Credit during the year ended October 31, 2019.
Interfund Lending:
The Trust and Adviser rely on an exemptive order granted by the SEC in March 2017 (the "Order"), permitting the establishment and operation of an Interfund Lending Facility (the "Facility"). The Facility allows each Fund to directly lend and borrow money to or from any other Victory Fund relying upon the Order at rates beneficial to both the borrowing and lending funds. Advances under the Facility are allowed for temporary or emergency purposes, including the meeting of redemption requests that otherwise might require the untimely disposition of securities, and are subject to each Fund's borrowing restrictions. The interfund loan rate is determined, as specified in the Order, by averaging the current repurchase agreement rate and the current bank loan rate. As a Borrower, interest charged to each Fund during the period is presented on the Statement of Operations under Interfund lending fees. As a Lender, interest earned by each Fund during the period is presented on the Statement of Operations under Interfund lending.
The average borrowing and lending for the days outstanding and average interest rate for each Fund during the year ended October 31, 2019 were as follows (amounts in thousands):
| Borrower or Lender | Amount Outstanding at October 31, 2019 | Average Borrowing* | Days Borrowing Outstanding | Average Interest Rate* | Maximum Borrowing During the Period | ||||||||||||||||||||||
| NewBridge Large Cap Growth Fund | Borrower | $ | — | $ | 1,890 | 2 | 2.99 | % | $ | 1,895 | |||||||||||||||||
Special Value Fund | Borrower | — | 855 | 2 | 3.16 | % | 1,044 | ||||||||||||||||||||
| Borrower or Lender | Amount Outstanding at October 31, 2019 | Average Borrowing* | Days Borrowing Outstanding | Average Interest Rate* | Maximum Borrowing During the Period | ||||||||||||||||||||||
| Strategic Allocation Fund | Borrower | $ | — | $ | 484 | 27 | 2.94 | % | $ | 1,585 | |||||||||||||||||
| INCORE Fund for Income | Borrower | — | 21,200 | 1 | 2.38 | % | 21,200 | ||||||||||||||||||||
* For the year ended October 31, 2019, based on the number of days borrowings were outstanding.
75
Victory Portfolios | Notes to Financial Statements — continued October 31, 2019 | ||||||
7. Federal Income Tax Information:
The tax character of distributions paid during the tax years ended, as noted below, were as follows (total distributions paid may differ from the Statements of Changes in Net Assets because, for tax purposes, dividends are recognized when actually paid) (amounts in thousands):
Year Ended October 31, 2019 | |||||||||||||||||||
Distributions paid from | |||||||||||||||||||
| Net Ordinary Income | Total Long-Term Capital Gains | Total Taxable Distributions | Distributions Paid | ||||||||||||||||
Diversified Stock Fund | $ | 26,283 | $ | 14,832 | $ | 41,115 | $ | 41,115 | |||||||||||
NewBridge Large Cap Growth Fund | 29 | 7,115 | 7,144 | 7,144 | |||||||||||||||
Special Value Fund | 3,982 | 2,621 | 6,603 | 6,603 | |||||||||||||||
Strategic Allocation Fund | 709 | 254 | 963 | 963 | |||||||||||||||
INCORE Fund for Income | 36,122 | — | 36,122 | 36,122 | |||||||||||||||
INCORE Investment Grade Convertible Fund | 3,943 | 4,048 | 7,991 | 7,991 | |||||||||||||||
Year Ended October 31, 2018 | |||||||||||||||||||
Distributions paid from | |||||||||||||||||||
| Net Ordinary Income | Total Long-Term Capital Gains | Total Taxable Distributions | Distributions Paid | ||||||||||||||||
Diversified Stock Fund | $ | 33,530 | $ | 63,180 | $ | 96,710 | $ | 96,710 | |||||||||||
NewBridge Large Cap Growth Fund | — | 8,952 | 8,952 | 8,952 | |||||||||||||||
Special Value Fund | 258 | — | 258 | 258 | |||||||||||||||
Strategic Allocation Fund | 893 | 448 | 1,341 | 1,341 | |||||||||||||||
INCORE Fund for Income | 37,153 | — | 37,153 | 37,153 | |||||||||||||||
INCORE Investment Grade Convertible Fund | 4,734 | 661 | 5,395 | 5,395 | |||||||||||||||
As of October 31, 2019, the components of accumulated earnings (deficit) on a tax basis were as follows (amounts in thousands):
| Undistributed Ordinary Income | Undistributed Long-Term Capital Gains | Accumulated Earnings | Accumulated Capital and Other Losses | Qualified Late-Year Losses* | Unrealized Appreciation (Depreciation)** | Total Accumulated Earnings (Deficit) | |||||||||||||||||||||||||
Diversified Stock Fund | $ | 8 | $ | 18,724 | $ | 18,732 | $ | — | $ | — | $ | 52,093 | $ | 70,825 | |||||||||||||||||
| NewBridge Large Cap Growth Fund | — | 3,123 | 3,123 | — | (130 | ) | 6,211 | 9,204 | |||||||||||||||||||||||
Special Value Fund | 134 | 1,611 | 1,745 | — | — | 8,427 | 10,172 | ||||||||||||||||||||||||
Strategic Allocation Fund | 116 | 504 | 620 | — | — | 308 | 928 | ||||||||||||||||||||||||
| INCORE Fund for Income | 1,582 | — | 1,582 | (289,313 | ) | — | (15,975 | ) | (303,706 | ) | |||||||||||||||||||||
| INCORE Investment Grade Convertible Fund | 3,835 | 7,674 | 11,509 | — | — | 20,356 | 31,865 | ||||||||||||||||||||||||
* Qualified late-year losses are comprised of post-October capital losses incurred after October 31 and certain late-year ordinary losses. Late-year ordinary losses represent ordinary losses incurred after December 31 and specified losses incurred after October 31. These losses are deemed to arise on the first day of the Fund's next taxable year.
** The difference between the book-basis and tax-basis unrealized appreciation (depreciation) is attributable primarily to tax deferral of losses on wash sales.
76
Victory Portfolios | Notes to Financial Statements — continued October 31, 2019 | ||||||
As of the tax year ended October 31, 2019, the following funds had net capital loss carryforwards (no expiration) as summarized in the table below (amounts in thousands):
| Short-Term Amount | Long-Term Amount | Total | |||||||||||||
INCORE Fund for Income | $ | 102,634 | $ | 186,679 | $ | 289,313 | |||||||||
As of October 31, 2019, the cost basis for federal income tax purposes, gross unrealized appreciation, gross unrealized depreciation, and net unrealized appreciation (depreciation) for investments were as follows (amounts in thousands):
| Cost of Investments for Federal Tax Purposes | Net Gross Unrealized Appreciation | Gross Unrealized Depreciation | Unrealized Appreciation (Depreciation) | ||||||||||||||||
Diversified Stock Fund | $ | 248,296 | $ | 56,577 | $ | (4,484 | ) | $ | 52,093 | ||||||||||
NewBridge Large Cap Growth Fund | 9,568 | 6,285 | (74 | ) | 6,211 | ||||||||||||||
Special Value Fund | 46,266 | 9,319 | (892 | ) | 8,427 | ||||||||||||||
Strategic Allocation Fund | 25,179 | 1,804 | (1,496 | ) | 308 | ||||||||||||||
INCORE Fund for Income | 730,360 | 6,118 | (22,093 | ) | (15,975 | ) | |||||||||||||
| INCORE Investment Grade Convertible Fund | 253,622 | 26,056 | (5,700 | ) | 20,356 | ||||||||||||||
8. Affiliated Securities:
An affiliated security is a security in which the Fund has ownership of at least 5% of the security's outstanding voting shares or an investment company managed by VCM. Transactions in affiliated securities during the year ended October 31, 2019 were as follows (amounts in thousands):
| Fair Value 10/31/2018 | Purchases at Cost | Proceeds from Sales | Realized Gain (Loss) | Capital Gain Distribution | Net Change in Unrealized Appreciation/ Depreciation | Fair Value 10/31/2019 | Dividend Income | ||||||||||||||||||||||||||||
Strategic Allocation Fund | |||||||||||||||||||||||||||||||||||
| Victory INCORE Total Return Bond Fund, Class R6 | $ | 4,230 | $ | 99 | $ | (1,400 | ) | $ | (103 | ) | $ | — | $ | 325 | $ | 3,151 | $ | 100 | |||||||||||||||||
| Victory Integrity Discovery Fund, Class Y | 1,118 | 124 | (283 | ) | (57 | ) | 109 | (82 | ) | 929 | 15 | ||||||||||||||||||||||||
| Victory Market Neutral Income Fund, Class I | 7,695 | 178 | (2,361 | ) | (29 | ) | — | (46 | ) | 5,437 | 177 | ||||||||||||||||||||||||
| Victory RS Global Fund, Class Y | 9,643 | 407 | (3,572 | ) | 61 | 214 | 690 | 7,443 | 192 | ||||||||||||||||||||||||||
| Victory Sophus Emerging Markets Small Cap Fund, Class Y | 2,156 | 504 | (763 | ) | (281 | ) | 299 | 146 | 2,061 | 207 | |||||||||||||||||||||||||
| Victory Trivalent Emerging Markets Small-Cap Fund, Class Y | 2,255 | 189 | (634 | ) | (150 | ) | 153 | 155 | 1,968 | 36 | |||||||||||||||||||||||||
77
Victory Portfolios | Notes to Financial Statements — continued October 31, 2019 | ||||||
| Fair Value 10/31/2018 | Purchases at Cost | Proceeds from Sales | Realized Gain (Loss) | Capital Gain Distribution | Net Change in Unrealized Appreciation/ Depreciation | Fair Value 10/31/2019 | Dividend Income | ||||||||||||||||||||||||||||
| VictoryShares International Volatility Wtd ETF | $ | 2,279 | $ | — | $ | (597 | ) | $ | (56 | ) | $ | — | $ | 181 | $ | 1,807 | $ | 54 | |||||||||||||||||
| VictoryShares US Multi-Factor Minimum Volatility ETF | 2,501 | — | (870 | ) | 88 | — | 83 | 1,802 | 46 | ||||||||||||||||||||||||||
| VictoryShares US Small Cap Volatility Wtd ETF | 1,137 | — | (287 | ) | 5 | — | 34 | 889 | 14 | ||||||||||||||||||||||||||
Total | $ | 33,014 | $ | 1,501 | $ | (10,767 | ) | $ | (522 | ) | $ | 775 | $ | 1,486 | $ | 25,487 | $ | 841 | |||||||||||||||||
9. Fund Ownership:
Ownership of more than 25% of the voting securities of a fund creates presumptions of control of the fund, under section 2(a)(9) of the 1940 Act. As of October 31, 2019, the shareholders listed below held more than 25% of the shares outstanding of the Funds and may be deemed to control those Funds.
Shareholder | Percent | ||||||||||
NewBridge Large Cap Growth Fund | Raymond James & Associates, Inc. | 25.9 | % | ||||||||
Special Value Fund | Talcott Resolution Life Insurance Co. | 34.7 | % | ||||||||
INCORE Investment Grade Convertible Fund | Morgan Stanley Smith Barney LLC | 33.2 | % | ||||||||
10. Recent Accounting Pronouncements:
In March 2017, the Financial Accounting Standards Board ("FASB") issued Accounting Standards Update ("ASU") No. 2017-08 "Premium Amortization on Purchased Callable Debt Securities" ("ASU 2017-08"), which shortens the premium amortization period for purchased non-contingently callable debt securities. ASU 2017-08 specifies that the premium amortization period ends at the earliest call date, for purchased non-contingently callable debt securities. ASU 2017-08 is effective for fiscal years, and interim periods within those fiscal years, beginning after December 15, 2018. Management does not believe that adoption of ASU 2017-08 will materially impact the Funds' financial statements.
11. Reclassification Adjustment:
INCORE Fund for Income has restated certain elements of its 2018 financial statements resulting from the identification of a GAAP reclassification error for the Fund's pay-down gain (loss) transactions. The Fund accounts for pay-down gain (loss) on a tax basis, requiring a GAAP reclassification to its periodic financial statements. This GAAP reclassification was not applied to the Fund's 2018 annual financial statements, which resulted in net investment income being overstated by approximately $18.237 million with an equal and offsetting adjustment to net realized gain (loss) on investment transactions in the Statement of Operations and the Statement of Changes in Net Assets. Certain amounts in the Financial Highlights were misstated; net investment income (loss) per share, net realized and unrealized gains (losses) per share and ratio of net investment income (loss) to average net assets. However, this reclassification had no impact on the Fund's net assets, NAV, performance, or taxable distributions paid and reported to shareholders for the fiscal and tax years ended 2018. The 2018 GAAP
78
Victory Portfolios | Notes to Financial Statements — continued October 31, 2019 | ||||||
reclassification has been applied to the 2018 financial statements as they appear in this current 2019 shareholder report and are summarized below.
Statement of Operations/Statement of Changes in Net Assets (amounts in thousands):
| INCORE Fund for Income | As Reported in 2018 | Reclass Entry | Adjusted 2018 | ||||||||||||
Net investment income (loss) | $ | 30,284 | $ | (18,237 | ) | $ | 12,047 | ||||||||
| Net realized gains (losses) from unaffiliated investment transactions | (21,771 | ) | 18,237 | (3,534 | ) | ||||||||||
Subtotal | $ | 8,513 | $ | — | $ | 8,513 | |||||||||
Financial Highlights: | |||||||||||||||
| INCORE Fund for Income | As Reported in 2018 | Reclass Entry | Adjusted 2018 | ||||||||||||
Class A: | |||||||||||||||
Net investment income (loss) per share | $ | 0.37 | $ | (0.22 | ) | $ | 0.15 | ||||||||
| Net realized and unrealized gains (losses) on investments per share | (0.45 | ) | 0.22 | (0.23 | ) | ||||||||||
Subtotal | $ | (0.08 | ) | $ | — | $ | (0.08 | ) | |||||||
| Ratio of net investment income (loss) to average net assets | 4.22 | % | (2.58 | )% | 1.64 | % | |||||||||
Class C: | |||||||||||||||
Net investment income (loss) per share | $ | 0.29 | $ | (0.21 | ) | $ | 0.08 | ||||||||
| Net realized and unrealized gains (losses) on investments per share | (0.44 | ) | 0.21 | (0.23 | ) | ||||||||||
Subtotal | $ | (0.15 | ) | $ | — | $ | (0.15 | ) | |||||||
| Ratio of net investment income (loss) to average net assets | 3.33 | % | (2.39 | )% | 0.94 | % | |||||||||
Class I: | |||||||||||||||
Net investment income (loss) per share | $ | 0.37 | $ | (0.22 | ) | $ | 0.15 | ||||||||
| Net realized and unrealized gains (losses) on investments per share | (0.43 | ) | 0.22 | (0.21 | ) | ||||||||||
Subtotal | $ | (0.06 | ) | $ | — | $ | (0.06 | ) | |||||||
| Ratio of net investment income (loss) to average net assets | 4.21 | % | (2.52 | )% | 1.69 | % | |||||||||
Class R: | |||||||||||||||
Net investment income (loss) per share | $ | 0.38 | $ | (0.23 | ) | $ | 0.15 | ||||||||
| Net realized and unrealized gains (losses) on investments per share | (0.45 | ) | 0.23 | (0.22 | ) | ||||||||||
Subtotal | $ | (0.07 | ) | $ | — | $ | (0.07 | ) | |||||||
| Ratio of net investment income (loss) to average net assets | 4.27 | % | (2.60 | )% | 1.67 | % | |||||||||
Class R6: | |||||||||||||||
Net investment income (loss) per share | $ | 0.44 | $ | (0.31 | ) | $ | 0.13 | ||||||||
| Net realized and unrealized gains (losses) on investments per share | (0.49 | ) | 0.31 | (0.18 | ) | ||||||||||
Subtotal | $ | (0.05 | ) | $ | — | $ | (0.05 | ) | |||||||
| Ratio of net investment income (loss) to average net assets | 5.01 | % | (3.58 | )% | 1.43 | % | |||||||||
79
Victory Portfolios | Notes to Financial Statements — continued October 31, 2019 | ||||||
| INCORE Fund for Income | As Reported in 2018 | Reclass Entry | Adjusted 2018 | ||||||||||||
Class Y: | |||||||||||||||
Net investment income (loss) per share | $ | 0.37 | $ | (0.18 | ) | $ | 0.19 | ||||||||
| Net realized and unrealized gains (losses) on investments per share | (0.43 | ) | 0.18 | (0.25 | ) | ||||||||||
Subtotal | $ | (0.06 | ) | $ | — | $ | (0.06 | ) | |||||||
| Ratio of net investment income (loss) to average net assets | 4.22 | % | (2.08 | )% | 2.14 | % | |||||||||
12. Subsequent Events:
The Funds have evaluated the need for additional disclosures or adjustments resulting from subsequent events through the date these financial statements were issued. Based on this evaluation, there were no subsequent events to report that would have a material impact on the Funds' financial statements.
80
REPORT OF INDEPENDENT REGISTERED PUBLIC ACCOUNTING FIRM
To the Shareholders and Board of Trustees of
Victory Portfolios
Opinion on the Financial Statements
We have audited the accompanying statements of assets and liabilities, including the schedules of portfolio investments, of Victory Diversified Stock Fund, Victory NewBridge Large Cap Growth Fund, Victory Special Value Fund, Victory Strategic Allocation Fund, Victory INCORE Fund for Income and Victory INCORE Investment Grade Convertible Fund (the "Funds"), each a series of Victory Portfolios, as of October 31, 2019, the related statements of operations and changes in net assets, included the related notes, and the financial highlights for the year then ended (collectively referred to as the "financial statements"). In our opinion, the financial statements present fairly, in all material respects, the financial position of each of the Funds as of October 31, 2019, the results of their operations, the changes in their net assets, and the financial highlights for the year then ended, in conformity with accounting principles generally accepted in the United States of America.
We also have audited the adjustments described in Note 11 that were applied to restate the financial statements and financial highlights of Victory INCORE Fund for Income for the year ended October 31, 2018 to correct an error. In our opinion, such adjustments are appropriate and have been properly applied. We were not engaged to audit, review, or apply any procedures to the financial statements and financial highlights of Victory INCORE Fund for Income for the year ending October 31, 2018 other than with respect to the adjustments and, accordingly, we do not express an opinion on any other form of assurances on the financial statements for the year ending October 31, 2018 as a whole.
The Funds' financial statements and financial highlights for the years ended October 31, 2018 and prior, were audited by other auditors whose report dated December 21, 2018, expressed an unqualified opinion on those financial statements and financial highlights.
Basis for Opinion
These financial statements are the responsibility of the Funds' management. Our responsibility is to express an opinion on the Funds' financial statements based on our audit. We are a public accounting firm registered with the Public Company Accounting Oversight Board (United States) ("PCAOB") and are required to be independent with respect to the Funds in accordance with the U.S. federal securities laws and the applicable rules and regulations of the Securities and Exchange Commission and the PCAOB.
We conducted our audit in accordance with the standards of the PCAOB. Those standards require that we plan and perform the audit to obtain reasonable assurance about whether the financial statements are free of material misstatement, whether due to error or fraud.
Our audit included performing procedures to assess the risks of material misstatement of the financial statements, whether due to error or fraud, and performing procedures that respond to those risks. Such procedures included examining, on a test basis, evidence regarding the amounts and disclosures in the financial statements. Our procedures included confirmation of securities owned as of October 31, 2019, by correspondence with the custodian and brokers or by other appropriate auditing procedures where replies from brokers were not received. Our audit also included evaluating the accounting principles used and significant estimates made by management, as well as evaluating the overall presentation of the financial statements. We believe that our audit provides a reasonable basis for our opinion.
We have served as the auditor of one or more investment companies advised by Victory Capital Management, Inc. since 2015.
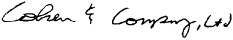
COHEN & COMPANY, LTD.
Cleveland, Ohio
December 30, 2019
81
Victory Portfolios | Supplemental Information October 31, 2019 | ||||||
(Unaudited)
Trustee and Officer Information
Board of Trustees:
Overall responsibility for management of the Trust rests with the Board. The Trust is managed by the Board in accordance with the laws of the State of Delaware. There are currently ten Trustees, nine of whom are not "interested persons" of the Trust within the meaning of that term under the 1940 Act ("Independent Trustees") and one of whom is an "interested person" of the Trust within the meaning of that term under the 1940 Act ("Interested Trustee"). The Trustees, in turn, elect the officers of the Trust to actively supervise its day-to-day operations.
The following tables list the Trustees, their ages, position with the Trust, commencement of service, principal occupations during the past five years and any directorships of other investment companies or companies whose securities are registered under the Securities Exchange Act of 1934, as amended, or who file reports under that Act. Each Trustee oversees 42 portfolios in the Trust, nine portfolios in Victory Variable Insurance Funds, and 24 portfolios in Victory Portfolios II, each a registered investment company that, together with the Trust, comprise the Victory Fund Complex. Each Trustee's address is c/o Victory Portfolios, 4900 Tiedeman Road, 4th Floor, Brooklyn, Ohio 44144. Each Trustee has an indefinite term.
Name and Age | Position Held with the Trust | Date Commenced Service | Principal Occupation During Past 5 Years | Other Directorships Held During Past 5 Years | |||||||||||||||
Independent Trustees. | |||||||||||||||||||
David Brooks Adcock, 68 | Trustee | May 2005 | Consultant (since 2006). | Chair and Trustee, Turner Funds (December 2016-December 2017). | |||||||||||||||
Nigel D. T. Andrews, 72 | Vice Chair and Trustee | August 2002 | Retired. | Director, TCG BDC II, Inc. (since 2017); Director, TCG BDC I, Inc. (formerly Carlyle GMS Finance, Inc.) (since 2012); Director, Old Mutual US Asset Management (2002-2014). | |||||||||||||||
E. Lee Beard, 68* | Trustee | May 2005 | Retired (since 2015); Consultant, The Henlee Group, LLC (consulting) (2005-2015). | None. | |||||||||||||||
82
Victory Portfolios | Supplemental Information — continued October 31, 2019 | ||||||
(Unaudited)
Name and Age | Position Held with the Trust | Date Commenced Service | Principal Occupation During Past 5 Years | Other Directorships Held During Past 5 Years | |||||||||||||||
Dennis M. Bushe, 75 | Trustee | July 2016 | Retired. | Trustee, RS Investment Trust and RS Variable Products Trust (November 2011-July 2016). | |||||||||||||||
Sally M. Dungan, 65 | Trustee | February 2011 | Chief Investment Officer, Tufts University (since 2002). | None. | |||||||||||||||
John L. Kelly, 66 | Trustee | February 2015 | Partner, McCarvill Capital Partners (September 2016- September 2017); Advisor, Endgate Commodities LLC (January 2016-April 2016); Managing Partner, Endgate Commodities LLC (August 2014-January 2016). | Director, Caledonia Mining Corporation (since May 2012). | |||||||||||||||
David L. Meyer, 62* | Trustee | December 2008 | Retired. | None. | |||||||||||||||
Gloria S. Nelund, 58 | Trustee | July 2016 | Chair, CEO and Co-Founder of TriLinc Global, LLC, an investment firm. | TriLinc Global Impact Fund, LLC (since 2012); Trustee, RS Investment Trust and RS Variable Products Trust (November 2007-July 2016). | |||||||||||||||
Leigh A. Wilson, 74 | Chair and Trustee | November 1994 | Private Investor. | Chair (since 2013), Caledonia Mining Corporation. | |||||||||||||||
Interested Trustee. | |||||||||||||||||||
David C. Brown, 47** | Trustee | May 2008 | Chairman and Chief Executive Officer (since 2013), the Adviser; Chairman and Chief Executive Officer, Victory Capital Holdings, Inc. (since 2013). | Trustee, USAA Mutual Funds Trust. | |||||||||||||||
* The Board has designated Mr. Meyer and Ms. Beard as its Audit Committee Financial Experts.
** Mr. Brown is an "Interested Person" by reason of his relationship with the Adviser.
The Statement of Additional Information includes additional information about the Trustees of the Trust and is available, without charge, on the SEC's website at www.sec.gov and/or by calling 800-539-3863.
83
Victory Portfolios | Supplemental Information — continued October 31, 2019 | ||||||
(Unaudited)
Officers:
The officers of the Trust, their ages, commencement of service and their principal occupations during the past five years, are detailed in the following table. Each officer serves until the earlier of his or her resignation, removal, retirement, death, or the election of a successor. The mailing address of each officer of the Trust is 4900 Tiedeman Road, 4th Floor, Brooklyn, Ohio 44144. The officers of the Trust receive no compensation directly from the Trust for performing the duties of their offices.
Name and Age | Position with the Trust | Date Commenced Service | Principal Occupation During Past 5 Years | ||||||||||||
Christopher K. Dyer, 57 | President | February 2006* | Director of Fund Administration, the Adviser. | ||||||||||||
Scott A. Stahorsky, 50 | Vice President | December 2014 | Manager, Fund Administration, the Adviser (since 2015); Senior Analyst, Fund Administration, the Adviser (prior to 2015). | ||||||||||||
Erin G. Wagner, 45 | Secretary | December 2014 | Associate General Counsel, the Adviser (since 2013). | ||||||||||||
Allan Shaer, 54 | Treasurer | May 2017 | Senior Vice President, Financial Administration, Citi Fund Services Ohio, Inc. (since 2016); Vice President, Mutual Fund Administration, JP Morgan Chase (2011-2016). | ||||||||||||
Christopher A. Ponte, 35 | Assistant Treasurer | December 2017 | Manager, Fund Administration, the Adviser (since 2017); Senior Analyst, Fund Administration, the Adviser (prior to 2017); Chief Financial Officer, Victory Capital Advisers, Inc. (since 2018). | ||||||||||||
Colin Kinney, 46 | Chief Compliance Officer | July 2017 | Chief Compliance Officer (since 2013) and Chief Risk Officer (2009-2017), the Adviser. | ||||||||||||
Chuck Booth, 59 | Anti-Money Laundering Compliance Officer and Identity Theft Officer | May 2015 | Director, Regulatory Administration and CCO Support Services, Citi Fund Services Ohio, Inc. | ||||||||||||
Jay G. Baris, 65 | Assistant Secretary | December 1997 | Partner, Shearman & Sterling LLP (since 2018); Partner, Morrison & Foerster LLP (2011-January 2018). | ||||||||||||
* On December 3, 2014, Mr. Dyer resigned as Secretary of the Trust and accepted the position of President.
84
Victory Portfolios | Supplemental Information — continued October 31, 2019 | ||||||
(Unaudited)
Proxy Voting and Portfolio Holdings Information
Proxy Voting:
Information regarding the policies and procedures each Fund uses to determine how to vote proxies relating to portfolio securities is available without charge, upon request, by calling 800-539-3863. The information is also included in the Funds' Statement of Additional Information, which is available on the SEC's website at www.sec.gov.
Information relating to how the Funds voted proxies relating to portfolio securities held during the most recent twelve months ended June 30 is available on the SEC's website at www.sec.gov.
Availability of Schedules of Portfolio Investments:
The Trust files a complete list of Schedules of Portfolio Investments with the SEC for the first and third quarter of each fiscal year on Form N-PORT. Prior to the implementation of Form N-PORT, the Trust filed a complete list of Schedules of Portfolio Investments with the SEC for the first and third quarters of each fiscal year on Form N-Q. Forms N-PORT and Forms N-Q are available on the SEC's website at www.sec.gov.
Expense Examples
As a shareholder of the Funds, you may incur two types of costs: (1) transaction costs, including sales charges (loads) on purchases; and (2) ongoing costs, including management fees, distribution and service (12b-1) fees, and other Fund expenses. These examples are intended to help you understand your ongoing costs (in dollars) of investing in the Funds and to compare these costs with the ongoing costs of investing in other mutual funds.
These examples are based on an investment of $1,000 invested at the beginning of the period and held for the entire period from May 1, 2019 through November 30, 2019.
The Actual Expense figures in the table below provide information about actual account values and actual expenses. You may use the information below, together with the amount you invested, to estimate the expenses that you paid over the period. Simply divide your account value by $1,000 (for example, an $8,600 account value divided by $1,000 = 8.6), then multiply the result by the number in the table under the heading entitled "Actual Expenses Paid During Period" to estimate the expenses you paid on your account during this period.
The Hypothetical Expense figures in the table below provide information about hypothetical account values and hypothetical expenses based on each Fund's actual expense ratio and an assumed rate of return of 5% per year before expenses, which is not the Fund's actual return. The hypothetical account values and expenses may not be used to estimate the actual ending account balance or expenses you paid for the period. You may use this information to compare this 5% hypothetical example with the 5% hypothetical examples that appear in shareholder reports of other funds.
Please note the expenses shown in the table are meant to highlight your ongoing costs only and do not reflect any transactional costs. Therefore, the table is useful in comparing ongoing costs only, and will not help you determine the relative total costs of owning different funds. In addition, if these transactional costs were included, your costs would have been higher.
85
Victory Portfolios | Supplemental Information — continued October 31, 2019 | ||||||
(Unaudited)
| Beginning Account Value 5/1/19 | Actual Ending Account Value 10/31/19 | Hypothetical Ending Account Value 10/31/19 | Actual Expenses Paid During Period 5/1/19- 10/31/19* | Hypothetical Expenses Paid During Period 5/1/19- 10/31/19* | Annualized Expense Ratio During Period 5/1/19- 10/31/19 | ||||||||||||||||||||||
Diversified Stock Fund | |||||||||||||||||||||||||||
Class A Shares | $ | 1,000.00 | $ | 1,041.90 | $ | 1,019.71 | $ | 5.61 | $ | 5.55 | 1.09 | % | |||||||||||||||
Class C Shares | 1,000.00 | 1,037.20 | 1,015.07 | 10.32 | 10.21 | 2.01 | % | ||||||||||||||||||||
Class I Shares | 1,000.00 | 1,043.30 | 1,020.97 | 4.33 | 4.28 | 0.84 | % | ||||||||||||||||||||
Class R Shares | 1,000.00 | 1,040.10 | 1,018.35 | 6.99 | 6.92 | 1.36 | % | ||||||||||||||||||||
Class R6 Shares | 1,000.00 | 1,043.60 | 1,021.27 | 4.02 | 3.97 | 0.78 | % | ||||||||||||||||||||
Class Y Shares | 1,000.00 | 1,043.80 | 1,020.87 | 4.43 | 4.38 | 0.86 | % | ||||||||||||||||||||
Newbridge Large Cap Growth Fund | |||||||||||||||||||||||||||
Class A Shares | 1,000.00 | 935.60 | 1,018.35 | 6.64 | 6.92 | 1.36 | % | ||||||||||||||||||||
Class C Shares | 1,000.00 | 934.60 | 1,014.62 | 10.24 | 10.66 | 2.10 | % | ||||||||||||||||||||
Class I Shares | 1,000.00 | 938.70 | 1,020.42 | 4.64 | 4.84 | 0.95 | % | ||||||||||||||||||||
Class Y Shares | 1,000.00 | 939.10 | 1,020.06 | 4.99 | 5.19 | 1.02 | % | ||||||||||||||||||||
Special Value Fund | |||||||||||||||||||||||||||
Class A Shares | 1,000.00 | 1,037.00 | 1,019.06 | 6.26 | 6.21 | 1.22 | % | ||||||||||||||||||||
Class C Shares | 1,000.00 | 1,032.10 | 1,014.62 | 10.76 | 10.66 | 2.10 | % | ||||||||||||||||||||
Class I Shares | 1,000.00 | 1,038.10 | 1,019.91 | 5.39 | 5.35 | 1.05 | % | ||||||||||||||||||||
Class R Shares | 1,000.00 | 1,035.40 | 1,017.59 | 7.75 | 7.68 | 1.51 | % | ||||||||||||||||||||
Class Y Shares | 1,000.00 | 1,038.00 | 1,020.16 | 5.14 | 5.09 | 1.00 | % | ||||||||||||||||||||
Strategic Allocation Fund | |||||||||||||||||||||||||||
Class A Shares | 1,000.00 | 1,024.90 | 1,023.19 | 2.04 | 2.04 | 0.40 | % | ||||||||||||||||||||
Class C Shares | 1,000.00 | 1,021.50 | 1,019.41 | 5.86 | 5.85 | 1.15 | % | ||||||||||||||||||||
Class I Shares | 1,000.00 | 1,026.70 | 1,024.45 | 0.77 | 0.77 | 0.15 | % | ||||||||||||||||||||
Class R Shares | 1,000.00 | 1,023.60 | 1,021.93 | 3.32 | 3.31 | 0.65 | % | ||||||||||||||||||||
INCORE Fund for Income | |||||||||||||||||||||||||||
Class A Shares | 1,000.00 | 1,023.70 | 1,020.62 | 4.64 | 4.63 | 0.91 | % | ||||||||||||||||||||
Class C Shares | 1,000.00 | 1,019.70 | 1,016.59 | 8.71 | 8.69 | 1.71 | % | ||||||||||||||||||||
Class I Shares | 1,000.00 | 1,025.10 | 1,021.98 | 3.27 | 3.26 | 0.64 | % | ||||||||||||||||||||
Class R Shares | 1,000.00 | 1,022.50 | 1,020.62 | 4.64 | 4.63 | 0.91 | % | ||||||||||||||||||||
Class R6 Shares | 1,000.00 | 1,024.00 | 1,022.03 | 3.21 | 3.21 | 0.63 | % | ||||||||||||||||||||
Class Y Shares | 1,000.00 | 1,024.80 | 1,021.63 | 3.62 | 3.62 | 0.71 | % | ||||||||||||||||||||
INCORE Investment Grade Convertible Fund | |||||||||||||||||||||||||||
Class A Shares | 1,000.00 | 1,067.70 | 1,017.74 | 7.71 | 7.53 | 1.48 | % | ||||||||||||||||||||
Class I Shares | 1,000.00 | 1,070.60 | 1,020.32 | 5.06 | 4.94 | 0.97 | % | ||||||||||||||||||||
* Expenses are equal to the average account value multiplied by the Fund's annualized expense ratio multiplied by 184/365 (the number of days in the most recent fiscal half-year divided by the number of days in the fiscal year).
86
Victory Portfolios | Supplemental Information — continued October 31, 2019 | ||||||
(Unaudited)
Additional Federal Income Tax Information
For the year ended October 31, 2019, the Funds paid qualified dividend income for the purposes of reduced individual federal income tax rates of:
Amount | |||||||
Diversified Stock Fund | 28 | % | |||||
NewBridge Large Cap Growth Fund | 100 | % | |||||
Special Value Fund | 28 | % | |||||
Strategic Allocation Fund | 30 | % | |||||
Dividends qualified for corporate dividends received deductions of:
Amount | |||||||
Diversified Stock Fund | 27 | % | |||||
NewBridge Large Cap Growth Fund | 100 | % | |||||
Special Value Fund | 26 | % | |||||
Strategic Allocation Fund | 48 | % | |||||
For the year ended October 31, 2019, the Funds designated short-term capital gain distributions (in thousands):
Amount | |||||||
Diversified Stock Fund | $ | 24,652 | |||||
NewBridge Large Cap Growth Fund | 29 | ||||||
Special Value Fund | 3,932 | ||||||
INCORE Investment Grade Convertible Fund | 19 | ||||||
For the year ended October 31, 2019, the following Funds designated long-term capital gain distributions (in thousands):
Amount | |||||||
Diversified Stock Fund | $ | 14,832 | |||||
NewBridge Large Cap Growth Fund | 7,817 | ||||||
Special Value Fund | 2,621 | ||||||
Strategic Allocation Fund | 254 | ||||||
INCORE Investment Grade Convertible Fund | 4,048 | ||||||
87
Privacy Policy
Protecting the Privacy of Information
The Trust respects your right to privacy. We also know that you expect us to conduct and process your business in an accurate and efficient manner. To do so, we must collect and maintain certain personal information about you. This is the information we collect from you on applications or other forms, and from the transactions you make with us or third parties. It may include your name, address, social security number, account transactions and balances, and information about investment goals and risk tolerance.
We do not disclose any information about you or about former customers to anyone except as permitted or required by law. Specifically, we may disclose the information we collect to companies that perform services on our behalf, such as the transfer agent that processes shareholder accounts and printers and mailers that assist us in the distribution of investor materials. We may also disclose this information to companies that perform marketing services on our behalf. This allows us to continue to offer you Victory investment products and services that meet your investing needs, and to effect transactions that you request or authorize. These companies will use this information only in connection with the services for which we hired them. They are not permitted to use or share this information for any other purpose.
To protect your personal information internally, we permit access only by authorized employees and maintain physical, electronic and procedural safeguards to guard your personal information.*
* You may have received communications regarding information about privacy policies from other financial institutions which gave you the opportunity to "opt-out" of certain information sharing with companies which are not affiliated with that financial institution. The Trust does not share information with other companies for purposes of marketing solicitations for products other than the Trust. Therefore, the Trust does not provide opt-out options to their shareholders.
Victory Funds
P.O. Box 182593
Columbus, Ohio 43218-2593

Visit our website at: | Call Victory at: | ||||||
www.vcm.com | 800-539-FUND (800-539-3863) | ||||||
VP-AR (10/19)

October 31, 2019
Annual Report
Victory Sycamore Established Value Fund
Victory Sycamore Small Company Opportunity Fund
Beginning January 1, 2021, as permitted by regulations adopted by the Securities and Exchange Commission, paper copies of the Victory Funds' shareholder reports will no longer be sent by mail, unless you specifically request paper copies of the reports from the Victory Funds or from your financial intermediary, such as a broker-dealer or bank. Instead, the reports will be made available on www.VictoryFunds.com, and you will be notified by mail each time a report is posted and provided with a website link to access the report.
If you already elected to receive shareholder reports electronically, you will not be affected by this change; and you need not take any action. You may elect to receive shareholder reports and other communications from the Victory Funds or your financial intermediary electronically by notifying your financial intermediary directly or, if you are a direct investor, by calling 800-539-3863 or by sending an e-mail request to TA.Processing@FISGlobal.com.
You may elect to receive all future reports in paper free of charge. If you invest through a financial intermediary, you can contact your financial intermediary to request that you continue to receive paper copies of your reports. If you invest directly with the Victory Funds, you can call 800-539-3863 or send an e-mail request to TA.Processing@FISGlobal.com. Your election to receive reports in paper will apply to all Victory Funds you hold directly or through your financial intermediary.
www.vcm.com
News, Information And Education 24 Hours A Day, 7 Days A Week
The Victory Funds site gives fund shareholders, prospective shareholders, and investment professionals a convenient way to access fund information, get guidance, and track fund performance anywhere they can access the Internet. The site includes:
• Detailed performance records
• Daily share prices
• The latest fund news
• Investment resources to help you become a better investor
• A section dedicated to investment professionals
Whether you're a potential investor searching for the fund that matches your investment philosophy, a seasoned investor interested in planning tools, or an investment professional, www.vcm.com has what you seek. Visit us anytime. We're always open.
Victory Portfolios
Table of Contents
Shareholder Letter (Unaudited) | 4 | ||||||
Fund Review and Commentary (Unaudited) | 6 | ||||||
Financial Statements | |||||||
Victory Sycamore Established Value Fund | |||||||
Schedule of Portfolio Investments | 13 | ||||||
Statement of Assets and Liabilities | 20-21 | ||||||
Statement of Operations | 22 | ||||||
Statements of Changes in Net Assets | 23-25 | ||||||
Financial Highlights | 26-27 | ||||||
Victory Sycamore Small Company Opportunity Fund | |||||||
Schedule of Portfolio Investments | 16 | ||||||
Statement of Assets and Liabilities | 20-21 | ||||||
Statement of Operations | 22 | ||||||
Statements of Changes in Net Assets | 23-25 | ||||||
Financial Highlights | 28-29 | ||||||
Notes to Financial Statements | 30 | ||||||
| Report of Independent Registered Public Accounting Firm | 40 | ||||||
Supplemental Information | |||||||
Trustee and Officer Information | 41 | ||||||
Proxy Voting and Portfolio Holdings Information | 44 | ||||||
Expense Examples | 44 | ||||||
Additional Federal Income Tax Information | 46 | ||||||
Privacy Policy (inside back cover) | |||||||
1
The Funds are distributed by Victory Capital Advisers, Inc. Victory Capital Management Inc. is the investment adviser to the Funds and receives fees from the Funds for performing services for the Funds.
This report is not authorized for distribution to prospective investors unless preceded or accompanied by a current prospectus of the Victory Funds.
For additional information about any Victory Fund, including fees, expenses, and risks, view our prospectus online at vcm.com or call 800-539-3863. Read it carefully before you invest or send money.
The information in this annual report is based on data obtained from recognized services and sources and is believed to be reliable. Any opinions, projections, or recommendations in this report are subject to change without notice and are not intended as individual investment advice. Past investment performance of the Funds, markets or securities mentioned herein should not be considered to be indicative of future results.
• NOT FDIC INSURED • NO BANK GUARANTEE • MAY LOSE VALUE

Call Victory at:
800-539-FUND (800-539-3863)
Visit our website at:
www.vcm.com
2
This page is intentionally left blank.
3
Victory Funds Letter to Shareholders
Dear Shareholder,
The past year has been anything but dull for investors. On one hand there are numerous factors that could have (and still might) derail the longest-ever bull market in U.S. equities. Yet stocks remained resilient throughout the most recent annual reporting period ended October 31, 2019, and despite periods of tumult, the bull market has endured.
The S&P 500® Index managed to post impressive gains of nearly 14% for the 12-months ended October 31, 2019, bouncing back smartly after a precipitous drop late in 2018. The move higher supports the notion that underlying fundamentals of U.S. companies drive performance, rather than the political rancor and headline fears that often capture the attention of investors. As just one example, approximately three quarters of S&P 500 companies exceeded earnings expectations in the most recent quarter ended September 30, 2019, according to FactSet.
Perhaps we should not be surprised at the positive earnings news given that the domestic economy remains on solid footing. Robust job creation, near-record low unemployment, and steady consumer spending continue and offer reasons for further optimism. Meanwhile, inflation remains muted and the U.S. Federal Reserve (the "Fed") has taken an accommodative stance (ever since its abrupt pivot in late 2018). In fact, the Fed has cut interest rates by a total of 0.75% over the past three meetings in July, September, and October. There is evidence that the Fed may move further in its attempt to aid and extend the economic expansion, which is likely to be welcomed by equities.
Still, it is important to remember that it has not been smooth sailing for investors. In addition to a steep drawdown late last year, in August 2019 the yield on 10-year U.S. Treasuries fell below the 2-year yield. Such an inversion not only created challenges for fixed-income investors, but it caused quite the commotion since it is heralded as a possible harbinger for recession. Since then, however, the yield curve has returned to its more normal upward slope.
Another factor periodically roiling markets has been U.S. trade policy. As we approached the end of the Funds' annual reporting period, optimism abounded regarding a resolution to the trade dispute, and domestic stocks were again flirting with record highs. However, the recent trade turmoil is still a wildcard without a clear resolution, and any prolonged uncertainty could impact economic growth both domestically and globally.
So while the most recent annual reporting period was constructive for most stock markets, ample risks remain. Yet it is these very risks — these cross-currents — that create pricing dislocations. This is an environment in which we believe our Victory Capital independent investment franchises can thrive.
On the following pages, you will find information relating to your Victory Funds investment. If you have any questions, we encourage you to contact your financial advisor. Or, if you invest with us directly, you may call (800) 539-3863, or visit our website at www.vcm.com.
4
My colleagues and I sincerely appreciate the confidence you have placed in the Victory Funds, and we value the opportunity to help meet your investment goals.

Christopher K. Dyer, CFA
President,
Victory Funds
5
Victory Sycamore Established Value Fund
Portfolio Holdings
As a Percentage of Total Investments
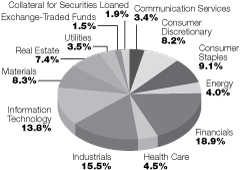
Commentary
The Victory Sycamore Established Value Fund (the "Fund") seeks to provide long-term capital growth by investing primarily in common stocks. For the fiscal year ended October 31, 2019, the Fund outperformed its benchmark, the Russell Midcap® Value Index (the "Index"), with the Fund (Class A Shares at net asset value) returning 11.96% versus the 10.08% return for the Index.
The Fund's performance relative to the Index was primarily driven by stock selection. Sector allocation — a by-product of the bottom-up stock selection process — had a marginal positive impact. Specifically, stock selection in the Materials, Consumer Discretionary, Information Technology, Financials, and Industrials sectors contributed to relative performance. An overweight position in Information Technology and Industrials was also beneficial. Conversely, stock selection in the Energy, Communication Services, Consumer Staples, and Real Estate sectors detracted from performance. The Fund's underweight position in Energy — the worst-performing sector for the period — entirely offset the unfavorable impact from selection in the sector. Underweight positions in Real Estate and Utilities in addition to the Fund's overweight position in Consumer Staples also detracted from performance. Favorable stock selection in Utilities partially offset the impact from the underweight in the sector.
Reliance Steel & Aluminum Co. ("RS") was the top contributor for the period. According to the company, end-market demand remains robust, particularly in Automotive and Aerospace, where the company continues to gain market share. Furthermore, we believe that shares were rewarded given the company's solid free-cash-flow profile, which offers RS optionality. Alleghany Corp. ("Y"), an insurance holding company with various segments anchored by a core position in Property & Casualty insurance and reinsurance, was another top contributor. The company reported solid results driven by rate increases and robust premium growth across most lines of business. We believe Alleghany is well positioned to benefit from the shift to the excess and surplus ("E&S") markets. The focus on specialty lines requires experience and expertise from underwriters, which gives Alleghany's E&S segment (RSUI) a competitive advantage. As other players scale back operations, RSUI is in a position to fill in the void created. W.R. Berkley Corp. ("WRB"), another property & casualty insurer, was also a top contributor. The company reported solid results attributed to both favorable underwriting trends and positive investment income. Catastrophe losses were slightly lower than expected, and management expects rates to continue to improve across various lines of business.
Cimarex Energy ("XEC") was the top detractor for the period. Like many companies within the Energy sector, XEC shares were under pressure for most of the period driven largely by weaker gas/natural gas liquids pricing that offset better than expected gas/natural gas liquids production and oil prices. The company raised its fiscal year oil production guidance and maintained its 2019 capital expenditures guidance. Management alluded to slowing activity
6
Victory Equity Funds (Unaudited)
Victory Sycamore Established Value Fund (continued)
in 2020 if weak prices persist. Despite the inhospitable environment, Cimarex is addressing what it can control. The company is focused on the appropriate level of growth in this environment that enables it to generate sustainable free cash flow without jeopardizing the balance sheet. DXC Technology ("DXC"), a leading IT services provider, was another top detractor. There were developments that transpired during the period that put downward pressure on the stock. First, the management team reduced their fiscal year 2020 guidance. Additionally, it was revealed that the company plans to invest approximately $100 million in the digital business to support growth efforts, which lowered the planned cost savings in fiscal year 2020. Furthermore, the company announced a change in leadership. While these developments weighed on sentiment, the company has made investments in its digital segment, which should improve the margin profile moving forward. Shares of Perrigo Co. ("PRGO"), the OTC consumer goods and specialty pharmaceutical company, sold off during the fourth quarter of 2018. Several factors likely contributed to the stock's underperformance during the year. First, we believe the lack of transparency as it pertains to the CEO change (less than a year after the previous CEO commenced his role) may have been one catalyst. This change took place not long after Perrigo cancelled the company's scheduled investor day where the previously named CEO was to unveil his strategic vision. Perrigo also reported disappointing third quarter earnings with revenue and margin misses in each segment leading to a lowered outlook for sales and earnings in 2019. Shares were divested in favor of more compelling investment opportunities.
The possibility for slowing economic growth and potential peaking in corporate earnings coupled with hawkish commentary from the U.S. Federal Reserve (the "Fed") resulted in a sharp sell-off in U.S. equities in the fourth quarter of 2018. However, the Fed was quick to pivot, and the tone became increasingly dovish early in the new year. Consequently, the S&P 500® Index posted the biggest first quarter gain since 1998, while the bull market celebrated its tenth anniversary. This noteworthy feat was clouded by even more dovish Fed commentary in March and concern over slowing global growth. The Fed and the U.S. Treasury market were in focus for the latter part of the first quarter. Worry about slowing growth also was reflected in the bond market, which saw shorter segments of the curve — 10-year/3-month and 10-year/1-year — invert in late March. It was the first time that the 10-year U.S. Treasury note has traded below the three-month U.S. Treasury bill since 2007. Historically, a yield curve inverting in a sustained manner is viewed as a harbinger to recession in the following 12 months, on average.
Despite a barrage of headlines during the second quarter, the U.S. equity market ended the quarter higher — posting the best first half since 1997. The primary focus remained on China and the Fed. Despite fundamental disagreements between the United States and China, there was optimism early in the quarter that some sort of trade deal would be struck. However, trade negotiations broke down and in May, the Trump administration threatened to impose tariffs on an additional $300 billion of Chinese goods. Rhetoric between the two countries escalated when the United States sanctioned Chinese telecom company Huawei on grounds of national security. However, tensions abated when the leaders of both countries met at the G20 Summit and agreed to defuse the trade dispute by temporarily halting any further tariffs. The Chinese also pledged to purchase more U.S. agricultural products.
The frenzy of headlines did not abate during the third quarter. Despite persistent jolts and distractions, the U.S. equity market as measured by the S&P 500® Index ended the quarter in positive territory and delivered the best year-to-date performance since 1997.
7
Victory Equity Funds (Unaudited)
Victory Sycamore Established Value Fund (continued)
Nevertheless, there were several developments that kept the market and investors on edge. Trade remained front and center, with little progress made on the negotiation front. However, a couple of actions taken by the Trump administration indicated that the White House may finally be weighing the impact tariffs are having on the consumer. The administration delayed implementation of 10% tariffs on more than half of the final tranche of approximately $300 billion of Chinese imports. Additionally, there were efforts on both sides to de-escalate tensions with the hope of finding some common ground.
The Fed also cut rates twice during the quarter; however, that did not necessarily assuage investor concern about slowing global growth and how that may eventually impact the U.S. economy. In fact, some perceived the cuts to be relatively "hawkish," with particular focus on Chairman Powell's decision to describe the moves as a mid-cycle adjustment rather than a return to an easing regime. Furthermore, there was skepticism regarding whether the Fed has enough ammunition in its war chest to offset the effects from tariffs and prolong the expansion. The inversion of the U.S. Treasury yield curve — particularly the 10-year/2-year curve, which inverted briefly in mid-August for the first time since 2007 — prompted pundits to debate its signaling effects. Markets also had to grapple with heightened geopolitical risks in Asia and the Middle East. As has been the case for most of this cycle, any negative reaction to geopolitical uncertainty was short-lived.
The U.S. equity market continued its advance in October in response to easier financial conditions and the potential for de-escalation in the trade dispute. Looser financial conditions resulted in the un-inverting of the yield curve, which has alleviated some of the concern that a recession could be on the horizon. Time will tell whether unconventional monetary policy can reignite the economy and help propel the equity market higher.
8
Victory Equity Funds (Unaudited)
Victory Sycamore Established Value Fund (continued)
Average Annual Return
Year Ended October 31, 2019
Class A | Class C | Class I | Class R | Class R6 | Class Y | ||||||||||||||||||||||||||||||||||
INCEPTION DATE | 5/5/00 | 3/1/16 | 3/1/10 | 8/16/83 | 3/4/14 | 1/28/13 | |||||||||||||||||||||||||||||||||
| Net Asset Value | Maximum Offering Price | Net Asset Value | Maximum Offering Price | Net Asset Value | Net Asset Value | Net Asset Value | Net Asset Value | Russell Mid Cap® Value Index(1) | |||||||||||||||||||||||||||||||
One Year | 11.96 | % | 5.52 | % | 11.10 | % | 10.10 | % | 12.31 | % | 11.72 | % | 12.35 | % | 12.28 | % | 10.08 | % | |||||||||||||||||||||
Three Year | 11.11 | % | 8.94 | % | 10.25 | % | 10.25 | % | 11.45 | % | 10.89 | % | 11.49 | % | 11.43 | % | 8.90 | % | |||||||||||||||||||||
Five Year | 9.82 | % | 8.53 | % | N/A | N/A | 10.17 | % | 9.61 | % | 10.21 | % | 10.10 | % | 6.95 | % | |||||||||||||||||||||||
Ten Year | 13.12 | % | 12.45 | % | N/A | N/A | N/A | 12.91 | % | N/A | N/A | 12.90 | % | ||||||||||||||||||||||||||
Since Inception | 9.89 | % | 9.56 | % | 12.44 | % | 12.44 | % | 12.72 | % | 11.59 | % | 10.33 | % | 12.36 | % | N/A | ||||||||||||||||||||||
Expense Ratios | |||||||||||||||||||||||||||||||||||||||
Gross | 0.89% | 1.68% | 0.59% | 1.10% | 0.57% | 0.62% | |||||||||||||||||||||||||||||||||
| With Applicable Waivers | 0.89% | 1.68% | 0.59% | 1.10% | 0.57% | 0.62% | |||||||||||||||||||||||||||||||||
Past performance is not indicative of future results. The performance data quoted represents past performance and current returns may be lower or higher. The investment return and principal value will fluctuate so that an investor's shares, when redeemed, may be worth more or less than the original cost. To obtain performance information current to the most recent month's end, please visit www.vcm.com. | |||||||||||||||||||||||||||||||||||||||
The above expense ratios are from the Fund's prospectus dated March 1, 2019, as may be supplemented. Additional information pertaining to the Fund's expense ratios as of October 31, 2019 can be found in the financial highlights.
The maximum offering price (MOP) reflects a maximum sales charge of 5.75% for Class A Shares. Class C Shares are not subject to an initial sales charge, but are subject to a deferred sales charge of 1.00% on shares redeemed within one year of purchase. NAV does not reflect sales charges.
The total return figures set forth above include all waivers of fees for various periods since inception. Without such fee waivers, the total returns would
have been lower. Some fee waivers are voluntary and may be modified or terminated at any time.
Victory Sycamore Established Value Fund — Growth of $10,000

(1)The Russell MidCap Value Index is an unmanaged Index made up of medium and medium/small companies in the Russell 1000 Index chosen for their value orientation. This Index does not include the effect of expenses, is not representative of any specific fund or product and cannot be invested in directly.
The graph reflects investment growth of a hypothetical $10,000 investment in Class A Shares of the Fund. The performance of other classes of the Fund's shares will be greater than or less than the line shown based on the differences in loads and fees paid by shareholders investing in the different classes. Past performance is no guarantee of future results.
The graph and table do not reflect the deduction of taxes that a shareholder would pay on Fund distributions or the redemption of Fund shares.
9
Victory Equity Funds (Unaudited)
Victory Sycamore Small Company Opportunity Fund
Portfolio Holdings
As a Percentage of Total Investments

Commentary
The Victory Sycamore Small Company Opportunity Fund (the "Fund") seeks to provide capital appreciation. For the fiscal year ended October 31, 2019, the Fund outperformed its benchmark index, the Russell 2000® Value Index (the "Index"), with the Fund (Class A shares at net asset value) returning 12.10% versus the Index's return of 3.22%.
Both stock selection and sector allocation contributed favorably to the Fund's performance, with security selection having a larger impact on relative performance for the period. Sector weighting is a by-product of the bottom-up stock selection process. Specifically, stock selection in the Industrials, Consumer Staples, Consumer Discretionary, Financials, and Health Care sectors contributed the most to relative return. However, the Fund's overweight position in Consumer Staples partially offset the positive impact from selection in the sector. An overweight position in Industrials, which outpaced the broader Index, also was beneficial. Conversely, the Fund's stock selection in the Information Technology and Energy sectors detracted from relative performance. An underweight position in Energy — the worst-performing sector for the period — entirely offset the unfavorable impact from selection in the sector. The Fund's underweight positions in Real Estate and Utilities also detracted from its performance.
Sanderson Farms, Inc. ("SAFM"), a leading poultry processer and distributor, was the top contributor for the period. Higher volume and better cost performance helped results. Additionally, robust grain harvests in fall 2018 provided a favorable price environment for feed during the year. Universal Forest Products, Inc. ("UFPI"), a wood products company, was another top contributor. The company benefited from a decrease in lumber prices during the year as well as from favorable housing trends. Performance Food Group Co. ("PFGC") was also a top contributor. Shares in the food distributor rallied due to solid execution. The company made an acquisition during the period that enhanced its market share in its core business. PFGC made another acquisition, which allowed the company to enter into the convenience store vertical.
Two of the Fund's top detractors were holdings in the Energy sector. Unit Corp. ("UNT"), an oil and gas company with three separate businesses (contract drilling, exploration and production ("E&P"), and midstream), was the top detractor. The company missed consensus estimates in the second quarter of 2019, largely driven by weaker than expected natural gas liquids/natural gas price realizations and rig utilizations, which pressured margins. The company also experienced some operational issues at one of its well locations. Shares were punished given the difficult pricing environment and the operational hiccup. SRC Energy ("SRCI"), an E&P company leveraged to eastern Colorado was another top detractor. The company's production guide was below expectations given gathering and processing constraints that impacted companies in the industry. In August, it was announced that PDC Energy, Inc. ("PDCE"), another E&P with Colorado assets, would acquire SRCI. We believe the acquisition made strategic sense given the scale that SRCI provides. Shares of Andersons, Inc. ("ANDE"), a leading agriculture-based company, were punished given the difficult operating environment for the sector. The U.S.-China trade spat remains top-of-mind for the sector, and Andersons was not immune to the back-and-forth between the two countries. Additionally, adverse weather across the Midwest (flooding at a Nebraska facility) created volume headwinds for the Plant Nutrient segment. Shares were divested in the Fund given the challenging backdrop and diminished risk/reward profile.
10
Victory Equity Funds (Unaudited)
Victory Sycamore Small Company Opportunity Fund (continued)
The possibility for slowing economic growth and potential peaking in corporate earnings coupled with hawkish commentary from the U.S. Federal Reserve ("Fed") resulted in a sharp sell-off in U.S. equities in the fourth quarter of 2018. However, the Fed was quick to pivot, and the tone became increasingly dovish early in the new year. Consequently, the S&P 500® Index posted the biggest first quarter gain since 1998, while the bull market celebrated its tenth anniversary. This noteworthy feat was clouded by even more dovish Fed commentary in March and concern over slowing global growth. The Fed and the U.S. Treasury market were in focus for the latter part of the first quarter. Worry about slowing growth also was reflected in the bond market, which saw shorter segments of the curve — 10-year/3-month and 10 year/1-year — invert in late March. It was the first time that the 10-year U.S. Treasury note has traded below the three-month U.S. Treasury bill since 2007. Historically, a yield curve inverting in a sustained manner is viewed as a harbinger to recession in the following 12 months, on average. Despite a barrage of headlines during the second quarter, the U.S. equity market ended the quarter higher — posting the best first half since 1997. The primary focus remained on China and the Fed. Despite fundamental disagreements between the United States and China, there was optimism early in the quarter that some sort of trade deal would be struck. However, trade negotiations broke down and in May, the Trump administration threatened to impose tariffs on an additional $300 billion of Chinese goods. Rhetoric between the two countries escalated when the United States sanctioned Chinese telecom company Huawei on grounds of national security. However, tensions abated when the leaders of both countries met at the G20 Summit and agreed to defuse the trade dispute by temporarily halting any further tariffs. The Chinese also pledged to purchase more U.S. agricultural products.
The frenzy of headlines did not abate during the third quarter. Despite persistent jolts and distractions, the U.S. equity market as measured by the S&P 500® Index ended the quarter in positive territory and delivered the best year-to-date performance since 1997. Nevertheless, there were several developments that kept the market and investors on edge. Trade remained front and center, with little progress made on the negotiation front. However, a couple of actions taken by the Trump administration indicated that the White House may finally be weighing the impact tariffs are having on the consumer. The administration delayed implementation of 10% tariffs on more than half of the final tranche of approximately $300 billion of Chinese imports. Additionally, there were efforts on both sides to de-escalate tensions with the hope of finding some common ground.
The Fed also cut rates twice during the quarter; however, that did not necessarily assuage investor concern about slowing global growth and how that may eventually impact the U.S. economy. In fact, some perceived the cuts to be relatively "hawkish," with particular focus on Chairman Powell's decision to describe the moves as a mid-cycle adjustment rather than a return to an easing regime. Furthermore, there was skepticism regarding whether the Fed has enough ammunition in its war chest to offset the effects from tariffs and prolong the expansion. The inversion of the U.S. Treasury yield curve — particularly the 10-year/2-year curve, which inverted briefly in mid-August for the first time since 2007 — prompted pundits to debate its signaling effects. Markets also had to grapple with heightened geopolitical risks in Asia and the Middle East. As has been the case for most of this cycle, any negative reaction to geopolitical uncertainty was short-lived.
The U.S. equity market continued its advance in October in response to easier financial conditions and the potential for de-escalation in the trade dispute. Looser financial conditions resulted in the un-inverting of the yield curve, which has alleviated some of the concern that a recession could be on the horizon. Time will tell whether unconventional monetary policy can reignite the economy and help propel the equity market higher.
11
Victory Equity Funds (Unaudited)
Victory Sycamore Small Company Opportunity Fund (continued)
Average Annual Return
Year Ended October 31, 2019
Class A | Class I | Class R | Class R6 | Class Y | |||||||||||||||||||||||||||
INCEPTION DATE | 3/26/99 | 8/31/07 | 8/16/83 | 12/14/15 | 1/28/13 | ||||||||||||||||||||||||||
| Net Asset Value | Maximum Offering Price | Net Asset Value | Net Asset Value | Net Asset Value | Net Asset Value | Russell 2000® Value Index(1) | |||||||||||||||||||||||||
One Year | 12.10 | % | 5.66 | % | 12.49 | % | 11.89 | % | 12.52 | % | 12.31 | % | 3.22 | % | |||||||||||||||||
Three Year | 12.56 | % | 10.37 | % | 12.94 | % | 12.32 | % | 12.96 | % | 12.72 | % | 8.60 | % | |||||||||||||||||
Five Year | 10.01 | % | 8.71 | % | 10.37 | % | 9.77 | % | N/A | 10.16 | % | 6.24 | % | ||||||||||||||||||
Ten Year | 12.91 | % | 12.25 | % | 13.30 | % | 12.66 | % | N/A | N/A | 11.08 | % | |||||||||||||||||||
Since Inception | 10.23 | % | 9.91 | % | 9.22 | % | 9.86 | % | 13.36 | % | 11.76 | % | N/A | ||||||||||||||||||
Expense Ratios | |||||||||||||||||||||||||||||||
Gross | 1.22% | 0.88% | 1.44% | 0.87% | 1.06% | ||||||||||||||||||||||||||
With Applicable Waivers | 1.22% | 0.88% | 1.44% | 0.87% | 1.06% | ||||||||||||||||||||||||||
Past performance is not indicative of future results. The performance data quoted represents past performance and current returns may be lower or higher. The investment return and principal value will fluctuate so that an investor's shares, when redeemed, may be worth more or less than the original cost. To obtain performance information current to the most recent month's end, please visit www.vcm.com.
The above expense ratios are from the Fund's prospectus dated March 1, 2019, as may be supplemented. Additional information pertaining to the Fund's expense ratios as of October 31, 2019 can be found in the financial highlights.
The maximum offering price (MOP) figures reflect a maximum sales charge of 5.75% for Class A Shares. NAV does not reflect sales charges.
The total return figures set forth above include all waivers of fees for various periods since inception. Without such fee waivers, the total returns would have been lower. Some fee waivers are voluntary and may be modified or terminated at any time.
Victory Sycamore Small Company Opportunity Fund — Growth of $10,000
(1)The Russell 2000 Value Index is an unmanaged index that measures the performance of those Russell 2000 companies with lower price-to-book ratios and lower forecasted growth values. These indicies do not include the effect of sales charges, are not representative of the Fund and it is not possible to invest directly in an index.
The graph reflects investment growth of a hypothetical $10,000 investment in Class A Shares of the Fund. The performance of other classes of the Fund's shares will be greater than or less than the line shown based on the differences in loads and fees paid by shareholders investing in the different classes. Past performance is no guarantee of future results.
The graph and table do not reflect the deduction of taxes that a shareholder would pay on Fund distributions or the redemption of Fund shares.
12
| Victory Portfolios Victory Sycamore Established Value Fund | Schedule of Portfolio Investments October 31, 2019 | ||||||
(Amounts in Thousands, Except for Shares)
Security Description | Shares | Value | |||||||||
Common Stocks (95.1%) | |||||||||||
Communication Services (3.3%): | |||||||||||
CBS Corp., Class B | 3,018,500 | $ | 108,787 | ||||||||
Cinemark Holdings, Inc. | 4,508,800 | 165,022 | |||||||||
The Interpublic Group of Co., Inc. | 5,084,520 | 110,588 | |||||||||
384,397 | |||||||||||
Consumer Discretionary (8.1%): | |||||||||||
AutoNation, Inc. (a) (b) | 2,536,477 | 128,980 | |||||||||
BorgWarner, Inc. | 4,726,025 | 196,981 | |||||||||
Carter's, Inc. (b) | 2,388,300 | 239,403 | |||||||||
Darden Restaurants, Inc. | 1,573,875 | 176,699 | |||||||||
Hasbro, Inc. | 895,625 | 87,153 | |||||||||
Tiffany & Co. (b) | 235,800 | 29,359 | |||||||||
Yum! Brands, Inc. | 848,175 | 86,268 | |||||||||
944,843 | |||||||||||
Consumer Staples (9.0%): | |||||||||||
Archer-Daniels-Midland Co. | 6,520,200 | 274,110 | |||||||||
Hormel Foods Corp. (b) | 2,265,575 | 92,639 | |||||||||
Kimberly-Clark Corp. | 1,375,075 | 182,720 | |||||||||
Sysco Corp. | 2,143,700 | 171,217 | |||||||||
The Clorox Co. (b) | 852,500 | 125,906 | |||||||||
The Kroger Co. | 8,024,200 | 197,716 | |||||||||
1,044,308 | |||||||||||
Energy (3.9%): | |||||||||||
Cimarex Energy Co. | 3,208,800 | 135,475 | |||||||||
Devon Energy Corp. | 5,722,475 | 116,052 | |||||||||
Parsley Energy, Inc., Class A | 6,233,500 | 98,552 | |||||||||
Valero Energy Corp. (b) | 1,064,500 | 103,235 | |||||||||
453,314 | |||||||||||
Financials (18.5%): | |||||||||||
Aflac, Inc. | 2,223,575 | 118,205 | |||||||||
Alleghany Corp. (a) | 337,250 | 262,478 | |||||||||
American Financial Group, Inc. | 1,774,025 | 184,570 | |||||||||
Arthur J. Gallagher & Co. | 980,375 | 89,430 | |||||||||
E*TRADE Financial Corp. | 4,296,000 | 179,530 | |||||||||
Everest Re Group Ltd. (b) | 457,400 | 117,593 | |||||||||
Fidelity National Financial, Inc., Class A | 3,035,825 | 139,162 | |||||||||
Markel Corp. (a) | 63,525 | 74,388 | |||||||||
Old Republic International Corp. | 3,650,000 | 81,541 | |||||||||
Prosperity Bancshares, Inc. (b) | 2,634,600 | 181,840 | |||||||||
SunTrust Banks, Inc. | 1,677,550 | 114,644 | |||||||||
The Allstate Corp. | 1,909,825 | 203,244 | |||||||||
The Travelers Co., Inc. | 947,475 | 124,176 | |||||||||
W.R. Berkley Corp. | 1,618,448 | 113,130 | |||||||||
Zions Bancorp NA | 3,442,300 | 166,848 | |||||||||
2,150,779 | |||||||||||
See notes to financial statements.
13
| Victory Portfolios Victory Sycamore Established Value Fund | Schedule of Portfolio Investments — continued October 31, 2019 | ||||||
(Amounts in Thousands, Except for Shares)
Security Description | Shares | Value | |||||||||
Health Care (4.4%): | |||||||||||
AmerisourceBergen Corp. | 2,073,975 | $ | 177,076 | ||||||||
Molina Healthcare, Inc. (a) | 377,400 | 44,397 | |||||||||
Quest Diagnostics, Inc. | 2,907,075 | 294,342 | |||||||||
515,815 | |||||||||||
Industrials (15.3%): | |||||||||||
AGCO Corp. | 2,202,700 | 168,925 | |||||||||
Alaska Air Group, Inc. | 2,867,000 | 199,056 | |||||||||
Hubbell, Inc. | 760,700 | 107,791 | |||||||||
Ingersoll-Rand PLC | 591,975 | 75,116 | |||||||||
JB Hunt Transport Services, Inc. | 702,800 | 82,621 | |||||||||
Landstar System, Inc. | 1,740,550 | 196,943 | |||||||||
ManpowerGroup, Inc. | 1,639,900 | 149,100 | |||||||||
Owens Corning, Inc. | 2,285,900 | 140,080 | |||||||||
Parker-Hannifin Corp. | 838,450 | 153,847 | |||||||||
Quanta Services, Inc. | 3,340,575 | 140,471 | |||||||||
Republic Services, Inc., Class A | 1,297,000 | 113,500 | |||||||||
Textron, Inc. (b) | 4,172,925 | 192,330 | |||||||||
Xylem, Inc. | 723,400 | 55,478 | |||||||||
1,775,258 | |||||||||||
Information Technology (13.6%): | |||||||||||
Cerence, Inc. (a) | 731,237 | 11,334 | |||||||||
Coherent, Inc. (a) | 878,425 | 130,815 | |||||||||
DXC Technology Co. | 2,748,793 | 76,059 | |||||||||
Fidelity National Information Services, Inc. | 654,200 | 86,197 | |||||||||
Flextronics International Ltd. (a) | 14,722,825 | 172,993 | |||||||||
Hewlett Packard Enterprises Co. | 8,057,319 | 132,221 | |||||||||
KLA Corp. | 683,700 | 115,573 | |||||||||
Leidos Holdings, Inc. | 2,088,800 | 180,117 | |||||||||
MAXIMUS, Inc. | 2,299,450 | 176,460 | |||||||||
Motorola Solutions, Inc. | 818,000 | 136,050 | |||||||||
Nuance Communications, Inc. (a) (b) | 11,928,100 | 194,667 | |||||||||
Skyworks Solutions, Inc. | 1,300,500 | 118,423 | |||||||||
Synopsys, Inc. (a) | 408,450 | 55,447 | |||||||||
1,586,356 | |||||||||||
Materials (8.2%): | |||||||||||
AptarGroup, Inc. | 592,100 | 69,957 | |||||||||
Avery Dennison Corp. (b) | 1,396,900 | 178,607 | |||||||||
Eastman Chemical Co. | 2,913,800 | 221,566 | |||||||||
Packaging Corp. of America | 905,850 | 99,154 | |||||||||
Reliance Steel & Aluminum Co. | 2,269,346 | 263,335 | |||||||||
Westlake Chemical Corp. (b) | 1,944,600 | 122,879 | |||||||||
955,498 | |||||||||||
Real Estate (7.3%): | |||||||||||
Healthcare Trust of America, Inc., Class A | 6,318,100 | 195,861 | |||||||||
Highwoods Properties, Inc. | 4,035,700 | 188,871 | |||||||||
Lamar Advertising Co., Class A | 2,440,600 | 195,272 | |||||||||
National Retail Properties, Inc. | 2,055,925 | 121,115 | |||||||||
Public Storage | 649,300 | 144,703 | |||||||||
845,822 | |||||||||||
See notes to financial statements.
14
| Victory Portfolios Victory Sycamore Established Value Fund | Schedule of Portfolio Investments — continued October 31, 2019 | ||||||
(Amounts in Thousands, Except for Shares)
Security Description | Shares | Value | |||||||||
Utilities (3.5%): | |||||||||||
Alliant Energy Corp. | 2,724,100 | $ | 145,303 | ||||||||
DTE Energy Co. | 972,375 | 123,803 | |||||||||
Xcel Energy, Inc. (b) | 2,154,275 | 136,818 | |||||||||
405,924 | |||||||||||
Total Common Stocks (Cost $9,521,225) | 11,062,314 | ||||||||||
Exchange-Traded Funds (1.5%) | |||||||||||
iShares Russell Midcap Value Index ETF | 1,896,800 | 171,091 | |||||||||
Total Exchange-Traded Funds (Cost $133,210) | 171,091 | ||||||||||
Collateral for Securities Loaned^ (1.9%) | |||||||||||
BlackRock Liquidity Funds TempFund, Institutional Class, 1.92% (c) | 26,074,023 | 26,074 | |||||||||
| Fidelity Investments Money Market Government Portfolio, Institutional Class, 1.75% (c) | 61,876,830 | 61,877 | |||||||||
| Fidelity Investments Money Market Prime Money Market Portfolio, Institutional Class, 1.87% (c) | 1,868,591 | 1,869 | |||||||||
| Goldman Sachs Financial Square Prime Obligations Fund, Institutional Class, 1.99% (c) | 35,372,413 | 35,372 | |||||||||
JPMorgan Prime Money Market Fund, Capital Class, 1.93% (c) | 40,959,951 | 40,960 | |||||||||
| Morgan Stanley Institutional Liquidity Prime Portfolio, Institutional Class, 1.97% (c) | 56,785,008 | 56,785 | |||||||||
Total Collateral for Securities Loaned (Cost $222,937) | 222,937 | ||||||||||
Total Investments (Cost $9,877,372) — 98.5% | 11,456,342 | ||||||||||
Other assets in excess of liabilities — 1.5% | 172,139 | ||||||||||
NET ASSETS — 100.00% | $ | 11,628,481 | |||||||||
^ Purchased with cash collateral from securities on loan.
(a) Non-income producing security.
(b) All or a portion of this security is on loan.
(c) Rate disclosed is the daily yield on October 31, 2019.
ETF — Exchange-Traded Fund
PLC — Public Limited Company
See notes to financial statements.
15
| Victory Portfolios Victory Sycamore Small Company Opportunity Fund | Schedule of Portfolio Investments October 31, 2019 | ||||||
(Amounts in Thousands, Except for Shares)
Security Description | Shares | Value | |||||||||
Common Stocks (95.7%) | |||||||||||
Communication Services (0.9%): | |||||||||||
The E.W. Scripps Co., Class A (a) | 3,850,000 | $ | 51,725 | ||||||||
Consumer Discretionary (13.8%): | |||||||||||
Asbury Automotive Group, Inc. (b) | 533,550 | 55,025 | |||||||||
Boyd Gaming Corp. | 1,066,600 | 29,065 | |||||||||
Choice Hotels International, Inc. (c) | 495,175 | 43,813 | |||||||||
Churchill Downs, Inc. | 157,000 | 20,408 | |||||||||
Core-Mark Holding Co., Inc. | 2,083,350 | 63,584 | |||||||||
Culp, Inc. | 430,870 | 6,666 | |||||||||
Dunkin' Brands Group, Inc. | 471,050 | 37,034 | |||||||||
Helen of Troy Ltd. (b) | 392,975 | 58,852 | |||||||||
Hyatt Hotels Corp., Class A | 348,400 | 26,039 | |||||||||
Murphy USA, Inc. (b) | 401,200 | 47,314 | |||||||||
Oxford Industries, Inc. | 685,550 | 47,207 | |||||||||
Penske Automotive Group, Inc. (c) | 1,396,875 | 68,055 | |||||||||
Steven Madden Ltd. | 1,419,062 | 58,437 | |||||||||
Texas Roadhouse, Inc. | 1,166,525 | 65,910 | |||||||||
Unifi, Inc. (a) (b) | 1,302,900 | 35,569 | |||||||||
Visteon Corp. (b) (c) | 446,000 | 41,487 | |||||||||
Wolverine World Wide, Inc. | 2,409,293 | 71,507 | |||||||||
775,972 | |||||||||||
Consumer Staples (3.2%): | |||||||||||
Casey's General Stores, Inc. | 252,800 | 43,181 | |||||||||
Flowers Foods, Inc. (c) | 2,497,075 | 54,236 | |||||||||
Sanderson Farms, Inc. (c) | 532,975 | 82,510 | |||||||||
179,927 | |||||||||||
Energy (2.1%): | |||||||||||
Delek US Holdings, Inc. | 766,500 | 30,622 | |||||||||
Helix Energy Solutions Group, Inc. (b) (c) | 6,200,000 | 53,258 | |||||||||
SRC Energy, Inc. (b) | 8,962,650 | 27,963 | |||||||||
Unit Corp. (a) (b) | 2,833,564 | 5,781 | |||||||||
117,624 | |||||||||||
Financials (21.1%): | |||||||||||
American Financial Group, Inc. | 354,553 | 36,888 | |||||||||
AMERISAFE, Inc. | 842,350 | 53,514 | |||||||||
Associated Bancorp, Class A | 2,905,234 | 58,424 | |||||||||
Axis Capital Holdings Ltd., Class A | 1,141,575 | 67,843 | |||||||||
Bank of Hawaii Corp. | 970,000 | 84,690 | |||||||||
Columbia Banking System, Inc. | 1,347,500 | 52,957 | |||||||||
Eagle Bancorp, Inc. (c) | 946,050 | 42,705 | |||||||||
FBL Financial Group, Inc., Class A | 650,000 | 37,297 | |||||||||
First American Financial Corp. | 946,600 | 58,481 | |||||||||
Horace Mann Educators Corp. | 1,384,600 | 60,313 | |||||||||
Independent Bank Corp. | 806,721 | 66,216 | |||||||||
Kemper Corp. | 667,300 | 47,966 | |||||||||
Kinsale Capital Group, Inc. | 106,777 | 11,288 | |||||||||
See notes to financial statements.
16
| Victory Portfolios Victory Sycamore Small Company Opportunity Fund | Schedule of Portfolio Investments — continued October 31, 2019 | ||||||
(Amounts in Thousands, Except for Shares)
Security Description | Shares | Value | |||||||||
Lakeland Financial Corp. (c) | 947,150 | $ | 44,090 | ||||||||
Pinnacle Financial Partners, Inc. (c) | 1,370,175 | 80,594 | |||||||||
RenaissanceRe Holdings Ltd. | 240,900 | 45,092 | |||||||||
South State Corp. (c) | 1,047,300 | 82,590 | |||||||||
State Auto Financial Corp. | 1,276,894 | 42,252 | |||||||||
Stewart Information Services (c) | 1,006,800 | 41,198 | |||||||||
The Hanover Insurance Group, Inc. | 144,475 | 19,029 | |||||||||
UMB Financial Corp. (c) | 992,450 | 64,767 | |||||||||
Virtus Investment Partners, Inc. (c) | 220,775 | 23,950 | |||||||||
White Mountains Insurance Group Ltd. | 59,900 | 64,153 | |||||||||
1,186,297 | |||||||||||
Health Care (5.4%): | |||||||||||
AngioDynamics, Inc. (a) (b) | 3,830,925 | 58,613 | |||||||||
Avanos Medical, Inc., Class I (b) | 1,530,125 | 67,387 | |||||||||
Hanger, Inc. (a) (b) (c) | 2,173,650 | 49,146 | |||||||||
ICU Medical, Inc. (b) (c) | 267,600 | 43,247 | |||||||||
Natus Medical, Inc. (b) | 806,800 | 27,173 | |||||||||
NuVasive, Inc. (b) | 809,875 | 57,129 | |||||||||
302,695 | |||||||||||
Industrials (20.7%): | |||||||||||
ABM Industries, Inc. | 1,257,925 | 45,864 | |||||||||
Alamo Group, Inc. (c) | 507,650 | 54,349 | |||||||||
Altra Industrial Motion Corp. | 494,100 | 15,218 | |||||||||
Applied Industrial Technologies, Inc. | 1,199,225 | 71,762 | |||||||||
Astec Industries, Inc. | 149,500 | 5,246 | |||||||||
Carlisle Cos., Inc. | 402,184 | 61,241 | |||||||||
Crane Co. | 915,100 | 70,023 | |||||||||
EMCOR Group, Inc. | 775,925 | 68,056 | |||||||||
Encore Wire Corp. | 866,200 | 48,680 | |||||||||
Forward Air Corp. | 826,602 | 57,176 | |||||||||
FTI Consulting, Inc. (b) | 260,850 | 28,399 | |||||||||
Granite Construction, Inc. | 79,300 | 1,867 | |||||||||
Marten Transport Ltd. | 2,048,000 | 44,360 | |||||||||
Milacron Holdings Corp. (b) | 3,020,500 | 50,503 | |||||||||
Mueller Industries, Inc. | 1,151,975 | 35,446 | |||||||||
MYR Group, Inc. (a) (b) | 1,026,700 | 35,329 | |||||||||
Saia, Inc. (b) | 504,225 | 44,977 | |||||||||
TriMas Corp. (b) | 1,801,150 | 58,213 | |||||||||
UniFirst Corp. | 355,225 | 71,342 | |||||||||
Universal Forest Products, Inc. (c) | 1,350,850 | 68,029 | |||||||||
US Ecology, Inc. (c) | 620,000 | 38,583 | |||||||||
Viad Corp. (c) | 793,650 | 48,428 | |||||||||
Watts Water Technologies, Inc., Class A | 726,400 | 67,737 | |||||||||
Werner Enterprises, Inc. | 1,953,600 | 71,306 | |||||||||
1,162,134 | |||||||||||
Information Technology (12.3%): | |||||||||||
ADTRAN, Inc. (a) | 2,697,400 | 23,764 | |||||||||
Advanced Energy Industries, Inc. (b) (c) | 1,058,550 | 62,560 | |||||||||
See notes to financial statements.
17
| Victory Portfolios Victory Sycamore Small Company Opportunity Fund | Schedule of Portfolio Investments — continued October 31, 2019 | ||||||
(Amounts in Thousands, Except for Shares)
Security Description | Shares | Value | |||||||||
Anixter International, Inc. (b) | 1,152,650 | $ | 95,382 | ||||||||
Littelfuse, Inc. | 311,200 | 54,637 | |||||||||
LogMeIn, Inc. | 821,625 | 53,964 | |||||||||
ManTech International Corp., Class A | 744,800 | 58,973 | |||||||||
MAXIMUS, Inc. | 743,975 | 57,093 | |||||||||
MicroStrategy, Inc. (b) | 354,900 | 54,389 | |||||||||
MKS Instruments, Inc. | 667,000 | 72,183 | |||||||||
NETGEAR, Inc. (b) (c) | 1,542,700 | 41,915 | |||||||||
Plexus Corp. (b) (c) | 292,400 | 21,620 | |||||||||
ScanSource, Inc. (b) | 1,186,000 | 38,308 | |||||||||
Sykes Enterprises, Inc. (b) | 1,912,925 | 59,100 | |||||||||
693,888 | |||||||||||
Materials (7.6%): | |||||||||||
Cabot Corp. | 778,333 | 33,928 | |||||||||
Kaiser Aluminum Corp. | 449,525 | 48,135 | |||||||||
Minerals Technologies, Inc. (c) | 1,188,825 | 58,786 | |||||||||
Orion Engineered Carbons SA | 2,877,650 | 47,654 | |||||||||
PolyOne Corp. | 1,719,550 | 55,112 | |||||||||
Silgan Holdings, Inc. | 1,166,000 | 35,878 | |||||||||
Sonoco Products Co. | 993,050 | 57,299 | |||||||||
Valvoline, Inc. | 1,585,000 | 33,824 | |||||||||
Worthington Industries, Inc. | 1,548,900 | 57,015 | |||||||||
427,631 | |||||||||||
Real Estate (5.6%): | |||||||||||
American Assets Trust, Inc. | 841,425 | 41,196 | |||||||||
Healthcare Realty Trust, Inc. | 2,057,175 | 71,528 | |||||||||
LTC Properties, Inc. | 621,575 | 32,229 | |||||||||
Rayonier, Inc. | 2,230,100 | 60,168 | |||||||||
Urstadt Biddle Properties, Inc., Class A | 781,925 | 19,024 | |||||||||
Washington Real Estate Investment Trust (c) | 2,861,425 | 88,762 | |||||||||
312,907 | |||||||||||
Utilities (3.0%): | |||||||||||
ALLETE, Inc. | 560,400 | 48,229 | |||||||||
MGE Energy, Inc. | 528,300 | 40,700 | |||||||||
NorthWestern Corp. | 613,050 | 44,458 | |||||||||
ONE Gas, Inc. (c) | 393,100 | 36,495 | |||||||||
169,882 | |||||||||||
Total Common Stocks (Cost $4,608,158) | 5,380,682 | ||||||||||
Exchange-Traded Funds (1.3%) | |||||||||||
iShares Russell 2000 Value Index Fund ETF (c) | 576,000 | 70,497 | |||||||||
Total Exchange-Traded Funds (Cost $66,331) | 70,497 | ||||||||||
See notes to financial statements.
18
| Victory Portfolios Victory Sycamore Small Company Opportunity Fund | Schedule of Portfolio Investments — continued October 31, 2019 | ||||||
(Amounts in Thousands, Except for Shares)
Security Description | Shares | Value | |||||||||
Collateral for Securities Loaned^ (1.8%) | |||||||||||
BlackRock Liquidity Funds TempFund, Institutional Class, 1.92% (d) | 11,967,174 | $ | 11,967 | ||||||||
| Fidelity Investments Money Market Government Portfolio, Institutional Class, 1.75% (d) | 28,399,561 | 28,399 | |||||||||
| Fidelity Investments Money Market Prime Money Market Portfolio, Institutional Class, 1.87% (d) | 857,626 | 858 | |||||||||
| Goldman Sachs Financial Square Prime Obligations Fund, Institutional Class, 1.99% (d) | 16,234,849 | 16,235 | |||||||||
JPMorgan Prime Money Market Fund, Capital Class, 1.93% (d) | 18,799,357 | 18,799 | |||||||||
| Morgan Stanley Institutional Liquidity Prime Portfolio, Institutional Class, 1.97% (d) | 26,062,571 | 26,063 | |||||||||
Total Collateral for Securities Loaned (Cost $102,321) | 102,321 | ||||||||||
Total Investments (Cost $4,776,810) — 98.8% | 5,553,500 | ||||||||||
Other assets in excess of liabilities — 1.2% | 69,220 | ||||||||||
NET ASSETS — 100.00% | $ | 5,622,720 | |||||||||
^ Purchased with cash collateral from securities on loan.
(a) Affiliated security (See Note 8).
(b) Non-income producing security.
(c) All or a portion of this security is on loan.
(d) Rate disclosed is the daily yield on October 31, 2019.
ETF — Exchange-Traded Fund
See notes to financial statements.
19
Victory Portfolios | Statements of Assets and Liabilities October 31, 2019 | ||||||
(Amounts in Thousands, Except Per Share Amounts)
| Victory Sycamore Established Value Fund | Victory Sycamore Small Company Opportunity Fund | ||||||||||
ASSETS: | |||||||||||
Affiliated investments, at value (Cost $— and $348,909) | $ | — | $ | 259,927 | |||||||
Unaffiliated investments, at value (Cost $9,877,372 and $4,427,901) | 11,456,342 | (a) | 5,293,573 | (b) | |||||||
Cash and cash equivalents | 405,936 | 205,257 | |||||||||
Interest and dividends receivable | 6,578 | 2,025 | |||||||||
Receivable from affiliate on interfund lending | 4,081 | — | |||||||||
Receivable for capital shares issued | 9,770 | 5,004 | |||||||||
Receivable for investments sold | 115,529 | 41,017 | |||||||||
Receivable from Adviser | — | (c) | — | ||||||||
Prepaid expenses | 68 | 34 | |||||||||
Total Assets | 11,998,304 | 5,806,837 | |||||||||
LIABILITIES: | |||||||||||
Payables: | |||||||||||
Collateral received on loaned securities | 222,937 | 102,321 | |||||||||
Investments purchased | 119,288 | 71,562 | |||||||||
Capital shares redeemed | 20,667 | 5,484 | |||||||||
Accrued expenses and other payables: | |||||||||||
Investment advisory fees | 4,378 | 3,541 | |||||||||
Administration fees | 549 | 266 | |||||||||
Custodian fees | 80 | 39 | |||||||||
Transfer agent fees | 956 | 467 | |||||||||
Chief Compliance Officer fees | 8 | 4 | |||||||||
Trustees' fees | 28 | 17 | |||||||||
| 12b-1 fees | 412 | 110 | |||||||||
Other accrued expenses | 520 | 306 | |||||||||
Total Liabilities | 369,823 | 184,117 | |||||||||
NET ASSETS: | |||||||||||
Capital | 9,499,038 | 4,570,836 | |||||||||
Total distributable earnings/(loss) | 2,129,443 | 1,051,884 | |||||||||
Net Assets | $ | 11,628,481 | $ | 5,622,720 | |||||||
Net Assets | |||||||||||
Class A Shares | $ | 1,802,034 | $ | 451,310 | |||||||
Class C Shares | 79,066 | — | |||||||||
Class I Shares | 3,501,630 | 4,584,086 | |||||||||
Class R Shares | 823,796 | 279,090 | |||||||||
Class R6 Shares | 4,762,844 | 277,218 | |||||||||
Class Y Shares | 659,111 | 31,016 | |||||||||
Total | $ | 11,628,481 | $ | 5,622,720 | |||||||
| Shares (unlimited number of shares authorized with a par value of $0.001 per share): | |||||||||||
Class A Shares | 44,953 | 9,994 | |||||||||
Class C Shares | 2,019 | — | |||||||||
Class I Shares | 87,291 | 100,286 | |||||||||
Class R Shares | 20,837 | 6,636 | |||||||||
Class R6 Shares | 118,692 | 6,071 | |||||||||
Class Y Shares | 16,433 | 683 | |||||||||
Total | 290,225 | 123,670 | |||||||||
(continues on next page)
See notes to financial statements.
20
Victory Portfolios | Statements of Assets and Liabilities October 31, 2019 | ||||||
(Amounts in Thousands, Except Per Share Amounts) (continued)
| Victory Sycamore Established Value Fund | Victory Sycamore Small Company Opportunity Fund | ||||||||||
| Net asset value, offering (except Class A Shares) and redemption price per share: (d) | |||||||||||
Class A Shares | $ | 40.09 | $ | 45.16 | |||||||
Class C Shares (e) | 39.16 | — | |||||||||
Class I Shares | 40.12 | 45.71 | |||||||||
Class R Shares | 39.54 | 42.05 | |||||||||
Class R6 Shares | 40.13 | 45.66 | |||||||||
Class Y Shares | 40.11 | 45.39 | |||||||||
Maximum Sales Charge — Class A Shares | 5.75 | % | 5.75 | % | |||||||
| Maximum offering price (100%/(100%-maximum sales charge) of net asset value adjusted to the nearest cent) per share — Class A Shares | $ | 42.54 | $ | 47.92 | |||||||
(a) Includes $215,583 of securities on loan.
(b) Includes $98,660 of securities on loan.
(c) Rounds to less than $1.
(d) Per share amount may not recalculate due to rounding of net assets and/or shares outstanding.
(e) Redemption price per share varies by the length of time shares are held.
See notes to financial statements.
21
Victory Portfolios | Statements of Operations For the Year Ended October 31, 2019 | ||||||
(Amounts in Thousands, Except Per Share Amounts)
| Victory Sycamore Established Value Fund | Victory Sycamore Small Company Opportunity Fund | ||||||||||
Investment Income: | |||||||||||
Interest from non-affiliates | $ | 4,253 | $ | 2,526 | |||||||
Dividends from affiliates | — | 1,399 | |||||||||
Dividends from non-affiliates | 210,039 | 87,878 | |||||||||
Interfund lending income | 47 | — | |||||||||
Securities lending (net of fees) | 273 | 306 | |||||||||
Foreign tax withholding | — | (331 | ) | ||||||||
Total Income | 214,612 | 91,778 | |||||||||
Expenses: | |||||||||||
Investment advisory fees | 49,355 | 39,868 | |||||||||
Administration fees | 6,716 | 3,237 | |||||||||
12b-1 fees — Class A Shares | 4,673 | 1,156 | |||||||||
12b-1 fees — Class C Shares | 820 | — | |||||||||
12b-1 fees — Class R Shares | 4,224 | 1,394 | |||||||||
Custodian fees | 467 | 231 | |||||||||
Transfer agent fees — Class A Shares | 2,375 | 696 | |||||||||
Transfer agent fees — Class C Shares | 100 | — | |||||||||
Transfer agent fees — Class I Shares | 2,057 | 2,829 | |||||||||
Transfer agent fees — Class R Shares | 799 | 255 | |||||||||
Transfer agent fees — Class R6 Shares | 1,188 | 3 | |||||||||
Transfer agent fees — Class Y Shares | 467 | 52 | |||||||||
Trustees' fees | 912 | 443 | |||||||||
Chief Compliance Officer fees | 87 | 42 | |||||||||
Legal and audit fees | 547 | 267 | |||||||||
State registration and filing fees | 317 | 171 | |||||||||
Other expenses | 1,161 | 715 | |||||||||
Total Expenses | 76,265 | 51,359 | |||||||||
Net Investment Income (Loss) | 138,347 | 40,419 | |||||||||
Realized/Unrealized Gains (Losses) from Investment Transactions: | |||||||||||
Net realized gains (losses) from affiliated investment transactions | — | (11,955 | ) | ||||||||
| Net realized gains (losses) from unaffiliated investment transactions | 553,734 | 267,766 | |||||||||
| Net change in unrealized appreciation/depreciation on affiliated investments | — | (72,017 | ) | ||||||||
| Net change in unrealized appreciation/depreciation on unaffiliated investments | 547,492 | 390,625 | |||||||||
Net realized/unrealized gains (losses) on investments | 1,101,226 | 574,419 | |||||||||
Change in net assets resulting from operations | $ | 1,239,573 | $ | 614,838 | |||||||
See notes to financial statements.
22
Victory Portfolios | Statements of Changes in Net Assets | ||||||
(Amounts in Thousands)
| Victory Sycamore Established Value Fund | Victory Sycamore Small Company Opportunity Fund | ||||||||||||||||||
| Year Ended October 31, 2019 | Year Ended October 31, 2018 | Year Ended October 31, 2019 | Year Ended October 31, 2018 | ||||||||||||||||
From Investment Activities: | |||||||||||||||||||
Operations: | |||||||||||||||||||
Net investment income (loss) | $ | 138,347 | $ | 115,445 | $ | 40,419 | $ | 36,531 | |||||||||||
| Net realized gains (losses) from affiliated and unaffiliated investment transactions | 553,734 | 836,605 | 255,811 | 564,832 | |||||||||||||||
| Net change in unrealized appreciation (depreciation) on affiliated and unaffiliated investments | 547,492 | (717,844 | ) | 318,608 | (586,086 | ) | |||||||||||||
| Change in net assets resulting from operations | 1,239,573 | 234,206 | 614,838 | 15,277 | |||||||||||||||
Distributions to Shareholders: | |||||||||||||||||||
Class A Shares | (169,100 | ) | (75,454 | ) | (53,953 | ) | (30,027 | ) | |||||||||||
Class C Shares | (7,200 | ) | (2,641 | ) | — | — | |||||||||||||
Class I Shares | (316,124 | ) | (186,691 | ) | (475,137 | ) | (216,065 | ) | |||||||||||
Class R Shares | (76,258 | ) | (31,232 | ) | (33,313 | ) | (17,144 | ) | |||||||||||
Class R6 Shares | (354,635 | ) | (59,772 | ) | (23,009 | ) | (4,823 | ) | |||||||||||
Class Y Shares | (43,476 | ) | (15,681 | ) | (3,713 | ) | (1,762 | ) | |||||||||||
| Change in net assets resulting from distributions to shareholders | (966,793 | ) | (371,471 | ) | (589,125 | ) | (269,821 | ) | |||||||||||
| Change in net assets resulting from capital transactions | 580,139 | 354,771 | 468,542 | 321,072 | |||||||||||||||
Change in net assets | 852,919 | 217,506 | 494,255 | 66,528 | |||||||||||||||
Net Assets: | |||||||||||||||||||
Beginning of period | 10,775,562 | 10,558,056 | 5,128,465 | 5,061,937 | |||||||||||||||
End of period | $ | 11,628,481 | $ | 10,775,562 | $ | 5,622,720 | $ | 5,128,465 | |||||||||||
(continues on next page)
See notes to financial statements.
23
Victory Portfolios | Statements of Changes in Net Assets | ||||||
(Amounts in Thousands) (continued)
| Victory Sycamore Established Value Fund | Victory Sycamore Small Company Opportunity Fund | ||||||||||||||||||
| Year Ended October 31, 2019 | Year Ended October 31, 2018 | Year Ended October 31, 2019 | Year Ended October 31, 2018 | ||||||||||||||||
Capital Transactions: | |||||||||||||||||||
Class A Shares | |||||||||||||||||||
Proceeds from shares issued | $ | 354,106 | $ | 391,843 | $ | 96,031 | $ | 118,885 | |||||||||||
Distributions reinvested | 140,929 | 62,087 | 45,327 | 24,644 | |||||||||||||||
Cost of shares redeemed | (739,328 | ) | (815,800 | ) | (174,978 | ) | (236,724 | ) | |||||||||||
Total Class A Shares | $ | (244,293 | ) | $ | (361,870 | ) | $ | (33,620 | ) | $ | (93,195 | ) | |||||||
Class C Shares | |||||||||||||||||||
Proceeds from shares issued | $ | 3,767 | $ | 7,132 | $ | — | $ | — | |||||||||||
Distributions reinvested | 6,686 | 2,424 | — | — | |||||||||||||||
Cost of shares redeemed | (22,418 | ) | (20,048 | ) | — | — | |||||||||||||
Total Class C Shares | $ | (11,965 | ) | $ | (10,492 | ) | $ | — | $ | — | |||||||||
Class I Shares | |||||||||||||||||||
Proceeds from shares issued | $ | 880,254 | $ | 1,395,898 | $ | 911,034 | $ | 993,338 | |||||||||||
Distributions reinvested | 273,354 | 169,868 | 434,644 | 200,613 | |||||||||||||||
Cost of shares redeemed | (1,206,721 | ) | (3,383,407 | ) | (913,187 | ) | (866,339 | ) | |||||||||||
Total Class I Shares | $ | (53,113 | ) | $ | (1,817,641 | ) | $ | 432,491 | $ | 327,612 | |||||||||
Class R Shares | |||||||||||||||||||
Proceeds from shares issued | $ | 119,414 | $ | 153,972 | $ | 40,972 | $ | 37,214 | |||||||||||
Distributions reinvested | 73,094 | 29,591 | 31,790 | 16,163 | |||||||||||||||
Cost of shares redeemed | (279,535 | ) | (284,445 | ) | (77,878 | ) | (85,267 | ) | |||||||||||
Total Class R Shares | $ | (87,027 | ) | $ | (100,882 | ) | $ | (5,116 | ) | $ | (31,890 | ) | |||||||
Class R6 Shares | |||||||||||||||||||
Proceeds from shares issued | $ | 1,274,143 | $ | 3,025,909 | $ | 102,798 | $ | 147,778 | |||||||||||
Distributions reinvested | 345,033 | 58,065 | 22,339 | 4,823 | |||||||||||||||
Cost of shares redeemed | (829,351 | ) | (404,289 | ) | (49,049 | ) | (32,850 | ) | |||||||||||
Total Class R6 Shares | $ | 789,825 | $ | 2,679,685 | $ | 76,088 | $ | 119,751 | |||||||||||
Class Y Shares | |||||||||||||||||||
Proceeds from shares issued | $ | 333,916 | $ | 229,752 | $ | 7,131 | $ | 4,999 | |||||||||||
Distributions reinvested | 37,685 | 13,058 | 1,272 | 517 | |||||||||||||||
Cost of shares redeemed | (184,889 | ) | (276,839 | ) | (9,704 | ) | (6,722 | ) | |||||||||||
Total Class Y Shares | $ | 186,712 | $ | (34,029 | ) | $ | (1,301 | ) | $ | (1,206 | ) | ||||||||
| Change in net assets resulting from capital transactions | $ | 580,139 | $ | 354,771 | $ | 468,542 | $ | 321,072 | |||||||||||
(continues on next page)
See notes to financial statements.
24
Victory Portfolios | Statements of Changes in Net Assets | ||||||
(Amounts in Thousands) (continued)
| Victory Sycamore Established Value Fund | Victory Sycamore Small Company Opportunity Fund | ||||||||||||||||||
| Year Ended October 31, 2019 | Year Ended October 31, 2018 | Year Ended October 31, 2019 | Year Ended October 31, 2018 | ||||||||||||||||
Share Transactions: | |||||||||||||||||||
Class A Shares | |||||||||||||||||||
Issued | 9,514 | 9,528 | 2,275 | 2,480 | |||||||||||||||
Reinvested | 4,199 | 1,524 | 1,215 | 524 | |||||||||||||||
Redeemed | (19,577 | ) | (19,865 | ) | (4,096 | ) | (4,924 | ) | |||||||||||
Total Class A Shares | (5,864 | ) | (8,813 | ) | (606 | ) | (1,920 | ) | |||||||||||
Class C Shares | |||||||||||||||||||
Issued | 105 | 178 | — | — | |||||||||||||||
Reinvested | 206 | 61 | — | — | |||||||||||||||
Redeemed | (621 | ) | (498 | ) | — | — | |||||||||||||
Total Class C Shares | (310 | ) | (259 | ) | — | — | |||||||||||||
Class I Shares | |||||||||||||||||||
Issued | 23,417 | 33,958 | 21,227 | 20,357 | |||||||||||||||
Reinvested | 8,111 | 4,167 | 11,502 | 4,219 | |||||||||||||||
Redeemed | (32,973 | ) | (80,850 | ) | (21,333 | ) | (17,803 | ) | |||||||||||
Total Class I Shares | (1,445 | ) | (42,725 | ) | 11,396 | 6,773 | |||||||||||||
Class R Shares | |||||||||||||||||||
Issued | 3,186 | 3,819 | 1,036 | 819 | |||||||||||||||
Reinvested | 2,212 | 736 | 915 | 366 | |||||||||||||||
Redeemed | (7,552 | ) | (6,994 | ) | (1,957 | ) | (1,887 | ) | |||||||||||
Total Class R Shares | (2,154 | ) | (2,439 | ) | (6 | ) | (702 | ) | |||||||||||
Class R6 Shares | |||||||||||||||||||
Issued | 33,711 | 72,178 | 2,402 | 3,032 | |||||||||||||||
Reinvested | 10,212 | 1,413 | 592 | 102 | |||||||||||||||
Redeemed | (21,871 | ) | (9,777 | ) | (1,136 | ) | (673 | ) | |||||||||||
Total Class R6 Shares | 22,052 | 63,814 | 1,858 | 2,461 | |||||||||||||||
Class Y Shares | |||||||||||||||||||
Issued | 8,883 | 5,577 | 172 | 103 | |||||||||||||||
Reinvested | 1,114 | 320 | 34 | 11 | |||||||||||||||
Redeemed | (4,909 | ) | (6,717 | ) | (230 | ) | (140 | ) | |||||||||||
Total Class Y Shares | 5,088 | (820 | ) | (24 | ) | (26 | ) | ||||||||||||
Change in Shares | 17,367 | 8,758 | 12,618 | 6,586 | |||||||||||||||
See notes to financial statements.
25
Victory Portfolios | Financial Highlights | ||||||
For a Share Outstanding Throughout Each Period
Investment Activities | Distributions to Shareholders From | ||||||||||||||||||||||||||
| Net Asset Value, Beginning of Period | Net Investment Income (Loss) | Net Realized and Unrealized Gains (Losses) on Investments | Total from Investment Activities | Net Investment Income | Net Realized Gains from Investments | ||||||||||||||||||||||
Victory Sycamore Established Value Fund | |||||||||||||||||||||||||||
Class A | |||||||||||||||||||||||||||
Year Ended 10/31/19 | $ | 39.52 | 0.40 | (b) | 3.61 | 4.01 | (0.39 | ) | (3.05 | ) | |||||||||||||||||
Year Ended 10/31/18 | $ | 40.01 | 0.35 | (b) | 0.48 | 0.83 | (0.33 | ) | (0.99 | ) | |||||||||||||||||
Year Ended 10/31/17 | $ | 33.82 | 0.22 | (b) | 6.53 | 6.75 | (0.21 | ) | (0.35 | ) | |||||||||||||||||
Year Ended 10/31/16 | $ | 35.55 | 0.23 | (b) | 1.50 | 1.73 | (0.22 | ) | (3.24 | ) | |||||||||||||||||
Year Ended 10/31/15 | $ | 37.01 | 0.44 | 3.07 | 3.51 | (0.41 | ) | (4.56 | ) | ||||||||||||||||||
Class C | |||||||||||||||||||||||||||
Year Ended 10/31/19 | $ | 38.69 | 0.11 | (b) | 3.53 | 3.64 | (0.12 | ) | (3.05 | ) | |||||||||||||||||
Year Ended 10/31/18 | $ | 39.22 | 0.03 | (b) | 0.46 | 0.49 | (0.03 | ) | (0.99 | ) | |||||||||||||||||
Year Ended 10/31/17 | $ | 33.26 | (0.09 | )(b) | 6.44 | 6.35 | (0.04 | ) | (0.35 | ) | |||||||||||||||||
| 3/1/16(c) through 10/31/16 | $ | 29.08 | (0.09 | ) | 4.37 | 4.28 | (0.10 | ) | — | ||||||||||||||||||
Class I | |||||||||||||||||||||||||||
Year Ended 10/31/19 | $ | 39.55 | 0.52 | (b) | 3.62 | 4.14 | (0.52 | ) | (3.05 | ) | |||||||||||||||||
Year Ended 10/31/18 | $ | 40.04 | 0.47 | (b) | 0.48 | 0.95 | (0.45 | ) | (0.99 | ) | |||||||||||||||||
Year Ended 10/31/17 | $ | 33.83 | 0.32 | (b) | 6.56 | 6.88 | (0.32 | ) | (0.35 | ) | |||||||||||||||||
Year Ended 10/31/16 | $ | 35.56 | 0.30 | (b) | 1.52 | 1.82 | (0.31 | ) | (3.24 | ) | |||||||||||||||||
Year Ended 10/31/15 | $ | 37.01 | 0.56 | 3.08 | 3.64 | (0.53 | ) | (4.56 | ) | ||||||||||||||||||
Class R | |||||||||||||||||||||||||||
Year Ended 10/31/19 | $ | 39.03 | 0.31 | (b) | 3.57 | 3.88 | (0.32 | ) | (3.05 | ) | |||||||||||||||||
Year Ended 10/31/18 | $ | 39.54 | 0.26 | (b) | 0.48 | 0.74 | (0.26 | ) | (0.99 | ) | |||||||||||||||||
Year Ended 10/31/17 | $ | 33.43 | 0.14 | (b) | 6.46 | 6.60 | (0.14 | ) | (0.35 | ) | |||||||||||||||||
Year Ended 10/31/16 | $ | 35.18 | 0.17 | (b) | 1.48 | 1.65 | (0.16 | ) | (3.24 | ) | |||||||||||||||||
Year Ended 10/31/15 | $ | 36.67 | 0.38 | 3.04 | 3.42 | (0.35 | ) | (4.56 | ) | ||||||||||||||||||
Class R6 | |||||||||||||||||||||||||||
Year Ended 10/31/19 | $ | 39.55 | 0.52 | (b) | 3.63 | 4.15 | (0.52 | ) | (3.05 | ) | |||||||||||||||||
Year Ended 10/31/18 | $ | 40.05 | 0.49 | (b) | 0.48 | 0.97 | (0.48 | ) | (0.99 | ) | |||||||||||||||||
Year Ended 10/31/17 | $ | 33.85 | 0.35 | (b) | 6.54 | 6.89 | (0.34 | ) | (0.35 | ) | |||||||||||||||||
Year Ended 10/31/16 | $ | 35.56 | 0.31 | (b) | 1.55 | 1.86 | (0.33 | ) | (3.24 | ) | |||||||||||||||||
Year Ended 10/31/15 | $ | 37.02 | 0.55 | 3.08 | 3.63 | (0.53 | ) | (4.56 | ) | ||||||||||||||||||
Class Y | |||||||||||||||||||||||||||
Year Ended 10/31/19 | $ | 39.54 | 0.50 | (b) | 3.63 | 4.13 | (0.51 | ) | (3.05 | ) | |||||||||||||||||
Year Ended 10/31/18 | $ | 40.04 | 0.46 | (b) | 0.48 | 0.94 | (0.45 | ) | (0.99 | ) | |||||||||||||||||
Year Ended 10/31/17 | $ | 33.83 | 0.31 | (b) | 6.57 | 6.88 | (0.32 | ) | (0.35 | ) | |||||||||||||||||
Year Ended 10/31/16 | $ | 35.56 | 0.28 | (b) | 1.53 | 1.81 | (0.30 | ) | (3.24 | ) | |||||||||||||||||
Year Ended 10/31/15 | $ | 37.02 | 0.49 | 3.08 | 3.57 | (0.47 | ) | (4.56 | ) | ||||||||||||||||||
(a) Portfolio turnover is calculated on the basis of the Fund as a whole without distinguishing between the classes of shares issued.
(b) Per share net investment income (loss) has been calculated using the average daily shares method.
(c) Commencement of operations.
See notes to financial statements.
26
Victory Portfolios | Financial Highlights — continued | ||||||
For a Share Outstanding Throughout Each Period
Ratios to Average Net Assets | Supplemental Data | ||||||||||||||||||||||||||||||||||
| Total Distributions | Net Asset Value, End of Period | Total Return (Excludes Sales Charge) | Net Expenses | Net Investment Income (Loss) | Gross Expenses | Net Assets, End of Period (000's) | Portfolio Turnover(a) | ||||||||||||||||||||||||||||
Victory Sycamore Established Value Fund | |||||||||||||||||||||||||||||||||||
Class A | |||||||||||||||||||||||||||||||||||
Year Ended 10/31/19 | (3.44 | ) | $ | 40.09 | 11.96 | % | 0.92 | % | 1.06 | % | 0.92 | % | $ | 1,802,034 | 34 | % | |||||||||||||||||||
Year Ended 10/31/18 | (1.32 | ) | $ | 39.52 | 2.01 | % | 0.89 | % | 0.85 | % | 0.89 | % | $ | 2,008,143 | 36 | % | |||||||||||||||||||
Year Ended 10/31/17 | (0.56 | ) | $ | 40.01 | 20.12 | % | 0.90 | % | 0.58 | % | 0.90 | % | $ | 2,386,049 | 32 | % | |||||||||||||||||||
Year Ended 10/31/16 | (3.46 | ) | $ | 33.82 | 5.80 | % | 0.95 | % | 0.69 | % | 0.95 | % | $ | 1,735,974 | 40 | % | |||||||||||||||||||
Year Ended 10/31/15 | (4.97 | ) | $ | 35.55 | 10.08 | % | 0.99 | % | 1.21 | % | 0.99 | % | $ | 1,076,956 | 58 | % | |||||||||||||||||||
Class C | |||||||||||||||||||||||||||||||||||
Year Ended 10/31/19 | (3.17 | ) | $ | 39.16 | 11.10 | % | 1.68 | % | 0.30 | % | 1.68 | % | $ | 79,066 | 34 | % | |||||||||||||||||||
Year Ended 10/31/18 | (1.02 | ) | $ | 38.69 | 1.19 | % | 1.68 | % | 0.07 | % | 1.68 | % | $ | 90,128 | 36 | % | |||||||||||||||||||
Year Ended 10/31/17 | (0.39 | ) | $ | 39.22 | 19.20 | % | 1.70 | % | (0.24 | )% | 1.70 | % | $ | 101,506 | 32 | % | |||||||||||||||||||
| 3/1/16(c) through 10/31/16 | (0.10 | ) | $ | 33.26 | 14.75 | %(d) | 1.80 | %(e) | (0.40 | )%(e) | 1.80 | %(e) | $ | 25,146 | 40 | %(d) | |||||||||||||||||||
Class I | |||||||||||||||||||||||||||||||||||
Year Ended 10/31/19 | (3.57 | ) | $ | 40.12 | 12.31 | % | 0.60 | % | 1.37 | % | 0.60 | % | $ | 3,501,630 | 34 | % | |||||||||||||||||||
Year Ended 10/31/18 | (1.44 | ) | $ | 39.55 | 2.30 | % | 0.59 | % | 1.14 | % | 0.59 | % | $ | 3,509,093 | 36 | % | |||||||||||||||||||
Year Ended 10/31/17 | (0.67 | ) | $ | 40.04 | 20.50 | % | 0.62 | % | 0.85 | % | 0.62 | % | $ | 5,263,053 | 32 | % | |||||||||||||||||||
Year Ended 10/31/16 | (3.55 | ) | $ | 33.83 | 6.08 | % | 0.69 | % | 0.91 | % | 0.69 | % | $ | 2,590,122 | 40 | % | |||||||||||||||||||
Year Ended 10/31/15 | (5.09 | ) | $ | 35.56 | 10.51 | % | 0.63 | % | 1.55 | % | 0.63 | % | $ | 761,549 | 58 | % | |||||||||||||||||||
Class R | |||||||||||||||||||||||||||||||||||
Year Ended 10/31/19 | (3.37 | ) | $ | 39.54 | 11.72 | % | 1.13 | % | 0.84 | % | 1.13 | % | $ | 823,796 | 34 | % | |||||||||||||||||||
Year Ended 10/31/18 | (1.25 | ) | $ | 39.03 | 1.80 | % | 1.10 | % | 0.65 | % | 1.10 | % | $ | 897,277 | 36 | % | |||||||||||||||||||
Year Ended 10/31/17 | (0.49 | ) | $ | 39.54 | 19.89 | % | 1.10 | % | 0.38 | % | 1.10 | % | $ | 1,005,561 | 32 | % | |||||||||||||||||||
Year Ended 10/31/16 | (3.40 | ) | $ | 33.43 | 5.60 | % | 1.13 | % | 0.54 | % | 1.13 | % | $ | 784,442 | 40 | % | |||||||||||||||||||
Year Ended 10/31/15 | (4.91 | ) | $ | 35.18 | 9.91 | % | 1.16 | % | 1.05 | % | 1.16 | % | $ | 705,436 | 58 | % | |||||||||||||||||||
Class R6 | |||||||||||||||||||||||||||||||||||
Year Ended 10/31/19 | (3.57 | ) | $ | 40.13 | 12.35 | % | 0.58 | % | 1.38 | % | 0.58 | % | $ | 4,762,844 | 34 | % | |||||||||||||||||||
Year Ended 10/31/18 | (1.47 | ) | $ | 39.55 | 2.34 | % | 0.57 | % | 1.19 | % | 0.57 | % | $ | 3,822,378 | 36 | % | |||||||||||||||||||
Year Ended 10/31/17 | (0.69 | ) | $ | 40.05 | 20.54 | % | 0.54 | % | 0.91 | % | 0.54 | % | $ | 1,314,843 | 32 | % | |||||||||||||||||||
Year Ended 10/31/16 | (3.57 | ) | $ | 33.85 | 6.20 | % | 0.59 | % | 0.93 | % | 0.59 | % | $ | 458,750 | 40 | % | |||||||||||||||||||
Year Ended 10/31/15 | (5.09 | ) | $ | 35.56 | 10.48 | % | 0.63 | % | 1.47 | % | 0.65 | %(f) | $ | 52,450 | 58 | % | |||||||||||||||||||
Class Y | |||||||||||||||||||||||||||||||||||
Year Ended 10/31/19 | (3.56 | ) | $ | 40.11 | 12.28 | % | 0.63 | % | 1.32 | % | 0.63 | % | $ | 659,111 | 34 | % | |||||||||||||||||||
Year Ended 10/31/18 | (1.44 | ) | $ | 39.54 | 2.27 | % | 0.62 | % | 1.13 | % | 0.62 | % | $ | 448,543 | 36 | % | |||||||||||||||||||
Year Ended 10/31/17 | (0.67 | ) | $ | 40.04 | 20.51 | % | 0.60 | % | 0.81 | % | 0.60 | % | $ | 487,044 | 32 | % | |||||||||||||||||||
Year Ended 10/31/16 | (3.54 | ) | $ | 33.83 | 6.03 | % | 0.72 | % | 0.85 | % | 0.72 | % | $ | 50,765 | 40 | % | |||||||||||||||||||
Year Ended 10/31/15 | (5.03 | ) | $ | 35.56 | 10.27 | % | 0.83 | % | 1.36 | % | 0.94 | %(f) | $ | 10,200 | 58 | % | |||||||||||||||||||
(d) Not annualized for periods less than one year.
(e) Annualized for periods less than one year.
(f) During the period, certain fees were reduced and/or reimbursed. If such fee reductions and/or reimbursements had not occurred, the ratios would have been as indicated.
See notes to financial statements.
27
Victory Portfolios | Financial Highlights | ||||||
For a Share Outstanding Throughout Each Period
Investment Activities | Distributions to Shareholders From | ||||||||||||||||||||||||||
| Net Asset Value, Beginning of Period | Net Investment Income (Loss) | Net Realized and Unrealized Gains (Losses) on Investments | Total from Investment Activities | Net Investment Income | Net Realized Gains from Investments | ||||||||||||||||||||||
Victory Sycamore Small Company Opportunity Fund | |||||||||||||||||||||||||||
Class A | |||||||||||||||||||||||||||
Year Ended 10/31/19 | $ | 45.91 | 0.22 | (b) | 4.22 | 4.44 | (0.10 | ) | (5.09 | ) | |||||||||||||||||
Year Ended 10/31/18 | $ | 48.23 | 0.22 | (b) | (0.09 | ) | 0.13 | (0.21 | ) | (2.24 | ) | ||||||||||||||||
Year Ended 10/31/17 | $ | 39.74 | 0.11 | (b) | 10.44 | 10.55 | (0.12 | ) | (1.94 | ) | |||||||||||||||||
Year Ended 10/31/16 | $ | 40.01 | 0.10 | (b) | 3.05 | 3.15 | (0.05 | ) | (3.37 | ) | |||||||||||||||||
Year Ended 10/31/15 | $ | 42.01 | 0.03 | 1.60 | 1.63 | — | (3.63 | ) | |||||||||||||||||||
Class I | |||||||||||||||||||||||||||
Year Ended 10/31/19 | $ | 46.43 | 0.35 | (b) | 4.28 | 4.63 | (0.26 | ) | (5.09 | ) | |||||||||||||||||
Year Ended 10/31/18 | $ | 48.75 | 0.37 | (b) | (0.09 | ) | 0.28 | (0.36 | ) | (2.24 | ) | ||||||||||||||||
Year Ended 10/31/17 | $ | 40.12 | 0.25 | (b) | 10.55 | 10.80 | (0.23 | ) | (1.94 | ) | |||||||||||||||||
Year Ended 10/31/16 | $ | 40.37 | 0.21 | (b) | 3.08 | 3.29 | (0.17 | ) | (3.37 | ) | |||||||||||||||||
Year Ended 10/31/15 | $ | 42.31 | 0.16 | 1.62 | 1.78 | (0.09 | ) | (3.63 | ) | ||||||||||||||||||
Class R | |||||||||||||||||||||||||||
Year Ended 10/31/19 | $ | 43.13 | 0.13 | (b) | 3.91 | 4.04 | (0.03 | ) | (5.09 | ) | |||||||||||||||||
Year Ended 10/31/18 | $ | 45.47 | 0.10 | (b) | (0.08 | ) | 0.02 | (0.12 | ) | (2.24 | ) | ||||||||||||||||
Year Ended 10/31/17 | $ | 37.59 | 0.01 | (b) | 9.86 | 9.87 | (0.05 | ) | (1.94 | ) | |||||||||||||||||
Year Ended 10/31/16 | $ | 38.06 | 0.02 | (b) | 2.88 | 2.90 | — | (3.37 | ) | ||||||||||||||||||
Year Ended 10/31/15 | $ | 40.21 | (0.05 | ) | 1.53 | 1.48 | — | (3.63 | ) | ||||||||||||||||||
Class R6 | |||||||||||||||||||||||||||
Year Ended 10/31/19 | $ | 46.38 | 0.36 | (b) | 4.28 | 4.64 | (0.27 | ) | (5.09 | ) | |||||||||||||||||
Year Ended 10/31/18 | $ | 48.69 | 0.30 | (b) | — | (c) | 0.30 | (0.37 | ) | (2.24 | ) | ||||||||||||||||
Year Ended 10/31/17 | $ | 40.08 | 0.21 | (b) | 10.58 | 10.79 | (0.24 | ) | (1.94 | ) | |||||||||||||||||
| 12/15/15(d) through 10/31/16 | $ | 38.97 | 0.13 | (b) | 4.54 | 4.67 | (0.19 | ) | (3.37 | ) | |||||||||||||||||
Class Y | |||||||||||||||||||||||||||
Year Ended 10/31/19 | $ | 46.13 | 0.30 | (b) | 4.24 | 4.54 | (0.19 | ) | (5.09 | ) | |||||||||||||||||
Year Ended 10/31/18 | $ | 48.33 | 0.29 | (b) | (0.09 | ) | 0.20 | (0.16 | ) | (2.24 | ) | ||||||||||||||||
Year Ended 10/31/17 | $ | 39.84 | 0.20 | (b) | 10.40 | 10.60 | (0.17 | ) | (1.94 | ) | |||||||||||||||||
Year Ended 10/31/16 | $ | 40.10 | 0.13 | (b) | 3.07 | 3.20 | (0.09 | ) | (3.37 | ) | |||||||||||||||||
Year Ended 10/31/15 | $ | 42.06 | 0.10 | 1.59 | 1.69 | (0.02 | ) | (3.63 | ) | ||||||||||||||||||
(a) Portfolio turnover is calculated on the basis of the Fund as a whole without distinguishing between the classes of shares issued.
(b) Per share net investment income (loss) has been calculated using the average daily shares method.
(c) Rounds to less than $0.005.
(d) Commencement of operations.
(e) Not annualized for periods less than one year.
(f) Annualized for periods less than one year.
(g) During the period, certain fees were reduced and/or reimbursed. If such fee reductions and/or reimbursements had not occurred, the ratios would have been as indicated.
See notes to financial statements.
28
Victory Portfolios | Financial Highlights — continued | ||||||
For a Share Outstanding Throughout Each Period
Ratios to Average Net Assets | Supplemental Data | ||||||||||||||||||||||||||||||||||
| Total Distributions | Net Asset Value, End of Period | Total Return (Excludes Sales Charge) | Net Expenses | Net Investment Income (Loss) | Gross Expenses | Net Assets, End of Period (000's) | Portfolio Turnover(a) | ||||||||||||||||||||||||||||
Victory Sycamore Small Company Opportunity Fund | |||||||||||||||||||||||||||||||||||
Class A | |||||||||||||||||||||||||||||||||||
Year Ended 10/31/19 | (5.19 | ) | $ | 45.16 | 12.10 | % | 1.25 | % | 0.51 | % | 1.25 | % | $ | 451,310 | 34 | % | |||||||||||||||||||
Year Ended 10/31/18 | (2.45 | ) | $ | 45.91 | 0.17 | % | 1.22 | % | 0.46 | % | 1.22 | % | $ | 486,622 | 43 | % | |||||||||||||||||||
Year Ended 10/31/17 | (2.06 | ) | $ | 48.23 | 27.02 | % | 1.23 | % | 0.25 | % | 1.23 | % | $ | 603,851 | 36 | % | |||||||||||||||||||
Year Ended 10/31/16 | (3.42 | ) | $ | 39.74 | 8.66 | % | 1.26 | % | 0.25 | % | 1.26 | % | $ | 529,545 | 59 | % | |||||||||||||||||||
Year Ended 10/31/15 | (3.63 | ) | $ | 40.01 | 3.94 | % | 1.30 | % | 0.08 | % | 1.30 | % | $ | 437,280 | 53 | % | |||||||||||||||||||
Class I | |||||||||||||||||||||||||||||||||||
Year Ended 10/31/19 | (5.35 | ) | $ | 45.71 | 12.49 | % | 0.92 | % | 0.82 | % | 0.92 | % | $ | 4,584,086 | 34 | % | |||||||||||||||||||
Year Ended 10/31/18 | (2.60 | ) | $ | 46.43 | 0.49 | % | 0.88 | % | 0.76 | % | 0.88 | % | $ | 4,127,411 | 43 | % | |||||||||||||||||||
Year Ended 10/31/17 | (2.17 | ) | $ | 48.75 | 27.44 | % | 0.90 | % | 0.56 | % | 0.90 | % | $ | 4,003,419 | 36 | % | |||||||||||||||||||
Year Ended 10/31/16 | (3.54 | ) | $ | 40.12 | 8.99 | % | 0.96 | % | 0.56 | % | 0.96 | % | $ | 2,428,803 | 59 | % | |||||||||||||||||||
Year Ended 10/31/15 | (3.72 | ) | $ | 40.37 | 4.30 | % | 0.96 | % | 0.40 | % | 0.96 | % | $ | 2,049,885 | 53 | % | |||||||||||||||||||
Class R | |||||||||||||||||||||||||||||||||||
Year Ended 10/31/19 | (5.12 | ) | $ | 42.05 | 11.89 | % | 1.44 | % | 0.32 | % | 1.44 | % | $ | 279,090 | 34 | % | |||||||||||||||||||
Year Ended 10/31/18 | (2.36 | ) | $ | 43.13 | (0.06 | )% | 1.44 | % | 0.23 | % | 1.44 | % | $ | 286,480 | 43 | % | |||||||||||||||||||
Year Ended 10/31/17 | (1.99 | ) | $ | 45.47 | 26.73 | % | 1.45 | % | 0.03 | % | 1.45 | % | $ | 333,944 | 36 | % | |||||||||||||||||||
Year Ended 10/31/16 | (3.37 | ) | $ | 37.59 | 8.42 | % | 1.48 | % | 0.05 | % | 1.48 | % | $ | 302,652 | 59 | % | |||||||||||||||||||
Year Ended 10/31/15 | (3.63 | ) | $ | 38.06 | 3.73 | % | 1.52 | % | (0.13 | )% | 1.52 | % | $ | 274,917 | 53 | % | |||||||||||||||||||
Class R6 | |||||||||||||||||||||||||||||||||||
Year Ended 10/31/19 | (5.36 | ) | $ | 45.66 | 12.52 | % | 0.87 | % | 0.84 | % | 0.87 | % | $ | 277,218 | 34 | % | |||||||||||||||||||
Year Ended 10/31/18 | (2.61 | ) | $ | 46.38 | 0.52 | % | 0.87 | % | 0.62 | % | 0.87 | % | $ | 195,360 | 43 | % | |||||||||||||||||||
Year Ended 10/31/17 | (2.18 | ) | $ | 48.69 | 27.44 | % | 0.90 | % | 0.46 | % | 0.90 | % | $ | 85,307 | 36 | % | |||||||||||||||||||
| 12/15/15(d) through 10/31/16 | (3.56 | ) | $ | 40.08 | 12.86 | %(e) | 0.98 | %(f) | 0.39 | %(f) | 1.12 | %(f)(g) | $ | 21,044 | 59 | %(e) | |||||||||||||||||||
Class Y | |||||||||||||||||||||||||||||||||||
Year Ended 10/31/19 | (5.28 | ) | $ | 45.39 | 12.31 | % | 1.07 | % | 0.69 | % | 1.07 | % | $ | 31,016 | 34 | % | |||||||||||||||||||
Year Ended 10/31/18 | (2.40 | ) | $ | 46.13 | 0.33 | % | 1.06 | % | 0.61 | % | 1.06 | % | $ | 32,592 | 43 | % | |||||||||||||||||||
Year Ended 10/31/17 | (2.11 | ) | $ | 48.33 | 27.10 | % | 1.15 | % | 0.45 | % | 1.25 | %(g) | $ | 35,416 | 36 | % | |||||||||||||||||||
Year Ended 10/31/16 | (3.46 | ) | $ | 39.84 | 8.79 | % | 1.15 | % | 0.34 | % | 1.39 | %(g) | $ | 141,097 | 59 | % | |||||||||||||||||||
Year Ended 10/31/15 | (3.65 | ) | $ | 40.10 | 4.10 | % | 1.15 | % | 0.23 | % | 1.33 | %(g) | $ | 76,761 | 53 | % | |||||||||||||||||||
See notes to financial statements.
29
Victory Portfolios | Notes to Financial Statements October 31, 2019 | ||||||
1. Organization:
Victory Portfolios (the "Trust") was organized on December 6, 1995 as a Delaware statutory trust as a successor to a company named "The Victory Portfolios," which was organized as a Massachusetts business trust on February 5, 1986. The Trust is registered under the Investment Company Act of 1940, as amended (the "1940 Act"), as an open-end investment company. The Trust is comprised of 42 funds and is authorized to issue an unlimited number of shares, which are units of beneficial interest with a par value of $0.001 per share. Each Fund is classified as diversified under the 1940 Act.
The accompanying financial statements are those of the following two Funds (collectively, the "Funds" and individually, a "Fund").
Funds (Legal Name) | Funds (Short Name)* | Investment Share Classes Offered | |||||||||
| Victory Sycamore Established Value Fund | Sycamore Established Value Fund | Class A, C, I, R, R6 and Y | |||||||||
| Victory Sycamore Small Company Opportunity Fund | Sycamore Small Company Opportunity Fund | Class A, I, R, R6 and Y | |||||||||
* The Funds are generally closed to new investors. The Funds will continue to be available for investment (by direct purchase or exchange) by only: existing shareholders, investors that purchase shares through certain intermediaries, retirement plans that purchase shares through certain record keepers, and current and retired Fund trustees, officers, employees of Victory Capital Management Inc. and affiliated providers, and their family members.
Each class of shares of a Fund has substantially identical rights and privileges except with respect to sales charges, fees paid under distribution plans, expenses allocable exclusively to each class of shares, voting rights on matters solely affecting a single class of shares, and the exchange privilege of each class of shares.
Under the Trust's organizational documents, its officers and trustees are indemnified against certain liabilities arising out of the performance of their duties to the Funds. In addition, in the normal course of business, the Funds enter into contracts with their vendors and others that provide for general indemnifications. The Funds' maximum exposure under these arrangements is unknown, as this would involve future claims that may be made against the Funds. However, based on experience, the Funds expect that risk of loss to be remote.
2. Significant Accounting Policies:
The following is a summary of significant accounting policies followed by the Trust in the preparation of its financial statements. The policies are in conformity with accounting principles generally accepted in the United States of America ("GAAP"). The preparation of financial statements in accordance with GAAP requires management to make estimates and assumptions that affect the reported amounts of assets and liabilities and disclosure of contingent assets and liabilities at the date of the financial statements and the reported amounts of income and expenses for the period. Actual results could differ from those estimates. The Funds follow the specialized accounting and reporting requirements under GAAP that are applicable to investment companies.
Investment Valuation:
The Funds record investments at fair value. Fair value is defined as the price that would be received to sell an asset or paid to transfer a liability in an orderly transaction between market participants at the measurement date.
The valuation techniques described below maximize the use of observable inputs and minimize the use of unobservable inputs in determining fair value. The inputs used for valuing the Funds' investments are summarized in the three broad levels listed below:
• Level 1 — quoted prices in active markets for identical securities
30
Victory Portfolios | Notes to Financial Statements — continued October 31, 2019 | ||||||
• Level 2 — other significant observable inputs (including quoted prices for similar securities or interest rates applicable to those securities, etc.)
• Level 3 — significant unobservable inputs (including the Funds' own assumptions in determining the fair value of investments)
Changes in valuation techniques may result in transfers in or out of an assigned level within the disclosure hierarchy. The inputs or methodologies used for valuation techniques are not necessarily an indication of the risk associated with entering into those investments.
Portfolio securities listed or traded on securities exchanges, including exchange-traded funds ("ETFs"), American Depositary Receipts ("ADRs") and Rights, are valued at the closing price on the exchange or system where the security is principally traded, if available, or at the Nasdaq Official Closing Price. If there have been no sales for that day on the exchange or system, then a security is valued at the last available bid quotation on the exchange or system where the security is principally traded. In each of these situations, valuations are typically categorized as Level 1 in the fair value hierarchy.
Investments in open-end investment companies are valued at net asset value. These valuations are typically categorized as Level 1 in the fair value hierarchy.
Investments for which there are no such quotations, or for which quotations do not appear reliable, are valued at fair value in accordance with procedures established by and under the general supervision and responsibility of the Trust's Board of Trustees (the "Board"). These valuations are typically categorized as Level 2 or Level 3 in the fair value hierarchy, based on the observability of inputs used to determine the fair value.
A summary of the valuations as of October 31, 2019, based upon the three levels defined above, is included in the table below while the breakdown, by category, of investments is disclosed in the Schedules of Portfolio Investments (amounts in thousands):
| LEVEL 1 — Quoted Prices | Total | ||||||||||
| Investments in Securities | Investments in Securities | ||||||||||
Sycamore Established Value Fund | |||||||||||
Common Stocks | $ | 11,062,314 | $ | 11,062,314 | |||||||
Exchange-Traded Funds | 171,091 | 171,091 | |||||||||
Collateral for Securities Loaned | 222,937 | 222,937 | |||||||||
Total | 11,456,342 | 11,456,342 | |||||||||
Sycamore Small Company Opportunity Fund | |||||||||||
Common Stocks | 5,380,682 | 5,380,682 | |||||||||
Exchange-Traded Funds | 70,497 | 70,497 | |||||||||
Collateral for Securities Loaned | 102,321 | 102,321 | |||||||||
Total | 5,553,500 | 5,553,500 | |||||||||
For the year ended October 31, 2019, there were no Level 3 investments for which significant unobservable inputs were used to determine fair value.
Real Estate Investment Trusts ("REITS"):
The Funds may invest in REITS which report information on the source of their distributions annually. REITS are pooled investment vehicles that invest primarily in income producing real estate or real estate related loans or interests (such as mortgages). Certain distributions received from REITS during the year are recorded as realized gains or return of capital as estimated by the Funds or when such information becomes known.
31
Victory Portfolios | Notes to Financial Statements — continued October 31, 2019 | ||||||
Investment Companies:
Exchange-Traded Funds:
The Funds may invest in ETFs. ETFs are a type of index fund, the shares of which are bought and sold on a securities exchange. An ETF trades like common stock and represents a fixed portfolio of securities designed to track the performance and dividend yield of a particular domestic or foreign market index. A Fund may purchase shares of an ETF to temporarily gain exposure to a portion of the U.S. or a foreign market while awaiting purchase of underlying securities. The risks of owning an ETF generally reflect the risks of owning the underlying securities they are designed to track, although the lack of liquidity of an ETF could result in it being more volatile. Additionally, ETFs have fees and expenses that reduce their value.
Open-End Funds:
The Funds may invest in portfolios of open-end investment companies. These investment companies value securities in their portfolios for which market quotations are readily available at their market values (generally the last reported sale price) and all other securities and assets at their fair value by the methods established by the board of directors of the underlying funds.
Investment Transactions and Related Income:
Changes in holdings of investments are accounted for no later than one business day following the trade date. For financial reporting purposes, however, investment transactions are accounted for on trade date on the last business day of the reporting period. Interest income is determined on the basis of coupon interest accrued using the effective interest method which adjusts, where applicable, the amortization of premiums or accretion of discounts. Dividend income is recorded on the ex-dividend date. Gains or losses realized on sales of securities are determined by comparing the identified cost of the security lot sold with the net sales proceeds. Pay-down gains or losses on applicable securities, if any, are recorded as components of interest income on the Statements of Operations.
Withholding taxes on interest, dividends and gains as a result of certain investments in ADRs by the Funds have been provided for in accordance with each investment's applicable country's tax rules and rates.
Securities Lending:
The Trust has entered into a Master Securities Lending Agreement ("MSLA") with Citibank, N.A. ("Citibank" or the "Agent"). Under the terms of the MSLA, the Funds may lend securities to certain broker-dealers and banks in exchange for collateral in the amount of at least 102% of the value of U.S. securities loaned or at least 105% of the value of non-U.S. securities loaned, marked-to-market daily. Any collateral shortfalls associated with increases in the valuation of the securities loaned are adjusted the next business day. The collateral can be received in the form of cash collateral and/or non-cash collateral. Non-cash collateral can include U.S. Government Securities, letters of credit and certificates of deposit. The cash collateral is invested in short-term instruments or cash equivalents, primarily open-end investment companies, as noted in the Funds' Schedules of Portfolio Investments. The Trust does not have effective control of the non-cash collateral and therefore it is not disclosed in the Funds' Schedules of Portfolio Investments. During the time portfolio securities are on loan, the borrower will pay the Funds any dividends or interest paid on such securities plus any fee negotiated between the parties to the lending agreement. The Funds also earn a return from the collateral. The Funds pay the Agent various fees in connection with the investment of cash collateral and fees based on the investment income received from securities lending activities. Securities lending income (net of these fees) is disclosed on the Statements of Operations. Although risk is mitigated by the collateral, the Funds could experience a delay in recovering their securities and possible loss of income or value if the borrower fails to return them.
Securities lending transactions are entered into by a Fund under the MSLA, which permits the Fund, under certain circumstances such as an event of default, to offset amounts payable by the Fund to the
32
Victory Portfolios | Notes to Financial Statements — continued October 31, 2019 | ||||||
same counterparty against amounts receivable from the counterparty to create a net payment due to or from the Fund.
The following table (amounts in thousands) is a summary of the Funds' securities lending transactions which are subject to offset under the MSLA as of October 31, 2019. These transactions are accounted for as secured borrowings with an overnight and continuous contractual maturity for cash collateral, and greater than overnight and continuous contractual maturity for non-cash collateral.
| Gross Amount of Recognized Assets (Value of | Value of Cash | Value of Non-cash Collateral Received by Maturity | |||||||||||||||||||||||||
| Securities on Loan) | Collateral Received* | <30Days | Between 30 & 90 Days | >90 Days | Net Amount | ||||||||||||||||||||||
| Sycamore Established Value Fund | $ | 215,583 | $ | 215,583 | $ | — | $ | — | $ | — | $ | — | |||||||||||||||
| Sycamore Small Company Opportunity Fund | 98,660 | 98,660 | — | — | — | — | |||||||||||||||||||||
* Collateral received in excess of the market value of securities on loan is not presented in this table. The total cash collateral received by each Fund is disclosed in the Statements of Assets and Liabilities.
Distributions to Shareholders:
Dividends from net investment income, if any, are declared and paid quarterly for the Sycamore Established Value Fund. Dividends from net investment income, if any, are declared and paid annually for the Sycamore Small Company Opportunity Fund. Distributable net realized gains, if any, are declared and distributed at least annually from each Fund.
The amounts of dividends from net investment income and distributions from net realized gains are determined in accordance with federal income tax regulations, which may differ from GAAP. To the extent these "book/tax" differences are permanent in nature (e.g., net operating loss and distribution reclassification), such amounts are reclassified within the components of net assets based on their federal tax-basis treatment; temporary differences (e.g., wash sales) do not require reclassification. To the extent dividends and distributions exceed net investment income and net realized gains for tax purposes, they are reported as distributions of capital. Net investment losses incurred by a Fund may be reclassified as an offset to capital on the accompanying Statements of Assets and Liabilities.
Federal Income Taxes:
It is the policy of each Fund to continue to qualify as a regulated investment company by complying with the provisions available to certain investment companies, as defined in applicable sections of the Internal Revenue Code, and to make distributions of net investment income and net realized gains sufficient to relieve it from all, or substantially all, federal income taxes. Accordingly, no provision for federal income taxes is required in the financial statements. The Funds have a tax year end of October 31.
Management of the Funds has reviewed tax positions taken in tax years that remain subject to examination by all major tax jurisdictions, including federal (i.e., the last four tax year ends and the interim tax period since then). Management believes that there is no tax liability resulting from unrecognized tax benefits related to uncertain tax positions taken.
Allocations:
Expenses directly attributable to a Fund are charged to the Fund, while expenses which are attributable to more than one fund in the Trust, or jointly with an affiliated trust, are allocated among the respective funds in the Trust and/or affiliated trust based upon net assets or another appropriate basis.
33
Victory Portfolios | Notes to Financial Statements — continued October 31, 2019 | ||||||
Income, expenses (other than class-specific expenses such as transfer agent fees, state registration fees, printing and 12b-1 fees), and realized and unrealized gains or losses on investments are allocated to each class of shares based on its relative net assets on the date income is earned or expenses and realized and unrealized gains and losses are incurred.
Cross-Trade Transactions:
Pursuant to Rule 17a-7 under the 1940 Act, the Funds may engage in cross-trades which are securities transactions with affiliated investment companies and advisory accounts managed by the Adviser and any applicable sub-adviser. Any such purchase or sale transaction must be effected without brokerage commission or other remuneration, except for customary transfer fees. The transaction must be effected at the current market price, which is either the security's last sale price on an exchange or, if there are no transactions in the security that day, at the average of the highest bid and lowest asked price. For the year ended October 31, 2019, the Funds did not engage in any Rule 17a-7 transactions under the 1940 Act.
3. Purchases and Sales of Securities:
Purchases and sales of securities (excluding securities maturing less than one year from acquisition) for the year ended October 31, 2019 were as follows (amounts in thousands):
Purchases | Sales | ||||||||||
Sycamore Established Value Fund | $ | 3,652,559 | $ | 4,069,104 | |||||||
Sycamore Small Company Opportunity Fund | 1,753,506 | 1,786,310 | |||||||||
For the year ended October 31, 2019, there were no purchases or sales of U.S. Government Securities.
4. Fees and Transactions with Affiliates and Related Parties:
Investment advisory services are provided to the Funds by Victory Capital Management Inc. ("VCM" or the "Adviser"), a New York corporation registered as an investment adviser with the Securities and Exchange Commission ("SEC"). The Adviser is a wholly-owned indirect subsidiary of Victory Capital Holdings, Inc., a publicly traded Delaware Corporation and a wholly-owned direct subsidiary of Victory Capital Operating, LLC.
Under the terms of the Investment Advisory Agreements, the Adviser is entitled to receive fees based on a percentage of the average daily net assets of each Fund. The rates at which the Adviser is paid by each Fund are included in the table below. The Adviser may use its resources to assist with the Funds' distribution and marketing expenses.
| Adviser Fee Tier Rate | |||||||
Sycamore Established Value Fund | |||||||
Up to $100 million | 0.65 | % | |||||
$100 million — $200 million | 0.55 | % | |||||
Over $200 million | 0.45 | % | |||||
Sycamore Small Company Opportunity Fund | |||||||
Up to $500 million | 0.85 | % | |||||
Over $500 million | 0.75 | % | |||||
VCM also serves as the Funds' administrator and fund accountant. Under an Administration and Fund Accounting Agreement, VCM is paid for its services an annual fee at a rate of 0.08% of the first $15 billion in average daily net assets of the Trust, Victory Variable Insurance Funds and Victory Portfolios II (collectively, the "Victory Funds Complex"), 0.05% of the average daily net assets above $15 billion to $30 billion of the Victory Funds Complex and 0.04% of the average daily net assets over $30 billion of the Victory Funds Complex.
Citi Fund Services Ohio, Inc. ("Citi"), an affiliate of Citibank N.A., acts as sub-administrator and sub-fund accountant to the Funds pursuant to a Sub-Administration and Sub-Fund Accounting Services
34
Victory Portfolios | Notes to Financial Statements — continued October 31, 2019 | ||||||
Agreement between VCM and Citi. VCM pays Citi a fee for providing these services. The Trust reimburses VCM and Citi for all of their reasonable out-of-pocket expenses incurred in providing these services.
FIS Investor Services, LLC ("FIS") serves as the Funds' transfer agent. Under the Transfer Agent Agreement, the Trust pays FIS a fee for its services and reimburses FIS for all of their reasonable out-of-pocket expenses incurred in providing these services.
The Chief Compliance Officer ("CCO") is an employee of the Adviser, which pays the compensation of the CCO and his support staff. The Trust has entered into an Agreement to provide compliance services with the Adviser, pursuant to which the Adviser furnishes its compliance personnel, including the services of the CCO, and other resources reasonably necessary to provide the Trust with compliance oversight services related to the design, administration and oversight of a compliance program for the Trust in accordance with Rule 38a-1 under the 1940 Act. The Victory Funds Complex compensates the Adviser for these services.
The Victory Funds Complex pays an annual retainer to each Independent Trustee, plus an additional annual retainer to the Chairman of the Board. The aggregate amount of the fees and expenses of the Independent Trustees are allocated amongst all the funds in the Victory Funds Complex and are presented in the Statements of Operations.
Shearman & Sterling LLP provides legal services to the Trust.
Victory Capital Advisers, Inc. (the "Distributor"), an affiliate of the Adviser, serves as distributor for the continuous offering of the shares of the Funds pursuant to a Distribution Agreement between the Distributor and the Trust. Pursuant to the Distribution and Service Plans adopted in accordance with Rule 12b-1 under the 1940 Act, the Distributor may receive a monthly distribution and service fee, at an annual rate of up to 0.25% of the average daily net assets of Class A Shares, at an annual rate of up to 0.50% of the average daily net assets of Class R Shares of the Funds, and 1.00% of the average daily net assets of Class C Shares of the Funds. The distribution and service fees paid to the Distributor may be used by the Distributor to pay for activities primarily intended to result in the sale of Class A, Class R or Class C Shares of the Funds.
In addition, the Distributor is entitled to receive commissions on sales of the Class A Shares of the Funds. For the year ended October 31, 2019, the Distributor received approximately $31 thousand from commissions earned on sales of Class A Shares of the Funds.
The Adviser has entered into expense limitation agreements with certain Funds. Under the terms of the agreements, the Adviser has agreed to waive fees or reimburse certain expenses to the extent that ordinary operating expenses incurred by certain classes of a Fund in any fiscal year exceed the expense limit for such classes of the Fund. Such excess amounts will be the liability of the Adviser. Interest, taxes, brokerage commissions, other expenditures which are capitalized in accordance with GAAP, and other extraordinary expenses not incurred in the ordinary course of a Fund's business are excluded from the expense limits. As of October 31, 2019, the expense limits (excluding voluntary waivers) are as follows:
In effect November 1, 2018 until February 29, 2020 | |||||||||||||||||||||||||||
| Class A Shares | Class C Shares | Class I Shares | Class R Shares | Class R6 Shares | Class Y Shares | ||||||||||||||||||||||
| Sycamore Established Value Fund | N/A | 1.84 | % | N/A | N/A | N/A | N/A | ||||||||||||||||||||
| Sycamore Small Company Opportunity Fund | N/A | N/A | N/A | N/A | N/A | 1.15 | % | ||||||||||||||||||||
The Funds have agreed to repay fees and expenses that were waived or reimbursed by the Adviser for a period up to three fiscal years after such waiver or reimbursement was made to the extent such payments or repayments would not cause the expenses of a class to exceed the original expense limitation in place at time of the waiver or reimbursement or any expense limitation agreement in place at the time of repayment. Amounts repaid to the Adviser during the year ended, if any, are reflected on the Statements of Operations as "Recoupment of prior expenses waived/reimbursed by Adviser."
35
Victory Portfolios | Notes to Financial Statements — continued October 31, 2019 | ||||||
As of October 31, 2019, the following amounts are available to be repaid to the Adviser (amounts in thousands).
| Expires 10/31/20 | Total | ||||||||||
Sycamore Small Company Opportunity Fund | $ | 79 | $ | 79 | |||||||
The Adviser, may voluntarily waive or reimburse additional fees to assist the Funds in maintaining competitive expense ratios. Voluntary waivers and reimbursements applicable to the Funds are not available to be recouped at a future time. There were no voluntary waivers or reimbursements for the year ended October 31, 2019.
Certain officers and/or interested trustees of the Funds are also officers and/or employees of the Adviser, Administrator, Fund Accountant, Sub-Administrator, Sub-Fund Accountant, and Legal Counsel.
5. Risks:
Each Fund may be subject to other risks in addition to these identified risks.
An investment in the Funds' shares represents an indirect investment in the securities owned by the Funds, some of which will be traded on a national securities exchange or in the over-the-counter markets. The value of the securities in which the Funds invest, like other market investments, may move up or down, sometimes rapidly and unpredictably. The value of the securities in which the Funds invest may affect the value of the Funds' shares. An investment in the Funds' shares at any point in time may be worth less than the original investment, even after taking into account the reinvestment of the Funds' distributions.
The Funds will be subject to credit risk with respect to the amount each expects to receive from counterparties for financial instruments entered into by the Funds. The Funds may be negatively impacted if a counterparty becomes bankrupt or otherwise fails to perform its obligations due to financial difficulties. The Funds may experience significant delays in obtaining any recovery in bankruptcy or other reorganization proceeding and the Funds may obtain only limited recovery or may obtain no recovery in such circumstances. The Funds typically enter into transactions with counterparties whose credit ratings are investment grade, as determined by a nationally recognized statistical rating organization or, if unrated, judged by the Adviser to be of comparable quality.
6. Borrowing and Interfund Lending:
Line of Credit:
Effective July 1, 2019, the Victory Funds Complex participates in a short-term, demand note "Line of Credit" agreement with Citibank. Under the agreement with Citibank, the Victory Funds Complex may borrow up to $600 million, of which $300 million is committed and $300 million is uncommitted. $40 million of the Line of Credit is reserved for use by the Victory Floating Rate Fund, another series of the Victory Funds Complex, with that Fund paying the related commitment fees for that amount. The purpose of the agreement is to meet temporary or emergency cash needs, including redemption requests that might otherwise require the untimely disposition of securities. The current agreement was amended on June 28, 2019 with a new termination date of June 29, 2020. Citibank receives an annual commitment fee of 0.15% on $300 million for providing the Line of Credit. Each fund in the Victory Funds Complex pays a pro-rata portion of the commitment fees plus any interest (one month LIBOR plus one percent) on amounts borrowed. Interest charged to each Fund during the period is presented on the Statements of Operations under Line of credit fees. Prior to July 1, 2019. The Victory Funds Complex excluded the USAA Mutual Funds Trust and could borrow up to $250 million, of which $100 million was committed and $150 million was uncommitted. $40 million of the Line of Credit was reserved for use by the Victory Floating Rate Fund, with that Fund paying the related commitment fees for that amount. Citibank received an annual commitment fee of 0.15% on $100 million for providing the Line of Credit.
The Funds did not utilize the Line of Credit during the year ended October 31, 2019.
36
Victory Portfolios | Notes to Financial Statements — continued October 31, 2019 | ||||||
Interfund Lending:
The Trust and Adviser rely on an exemptive order granted by the SEC in March 2017 (the "Order"), permitting the establishment and operation of an Interfund Lending Facility (the "Facility"). The Facility allows each Fund to directly lend and borrow money to or from any other Victory Fund relying upon the Order at rates beneficial to both the borrowing and lending funds. Advances under the Facility are allowed for temporary or emergency purposes, including the meeting of redemption requests that otherwise might require the untimely disposition of securities, and are subject to each Fund's borrowing restrictions. The interfund loan rate is determined, as specified in the Order, by averaging the current repurchase agreement rate and the current bank loan rate. As a Borrower, interest charged to each Fund during the period is presented on the Statements of Operations under Interfund lending fees. As a Lender, interest earned by each Fund during the period is presented on the Statements of Operations under Interfund lending.
The average borrowing and lending for the days outstanding and average interest rate for each Fund during the year ended October 31, 2019 were as follows (amounts in thousands):
| Borrower or Lender | Amount Outstanding at October 31, 2019 | Average Lending* | Days Lending Outstanding | Average Interest Rate* | Maximum Lending During the Period | ||||||||||||||||||||||
| Sycamore Established Value Fund | Lender | $ | 4,081 | $ | 4,958 | 122 | 2.66 | % | $ | 50,487 | |||||||||||||||||
| Sycamore Small Company Opportunity Fund | Lender | — | 606 | 9 | 2.84 | % | 1,331 | ||||||||||||||||||||
* For the year ended October 31, 2019, based on the number of days borrowings were outstanding.
7. Federal Income Tax Information:
The tax character of distributions during the tax years ended, as noted below, were as follows (total distributions paid may differ from the Statements of Changes in Net Assets because, for tax purposes, dividends are recognized when actually paid) (amounts in thousands):
Year Ended October 31, 2019 | |||||||||||||||||||
Distributions paid from | |||||||||||||||||||
| Ordinary Income | Net Long-Term Capital Gains | Total Taxable Distributions | Total Distributions Paid | ||||||||||||||||
Sycamore Established Value Fund | $ | 209,182 | $ | 757,611 | $ | 966,793 | $ | 966,793 | |||||||||||
Sycamore Small Company Opportunity Fund | 134,592 | 454,533 | 589,125 | 589,125 | |||||||||||||||
Year Ended October 31, 2018 | |||||||||||||||||||
Distributions paid from | |||||||||||||||||||
| Ordinary Income | Net Long-Term Capital Gains | Total Taxable Distributions | Total Distributions Paid | ||||||||||||||||
Sycamore Established Value Fund | $ | 169,596 | $ | 201,875 | $ | 371,471 | $ | 371,471 | |||||||||||
Sycamore Small Company Opportunity Fund | 79,382 | 190,439 | 269,821 | 269,821 | |||||||||||||||
37
Victory Portfolios | Notes to Financial Statements — continued October 31, 2019 | ||||||
As of the tax year ended October 31, 2019, the components of distributable earnings/accumulated deficit on a tax basis were as follows (amounts in thousands):
| Undistributed Ordinary Income | Undistributed Long-Term Capital Gains | Accumulated Earnings | Accumulated Capital and Other Losses | Qualified Late-Year Losses* | Unrealized Appreciation (Depreciation)** | Total Accumulated Earnings (Deficit) | |||||||||||||||||||||||||
| Sycamore Established Value Fund | $ | 45,790 | $ | 517,492 | $ | 563,282 | $ | — | $ | — | $ | 1,566,186 | $ | 2,129,468 | |||||||||||||||||
| Sycamore Small Company Opportunity Fund | 58,670 | 224,772 | 283,442 | — | — | 768,469 | 1,051,911 | ||||||||||||||||||||||||
* Qualified late-year losses are comprised of post-October capital losses incurred after October 31 and certain late-year ordinary losses. Late-year ordinary losses represent ordinary losses incurred after December 31 and specified losses incurred after October 31. These losses are deemed to arise on the first day of the Fund's next taxable year.
** The difference between the book-basis and tax-basis unrealized appreciation (depreciation) is attributable primarily to tax deferral of losses on wash sales.
At October 31, 2019, the cost basis for federal income tax purposes, gross unrealized appreciation, gross unrealized depreciation and net unrealized appreciation (depreciation) for investments were as follows (amounts in thousands):
| Cost of Investments for Federal Tax Purposes | Gross Unrealized Appreciation | Gross Unrealized Depreciation | Net Unrealized Appreciation (Depreciation) | ||||||||||||||||
Sycamore Established Value Fund | $ | 9,890,156 | $ | 2,055,190 | $ | (489,004 | ) | $ | 1,566,186 | ||||||||||
Sycamore Small Company Opportunity Fund | 4,785,031 | 1,007,557 | (239,088 | ) | 768,469 | ||||||||||||||
8. Affiliated Securities:
An affiliated security is a security in which the Fund has ownership of at least 5% of the security's outstanding voting shares or an investment company managed by VCM. Transactions in affiliated securities during the year ended October 31, 2019 were as follows (amounts in thousands):
| Fair Value 10/31/2018 | Purchases at Cost | Proceeds from Sales | Realized Gain (Loss) | Capital Gain Distribution | Net Change in Unrealized Appreciation/ Depreciation | Fair Value 10/31/2019 | Dividend Income | ||||||||||||||||||||||||||||
| Sycamore Small Company Opportunity Fund | |||||||||||||||||||||||||||||||||||
| ADTRAN Inc. | $ | 34,831 | $ | 1,085 | $ | (326 | ) | $ | (226 | ) | $ | — | $ | (11,600 | ) | $ | 23,764 | $ | 698 | ||||||||||||||||
| Angiodynamics Inc. | 27,301 | 50,535 | — | — | — | (19,223 | ) | 58,613 | — | ||||||||||||||||||||||||||
Hanger Inc. | 20,595 | 21,056 | — | — | — | 7,495 | 49,146 | — | |||||||||||||||||||||||||||
Myr Group Inc. | 41,816 | 1,949 | (10,337 | ) | 292 | — | 1,609 | 35,329 | — | ||||||||||||||||||||||||||
| The E.W. Scripps Co., Class A | 67,480 | 11,764 | (20,475 | ) | 2,945 | — | (9,989 | ) | 51,725 | 701 | |||||||||||||||||||||||||
Unifi Inc. | 29,823 | — | — | — | — | 5,746 | 35,569 | — | |||||||||||||||||||||||||||
Unit Corp. | 63,624 | 4,135 | (957 | ) | (14,966 | ) | — | (46,055 | ) | 5,781 | — | ||||||||||||||||||||||||
Total | $ | 285,470 | $ | 90,524 | $ | (32,095 | ) | $ | (11,955 | ) | $ | — | $ | (72,017 | ) | $ | 259,927 | $ | 1,399 | ||||||||||||||||
38
Victory Portfolios | Notes to Financial Statements — continued October 31, 2019 | ||||||
9. Fund Ownership:
Ownership of more than 25% of the voting securities of a fund creates presumptions of control of the fund, under section 2(a)(9) of the 1940 Act. As of October 31, 2019, no shareholder held more than 25% of the shares outstanding of any Fund.
10. Recent Accounting Pronouncements:
In March 2017, the Financial Accounting Standards Board ("FASB") issued Accounting Standards Update ("ASU") No. 2017-08 "Premium Amortization on Purchased Callable Debt Securities" ("ASU 2017-08"), which shortens the premium amortization period for purchased non-contingently callable debt securities. ASU 2017-08 specifies that the premium amortization period ends at the earliest call date, for purchased non-contingently callable debt securities. ASU 2017-08 is effective for fiscal years, and interim periods within those fiscal years, beginning after December 15, 2018. Management does not believe that adoption of ASU 2017-08 will materially impact the Funds' financial statements.
11. Subsequent Events:
The Funds have evaluated the need for additional disclosures or adjustments resulting from subsequent events through the date these financial statements were issued. Based on this evaluation, there were no subsequent events to report that would have a material impact on the Funds' financial statements.
39
REPORT OF INDEPENDENT REGISTERED PUBLIC ACCOUNTING FIRM
To the Shareholders and Board of Trustees of
Victory Portfolios
Opinion on the Financial Statements
We have audited the accompanying statements of assets and liabilities, including the schedules of portfolio investments, of Victory Sycamore Established Value Fund and Victory Sycamore Small Company Opportunity Fund (the "Funds"), each a series of Victory Portfolios, as of October 31, 2019, the related statements of operations and changes in net assets, included the related notes, and the financial highlights for the year then ended (collectively referred to as the "financial statements"). In our opinion, the financial statements present fairly, in all material respects, the financial position of each of the Funds as of October 31, 2019, the results of their operations, the changes in their net assets, and the financial highlights for the year then ended, in conformity with accounting principles generally accepted in the United States of America.
The Funds' financial statements and financial highlights for the years ended October 31, 2018 and prior, were audited by other auditors whose report dated December 21, 2018, expressed an unqualified opinion on those financial statements and financial highlights.
Basis for Opinion
These financial statements are the responsibility of the Funds' management. Our responsibility is to express an opinion on the Funds' financial statements based on our audit. We are a public accounting firm registered with the Public Company Accounting Oversight Board (United States) ("PCAOB") and are required to be independent with respect to the Funds in accordance with the U.S. federal securities laws and the applicable rules and regulations of the Securities and Exchange Commission and the PCAOB.
We conducted our audit in accordance with the standards of the PCAOB. Those standards require that we plan and perform the audit to obtain reasonable assurance about whether the financial statements are free of material misstatement, whether due to error or fraud.
Our audit included performing procedures to assess the risks of material misstatement of the financial statements, whether due to error or fraud, and performing procedures that respond to those risks. Such procedures included examining, on a test basis, evidence regarding the amounts and disclosures in the financial statements. Our procedures included confirmation of securities owned as of October 31, 2019, by correspondence with the custodian and brokers or by other appropriate auditing procedures where replies from brokers were not received. Our audit also included evaluating the accounting principles used and significant estimates made by management, as well as evaluating the overall presentation of the financial statements. We believe that our audit provides a reasonable basis for our opinion.
We have served as the auditor of one or more investment companies advised by Victory Capital Management, Inc. since 2015.

COHEN & COMPANY, LTD.
Cleveland, Ohio
December 30, 2019
40
Victory Portfolios | Supplemental Information October 31, 2019 | ||||||
(Unaudited)
Trustee and Officer Information
Board of Trustees:
Overall responsibility for management of the Trust rests with the Board. The Trust is managed by the Board in accordance with the laws of the State of Delaware. There are currently ten Trustees, nine of whom are not "interested persons" of the Trust within the meaning of that term under the 1940 Act ("Independent Trustees") and one of whom is an "interested person" of the Trust within the meaning of that term under the 1940 Act ("Interested Trustee"). The Trustees, in turn, elect the officers of the Trust to actively supervise its day-to-day operations.
The following tables list the Trustees, their ages, position with the Trust, commencement of service, principal occupations during the past five years and any directorships of other investment companies or companies whose securities are registered under the Securities Exchange Act of 1934, as amended, or who file reports under that Act.
Each Trustee oversees 42 portfolios in the Trust, nine portfolios in Victory Variable Insurance Funds, and 24 portfolios in Victory Portfolios II, each a registered investment company that, together with the Trust, comprise the Victory Fund Complex. Each Trustee's address is c/o Victory Portfolios, 4900 Tiedeman Road, 4th Floor, Brooklyn, Ohio 44144. Each Trustee has an indefinite term.
Name and Age | Position Held with the Trust | Date Commenced Service | Principal Occupation During Past 5 Years | Other Directorships Held During Past 5 Years | |||||||||||||||
Independent Trustees. | |||||||||||||||||||
David Brooks Adcock, 68 | Trustee | May 2005 | Consultant (since 2006). | Chair and Trustee, Turner Funds (December 2016-December 2017). | |||||||||||||||
Nigel D. T. Andrews, 72 | Vice Chair and Trustee | August 2002 | Retired. | Director, TCG BDC II, Inc. (since 2017); Director, TCG BDC I, Inc. (formerly Carlyle GMS Finance, Inc.) (since 2012); Director, Old Mutual US Asset Management (2002-2014). | |||||||||||||||
E. Lee Beard, 68* | Trustee | May 2005 | Retired (since 2015); Consultant, The Henlee Group, LLC (consulting) (2005-2015). | None. | |||||||||||||||
41
Victory Portfolios | Supplemental Information — continued October 31, 2019 | ||||||
(Unaudited)
Name and Age | Position Held with the Trust | Date Commenced Service | Principal Occupation During Past 5 Years | Other Directorships Held During Past 5 Years | |||||||||||||||
Dennis M. Bushe, 75 | Trustee | July 2016 | Retired. | Trustee, RS Investment Trust and RS Variable Products Trust (November 2011-July 2016). | |||||||||||||||
Sally M. Dungan, 65 | Trustee | February 2011 | Chief Investment Officer, Tufts University (since 2002). | None. | |||||||||||||||
John L. Kelly, 66 | Trustee | February 2015 | Partner, McCarvill Capital Partners (September 2016- September 2017); Advisor, Endgate Commodities LLC (January 2016-April 2016); Managing Partner, Endgate Commodities LLC (August 2014-January 2016). | Director, Caledonia Mining Corporation (since May 2012). | |||||||||||||||
David L. Meyer, 62* | Trustee | December 2008 | Retired. | None. | |||||||||||||||
Gloria S. Nelund, 58 | Trustee | July 2016 | Chair, CEO and Co-Founder of TriLinc Global, LLC, an investment firm. | TriLinc Global Impact Fund, LLC (since 2012); Trustee, RS Investment Trust and RS Variable Products Trust (November 2007-July 2016). | |||||||||||||||
Leigh A. Wilson, 74 | Chair and Trustee | November 1994 | Private Investor. | Chair (since 2013), Caledonia Mining Corporation. | |||||||||||||||
Interested Trustee. | |||||||||||||||||||
David C. Brown, 47** | Trustee | May 2008 | Chairman and Chief Executive Officer (since 2013), the Adviser; Chairman and Chief Executive Officer, Victory Capital Holdings, Inc. (since 2013). | Trustee, USAA Mutual Funds Trust. | |||||||||||||||
* The Board has designated Mr. Meyer and Ms. Beard as its Audit Committee Financial Experts.
** Mr. Brown is an "Interested Person" by reason of his relationship with the Adviser.
The Statement of Additional Information includes additional information about the Trustees of the Trust and is available, without charge, on the SEC's website at www.sec.gov and/or by calling 800-539-3863.
42
Victory Portfolios | Supplemental Information — continued October 31, 2019 | ||||||
(Unaudited)
Officers:
The officers of the Trust, their ages, commencement of service and their principal occupations during the past five years, are detailed in the following table. Each officer serves until the earlier of his or her resignation, removal, retirement, death, or the election of a successor. The mailing address of each officer of the Trust is 4900 Tiedeman Road, 4th Floor, Brooklyn, Ohio 44144. The officers of the Trust receive no compensation directly from the Trust for performing the duties of their offices.
Name and Age | Position with the Trust | Date Commenced Service | Principal Occupation During Past 5 Years | ||||||||||||
Christopher K. Dyer, 57 | President | February 2006* | Director of Fund Administration, the Adviser. | ||||||||||||
Scott A. Stahorsky, 50 | Vice President | December 2014 | Manager, Fund Administration, the Adviser (since 2015); Senior Analyst, Fund Administration, the Adviser (prior to 2015). | ||||||||||||
Erin G. Wagner, 45 | Secretary | December 2014 | Associate General Counsel, the Adviser (since 2013). | ||||||||||||
Allan Shaer, 54 | Treasurer | May 2017 | Senior Vice President, Financial Administration, Citi Fund Services Ohio, Inc. (since 2016); Vice President, Mutual Fund Administration, JP Morgan Chase (2011-2016). | ||||||||||||
Christopher A. Ponte, 35 | Assistant Treasurer | December 2017 | Manager, Fund Administration, the Adviser (since 2017); Senior Analyst, Fund Administration, the Adviser (prior to 2017); Chief Financial Officer, Victory Capital Advisers, Inc. (since 2018). | ||||||||||||
Colin Kinney, 46 | Chief Compliance Officer | July 2017 | Chief Compliance Officer (since 2013) and Chief Risk Officer (2009-2017), the Adviser. | ||||||||||||
Chuck Booth, 59 | Anti-Money Laundering Compliance Officer and Identity Theft Officer | May 2015 | Director, Regulatory Administration and CCO Support Services, Citi Fund Services Ohio, Inc. | ||||||||||||
Jay G. Baris, 65 | Assistant Secretary | December 1997 | Partner, Shearman & Sterling LLP (since 2018); Partner, Morrison & Foerster LLP (2011-January 2018). | ||||||||||||
* On December 3, 2014, Mr. Dyer resigned as Secretary of the Trust and accepted the position of President.
43
Victory Portfolios | Supplemental Information — continued October 31, 2019 | ||||||
(Unaudited)
Proxy Voting and Portfolio Holdings Information
Proxy Voting:
Information regarding the policies and procedures that each Fund uses to determine how to vote proxies relating to portfolio securities is available without charge, upon request, by calling 800-539-3863. The information is also included in the Funds' Statement of Additional Information, which is available on the SEC's website at www.sec.gov.
Information relating to how the Funds voted proxies relating to portfolio securities held during the most recent twelve months ended June 30 is available on the SEC's website at www.sec.gov.
Availability of Schedules of Portfolio Investments:
The Trust files a complete list of Schedules of Portfolio Investments with the SEC for the first and third quarter of each fiscal year on Form N-PORT. Prior to the implementation of Form N-PORT, the Trust filed a complete list of Schedules of Portfolio Investments with the SEC for the first and third quarters of each fiscal year on Form N-Q. Forms N-PORT and Forms N-Q are available on the SEC's website at www.sec.gov.
Expense Examples
As a shareholder of the Funds, you may incur two types of costs: (1) transaction costs, including sales charges (loads) on purchases; and (2) ongoing costs, including management fees, distribution and service (12b-1) fees, and other Fund expenses. These examples are intended to help you understand your ongoing costs (in dollars) of investing in the Funds and to compare these costs with the ongoing costs of investing in other mutual funds.
These examples are based on an investment of $1,000 invested at the beginning of the period and held for the entire period from May 1, 2019 through October 31, 2019.
The Actual Expense figures in the table below provide information about actual account values and actual expenses. You may use the information below, together with the amount you invested, to estimate the expenses that you paid over the period. Simply divide your account value by $1,000 (for example, an $8,600 account value divided by $1,000 = 8.6), then multiply the result by the number in the table under the heading entitled "Actual Expenses Paid During Period" to estimate the expenses you paid on your account during this period.
The Hypothetical Expense figures in the table below provide information about hypothetical account values and hypothetical expenses based on each Fund's actual expense ratio and an assumed rate of return of 5% per year before expenses, which is not the Fund's actual return. The hypothetical account values and expenses may not be used to estimate the actual ending account balance or expenses you paid for the period. You may use this information to compare this 5% hypothetical example with the 5% hypothetical examples that appear in shareholder reports of other funds.
Please note the expenses shown in the table are meant to highlight your ongoing costs only and do not reflect any transactional costs. Therefore, the table is useful in comparing ongoing costs only, and will not help you determine the relative total costs of owning different funds. In addition, if these transactional costs were included, your costs would have been higher.
44
Victory Portfolios | Supplemental Information — continued October 31, 2019 | ||||||
(Unaudited)
| Beginning Account Value 5/1/19 | Actual Ending Account Value 10/31/19 | Hypothetical Ending Account Value 10/31/19 | Actual Expenses Paid During Period 5/1/19- 10/31/19* | Hypothetical Expenses Paid During Period 5/1/19- 10/31/19* | Annualized Expense Ratio During Period 5/1/19- 10/31/19 | ||||||||||||||||||||||
Sycamore Established Value Fund | |||||||||||||||||||||||||||
Class A Shares | $ | 1,000.00 | $ | 1,030.30 | $ | 1,020.62 | $ | 4.66 | $ | 4.63 | 0.91 | % | |||||||||||||||
Class C Shares | 1,000.00 | 1,026.30 | 1,016.79 | 8.53 | 8.49 | 1.67 | % | ||||||||||||||||||||
Class I Shares | 1,000.00 | 1,032.00 | 1,022.23 | 3.02 | 3.01 | 0.59 | % | ||||||||||||||||||||
Class R Shares | 1,000.00 | 1,029.10 | 1,019.51 | 5.78 | 5.75 | 1.13 | % | ||||||||||||||||||||
Class R6 Shares | 1,000.00 | 1,032.00 | 1,022.23 | 3.02 | 3.01 | 0.59 | % | ||||||||||||||||||||
Class Y Shares | 1,000.00 | 1,031.50 | 1,021.93 | 3.33 | 3.31 | 0.65 | % | ||||||||||||||||||||
Sycamore Small Company Opportunity Fund | |||||||||||||||||||||||||||
Class A Shares | 1,000.00 | 1,029.90 | 1,018.90 | 6.40 | 6.36 | 1.25 | % | ||||||||||||||||||||
Class I Shares | 1,000.00 | 1,031.60 | 1,020.52 | 4.76 | 4.74 | 0.93 | % | ||||||||||||||||||||
Class R Shares | 1,000.00 | 1,028.90 | 1,018.00 | 7.31 | 7.27 | 1.43 | % | ||||||||||||||||||||
Class R6 Shares | 1,000.00 | 1,031.60 | 1,020.82 | 4.46 | 4.43 | 0.87 | % | ||||||||||||||||||||
Class Y Shares | 1,000.00 | 1,030.90 | 1,019.86 | 5.43 | 5.40 | 1.06 | % | ||||||||||||||||||||
* Expenses are equal to the average account value multiplied by the Fund's annualized expense ratio multiplied by 184/365 (the number of days in the most recent fiscal half-year divided by the number of days in the fiscal year).
45
Victory Portfolios | Supplemental Information — continued October 31, 2019 | ||||||
(Unaudited)
Additional Federal Income Tax Information
For the year ended October 31, 2019, the Funds paid qualified dividend income for the purposes of reduced individual federal income tax rates of:
Amount | |||||||
Sycamore Established Value Fund | 96 | % | |||||
Sycamore Small Company Opportunity Fund | 53 | % | |||||
Dividends qualified for corporate dividends received deductions of:
Amount | |||||||
| Sycamore Established Value Fund | 94 | % | |||||
| Sycamore Small Company Opportunity Fund | 63 | % | |||||
For the year ended October 31, 2019, the Funds designated short-term capital gain distributions (in thousands):
Amount | |||||||
| Sycamore Established Value Fund | $ | 71,853 | |||||
| Sycamore Small Company Opportunity Fund | 105,704 | ||||||
For the year ended October 31, 2019, the following Funds designated long-term capital gain distributions (in thousands):
Amount | |||||||
| Sycamore Established Value Fund | $ | 757,611 | |||||
| Sycamore Small Company Opportunity Fund | 454,533 | ||||||
46
Privacy Policy
Protecting the Privacy of Information
The Trust respects your right to privacy. We also know that you expect us to conduct and process your business in an accurate and efficient manner. To do so, we must collect and maintain certain personal information about you. This is the information we collect from you on applications or other forms, and from the transactions you make with us or third parties. It may include your name, address, social security number, account transactions and balances, and information about investment goals and risk tolerance.
We do not disclose any information about you or about former customers to anyone except as permitted or required by law. Specifically, we may disclose the information we collect to companies that perform services on our behalf, such as the transfer agent that processes shareholder accounts and printers and mailers that assist us in the distribution of investor materials. We may also disclose this information to companies that perform marketing services on our behalf. This allows us to continue to offer you Victory investment products and services that meet your investing needs, and to effect transactions that you request or authorize. These companies will use this information only in connection with the services for which we hired them. They are not permitted to use or share this information for any other purpose.
To protect your personal information internally, we permit access only by authorized employees and maintain physical, electronic and procedural safeguards to guard your personal information.*
* You may have received communications regarding information about privacy policies from other financial institutions which gave you the opportunity to "opt-out" of certain information sharing with companies which are not affiliated with that financial institution. The Trust does not share information with other companies for purposes of marketing solicitations for products other than the Trust. Therefore, the Trust does not provide opt-out options to their shareholders.
Victory Funds
P.O. Box 182593
Columbus, Ohio 43218-2593

Visit our website at: | Call Victory at: | ||||||
www.vcm.com | 800-539-FUND (800-539-3863) | ||||||
VP-SMF-AR (10/19)
Item 2. Code of Ethics.
(a) The registrant has adopted a code of ethics that applies to the registrant’s principal executive officer, principal financial officer, principal accounting officer or controller, or persons performing similar functions. This code of ethics in included as an Exhibit.
(b) During the period covered by the report, with respect to the registrant’s code of ethics that applies to its principal executive officer, principal financial officer, principal accounting officer or controller, or persons performing similar functions; there have been no amendments to, nor any waivers granted from, a provision that relates to any element of the code of ethics definition enumerated in paragraph (b) of this Item 2.
Item 3. Audit Committee Financial Expert.
(a)(1) The registrant’s board of directors has determined that the registrant has at least one audit committee financial expert serving on its audit committee.
(a)(2) The audit committee financial experts are David L. Meyer and E. Lee Beard, who are “independent” for purposes of this Item 3 of Form N-CSR.
Item 4. Principal Accountant Fees and Services.
|
| 2019 |
| 2018 |
| ||
(a) Audit Fees (1) |
| $ | 96,000 |
| $ | 15,914 |
|
(b) Audit-Related Fees (2) |
| 0 |
| 0 |
| ||
(c) Tax Fees (3) |
| 28,500 |
| 6,366 |
| ||
(d) All Other Fees (4) |
| 0 |
| 0 |
| ||
(1) Audit fees include amounts related to the audit of the Registrant’s annual financial statements and services normally provided by the accountant in connection with statutory and regulatory filings. Audit fees billed were for professional services provided by Cohen & Company, Ltd for audit compliance, audit advice and audit planning.
(2) Represents the fee for assurance and related services by Cohen & Company, Ltd reasonably related to the performance of the audit of the Registrant’s financial statements that was not reported under (a) of this item.
(3) Represents the aggregate tax fee billed for professional services rendered by Cohen & Company, Ltd for tax compliance, tax advice, international tax fee transactions and tax planning. Such tax services included the review of income and excise tax returns for the Registrant.
(4) For the fiscal years ended August 31, 2019 and August 31, 2018, there were no fees billed for professional services rendered by Cohen & Company, Ltd to the Registrant, other than the services reported in (a) through (c) of this item.
Tax fees for 2019 and 2018 are for recurring tax fees for the preparation of the federal and state tax returns and procedures performed relating to the Registrant’s analysis of complex securities.
(e)(1) The Registrant’s Audit Committee must pre-approve non-audit services to be provided by the principal accountant and the fees charged with these services. The Committee may delegate authority to one or more Committee members to pre-approve these services, subject to subsequent review and approval by the Committee.
(e)(2) There were no services performed under Rule 2.01 (c)(7)(i)(C).
(f) Not applicable.
(g)
2019 |
| $ | 87,917 |
|
2018 |
| $ | 133,280 |
|
(h) The Registrant’s Audit Committee has evaluated the non-audit services that the principal accountant provided to the Registrant’s investment adviser (and the adviser’s relevant affiliated), which services the Committee did not pre-approve, and has concluded that the provision of those services was compatible with maintaining the accountant’s independence.
Item 5. Audit Committee of Listed Registrants.
Not applicable.
Item 6. Investments.
(a) Not applicable.
(b) Not applicable.
Item 7. Disclosure of Proxy Voting Policies and Procedures for Closed-End Management Investment Companies.
Not applicable.
Item 8. Portfolio Managers of Closed-End Management Investment Companies.
Not applicable.
Item 9. Purchases of Equity Securities by Closed-End Management Investment Company and Affiliated Purchasers.
Not applicable.
Item 10. Submission of Matters to a Vote of Security Holders.
Not applicable.
Item 11. Controls and Procedures.
(a)The registrant’s principal executive officer and principal financial officer have concluded, based on their evaluation of the registrant’s disclosure controls and procedures as conducted within 90 days of the filing date of this report, that these disclosure controls and procedures are adequately designed and are operating effectively to ensure that information required to be disclosed by the registrant on Form N-CSR is recorded, processed, summarized and reported within the time periods specified in the Securities and Exchange Commission’s rules and forms.
(b)There were no changes in the registrant’s internal control over financial reporting (as defined in Rule 30a-3(d) under the Investment Company Act of 1940 (17 CFR 270.30a-3(d)) that occurred during the period covered by this report that have materially affected or are reasonably likely to materially affect, the registrant’s internal control over financial reporting.
Item 12. Disclosure of Securities Lending Activities for Closed-End Management Investment Companies.
(a)(1) Not applicable.
(a)(2) Not applicable.
(a)(3) Not applicable.
(a)(4) Not applicable.
(b) Not applicable.
Item 13. Exhibits.
(a)(1) The code of ethics that is the subject of the disclosure required by Item 2 is attached hereto.
(a)(2) Certifications pursuant to Rule 30a-2(a) are attached hereto.
(a)(3) Not applicable.
(b) Certifications pursuant to Rule 30a-2(b) are furnished herewith.
SIGNATURES
Pursuant to the requirements of the Securities Exchange Act of 1934 and the Investment Company Act of 1940, the registrant has duly caused this report to be signed on its behalf by the undersigned, thereunto duly authorized.
(Registrant) | Victory Portfolios |
| ||
|
|
| ||
By (Signature and Title)* | /s/ Allan Shaer |
| ||
| Allan Shaer, Principal Financial Officer |
| ||
|
|
|
| |
Date | December 26, 2019 |
| ||
Pursuant to the requirements of the Securities Exchange Act of 1934 and the Investment Company Act of 1940, this report has been signed below by the following persons on behalf of the registrant and in the capacities and on the dates indicated.
By (Signature and Title)* | /s/ Christopher K. Dyer |
| |
|
| Christopher K. Dyer, Principal Executive Officer |
|
|
|
|
|
Date | December 24, 2019 |
| |
|
|
|
|
By (Signature and Title)* | /s/ Allan Shaer |
| |
|
| Allan Shaer, Principal Financial Officer |
|
|
|
|
|
Date | December 26, 2019 |
| |