UNITED STATES
SECURITIES AND EXCHANGE COMMISSION
Washington, D.C. 20549
FORM N-CSR
CERTIFIED SHAREHOLDER REPORT OF REGISTERED
MANAGEMENT INVESTMENT COMPANIES
| Investment Company Act file number: | 811-04852 |
Victory Portfolios
(Exact name of registrant as specified in charter)
| 4900 Tiedeman Road, 4th Floor, Brooklyn, Ohio | 44144 | |
| (Address of principal executive offices) | (Zip code) |
Citi Fund Services Ohio, Inc., 4400 Easton Commons, Suite 200, Columbus, Ohio 43219
(Name and address of agent for service)
Registrant’s telephone number, including area code: 800-539-3863
Date of fiscal year end: December 31
Date of reporting period: June 30, 2020
Item 1. Reports to Stockholders.

June 30, 2020
Semi Annual Report
Victory INCORE Investment Quality Bond Fund
Victory INCORE Low Duration Bond Fund
Victory High Yield Fund
Victory Tax-Exempt Fund
Victory High Income Municipal Bond Fund
Victory Floating Rate Fund
Victory Strategic Income Fund
Beginning January 1, 2021, as permitted by regulations adopted by the Securities and Exchange Commission, paper copies of the Victory Funds' shareholder reports will no longer be sent by mail, unless you specifically request paper copies of the reports from the Victory Funds or from your financial intermediary, such as a broker-dealer or bank. Instead, the reports will be made available on www.VictoryFunds.com, and you will be notified by mail each time a report is posted and provided with a website link to access the report. If you already elected to receive shareholder reports electronically, you will not be affected by this change, and you need not take any action.
You may elect to receive shareholder reports and other communications from the Victory Funds or your financial intermediary electronically sooner than January 1, 2021 by notifying your financial intermediary directly or, if you are a direct investor, by calling 800-539-3863 or by sending an e-mail request to TA.Processing@FISGlobal.com.
You may elect to receive all future reports in paper free of charge. If you invest through a financial intermediary, you can contact your financial intermediary to request that you continue to receive paper copies of your reports. If you invest directly with the Victory Funds, you can call 800-539-3863 or send an e-mail request to TA.Processing@FISGlobal.com. Your election to receive reports in paper will apply to all Victory Funds you hold directly or through your financial intermediary.
www.vcm.com
News, Information And Education 24 Hours A Day, 7 Days A Week
The Victory Funds site gives fund shareholders, prospective shareholders, and investment professionals a convenient way to access fund information, get guidance, and track fund performance anywhere they can access the Internet. The site includes:
• Detailed performance records
• Daily share prices
• The latest fund news
• Investment resources to help you become a better investor
• A section dedicated to investment professionals
Whether you're a potential investor searching for the fund that matches your investment philosophy, a seasoned investor interested in planning tools, or an investment professional, www.vcm.com has what you seek. Visit us anytime. We're always open.
Victory Portfolios
Table of Contents
Financial Statements | |||||||
The Victory Fixed Income Funds | |||||||
Victory INCORE Investment Quality Bond Fund | |||||||
Investment Objectives & Portfolio Holdings | 5 | ||||||
Schedule of Portfolio Investments | 7 | ||||||
Statements of Assets and Liabilities | 44 | ||||||
Statements of Operations | 47 | ||||||
Statements of Changes in Net Assets | 50-52 | ||||||
Financial Highlights | 58-59 | ||||||
Victory INCORE Low Duration Bond Fund | |||||||
Investment Objectives & Portfolio Holdings | 5 | ||||||
Schedule of Portfolio Investments | 14 | ||||||
Statements of Assets and Liabilities | 44 | ||||||
Statements of Operations | 47 | ||||||
Statements of Changes in Net Assets | 50-52 | ||||||
Financial Highlights | 60-63 | ||||||
Victory High Yield Fund | |||||||
Investment Objectives & Portfolio Holdings | 5 | ||||||
Schedule of Portfolio Investments | 20 | ||||||
Statements of Assets and Liabilities | 44 | ||||||
Statements of Operations | 47 | ||||||
Statements of Changes in Net Assets | 50-52 | ||||||
Financial Highlights | 64-65 | ||||||
Victory Tax-Exempt Fund | |||||||
Investment Objectives & Portfolio Holdings | 5 | ||||||
Schedule of Portfolio Investments | 26 | ||||||
Statements of Assets and Liabilities | 45 | ||||||
Statements of Operations | 48 | ||||||
Statements of Changes in Net Assets | 53-55 | ||||||
Financial Highlights | 66-67 | ||||||
Victory High Income Municipal Bond Fund | |||||||
Investment Objectives & Portfolio Holdings | 6 | ||||||
Schedule of Portfolio Investments | 29 | ||||||
Statements of Assets and Liabilities | 45 | ||||||
Statements of Operations | 48 | ||||||
Statements of Changes in Net Assets | 53-55 | ||||||
Financial Highlights | 68-69 | ||||||
Victory Floating Rate Fund | |||||||
Investment Objectives & Portfolio Holdings | 6 | ||||||
Schedule of Portfolio Investments | 32 | ||||||
Statements of Assets and Liabilities | 45 | ||||||
Statements of Operations | 48 | ||||||
Statements of Changes in Net Assets | 53-55 | ||||||
Financial Highlights | 70-71 | ||||||
Victory Strategic Income Fund | |||||||
Investment Objectives & Portfolio Holdings | 6 | ||||||
Schedule of Portfolio Investments | 38 | ||||||
Statement of Assets and Liabilities | 46 | ||||||
Statement of Operations | 49 | ||||||
Statements of Changes in Net Assets | 56-57 | ||||||
Financial Highlights | 72-75 | ||||||
1
Table of Contents (continued)
Notes to Financial Statements | 76 | ||||||
Supplemental Information | 91 | ||||||
| Proxy Voting and Portfolio Holdings Information | 91 | ||||||
Expense Examples | 91 | ||||||
Liquidity Risk Management Program | 93 | ||||||
Privacy Policy (inside back cover) | |||||||
2
The Funds are distributed by Victory Capital Services, Inc. Victory Capital Management Inc. is the investment adviser to the Funds and receives fees from the Funds for performing services for the Funds.
This report is not authorized for distribution to prospective investors unless preceded or accompanied by a current prospectus of the Victory Funds.
For additional information about any Victory Fund, including fees, expenses, and risks, view our prospectus online at www.vcm.com or call 800-539-3863. Read it carefully before you invest or send money.
The information in this semi annual report is based on data obtained from recognized services and sources and is believed to be reliable. Any opinions, projections, or recommendations in this report are subject to change without notice and are not intended as individual investment advice. Past investment performance of the Funds, markets or securities mentioned herein should not be considered to be indicative of future results.
• NOT FDIC INSURED • NO BANK GUARANTEE • MAY LOSE VALUE

Call Victory at:
800-539-FUND (800-539-3863)
Visit our website at:
www.vcm.com
3
This page is intentionally left blank.
4
Victory Portfolios | June 30, 2020 | ||||||
(Unaudited)
Investment Objectives & Portfolio Holdings:
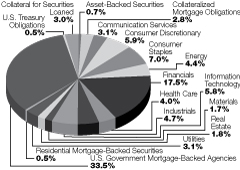
Victory INCORE Investment Quality Bond Fund
Seeks to provide a high level of current income
and capital appreciation without undue risk to principal.
Portfolio Holdings
As a Percentage of Total Investments
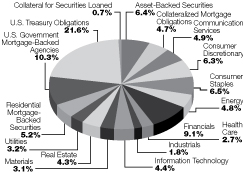
Victory INCORE Low Duration Bond Fund
Seeks to provide a high level of current income
consistent with preservation of capital.
Portfolio Holdings
As a Percentage of Total Investments
Victory High Yield Fund
Seeks to provide current income. Capital
appreciation is a secondary objective.
Portfolio Holdings
As a Percentage of Total Investments

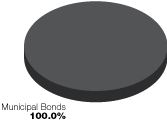
Victory Tax-Exempt Fund
Seeks to maximize current income exempt from
federal income taxes, consistent with the
preservation of capital.
Portfolio Holdings
As a Percentage of Total Investments
5
Victory Portfolios | June 30, 2020 | ||||||
(Unaudited)
Investment Objectives & Portfolio Holdings: (continued)
Victory High Income Municipal Bond Fund
Seeks to provide a high current income exempt
from federal income taxes with a secondary
objective of capital appreciation.
Portfolio Holdings
As a Percentage of Total Investments

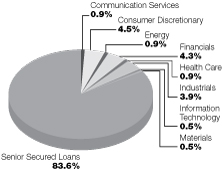
Victory Floating Rate Fund
Seeks to provide a high level of current income.
Portfolio Holdings
As a Percentage of Total Investments
Victory Strategic Income Fund
Seeks to provide a high current income with a
secondary objective of capital appreciation.
Portfolio Holdings
As a Percentage of Total Investments

6
| Victory Portfolios Victory INCORE Investment Quality Bond Fund | Schedule of Portfolio Investments June 30, 2020 | ||||||
(Unaudited)
Security Description | Principal Amount | Value | |||||||||
Asset-Backed Securities (0.6%) | |||||||||||
| Santander Drive Auto Receivables Trust, Series 2020-1, Class A2A, 2.07%, 1/17/23, Callable 2/15/25 @ 100 (a) | $ | 70,000 | $ | 70,578 | |||||||
| Synchrony Credit Card Master Note Trust, Series 2018-1, Class A, 2.97%, 3/15/24 | 130,000 | 131,807 | |||||||||
Total Asset-Backed Securities (Cost $200,417) | 202,385 | ||||||||||
Collateralized Mortgage Obligations (2.6%) | |||||||||||
BANK, Series 2020-BN26, Class AS, 2.69%, 3/15/63 | 130,000 | 133,048 | |||||||||
| Citigroup Commercial Mortgage Trust, Series 2020-GC46, Class AS, 2.92%, 1/15/53 | 117,000 | 121,457 | |||||||||
GS Mortgage Securities Trust, Series 2012-GC6, Class B, 5.84%, 1/10/45 (a) (b) (c) | 250,000 | 250,392 | |||||||||
WF-RBS Commercial Mortgage Trust, Series 2012-C6, Class B, 4.70%, 4/15/45 | 300,000 | 307,612 | |||||||||
Total Collateralized Mortgage Obligations (Cost $869,907) | 812,509 | ||||||||||
Corporate Bonds (54.2%) | |||||||||||
Communication Services (2.9%): | |||||||||||
Activision Blizzard, Inc., 2.60%, 6/15/22, Callable 5/15/22 @ 100 (a) | 55,000 | 57,067 | |||||||||
| AT&T, Inc. 3.20%, 3/1/22 (a) (d) | 77,000 | 80,331 | |||||||||
4.25%, 3/1/27, Callable 12/1/26 @ 100 (a) | 76,000 | 86,913 | |||||||||
5.15%, 11/15/46, Callable 5/15/46 @ 100 (a) | 126,000 | 154,963 | |||||||||
| Comcast Corp. 3.45%, 2/1/50, Callable 8/1/49 @ 100 | 70,000 | 79,335 | |||||||||
2.80%, 1/15/51, Callable 7/15/50 @ 100 (d) | 56,000 | 57,272 | |||||||||
| Verizon Communications, Inc. 5.15%, 9/15/23 (a) | 60,000 | 68,439 | |||||||||
3.38%, 2/15/25 (a) | 38,000 | 42,290 | |||||||||
| Vodafone Group PLC 3.75%, 1/16/24 | 142,000 | 155,464 | |||||||||
5.25%, 5/30/48 | 89,000 | 115,436 | |||||||||
897,510 | |||||||||||
Consumer Discretionary (5.2%): | |||||||||||
D.R. Horton, Inc., 2.50%, 10/15/24, Callable 9/15/24 @ 100 | 315,000 | 328,207 | |||||||||
General Motors Co., 4.88%, 10/2/23 (a) | 96,000 | 101,942 | |||||||||
| Hasbro, Inc. 2.60%, 11/19/22 (d) | 130,000 | 133,780 | |||||||||
6.35%, 3/15/40 | 75,000 | 85,767 | |||||||||
Lear Corp., 3.50%, 5/30/30, Callable 2/28/30 @ 100 | 52,000 | 51,275 | |||||||||
Magna International, Inc., 3.63%, 6/15/24, Callable 3/15/24 @ 100 | 245,000 | 269,221 | |||||||||
NIKE, Inc., 3.88%, 11/1/45, Callable 5/1/45 @ 100 | 100,000 | 122,774 | |||||||||
| NVR, Inc. 3.95%, 9/15/22, Callable 6/15/22 @ 100 (a) | 126,000 | 133,695 | |||||||||
3.00%, 5/15/30, Callable 11/15/29 @ 100 | 118,000 | 123,078 | |||||||||
Ross Stores, Inc., 3.38%, 9/15/24, Callable 6/15/24 @ 100 | 70,000 | 74,908 | |||||||||
See notes to financial statements.
7
| Victory Portfolios Victory INCORE Investment Quality Bond Fund | Schedule of Portfolio Investments — continued June 30, 2020 | ||||||
(Unaudited)
Security Description | Principal Amount | Value | |||||||||
| Starbucks Corp. 3.80%, 8/15/25, Callable 6/15/25 @ 100 | $ | 61,000 | $ | 68,870 | |||||||
2.25%, 3/12/30, Callable 12/12/29 @ 100 | 92,000 | 95,638 | |||||||||
4.50%, 11/15/48, Callable 5/15/48 @ 100 | 49,000 | 58,250 | |||||||||
1,647,405 | |||||||||||
Consumer Staples (6.4%): | |||||||||||
Altria Group, Inc., 4.40%, 2/14/26, Callable 12/14/25 @ 100 (a) | 64,000 | 73,589 | |||||||||
BAT Capital Corp., 5.28%, 4/2/50 (d) | 75,000 | 90,815 | |||||||||
Church & Dwight Co., Inc., 2.45%, 8/1/22, Callable 7/1/22 @ 100 (a) | 30,000 | 30,965 | |||||||||
Constellation Brands, Inc., 4.65%, 11/15/28, Callable 8/15/28 @ 100 (a) | 55,000 | 64,951 | |||||||||
Estee Lauder Cos., Inc., 4.15%, 3/15/47, Callable 9/15/46 @ 100 | 52,000 | 64,990 | |||||||||
Hormel Foods Corp., 1.80%, 6/11/30, Callable 3/11/30 @ 100 | 160,000 | 162,839 | |||||||||
| Kerry Group Financial Services Unlimited Co., 3.20%, 4/9/23, Callable 1/9/23 @ 100 (a) (b) | 400,000 | 417,996 | |||||||||
| Keurig Dr Pepper, Inc. 4.06%, 5/25/23, Callable 4/25/23 @ 100 (a) | 160,000 | 174,275 | |||||||||
5.09%, 5/25/48, Callable 11/25/47 @ 100 | 40,000 | 53,048 | |||||||||
Mead Johnson Nutrition Co., 4.60%, 6/1/44, Callable 12/1/43 @ 100 (a) | 105,000 | 133,199 | |||||||||
Reynolds American, Inc., 5.70%, 8/15/35, Callable 2/15/35 @ 100 | 92,000 | 112,587 | |||||||||
| Suntory Holdings Ltd. 2.55%, 6/28/22, Callable 5/28/22 @ 100 (a) (b) | 258,000 | 265,559 | |||||||||
2.25%, 10/16/24, Callable 9/16/24 @ 100 (b) | 200,000 | 208,026 | |||||||||
The Coca-Cola Co., 2.95%, 3/25/25 | 117,000 | 128,795 | |||||||||
Tyson Foods, Inc., 5.10%, 9/28/48, Callable 3/28/48 @ 100 | 39,000 | 50,294 | |||||||||
2,031,928 | |||||||||||
Energy (4.1%): | |||||||||||
| Canadian Natural Resources Ltd. 2.95%, 1/15/23, Callable 12/15/22 @ 100 | 65,000 | 67,135 | |||||||||
2.05%, 7/15/25, Callable 6/15/25 @ 100 | 163,000 | 163,122 | |||||||||
Continental Resources, Inc., 4.50%, 4/15/23, Callable 1/15/23 @ 100 (a) | 113,000 | 108,160 | |||||||||
Ecopetrol SA, 5.88%, 9/18/23 (a) | 133,000 | 142,829 | |||||||||
EQM Midstream Partners LP, 4.75%, 7/15/23, Callable 6/15/23 @ 100 (a) | 113,000 | 113,861 | |||||||||
Exxon Mobil Corp., 4.11%, 3/1/46, Callable 9/1/45 @ 100 | 40,000 | 48,090 | |||||||||
| Marathon Petroleum Corp. 6.50%, 3/1/41, Callable 9/1/40 @ 100 | 65,000 | 80,517 | |||||||||
5.85%, 12/15/45, Callable 6/15/45 @ 100 | 50,000 | 54,084 | |||||||||
| Plains All American Pipeline LP/PAA Finance Corp. 2.85%, 1/31/23, Callable 10/31/22 @ 100 (a) | 120,000 | 121,315 | |||||||||
3.80%, 9/15/30, Callable 6/15/30 @ 100 | 90,000 | 88,270 | |||||||||
Statoil ASA, 3.95%, 5/15/43 | 20,000 | 22,954 | |||||||||
| Valero Energy Corp. 4.00%, 4/1/29, Callable 1/1/29 @ 100 (a) | 62,000 | 69,141 | |||||||||
6.63%, 6/15/37 | 140,000 | 183,161 | |||||||||
1,262,639 | |||||||||||
Financials (16.1%): | |||||||||||
| Aflac, Inc. 2.88%, 10/15/26, Callable 7/15/26 @ 100 | 185,000 | 203,715 | |||||||||
4.75%, 1/15/49, Callable 7/15/48 @ 100 | 20,000 | 25,656 | |||||||||
See notes to financial statements.
8
| Victory Portfolios Victory INCORE Investment Quality Bond Fund | Schedule of Portfolio Investments — continued June 30, 2020 | ||||||
(Unaudited)
Security Description | Principal Amount | Value | |||||||||
| Alleghany Corp. 3.63%, 5/15/30, Callable 2/15/30 @ 100 | $ | 55,000 | $ | 58,662 | |||||||
4.90%, 9/15/44, Callable 3/15/44 @ 100 | 89,000 | 104,551 | |||||||||
| Bank of America Corp. 2.33% (LIBOR03M+63bps), 10/1/21, Callable 10/1/20 @ 100 (a) (e) | 130,000 | 130,521 | |||||||||
2.50%, 10/21/22, Callable 10/21/21 @ 100, MTN | 285,000 | 291,741 | |||||||||
4.20%, 8/26/24, MTN (a) | 51,000 | 56,580 | |||||||||
3.25%, 10/21/27, Callable 10/21/26 @ 100, MTN | 100,000 | 110,515 | |||||||||
Capital One Financial Corp., 3.30%, 10/30/24, Callable 9/30/24 @ 100 (a) | 72,000 | 77,452 | |||||||||
Cincinnati Financial Corp., 6.13%, 11/1/34 | 100,000 | 140,013 | |||||||||
| Citigroup, Inc. 2.75%, 4/25/22, Callable 3/25/22 @ 100 | 175,000 | 181,290 | |||||||||
3.88%, 3/26/25 | 35,000 | 38,291 | |||||||||
4.60%, 3/9/26 (a) | 36,000 | 41,049 | |||||||||
4.45%, 9/29/27 (a) | 63,000 | 71,660 | |||||||||
3.88% (LIBOR03M+117bps), 1/24/39, Callable 1/24/38 @ 100 (e) | 51,000 | 59,046 | |||||||||
Enel Finance International NV, 2.88%, 5/25/22 (a) (b) | 200,000 | 206,752 | |||||||||
| Fifth Third Bancorp 1.63%, 5/5/23, Callable 4/5/23 @ 100 | 55,000 | 56,323 | |||||||||
3.65%, 1/25/24, Callable 12/25/23 @ 100 (a) | 261,000 | 284,485 | |||||||||
Ford Motor Credit Co. LLC, 4.06%, 11/1/24, Callable 10/1/24 @ 100 | 200,000 | 190,590 | |||||||||
General Motors Financial Co., Inc., 4.15%, 6/19/23, Callable 5/19/23 @ 100 | 49,000 | 51,140 | |||||||||
| JPMorgan Chase & Co. 2.95%, 10/1/26, Callable 7/1/26 @ 100 | 170,000 | 186,329 | |||||||||
5.60%, 7/15/41 | 52,000 | 75,401 | |||||||||
KeyCorp, 2.25%, 4/6/27, MTN | 108,000 | 113,045 | |||||||||
| Morgan Stanley 4.88%, 11/1/22 (a) | 144,000 | 156,581 | |||||||||
3.75%, 2/25/23 (a) | 300,000 | 323,431 | |||||||||
3.13%, 7/27/26, MTN | 305,000 | 336,376 | |||||||||
| Newcrest Finance Pty Ltd. 5.75%, 11/15/41 (b) | 95,000 | 123,767 | |||||||||
4.20%, 5/13/50, Callable 11/13/49 @ 100 (b) (d) | 25,000 | 27,784 | |||||||||
NXP BV/NXP Funding LLC, 4.63%, 6/1/23 (b) | 200,000 | 218,712 | |||||||||
| NXP BV/NXP Funding LLC/NXP USA, Inc., 2.70%, 5/1/25, Callable 4/1/25 @ 100 (b) (d) | 77,000 | 80,630 | |||||||||
Regions Financial Corp., 2.25%, 5/18/25, Callable 4/18/25 @ 100 | 105,000 | 109,900 | |||||||||
SVB Financial Group, 3.13%, 6/5/30, Callable 3/5/30 @ 100 | 63,000 | 67,545 | |||||||||
The Goldman Sachs Group, Inc., 2.35%, 11/15/21, Callable 11/15/20 @ 100 | 115,000 | 115,706 | |||||||||
Total Capital International SA, 2.99%, 6/29/41, Callable 12/29/40 @ 100 (d) | 85,000 | 86,860 | |||||||||
Truist Financial Corp., 2.75%, 4/1/22, MTN, Callable 3/1/22 @ 100 | 260,000 | 269,433 | |||||||||
Unum Group, 4.00%, 6/15/29, Callable 3/15/29 @ 100 | 92,000 | 95,014 | |||||||||
| Wells Fargo & Co. 4.30%, 7/22/27, MTN | 180,000 | 205,904 | |||||||||
4.90%, 11/17/45 (a) | 80,000 | 102,493 | |||||||||
5,074,943 | |||||||||||
Health Care (3.7%): | |||||||||||
AbbVie, Inc., 3.20%, 11/21/29, Callable 8/21/29 @ 100 (a) (b) | 135,000 | 148,188 | |||||||||
Amgen, Inc., 4.40%, 5/1/45, Callable 11/1/44 @ 100 | 70,000 | 86,770 | |||||||||
Anthem, Inc., 2.38%, 1/15/25, Callable 12/15/24 @ 100 | 65,000 | 68,894 | |||||||||
See notes to financial statements.
9
| Victory Portfolios Victory INCORE Investment Quality Bond Fund | Schedule of Portfolio Investments — continued June 30, 2020 | ||||||
(Unaudited)
Security Description | Principal Amount | Value | |||||||||
Bristol-Myers Squibb Co., 3.40%, 7/26/29, Callable 4/26/29 @ 100 (b) | $ | 220,000 | $ | 254,023 | |||||||
Gilead Sciences, Inc., 4.40%, 12/1/21, Callable 9/1/21 @ 100 (a) | 318,000 | 332,873 | |||||||||
HCA, Inc., 4.13%, 6/15/29, Callable 3/15/29 @ 100 | 91,000 | 100,406 | |||||||||
Humana, Inc., 2.90%, 12/15/22, Callable 11/15/22 @ 100 (a) | 65,000 | 67,950 | |||||||||
Merck & Co., Inc., 2.45%, 6/24/50, Callable 12/24/49 @ 100 | 59,000 | 59,276 | |||||||||
Upjohn, Inc., 2.30%, 6/22/27, Callable 4/22/27 @ 100 (b) | 40,000 | 41,261 | |||||||||
1,159,641 | |||||||||||
Industrials (4.3%): | |||||||||||
Canadian National Railway Co., 3.20%, 8/2/46, Callable 2/2/46 @ 100 | 60,000 | 66,407 | |||||||||
Carlisle Cos., Inc., 2.75%, 3/1/30, Callable 12/1/29 @ 100 (d) | 75,000 | 77,174 | |||||||||
Delta Air Lines, Inc., 3.80%, 4/19/23, Callable 3/19/23 @ 100 (a) | 130,000 | 115,612 | |||||||||
Hillenbrand, Inc., 4.50%, 9/15/26, Callable 7/15/26 @ 100 | 195,000 | 200,662 | |||||||||
IDEX Corp., 3.00%, 5/1/30, Callable 2/1/30 @ 100 | 107,000 | 111,808 | |||||||||
Kansas City Southern, 4.95%, 8/15/45, Callable 2/15/45 @ 100 | 75,000 | 96,930 | |||||||||
Oshkosh Corp., 3.10%, 3/1/30, Callable 12/1/29 @ 100 | 60,000 | 60,262 | |||||||||
PACCAR Financial Corp., 0.80%, 6/8/23, MTN | 100,000 | 100,360 | |||||||||
| Rockwell Automation, Inc. 3.50%, 3/1/29, Callable 12/1/28 @ 100 (d) | 65,000 | 73,305 | |||||||||
6.25%, 12/1/37 | 60,000 | 83,456 | |||||||||
Roper Technologies, Inc., 2.95%, 9/15/29, Callable 6/15/29 @ 100 (a) | 167,000 | 181,933 | |||||||||
Snap-on, Inc., 4.10%, 3/1/48, Callable 9/1/47 @ 100 | 56,000 | 66,383 | |||||||||
Valmont Industries, Inc., 5.00%, 10/1/44, Callable 4/1/44 @ 100 (a) | 137,000 | 140,451 | |||||||||
1,374,743 | |||||||||||
Information Technology (5.4%): | |||||||||||
Apple, Inc., 4.65%, 2/23/46, Callable 8/23/45 @ 100 | 53,000 | 72,869 | |||||||||
Broadcom Corp., 3.00%, 1/15/22, Callable 12/15/21 @ 100 (a) (d) | 77,000 | 79,020 | |||||||||
Broadcom, Inc., 5.00%, 4/15/30, Callable 1/15/30 @ 100 (b) | 140,000 | 160,697 | |||||||||
Cadence Design Systems, Inc., 4.38%, 10/15/24, Callable 7/15/24 @ 100 | 153,000 | 170,298 | |||||||||
Intel Corp., 3.40%, 3/25/25, Callable 2/25/25 @ 100 | 102,000 | 114,442 | |||||||||
Lam Research Corp., 4.00%, 3/15/29, Callable 12/15/28 @ 100 (a) | 59,000 | 70,043 | |||||||||
| Micron Technology, Inc. 4.19%, 2/15/27, Callable 12/15/26 @ 100 | 49,000 | 54,895 | |||||||||
5.33%, 2/6/29, Callable 11/6/28 @ 100 | 130,000 | 155,396 | |||||||||
| NetApp, Inc. 3.25%, 12/15/22, Callable 9/15/22 @ 100 | 70,000 | 72,765 | |||||||||
1.88%, 6/22/25, Callable 5/22/25 @ 100 | 126,000 | 127,781 | |||||||||
NVIDIA Corp., 2.20%, 9/16/21, Callable 8/16/21 @ 100 | 85,000 | 86,664 | |||||||||
PayPal Holdings, Inc., 1.65%, 6/1/25, Callable 5/1/25 @ 100 | 184,000 | 190,363 | |||||||||
Texas Instruments, Inc., 4.15%, 5/15/48, Callable 11/15/47 @ 100 | 66,000 | 85,628 | |||||||||
Tyco Electronics Group SA, 7.13%, 10/1/37 | 34,000 | 51,937 | |||||||||
VMware, Inc., 2.95%, 8/21/22, Callable 7/21/22 @ 100 | 170,000 | 175,896 | |||||||||
1,668,694 | |||||||||||
Materials (1.5%): | |||||||||||
Celanese US Holdings LLC, 4.63%, 11/15/22 (a) | 100,000 | 106,237 | |||||||||
LYB International Finance II BV, 3.50%, 3/2/27, Callable 12/2/26 @ 100 (a) (d) | 61,000 | 66,494 | |||||||||
| Nucor Corp. 2.00%, 6/1/25, Callable 5/1/25 @ 100 (d) | 71,000 | 73,531 | |||||||||
4.40%, 5/1/48, Callable 11/1/47 @ 100 | 46,000 | 55,460 | |||||||||
See notes to financial statements.
10
| Victory Portfolios Victory INCORE Investment Quality Bond Fund | Schedule of Portfolio Investments — continued June 30, 2020 | ||||||
(Unaudited)
Security Description | Principal Amount | Value | |||||||||
| Rio Tinto Finance USA Ltd. 3.75%, 6/15/25, Callable 3/15/25 @ 100 | $ | 80,000 | $ | 90,600 | |||||||
5.20%, 11/2/40 | 50,000 | 69,981 | |||||||||
Steel Dynamics, Inc., 2.40%, 6/15/25, Callable 5/15/25 @ 100 (d) | 22,000 | 22,613 | |||||||||
484,916 | |||||||||||
Real Estate (1.7%): | |||||||||||
Duke Realty LP, 3.05%, 3/1/50, Callable 9/1/49 @ 100 | 72,000 | 75,303 | |||||||||
Highwoods Realty LP, 3.63%, 1/15/23, Callable 10/15/22 @ 100 | 285,000 | 295,119 | |||||||||
Retail Properties of America, Inc., 4.00%, 3/15/25, Callable 12/15/24 @ 100 | 155,000 | 150,893 | |||||||||
521,315 | |||||||||||
Utilities (2.9%): | |||||||||||
Arizona Public Service Co., 2.95%, 9/15/27, Callable 6/15/27 @ 100 | 120,000 | 129,544 | |||||||||
Consolidated Edison, Inc., 6.30%, 8/15/37 | 110,000 | 157,606 | |||||||||
| Iberdrola International BV 6.75%, 9/15/33 (d) | 35,000 | 48,111 | |||||||||
6.75%, 7/15/36 | 47,000 | 65,466 | |||||||||
NextEra Energy Capital Holdings, Inc., 2.80%, 1/15/23, Callable 12/15/22 @ 100 (a) | 145,000 | 152,309 | |||||||||
Oklahoma G&E Co., 5.25%, 5/15/41, Callable 11/15/40 @ 100 | 105,000 | 129,743 | |||||||||
Public Service Electric & Gas Co., 4.00%, 6/1/44, Callable 12/1/43 @ 100 | 65,000 | 76,364 | |||||||||
Vistra Operations Co. LLC, 3.70%, 1/30/27, Callable 11/30/26 @ 100 (b) | 134,000 | 137,528 | |||||||||
896,671 | |||||||||||
Total Corporate Bonds (Cost $16,092,862) | 17,020,405 | ||||||||||
Residential Mortgage-Backed Securities (0.5%) | |||||||||||
| Credit Suisse First Boston Mortgage Securities Corp., Series 2002-HE16, Class M1, 1.50% (LIBOR01M+132bps), 10/25/32, Callable 7/25/20 @ 100 (e) | 69,239 | 67,638 | |||||||||
| JPMorgan Mortgage Trust, Series 2004-S2, Class 1A3, 4.75%, 12/31/20, Callable 7/25/20 @ 100 (a) | 6,576 | 4,969 | |||||||||
| JPMorgan Mortgage Trust, Series 2016-4, Class A5, 3.50%, 10/25/46, Callable 9/25/23 @ 100 (a) (b) (c) | 77,964 | 79,200 | |||||||||
Total Residential Mortgage-Backed Securities (Cost $153,755) | 151,807 | ||||||||||
U.S. Government Mortgage-Backed Agencies (30.8%) | |||||||||||
| Federal Home Loan Mortgage Corp. 5.00%, 6/15/23 (a) | 21,290 | 22,307 | |||||||||
Series 4395, Class PA, 2.50%, 4/15/37 – 7/1/50 (a) | 273,458 | 286,636 | |||||||||
5.50%, 6/1/38 | 42,930 | 49,768 | |||||||||
7.00%, 9/1/38 (a) | 10,115 | 12,824 | |||||||||
Series 4320, Class AP, 3.50%, 7/15/39 – 12/15/48 (a) | 1,011,089 | 1,086,487 | |||||||||
4.50%, 1/1/41 – 7/1/44 (a) | 529,894 | 590,797 | |||||||||
Series 4444, Class CH, 3.00%, 1/15/41 (a) | 116,003 | 118,969 | |||||||||
Series 4049, Class AB, 2.75%, 12/15/41 (a) | 66,258 | 68,080 | |||||||||
Series 4494, Class JA, 3.75%, 5/15/42 (a) | 242,458 | 253,106 | |||||||||
2,488,974 | |||||||||||
See notes to financial statements.
11
| Victory Portfolios Victory INCORE Investment Quality Bond Fund | Schedule of Portfolio Investments — continued June 30, 2020 | ||||||
(Unaudited)
Security Description | Shares or Principal Amount | Value | |||||||||
| Federal National Mortgage Association 6.00%, 8/1/21 – 2/1/37 (a) | $ | 76,364 | $ | 90,206 | |||||||
5.50%, 4/1/22 – 1/1/38 (a) | 144,050 | 165,968 | |||||||||
7.00%, 8/1/23 – 6/1/32 | 20,040 | 24,204 | |||||||||
7.50%, 12/1/29 – 2/1/31 (a) | 19,807 | 23,195 | |||||||||
8.00%, 6/1/30 – 9/1/30 | 12,767 | 15,321 | |||||||||
5.00%, 12/1/34 – 3/1/40 | 75,635 | 86,451 | |||||||||
3.79% (LIBOR12M+166bps), 12/1/36 (a) (e) | 27,044 | 27,764 | |||||||||
4.50%, 12/1/38 – 5/25/40 (a) | 372,860 | 399,866 | |||||||||
Series 2013-33, Class UD, 2.50%, 4/25/39 – 12/25/47 (a) | 732,168 | 765,222 | |||||||||
3.50%, 8/1/39 – 12/25/50 | 1,623,542 | 1,705,544 | |||||||||
3.00%, 7/1/40 – 2/25/49 | 2,430,376 | 2,575,861 | |||||||||
4.00%, 11/1/43 – 6/1/49 (a) | 932,780 | 1,025,909 | |||||||||
6,905,511 | |||||||||||
| Government National Mortgage Association 4.50%, 10/20/49 | 108,604 | 115,999 | |||||||||
3.00%, 2/20/50 | 123,516 | 131,023 | |||||||||
247,022 | |||||||||||
Multi-family (0.1%): | |||||||||||
Collateralized Mortgage Obligations (0.1%): | |||||||||||
| Government National Mortgage Association 6.00%, 12/15/33 (a) | 20,252 | 23,997 | |||||||||
Total U.S. Government Mortgage-Backed Agencies (Cost $9,320,174) | 9,665,504 | ||||||||||
U.S. Treasury Obligations (0.5%) | |||||||||||
U.S. Treasury Bonds, 2.00%, 2/15/50 (a) | 125,000 | 143,164 | |||||||||
Total U.S. Treasury Obligations (Cost $136,745) | 143,164 | ||||||||||
Collateral for Securities Loaned^ (2.7%) | |||||||||||
BlackRock Liquidity Funds TempFund Portfolio, Institutional Class, 0.28% (f) | 14,295 | 14,295 | |||||||||
Fidelity Investments Money Market Government Portfolio, Class I, 0.09% (f) | 432,635 | 432,634 | |||||||||
| Goldman Sachs Financial Square Prime Obligations Fund, Institutional Class, 0.30% (f) | 99,404 | 99,404 | |||||||||
JPMorgan Prime Money Market Fund, Capital Class, 0.43% (f) | 56,882 | 56,882 | |||||||||
| Morgan Stanley Institutional Liquidity Prime Portfolio, Institutional Class, 0.41% (f) | 255,752 | 255,752 | |||||||||
Total Collateral for Securities Loaned (Cost $858,967) | 858,967 | ||||||||||
Total Investments (Cost $27,632,827) — 91.9% | 28,854,741 | ||||||||||
Other assets in excess of liabilities — 8.1% | 2,536,059 | ||||||||||
NET ASSETS — 100.00% | $ | 31,390,800 | |||||||||
^ Purchased with cash collateral from securities on loan.
(a) All or a portion of this security has been segregated as collateral for derivative instruments.
(b) Rule 144A security or other security that is restricted as to resale to institutional investors. The Fund's Adviser has deemed this security to be liquid based upon procedures approved by the Board of Trustees. As of June 30, 2020, the fair value of these securities was $2,620,515 and amounted to 8.3% of net assets.
See notes to financial statements.
12
| Victory Portfolios Victory INCORE Investment Quality Bond Fund | Schedule of Portfolio Investments — continued June 30, 2020 | ||||||
(Unaudited)
(c) The rate for certain asset-backed and mortgage-backed securities may vary based on factors relating to the pool of assets underlying the security. The rate disclosed is the rate in effect at June 30, 2020.
(d) All or a portion of this security is on loan.
(e) Variable or Floating-Rate Security. Rate disclosed is as of June 30, 2020.
(f) Rate disclosed is the daily yield on June 30, 2020.
bps — Basis points
LIBOR — London InterBank Offered Rate
LIBOR01M — 1 Month US Dollar LIBOR, rate disclosed as of June 30, 2020, based on the last reset date of the security
LIBOR03M — 3 Month US Dollar LIBOR, rate disclosed as of June 30, 2020, based on the last reset date of the security
LIBOR12M — 12 Month US Dollar LIBOR, rate disclosed as of June 30, 2020, based on the last reset date of the security
LLC — Limited Liability Company
LP — Limited Partnership
MTN — Medium Term Note
PLC — Public Limited Company
Futures Contracts Purchased
| Number of Contracts | Expiration Date | Notional Amount | Value | Unrealized Appreciation (Depreciation) | |||||||||||||||||||
2-Year U.S. Treasury Note Futures | 1 | 9/30/20 | $ | 220,691 | $ | 220,828 | $ | 137 | |||||||||||||||
5-Year U.S. Treasury Note Futures | 14 | 9/30/20 | 1,755,663 | 1,760,391 | 4,728 | ||||||||||||||||||
| Ultra Long-Term U.S. Treasury Bond Futures | 12 | 9/21/20 | 2,618,026 | 2,617,875 | (151 | ) | |||||||||||||||||
$ | 4,714 | ||||||||||||||||||||||
Futures Contracts Sold
| Number of Contracts | Expiration Date | Notional Amount | Value | Unrealized Appreciation (Depreciation) | |||||||||||||||||||
10-Year U.S. Treasury Note Futures | 8 | 9/21/20 | $ | 1,104,910 | $ | 1,113,375 | $ | (8,465 | ) | ||||||||||||||
Total unrealized appreciation | $ | 4,865 | |||||||||||||||||||||
Total unrealized depreciation | (8,616 | ) | |||||||||||||||||||||
Total net unrealized appreciation (depreciation) | $ | (3,751 | ) | ||||||||||||||||||||
See notes to financial statements.
13
| Victory Portfolios Victory INCORE Low Duration Bond Fund | Schedule of Portfolio Investments June 30, 2020 | ||||||
(Unaudited)
Security Description | Principal Amount | Value | |||||||||
Asset-Backed Securities (6.2%) | |||||||||||
| AmeriCredit Automobile Receivables Trust, Series 2016-3, Class C, 2.24%, 4/8/22, Callable 3/8/21 @ 100 (a) | $ | 2,799,973 | $ | 2,809,016 | |||||||
| AmeriCredit Automobile Receivables Trust, Series 2017-2, Class B, 2.40%, 5/18/22, Callable 1/18/22 @ 100 (a) | 1,925,521 | 1,932,921 | |||||||||
| AmeriCredit Automobile Receivables Trust, Series 2018-1, Class B, 3.26%, 1/18/24, Callable 10/18/22 @ 100 (a) | 3,200,000 | 3,281,638 | |||||||||
| Chrysler Capital Auto Receivables Trust, Series 2016-BA, Class B, 2.22%, 5/16/22, Callable 7/15/21 @ 100 (a) (b) | 4,180,000 | 4,198,133 | |||||||||
| Santander Drive Auto Receivables Trust, Series 2016-3, Class C, 2.46%, 3/15/22, Callable 2/15/21 @ 100 (a) | 618,526 | 619,304 | |||||||||
| Santander Drive Auto Receivables Trust, Series 2020-1, Class A2A, 2.07%, 1/17/23, Callable 2/15/25 @ 100 (a) | 540,000 | 544,457 | |||||||||
| Santander Retail Auto Lease Trust, Series 2018-A, Class B, 3.20%, 4/20/22, Callable 3/20/21 @ 100 (a) (b) | 2,400,000 | 2,407,874 | |||||||||
Total Asset-Backed Securities (Cost $15,662,725) | 15,793,343 | ||||||||||
Collateralized Mortgage Obligations (4.6%) | |||||||||||
| Benefit Street Partners CLO III Ltd., Series 2013-IIIA, Class AIR, 2.39% (LIBOR03M+125bps), 7/20/29, Callable 7/20/20 @ 100 (a) (b) (c) | 1,500,000 | 1,482,279 | |||||||||
| Galaxy CLO Ltd., Series 2017-24A, Class A, 2.34% (LIBOR03M+112bps), 1/15/31, Callable 7/15/20 @ 100 (a) (b) (c) | 2,000,000 | 1,947,531 | |||||||||
GS Mortgage Securities Trust, Series 2012-GC6, Class B, 5.84%, 1/10/45 (a) (b) (d) | 3,500,000 | 3,505,482 | |||||||||
| Steele Creek CLO Ltd., Series 2017-1A, Class A, 2.47% (LIBOR03M+125bps), 1/15/30, Callable 7/15/20 @ 100 (a) (b) (c) | 2,825,000 | 2,729,314 | |||||||||
| Voya CLO Ltd., Series 2017-4A, Class A1, 2.35% (LIBOR03M+113bps), 10/15/30, Callable 7/15/20 @ 100 (a) (b) (c) | 2,000,000 | 1,961,930 | |||||||||
Total Collateralized Mortgage Obligations (Cost $12,076,784) | 11,626,536 | ||||||||||
Corporate Bonds (49.9%) | |||||||||||
Communication Services (4.9%): | |||||||||||
Activision Blizzard, Inc., 2.60%, 6/15/22, Callable 5/15/22 @ 100 (a) | 455,000 | 472,099 | |||||||||
| AT&T, Inc. 3.20%, 3/1/22 (a) | 509,000 | 531,019 | |||||||||
4.25%, 3/1/27, Callable 12/1/26 @ 100 (a) | 514,000 | 587,805 | |||||||||
Comcast Corp., 3.10%, 4/1/25, Callable 3/1/25 @ 100 (a) | 1,182,000 | 1,300,070 | |||||||||
Electronic Arts, Inc., 3.70%, 3/1/21, Callable 2/1/21 @ 100 (a) | 4,185,000 | 4,261,669 | |||||||||
Sirius XM Radio, Inc., 4.63%, 7/15/24, Callable 7/15/21 @ 102.31 (a) (b) | 836,000 | 856,808 | |||||||||
| Verizon Communications, Inc. 5.15%, 9/15/23 (a) | 1,866,000 | 2,128,454 | |||||||||
3.38%, 2/15/25 (a) | 354,000 | 393,963 | |||||||||
1.49% (LIBOR03M+110bps), 5/15/25, Callable 3/15/25 @ 100 (a) (c) | 827,000 | 836,924 | |||||||||
Vodafone Group PLC, 2.95%, 2/19/23 (a) | 631,000 | 665,276 | |||||||||
12,034,087 | |||||||||||
See notes to financial statements.
14
| Victory Portfolios Victory INCORE Low Duration Bond Fund | Schedule of Portfolio Investments — continued June 30, 2020 | ||||||
(Unaudited)
Security Description | Principal Amount | Value | |||||||||
Consumer Discretionary (6.1%): | |||||||||||
| Best Buy Co., Inc. 5.50%, 3/15/21, Callable 12/15/20 @ 100 (a) | $ | 3,055,000 | $ | 3,121,538 | |||||||
4.45%, 10/1/28, Callable 7/1/28 @ 100 (a) | 409,000 | 473,945 | |||||||||
DR Horton, Inc., 4.75%, 2/15/23, Callable 11/15/22 @ 100 (a) | 3,027,000 | 3,268,948 | |||||||||
General Motors Co., 4.88%, 10/2/23 (a) | 1,297,000 | 1,377,284 | |||||||||
Hasbro, Inc., 3.15%, 5/15/21, Callable 3/15/21 @ 100 (a) | 3,380,000 | 3,425,360 | |||||||||
LGI Homes, Inc., 6.88%, 7/15/26, Callable 7/15/21 @ 103.44 (a) (b) | 244,000 | 251,176 | |||||||||
NVR, Inc., 3.95%, 9/15/22, Callable 6/15/22 @ 100 (a) | 3,283,000 | 3,483,493 | |||||||||
15,401,744 | |||||||||||
Consumer Staples (6.3%): | |||||||||||
Altria Group, Inc., 4.40%, 2/14/26, Callable 12/14/25 @ 100 (a) | 620,000 | 712,895 | |||||||||
BAT Capital Corp., 4.70%, 4/2/27, Callable 2/2/27 @ 100 (a) | 1,400,000 | 1,605,576 | |||||||||
Church & Dwight Co., Inc., 2.45%, 8/1/22, Callable 7/1/22 @ 100 (a) | 792,000 | 817,463 | |||||||||
| Constellation Brands, Inc. 1.09% (LIBOR03M+70bps), 11/15/21, Callable 8/6/20 @ 100 (a) (c) | 2,500,000 | 2,495,025 | |||||||||
4.65%, 11/15/28, Callable 8/15/28 @ 100 (a) | 375,000 | 442,845 | |||||||||
Heineken NV, 3.40%, 4/1/22 (b) | 1,570,000 | 1,638,468 | |||||||||
| Kerry Group Financial Services Unlimited Co., 3.20%, 4/9/23, Callable 1/9/23 @ 100 (a) (b) | 2,391,000 | 2,498,571 | |||||||||
Keurig Dr Pepper, Inc., 4.06%, 5/25/23, Callable 4/25/23 @ 100 (a) | 1,385,000 | 1,508,570 | |||||||||
Pernod Ricard SA, 4.25%, 7/15/22 (a) (b) | 833,000 | 888,736 | |||||||||
Suntory Holdings Ltd., 2.55%, 6/28/22, Callable 5/28/22 @ 100 (a) (b) | 2,122,000 | 2,184,175 | |||||||||
Tyson Foods, Inc., 2.25%, 8/23/21, Callable 7/23/21 @ 100 | 1,080,000 | 1,097,302 | |||||||||
15,889,626 | |||||||||||
Energy (4.6%): | |||||||||||
Continental Resources, Inc., 4.50%, 4/15/23, Callable 1/15/23 @ 100 (a) | 801,000 | 766,693 | |||||||||
Ecopetrol SA, 5.88%, 9/18/23 (a) | 495,000 | 531,581 | |||||||||
EQM Midstream Partners LP, 4.75%, 7/15/23, Callable 6/15/23 @ 100 (a) | 975,000 | 982,430 | |||||||||
LUKOIL International Finance BV, 6.13%, 11/9/20 (a) (b) | 5,185,000 | 5,278,329 | |||||||||
Marathon Petroleum Corp., 3.40%, 12/15/20, Callable 11/15/20 @ 100 (a) | 1,850,000 | 1,867,315 | |||||||||
| Plains All American Pipeline LP/PAA Finance Corp., 2.85%, 1/31/23, Callable 10/31/22 @ 100 (a) | 1,010,000 | 1,021,070 | |||||||||
| Valero Energy Corp. 2.70%, 4/15/23 (a) | 951,000 | 986,948 | |||||||||
4.00%, 4/1/29, Callable 1/1/29 @ 100 (a) | 382,000 | 425,999 | |||||||||
11,860,365 | |||||||||||
Financials (8.9%): | |||||||||||
| Bank of America Corp. 2.33% (LIBOR03M+63bps), 10/1/21, Callable 10/1/20 @ 100 (a) (c) | 1,391,000 | 1,396,578 | |||||||||
4.20%, 8/26/24, MTN (a) | 458,000 | 508,114 | |||||||||
| Capital One Financial Corp. 3.45%, 4/30/21, Callable 3/30/21 @ 100 (a) | 3,500,000 | 3,574,060 | |||||||||
3.30%, 10/30/24, Callable 9/30/24 @ 100 (a) | 684,000 | 735,792 | |||||||||
Citigroup, Inc., 4.45%, 9/29/27 (a) | 404,000 | 459,534 | |||||||||
| Dana Financing Luxembourg Sarl, 5.75%, 4/15/25, Callable 8/6/20 @ 104.31 (a) (b) | 772,000 | 783,741 | |||||||||
Enel Finance International NV, 2.88%, 5/25/22 (a) (b) | 1,675,000 | 1,731,548 | |||||||||
See notes to financial statements.
15
| Victory Portfolios Victory INCORE Low Duration Bond Fund | Schedule of Portfolio Investments — continued June 30, 2020 | ||||||
(Unaudited)
Security Description | Principal Amount | Value | |||||||||
| Fifth Third Bancorp 1.63%, 5/5/23, Callable 4/5/23 @ 100 | $ | 1,660,000 | $ | 1,699,923 | |||||||
3.65%, 1/25/24, Callable 12/25/23 @ 100 (a) | 799,000 | 870,894 | |||||||||
Ford Motor Credit Co. LLC, 3.10%, 5/4/23 (a) | 1,500,000 | 1,420,950 | |||||||||
| Level 3 Financing, Inc. 5.13%, 5/1/23, Callable 8/6/20 @ 100 (a) | 750,000 | 750,068 | |||||||||
5.38%, 1/15/24, Callable 8/6/20 @ 101.34 (a) | 637,000 | 642,141 | |||||||||
Morgan Stanley, 4.88%, 11/1/22 (a) | 1,004,000 | 1,091,719 | |||||||||
Newcrest Finance Pty Ltd., 4.20%, 10/1/22 (a) (b) | 2,214,000 | 2,334,043 | |||||||||
| The Goldman Sachs Group, Inc., 2.64% (LIBOR03M+175bps), 10/28/27, Callable 10/28/26 @ 100 (a) (c) | 1,500,000 | 1,518,285 | |||||||||
| Zions Bancorp NA 3.50%, 8/27/21 (a) (e) | 1,785,000 | 1,827,393 | |||||||||
3.35%, 3/4/22, Callable 2/4/22 @ 100 (a) | 1,090,000 | 1,123,409 | |||||||||
22,468,192 | |||||||||||
Health Care (2.7%): | |||||||||||
AbbVie, Inc., 2.30%, 5/14/21, Callable 4/14/21 @ 100 (a) | 1,211,000 | 1,227,978 | |||||||||
Biogen, Inc., 3.63%, 9/15/22 | 1,025,000 | 1,088,888 | |||||||||
Bristol-Myers Squibb Co., 2.88%, 2/19/21 (a) (b) | 3,354,000 | 3,406,725 | |||||||||
Humana, Inc., 2.90%, 12/15/22, Callable 11/15/22 @ 100 (a) | 560,000 | 585,418 | |||||||||
Upjohn, Inc., 1.13%, 6/22/22 (b) | 525,000 | 528,156 | |||||||||
6,837,165 | |||||||||||
Industrials (1.8%): | |||||||||||
AerCap Ireland Capital DAC/AerCap Global Aviation Trust, 4.63%, 10/30/20 (a) | 2,065,000 | 2,073,983 | |||||||||
Delta Air Lines, Inc., 3.80%, 4/19/23, Callable 3/19/23 @ 100 (a) | 1,115,000 | 991,592 | |||||||||
EnPro Industries, Inc., 5.75%, 10/15/26, Callable 10/15/21 @ 104.31 (a) | 725,000 | 724,964 | |||||||||
Fortive Corp., 3.15%, 6/15/26, Callable 3/15/26 @ 100 (a) (e) | 188,000 | 206,264 | |||||||||
Roper Technologies, Inc., 2.95%, 9/15/29, Callable 6/15/29 @ 100 (a) | 391,000 | 425,963 | |||||||||
4,422,766 | |||||||||||
Information Technology (4.3%): | |||||||||||
Broadcom Corp., 3.00%, 1/15/22, Callable 12/15/21 @ 100 (a) (e) | 988,000 | 1,013,915 | |||||||||
FLIR Systems, Inc., 3.13%, 6/15/21, Callable 5/15/21 @ 100 (a) | 2,375,000 | 2,412,881 | |||||||||
Lam Research Corp., 4.00%, 3/15/29, Callable 12/15/28 @ 100 (a) | 501,000 | 594,772 | |||||||||
Lam Research Group, 2.80%, 6/15/21, Callable 5/15/21 @ 100 (a) | 3,328,000 | 3,401,449 | |||||||||
Marvell Technology Group Ltd., 4.20%, 6/22/23, Callable 5/22/23 @ 100 | 941,000 | 1,012,921 | |||||||||
NetApp, Inc., 3.38%, 6/15/21 (a) | 1,605,000 | 1,639,957 | |||||||||
PayPal Holdings, Inc., 2.20%, 9/26/22 (a) | 757,000 | 783,389 | |||||||||
10,859,284 | |||||||||||
Materials (3.1%): | |||||||||||
Anglo American Capital PLC, 4.13%, 4/15/21 (a) (b) | 3,525,000 | 3,593,491 | |||||||||
Celanese US Holdings LLC, 4.63%, 11/15/22 (a) | 855,000 | 908,326 | |||||||||
LYB International Finance II BV, 3.50%, 3/2/27, Callable 12/2/26 @ 100 (a) (e) | 548,000 | 597,358 | |||||||||
Lyondellbasell Industries NV, 6.00%, 11/15/21, Callable 8/17/21 @ 100 (a) | 800,000 | 845,384 | |||||||||
Nucor Corp., 4.00%, 8/1/23, Callable 5/1/23 @ 100 | 1,190,000 | 1,290,043 | |||||||||
Steel Dynamics, Inc., 5.25%, 4/15/23 (a) | 505,000 | 509,419 | |||||||||
7,744,021 | |||||||||||
See notes to financial statements.
16
| Victory Portfolios Victory INCORE Low Duration Bond Fund | Schedule of Portfolio Investments — continued June 30, 2020 | ||||||
(Unaudited)
Security Description | Principal Amount | Value | |||||||||
Real Estate (4.2%): | |||||||||||
American Tower Corp., 3.00%, 6/15/23 (a) | $ | 1,000,000 | $ | 1,067,150 | |||||||
CubeSmart LP, 4.80%, 7/15/22, Callable 4/15/22 @ 100 (a) | 3,470,000 | 3,676,605 | |||||||||
Duke Realty LP, 3.63%, 4/15/23, Callable 1/15/23 @ 100 (a) | 1,230,000 | 1,306,604 | |||||||||
Highwoods Realty LP, 3.20%, 6/15/21, Callable 4/15/21 @ 100 (a) | 3,130,000 | 3,180,049 | |||||||||
Piedmont Operating Partnership LP, 3.40%, 6/1/23, Callable 3/1/23 @ 100 (a) | 1,629,000 | 1,660,391 | |||||||||
10,890,799 | |||||||||||
Utilities (3.0%): | |||||||||||
Eversource Energy, 2.50%, 3/15/21, Callable 2/15/21 @ 100 (a) | 2,900,000 | 2,935,729 | |||||||||
| Exelon Corp. 3.50%, 6/1/22, Callable 5/1/22 @ 100 (a) (f) | 2,681,000 | 2,803,173 | |||||||||
3.95%, 6/15/25, Callable 3/15/25 @ 100 (a) | 591,000 | 664,444 | |||||||||
| NextEra Energy Capital Holdings, Inc., 2.80%, 1/15/23, Callable 12/15/22 @ 100 (a) | 1,462,000 | 1,535,699 | |||||||||
7,939,045 | |||||||||||
Total Corporate Bonds (Cost $122,560,295) | 126,347,094 | ||||||||||
Residential Mortgage-Backed Securities (5.0%) | |||||||||||
| Bear Stearns Alt-A Trust, Series 2003-3, Class 2A, 4.09%, 10/25/33, Callable 7/25/20 @ 100 (a) (d) | 1,592,799 | 1,567,084 | |||||||||
| Credit Suisse First Boston Mortgage Securities Corp., Series 2003-23, Class 2A8, 4.50%, 12/31/49 (a) | 13,454 | 13,739 | |||||||||
| Credit Suisse First Boston Mortgage Securities Corp., Series 2004-AR7, Class 4A1, 3.48%, 11/25/34, Callable 7/25/20 @ 100 (a) (d) | 1,242,993 | 1,206,281 | |||||||||
| JPMorgan Mortgage Trust, Series 2004-S2, Class 1A3, 4.75%, 12/31/20, Callable 7/25/20 @ 100 (a) | 11,905 | 8,995 | |||||||||
| JPMorgan Mortgage Trust, Series 2016-4, Class A5, 3.50%, 10/25/46, Callable 9/25/23 @ 100 (a) (b) (d) | 974,547 | 989,996 | |||||||||
| JPMorgan Mortgage Trust, Series 2004-S1, Class 1A7, 5.00%, 9/25/34, Callable 7/25/20 @ 100 (a) | 44,062 | 39,555 | |||||||||
| JPMorgan Mortgage Trust, Series 2016-3, Class 1A3, 3.50%, 10/25/46, Callable 9/25/24 @ 100 (a) (b) (d) | 598,827 | 604,591 | |||||||||
| JPMorgan Mortgage Trust, Series 2014-5, Class A11, 2.96%, 10/25/29, Callable 8/25/23 @ 100 (a) (b) (d) | 3,091,143 | 3,134,806 | |||||||||
| JPMorgan Mortgage Trust, Series 2017-1, Class A5, 3.50%, 1/25/47, Callable 5/25/25 @ 100 (a) (b) (d) | 1,139,375 | 1,157,410 | |||||||||
| JPMorgan Mortgage Trust, Series 2017-3, Class 2A2, 2.50%, 8/25/47, Callable 10/25/26 @ 100 (a) (b) (d) | 1,773,735 | 1,794,165 | |||||||||
| Madison Park Funding Ltd., Series 2007-4A, Class AR, 2.04% (LIBOR03M+120bps), 7/29/30, Callable 7/29/20 @ 100 (a) (b) (c) | 2,250,000 | 2,200,500 | |||||||||
Total Residential Mortgage-Backed Securities (Cost $12,821,540) | 12,717,122 | ||||||||||
U.S. Government Mortgage-Backed Agencies (10.1%) | |||||||||||
| Federal Home Loan Mortgage Corp. 5.00%, 6/15/23 – 8/1/40 (a) | 905,830 | 1,032,295 | |||||||||
5.50%, 10/25/23 (a) | 4,430 | 4,712 | |||||||||
Series 4430, Class NG, 2.50%, 2/15/38 (a) | 1,515,425 | 1,530,790 | |||||||||
7.00%, 9/1/38 (a) | 4,855 | 6,156 | |||||||||
See notes to financial statements.
17
| Victory Portfolios Victory INCORE Low Duration Bond Fund | Schedule of Portfolio Investments — continued June 30, 2020 | ||||||
(Unaudited)
Security Description | Shares or Principal Amount | Value | |||||||||
Series 4320, Class AP, 3.50%, 7/15/39 (a) | $ | 1,246,594 | $ | 1,346,914 | |||||||
Series 3713, Class PA, 2.00%, 2/15/40 – 3/15/40 (a) | 4,539,883 | 4,615,476 | |||||||||
Series 4444, Class CH, 3.00%, 1/15/41 (a) | 2,126,728 | 2,181,107 | |||||||||
Series 4049, Class AB, 2.75%, 12/15/41 (a) | 711,541 | 731,114 | |||||||||
11,448,564 | |||||||||||
| Federal National Mortgage Association 6.00%, 2/1/37 (a) | 1,246,056 | 1,484,583 | |||||||||
Series 2013-83, Class CA, 3.50%, 10/25/37 – 3/25/44 (a) | 2,192,865 | 2,233,037 | |||||||||
Series 2013-33, Class UD, 2.50%, 4/25/39 (a) | 1,421,640 | 1,457,919 | |||||||||
Series 2011-21, Class PA, 4.50%, 5/25/40 (a) | 2,962,137 | 3,129,632 | |||||||||
Series 2011-101, Class LA, 3.00%, 10/25/40 (a) | 1,079,496 | 1,110,829 | |||||||||
5.00%, 2/1/41 – 10/1/41 (a) | 3,446,476 | 3,930,065 | |||||||||
13,346,065 | |||||||||||
| Government National Mortgage Association Series 2018-22, Class JA, 3.00%, 1/20/44 (a) | 652,709 | 673,806 | |||||||||
Total U.S. Government Mortgage-Backed Agencies (Cost $24,942,607) | 25,468,435 | ||||||||||
U.S. Treasury Obligations (21.0%) | |||||||||||
| U.S. Treasury Notes 0.38%, 3/31/22 (a) | 1,792,000 | 1,798,580 | |||||||||
| 0.13%, 4/15/22 (a) | 19,623,004 | 19,902,585 | |||||||||
0.13%, 6/30/22 | 25,000,000 | 24,984,375 | |||||||||
0.50%, 3/15/23 (a) | 6,454,000 | 6,511,481 | |||||||||
Total U.S. Treasury Obligations (Cost $52,927,815) | 53,197,021 | ||||||||||
Collateral for Securities Loaned^ (0.6%) | |||||||||||
BlackRock Liquidity Funds TempFund Portfolio, Institutional Class, 0.28% (g) | 27,140 | 27,140 | |||||||||
Fidelity Investments Money Market Government Portfolio, Class I, 0.09% (g) | 821,423 | 821,424 | |||||||||
| Goldman Sachs Financial Square Prime Obligations Fund, Institutional Class, 0.30% (g) | 188,734 | 188,734 | |||||||||
JPMorgan Prime Money Market Fund, Capital Class, 0.43% (g) | 107,999 | 107,999 | |||||||||
| Morgan Stanley Institutional Liquidity Prime Portfolio, Institutional Class, 0.41% (g) | 485,584 | 485,584 | |||||||||
Total Collateral for Securities Loaned (Cost $1,630,881) | 1,630,881 | ||||||||||
Total Investments (Cost $242,622,647) — 97.4% | 246,780,432 | ||||||||||
Other assets in excess of liabilities — 2.6% | 6,514,080 | ||||||||||
NET ASSETS — 100.00% | $ | 253,294,512 | |||||||||
^ Purchased with cash collateral from securities on loan.
(a) All or a portion of this security has been segregated as collateral for derivative instruments.
(b) Rule 144A security or other security that is restricted as to resale to institutional investors. The Fund's Adviser has deemed this security to be liquid based upon procedures approved by the Board of Trustees. As of June 30, 2020, the fair value of these securities was $54,087,978 and amounted to 21.4% of net assets.
(c) Variable or Floating-Rate Security. Rate disclosed is as of June 30, 2020.
See notes to financial statements.
18
| Victory Portfolios Victory INCORE Low Duration Bond Fund | Schedule of Portfolio Investments — continued June 30, 2020 | ||||||
(Unaudited)
(d) The rate for certain asset-backed and mortgage-backed securities may vary based on factors relating to the pool of assets underlying the security. The rate disclosed is the rate in effect at June 30, 2020.
(e) All or a portion of this security is on loan.
(f) Variable Rate Demand Notes that provide the rights to sell the security at face value on either that day or within the rate-reset period. The interest rate is reset on the put date at a stipulated daily, weekly, monthly, quarterly, or other specified time interval to reflect current market conditions. These securities do not indicate a reference rate and spread in their description.
(g) Rate disclosed is the daily yield on June 30, 2020.
bps — Basis points
LIBOR — London InterBank Offered Rate
LIBOR03M — 3 Month US Dollar LIBOR, rate disclosed as of June 30, 2020, based on the last reset date of the security
LLC — Limited Liability Company
LP — Limited Partnership
MTN — Medium-Term Note
PLC — Public Limited Company
Futures Contracts Purchased
| Number of Contracts | Expiration Date | Notional Amount | Value | Unrealized Appreciation (Depreciation) | |||||||||||||||||||
2-Year U.S. Treasury Note Futures | 396 | 9/30/20 | $ | 87,450,897 | $ | 87,447,937 | $ | (2,960 | ) | ||||||||||||||
Futures Contracts Sold
| Number of Contracts | Expiration Date | Notional Amount | Value | Unrealized Appreciation (Depreciation) | |||||||||||||||||||
10-Year U.S. Treasury Note Futures | 53 | 9/21/20 | $ | 7,370,629 | $ | 7,376,109 | $ | (5,480 | ) | ||||||||||||||
5-Year U.S. Treasury Note Futures | 65 | 9/30/20 | 8,163,877 | 8,173,242 | (9,365 | ) | |||||||||||||||||
$ | (14,845 | ) | |||||||||||||||||||||
Total unrealized appreciation | $ | — | |||||||||||||||||||||
Total unrealized depreciation | (17,805 | ) | |||||||||||||||||||||
Total net unrealized appreciation (depreciation) | $ | (17,805 | ) | ||||||||||||||||||||
See notes to financial statements.
19
| Victory Portfolios Victory High Yield Fund | Schedule of Portfolio Investments June 30, 2020 | ||||||
(Unaudited)
Security Description | Shares or Principal Amount | Value | |||||||||
Common Stocks (0.6%) | |||||||||||
Communication Services (0.4%): | |||||||||||
AMC Networks, Inc., Class A (a) (b) | 6,000 | $ | 140,340 | ||||||||
Cinemark Holdings, Inc. | 10,000 | 115,500 | |||||||||
Nexstar Media Group, Inc., Class A | 7,250 | 606,753 | |||||||||
862,593 | |||||||||||
Health Care (0.2%): | |||||||||||
Surgery Partners, Inc. (a) | 40,000 | 462,800 | |||||||||
Total Common Stocks (Cost $1,896,556) | 1,325,393 | ||||||||||
Senior Secured Loans (16.2%) | |||||||||||
Air Methods Corp., 1st Lien Term Loan, 4.95% (LIBOR03M+350bps), 4/21/24 (c) | $ | 1,989,744 | 1,631,172 | ||||||||
| Alphabet Holding Co., Inc., 2nd Lien Term Loan, 7.92% (LIBOR01M+775bps), 8/15/25, Callable 8/5/20 @ 100 (c) | 1,500,000 | 1,339,995 | |||||||||
| Avaya, Inc., 1st Lien Term Loan B, 4.43% (LIBOR01M+425bps), 12/15/24, Callable 8/5/20 @ 100 (c) | 1,583,069 | 1,457,215 | |||||||||
| Bass Pro Group LLC, Term Loan B, 6.07% (LIBOR06M+500bps), 12/16/23, Callable 8/5/20 @ 100 (c) | 1,962,322 | 1,883,122 | |||||||||
CenturyLink, Inc., 2.42% (LIBOR01M+225bps), 3/15/27, Callable 7/31/20 @ 100 (c) | 1,994,987 | 1,876,405 | |||||||||
| Clear Channel Outdoor Holdings, Inc., 4.26% (LIBOR03M+350bps), 11/25/26, Callable 8/5/20 @ 100 (c) | 1,736,875 | 1,570,135 | |||||||||
| CPM Holdings, Inc., 1st Lien Term Loan, 3.92%- 3.96% (LIBOR01M+375bps), 11/17/25, Callable 8/5/20 @ 100 (c) | 788,000 | 714,125 | |||||||||
| Dayco Products LLC, 4.61% (LIBOR03M+425bps), 5/19/24, Callable 8/5/20 @ 100 (c) | 970,000 | 601,400 | |||||||||
| Dynasty Acquisition Co., Inc., 1st Lien Term Loan, 4.95% (LIBOR03M+350bps), 4/6/26, Callable 8/5/20 @ 101 (c) | 1,551,398 | 1,320,627 | |||||||||
| Dynasty Acquisition Co., Inc., 1st Lien Term Loan, 4.95% (LIBOR03M+350bps), 4/6/26, Callable 8/5/20 @ 101 (c) | 834,085 | 710,015 | |||||||||
| Froneri U.S., Inc., 2nd Lien Term Loan, 5.92% (LIBOR01M+575bps), 1/30/28, Callable 8/5/20 @ 102 (c) | 500,000 | 473,750 | |||||||||
| GTT Communications, Inc., 1st Lien Term Loan B, 2.92% (LIBOR01M+275bps), 5/31/25, Callable 8/5/20 @ 100 (c) | 875,379 | 641,583 | |||||||||
| Holley Purchaser, Inc., 1st Lien Term Loan, 5.76% (LIBOR03M+500bps), 10/24/25, Callable 8/5/20 @ 100 (c) | 985,000 | 802,775 | |||||||||
II-VI, Inc., 3.67% (LIBOR01M+350bps), 9/24/26 (c) | 1,736,875 | 1,684,769 | |||||||||
| Leslie's Poolmart, Inc., Term Loan B, 3.67% (LIBOR01M+350bps), 8/16/23, Callable 8/5/20 @ 100 (c) | 984,849 | 936,227 | |||||||||
| LifeScan Global Corp., 1st Lien Term Loan, 7.18% (LIBOR06M+600bps), 6/19/24, Callable 8/5/20 @ 100 (c) | 1,822,461 | 1,642,037 | |||||||||
| Navistar, Inc., 1st Lien Term Loan B, 3.70% (LIBOR01M+350bps), 11/2/24, Callable 8/5/20 @ 100 (c) | 1,967,373 | 1,858,342 | |||||||||
| Nexstar Broadcasting, Inc., 1st Lien Term Loan, 2.92% (LIBOR01M+275bps), 6/20/26 (c) | 1,681,094 | 1,595,543 | |||||||||
| Packaging Coordinators Midco, Inc., 2nd Lien Term Loan, 9.83% (LIBOR06M+875bps), 7/1/24, Callable 8/5/20 @ 100 (c) | 500,000 | 485,000 | |||||||||
PetSmart, Inc., 1st Lien Term Loan B2, 5.00% (LIBOR06M+400bps), 3/10/22 (c) (d) | 179,336 | 176,706 | |||||||||
See notes to financial statements.
20
| Victory Portfolios Victory High Yield Fund | Schedule of Portfolio Investments — continued June 30, 2020 | ||||||
(Unaudited)
Security Description | Principal Amount | Value | |||||||||
| Radiate Holdco LLC, 3.75% (LIBOR01M+300bps), 2/1/24, Callable 8/5/20 @ 100 (c) | $ | 1,969,692 | $ | 1,876,132 | |||||||
| Reynolds Group Holdings, Inc., 1st Lien Term Loan B, 2.92% (LIBOR01M+275bps), 2/5/23, Callable 8/5/20 @ 100 (c) | 1,773,813 | 1,690,266 | |||||||||
| SIWF Holdings, Inc., 9.57% (LIBOR06M+850bps), 5/26/26, Callable 8/5/20 @ 101 (c) | 1,000,000 | 835,000 | |||||||||
| Specialty Building Products Holdings LLC, 1st Lien Term Loan, 5.92% (LIBOR01M+575bps), 10/1/25, Callable 8/5/20 @ 100 (c) | 987,500 | 938,125 | |||||||||
Spectacle Gary Holdings LLC, 10/17/25 (c) (d) (e) | 135,135 | 124,324 | |||||||||
| Spectacle Gary Holdings LLC, 11.00% (LIBOR03M+900bps), 12/23/25, Callable 6/23/21 @ 109 (c) | 1,864,865 | 1,715,676 | |||||||||
| Stars Group Holdings BV, 4.95% (LIBOR03M+350bps), 6/27/25, Callable 8/5/20 @ 100 (c) | 1,066,415 | 1,058,908 | |||||||||
| Team Health Holdings, Inc., 1st Lien Term Loan B, 3.75% (LIBOR01M+275bps), 2/6/24, Callable 8/5/20 @ 100 (c) | 1,484,655 | 1,131,129 | |||||||||
| Tenneco, Inc., 1st Lien Term Loan B, 3.17% (LIBOR01M+300bps), 6/18/25, Callable 8/5/20 @ 100 (c) | 1,974,950 | 1,701,755 | |||||||||
| The Men's Wearhouse, Inc., 1st Lien Term Loan B2, 4.68% (LIBOR03M+325bps), 4/9/25, Callable 8/5/20 @ 100 (c) | 390,631 | 62,501 | |||||||||
The Men's Wearhouse, Inc., 1st Lien Term Loan B2, 4.25% (LIBOR01M+325bps) | 1,599,924 | 255,988 | |||||||||
Total Senior Secured Loans (Cost $38,930,677) | 34,790,747 | ||||||||||
Corporate Bonds (79.8%) | |||||||||||
Communication Services (11.5%): | |||||||||||
AMC Networks, Inc., 4.75%, 8/1/25, Callable 8/1/21 @ 102.38 (b) | 2,500,000 | 2,462,400 | |||||||||
| CCO Holdings LLC/CCO Holdings Capital Corp., 5.00%, 2/1/28, Callable 8/1/22 @ 102.5 (f) | 3,000,000 | 3,098,190 | |||||||||
| Consolidated Communications, Inc., 6.50%, 10/1/22, Callable 8/6/20 @ 101.63 (b) (g) | 1,750,000 | 1,611,820 | |||||||||
Cumulus Media New Holdings, Inc., 6.75%, 7/1/26, Callable 7/1/22 @ 103.38 (f) | 2,500,000 | 2,307,325 | |||||||||
Entercom Media Corp., 6.50%, 5/1/27, Callable 5/1/22 @ 104.88 (b) (f) | 2,500,000 | 2,248,125 | |||||||||
| Lamar Media Corp. 3.75%, 2/15/28, Callable 2/15/23 @ 101.88 (f) | 1,000,000 | 947,510 | |||||||||
4.00%, 2/15/30, Callable 2/15/25 @ 102 (f) | 1,000,000 | 959,990 | |||||||||
Meredith Corp., 6.88%, 2/1/26, Callable 2/1/21 @ 103.44 (b) | 2,500,000 | 2,089,400 | |||||||||
Sinclair Television Group, Inc., 5.50%, 3/1/30, Callable 12/1/24 @ 102.75 (b) (f) | 2,500,000 | 2,308,325 | |||||||||
Sirius XM Radio, Inc., 5.50%, 7/1/29, Callable 7/1/24 @ 102.75 (f) (g) | 3,000,000 | 3,158,339 | |||||||||
TEGNA, Inc., 4.63%, 3/15/28, Callable 3/15/23 @ 102.31 (f) | 950,000 | 872,366 | |||||||||
Univision Communications, Inc., 5.13%, 2/15/25, Callable 7/17/20 @ 102.56 (b) (f) | 2,500,000 | 2,355,525 | |||||||||
24,419,315 | |||||||||||
Consumer Discretionary (18.9%): | |||||||||||
| 1011778 BC ULC/New Red Finance, Inc., 4.38%, 1/15/28, Callable 11/15/22 @ 102.19 (b) (f) | 3,000,000 | 2,940,300 | |||||||||
Beazer Homes USA, Inc., 5.88%, 10/15/27, Callable 10/15/22 @ 102.94 | 2,000,000 | 1,910,320 | |||||||||
| Boyd Gaming Corp. 8.63%, 6/1/25, Callable 6/1/22 @ 104.31 (f) | 1,200,000 | 1,254,540 | |||||||||
6.38%, 4/1/26, Callable 4/1/21 @ 103.19 | 2,250,000 | 2,138,287 | |||||||||
| Caesars Resort Collection LLC/CRC Finco, Inc., 5.25%, 10/15/25, Callable 10/15/20 @ 102.63 (f) | 2,250,000 | 1,957,973 | |||||||||
See notes to financial statements.
21
| Victory Portfolios Victory High Yield Fund | Schedule of Portfolio Investments — continued June 30, 2020 | ||||||
(Unaudited)
Security Description | Principal Amount | Value | |||||||||
| Clarios Global LP/Clarios US Finance Co., 8.50%, 5/15/27, Callable 5/15/22 @ 104.25 (f) | $ | 2,500,000 | $ | 2,515,800 | |||||||
| Diamond Sports Group LLC/Diamond Sports Finance Co., 6.63%, 8/15/27, Callable 8/15/22 @ 103.31 (f) (g) | 2,284,000 | 1,222,465 | |||||||||
Eldorado Resorts, Inc., 6.00%, 9/15/26 (b) | 1,750,000 | 1,934,240 | |||||||||
Ford Motor Co., 9.00%, 4/22/25, Callable 3/22/25 @ 100 (g) | 3,000,000 | 3,243,180 | |||||||||
Golden Nugget, Inc., 8.75%, 10/1/25, Callable 10/1/20 @ 104.38 (b) (f) (g) | 2,000,000 | 1,176,360 | |||||||||
Hanesbrands, Inc., 5.38%, 5/15/25, Callable 5/15/22 @ 102.69 (f) | 2,000,000 | 2,023,880 | |||||||||
Hyatt Hotels Corp., 5.38%, 4/23/25, Callable 3/23/25 @ 100 (g) | 1,500,000 | 1,583,715 | |||||||||
Installed Building Products, Inc., 5.75%, 2/1/28, Callable 2/1/23 @ 102.88 (f) | 1,200,000 | 1,210,872 | |||||||||
International Game Technology PLC, 5.25%, 1/15/29, Callable 1/15/24 @ 102.63 (f) | 2,000,000 | 1,952,780 | |||||||||
Marriott International, Inc., 5.75%, 5/1/25, Callable 4/1/25 @ 100 (g) | 2,000,000 | 2,173,419 | |||||||||
Mattel, Inc., 5.45%, 11/1/41, Callable 5/1/41 @ 100 | 2,000,000 | 1,657,340 | |||||||||
MGM Resorts International, 5.50%, 4/15/27, Callable 1/15/27 @ 100 | 2,475,000 | 2,392,087 | |||||||||
Michaels Stores, Inc., 8.00%, 7/15/27, Callable 7/15/22 @ 104 (f) | 1,000,000 | 869,670 | |||||||||
| Scientific Games International, Inc. 8.63%, 7/1/25, Callable 7/1/22 @ 104.31 (d) (f) | 1,000,000 | 935,090 | |||||||||
8.25%, 3/15/26, Callable 3/15/22 @ 104.13 (f) | 2,250,000 | 2,017,373 | |||||||||
| The Enterprise Development Authority, 12.00%, 7/15/24, Callable 7/15/21 @ 109 (f) (g) | 1,200,000 | 1,208,220 | |||||||||
The William Carter Co., 5.50%, 5/15/25, Callable 5/15/22 @ 102.75 (f) | 900,000 | 927,252 | |||||||||
Yum! Brands, Inc., 5.35%, 11/1/43, Callable 5/1/43 @ 100 | 1,000,000 | 993,640 | |||||||||
40,238,803 | |||||||||||
Consumer Staples (7.4%): | |||||||||||
| Albertsons Cos., Inc./Safeway, Inc./New Albertsons LP/Albertsons LLC, 5.88%, 2/15/28, Callable 8/15/22 @ 104.41 (f) | 2,750,000 | 2,836,790 | |||||||||
B&G Foods, Inc., 5.25%, 4/1/25, Callable 8/6/20 @ 103.94 | 2,250,000 | 2,263,095 | |||||||||
Cott Holdings, Inc., 5.50%, 4/1/25, Callable 7/17/20 @ 104.13 (f) (g) | 2,250,000 | 2,265,638 | |||||||||
Dole Food Co., Inc., 7.25%, 6/15/25, Callable 8/6/20 @ 103.63 (f) | 2,250,000 | 2,163,848 | |||||||||
Post Holdings, Inc., 5.00%, 8/15/26, Callable 8/15/21 @ 102.5 (f) | 3,000,000 | 3,014,220 | |||||||||
| Simmons Foods, Inc. 7.75%, 1/15/24, Callable 1/15/21 @ 103.88 (f) | 1,715,000 | 1,787,853 | |||||||||
5.75%, 11/1/24, Callable 11/1/20 @ 102.88 (f) | 1,469,000 | 1,410,945 | |||||||||
15,742,389 | |||||||||||
Energy (0.6%): | |||||||||||
Buckeye Partners LP, 4.50%, 3/1/28, Callable 12/1/27 @ 100 (f) | 175,000 | 163,385 | |||||||||
EQT Corp., 7.00%, 2/1/30, Callable 11/1/29 @ 100 | 750,000 | 772,200 | |||||||||
Husky Holding Ltd. PIK, 13.00%, 2/15/25, Callable 2/15/21 @ 109.75 (f) (g) | 500,000 | 481,085 | |||||||||
1,416,670 | |||||||||||
Financials (10.0%): | |||||||||||
Acrisure LLC/Acrisure Finance, Inc., 8.13%, 2/15/24, Callable 2/15/21 @ 104.06 (f) | 2,375,000 | 2,468,480 | |||||||||
AmWINS Group, Inc., 7.75%, 7/1/26, Callable 7/1/21 @ 105.81 (f) | 1,500,000 | 1,575,000 | |||||||||
BCPE Cycle Merger Sub II, Inc., 10.63%, 7/15/27, Callable 7/15/22 @ 105.31 (f) | 2,500,000 | 2,574,575 | |||||||||
Capitol Investment Merger Sub 2 LLC, 10.00%, 8/1/24, Callable 8/1/21 @ 105 (b) (f) | 2,091,000 | 2,086,400 | |||||||||
| Compass Group Diversified Holdings LLC, 8.00%, 5/1/26, Callable 5/1/21 @ 104 (f) (g) | 2,500,000 | 2,550,050 | |||||||||
| Downstream Development Authority of the Quapaw Tribe of Oklahoma, 10.50%, 2/15/23, Callable 8/6/20 @ 107.25 (f) | 1,000,000 | 838,570 | |||||||||
See notes to financial statements.
22
| Victory Portfolios Victory High Yield Fund | Schedule of Portfolio Investments — continued June 30, 2020 | ||||||
(Unaudited)
Security Description | Principal Amount | Value | |||||||||
Gray Television, Inc., 7.00%, 5/15/27, Callable 5/15/22 @ 105.25 (f) | $ | 2,500,000 | $ | 2,579,100 | |||||||
| Intelsat Jackson Holdings SA, 8.50%, 10/15/24, Callable 10/15/20 @ 106.38 (f) (h) (i) | 2,000,000 | 1,203,780 | |||||||||
LABL Escrow Issuer LLC, 10.50%, 7/15/27, Callable 7/15/22 @ 105.25 (b) (f) (g) | 2,250,000 | 2,393,888 | |||||||||
Resideo Funding, Inc., 6.13%, 11/1/26, Callable 11/1/21 @ 104.59 (f) | 2,000,000 | 1,953,500 | |||||||||
Wolverine Escrow LLC, 13.13%, 11/15/27, Callable 11/15/22 @ 109.84 (f) | 2,000,000 | 1,316,820 | |||||||||
21,540,163 | |||||||||||
Health Care (8.8%): | |||||||||||
Air Medical Group Holdings, Inc., 6.38%, 5/15/23, Callable 8/6/20 @ 100 (f) | 1,750,000 | 1,651,773 | |||||||||
Bausch Health Cos., Inc., 6.13%, 4/15/25, Callable 8/6/20 @ 103.06 (f) | 3,000,000 | 3,039,570 | |||||||||
| Endo Dac/Endo Finance LLC/Endo Finco, Inc., 6.00%, 6/30/28, Callable 6/30/23 @ 104.5 (f) | 1,900,000 | 1,225,500 | |||||||||
| Ortho-Clinical Diagnostics, Inc./Ortho-Clinical Diagnostics SA, 7.25%, 2/1/28, Callable 2/1/23 @ 103.63 (b) (f) | 2,000,000 | 2,030,760 | |||||||||
Radiology Partners, Inc., 9.25%, 2/1/28, Callable 2/1/23 @ 104.63 (b) (f) (g) | 2,500,000 | 2,355,375 | |||||||||
| Regional Care Hospital Partners Holdings, Inc./LifePoint Health, Inc., 9.75%, 12/1/26, Callable 12/1/21 @ 104.88 (f) | 2,500,000 | 2,578,850 | |||||||||
Surgery Center Holdings, Inc., 10.00%, 4/15/27, Callable 4/15/22 @ 105 (b) (f) | 2,000,000 | 2,021,600 | |||||||||
Tenet Healthcare Corp., 6.75%, 6/15/23 | 2,500,000 | 2,480,725 | |||||||||
Verscend Escrow Corp., 9.75%, 8/15/26, Callable 8/15/21 @ 104.88 (f) | 1,450,000 | 1,562,230 | |||||||||
18,946,383 | |||||||||||
Industrials (15.3%): | |||||||||||
Ahern Rentals, Inc., 7.38%, 5/15/23, Callable 8/6/20 @ 101.84 (f) | 2,000,000 | 906,360 | |||||||||
Algeco Global Finance 2 PLC, 10.00%, 8/15/23, Callable 7/17/20 @ 105 (b) (f) (g) | 2,000,000 | 1,678,080 | |||||||||
| Apex Tool Group LLC/BC Mountain Finance, Inc., 9.00%, 2/15/23, Callable 8/6/20 @ 101 (b) (f) | 2,000,000 | 1,399,560 | |||||||||
Aramark Services, Inc., 6.38%, 5/1/25, Callable 5/1/22 @ 103.19 (f) | 3,000,000 | 3,097,620 | |||||||||
Beacon Escrow Corp., 4.88%, 11/1/25, Callable 11/1/20 @ 102.44 (f) | 2,030,000 | 1,815,713 | |||||||||
Bombardier, Inc., 7.88%, 4/15/27, Callable 4/15/22 @ 103.94 (f) | 2,500,000 | 1,629,550 | |||||||||
Cargo Aircraft Management, Inc., 4.75%, 2/1/28, Callable 2/1/23 @ 102.38 (f) | 1,800,000 | 1,787,562 | |||||||||
Delta Air Lines, Inc., 7.00%, 5/1/25 (f) | 2,000,000 | 2,064,440 | |||||||||
Hillenbrand, Inc., 5.75%, 6/15/25, Callable 6/15/22 @ 102.88 | 900,000 | 931,455 | |||||||||
Howmet Aerospace, Inc., 6.88%, 5/1/25, Callable 4/1/25 @ 100 (g) | 2,000,000 | 2,170,120 | |||||||||
| Mileage Plus Holdings LLC/Mileage Plus Intellectual Property Assets Ltd., 6.50%, 6/20/27, Callable 6/30/23 @ 103.25 (d) (f) | 2,750,000 | 2,744,005 | |||||||||
Pisces Midco, Inc., 8.00%, 4/15/26, Callable 4/15/21 @ 104 (b) (f) | 2,250,000 | 2,271,555 | |||||||||
SRS Distribution, Inc., 8.25%, 7/1/26, Callable 7/1/21 @ 104.13 (b) (f) (g) | 1,750,000 | 1,766,748 | |||||||||
TransDigm, Inc., 6.50%, 7/15/24, Callable 8/6/20 @ 101.63 | 3,000,000 | 2,867,250 | |||||||||
Triumph Group, Inc., 6.25%, 9/15/24, Callable 9/15/20 @ 103.13 (f) | 1,350,000 | 1,147,500 | |||||||||
WESCO Distribution, Inc., 7.25%, 6/15/28, Callable 6/15/23 @ 103.63 (f) | 2,250,000 | 2,384,707 | |||||||||
XPO Logistics, Inc., 6.25%, 5/1/25, Callable 5/1/22 @ 103.13 (f) | 2,000,000 | 2,094,320 | |||||||||
32,756,545 | |||||||||||
Information Technology (1.0%): | |||||||||||
Colt Merger Sub, Inc., 8.13%, 7/1/27, Callable 7/1/23 @ 104.06 (d) (f) | 2,250,000 | 2,174,828 | |||||||||
Materials (4.5%): | |||||||||||
| Ardagh Packaging Finance PLC/Ardagh Holdings USA, Inc., 5.25%, 8/15/27, Callable 8/15/22 @ 102.63 (f) | 2,500,000 | 2,453,200 | |||||||||
Greif, Inc., 6.50%, 3/1/27, Callable 3/1/22 @ 103.25 (b) (f) | 2,000,000 | 2,039,720 | |||||||||
See notes to financial statements.
23
| Victory Portfolios Victory High Yield Fund | Schedule of Portfolio Investments — continued June 30, 2020 | ||||||
(Unaudited)
Security Description | Shares or Principal Amount | Value | |||||||||
Intertape Polymer Group, Inc., 7.00%, 10/15/26, Callable 10/15/21 @ 103.5 (f) | $ | 1,330,000 | $ | 1,366,668 | |||||||
Plastipak Holdings, Inc., 6.25%, 10/15/25, Callable 10/15/20 @ 103.13 (f) | 1,990,000 | 1,933,066 | |||||||||
| Titan Acquisition Ltd./Titan Co-Borrower LLC, 7.75%, 4/15/26, Callable 4/15/21 @ 103.88 (f) (g) | 2,000,000 | 1,893,900 | |||||||||
9,686,554 | |||||||||||
Real Estate (1.3%): | |||||||||||
Adams Homes, Inc., 7.50%, 2/15/25, Callable 2/15/22 @ 103.75 (f) | 1,800,000 | 1,765,368 | |||||||||
Vertical Holdco GmbH, 7.63%, 7/15/28, Callable 7/15/23 @ 103.81 | 1,000,000 | 1,000,000 | |||||||||
2,765,368 | |||||||||||
Utilities (0.5%): | |||||||||||
PG&E Corp., 5.00%, 7/1/28, Callable 7/1/23 @ 102.5 | 1,000,000 | 999,629 | |||||||||
Total Corporate Bonds (Cost $176,593,011) | 170,686,647 | ||||||||||
Collateral for Securities Loaned^ (11.9%) | |||||||||||
BlackRock Liquidity Funds TempFund Portfolio, Institutional Class, 0.28% (i) | 423,832 | 423,832 | |||||||||
Fidelity Investments Money Market Government Portfolio, Class I, 0.09% (i) | 12,827,573 | 12,827,573 | |||||||||
| Goldman Sachs Financial Square Prime Obligations Fund, Institutional Class, 0.30% (i) | 2,947,320 | 2,947,320 | |||||||||
JPMorgan Prime Money Market Fund, Capital Class, 0.43% (i) | 1,686,541 | 1,686,541 | |||||||||
| Morgan Stanley Institutional Liquidity Prime Portfolio, Institutional Class, 0.41% (i) | 7,583,018 | 7,583,018 | |||||||||
Total Collateral for Securities Loaned (Cost $25,468,284) | 25,468,284 | ||||||||||
Total Investments (Cost $242,888,528) — 108.5% | 232,271,071 | ||||||||||
Liabilities in excess of other assets — (8.5)% | (18,155,534 | ) | |||||||||
NET ASSETS — 100.00% | $ | 214,115,537 | |||||||||
^ Purchased with cash collateral from securities on loan.
(a) Non-income producing security.
(b) All or a portion of this security is on loan.
(c) Variable or Floating-Rate Security. Rate disclosed is as of June 30, 2020.
(d) Security purchased on a when-issued basis.
(e) The rates for this senior secured loan will be known on settlement date of the loan, subsequent to this report date. Senior secured loans have rates that will fluctuate over time in line with prevailing interest rates.
(f) Rule 144A security or other security that is restricted as to resale to institutional investors. The Fund's Adviser has deemed this security to be liquid based upon procedures approved by the Board of Trustees. As of June 30, 2020, the fair value of these securities was $133,012,325 and amounted to 62.1% of net assets.
(g) All or a portion of this security has been segregated as collateral for securities purchased on a when-issued basis.
(h) Defaulted security.
(i) Rate disclosed is the daily yield on June 30, 2020.
bps — Basis points
See notes to financial statements.
24
| Victory Portfolios Victory High Yield Fund | Schedule of Portfolio Investments — continued June 30, 2020 | ||||||
(Unaudited)
LIBOR — London InterBank Offered Rate
LIBOR01M — 1 Month US Dollar LIBOR, rate disclosed as of June 30, 2020, based on the last reset date of the security
LIBOR03M — 3 Month US Dollar LIBOR, rate disclosed as of June 30, 2020, based on the last reset date of the security
LIBOR06M — 6 Month US Dollar LIBOR, rate disclosed as of June 30, 2020, based on the last reset date of the security
LLC — Limited Liability Company
LP — Limited Partnership
PIK — Payment-in-Kind
PLC — Public Limited Company
ULC — Unlimited Liability Company
See notes to financial statements.
25
| Victory Portfolios Victory Tax-Exempt Fund | Schedule of Portfolio Investments June 30, 2020 | ||||||
(Unaudited)
Security Description | Principal Amount | Value | |||||||||
Municipal Bonds (98.9%) | |||||||||||
Arkansas (1.6%): | |||||||||||
| Arkansas Development Finance Authority Revenue Bonds, 3.20%, 12/1/49, Continuously Callable @ 100 | $ | 750,000 | $ | 750,458 | |||||||
| University of Central Arkansas Revenue Bonds, Series A, 3.00%, 11/1/49, Continuously Callable @ 100 | 265,000 | 269,388 | |||||||||
1,019,846 | |||||||||||
California (6.7%): | |||||||||||
| California Educational Facilities Authority Revenue Bonds, 5.00%, 5/1/49 | 1,500,000 | 2,503,275 | |||||||||
| Golden State Tobacco Securitization Corp. Revenue Bonds, Series A2, 5.00%, 6/1/47, Continuously Callable @ 100 | 1,500,000 | 1,518,750 | |||||||||
4,022,025 | |||||||||||
Connecticut (3.8%): | |||||||||||
| Connecticut Health and Educational Facilities Authority Revenue Bonds, Series 2016 CT, 5.00%, 12/1/41, Continuously Callable @ 100 | 2,000,000 | 2,299,360 | |||||||||
Florida (3.9%): | |||||||||||
| Miami-Dade County Public Facilities Revenue Bonds, Series A, 5.00%, 6/1/33, Continuously Callable @ 100 | 2,000,000 | 2,334,660 | |||||||||
Guam (1.8%): | |||||||||||
| Port Authority of Guam Revenue, Series A, 5.00%, 7/1/48, Continuously Callable @ 100 | 1,000,000 | 1,105,860 | |||||||||
Illinois (25.8%): | |||||||||||
| Chicago Board of Education General Obligation Bonds, 6.00%, 4/1/46, Continuously Callable @ 100 | 2,275,000 | 2,429,882 | |||||||||
| Chicago General Obligation Refunding Bonds, Series A, 5.75%, 1/1/33, Continuously Callable @ 100 | 2,000,000 | 2,213,960 | |||||||||
| Chicago Transit Authority Sales Tax Receipts Revenue Bonds, Series 2014, 5.00%, 12/1/44, Continuously Callable @ 100 | 2,450,000 | 2,690,811 | |||||||||
| City of Chicago General Obligation Bonds Series A, 6.00%, 1/1/38, Continuously Callable @ 100 | 1,000,000 | 1,110,400 | |||||||||
Series A, 5.50%, 1/1/49, Continuously Callable @ 100 | 1,000,000 | 1,090,580 | |||||||||
| City of Chicago Wastewater Transmission Revenue Series A, 5.00%, 1/1/47, Continuously Callable @ 100 | 1,000,000 | 1,101,770 | |||||||||
Series C, 5.00%, 1/1/34, Continuously Callable @ 100 | 1,000,000 | 1,105,730 | |||||||||
| Illinois General Obligation Bonds, Series 2013, 5.50%, 7/1/27, Continuously Callable @ 100 | 2,000,000 | 2,127,860 | |||||||||
| Sales Tax Securitization Corp. Revenue Bonds, Series 2018 C, 5.00%, 1/1/43, Continuously Callable @ 100 | 1,500,000 | 1,723,275 | |||||||||
15,594,268 | |||||||||||
Massachusetts (1.6%): | |||||||||||
| University of Massachusetts Building Authority Revenue Bonds, Series 1, 5.00%, 11/1/39, Continuously Callable @ 100 | 820,000 | 953,225 | |||||||||
Missouri (2.0%): | |||||||||||
| Health & Educational Facilities Authority of the State of Missouri Revenue Bonds, 4.25%, 12/1/42, Continuously Callable @ 100 (a) | 1,150,000 | 1,217,321 | |||||||||
See notes to financial statements.
26
| Victory Portfolios Victory Tax-Exempt Fund | Schedule of Portfolio Investments — continued June 30, 2020 | ||||||
(Unaudited)
Security Description | Principal Amount | Value | |||||||||
New Jersey (12.2%): | |||||||||||
| New Jersey Economic Development Authority Biomedical Research Facilities Revenue Bonds, Series 2016 A, 5.00%, 7/15/29, Continuously Callable @ 100 | $ | 885,000 | $ | 988,076 | |||||||
| New Jersey Economic Development Authority School Facilities Construction Revenue Bonds, Series 2015 WW, 5.25%, 6/15/32, Continuously Callable @ 100 | 3,000,000 | 3,301,349 | |||||||||
| New Jersey Transportation Trust Fund Authority Revenue Bonds 5.00%, 6/15/28, Continuously Callable @ 100 | 1,000,000 | 1,127,500 | |||||||||
Series BB, 3.50%, 6/15/46, Continuously Callable @ 100 | 200,000 | 189,538 | |||||||||
| Tobacco Settlement Financing Corp. Revenue Bonds, Series 2018 A, 5.00%, 6/1/46, Continuously Callable @ 100 | 1,500,000 | 1,715,520 | |||||||||
7,321,983 | |||||||||||
New York (15.1%): | |||||||||||
| Metropolitan Transportation Authority Dedicated Tax Green Fund Revenue Bonds, Series 2016 B1, 5.00%, 11/15/56, Continuously Callable @ 100 | 1,545,000 | 1,761,053 | |||||||||
| New York Counties Tobacco Trust II Revenue Bonds, 5.75%, 6/1/43, Continuously Callable @ 100 | 200,000 | 200,578 | |||||||||
| New York Utility Debt Securitization Authority Revenue Bonds, Series 2013 TE, 5.00%, 12/15/41, Continuously Callable @ 100 | 1,500,000 | 1,691,145 | |||||||||
| Port Authority of New York & New Jersey Revenue Bonds 5.00%, 10/1/30, Continuously Callable @ 100 | 2,000,000 | 2,135,880 | |||||||||
5.00%, 12/1/32, Continuously Callable @ 100 | 1,000,000 | 1,122,750 | |||||||||
| TSASC, Inc. Revenue, Series A, 5.00%, 6/1/41, Continuously Callable @ 100 | 2,000,000 | 2,199,960 | |||||||||
9,111,366 | |||||||||||
North Carolina (5.7%): | |||||||||||
| City of Charlotte Certificate of Participation, 4.00%, 6/1/49, Continuously Callable @ 100 | 1,670,000 | 1,900,761 | |||||||||
University of North Carolina Hill Revenue Bonds, 5.00%, 2/1/49 | 1,000,000 | 1,519,870 | |||||||||
3,420,631 | |||||||||||
Ohio (4.5%): | |||||||||||
| Buckeye Tobacco Settlement Financing Authority Revenue Bonds, Series B-2, 5.00%, 6/1/55, Continuously Callable @ 100 | 1,000,000 | 1,050,070 | |||||||||
| Logan Elm Local School District General Obligation Bonds, 4.00%, 11/1/55, Continuously Callable @ 100 | 1,500,000 | 1,695,810 | |||||||||
2,745,880 | |||||||||||
Oregon (0.4%): | |||||||||||
| Oregon State Lottery Revenue Bonds, Series A, 5.25%, 4/1/30, Continuously Callable @ 100 | 205,000 | 212,202 | |||||||||
Pennsylvania (4.4%): | |||||||||||
| Philadelphia School District General Obligation Bonds Series A, 5.00%, 9/1/38, Continuously Callable @ 100 | 1,200,000 | 1,440,372 | |||||||||
Series A, 5.00%, 9/1/44, Continuously Callable @ 100 | 1,000,000 | 1,203,930 | |||||||||
2,644,302 | |||||||||||
See notes to financial statements.
27
| Victory Portfolios Victory Tax-Exempt Fund | Schedule of Portfolio Investments — continued June 30, 2020 | ||||||
(Unaudited)
Security Description | Principal Amount | Value | |||||||||
Texas (2.9%): | |||||||||||
| New Hope Cultural Education Facilities Finance Corp. Revenue, 5.00%, 7/1/47, Continuously Callable @ 102 | $ | 500,000 | $ | 420,040 | |||||||
| Port of Port Arthur Navigation District Revenue, Series C, 0.92%, 4/1/40, Continuously Callable @ 100 (b) | 1,300,000 | 1,300,000 | |||||||||
1,720,040 | |||||||||||
Utah (1.8%): | |||||||||||
| Utah Infrastructure Agency Revenue Bonds, Series A, 5.00%, 10/15/40, Continuously Callable @ 100 | 1,000,000 | 1,064,340 | |||||||||
Washington (4.7%): | |||||||||||
| Richland Electric Utility Revenue Bonds, 5.00%, 11/1/41, Continuously Callable @ 100 | 2,370,000 | 2,747,280 | |||||||||
Total Municipal Bonds (Cost $55,927,688) | 59,534,589 | ||||||||||
Total Investments (Cost $55,927,688) — 98.9% | 59,534,589 | ||||||||||
Other assets in excess of liabilities — 1.1% | 687,762 | ||||||||||
NET ASSETS — 100.00% | $ | 60,222,351 | |||||||||
(a) Rule 144A security or other security that is restricted as to resale to institutional investors. The Fund's Adviser has deemed this security to be liquid based upon procedures approved by the Board of Trustees. As of June 30, 2020, the fair value of these securities was $1,217,321 and amounted to 2.0% of net assets.
(b) Variable Rate Demand Notes that provide the rights to sell the security at face value on either that day or within the rate-reset period. The interest rate is reset on the put date at a stipulated daily, weekly, monthly, quarterly, or other specified time interval to reflect current market conditions. These securities do not indicate a reference rate and spread in their description.
See notes to financial statements.
28
| Victory Portfolios Victory High Income Municipal Bond Fund | Schedule of Portfolio Investments June 30, 2020 | ||||||
(Unaudited)
Security Description | Principal Amount | Value | |||||||||
Municipal Bonds (93.9%) | |||||||||||
California (7.7%): | |||||||||||
| California County Tobacco Securitization Agency Revenue Bonds, Series B-1, 5.00%, 6/1/49, Continuously Callable @ 100 | $ | 250,000 | $ | 290,358 | |||||||
California Educational Facilities Authority Revenue Bonds, 5.00%, 5/1/49 | 1,000,000 | 1,668,849 | |||||||||
| Golden State Tobacco Securitization Corp. Revenue Bonds, Series A2, 5.00%, 6/1/47, Continuously Callable @ 100 | 1,000,000 | 1,012,500 | |||||||||
2,971,707 | |||||||||||
Colorado (3.9%): | |||||||||||
| Regional Transportation District, Denver Transit Partners Eagle P3 Project Revenue Bonds, Series 2010, 6.00%, 1/15/34, Continuously Callable @ 100 | 1,500,000 | 1,503,045 | |||||||||
District of Columbia (2.0%): | |||||||||||
| District of Columbia Tobacco Settlement Financing Corp. Revenue Bonds, 6.50%, 5/15/33 | 715,000 | 767,796 | |||||||||
Florida (6.0%): | |||||||||||
| Escambia County Health Facilities Authority Revenue Bonds, 3.00%, 8/15/50, Continuously Callable @ 100 | 1,000,000 | 991,900 | |||||||||
| Sumter County Village Community Development District No. 10 Special Assessment Revenue Bonds, Series 2014, 5.75%, 5/1/31, Continuously Callable @ 100 | 1,225,000 | 1,290,097 | |||||||||
2,281,997 | |||||||||||
Illinois (18.7%): | |||||||||||
| Chicago Board of Education General Obligation Bonds, 6.00%, 4/1/46, Continuously Callable @ 100 | 1,500,000 | 1,602,119 | |||||||||
| Chicago General Obligation Refunding Bonds, Series 2015 C, 5.00%, 1/1/38, Continuously Callable @ 100 | 1,000,000 | 1,050,490 | |||||||||
City of Chicago General Obligation Bonds | |||||||||||
Series A, 6.00%, 1/1/38, Continuously Callable @ 100 | 1,000,000 | �� | 1,110,400 | ||||||||
Series A, 5.50%, 1/1/49, Continuously Callable @ 100 | 1,000,000 | 1,090,580 | |||||||||
Illinois General Obligation Bonds | |||||||||||
Series June 2013, 5.50%, 7/1/33, Continuously Callable @ 100 | 1,000,000 | 1,044,110 | |||||||||
Series June 2013, 5.50%, 7/1/38, Continuously Callable @ 100 | 1,250,000 | 1,297,963 | |||||||||
7,195,662 | |||||||||||
Massachusetts (3.0%): | |||||||||||
| Massachusetts Educational Financing Authority, Education Loan Revenue Bonds, Issue J | |||||||||||
Series 2011, 5.63%, 7/1/28, Continuously Callable @ 100 | 320,000 | 329,770 | |||||||||
Series 2011, 5.63%, 7/1/29, Continuously Callable @ 100 | 645,000 | 664,479 | |||||||||
Series 2011, 5.63%, 7/1/33, Continuously Callable @ 100 | 160,000 | 164,586 | |||||||||
1,158,835 | |||||||||||
Mississippi (3.1%): | |||||||||||
| Mississippi Development Bank Revenue Bonds, 5.00%, 3/1/48, Continuously Callable @ 100 | 1,000,000 | 1,196,830 | |||||||||
See notes to financial statements.
29
| Victory Portfolios Victory High Income Municipal Bond Fund | Schedule of Portfolio Investments — continued June 30, 2020 | ||||||
(Unaudited)
Security Description | Principal Amount | Value | |||||||||
Missouri (1.4%): | |||||||||||
| Health & Educational Facilities Authority of the State of Missouri Revenue Bonds, 4.25%, 12/1/42, Continuously Callable @ 100 (a) | $ | 500,000 | $ | 529,270 | |||||||
New Jersey (11.6%): | |||||||||||
| New Jersey Economic Development Authority School Facilities Construction Revenue Bonds, Series 2015 WW, 5.25%, 6/15/32, Continuously Callable @ 100 | 1,000,000 | 1,100,450 | |||||||||
| New Jersey Economic Development Motor Vehicle Surcharges Subordinate Revenue Bonds, Series A, 5.00%, 7/1/33, Continuously Callable @ 100 | 500,000 | 543,835 | |||||||||
| New Jersey Higher Education Student Assistance Authority, Student Loan Revenue Bonds, Series 2011-1, 5.75%, 12/1/28, Continuously Callable @ 100 | 575,000 | 603,974 | |||||||||
| New Jersey Transportation Trust Fund Authority Revenue Bonds, Series BB, 3.50%, 6/15/46, Continuously Callable @ 100 | 500,000 | 473,845 | |||||||||
| Tobacco Settlement Financing Corp. Revenue Bonds, Series 2018 A, 5.00%, 6/1/46, Continuously Callable @ 100 | 1,500,000 | 1,715,519 | |||||||||
4,437,623 | |||||||||||
New York (1.7%): | |||||||||||
| Metropolitan Transportation Authority Revenue, Series A-2, 5.00%, 11/15/45, (Put Date 5/15/30) (b) (c) | 365,000 | 420,469 | |||||||||
| Onondaga Civic Development Corp. Revenue, 5.00%, 10/1/40, Continuously Callable @ 100 | 250,000 | 249,390 | |||||||||
669,859 | |||||||||||
North Carolina (3.9%): | |||||||||||
University of North Carolina Hill Revenue Bonds, 5.00%, 2/1/49 | 1,000,000 | 1,519,870 | |||||||||
North Dakota (2.5%): | |||||||||||
| Grand Forks, North Dakota Senior Housing and Nursing Facility Revenue Bonds, 5.00%, 12/1/36, Continuously Callable @ 100 | 1,000,000 | 980,550 | |||||||||
Ohio (2.9%): | |||||||||||
| Logan Elm Local School District General Obligation Bonds, 4.00%, 11/1/55, Continuously Callable @ 100 | 975,000 | 1,102,277 | |||||||||
Oklahoma (0.0%): (d) | |||||||||||
| Oklahoma Development Finance Authority Continuing Care Retirement Community Revenue Bonds, Series 2012, 6.00%, 1/1/32, Continuously Callable @ 100 (e) (f) | 1,885,000 | 18,858 | |||||||||
Oregon (1.6%): | |||||||||||
Clackamas County Hospital Facility Authority Revenue Bonds | |||||||||||
Series A, 5.00%, 11/15/52, Continuously Callable @ 102 | 500,000 | 503,720 | |||||||||
Series A, 5.38%, 11/15/55, Continuously Callable @ 102 | 100,000 | 100,903 | |||||||||
604,623 | |||||||||||
South Carolina (4.6%): | |||||||||||
| Lancaster County, Walnut Creek Improvement District Assessment Refunding Revenue Bonds, Series 2016 A-1, 5.00%, 12/1/37, Continuously Callable @ 100 | 1,675,000 | 1,792,450 | |||||||||
See notes to financial statements.
30
| Victory Portfolios Victory High Income Municipal Bond Fund | Schedule of Portfolio Investments — continued June 30, 2020 | ||||||
(Unaudited)
Security Description | Shares or Principal Amount | Value | |||||||||
South Dakota (1.6%): | |||||||||||
Oglala Sioux Tribe, Series 2012, 5.00%, 10/1/22, Callable 8/6/20 @ 100 (a) | $ | 600,000 | $ | 600,564 | |||||||
Texas (8.9%): | |||||||||||
| New Hope Cultural Education Facilities Finance Corp. Revenue, 5.00%, 7/1/47, Continuously Callable @ 102 | 1,000,000 | 691,840 | |||||||||
| Port of Port Arthur Navigation District Revenue, Series C, 0.92%, 4/1/40, Continuously Callable @ 100 (c) | 1,600,000 | 1,600,000 | |||||||||
| Texas Private Activity Bond Surface Transportation Corp. Revenue Bonds, NTE Mobility Partners Segments 3 LLC — Segments 3A & 3B Facility, Series 2013, 7.00%, 12/31/38, Continuously Callable @ 100 | 1,000,000 | 1,128,760 | |||||||||
3,420,600 | |||||||||||
Utah (6.2%): | |||||||||||
Utah Charter School Finance Authority Revenue Bonds | |||||||||||
5.00%, 4/15/37, Continuously Callable @ 100 | 500,000 | 588,440 | |||||||||
2.75%, 4/15/50, Continuously Callable @ 100 | 525,000 | 528,465 | |||||||||
| Utah Infrastructure Agency Revenue Bonds, Series A, 5.38%, 10/15/40, Continuously Callable @ 100 | 1,150,000 | 1,253,098 | |||||||||
2,370,003 | |||||||||||
West Virginia (2.6%): | |||||||||||
| The Country Commission of Monongalia Country, WV Special District Excise Tax Revenue Bonds, Series 2017 A, 5.75%, 6/1/43, Continuously Callable @ 100 (a) | 1,000,000 | 1,007,990 | |||||||||
Total Municipal Bonds (Cost $34,693,961) | 36,130,409 | ||||||||||
Exchange-Traded Funds (4.0%) | |||||||||||
VanEck Vectors High-Yield Municipal Index ETF | 26,000 | 1,541,280 | |||||||||
Total Exchange-Traded Funds (Cost $1,532,682) | 1,541,280 | ||||||||||
Total Investments (Cost $36,226,643) — 97.9% | 37,671,689 | ||||||||||
Other assets in excess of liabilities — 2.1% | 824,356 | ||||||||||
NET ASSETS — 100.00% | $ | 38,496,045 | |||||||||
(a) Rule 144A security or other security that is restricted as to resale to institutional investors. The Fund's Adviser has deemed this security to be liquid based upon procedures approved by the Board of Trustees. As of June 30, 2020, the fair value of these securities was $2,137,824 and amounted to 5.6% of net assets.
(b) Put Bond.
(c) Variable Rate Demand Notes that provide the rights to sell the security at face value on either that day or within the rate-reset period. The interest rate is reset on the put date at a stipulated daily, weekly, monthly, quarterly, or other specified time interval to reflect current market conditions. These securities do not indicate a reference rate and spread in their description.
(d) Amount represents less than 0.05% of net assets.
(e) Defaulted security.
(f) The Fund's Adviser has deemed this security to be illiquid based upon procedures approved by the Board of Trustees. As of June 30, 2020, illiquid securities were less than 0.05% of the Fund's net assets.
ETF — Exchange-Traded Fund
LLC — Limited Liability Company
See notes to financial statements.
31
| Victory Portfolios Victory Floating Rate Fund | Schedule of Portfolio Investments June 30, 2020 | ||||||
(Unaudited)
Security Description | Principal Amount | Value | |||||||||
Senior Secured Loans (82.8%) | |||||||||||
| Acrisure LLC, 1st Lien Term Loan B, 3.77% (LIBOR01M+350bps), 1/31/27, Callable 8/5/20 @ 101 (a) | $ | 3,786,988 | $ | 3,569,236 | |||||||
| Air Medical Group Holdings, Inc., 5.25% (LIBOR06M+425bps), 3/14/25, Callable 8/5/20 @ 100 (a) | 4,936,709 | 4,708,386 | |||||||||
| Air Methods Corp., 1st Lien Term Loan, 4.95% (LIBOR03M+350bps), 4/21/24 (a) | 3,949,109 | 3,237,440 | |||||||||
| Aldevron LLC, 5.70% (LIBOR03M+425bps), 9/20/26, Callable 8/5/20 @ 100 (a) | 3,192,000 | 3,140,130 | |||||||||
| Alphabet Holding Co., Inc., 1st Lien Term Loan, 3.67% (LIBOR01M+350bps), 8/15/24, Callable 8/5/20 @ 100 (a) | 5,446,000 | 5,114,120 | |||||||||
| Alphabet Holding Co., Inc., 2nd Lien Term Loan, 7.92% (LIBOR01M+775bps), 8/15/25, Callable 8/5/20 @ 100 (a) | 4,950,000 | 4,421,984 | |||||||||
| American Axle & Manufacturing, Inc., 1st Lien Term Loan B, 3.00% (LIBOR01M+225bps), 4/6/24, Callable 8/5/20 @ 100 (a) | 6,624,628 | 6,276,835 | |||||||||
| American Renal Holdings, Inc., 5.17% (LIBOR01M+500bps), 6/15/24, Callable 8/5/20 @ 100 (a) | 4,988,609 | 4,676,821 | |||||||||
| Amneal Pharmaceuticals LLC, 1st Lien Term Loan B, 3.69% (LIBOR01M+350bps), 3/23/25, Callable 8/5/20 @ 100 (a) | 7,838,151 | 7,142,514 | |||||||||
| Apex Tool Group LLC, 6.50% (LIBOR01M+525bps), 8/19/24, Callable 8/5/20 @ 100 (a) | 3,900,000 | 3,478,566 | |||||||||
| Asurion LLC, 1st Lien Term Loan B7, 3.17% (LIBOR01M+300bps), 11/4/24, Callable 8/5/20 @ 100 (a) | 3,875,228 | 3,732,349 | |||||||||
| Avaya, Inc., 1st Lien Term Loan B, 4.43% (LIBOR01M+425bps), 12/15/24, Callable 8/5/20 @ 100 (a) | 6,727,724 | 6,192,870 | |||||||||
| Bass Pro Group LLC, Term Loan B, 6.07% (LIBOR06M+500bps), 12/16/23, Callable 8/5/20 @ 100 (a) | 6,276,280 | 6,022,969 | |||||||||
| Blount International, Inc., 1st Lien Term Loan B, 4.75% (LIBOR01M+375bps), 4/12/23, Callable 8/5/20 @ 100 (a) | 5,865,675 | 5,695,218 | |||||||||
| Boyd Gaming Corp., 2.36% (LIBOR01W+225bps), 9/15/23, Callable 8/5/20 @ 100 (a) | 1,567,636 | 1,470,144 | |||||||||
| Brand Energy & Infrastructure Services, Inc., 1st Lien Term Loan, 5.29%-5.70% (LIBOR03M+425bps), 6/21/24, Callable 8/5/20 @ 100 (a) | 5,753,018 | 5,249,628 | |||||||||
| BW NHHC Holdco, Inc., 9.39% (LIBOR03M+900bps), 5/15/26, Callable 8/5/20 @ 100 (a) | 3,000,000 | 1,350,000 | |||||||||
Caesars Resort Collection LLC, 6/19/25 (a) (b) (c) | 5,000,000 | 4,690,650 | |||||||||
| Chassix, Inc., 1st Lien Term Loan B, 6.50% (LIBOR03M+550bps), 11/10/23, Callable 8/5/20 @ 100 (a) | 1,883,966 | 1,331,342 | |||||||||
| Chassix, Inc., 1st Lien Term Loan B, 6.50% (LIBOR06M+550bps), 11/10/23 (a) | 2,001,299 | 1,414,257 | |||||||||
| CIBT Solutions, Inc., 1st Lien Term Loan, 5.20% (LIBOR03M+375bps), 6/1/24, Callable 8/5/20 @ 100 (a) | 3,840,408 | 2,715,169 | |||||||||
| Clear Channel Outdoor Holdings, Inc., 4.26% (LIBOR03M+350bps), 11/25/26, Callable 8/5/20 @ 100 (a) | 4,962,500 | 4,486,100 | |||||||||
| Concrete Pumping Holdings, Inc., 7.07% (LIBOR06M+600bps), 11/14/25, Callable 8/5/20 @ 100 (a) | 5,625,000 | 5,217,188 | |||||||||
| Consolidated Communications, Inc., 1st Lien Term Loan B, 4.00% (LIBOR01M+300bps), 10/5/23, Callable 8/5/20 @ 100 (a) | 4,874,068 | 4,614,816 | |||||||||
See notes to financial statements.
32
| Victory Portfolios Victory Floating Rate Fund | Schedule of Portfolio Investments — continued June 30, 2020 | ||||||
(Unaudited)
Security Description | Principal Amount | Value | |||||||||
| CPM Holdings, Inc., 1st Lien Term Loan, 3.92%-3.96% (LIBOR01M+375bps), 11/17/25, Callable 8/5/20 @ 100 (a) | $ | 2,955,000 | $ | 2,677,969 | |||||||
| CPM Holdings, Inc., 2nd Lien Term Loan, 8.46% (LIBOR01M+825bps), 11/16/26, Callable 8/5/20 @ 101 (a) | 2,000,000 | 1,682,500 | |||||||||
| Dawn Acquisition LLC, 1st Lien Term Loan B, 5.20% (LIBOR03M+375bps), 10/25/25, Callable 8/5/20 @ 100 (a) | 3,447,500 | 3,117,402 | |||||||||
| Dayco Products LLC, 4.61% (LIBOR03M+425bps), 5/19/24, Callable 8/5/20 @ 100 (a) | 7,760,000 | 4,811,200 | |||||||||
| Delta Air Lines, Inc., 5.51% (LIBOR03M+475bps), 4/27/23, Callable 4/29/21 @ 100 (a) (b) | 8,750,000 | 8,569,575 | |||||||||
Distributed Power, 4.21%-4.22% (LIBOR06M+300bps), 11/6/25 (a) | 5,969,697 | 5,372,727 | |||||||||
| Dole Food Co., Inc., 1st Lien Term Loan B, 3.75% (LIBOR01M+275bps), 3/24/24, Callable 8/5/20 @ 100 (a) | 4,933,333 | 4,785,333 | |||||||||
| Dynasty Acquisition Co., Inc., 1st Lien Term Loan, 4.95% (LIBOR03M+350bps), 4/6/26, Callable 8/5/20 @ 101 (a) | 1,943,357 | 1,654,282 | |||||||||
| Dynasty Acquisition Co., Inc., 1st Lien Term Loan, 4.95% (LIBOR03M+350bps), 4/6/26, Callable 8/5/20 @ 101 (a) | 3,614,643 | 3,076,965 | |||||||||
| Endo International PLC, 1st Lien Term Loan B, 5.00% (LIBOR01M+425bps), 4/29/24, Callable 8/5/20 @ 100 (a) | 4,923,858 | 4,640,736 | |||||||||
| Engineered Machinery Holdings, Inc., 1st Lien Term Loan, 4.45% (LIBOR03M+300bps), 7/19/24, Callable 8/5/20 @ 100 (a) | 3,762,215 | 3,567,822 | |||||||||
| Forterra Finance LLC, 1st Lien Term Loan, 4.00% (LIBOR01M+300bps), 10/25/23, Callable 8/5/20 @ 100 (a) | 5,888,798 | 5,712,134 | |||||||||
| Froneri U.S., Inc., 1st Lien Term Loan B, 2.42% (LIBOR01M+225bps), 1/31/27, Callable 7/31/20 @ 100 (a) | 5,000,000 | 4,690,650 | |||||||||
| Gates Global LLC, 1st Lien Term Loan B2, 3.75% (LIBOR01M+275bps), 3/31/24, Callable 8/5/20 @ 100 (a) | 7,392,685 | 7,103,114 | |||||||||
| Greenway Health LLC, 4.82% (LIBOR06M+375bps), 2/16/24, Callable 8/5/20 @ 100 (a) | 3,332,821 | 2,627,362 | |||||||||
| GTT Communications, Inc., 1st Lien Term Loan B, 2.92% (LIBOR01M+275bps), 5/31/25, Callable 8/5/20 @ 100 (a) | 5,860,202 | 4,295,059 | |||||||||
| Gulf Finance LLC, 1st Lien Term Loan B, 6.25% (LIBOR01M+525bps), 8/25/23 | 2,512,714 | 1,608,137 | |||||||||
| Gulf Finance LLC, 1st Lien Term Loan B, 6.71% (LIBOR03M+525bps), 8/25/23, Callable 8/5/20 @ 100 (a) | 1,512,371 | 967,917 | |||||||||
| Holley Purchaser, Inc., 1st Lien Term Loan, 5.76% (LIBOR03M+500bps), 10/24/25, Callable 8/5/20 @ 100 (a) | 4,334,000 | 3,532,210 | |||||||||
| Hub International Ltd., 1st Lien Term Loan B, 3.87%-4.02% (LIBOR02M+300bps), 4/25/25, Callable 8/5/20 @ 100 (a) | 7,350,000 | 6,976,399 | |||||||||
| iHeart Communications, Inc., 1st Lien Term Loan B, 3.17% (LIBOR01M+300bps), 5/1/26, Callable 8/3/20 @ 100 (a) | 4,975,000 | 4,572,871 | |||||||||
II-VI, Inc., 3.67% (LIBOR01M+350bps), 9/24/26 (a) | 4,962,500 | 4,813,625 | |||||||||
| Intelsat Jackson Holdings SA, 6.50% (LIBOR03M+550bps), 7/13/21 (a) (b) | 4,172,613 | 4,227,399 | |||||||||
| Intelsat Jackson Holdings SA, 1st Lien Term Loan B3, 6.00% (Prime+275bps), 11/27/23, Callable 8/5/20 @ 100 (a) | 6,750,000 | 6,703,627 | |||||||||
| Janus International Group LLC, 1st Lien Term Loan, 4.82% (LIBOR06M+375bps), 2/9/25, Callable 8/5/20 @ 100 (a) | 5,908,502 | 5,553,992 | |||||||||
See notes to financial statements.
33
| Victory Portfolios Victory Floating Rate Fund | Schedule of Portfolio Investments — continued June 30, 2020 | ||||||
(Unaudited)
Security Description | Principal Amount | Value | |||||||||
| Janus International Group LLC, 1st Lien Term Loan, 5.20% (LIBOR03M+375bps) | $ | 15,078 | $ | 14,174 | |||||||
| Kindred Healthcare LLC, 1st Lien Term Loan B, 5.19% (LIBOR01M+500bps), 7/2/25, Callable 8/5/20 @ 100 (a) | 5,895,000 | 5,629,725 | |||||||||
| Leslie's Poolmart, Inc., Term Loan B, 3.67% (LIBOR01M+350bps), 8/16/23, Callable 8/5/20 @ 100 (a) | 5,621,939 | 5,344,384 | |||||||||
| LifeScan Global Corp., 1st Lien Term Loan, 7.18% (LIBOR06M+600bps), 6/19/24, Callable 8/5/20 @ 100 (a) | 3,222,000 | 2,903,022 | |||||||||
| LifeScan Global Corp., 2nd Lien Term Loan, 10.68% (LIBOR06M+950bps), 6/19/25, Callable 8/5/20 @ 102 (a) | 2,250,000 | 1,571,243 | |||||||||
Meredith Corp., 1/31/25 (a) (b) (c) | 5,000,000 | 4,762,500 | |||||||||
| MHI Holdings LLC, 5.17% (LIBOR01M+500bps), 9/20/26, Callable 8/5/20 @ 101 (a) | 6,965,000 | 6,651,576 | |||||||||
| Mileage Plus Holdings LLC/Mileage Plus Intellectual Property Assets Ltd., 6/25/27 (a) (b) (c) | 6,000,000 | 5,952,480 | |||||||||
| Navistar, Inc., 1st Lien Term Loan B, 3.70% (LIBOR01M+350bps), 11/2/24, Callable 8/5/20 @ 100 (a) | 4,338,903 | 4,098,441 | |||||||||
| NCI Building Systems, Inc., 1st Lien Term Loan B, 3.94% (LIBOR01M+375bps), 4/14/25, Callable 8/5/20 @ 100 (a) | 5,865,014 | 5,564,432 | |||||||||
| Ortho-Clinical Diagnostics SA, 1st Lien Term Loan B, 3.43% (LIBOR01M+325bps), 5/22/25, Callable 8/5/20 @ 100 (a) | 3,599,926 | 3,359,199 | |||||||||
Pacific Gas And Electric Co., 5.50% (LIBOR03M+450bps), 5/25/21 (a) | 2,000,000 | 1,962,500 | |||||||||
| Packaging Coordinators Midco, Inc., 2nd Lien Term Loan, 9.83% (LIBOR06M+875bps), 7/1/24, Callable 8/5/20 @ 100 (a) | 4,250,000 | 4,122,500 | |||||||||
| Panther BF Aggregator 2 LP, 3.67% (LIBOR01M+350bps), 4/30/26, Callable 8/5/20 @ 100 (a) | 6,947,500 | 6,600,125 | |||||||||
PG&E Corp., 5.50% (LIBOR03M+450bps), 6/18/25 (a) | 3,000,000 | 2,943,750 | |||||||||
| Pluto Acquisition I, Inc., 5.17% (LIBOR01M+500bps), 6/18/26, Callable 8/5/20 @ 100 (a) | 5,445,000 | 5,172,750 | |||||||||
| Precyse Acquisition Corp., 5.50% (LIBOR01M+450bps), 10/20/22, Callable 8/5/20 @ 100 (a) | 6,653,708 | 5,456,042 | |||||||||
Radiology Partners, Inc., 7/9/25, Callable 8/5/20 @ 100 (a) (b) (c) | 3,000,000 | 2,780,370 | |||||||||
| Regionalcare Hospital Partners Holdings, Inc., 3.92% (LIBOR01M+375bps), 11/16/25, Callable 7/21/20 @ 100 (a) | 2,702,606 | 2,526,585 | |||||||||
| Reynolds Group Holdings, Inc., 1st Lien Term Loan B, 2.92% (LIBOR01M+275bps), 2/5/23, Callable 8/5/20 @ 100 (a) | 2,964,152 | 2,824,540 | |||||||||
| Robertshaw U.S. Holding Corp., 1st Lien Term Loan, 4.25% (LIBOR06M+325bps), 2/15/25, Callable 8/5/20 @ 100 (a) | 1,950,000 | 1,617,525 | |||||||||
| Robertshaw U.S. Holding Corp., 1st Lien Term Loan, 4.25% (LIBOR03M+325bps) | 5,000 | 4,148 | |||||||||
| Robertshaw U.S. Holding Corp., 2nd Lien Term Loan, 9.00% (LIBOR06M+800bps), 2/15/26, Callable 8/5/20 @ 100 (a) | 4,000,000 | 2,160,000 | |||||||||
| Sabert Corp.,1st Lien Term Loan B, 5.50% (LIBOR01M+450bps), 11/25/26, Callable 8/5/20 @ 101 (a) | 3,990,000 | 3,876,964 | |||||||||
| SIWF Holdings, Inc., 9.57% (LIBOR06M+850bps), 5/26/26, Callable 8/5/20 @ 101 (a) | 1,500,000 | 1,252,500 | |||||||||
| SIWF Holdings, Inc., 5.32% (LIBOR06M+425bps), 6/15/25, Callable 8/5/20 @ 100 (a) | 6,912,366 | 6,428,501 | |||||||||
| Specialty Building Products Holdings LLC, 1st Lien Term Loan, 5.92% (LIBOR01M+575bps), 10/1/25, Callable 8/5/20 @ 100 (a) | 6,912,500 | 6,566,874 | |||||||||
See notes to financial statements.
34
| Victory Portfolios Victory Floating Rate Fund | Schedule of Portfolio Investments — continued June 30, 2020 | ||||||
(Unaudited)
Security Description | Principal Amount | Value | |||||||||
| Spectacle Gary Holdings LLC, 11.00% (LIBOR03M+900bps), 12/23/25, Callable 6/23/21 @ 109 (a) | $ | 5,594,595 | $ | 5,147,027 | |||||||
Spectacle Gary Holdings LLC, 10/17/25 (a) (b) (c) | 405,405 | 372,973 | |||||||||
SRS Distribution, Inc., 5.57% (LIBOR06M+450bps), 5/23/25 (a) | 2,487,500 | 2,400,438 | |||||||||
| SRS Distribution, Inc., 1st Lien Term Loan B, 4.32% (LIBOR06M+325bps), 5/19/25, Callable 8/5/20 @ 100 (a) | 3,930,000 | 3,705,008 | |||||||||
| Station Casinos LLC, 1st Lien Term Loan B1, 2.50% (LIBOR01M+225bps), 2/8/27, Callable 8/5/20 @ 101 (a) | 4,483,694 | 4,068,952 | |||||||||
Surgery Center Holdings, Inc., 8/31/24, Callable 8/5/20 @ 100 (a) (b) (c) | 4,099,744 | 3,585,800 | |||||||||
| Tailwind Smith Cooper Intermediate Corp., 6.08% (LIBOR06M+500bps), 5/28/26, Callable 8/5/20 @ 100 (a) | 4,962,500 | 4,368,538 | |||||||||
| Tailwind Smith Cooper Intermediate Corp., 10.08% (LIBOR06M+900bps), 5/28/27, Callable 8/5/20 @ 101 (a) | 3,000,000 | 2,349,990 | |||||||||
| Team Health Holdings, Inc., 1st Lien Term Loan B, 3.75% (LIBOR01M+275bps), 2/6/24, Callable 8/5/20 @ 100 (a) | 6,693,063 | 5,099,311 | |||||||||
| Tecomet, Inc., 1st Lien Term Loan B, 4.68% (LIBOR06M+350bps), 4/18/24, Callable 8/5/20 @ 100 (a) | 6,789,999 | 6,399,574 | |||||||||
| Tenneco, Inc., 1st Lien Term Loan B, 3.17% (LIBOR01M+300bps), 6/18/25, Callable 8/5/20 @ 100 (a) | 6,402,500 | 5,516,842 | |||||||||
| The Hillman Group, Inc., 1st Lien Term Loan B, 5.07% (LIBOR06M+400bps), 5/31/25, Callable 8/5/20 @ 100 (a) | 2,984,772 | 2,790,761 | |||||||||
| The Men's Wearhouse, Inc., 1st Lien Term Loan B2, 4.25% (LIBOR01M+325bps) | 2,801,862 | 448,298 | |||||||||
| The Men's Wearhouse, Inc., 1st Lien Term Loan B2, 4.68% (LIBOR03M+325bps), 4/9/25, Callable 8/5/20 @ 100 (a) | 684,092 | 109,455 | |||||||||
| Thor Industries, Inc., 1st Lien Term Loan B, 3.94% (LIBOR01M+375bps), 2/1/26, Callable 8/5/20 @ 100 (a) | 5,813,868 | 5,675,789 | |||||||||
| Titan Acquisition Ltd./Titan Co-Borrower LLC, 4.45% (LIBOR03M+300bps), 3/28/25, Callable 8/5/20 @ 100 (a) | 4,849,730 | 4,423,585 | |||||||||
| TransDigm, Inc., 2.42% (LIBOR01M+225bps), 12/9/25, Callable 8/5/20 @ 101 (a) | 4,987,469 | 4,474,458 | |||||||||
| U.S. LBM Borrower LLC, 4.82% (LIBOR06M+375bps), 8/20/22, Callable 8/5/20 @ 100 (a) | 4,762,022 | 4,669,781 | |||||||||
| U.S. Renal Care, Inc., 5.19% (LIBOR01M+500bps), 6/26/26, Callable 8/5/20 @ 100 (a) | 5,967,487 | 5,727,953 | |||||||||
| Univision Communications, 1st Lien Term Loan C5, 4.75% (LIBOR01M+375bps), 3/15/24, Callable 8/5/20 @ 100 (a) | 6,030,922 | 5,563,525 | |||||||||
| USI, Inc., 1st Lien Term Loan B, 3.17% (LIBOR01M+300bps), 5/16/24, Callable 8/5/20 @ 100 (a) | 5,783,034 | 5,476,534 | |||||||||
| UTZ Quality Foods LLC, 1st Lien Term Loan, 3.67% (LIBOR01M+350bps), 11/14/24, Callable 8/5/20 @ 100 (a) | 6,318,236 | 6,194,525 | |||||||||
| Verscend Holding Corp., 4.67% (LIBOR01M+450bps), 8/10/25, Callable 8/5/20 @ 100 (a) | 2,910,176 | 2,806,137 | |||||||||
| Vertex Aerospace Services Corp., 1st Lien Term Loan B, 4.67% (LIBOR01M+450bps), 6/16/25, Callable 8/5/20 @ 100 (a) | 2,940,000 | 2,881,200 | |||||||||
| WP CPP Holdings LLC, 1st Lien Term Loan B, 4.50% (LIBOR03M+350bps), 4/30/25, Callable 8/5/20 @ 100 (a) | 3,931,310 | 3,383,364 | |||||||||
| WP CPP Holdings LLC, 2nd Lien Term Loan, 8.75% (LIBOR03M+775bps), 4/30/26, Callable 8/5/20 @ 100 (a) | 2,000,000 | 1,480,000 | |||||||||
Total Senior Secured Loans (Cost $445,376,446) | 408,556,407 | ||||||||||
See notes to financial statements.
35
| Victory Portfolios Victory Floating Rate Fund | Schedule of Portfolio Investments — continued June 30, 2020 | ||||||
(Unaudited)
Security Description | Principal Amount | Value | |||||||||
Corporate Bonds (16.1%) | |||||||||||
Communication Services (0.9%): | |||||||||||
| Consolidated Communications, Inc., 6.50%, 10/1/22, Callable 8/6/20 @ 101.63 (d) | $ | 5,000,000 | $ | 4,605,200 | |||||||
Consumer Discretionary (4.4%): | |||||||||||
| Diamond Sports Group LLC/Diamond Sports Finance Co., 6.63%, 8/15/27, Callable 8/15/22 @ 103.31 (d) (e) | 2,500,000 | 1,338,075 | |||||||||
Ford Motor Co. | |||||||||||
8.50%, 4/21/23 (d) | 500,000 | 528,655 | |||||||||
9.00%, 4/22/25, Callable 3/22/25 @ 100 (d) | 4,275,000 | 4,621,532 | |||||||||
Golden Nugget, Inc., 8.75%, 10/1/25, Callable 10/1/20 @ 104.38 (d) (e) | 5,000,000 | 2,940,900 | |||||||||
Scientific Games International, Inc. | |||||||||||
8.63%, 7/1/25, Callable 7/1/22 @ 104.31 (b) (e) | 1,000,000 | 935,090 | |||||||||
8.25%, 3/15/26, Callable 3/15/22 @ 104.13 (e) | 6,000,000 | 5,379,659 | |||||||||
| The Enterprise Development Authority, 12.00%, 7/15/24, Callable 7/15/21 @ 109 (d) (e) | 5,000,000 | 5,034,250 | |||||||||
Winnebago Industries, Inc., 6.25%, 7/15/28, Callable 7/15/23 @ 103.13 | 1,000,000 | 1,000,000 | |||||||||
21,778,161 | |||||||||||
Energy (0.8%): | |||||||||||
Husky Holding Ltd. PIK, 13.00%, 2/15/25, Callable 2/15/21 @ 109.75 (d) (e) | 4,500,000 | 4,329,765 | |||||||||
Financials (4.2%): | |||||||||||
| Capitol Investment Merger Sub 2 LLC, 10.00%, 8/1/24, Callable 8/1/21 @ 105 (e) | 2,500,000 | 2,494,500 | |||||||||
| Compass Group Diversified Holdings LLC, 8.00%, 5/1/26, Callable 5/1/21 @ 104 (d) (e) | 5,000,000 | 5,100,100 | |||||||||
| LABL Escrow Issuer LLC, 10.50%, 7/15/27, Callable 7/15/22 @ 105.25 (d) (e) | 6,500,000 | 6,915,675 | |||||||||
Wolverine Escrow LLC | |||||||||||
9.00%, 11/15/26, Callable 11/15/22 @ 106.75 (e) | 4,500,000 | 3,294,900 | |||||||||
13.13%, 11/15/27, Callable 11/15/22 @ 109.84 (e) | 4,750,000 | 3,127,448 | |||||||||
20,932,623 | |||||||||||
Health Care (0.9%): | |||||||||||
| Ortho-Clinical Diagnostics, Inc. / Ortho-Clinical Diagnostics SA, 7.38%, 6/1/25, Callable 6/1/22 @ 103.69 (d) (e) | 2,000,000 | 2,035,420 | |||||||||
Radiology Partners, Inc., 9.25%, 2/1/28, Callable 2/1/23 @ 104.63 (d) (e) | 2,500,000 | 2,355,375 | |||||||||
4,390,795 | |||||||||||
Industrials (3.9%): | |||||||||||
| Algeco Global Finance 2 PLC, 10.00%, 8/15/23, Callable 7/17/20 @ 105 (d) (e) | 4,000,000 | 3,356,160 | |||||||||
| Apex Tool Group LLC/BC Mountain Finance, Inc., 9.00%, 2/15/23, Callable 8/6/20 @ 101 (e) | 4,000,000 | 2,799,120 | |||||||||
| Mileage Plus Holdings LLC/Mileage Plus Intellectual Property Assets Ltd., 6.50%, 6/20/27, Callable 6/30/23 @ 103.25 (b) (e) | 4,000,000 | 3,991,280 | |||||||||
Picasso Finance Sub, Inc., 6.13%, 6/15/25, Callable 6/15/22 @ 103.06 (d) (e) | 1,000,000 | 1,021,970 | |||||||||
SRS Distribution, Inc., 8.25%, 7/1/26, Callable 7/1/21 @ 104.13 (d) (e) | 3,000,000 | 3,028,710 | |||||||||
WESCO Distribution, Inc., 7.13%, 6/15/25, Callable 6/15/22 @ 103.56 (e) | 4,500,000 | 4,744,170 | |||||||||
18,941,410 | |||||||||||
See notes to financial statements.
36
| Victory Portfolios Victory Floating Rate Fund | Schedule of Portfolio Investments — continued June 30, 2020 | ||||||
(Unaudited)
Security Description | Principal Amount | Value | |||||||||
Information Technology (0.5%): | |||||||||||
Colt Merger Sub, Inc., 8.13%, 7/1/27, Callable 7/1/23 @ 104.06 (b) (e) | $ | 2,500,000 | $ | 2,416,475 | |||||||
Materials (0.5%): | |||||||||||
| Titan Acquisition Ltd./Titan Co-Borrower LLC, 7.75%, 4/15/26, Callable 4/15/21 @ 103.88 (d) (e) | 2,500,000 | 2,367,375 | |||||||||
Total Corporate Bonds (Cost $86,469,199) | 79,761,804 | ||||||||||
Total Investments (Cost $531,845,645) — 98.9% | 488,318,211 | ||||||||||
Other assets in excess of liabilities — 1.1% | 5,207,800 | ||||||||||
NET ASSETS — 100.00% | $ | 493,526,011 | |||||||||
(a) Variable or Floating-Rate Security. Rate disclosed is as of June 30, 2020.
(b) Security purchased on a when-issued basis.
(c) The rates for this senior secured loan will be known on settlement date of the loan, subsequent to this report date. Senior secured loans have rates that will fluctuate over time in line with prevailing interest rates.
(d) All or a portion of this security has been segregated as collateral for securities purchased on a when-issued basis.
(e) Rule 144A security or other security that is restricted as to resale to institutional investors. The Fund's Adviser has deemed this security to be liquid based upon procedures approved by the Board of Trustees. As of June 30, 2020, the fair value of these securities was $69,006,417 and amounted to 14.0% of net assets.
bps — Basis points
LIBOR — London InterBank Offered Rate
LIBOR01M — 1 Month US Dollar LIBOR, rate disclosed as of June 30, 2020, based on the last reset date of the security
LIBOR01W — 1 Week US Dollar LIBOR, rate disclosed as of June 30, 2020, based on the last reset date of the security
LIBOR02M — 2 Month US Dollar LIBOR, rate disclosed as of June 30, 2020, based on the last reset date of the security
LIBOR03M — 3 Month US Dollar LIBOR, rate disclosed as of June 30, 2020, based on the last reset date of the security
LIBOR06M — 6 Month US Dollar LIBOR, rate disclosed as of June 30, 2020, based on the last reset date of the security
LLC — Limited Liability Company
LP — Limited Partnership
PIK — Payment-in-Kind
PLC — Public Limited Company
PRIME — U.S. Prime Rate
See notes to financial statements.
37
| Victory Portfolios Victory Strategic Income Fund | Schedule of Portfolio Investments June 30, 2020 | ||||||
(Unaudited)
Security Description | Principal Amount | Value | |||||||||
Asset-Backed Securities (4.1%) | |||||||||||
| Ally Auto Receivables Trust, Series 2018-2, Class A3, 2.92%, 11/15/22, Callable 12/15/21 @ 100 | $ | 162,469 | $ | 164,548 | |||||||
| AmeriCredit Automobile, Series 2017-3, Class A3, 1.90%, 3/18/22, Callable 3/18/22 @ 100 (a) | 22,073 | 22,089 | |||||||||
| Applebee's Funding LLC/IHOP Funding LLC, Series 2019-1A, Class A2I, 4.19%, 6/7/49, Callable 6/5/24 @ 100 (a) (b) | 500,000 | 438,858 | |||||||||
Capital Automotive REIT, Series 2016-A1, Class A, 4.55%, 2/15/46 (a) (b) | 711,279 | 716,074 | |||||||||
Chesapeake Funding LLC, Series 2018-A1, Class A1, 3.04%, 4/15/30 (b) | 165,712 | 168,462 | |||||||||
| Enterprise Fleet Financing LLC, Series 2019-1, Class A2, 2.98%, 10/22/24 (b) | 153,596 | 156,507 | |||||||||
| Focus Brands Funding LLC, Series 2017-1A, Class A2I, 3.86%, 4/30/47, Callable 7/30/20 @ 100 (a) (b) | 970,000 | 907,985 | |||||||||
| Honda Auto Receivables Owner Trust, Series 2018-3, Class A3, 2.95%, 8/22/22, Callable 1/21/22 @ 100 | 160,429 | 163,137 | |||||||||
| Santander Drive Auto Receivables Trust, Series 2016-3, Class C, 2.46%, 3/15/22, Callable 2/15/21 @ 100 (a) | 45,247 | 45,304 | |||||||||
| Verizon Owner Trust, Series 2017-3A, Class B, 2.38%, 4/20/22, Callable 1/20/21 @ 100 (a) (b) | 500,000 | 504,124 | |||||||||
Total Asset-Backed Securities (Cost $3,432,300) | 3,287,088 | ||||||||||
Collateralized Mortgage Obligations (4.1%) | |||||||||||
| CGMS Commercial Mortgage Trust, Series 2017-B1, Class A4, 3.46%, 8/15/50 (a) | 590,000 | 653,242 | |||||||||
COMM Mortgage Trust, Series 2015-PC1, Class A5, 3.90%, 7/10/50 (a) | 250,000 | 275,846 | |||||||||
Four Times Square Trust, Series 2006-4TS, Class A, 5.40%, 12/13/28 (b) | 457,356 | 461,229 | |||||||||
| GS Mortgage Securities Trust, Series 2012-GCJ7, Class A4, 3.38%, 5/10/45 (a) | 617,559 | 627,759 | |||||||||
| GS Mortgage Securities Trust, Series 2019-GC42, Class A4, 3.00%, 9/1/52 (a) | 690,000 | 759,229 | |||||||||
Hilton USA Trust, Series 2016-SFP, Class A, 2.83%, 11/5/35 (a) (b) | 500,000 | 492,027 | |||||||||
Total Collateralized Mortgage Obligations (Cost $3,217,629) | 3,269,332 | ||||||||||
Corporate Bonds (63.1%) | |||||||||||
Communication Services (8.0%): | |||||||||||
| Charter Communications Operating LLC / Charter Communications Operating Capital | |||||||||||
5.05%, 3/30/29, Callable 12/30/28 @ 100 (a) (c) | 750,000 | 885,585 | |||||||||
2.80%, 4/1/31, Callable 1/1/31 @ 100 | 250,000 | 253,813 | |||||||||
| Charter Communications Operating LLC/Capital, 4.20%, 3/15/28, Callable 12/15/27 @ 100 (a) | 200,000 | 223,632 | |||||||||
Comcast Corp. | |||||||||||
4.15%, 10/15/28, Callable 7/15/28 @ 100 (a) | 750,000 | 898,582 | |||||||||
3.97%, 11/1/47, Callable 5/1/47 @ 100 | 300,000 | 357,507 | |||||||||
T-Mobile USA, Inc. | |||||||||||
3.88%, 4/15/30, Callable 1/15/30 @ 100 (a) (b) | 500,000 | 556,525 | |||||||||
4.50%, 4/15/50, Callable 10/15/49 @ 100 (b) | 170,000 | 200,286 | |||||||||
See notes to financial statements.
38
| Victory Portfolios Victory Strategic Income Fund | Schedule of Portfolio Investments — continued June 30, 2020 | ||||||
(Unaudited)
Security Description | Principal Amount | Value | |||||||||
Verizon Communications, Inc., 4.52%, 9/15/48 (a) | $ | 1,250,000 | $ | 1,652,250 | |||||||
ViacomCBS, Inc., 4.20%, 5/19/32, Callable 2/19/32 @ 100 | 500,000 | 557,905 | |||||||||
Vodafone Group PLC, 4.38%, 2/19/43 | 650,000 | 754,572 | |||||||||
6,340,657 | |||||||||||
Consumer Discretionary (5.7%): | |||||||||||
General Motors Co., 6.80%, 10/1/27, Callable 8/1/27 @ 100 | 300,000 | 349,482 | |||||||||
Hasbro, Inc., 3.90%, 11/19/29, Callable 8/19/29 @ 100 (a) | 750,000 | 780,908 | |||||||||
McDonald's Corp., 2.63%, 9/1/29, MTN, Callable 6/1/29 @ 100 (a) | 280,000 | 299,818 | |||||||||
Ross Stores, Inc., 4.80%, 4/15/30, Callable 1/15/30 @ 100 | 1,000,000 | 1,196,910 | |||||||||
Target Corp. | |||||||||||
3.50%, 7/1/24 (a) | 750,000 | 836,910 | |||||||||
2.35%, 2/15/30, Callable 11/15/29 @ 100 (a) | 1,000,000 | 1,075,390 | |||||||||
4,539,418 | |||||||||||
Consumer Staples (8.8%): | |||||||||||
| Anheuser-Busch InBev Worldwide, Inc., 4.75%, 1/23/29, Callable 10/23/28 @ 100 (a) | 1,750,000 | 2,112,163 | |||||||||
BAT Capital Corp., 3.46%, 9/6/29, Callable 6/6/29 @ 100 (a) | 1,500,000 | 1,597,530 | |||||||||
Constellation Brands, Inc. | |||||||||||
2.88%, 5/1/30, Callable 2/1/30 @ 100 (a) | 750,000 | 795,585 | |||||||||
4.10%, 2/15/48, Callable 8/15/47 @ 100 (a) | 250,000 | 282,995 | |||||||||
Philip Morris International, Inc., 4.25%, 11/10/44 (c) | 600,000 | 725,250 | |||||||||
The Kroger Co. | |||||||||||
2.20%, 5/1/30, Callable 2/1/30 @ 100 (a) (c) | 1,250,000 | 1,298,863 | |||||||||
3.95%, 1/15/50, Callable 7/15/49 @ 100 | 200,000 | 229,656 | |||||||||
7,042,042 | |||||||||||
Energy (8.1%): | |||||||||||
Chevron Corp., 2.24%, 5/11/30, Callable 2/11/30 @ 100 (a) (c) | 300,000 | 315,243 | |||||||||
Energy Transfer Operating LP, 4.95%, 6/15/28, Callable 3/15/28 @ 100 (a) | 700,000 | 754,005 | |||||||||
Hess Corp., 4.30%, 4/1/27, Callable 1/1/27 @ 100 | 1,400,000 | 1,449,728 | |||||||||
Marathon Petroleum Corp., 4.50%, 4/1/48, Callable 10/1/47 @ 100 | 250,000 | 256,915 | |||||||||
| MPLX LP | |||||||||||
4.80%, 2/15/29, Callable 11/15/28 @ 100 (c) | 1,500,000 | 1,668,464 | |||||||||
5.50%, 2/15/49, Callable 8/15/48 @ 100 (c) | 100,000 | 110,778 | |||||||||
ONEOK, Inc., 3.40%, 9/1/29, Callable 6/1/29 @ 100 | 500,000 | 486,665 | |||||||||
Sabine Pass Liquefaction LLC | |||||||||||
5.00%, 3/15/27, Callable 9/15/26 @ 100 (a) | 500,000 | 558,375 | |||||||||
4.20%, 3/15/28, Callable 9/15/27 @ 100 | 250,000 | 268,483 | |||||||||
Valero Energy Corp., 2.85%, 4/15/25, Callable 3/15/25 @ 100 (a) (c) | 500,000 | 528,270 | |||||||||
6,396,926 | |||||||||||
Financials (15.5%): | |||||||||||
| Apollo Management Holdings LP, 4.87%, 2/15/29, Callable 11/15/28 @ 100 (b) | 500,000 | 586,945 | |||||||||
Arch Capital Group Ltd., 3.64%, 6/30/50, Callable 12/30/49 @ 100 | 300,000 | 314,037 | |||||||||
BP Capital Markets America, Inc., 3.00%, 2/24/50, Callable 8/24/49 @ 100 | 200,000 | 195,984 | |||||||||
Citigroup, Inc. | |||||||||||
4.08%(LIBOR03M+119bps), 4/23/29, Callable 4/23/28 @ 100 (a) (d) | 750,000 | 856,088 | |||||||||
4.65%, 7/23/48, Callable 6/23/48 @ 100 | 300,000 | 392,310 | |||||||||
See notes to financial statements.
39
| Victory Portfolios Victory Strategic Income Fund | Schedule of Portfolio Investments — continued June 30, 2020 | ||||||
(Unaudited)
Security Description | Principal Amount | Value | |||||||||
| Credit Suisse Group AG, 3.87%(LIBOR03M+141bps), 1/12/29, Callable 1/12/28 @ 100 (a) (b) (d) | $ | 2,500,000 | $ | 2,755,125 | |||||||
Discover Bank, 4.65%, 9/13/28, Callable 6/13/28 @ 100 (a) | 600,000 | 689,034 | |||||||||
Huntington Bancshares, Inc., 2.55%, 2/4/30, Callable 11/4/29 @ 100 | 1,400,000 | 1,448,187 | |||||||||
Jefferies GRP LLC/Capital, 4.85%, 1/15/27 (a) | 1,000,000 | 1,095,769 | |||||||||
| JPMorgan Chase & Co., 2.96%(SOFR+252bps), 5/13/31, Callable 5/13/30 @ 100 (a) (d) | 500,000 | 530,375 | |||||||||
Morgan Stanley | |||||||||||
3.13%, 1/23/23 (a) | 750,000 | 795,442 | |||||||||
3.95%, 4/23/27 | 250,000 | 280,383 | |||||||||
Sumitomo Mitsui Financial Group, Inc., 3.20%, 9/17/29 (a) | 750,000 | 801,158 | |||||||||
The Goldman Sachs Group, Inc., 5.95%, 1/15/27 (a) (c) | 500,000 | 623,650 | |||||||||
Wells Fargo & Co. | |||||||||||
3.07%(SOFR+253bps), 4/30/41, Callable 4/30/40 @ 100 (d) | 250,000 | 260,935 | |||||||||
3.90%, 5/1/45 | 500,000 | 585,215 | |||||||||
12,210,637 | |||||||||||
Health Care (2.2%): | |||||||||||
Becton Dickinson and Co., 3.36%, 6/6/24, Callable 4/6/24 @ 100 (a) | 850,000 | 914,855 | |||||||||
CVS Health Corp., 3.25%, 8/15/29, Callable 5/15/29 @ 100 (a) | 750,000 | 827,490 | |||||||||
1,742,345 | |||||||||||
Industrials (2.0%): | |||||||||||
Carrier Global Corp., 2.70%, 2/15/31, Callable 11/15/30 @ 100 (b) | 100,000 | 99,624 | |||||||||
The Boeing Co., 5.04%, 5/1/27, Callable 3/1/27 @ 100 | 800,000 | 882,344 | |||||||||
Waste Connections, Inc., 3.50%, 5/1/29, Callable 2/1/29 @ 100 (a) | 600,000 | 674,232 | |||||||||
1,656,200 | |||||||||||
Information Technology (4.0%): | |||||||||||
Broadcom, Inc. | |||||||||||
4.11%, 9/15/28, Callable 6/15/28 @ 100 (b) | 736,000 | 804,676 | |||||||||
4.75%, 4/15/29, Callable 1/15/29 @ 100 (a) (b) | 500,000 | 567,460 | |||||||||
Fiserv, Inc. | |||||||||||
3.80%, 10/1/23, Callable 9/1/23 @ 100 | 250,000 | 273,205 | |||||||||
3.50%, 7/1/29, Callable 4/1/29 @ 100 (a) | 600,000 | 674,160 | |||||||||
KLA Corp., 4.10%, 3/15/29, Callable 12/15/28 @ 100 (a) (c) | 750,000 | 885,773 | |||||||||
3,205,274 | |||||||||||
Materials (2.3%): | |||||||||||
Steel Dynamics, Inc. | |||||||||||
3.45%, 4/15/30, Callable 1/15/30 @ 100 (a) | 750,000 | 786,037 | |||||||||
3.25%, 1/15/31, Callable 10/15/30 @ 100 | 150,000 | 152,942 | |||||||||
WRKCo, Inc. | |||||||||||
4.90%, 3/15/29, Callable 12/15/28 @ 100 (a) | 600,000 | 714,204 | |||||||||
3.00%, 6/15/33, Callable 3/15/33 @ 100 | 150,000 | 156,150 | |||||||||
1,809,333 | |||||||||||
Real Estate (4.2%): | |||||||||||
American Tower Corp., 2.95%, 1/15/25, Callable 12/15/24 @ 100 (a) | 1,000,000 | 1,075,070 | |||||||||
Mid-America Apartments LP, 3.95%, 3/15/29, Callable 12/15/28 @ 100 | 2,000,000 | 2,299,579 | |||||||||
3,374,649 | |||||||||||
See notes to financial statements.
40
| Victory Portfolios Victory Strategic Income Fund | Schedule of Portfolio Investments — continued June 30, 2020 | ||||||
(Unaudited)
| Security Description | Principal Amount | Value | |||||||||
Utilities (2.3%): | |||||||||||
Avangrid, Inc., 3.80%, 6/1/29, Callable 3/1/29 @ 100 (a) (c) | $ | 750,000 | $ | 868,688 | |||||||
CenterPoint Energy, Inc., 2.95%, 3/1/30, Callable 12/1/29 @ 100 | 300,000 | 320,238 | |||||||||
FirstEnergy Corp., 2.65%, 3/1/30, Callable 12/1/29 @ 100 (a) | 600,000 | 627,558 | |||||||||
1,816,484 | |||||||||||
Total Corporate Bonds (Cost $48,233,303) | 50,133,965 | ||||||||||
Residential Mortgage-Backed Securities (0.4%) | |||||||||||
| Bank of America Funding Corp., Series 2004-2, Class 1CB1, 5.75%, 9/20/34, Callable 10/20/24 @ 100 (a) | 66,691 | 69,317 | |||||||||
| Bear Stearns Alt-A Trust, Series 2003-3, Class 2A, 4.09%, 10/25/33, Callable 7/25/20 @ 100 (a) (e) | 127,274 | 125,220 | |||||||||
| Countrywide Home Loans, Inc., Series 2004-5, Class 2A9, 5.25%, 5/25/34, Callable 7/25/20 @ 100 (a) | 95,227 | 95,474 | |||||||||
| JPMorgan Mortgage Trust, Series 2005-A1, Class 6T1, 3.77%, 2/25/35, Callable 7/25/20 @ 100 (a) (e) | 24,831 | 24,831 | |||||||||
| JPMorgan Mortgage Trust, Series 2004-S2, Class 1A3, 4.75%, 12/31/20, Callable 7/25/20 @ 100 (a) | 2,327 | 1,759 | |||||||||
Total Residential Mortgage-Backed Securities (Cost $320,692) | 316,601 | ||||||||||
U.S. Government Mortgage-Backed Agencies (0.2%) | |||||||||||
| Federal National Mortgage Association Series 2018-M1, Class A2, 3.08%, 12/25/27 (e) | 65,000 | 72,158 | |||||||||
3.50%, 7/1/43 (a) | 76,198 | 82,418 | |||||||||
154,576 | |||||||||||
Total U.S. Government Mortgage-Backed Agencies (Cost $140,396) | 154,576 | ||||||||||
U.S. Treasury Obligations (23.0%) | |||||||||||
U.S. Treasury Bonds | |||||||||||
2.25%, 8/15/49 | 175,000 | 210,438 | |||||||||
2.38%, 11/15/49 | 190,000 | 234,650 | |||||||||
2.00%, 2/15/50 (a) | 500,000 | 572,656 | |||||||||
U.S. Treasury Notes | |||||||||||
1.38%, 8/31/20 | 2,500,000 | 2,504,883 | |||||||||
1.25%, 3/31/21 | 2,000,000 | 2,016,094 | |||||||||
0.13%, 4/30/22 (a) | 10,610,000 | 10,602,954 | |||||||||
1.75%, 7/31/24 (a) | 1,500,000 | 1,592,461 | |||||||||
1.25%, 8/31/24 | 100,000 | 104,180 | |||||||||
0.63%, 5/15/30 | 420,000 | 418,884 | |||||||||
Total U.S. Treasury Obligations (Cost $18,141,747) | 18,257,200 | ||||||||||
See notes to financial statements.
41
| Victory Portfolios Victory Strategic Income Fund | Schedule of Portfolio Investments — continued June 30, 2020 | ||||||
(Unaudited)
Security Description | Shares | Value | |||||||||
Exchange-Traded Funds (1.8%) | |||||||||||
iShares iBoxx High Yield Corporate Bond ETF | 18,000 | $ | 1,469,160 | ||||||||
Total Exchange-Traded Funds (Cost $1,494,000) | 1,469,160 | ||||||||||
Collateral for Securities Loaned^ (5.7%) | |||||||||||
| BlackRock Liquidity Funds TempFund Portfolio, Institutional Class, 0.28% (f) | 75,108 | 75,108 | |||||||||
| Fidelity Investments Money Market Government Portfolio, Class I, 0.09% (f) | 2,273,209 | 2,273,209 | |||||||||
| Goldman Sachs Financial Square Prime Obligations Fund, Institutional Class, 0.30% (f) | 522,302 | 522,302 | |||||||||
JPMorgan Prime Money Market Fund, Capital Class, 0.43% (f) | 298,876 | 298,876 | |||||||||
| Morgan Stanley Institutional Liquidity Prime Portfolio, Institutional Class, 0.41% (f) | 1,343,807 | 1,343,807 | |||||||||
Total Collateral for Securities Loaned (Cost $4,513,302) | 4,513,302 | ||||||||||
Total Investments (Cost $79,493,369) — 102.4% | 81,401,224 | ||||||||||
Liabilities in excess of other assets — (2.4)% | (1,869,921 | ) | |||||||||
NET ASSETS — 100.00% | $ | 79,531,303 | |||||||||
^ Purchased with cash collateral from securities on loan.
(a) All or a portion of this security has been segregated as collateral for derivative instruments.
(b) Rule 144A security or other security that is restricted as to resale to institutional investors. The Fund's Adviser has deemed this security to be liquid based upon procedures approved by the Board of Trustees. As of June 30, 2020, the fair value of these securities was $9,415,907 and amounted to 11.8% of net assets.
(c) All or a portion of this security is on loan.
(d) Variable or Floating-Rate Security. Rate disclosed is as of June 30, 2020.
(e) The rate for certain asset-backed and mortgage-backed securities may vary based on factors relating to the pool of assets underlying the security. The rate disclosed is the rate in effect at June 30, 2020.
(f) Rate disclosed is the daily yield on June 30, 2020.
bps — Basis points
ETF — Exchange-Traded Fund
LIBOR — London InterBank Offered Rate
LIBOR03M — 3 Month US Dollar LIBOR, rate disclosed as of June 30, 2020, based on the last reset date of the security
LLC — Limited Liability Company
LP — Limited Partnership
MTN — Medium-Term Note
PLC — Public Limited Company
REIT — Real Estate Investment Trust
SOFR — Secured Overnight Financing Rate
See notes to financial statements.
42
| Victory Portfolios Victory Strategic Income Fund | Schedule of Portfolio Investments — continued June 30, 2020 | ||||||
(Unaudited)
Futures Contracts Purchased
| Number of Contracts | Expiration Date | Notional Amount | Value | Unrealized Appreciation (Depreciation) | |||||||||||||||||||
2-Year U.S. Treasury Note Futures | 25 | 9/30/20 | $ | 5,518,875 | $ | 5,520,703 | $ | 1,828 | |||||||||||||||
30-Year U.S. Treasury Bond Futures | 25 | 9/21/20 | 4,406,318 | 4,464,063 | 57,745 | ||||||||||||||||||
Ultra Long-Term U.S. Treasury Bond Futures | 17 | 9/21/20 | 3,698,879 | 3,708,656 | 9,777 | ||||||||||||||||||
$ | 69,350 | ||||||||||||||||||||||
Futures Contracts Sold
| Number of Contracts | Expiration Date | Notional Amount | Value | Unrealized Appreciation (Depreciation) | |||||||||||||||||||
10-Year U.S. Treasury Note Futures | 114 | 9/21/20 | $ | 17,842,860 | $ | 17,953,219 | $ | (110,359 | ) | ||||||||||||||
Total unrealized appreciation | $ | 69,350 | |||||||||||||||||||||
Total unrealized depreciation | (110,359 | ) | |||||||||||||||||||||
Total net unrealized appreciation (depreciation) | $ | (41,009 | ) | ||||||||||||||||||||
See notes to financial statements.
43
Victory Portfolios | Statements of Assets and Liabilities June 30, 2020 | ||||||
(Unaudited)
| Victory INCORE Investment Quality Bond Fund | Victory INCORE Low Duration Bond Fund | Victory High Yield Fund | |||||||||||||
ASSETS: | |||||||||||||||
| Investments, at value (Cost $27,632,827, $242,622,647 and $242,888,528) | $ | 28,854,741 | (a) | $ | 246,780,432 | (b) | $ | 232,271,071 | (c) | ||||||
Cash and cash equivalents | 1,105,009 | 29,577,626 | 10,290,810 | ||||||||||||
Deposits with brokers for futures contracts | 329,912 | 949,647 | — | ||||||||||||
Deposits with brokers for swap agreements | 156,629 | 1,273,280 | — | ||||||||||||
Receivables: | |||||||||||||||
Interest and dividends | 178,028 | 1,258,005 | 3,270,365 | ||||||||||||
Capital shares issued | 10,319 | 298,532 | 429,325 | ||||||||||||
Investments sold | 1,605,809 | 16,879 | 5,768,286 | ||||||||||||
Variation margin on open futures contracts | 1,115 | 20,320 | — | ||||||||||||
From Adviser | 22,651 | 32,573 | 39,550 | ||||||||||||
Prepaid expenses | 31,425 | 46,374 | 43,130 | ||||||||||||
Total Assets | 32,295,638 | 280,253,668 | 252,112,537 | ||||||||||||
LIABILITIES: | |||||||||||||||
Payables: | |||||||||||||||
Collateral received on loaned securities | 858,967 | 1,630,881 | 25,468,284 | ||||||||||||
Distributions | 1,188 | 30,935 | 226,680 | ||||||||||||
Investments purchased | — | 24,986,328 | 11,947,950 | ||||||||||||
Capital shares redeemed | 4,400 | 95,883 | 179,068 | ||||||||||||
Variation margin on open futures contracts | 438 | — | — | ||||||||||||
Accrued expenses and other payables: | |||||||||||||||
Investment advisory fees | 12,793 | 93,763 | 100,266 | ||||||||||||
Administration fees | 1,531 | 12,396 | 10,268 | ||||||||||||
Custodian fees | 1,395 | 2,943 | 5,489 | ||||||||||||
Transfer agent fees | 9,609 | 60,183 | 24,784 | ||||||||||||
Compliance fees | 28 | 224 | 147 | ||||||||||||
Trustees' fees | — | 254 | — | ||||||||||||
| 12b-1 fees | 4,087 | 20,533 | 15,275 | ||||||||||||
Other accrued expenses | 10,402 | 24,833 | 18,789 | ||||||||||||
Total Liabilities | 904,838 | 26,959,156 | 37,997,000 | ||||||||||||
NET ASSETS: | |||||||||||||||
Capital | 30,084,676 | 281,297,448 | 234,540,354 | ||||||||||||
Total distributable earnings/(loss) | 1,306,124 | (28,002,936 | ) | (20,424,817 | ) | ||||||||||
Net Assets | $ | 31,390,800 | $ | 253,294,512 | $ | 214,115,537 | |||||||||
Net Assets | |||||||||||||||
Class A Shares | $ | 21,913,916 | $ | 62,816,928 | $ | 30,504,579 | |||||||||
Class C Shares | 2,731,423 | 33,690,841 | 20,659,989 | ||||||||||||
Class R Shares | 3,509,798 | 1,139,210 | 17,277,423 | ||||||||||||
Class Y Shares | 3,235,663 | 155,647,533 | 145,673,546 | ||||||||||||
Total | $ | 31,390,800 | $ | 253,294,512 | $ | 214,115,537 | |||||||||
| Shares (unlimited number of shares authorized with a par value of $0.001 per share): | |||||||||||||||
Class A Shares | 2,166,470 | 6,199,725 | 4,962,044 | ||||||||||||
Class C Shares | 270,156 | 3,326,366 | 3,353,765 | ||||||||||||
Class R Shares | 346,120 | 112,456 | 2,803,241 | ||||||||||||
Class Y Shares | 320,247 | 15,355,824 | 23,816,877 | ||||||||||||
Total | 3,102,993 | 24,994,371 | 34,935,927 | ||||||||||||
| Net asset value, offering (except Class A Shares) and redemption price per share: | |||||||||||||||
Class A Shares | $ | 10.12 | $ | 10.13 | $ | 6.15 | |||||||||
Class C Shares (d) | $ | 10.11 | $ | 10.13 | $ | 6.16 | |||||||||
Class R Shares | $ | 10.14 | $ | 10.13 | $ | 6.16 | |||||||||
Class Y Shares | $ | 10.10 | $ | 10.14 | $ | 6.12 | |||||||||
Maximum Sales Charge — Class A Shares | 2.00 | % | 2.00 | % | 2.00 | % | |||||||||
| Maximum offering price (100%/(100%-maximum sales charge) of net asset value adjusted to the nearest cent) per share — Class A Shares | $ | 10.33 | $ | 10.34 | $ | 6.28 | |||||||||
(a) Includes $832,694 of securities on loan.
(b) Includes $1,573,880 of securities on loan.
(c) Includes $24,190,205 of securities on loan.
(d) Redemption price per share varies by the length of time shares are held.
See notes to financial statements.
44
Victory Portfolios | Statements of Assets and Liabilities June 30, 2020 | ||||||
(Unaudited)
| Victory Tax-Exempt Fund | Victory High Income Municipal Bond Fund | Victory Floating Rate Fund | |||||||||||||
ASSETS: | |||||||||||||||
| Investments, at value (Cost $55,927,688, $36,226,643 and $531,845,645) | $ | 59,534,589 | $ | 37,671,689 | $ | 488,318,211 | |||||||||
Cash and cash equivalents | 138,900 | 1,985,694 | 35,237,540 | ||||||||||||
Receivables: | |||||||||||||||
Interest and dividends | 607,891 | 441,523 | 733,760 | ||||||||||||
Capital shares issued | 4,063 | 4,168 | 774,464 | ||||||||||||
Investments sold | — | — | 11,601,976 | ||||||||||||
From Adviser | 23,444 | 21,287 | 142,447 | ||||||||||||
Prepaid expenses | 23,469 | 9,909 | 23,797 | ||||||||||||
Total Assets | 60,332,356 | 40,134,270 | 536,832,195 | ||||||||||||
LIABILITIES: | |||||||||||||||
Payables: | |||||||||||||||
Distributions | 10,255 | 8,741 | 319,929 | ||||||||||||
Investments purchased | — | 1,532,681 | 40,450,238 | ||||||||||||
Capital shares redeemed | 41,743 | 55,685 | 1,972,553 | ||||||||||||
Accrued expenses and other payables: | |||||||||||||||
Investment advisory fees | 24,492 | 15,646 | 266,265 | ||||||||||||
Administration fees | 2,925 | 1,861 | 24,334 | ||||||||||||
Custodian fees | 882 | 615 | 39,856 | ||||||||||||
Transfer agent fees | 12,178 | 6,580 | 103,455 | ||||||||||||
Compliance fees | 52 | 34 | 459 | ||||||||||||
Trustees' fees | — | — | 389 | ||||||||||||
| 12b-1 fees | 6,608 | 6,648 | 61,460 | ||||||||||||
Other accrued expenses | 10,870 | 9,734 | 67,246 | ||||||||||||
Total Liabilities | 110,005 | 1,638,225 | 43,306,184 | ||||||||||||
NET ASSETS: | |||||||||||||||
Capital | 56,966,036 | 37,545,384 | 717,857,663 | ||||||||||||
Total distributable earnings/(loss) | 3,256,315 | 950,661 | (224,331,652 | ) | |||||||||||
Net Assets | $ | 60,222,351 | $ | 38,496,045 | $ | 493,526,011 | |||||||||
Net Assets | |||||||||||||||
Class A Shares | $ | 29,561,798 | $ | 18,609,699 | $ | 120,538,982 | |||||||||
Class C Shares | 8,752,702 | 11,577,713 | 117,211,505 | ||||||||||||
Class R Shares | — | — | 261,676 | ||||||||||||
Class Y Shares | 21,907,851 | 8,308,633 | 255,513,848 | ||||||||||||
Total | $ | 60,222,351 | $ | 38,496,045 | $ | 493,526,011 | |||||||||
| Shares (unlimited number of shares authorized with a par value of $0.001 per share): | |||||||||||||||
Class A Shares | 3,056,025 | 1,767,597 | 13,928,239 | ||||||||||||
Class C Shares | 905,105 | 1,099,728 | 13,539,160 | ||||||||||||
Class R Shares | — | — | 30,248 | ||||||||||||
Class Y Shares | 2,265,762 | 789,148 | 29,502,251 | ||||||||||||
Total | 6,226,892 | 3,656,473 | 56,999,898 | ||||||||||||
| Net asset value, offering (except Class A Shares) and redemption price per share: | |||||||||||||||
Class A Shares | $ | 9.67 | $ | 10.53 | $ | 8.65 | |||||||||
Class C Shares (a) | $ | 9.67 | $ | 10.53 | $ | 8.66 | |||||||||
Class R Shares | $ | — | $ | — | $ | 8.65 | |||||||||
Class Y Shares | $ | 9.67 | $ | 10.53 | $ | 8.66 | |||||||||
Maximum Sales Charge — Class A Shares | 2.00 | % | 2.00 | % | 2.00 | % | |||||||||
| Maximum offering price (100%/(100%-maximum sales charge) of net asset value adjusted to the nearest cent) per share — Class A Shares | $ | 9.87 | $ | 10.74 | $ | 8.83 | |||||||||
(a) Redemption price per share varies by the length of time shares are held.
See notes to financial statements.
45
Victory Portfolios | Statement of Assets and Liabilities June 30, 2020 | ||||||
(Unaudited)
| Victory Strategic Income Fund | |||||||
ASSETS: | |||||||
Investments, at value (Cost $79,493,369) | $ | 81,401,224 | (a) | ||||
Cash and cash equivalents | 1,645,369 | ||||||
Deposits with brokers for futures contracts | 389,393 | ||||||
Receivables: | |||||||
Interest and dividends | 566,421 | ||||||
Capital shares issued | 166,468 | ||||||
Investments sold | 1,178,699 | ||||||
Variation margin on open futures contracts | 29,991 | ||||||
From Adviser | 18,790 | ||||||
Prepaid expenses | �� | 14,904 | |||||
Total Assets | 85,411,259 | ||||||
LIABILITIES: | |||||||
Payables: | |||||||
Collateral received on loaned securities | 4,513,302 | ||||||
Distributions | 38,073 | ||||||
Investments purchased | 1,204,130 | ||||||
Capital shares redeemed | 28,245 | ||||||
Variation margin on open futures contracts | 30,629 | ||||||
Accrued expenses and other payables: | |||||||
Investment advisory fees | 37,267 | ||||||
Administration fees | 3,775 | ||||||
Custodian fees | 1,881 | ||||||
Transfer agent fees | 1,408 | ||||||
Compliance fees | 73 | ||||||
Trustees' fees | 4 | ||||||
| 12b-1 fees | 8,189 | ||||||
Other accrued expenses | 12,980 | ||||||
Total Liabilities | 5,879,956 | ||||||
NET ASSETS: | |||||||
Capital | 77,196,085 | ||||||
Total distributable earnings/(loss) | 2,335,218 | ||||||
Net Assets | $ | 79,531,303 | |||||
Net Assets | |||||||
Class A Shares | $ | 36,045,462 | |||||
Class C Shares | 9,509,063 | ||||||
Class R Shares | 2,961,576 | ||||||
Class Y Shares | 31,015,202 | ||||||
Total | $ | 79,531,303 | |||||
Shares (unlimited number of shares authorized with a par value of $0.001 per share): | |||||||
Class A Shares | 3,360,950 | ||||||
Class C Shares | 882,503 | ||||||
Class R Shares | 274,678 | ||||||
Class Y Shares | 2,907,862 | ||||||
Total | 7,425,993 | ||||||
Net asset value, offering (except Class A Shares) and redemption price per share: | |||||||
Class A Shares | $ | 10.72 | |||||
Class C Shares (b) | $ | 10.78 | |||||
Class R Shares | $ | 10.78 | |||||
Class Y Shares | $ | 10.67 | |||||
Maximum Sales Charge — Class A Shares | 2.00 | % | |||||
| Maximum offering price (100%/(100%-maximum sales charge) of net asset value adjusted to the nearest cent) per share — Class A Shares | $ | 10.94 | |||||
(a) Includes $3,209,796 of securities on loan.
(b) Redemption price per share varies by the length of time shares are held.
See notes to financial statements.
46
Victory Portfolios | Statements of Operations For the Six Months Ended June 30, 2020 | ||||||
(Unaudited)
| Victory INCORE Investment Quality Bond Fund | Victory INCORE Low Duration Bond Fund | Victory High Yield Fund | |||||||||||||
Investment Income: | |||||||||||||||
Dividends | $ | — | $ | — | $ | 11,720 | |||||||||
Interest | 422,526 | 3,010,723 | 6,082,277 | ||||||||||||
Securities lending (net of fees) | 1,032 | 3,238 | 58,773 | ||||||||||||
Total Income | 423,558 | 3,013,961 | 6,152,770 | ||||||||||||
Expenses: | |||||||||||||||
Investment advisory fees | 77,929 | 570,219 | 535,882 | ||||||||||||
Administration fees | 9,562 | 77,663 | 54,747 | ||||||||||||
Sub-Administration fees | 7,446 | 7,430 | 7,446 | ||||||||||||
12b-1 fees — Class A Shares | 27,134 | 75,646 | 37,080 | ||||||||||||
12b-1 fees — Class C Shares | 13,801 | 178,394 | 100,003 | ||||||||||||
12b-1 fees — Class R Shares | 8,507 | 2,637 | 43,722 | ||||||||||||
Custodian fees | 4,584 | 8,736 | 16,527 | ||||||||||||
Transfer agent fees — Class A Shares | 18,057 | 32,937 | 12,750 | ||||||||||||
Transfer agent fees — Class C Shares | 1,811 | 19,855 | 3,008 | ||||||||||||
Transfer agent fees — Class R Shares | 3,192 | 870 | 1,917 | ||||||||||||
Transfer agent fees — Class Y Shares | 2,140 | 88,402 | 75,424 | ||||||||||||
Trustees' fees | 1,549 | 11,577 | 7,542 | ||||||||||||
Compliance fees | 135 | 1,102 | 732 | ||||||||||||
Legal and audit fees | 6,491 | 15,611 | 12,751 | ||||||||||||
State registration and filing fees | 31,103 | 35,950 | 38,858 | ||||||||||||
Interest expense on interfund lending | — | 64 | — | ||||||||||||
Other expenses | 8,892 | 25,227 | 19,310 | ||||||||||||
Total Expenses | 222,333 | 1,152,320 | 967,699 | ||||||||||||
Expenses waived/reimbursed by Adviser | (67,213 | ) | (115,608 | ) | (109,060 | ) | |||||||||
Net Expenses | 155,120 | 1,036,712 | 858,639 | ||||||||||||
Net Investment Income (Loss) | 268,438 | 1,977,249 | 5,294,131 | ||||||||||||
| Realized/Unrealized Gains (Losses) from Investments: | |||||||||||||||
| Net realized gains (losses) from investment securities | 671,330 | 352,638 | (2,635,873 | ) | |||||||||||
Net realized gains (losses) from futures contracts | 206,746 | 1,028,458 | — | ||||||||||||
Net realized gains (losses) from swap agreements | (91,757 | ) | (449,155 | ) | — | ||||||||||
| Net change in unrealized appreciation/depreciation on investment securities | 502,176 | 2,909,605 | (14,841,662 | ) | |||||||||||
| Net change in unrealized appreciation/depreciation on futures contracts | 1,142 | (21,991 | ) | — | |||||||||||
| Net change in unrealized appreciation/depreciation on swap agreements | (14,094 | ) | (120,813 | ) | — | ||||||||||
Net realized/unrealized gains (losses) on investments | 1,275,543 | 3,698,742 | (17,477,535 | ) | |||||||||||
Change in net assets resulting from operations | $ | 1,543,981 | $ | 5,675,991 | $ | (12,183,404 | ) | ||||||||
See notes to financial statements.
47
Victory Portfolios | Statements of Operations For the Six Months Ended June 30, 2020 | ||||||
(Unaudited)
| Victory Tax-Exempt Fund | Victory High Income Municipal Bond Fund | Victory Floating Rate Fund | |||||||||||||
Investment Income: | |||||||||||||||
Interest | $ | 1,267,081 | $ | 926,522 | $ | 17,502,475 | |||||||||
Total Income | 1,267,081 | 926,522 | 17,502,475 | ||||||||||||
Expenses: | |||||||||||||||
Investment advisory fees | 154,538 | 100,323 | 1,676,826 | ||||||||||||
Administration fees | 18,924 | 12,281 | 157,749 | ||||||||||||
Sub-Administration fees | 6,988 | 6,900 | 7,446 | ||||||||||||
12b-1 fees — Class A Shares | 36,109 | 22,833 | 160,201 | ||||||||||||
12b-1 fees — Class C Shares | 50,073 | 63,622 | 644,237 | ||||||||||||
12b-1 fees — Class R Shares | — | — | 758 | ||||||||||||
Custodian fees | 3,071 | 2,831 | 117,170 | ||||||||||||
Transfer agent fees — Class A Shares | 10,975 | 6,556 | 56,766 | ||||||||||||
Transfer agent fees — Class C Shares | 4,612 | 4,837 | 70,966 | ||||||||||||
Transfer agent fees — Class R Shares | — | — | 250 | ||||||||||||
Transfer agent fees — Class Y Shares | 15,185 | 4,211 | 139,288 | ||||||||||||
Trustees' fees | 2,941 | 1,998 | 23,939 | ||||||||||||
Compliance fees | 268 | 175 | 2,265 | ||||||||||||
Legal and audit fees | 7,036 | 6,135 | 44,632 | ||||||||||||
State registration and filing fees | 24,282 | 24,898 | 44,065 | ||||||||||||
Interest expense on interfund lending | 275 | — | — | ||||||||||||
Other expenses | 6,785 | 5,146 | 81,289 | ||||||||||||
Total Expenses | 342,062 | 262,746 | 3,227,847 | ||||||||||||
Expenses waived/reimbursed by Adviser | (67,239 | ) | (63,898 | ) | (419,366 | ) | |||||||||
Net Expenses | 274,823 | 198,848 | 2,808,481 | ||||||||||||
Net Investment Income (Loss) | 992,258 | 727,674 | 14,693,994 | ||||||||||||
| Realized/Unrealized Gains (Losses) from Investments: | |||||||||||||||
| Net realized gains (losses) from investment securities | (50,095 | ) | 243,927 | (9,644,021 | ) | ||||||||||
| Net change in unrealized appreciation/depreciation on investment securities | (917,434 | ) | (1,194,667 | ) | (38,188,086 | ) | |||||||||
Net realized/unrealized gains (losses) on investments | (967,529 | ) | (950,740 | ) | (47,832,107 | ) | |||||||||
Change in net assets resulting from operations | $ | 24,729 | $ | (223,066 | ) | $ | (33,138,113 | ) | |||||||
See notes to financial statements.
48
Victory Portfolios | Statement of Operations For the Six Months Ended June 30, 2020 | ||||||
(Unaudited)
| Victory Strategic Income Fund | |||||||
Investment Income: | |||||||
Interest | $ | 789,423 | |||||
Securities lending (net of fees) | 4,408 | ||||||
Total Income | 793,831 | ||||||
Expenses: | |||||||
Investment advisory fees | 200,398 | ||||||
Administration fees | 20,620 | ||||||
Sub-Administration fees | 7,446 | ||||||
12b-1 fees — Class A Shares | 42,860 | ||||||
12b-1 fees — Class C Shares | 45,540 | ||||||
12b-1 fees — Class R Shares | 7,245 | ||||||
Custodian fees | 6,391 | ||||||
Transfer agent fees — Class A Shares | 4,181 | ||||||
Transfer agent fees — Class C Shares | 2,760 | ||||||
Transfer agent fees — Class R Shares | 263 | ||||||
Transfer agent fees — Class Y Shares | 3,278 | ||||||
Trustees' fees | 2,879 | ||||||
Compliance fees | 282 | ||||||
Legal and audit fees | 8,401 | ||||||
State registration and filing fees | 31,648 | ||||||
Other expenses | 6,598 | ||||||
Total Expenses | 390,790 | ||||||
Expenses waived/reimbursed by Adviser | (52,801 | ) | |||||
Net Expenses | 337,989 | ||||||
Net Investment Income (Loss) | 455,842 | ||||||
Realized/Unrealized Gains (Losses) from Investments: | |||||||
Net realized gains (losses) from investment securities | 1,766,198 | ||||||
Net realized gains (losses) from futures contracts | (183,191 | ) | |||||
Net realized gains (losses) from swap agreements | (185,936 | ) | |||||
Net change in unrealized appreciation/depreciation on investment securities | 224,460 | ||||||
Net change in unrealized appreciation/depreciation on futures contracts | 29,077 | ||||||
Net change in unrealized appreciation/depreciation on swap agreements | 20,150 | ||||||
Net realized/unrealized gains (losses) on investments | 1,670,758 | ||||||
Change in net assets resulting from operations | $ | 2,126,600 | |||||
See notes to financial statements.
49
Victory Portfolios | Statements of Changes in Net Assets | ||||||
| Victory INCORE Investment Quality Bond Fund | Victory INCORE Low Duration Bond Fund | Victory High Yield Fund | |||||||||||||||||||||||||
| Six Months Ended June 30, 2020 (Unaudited) | Year Ended December 31, 2019 | Six Months Ended June 30, 2020 (Unaudited) | Year Ended December 31, 2019 | Six Months Ended June 30, 2020 (Unaudited) | Year Ended December 31, 2019 | ||||||||||||||||||||||
From Investment Activities: | |||||||||||||||||||||||||||
Operations: | |||||||||||||||||||||||||||
| Net investment income (loss) | $ | 268,438 | $ | 668,632 | $ | 1,977,249 | $ | 5,596,772 | $ | 5,294,131 | $ | 8,072,654 | |||||||||||||||
| Net realized gains (losses) from investments | 786,319 | 458,868 | 931,941 | (1,554,338 | ) | (2,635,873 | ) | 928,393 | |||||||||||||||||||
| Net change in unrealized appreciation/ depreciation on investments | 489,224 | 1,246,028 | 2,766,801 | 6,190,500 | (14,841,662 | ) | 8,834,338 | ||||||||||||||||||||
| Change in net assets resulting from operations | 1,543,981 | 2,373,528 | 5,675,991 | 10,232,934 | (12,183,404 | ) | 17,835,385 | ||||||||||||||||||||
Distributions to Shareholders: | |||||||||||||||||||||||||||
Class A Shares | (245,551 | ) | (553,387 | ) | (572,416 | ) | (1,562,354 | ) | (873,985 | ) | (1,707,779 | ) | |||||||||||||||
Class C Shares | (19,009 | ) | (48,455 | ) | (201,113 | ) | (645,910 | ) | (517,552 | ) | (1,017,743 | ) | |||||||||||||||
Class R Shares | (31,422 | ) | (64,516 | ) | (7,683 | ) | (22,128 | ) | (485,150 | ) | (991,828 | ) | |||||||||||||||
Class Y Shares | (41,526 | ) | (85,405 | ) | (1,654,719 | ) | (3,852,275 | ) | (3,426,545 | ) | (4,352,666 | ) | |||||||||||||||
From return of capital: | |||||||||||||||||||||||||||
Class A Shares | — | — | — | (54,402 | ) | — | — | ||||||||||||||||||||
Class C Shares | — | — | — | (22,491 | ) | — | — | ||||||||||||||||||||
Class R Shares | — | — | — | (770 | ) | — | — | ||||||||||||||||||||
Class Y Shares | — | — | — | (134,138 | ) | — | — | ||||||||||||||||||||
| Change in net assets resulting from distributions to shareholders | (337,508 | ) | (751,763 | ) | (2,435,931 | ) | (6,294,468 | ) | (5,303,232 | ) | (8,070,016 | ) | |||||||||||||||
| Change in net assets resulting from capital transactions | (1,417,802 | ) | (4,159,816 | ) | (16,542,232 | ) | (77,242,799 | ) | 51,848,752 | 88,103,596 | |||||||||||||||||
Change in net assets | (211,329 | ) | (2,538,051 | ) | (13,302,172 | ) | (73,304,333 | ) | 34,362,116 | 97,868,965 | |||||||||||||||||
Net Assets: | |||||||||||||||||||||||||||
Beginning of period | 31,602,129 | 34,140,180 | 266,596,684 | 339,901,017 | 179,753,421 | 81,884,456 | |||||||||||||||||||||
End of period | $ | 31,390,800 | $ | 31,602,129 | $ | 253,294,512 | $ | 266,596,684 | $ | 214,115,537 | $ | 179,753,421 | |||||||||||||||
(continues on next page)
See notes to financial statements.
50
Victory Portfolios | Statements of Changes in Net Assets | ||||||
(continued)
| Victory INCORE Investment Quality Bond Fund | Victory INCORE Low Duration Bond Fund | Victory High Yield Fund | |||||||||||||||||||||||||
| Six Months Ended June 30, 2020 (Unaudited) | Year Ended December 31, 2019 | Six Months Ended June 30, 2020 (Unaudited) | Year Ended December 31, 2019 | Six Months Ended June 30, 2020 (Unaudited) | Year Ended December 31, 2019 | ||||||||||||||||||||||
Capital Transactions: | |||||||||||||||||||||||||||
Class A Shares | |||||||||||||||||||||||||||
| Proceeds from shares issued | $ | 2,640,057 | $ | 2,390,006 | $ | 12,098,056 | $ | 26,923,927 | $ | 4,615,250 | $ | 14,316,080 | |||||||||||||||
Distributions reinvested | 240,174 | 541,439 | 541,451 | 1,496,239 | 543,243 | 1,089,701 | |||||||||||||||||||||
Cost of shares redeemed | (3,800,557 | ) | (6,120,937 | ) | (12,592,886 | ) | (63,661,715 | ) | (3,322,386 | ) | (9,825,415 | ) | |||||||||||||||
Total Class A Shares | $ | (920,326 | ) | $ | (3,189,492 | ) | $ | 46,621 | $ | (35,241,549 | ) | $ | 1,836,107 | $ | 5,580,366 | ||||||||||||
Class C Shares | |||||||||||||||||||||||||||
| Proceeds from shares issued | $ | 260,166 | $ | 143,899 | $ | 741,075 | $ | 1,733,369 | $ | 2,323,150 | $ | 2,217,726 | |||||||||||||||
Distributions reinvested | 16,292 | 40,736 | 164,016 | 555,049 | 142,821 | 243,448 | |||||||||||||||||||||
Cost of shares redeemed | (481,608 | ) | (1,154,650 | ) | (6,667,054 | ) | (26,142,779 | ) | (1,055,432 | ) | (2,392,678 | ) | |||||||||||||||
Total Class C Shares | $ | (205,150 | ) | $ | (970,015 | ) | $ | (5,761,963 | ) | $ | (23,854,361 | ) | $ | 1,410,539 | $ | 68,496 | |||||||||||
Class R Shares | |||||||||||||||||||||||||||
| Proceeds from shares issued | $ | 213,207 | $ | 254,810 | $ | 299,129 | $ | 166,661 | $ | 311,796 | $ | 201,511 | |||||||||||||||
Distributions reinvested | 31,343 | 64,470 | 7,465 | 21,886 | 50,607 | 104,219 | |||||||||||||||||||||
Cost of shares redeemed | (232,913 | ) | (310,418 | ) | (328,534 | ) | (614,563 | ) | (241,232 | ) | (584,834 | ) | |||||||||||||||
Total Class R Shares | $ | 11,637 | $ | 8,862 | $ | (21,940 | ) | $ | (426,016 | ) | $ | 121,171 | $ | (279,104 | ) | ||||||||||||
Class Y Shares | |||||||||||||||||||||||||||
| Proceeds from shares issued | $ | 731,505 | $ | 1,073,428 | $ | 45,743,187 | $ | 79,871,959 | $ | 106,293,512 | $ | 109,042,788 | |||||||||||||||
Distributions reinvested | 41,083 | 83,285 | 1,324,695 | 3,209,388 | 3,084,978 | 3,905,005 | |||||||||||||||||||||
Cost of shares redeemed | (1,076,551 | ) | (1,165,884 | ) | (57,872,832 | ) | (100,802,220 | ) | (60,897,555 | ) | (30,213,955 | ) | |||||||||||||||
Total Class Y Shares | $ | (303,963 | ) | $ | (9,171 | ) | $ | (10,804,950 | ) | $ | (17,720,873 | ) | $ | 48,480,935 | $ | 82,733,838 | |||||||||||
| Change in net assets resulting from capital transactions | $ | (1,417,802 | ) | $ | (4,159,816 | ) | $ | (16,542,232 | ) | $ | (77,242,799 | ) | $ | 51,848,752 | $ | 88,103,596 | |||||||||||
(continues on next page)
See notes to financial statements.
51
Victory Portfolios | Statements of Changes in Net Assets | ||||||
(continued)
| Victory INCORE Investment Quality Bond Fund | Victory INCORE Low Duration Bond Fund | Victory High Yield Fund | |||||||||||||||||||||||||
| Six Months Ended June 30, 2020 (Unaudited) | Year Ended December 31, 2019 | Six Months Ended June 30, 2020 (Unaudited) | Year Ended December 31, 2019 | Six Months Ended June 30, 2020 (Unaudited) | Year Ended December 31, 2019 | ||||||||||||||||||||||
Share Transactions: | |||||||||||||||||||||||||||
Class A Shares | |||||||||||||||||||||||||||
Issued | 266,486 | 250,126 | 1,206,204 | 2,713,126 | 728,449 | 2,178,302 | |||||||||||||||||||||
Reinvested | 24,112 | 56,710 | 54,129 | 150,473 | 87,914 | 165,464 | |||||||||||||||||||||
Redeemed | (387,373 | ) | (642,094 | ) | (1,263,721 | ) | (6,419,997 | ) | (547,001 | ) | (1,488,742 | ) | |||||||||||||||
Total Class A Shares | (96,775 | ) | (335,258 | ) | (3,388 | ) | (3,556,398 | ) | 269,362 | 855,024 | |||||||||||||||||
Class C Shares | |||||||||||||||||||||||||||
Issued | 26,532 | 14,963 | 74,604 | 174,135 | 365,670 | 336,209 | |||||||||||||||||||||
Reinvested | 1,636 | 4,274 | 16,423 | 55,850 | 23,097 | 36,921 | |||||||||||||||||||||
Redeemed | (48,615 | ) | (121,567 | ) | (666,829 | ) | (2,631,589 | ) | (171,111 | ) | (364,090 | ) | |||||||||||||||
Total Class C Shares | (20,447 | ) | (102,330 | ) | (575,802 | ) | (2,401,604 | ) | 217,656 | 9,040 | |||||||||||||||||
Class R Shares | |||||||||||||||||||||||||||
Issued | 21,485 | 26,637 | 29,600 | 16,756 | 47,338 | 30,796 | |||||||||||||||||||||
Reinvested | 3,138 | 6,730 | 747 | 2,201 | 8,183 | 15,810 | |||||||||||||||||||||
Redeemed | (23,402 | ) | (32,531 | ) | (32,704 | ) | (61,801 | ) | (39,410 | ) | (89,390 | ) | |||||||||||||||
Total Class R Shares | 1,221 | 836 | (2,357 | ) | (42,844 | ) | 16,111 | (42,784 | ) | ||||||||||||||||||
Class Y Shares | |||||||||||||||||||||||||||
Issued | 74,023 | 111,553 | 4,569,893 | 8,030,344 | 17,615,190 | 16,745,403 | |||||||||||||||||||||
Reinvested | 4,130 | 8,725 | 132,387 | 322,449 | 501,619 | 594,277 | |||||||||||||||||||||
Redeemed | (109,200 | ) | (122,068 | ) | (5,806,853 | ) | (10,149,972 | ) | (10,444,834 | ) | (4,607,680 | ) | |||||||||||||||
Total Class Y Shares | (31,047 | ) | (1,790 | ) | (1,104,573 | ) | (1,797,179 | ) | 7,671,975 | 12,732,000 | |||||||||||||||||
Change in Shares | (147,048 | ) | (438,542 | ) | (1,686,120 | ) | (7,798,025 | ) | 8,175,104 | 13,553,280 | |||||||||||||||||
See notes to financial statements.
52
Victory Portfolios | Statements of Changes in Net Assets | ||||||
| Victory Tax-Exempt Fund | Victory High Income Municipal Bond Fund | Victory Floating Rate Fund | |||||||||||||||||||||||||
| Six Months Ended June 30, 2020 (Unaudited) | Year Ended December 31, 2019 | Six Months Ended June 30, 2020 (Unaudited) | Year Ended December 31, 2019 | Six Months Ended June 30, 2020 (Unaudited) | Year Ended December 31, 2019 | ||||||||||||||||||||||
From Investment Activities: | |||||||||||||||||||||||||||
Operations: | |||||||||||||||||||||||||||
| Net investment income (loss) | $ | 992,258 | $ | 1,965,191 | $ | 727,674 | $ | 1,405,189 | $ | 14,693,994 | $ | 34,566,694 | |||||||||||||||
| Net realized gains (losses) from investments | (50,095 | ) | 930,963 | 243,927 | (123,953 | ) | (9,644,021 | ) | (3,969,624 | ) | |||||||||||||||||
| Net change in unrealized appreciation/ depreciation on investments | (917,434 | ) | 2,797,481 | (1,194,667 | ) | 2,151,260 | (38,188,086 | ) | 23,471,885 | ||||||||||||||||||
| Change in net assets resulting from operations | 24,729 | 5,693,635 | (223,066 | ) | 3,432,496 | (33,138,113 | ) | 54,068,955 | |||||||||||||||||||
Distributions to Shareholders: | |||||||||||||||||||||||||||
Class A Shares | (477,228 | ) | (1,464,845 | ) | (349,197 | ) | (787,699 | ) | (3,735,571 | ) | (8,004,025 | ) | |||||||||||||||
Class C Shares | (124,134 | ) | (531,783 | ) | (194,126 | ) | (562,857 | ) | (3,233,708 | ) | (9,318,078 | ) | |||||||||||||||
Class R Shares | — | — | — | — | (7,932 | ) | (30,409 | ) | |||||||||||||||||||
Class Y Shares | (390,896 | ) | (1,054,293 | ) | (184,361 | ) | (507,091 | ) | (7,803,797 | ) | (17,355,800 | ) | |||||||||||||||
| Change in net assets resulting from distributions to shareholders | (992,258 | ) | (3,050,921 | ) | (727,684 | ) | (1,857,647 | ) | (14,781,008 | ) | (34,708,312 | ) | |||||||||||||||
| Change in net assets resulting from capital transactions | (4,778,656 | ) | (4,913,162 | ) | (4,321,188 | ) | (5,254,452 | ) | (44,442,626 | ) | (45,868,103 | ) | |||||||||||||||
Change in net assets | (5,746,185 | ) | (2,270,448 | ) | (5,271,938 | ) | (3,679,603 | ) | (92,361,747 | ) | (26,507,460 | ) | |||||||||||||||
Net Assets: | |||||||||||||||||||||||||||
Beginning of period | 65,968,536 | 68,238,984 | 43,767,983 | 47,447,586 | 585,887,758 | 612,395,218 | |||||||||||||||||||||
End of period | $ | 60,222,351 | $ | 65,968,536 | $ | 38,496,045 | $ | 43,767,983 | $ | 493,526,011 | $ | 585,887,758 | |||||||||||||||
(continues on next page)
See notes to financial statements.
53
Victory Portfolios | Statements of Changes in Net Assets | ||||||
(continued)
| Victory Tax-Exempt Fund | Victory High Income Municipal Bond Fund | Victory Floating Rate Fund | |||||||||||||||||||||||||
| Six Months Ended June 30, 2020 (Unaudited) | Year Ended December 31, 2019 | Six Months Ended June 30, 2020 (Unaudited) | Year Ended December 31, 2019 | Six Months Ended June 30, 2020 (Unaudited) | Year Ended December 31, 2019 | ||||||||||||||||||||||
Capital Transactions: | |||||||||||||||||||||||||||
Class A Shares | |||||||||||||||||||||||||||
| Proceeds from shares issued | $ | 2,343,071 | $ | 4,695,710 | $ | 1,333,798 | $ | 4,547,178 | $ | 21,737,729 | $ | 70,076,253 | |||||||||||||||
Distributions reinvested | 445,319 | 1,392,860 | 322,524 | 711,497 | 3,493,528 | 7,183,990 | |||||||||||||||||||||
Cost of shares redeemed | (3,027,711 | ) | (7,042,732 | ) | (1,828,478 | ) | (3,153,534 | ) | (38,897,671 | ) | (53,129,272 | ) | |||||||||||||||
Total Class A Shares | $ | (239,321 | ) | $ | (954,162 | ) | $ | (172,156 | ) | $ | 2,105,141 | $ | (13,666,414 | ) | $ | 24,130,971 | |||||||||||
Class C Shares | |||||||||||||||||||||||||||
| Proceeds from shares issued | $ | 539,161 | $ | 452,375 | $ | 44,609 | $ | 641,769 | $ | 5,295,492 | $ | 7,693,670 | |||||||||||||||
Distributions reinvested | 101,493 | 442,740 | 169,024 | 493,333 | 2,643,884 | 7,766,719 | |||||||||||||||||||||
Cost of shares redeemed | (2,946,549 | ) | (8,300,227 | ) | (2,297,220 | ) | (7,042,158 | ) | (27,396,873 | ) | (84,302,278 | ) | |||||||||||||||
Total Class C Shares | $ | (2,305,895 | ) | $ | (7,405,112 | ) | $ | (2,083,587 | ) | $ | (5,907,056 | ) | $ | (19,457,497 | ) | $ | (68,841,889 | ) | |||||||||
Class R Shares | |||||||||||||||||||||||||||
| Proceeds from shares issued | $ | — | $ | — | $ | — | $ | — | $ | 25,685 | $ | 111,430 | |||||||||||||||
Distributions reinvested | — | — | — | — | 7,262 | 22,324 | |||||||||||||||||||||
Cost of shares redeemed | — | — | — | — | (203,241 | ) | (414,932 | ) | |||||||||||||||||||
Total Class R Shares | $ | — | $ | — | $ | — | $ | — | $ | (170,294 | ) | $ | (281,178 | ) | |||||||||||||
Class Y Shares | |||||||||||||||||||||||||||
| Proceeds from shares issued | $ | 2,874,281 | $ | 6,261,814 | $ | 543,639 | $ | 1,046,792 | $ | 113,128,407 | $ | 127,457,843 | |||||||||||||||
Distributions reinvested | 383,099 | 1,026,770 | 177,226 | 489,689 | 6,745,465 | 14,917,921 | |||||||||||||||||||||
Cost of shares redeemed | (5,490,820 | ) | (3,842,472 | ) | (2,786,310 | ) | (2,989,018 | ) | (131,022,293 | ) | (143,251,771 | ) | |||||||||||||||
Total Class Y Shares | $ | (2,233,440 | ) | $ | 3,446,112 | $ | (2,065,445 | ) | $ | (1,452,537 | ) | $ | (11,148,421 | ) | $ | (876,007 | ) | ||||||||||
| Change in net assets resulting from capital transactions | $ | (4,778,656 | ) | $ | (4,913,162 | ) | $ | (4,321,188 | ) | $ | (5,254,452 | ) | $ | (44,442,626 | ) | $ | (45,868,103 | ) | |||||||||
(continues on next page)
See notes to financial statements.
54
Victory Portfolios | Statements of Changes in Net Assets | ||||||
(continued)
| Victory Tax-Exempt Fund | Victory High Income Municipal Bond Fund | Victory Floating Rate Fund | |||||||||||||||||||||||||
| Six Months Ended June 30, 2020 (Unaudited) | Year Ended December 31, 2019 | Six Months Ended June 30, 2020 (Unaudited) | Year Ended December 31, 2019 | Six Months Ended June 30, 2020 (Unaudited) | Year Ended December 31, 2019 | ||||||||||||||||||||||
Share Transactions: | |||||||||||||||||||||||||||
Class A Shares | |||||||||||||||||||||||||||
Issued | 242,482 | 478,144 | 128,752 | 425,557 | 2,422,374 | 7,475,434 | |||||||||||||||||||||
Reinvested | 46,111 | 141,785 | 30,717 | 66,390 | 403,931 | 767,211 | |||||||||||||||||||||
Redeemed | (306,578 | ) | (713,456 | ) | (173,299 | ) | (296,773 | ) | (4,459,549 | ) | (5,679,746 | ) | |||||||||||||||
Total Class A Shares | (17,985 | ) | (93,527 | ) | (13,830 | ) | 195,174 | (1,633,244 | ) | 2,562,899 | |||||||||||||||||
Class C Shares | |||||||||||||||||||||||||||
Issued | 55,287 | 45,850 | 4,150 | 59,871 | 592,905 | 821,505 | |||||||||||||||||||||
Reinvested | 10,507 | 45,183 | 16,098 | 46,148 | 305,832 | 828,359 | |||||||||||||||||||||
Redeemed | (305,308 | ) | (846,526 | ) | (222,251 | ) | (659,895 | ) | (3,178,366 | ) | (8,978,146 | ) | |||||||||||||||
Total Class C Shares | (239,514 | ) | (755,493 | ) | (202,003 | ) | (553,876 | ) | (2,279,629 | ) | (7,328,282 | ) | |||||||||||||||
Class R Shares | |||||||||||||||||||||||||||
Issued | — | — | — | — | 2,746 | 11,901 | |||||||||||||||||||||
Reinvested | — | — | — | — | 839 | 2,385 | |||||||||||||||||||||
Redeemed | — | — | — | — | (21,622 | ) | (44,380 | ) | |||||||||||||||||||
Total Class R Shares | — | — | — | — | (18,037 | ) | (30,094 | ) | |||||||||||||||||||
Class Y Shares | |||||||||||||||||||||||||||
Issued | 298,017 | 633,656 | 51,301 | 98,269 | 13,093,224 | 13,621,991 | |||||||||||||||||||||
Reinvested | 39,607 | 104,534 | 16,829 | 45,760 | 778,860 | 1,591,749 | |||||||||||||||||||||
Redeemed | (558,531 | ) | (392,165 | ) | (266,707 | ) | (280,476 | ) | (15,112,635 | ) | (15,289,018 | ) | |||||||||||||||
Total Class Y Shares | (220,907 | ) | 346,025 | (198,577 | ) | (136,447 | ) | (1,240,551 | ) | (75,278 | ) | ||||||||||||||||
Change in Shares | (478,406 | ) | (502,995 | ) | (414,410 | ) | (495,149 | ) | (5,171,461 | ) | (4,870,755 | ) | |||||||||||||||
See notes to financial statements.
55
Victory Portfolios | Statements of Changes in Net Assets | ||||||
| Victory Strategic Income Fund | |||||||||||
| Six Months Ended June 30, 2020 (Unaudited) | Year Ended December 31, 2019 | ||||||||||
From Investment Activities: | |||||||||||
Operations: | |||||||||||
Net investment income (loss) | $ | 455,842 | $ | 1,251,164 | |||||||
Net realized gains (losses) from investments | 1,397,071 | 1,161,066 | |||||||||
Net change in unrealized appreciation/depreciation on investments | 273,687 | 1,949,178 | |||||||||
Change in net assets resulting from operations | 2,126,600 | 4,361,408 | |||||||||
Distributions to Shareholders: | |||||||||||
Class A Shares | (265,115 | ) | (852,988 | ) | |||||||
Class C Shares | (33,921 | ) | (173,876 | ) | |||||||
Class R Shares | (16,557 | ) | (60,881 | ) | |||||||
Class Y Shares | (163,191 | ) | (136,515 | ) | |||||||
From return of capital: | |||||||||||
Class A Shares | — | (50,329 | ) | ||||||||
Class C Shares | — | (10,259 | ) | ||||||||
Class R Shares | — | (3,592 | ) | ||||||||
Class Y Shares | — | (8,055 | ) | ||||||||
Change in net assets resulting from distributions to shareholders | (478,784 | ) | (1,296,495 | ) | |||||||
Change in net assets resulting from capital transactions | 26,851,086 | (1,865,822 | ) | ||||||||
Change in net assets | 28,498,902 | 1,199,091 | |||||||||
Net Assets: | |||||||||||
Beginning of period | 51,032,401 | 49,833,310 | |||||||||
End of period | $ | 79,531,303 | $ | 51,032,401 | |||||||
(continues on next page)
See notes to financial statements.
56
Victory Portfolios | Statements of Changes in Net Assets | ||||||
(continued)
| Victory Strategic Income Fund | |||||||||||
| Six Months Ended June 30, 2020 (Unaudited) | Year Ended December 31, 2019 | ||||||||||
Capital Transactions: | |||||||||||
Class A Shares | |||||||||||
Proceeds from shares issued | $ | 1,625,481 | $ | 1,094,391 | |||||||
Distributions reinvested | 40,427 | 139,804 | |||||||||
Cost of shares redeemed | (606,295 | ) | (1,529,524 | ) | |||||||
Total Class A Shares | $ | 1,059,613 | $ | (295,329 | ) | ||||||
Class C Shares | |||||||||||
Proceeds from shares issued | $ | 924,997 | $ | 332,247 | |||||||
Distributions reinvested | 24,668 | 137,629 | |||||||||
Cost of shares redeemed | (885,900 | ) | (2,160,161 | ) | |||||||
Total Class C Shares | $ | 63,765 | $ | (1,690,285 | ) | ||||||
Class R Shares | |||||||||||
Proceeds from shares issued | $ | 11,820 | $ | 8,929 | |||||||
Distributions reinvested | 2,157 | 8,376 | |||||||||
Cost of shares redeemed | (20,641 | ) | (82,802 | ) | |||||||
Total Class R Shares | $ | (6,664 | ) | $ | (65,497 | ) | |||||
Class Y Shares | |||||||||||
Proceeds from shares issued | $ | 55,866,190 | $ | 638,486 | |||||||
Distributions reinvested | 140,467 | 71,237 | |||||||||
Cost of shares redeemed | (30,272,285 | ) | (524,434 | ) | |||||||
Total Class Y Shares | $ | 25,734,372 | $ | 185,289 | |||||||
Change in net assets resulting from capital transactions | $ | 26,851,086 | $ | (1,865,822 | ) | ||||||
Share Transactions: | |||||||||||
Class A Shares | |||||||||||
Issued | 154,080 | 107,366 | |||||||||
Reinvested | 3,824 | 13,743 | |||||||||
Redeemed | (58,183 | ) | (149,880 | ) | |||||||
Total Class A Shares | 99,721 | (28,771 | ) | ||||||||
Class C Shares | |||||||||||
Issued | 87,390 | 32,731 | |||||||||
Reinvested | 2,322 | 13,502 | |||||||||
Redeemed | (84,536 | ) | (213,151 | ) | |||||||
Total Class C Shares | 5,176 | (166,918 | ) | ||||||||
Class R Shares | |||||||||||
Issued | 1,104 | 880 | |||||||||
Reinvested | 203 | 820 | |||||||||
Redeemed | (1,915 | ) | (8,345 | ) | |||||||
Total Class R Shares | (608 | ) | (6,645 | ) | |||||||
Class Y Shares | |||||||||||
Issued | 5,282,463 | 62,449 | |||||||||
Reinvested | 13,371 | 7,040 | |||||||||
Redeemed | (2,900,241 | ) | (52,459 | ) | |||||||
Total Class Y Shares | 2,395,593 | 17,030 | |||||||||
Change in Shares | 2,499,882 | (185,304 | ) | ||||||||
See notes to financial statements.
57
Victory Portfolios | Financial Highlights | ||||||
For a Share Outstanding Throughout Each Period
Investment Activities | Distributions to Shareholders From | ||||||||||||||||||||||||||
| Net Asset Value, Beginning of Period | Net Investment Income (Loss)(a) | Net Realized and Unrealized Gains (Losses) on Investments | Total from Investment Activities | Net Investment Income | Net Realized Gains from Investments | ||||||||||||||||||||||
Victory INCORE Investment Quality Bond Fund | |||||||||||||||||||||||||||
Class A | |||||||||||||||||||||||||||
| Six Months Ended 6/30/20 (unaudited) | $ | 9.72 | 0.09 | 0.42 | 0.51 | (0.11 | ) | — | |||||||||||||||||||
Year Ended 12/31/19 | $ | 9.26 | 0.20 | 0.49 | 0.69 | (0.23 | ) | — | |||||||||||||||||||
Year Ended 12/31/18 | $ | 9.59 | 0.21 | (0.29 | ) | (0.08 | ) | (0.25 | ) | — | |||||||||||||||||
Year Ended 12/31/17 | $ | 9.48 | 0.18 | 0.16 | 0.34 | (0.23 | ) | — | |||||||||||||||||||
Year Ended 12/31/16 | $ | 9.57 | 0.22 | 0.16 | 0.38 | (0.23 | ) | (0.24 | ) | ||||||||||||||||||
Year Ended 12/31/15 | $ | 10.16 | 0.31 | (0.38 | ) | (0.07 | ) | (0.30 | ) | (0.22 | ) | ||||||||||||||||
Class C | |||||||||||||||||||||||||||
| Six Months Ended 6/30/20 (unaudited) | $ | 9.72 | 0.05 | 0.41 | 0.46 | (0.07 | ) | — | |||||||||||||||||||
Year Ended 12/31/19 | $ | 9.25 | 0.12 | 0.49 | 0.61 | (0.14 | ) | — | |||||||||||||||||||
Year Ended 12/31/18 | $ | 9.58 | 0.13 | (0.29 | ) | (0.16 | ) | (0.17 | ) | — | |||||||||||||||||
Year Ended 12/31/17 | $ | 9.47 | 0.10 | 0.16 | 0.26 | (0.15 | ) | — | |||||||||||||||||||
Year Ended 12/31/16 | $ | 9.56 | 0.14 | 0.16 | 0.30 | (0.15 | ) | (0.24 | ) | ||||||||||||||||||
Year Ended 12/31/15 | $ | 10.16 | 0.22 | (0.38 | ) | (0.16 | ) | (0.22 | ) | (0.22 | ) | ||||||||||||||||
Class R | |||||||||||||||||||||||||||
| Six Months Ended 6/30/20 (unaudited) | $ | 9.75 | 0.07 | 0.41 | 0.48 | (0.09 | ) | — | |||||||||||||||||||
Year Ended 12/31/19 | $ | 9.28 | 0.16 | 0.50 | 0.66 | (0.19 | ) | — | |||||||||||||||||||
Year Ended 12/31/18 | $ | 9.61 | 0.18 | (0.30 | ) | (0.12 | ) | (0.21 | ) | — | |||||||||||||||||
Year Ended 12/31/17 | $ | 9.50 | 0.14 | 0.16 | 0.30 | (0.19 | ) | — | |||||||||||||||||||
Year Ended 12/31/16 | $ | 9.58 | 0.19 | 0.17 | 0.36 | (0.20 | ) | (0.24 | ) | ||||||||||||||||||
Year Ended 12/31/15 | $ | 10.18 | 0.27 | (0.39 | ) | (0.12 | ) | (0.26 | ) | (0.22 | ) | ||||||||||||||||
Class Y | |||||||||||||||||||||||||||
| Six Months Ended 6/30/20 (unaudited) | $ | 9.71 | 0.10 | 0.41 | 0.51 | (0.12 | ) | — | |||||||||||||||||||
Year Ended 12/31/19 | $ | 9.25 | 0.22 | 0.49 | 0.71 | (0.25 | ) | — | |||||||||||||||||||
Year Ended 12/31/18 | $ | 9.58 | 0.23 | (0.29 | ) | (0.06 | ) | (0.27 | ) | — | |||||||||||||||||
Year Ended 12/31/17 | $ | 9.47 | 0.20 | 0.16 | 0.36 | (0.25 | ) | — | |||||||||||||||||||
Year Ended 12/31/16 | $ | 9.56 | 0.25 | 0.16 | 0.41 | (0.26 | ) | (0.24 | ) | ||||||||||||||||||
Year Ended 12/31/15 | $ | 10.17 | 0.32 | (0.39 | ) | (0.07 | ) | (0.32 | ) | (0.22 | ) | ||||||||||||||||
(a) Per share net investment income (loss) has been calculated using the average daily shares method.
(b) Not annualized for periods less than one year.
(c) Annualized for periods less than one year.
(d) Portfolio turnover is calculated on the basis of the Fund as a whole without distinguishing between the classes of shares issued.
See notes to financial statements.
58
Victory Portfolios | Financial Highlights — continued | ||||||
For a Share Outstanding Throughout Each Period
Ratios to Average Net Assets | Supplemental Data | ||||||||||||||||||||||||||||||||||
| Total Distributions | Net Asset Value, End of Period | Total Return (Excludes Sales Charge)(b) | Ratio of Net Expenses to Average Net Assets(c) | Ratio of Net Investment Income (Loss) to Average Net Assets(c) | Ratio of Gross Expenses to Average Net Assets(c) | Net Assets, End of Period (000's) | Portfolio Turnover(b)(d) | ||||||||||||||||||||||||||||
Victory INCORE Investment Quality Bond Fund | |||||||||||||||||||||||||||||||||||
Class A | |||||||||||||||||||||||||||||||||||
| Six Months Ended 6/30/20 (unaudited) | (0.11 | ) | $ | 10.12 | 5.18 | % | 0.90 | % | 1.82 | % | 1.26 | % | $ | 21,914 | 35 | % | |||||||||||||||||||
Year Ended 12/31/19 | (0.23 | ) | $ | 9.72 | 7.49 | % | 0.90 | % | 2.13 | % | 1.23 | % | $ | 22,004 | 92 | % | |||||||||||||||||||
Year Ended 12/31/18 | (0.25 | ) | $ | 9.26 | (0.80 | )% | 0.90 | % | 2.27 | % | 1.13 | % | $ | 24,049 | 115 | % | |||||||||||||||||||
Year Ended 12/31/17 | (0.23 | ) | $ | 9.59 | 3.62 | % | 0.90 | % | 1.86 | % | 1.07 | % | $ | 31,306 | 70 | % | |||||||||||||||||||
Year Ended 12/31/16 | (0.47 | ) | $ | 9.48 | 4.01 | % | 0.90 | % | 2.29 | % | 1.14 | % | $ | 40,510 | 148 | % | |||||||||||||||||||
Year Ended 12/31/15 | (0.52 | ) | $ | 9.57 | (0.74 | )% | 0.90 | % | 3.06 | % | 1.07 | % | $ | 51,747 | 73 | % | |||||||||||||||||||
Class C | |||||||||||||||||||||||||||||||||||
| Six Months Ended 6/30/20 (unaudited) | (0.07 | ) | $ | 10.11 | 4.72 | % | 1.77 | % | 0.96 | % | 2.38 | % | $ | 2,731 | 35 | % | |||||||||||||||||||
Year Ended 12/31/19 | (0.14 | ) | $ | 9.72 | 6.65 | % | 1.77 | % | 1.28 | % | 2.23 | % | $ | 2,824 | 92 | % | |||||||||||||||||||
Year Ended 12/31/18 | (0.17 | ) | $ | 9.25 | (1.66 | )% | 1.77 | % | 1.42 | % | 2.10 | % | $ | 3,634 | 115 | % | |||||||||||||||||||
Year Ended 12/31/17 | (0.15 | ) | $ | 9.58 | 2.74 | % | 1.77 | % | 0.99 | % | 1.91 | % | $ | 6,127 | 70 | % | |||||||||||||||||||
Year Ended 12/31/16 | (0.39 | ) | $ | 9.47 | 3.11 | % | 1.77 | % | 1.42 | % | 1.92 | % | $ | 8,915 | 148 | % | |||||||||||||||||||
Year Ended 12/31/15 | (0.44 | ) | $ | 9.56 | (1.70 | )% | 1.77 | % | 2.19 | % | 1.85 | % | $ | 10,510 | 73 | % | |||||||||||||||||||
Class R | |||||||||||||||||||||||||||||||||||
| Six Months Ended 6/30/20 (unaudited) | (0.09 | ) | $ | 10.14 | 4.95 | % | 1.30 | % | 1.40 | % | 1.84 | % | $ | 3,510 | 35 | % | |||||||||||||||||||
Year Ended 12/31/19 | (0.19 | ) | $ | 9.75 | 7.14 | % | 1.30 | % | 1.71 | % | 1.83 | % | $ | 3,362 | 92 | % | |||||||||||||||||||
Year Ended 12/31/18 | (0.21 | ) | $ | 9.28 | (1.20 | )% | 1.30 | % | 1.88 | % | 1.69 | % | $ | 3,192 | 115 | % | |||||||||||||||||||
Year Ended 12/31/17 | (0.19 | ) | $ | 9.61 | 3.16 | % | 1.30 | % | 1.44 | % | 1.65 | % | $ | 3,940 | 70 | % | |||||||||||||||||||
Year Ended 12/31/16 | (0.44 | ) | $ | 9.50 | 3.71 | % | 1.30 | % | 1.90 | % | 1.44 | % | $ | 4,477 | 148 | % | |||||||||||||||||||
Year Ended 12/31/15 | (0.48 | ) | $ | 9.58 | (1.24 | )% | 1.30 | % | 2.65 | % | 1.45 | % | $ | 5,568 | 73 | % | |||||||||||||||||||
Class Y | |||||||||||||||||||||||||||||||||||
| Six Months Ended 6/30/20 (unaudited) | (0.12 | ) | $ | 10.10 | 5.31 | % | 0.66 | % | 2.08 | % | 1.30 | % | $ | 3,236 | 35 | % | |||||||||||||||||||
Year Ended 12/31/19 | (0.25 | ) | $ | 9.71 | 7.76 | % | 0.66 | % | 2.35 | % | 1.24 | % | $ | 3,412 | 92 | % | |||||||||||||||||||
Year Ended 12/31/18 | (0.27 | ) | $ | 9.25 | (0.56 | )% | 0.66 | % | 2.51 | % | 1.12 | % | $ | 3,265 | 115 | % | |||||||||||||||||||
Year Ended 12/31/17 | (0.25 | ) | $ | 9.58 | 3.87 | % | 0.66 | % | 2.09 | % | 0.98 | % | $ | 4,421 | 70 | % | |||||||||||||||||||
Year Ended 12/31/16 | (0.50 | ) | $ | 9.47 | 4.26 | % | 0.66 | % | 2.53 | % | 0.94 | % | $ | 6,133 | 148 | % | |||||||||||||||||||
Year Ended 12/31/15 | (0.54 | ) | $ | 9.56 | (0.73 | )% | 0.66 | % | 3.19 | % | 0.86 | % | $ | 5,557 | 73 | % | |||||||||||||||||||
See notes to financial statements.
59
Victory Portfolios | Financial Highlights | ||||||
For a Share Outstanding Throughout Each Period
Investment Activities | Distributions to Shareholders From | ||||||||||||||||||||||||||||||
| Net Asset Value, Beginning of Period | Net Investment Income (Loss)(a) | Net Realized and Unrealized Gains (Losses) on Investments | Total from Investment Activities | Net Investment Income | Return of Capital | Total Distributions | |||||||||||||||||||||||||
Victory INCORE Low Duration Bond Fund | |||||||||||||||||||||||||||||||
Class A | |||||||||||||||||||||||||||||||
| Six Months Ended 6/30/20 (unaudited) | $ | 9.99 | 0.08 | 0.15 | 0.23 | (0.09 | ) | — | (0.09 | ) | |||||||||||||||||||||
| Year Ended 12/31/19 | $ | 9.86 | 0.19 | 0.15 | 0.34 | (0.20 | ) | (0.01 | ) | (0.21 | ) | ||||||||||||||||||||
| Year Ended 12/31/18 | $ | 9.99 | 0.16 | (0.08 | ) | 0.08 | (0.21 | ) | — | (0.21 | ) | ||||||||||||||||||||
| Year Ended 12/31/17 | $ | 10.03 | 0.12 | 0.02 | 0.14 | (0.18 | ) | — | (0.18 | ) | |||||||||||||||||||||
| Year Ended 12/31/16 | $ | 9.95 | 0.12 | 0.06 | 0.18 | (0.10 | ) | — | (0.10 | ) | |||||||||||||||||||||
| Year Ended 12/31/15 | $ | 10.03 | 0.14 | (0.09 | ) | 0.05 | (0.13 | ) | — | (0.13 | ) | ||||||||||||||||||||
Class C | |||||||||||||||||||||||||||||||
| Six Months Ended 6/30/20 (unaudited) | $ | 9.99 | 0.04 | 0.16 | 0.20 | (0.06 | ) | — | (0.06 | ) | |||||||||||||||||||||
| Year Ended 12/31/19 | $ | 9.85 | 0.12 | 0.16 | 0.28 | (0.14 | ) | — | (e) | (0.14 | ) | ||||||||||||||||||||
| Year Ended 12/31/18 | $ | 9.99 | 0.09 | (0.09 | ) | — | (e) | (0.14 | ) | — | (0.14 | ) | |||||||||||||||||||
| Year Ended 12/31/17 | $ | 10.02 | 0.04 | 0.03 | 0.07 | (0.10 | ) | — | (0.10 | ) | |||||||||||||||||||||
| Year Ended 12/31/16 | $ | 9.95 | 0.04 | 0.05 | 0.09 | (0.02 | ) | — | (0.02 | ) | |||||||||||||||||||||
| Year Ended 12/31/15 | $ | 10.03 | 0.06 | (0.08 | ) | (0.02 | ) | (0.06 | ) | — | (0.06 | ) | |||||||||||||||||||
(a) Per share net investment income (loss) has been calculated using the average daily shares method.
(b) Not annualized for periods less than one year.
(c) Annualized for periods less than one year.
(d) Portfolio turnover is calculated on the basis of the Fund as a whole without distinguishing between the classes of shares issued.
(e) Amount is less than $0.005 per share.
(f) The Fund received monies related to a nonrecurring refund from the prior Custodian. The corresponding impact to the total return was less than 0.005% for the period shown. (See Note 8)
See notes to financial statements.
60
Victory Portfolios | Financial Highlights — continued | ||||||
For a Share Outstanding Throughout Each Period
Ratios to Average Net Assets | Supplemental Data | ||||||||||||||||||||||||||||||||||
| Capital Contributions from Prior Custodian, Net (See Note 8) | Net Asset Value, End of Period | Total Return (Excludes Sales Charge)(b) | Ratio of Net Expenses to Average Net Assets(c) | Ratio of Net Investment Income (Loss) to Average Net Assets(c) | Ratio of Gross Expenses to Average Net Assets(c) | Net Assets, End of Period (000's) | Portfolio Turnover(b)(d) | ||||||||||||||||||||||||||||
Victory INCORE Low Duration Bond Fund | |||||||||||||||||||||||||||||||||||
Class A | |||||||||||||||||||||||||||||||||||
| Six Months Ended 6/30/20 (unaudited) | — | $ | 10.13 | 2.36 | % | 0.85 | % | 1.52 | % | 0.96 | % | $ | 62,817 | 41 | % | ||||||||||||||||||||
| Year Ended 12/31/19 | — | $ | 9.99 | 3.51 | % | 0.85 | % | 1.93 | % | 0.95 | % | $ | 61,972 | 50 | % | ||||||||||||||||||||
| Year Ended 12/31/18 | — | $ | 9.86 | 0.73 | % | 0.85 | % | 1.66 | % | 0.90 | % | $ | 96,210 | 45 | % | ||||||||||||||||||||
| Year Ended 12/31/17 | — | $ | 9.99 | 1.47 | % | 0.85 | % | 1.21 | % | 0.90 | % | $ | 149,287 | 62 | % | ||||||||||||||||||||
| Year Ended 12/31/16 | — | (e) | $ | 10.03 | 1.80 | %(f) | 0.85 | % | 1.21 | % | 0.89 | % | $ | 214,825 | 49 | % | |||||||||||||||||||
| Year Ended 12/31/15 | — | $ | 9.95 | 0.52 | % | 0.84 | % | 1.38 | % | 0.85 | % | $ | 314,347 | 36 | % | ||||||||||||||||||||
Class C | |||||||||||||||||||||||||||||||||||
| Six Months Ended 6/30/20 (unaudited) | — | $ | 10.13 | 1.97 | % | 1.62 | % | 0.79 | % | 1.73 | % | $ | 33,691 | 41 | % | ||||||||||||||||||||
| Year Ended 12/31/19 | — | $ | 9.99 | 2.81 | % | 1.62 | % | 1.17 | % | 1.70 | % | $ | 38,969 | 50 | % | ||||||||||||||||||||
| Year Ended 12/31/18 | — | $ | 9.85 | (0.04 | )% | 1.62 | % | 0.88 | % | 1.68 | % | $ | 62,103 | 45 | % | ||||||||||||||||||||
| Year Ended 12/31/17 | — | $ | 9.99 | 0.70 | % | 1.62 | % | 0.44 | % | 1.65 | % | $ | 82,847 | 62 | % | ||||||||||||||||||||
| Year Ended 12/31/16 | — | (e) | $ | 10.02 | 0.94 | %(f) | 1.62 | % | 0.44 | % | 1.65 | % | $ | 117,544 | 49 | % | |||||||||||||||||||
| Year Ended 12/31/15 | — | $ | 9.95 | (0.20 | )% | 1.61 | % | 0.62 | % | 1.62 | % | $ | 154,056 | 36 | % | ||||||||||||||||||||
(continues on next page)
See notes to financial statements.
61
Victory Portfolios | Financial Highlights | ||||||
For a Share Outstanding Throughout Each Period
Investment Activities | Distributions to Shareholders From | ||||||||||||||||||||||||||||||
| Net Asset Value, Beginning of Period | Net Investment Income (Loss)(a) | Net Realized and Unrealized Gains (Losses) on Investments | Total from Investment Activities | Net Investment Income | Return of Capital | Total Distributions | |||||||||||||||||||||||||
Victory INCORE Low Duration Bond Fund | |||||||||||||||||||||||||||||||
Class R | |||||||||||||||||||||||||||||||
| Six Months Ended 6/30/20 (unaudited) | $ | 9.99 | 0.05 | 0.16 | 0.21 | (0.07 | ) | — | (0.07 | ) | |||||||||||||||||||||
| Year Ended 12/31/19 | $ | 9.86 | 0.15 | 0.15 | 0.30 | (0.16 | ) | (0.01 | ) | (0.17 | ) | ||||||||||||||||||||
| Year Ended 12/31/18 | $ | 9.99 | 0.12 | (0.08 | ) | 0.04 | (0.17 | ) | — | (0.17 | ) | ||||||||||||||||||||
| Year Ended 12/31/17 | $ | 10.02 | 0.08 | 0.03 | 0.11 | (0.14 | ) | — | (0.14 | ) | |||||||||||||||||||||
| Year Ended 12/31/16 | $ | 9.95 | 0.08 | 0.05 | 0.13 | (0.06 | ) | — | (0.06 | ) | |||||||||||||||||||||
| Year Ended 12/31/15 | $ | 10.03 | 0.10 | (0.09 | ) | 0.01 | (0.09 | ) | — | (0.09 | ) | ||||||||||||||||||||
Class Y | |||||||||||||||||||||||||||||||
| Six Months Ended 6/30/20 (unaudited) | $ | 9.99 | 0.09 | 0.17 | 0.26 | (0.11 | ) | — | (0.11 | ) | |||||||||||||||||||||
| Year Ended 12/31/19 | $ | 9.86 | 0.21 | 0.16 | 0.37 | (0.23 | ) | (0.01 | ) | (0.24 | ) | ||||||||||||||||||||
| Year Ended 12/31/18 | $ | 10.00 | 0.19 | (0.10 | ) | 0.09 | (0.23 | ) | — | (0.23 | ) | ||||||||||||||||||||
| Year Ended 12/31/17 | $ | 10.03 | 0.15 | 0.02 | 0.17 | (0.20 | ) | — | (0.20 | ) | |||||||||||||||||||||
| Year Ended 12/31/16 | $ | 9.95 | 0.14 | 0.06 | 0.20 | (0.12 | ) | — | (0.12 | ) | |||||||||||||||||||||
| Year Ended 12/31/15 | $ | 10.03 | 0.16 | (0.08 | ) | 0.08 | (0.16 | ) | — | (0.16 | ) | ||||||||||||||||||||
(a) Per share net investment income (loss) has been calculated using the average daily shares method.
(b) Not annualized for periods less than one year.
(c) Annualized for periods less than one year.
(d) Portfolio turnover is calculated on the basis of the Fund as a whole without distinguishing between the classes of shares issued.
(e) Amount is less than $0.005 per share.
(f) The Fund received monies related to a nonrecurring refund from the prior Custodian. The corresponding impact to the total return was less than 0.005% for the period shown. (See Note 8)
See notes to financial statements.
62
Victory Portfolios | Financial Highlights — continued | ||||||
For a Share Outstanding Throughout Each Period (continued)
Ratios to Average Net Assets | Supplemental Data | ||||||||||||||||||||||||||||||||||
| Capital Contributions from Prior Custodian, Net (See Note 8) | Net Asset Value, End of Period | Total Return (Excludes Sales Charge)(b) | Ratio of Net Expenses to Average Net Assets(c) | Ratio of Net Investment Income (Loss) to Average Net Assets(c) | Ratio of Gross Expenses to Average Net Assets(c) | Net Assets, End of Period (000's) | Portfolio Turnover(b)(d) | ||||||||||||||||||||||||||||
Victory INCORE Low Duration Bond Fund | |||||||||||||||||||||||||||||||||||
Class R | |||||||||||||||||||||||||||||||||||
| Six Months Ended 6/30/20 (unaudited) | — | $ | 10.13 | 2.15 | % | 1.27 | % | 1.07 | % | 2.46 | % | $ | 1,139 | 41 | % | ||||||||||||||||||||
| Year Ended 12/31/19 | — | $ | 9.99 | 3.17 | % | 1.27 | % | 1.50 | % | 2.13 | % | $ | 1,147 | 50 | % | ||||||||||||||||||||
| Year Ended 12/31/18 | — | $ | 9.86 | 0.31 | % | 1.27 | % | 1.20 | % | 1.87 | % | $ | 1,554 | 45 | % | ||||||||||||||||||||
| Year Ended 12/31/17 | — | $ | 9.99 | 1.05 | % | 1.27 | % | 0.79 | % | 1.68 | % | $ | 2,078 | 62 | % | ||||||||||||||||||||
| Year Ended 12/31/16 | — | (e) | $ | 10.02 | 1.33 | %(f) | 1.23 | % | 0.83 | % | 1.25 | % | $ | 2,583 | 49 | % | |||||||||||||||||||
| Year Ended 12/31/15 | — | $ | 9.95 | 0.12 | % | 1.26 | % | 0.96 | % | 1.27 | % | $ | 3,925 | 36 | % | ||||||||||||||||||||
Class Y | |||||||||||||||||||||||||||||||||||
| Six Months Ended 6/30/20 (unaudited) | — | $ | 10.14 | 2.58 | % | 0.62 | % | 1.76 | % | 0.69 | % | $ | 155,648 | 41 | % | ||||||||||||||||||||
| Year Ended 12/31/19 | — | $ | 9.99 | 3.76 | % | 0.62 | % | 2.12 | % | 0.69 | % | $ | 164,509 | 50 | % | ||||||||||||||||||||
| Year Ended 12/31/18 | — | $ | 9.86 | 0.96 | % | 0.62 | % | 1.87 | % | 0.68 | % | $ | 180,034 | 45 | % | ||||||||||||||||||||
| Year Ended 12/31/17 | — | $ | 10.00 | 1.71 | % | 0.62 | % | 1.44 | % | 0.65 | % | $ | 271,294 | 62 | % | ||||||||||||||||||||
| Year Ended 12/31/16 | — | (e) | $ | 10.03 | 2.04 | %(f) | 0.60 | % | 1.42 | % | 0.63 | % | $ | 334,841 | 49 | % | |||||||||||||||||||
| Year Ended 12/31/15 | — | $ | 9.95 | 0.74 | % | 0.61 | % | 1.60 | % | 0.62 | % | $ | 367,112 | 36 | % | ||||||||||||||||||||
See notes to financial statements.
63
Victory Portfolios | Financial Highlights | ||||||
For a Share Outstanding Throughout Each Period
Investment Activities | Distributions to Shareholders From | ||||||||||||||||||||||||||
| Net Asset Value, Beginning of Period | Net Investment Income (Loss)(a) | Net Realized and Unrealized Gains (Losses) on Investments | Total from Investment Activities | Net Investment Income | Total Distributions | ||||||||||||||||||||||
Victory High Yield Fund | |||||||||||||||||||||||||||
Class A | |||||||||||||||||||||||||||
| Six Months Ended 6/30/20 (unaudited) | $ | 6.73 | 0.18 | (0.58 | ) | (0.40 | ) | (0.18 | ) | (0.18 | ) | ||||||||||||||||
Year Ended 12/31/19 | $ | 6.20 | 0.37 | 0.54 | 0.91 | (0.38 | ) | (0.38 | ) | ||||||||||||||||||
Year Ended 12/31/18 | $ | 6.57 | 0.39 | (0.37 | ) | 0.02 | (0.39 | ) | (0.39 | ) | |||||||||||||||||
Year Ended 12/31/17 | $ | 6.34 | 0.39 | 0.22 | 0.61 | (0.38 | ) | (0.38 | ) | ||||||||||||||||||
Year Ended 12/31/16 | $ | 5.85 | 0.38 | 0.49 | 0.87 | (0.38 | ) | (0.38 | ) | ||||||||||||||||||
Year Ended 12/31/15 | $ | 6.52 | 0.40 | (0.67 | ) | (0.27 | ) | (0.40 | ) | (0.40 | ) | ||||||||||||||||
Class C | |||||||||||||||||||||||||||
| Six Months Ended 6/30/20 (unaudited) | $ | 6.75 | 0.16 | (0.59 | ) | (0.43 | ) | (0.16 | ) | (0.16 | ) | ||||||||||||||||
Year Ended 12/31/19 | $ | 6.21 | 0.33 | 0.54 | 0.87 | (0.33 | ) | (0.33 | ) | ||||||||||||||||||
Year Ended 12/31/18 | $ | 6.58 | 0.34 | (0.36 | ) | (0.02 | ) | (0.35 | ) | (0.35 | ) | ||||||||||||||||
Year Ended 12/31/17 | $ | 6.35 | 0.34 | 0.23 | 0.57 | (0.34 | ) | (0.34 | ) | ||||||||||||||||||
Year Ended 12/31/16 | $ | 5.86 | 0.34 | 0.49 | 0.83 | (0.34 | ) | (0.34 | ) | ||||||||||||||||||
Year Ended 12/31/15 | $ | 6.53 | 0.35 | (0.67 | ) | (0.32 | ) | (0.35 | ) | (0.35 | ) | ||||||||||||||||
Class R | |||||||||||||||||||||||||||
| Six Months Ended 6/30/20 (unaudited) | $ | 6.75 | 0.17 | (0.59 | ) | (0.42 | ) | (0.17 | ) | (0.17 | ) | ||||||||||||||||
Year Ended 12/31/19 | $ | 6.22 | 0.35 | 0.53 | 0.88 | (0.35 | ) | (0.35 | ) | ||||||||||||||||||
Year Ended 12/31/18 | $ | 6.59 | 0.37 | (0.37 | ) | — | (e) | (0.37 | ) | (0.37 | ) | ||||||||||||||||
Year Ended 12/31/17 | $ | 6.35 | 0.37 | 0.23 | 0.60 | (0.36 | ) | (0.36 | ) | ||||||||||||||||||
Year Ended 12/31/16 | $ | 5.87 | 0.36 | 0.48 | 0.84 | (0.36 | ) | (0.36 | ) | ||||||||||||||||||
Year Ended 12/31/15 | $ | 6.54 | 0.37 | (0.66 | ) | (0.29 | ) | (0.38 | ) | (0.38 | ) | ||||||||||||||||
Class Y | |||||||||||||||||||||||||||
| Six Months Ended 6/30/20 (unaudited) | $ | 6.70 | 0.19 | (0.58 | ) | (0.39 | ) | (0.19 | ) | (0.19 | ) | ||||||||||||||||
Year Ended 12/31/19 | $ | 6.17 | 0.39 | 0.53 | 0.92 | (0.39 | ) | (0.39 | ) | ||||||||||||||||||
Year Ended 12/31/18 | $ | 6.54 | 0.41 | (0.37 | ) | 0.04 | (0.41 | ) | (0.41 | ) | |||||||||||||||||
Year Ended 12/31/17 | $ | 6.31 | 0.40 | 0.23 | 0.63 | (0.40 | ) | (0.40 | ) | ||||||||||||||||||
Year Ended 12/31/16 | $ | 5.82 | 0.39 | 0.49 | 0.88 | (0.39 | ) | (0.39 | ) | ||||||||||||||||||
Year Ended 12/31/15 | $ | 6.49 | 0.41 | (0.67 | ) | (0.26 | ) | (0.41 | ) | (0.41 | ) | ||||||||||||||||
(a) Per share net investment income (loss) has been calculated using the average daily shares method.
(b) Not annualized for periods less than one year.
(c) Annualized for periods less than one year.
(d) Portfolio turnover is calculated on the basis of the Fund as a whole without distinguishing between the classes of shares issued.
(e) Amount is less than $0.005 per share.
See notes to financial statements.
64
Victory Portfolios | Financial Highlights — continued | ||||||
For a Share Outstanding Throughout Each Period
Ratios to Average Net Assets | Supplemental Data | ||||||||||||||||||||||||||||||
| Net Asset Value, End of Period | Total Return (Excludes Sales Charge)(b) | Ratio of Net Expenses to Average Net Assets(c) | Ratio of Net Investment Income (Loss) to Average Net Assets(c) | Ratio of Gross Expenses to Average Net Assets(c) | Net Assets, End of Period (000's) | Portfolio Turnover(b)(d) | |||||||||||||||||||||||||
Victory High Yield Fund | |||||||||||||||||||||||||||||||
Class A | |||||||||||||||||||||||||||||||
| Six Months Ended 6/30/20 (unaudited) | $ | 6.15 | (5.88 | )% | 1.00 | % | 5.88 | % | 1.14 | % | $ | 30,505 | 66 | % | |||||||||||||||||
Year Ended 12/31/19 | $ | 6.73 | 14.90 | % | 1.00 | % | 5.70 | % | 1.12 | % | $ | 31,602 | 87 | % | |||||||||||||||||
Year Ended 12/31/18 | $ | 6.20 | 0.28 | % | 1.00 | % | 6.01 | % | 1.12 | % | $ | 23,797 | 87 | % | |||||||||||||||||
Year Ended 12/31/17 | $ | 6.57 | 9.93 | % | 1.00 | % | 5.99 | % | 1.13 | % | $ | 21,882 | 174 | % | |||||||||||||||||
Year Ended 12/31/16 | $ | 6.34 | 15.40 | % | 1.00 | % | 6.32 | % | 1.18 | % | $ | 25,530 | 165 | % | |||||||||||||||||
Year Ended 12/31/15 | $ | 5.85 | (4.51 | )% | 1.00 | % | 6.16 | % | 1.16 | % | $ | 26,608 | 151 | % | |||||||||||||||||
Class C | |||||||||||||||||||||||||||||||
| Six Months Ended 6/30/20 (unaudited) | $ | 6.16 | (6.34 | )% | 1.70 | % | 5.17 | % | 1.83 | % | $ | 20,660 | 66 | % | |||||||||||||||||
Year Ended 12/31/19 | $ | 6.75 | 14.24 | % | 1.70 | % | 5.00 | % | 1.82 | % | $ | 21,163 | 87 | % | |||||||||||||||||
Year Ended 12/31/18 | $ | 6.21 | (0.43 | )% | 1.70 | % | 5.29 | % | 1.84 | % | $ | 19,432 | 87 | % | |||||||||||||||||
Year Ended 12/31/17 | $ | 6.58 | 9.19 | % | 1.70 | % | 5.27 | % | 1.84 | % | $ | 22,283 | 174 | % | |||||||||||||||||
Year Ended 12/31/16 | $ | 6.35 | 14.58 | % | 1.70 | % | 5.61 | % | 1.91 | % | $ | 22,498 | 165 | % | |||||||||||||||||
Year Ended 12/31/15 | $ | 5.86 | (5.16 | )% | 1.70 | % | 5.47 | % | 1.90 | % | $ | 22,138 | 151 | % | |||||||||||||||||
Class R | |||||||||||||||||||||||||||||||
| Six Months Ended 6/30/20 (unaudited) | $ | 6.16 | (6.16 | )% | 1.33 | % | 5.54 | % | 1.33 | % | $ | 17,277 | 66 | % | |||||||||||||||||
Year Ended 12/31/19 | $ | 6.75 | 14.48 | % | 1.33 | % | 5.37 | % | 1.33 | % | $ | 18,818 | 87 | % | |||||||||||||||||
Year Ended 12/31/18 | $ | 6.22 | (0.07 | )% | 1.35 | % | 5.64 | % | 1.35 | % | $ | 17,595 | 87 | % | |||||||||||||||||
Year Ended 12/31/17 | $ | 6.59 | 9.64 | % | 1.35 | % | 5.61 | % | 1.36 | % | $ | 19,217 | 174 | % | |||||||||||||||||
Year Ended 12/31/16 | $ | 6.35 | 14.78 | % | 1.35 | % | 5.96 | % | 1.45 | % | $ | 18,742 | 165 | % | |||||||||||||||||
Year Ended 12/31/15 | $ | 5.87 | (4.82 | )% | 1.35 | % | 5.82 | % | 1.51 | % | $ | 18,042 | 151 | % | |||||||||||||||||
Class Y | |||||||||||||||||||||||||||||||
| Six Months Ended 6/30/20 (unaudited) | $ | 6.12 | (5.79 | )% | 0.76 | % | 6.13 | % | 0.90 | % | $ | 145,674 | 66 | % | |||||||||||||||||
Year Ended 12/31/19 | $ | 6.70 | 15.25 | % | 0.76 | % | 5.96 | % | 0.92 | % | $ | 108,171 | 87 | % | |||||||||||||||||
Year Ended 12/31/18 | $ | 6.17 | 0.52 | % | 0.76 | % | 6.32 | % | 0.97 | % | $ | 21,060 | 87 | % | |||||||||||||||||
Year Ended 12/31/17 | $ | 6.54 | 10.24 | % | 0.76 | % | 6.27 | % | 1.04 | % | $ | 5,213 | 174 | % | |||||||||||||||||
Year Ended 12/31/16 | $ | 6.31 | 15.72 | % | 0.76 | % | 6.54 | % | 1.00 | % | $ | 6,938 | 165 | % | |||||||||||||||||
Year Ended 12/31/15 | $ | 5.82 | (4.34 | )% | 0.76 | % | 6.36 | % | 0.95 | % | $ | 6,047 | 151 | % | |||||||||||||||||
See notes to financial statements.
65
Victory Portfolios | Financial Highlights | ||||||
For a Share Outstanding Throughout Each Period
Investment Activities | Distributions to Shareholders From | ||||||||||||||||||||||||||
| Net Asset Value, Beginning of Period | Net Investment Income (Loss)(a) | Net Realized and Unrealized Gains (Losses) on Investments | Total from Investment Activities | Net Investment Income | Net Realized Gains from Investments | ||||||||||||||||||||||
Victory Tax-Exempt Fund | |||||||||||||||||||||||||||
Class A | |||||||||||||||||||||||||||
| Six Months Ended 6/30/20 (unaudited) | $ | 9.84 | 0.16 | (0.17 | ) | (0.01 | ) | (0.16 | ) | — | |||||||||||||||||
Year Ended 12/31/19 | $ | 9.47 | 0.30 | 0.53 | 0.83 | (0.34 | ) | (0.12 | ) | ||||||||||||||||||
Year Ended 12/31/18 | $ | 9.91 | 0.36 | (0.30 | ) | 0.06 | (0.36 | ) | (0.14 | ) | |||||||||||||||||
Year Ended 12/31/17 | $ | 9.65 | 0.36 | 0.39 | 0.75 | (0.37 | ) | (0.12 | ) | ||||||||||||||||||
Year Ended 12/31/16 | $ | 10.53 | 0.35 | (0.49 | ) | (0.14 | ) | (0.35 | ) | (0.39 | ) | ||||||||||||||||
Year Ended 12/31/15 | $ | 10.83 | 0.35 | (0.05 | ) | 0.30 | (0.35 | ) | (0.25 | ) | |||||||||||||||||
Class C | |||||||||||||||||||||||||||
| Six Months Ended 6/30/20 (unaudited) | $ | 9.84 | 0.12 | (0.17 | ) | (0.05 | ) | (0.12 | ) | — | |||||||||||||||||
Year Ended 12/31/19 | $ | 9.47 | 0.23 | 0.52 | 0.75 | (0.26 | ) | (0.12 | ) | ||||||||||||||||||
Year Ended 12/31/18 | $ | 9.90 | 0.28 | (0.29 | ) | (0.01 | ) | (0.28 | ) | (0.14 | ) | ||||||||||||||||
Year Ended 12/31/17 | $ | 9.65 | 0.29 | 0.37 | 0.66 | (0.29 | ) | (0.12 | ) | ||||||||||||||||||
Year Ended 12/31/16 | $ | 10.53 | 0.26 | (0.48 | ) | (0.22 | ) | (0.27 | ) | (0.39 | ) | ||||||||||||||||
Year Ended 12/31/15 | $ | 10.82 | 0.26 | (0.04 | ) | 0.22 | (0.26 | ) | (0.25 | ) | |||||||||||||||||
Class Y | |||||||||||||||||||||||||||
| Six Months Ended 6/30/20 (unaudited) | $ | 9.84 | 0.16 | (0.17 | ) | (0.01 | ) | (0.16 | ) | — | |||||||||||||||||
Year Ended 12/31/19 | $ | 9.46 | 0.30 | 0.55 | 0.85 | (0.35 | ) | (0.12 | ) | ||||||||||||||||||
Year Ended 12/31/18 | $ | 9.90 | 0.37 | (0.30 | ) | 0.07 | (0.37 | ) | (0.14 | ) | |||||||||||||||||
Year Ended 12/31/17 | $ | 9.65 | 0.37 | 0.38 | 0.75 | (0.38 | ) | (0.12 | ) | ||||||||||||||||||
Year Ended 12/31/16 | $ | 10.52 | 0.36 | (0.48 | ) | (0.12 | ) | (0.36 | ) | (0.39 | ) | ||||||||||||||||
Year Ended 12/31/15 | $ | 10.82 | 0.36 | (0.05 | ) | 0.31 | (0.36 | ) | (0.25 | ) | |||||||||||||||||
(a) Per share net investment income (loss) has been calculated using the average daily shares method.
(b) Not annualized for periods less than one year.
(c) Annualized for periods less than one year.
(d) Portfolio turnover is calculated on the basis of the Fund as a whole without distinguishing between the classes of shares issued.
See notes to financial statements.
66
Victory Portfolios | Financial Highlights — continued | ||||||
For a Share Outstanding Throughout Each Period
Ratios to Average Net Assets | Supplemental Data | ||||||||||||||||||||||||||||||||||
| Total Distributions | Net Asset Value, End of Period | Total Return (Excludes Sales Charge)(b) | Ratio of Net Expenses to Average Net Assets(c) | Ratio of Net Investment Income (Loss) to Average Net Assets(c) | Ratio of Gross Expenses to Average Net Assets(c) | Net Assets, End of Period (000's) | Portfolio Turnover(b)(d) | ||||||||||||||||||||||||||||
Victory Tax-Exempt Fund | |||||||||||||||||||||||||||||||||||
Class A | |||||||||||||||||||||||||||||||||||
| Six Months Ended 6/30/20 (unaudited) | (0.16 | ) | $ | 9.67 | (0.10 | )% | 0.80 | % | 3.30 | % | 1.04 | % | $ | 29,562 | 17 | % | |||||||||||||||||||
Year Ended 12/31/19 | (0.46 | ) | $ | 9.84 | 8.82 | % | 0.80 | % | 3.04 | % | 1.02 | % | $ | 30,251 | 64 | % | |||||||||||||||||||
Year Ended 12/31/18 | (0.50 | ) | $ | 9.47 | 0.69 | % | 0.80 | % | 3.68 | % | 0.97 | % | $ | 29,993 | 42 | % | |||||||||||||||||||
Year Ended 12/31/17 | (0.49 | ) | $ | 9.91 | 7.89 | % | 0.80 | % | 3.70 | % | 0.96 | % | $ | 37,570 | 84 | % | |||||||||||||||||||
Year Ended 12/31/16 | (0.74 | ) | $ | 9.65 | (1.40 | )% | 0.80 | % | 3.30 | % | 0.95 | % | $ | 54,658 | 39 | % | |||||||||||||||||||
Year Ended 12/31/15 | (0.60 | ) | $ | 10.53 | 2.76 | % | 0.80 | % | 3.22 | % | 0.93 | % | $ | 90,301 | 39 | % | |||||||||||||||||||
Class C | |||||||||||||||||||||||||||||||||||
| Six Months Ended 6/30/20 (unaudited) | (0.12 | ) | $ | 9.67 | (0.50 | )% | 1.60 | % | 2.50 | % | 1.89 | % | $ | 8,753 | 17 | % | |||||||||||||||||||
Year Ended 12/31/19 | (0.38 | ) | $ | 9.84 | 7.97 | % | 1.60 | % | 2.34 | % | 1.82 | % | $ | 11,259 | 64 | % | |||||||||||||||||||
Year Ended 12/31/18 | (0.42 | ) | $ | 9.47 | (0.01 | )% | 1.60 | % | 2.88 | % | 1.78 | % | $ | 17,986 | 42 | % | |||||||||||||||||||
Year Ended 12/31/17 | (0.41 | ) | $ | 9.90 | 6.92 | % | 1.60 | % | 2.89 | % | 1.74 | % | $ | 26,520 | 84 | % | |||||||||||||||||||
Year Ended 12/31/16 | (0.66 | ) | $ | 9.65 | (2.19 | )% | 1.60 | % | 2.51 | % | 1.71 | % | $ | 33,369 | 39 | % | |||||||||||||||||||
Year Ended 12/31/15 | (0.51 | ) | $ | 10.53 | 2.04 | % | 1.60 | % | 2.43 | % | 1.70 | % | $ | 43,404 | 39 | % | |||||||||||||||||||
Class Y | |||||||||||||||||||||||||||||||||||
| Six Months Ended 6/30/20 (unaudited) | (0.16 | ) | $ | 9.67 | (0.05 | )% | 0.69 | % | 3.41 | % | 0.85 | % | $ | 21,908 | 17 | % | |||||||||||||||||||
Year Ended 12/31/19 | (0.47 | ) | $ | 9.84 | 9.06 | % | 0.69 | % | 3.07 | % | 0.83 | % | $ | 24,459 | 64 | % | |||||||||||||||||||
Year Ended 12/31/18 | (0.51 | ) | $ | 9.46 | 0.80 | % | 0.69 | % | 3.79 | % | 0.77 | % | $ | 20,260 | 42 | % | |||||||||||||||||||
Year Ended 12/31/17 | (0.50 | ) | $ | 9.90 | 7.90 | % | 0.69 | % | 3.80 | % | 0.73 | % | $ | 27,420 | 84 | % | |||||||||||||||||||
Year Ended 12/31/16 | (0.75 | ) | $ | 9.65 | (1.20 | )% | 0.69 | % | 3.41 | % | 0.71 | % | $ | 31,762 | 39 | % | |||||||||||||||||||
Year Ended 12/31/15 | (0.61 | ) | $ | 10.52 | 2.87 | % | 0.69 | % | 3.33 | % | 0.71 | % | $ | 52,012 | 39 | % | |||||||||||||||||||
See notes to financial statements.
67
Victory Portfolios | Financial Highlights | ||||||
For a Share Outstanding Throughout Each Period
Investment Activities | Distributions to Shareholders From | ||||||||||||||||||||||||||
| Net Asset Value, Beginning of Period | Net Investment Income (Loss)(a) | Net Realized and Unrealized Gains (Losses) on Investments | Total from Investment Activities | Net Investment Income | Net Realized Gains from Investments | ||||||||||||||||||||||
Victory High Income Municipal Bond Fund | |||||||||||||||||||||||||||
Class A | |||||||||||||||||||||||||||
| Six Months Ended 6/30/20 (unaudited) | $ | 10.75 | 0.20 | (0.22 | ) | (0.02 | ) | (0.20 | ) | — | |||||||||||||||||
Year Ended 12/31/19 | $ | 10.39 | 0.35 | 0.47 | 0.82 | (0.40 | ) | (0.06 | ) | ||||||||||||||||||
Year Ended 12/31/18 | $ | 10.79 | 0.43 | (0.40 | ) | 0.03 | (0.43 | ) | — | ||||||||||||||||||
Year Ended 12/31/17 | $ | 10.35 | 0.46 | 0.44 | 0.90 | (0.46 | ) | — | |||||||||||||||||||
Year Ended 12/31/16 | $ | 10.89 | 0.44 | (0.54 | ) | (0.10 | ) | (0.44 | ) | — | |||||||||||||||||
Year Ended 12/31/15 | $ | 10.84 | 0.43 | 0.05 | 0.48 | (0.43 | ) | — | |||||||||||||||||||
Class C | |||||||||||||||||||||||||||
| Six Months Ended 6/30/20 (unaudited) | $ | 10.75 | 0.16 | (0.22 | ) | (0.06 | ) | (0.16 | ) | — | |||||||||||||||||
Year Ended 12/31/19 | $ | 10.39 | 0.28 | 0.46 | 0.74 | (0.32 | ) | (0.06 | ) | ||||||||||||||||||
Year Ended 12/31/18 | $ | 10.79 | 0.35 | (0.40 | ) | (0.05 | ) | (0.35 | ) | — | |||||||||||||||||
Year Ended 12/31/17 | $ | 10.35 | 0.38 | 0.44 | 0.82 | (0.38 | ) | — | |||||||||||||||||||
Year Ended 12/31/16 | $ | 10.89 | 0.36 | (0.54 | ) | (0.18 | ) | (0.36 | ) | — | |||||||||||||||||
Year Ended 12/31/15 | $ | 10.84 | 0.35 | 0.05 | 0.40 | (0.35 | ) | — | |||||||||||||||||||
Class Y | |||||||||||||||||||||||||||
| Six Months Ended 6/30/20 (unaudited) | $ | 10.75 | 0.21 | (0.22 | ) | (0.01 | ) | (0.21 | ) | — | |||||||||||||||||
Year Ended 12/31/19 | $ | 10.39 | 0.38 | 0.47 | 0.85 | (0.43 | ) | (0.06 | ) | ||||||||||||||||||
Year Ended 12/31/18 | $ | 10.79 | 0.46 | (0.40 | ) | 0.06 | (0.46 | ) | — | ||||||||||||||||||
Year Ended 12/31/17 | $ | 10.35 | 0.48 | 0.44 | 0.92 | (0.48 | ) | — | |||||||||||||||||||
Year Ended 12/31/16 | $ | 10.89 | 0.47 | (0.54 | ) | (0.07 | ) | (0.47 | ) | — | |||||||||||||||||
Year Ended 12/31/15 | $ | 10.84 | 0.45 | 0.05 | 0.50 | (0.45 | ) | — | |||||||||||||||||||
(a) Per share net investment income (loss) has been calculated using the average daily shares method.
(b) Not annualized for periods less than one year.
(c) Annualized for periods less than one year.
(d) Portfolio turnover is calculated on the basis of the Fund as a whole without distinguishing between the classes of shares issued.
See notes to financial statements.
68
Victory Portfolios | Financial Highlights — continued | ||||||
For a Share Outstanding Throughout Each Period
Ratios to Average Net Assets | Supplemental Data | ||||||||||||||||||||||||||||||||||
| Total Distributions | Net Asset Value, End of Period | Total Return (Excludes Sales Charge)(b) | Ratio of Net Expenses to Average Net Assets(c) | Ratio of Net Investment Income (Loss) to Average Net Assets(c) | Ratio of Gross Expenses to Average Net Assets(c) | Net Assets, End of Period (000's) | Portfolio Turnover(b)(d) | ||||||||||||||||||||||||||||
Victory High Income Municipal Bond Fund | |||||||||||||||||||||||||||||||||||
Class A | |||||||||||||||||||||||||||||||||||
| Six Months Ended 6/30/20 (unaudited) | (0.20 | ) | $ | 10.53 | (0.17 | )% | 0.80 | % | 3.82 | % | 1.09 | % | $ | 18,610 | 22 | % | |||||||||||||||||||
Year Ended 12/31/19 | (0.46 | ) | $ | 10.75 | 8.04 | % | 0.80 | % | 3.27 | % | 1.09 | % | $ | 19,153 | 49 | % | |||||||||||||||||||
Year Ended 12/31/18 | (0.43 | ) | $ | 10.39 | 0.34 | % | 0.80 | % | 4.13 | % | 1.02 | % | $ | 16,483 | 48 | % | |||||||||||||||||||
Year Ended 12/31/17 | (0.46 | ) | $ | 10.79 | 8.85 | % | 0.80 | % | 4.31 | % | 0.96 | % | $ | 25,831 | 66 | % | |||||||||||||||||||
Year Ended 12/31/16 | (0.44 | ) | $ | 10.35 | (1.04 | )% | 0.80 | % | 4.02 | % | 0.96 | % | $ | 32,943 | 49 | % | |||||||||||||||||||
Year Ended 12/31/15 | (0.43 | ) | $ | 10.89 | 4.51 | % | 0.80 | % | 3.96 | % | 0.95 | % | $ | 48,485 | 53 | % | |||||||||||||||||||
Class C | |||||||||||||||||||||||||||||||||||
| Six Months Ended 6/30/20 (unaudited) | (0.16 | ) | $ | 10.53 | (0.55 | )% | 1.57 | % | 3.05 | % | 1.89 | % | $ | 11,578 | 22 | % | |||||||||||||||||||
Year Ended 12/31/19 | (0.38 | ) | $ | 10.75 | 7.22 | % | 1.57 | % | 2.61 | % | 1.85 | % | $ | 13,995 | 49 | % | |||||||||||||||||||
Year Ended 12/31/18 | (0.35 | ) | $ | 10.39 | (0.43 | )% | 1.57 | % | 3.35 | % | 1.78 | % | $ | 19,282 | 48 | % | |||||||||||||||||||
Year Ended 12/31/17 | (0.38 | ) | $ | 10.79 | 8.01 | % | 1.57 | % | 3.54 | % | 1.73 | % | $ | 25,175 | 66 | % | |||||||||||||||||||
Year Ended 12/31/16 | (0.36 | ) | $ | 10.35 | (1.79 | )% | 1.57 | % | 3.26 | % | 1.73 | % | $ | 29,563 | 49 | % | |||||||||||||||||||
Year Ended 12/31/15 | (0.35 | ) | $ | 10.89 | 3.71 | % | 1.57 | % | 3.19 | % | 1.73 | % | $ | 36,190 | 53 | % | |||||||||||||||||||
Class Y | |||||||||||||||||||||||||||||||||||
| Six Months Ended 6/30/20 (unaudited) | (0.21 | ) | $ | 10.53 | (0.05 | )% | 0.57 | % | 4.04 | % | 0.94 | % | $ | 8,309 | 22 | % | |||||||||||||||||||
Year Ended 12/31/19 | (0.49 | ) | $ | 10.75 | 8.29 | % | 0.57 | % | 3.56 | % | 0.88 | % | $ | 10,620 | 49 | % | |||||||||||||||||||
Year Ended 12/31/18 | (0.46 | ) | $ | 10.39 | 0.57 | % | 0.57 | % | 4.36 | % | 0.78 | % | $ | 11,683 | 48 | % | |||||||||||||||||||
Year Ended 12/31/17 | (0.48 | ) | $ | 10.79 | 9.10 | % | 0.57 | % | 4.55 | % | 0.73 | % | $ | 26,864 | 66 | % | |||||||||||||||||||
Year Ended 12/31/16 | (0.47 | ) | $ | 10.35 | (0.81 | )% | 0.57 | % | 4.26 | % | 0.72 | % | $ | 36,603 | 49 | % | |||||||||||||||||||
Year Ended 12/31/15 | (0.45 | ) | $ | 10.89 | 4.75 | % | 0.57 | % | 4.18 | % | 0.73 | % | $ | 43,024 | 53 | % | |||||||||||||||||||
See notes to financial statements.
69
Victory Portfolios | Financial Highlights | ||||||
For a Share Outstanding Throughout Each Period
Investment Activities | Distributions to Shareholders From | ||||||||||||||||||||||||||
| Net Asset Value, Beginning of Period | Net Investment Income (Loss)(a) | Net Realized and Unrealized Gains (Losses) on Investments | Total from Investment Activities | Net Investment Income | Total Distributions | ||||||||||||||||||||||
Victory Floating Rate Fund | |||||||||||||||||||||||||||
Class A | |||||||||||||||||||||||||||
| Six Months Ended 6/30/20 (unaudited) | $ | 9.42 | 0.25 | (0.77 | ) | (0.52 | ) | (0.25 | ) | (0.25 | ) | ||||||||||||||||
Year Ended 12/31/19 | $ | 9.13 | 0.55 | 0.29 | 0.84 | (0.55 | ) | (0.55 | ) | ||||||||||||||||||
Year Ended 12/31/18 | $ | 9.60 | 0.52 | (0.47 | ) | 0.05 | (0.52 | ) | (0.52 | ) | |||||||||||||||||
Year Ended 12/31/17 | $ | 9.71 | 0.46 | (0.10 | ) | 0.36 | (0.47 | ) | (0.47 | ) | |||||||||||||||||
Year Ended 12/31/16 | $ | 9.08 | 0.46 | 0.63 | 1.09 | (0.46 | ) | (0.46 | ) | ||||||||||||||||||
Year Ended 12/31/15 | $ | 9.82 | 0.46 | (0.74 | ) | (0.28 | ) | (0.46 | ) | (0.46 | ) | ||||||||||||||||
Class C | |||||||||||||||||||||||||||
| Six Months Ended 6/30/20 (unaudited) | $ | 9.42 | 0.22 | (0.76 | ) | (0.54 | ) | (0.22 | ) | (0.22 | ) | ||||||||||||||||
Year Ended 12/31/19 | $ | 9.14 | 0.48 | 0.28 | 0.76 | (0.48 | ) | (0.48 | ) | ||||||||||||||||||
Year Ended 12/31/18 | $ | 9.61 | 0.44 | (0.47 | ) | (0.03 | ) | (0.44 | ) | (0.44 | ) | ||||||||||||||||
Year Ended 12/31/17 | $ | 9.72 | 0.38 | (0.10 | ) | 0.28 | (0.39 | ) | (0.39 | ) | |||||||||||||||||
Year Ended 12/31/16 | $ | 9.08 | 0.39 | 0.64 | 1.03 | (0.39 | ) | (0.39 | ) | ||||||||||||||||||
Year Ended 12/31/15 | $ | 9.83 | 0.38 | (0.75 | ) | (0.37 | ) | (0.38 | ) | (0.38 | ) | ||||||||||||||||
Class R | |||||||||||||||||||||||||||
| Six Months Ended 6/30/20 (unaudited) | $ | 9.41 | 0.23 | (0.76 | ) | (0.53 | ) | (0.23 | ) | (0.23 | ) | ||||||||||||||||
Year Ended 12/31/19 | $ | 9.13 | 0.50 | 0.28 | 0.78 | (0.50 | ) | (0.50 | ) | ||||||||||||||||||
Year Ended 12/31/18 | $ | 9.60 | 0.46 | (0.46 | ) | — | (e) | (0.47 | ) | (0.47 | ) | ||||||||||||||||
Year Ended 12/31/17 | $ | 9.72 | 0.41 | (0.12 | ) | 0.29 | (0.41 | ) | (0.41 | ) | |||||||||||||||||
Year Ended 12/31/16 | $ | 9.08 | 0.42 | 0.63 | 1.05 | (0.41 | ) | (0.41 | ) | ||||||||||||||||||
Year Ended 12/31/15 | $ | 9.83 | 0.41 | (0.75 | ) | (0.34 | ) | (0.41 | ) | (0.41 | ) | ||||||||||||||||
Class Y | |||||||||||||||||||||||||||
| Six Months Ended 6/30/20 (unaudited) | $ | 9.43 | 0.26 | (0.77 | ) | (0.51 | ) | (0.26 | ) | (0.26 | ) | ||||||||||||||||
Year Ended 12/31/19 | $ | 9.14 | 0.57 | 0.29 | 0.86 | (0.57 | ) | (0.57 | ) | ||||||||||||||||||
Year Ended 12/31/18 | $ | 9.61 | 0.54 | (0.47 | ) | 0.07 | (0.54 | ) | (0.54 | ) | |||||||||||||||||
Year Ended 12/31/17 | $ | 9.72 | 0.48 | (0.10 | ) | 0.38 | (0.49 | ) | (0.49 | ) | |||||||||||||||||
Year Ended 12/31/16 | $ | 9.08 | 0.49 | 0.63 | 1.12 | (0.48 | ) | (0.48 | ) | ||||||||||||||||||
Year Ended 12/31/15 | $ | 9.83 | 0.48 | (0.75 | ) | (0.27 | ) | (0.48 | ) | (0.48 | ) | ||||||||||||||||
(a) Per share net investment income (loss) has been calculated using the average daily shares method.
(b) Not annualized for periods less than one year.
(c) Annualized for periods less than one year.
(d) Portfolio turnover is calculated on the basis of the Fund as a whole without distinguishing between the classes of shares issued.
(e) Amount is less than $0.005 per share.
See notes to financial statements.
70
Victory Portfolios | Financial Highlights — continued | ||||||
For a Share Outstanding Throughout Each Period
Ratios to Average Net Assets | Supplemental Data | ||||||||||||||||||||||||||||||
| Net Asset Value, End of Period | Total Return (Excludes Sales Charge)(b) | Ratio of Net Expenses to Average Net Assets(c) | Ratio of Net Investment Income (Loss) to Average Net Assets(c) | Ratio of Gross Expenses to Average Net Assets(c) | Net Assets, End of Period (000's) | Portfolio Turnover(b)(d) | |||||||||||||||||||||||||
Victory Floating Rate Fund | |||||||||||||||||||||||||||||||
Class A | |||||||||||||||||||||||||||||||
| Six Months Ended 6/30/20 (unaudited) | $ | 8.65 | (5.45 | )% | 1.00 | % | 5.80 | % | 1.18 | % | $ | 120,539 | 30 | % | |||||||||||||||||
Year Ended 12/31/19 | $ | 9.42 | 9.43 | % | 1.00 | % | 5.89 | % | 1.17 | % | $ | 146,584 | 35 | % | |||||||||||||||||
Year Ended 12/31/18 | $ | 9.13 | 0.43 | % | 1.00 | % | 5.41 | % | 1.14 | % | $ | 118,672 | 48 | % | |||||||||||||||||
Year Ended 12/31/17 | $ | 9.60 | 3.76 | % | 1.00 | % | 4.76 | % | 1.10 | % | $ | 148,060 | 57 | % | |||||||||||||||||
Year Ended 12/31/16 | $ | 9.71 | 12.35 | % | 1.00 | % | 4.95 | % | 1.11 | % | $ | 221,022 | 56 | % | |||||||||||||||||
Year Ended 12/31/15 | $ | 9.08 | (3.03 | )% | 1.00 | % | 4.71 | % | 1.06 | % | $ | 227,240 | 29 | % | |||||||||||||||||
Class C | |||||||||||||||||||||||||||||||
| Six Months Ended 6/30/20 (unaudited) | $ | 8.66 | (5.72 | )% | 1.80 | % | 5.02 | % | 1.95 | % | $ | 117,212 | 30 | % | |||||||||||||||||
Year Ended 12/31/19 | $ | 9.42 | 8.49 | % | 1.80 | % | 5.08 | % | 1.92 | % | $ | 149,054 | 35 | % | |||||||||||||||||
Year Ended 12/31/18 | $ | 9.14 | (0.38 | )% | 1.80 | % | 4.60 | % | 1.90 | % | $ | 211,462 | 48 | % | |||||||||||||||||
Year Ended 12/31/17 | $ | 9.61 | 2.93 | % | 1.80 | % | 3.97 | % | 1.87 | % | $ | 265,486 | 57 | % | |||||||||||||||||
Year Ended 12/31/16 | $ | 9.72 | 11.57 | % | 1.80 | % | 4.18 | % | 1.89 | % | $ | 341,169 | 56 | % | |||||||||||||||||
Year Ended 12/31/15 | $ | 9.08 | (3.91 | )% | 1.80 | % | 3.92 | % | 1.85 | % | $ | 399,361 | 29 | % | |||||||||||||||||
Class R | |||||||||||||||||||||||||||||||
| Six Months Ended 6/30/20 (unaudited) | $ | 8.65 | (5.60 | )% | 1.56 | % | 5.22 | % | 6.07 | % | $ | 262 | 30 | % | |||||||||||||||||
Year Ended 12/31/19 | $ | 9.41 | 8.75 | % | 1.56 | % | 5.34 | % | 3.73 | % | $ | 455 | 35 | % | |||||||||||||||||
Year Ended 12/31/18 | $ | 9.13 | (0.13 | )% | 1.56 | % | 4.84 | % | 2.99 | % | $ | 716 | 48 | % | |||||||||||||||||
Year Ended 12/31/17 | $ | 9.60 | 3.07 | % | 1.56 | % | 4.20 | % | 2.26 | % | $ | 916 | 57 | % | |||||||||||||||||
Year Ended 12/31/16 | $ | 9.72 | 11.88 | % | 1.53 | % | 4.48 | % | 1.53 | % | $ | 1,319 | 56 | % | |||||||||||||||||
Year Ended 12/31/15 | $ | 9.08 | (3.62 | )% | 1.52 | % | 4.22 | % | 1.52 | % | $ | 1,920 | 29 | % | |||||||||||||||||
Class Y | |||||||||||||||||||||||||||||||
| Six Months Ended 6/30/20 (unaudited) | $ | 8.66 | (5.34 | )% | 0.78 | % | 6.00 | % | 0.94 | % | $ | 255,514 | 30 | % | |||||||||||||||||
Year Ended 12/31/19 | $ | 9.43 | 9.65 | % | 0.78 | % | 6.10 | % | 0.92 | % | $ | 289,796 | 35 | % | |||||||||||||||||
Year Ended 12/31/18 | $ | 9.14 | 0.64 | % | 0.78 | % | 5.64 | % | 0.89 | % | $ | 281,545 | 48 | % | |||||||||||||||||
Year Ended 12/31/17 | $ | 9.61 | 3.98 | % | 0.78 | % | 4.99 | % | 0.88 | % | $ | 276,195 | 57 | % | |||||||||||||||||
Year Ended 12/31/16 | $ | 9.72 | 12.71 | % | 0.78 | % | 5.21 | % | 0.88 | % | $ | 370,035 | 56 | % | |||||||||||||||||
Year Ended 12/31/15 | $ | 9.08 | (2.91 | )% | 0.78 | % | 4.91 | % | 0.84 | % | $ | 471,827 | 29 | % | |||||||||||||||||
See notes to financial statements.
71
Victory Portfolios | Financial Highlights | ||||||
For a Share Outstanding Throughout Each Period
Investment Activities | Distributions to Shareholders From | ||||||||||||||||||||||||||||||
| Net Asset Value, Beginning of Period | Net Investment Income (Loss)(a) | Net Realized and Unrealized Gains (Losses) on Investments | Total from Investment Activities | Net Investment Income | Net Realized Gains From Investments | Return of Capital | |||||||||||||||||||||||||
Victory Strategic Income Fund | |||||||||||||||||||||||||||||||
Class A | |||||||||||||||||||||||||||||||
| Six Months Ended 6/30/20 (unaudited) | $ | 10.35 | 0.08 | 0.37 | 0.45 | (0.08 | ) | — | — | ||||||||||||||||||||||
| Year Ended 12/31/19 | $ | 9.74 | 0.27 | 0.61 | 0.88 | (0.25 | ) | — | (0.02 | ) | |||||||||||||||||||||
| Year Ended 12/31/18 | $ | 10.14 | 0.34 | (0.41 | ) | (0.07 | ) | (0.33 | ) | — | — | ||||||||||||||||||||
| Year Ended 12/31/17 | $ | 9.99 | 0.33 | 0.17 | 0.50 | (0.35 | ) | — | — | ||||||||||||||||||||||
| Year Ended 12/31/16 | $ | 9.68 | 0.23 | 0.36 | 0.59 | (0.27 | ) | — | (0.01 | ) | |||||||||||||||||||||
| Year Ended 12/31/15 | $ | 10.10 | 0.31 | (0.40 | ) | (0.09 | ) | (0.32 | ) | (0.01 | ) | — | |||||||||||||||||||
Class C | |||||||||||||||||||||||||||||||
| Six Months Ended 6/30/20 (unaudited) | $ | 10.40 | 0.04 | 0.38 | 0.42 | (0.04 | ) | — | — | ||||||||||||||||||||||
| Year Ended 12/31/19 | $ | 9.79 | 0.19 | 0.61 | 0.80 | (0.18 | ) | — | (0.01 | ) | |||||||||||||||||||||
| Year Ended 12/31/18 | $ | 10.19 | 0.26 | (0.41 | ) | (0.15 | ) | (0.25 | ) | — | — | ||||||||||||||||||||
| Year Ended 12/31/17 | $ | 10.04 | 0.25 | 0.17 | 0.42 | (0.27 | ) | — | — | ||||||||||||||||||||||
| Year Ended 12/31/16 | $ | 9.72 | 0.15 | 0.38 | 0.53 | (0.20 | ) | — | (0.01 | ) | |||||||||||||||||||||
| Year Ended 12/31/15 | $ | 10.15 | 0.23 | (0.40 | ) | (0.17 | ) | (0.25 | ) | (0.01 | ) | — | |||||||||||||||||||
(a) Per share net investment income (loss) has been calculated using the average daily shares method.
(b) Not annualized for periods less than one year.
(c) Annualized for periods less than one year.
(d) Portfolio turnover is calculated on the basis of the Fund as a whole without distinguishing between the classes of shares issued.
See notes to financial statements.
72
Victory Portfolios | Financial Highlights — continued | ||||||
For a Share Outstanding Throughout Each Period
Ratios to Average Net Assets | Supplemental Data | ||||||||||||||||||||||||||||||||||
Total Distributions | Net Asset Value, End of Period | Total Return (Excludes Sales Charge)(b) | Ratio of Net Expenses to Average Net Assets(c) | Ratio of Net Investment Income (Loss) to Average Net Assets(c) | Ratio of Gross Expenses to Average Net Assets(c) | Net Assets, End of Period (000's) | Portfolio Turnover(b)(d) | ||||||||||||||||||||||||||||
Victory Strategic Income Fund | |||||||||||||||||||||||||||||||||||
Class A | |||||||||||||||||||||||||||||||||||
| Six Months Ended 6/30/20 (unaudited) | (0.08 | ) | $ | 10.72 | 4.47 | % | 0.95 | % | 1.48 | % | 1.09 | % | $ | 36,045 | 152 | % | |||||||||||||||||||
| Year Ended 12/31/19 | (0.27 | ) | $ | 10.35 | 9.17 | % | 0.95 | % | 2.61 | % | 1.11 | % | $ | 33,767 | 106 | % | |||||||||||||||||||
| Year Ended 12/31/18 | (0.33 | ) | $ | 9.74 | (0.66 | )% | 0.95 | % | 3.46 | % | 1.09 | % | $ | 32,053 | 115 | % | |||||||||||||||||||
| Year Ended 12/31/17 | (0.35 | ) | $ | 10.14 | 5.12 | % | 0.95 | % | 3.24 | % | 1.07 | % | $ | 34,957 | 138 | % | |||||||||||||||||||
| Year Ended 12/31/16 | (0.28 | ) | $ | 9.99 | 6.20 | % | 0.95 | % | 2.28 | % | 1.17 | % | $ | 37,121 | 79 | % | |||||||||||||||||||
| Year Ended 12/31/15 | (0.33 | ) | $ | 9.68 | (0.93 | )% | 0.95 | % | 3.05 | % | 1.16 | % | $ | 37,845 | 41 | % | |||||||||||||||||||
Class C | |||||||||||||||||||||||||||||||||||
| Six Months Ended 6/30/20 (unaudited) | (0.04 | ) | $ | 10.78 | 4.03 | % | 1.74 | % | 0.69 | % | 1.99 | % | $ | 9,509 | 152 | % | |||||||||||||||||||
| Year Ended 12/31/19 | (0.19 | ) | $ | 10.40 | 8.26 | % | 1.74 | % | 1.83 | % | 2.00 | % | $ | 9,126 | 106 | % | |||||||||||||||||||
| Year Ended 12/31/18 | (0.25 | ) | $ | 9.79 | (1.45 | )% | 1.74 | % | 2.65 | % | 1.97 | % | $ | 10,221 | 115 | % | |||||||||||||||||||
| Year Ended 12/31/17 | (0.27 | ) | $ | 10.19 | 4.27 | % | 1.74 | % | 2.44 | % | 1.89 | % | $ | 11,671 | 138 | % | |||||||||||||||||||
| Year Ended 12/31/16 | (0.21 | ) | $ | 10.04 | 5.46 | % | 1.74 | % | 1.49 | % | 2.00 | % | $ | 11,547 | 79 | % | |||||||||||||||||||
| Year Ended 12/31/15 | (0.26 | ) | $ | 9.72 | (1.79 | )% | 1.74 | % | 2.25 | % | 1.97 | % | $ | 12,940 | 41 | % | |||||||||||||||||||
(continues on next page)
See notes to financial statements.
73
Victory Portfolios | Financial Highlights | ||||||
For a Share Outstanding Throughout Each Period
Investment Activities | Distributions to Shareholders From | ||||||||||||||||||||||||||||||
| Net Asset Value, Beginning of Period | Net Investment Income (Loss)(a) | Net Realized and Unrealized Gains (Losses) on Investments | Total from Investment Activities | Net Investment Income | Net Realized Gains From Investments | Return of Capital | |||||||||||||||||||||||||
Victory Strategic Income Fund | |||||||||||||||||||||||||||||||
Class R | |||||||||||||||||||||||||||||||
| Six Months Ended 6/30/20 (unaudited) | $ | 10.41 | 0.06 | 0.37 | 0.43 | (0.06 | ) | — | — | ||||||||||||||||||||||
| Year Ended 12/31/19 | $ | 9.79 | 0.23 | 0.62 | 0.85 | (0.22 | ) | — | (0.01 | ) | |||||||||||||||||||||
| Year Ended 12/31/18 | $ | 10.20 | 0.30 | (0.42 | ) | (0.12 | ) | (0.29 | ) | — | — | ||||||||||||||||||||
| Year Ended 12/31/17 | $ | 10.04 | 0.29 | 0.18 | 0.47 | (0.31 | ) | — | — | ||||||||||||||||||||||
| Year Ended 12/31/16 | $ | 9.73 | 0.19 | 0.37 | 0.56 | (0.24 | ) | — | (0.01 | ) | |||||||||||||||||||||
| Year Ended 12/31/15 | $ | 10.16 | 0.27 | (0.40 | ) | (0.13 | ) | (0.29 | ) | (0.01 | ) | — | |||||||||||||||||||
Class Y | |||||||||||||||||||||||||||||||
| Six Months Ended 6/30/20 (unaudited) | $ | 10.29 | 0.08 | 0.39 | 0.47 | (0.09 | ) | — | — | ||||||||||||||||||||||
| Year Ended 12/31/19 | $ | 9.69 | 0.29 | 0.61 | 0.90 | (0.28 | ) | — | (0.02 | ) | |||||||||||||||||||||
| Year Ended 12/31/18 | $ | 10.09 | 0.36 | (0.41 | ) | (0.05 | ) | (0.35 | ) | — | — | ||||||||||||||||||||
| Year Ended 12/31/17 | $ | 9.94 | 0.35 | 0.18 | 0.53 | (0.38 | ) | — | — | ||||||||||||||||||||||
| Year Ended 12/31/16 | $ | 9.63 | 0.25 | 0.36 | 0.61 | (0.29 | ) | — | (0.01 | ) | |||||||||||||||||||||
| Year Ended 12/31/15 | $ | 10.05 | 0.32 | (0.39 | ) | (0.07 | ) | (0.34 | ) | (0.01 | ) | — | |||||||||||||||||||
(a) Per share net investment income (loss) has been calculated using the average daily shares method.
(b) Not annualized for periods less than one year.
(c) Annualized for periods less than one year.
(d) Portfolio turnover is calculated on the basis of the Fund as a whole without distinguishing between the classes of shares issued.
See notes to financial statements.
74
Victory Portfolios | Financial Highlights — continued | ||||||
For a Share Outstanding Throughout Each Period (continued)
Ratios to Average Net Assets | Supplemental Data | ||||||||||||||||||||||||||||||||||
Total Distributions | Net Asset Value, End of Period | Total Return (Excludes Sales Charge)(b) | Ratio of Net Expenses to Average Net Assets(c) | Ratio of Net Investment Income (Loss) to Average Net Assets(c) | Ratio of Gross Expenses to Average Net Assets(c) | Net Assets, End of Period (000's) | Portfolio Turnover(b)(d) | ||||||||||||||||||||||||||||
Victory Strategic Income Fund | |||||||||||||||||||||||||||||||||||
Class R | |||||||||||||||||||||||||||||||||||
| Six Months Ended 6/30/20 (unaudited) | (0.06 | ) | $ | 10.78 | 4.14 | % | 1.34 | % | 1.08 | % | 1.76 | % | $ | 2,962 | 152 | % | |||||||||||||||||||
| Year Ended 12/31/19 | (0.23 | ) | $ | 10.41 | 8.79 | % | 1.34 | % | 2.21 | % | 1.77 | % | $ | 2,866 | 106 | % | |||||||||||||||||||
| Year Ended 12/31/18 | (0.29 | ) | $ | 9.79 | (1.15 | )% | 1.34 | % | 3.05 | % | 1.70 | % | $ | 2,761 | 115 | % | |||||||||||||||||||
| Year Ended 12/31/17 | (0.31 | ) | $ | 10.20 | 4.78 | % | 1.34 | % | 2.83 | % | 1.61 | % | $ | 2,927 | 138 | % | |||||||||||||||||||
| Year Ended 12/31/16 | (0.25 | ) | $ | 10.04 | 5.77 | % | 1.34 | % | 1.89 | % | 1.53 | % | $ | 2,979 | 79 | % | |||||||||||||||||||
| Year Ended 12/31/15 | (0.30 | ) | $ | 9.73 | (1.39 | )% | 1.34 | % | 2.64 | % | 1.58 | % | $ | 3,338 | 41 | % | |||||||||||||||||||
Class Y | |||||||||||||||||||||||||||||||||||
| Six Months Ended 6/30/20 (unaudited) | (0.09 | ) | $ | 10.67 | 4.60 | % | 0.74 | % | 1.50 | % | 0.85 | % | $ | 31,015 | 152 | % | |||||||||||||||||||
| Year Ended 12/31/19 | (0.30 | ) | $ | 10.29 | 9.35 | % | 0.74 | % | 2.83 | % | 1.11 | % | $ | 5,274 | 106 | % | |||||||||||||||||||
| Year Ended 12/31/18 | (0.35 | ) | $ | 9.69 | (0.45 | )% | 0.74 | % | 3.72 | % | 1.06 | % | $ | 4,798 | 115 | % | |||||||||||||||||||
| Year Ended 12/31/17 | (0.38 | ) | $ | 10.09 | 5.38 | % | 0.74 | % | 3.46 | % | 0.95 | % | $ | 10,180 | 138 | % | |||||||||||||||||||
| Year Ended 12/31/16 | (0.30 | ) | $ | 9.94 | 6.45 | % | 0.74 | % | 2.50 | % | 0.99 | % | $ | 11,768 | 79 | % | |||||||||||||||||||
| Year Ended 12/31/15 | (0.35 | ) | $ | 9.63 | (0.74 | )% | 0.74 | % | 3.24 | % | 0.98 | % | $ | 13,217 | 41 | % | |||||||||||||||||||
See notes to financial statements.
75
Victory Portfolios | Notes to Financial Statements June 30, 2020 | ||||||
(Unaudited)
1. Organization:
Victory Portfolios (the "Trust") was organized on December 6, 1995 as a Delaware statutory trust as a successor to a company named "The Victory Portfolios," which was organized as a Massachusetts business trust on February 5, 1986. The Trust is registered under the Investment Company Act of 1940, as amended (the "1940 Act"), as an open-end investment company. The Trust is comprised of 42 funds and is authorized to issue an unlimited number of shares, which are units of beneficial interest with a par value of $0.001 per share. Each Fund is classified as diversified under the 1940 Act.
The accompanying financial statements are those of the following seven Funds (collectively, the "Funds" and individually, a "Fund").
Funds (Legal Name) | Funds (Short Name) | Investment Share Classes Offered | |||||||||
Victory INCORE Investment | INCORE Investment | Classes A, C, R and Y | |||||||||
Quality Bond Fund | Quality Bond Fund | ||||||||||
Victory INCORE Low Duration | INCORE Low Duration | Classes A, C, R and Y | |||||||||
Bond Fund | Bond Fund | ||||||||||
Victory High Yield Fund | High Yield Fund | Classes A, C, R and Y | |||||||||
Victory Tax-Exempt Fund | Tax-Exempt Fund | Classes A, C and Y | |||||||||
Victory High Income Municipal | High Income Municipal | Classes A, C and Y | |||||||||
Bond Fund | Bond Fund | ||||||||||
Victory Floating Rate Fund | Floating Rate Fund | Classes A, C, R and Y | |||||||||
Victory Strategic Income Fund | Strategic Income Fund | Classes A, C, R and Y | |||||||||
Each class of shares of a Fund has substantially identical rights and privileges except with respect to sales charges, fees paid under distribution plans, expenses allocable exclusively to each class of shares, voting rights on matters solely affecting a single class of shares, and the exchange privilege of each class of shares.
Under the Trust's organizational documents, its officers and trustees are indemnified against certain liabilities arising out of the performance of their duties to the Funds. In addition, in the normal course of business, the Funds enter into contracts with their vendors and others that provide for general indemnifications. The Funds' maximum exposure under these arrangements is unknown, as this would involve future claims that may be made against the Funds. However, based on experience, the Funds expect that risk of loss to be remote.
2. Significant Accounting Policies:
The following is a summary of significant accounting policies followed by the Trust in the preparation of its financial statements. The policies are in conformity with generally accepted accounting principles in the United States of America ("GAAP"). The preparation of financial statements in accordance with GAAP requires management to make estimates and assumptions that affect the reported amounts of assets and liabilities and disclosure of contingent assets and liabilities at the date of the financial statements and the reported amounts of income and expenses for the period. Actual results could differ from those estimates. The Funds follow the specialized accounting and reporting requirements under GAAP that are applicable to investment companies.
Investment Valuation:
The Funds record investments at fair value. Fair value is defined as the price that would be received to sell an asset or paid to transfer a liability in an orderly transaction between market participants at the measurement date.
76
Victory Portfolios | Notes to Financial Statements — continued June 30, 2020 | ||||||
(Unaudited)
The valuation techniques described below maximize the use of observable inputs and minimize the use of unobservable inputs in determining fair value. The inputs used for valuing the Funds' investments are summarized in the three broad levels listed below:
• Level 1 — quoted prices in active markets for identical securities
• Level 2 — other significant observable inputs (including quoted prices for similar securities or interest rates applicable to those securities, etc.)
• Level 3 — significant unobservable inputs (including the Funds' own assumptions in determining the fair value of investments)
Changes in valuation techniques may result in transfers in or out of an assigned level within the disclosure hierarchy. The inputs or methodologies used for valuation techniques are not necessarily an indication of the risk associated with entering into those investments.
Portfolio securities listed or traded on securities exchanges, including American Depositary Receipts ("ADRs") and Rights, are valued at the closing price on the exchange or system where the security is principally traded, if available, or at the Nasdaq Official Closing Price. If there have been no sales for that day on the exchange or system, then a security is valued at the last available bid quotation on the exchange or system where the security is principally traded. In each of these situations, valuations are typically categorized as Level 1 in the fair value hierarchy.
Futures contracts are valued at the settlement price established each day by the board of trade or an exchange on which they are traded. These valuations are typically categorized as Level 1 in the fair value hierarchy.
Swap agreements are valued at the mean between the current bid and ask prices. To the extent this model is utilized, these valuations are considered as Level 2 in the fair value hierarchy.
Debt securities of United States ("U.S.") issuers (other than short-term investments maturing in 60 days or less), including corporate and municipal securities, are valued on the basis of bid valuations provided by dealers or an independent pricing service approved by the Trust's Board of Trustees (the "Board"). Short-term investments maturing in 60 days or less may be valued at amortized cost, which approximates market value. Under the amortized cost method, premium or discount, if any, is amortized or accreted, respectively, on a constant basis to the maturity of the security. In each of these situations, valuations are typically categorized as Level 2 in the fair value hierarchy.
Investments for which there are no such quotations, or for which quotations do not appear reliable, are valued at fair value in accordance with procedures established by and under the general supervision and responsibility of the Trust's Board. These valuations are typically categorized as Level 2 or Level 3 in the fair value hierarchy, based on the observability of inputs used to determine the fair value.
A summary of the valuations as of June 30, 2020, based upon the three levels defined above, is included in the table below while the breakdown, by category, of investments is disclosed on the Schedules of Portfolio Investments.
LEVEL 1 | LEVEL 2 | LEVEL 3 | Total | ||||||||||||||||
INCORE Investment Quality Bond Fund | |||||||||||||||||||
Asset-Backed Securities | $ | — | $ | 202,385 | $ | — | $ | 202,385 | |||||||||||
Collateralized Mortgage Obligations | — | 812,509 | — | 812,509 | |||||||||||||||
Corporate Bonds | — | 17,020,405 | — | 17,020,405 | |||||||||||||||
Residential Mortgage-Backed Securities | — | 151,807 | — | 151,807 | |||||||||||||||
U.S. Government Mortgage-Backed Agencies | — | 9,665,504 | — | 9,665,504 | |||||||||||||||
U.S. Treasury Obligations | — | 143,164 | — | 143,164 | |||||||||||||||
Collateral for Securities Loaned | 858,967 | — | — | 858,967 | |||||||||||||||
Total | $ | 858,967 | $ | 27,995,774 | $ | — | $ | 28,854,741 | |||||||||||
Other Financial Investments^ | |||||||||||||||||||
Assets: | |||||||||||||||||||
Futures Contracts | $ | 4,865 | $ | — | $ | — | $ | 4,865 | |||||||||||
Liabilities: | |||||||||||||||||||
Futures Contracts | (8,616 | ) | — | — | (8,616 | ) | |||||||||||||
Total | $ | (3,751 | ) | $ | — | $ | — | $ | (3,751 | ) | |||||||||
77
Victory Portfolios | Notes to Financial Statements — continued June 30, 2020 | ||||||
(Unaudited)
LEVEL 1 | LEVEL 2 | LEVEL 3 | Total | ||||||||||||||||
INCORE Low Duration Bond Fund | |||||||||||||||||||
Asset-Backed Securities | $ | — | $ | 15,793,343 | $ | — | $ | 15,793,343 | |||||||||||
Collateralized Mortgage Obligations | — | 11,626,536 | — | 11,626,536 | |||||||||||||||
Corporate Bonds | — | 126,347,094 | — | 126,347,094 | |||||||||||||||
Residential Mortgage-Backed Securities | — | 12,717,122 | — | 12,717,122 | |||||||||||||||
U.S. Government Mortgage-Backed Agencies | — | 25,468,435 | — | 25,468,435 | |||||||||||||||
U.S. Treasury Obligations | — | 53,197,021 | — | 53,197,021 | |||||||||||||||
Collateral for Securities Loaned | 1,630,881 | — | — | 1,630,881 | |||||||||||||||
Total | $ | 1,630,881 | $ | 245,149,551 | $ | — | $ | 246,780,432 | |||||||||||
Other Financial Investments^ | |||||||||||||||||||
Liabilities: | |||||||||||||||||||
Futures Contracts | $ | (17,805 | ) | $ | — | $ | — | $ | (17,805 | ) | |||||||||
Total | $ | (17,805 | ) | $ | — | $ | — | $ | (17,805 | ) | |||||||||
High Yield Fund | |||||||||||||||||||
Common Stocks | $ | 1,325,393 | $ | — | $ | — | $ | 1,325,393 | |||||||||||
Senior Secured Loans | — | 34,790,747 | — | 34,790,747 | |||||||||||||||
Corporate Bonds | — | 170,686,647 | — | 170,686,647 | |||||||||||||||
Collateral for Securities Loaned | 25,468,284 | — | — | 25,468,284 | |||||||||||||||
Total | $ | 26,793,677 | $ | 205,477,394 | $ | — | $ | 232,271,071 | |||||||||||
Tax-Exempt Fund | |||||||||||||||||||
Municipal Bonds | $ | — | $ | 59,534,589 | $ | — | $ | 59,534,589 | |||||||||||
Total | $ | — | $ | 59,534,589 | $ | — | $ | 59,534,589 | |||||||||||
High Income Municipal Bond Fund | |||||||||||||||||||
Municipal Bonds | $ | — | $ | 36,130,409 | $ | — | $ | 36,130,409 | |||||||||||
Exchange-Traded Funds | 1,541,280 | — | — | 1,541,280 | |||||||||||||||
Total | $ | 1,541,280 | $ | 36,130,409 | $ | — | $ | 37,671,689 | |||||||||||
Floating Rate Fund | |||||||||||||||||||
Senior Secured Loans | $ | — | $ | 408,556,407 | $ | — | $ | 408,556,407 | |||||||||||
Corporate Bonds | — | 79,761,804 | — | 79,761,804 | |||||||||||||||
Total | $ | — | $ | 488,318,211 | $ | — | $ | 488,318,211 | |||||||||||
Strategic Income Fund | |||||||||||||||||||
Asset-Backed Securities | $ | — | $ | 3,287,088 | $ | — | $ | 3,287,088 | |||||||||||
Collateralized Mortgage Obligations | — | 3,269,332 | — | 3,269,332 | |||||||||||||||
Corporate Bonds | — | 50,133,965 | — | 50,133,965 | |||||||||||||||
Residential Mortgage-Backed Securities | — | 316,601 | — | 316,601 | |||||||||||||||
U.S. Government Mortgage-Backed Agencies | — | 154,576 | — | 154,576 | |||||||||||||||
U.S. Treasury Obligations | — | 18,257,200 | — | 18,257,200 | |||||||||||||||
Exchange-Traded Funds | 1,469,160 | — | — | 1,469,160 | |||||||||||||||
Collateral for Securities Loaned | 4,513,302 | — | — | 4,513,302 | |||||||||||||||
Total | $ | 5,982,462 | $ | 75,418,762 | $ | — | $ | 81,401,224 | |||||||||||
Other Financial Investments^ | |||||||||||||||||||
Assets: | |||||||||||||||||||
Futures Contracts | $ | 69,350 | $ | — | $ | — | $ | 69,350 | |||||||||||
Liabilities: | |||||||||||||||||||
Futures Contracts | (110,359 | ) | — | — | (110,359 | ) | |||||||||||||
Total | $ | (41,009 | ) | $ | — | $ | — | $ | (41,009 | ) | |||||||||
^ Futures Contracts are valued at the unrealized appreciation (depreciation) on the investment.
78
Victory Portfolios | Notes to Financial Statements — continued June 30, 2020 | ||||||
(Unaudited)
For the six months ended June 30, 2020, there were no transfers in or out of the Level 3 fair value hierarchy.
Securities Purchased on a When-Issued Basis:
The Funds may purchase securities on a when-issued basis. When-issued securities are securities purchased for delivery beyond normal settlement periods at a stated price and/or yield, thereby involving the risk that the price and/or yield obtained may be more or less than those available in the market when delivery takes place. At the time a Fund makes the commitment to purchase a security on a when-issued basis, the Fund records the transaction and reflects the value of the security in determining net asset value. No interest accrues to the Fund until the transaction settles and payment takes place. Normally, the settlement date occurs within one month of the purchase. A segregated account is established and the Fund maintains cash and/or marketable securities at least equal in value to commitments for when-issued securities. If a Fund owns when-issued securities, these values are included in Payable for investments purchased on the accompanying Statements of Assets and Liabilities and the segregated assets are identified on the Schedules of Portfolio Investments.
Municipal Obligations:
The values of municipal obligations can fluctuate and may be affected by adverse tax, legislative, or political changes, and by financial developments affecting municipal issuers. Payment of municipal obligations may depend on a relatively limited source of revenue, resulting in greater credit risk. Future changes in federal tax laws or the activity of an issuer may adversely affect the tax-exempt status of municipal obligations.
Mortgage-Related and Asset-Backed Securities:
The values of some mortgage-related or asset-backed securities may be particularly sensitive to changes in prevailing interest rates. Early repayment of principal on some mortgage-related securities may expose a Fund to a lower rate of return upon reinvestment of principal. The values of mortgage- and asset-backed securities depend in part on the credit quality and adequacy of the underlying assets or collateral and may fluctuate in response to the market's perception of these factors as well as current and future repayment rates. Some mortgage-backed securities are backed by the full faith and credit of the U.S. government (e.g., mortgage-backed securities issued by the Government National Mortgage Association, commonly known as "Ginnie Mae"), while other mortgage-backed securities (e.g., mortgage-backed securities issued by the Federal National Mortgage Association and the Federal Home Loan Mortgage Corporation, commonly known as "Fannie Mae" and "Freddie Mac, respectively"), are backed only by the credit of the government entity issuing them. In addition, some mortgage-backed securities are issued by private entities and, as such, are not guaranteed by the U.S. government or any agency or instrumentality of the U.S. government.
Loans:
Floating rate loans in which a Fund invests are primarily "senior" loans. Senior floating rate loans typically hold a senior position in the capital structure of the borrower, are typically secured by specific collateral, and have a claim on the assets and/or stock of the borrower that is senior to that held by subordinated debtholders and stockholders of the borrower. While these protections may reduce risk, these investments still present significant credit risk. A significant portion of a Fund's floating rate investments may be issued in connection with highly leveraged transactions such as leveraged buyouts, leveraged recapitalization loans, and other types of acquisition financing. Obligations in these types of transactions are subject to greater credit risk (including default and bankruptcy) than many other investments and may be, or become, illiquid. See the note below regarding below-investment-grade securities.
A Fund may purchase second lien loans (secured loans with a claim on collateral subordinate to a senior lender's claim on such collateral), fixed rate loans, unsecured loans, and other debt obligations.
79
Victory Portfolios | Notes to Financial Statements — continued June 30, 2020 | ||||||
(Unaudited)
Transactions in loans often settle on a delayed basis, and a Fund may not receive the proceeds from the sale of a loan or pay for a loan purchase for a substantial period of time after entering into the transactions.
Below-Investment-Grade Securities:
Certain Funds may invest in below-investment-grade securities (i.e., lower-quality, "junk" debt), which are subject to various risks. Lower-quality debt is considered to be speculative because it is less certain that the issuer will be able to pay interest or repay the principal than in the case of investment grade debt. These securities can involve a substantially greater risk of default than higher-rated securities, and their values can decline significantly over short periods of time. Lower-quality debt securities tend to be more sensitive to adverse news about their issuers, the market and the economy in general, than higher-quality debt securities. The market for these securities can be less liquid, especially during periods of recession or general market decline.
Real Estate Investment Trusts ("REITs"):
The Funds may invest in REITs, which report information on the source of their distributions annually. REITs are pooled investment vehicles that invest primarily in income-producing real estate or real-estate related loans or interests (such as mortgages). Certain distributions received from REITs during the year are recorded as realized gains or return of capital as estimated by the Funds or when such information becomes known.
Derivative Instruments:
Futures Contracts:
The Funds may enter into contracts for the future delivery of securities or foreign currencies and futures contracts based on a specific security, class of securities, foreign currency or an index, and purchase or sell options on any such futures contracts. A futures contract on a securities index is an agreement obligating either party to pay, and entitling the other party to receive, while the contract is outstanding, cash payments based on the level of a specified securities index. No physical delivery of the underlying asset is made. A Fund may enter into futures contracts in an effort to hedge against market risks. The acquisition of put and call options on futures contracts will give the Fund the right (but not the obligation), for a specified price, to sell or to purchase the underlying futures contract, upon exercise of the option, at any time during the option period. Futures transactions involve brokerage costs and require the Fund to segregate assets to cover contracts that would require it to purchase securities or currencies. A good faith margin deposit, known as initial margin, of cash or government securities with a broker or custodian is required to initiate and maintain open positions in futures contracts. Subsequent payments, known as variation margin, are made or received by the Fund based on the change in the market value of the position and are recorded as unrealized appreciation or depreciation until the contract is closed out, at which time the gain or loss is realized. A Fund may lose the expected benefit of futures transactions if interest rates, exchange rates or securities prices change in an unanticipated manner. Such unanticipated changes may also result in lower overall performance than if the Fund had not entered into any futures transactions. In addition, the value of a Fund's futures positions may not prove to be perfectly or even highly correlated with the value of its portfolio securities or foreign currencies, limiting a Fund's ability to hedge effectively against interest rate, exchange rate and/or market risk and giving rise to additional risks. There is no assurance of liquidity in the secondary market for purposes of closing out futures positions. The collateral held by the Funds is presented on the Statements of Assets and Liabilities under Deposits with brokers for futures contracts.
During the six months ended June 30, 2020, the Funds entered into futures contracts primarily for the strategy of hedging or other purposes, including but not limited to, providing liquidity and equitizing cash.
80
Victory Portfolios | Notes to Financial Statements — continued June 30, 2020 | ||||||
(Unaudited)
Credit Derivatives:
The Funds may enter into credit derivatives, including centrally cleared credit default swaps on individual obligations or credit indices. The Funds may use these investments (i) as alternatives to direct long or short investment in a particular security or securities, (ii) to adjust a Fund's asset allocation or risk exposure, or (iii) for hedging purposes. The use by a Fund of credit default swaps may have the effect of creating a short position in a security. Credit derivatives can create investment leverage and may create additional investment risks that may subject a Fund to greater volatility than investments in more traditional securities, as described in the Funds' Statement of Additional Information.
Centrally cleared credit default swap ("CDS") agreements on credit indices involve one party making a stream of payments (referred to as the buyer of protection) to another party (the seller of protection) in exchange for the right to receive a specified return in the event of a write-down, principal shortfall, interest shortfall or default of all or part of the referenced entities comprising the credit index. A credit index is a basket of credit instruments or exposures designed to be representative of a specific sector of the credit market as a whole. These indices are made up of reference credits that are judged by a poll of dealers to be the most liquid entities in the CDS.
The counterparty risk for cleared swap agreements is generally lower than uncleared over-the-counter swap agreements because generally a clearing organization becomes substituted for each counterparty to a cleared swap agreement and, in effect, guarantees each party's performance under the contract as each party to a trade looks only to the clearing organization for performance of financial obligations. However, there can be no assurance that the clearing organization, or its members, will satisfy its obligations to the Funds.
The Funds may enter into CDS agreements either as a buyer or seller. The Funds may buy protection under a CDS to attempt to mitigate the risk of default or credit quality deterioration in one or more individual holdings or in a segment of the fixed income securities market. The Funds may sell protection under a CDS in an attempt to gain exposure to an underlying issuer's credit quality characteristics without investing directly in that issuer. For swaps entered with an individual counterparty, the Funds bear the risk of loss of the uncollateralized amount expected to be received under a CDS agreement in the event of the default or bankruptcy of the counterparty. CDS agreements are generally valued at a price at which the counterparty to such agreement would terminate the agreement. The Funds may also enter into cleared swaps.
Upon entering into a cleared CDS, the Funds may be required to deposit with the broker an amount of cash or cash equivalents in the range of approximately 3% to 6% of the notional amount for CDS on high yield debt issuers (this amount is subject to change by the clearing organization that clears the trade). This amount, known as "initial margin," is in the nature of a performance bond or good faith deposit on the CDS and is returned to the Funds upon termination of the CDS, assuming all contractual obligations have been satisfied. Subsequent payments, known as "variation margin," to and from the broker will be made daily as the price of the CDS fluctuates, making the long and short positions in the CDS contract more or less valuable, a process known as "marking-to-market." The premium (discount) payments are built into the daily price of the CDS and thus are amortized through the variation margin. The variation margin payment also includes the daily portion of the periodic payment stream.
The maximum potential amount of future payments (undiscounted) that the Fund as a seller of protection could be required to make under a CDS agreement equals the notional amount of the agreement. Notional amounts of each individual CDS agreement outstanding as of period end for which a Fund is the seller of protection are disclosed on the Schedule of Portfolio Investments. These potential amounts would be partially offset by any recovery values of the respective referenced obligations, upfront payments received upon entering into the agreement, periodic interest payments, or net amounts received from the settlement of buy protection CDS agreements entered into by the Funds for the same referenced entity or entities.
81
Victory Portfolios | Notes to Financial Statements — continued June 30, 2020 | ||||||
(Unaudited)
During the six months ended June 30, 2020, the INCORE Investment Quality Bond Fund, INCORE Low Duration Bond Fund and Strategic Income Fund entered into centrally cleared CDS agreements primarily for the strategy of asset allocation and risk exposure management.
Offsetting of Financial Assets and Derivatives Assets:
The Funds are subject to various Master Netting Arrangements, which govern the terms of certain transactions with select counterparties. The Master Netting Arrangements allow the Funds to close out and net total exposure to a counterparty in the event of a default with respect to all the transactions governed under a single agreement with a counterparty. The Master Netting Arrangements also specify collateral posting arrangements at pre-arranged exposure levels. Under the Master Netting Arrangements, collateral is routinely transferred if the total net exposure to certain transactions (net of existing collateral already in place) governed under the relevant Master Netting Arrangement with a counterparty in a given account exceeds a specified threshold depending on the counterparty and the type of Master Netting Arrangement.
The table below, as of June 30, 2020, discloses both gross information and net information about instruments and transactions eligible for offset on the Statements of Assets and Liabilities and instruments and transactions that are subject to an agreement similar to a master netting agreement as well as amounts related to collateral held at clearing brokers and counterparties.
| Gross Amounts of Recognized Assets | Gross Amounts Available for Offset | Net Amounts Presented in the Statements of Assets and Liabilities | Cash Collateral Received | Net Amount | |||||||||||||||||||
INCORE Investment Quality Bond Fund | |||||||||||||||||||||||
| Futures Goldman Sachs & Co. | $ | 1,115 | $ | — | $ | 1,115 | $ | — | $ | 1,115 | |||||||||||||
INCORE Low Duration Bond Fund | |||||||||||||||||||||||
| Futures Goldman Sachs & Co. | 20,320 | — | 20,320 | — | 20,320 | ||||||||||||||||||
Strategic Income Fund | |||||||||||||||||||||||
| Futures Goldman Sachs & Co. | 29,991 | — | 29,991 | — | 29,991 | ||||||||||||||||||
| Gross Amounts of Recognized Liabilities | Gross Amounts Available for Offset | Net Amounts Presented in the Statements of Assets and Liabilities | Cash Collateral Pledged* | Net Amount | |||||||||||||||||||
INCORE Investment Quality Bond Fund | |||||||||||||||||||||||
| Futures Goldman Sachs & Co. | $ | 438 | $ | — | $ | 438 | $ | (438 | ) | $ | — | ||||||||||||
Strategic Income Fund | |||||||||||||||||||||||
| Futures Goldman Sachs & Co. | 30,629 | — | 30,629 | (30,629 | ) | — | |||||||||||||||||
* Cash collateral pledged may be in excess of the amounts shown in the table. The total cash collateral pledged by each Fund is disclosed on the Statements of Assets and Liabilities.
82
Victory Portfolios | Notes to Financial Statements — continued June 30, 2020 | ||||||
(Unaudited)
Summary of Derivative Instruments:
The following table summarizes the fair values of derivative instruments on the Statements of Assets and Liabilities, categorized by risk exposure, as of June 30, 2020:
Assets | Liabilities | ||||||||||
| Variation Margin Receivable on Open Futures Contracts* | Variation Margin Payable on Open Futures Contracts* | ||||||||||
Interest Rate Risk Exposure: | |||||||||||
INCORE Investment Quality Bond Fund | $ | 4,865 | $ | 8,616 | |||||||
INCORE Low Duration Bond Fund | — | 17,805 | |||||||||
Strategic Income Fund | 69,350 | 110,359 | |||||||||
* Includes cumulative appreciation/depreciation of futures contracts and credit default swap agreements as reported on the Schedules of Portfolio Investments. Only current day's variation margin for futures contracts are reported within the Statements of Assets and Liabilities.
The following table presents the effect of derivative instruments on the Statements of Operations, categorized by risk exposure, for the six months ended June 30, 2020:
| Net Realized Gains (Losses) on Derivatives Recognized as a Result from Operations | Net Change in Unrealized Appreciation/Depreciation on Derivatives Recognized as a Result of Operations | ||||||||||||||||||
| Net Realized Gains (Losses) from Futures Contracts | Net Realized Gains (Losses) from Swap Agreements | Net Change in Unrealized Appreciation/ Depreciation on Futures Contracts | Net Change in Unrealized Appreciation/ Depreciation on Swap Agreements | ||||||||||||||||
Credit Risk Exposure: | |||||||||||||||||||
INCORE Investment Quality Bond Fund | $ | — | $ | (91,757 | ) | $ | — | $ | (14,094 | ) | |||||||||
INCORE Low Duration Bond Fund | — | (449,155 | ) | — | (120,813 | ) | |||||||||||||
Strategic Income Fund | — | (185,936 | ) | — | 20,150 | ||||||||||||||
Interest Rate Risk Exposure: | |||||||||||||||||||
INCORE Investment Quality Bond Fund | 206,746 | — | 1,142 | — | |||||||||||||||
INCORE Low Duration Bond Fund | 1,028,458 | — | (21,991 | ) | — | ||||||||||||||
Strategic Income Fund | (183,191 | ) | — | 29,077 | — | ||||||||||||||
All open derivative positions at period end are reflected in each respective Fund's Schedule of Portfolio Investments. The volume associated with derivative positions in the INCORE Investment Quality Bond Fund, INCORE Low Duration Bond Fund and Strategic Income Fund was 11%, 26% and 5% for futures contracts, respectively, and 4%, 5% and 1% for swap agreements, respectively, based on average monthly notional amounts in comparison to net assets during the year.
Investment Transactions and Related Income:
Changes in holdings of investments are accounted for no later than one business day following the trade date. For financial reporting purposes, however, investment transactions are accounted for on trade date on the last business day of the reporting period. Interest income is determined on the basis of coupon interest accrued using the effective interest method which adjusts, where applicable, the amortization of premiums or accretion of discounts. Dividend income is recorded on the ex-dividend date. Gains or losses realized on sales of securities are recorded on the identified cost basis. Paydown gains or losses on applicable securities, if any, are recorded as components of Interest income on the Statements of Operations.
83
Victory Portfolios | Notes to Financial Statements — continued June 30, 2020 | ||||||
(Unaudited)
Certain Funds may receive other income from investment in loan assignments and/or unfunded commitments, including amendment fees, consent fees, and commitment fees. These fees are recorded as income when received by the Fund. These amounts are included in Interest Income on the Statements of Operations.
Withholding taxes on interest, dividends and gains as a result of certain investments in ADRs by the Funds have been provided for in accordance with each investment's applicable country's tax rules and rates.
Securities Lending:
The Trust has entered into a Master Securities Lending Agreement ("MSLA") with Citibank, N.A. ("Citibank" or the "Agent"). Under the terms of the MSLA, the Funds may lend securities to certain broker-dealers and banks in exchange for collateral in the amount of at least 102% of the value of U.S. securities loaned or at least 105% of the value of non-U.S. securities loaned, marked-to-market daily. Any collateral shortfalls associated with increases in the valuation of the securities loaned are adjusted the next business day. The collateral can be received in the form of cash collateral and/or non-cash collateral. Non-cash collateral can include U.S. Government Securities, letters of credit and certificates of deposit. The cash collateral is invested in short-term instruments or cash equivalents, primarily open-end investment companies, as noted on the Funds' Schedules of Portfolio Investments. The Trust does not have effective control of the non-cash collateral and therefore it is not disclosed on the Funds' Schedules of Portfolio Investments. During the time portfolio securities are on loan, the borrower will pay the Funds any dividends or interest paid on such securities plus any fee negotiated between the parties to the lending agreement. The Funds also earn a return from the collateral. The Funds pay the Agent various fees in connection with the investment of cash collateral and fees based on the investment income received from securities lending activities. Securities lending income (net of these fees) is disclosed on the Statements of Operations. Although risk is mitigated by the collateral, the Funds could experience a delay in recovering their securities and possible loss of income or value if the borrower fails to return them.
Securities lending transactions are entered into by a Fund under the MSLA, which permits the Fund, under certain circumstances such as an event of default, to offset amounts payable by the Fund to the same counterparty against amounts receivable from the counterparty to create a net payment due to or from the Fund.
The following table is a summary of the Funds' securities lending transactions which are subject to offset under the MSLA as of June 30, 2020. These transactions are accounted for as secured borrowings with an overnight and continuous contractual maturity for cash collateral and greater than overnight and continuous contractual maturity for non-cash collateral.
| Gross Amount of Recognized Assets (Value of | Value of Cash | Value of Non-cash Collateral Received by Maturity | |||||||||||||||||||||||||
| Securities on Loan) | Collateral Received* | <30 | Between 30 & 90 days | 90 days | Net Amount | ||||||||||||||||||||||
| INCORE Investment Quality Bond Fund | $ | 832,694 | $ | 832,694 | $ | — | $ | — | $ | — | $ | — | |||||||||||||||
| INCORE Low Duration Bond Fund | 1,573,880 | 1,573,880 | — | — | — | — | |||||||||||||||||||||
High Yield Fund | 24,190,205 | 24,190,205 | — | — | — | — | |||||||||||||||||||||
Strategic Income Fund | 3,209,796 | 3,209,796 | — | — | — | — | |||||||||||||||||||||
* Collateral received in excess of the market value of securities on loan is not presented in this table. The total cash collateral received by each Fund is disclosed on the Statements of Assets and Liabilities.
84
Victory Portfolios | Notes to Financial Statements — continued June 30, 2020 | ||||||
(Unaudited)
Foreign Currency Translations:
The accounting records of the Funds are maintained in U.S. dollars. Investment securities and other assets and liabilities of a Fund denominated in a foreign currency are translated into U.S. dollars at current exchange rates. Purchases and sales of securities, income receipts and expense payments are translated into U.S. dollars at the exchange rates on the date of the transactions. The Funds do not isolate the portion of the results of operations resulting from changes in foreign exchange rates on investments from fluctuations arising from changes in market prices of securities held. Such fluctuations are disclosed as Net change in unrealized appreciation/depreciation on investment securities and foreign currency translations on the Statements of Operations. Any realized gains or losses from these fluctuations are disclosed as Net realized gains (losses) from investment securities and foreign currency translations on the Statements of Operations.
Foreign Taxes:
The Funds may be subject to foreign taxes related to foreign income received (a portion of which may be reclaimable), capital gains on the sale of securities, and certain foreign currency transactions. All foreign taxes are recorded in accordance with the applicable regulations and rates that exist in the foreign jurisdictions in which the Funds invest.
Distributions to Shareholders:
Dividends from net investment income, if any, are declared and paid monthly for the Funds. Distributable net realized gains, if any, are declared and distributed at least annually from each Fund. The amounts of dividends from net investment income and distributions from net realized gains (collectively, distributions to shareholders) are determined in accordance with federal income tax regulations, which may differ from GAAP. To the extent these "book/tax" differences are permanent in nature (e.g., net operating loss and distribution reclassification), such amounts are reclassified within the components of net assets based on their federal tax-basis treatment; temporary differences (e.g., wash sales) do not require reclassification. To the extent dividends and distributions exceed net investment income and net realized gains for tax purposes, they are reported as distributions of capital. Net investment losses incurred by a Fund may be reclassified as an offset to capital on the accompanying Statements of Assets and Liabilities.
Federal Income Taxes:
It is the policy of each Fund to continue to qualify as a regulated investment company by complying with the provisions available to certain investment companies, as defined in applicable sections of the Internal Revenue Code, and to make distributions of net investment income and net realized gains sufficient to relieve it from all, or substantially all, federal income taxes. Accordingly, no provision for federal income taxes is required in the financial statements. The Funds have a tax year end of December 31.
Management of the Funds has reviewed tax positions taken in tax years that remain subject to examination by all major tax jurisdictions, including federal (i.e., the last four tax years, which includes the current fiscal tax year end). Management believes that there is no tax liability resulting from unrecognized tax benefits related to uncertain tax positions taken.
Allocations:
Expenses directly attributable to a Fund are charged to the Fund, while expenses which are attributable to more than one fund in the Trust, or jointly with an affiliated trust, are allocated among the respective funds in the Trust and/or affiliated trust based upon net assets or another appropriate basis.
Income, expenses (other than class-specific expenses such as transfer agent fees, state registration fees, printing fees and 12b-1 fees), and realized and unrealized gains or losses on investments are allocated to each class of shares based on its relative net assets on the date income is earned or expenses and realized and unrealized gains and losses are incurred.
85
Victory Portfolios | Notes to Financial Statements — continued June 30, 2020 | ||||||
(Unaudited)
3. Purchases and Sales of Securities:
Purchases and sales of securities (excluding securities maturing less than one year from acquisition) for the six months ended June 30, 2020 were as follows:
| Purchases (excluding U.S. Government Securities) | Sales (excluding U,S, Government Securities) | Purchases of U.S. Government Securities | Sales of U.S. Government Securities | ||||||||||||||||
| INCORE Investment Quality Bond Fund | $ | 5,956,039.45 | $ | 3,058,944.66 | $ | 4,353,273.64 | $ | 9,974,545.46 | |||||||||||
| INCORE Low Duration Bond Fund | 34,973,649 | 38,240,233 | 64,130,133 | 73,048,141 | |||||||||||||||
High Yield Fund | 168,618,682 | 113,833,773 | — | — | |||||||||||||||
Tax-Exempt Fund | 10,367,009 | 13,516,593 | — | — | |||||||||||||||
| High Income Municipal Bond Fund | 8,771,968 | 12,043,346 | — | — | |||||||||||||||
Floating Rate Fund | 151,199,856 | 188,381,883 | — | — | |||||||||||||||
Strategic Income Fund | 51,214,083 | 27,089,561 | 63,180,620 | 66,531,479 | |||||||||||||||
4. Fees and Transactions with Affiliates and Related Parties:
Investment advisory services are provided to the Funds by Victory Capital Management Inc. ("VCM" or the "Adviser"), a New York corporation registered as an investment adviser with the Securities and Exchange Commission ("SEC"). The Adviser is a wholly owned indirect subsidiary of Victory Capital Holdings, Inc., a publicly traded Delaware corporation and a wholly owned direct subsidiary of Victory Capital Operating, LLC.
VCM has entered into a Sub-Advisory Agreement with Park Avenue Institutional Advisers LLC ("Park Avenue"). Park Avenue is responsible for providing day-to-day investment advisory services to the High Yield Fund, the Floating Rate Fund and the Strategic Income Fund, subject to the oversight of the Board. Prior to April 2020, Park Avenue provided investment advisory services to the Tax-Exempt Fund and the High Income Municipal Bond Fund. Sub-investment advisory fees are paid by VCM to Park Avenue and do not represent a separate or additional expense to the Funds.
Under the terms of the Investment Advisory Agreement, the Adviser is entitled to receive fees based on a percentage of the average daily net assets of each Fund. The rates at which the Adviser is paid by each Fund are included in the table below. The Adviser may use its resources to assist with the Funds' distribution and marketing expenses.
Flat Rate | |||||||
INCORE Investment Quality Bond Fund | 0.50 | % | |||||
INCORE Low Duration Bond Fund | 0.45 | % | |||||
High Yield Fund | 0.60 | % | |||||
Tax-Exempt Fund | 0.50 | % | |||||
High Income Municipal Bond Fund | 0.50 | % | |||||
Floating Rate Fund | 0.65 | % | |||||
Strategic Income Fund | 0.60 | % | |||||
VCM also serves as the Funds' administrator and fund accountant. Under an Administration and Fund Accounting Agreement, VCM is paid for its services an annual fee at a rate of 0.08% of the first $15 billion in average daily net assets of the Trust, Victory Variable Insurance Funds and Victory Portfolios II (collectively, the "Victory Funds Complex"), 0.05% of the average daily net assets above $15 billion to $30 billion of the Victory Funds Complex and 0.04% of the average daily net assets over $30 billion of the Victory Funds Complex.
86
Victory Portfolios | Notes to Financial Statements — continued June 30, 2020 | ||||||
(Unaudited)
Citi Fund Services Ohio, Inc. ("Citi"), an affiliate of Citibank, acts as sub-administrator and sub-fund accountant to the Funds pursuant to a Sub-Administration and Sub-Fund Accounting Services Agreement between VCM and Citi. VCM pays Citi a fee for providing these services. The Funds reimburse VCM and Citi for reasonable out-of-pocket expenses incurred in providing these services and certain other expenses specifically allocated to the Funds under the Fund Administration, Servicing, and Accounting Agreement. Amounts paid by the Funds to reimburse VCM for expenses incurred during the six months ended June 30, 2020, are reflected on the Statements of Operations as Sub-Administration fees.
Citibank acts as the custodian of the Funds' assets pursuant to the Global Custodial Services Agreement (the "Custody Agreement"). Citibank's responsibilities include safeguarding and controlling the Funds' cash and securities, handling the receipt and delivery of securities, and collecting interest and dividends on the Funds' investments. Pursuant to the Custody Agreement, Citibank also maintains original entry documents and books of record and general ledgers; posts cash receipts and disbursements; and records purchases and sales based upon communications from the Adviser. Citibank may, with the approval of a Fund and at its own expense, open and maintain a sub-custody account or accounts on behalf of a Fund, provided that it shall remain liable for the performance of all of its duties under the Custody Agreement.
FIS Investor Services, LLC ("FIS") serves as the Funds' transfer agent. Under the Transfer Agent Agreement, the Trust pays FIS a fee for its services and reimburses FIS for all of their reasonable out-of-pocket expenses incurred in providing these services.
The Chief Compliance Officer ("CCO") is an employee of the Adviser, which pays the compensation of the CCO and his support staff. The Trust has entered into an agreement to provide compliance services with the Adviser, pursuant to which the Adviser furnishes its compliance personnel, including the services of the CCO, and other resources reasonably necessary to provide the Trust with compliance oversight services related to the design, administration and oversight of a compliance program for the Trust in accordance with Rule 38a-1 under the 1940 Act. The Funds in the Victory Funds Complex, in aggregate, compensate the Adviser for these services.
The Victory Funds Complex pays an annual retainer to each Independent Trustee, plus an additional annual retainer to the Chairman of the Board. The aggregate amount of the fees and expenses of the Independent Trustees are allocated amongst all the funds in the Victory Funds Complex and are presented on the Statements of Operations.
Sidley Austin LLP provides legal services to the Trust.
Victory Capital Services, Inc. (the "Distributor"), an affiliate of the Adviser, serves as distributor for the continuous offering of the shares of the Funds pursuant to a Distribution Agreement between the Distributor and the Trust. Effective June 30, 2020, the Distributor's name was changed from Victory Capital Advisers, Inc.
Pursuant to the Distribution and Service Plans adopted in accordance with Rule 12b-1 under the 1940 Act, the Distributor may receive a monthly distribution and service fee, at an annual rate of up to 0.25% of the average daily net assets of Class A Shares, at an annual rate of up to 0.50% of the average daily net assets of Class R Shares and 1.00% of the average daily net assets of Class C Shares of the Funds. The distribution and service fees paid to the Distributor may be used by the Distributor to pay for activities primarily intended to result in the sale of Class A, Class R or Class C Shares of the Funds.
In addition, the Distributor is entitled to receive commissions on sales of the Class A Shares of the Funds. For the six months ended June 30, 2020, the Distributor received approximately $14,574 from commissions earned on sales of Class A Shares of the Funds.
The Adviser has entered into expense limitation agreements with certain Funds. Under the terms of the agreements, the Adviser has agreed to waive fees or reimburse certain expenses to the extent that ordinary operating expenses incurred by certain classes of a Fund in any fiscal year exceed the expense limit for such classes of the Fund. Such excess amounts will be the liability of the Adviser. Interest, taxes, brokerage commissions, other expenditures which are capitalized in accordance with GAAP, and other
87
Victory Portfolios | Notes to Financial Statements — continued June 30, 2020 | ||||||
(Unaudited)
extraordinary expenses not incurred in the ordinary course of a Fund's business are excluded from the expense limits. As of June 30, 2020, the expense limits (excluding voluntary waivers) are as follows:
In effect May 1, 2020 until April 30, 2021 | |||||||||||||||||||
| Class A Shares | Class C Shares | Class R Shares | Class Y Shares | ||||||||||||||||
INCORE Investment Quality Bond Fund | 0.90 | % | 1.77 | % | 1.30 | % | 0.66 | % | |||||||||||
INCORE Low Duration Bond Fund | 0.85 | % | 1.62 | % | 1.27 | % | 0.62 | % | |||||||||||
High Yield Fund | 1.00 | % | 1.70 | % | 1.35 | % | 0.76 | % | |||||||||||
Tax-Exempt Fund | 0.80 | % | 1.60 | % | N/A | 0.69 | % | ||||||||||||
High Income Municipal Bond Fund | 0.80 | % | 1.57 | % | N/A | 0.57 | % | ||||||||||||
Floating Rate Fund | 1.00 | % | 1.80 | % | 1.56 | % | 0.78 | % | |||||||||||
Strategic Income Fund | 0.95 | % | 1.74 | % | 1.34 | % | 0.74 | % | |||||||||||
The Funds have agreed to repay fees and expenses that were waived or reimbursed by the Adviser for a period up to three fiscal years after such waiver or reimbursement was made to the extent such payments or repayments would not cause the expenses of a class to exceed the original expense limitation in place at the time of the waiver or reimbursement or any expense limitation agreement in place at the time of repayment. Amounts repaid to the Adviser during the six months ended June 30, 2020, if any, are reflected on the Statements of Operations as Recoupment of prior expenses waived/reimbursed by Adviser.
As of June 30, 2020, the following amounts are available to be repaid to the Adviser:
| Expires December 30, 2020 | Expires December 30, 2021 | Expires December 30, 2022 | Expires December 31, 2023 | Total | |||||||||||||||||||
| INCORE Investment Quality Bond Fund | $ | 102,291 | $ | 107,641 | $ | 127,606 | $ | 67,213 | $ | 404,751 | |||||||||||||
| INCORE Low Duration Bond Fund | 217,933 | 110,273 | 163,391 | 77,592 | 569,189 | ||||||||||||||||||
High Yield Fund | 80,774 | 76,868 | 181,413 | 109,060 | 448,115 | ||||||||||||||||||
Tax-Exempt Fund | 122,100 | 114,539 | 132,065 | 67,239 | 435,943 | ||||||||||||||||||
| High Income Municipal Bond Fund | 139,397 | 121,563 | 132,417 | 63,898 | 457,275 | ||||||||||||||||||
Floating Rate Fund | 718,769 | 765,491 | 841,458 | 419,366 | 2,745,084 | ||||||||||||||||||
Strategic Income Fund | 90,313 | 98,810 | 110,089 | 52,801 | 352,013 | ||||||||||||||||||
The Adviser may voluntarily waive or reimburse additional fees to assist the Funds in maintaining competitive expense ratios. Voluntary waivers and reimbursements applicable to the Funds are not available to be recouped at a future time. The Adviser voluntarily waived $38,016 for the six months ended June 30, 2020 for the INCORE Low Duration Bond Fund.
Certain officers and/or interested trustees of the Funds are also officers and/or employees of the Adviser, Administrator, Fund Accountant, Sub-Administrator, Sub-Fund Accountant, and Legal Counsel.
5. Risks:
Each Fund may be subject to other risks in addition to these identified risks.
An investment in the Funds' shares represents an indirect investment in the securities owned by the Funds, some of which will be traded on a national securities exchange or in the over-the-counter markets. The value of the securities in which the Funds invest, like other market investments, may move up or down, sometimes rapidly and unpredictably. The value of the securities in which the Funds invest may affect the value of the Funds' shares. An investment in the Funds' shares at any point in time may be worth less than the original investment, even after taking into account the reinvestment of the Funds' distributions.
The Funds will be subject to credit risk with respect to the amount each expects to receive from counterparties for financial instruments entered into by the Funds. The Funds may be negatively
88
Victory Portfolios | Notes to Financial Statements — continued June 30, 2020 | ||||||
(Unaudited)
impacted if a counterparty becomes bankrupt or otherwise fails to perform its obligations due to financial difficulties. The Funds may experience significant delays in obtaining any recovery in bankruptcy or other reorganization proceeding and the Funds may obtain only limited recovery or may obtain no recovery in such circumstances. The Funds typically enter into transactions with counterparties whose credit ratings are investment grade, as determined by a nationally recognized statistical rating organization or, if unrated, judged by the Adviser to be of comparable quality.
An outbreak of respiratory disease called COVID-19 was first detected in China in December 2019 and subsequently spread internationally. The transmission of COVID-19 and efforts to contain its spread have resulted in international, national and local border closings and other significant travel restrictions and disruptions, significant disruptions to business operations, supply chains and consumer activity, significant challenges in healthcare service preparation and delivery, quarantines and general concern and uncertainty. These negative impacts have caused significant volatility and declines in global financial markets, which have caused losses for Fund investors during and subsequent to period end. The impact of the COVID-19 pandemic may be short term or may last for an extended period of time, and in either case could result in a substantial economic downturn or recession. Public health crises may exacerbate other pre-existing political, social, economic, market and financial risks. The extent of the impact to the financial performance of the Funds' investments will depend on future developments, including (i) the duration and spread of the outbreak, (ii) the restrictions and advisories, (iii) the effects on the financial markets, and (iv) the effects on the economy overall, all of which are highly uncertain and cannot be predicted.
6. Borrowing and Interfund Lending:
Line of Credit:
For the six months ended June 30, 2020, the Victory Funds Complex participated in a short-term demand note "Line of Credit" agreement with Citibank. The Line of Credit agreement with Citibank was renewed on June 29, 2020 with a termination date of June 28, 2021. Under the agreement with Citibank, the Victory Funds Complex and USAA Mutual Funds Complex, combined, may borrow up to $600 million, of which $300 million is committed and $300 million is uncommitted. $40 million of the Line of Credit is reserved for use by the Victory Floating Rate Fund (herein, the "Fund"), another series of the Victory Funds Complex, with that Fund paying the related commitment fees for that amount. The purpose of the agreement is to meet temporary or emergency cash needs. For the six months ended June 30, 2020, Citibank received an annual commitment fee of 0.15% on $300 million for providing the Line of Credit. For the six months ended June 30, 2020, Citibank earned approximately $225 thousand in commitment fees from the combined Victory Funds Complex and USAA Mutual Funds Complex. Each fund in the Victory Funds Complex pays a pro-rata portion of the commitment fees plus any interest (one month LIBOR plus one percent) on amounts borrowed. Effective June 29, 2020, under an amended Line of Credit agreement, Citibank will also receive an annual upfront fee of 0.10% on the $300 million committed line of credit. Each fund in the Victory Funds Complex will pay a pro-rata portion of the upfront fee. Interest charged to each Fund during the period, if applicable, is presented on the Statements of Operations under Line of credit fees.
The funds did not utilize the Line of Credit during the six months ended June 30, 2020.
Interfund Lending:
The Trust and Adviser rely on an exemptive order granted by the SEC in March 2017 (the "Order"), permitting the establishment and operation of an Interfund Lending Facility (the "Facility"). The Facility allows each Fund to directly lend money to and borrow money from any other Victory Fund relying upon the Order at rates beneficial to both the borrowing and lending funds. Advances under the Facility are allowed for temporary or emergency purposes, including the meeting of redemption requests that otherwise might require the untimely disposition of securities, and are subject to each Fund's borrowing restrictions. The interfund loan rate is determined, as specified in the Order, by averaging the current repurchase agreement rate and the current bank loan rate. As a Borrower, interest charged to each Fund during the period, if applicable, is presented on the Statements of Operations under Interest
89
Victory Portfolios | Notes to Financial Statements — continued June 30, 2020 | ||||||
(Unaudited)
expense on interfund lending. As a Lender, interest earned by each Fund during the period, if applicable, is presented on the Statements of Operations under Interfund lending income.
The average borrowing and lending for the days outstanding and average interest rate for each Fund during the six months ended June 30, 2020 were as follows:
| Borrower or Lender | Amount Outstanding at June 30, 2020 | Average Borrowing* | Days Borrowing Outstanding | Average Interest Rate* | Maximum Borrowing During the Period | ||||||||||||||||||||||
| INCORE Low Duration Bond Fund | Borrower | $ | — | $ | 2,282,000 | 1 | 1.02 | % | $ | 2,282,000 | |||||||||||||||||
Tax-Exempt Fund | Borrower | — | 1,721,667 | 3 | 1.82 | % | 2,024,000 | ||||||||||||||||||||
* For the six months ended June 30, 2020, based on the number of days borrowings were outstanding.
7. Federal Income Tax Information:
The tax character of distributions paid and the tax basis of current components of accumulated earnings (deficit) will be determined at the end of the current tax year ending December 31, 2020.
At December 31, 2019, the following Funds had net capital loss carryforwards ("CLCFs") as summarized in the table below.
| Short-Term Amount | Long-Term Amount | Total | |||||||||||||
INCORE Investment Quality Bond Fund | $ | — | $ | 580,846 | $ | 580,846 | |||||||||
INCORE Low Duration Bond Fund | 12,232,919 | 19,706,466 | 31,939,385 | ||||||||||||
High Yield Fund | 1,231,844 | 5,939,780 | 7,171,624 | ||||||||||||
Floating Rate Fund | 26,576,093 | 144,595,846 | 171,171,939 | ||||||||||||
Strategic Income Fund | — | 902,515 | 902,515 | ||||||||||||
During the tax year ended December 31, 2019, the INCORE Investment Quality Bond Fund, High Yield Fund, High Income Municipal Bond Fund and Strategic Income Fund utilized $438,646, $928,506, $262,516 and $886,217, respectively, of CLCFs.
8. Capital Contribution from Prior Custodian:
During 2016, certain Funds received notification from their prior custodian, State Street Bank and Trust ("State Street"), concerning issues related to billing on certain categories of expenses during the approximately 16-year period from 1998 through October 31, 2014. The over-billing primarily related to categories of expenses that involved an allocation of general costs among multiple clients.
State Street paid the refunded amounts during January 2017. Based on billing information received during 2016 from State Street and an analysis of any expense limitation agreements that were in place during the period of the activities in question, including the application of any recoupment provisions in such agreements, the Adviser received a portion of the refund.
The portion of the refund retained by the Funds was accounted for as a capital contribution and is reflected on the Financial Highlights as Capital Contribution from Prior Custodian, Net.
9. Fund Ownership:
Ownership of more than 25% of the voting securities of a fund creates presumptions of control of the fund, under section 2(a)(9) of the 1940 Act. As of June 30, 2020, the shareholder listed below held more than 25% of the shares outstanding of the Funds and may be deemed to control those Funds. Shareholders of record may hold Fund shares for the benefit of their customers.
Shareholder | Percent | ||||||||||
Strategic Income Fund | Guardian Life Insurance | 47.3 | % | ||||||||
90
Victory Portfolios | Supplemental Information June 30, 2020 | ||||||
(Unaudited)
Proxy Voting and Portfolio Holdings Information
Proxy Voting:
Information regarding the policies and procedures each Fund uses to determine how to vote proxies relating to portfolio securities is available without charge, upon request, by calling 800-539-3863. The information is also included in the Funds' Statement of Additional Information, which is available on the SEC's website at www.sec.gov.
Information relating to how the Funds voted proxies relating to portfolio securities held during the most recent twelve months ended June 30 is available on the SEC's website at www.sec.gov.
Availability of Schedules of Portfolio Investments:
The Trust files a complete list of Schedules of Portfolio Investments with the SEC for the first and third quarter of each fiscal year on Form N-PORT. Forms N-PORT are available on the SEC's web site at www.sec.gov.
Expense Examples
As a shareholder of the Funds, you may incur two types of costs: (1) transaction costs, including sales charges (loads) on purchases; and (2) ongoing costs, including management fees, distribution and service (12b-1) fees and other Fund expenses. These examples are intended to help you understand your ongoing costs (in dollars) of investing in the Funds and to compare these costs with the ongoing costs of investing in other mutual funds.
These examples are based on an investment of $1,000 invested at the beginning of the period and held for the entire period from January 1, 2020 through June 30, 2020.
The Actual Expense figures in the table below provide information about actual account values and actual expenses. You may use the information below, together with the amount you invested, to estimate the expenses that you paid over the period. Simply divide your account value by $1,000 (for example, an $8,600 account value divided by $1,000 = 8.6), then multiply the result by the number in the table under the heading entitled "Actual Expenses Paid During Period" to estimate the expenses you paid on your account during this period.
The Hypothetical Expense figures in the table below provide information about hypothetical account values and hypothetical expenses based on each Fund's actual expense ratio and an assumed rate of return of 5% per year before expenses, which is not the Fund's actual return. The hypothetical account values and expenses may not be used to estimate the actual ending account balance or expenses you paid for the period. You may use this information to compare this 5% hypothetical example with the 5% hypothetical examples that appear in shareholder reports of other funds.
Please note the expenses shown in the table are meant to highlight your ongoing costs only and do not reflect any transactional costs. Therefore, the table is useful in comparing ongoing costs only, and will not help you determine the relative total costs of owning different funds. In addition, if these transactional costs were included, your costs would have been higher.
Fund | Beginning Account Value 1/1/20 | Actual Ending Account Value 6/30/20 | Hypothetical Ending Account Value 6/30/20 | Actual Expenses Paid During Period 1/1/20- 6/30/20 | Hypothetical Expenses Paid During Period 1/1/20- 6/30/20 | Annualized Expense Ratio During Period 1/1/20- 6/30/20 | |||||||||||||||||||||
INCORE Investment Quality Bond Fund | |||||||||||||||||||||||||||
Class A Shares | $ | 1,000.00 | $ | 1,051.80 | $ | 1,020.39 | $ | 4.59 | $ | 4.52 | 0.90 | % | |||||||||||||||
Class C Shares | 1,000.00 | 1,047.20 | 1,016.06 | 9.01 | 8.87 | 1.77 | % | ||||||||||||||||||||
Class R Shares | 1,000.00 | 1,049.50 | 1,018.40 | 6.62 | 6.52 | 1.30 | % | ||||||||||||||||||||
Class Y Shares | 1,000.00 | 1,053.10 | 1,021.58 | 3.37 | 3.32 | 0.66 | % | ||||||||||||||||||||
91
Victory Portfolios | Supplemental Information — continued June 30, 2020 | ||||||
(Unaudited)
Fund | Beginning Account Value 1/1/20 | Actual Ending Account Value 6/30/20 | Hypothetical Ending Account Value 6/30/20 | Actual Expenses Paid During Period 1/1/20- 6/30/20 | Hypothetical Expenses Paid During Period 1/1/20- 6/30/20 | Annualized Expense Ratio During Period 1/1/20- 6/30/20 | |||||||||||||||||||||
INCORE Low Duration Bond Fund | |||||||||||||||||||||||||||
Class A Shares | $ | 1,000.00 | $ | 1,023.60 | $ | 1,020.64 | $ | 4.28 | $ | 4.27 | 0.85 | % | |||||||||||||||
Class C Shares | 1,000.00 | 1,019.70 | 1,016.81 | 8.14 | 8.12 | 1.62 | % | ||||||||||||||||||||
Class R Shares | 1,000.00 | 1,021.50 | 1,018.55 | 6.38 | 6.37 | 1.27 | % | ||||||||||||||||||||
Class Y Shares | 1,000.00 | 1,025.80 | 1,021.78 | 3.12 | 3.12 | 0.62 | % | ||||||||||||||||||||
High Yield Fund | |||||||||||||||||||||||||||
Class A Shares | 1,000.00 | 941.20 | 1,019.89 | 4.83 | 5.02 | 1.00 | % | ||||||||||||||||||||
Class C Shares | 1,000.00 | 936.60 | 1,016.41 | 8.19 | 8.52 | 1.70 | % | ||||||||||||||||||||
Class R Shares | 1,000.00 | 938.40 | 1,018.25 | 6.41 | 6.67 | 1.33 | % | ||||||||||||||||||||
Class Y Shares | 1,000.00 | 942.10 | 1,021.08 | 3.67 | 3.82 | 0.76 | % | ||||||||||||||||||||
Tax-Exempt Fund | |||||||||||||||||||||||||||
Class A Shares | 1,000.00 | 999.00 | 1,020.89 | 3.98 | 4.02 | 0.80 | % | ||||||||||||||||||||
Class C Shares | 1,000.00 | 995.00 | 1,016.91 | 7.94 | 8.02 | 1.60 | % | ||||||||||||||||||||
Class Y Shares | 1,000.00 | 999.50 | 1,021.43 | 3.43 | 3.47 | 0.69 | % | ||||||||||||||||||||
High Income Municipal Bond Fund | |||||||||||||||||||||||||||
Class A Shares | 1,000.00 | 998.30 | 1,020.89 | 3.97 | 4.02 | 0.80 | % | ||||||||||||||||||||
Class C Shares | 1,000.00 | 994.50 | 1,017.06 | 7.79 | 7.87 | 1.57 | % | ||||||||||||||||||||
Class Y Shares | 1,000.00 | 999.50 | 1,022.03 | 2.83 | 2.87 | 0.57 | % | ||||||||||||||||||||
Floating Rate Fund | |||||||||||||||||||||||||||
Class A Shares | 1,000.00 | 945.50 | 1,019.89 | 4.84 | 5.02 | 1.00 | % | ||||||||||||||||||||
Class C Shares | 1,000.00 | 942.80 | 1,015.91 | 8.69 | 9.02 | 1.80 | % | ||||||||||||||||||||
Class R Shares | 1,000.00 | 944.00 | 1,017.11 | 7.54 | 7.82 | 1.56 | % | ||||||||||||||||||||
Class Y Shares | 1,000.00 | 946.60 | 1,020.98 | 3.78 | 3.92 | 0.78 | % | ||||||||||||||||||||
Strategic Income Fund | |||||||||||||||||||||||||||
Class A Shares | 1,000.00 | 1,044.70 | 1,020.14 | 4.83 | 4.77 | 0.95 | % | ||||||||||||||||||||
Class C Shares | 1,000.00 | 1,040.30 | 1,016.21 | 8.83 | 8.72 | 1.74 | % | ||||||||||||||||||||
Class R Shares | 1,000.00 | 1,041.40 | 1,018.20 | 6.80 | 6.72 | 1.34 | % | ||||||||||||||||||||
Class Y Shares | 1,000.00 | 1,046.00 | 1,021.18 | 3.76 | 3.72 | 0.74 | % | ||||||||||||||||||||
* Expenses are equal to the average account value multiplied by the Fund's annualized expense ratio multiplied by 182/366 (the number of days in the most recent fiscal half-year divided by the number of days in the fiscal year).
92
Victory Portfolios | Supplemental Information — continued June 30, 2020 | ||||||
(Unaudited)
Liquidity Risk Management Program:
The Victory Funds have adopted and implemented a written liquidity risk management program (the "LRMP") as required by Rule 22e-4 under the Act. The LRMP is reasonably designed to assess and manage each Fund's liquidity risk, taking into consideration each Fund's investment strategy and the liquidity of its portfolio investments during normal and reasonably foreseeable stressed market conditions; its short and long-term cash flow projections; and its cash holdings and access to other liquidity management tools such as available funding sources including the Victory Funds Complex Interfund Lending Facility and Line of Credit (discussed in the Notes to Financial Statements). The Board approved the appointment of VCM as the administrator of the LRMP. At an in-person meeting held on February 20, 2020, VCM provided an oral and written report to the Trustees on the operation and effectiveness of the LRMP during the previous year.
VCM manages liquidity risks associated with the Funds' investments by monitoring, among other things, cash and cash equivalents, any use of derivatives, the concentration of investments, the appropriateness of each Fund's investment strategy, and by classifying every fund investment as either highly liquid, moderately liquid, less liquid or illiquid on at least a monthly basis. To assist with the classification of Fund investments, VCM has retained a third-party provider of liquidity evaluation services. This provider determines preliminary liquidity classifications for all portfolio holdings based upon portfolio-level data and certain assumptions provided by VCM. VCM reviews the preliminary liquidity classifications and, when appropriate, considers other information including input from the Funds' portfolio managers (including the portfolio managers employed by any investment sub-advisers) in determining final liquidity classifications.
The report from VCM concluded that the Funds did not experience any significant liquidity challenges during the covered period, and the Funds' LRMP is reasonably designed to assess and manage its liquidity risk. The report also concluded that the LRMP continues to operate adequately and effectively to enable VCM to oversee and manage liquidity risk and ensure each Fund is able to meet redemption requests without significant dilution to the remaining investors' interest in each Fund. During the review period, except for Floating Rate Fund, each Fund's portfolio consisted primarily of highly liquid investments, which are defined as cash and any investments reasonably expected to be converted to cash in current market conditions in three business days or less without significantly changing the market value of the investment. Therefore, these Funds have not adopted a Highly Liquid Investment Minimum. The Floating Rate Fund set a Highly Liquid Investment Minimum of 5% upon implementation of the LRMP. The Floating Rate Fund invests primarily in floating rate bank loans, which typically are characterized as less liquid because transactions on these securities often occur on a delayed basis. The Fund typically maintains 12-15% of its net assets in highly liquid investments. The Fund also reserves a set portion of the Line of Credit agreement with Citibank to mitigate the liquidity risk from holding less-liquid investments during the review period. Additionally, VCM indicated that no events occurred that would require the filing of Form N-LIQUID and recommended no material changes to the LRMP.
93
Privacy Policy
Protecting the Privacy of Information
The Trust respects your right to privacy. We also know that you expect us to conduct and process your business in an accurate and efficient manner. To do so, we must collect and maintain certain personal information about you. This is the information we collect from you on applications or other forms, and from the transactions you make with us or third parties. It may include your name, address, social security number, account transactions and balances, and information about investment goals and risk tolerance.
We do not disclose any information about you or about former customers to anyone except as permitted or required by law. Specifically, we may disclose the information we collect to companies that perform services on our behalf, such as the transfer agent that processes shareholder accounts and printers and mailers that assist us in the distribution of investor materials. We may also disclose this information to companies that perform marketing services on our behalf. This allows us to continue to offer you Victory investment products and services that meet your investing needs, and to effect transactions that you request or authorize. These companies will use this information only in connection with the services for which we hired them. They are not permitted to use or share this information for any other purpose.
To protect your personal information internally, we permit access only by authorized employees and maintain physical, electronic and procedural safeguards to guard your personal information.*
* You may have received communications regarding information about privacy policies from other financial institutions which gave you the opportunity to "opt-out" of certain information sharing with companies which are not affiliated with that financial institution. The Trust does not share information with other companies for purposes of marketing solicitations for products other than the Trust. Therefore, the Trust does not provide opt-out options to their shareholders.
Victory Funds
P.O. Box 182593
Columbus, Ohio 43218-2593

Visit our website at: | Call Victory at: | ||||||
www.vcm.com | 800-539-FUND (800-539-3863) | ||||||
VPRSFIF-SAR (6/20)

June 30, 2020
Semi Annual Report
Victory RS Small Cap Growth Fund
Victory RS Select Growth Fund
Victory RS Mid Cap Growth Fund
Victory RS Growth Fund
Victory RS Science and Technology Fund
Victory RS Small Cap Equity Fund
Beginning January 1, 2021, as permitted by regulations adopted by the Securities and Exchange Commission, paper copies of the Victory Funds' shareholder reports will no longer be sent by mail, unless you specifically request paper copies of the reports from the Victory Funds or from your financial intermediary, such as a broker-dealer or bank. Instead, the reports will be made available on www.VictoryFunds.com, and you will be notified by mail each time a report is posted and provided with a website link to access the report. If you already elected to receive shareholder reports electronically, you will not be affected by this change, and you need not take any action.
You may elect to receive shareholder reports and other communications from the Victory Funds or your financial intermediary electronically sooner than January 1, 2021 by notifying your financial intermediary directly or, if you are a direct investor, by calling 800-539-3863 or by sending an e-mail request to TA.Processing@FISGlobal.com.
You may elect to receive all future reports in paper free of charge. If you invest through a financial intermediary, you can contact your financial intermediary to request that you continue to receive paper copies of your reports. If you invest directly with the Victory Funds, you can call 800-539-3863 or send an e-mail request to TA.Processing@FISGlobal.com. Your election to receive reports in paper will apply to all Victory Funds you hold directly or through your financial intermediary.
www.vcm.com
News, Information And Education 24 Hours A Day, 7 Days A Week
The Victory Funds site gives fund shareholders, prospective shareholders, and investment professionals a convenient way to access fund information, get guidance, and track fund performance anywhere they can access the Internet. The site includes:
• Detailed performance records
• Daily share prices
• The latest fund news
• Investment resources to help you become a better investor
• A section dedicated to investment professionals
Whether you're a potential investor searching for the fund that matches your investment philosophy, a seasoned investor interested in planning tools, or an investment professional, www.vcm.com has what you seek. Visit us anytime. We're always open.
Victory Portfolios
Table of Contents
Financial Statements | |||||||
The Victory Growth Funds | |||||||
Victory RS Small Cap Growth Fund | |||||||
Investment Objectives & Portfolio Holdings | 3 | ||||||
Schedule of Portfolio Investments | 5 | ||||||
Statements of Assets and Liabilities | 25 | ||||||
Statements of Operations | 27 | ||||||
Statements of Changes in Net Assets | 29-31 | ||||||
Financial Highlights | 36-37 | ||||||
Victory RS Select Growth Fund | |||||||
Investment Objectives & Portfolio Holdings | 3 | ||||||
Schedule of Portfolio Investments | 9 | ||||||
Statements of Assets and Liabilities | 25 | ||||||
Statements of Operations | 27 | ||||||
Statements of Changes in Net Assets | 29-31 | ||||||
Financial Highlights | 38-39 | ||||||
Victory RS Mid Cap Growth Fund | |||||||
Investment Objectives & Portfolio Holdings | 3 | ||||||
Schedule of Portfolio Investments | 12 | ||||||
Statements of Assets and Liabilities | 25 | ||||||
Statements of Operations | 27 | ||||||
Statements of Changes in Net Assets | 29-31 | ||||||
Financial Highlights | 40-41 | ||||||
Victory RS Growth Fund | |||||||
Investment Objectives & Portfolio Holdings | 3 | ||||||
Schedule of Portfolio Investments | 15 | ||||||
Statements of Assets and Liabilities | 26 | ||||||
Statements of Operations | 28 | ||||||
Statements of Changes in Net Assets | 32-34 | ||||||
Financial Highlights | 42-43 | ||||||
Victory RS Science and Technology Fund | |||||||
Investment Objectives & Portfolio Holdings | 4 | ||||||
Schedule of Portfolio Investments | 17 | ||||||
Statements of Assets and Liabilities | 26 | ||||||
Statements of Operations | 28 | ||||||
Statements of Changes in Net Assets | 32-34 | ||||||
Financial Highlights | 44-45 | ||||||
Victory RS Small Cap Equity Fund | |||||||
Investment Objectives & Portfolio Holdings | 4 | ||||||
Schedule of Portfolio Investments | 21 | ||||||
Statements of Assets and Liabilities | 26 | ||||||
Statements of Operations | 28 | ||||||
Statements of Changes in Net Assets | 32-34 | ||||||
Financial Highlights | 46-47 | ||||||
Notes to Financial Statements | 48 | ||||||
Supplemental Information | 57 | ||||||
Proxy Voting and Portfolio Holdings Information | 57 | ||||||
Expense Examples | 57 | ||||||
Liquidity Risk Management Program | 59 | ||||||
Privacy Policy (inside back cover) | |||||||
1
The Funds are distributed by Victory Capital Services, Inc. Victory Capital Management Inc. is the investment adviser to the Funds and receives fees from the Funds for performing services for the Funds.
This report is not authorized for distribution to prospective investors unless preceded or accompanied by a current prospectus of the Victory Funds.
For additional information about any Victory Fund, including fees, expenses, and risks, view our prospectus online at www.vcm.com or call 800-539-3863. Read it carefully before you invest or send money.
The information in this semi annual report is based on data obtained from recognized services and sources and is believed to be reliable. Any opinions, projections, or recommendations in this report are subject to change without notice and are not intended as individual investment advice. Past investment performance of the Funds, markets or securities mentioned herein should not be considered to be indicative of future results.
• NOT FDIC INSURED • NO BANK GUARANTEE • MAY LOSE VALUE

Call Victory at:
800-539-FUND (800-539-3863)
Visit our website at:
www.vcm.com
2
Victory Portfolios | April 30, 2020 | ||||||
(Unaudited)
Investment Objectives & Portfolio Holdings:
| Victory RS Small Cap Growth Fund The Fund seeks to provide long-term capital growth. | |||
Portfolio Holdings
As a Percentage of Total Investments
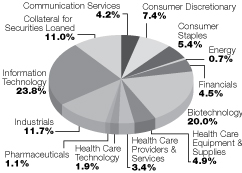
| Victory RS Select Growth Fund The Fund seeks to provide long-term capital growth. | |||
Portfolio Holdings
As a Percentage of Total Investments

Victory RS Mid Cap Growth Fund
The Fund seeks to provide long-term capital growth.
Portfolio Holdings
As a Percentage of Total Investments
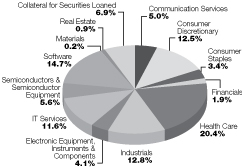
Victory RS Growth Fund
The Fund seeks to provide long-term capital growth.
Portfolio Holdings
As a Percentage of Total Investments
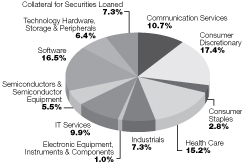
3
Victory Portfolios | April 30, 2020 | ||||||
(Unaudited)
Investment Objectives & Portfolio Holdings: (continued)
| Victory RS Science and Technology Fund The Fund seeks to provide long-term capital growth. | |||
Portfolio Holdings
As a Percentage of Total Investments
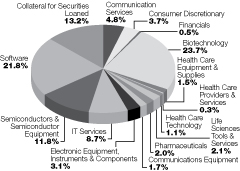
| Victory RS Small Cap Equity Fund The Fund seeks to provide long-term capital growth. | |||
Portfolio Holdings
As a Percentage of Total Investments
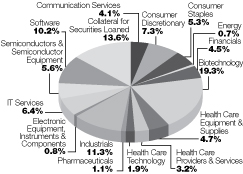
4
| Victory Portfolios Victory RS Small Cap Growth Fund | Schedule of Portfolio Investments June 30, 2020 | ||||||
(Unaudited)
Security Description | Shares | Value | |||||||||
Common Stocks (98.3%) | |||||||||||
Biotechnology (22.1%): | |||||||||||
Adaptimmune Therapeutics PLC, ADR (a) | 1,065,390 | $ | 10,664,554 | ||||||||
Aimmune Therapeutics, Inc. (a) (b) | 1,171,310 | 19,572,590 | |||||||||
Allogene Therapeutics, Inc. (a) (b) | 381,550 | 16,337,971 | |||||||||
Amicus Therapeutics, Inc. (a) | 2,012,805 | 30,353,098 | |||||||||
Apellis Pharmaceuticals, Inc. (a) (b) | 674,820 | 22,039,621 | |||||||||
Arcus Biosciences, Inc. (a) | 500,500 | 12,382,370 | |||||||||
Arena Pharmaceuticals, Inc. (a) (b) | 347,950 | 21,903,453 | |||||||||
Ascendis Pharma A/S, ADR (a) | 153,050 | 22,636,095 | |||||||||
Avidity Biosciences, Inc. (a) | 466,680 | 13,188,377 | |||||||||
bluebird bio, Inc. (a) (b) | 386,559 | 23,595,561 | |||||||||
Blueprint Medicines Corp. (a) | 309,618 | 24,150,204 | |||||||||
Celyad SA, ADR (a) (b) | 431,611 | 4,687,295 | |||||||||
Constellation Pharmaceuticals, Inc. (a) (b) | 429,460 | 12,905,273 | |||||||||
CytomX Therapeutics, Inc. (a) | 1,251,290 | 10,423,246 | |||||||||
Epizyme, Inc. (a) (b) | 1,249,150 | 20,061,349 | |||||||||
Equillium, Inc. (a) | 809,450 | 2,387,878 | |||||||||
Fate Therapeutics, Inc. (a) | 982,430 | 33,707,172 | |||||||||
Generation Bio Co. (a) | 440,720 | 9,255,120 | |||||||||
Gossamer Bio, Inc. (a) (b) | 821,860 | 10,684,180 | |||||||||
Immunomedics, Inc. (a) (b) | 433,920 | 15,378,125 | |||||||||
Invitae Corp. (a) | 619,320 | 18,759,203 | |||||||||
Iovance Biotherapeutics, Inc. (a) (b) | 745,565 | 20,465,759 | |||||||||
Krystal Biotech, Inc. (a) | 160,530 | 6,649,153 | |||||||||
Kura Oncology, Inc. (a) | 1,133,520 | 18,476,376 | |||||||||
Mirati Therapeutics, Inc. (a) | 207,180 | 23,653,741 | |||||||||
Myovant Sciences Ltd. (a) (b) | 1,085,830 | 22,389,814 | |||||||||
ORIC Pharmaceuticals, Inc. (a) (b) | 325,420 | 10,976,417 | |||||||||
Replimune Group, Inc. (a) | 598,410 | 14,870,489 | |||||||||
Sage Therapeutics, Inc. (a) (b) | 233,450 | 9,706,851 | |||||||||
Twist Bioscience Corp. (a) | 328,030 | 14,859,759 | |||||||||
497,121,094 | |||||||||||
Communication Services (4.7%): | |||||||||||
Bandwidth, Inc., Class A (a) (b) | 600,510 | 76,264,770 | |||||||||
Cardlytics, Inc. (a) (b) | 178,620 | 12,499,828 | |||||||||
EverQuote, Inc., Class A (a) | 258,620 | 15,041,339 | |||||||||
103,805,937 | |||||||||||
Consumer Discretionary (8.1%): | |||||||||||
Arco Platform Ltd., Class A (a) | 462,690 | 20,117,761 | |||||||||
Denny's Corp. (a) | 209,610 | 2,117,061 | |||||||||
Eldorado Resorts, Inc. (a) (b) | 581,190 | 23,282,472 | |||||||||
Fox Factory Holding Corp. (a) (b) | 176,480 | 14,579,013 | |||||||||
Frontdoor, Inc. (a) | 432,380 | 19,167,405 | |||||||||
Ollie's Bargain Outlet Holdings, Inc. (a) (b) | 147,540 | 14,407,281 | |||||||||
Planet Fitness, Inc., Class A (a) (b) | 288,220 | 17,457,485 | |||||||||
Skyline Champion Corp. (a) | 388,200 | 9,448,788 | |||||||||
Strategic Education, Inc.(b) | 251,820 | 38,692,143 | |||||||||
See notes to financial statements.
5
| Victory Portfolios Victory RS Small Cap Growth Fund | Schedule of Portfolio Investments — continued June 30, 2020 | ||||||
(Unaudited)
Security Description | Shares | Value | |||||||||
Wingstop, Inc.(b) | 78,790 | $ | 10,949,446 | ||||||||
YETI Holdings, Inc. (a) | 298,420 | 12,751,487 | |||||||||
182,970,342 | |||||||||||
Consumer Staples (6.0%): | |||||||||||
BellRing Brands, Inc., Class A (a) (b) | 1,990,310 | 39,686,781 | |||||||||
BJ's Wholesale Club Holdings, Inc. (a) | 467,240 | 17,414,035 | |||||||||
e.l.f. Beauty, Inc. (a) | 1,343,480 | 25,620,164 | |||||||||
Freshpet, Inc. (a) | 208,150 | 17,413,829 | |||||||||
Hostess Brands, Inc. (a) (b) | 2,893,170 | 35,354,538 | |||||||||
135,489,347 | |||||||||||
Electronic Equipment, Instruments & Components (0.9%): | |||||||||||
Itron, Inc. (a) (b) | 296,400 | 19,636,500 | |||||||||
Energy (0.4%): | |||||||||||
Amyris, Inc. PIPE (a) (c) (d) | 2,447,976 | 9,596,066 | |||||||||
Financials (5.1%): | |||||||||||
Assetmark Financial Holdings, Inc. (a) | 353,130 | 9,636,918 | |||||||||
eHealth, Inc. (a) | 154,740 | 15,201,658 | |||||||||
Essent Group Ltd. | 302,420 | 10,968,773 | |||||||||
FirstCash, Inc., Class A | 202,460 | 13,662,001 | |||||||||
LendingTree, Inc. (a) (b) | 31,160 | 9,021,755 | |||||||||
PRA Group, Inc. (a) (b) | 757,890 | 29,300,027 | |||||||||
Walker & Dunlop, Inc. | 305,770 | 15,536,174 | |||||||||
Western Alliance Bancorp | 295,530 | 11,191,721 | |||||||||
114,519,027 | |||||||||||
Health Care Equipment & Supplies (5.4%): | |||||||||||
CryoPort, Inc. (a) (b) | 502,230 | 15,192,458 | |||||||||
iRhythm Technologies, Inc. (a) (b) | 300,540 | 34,829,580 | |||||||||
Masimo Corp. (a) (b) | 94,910 | 21,638,531 | |||||||||
Nevro Corp. (a) (b) | 240,810 | 28,769,571 | |||||||||
Silk Road Medical, Inc. (a) (b) | 519,660 | 21,768,557 | |||||||||
122,198,697 | |||||||||||
Health Care Providers & Services (3.7%): | |||||||||||
Hanger, Inc. (a) | 652,240 | 10,801,094 | |||||||||
HealthEquity, Inc. (a) | 342,600 | 20,100,342 | |||||||||
LHC Group, Inc. (a) (b) | 303,970 | 52,988,051 | |||||||||
83,889,487 | |||||||||||
Health Care Technology (2.1%): | |||||||||||
Health Catalyst, Inc. (a) (b) | 666,050 | 19,428,679 | |||||||||
Inspire Medical System, Inc. (a) | 324,040 | 28,197,960 | |||||||||
47,626,639 | |||||||||||
Industrials (12.9%): | |||||||||||
Advanced Drainage Systems, Inc. | 407,340 | 20,122,596 | |||||||||
Axon Enterprise, Inc. (a) (b) | 178,680 | 17,533,868 | |||||||||
ESCO Technologies, Inc. | 160,330 | 13,552,695 | |||||||||
Evoqua Water Technologies Corp. (a) | 1,004,450 | 18,682,770 | |||||||||
FTI Consulting, Inc. (a) | 294,100 | 33,689,155 | |||||||||
See notes to financial statements.
6
| Victory Portfolios Victory RS Small Cap Growth Fund | Schedule of Portfolio Investments — continued June 30, 2020 | ||||||
(Unaudited)
Security Description | Shares | Value | |||||||||
Generac Holdings, Inc. (a) | 183,880 | $ | 22,420,488 | ||||||||
Kornit Digital Ltd. (a) (b) | 226,520 | 12,091,638 | |||||||||
Mercury Systems, Inc. (a) | 471,830 | 37,114,148 | |||||||||
Saia, Inc. (a) | 20,080 | 2,232,494 | |||||||||
Simpson Manufacturing Co., Inc. | 303,340 | 25,589,762 | |||||||||
SiteOne Landscape Supply, Inc. (a) (b) | 298,570 | 34,028,023 | |||||||||
Trex Co., Inc. (a) (b) | 193,650 | 25,188,056 | |||||||||
Watts Water Technologies, Inc., Class A | 346,890 | 28,098,090 | |||||||||
290,343,783 | |||||||||||
IT Services (7.3%): | |||||||||||
Evo Payments, Inc., Class A (a) | 822,440 | 18,776,305 | |||||||||
LiveRamp Holdings, Inc. (a) | 591,050 | 25,101,894 | |||||||||
Repay Holdings Corp. (a) (b) | 588,070 | 14,484,164 | |||||||||
Wix.com Ltd. (a) | 325,570 | 83,417,545 | |||||||||
WNS Holdings Ltd., ADR (a) | 418,897 | 23,030,957 | |||||||||
164,810,865 | |||||||||||
Pharmaceuticals (1.3%): | |||||||||||
Assembly Biosciences, Inc. (a) | 472,180 | 11,011,238 | |||||||||
GW Pharmaceuticals PLC, ADR (a) (b) | 144,387 | 17,719,173 | |||||||||
28,730,411 | |||||||||||
Semiconductors & Semiconductor Equipment (6.6%): | |||||||||||
Advanced Energy Industries, Inc. (a) | 411,250 | 27,878,638 | |||||||||
Cabot Microelectronics Corp.(b) | 184,990 | 25,813,505 | |||||||||
Lattice Semiconductor Corp. (a) | 1,353,010 | 38,411,953 | |||||||||
MACOM Technology Solutions Holdings, Inc. (a) | 869,040 | 29,851,524 | |||||||||
Silicon Laboratories, Inc. (a) (b) | 254,180 | 25,486,629 | |||||||||
147,442,249 | |||||||||||
Software (11.7%): | |||||||||||
ACI Worldwide, Inc. (a) (b) | 1,075,580 | 29,029,904 | |||||||||
Avaya Holdings Corp. (a) (b) | 2,316,430 | 28,631,075 | |||||||||
Bill.com Holdings, Inc. (a) | 127,510 | 11,502,677 | |||||||||
Cornerstone OnDemand, Inc. (a) | 185,547 | 7,154,692 | |||||||||
Envestnet, Inc. (a) | 385,246 | 28,330,991 | |||||||||
Everbridge, Inc. (a) (b) | 465,800 | 64,448,088 | |||||||||
Five9, Inc. (a) (b) | 176,210 | 19,501,161 | |||||||||
Q2 Holdings, Inc. (a) (b) | 325,990 | 27,966,682 | |||||||||
Varonis Systems, Inc. (a) (b) | 531,620 | 47,037,737 | |||||||||
263,603,007 | |||||||||||
Total Common Stocks (Cost $1,708,656,113) | 2,211,783,451 | ||||||||||
Preferred Stocks (0.3%) | |||||||||||
Energy (0.3%): | |||||||||||
Amyris, Inc. PIPE (a) (c) (d) | 5,960 | 7,615,565 | |||||||||
Total Preferred Stocks (Cost $5,960,370) | 7,615,565 | ||||||||||
See notes to financial statements.
7
| Victory Portfolios Victory RS Small Cap Growth Fund | Schedule of Portfolio Investments — continued June 30, 2020 | ||||||
(Unaudited)
Security Description | Shares | Value | |||||||||
Collateral for Securities Loaned^ (12.2%) | |||||||||||
| BlackRock Liquidity Funds TempFund Portfolio, Institutional Class , 0.28% (e) | 4,558,890 | $ | 4,558,890 | ||||||||
| Fidelity Investments Money Market Government Portfolio, Class I , 0.09% (e) | 137,977,906 | 137,977,906 | |||||||||
| Goldman Sachs Financial Square Prime Obligations Fund, Institutional Class, 0.30% (e) | 31,702,416 | 31,702,416 | |||||||||
JPMorgan Prime Money Market Fund, Capital Class, 0.43% (e) | 18,141,030 | 18,141,030 | |||||||||
| Morgan Stanley Institutional Liquidity Prime Portfolio, Institutional Class, 0.41% (e) | 81,565,613 | 81,565,613 | |||||||||
Total Collateral for Securities Loaned (Cost $273,945,855) | 273,945,855 | ||||||||||
Total Investments (Cost $1,988,562,338) — 110.8% | 2,493,344,871 | ||||||||||
Liabilities in excess of other assets — (10.8)% | (243,222,748 | ) | |||||||||
NET ASSETS — 100.00% | $ | 2,250,122,123 | |||||||||
^ Purchased with cash collateral from securities on loan.
(a) Non-income producing security.
(b) All or a portion of this security is on loan.
(c) The Fund's Adviser has deemed this security to be illiquid based upon procedures approved by the Board of Trustees. As of June 30, 2020, illiquid securities were 0.8% of the Fund's net assets.
(d) Security was fair valued based upon procedures approved by the Board of Trustees and represents 0.8% of the Fund's net assets as of June 30, 2020.
(e) Rate disclosed is the daily yield on June 30, 2020.
ADR — American Depositary Receipt
PIPE — Private Investment in Public Equity
PLC — Public Limited Company
See notes to financial statements.
8
| Victory Portfolios Victory RS Select Growth Fund | Schedule of Portfolio Investments June 30, 2020 | ||||||
(Unaudited)
Security Description | Shares | Value | |||||||||
Common Stocks (99.1%) | |||||||||||
Biotechnology (10.2%): | |||||||||||
Exact Sciences Corp. (a) | 55,630 | $ | 4,836,472 | ||||||||
Halozyme Therapeutics, Inc. (a) (b) | 190,890 | 5,117,761 | |||||||||
Ligand Pharmaceuticals, Inc. (a) (b) | 38,970 | 4,358,795 | |||||||||
Neurocrine Biosciences, Inc. (a) | 51,890 | 6,330,579 | |||||||||
20,643,607 | |||||||||||
Communication Services (1.3%): | |||||||||||
Boingo Wireless, Inc. (a) (b) | 197,940 | 2,636,561 | |||||||||
Communications Equipment (1.4%): | |||||||||||
Viavi Solutions, Inc. (a) (b) | 218,650 | 2,785,601 | |||||||||
Consumer Discretionary (10.4%): | |||||||||||
Bright Horizons Family Solutions, Inc. (a) | 25,000 | 2,930,000 | |||||||||
Burlington Stores, Inc. (a) | 16,130 | 3,176,481 | |||||||||
Churchill Downs, Inc. | 11,750 | 1,564,513 | |||||||||
Frontdoor, Inc. (a) | 42,910 | 1,902,200 | |||||||||
Planet Fitness, Inc., Class A (a) | 39,660 | 2,402,205 | |||||||||
Pool Corp. | 12,950 | 3,520,717 | |||||||||
Strategic Education, Inc. | 23,560 | 3,619,994 | |||||||||
The Wendy's Co. | 87,370 | 1,902,919 | |||||||||
21,019,029 | |||||||||||
Consumer Staples (3.4%): | |||||||||||
Beyond Meat, Inc. (a) (b) | 6,410 | 858,812 | |||||||||
Freshpet, Inc. (a) (b) | 31,410 | 2,627,761 | |||||||||
Hostess Brands, Inc. (a) | 270,910 | 3,310,520 | |||||||||
6,797,093 | |||||||||||
Financials (2.2%): | |||||||||||
Focus Financial Partners, Inc., Class A (a) | 61,870 | 2,044,804 | |||||||||
LendingTree, Inc. (a) (b) | 3,450 | 998,879 | |||||||||
Western Alliance Bancorp | 35,250 | 1,334,918 | |||||||||
4,378,601 | |||||||||||
Health Care Equipment & Supplies (7.0%): | |||||||||||
Insulet Corp. (a) (b) | 17,080 | 3,317,961 | |||||||||
Masimo Corp. (a) | 14,970 | 3,413,010 | |||||||||
The Cooper Cos., Inc. | 13,340 | 3,783,758 | |||||||||
West Pharmaceutical Services, Inc. | 15,796 | 3,588,377 | |||||||||
14,103,106 | |||||||||||
Health Care Providers & Services (4.2%): | |||||||||||
Encompass Health Corp. | 37,580 | 2,327,329 | |||||||||
HealthEquity, Inc. (a) | 37,430 | 2,196,018 | |||||||||
LHC Group, Inc. (a) | 23,310 | 4,063,400 | |||||||||
8,586,747 | |||||||||||
Industrials (15.4%): | |||||||||||
Advanced Drainage Systems, Inc. | 52,750 | 2,605,850 | |||||||||
FTI Consulting, Inc. (a) | 28,970 | 3,318,514 | |||||||||
See notes to financial statements.
9
| Victory Portfolios Victory RS Select Growth Fund | Schedule of Portfolio Investments — continued June 30, 2020 | ||||||
(Unaudited)
Security Description | Shares | Value | |||||||||
Generac Holdings, Inc. (a) | 31,040 | $ | 3,784,707 | ||||||||
HEICO Corp., Class A | 18,753 | 1,523,494 | |||||||||
IDEX Corp. | 14,800 | 2,338,992 | |||||||||
Mercury Systems, Inc. (a) | 50,850 | 3,999,861 | |||||||||
MSA Safety, Inc. | 26,180 | 2,996,039 | |||||||||
Nordson Corp.(b) | 12,790 | 2,426,391 | |||||||||
Rollins, Inc.(b) | 26,600 | 1,127,574 | |||||||||
SiteOne Landscape Supply, Inc. (a) | 33,880 | 3,861,304 | |||||||||
Trex Co., Inc. (a) | 24,860 | 3,233,540 | |||||||||
31,216,266 | |||||||||||
IT Services (6.1%): | |||||||||||
Black Knight, Inc. (a) | 68,169 | 4,946,343 | |||||||||
GoDaddy, Inc., Class A (a) | 44,477 | 3,261,498 | |||||||||
Jack Henry & Associates, Inc. | 22,360 | 4,114,911 | |||||||||
12,322,752 | |||||||||||
Life Sciences Tools & Services (0.7%): | |||||||||||
Charles River Laboratories International, Inc. (a) | 8,380 | 1,461,053 | |||||||||
Pharmaceuticals (8.1%): | |||||||||||
GW Pharmaceuticals PLC, ADR (a) (b) | 20,560 | 2,523,123 | |||||||||
Horizon Therapeutics PLC (a) | 152,330 | 8,466,501 | |||||||||
Royalty Pharma PLC, Class A (a) | 114,580 | 5,562,859 | |||||||||
16,552,483 | |||||||||||
Semiconductors & Semiconductor Equipment (6.2%): | |||||||||||
Cabot Microelectronics Corp. | 15,560 | 2,171,242 | |||||||||
Entegris, Inc. | 43,110 | 2,545,646 | |||||||||
Lattice Semiconductor Corp. (a) | 83,970 | 2,383,908 | |||||||||
MKS Instruments, Inc. | 26,380 | 2,987,271 | |||||||||
Monolithic Power Systems, Inc. | 10,615 | 2,515,755 | |||||||||
12,603,822 | |||||||||||
Software (22.5%): | |||||||||||
ACI Worldwide, Inc. (a) (b) | 141,230 | 3,811,798 | |||||||||
Coupa Software, Inc. (a) (b) | 21,660 | 6,000,686 | |||||||||
DocuSign, Inc. (a) | 42,990 | 7,403,307 | |||||||||
Dynatrace, Inc. (a) | 96,410 | 3,914,246 | |||||||||
Fair Isaac Corp. (a) | 8,620 | 3,603,505 | |||||||||
Paycom Software, Inc. (a) | 14,875 | 4,607,234 | |||||||||
Proofpoint, Inc. (a) | 21,260 | 2,362,411 | |||||||||
RingCentral, Inc., Class A (a) | 39,270 | 11,192,342 | |||||||||
Zendesk, Inc. (a) | 31,760 | 2,811,713 | |||||||||
45,707,242 | |||||||||||
Total Common Stocks (Cost $141,607,087) | 200,813,963 | ||||||||||
See notes to financial statements.
10
| Victory Portfolios Victory RS Select Growth Fund | Schedule of Portfolio Investments — continued June 30, 2020 | ||||||
(Unaudited)
Security Description | Shares | Value | |||||||||
Collateral for Securities Loaned^ (6.5%) | |||||||||||
| BlackRock Liquidity Funds TempFund Portfolio, Institutional Class, 0.28% (c) | 217,450 | $ | 217,450 | ||||||||
| Fidelity Investments Money Market Government Portfolio, Class I, 0.09% (c) | 6,581,261 | 6,581,261 | |||||||||
| Goldman Sachs Financial Square Prime Obligations Fund, Institutional Class, 0.30% (c) | 1,512,140 | 1,512,140 | |||||||||
JPMorgan Prime Money Market Fund, Capital Class, 0.43% (c) | 865,290 | 865,290 | |||||||||
| Morgan Stanley Institutional Liquidity Prime Portfolio, Institutional Class, 0.41% (c) | 3,890,511 | 3,890,511 | |||||||||
Total Collateral for Securities Loaned (Cost $13,066,652) | 13,066,652 | ||||||||||
Total Investments (Cost $154,673,739) — 105.6% | 213,880,615 | ||||||||||
Liabilities in excess of other assets — (5.6)% | (11,402,840 | ) | |||||||||
NET ASSETS — 100.00% | $ | 202,477,775 | |||||||||
^ Purchased with cash collateral from securities on loan.
(a) Non-income producing security.
(b) All or a portion of this security is on loan.
(c) Rate disclosed is the daily yield on June 30, 2020.
ADR — American Depositary Receipt
PLC — Public Limited Company
See notes to financial statements.
11
| Victory Portfolios Victory RS Mid Cap Growth Fund | Schedule of Portfolio Investments June 30, 2020 | ||||||
(Unaudited)
Security Description | Shares | Value | |||||||||
Common Stocks (98.9%) | |||||||||||
Communication Services (5.2%): | |||||||||||
Live Nation Entertainment, Inc. (a) (b) | 93,550 | $ | 4,147,072 | ||||||||
Match Group, Inc. (a) (b) | 71,070 | 7,608,044 | |||||||||
Take-Two Interactive Software, Inc. (a) | 52,400 | 7,313,468 | |||||||||
Twitter, Inc. (a) | 267,040 | 7,955,121 | |||||||||
ZoomInfo Technologies, Inc., Class A (a) | 4,060 | 207,182 | |||||||||
27,230,887 | |||||||||||
Consumer Discretionary (13.2%): | |||||||||||
Bright Horizons Family Solutions, Inc. (a) | 17,920 | 2,100,224 | |||||||||
Burlington Stores, Inc. (a) | 42,130 | 8,296,661 | |||||||||
Chipotle Mexican Grill, Inc. (a) | 7,040 | 7,408,615 | |||||||||
Dollar General Corp. | 51,990 | 9,904,615 | |||||||||
Eldorado Resorts, Inc. (a) (b) | 66,530 | 2,665,192 | |||||||||
Grand Canyon Education, Inc. (a) (b) | 47,980 | 4,343,629 | |||||||||
Hasbro, Inc. | 32,530 | 2,438,124 | |||||||||
Lululemon Athletica, Inc. (a) | 18,650 | 5,818,987 | |||||||||
O'Reilly Automotive, Inc. (a) (b) | 19,220 | 8,104,497 | |||||||||
Planet Fitness, Inc., Class A (a) | 52,130 | 3,157,514 | |||||||||
Pool Corp.(b) | 33,130 | 9,007,053 | |||||||||
The Wendy's Co. | 249,880 | 5,442,386 | |||||||||
68,687,497 | |||||||||||
Consumer Staples (3.6%): | |||||||||||
Beyond Meat, Inc. (a) (b) | 25,040 | 3,354,859 | |||||||||
Church & Dwight Co., Inc. | 108,620 | 8,396,326 | |||||||||
Lamb Weston Holdings, Inc.(b) | 70,930 | 4,534,556 | |||||||||
Post Holdings, Inc. (a) | 29,920 | 2,621,590 | |||||||||
18,907,331 | |||||||||||
Electronic Equipment, Instruments & Components (4.4%): | |||||||||||
Amphenol Corp., Class A | 78,950 | 7,564,200 | |||||||||
Keysight Technologies, Inc. (a) | 79,740 | 8,036,197 | |||||||||
Trimble, Inc. (a) | 166,190 | 7,177,746 | |||||||||
22,778,143 | |||||||||||
Financials (2.0%): | |||||||||||
MarketAxess Holdings, Inc. | 8,710 | 4,363,013 | |||||||||
MSCI, Inc. | 18,620 | 6,215,729 | |||||||||
10,578,742 | |||||||||||
Health Care (21.8%): | |||||||||||
10X Genomics, Inc., Class A (a) | 32,070 | 2,864,172 | |||||||||
Allogene Therapeutics, Inc. (a) (b) | 58,800 | 2,517,816 | |||||||||
AmerisourceBergen Corp. | 51,280 | 5,167,486 | |||||||||
Apellis Pharmaceuticals, Inc. (a) (b) | 109,580 | 3,578,883 | |||||||||
Ascendis Pharma A/S, ADR (a) | 19,460 | 2,878,134 | |||||||||
bluebird bio, Inc. (a) | 50,720 | 3,095,949 | |||||||||
Centene Corp. (a) | 85,421 | 5,428,504 | |||||||||
DexCom, Inc. (a) | 21,970 | 8,906,638 | |||||||||
See notes to financial statements.
12
| Victory Portfolios Victory RS Mid Cap Growth Fund | Schedule of Portfolio Investments — continued June 30, 2020 | ||||||
(Unaudited)
Security Description | Shares | Value | |||||||||
Encompass Health Corp. | 84,010 | $ | 5,202,739 | ||||||||
Fate Therapeutics, Inc. (a) | 104,860 | 3,597,747 | |||||||||
GW Pharmaceuticals PLC, ADR (a) (b) | 25,710 | 3,155,131 | |||||||||
Horizon Therapeutics PLC (a) | 79,290 | 4,406,938 | |||||||||
Insulet Corp. (a) | 33,010 | 6,412,523 | |||||||||
Iovance Biotherapeutics, Inc. (a) (b) | 129,300 | 3,549,285 | |||||||||
IQVIA Holdings, Inc. (a) | 54,750 | 7,767,930 | |||||||||
Masimo Corp. (a) | 27,020 | 6,160,290 | |||||||||
Neurocrine Biosciences, Inc. (a) | 42,820 | 5,224,039 | |||||||||
Royalty Pharma PLC, Class A (a) | 165,000 | 8,010,750 | |||||||||
Sage Therapeutics, Inc. (a) | 43,210 | 1,796,672 | |||||||||
The Cooper Cos., Inc. | 26,250 | 7,445,550 | |||||||||
Veeva Systems, Inc., Class A (a) | 28,350 | 6,645,807 | |||||||||
West Pharmaceutical Services, Inc. | 37,460 | 8,509,788 | |||||||||
112,322,771 | |||||||||||
Industrials (13.5%): | |||||||||||
AMETEK, Inc. | 58,410 | 5,220,102 | |||||||||
CoStar Group, Inc. (a) | 9,760 | 6,936,139 | |||||||||
FTI Consulting, Inc. (a) | 37,360 | 4,279,588 | |||||||||
Generac Holdings, Inc. (a) | 68,240 | 8,320,503 | |||||||||
HEICO Corp., Class A | 47,210 | 3,835,340 | |||||||||
IDEX Corp. | 37,340 | 5,901,214 | |||||||||
IHS Markit Ltd. | 57,510 | 4,342,005 | |||||||||
L3Harris Technologies, Inc. | 9,940 | 1,686,520 | |||||||||
Nordson Corp.(b) | 32,370 | 6,140,912 | |||||||||
Old Dominion Freight Line, Inc. | 22,920 | 3,887,003 | |||||||||
Trane Technologies PLC | 51,580 | 4,589,589 | |||||||||
TransUnion | 63,730 | 5,547,059 | |||||||||
Trex Co., Inc. (a) (b) | 34,260 | 4,456,198 | |||||||||
Verisk Analytics, Inc. | 29,430 | 5,008,986 | |||||||||
70,151,158 | |||||||||||
IT Services (12.3%): | |||||||||||
Black Knight, Inc. (a) | 66,464 | 4,822,628 | |||||||||
FleetCor Technologies, Inc. (a) | 18,870 | 4,746,371 | |||||||||
Global Payments, Inc. | 36,623 | 6,211,993 | |||||||||
GoDaddy, Inc., Class A (a) | 86,500 | 6,343,045 | |||||||||
Jack Henry & Associates, Inc. | 44,960 | 8,273,989 | |||||||||
Okta, Inc. (a) | 19,430 | 3,890,469 | |||||||||
Square, Inc., Class A (a) (b) | 38,970 | 4,089,512 | |||||||||
Twilio, Inc., Class A (a) (b) | 54,300 | 11,914,505 | |||||||||
Wix.com Ltd. (a) | 53,170 | 13,623,217 | |||||||||
63,915,729 | |||||||||||
Materials (0.3%): | |||||||||||
The Scotts Miracle-Gro Co. | 9,640 | 1,296,291 | |||||||||
Real Estate (1.0%): | |||||||||||
SBA Communications Corp. | 16,660 | 4,963,347 | |||||||||
See notes to financial statements.
13
| Victory Portfolios Victory RS Mid Cap Growth Fund | Schedule of Portfolio Investments — continued June 30, 2020 | ||||||
(Unaudited)
Security Description | Shares | Value | |||||||||
Semiconductors & Semiconductor Equipment (6.0%): | |||||||||||
Advanced Micro Devices, Inc. (a) | 124,790 | $ | 6,565,202 | ||||||||
Entegris, Inc.(b) | 67,810 | 4,004,181 | |||||||||
KLA Corp. | 34,880 | 6,783,462 | |||||||||
Marvell Technology Group Ltd. | 242,260 | 8,493,636 | |||||||||
Monolithic Power Systems, Inc. | 21,120 | 5,005,440 | |||||||||
30,851,921 | |||||||||||
Software (15.6%): | |||||||||||
DocuSign, Inc. (a) | 64,150 | 11,047,271 | |||||||||
Dropbox, Inc., Class A (a) | 392,700 | 8,549,079 | |||||||||
Fair Isaac Corp. (a) | 13,200 | 5,518,128 | |||||||||
Paycom Software, Inc. (a) | 23,320 | 7,222,904 | |||||||||
Proofpoint, Inc. (a) | 45,940 | 5,104,853 | |||||||||
RingCentral, Inc., Class A (a) (b) | 92,070 | 26,240,870 | |||||||||
Synopsys, Inc. (a) | 68,190 | 13,297,050 | |||||||||
Zendesk, Inc. (a) | 38,690 | 3,425,225 | |||||||||
80,405,380 | |||||||||||
Total Common Stocks (Cost $399,109,777) | 512,089,197 | ||||||||||
Collateral for Securities Loaned^ (7.4%) | |||||||||||
BlackRock Liquidity Funds TempFund Portfolio, Institutional Class, 0.28% (c) | 636,420 | 636,420 | |||||||||
Fidelity Investments Money Market Government Portfolio, Class I, 0.09% (c) | 19,261,694 | 19,261,694 | |||||||||
| Goldman Sachs Financial Square Prime Obligations Fund, Institutional Class, 0.30% (c) | 4,425,652 | 4,425,652 | |||||||||
JPMorgan Prime Money Market Fund, Capital Class, 0.43% (c) | 2,532,485 | 2,532,485 | |||||||||
| Morgan Stanley Institutional Liquidity Prime Portfolio, Institutional Class, 0.41% (c) | 11,386,548 | 11,386,548 | |||||||||
Total Collateral for Securities Loaned (Cost $38,242,799) | 38,242,799 | ||||||||||
Total Investments (Cost $437,352,576) — 106.3% | 550,331,996 | ||||||||||
Liabilities in excess of other assets — (6.3)% | (32,704,439 | ) | |||||||||
NET ASSETS — 100.00% | $ | 517,627,557 | |||||||||
^ Purchased with cash collateral from securities on loan.
(a) Non-income producing security.
(b) All or a portion of this security is on loan.
(c) Rate disclosed is the daily yield on June 30, 2020.
ADR — American Depositary Receipt
PLC — Public Limited Company
See notes to financial statements.
14
| Victory Portfolios Victory RS Growth Fund | Schedule of Portfolio Investments June 30, 2020 | ||||||
(Unaudited)
Security Description | Shares | Value | |||||||||
Common Stocks (98.9%) | |||||||||||
Communication Services (11.4%): | |||||||||||
Activision Blizzard, Inc. | 47,890 | $ | 3,634,851 | ||||||||
Alphabet, Inc., Class C (a) | 8,831 | 12,483,591 | |||||||||
Facebook, Inc., Class A (a) | 18,720 | 4,250,750 | |||||||||
Netflix, Inc. (a) | 10,130 | 4,609,555 | |||||||||
Twitter, Inc. (a) | 152,680 | 4,548,337 | |||||||||
29,527,084 | |||||||||||
Consumer Discretionary (18.7%): | |||||||||||
Amazon.com, Inc. (a) | 6,540 | 18,042,683 | |||||||||
Booking Holdings, Inc. (a) | 1,810 | 2,882,135 | |||||||||
Chipotle Mexican Grill, Inc. (a) | 2,730 | 2,872,943 | |||||||||
Nike, Inc., Class B | 57,760 | 5,663,368 | |||||||||
Starbucks Corp. | 18,930 | 1,393,059 | |||||||||
Target Corp. | 30,940 | 3,710,634 | |||||||||
Tesla, Inc. (a) | 3,740 | 4,038,489 | |||||||||
The Home Depot, Inc. | 20,365 | 5,101,636 | |||||||||
The TJX Cos., Inc. | 86,110 | 4,353,722 | |||||||||
48,058,669 | |||||||||||
Consumer Staples (3.0%): | |||||||||||
Church & Dwight Co., Inc. | 51,050 | 3,946,165 | |||||||||
Constellation Brands, Inc., Class A | 22,760 | 3,981,862 | |||||||||
7,928,027 | |||||||||||
Electronic Equipment, Instruments & Components (1.0%): | |||||||||||
Amphenol Corp., Class A | 27,510 | 2,635,733 | |||||||||
Health Care (16.2%): | |||||||||||
bluebird bio, Inc. (a) | 33,310 | 2,033,242 | |||||||||
Bristol-Myers Squibb Co. | 87,290 | 5,132,652 | |||||||||
Eli Lilly & Co. | 27,650 | 4,539,577 | |||||||||
IQVIA Holdings, Inc. (a) | 27,520 | 3,904,538 | |||||||||
Masimo Corp. (a) | 13,070 | 2,979,829 | |||||||||
Royalty Pharma PLC, Class A (a) | 124,450 | 6,042,048 | |||||||||
Sage Therapeutics, Inc. (a) | 22,830 | 949,271 | |||||||||
The Cooper Cos., Inc. | 8,800 | 2,496,032 | |||||||||
UnitedHealth Group, Inc. | 17,910 | 5,282,555 | |||||||||
Vertex Pharmaceuticals, Inc. (a) | 18,460 | 5,359,123 | |||||||||
West Pharmaceutical Services, Inc. | 14,770 | 3,355,301 | |||||||||
42,074,168 | |||||||||||
Industrials (7.8%): | |||||||||||
FTI Consulting, Inc. (a) | 23,610 | 2,704,526 | |||||||||
IDEX Corp. | 22,660 | 3,581,186 | |||||||||
IHS Markit Ltd. | 37,130 | 2,803,315 | |||||||||
L3Harris Technologies, Inc. | 6,550 | 1,111,339 | |||||||||
Old Dominion Freight Line, Inc. | 17,520 | 2,971,217 | |||||||||
Roper Technologies, Inc. | 10,400 | 4,037,904 | |||||||||
Trane Technologies PLC | 31,490 | 2,801,980 | |||||||||
20,011,467 | |||||||||||
See notes to financial statements.
15
| Victory Portfolios Victory RS Growth Fund | Schedule of Portfolio Investments — continued June 30, 2020 | ||||||
(Unaudited)
Security Description | Shares | Value | |||||||||
IT Services (10.6%): | |||||||||||
Fiserv, Inc. (a) | 48,090 | $ | 4,694,546 | ||||||||
PayPal Holdings, Inc. (a) | 26,280 | 4,578,764 | |||||||||
Twilio, Inc., Class A (a) (b) | 38,630 | 8,476,195 | |||||||||
Visa, Inc., Class A (b) | 49,837 | 9,627,012 | |||||||||
27,376,517 | |||||||||||
Semiconductors & Semiconductor Equipment (5.9%): | |||||||||||
Lam Research Corp. | 11,360 | 3,674,506 | |||||||||
Marvell Technology Group Ltd. | 103,560 | 3,630,814 | |||||||||
NVIDIA Corp. | 10,160 | 3,859,885 | |||||||||
STMicroelectronics NV, NYS (b) | 147,620 | 4,046,264 | |||||||||
15,211,469 | |||||||||||
Software (17.5%): | |||||||||||
Fair Isaac Corp. (a) | 10,010 | 4,184,580 | |||||||||
Microsoft Corp. | 126,480 | 25,739,944 | |||||||||
RingCentral, Inc., Class A (a) | 24,910 | 7,099,599 | |||||||||
Salesforce.com, Inc. (a) | 9,380 | 1,757,155 | |||||||||
Synopsys, Inc. (a) | 14,740 | 2,874,300 | |||||||||
Workday, Inc., Class A (a) | 18,520 | 3,469,907 | |||||||||
45,125,485 | |||||||||||
Technology Hardware, Storage & Peripherals (6.8%): | |||||||||||
Apple, Inc. | 47,977 | 17,502,011 | |||||||||
Total Common Stocks (Cost $167,377,238) | 255,450,630 | ||||||||||
Collateral for Securities Loaned^ (7.8%) | |||||||||||
| BlackRock Liquidity Funds TempFund Portfolio, Institutional Class, 0.28% (c) | 333,729 | 333,729 | |||||||||
Fidelity Investments Money Market Government Portfolio, Class I, 0.09% (c) | 10,100,526 | 10,100,526 | |||||||||
| Goldman Sachs Financial Square Prime Obligations Fund, Institutional Class , 0.30% (c) | 2,320,742 | 2,320,742 | |||||||||
JPMorgan Prime Money Market Fund, Capital Class, 0.43% (c) | 1,327,995 | 1,327,995 | |||||||||
| Morgan Stanley Institutional Liquidity Prime Portfolio, Institutional Class, 0.41% (c) | 5,970,923 | 5,970,923 | |||||||||
Total Collateral for Securities Loaned (Cost $20,053,915) | 20,053,915 | ||||||||||
Total Investments (Cost $187,431,153) — 106.7% | 275,504,545 | ||||||||||
Liabilities in excess of other assets — (6.7)% | (17,184,967 | ) | |||||||||
NET ASSETS — 100.00% | $ | 258,319,578 | |||||||||
^ Purchased with cash collateral from securities on loan.
(a) Non-income producing security.
(b) All or a portion of this security is on loan.
(c) Rate disclosed is the daily yield on June 30, 2020.
NYS — New York Registered Shares
PLC — Public Limited Company
See notes to financial statements.
16
| Victory Portfolios Victory RS Science and Technology Fund | Schedule of Portfolio Investments June 30, 2020 | ||||||
(Unaudited)
Security Description | Shares | Value | |||||||||
Common Stocks (96.5%) | |||||||||||
Biotechnology (26.5%): | |||||||||||
Adaptimmune Therapeutics PLC, ADR (a) | 143,670 | $ | 1,438,136 | ||||||||
Adverum Biotechnologies, Inc. (a) | 65,990 | 1,377,871 | |||||||||
Aimmune Therapeutics, Inc. (a) (b) | 91,620 | 1,530,970 | |||||||||
Akouos, Inc. (a) | 35,000 | 787,500 | |||||||||
Albireo Pharma, Inc. (a) | 23,820 | 630,992 | |||||||||
Allogene Therapeutics, Inc. (a) (b) | 34,910 | 1,494,846 | |||||||||
Amicus Therapeutics, Inc. (a) | 71,640 | 1,080,331 | |||||||||
Apellis Pharmaceuticals, Inc. (a) | 73,603 | 2,403,874 | |||||||||
Arcus Biosciences, Inc. (a) | 49,820 | 1,232,547 | |||||||||
Arena Pharmaceuticals, Inc. (a) (b) | 18,440 | 1,160,798 | |||||||||
Ascendis Pharma A/S, ADR (a) | 13,190 | 1,950,801 | |||||||||
Athenex, Inc. (a) (b) | 43,520 | 598,835 | |||||||||
Atreca, Inc., Class A (a) (b) | 41,935 | 892,377 | |||||||||
Autolus Therapeutics PLC, ADR (a) | 57,600 | 923,328 | |||||||||
Avidity Biosciences, Inc. (a) | 48,000 | 1,356,480 | |||||||||
Avrobio, Inc. (a) | 66,310 | 1,157,110 | |||||||||
Beam Therapeutics, Inc. (a) (b) | 36,290 | 1,016,120 | |||||||||
BeiGene Ltd., ADR (a) | 6,450 | 1,215,180 | |||||||||
Bicycle Therapeutics PLC, ADR (a) (b) | 81,519 | 1,263,545 | |||||||||
bluebird bio, Inc. (a) | 82,310 | 5,024,201 | |||||||||
Blueprint Medicines Corp. (a) | 27,490 | 2,144,220 | |||||||||
Bridgebio Pharma, Inc. (a) (b) | 40,333 | 1,315,259 | |||||||||
Celyad SA, ADR (a) | 50,610 | 549,625 | |||||||||
Centogene NV (a) | 50,310 | 1,151,093 | |||||||||
Constellation Pharmaceuticals, Inc. (a) | 28,550 | 857,928 | |||||||||
Crinetics Pharmaceuticals, Inc. (a) (b) | 36,238 | 634,890 | |||||||||
CytomX Therapeutics, Inc. (a) | 127,250 | 1,059,993 | |||||||||
Dermtech, Inc. PIPE (a) | 307,693 | 4,070,772 | |||||||||
Editas Medicine, Inc. (a) (b) | 27,930 | 826,169 | |||||||||
Eidos Therapeutics, Inc. (a) (b) | 26,910 | 1,282,800 | |||||||||
Epizyme, Inc. (a) | 116,510 | 1,871,151 | |||||||||
Equillium, Inc. (a) | 210,460 | 620,857 | |||||||||
Exact Sciences Corp. (a) | 20,820 | 1,810,091 | |||||||||
Fate Therapeutics, Inc. (a) | 150,360 | 5,158,851 | |||||||||
Fusion Pharmaceuticals, Inc. (a) | 48,890 | 854,108 | |||||||||
Generation Bio Co. (a) | 45,470 | 954,870 | |||||||||
Gossamer Bio, Inc. (a) (b) | 80,980 | 1,052,740 | |||||||||
Gritstone Oncology, Inc. (a) (b) | 124,698 | 827,995 | |||||||||
Homology Medicines, Inc. (a) | 52,580 | 798,690 | |||||||||
Immunomedics, Inc. (a) | 38,230 | 1,354,871 | |||||||||
Invitae Corp. (a) | 58,565 | 1,773,934 | |||||||||
Iovance Biotherapeutics, Inc. (a) | 64,560 | 1,772,172 | |||||||||
KalVista Pharmaceuticals, Inc. (a) | 53,653 | 649,201 | |||||||||
Kezar Life Sciences, Inc. (a) | 332,406 | 1,721,863 | |||||||||
Krystal Biotech, Inc. (a) | 12,740 | 527,691 | |||||||||
Kura Oncology, Inc. (a) | 102,900 | 1,677,270 | |||||||||
MacroGenics, Inc. (a) (b) | 44,170 | 1,233,226 | |||||||||
Matinas BioPharma Holdings, Inc. (a) (b) | 712,390 | 550,677 | |||||||||
See notes to financial statements.
17
| Victory Portfolios Victory RS Science and Technology Fund | Schedule of Portfolio Investments — continued June 30, 2020 | ||||||
(Unaudited)
Security Description | Shares | Value | |||||||||
Mirati Therapeutics, Inc. (a) | 14,260 | $ | 1,628,064 | ||||||||
Myovant Sciences Ltd. (a) (b) | 62,970 | 1,298,441 | |||||||||
Neurocrine Biosciences, Inc. (a) | 6,300 | 768,600 | |||||||||
ORIC Pharmaceuticals, Inc. (a) (b) | 25,870 | 872,595 | |||||||||
Passage Bio, Inc. (a) (b) | 20,550 | 561,632 | |||||||||
Precision BioSciences, Inc. (a) (b) | 113,560 | 945,955 | |||||||||
RAPT Therapeutics, Inc. (a) (b) | 20,900 | 606,518 | |||||||||
Replimune Group, Inc. (a) | 85,370 | 2,121,445 | |||||||||
REVOLUTION Medicines, Inc. (a) | 9,660 | 304,966 | |||||||||
Sage Therapeutics, Inc. (a) | 20,370 | 846,985 | |||||||||
Scholar Rock Holding Corp. (a) (b) | 49,670 | 904,491 | |||||||||
SpringWorks Therapeutics, Inc. (a) (b) | 24,240 | 1,018,080 | |||||||||
Stoke Therapeutics, Inc. (a) (b) | 26,620 | 634,355 | |||||||||
Surface Oncology, Inc. (a) | 325,920 | 2,138,035 | |||||||||
Sutro Biopharma, Inc. (a) (b) | 62,190 | 482,594 | |||||||||
Turning Point Therapeutics, Inc. (a) | 16,040 | 1,036,024 | |||||||||
Twist Bioscience Corp. (a) (b) | 57,460 | 2,602,938 | |||||||||
Zymeworks, Inc. (a) | 41,870 | 1,510,251 | |||||||||
87,920,818 | |||||||||||
Communication Services (5.3%): | |||||||||||
Boingo Wireless, Inc. (a) (b) | 280,870 | 3,741,188 | |||||||||
Facebook, Inc., Class A (a) | 20,750 | 4,711,702 | |||||||||
Match Group, Inc. (a) (b) | 38,760 | 4,149,258 | |||||||||
Take-Two Interactive Software, Inc. (a) | 20,270 | 2,829,084 | |||||||||
Twitter, Inc. (a) | 68,030 | 2,026,614 | |||||||||
ZoomInfo Technologies, Inc., Class A (a) | 1,000 | 51,030 | |||||||||
17,508,876 | |||||||||||
Communications Equipment (1.9%): | |||||||||||
Lumentum Holdings, Inc. (a) | 45,570 | 3,710,765 | |||||||||
Viavi Solutions, Inc. (a) (b) | 200,980 | 2,560,485 | |||||||||
6,271,250 | |||||||||||
Consumer Discretionary (4.2%): | |||||||||||
Amazon.com, Inc. (a) | 3,500 | 9,655,870 | |||||||||
Arco Platform Ltd., Class A (a) | 49,910 | 2,170,087 | |||||||||
Booking Holdings, Inc. (a) | 1,220 | 1,942,655 | |||||||||
13,768,612 | |||||||||||
Electronic Equipment, Instruments & Components (3.5%): | |||||||||||
Airgain, Inc. (a) (b) | 92,078 | 988,918 | |||||||||
Dolby Laboratories, Inc., Class A | 34,410 | 2,266,587 | |||||||||
Fabrinet (a) | 56,250 | 3,511,125 | |||||||||
Keysight Technologies, Inc. (a) | 23,780 | 2,396,548 | |||||||||
Rogers Corp. (a) (b) | 17,990 | 2,241,554 | |||||||||
11,404,732 | |||||||||||
Financials (0.6%): | |||||||||||
LendingTree, Inc. (a) (b) | 6,330 | 1,832,725 | |||||||||
See notes to financial statements.
18
| Victory Portfolios Victory RS Science and Technology Fund | Schedule of Portfolio Investments — continued June 30, 2020 | ||||||
(Unaudited)
Security Description | Shares | Value | |||||||||
Health Care Equipment & Supplies (1.6%): | |||||||||||
CryoPort, Inc. (a) (b) | 155,793 | $ | 4,712,738 | ||||||||
Quotient Ltd. (a) (b) | 111,620 | 825,988 | |||||||||
5,538,726 | |||||||||||
Health Care Providers & Services (0.3%): | |||||||||||
Exagen, Inc. (a) (b) | 81,012 | 1,005,359 | |||||||||
Health Care Technology (1.2%): | |||||||||||
iCAD, Inc. (a) | 18,350 | 183,317 | |||||||||
Veeva Systems, Inc., Class A (a) | 16,620 | 3,896,060 | |||||||||
4,079,377 | |||||||||||
IT Services (9.5%): | |||||||||||
Euronet Worldwide, Inc. (a) | 14,600 | 1,398,972 | |||||||||
Global Payments, Inc. | 15,680 | 2,659,642 | |||||||||
GoDaddy, Inc., Class A (a) | 44,870 | 3,290,317 | |||||||||
Twilio, Inc., Class A (a) (b) | 41,150 | 9,029,132 | |||||||||
Visa, Inc., Class A (b) | 29,550 | 5,708,174 | |||||||||
Wix.com Ltd. (a) | 39,120 | 10,023,326 | |||||||||
32,109,563 | |||||||||||
Life Sciences Tools & Services (2.3%): | |||||||||||
10X Genomics, Inc., Class A (a) | 25,890 | 2,312,236 | |||||||||
Adaptive Biotechnologies Corp. (a) | 19,170 | 927,445 | |||||||||
Illumina, Inc. (a) | 6,850 | 2,536,897 | |||||||||
NeoGenomics, Inc. (a) | 63,530 | 1,968,159 | |||||||||
7,744,737 | |||||||||||
Pharmaceuticals (2.2%): | |||||||||||
Assembly Biosciences, Inc. (a) | 82,630 | 1,926,932 | |||||||||
GW Pharmaceuticals PLC, ADR (a) (b) | 15,740 | 1,931,613 | |||||||||
Kaleido Biosciences, Inc. (a) (b) | 43,790 | 325,360 | |||||||||
Lyra Therapeutics, Inc. (a) (b) | 29,550 | 335,097 | |||||||||
Marinus Pharmaceuticals, Inc. (a) | 249,860 | 634,644 | |||||||||
MyoKardia, Inc. (a) | 12,950 | 1,251,229 | |||||||||
Provention Bio, Inc. (a) (b) | 68,400 | 965,124 | |||||||||
7,369,999 | |||||||||||
Semiconductors & Semiconductor Equipment (13.1%): | |||||||||||
Cohu, Inc. | 213,740 | 3,706,252 | |||||||||
Lam Research Corp. | 18,220 | 5,893,441 | |||||||||
Lattice Semiconductor Corp. (a) | 184,760 | 5,245,336 | |||||||||
MACOM Technology Solutions Holdings, Inc. (a) | 227,830 | 7,825,961 | |||||||||
Marvell Technology Group Ltd. | 123,560 | 4,332,014 | |||||||||
MKS Instruments, Inc. | 34,530 | 3,910,177 | |||||||||
Monolithic Power Systems, Inc. | 13,120 | 3,109,440 | |||||||||
NVIDIA Corp. | 10,480 | 3,981,457 | |||||||||
STMicroelectronics NV, NYS (b) | 201,740 | 5,529,693 | |||||||||
43,533,771 | |||||||||||
See notes to financial statements.
19
| Victory Portfolios Victory RS Science and Technology Fund | Schedule of Portfolio Investments — continued June 30, 2020 | ||||||
(Unaudited)
Security Description | Shares | Value | |||||||||
Software (24.3%): | |||||||||||
Avaya Holdings Corp. (a) | 172,460 | $ | 2,131,606 | ||||||||
Coupa Software, Inc. (a) | 24,860 | 6,887,214 | |||||||||
DocuSign, Inc. (a) | 43,340 | 7,463,581 | |||||||||
Domo, Inc., Class B (a) | 105,370 | 3,389,753 | |||||||||
Dropbox, Inc., Class A (a) | 145,070 | 3,158,174 | |||||||||
Fair Isaac Corp. (a) | 7,560 | 3,160,382 | |||||||||
Microsoft Corp. | 75,810 | 15,428,094 | |||||||||
Paycom Software, Inc. (a) | 13,740 | 4,255,690 | |||||||||
Proofpoint, Inc. (a) | 28,029 | 3,114,582 | |||||||||
RingCentral, Inc., Class A (a) | 64,060 | 18,257,742 | |||||||||
ServiceNow, Inc. (a) | 18,370 | 7,440,952 | |||||||||
Varonis Systems, Inc. (a) (b) | 40,500 | 3,583,440 | |||||||||
Zendesk, Inc. (a) | 26,810 | 2,373,489 | |||||||||
80,644,699 | |||||||||||
Total Common Stocks (Cost $201,935,530) | 320,733,244 | ||||||||||
Collateral for Securities Loaned^ (14.7%) | |||||||||||
| BlackRock Liquidity Funds TempFund Portfolio, Institutional Class, 0.28% (c) | 811,036 | 811,036 | |||||||||
| Fidelity Investments Money Market Government Portfolio, Class I, 0.09% (c) | 24,546,569 | 24,546,569 | |||||||||
| Goldman Sachs Financial Square Prime Obligations Fund, Institutional Class, 0.30% (c) | 5,639,929 | 5,639,929 | |||||||||
JPMorgan Prime Money Market Fund, Capital Class, 0.43% (c) | 3,227,329 | 3,227,329 | |||||||||
| Morgan Stanley Institutional Liquidity Prime Portfolio, Institutional Class, 0.41% (c) | 14,510,700 | 14,510,700 | |||||||||
Total Collateral for Securities Loaned (Cost $48,735,563) | 48,735,563 | ||||||||||
Total Investments (Cost $250,671,093) — 111.2% | 369,468,807 | ||||||||||
Liabilities in excess of other assets — (11.2)% | (37,220,305 | ) | |||||||||
NET ASSETS — 100.00% | $ | 332,248,502 | |||||||||
^ Purchased with cash collateral from securities on loan.
(a) Non-income producing security.
(b) All or a portion of this security is on loan.
(c) Rate disclosed is the daily yield on June 30, 2020.
ADR — American Depositary Receipt
NYS — New York Registered Shares
PIPE — Private Investment in Public Equity
PLC — Public Limited Company
See notes to financial statements.
20
| Victory Portfolios Victory RS Small Cap Equity Fund | Schedule of Portfolio Investments June 30, 2020 | ||||||
(Unaudited)
Security Description | Shares | Value | |||||||||
Common Stocks (98.3%) | |||||||||||
Biotechnology (22.1%): | |||||||||||
Adaptimmune Therapeutics PLC, ADR (a) | 31,480 | $ | 315,115 | ||||||||
Aimmune Therapeutics, Inc. (a) (b) | 34,650 | 579,002 | |||||||||
Allogene Therapeutics, Inc. (a) (b) | 11,280 | 483,010 | |||||||||
Amicus Therapeutics, Inc. (a) | 59,534 | 897,773 | |||||||||
Apellis Pharmaceuticals, Inc. (a) | 19,940 | 651,240 | |||||||||
Arcus Biosciences, Inc. (a) | 14,810 | 366,399 | |||||||||
Arena Pharmaceuticals, Inc. (a) | 10,310 | 649,015 | |||||||||
Ascendis Pharma A/S, ADR (a) | 4,500 | 665,550 | |||||||||
Avidity Biosciences, Inc. (a) (b) | 13,804 | 390,101 | |||||||||
bluebird bio, Inc. (a) | 11,417 | 696,894 | |||||||||
Blueprint Medicines Corp. (a) | 9,138 | 712,764 | |||||||||
Celyad SA, ADR (a) | 11,626 | 126,258 | |||||||||
Constellation Pharmaceuticals, Inc. (a) | 12,700 | 381,635 | |||||||||
CytomX Therapeutics, Inc. (a) | 37,440 | 311,875 | |||||||||
Epizyme, Inc. (a) | 36,950 | 593,417 | |||||||||
Equillium, Inc. (a) | 25,948 | 76,547 | |||||||||
Fate Therapeutics, Inc. (a) | 28,900 | 991,558 | |||||||||
Generation Bio Co. (a) | 13,030 | 273,630 | |||||||||
Gossamer Bio, Inc. (a) | 24,770 | 322,010 | |||||||||
Immunomedics, Inc. (a) | 12,830 | 454,695 | |||||||||
Invitae Corp. (a) | 18,320 | 554,913 | |||||||||
Iovance Biotherapeutics, Inc. (a) | 22,051 | 605,300 | |||||||||
Krystal Biotech, Inc. (a) | 4,730 | 195,917 | |||||||||
Kura Oncology, Inc. (a) | 33,510 | 546,213 | |||||||||
Mirati Therapeutics, Inc. (a) | 6,050 | 690,729 | |||||||||
Myovant Sciences Ltd. (a) | 32,110 | 662,108 | |||||||||
ORIC Pharmaceuticals, Inc. (a) (b) | 9,610 | 324,145 | |||||||||
Replimune Group, Inc. (a) | 17,610 | 437,609 | |||||||||
Sage Therapeutics, Inc. (a) | 6,880 | 286,070 | |||||||||
Twist Bioscience Corp. (a) | 9,690 | 438,957 | |||||||||
14,680,449 | |||||||||||
Communication Services (4.7%): | |||||||||||
Bandwidth, Inc., Class A (a) (b) | 17,760 | 2,255,520 | |||||||||
Cardlytics, Inc. (a) (b) | 5,280 | 369,494 | |||||||||
EverQuote, Inc., Class A (a) | 7,660 | 445,506 | |||||||||
3,070,520 | |||||||||||
Consumer Discretionary (8.1%): | |||||||||||
Arco Platform Ltd., Class A (a) | 13,663 | 594,067 | |||||||||
Denny's Corp. (a) | 6,200 | 62,620 | |||||||||
Eldorado Resorts, Inc. (a) (b) | 17,360 | 695,442 | |||||||||
Fox Factory Holding Corp. (a) | 5,220 | 431,224 | |||||||||
Frontdoor, Inc. (a) | 12,790 | 566,981 | |||||||||
Ollie's Bargain Outlet Holdings, Inc. (a) (b) | 4,360 | 425,754 | |||||||||
Planet Fitness, Inc., Class A (a) | 8,520 | 516,056 | |||||||||
Skyline Champion Corp. (a) | 11,520 | 280,397 | |||||||||
Strategic Education, Inc. | 7,470 | 1,147,765 | |||||||||
See notes to financial statements.
21
| Victory Portfolios Victory RS Small Cap Equity Fund | Schedule of Portfolio Investments — continued June 30, 2020 | ||||||
(Unaudited)
Security Description | Shares | Value | |||||||||
Wingstop, Inc. | 2,330 | $ | 323,800 | ||||||||
YETI Holdings, Inc. (a) | 8,830 | 377,306 | |||||||||
5,421,412 | |||||||||||
Consumer Staples (6.0%): | |||||||||||
BellRing Brands, Inc., Class A (a) | 58,970 | 1,175,862 | |||||||||
BJ's Wholesale Club Holdings, Inc. (a) | 13,820 | 515,071 | |||||||||
elf Beauty, Inc. (a) | 39,790 | 758,795 | |||||||||
Freshpet, Inc. (a) | 6,147 | 514,258 | |||||||||
Hostess Brands, Inc. (a) | 85,740 | 1,047,744 | |||||||||
4,011,730 | |||||||||||
Electronic Equipment, Instruments & Components (0.9%): | |||||||||||
Itron, Inc. (a) | 8,770 | 581,013 | |||||||||
Energy (0.4%): | |||||||||||
Amyris, Inc. PIPE (a) (c) (d) | 73,240 | 287,101 | |||||||||
Financials (5.1%): | |||||||||||
Assetmark Financial Holdings, Inc. (a) | 10,340 | 282,179 | |||||||||
eHealth, Inc. (a) | 4,561 | 448,073 | |||||||||
Essent Group Ltd. | 8,950 | 324,617 | |||||||||
FirstCash, Inc., Class A | 5,990 | 404,205 | |||||||||
LendingTree, Inc. (a) (b) | 930 | 269,263 | |||||||||
PRA Group, Inc. (a) (b) | 22,420 | 866,757 | |||||||||
Walker & Dunlop, Inc. | 9,022 | 458,407 | |||||||||
Western Alliance Bancorp | 8,740 | 330,984 | |||||||||
3,384,485 | |||||||||||
Health Care Equipment & Supplies (5.4%): | |||||||||||
CryoPort, Inc. (a) (b) | 14,850 | 449,213 | |||||||||
iRhythm Technologies, Inc. (a) (b) | 9,010 | 1,044,169 | |||||||||
Masimo Corp. (a) | 2,825 | 644,072 | |||||||||
Nevro Corp. (a) | 7,090 | 847,042 | |||||||||
Silk Road Medical, Inc. (a) (b) | 15,380 | 644,268 | |||||||||
3,628,764 | |||||||||||
Health Care Providers & Services (3.7%): | |||||||||||
Hanger, Inc. (a) | 19,330 | 320,105 | |||||||||
HealthEquity, Inc. (a) (b) | �� | 10,200 | 598,434 | ||||||||
LHC Group, Inc. (a) | 9,010 | 1,570,623 | |||||||||
2,489,162 | |||||||||||
Health Care Technology (2.1%): | |||||||||||
Health Catalyst, Inc. (a) (b) | 19,716 | 575,116 | |||||||||
Inspire Medical System, Inc. (a) | 9,570 | 832,781 | |||||||||
1,407,897 | |||||||||||
Industrials (12.8%): | |||||||||||
Advanced Drainage Systems, Inc. | 12,020 | 593,788 | |||||||||
Axon Enterprise, Inc. (a) (b) | 5,294 | 519,500 | |||||||||
ESCO Technologies, Inc. | 4,720 | 398,982 | |||||||||
Evoqua Water Technologies Corp. (a) | 29,710 | 552,606 | |||||||||
FTI Consulting, Inc. (a) | 8,680 | 994,294 | |||||||||
See notes to financial statements.
22
| Victory Portfolios Victory RS Small Cap Equity Fund | Schedule of Portfolio Investments — continued June 30, 2020 | ||||||
(Unaudited)
Security Description | Shares | Value | |||||||||
Generac Holdings, Inc. (a) | 5,440 | $ | 663,299 | ||||||||
Kornit Digital Ltd. (a) (b) | 6,700 | 357,646 | |||||||||
Mercury Systems, Inc. (a) | 13,960 | 1,098,094 | |||||||||
Saia, Inc. (a) | 599 | 66,597 | |||||||||
Simpson Manufacturing Co., Inc. | 8,970 | 756,709 | |||||||||
SiteOne Landscape Supply, Inc. (a) | 8,930 | 1,017,752 | |||||||||
Trex Co., Inc. (a) (b) | 5,730 | 745,301 | |||||||||
Watts Water Technologies, Inc., Class A | 10,250 | 830,250 | |||||||||
8,594,818 | |||||||||||
IT Services (7.4%): | |||||||||||
Evo Payments, Inc., Class A (a) | 24,330 | 555,454 | |||||||||
LiveRamp Holdings, Inc. (a) | 17,482 | 742,461 | |||||||||
Repay Holdings Corp. (a) | 17,394 | 428,414 | |||||||||
Wix.com Ltd. (a) | 9,620 | 2,464,836 | |||||||||
WNS Holdings Ltd., ADR (a) | 12,388 | 681,092 | |||||||||
4,872,257 | |||||||||||
Pharmaceuticals (1.3%): | |||||||||||
Assembly Biosciences, Inc. (a) | 14,120 | 329,278 | |||||||||
GW Pharmaceuticals PLC, ADR (a) (b) | 4,240 | 520,333 | |||||||||
849,611 | |||||||||||
Semiconductors & Semiconductor Equipment (6.5%): | |||||||||||
Advanced Energy Industries, Inc. (a) | 12,140 | 822,971 | |||||||||
Cabot Microelectronics Corp. | 5,560 | 775,842 | |||||||||
Lattice Semiconductor Corp. (a) | 39,800 | 1,129,922 | |||||||||
MACOM Technology Solutions Holdings, Inc. (a) | 25,700 | 882,795 | |||||||||
Silicon Laboratories, Inc. (a) | 7,490 | 751,022 | |||||||||
4,362,552 | |||||||||||
Software (11.8%): | |||||||||||
ACI Worldwide, Inc. (a) (b) | 31,810 | 858,552 | |||||||||
Avaya Holdings Corp. (a) (b) | 68,510 | 846,784 | |||||||||
Bill.com Holdings, Inc. (a) | 3,770 | 340,092 | |||||||||
Cornerstone OnDemand, Inc. (a) | 5,521 | 212,890 | |||||||||
Envestnet, Inc. (a) | 11,370 | 836,150 | |||||||||
Everbridge, Inc. (a) | 13,790 | 1,907,983 | |||||||||
Five9, Inc. (a) (b) | 5,220 | 577,697 | |||||||||
Q2 Holdings, Inc. (a) (b) | 9,640 | 827,016 | |||||||||
Varonis Systems, Inc. (a) | 15,850 | 1,402,407 | |||||||||
7,809,571 | |||||||||||
Total Common Stocks (Cost $52,653,505) | 65,451,342 | ||||||||||
Preferred Stocks (0.3%) | |||||||||||
Energy (0.3%): | |||||||||||
Amyris, Inc. PIPE (a) (c) (d) | 178 | 227,852 | |||||||||
Total Preferred Stocks (Cost $178,330) | 227,852 | ||||||||||
See notes to financial statements.
23
| Victory Portfolios Victory RS Small Cap Equity Fund | Schedule of Portfolio Investments — continued June 30, 2020 | ||||||
(Unaudited)
Security Description | Shares | Value | |||||||||
Collateral for Securities Loaned^ (15.4%) | |||||||||||
| BlackRock Liquidity Funds TempFund Portfolio, Institutional Class, 0.28% (e) | 171,386 | $ | 171,386 | ||||||||
| Fidelity Investments Money Market Government Portfolio, Class I, 0.09% (e) | 5,187,129 | 5,187,129 | |||||||||
| Goldman Sachs Financial Square Prime Obligations Fund, Institutional Class, 0.30% (e) | 1,191,818 | 1,191,818 | |||||||||
JPMorgan Prime Money Market Fund, Capital Class, 0.43% (e) | 681,992 | 681,992 | |||||||||
| Morgan Stanley Institutional Liquidity Prime Portfolio, Institutional Class, 0.41% (e) | 3,066,371 | 3,066,371 | |||||||||
Total Collateral for Securities Loaned (Cost $10,298,696) | 10,298,696 | ||||||||||
Total Investments (Cost $63,130,531) — 114.0% | 75,977,890 | ||||||||||
Liabilities in excess of other assets — (14.0)% | (9,302,728 | ) | |||||||||
NET ASSETS — 100.00% | $ | 66,675,162 | |||||||||
^ Purchased with cash collateral from securities on loan.
(a) Non-income producing security.
(b) All or a portion of this security is on loan.
(c) The Fund's Adviser has deemed this security to be illiquid based upon procedures approved by the Board of Trustees. As of June 30, 2020, illiquid securities were 0.8% of the Fund's net assets.
(d) Security was fair valued based upon procedures approved by the Board of Trustees and represents 0.8% of the Fund's net assets as of June 30, 2020.
(e) Rate disclosed is the daily yield on June 30, 2020.
ADR — American Depositary Receipt
PIPE — Private Investment in Public Equity
PLC — Public Limited Company
See notes to financial statements.
24
Victory Portfolios | Statements of Assets and Liabilities June 30, 2020 | ||||||
(Unaudited)
| Victory RS Small Cap Growth Fund | Victory RS Select Growth Fund | Victory RS Mid Cap Growth Fund | |||||||||||||
ASSETS: | |||||||||||||||
| Investments, at value (Cost $1,988,562,338, $154,673,739 and $437,352,576) | $ | 2,493,344,871 | (a) | $ | 213,880,615 | (b) | $ | 550,331,996 | (c) | ||||||
Cash and cash equivalents | 17,664,690 | 2,706,569 | 10,752,967 | ||||||||||||
Receivables: | |||||||||||||||
Interest and dividends | 216,341 | 27,810 | 130,495 | ||||||||||||
Capital shares issued | 941,292 | 105,544 | 286,742 | ||||||||||||
Investments sold | 43,879,976 | — | 4,164,859 | ||||||||||||
From Adviser | 108,663 | 39,686 | 119,765 | ||||||||||||
Prepaid expenses | 35,790 | 13,309 | 22,936 | ||||||||||||
Total Assets | 2,556,191,623 | 216,773,533 | 565,809,760 | ||||||||||||
LIABILITIES: | |||||||||||||||
Payables: | |||||||||||||||
Collateral received on loaned securities | 273,945,855 | 13,066,652 | 38,242,799 | ||||||||||||
Investments purchased | 27,530,597 | 742,353 | 9,214,404 | ||||||||||||
Capital shares redeemed | 2,187,200 | 220,015 | 193,507 | ||||||||||||
Accrued expenses and other payables: | |||||||||||||||
Investment advisory fees | 1,724,681 | 163,704 | 356,743 | ||||||||||||
Administration fees | 110,328 | 9,662 | 25,347 | ||||||||||||
Custodian fees | 8,299 | 267 | 3,755 | ||||||||||||
Transfer agent fees | 380,948 | 55,331 | 99,160 | ||||||||||||
Compliance fees | 1,813 | 183 | 406 | ||||||||||||
| 12b-1 fees | 74,024 | 19,458 | 15,143 | ||||||||||||
Other accrued expenses | 105,755 | 18,133 | 30,939 | ||||||||||||
Total Liabilities | 306,069,500 | 14,295,758 | 48,182,203 | ||||||||||||
NET ASSETS: | |||||||||||||||
Capital | 1,670,936,941 | 99,257,368 | 404,703,762 | ||||||||||||
Total distributable earnings/(loss) | 579,185,182 | 103,220,407 | 112,923,795 | ||||||||||||
Net Assets | $ | 2,250,122,123 | $ | 202,477,775 | $ | 517,627,557 | |||||||||
Net Assets | |||||||||||||||
Class A Shares | $ | 646,912,930 | $ | 96,788,790 | $ | 81,701,820 | |||||||||
Class C Shares | 17,529,616 | 23,472,479 | 16,205,046 | ||||||||||||
Class R Shares | 6,268,801 | 534,657 | 720,517 | ||||||||||||
Class R6 Shares | 493,422,595 | 323,493 | 23,434,581 | ||||||||||||
Class Y Shares | 1,085,988,181 | 81,358,356 | 395,565,593 | ||||||||||||
Total | $ | 2,250,122,123 | $ | 202,477,775 | $ | 517,627,557 | |||||||||
| Shares (unlimited number of shares authorized with a par value of $0.001 per share): | |||||||||||||||
Class A Shares | 8,146,652 | 2,700,604 | 3,047,205 | ||||||||||||
Class C Shares | 265,825 | 830,361 | 702,796 | ||||||||||||
Class R Shares | 87,738 | 18,523 | 29,545 | ||||||||||||
Class R6 Shares | 5,893,552 | 8,467 | 837,692 | ||||||||||||
Class Y Shares | 13,004,151 | 2,138,812 | 14,151,648 | ||||||||||||
Total | 27,397,918 | 5,696,767 | 18,768,886 | ||||||||||||
| Net asset value, offering (except Class A Shares) and redemption price per share: | |||||||||||||||
Class A Shares | $ | 79.41 | $ | 35.84 | $ | 26.81 | |||||||||
Class C Shares (d) | $ | 65.94 | $ | 28.27 | $ | 23.06 | |||||||||
Class R Shares | $ | 71.45 | $ | 28.86 | $ | 24.39 | |||||||||
Class R6 Shares | $ | 83.72 | $ | 38.21 | $ | 27.98 | |||||||||
Class Y Shares | $ | 83.51 | $ | 38.04 | $ | 27.95 | |||||||||
Maximum Sales Charge — Class A Shares | 5.75 | % | 5.75 | % | 5.75 | % | |||||||||
| Maximum offering price (100%/(100%-maximum sales charge) of net asset value adjusted to the nearest cent) per share — Class A Shares | $ | 84.25 | $ | 38.03 | $ | 28.45 | |||||||||
(a) Includes $271,352,115 of securities on loan.
(b) Includes $12,914,499 of securities on loan.
(c) Includes $38,186,338 of securities on loan.
(d) Redemption price per share varies by the length of time shares are held.
See notes to financial statements.
25
Victory Portfolios | Statements of Assets and Liabilities June 30, 2020 | ||||||
(Unaudited)
| Victory RS Growth Fund | Victory RS Science and Technology Fund | Victory RS Small Cap Equity Fund | |||||||||||||
ASSETS: | |||||||||||||||
| Investments, at value (Cost $187,431,153, $250,671,093 and $63,130,531) | $ | 275,504,545 | (a) | $ | 369,468,807 | (b) | $ | 75,977,890 | (c) | ||||||
Cash and cash equivalents | 1,430,779 | 11,227,173 | 566,670 | ||||||||||||
Receivables: | |||||||||||||||
Interest and dividends | 82,454 | 81,610 | 7,333 | ||||||||||||
Capital shares issued | 108 | 302,094 | 484 | ||||||||||||
Investments sold | 3,083,277 | 1,634,080 | 1,292,390 | ||||||||||||
From Adviser | 49,263 | 7,431 | 6,281 | ||||||||||||
Prepaid expenses | 1,160 | 1,282 | 21,343 | ||||||||||||
Total Assets | 280,151,586 | 382,722,477 | 77,872,391 | ||||||||||||
LIABILITIES: | |||||||||||||||
Payables: | |||||||||||||||
Collateral received on loaned securities | 20,053,915 | 48,735,563 | 10,298,696 | ||||||||||||
Investments purchased | 1,430,678 | 1,179,500 | 822,429 | ||||||||||||
Capital shares redeemed | 90,925 | 175,789 | 5,053 | ||||||||||||
Accrued expenses and other payables: | |||||||||||||||
Investment advisory fees | 156,153 | 262,682 | 40,441 | ||||||||||||
Administration fees | 12,594 | 15,999 | 3,262 | ||||||||||||
Custodian fees | 2,122 | 1,794 | 380 | ||||||||||||
Transfer agent fees | 35,178 | 51,738 | 11,272 | ||||||||||||
Compliance fees | 220 | 259 | 56 | ||||||||||||
| 12b-1 fees | 24,488 | 29,561 | 6,818 | ||||||||||||
Other accrued expenses | 25,735 | 21,090 | 8,822 | ||||||||||||
Total Liabilities | 21,832,008 | 50,473,975 | 11,197,229 | ||||||||||||
NET ASSETS: | |||||||||||||||
Capital | 158,249,213 | 202,319,401 | 47,126,358 | ||||||||||||
Total distributable earnings/(loss) | 100,070,365 | 129,929,101 | 19,548,804 | ||||||||||||
Net Assets | $ | 258,319,578 | $ | 332,248,502 | $ | 66,675,162 | |||||||||
Net Assets | |||||||||||||||
Class A Shares | $ | 226,317,838 | $ | 232,839,611 | $ | 59,950,625 | |||||||||
Class C Shares | 3,698,569 | 14,675,941 | 349,435 | ||||||||||||
Class R Shares | 345,284 | 886,315 | 3,031,458 | ||||||||||||
Class Y Shares | 27,957,887 | 83,846,635 | 3,343,644 | ||||||||||||
Total | $ | 258,319,578 | $ | 332,248,502 | $ | 66,675,162 | |||||||||
| Shares (unlimited number of shares authorized with a par value of $0.001 per share): | |||||||||||||||
Class A Shares | 10,929,392 | 8,413,044 | 3,636,798 | ||||||||||||
Class C Shares | 220,507 | 701,822 | 82,642 | ||||||||||||
Class R Shares | 18,590 | 38,264 | 240,215 | ||||||||||||
Class Y Shares | 1,288,555 | 2,788,654 | 196,907 | ||||||||||||
Total | 12,457,044 | 11,941,784 | 4,156,562 | ||||||||||||
| Net asset value, offering (except Class A Shares) and redemption price per share: | |||||||||||||||
Class A Shares | $ | 20.71 | $ | 27.68 | $ | 16.48 | |||||||||
Class C Shares (d) | $ | 16.77 | $ | 20.91 | $ | 4.23 | |||||||||
Class R Shares | $ | 18.57 | $ | 23.16 | $ | 12.62 | |||||||||
Class Y Shares | $ | 21.70 | $ | 30.07 | $ | 16.98 | |||||||||
Maximum Sales Charge — Class A Shares | 5.75 | % | 5.75 | % | 5.75 | % | |||||||||
| Maximum offering price (100%/(100%-maximum sales charge) of net asset value adjusted to the nearest cent) per share — Class A Shares | $ | 21.97 | $ | 29.37 | $ | 17.49 | |||||||||
(a) Includes $20,085,225 of securities on loan.
(b) Includes $48,058,199 of securities on loan.
(c) Includes $10,204,751 of securities on loan.
(d) Redemption price per share varies by the length of time shares are held.
See notes to financial statements.
26
Victory Portfolios | Statements of Operations For the Six Months Ended June 30, 2020 | ||||||
(Unaudited)
| Victory RS Small Cap Growth Fund | Victory RS Select Growth Fund | Victory RS Mid Cap Growth Fund | |||||||||||||
Investment Income: | |||||||||||||||
Dividends | $ | 1,771,215 | $ | 246,470 | $ | 1,020,974 | |||||||||
Interest | 191,020 | 11,618 | 26,890 | ||||||||||||
Securities lending (net of fees) | 643,221 | 33,476 | 209,171 | ||||||||||||
Total Income | 2,605,456 | 291,564 | 1,257,035 | ||||||||||||
Expenses: | |||||||||||||||
Investment advisory fees | 9,852,267 | 981,601 | 2,072,830 | ||||||||||||
Administration fees | 634,396 | 60,021 | 149,275 | ||||||||||||
Sub-Administration fees | 7,419 | 7,446 | 7,419 | ||||||||||||
12b-1 fees — Class A Shares | 756,834 | 112,294 | 96,054 | ||||||||||||
12b-1 fees — Class C Shares | 83,300 | 117,713 | 88,191 | ||||||||||||
12b-1 fees — Class R Shares | 15,859 | 1,417 | 1,909 | ||||||||||||
Custodian fees | 60,484 | 7,509 | 12,624 | ||||||||||||
Transfer agent fees — Class A Shares | 436,963 | 58,282 | 56,892 | ||||||||||||
Transfer agent fees — Class C Shares | 9,911 | 13,437 | 9,577 | ||||||||||||
Transfer agent fees — Class R Shares | 6,387 | 1,842 | 1,098 | ||||||||||||
Transfer agent fees — Class R6 Shares | 8,969 | 65 | 361 | ||||||||||||
Transfer agent fees — Class Y Shares | 593,270 | 47,216 | 244,643 | ||||||||||||
Trustees' fees | 89,907 | 9,263 | 21,069 | ||||||||||||
Compliance fees | 8,632 | 855 | 2,033 | ||||||||||||
Legal and audit fees | 85,965 | 11,630 | 23,047 | ||||||||||||
State registration and filing fees | 73,328 | 42,987 | 49,242 | ||||||||||||
Interfund lending fees | — | — | 59 | ||||||||||||
Other expenses | 121,464 | 16,764 | 37,532 | ||||||||||||
Total Expenses | 12,845,355 | 1,490,342 | 2,873,855 | ||||||||||||
Expenses waived/reimbursed by Adviser | (367,785 | ) | (130,851 | ) | (357,038 | ) | |||||||||
Net Expenses | 12,477,570 | 1,359,491 | 2,516,817 | ||||||||||||
Net Investment Income (Loss) | (9,872,114 | ) | (1,067,927 | ) | (1,259,782 | ) | |||||||||
| Realized/Unrealized Gains (Losses) from Investments: | |||||||||||||||
| Net realized gains (losses) from investment securities | (52,880,854 | ) | 10,672,794 | 8,852,381 | |||||||||||
| Net change in unrealized appreciation/depreciation on investment securities | 106,648,573 | (473,169 | ) | 16,406,657 | |||||||||||
| Net realized/unrealized gains (losses) on investments | 53,767,719 | 10,199,625 | 25,259,038 | ||||||||||||
Change in net assets resulting from operations | $ | 43,895,605 | $ | 9,131,698 | $ | 23,999,256 | |||||||||
See notes to financial statements.
27
Victory Portfolios | Statements of Operations For the Six Months Ended June 30, 2020 | ||||||
(Unaudited)
| Victory RS Growth Fund | Victory RS Science and Technology Fund | Victory RS Small Cap Equity Fund | |||||||||||||
Investment Income: | |||||||||||||||
Dividends | $ | 958,321 | $ | 237,839 | $ | 53,395 | |||||||||
Interest | 7,112 | 14,283 | 5,475 | ||||||||||||
Securities lending (net of fees) | 23,961 | 231,094 | 20,891 | ||||||||||||
Total Income | 989,394 | 483,216 | 79,761 | ||||||||||||
Expenses: | |||||||||||||||
Investment advisory fees | 912,404 | 1,421,008 | 235,122 | ||||||||||||
Administration fees | 74,469 | 87,068 | 19,174 | ||||||||||||
Sub-Administration fees | 5,904 | 7,446 | 7,446 | ||||||||||||
12b-1 fees — Class A Shares | 264,062 | 247,716 | 70,692 | ||||||||||||
12b-1 fees — Class C Shares | 18,320 | 65,990 | 2,049 | ||||||||||||
12b-1 fees — Class R Shares | 895 | 1,787 | 6,738 | ||||||||||||
Custodian fees | 6,225 | 11,590 | 3,297 | ||||||||||||
Transfer agent fees — Class A Shares | 89,832 | 111,439 | 29,799 | ||||||||||||
Transfer agent fees — Class C Shares | 2,238 | 6,867 | 302 | ||||||||||||
Transfer agent fees — Class R Shares | 602 | 874 | 2,341 | ||||||||||||
Transfer agent fees — Class Y Shares | 10,980 | 45,656 | 1,750 | ||||||||||||
Trustees' fees | 10,807 | 12,102 | 2,942 | ||||||||||||
Compliance fees | 1,032 | 1,170 | 264 | ||||||||||||
Legal and audit fees | 13,444 | 14,799 | 6,172 | ||||||||||||
State registration and filing fees | 38,880 | 43,751 | 34,711 | ||||||||||||
Other expenses | 12,690 | 25,003 | 4,933 | ||||||||||||
Total Expenses | 1,462,784 | 2,104,266 | 427,732 | ||||||||||||
Expenses waived/reimbursed by Adviser | (146,326 | ) | (24,021 | ) | (18,859 | ) | |||||||||
Net Expenses | 1,316,458 | 2,080,245 | 408,873 | ||||||||||||
Net Investment Income (Loss) | (327,064 | ) | (1,597,029 | ) | (329,112 | ) | |||||||||
| Realized/Unrealized Gains (Losses) from Investments: | |||||||||||||||
| Net realized gains (losses) from investment securities and foreign currency translations | 7,594,959 | 10,808,101 | (600,391 | ) | |||||||||||
| Net change in unrealized appreciation/depreciation on investment securities | 10,028,316 | 39,222,521 | 2,214,724 | ||||||||||||
| Net realized/unrealized gains (losses) on investments | 17,623,275 | 50,030,622 | 1,614,333 | ||||||||||||
Change in net assets resulting from operations | $ | 17,296,211 | $ | 48,433,593 | $ | 1,285,221 | |||||||||
See notes to financial statements.
28
Victory Portfolios | Statements of Changes in Net Assets | ||||||
| Victory RS Small Cap Growth Fund | Victory RS Select Growth Fund | Victory RS Mid Cap Growth Fund | |||||||||||||||||||||||||
| Six Months Ended June 30, 2020 (unaudited) | Year Ended December 31, 2019 | Six Months Ended June 30, 2020 (unaudited) | Year Ended December 31, 2019 | Six Months Ended June 30, 2020 (unaudited) | Year Ended December 31, 2019 | ||||||||||||||||||||||
| From Investment Activities: | |||||||||||||||||||||||||||
Operations: | |||||||||||||||||||||||||||
| Net investment income (loss) | $ | (9,872,114 | ) | $ | (18,309,524 | ) | $ | (1,067,927 | ) | $ | (2,580,310 | ) | $ | (1,259,782 | ) | $ | (2,481,501 | ) | |||||||||
| Net realized gains (losses) from investment transactions | (52,880,854 | ) | 374,740,043 | 10,672,794 | 54,394,565 | 8,852,381 | 5,937,106 | ||||||||||||||||||||
| Net change in unrealized appreciation/ depreciation on investments | 106,648,573 | 272,638,580 | (473,169 | ) | 19,783,471 | 16,406,657 | 95,247,594 | ||||||||||||||||||||
| Change in net assets resulting from operations | 43,895,605 | 629,069,099 | 9,131,698 | 71,597,726 | 23,999,256 | 98,703,199 | |||||||||||||||||||||
| Distributions to Shareholders: | |||||||||||||||||||||||||||
Class A Shares | — | (57,940,117 | ) | — | (11,607,770 | ) | — | — | |||||||||||||||||||
Class C Shares | — | (1,811,529 | ) | — | (3,987,456 | ) | — | — | |||||||||||||||||||
Class R Shares | — | (725,922 | ) | — | (83,853 | ) | — | — | |||||||||||||||||||
Class R6 Shares | — | (35,271,765 | ) | — | (33,206 | ) | — | — | |||||||||||||||||||
Class Y Shares | — | (91,533,905 | ) | — | (10,834,909 | ) | — | — | |||||||||||||||||||
| Change in net assets resulting from distributions to shareholders | — | (187,283,238 | ) | — | (26,547,194 | ) | — | — | |||||||||||||||||||
| Change in net assets resulting from capital transactions | (80,911,700 | ) | 244,715,312 | (26,818,434 | ) | (72,669,141 | ) | (26,359,698 | ) | 79,815,678 | |||||||||||||||||
Change in net assets | (37,016,095 | ) | 686,501,173 | (17,686,736 | ) | (27,618,609 | ) | (2,360,442 | ) | 178,518,877 | |||||||||||||||||
Net Assets: | |||||||||||||||||||||||||||
Beginning of period | 2,287,138,218 | 1,600,637,045 | 220,164,511 | 247,783,120 | 519,987,999 | 341,469,122 | |||||||||||||||||||||
End of period | $ | 2,250,122,123 | $ | 2,287,138,218 | $ | 202,477,775 | $ | 220,164,511 | $ | 517,627,557 | $ | 519,987,999 | |||||||||||||||
(continues on next page)
See notes to financial statements.
29
Victory Portfolios | Statements of Changes in Net Assets | ||||||
(continued)
| Victory RS Small Cap Growth Fund | Victory RS Select Growth Fund | Victory RS Mid Cap Growth Fund | |||||||||||||||||||||||||
| Six Months Ended June 30, 2020 (unaudited) | Year Ended December 31, 2019 | Six Months Ended June 30, 2020 (unaudited) | Year Ended December 31, 2019 | Six Months Ended June 30, 2020 (unaudited) | Year Ended December 31, 2019 | ||||||||||||||||||||||
Capital Transactions: | |||||||||||||||||||||||||||
Class A Shares | |||||||||||||||||||||||||||
| Proceeds from shares issued | $ | 30,691,295 | $ | 142,955,975 | $ | 3,193,242 | $ | 8,995,981 | $ | 1,717,780 | $ | 7,679,624 | |||||||||||||||
| Distributions reinvested | — | 56,001,065 | — | 11,220,690 | — | — | |||||||||||||||||||||
| Cost of shares redeemed | (83,638,384 | ) | (144,757,608 | ) | (8,761,858 | ) | (34,103,074 | ) | (6,224,649 | ) | (20,994,420 | ) | |||||||||||||||
| Total Class A Shares | $ | (52,947,089 | ) | $ | 54,199,432 | $ | (5,568,616 | ) | $ | (13,886,403 | ) | $ | (4,506,869 | ) | $ | (13,314,796 | ) | ||||||||||
Class C Shares | |||||||||||||||||||||||||||
| Proceeds from shares issued | $ | 2,045,186 | $ | 4,638,000 | $ | 253,885 | $ | 1,172,611 | $ | 246,657 | $ | 1,091,058 | |||||||||||||||
| Distributions reinvested | — | 1,567,471 | — | 3,691,152 | — | — | |||||||||||||||||||||
| Cost of shares redeemed | (3,410,604 | ) | (4,534,786 | ) | (4,796,742 | ) | (14,429,238 | ) | (4,666,534 | ) | (3,720,853 | ) | |||||||||||||||
| Total Class C Shares | $ | (1,365,418 | ) | $ | 1,670,685 | $ | (4,542,857 | ) | $ | (9,565,475 | ) | $ | (4,419,877 | ) | $ | (2,629,795 | ) | ||||||||||
Class R Shares | |||||||||||||||||||||||||||
| Proceeds from shares issued | $ | 929,896 | $ | 3,104,717 | $ | 66,336 | $ | 229,179 | $ | 147,983 | $ | 109,581 | |||||||||||||||
| Distributions reinvested | — | 725,922 | — | 43,116 | — | — | |||||||||||||||||||||
| Cost of shares redeemed | (2,677,679 | ) | (4,973,375 | ) | (171,862 | ) | (503,698 | ) | (383,852 | ) | (621,978 | ) | |||||||||||||||
| Total Class R Shares | $ | (1,747,783 | ) | $ | (1,142,736 | ) | $ | (105,526 | ) | $ | (231,403 | ) | $ | (235,869 | ) | $ | (512,397 | ) | |||||||||
Class R6 Shares | |||||||||||||||||||||||||||
| Proceeds from shares issued | $ | 117,212,671 | $ | 329,155,802 | $ | 7,320 | $ | 16,248 | $ | 6,327,725 | $ | 16,219,140 | |||||||||||||||
| Distributions reinvested | — | 24,270,509 | — | 33,206 | — | — | |||||||||||||||||||||
| Cost of shares redeemed | (77,874,317 | ) | (61,983,716 | ) | (4,898 | ) | (27,077 | ) | (4,569,123 | ) | (1,352,556 | ) | |||||||||||||||
| Total Class R6 Shares | $ | 39,338,354 | $ | 291,442,595 | $ | 2,422 | $ | 22,377 | $ | 1,758,602 | $ | 14,866,584 | |||||||||||||||
Class Y Shares | |||||||||||||||||||||||||||
| Proceeds from shares issued | $ | 168,984,602 | $ | 289,704,953 | $ | 7,283,086 | $ | 18,878,964 | $ | 51,282,931 | $ | 205,621,682 | |||||||||||||||
| Distributions reinvested | — | 84,364,967 | — | 9,975,034 | — | — | |||||||||||||||||||||
| Cost of shares redeemed | (233,174,366 | ) | (475,524,584 | ) | (23,886,943 | ) | (77,862,235 | ) | (70,238,616 | ) | (124,215,600 | ) | |||||||||||||||
| Total Class Y Shares | $ | (64,189,764 | ) | $ | (101,454,664 | ) | $ | (16,603,857 | ) | $ | (49,008,237 | ) | $ | (18,955,685 | ) | $ | 81,406,082 | ||||||||||
| Change in net assets resulting from capital transactions | $ | (80,911,700 | ) | $ | 244,715,312 | $ | (26,818,434 | ) | $ | (72,669,141 | ) | $ | (26,359,698 | ) | $ | 79,815,678 | |||||||||||
(continues on next page)
See notes to financial statements.
30
Victory Portfolios | Statements of Changes in Net Assets | ||||||
(continued)
| Victory RS Small Cap Growth Fund | Victory RS Select Growth Fund | Victory RS Mid Cap Growth Fund | |||||||||||||||||||||||||
| Six Months Ended June 30, 2020 (unaudited) | Year Ended December 31, 2019 | Six Months Ended June 30, 2020 (unaudited) | Year Ended December 31, 2019 | Six Months Ended June 30, 2020 (unaudited) | Year Ended December 31, 2019 | ||||||||||||||||||||||
Share Transactions: | |||||||||||||||||||||||||||
Class A Shares | |||||||||||||||||||||||||||
Issued | 432,087 | 1,896,687 | 98,814 | 262,448 | 70,725 | 313,448 | |||||||||||||||||||||
Reinvested | — | 739,093 | — | 334,946 | — | — | |||||||||||||||||||||
Redeemed | (1,191,215 | ) | (1,900,975 | ) | (276,768 | ) | (978,442 | ) | (266,322 | ) | (851,382 | ) | |||||||||||||||
| Total Class A Shares | (759,128 | ) | 734,805 | (177,954 | ) | (381,048 | ) | (195,597 | ) | (537,934 | ) | ||||||||||||||||
Class C Shares | |||||||||||||||||||||||||||
Issued | 35,281 | 73,386 | 10,142 | 42,508 | 12,764 | 52,282 | |||||||||||||||||||||
Reinvested | — | 24,810 | — | 139,131 | — | — | |||||||||||||||||||||
Redeemed | (58,239 | ) | (70,038 | ) | (187,756 | ) | �� | (506,621 | ) | (227,748 | ) | (173,253 | ) | ||||||||||||||
| Total Class C Shares | (22,958 | ) | 28,158 | (177,614 | ) | (324,982 | ) | (214,984 | ) | (120,971 | ) | ||||||||||||||||
Class R Shares | |||||||||||||||||||||||||||
Issued | 14,460 | 44,878 | 2,701 | 8,420 | 7,823 | 4,976 | |||||||||||||||||||||
Reinvested | — | 10,621 | — | 1,594 | — | — | |||||||||||||||||||||
Redeemed | (41,825 | ) | (70,784 | ) | (6,308 | ) | (16,917 | ) | (18,024 | ) | (27,710 | ) | |||||||||||||||
| Total Class R Shares | (27,365 | ) | (15,285 | ) | (3,607 | ) | (6,903 | ) | (10,201 | ) | (22,734 | ) | |||||||||||||||
Class R6 Shares | |||||||||||||||||||||||||||
Issued | 1,564,330 | 4,132,995 | 227 | 430 | 257,353 | 631,514 | |||||||||||||||||||||
Reinvested | — | 304,371 | — | 931 | — | — | |||||||||||||||||||||
Redeemed | (1,104,802 | ) | (778,119 | ) | (158 | ) | (787 | ) | (182,596 | ) | (51,468 | ) | |||||||||||||||
| Total Class R6 Shares | 459,528 | 3,659,247 | 69 | 574 | 74,757 | 580,046 | |||||||||||||||||||||
Class Y Shares | |||||||||||||||||||||||||||
Issued | 2,320,712 | 3,695,019 | 213,684 | 523,309 | 2,112,683 | 8,112,643 | |||||||||||||||||||||
Reinvested | — | 1,060,261 | — | 280,987 | — | — | |||||||||||||||||||||
Redeemed | (3,276,353 | ) | (5,965,460 | ) | (723,457 | ) | (2,124,164 | ) | (2,825,414 | ) | (4,972,460 | ) | |||||||||||||||
| Total Class Y Shares | (955,641 | ) | (1,210,180 | ) | (509,773 | ) | (1,319,868 | ) | (712,731 | ) | 3,140,183 | ||||||||||||||||
Change in Shares | (1,305,564 | ) | 3,196,745 | (868,879 | ) | (2,032,227 | ) | (1,058,756 | ) | 3,038,590 | |||||||||||||||||
See notes to financial statements.
31
Victory Portfolios | Statements of Changes in Net Assets | ||||||
| Victory RS Growth Fund | Victory RS Science and Technology Fund | Victory RS Small Cap Equity Fund | |||||||||||||||||||||||||
| Six Months Ended June 30, 2020 (unaudited) | Year Ended December 31, 2019 | Six Months Ended June 30, 2020 (unaudited) | Year Ended December 31, 2019 | Six Months Ended June 30, 2020 (unaudited) | Year Ended December 31, 2019 | ||||||||||||||||||||||
From Investment Activities: | |||||||||||||||||||||||||||
Operations: | |||||||||||||||||||||||||||
| Net investment income (loss) | $ | (327,064 | ) | $ | (368,637 | ) | $ | (1,597,029 | ) | $ | (2,964,010 | ) | $ | (329,112 | ) | $ | (643,046 | ) | |||||||||
| Net realized gains (losses) from investment transactions | 7,594,959 | 32,101,114 | 10,808,101 | 36,408,035 | (600,391 | ) | 12,548,237 | ||||||||||||||||||||
| Net change in unrealized appreciation/ depreciation on investments | 10,028,316 | 32,008,409 | 39,222,521 | 48,008,708 | 2,214,724 | 9,277,446 | |||||||||||||||||||||
| Change in net assets resulting from operations | 17,296,211 | 63,740,886 | 48,433,593 | 81,452,733 | 1,285,221 | 21,182,637 | |||||||||||||||||||||
Distributions to Shareholders: | |||||||||||||||||||||||||||
Class A Shares | — | (21,706,016 | ) | — | (16,847,930 | ) | — | (6,685,748 | ) | ||||||||||||||||||
Class C Shares | — | (511,609 | ) | — | (1,507,003 | ) | — | (183,966 | ) | ||||||||||||||||||
Class R Shares | — | (45,536 | ) | — | (65,870 | ) | — | (383,511 | ) | ||||||||||||||||||
Class Y Shares | — | (2,901,012 | ) | — | (6,017,832 | ) | — | (338,729 | ) | ||||||||||||||||||
| Change in net assets resulting from distributions to shareholders | — | (25,164,173 | ) | — | (24,438,635 | ) | — | (7,591,954 | ) | ||||||||||||||||||
| Change in net assets resulting from capital transactions | (18,631,018 | ) | 1,476,091 | (8,510,081 | ) | 28,962,815 | (4,483,463 | ) | (1,004,760 | ) | |||||||||||||||||
Change in net assets | (1,334,807 | ) | 40,052,804 | 39,923,512 | 85,976,913 | (3,198,242 | ) | 12,585,923 | |||||||||||||||||||
Net Assets: | |||||||||||||||||||||||||||
Beginning of period | 259,654,385 | 219,601,581 | 292,324,990 | 206,348,077 | 69,873,404 | 57,287,481 | |||||||||||||||||||||
End of period | $ | 258,319,578 | $ | 259,654,385 | $ | 332,248,502 | $ | 292,324,990 | $ | 66,675,162 | $ | 69,873,404 | |||||||||||||||
(continues on next page)
See notes to financial statements.
32
Victory Portfolios | Statements of Changes in Net Assets | ||||||
(continued)
| Victory RS Growth Fund | Victory RS Science and Technology Fund | Victory RS Small Cap Equity Fund | |||||||||||||||||||||||||
| Six Months Ended June 30, 2020 (unaudited) | Year Ended December 31, 2019 | Six Months Ended June 30, 2020 (unaudited) | Year Ended December 31, 2019 | Six Months Ended June 30, 2020 (unaudited) | Year Ended December 31, 2019 | ||||||||||||||||||||||
Capital Transactions: | |||||||||||||||||||||||||||
Class A Shares | |||||||||||||||||||||||||||
| Proceeds from shares issued | $ | 2,236,404 | $ | 5,052,289 | $ | 25,232,688 | $ | 37,207,174 | $ | 867,750 | $ | 2,379,117 | |||||||||||||||
Distributions reinvested | — | 21,131,656 | — | 16,058,001 | — | 6,575,672 | |||||||||||||||||||||
Cost of shares redeemed | (15,227,264 | ) | (23,856,360 | ) | (26,222,331 | ) | (32,975,335 | ) | (5,255,433 | ) | (9,742,633 | ) | |||||||||||||||
Total Class A Shares | $ | (12,990,860 | ) | $ | 2,327,585 | $ | (989,643 | ) | $ | 20,289,840 | $ | (4,387,683 | ) | $ | (787,844 | ) | |||||||||||
Class C Shares | |||||||||||||||||||||||||||
| Proceeds from shares issued | $ | 105,442 | $ | 279,641 | $ | 1,631,215 | $ | 2,713,477 | $ | 6,000 | $ | 68,990 | |||||||||||||||
Distributions reinvested | — | 421,834 | — | 1,377,592 | — | 183,966 | |||||||||||||||||||||
Cost of shares redeemed | (898,752 | ) | (1,524,992 | ) | (2,983,589 | ) | (4,658,036 | ) | (138,045 | ) | (411,685 | ) | |||||||||||||||
Total Class C Shares | $ | (793,310 | ) | $ | (823,517 | ) | $ | (1,352,374 | ) | $ | (566,967 | ) | $ | (132,045 | ) | $ | (158,729 | ) | |||||||||
Class R Shares | |||||||||||||||||||||||||||
| Proceeds from shares issued | $ | 21,183 | $ | 55,535 | $ | 197,082 | $ | 178,010 | $ | 165,137 | $ | 211,495 | |||||||||||||||
Distributions reinvested | — | 45,536 | — | 65,870 | — | 383,511 | |||||||||||||||||||||
Cost of shares redeemed | (129,676 | ) | (255,531 | ) | (127,194 | ) | (447,000 | ) | (99,958 | ) | (468,593 | ) | |||||||||||||||
Total Class R Shares | $ | (108,493 | ) | $ | (154,460 | ) | $ | 69,888 | $ | (203,120 | ) | $ | 65,179 | $ | 126,413 | ||||||||||||
Class Y Shares | |||||||||||||||||||||||||||
| Proceeds from shares issued | $ | 1,540,135 | $ | 3,050,227 | $ | 15,828,435 | $ | 38,822,411 | $ | 291,807 | $ | 1,004,953 | |||||||||||||||
Distributions reinvested | — | 2,783,706 | — | 5,687,567 | — | 338,056 | |||||||||||||||||||||
Cost of shares redeemed | (6,278,490 | ) | (5,707,450 | ) | (22,066,387 | ) | (35,066,916 | ) | (320,721 | ) | (1,527,609 | ) | |||||||||||||||
Total Class Y Shares | $ | (4,738,355 | ) | $ | 126,483 | $ | (6,237,952 | ) | $ | 9,443,062 | $ | (28,914 | ) | $ | (184,600 | ) | |||||||||||
| Change in net assets resulting from capital transactions | $ | (18,631,018 | ) | $ | 1,476,091 | $ | (8,510,081 | ) | $ | 28,962,815 | $ | (4,483,463 | ) | $ | (1,004,760 | ) | |||||||||||
(continues on next page)
See notes to financial statements.
33
Victory Portfolios | Statements of Changes in Net Assets | ||||||
(continued)
| Victory RS Growth Fund | Victory RS Science and Technology Fund | Victory RS Small Cap Equity Fund | |||||||||||||||||||||||||
| Six Months Ended June 30, 2020 (unaudited) | Year Ended December 31, 2019 | Six Months Ended June 30, 2020 (unaudited) | Year Ended December 31, 2019 | Six Months Ended June 30, 2020 (unaudited) | Year Ended December 31, 2019 | ||||||||||||||||||||||
Share Transactions: | |||||||||||||||||||||||||||
Class A Shares | |||||||||||||||||||||||||||
Issued | 115,702 | 255,580 | 1,062,366 | 1,623,445 | 58,993 | 147,134 | |||||||||||||||||||||
Reinvested | — | 1,113,364 | — | 701,529 | — | 417,238 | |||||||||||||||||||||
Redeemed | (814,298 | ) | (1,218,205 | ) | (1,188,448 | ) | (1,441,083 | ) | (362,417 | ) | (603,671 | ) | |||||||||||||||
Total Class A Shares | (698,596 | ) | 150,739 | (126,082 | ) | 883,891 | (303,424 | ) | (39,299 | ) | |||||||||||||||||
Class C Shares | |||||||||||||||||||||||||||
Issued | 7,275 | 17,290 | 92,988 | 150,655 | 1,518 | 12,495 | |||||||||||||||||||||
Reinvested | — | 27,321 | — | 79,309 | — | 45,312 | |||||||||||||||||||||
Redeemed | (58,007 | ) | (94,041 | ) | (183,865 | ) | (260,527 | ) | (34,444 | ) | (82,079 | ) | |||||||||||||||
Total Class C Shares | (50,732 | ) | (49,430 | ) | (90,877 | ) | (30,563 | ) | (32,926 | ) | (24,272 | ) | |||||||||||||||
Class R Shares | |||||||||||||||||||||||||||
Issued | 1,271 | 3,130 | 10,009 | 9,259 | 15,195 | 16,640 | |||||||||||||||||||||
Reinvested | — | 2,666 | — | 3,431 | — | 31,721 | |||||||||||||||||||||
Redeemed | (7,998 | ) | (14,840 | ) | (6,489 | ) | (22,942 | ) | (8,329 | ) | (38,038 | ) | |||||||||||||||
Total Class R Shares | (6,727 | ) | (9,044 | ) | 3,520 | (10,252 | ) | 6,866 | 10,323 | ||||||||||||||||||
Class Y Shares | |||||||||||||||||||||||||||
Issued | 74,439 | 148,829 | 625,088 | 1,584,545 | 20,354 | 60,144 | |||||||||||||||||||||
Reinvested | — | 140,237 | — | 229,060 | — | 20,842 | |||||||||||||||||||||
Redeemed | (350,690 | ) | (276,822 | ) | (911,922 | ) | (1,445,941 | ) | (21,713 | ) | (89,723 | ) | |||||||||||||||
Total Class Y Shares | (276,251 | ) | 12,244 | (286,834 | ) | 367,664 | (1,359 | ) | (8,737 | ) | |||||||||||||||||
Change in Shares | (1,032,306 | ) | 104,509 | (500,273 | ) | 1,210,740 | (330,843 | ) | (61,985 | ) | |||||||||||||||||
See notes to financial statements.
34
This page is intentionally left blank.
35
Victory Portfolios | Financial Highlights | ||||||
For a Share Outstanding Throughout Each Period
Investment Activities | Distributions to Shareholders From | ||||||||||||||||||||||||||
| Net Asset Value, Beginning of Period | Net Investment Income (Loss)(a) | Net Realized and Unrealized Gains (Losses) on Investments | Total from Investment Activities | Net Investment Income | Net Realized Gains from Investments | ||||||||||||||||||||||
Victory RS Small Cap Growth Fund | |||||||||||||||||||||||||||
Class A | |||||||||||||||||||||||||||
| Six Months Ended 6/30/20 (unaudited) | $ | 77.19 | (0.41 | ) | 2.63 | 2.22 | — | — | |||||||||||||||||||
Year Ended 12/31/19 | $ | 61.11 | (0.80 | ) | 23.84 | 23.04 | — | (6.96 | ) | ||||||||||||||||||
Year Ended 12/31/18 | $ | 80.96 | (0.83 | ) | (6.54 | ) | (7.37 | ) | — | (12.48 | ) | ||||||||||||||||
Year Ended 12/31/17 | $ | 65.31 | (0.75 | ) | 24.13 | 23.38 | — | (7.73 | ) | ||||||||||||||||||
Year Ended 12/31/16 | $ | 64.73 | (0.55 | ) | 1.13 | 0.58 | — | — | |||||||||||||||||||
Year Ended 12/31/15 | $ | 65.53 | (0.74 | ) | 0.80 | 0.06 | — | (0.86 | ) | ||||||||||||||||||
Class C | |||||||||||||||||||||||||||
| Six Months Ended 6/30/20 (unaudited) | $ | 64.34 | (0.57 | ) | 2.17 | 1.60 | — | — | |||||||||||||||||||
Year Ended 12/31/19 | $ | 52.19 | (1.17 | ) | 20.28 | 19.11 | — | (6.96 | ) | ||||||||||||||||||
Year Ended 12/31/18 | $ | 71.70 | (1.31 | ) | (5.72 | ) | (7.03 | ) | — | (12.48 | ) | ||||||||||||||||
Year Ended 12/31/17 | $ | 58.97 | (1.18 | ) | 21.64 | 20.46 | — | (7.73 | ) | ||||||||||||||||||
Year Ended 12/31/16 | $ | 58.90 | (0.90 | ) | 0.97 | 0.07 | — | — | |||||||||||||||||||
Year Ended 12/31/15 | $ | 60.15 | (1.15 | ) | 0.76 | (0.39 | ) | — | (0.86 | ) | |||||||||||||||||
Class R | |||||||||||||||||||||||||||
| Six Months Ended 6/30/20 (unaudited) | $ | 69.61 | (0.52 | ) | 2.36 | 1.84 | — | — | |||||||||||||||||||
Year Ended 12/31/19 | $ | 55.87 | (1.05 | ) | 21.75 | 20.70 | — | (6.96 | ) | ||||||||||||||||||
Year Ended 12/31/18 | $ | 75.55 | (1.15 | ) | (6.05 | ) | (7.20 | ) | — | (12.48 | ) | ||||||||||||||||
Year Ended 12/31/17 | $ | 61.63 | (1.04 | ) | 22.69 | 21.65 | — | (7.73 | ) | ||||||||||||||||||
Year Ended 12/31/16 | $ | 61.27 | (0.68 | ) | 1.04 | 0.36 | — | — | |||||||||||||||||||
Year Ended 12/31/15 | $ | 62.28 | (0.93 | ) | 0.78 | (0.15 | ) | — | (0.86 | ) | |||||||||||||||||
Class R6 | |||||||||||||||||||||||||||
| Six Months Ended 6/30/20 (unaudited) | $ | 81.24 | (0.30 | ) | 2.78 | 2.48 | — | — | |||||||||||||||||||
Year Ended 12/31/19 | $ | 63.83 | (0.58 | ) | 24.95 | 24.37 | — | (6.96 | ) | ||||||||||||||||||
Year Ended 12/31/18 | $ | 83.67 | (0.58 | ) | (6.78 | ) | (7.36 | ) | — | (12.48 | ) | ||||||||||||||||
| 7/12/17(e) through 12/31/17 | $ | 79.23 | (0.41 | ) | 12.58 | 12.17 | — | (7.73 | ) | ||||||||||||||||||
Class Y | |||||||||||||||||||||||||||
| Six Months Ended 6/30/20 (unaudited) | $ | 81.06 | (0.33 | ) | 2.78 | 2.45 | — | — | |||||||||||||||||||
Year Ended 12/31/19 | $ | 63.75 | (0.62 | ) | 24.89 | 24.27 | — | (6.96 | ) | ||||||||||||||||||
Year Ended 12/31/18 | $ | 83.64 | (0.61 | ) | (6.80 | ) | (7.41 | ) | — | (12.48 | ) | ||||||||||||||||
Year Ended 12/31/17 | $ | 67.08 | (0.53 | ) | 24.82 | 24.29 | — | (7.73 | ) | ||||||||||||||||||
Year Ended 12/31/16 | $ | 66.32 | (0.39 | ) | 1.16 | 0.77 | (0.01 | ) | — | ||||||||||||||||||
Year Ended 12/31/15 | $ | 67.04 | (0.56 | ) | 0.81 | 0.25 | (0.11 | ) | (0.86 | ) | |||||||||||||||||
(a) Per share net investment income (loss) has been calculated using the average daily shares method.
(b) Not annualized for periods less than one year.
(c) Annualized for periods less than one year.
See notes to financial statements.
36
Victory Portfolios | Financial Highlights — continued | ||||||
For a Share Outstanding Throughout Each Period
Ratios to Average Net Assets | Supplemental Data | ||||||||||||||||||||||||||||||||||
| Total Distributions | Net Asset Value, End of Period | Total Return (Excludes Sales Charge)(b) | Ratio of Net Expenses to Average Net Assets(c) | Ratio of Net Investment Income (Loss) to Average Net Assets(c) | Ratio of Gross Expenses to Average Net Assets(c) | Net Assets, End of Period (000's) | Portfolio Turnover(b)(d) | ||||||||||||||||||||||||||||
Victory RS Small Cap Growth Fund | |||||||||||||||||||||||||||||||||||
Class A | |||||||||||||||||||||||||||||||||||
| Six Months Ended 6/30/20 (unaudited) | — | $ | 79.41 | 2.88 | % | 1.40 | % | (1.15 | )% | 1.45 | % | $ | 646,913 | 40 | % | ||||||||||||||||||||
Year Ended 12/31/19 | (6.96 | ) | $ | 77.19 | 37.91 | % | 1.40 | % | (1.06 | )% | 1.44 | % | $ | 687,425 | 100 | % | |||||||||||||||||||
Year Ended 12/31/18 | (12.48 | ) | $ | 61.11 | (8.97 | )% | 1.40 | % | (0.94 | )% | 1.45 | % | $ | 499,350 | 86 | % | |||||||||||||||||||
Year Ended 12/31/17 | (7.73 | ) | $ | 80.96 | 36.86 | % | 1.40 | % | (1.00 | )% | 1.44 | % | $ | 575,227 | 107 | % | |||||||||||||||||||
Year Ended 12/31/16 | — | $ | 65.31 | 0.90 | % | 1.40 | % | (0.92 | )% | 1.45 | % | $ | 481,125 | 91 | % | ||||||||||||||||||||
Year Ended 12/31/15 | (0.86 | ) | $ | 64.73 | 0.08 | % | 1.40 | % | (1.07 | )% | 1.41 | % | $ | 767,304 | 94 | % | |||||||||||||||||||
Class C | |||||||||||||||||||||||||||||||||||
| Six Months Ended 6/30/20 (unaudited) | — | $ | 65.94 | 2.47 | % | 2.16 | % | (1.91 | )% | 2.28 | % | $ | 17,530 | 40 | % | ||||||||||||||||||||
Year Ended 12/31/19 | (6.96 | ) | $ | 64.34 | 36.88 | % | 2.16 | % | (1.82 | )% | 2.27 | % | $ | 18,581 | 100 | % | |||||||||||||||||||
Year Ended 12/31/18 | (12.48 | ) | $ | 52.19 | (9.66 | )% | 2.16 | % | (1.71 | )% | 2.26 | % | $ | 13,602 | 86 | % | |||||||||||||||||||
Year Ended 12/31/17 | (7.73 | ) | $ | 71.70 | 35.84 | % | 2.16 | % | (1.75 | )% | 2.23 | % | $ | 13,633 | 107 | % | |||||||||||||||||||
Year Ended 12/31/16 | — | $ | 58.97 | 0.12 | % | 2.16 | % | (1.67 | )% | 2.22 | % | $ | 13,035 | 91 | % | ||||||||||||||||||||
Year Ended 12/31/15 | (0.86 | ) | $ | 58.90 | (0.67 | )% | 2.16 | % | (1.67 | )% | 2.22 | % | $ | 20,878 | 94 | % | |||||||||||||||||||
Class R | |||||||||||||||||||||||||||||||||||
| Six Months Ended 6/30/20 (unaudited) | — | $ | 71.45 | 2.64 | % | 1.86 | % | (1.61 | )% | 2.03 | % | $ | 6,269 | 40 | % | ||||||||||||||||||||
Year Ended 12/31/19 | (6.96 | ) | $ | 69.61 | 37.28 | % | 1.86 | % | (1.52 | )% | 1.93 | % | $ | 8,012 | 100 | % | |||||||||||||||||||
Year Ended 12/31/18 | (12.48 | ) | $ | 55.87 | (9.39 | )% | 1.86 | % | (1.40 | )% | 1.87 | % | $ | 7,285 | 86 | % | |||||||||||||||||||
Year Ended 12/31/17 | (7.73 | ) | $ | 75.55 | 36.24 | % | 1.86 | % | (1.46 | )% | 1.94 | % | $ | 7,698 | 107 | % | |||||||||||||||||||
Year Ended 12/31/16 | — | $ | 61.63 | 0.59 | % | 1.70 | % | (1.20 | )% | 1.70 | % | $ | 5,371 | 91 | % | ||||||||||||||||||||
Year Ended 12/31/15 | (0.86 | ) | $ | 61.27 | (0.26 | )% | 1.75 | % | (1.41 | )% | 1.75 | % | $ | 5,241 | 94 | % | |||||||||||||||||||
Class R6 | |||||||||||||||||||||||||||||||||||
| Six Months Ended 6/30/20 (unaudited) | — | $ | 83.72 | 3.05 | % | 1.05 | % | (0.80 | )% | 1.05 | % | $ | 493,423 | 40 | % | ||||||||||||||||||||
Year Ended 12/31/19 | (6.96 | ) | $ | 81.24 | 38.38 | % | 1.06 | % | (0.72 | )% | 1.06 | % | $ | 441,471 | 100 | % | |||||||||||||||||||
Year Ended 12/31/18 | (12.48 | ) | $ | 63.83 | (8.66 | )% | 1.06 | % | (0.64 | )% | 1.10 | % | $ | 113,288 | 86 | % | |||||||||||||||||||
| 7/12/17(e) through 12/31/17 | (7.73 | ) | $ | 83.67 | 16.23 | % | 1.06 | % | (1.03 | )% | 1.41 | % | $ | 25,551 | 107 | % | |||||||||||||||||||
Class Y | |||||||||||||||||||||||||||||||||||
| Six Months Ended 6/30/20 (unaudited) | — | $ | 83.51 | 3.01 | % | 1.13 | % | (0.88 | )% | 1.17 | % | $ | 1,085,988 | 40 | % | ||||||||||||||||||||
Year Ended 12/31/19 | (6.96 | ) | $ | 81.06 | 38.29 | % | 1.13 | % | (0.79 | )% | 1.15 | % | $ | 1,131,648 | 100 | % | |||||||||||||||||||
Year Ended 12/31/18 | (12.48 | ) | $ | 63.75 | (8.72 | )% | 1.13 | % | (0.67 | )% | 1.15 | % | $ | 967,112 | 86 | % | |||||||||||||||||||
Year Ended 12/31/17 | (7.73 | ) | $ | 83.64 | 37.23 | % | 1.13 | % | (0.68 | )% | 1.17 | % | $ | 1,081,427 | 107 | % | |||||||||||||||||||
Year Ended 12/31/16 | (0.01 | ) | $ | 67.08 | 1.16 | % | 1.13 | % | (0.64 | )% | 1.21 | % | $ | 1,379,669 | 91 | % | |||||||||||||||||||
Year Ended 12/31/15 | (0.97 | ) | $ | 66.32 | 0.36 | % | 1.13 | % | (0.79 | )% | 1.18 | % | $ | 1,576,927 | 94 | % | |||||||||||||||||||
(d) Portfolio turnover is calculated on the basis of the Fund as a whole without distinguishing between the classes of shares issued.
(e) Commencement of operations.
See notes to financial statements.
37
Victory Portfolios | Financial Highlights | ||||||
For a Share Outstanding Throughout Each Period
Investment Activities | Distributions to Shareholders From | ||||||||||||||||||||||||||||||||||
| Net Asset Value, Beginning of Period | Net Investment Income (Loss)(a) | Net Realized and Unrealized Gains (Losses) on Investments | Total from Investment Activities | Net Realized Gains from Investments | Total Distributions | Net Asset Value, End of Period | Total Return (Excludes Sales Charge)(b) | ||||||||||||||||||||||||||||
Victory RS Select Growth Fund | |||||||||||||||||||||||||||||||||||
Class A | |||||||||||||||||||||||||||||||||||
| Six Months Ended 6/30/20 (unaudited) | $ | 33.81 | (0.18 | ) | 2.21 | 2.03 | — | — | $ | 35.84 | 6.00 | % | |||||||||||||||||||||||
Year Ended 12/31/19 | $ | 28.96 | (0.37 | ) | 9.68 | 9.31 | (4.46 | ) | (4.46 | ) | $ | 33.81 | 32.29 | % | |||||||||||||||||||||
Year Ended 12/31/18 | $ | 46.03 | (0.42 | ) | (3.12 | ) | (3.54 | ) | (13.53 | ) | (13.53 | ) | $ | 28.96 | (7.23 | )% | |||||||||||||||||||
Year Ended 12/31/17 | $ | 45.04 | (0.43 | ) | 8.16 | 7.73 | (6.74 | ) | (6.74 | ) | $ | 46.03 | 17.10 | % | |||||||||||||||||||||
Year Ended 12/31/16 | $ | 43.54 | (0.32 | ) | 3.30 | 2.98 | (1.48 | ) | (1.48 | ) | $ | 45.04 | 6.85 | % | |||||||||||||||||||||
Year Ended 12/31/15 | $ | 47.80 | (0.41 | ) | 0.24 | (0.17 | ) | (4.09 | ) | (4.09 | ) | $ | 43.54 | (0.38 | )% | ||||||||||||||||||||
Class C | |||||||||||||||||||||||||||||||||||
| Six Months Ended 6/30/20 (unaudited) | $ | 26.77 | (0.24 | ) | 1.74 | 1.50 | — | — | $ | 28.27 | 5.60 | % | |||||||||||||||||||||||
Year Ended 12/31/19 | $ | 23.82 | (0.53 | ) | 7.94 | 7.41 | (4.46 | ) | (4.46 | ) | $ | 26.77 | 31.28 | % | |||||||||||||||||||||
Year Ended 12/31/18 | $ | 40.80 | (0.70 | ) | (2.75 | ) | (3.45 | ) | (13.53 | ) | (13.53 | ) | $ | 23.82 | (7.98 | )% | |||||||||||||||||||
Year Ended 12/31/17 | $ | 40.89 | (0.73 | ) | 7.38 | 6.65 | (6.74 | ) | (6.74 | ) | $ | 40.80 | 16.19 | % | |||||||||||||||||||||
Year Ended 12/31/16 | $ | 39.97 | (0.60 | ) | 3.00 | 2.40 | (1.48 | ) | (1.48 | ) | $ | 40.89 | 6.04 | % | |||||||||||||||||||||
Year Ended 12/31/15 | $ | 44.57 | (0.74 | ) | 0.23 | (0.51 | ) | (4.09 | ) | (4.09 | ) | $ | 39.97 | (1.17 | )% | ||||||||||||||||||||
Class R | |||||||||||||||||||||||||||||||||||
| Six Months Ended 6/30/20 (unaudited) | $ | 27.30 | (0.21 | ) | 1.77 | 1.56 | — | — | $ | 28.86 | 5.71 | % | |||||||||||||||||||||||
Year Ended 12/31/19 | $ | 24.16 | (0.45 | ) | 8.05 | 7.60 | (4.46 | ) | (4.46 | ) | $ | 27.30 | 31.63 | % | |||||||||||||||||||||
Year Ended 12/31/18 | $ | 41.06 | (0.59 | ) | (2.78 | ) | (3.37 | ) | (13.53 | ) | (13.53 | ) | $ | 24.16 | (7.70 | )% | |||||||||||||||||||
Year Ended 12/31/17 | $ | 41.00 | (0.61 | ) | 7.41 | 6.80 | (6.74 | ) | (6.74 | ) | $ | 41.06 | 16.51 | % | |||||||||||||||||||||
Year Ended 12/31/16 | $ | 39.93 | (0.46 | ) | 3.01 | 2.55 | (1.48 | ) | (1.48 | ) | $ | 41.00 | 6.39 | % | |||||||||||||||||||||
Year Ended 12/31/15 | $ | 44.40 | (0.59 | ) | 0.21 | (0.38 | ) | (4.09 | ) | (4.09 | ) | $ | 39.93 | (0.88 | )% | ||||||||||||||||||||
Class R6 | |||||||||||||||||||||||||||||||||||
| Six Months Ended 6/30/20 (unaudited) | $ | 35.99 | (0.13 | ) | 2.35 | 2.22 | — | — | $ | 38.21 | 6.17 | % | |||||||||||||||||||||||
Year Ended 12/31/19 | $ | 30.50 | (0.27 | ) | 10.22 | 9.95 | (4.46 | ) | (4.46 | ) | $ | 35.99 | 32.76 | % | |||||||||||||||||||||
Year Ended 12/31/18 | $ | 47.53 | (0.29 | ) | (3.21 | ) | (3.50 | ) | (13.53 | ) | (13.53 | ) | $ | 30.50 | (6.92 | )% | |||||||||||||||||||
Year Ended 12/31/17 | $ | 46.16 | (0.28 | ) | 8.39 | 8.11 | (6.74 | ) | (6.74 | ) | $ | 47.53 | 17.48 | % | |||||||||||||||||||||
11/15/16(e) through 12/31/16 | $ | 46.65 | (0.03 | ) | 1.02 | 0.99 | (1.48 | ) | (1.48 | ) | $ | 46.16 | 2.15 | % | |||||||||||||||||||||
Class Y | |||||||||||||||||||||||||||||||||||
| Six Months Ended 6/30/20 (unaudited) | $ | 35.84 | (0.14 | ) | 2.34 | 2.20 | — | — | $ | 38.04 | 6.14 | % | |||||||||||||||||||||||
Year Ended 12/31/19 | $ | 30.41 | (0.29 | ) | 10.18 | 9.89 | (4.46 | ) | (4.46 | ) | $ | 35.84 | 32.66 | % | |||||||||||||||||||||
Year Ended 12/31/18 | $ | 47.47 | (0.30 | ) | (3.23 | ) | (3.53 | ) | (13.53 | ) | (13.53 | ) | $ | 30.41 | (7.02 | )% | |||||||||||||||||||
Year Ended 12/31/17 | $ | 46.15 | (0.31 | ) | 8.37 | 8.06 | (6.74 | ) | (6.74 | ) | $ | 47.47 | 17.40 | % | |||||||||||||||||||||
Year Ended 12/31/16 | $ | 44.47 | (0.21 | ) | 3.37 | 3.16 | (1.48 | ) | (1.48 | ) | $ | 46.15 | 7.13 | % | |||||||||||||||||||||
Year Ended 12/31/15 | $ | 48.61 | (0.29 | ) | 0.24 | (0.05 | ) | (4.09 | ) | (4.09 | ) | $ | 44.47 | (0.12 | )% | ||||||||||||||||||||
(a) Per share net investment income (loss) has been calculated using the average daily shares method.
(b) Not annualized for periods less than one year.
(c) Annualized for periods less than one year.
See notes to financial statements.
38
Victory Portfolios | Financial Highlights — continued | ||||||
For a Share Outstanding Throughout Each Period
Ratios to Average Net Assets | Supplemental Data | ||||||||||||||||||||||
| Ratio of Net Expenses to Average Net Assets(c) | Ratio of Net Investment Income (Loss) to Average Net Assets(c) | Ratio of Gross Expenses to Average Net Assets(c) | Net Assets, End of Period (000's) | Portfolio Turnover(b)(d) | |||||||||||||||||||
Victory RS Select Growth Fund | |||||||||||||||||||||||
Class A | |||||||||||||||||||||||
| Six Months Ended 6/30/20 (unaudited) | 1.40 | % | (1.10 | )% | 1.52 | % | $ | 96,789 | 34 | % | |||||||||||||
Year Ended 12/31/19 | 1.40 | % | (1.06 | )% | 1.52 | % | $ | 97,337 | 74 | % | |||||||||||||
Year Ended 12/31/18 | 1.40 | % | (0.86 | )% | 1.50 | % | $ | 94,393 | 79 | % | |||||||||||||
Year Ended 12/31/17 | 1.40 | % | (0.88 | )% | 1.49 | % | $ | 147,531 | 69 | % | |||||||||||||
Year Ended 12/31/16 | 1.40 | % | (0.74 | )% | 1.47 | % | $ | 170,825 | 89 | % | |||||||||||||
Year Ended 12/31/15 | 1.40 | % | (0.84 | )% | 1.44 | % | $ | 238 | 86 | % | |||||||||||||
Class C | |||||||||||||||||||||||
| Six Months Ended 6/30/20 (unaudited) | 2.18 | % | (1.88 | )% | 2.32 | % | $ | 23,472 | 34 | % | |||||||||||||
Year Ended 12/31/19 | 2.18 | % | (1.84 | )% | 2.30 | % | $ | 26,988 | 74 | % | |||||||||||||
Year Ended 12/31/18 | 2.18 | % | (1.64 | )% | 2.25 | % | $ | 31,754 | 79 | % | |||||||||||||
Year Ended 12/31/17 | 2.18 | % | (1.66 | )% | 2.24 | % | $ | 51,208 | 69 | % | |||||||||||||
Year Ended 12/31/16 | 2.18 | % | (1.52 | )% | 2.23 | % | $ | 63,841 | 89 | % | |||||||||||||
Year Ended 12/31/15 | 2.18 | % | (1.62 | )% | 2.20 | % | $ | 83 | 86 | % | |||||||||||||
Class R | |||||||||||||||||||||||
| Six Months Ended 6/30/20 (unaudited) | 1.91 | % | (1.61 | )% | 5.31 | % | $ | 535 | 34 | % | |||||||||||||
Year Ended 12/31/19 | 1.91 | % | (1.57 | )% | 4.35 | % | $ | 604 | 74 | % | |||||||||||||
Year Ended 12/31/18 | 1.91 | % | (1.38 | )% | 3.60 | % | $ | 701 | 79 | % | |||||||||||||
Year Ended 12/31/17 | 1.91 | % | (1.39 | )% | 2.90 | % | $ | 1,014 | 69 | % | |||||||||||||
Year Ended 12/31/16 | 1.82 | % | (1.17 | )% | 1.82 | % | $ | 1,440 | 89 | % | |||||||||||||
Year Ended 12/31/15 | 1.90 | % | (1.30 | )% | 1.90 | % | $ | 2 | 86 | % | |||||||||||||
Class R6 | |||||||||||||||||||||||
| Six Months Ended 6/30/20 (unaudited) | 1.06 | % | (0.76 | )% | 5.59 | % | $ | 323 | 34 | % | |||||||||||||
Year Ended 12/31/19 | 1.06 | % | (0.72 | )% | 5.46 | % | $ | 302 | 74 | % | |||||||||||||
Year Ended 12/31/18 | 1.06 | % | (0.59 | )% | 6.33 | % | $ | 239 | 79 | % | |||||||||||||
Year Ended 12/31/17 | 1.06 | % | (0.55 | )% | 27.47 | % | $ | 151 | 69 | % | |||||||||||||
11/15/16(e) through 12/31/16 | 1.06 | % | (0.43 | )% | 26.37 | % | $ | 51 | 89 | % | |||||||||||||
Class Y | |||||||||||||||||||||||
| Six Months Ended 6/30/20 (unaudited) | 1.14 | % | (0.84 | )% | 1.25 | % | $ | 81,358 | 34 | % | |||||||||||||
Year Ended 12/31/19 | 1.14 | % | (0.80 | )% | 1.23 | % | $ | 94,933 | 74 | % | |||||||||||||
Year Ended 12/31/18 | 1.14 | % | (0.59 | )% | 1.21 | % | $ | 120,696 | 79 | % | |||||||||||||
Year Ended 12/31/17 | 1.14 | % | (0.62 | )% | 1.20 | % | $ | 244,689 | 69 | % | |||||||||||||
Year Ended 12/31/16 | 1.14 | % | (0.49 | )% | 1.20 | % | $ | 287,970 | 89 | % | |||||||||||||
Year Ended 12/31/15 | 1.14 | % | (0.58 | )% | 1.18 | % | $ | 403 | 86 | % | |||||||||||||
(d) Portfolio turnover is calculated on the basis of the Fund as a whole without distinguishing between the classes of shares issued.
(e) Commencement of operations.
See notes to financial statements.
39
Victory Portfolios | Financial Highlights | ||||||
For a Share Outstanding Throughout Each Period
Investment Activities | Distributions to Shareholders From | ||||||||||||||||||||||||||
| Net Asset Value, Beginning of Period | Net Investment Income (Loss)(a) | Net Realized and Unrealized Gains (Losses) on Investments | Total from Investment Activities | Net Realized Gains from Investments | Return of Capital | ||||||||||||||||||||||
Victory RS Mid Cap Growth Fund | |||||||||||||||||||||||||||
Class A | |||||||||||||||||||||||||||
| Six Months Ended 6/30/20 (unaudited) | $ | 25.56 | (0.08 | ) | 1.33 | 1.25 | — | — | |||||||||||||||||||
Year Ended 12/31/19 | $ | 19.96 | (0.17 | ) | 5.77 | 5.60 | — | — | |||||||||||||||||||
Year Ended 12/31/18 | $ | 25.77 | (0.14 | ) | (1.79 | ) | (1.93 | ) | (3.00 | ) | (0.88 | ) | |||||||||||||||
Year Ended 12/31/17 | $ | 21.32 | (0.10 | ) | 4.55 | 4.45 | — | — | |||||||||||||||||||
Year Ended 12/31/16 | $ | 20.29 | (0.07 | ) | 1.10 | 1.03 | — | — | |||||||||||||||||||
Year Ended 12/31/15 | $ | 20.14 | (0.08 | ) | 0.23 | 0.15 | — | — | |||||||||||||||||||
Class C | |||||||||||||||||||||||||||
| Six Months Ended 6/30/20 (unaudited) | $ | 22.08 | (0.17 | ) | 1.15 | 0.98 | — | — | |||||||||||||||||||
Year Ended 12/31/19 | $ | 17.40 | (0.34 | ) | 5.02 | 4.68 | — | — | |||||||||||||||||||
Year Ended 12/31/18 | $ | 23.22 | (0.35 | ) | (1.59 | ) | (1.94 | ) | (3.65 | ) | (0.23 | ) | |||||||||||||||
Year Ended 12/31/17 | $ | 19.38 | (0.28 | ) | 4.12 | 3.84 | — | — | |||||||||||||||||||
Year Ended 12/31/16 | $ | 18.61 | (0.23 | ) | 1.00 | 0.77 | — | — | |||||||||||||||||||
Year Ended 12/31/15 | $ | 18.64 | (0.25 | ) | 0.22 | (0.03 | ) | — | — | ||||||||||||||||||
Class R | |||||||||||||||||||||||||||
| Six Months Ended 6/30/20 (unaudited) | $ | 23.32 | (0.14 | ) | 1.21 | 1.07 | — | — | |||||||||||||||||||
Year Ended 12/31/19 | $ | 18.31 | (0.28 | ) | 5.29 | 5.01 | — | — | |||||||||||||||||||
Year Ended 12/31/18 | $ | 24.14 | (0.29 | ) | (1.66 | ) | (1.95 | ) | (3.86 | ) | (0.02 | ) | |||||||||||||||
Year Ended 12/31/17 | $ | 20.09 | (0.23 | ) | 4.28 | 4.05 | — | — | |||||||||||||||||||
Year Ended 12/31/16 | $ | 19.22 | (0.16 | ) | 1.03 | 0.87 | — | — | |||||||||||||||||||
Year Ended 12/31/15 | $ | 19.18 | (0.18 | ) | 0.22 | 0.04 | — | — | |||||||||||||||||||
Class R6 | |||||||||||||||||||||||||||
| Six Months Ended 6/30/20 (unaudited) | $ | 26.63 | (0.05 | ) | 1.40 | 1.35 | — | — | |||||||||||||||||||
Year Ended 12/31/19 | $ | 20.74 | (0.11 | ) | 6.00 | 5.89 | — | — | |||||||||||||||||||
Year Ended 12/31/18 | $ | 26.55 | (0.07 | ) | (1.86 | ) | (1.93 | ) | (3.84 | ) | (0.04 | ) | |||||||||||||||
Year Ended 12/31/17 | $ | 21.90 | (0.04 | ) | 4.69 | 4.65 | — | — | |||||||||||||||||||
| 11/15/16(e) through 12/31/16 | $ | 21.30 | — | (f) | 0.60 | 0.60 | — | — | |||||||||||||||||||
Class Y | |||||||||||||||||||||||||||
| Six Months Ended 6/30/20 (unaudited) | $ | 26.61 | (0.06 | ) | 1.40 | 1.34 | — | — | |||||||||||||||||||
Year Ended 12/31/19 | $ | 20.73 | (0.11 | ) | 5.99 | 5.88 | — | — | |||||||||||||||||||
Year Ended 12/31/18 | $ | 26.54 | (0.08 | ) | (1.85 | ) | (1.93 | ) | (1.17 | ) | (2.71 | ) | |||||||||||||||
Year Ended 12/31/17 | $ | 21.90 | (0.04 | ) | 4.68 | 4.64 | — | — | |||||||||||||||||||
Year Ended 12/31/16 | $ | 20.79 | (0.02 | ) | 1.13 | 1.11 | — | — | |||||||||||||||||||
Year Ended 12/31/15 | $ | 20.58 | (0.03 | ) | 0.24 | 0.21 | — | — | |||||||||||||||||||
(a) Per share net investment income (loss) has been calculated using the average daily shares method.
(b) Not annualized for periods less than one year.
(c) Annualized for periods less than one year.
See notes to financial statements.
40
Victory Portfolios | Financial Highlights — continued | ||||||
For a Share Outstanding Throughout Each Period
Ratios to Average Net Assets | Supplemental Data | ||||||||||||||||||||||||||||||||||
| Total Distributions | Net Asset Value, End of Period | Total Return (Excludes Sales Charge)(b) | Ratio of Net Expenses to Average Net Assets(c) | Ratio of Net Investment Income (Loss) to Average Net Assets(c) | Ratio of Gross Expenses to Average Net Assets(c) | Net Assets, End of Period (000's) | Portfolio Turnover(b)(d) | ||||||||||||||||||||||||||||
Victory RS Mid Cap Growth Fund | |||||||||||||||||||||||||||||||||||
Class A | |||||||||||||||||||||||||||||||||||
| Six Months Ended 6/30/20 (unaudited) | — | $ | 26.81 | 4.89 | % | 1.20 | % | (0.68 | )% | 1.37 | % | $ | 81,702 | 52 | % | ||||||||||||||||||||
Year Ended 12/31/19 | — | $ | 25.56 | 28.06 | % | 1.20 | % | (0.67 | )% | 1.35 | % | $ | 82,888 | 86 | % | ||||||||||||||||||||
Year Ended 12/31/18 | (3.88 | ) | $ | 19.96 | (7.37 | )% | 1.20 | % | (0.53 | )% | 1.34 | % | $ | 75,451 | 126 | % | |||||||||||||||||||
Year Ended 12/31/17 | — | $ | 25.77 | 20.87 | % | 1.20 | % | (0.44 | )% | 1.29 | % | $ | 108,271 | 86 | % | ||||||||||||||||||||
Year Ended 12/31/16 | — | $ | 21.32 | 5.08 | % | 1.20 | % | (0.35 | )% | 1.27 | % | $ | 231,056 | 138 | % | ||||||||||||||||||||
Year Ended 12/31/15 | — | $ | 20.29 | 0.74 | % | 1.23 | % | (0.39 | )% | 1.31 | % | $ | 196,437 | 120 | % | ||||||||||||||||||||
Class C | |||||||||||||||||||||||||||||||||||
| Six Months Ended 6/30/20 (unaudited) | — | $ | 23.06 | 4.44 | % | 2.11 | % | (1.59 | )% | 2.15 | % | $ | 16,205 | 52 | % | ||||||||||||||||||||
Year Ended 12/31/19 | — | $ | 22.08 | 26.90 | % | 2.11 | % | (1.58 | )% | 2.12 | % | $ | 20,266 | 86 | % | ||||||||||||||||||||
Year Ended 12/31/18 | (3.88 | ) | $ | 17.40 | (8.23 | )% | 2.11 | % | (1.44 | )% | 2.12 | % | $ | 18,072 | 126 | % | |||||||||||||||||||
Year Ended 12/31/17 | — | $ | 23.22 | 19.81 | % | 2.10 | % | (1.33 | )% | 2.10 | % | $ | 23,264 | 86 | % | ||||||||||||||||||||
Year Ended 12/31/16 | — | $ | 19.38 | 4.14 | % | 2.11 | % | (1.25 | )% | 2.11 | % | $ | 24,618 | 138 | % | ||||||||||||||||||||
Year Ended 12/31/15 | — | $ | 18.61 | (0.16 | )% | 2.11 | % | (1.30 | )% | 2.11 | % | $ | 26,793 | 120 | % | ||||||||||||||||||||
Class R | |||||||||||||||||||||||||||||||||||
| Six Months Ended 6/30/20 (unaudited) | — | $ | 24.39 | 4.59 | % | 1.80 | % | (1.29 | )% | 4.00 | % | $ | 721 | 52 | % | ||||||||||||||||||||
Year Ended 12/31/19 | — | $ | 23.32 | 27.36 | % | 1.80 | % | (1.26 | )% | 3.41 | % | $ | 927 | 86 | % | ||||||||||||||||||||
Year Ended 12/31/18 | (3.88 | ) | $ | 18.31 | (7.99 | )% | 1.80 | % | (1.13 | )% | 2.68 | % | $ | 1,144 | 126 | % | |||||||||||||||||||
Year Ended 12/31/17 | — | $ | 24.14 | 20.21 | % | 1.80 | % | (1.03 | )% | 2.43 | % | $ | 1,685 | 86 | % | ||||||||||||||||||||
Year Ended 12/31/16 | — | $ | 20.09 | 4.53 | % | 1.69 | % | (0.84 | )% | 1.69 | % | $ | 1,486 | 138 | % | ||||||||||||||||||||
Year Ended 12/31/15 | — | $ | 19.22 | 0.21 | % | 1.74 | % | (0.93 | )% | 1.74 | % | $ | 1,740 | 120 | % | ||||||||||||||||||||
Class R6 | |||||||||||||||||||||||||||||||||||
| Six Months Ended 6/30/20 (unaudited) | — | $ | 27.98 | 5.03 | % | 0.94 | % | (0.42 | )% | 1.01 | % | $ | 23,435 | 52 | % | ||||||||||||||||||||
Year Ended 12/31/19 | — | $ | 26.63 | 28.40 | % | 0.94 | % | (0.44 | )% | 1.05 | % | $ | 20,321 | 86 | % | ||||||||||||||||||||
Year Ended 12/31/18 | (3.88 | ) | $ | 20.74 | (7.15 | )% | 0.94 | % | (0.26 | )% | 1.32 | % | $ | 3,793 | 126 | % | |||||||||||||||||||
Year Ended 12/31/17 | — | $ | 26.55 | 21.23 | % | 0.94 | % | (0.17 | )% | 2.26 | % | $ | 2,132 | 86 | % | ||||||||||||||||||||
| 11/15/16(e) through 12/31/16 | — | $ | 21.90 | 2.82 | % | 0.94 | % | (0.02 | )% | 25.90 | % | $ | 60 | 138 | % | ||||||||||||||||||||
Class Y | |||||||||||||||||||||||||||||||||||
| Six Months Ended 6/30/20 (unaudited) | — | $ | 27.95 | 5.04 | % | 0.95 | % | (0.43 | )% | 1.10 | % | $ | 395,566 | 52 | % | ||||||||||||||||||||
Year Ended 12/31/19 | — | $ | 26.61 | 28.36 | % | 0.95 | % | (0.43 | )% | 1.10 | % | $ | 395,586 | 86 | % | ||||||||||||||||||||
Year Ended 12/31/18 | (3.88 | ) | $ | 20.73 | (7.15 | )% | 0.95 | % | (0.27 | )% | 1.05 | % | $ | 243,009 | 126 | % | |||||||||||||||||||
Year Ended 12/31/17 | — | $ | 26.54 | 21.19 | % | 0.95 | % | (0.18 | )% | 1.06 | % | $ | 310,050 | 86 | % | ||||||||||||||||||||
Year Ended 12/31/16 | — | $ | 21.90 | 5.34 | % | 0.95 | % | (0.10 | )% | 1.05 | % | $ | 168,936 | 138 | % | ||||||||||||||||||||
Year Ended 12/31/15 | — | $ | 20.79 | 1.02 | % | 0.97 | % | (0.15 | )% | 1.08 | % | $ | 173,629 | 120 | % | ||||||||||||||||||||
(d) Portfolio turnover is calculated on the basis of the Fund as a whole without distinguishing between the classes of shares issued.
(e) Commencement of operations.
(f) Amount is less than $0.005 per share.
See notes to financial statements.
41
Victory Portfolios | Financial Highlights | ||||||
For a Share Outstanding Throughout Each Period
Investment Activities | Distributions to Shareholders From | ||||||||||||||||||||||||||||||||||
| Net Asset Value, Beginning of Period | Net Investment Income (Loss)(a) | Net Realized and Unrealized Gains (Losses) on Investments | Total from Investment Activities | Net Realized Gains from Investments | Total Distributions | Net Asset Value, End of Period | Total Return (Excludes Sales Charge)(b) | ||||||||||||||||||||||||||||
Victory RS Growth Fund | |||||||||||||||||||||||||||||||||||
Class A | |||||||||||||||||||||||||||||||||||
| Six Months Ended 6/30/20 (unaudited) | $ | 19.22 | (0.03 | ) | 1.52 | 1.49 | — | — | $ | 20.71 | 7.75 | % | |||||||||||||||||||||||
Year Ended 12/31/19 | $ | 16.40 | (0.03 | ) | 4.90 | 4.87 | (2.05 | ) | (2.05 | ) | $ | 19.22 | 29.83 | % | |||||||||||||||||||||
Year Ended 12/31/18 | $ | 20.60 | (0.06 | ) | (1.36 | ) | (1.42 | ) | (2.78 | ) | (2.78 | ) | $ | 16.40 | (6.81 | )% | |||||||||||||||||||
Year Ended 12/31/17 | $ | 16.44 | (0.02 | ) | 5.24 | 5.22 | (1.06 | ) | (1.06 | ) | $ | 20.60 | 31.75 | % | |||||||||||||||||||||
Year Ended 12/31/16 | $ | 17.49 | (0.02 | ) | 0.36 | 0.34 | (1.39 | ) | (1.39 | ) | $ | 16.44 | 1.86 | % | |||||||||||||||||||||
Year Ended 12/31/15 | $ | 18.01 | (0.03 | ) | 0.74 | 0.71 | (1.23 | ) | (1.23 | ) | $ | 17.49 | 3.94 | % | |||||||||||||||||||||
Class C | |||||||||||||||||||||||||||||||||||
| Six Months Ended 6/30/20 (unaudited) | $ | 15.63 | (0.09 | ) | 1.23 | 1.14 | — | — | $ | 16.77 | 7.29 | % | |||||||||||||||||||||||
Year Ended 12/31/19 | $ | 13.75 | (0.16 | ) | 4.09 | 3.93 | (2.05 | ) | (2.05 | ) | $ | 15.63 | 28.74 | % | |||||||||||||||||||||
Year Ended 12/31/18 | $ | 17.90 | (0.21 | ) | (1.16 | ) | (1.37 | ) | (2.78 | ) | (2.78 | ) | $ | 13.75 | (7.56 | )% | |||||||||||||||||||
Year Ended 12/31/17 | $ | 14.51 | (0.15 | ) | 4.60 | 4.45 | (1.06 | ) | (1.06 | ) | $ | 17.90 | 30.57 | % | |||||||||||||||||||||
Year Ended 12/31/16 | $ | 15.73 | (0.14 | ) | 0.31 | 0.17 | (1.39 | ) | (1.39 | ) | $ | 14.51 | 1.05 | % | |||||||||||||||||||||
Year Ended 12/31/15 | $ | 16.45 | (0.17 | ) | 0.68 | 0.51 | (1.23 | ) | (1.23 | ) | $ | 15.73 | 3.09 | % | |||||||||||||||||||||
Class R | |||||||||||||||||||||||||||||||||||
| Six Months Ended 6/30/20 (unaudited) | $ | 17.29 | (0.08 | ) | 1.36 | 1.28 | — | — | $ | 18.57 | 7.40 | % | |||||||||||||||||||||||
Year Ended 12/31/19 | $ | 15.00 | (0.14 | ) | 4.48 | 4.34 | (2.05 | ) | (2.05 | ) | $ | 17.29 | 29.08 | % | |||||||||||||||||||||
Year Ended 12/31/18 | $ | 19.22 | (0.18 | ) | (1.26 | ) | (1.44 | ) | (2.78 | ) | (2.78 | ) | $ | 15.00 | (7.41 | )% | |||||||||||||||||||
Year Ended 12/31/17 | $ | 15.49 | (0.13 | ) | 4.92 | 4.79 | (1.06 | ) | (1.06 | ) | $ | 19.22 | 30.92 | % | |||||||||||||||||||||
Year Ended 12/31/16 | $ | 16.65 | (0.11 | ) | 0.34 | 0.23 | (1.39 | ) | (1.39 | ) | $ | 15.49 | 1.29 | % | |||||||||||||||||||||
Year Ended 12/31/15 | $ | 17.31 | (0.14 | ) | 0.71 | 0.57 | (1.23 | ) | (1.23 | ) | $ | 16.65 | 3.28 | % | |||||||||||||||||||||
Class Y | |||||||||||||||||||||||||||||||||||
| Six Months Ended 6/30/20 (unaudited) | $ | 20.11 | — | (e) | 1.59 | 1.59 | — | — | $ | 21.70 | 7.91 | % | |||||||||||||||||||||||
Year Ended 12/31/19 | $ | 17.04 | 0.02 | 5.10 | 5.12 | (2.05 | ) | (2.05 | ) | $ | 20.11 | 30.18 | % | ||||||||||||||||||||||
Year Ended 12/31/18 | $ | 21.23 | — | (e) | (1.41 | ) | (1.41 | ) | (2.78 | ) | (2.78 | ) | $ | 17.04 | (6.56 | )% | |||||||||||||||||||
Year Ended 12/31/17 | $ | 16.88 | 0.03 | 5.38 | 5.41 | (1.06 | ) | (1.06 | ) | $ | 21.23 | 32.05 | % | ||||||||||||||||||||||
Year Ended 12/31/16 | $ | 17.87 | 0.03 | 0.37 | 0.40 | (1.39 | ) | (1.39 | ) | $ | 16.88 | 2.16 | % | ||||||||||||||||||||||
Year Ended 12/31/15 | $ | 18.33 | 0.02 | 0.75 | 0.77 | (1.23 | ) | (1.23 | ) | $ | 17.87 | 4.20 | % | ||||||||||||||||||||||
(a) Per share net investment income (loss) has been calculated using the average daily shares method.
(b) Not annualized for periods less than one year.
(c) Annualized for periods less than one year.
(d) Portfolio turnover is calculated on the basis of the Fund as a whole without distinguishing between the classes of shares issued.
(e) Amount is less than $0.005 per share.
See notes to financial statements.
42
Victory Portfolios | Financial Highlights — continued | ||||||
For a Share Outstanding Throughout Each Period
Ratios to Average Net Assets | Supplemental Data | ||||||||||||||||||||||
| Ratio of Net Expenses to Average Net Assets(c) | Ratio of Net Investment Income (Loss) to Average Net Assets(c) | Ratio of Gross Expenses to Average Net Assets(c) | Net Assets, End of Period (000's) | Portfolio Turnover(b)(d) | |||||||||||||||||||
Victory RS Growth Fund | |||||||||||||||||||||||
Class A | |||||||||||||||||||||||
| Six Months Ended 6/30/20 (unaudited) | 1.10 | % | (0.29 | )% | 1.20 | % | $ | 226,318 | 43 | % | |||||||||||||
Year Ended 12/31/19 | 1.10 | % | (0.16 | )% | 1.19 | % | $ | 223,503 | 95 | % | |||||||||||||
Year Ended 12/31/18 | 1.10 | % | (0.28 | )% | 1.19 | % | $ | 188,220 | 87 | % | |||||||||||||
Year Ended 12/31/17 | 1.10 | % | (0.09 | )% | 1.20 | % | $ | 218,238 | 74 | % | |||||||||||||
Year Ended 12/31/16 | 1.10 | % | (0.09 | )% | 1.20 | % | $ | 189,921 | 123 | % | |||||||||||||
Year Ended 12/31/15 | 1.10 | % | (0.18 | )% | 1.19 | % | $ | 204,027 | 105 | % | |||||||||||||
Class C | |||||||||||||||||||||||
| Six Months Ended 6/30/20 (unaudited) | 1.93 | % | (1.12 | )% | 2.46 | % | $ | 3,699 | 43 | % | |||||||||||||
Year Ended 12/31/19 | 1.93 | % | (0.99 | )% | 2.33 | % | $ | 4,240 | 95 | % | |||||||||||||
Year Ended 12/31/18 | 1.93 | % | (1.10 | )% | 2.20 | % | $ | 4,409 | 87 | % | |||||||||||||
Year Ended 12/31/17 | 1.93 | % | (0.92 | )% | 2.10 | % | $ | 6,974 | 74 | % | |||||||||||||
Year Ended 12/31/16 | 1.93 | % | (0.93 | )% | 2.06 | % | $ | 8,487 | 123 | % | |||||||||||||
Year Ended 12/31/15 | 1.93 | % | (1.02 | )% | 2.02 | % | $ | 11,553 | 105 | % | |||||||||||||
Class R | |||||||||||||||||||||||
| Six Months Ended 6/30/20 (unaudited) | 1.71 | % | (0.90 | )% | 6.52 | % | $ | 345 | 43 | % | |||||||||||||
Year Ended 12/31/19 | 1.71 | % | (0.77 | )% | 5.41 | % | $ | 438 | 95 | % | |||||||||||||
Year Ended 12/31/18 | 1.71 | % | (0.88 | )% | 3.49 | % | $ | 516 | 87 | % | |||||||||||||
Year Ended 12/31/17 | 1.71 | % | (0.70 | )% | 2.72 | % | $ | 830 | 74 | % | |||||||||||||
Year Ended 12/31/16 | 1.71 | % | (0.69 | )% | 1.77 | % | $ | 1,054 | 123 | % | |||||||||||||
Year Ended 12/31/15 | 1.71 | % | (0.80 | )% | 1.79 | % | $ | 979 | 105 | % | |||||||||||||
Class Y | |||||||||||||||||||||||
| Six Months Ended 6/30/20 (unaudited) | 0.83 | % | (0.01 | )% | 1.00 | % | $ | 27,958 | 43 | % | |||||||||||||
Year Ended 12/31/19 | 0.83 | % | 0.11 | % | 0.98 | % | $ | 31,473 | 95 | % | |||||||||||||
Year Ended 12/31/18 | 0.83 | % | (0.01 | )% | 0.97 | % | $ | 26,457 | 87 | % | |||||||||||||
Year Ended 12/31/17 | 0.83 | % | 0.17 | % | 0.97 | % | $ | 30,309 | 74 | % | |||||||||||||
Year Ended 12/31/16 | 0.83 | % | 0.17 | % | 0.95 | % | $ | 25,107 | 123 | % | |||||||||||||
Year Ended 12/31/15 | 0.83 | % | 0.10 | % | 0.95 | % | $ | 38,301 | 105 | % | |||||||||||||
See notes to financial statements.
43
Victory Portfolios | Financial Highlights | ||||||
For a Share Outstanding Throughout Each Period
Investment Activities | Distributions to Shareholders From | ||||||||||||||||||||||||||||||||||||||
| Net Asset Value, Beginning of Period | Net Investment Income (Loss)(a) | Net Realized and Unrealized Gains (Losses) on Investments | Total from Investment Activities | Net Realized Gains from Investments | Total Distributions | Capital Contributions from Prior Custodian, Net (See Note 8) | Net Asset Value, End of Period | Total Return (Excludes Sales Charge)(b) | |||||||||||||||||||||||||||||||
Victory RS Science and Technology Fund | |||||||||||||||||||||||||||||||||||||||
Class A | |||||||||||||||||||||||||||||||||||||||
| Six Months Ended 6/30/20 (unaudited) | $ | 23.37 | (0.13 | ) | 4.44 | 4.31 | — | — | — | $ | 27.68 | 18.44 | % | ||||||||||||||||||||||||||
Year Ended 12/31/19 | $ | 18.34 | (0.26 | ) | 7.43 | 7.17 | (2.14 | ) | (2.14 | ) | — | $ | 23.37 | 39.32 | % | ||||||||||||||||||||||||
Year Ended 12/31/18 | $ | 21.56 | (0.27 | ) | 0.06 | (e) | (0.21 | ) | (3.01 | ) | (3.01 | ) | — | $ | 18.34 | (0.73 | )% | ||||||||||||||||||||||
Year Ended 12/31/17 | $ | 17.49 | (0.25 | ) | 8.04 | 7.79 | (3.72 | ) | (3.72 | ) | — | $ | 21.56 | 44.74 | % | ||||||||||||||||||||||||
Year Ended 12/31/16 | $ | 17.35 | (0.22 | ) | 2.64 | 2.42 | (2.28 | ) | (2.28 | ) | — | (f) | $ | 17.49 | 13.80 | %(g) | |||||||||||||||||||||||
Year Ended 12/31/15 | $ | 18.13 | (0.19 | ) | 1.26 | 1.07 | (1.85 | ) | (1.85 | ) | — | $ | 17.35 | 5.89 | % | ||||||||||||||||||||||||
Class C | |||||||||||||||||||||||||||||||||||||||
| Six Months Ended 6/30/20 (unaudited) | $ | 17.73 | (0.17 | ) | 3.35 | 3.18 | — | — | — | $ | 20.91 | 17.94 | % | ||||||||||||||||||||||||||
Year Ended 12/31/19 | $ | 14.40 | (0.35 | ) | 5.82 | 5.47 | (2.14 | ) | (2.14 | ) | — | $ | 17.73 | 38.27 | % | ||||||||||||||||||||||||
Year Ended 12/31/18 | $ | 17.73 | (0.38 | ) | 0.06 | (e) | (0.32 | ) | (3.01 | ) | (3.01 | ) | — | $ | 14.40 | (1.58 | )% | ||||||||||||||||||||||
Year Ended 12/31/17 | $ | 14.96 | (0.36 | ) | 6.85 | 6.49 | (3.72 | ) | (3.72 | ) | — | $ | 17.73 | 43.70 | % | ||||||||||||||||||||||||
Year Ended 12/31/16 | $ | 15.25 | (0.31 | ) | 2.30 | 1.99 | (2.28 | ) | (2.28 | ) | — | (f) | $ | 14.96 | 12.87 | %(g) | |||||||||||||||||||||||
Year Ended 12/31/15 | $ | 16.27 | (0.29 | ) | 1.12 | 0.83 | (1.85 | ) | (1.85 | ) | — | $ | 15.25 | 5.08 | % | ||||||||||||||||||||||||
Class R | |||||||||||||||||||||||||||||||||||||||
| Six Months Ended 6/30/20 (unaudited) | $ | 19.60 | (0.16 | ) | 3.72 | 3.56 | — | — | — | $ | 23.16 | 18.16 | % | ||||||||||||||||||||||||||
Year Ended 12/31/19 | $ | 15.70 | (0.31 | ) | 6.35 | 6.04 | (2.14 | ) | (2.14 | ) | — | $ | 19.60 | 38.73 | % | ||||||||||||||||||||||||
Year Ended 12/31/18 | $ | 18.99 | (0.33 | ) | 0.05 | (e) | (0.28 | ) | (3.01 | ) | (3.01 | ) | — | $ | 15.70 | (1.20 | )% | ||||||||||||||||||||||
Year Ended 12/31/17 | $ | 15.78 | (0.31 | ) | 7.24 | 6.93 | (3.72 | ) | (3.72 | ) | — | $ | 18.99 | 44.05 | % | ||||||||||||||||||||||||
Year Ended 12/31/16 | $ | 15.91 | (0.26 | ) | 2.41 | 2.15 | (2.28 | ) | (2.28 | ) | — | (f) | $ | 15.78 | 13.41 | %(g) | |||||||||||||||||||||||
Year Ended 12/31/15 | $ | 16.85 | (0.25 | ) | 1.16 | 0.91 | (1.85 | ) | (1.85 | ) | — | $ | 15.91 | 5.38 | % | ||||||||||||||||||||||||
Class Y | |||||||||||||||||||||||||||||||||||||||
| Six Months Ended 6/30/20 (unaudited) | $ | 25.36 | (0.11 | ) | 4.82 | 4.71 | — | — | — | $ | 30.07 | 18.57 | % | ||||||||||||||||||||||||||
Year Ended 12/31/19 | $ | 19.72 | (0.22 | ) | 8.00 | 7.78 | (2.14 | ) | (2.14 | ) | — | $ | 25.36 | 39.66 | % | ||||||||||||||||||||||||
Year Ended 12/31/18 | $ | 22.90 | (0.22 | ) | 0.05 | (e) | (0.17 | ) | (3.01 | ) | (3.01 | ) | — | $ | 19.72 | (0.51 | )% | ||||||||||||||||||||||
Year Ended 12/31/17 | $ | 18.37 | (0.21 | ) | 8.46 | 8.25 | (3.72 | ) | (3.72 | ) | — | $ | 22.90 | 45.11 | % | ||||||||||||||||||||||||
Year Ended 12/31/16 | $ | 18.08 | (0.18 | ) | 2.75 | 2.57 | (2.28 | ) | (2.28 | ) | — | (f) | $ | 18.37 | 14.07 | %(g) | |||||||||||||||||||||||
Year Ended 12/31/15 | $ | 18.78 | (0.14 | ) | 1.29 | 1.15 | (1.85 | ) | (1.85 | ) | — | $ | 18.08 | 6.11 | % | ||||||||||||||||||||||||
(a) Per share net investment income (loss) has been calculated using the average daily shares method.
(b) Not annualized for periods less than one year.
(c) Annualized for periods less than one year.
(d) Portfolio turnover is calculated on the basis of the Fund as a whole without distinguishing between the classes of shares issued.
See notes to financial statements.
44
Victory Portfolios | Financial Highlights — continued | ||||||
For a Share Outstanding Throughout Each Period
Ratios to Average Net Assets | Supplemental Data | ||||||||||||||||||||||
| Ratio of Net Expenses to Average Net Assets(c) | Ratio of Net Investment Income (Loss) to Average Net Assets(c) | Ratio of Gross Expenses to Average Net Assets(c) | Net Assets, End of Period (000's) | Portfolio Turnover(b)(d) | |||||||||||||||||||
Victory RS Science and Technology Fund | |||||||||||||||||||||||
Class A | |||||||||||||||||||||||
| Six Months Ended 6/30/20 (unaudited) | 1.49 | % | (1.15 | )% | 1.49 | % | $ | 232,840 | 13 | % | |||||||||||||
Year Ended 12/31/19 | 1.48 | % | (1.14 | )% | 1.48 | % | $ | 199,591 | 88 | % | |||||||||||||
Year Ended 12/31/18 | 1.47 | % | (1.10 | )% | 1.47 | % | $ | 140,389 | 83 | % | |||||||||||||
Year Ended 12/31/17 | 1.49 | % | (1.18 | )% | 1.49 | % | $ | 146,002 | 89 | % | |||||||||||||
Year Ended 12/31/16 | 1.51 | % | (1.24 | )% | 1.52 | % | $ | 105,041 | 114 | % | |||||||||||||
Year Ended 12/31/15 | 1.49 | % | (1.01 | )% | 1.49 | % | $ | 109,201 | 119 | % | |||||||||||||
Class C | |||||||||||||||||||||||
| Six Months Ended 6/30/20 (unaudited) | 2.28 | % | (1.94 | )% | 2.35 | % | $ | 14,676 | 13 | % | |||||||||||||
Year Ended 12/31/19 | 2.28 | % | (1.94 | )% | 2.34 | % | $ | 14,054 | 88 | % | |||||||||||||
Year Ended 12/31/18 | 2.28 | % | (1.91 | )% | 2.31 | % | $ | 11,857 | 83 | % | |||||||||||||
Year Ended 12/31/17 | 2.28 | % | (1.97 | )% | 2.31 | % | $ | 11,831 | 89 | % | |||||||||||||
Year Ended 12/31/16 | 2.32 | % | (2.05 | )% | 2.32 | % | $ | 10,332 | 114 | % | |||||||||||||
Year Ended 12/31/15 | 2.28 | % | (1.79 | )% | 2.28 | % | $ | 11,160 | 119 | % | |||||||||||||
Class R | |||||||||||||||||||||||
| Six Months Ended 6/30/20 (unaudited) | 1.93 | % | (1.59 | )% | 4.26 | % | $ | 886 | 13 | % | |||||||||||||
Year Ended 12/31/19 | 1.93 | % | (1.59 | )% | 4.28 | % | $ | 681 | 88 | % | |||||||||||||
Year Ended 12/31/18 | 1.93 | % | (1.56 | )% | 2.75 | % | $ | 707 | 83 | % | |||||||||||||
Year Ended 12/31/17 | 1.93 | % | (1.62 | )% | 2.54 | % | $ | 1,705 | 89 | % | |||||||||||||
Year Ended 12/31/16 | 1.91 | % | (1.63 | )% | 1.91 | % | $ | 1,394 | 114 | % | |||||||||||||
Year Ended 12/31/15 | 1.93 | % | (1.45 | )% | 1.93 | % | $ | 1,281 | 119 | % | |||||||||||||
Class Y | |||||||||||||||||||||||
| Six Months Ended 6/30/20 (unaudited) | 1.24 | % | (0.90 | )% | 1.27 | % | $ | 83,847 | 13 | % | |||||||||||||
Year Ended 12/31/19 | 1.24 | % | (0.89 | )% | 1.26 | % | $ | 77,998 | 88 | % | |||||||||||||
Year Ended 12/31/18 | 1.24 | % | (0.85 | )% | 1.25 | % | $ | 53,395 | 83 | % | |||||||||||||
Year Ended 12/31/17 | 1.24 | % | (0.92 | )% | 1.26 | % | $ | 32,047 | 89 | % | |||||||||||||
Year Ended 12/31/16 | 1.28 | % | (1.01 | )% | 1.29 | % | $ | 19,335 | 114 | % | |||||||||||||
Year Ended 12/31/15 | 1.24 | % | (0.74 | )% | 1.24 | % | $ | 27,416 | 119 | % | |||||||||||||
(e) The amount shown for a share outstanding throughout the period does not accord with the change in net assets resulting from operations during the period because of the timing of sales and purchases of fund shares in relation to fluctuating market values during the period.
(f) Amount is less than $0.005 per share.
(g) The Fund received monies related to a nonrecurring refund from the prior Custodian. The corresponding impact to the total return was less than 0.005% for the period shown. (See Note 8)
See notes to financial statements.
45
Victory Portfolios | Financial Highlights | ||||||
For a Share Outstanding Throughout Each Period
Investment Activities | Distributions to Shareholders From | ||||||||||||||||||||||||||||||||||||||
| Net Asset Value, Beginning of Period | Net Investment Income (Loss)(a) | Net Realized and Unrealized Gains (Losses) on Investments | Total from Investment Activities | Net Realized Gains from Investments | Total Distributions | Capital Contributions from Prior Custodian, Net (See Note 8) | Net Asset Value, End of Period | Total Return (Excludes Sales Charge)(b) | |||||||||||||||||||||||||||||||
Victory RS Small Cap Equity Fund | |||||||||||||||||||||||||||||||||||||||
Class A | |||||||||||||||||||||||||||||||||||||||
| Six Months Ended 6/30/20 (unaudited) | $ | 16.05 | (0.08 | ) | 0.51 | 0.43 | — | — | — | $ | 16.48 | 2.68 | % | ||||||||||||||||||||||||||
Year Ended 12/31/19 | $ | 12.97 | (0.15 | ) | 5.11 | 4.96 | (1.88 | ) | (1.88 | ) | — | $ | 16.05 | 38.49 | % | ||||||||||||||||||||||||
Year Ended 12/31/18 | $ | 18.88 | (0.16 | ) | (1.47 | ) | (1.63 | ) | (4.28 | ) | (4.28 | ) | — | $ | 12.97 | (8.39 | )% | ||||||||||||||||||||||
Year Ended 12/31/17 | $ | 14.41 | (0.14 | ) | 5.55 | 5.41 | (0.94 | ) | (0.94 | ) | — | $ | 18.88 | 37.57 | % | ||||||||||||||||||||||||
Year Ended 12/31/16 | $ | 14.24 | (0.12 | ) | 0.28 | 0.16 | — | — | 0.01 | $ | 14.41 | 1.19 | %(e) | ||||||||||||||||||||||||||
Year Ended 12/31/15 | $ | 19.81 | (0.20 | ) | 0.38 | 0.18 | (5.75 | ) | (5.75 | ) | — | $ | 14.24 | 0.61 | % | ||||||||||||||||||||||||
Class C | |||||||||||||||||||||||||||||||||||||||
| Six Months Ended 6/30/20 (unaudited) | $ | 4.13 | (0.04 | ) | 0.14 | 0.10 | — | — | — | $ | 4.23 | 2.42 | % | ||||||||||||||||||||||||||
Year Ended 12/31/19 | $ | 4.40 | (0.09 | ) | 1.70 | 1.61 | (1.88 | ) | (1.88 | ) | — | $ | 4.13 | 37.26 | % | ||||||||||||||||||||||||
Year Ended 12/31/18 | $ | 9.61 | (0.17 | ) | (0.76 | ) | (0.93 | ) | (4.28 | ) | (4.28 | ) | — | $ | 4.40 | (9.23 | )% | ||||||||||||||||||||||
Year Ended 12/31/17 | $ | 7.74 | (0.15 | ) | 2.96 | 2.81 | (0.94 | ) | (0.94 | ) | — | $ | 9.61 | 36.34 | % | ||||||||||||||||||||||||
Year Ended 12/31/16 | $ | 7.71 | (0.12 | ) | 0.14 | 0.02 | — | — | 0.01 | $ | 7.74 | 0.39 | %(e) | ||||||||||||||||||||||||||
Year Ended 12/31/15 | $ | 13.42 | (0.25 | ) | 0.29 | 0.04 | (5.75 | ) | (5.75 | ) | — | $ | 7.71 | (0.17 | )% | ||||||||||||||||||||||||
Class R | |||||||||||||||||||||||||||||||||||||||
| Six Months Ended 6/30/20 (unaudited) | $ | 12.32 | (0.09 | ) | 0.39 | 0.30 | — | — | — | $ | 12.62 | 2.44 | % | ||||||||||||||||||||||||||
Year Ended 12/31/19 | $ | 10.32 | (0.18 | ) | 4.06 | 3.88 | (1.88 | ) | (1.88 | ) | — | $ | 12.32 | 37.91 | % | ||||||||||||||||||||||||
Year Ended 12/31/18 | $ | 16.08 | (0.23 | ) | (1.25 | ) | (1.48 | ) | (4.28 | ) | (4.28 | ) | — | $ | 10.32 | (8.92 | )% | ||||||||||||||||||||||
Year Ended 12/31/17 | $ | 12.44 | (0.20 | ) | 4.78 | 4.58 | (0.94 | ) | (0.94 | ) | — | $ | 16.08 | 36.84 | % | ||||||||||||||||||||||||
Year Ended 12/31/16 | $ | 12.33 | (0.14 | ) | 0.24 | 0.10 | — | — | 0.01 | $ | 12.44 | 0.89 | %(e) | ||||||||||||||||||||||||||
Year Ended 12/31/15 | $ | 17.99 | (0.26 | ) | 0.35 | 0.09 | (5.75 | ) | (5.75 | ) | — | $ | 12.33 | 0.16 | % | ||||||||||||||||||||||||
Class Y | |||||||||||||||||||||||||||||||||||||||
| Six Months Ended 6/30/20 (unaudited) | $ | 16.52 | (0.06 | ) | 0.52 | 0.46 | — | — | — | $ | 16.98 | 2.78 | % | ||||||||||||||||||||||||||
Year Ended 12/31/19 | $ | 13.29 | (0.13 | ) | 5.24 | 5.11 | (1.88 | ) | (1.88 | ) | — | $ | 16.52 | 38.69 | % | ||||||||||||||||||||||||
Year Ended 12/31/18 | $ | 19.20 | (0.14 | ) | (1.49 | ) | (1.63 | ) | (4.28 | ) | (4.28 | ) | — | $ | 13.29 | (8.23 | )% | ||||||||||||||||||||||
Year Ended 12/31/17 | $ | 14.62 | (0.14 | ) | 5.66 | 5.52 | (0.94 | ) | (0.94 | ) | — | $ | 19.20 | 37.78 | % | ||||||||||||||||||||||||
Year Ended 12/31/16 | $ | 14.39 | (0.08 | ) | 0.30 | 0.22 | — | — | 0.01 | $ | 14.62 | 1.60 | %(e) | ||||||||||||||||||||||||||
Year Ended 12/31/15 | $ | 20.04 | (0.16 | ) | 0.26 | 0.10 | (5.75 | ) | (5.75 | ) | — | $ | 14.39 | 0.18 | % | ||||||||||||||||||||||||
(a) Per share net investment income (loss) has been calculated using the average daily shares method.
(b) Not annualized for periods less than one year.
(c) Annualized for periods less than one year.
(d) Portfolio turnover is calculated on the basis of the Fund as a whole without distinguishing between the classes of shares issued.
(e) The Fund received monies related to a nonrecurring refund from the prior Custodian. The corresponding impact to the total return was less than 0.005% for the period shown. (See Note 8)
See notes to financial statements.
46
Victory Portfolios | Financial Highlights — continued | ||||||
For a Share Outstanding Throughout Each Period
Ratios to Average Net Assets | Supplemental Data | ||||||||||||||||||||||
Net Expenses(c) | Net Investment Income(c) | Gross Expenses(c) | Net Assets, End of Period (000's) | Portfolio Turnover(b)(d) | |||||||||||||||||||
Victory RS Small Cap Equity Fund | |||||||||||||||||||||||
Class A | |||||||||||||||||||||||
| Six Months Ended 6/30/20 (unaudited) | 1.29 | % | (1.03 | )% | 1.29 | % | $ | 59,951 | 38 | % | |||||||||||||
Year Ended 12/31/19 | 1.26 | % | (0.93 | )% | 1.26 | % | $ | 63,247 | 89 | % | |||||||||||||
Year Ended 12/31/18 | 1.22 | % | (0.78 | )% | 1.22 | % | $ | 51,619 | 77 | % | |||||||||||||
Year Ended 12/31/17 | 1.25 | % | (0.84 | )% | 1.25 | % | $ | 65,514 | 79 | % | |||||||||||||
Year Ended 12/31/16 | 1.35 | % | (0.88 | )% | 1.36 | % | $ | 52,075 | 86 | % | |||||||||||||
Year Ended 12/31/15 | 1.30 | % | 0.97 | % | 1.30 | % | $ | 65 | 98 | % | |||||||||||||
Class C | |||||||||||||||||||||||
| Six Months Ended 6/30/20 (unaudited) | 2.10 | % | (1.85 | )% | 5.21 | % | $ | 349 | 38 | % | |||||||||||||
Year Ended 12/31/19 | 2.10 | % | (1.76 | )% | 3.86 | % | $ | 478 | 89 | % | |||||||||||||
Year Ended 12/31/18 | 2.10 | % | (1.71 | )% | 4.24 | % | $ | 616 | 77 | % | |||||||||||||
Year Ended 12/31/17 | 2.10 | % | (1.69 | )% | 3.87 | % | $ | 533 | 79 | % | |||||||||||||
Year Ended 12/31/16 | 2.10 | % | (1.64 | )% | 3.14 | % | $ | 410 | 86 | % | |||||||||||||
Year Ended 12/31/15 | 2.10 | % | 1.77 | % | 2.39 | % | $ | 1 | 98 | % | |||||||||||||
Class R | |||||||||||||||||||||||
| Six Months Ended 6/30/20 (unaudited) | 1.75 | % | (1.49 | )% | 2.07 | % | $ | 3,031 | 38 | % | |||||||||||||
Year Ended 12/31/19 | 1.75 | % | (1.42 | )% | 2.05 | % | $ | 2,874 | 89 | % | |||||||||||||
Year Ended 12/31/18 | 1.75 | % | (1.30 | )% | 1.88 | % | $ | 2,303 | 77 | % | |||||||||||||
Year Ended 12/31/17 | 1.75 | % | (1.34 | )% | 1.97 | % | $ | 3,381 | 79 | % | |||||||||||||
Year Ended 12/31/16 | 1.70 | % | (1.24 | )% | 1.70 | % | $ | 2,954 | 86 | % | |||||||||||||
Year Ended 12/31/15 | 1.71 | % | (1.39 | )% | 1.71 | % | $ | 3,662 | 98 | % | |||||||||||||
Class Y | |||||||||||||||||||||||
| Six Months Ended 6/30/20 (unaudited) | 1.10 | % | (0.84 | )% | 1.64 | % | $ | 3,344 | 38 | % | |||||||||||||
Year Ended 12/31/19 | 1.10 | % | (0.77 | )% | 1.43 | % | $ | 3,275 | 89 | % | |||||||||||||
Year Ended 12/31/18 | 1.10 | % | (0.69 | )% | 1.68 | % | $ | 2,750 | 77 | % | |||||||||||||
Year Ended 12/31/17 | 1.10 | % | (0.78 | )% | 1.34 | % | $ | 6,398 | 79 | % | |||||||||||||
Year Ended 12/31/16 | 1.10 | % | (0.64 | )% | 1.24 | % | $ | 1,834 | 86 | % | |||||||||||||
Year Ended 12/31/15 | 1.07 | % | (0.76 | )% | 1.07 | % | $ | 3,804 | 98 | % | |||||||||||||
See notes to financial statements.
47
Victory Portfolios | Notes to Financial Statements June 30, 2020 | ||||||
(Unaudited)
1. Organization:
Victory Portfolios (the "Trust") was organized on December 6, 1995 as a Delaware statutory trust as a successor to a company named "The Victory Portfolios," which was organized as a Massachusetts business trust on February 5, 1986. The Trust is registered under the Investment Company Act of 1940, as amended (the "1940 Act"), as an open-end investment company. The Trust is comprised of 42 funds and is authorized to issue an unlimited number of shares, which are units of beneficial interest with a par value of $0.001 per share. Each Fund is classified as diversified under the 1940 Act.
The accompanying financial statements are those of the following six Funds (collectively, the "Funds" and individually, a "Fund").
Funds (Legal Name) | Funds (Short Name) | Investment Share Classes Offered | |||||||||
Victory RS Small Cap Growth Fund | RS Small Cap Growth Fund | Classes A, C, R, R6 and Y | |||||||||
Victory RS Select Growth Fund | RS Select Growth Fund | Classes A, C, R, R6 and Y | |||||||||
Victory RS Mid Cap Growth Fund | RS Mid Cap Growth Fund | Classes A, C, R, R6 and Y | |||||||||
Victory RS Growth Fund | RS Growth Fund | Classes A, C, R and Y | |||||||||
| Victory RS Science and Technology Fund | RS Science and Technology Fund | Classes A, C, R and Y | |||||||||
Victory RS Small Cap Equity Fund | RS Small Cap Equity Fund | Classes A, C, R and Y | |||||||||
Each class of shares of a Fund has substantially identical rights and privileges except with respect to sales charges, fees paid under distribution plans, expenses allocable exclusively to each class of shares, voting rights on matters solely affecting a single class of shares, and the exchange privilege of each class of shares.
Under the Trust's organizational documents, its officers and trustees are indemnified against certain liabilities arising out of the performance of their duties to the Funds. In addition, in the normal course of business, the Funds enter into contracts with their vendors and others that provide for general indemnifications. The Funds' maximum exposure under these arrangements is unknown, as this would involve future claims that may be made against the Funds. However, based on experience, the Funds expect that risk of loss to be remote.
2. Significant Accounting Policies:
The following is a summary of significant accounting policies followed by the Trust in the preparation of its financial statements. The policies are in conformity with generally accepted accounting principles in the United States of America ("GAAP"). The preparation of financial statements in accordance with GAAP requires management to make estimates and assumptions that affect the reported amounts of assets and liabilities and disclosure of contingent assets and liabilities at the date of the financial statements and the reported amounts of income and expenses for the period. Actual results could differ from those estimates. The Funds follow the specialized accounting and reporting requirements under GAAP that are applicable to investment companies.
Investment Valuation:
The Funds record investments at fair value. Fair value is defined as the price that would be received to sell an asset or paid to transfer a liability in an orderly transaction between market participants at the measurement date.
The valuation techniques described below maximize the use of observable inputs and minimize the use of unobservable inputs in determining fair value. The inputs used for valuing the Funds' investments are summarized in the three broad levels listed below:
• Level 1 — quoted prices in active markets for identical securities
• Level 2 — other significant observable inputs (including quoted prices for similar securities or interest rates applicable to those securities, etc.)
48
Victory Portfolios | Notes to Financial Statements — continued June 30, 2020 | ||||||
(Unaudited)
• Level 3 — significant unobservable inputs (including the Funds' own assumptions in determining the fair value of investments)
Changes in valuation techniques may result in transfers in or out of an assigned level within the disclosure hierarchy. The inputs or methodologies used for valuation techniques are not necessarily an indication of the risk associated with entering into those investments.
Portfolio securities listed or traded on securities exchanges, including American Depositary Receipts ("ADRs") and Rights, are valued at the closing price on the exchange or system where the security is principally traded, if available, or at the Nasdaq Official Closing Price. If there have been no sales for that day on the exchange or system, then a security is valued at the last available bid quotation on the exchange or system where the security is principally traded. In each of these situations, valuations are typically categorized as Level 1 in the fair value hierarchy.
Investments for which there are no such quotations, or for which quotations do not appear reliable, are valued at fair value in accordance with procedures established by and under the general supervision and responsibility of the Trust's Board of Trustees (the "Board"). These valuations are typically categorized as Level 2 or Level 3 in the fair value hierarchy, based on the observability of inputs used to determine the fair value.
A summary of the valuations as of June 30, 2020, based upon the three levels defined above, is included in the table below while the breakdown, by category, of investments is disclosed on the Schedules of Portfolio Investments.
LEVEL 1 | LEVEL 2 | LEVEL 3 | Total | ||||||||||||||||
RS Small Cap Growth Fund | |||||||||||||||||||
Common Stocks | $ | 2,202,187,385 | $ | 9,596,066 | $ | — | $ | 2,211,783,451 | |||||||||||
Preferred Stocks | — | 7,615,565 | — | 7,615,565 | |||||||||||||||
Collateral for Securities Loaned | 273,945,855 | — | — | 273,945,855 | |||||||||||||||
Total | $ | 2,476,133,240 | $ | 17,211,631 | $ | — | $ | 2,493,344,871 | |||||||||||
RS Select Growth Fund | |||||||||||||||||||
Common Stocks | $ | 200,813,963 | $ | — | $ | — | $ | 200,813,963 | |||||||||||
Collateral for Securities Loaned | 13,066,652 | — | — | 13,066,652 | |||||||||||||||
Total | $ | 213,880,615 | $ | — | $ | — | $ | 213,880,615 | |||||||||||
RS Mid Cap Growth Fund | |||||||||||||||||||
Common Stocks | $ | 512,089,197 | $ | — | $ | — | $ | 512,089,197 | |||||||||||
Collateral for Securities Loaned | 38,242,799 | — | — | 38,242,799 | |||||||||||||||
Total | $ | 550,331,996 | $ | — | $ | — | $ | 550,331,996 | |||||||||||
RS Growth Fund | |||||||||||||||||||
Common Stocks | $ | 255,450,630 | $ | — | $ | — | $ | 255,450,630 | |||||||||||
Collateral for Securities Loaned | 20,053,915 | — | — | 20,053,915 | |||||||||||||||
Total | $ | 275,504,545 | $ | — | $ | — | $ | 275,504,545 | |||||||||||
RS Science and Technology Fund | |||||||||||||||||||
Common Stocks | $ | 316,662,472 | $ | 4,070,772 | $ | — | $ | 320,733,244 | |||||||||||
Collateral for Securities Loaned | 48,735,563 | — | — | 48,735,563 | |||||||||||||||
Total | $ | 365,398,035 | $ | 4,070,772 | $ | — | $ | 369,468,807 | |||||||||||
RS Small Cap Equity Fund | |||||||||||||||||||
Common Stocks | $ | 65,164,241 | $ | 287,101 | $ | — | $ | 65,451,342 | |||||||||||
Preferred Stocks | — | 227,852 | — | 227,852 | |||||||||||||||
Collateral for Securities Loaned | 10,298,696 | — | — | 10,298,696 | |||||||||||||||
Total | $ | 75,462,937 | $ | 514,953 | $ | — | $ | 75,977,890 | |||||||||||
49
Victory Portfolios | Notes to Financial Statements — continued June 30, 2020 | ||||||
(Unaudited)
For the six months ended June 30, 2020, there were no transfers in or out of the Level 3 fair value hierarchy.
Real Estate Investment Trusts ("REITs"):
The Funds may invest in REITs, which report information on the source of their distributions annually. REITs are pooled investment vehicles that invest primarily in income-producing real estate or real-estate related loans or interests (such as mortgages). Certain distributions received from REITs during the year are recorded as realized gains or return of capital as estimated by the Funds or when such information becomes known.
Investment Transactions and Related Income:
Changes in holdings of investments are accounted for no later than one business day following the trade date. For financial reporting purposes, however, investment transactions are accounted for on trade date on the last business day of the reporting period. Interest income is determined on the basis of coupon interest accrued using the effective interest method which adjusts, where applicable, the amortization of premiums or accretion of discounts. Dividend income is recorded on the ex-dividend date. Gains or losses realized on sales of securities are recorded on the identified cost basis.
Withholding taxes on interest, dividends and gains as a result of certain investments in ADRs by the Funds have been provided for in accordance with each investment's applicable country's tax rules and rates.
Securities Lending:
The Trust has entered into a Master Securities Lending Agreement ("MSLA") with Citibank, N.A. ("Citibank" or the "Agent"). Under the terms of the MSLA, the Funds may lend securities to certain broker-dealers and banks in exchange for collateral in the amount of at least 102% of the value of U.S. securities loaned or at least 105% of the value of non-U.S. securities loaned, marked-to-market daily. Any collateral shortfalls associated with increases in the valuation of the securities loaned are adjusted the next business day. The collateral can be received in the form of cash collateral and/or non-cash collateral. Non-cash collateral can include U.S. Government Securities, letters of credit and certificates of deposit. The cash collateral is invested in short-term instruments or cash equivalents, primarily open-end investment companies, as noted on the Funds' Schedules of Portfolio Investments. The Trust does not have effective control of the non-cash collateral and therefore it is not disclosed on the Funds' Schedules of Portfolio Investments. During the time portfolio securities are on loan, the borrower will pay the Funds any dividends or interest paid on such securities plus any fee negotiated between the parties to the lending agreement. The Funds also earn a return from the collateral. The Funds pay the Agent various fees in connection with the investment of cash collateral and fees based on the investment income received from securities lending activities. Securities lending income (net of these fees) is disclosed on the Statements of Operations. Although risk is mitigated by the collateral, the Funds could experience a delay in recovering their securities and possible loss of income or value if the borrower fails to return them.
Securities lending transactions are entered into by a Fund under the MSLA, which permits the Fund, under certain circumstances such as an event of default, to offset amounts payable by the Fund to the same counterparty against amounts receivable from the counterparty to create a net payment due to or from the Fund.
The following table is a summary of the Funds' securities lending transactions which are subject to offset under the MSLA as of June 30, 2020. These transactions are accounted for as secured borrowings with an overnight and continuous contractual maturity for cash collateral and greater than overnight and continuous contractual maturity for non-cash collateral.
50
Victory Portfolios | Notes to Financial Statements — continued June 30, 2020 | ||||||
(Unaudited)
| Gross Amount of Recognized Assets (Value of | Value of Cash | Value of Non-cash Collateral Received by Maturity | |||||||||||||||||||||||||
| Securities on Loan) | Collateral Received* | <30 | Between 30 & 90 Days | 90 Days | Net Amount | ||||||||||||||||||||||
| RS Small Cap Growth Fund | $ | 271,352,115 | $ | 271,352,115 | $ | — | $ | — | $ | — | $ | — | |||||||||||||||
RS Select Growth Fund | 12,914,499 | 12,914,499 | — | — | — | — | |||||||||||||||||||||
| RS Mid Cap Growth Fund | 38,186,338 | 38,186,338 | — | — | — | — | |||||||||||||||||||||
RS Growth Fund | 20,085,225 | 20,085,225 | — | — | — | — | |||||||||||||||||||||
| RS Science and Technology Fund | 48,058,199 | 48,058,199 | — | — | — | — | |||||||||||||||||||||
| RS Small Cap Equity Fund | 10,204,751 | 10,204,751 | — | — | — | — | |||||||||||||||||||||
* Collateral received in excess of the market value of securities on loan is not presented in this table. The total cash collateral received by each Fund is disclosed on the Statements of Assets and Liabilities.
Distributions to Shareholders:
Dividends from net investment income, if any, are declared and paid annually for the Funds. Distributable net realized gains, if any, are declared and distributed at least annually from each Fund.
The amounts of dividends from net investment income and distributions from net realized gains (collectively, distributions to shareholders) are determined in accordance with federal income tax regulations, which may differ from GAAP. To the extent these "book/tax" differences are permanent in nature (e.g., net operating loss and distribution reclassification), such amounts are reclassified within the components of net assets based on their federal tax-basis treatment; temporary differences (e.g., wash sales) do not require reclassification. To the extent dividends and distributions exceed net investment income and net realized gains for tax purposes, they are reported as distributions of capital. Net investment losses incurred by a Fund may be reclassified as an offset to capital on the accompanying Statements of Assets and Liabilities.
Federal Income Taxes:
It is the policy of each Fund to continue to qualify as a regulated investment company by complying with the provisions available to certain investment companies, as defined in applicable sections of the Internal Revenue Code, and to make distributions of net investment income and net realized gains sufficient to relieve it from all, or substantially all, federal income taxes. Accordingly, no provision for federal income taxes is required in the financial statements. The Funds have a tax year end of December 31.
Management of the Funds has reviewed tax positions taken in tax years that remain subject to examination by all major tax jurisdictions, including federal (i.e., the last four tax years, which includes the current fiscal tax year end). Management believes that there is no tax liability resulting from unrecognized tax benefits related to uncertain tax positions taken.
Allocations:
Expenses directly attributable to a Fund are charged to the Fund, while expenses which are attributable to more than one fund in the Trust, or jointly with an affiliated trust, are allocated among the respective funds in the Trust and/or affiliated trust based upon net assets or another appropriate basis.
Income, expenses (other than class-specific expenses such as transfer agent fees, state registration fees, printing fees and 12b-1 fees), and realized and unrealized gains or losses on investments are allocated to each class of shares based on its relative net assets on the date income is earned or expenses and realized and unrealized gains and losses are incurred.
51
Victory Portfolios | Notes to Financial Statements — continued June 30, 2020 | ||||||
(Unaudited)
3. Purchases and Sales of Securities:
Purchases and sales of securities (excluding securities maturing less than one year from acquisition) for the six months ended June 30, 2020 were as follows:
Purchases | Sales | ||||||||||
RS Small Cap Growth Fund | $ | 823,712,937 | $ | 904,706,076 | |||||||
RS Select Growth Fund | 67,517,627 | 95,664,816 | |||||||||
RS Mid Cap Growth Fund | 251,810,439 | 278,524,049 | |||||||||
RS Growth Fund | 104,863,263 | 126,570,156 | |||||||||
RS Science and Technology Fund | 37,492,563 | 56,058,042 | |||||||||
RS Small Cap Equity Fund | 23,918,889 | 28,322,761 | |||||||||
For the six months ended June 30, 2020, there were no purchases or sales of U.S. Government Securities.
4. Fees and Transactions with Affiliates and Related Parties:
Investment advisory services are provided to the Funds by Victory Capital Management Inc. ("VCM" or the "Adviser"), a New York corporation registered as an investment adviser with the Securities and Exchange Commission ("SEC"). The Adviser is a wholly owned indirect subsidiary of Victory Capital Holdings, Inc., a publicly traded Delaware corporation and a wholly owned direct subsidiary of Victory Capital Operating, LLC.
Under the terms of the Investment Advisory Agreement, the Adviser is entitled to receive fees based on a percentage of the average daily net assets of each Fund. The rates at which the Adviser is paid by each Fund are included in the table below. The Adviser may use its resources to assist with the Funds' distribution and marketing expenses.
Flat Rate | |||||||
RS Small Cap Growth Fund | 0.95 | % | |||||
RS Select Growth Fund | 1.00 | % | |||||
RS Mid Cap Growth Fund | 0.85 | % | |||||
RS Growth Fund | 0.75 | % | |||||
RS Science and Technology Fund | 1.00 | % | |||||
RS Small Cap Equity Fund | 0.75 | % | |||||
VCM also serves as the Funds' administrator and fund accountant. Under an Administration and Fund Accounting Agreement, VCM is paid for its services an annual fee at a rate of 0.08% of the first $15 billion in average daily net assets of the Trust, Victory Variable Insurance Funds and Victory Portfolios II (collectively, the "Victory Funds Complex"), 0.05% of the average daily net assets above $15 billion to $30 billion of the Victory Funds Complex and 0.04% of the average daily net assets over $30 billion of the Victory Funds Complex.
Citi Fund Services Ohio, Inc. ("Citi"), an affiliate of Citibank, acts as sub-administrator and sub-fund accountant to the Funds pursuant to a Sub-Administration and Sub-Fund Accounting Services Agreement between VCM and Citi. VCM pays Citi a fee for providing these services. The Funds reimburse VCM and Citi for reasonable out-of-pocket expenses incurred in providing these services and certain other expenses specifically allocated to the Funds under the Fund Administration, Servicing, and Accounting Agreement. Amounts paid by the Funds to reimburse VCM for expenses incurred during the six months ended June 30, 2020, are reflected on the Statements of Operations as Sub-Administration fees.
Citibank acts as the custodian of the Funds' assets pursuant to the Global Custodial Services Agreement (the "Custody Agreement"). Citibank's responsibilities include safeguarding and controlling the Funds' cash and securities, handling the receipt and delivery of securities, and collecting interest and dividends on the Funds' investments. Pursuant to the Custody Agreement, Citibank also maintains original entry documents and books of record and general ledgers; posts cash receipts and disbursements; and records purchases and sales based upon communications from the Adviser.
52
Victory Portfolios | Notes to Financial Statements — continued June 30, 2020 | ||||||
(Unaudited)
Citibank may, with the approval of a Fund and at its own expense, open and maintain a sub-custody account or accounts on behalf of a Fund, provided that it shall remain liable for the performance of all of its duties under the Custody Agreement.
FIS Investor Services, LLC ("FIS") serves as the Funds' transfer agent. Under the Transfer Agent Agreement, the Trust pays FIS a fee for its services and reimburses FIS for all of their reasonable out-of-pocket expenses incurred in providing these services.
The Chief Compliance Officer ("CCO") is an employee of the Adviser, which pays the compensation of the CCO and his support staff. The Trust has entered into an agreement to provide compliance services with the Adviser, pursuant to which the Adviser furnishes its compliance personnel, including the services of the CCO, and other resources reasonably necessary to provide the Trust with compliance oversight services related to the design, administration and oversight of a compliance program for the Trust in accordance with Rule 38a-1 under the 1940 Act. The Funds in the Victory Funds Complex, in aggregate, compensate the Adviser for these services.
The Victory Funds Complex pays an annual retainer to each Independent Trustee, plus an additional annual retainer to the Chairman of the Board. The aggregate amount of the fees and expenses of the Independent Trustees are allocated amongst all the funds in the Victory Funds Complex and are presented on the Statements of Operations.
Sidley Austin LLP provides legal services to the Trust.
Victory Capital Services, Inc. (the "Distributor"), an affiliate of the Adviser, serves as distributor for the continuous offering of the shares of the Funds pursuant to a Distribution Agreement between the Distributor and the Trust. Effective June 30, 2020, the Distributor's name was changed from Victory Capital Advisers, Inc.
Pursuant to the Distribution and Service Plans adopted in accordance with Rule 12b-1 under the 1940 Act, the Distributor may receive a monthly distribution and service fee, at an annual rate of up to 0.25% of the average daily net assets of Class A Shares, at an annual rate of up to 0.50% of the average daily net assets of Class R Shares and 1.00% of the average daily net assets of Class C Shares of the Funds. The distribution and service fees paid to the Distributor may be used by the Distributor to pay for activities primarily intended to result in the sale of Class A, Class R or Class C Shares of the Funds.
In addition, the Distributor is entitled to receive commissions on sales of the Class A Shares of the Funds. For the six months ended June 30, 2020, the Distributor received approximately $23,573 from commissions earned on sales of Class A Shares of the Funds.
The Adviser has entered into expense limitation agreements with certain Funds. Under the terms of the agreements, the Adviser has agreed to waive fees or reimburse certain expenses to the extent that ordinary operating expenses incurred by certain classes of a Fund in any fiscal year exceed the expense limit for such classes of the Fund. Such excess amounts will be the liability of the Adviser. Interest, taxes, brokerage commissions, other expenditures which are capitalized in accordance with GAAP, and other extraordinary expenses not incurred in the ordinary course of a Fund's business are excluded from the expense limits. As of June 30, 2020, the expense limits (excluding voluntary waivers) are as follows:
| Member Class In effect May 1, 2020 until April 30, 2021 | |||||||||||||||||||||||
| Class A Shares | Class C Shares | Class R Shares | Class R6 Shares | Class Y Shares | |||||||||||||||||||
RS Small Cap Growth Fund | 1.40 | % | 2.16 | % | 1.86 | % | 1.06 | % | 1.13 | % | |||||||||||||
RS Select Growth Fund | 1.40 | % | 2.18 | % | 1.91 | % | 1.06 | % | 1.14 | % | |||||||||||||
RS Mid Cap Growth Fund | 1.20 | % | 2.11 | % | 1.80 | % | 0.94 | % | 0.95 | % | |||||||||||||
RS Growth Fund | 1.10 | % | 1.93 | % | 1.71 | % | N/A | 0.83 | % | ||||||||||||||
RS Science and Technology Fund | 1.49 | % | 2.28 | % | 1.93 | % | N/A | 1.24 | % | ||||||||||||||
RS Small Cap Equity Fund | 1.35 | % | 2.10 | % | 1.75 | % | N/A | 1.10 | % | ||||||||||||||
53
Victory Portfolios | Notes to Financial Statements — continued June 30, 2020 | ||||||
(Unaudited)
The Funds have agreed to repay fees and expenses that were waived or reimbursed by the Adviser for a period up to three fiscal years after such waiver or reimbursement was made to the extent such payments or repayments would not cause the expenses of a class to exceed the original expense limitation in place at the time of the waiver or reimbursement or any expense limitation agreement in place at the time of repayment. Amounts repaid to the Adviser during the six months ended June 30, 2020, if any, are reflected on the Statements of Operations as Recoupment of prior expenses waived/reimbursed by Adviser.
As of June 30, 2020, the following amounts are available to be repaid to the Adviser.
| Expires December 30, 2020 | Expires December 30, 2021 | Expires December 30, 2022 | Expires December 31, 2023 | Total | |||||||||||||||||||
RS Small Cap Growth Fund | $ | 745,744 | $ | 578,670 | $ | 506,151 | $ | 367,785 | $ | 2,198,350 | |||||||||||||
RS Select Growth Fund | 384,612 | 334,454 | 285,457 | 130,851 | 1,135,374 | ||||||||||||||||||
RS Mid Cap Growth Fund | 419,215 | 394,372 | 681,628 | 357,038 | 1,852,253 | ||||||||||||||||||
RS Growth Fund | 278,667 | 283,325 | 288,176 | 146,326 | 996,494 | ||||||||||||||||||
| RS Science and Technology Fund | 18,803 | 25,649 | 41,114 | 24,021 | 109,587 | ||||||||||||||||||
RS Small Cap Equity Fund | 22,386 | 28,246 | 30,362 | 18,859 | 99,853 | ||||||||||||||||||
The Adviser may voluntarily waive or reimburse additional fees to assist the Funds in maintaining competitive expense ratios. Voluntary waivers and reimbursements applicable to the Funds are not available to be recouped at a future time. There were no voluntary waivers or reimbursements for the six months ended June 30, 2020.
Certain officers and/or interested trustees of the Funds are also officers and/or employees of the Adviser, Administrator, Fund Accountant, Sub-Administrator, Sub-Fund Accountant, and Legal Counsel.
5. Risks:
Each Fund may be subject to other risks in addition to these identified risks.
An investment in the Funds' shares represents an indirect investment in the securities owned by the Funds, some of which will be traded on a national securities exchange or in the over-the-counter markets. The value of the securities in which the Funds invest, like other market investments, may move up or down, sometimes rapidly and unpredictably. The value of the securities in which the Funds invest may affect the value of the Funds' shares. An investment in the Funds' shares at any point in time may be worth less than the original investment, even after taking into account the reinvestment of the Funds' distributions.
The Funds will be subject to credit risk with respect to the amount each expects to receive from counterparties for financial instruments entered into by the Funds. The Funds may be negatively impacted if a counterparty becomes bankrupt or otherwise fails to perform its obligations due to financial difficulties. The Funds may experience significant delays in obtaining any recovery in bankruptcy or other reorganization proceeding and the Funds may obtain only limited recovery or may obtain no recovery in such circumstances. The Funds typically enter into transactions with counterparties whose credit ratings are investment grade, as determined by a nationally recognized statistical rating organization or, if unrated, judged by the Adviser to be of comparable quality.
An outbreak of respiratory disease called COVID-19 was first detected in China in December 2019 and subsequently spread internationally. The transmission of COVID-19 and efforts to contain its spread have resulted in international, national and local border closings and other significant travel restrictions and disruptions, significant disruptions to business operations, supply chains and consumer activity, significant challenges in healthcare service preparation and delivery, quarantines and general concern and uncertainty. These negative impacts have caused significant volatility and declines in global financial markets, which have caused losses for Fund investors during and subsequent to period end. The impact of the COVID-19 pandemic may be short term or may last for an extended period of time, and in either
54
Victory Portfolios | Notes to Financial Statements — continued June 30, 2020 | ||||||
(Unaudited)
case could result in a substantial economic downturn or recession. Public health crises may exacerbate other pre-existing political, social, economic, market and financial risks. The extent of the impact to the financial performance of the Funds' investments will depend on future developments, including (i) the duration and spread of the outbreak, (ii) the restrictions and advisories, (iii) the effects on the financial markets, and (iv) the effects on the economy overall, all of which are highly uncertain and cannot be predicted.
6. Borrowing and Interfund Lending:
Line of Credit:
For the six months ended June 30, 2020, the Victory Funds Complex participated in a short-term demand note "Line of Credit" agreement with Citibank. The Line of Credit agreement with Citibank was renewed on June 29, 2020 with a termination date of June 28, 2021. Under the agreement with Citibank, the Victory Funds Complex and USAA Mutual Funds Complex, combined, may borrow up to $600 million, of which $300 million is committed and $300 million is uncommitted. $40 million of the Line of Credit is reserved for use by the Victory Floating Rate Fund (herein, the "Fund"), another series of the Victory Funds Complex, with that Fund paying the related commitment fees for that amount. The purpose of the agreement is to meet temporary or emergency cash needs. For the six months ended June 30, 2020, Citibank received an annual commitment fee of 0.15% on $300 million for providing the Line of Credit. For the six months ended June 30, 2020, Citibank earned approximately $225 thousand in commitment fees from the combined Victory Funds Complex and USAA Mutual Funds Complex. Each fund in the Victory Funds Complex pays a pro-rata portion of the commitment fees plus any interest (one month LIBOR plus one percent) on amounts borrowed. Effective June 29, 2020, under an amended Line of Credit agreement, Citibank will also receive an annual upfront fee of 0.10% on the $300 million committed line of credit. Each fund in the Victory Funds Complex will pay a pro-rata portion of the upfront fee. Interest charged to each Fund during the period, if applicable, is presented on the Statements of Operations under Line of credit fees.
The Funds did not utilize the Line of Credit during the six months ended June 30, 2020.
Interfund Lending:
The Trust and Adviser rely on an exemptive order granted by the SEC in March 2017 (the "Order"), permitting the establishment and operation of an Interfund Lending Facility (the "Facility"). The Facility allows each Fund to directly lend money to and borrow money from any other Victory Fund relying upon the Order at rates beneficial to both the borrowing and lending funds. Advances under the Facility are allowed for temporary or emergency purposes, including the meeting of redemption requests that otherwise might require the untimely disposition of securities, and are subject to each Fund's borrowing restrictions. The interfund loan rate is determined, as specified in the Order, by averaging the current repurchase agreement rate and the current bank loan rate. As a Borrower, interest charged to each Fund during the period, if applicable, is presented on the Statements of Operations under Interfund lending fees. As a Lender, interest earned by each Fund during the period, if applicable, is presented on the Statements of Operations under Interfund lending income.
The average borrowing and lending for the days outstanding and average interest rate for each Fund during the six months ended June 30, 2020, were as follows:
| Borrower or Lender | Amount Outstanding at June 30, 2020 | Average Borrowing* | Days Borrowing Outstanding | Average Interest Rate* | Maximum Borrowing During the Period | ||||||||||||||||||||||
| RS Mid Cap Growth Fund | Borrower | $ | — | $ | 1,225,000 | 1 | 1.75 | % | $ | 1,225,000 | |||||||||||||||||
* For the six months ended June 30, 2020, based on the number of days borrowings were outstanding.
55
Victory Portfolios | Notes to Financial Statements — continued June 30, 2020 | ||||||
(Unaudited)
7. Federal Income Tax Information:
The tax character of distributions paid and the tax basis of current components of accumulated earnings (deficit) will be determined at the end of the current tax year ending December 31, 2020.
At December 31, 2019, the following Fund had net capital loss carryforwards as summarized in the table below:
| Short-Term Amount | Long-Term Amount | Total | |||||||||||||
RS Mid Cap Growth Fund | $ | 2,653,428 | $ | — | $ | 2,653,428 | |||||||||
8. Capital Contribution from Prior Custodian:
During 2016, certain Funds received notification from their prior custodian, State Street Bank and Trust ("State Street"), concerning issues related to billing on certain categories of expenses during the approximately 16-year period from 1998 through October 31, 2014. The over-billing primarily related to categories of expenses that involved an allocation of general costs among multiple clients.
State Street paid the refunded amounts during January 2017. Based on billing information received during 2016 from State Street and an analysis of any expense limitation agreements that were in place during the period of the activities in question, including the application of any recoupment provisions in such agreements, the Adviser received a portion of the refund.
The portion of the refund retained by the Funds was accounted for as a capital contribution and is reflected on the Financial Highlights as Capital Contribution from Prior Custodian, Net.
9. Fund Ownership:
Ownership of more than 25% of the voting securities of a fund creates presumptions of control of the fund, under section 2(a)(9) of the 1940 Act. As of June 30, 2020, the shareholder listed below held more than 25% of the shares outstanding of the Funds and may be deemed to control those Funds. Shareholders of record may hold Fund shares for the benefit of their customers.
Shareholder | Percent | ||||||||||
RS Mid Cap Growth Fund | Pershing LLC | 58.1 | % | ||||||||
56
Victory Portfolios | Supplemental Information June 30, 2020 | ||||||
(Unaudited)
Proxy Voting and Portfolio Holdings Information
Proxy Voting:
Information regarding the policies and procedures each Fund uses to determine how to vote proxies relating to portfolio securities is available without charge, upon request, by calling 800-539-3863. The information is also included in the Funds' Statement of Additional Information, which is available on the SEC's website at www.sec.gov.
Information relating to how the Funds voted proxies relating to portfolio securities held during the most recent twelve months ended June 30 is available on the SEC's website at www.sec.gov.
Availability of Schedules of Portfolio Investments:
The Trust files a complete list of Schedules of Portfolio Investments with the SEC for the first and third quarter of each fiscal year on Form N-PORT. Forms N-PORT are available on the SEC's web site at www.sec.gov.
Expense Examples
As a shareholder of the Funds, you may incur two types of costs: (1) transaction costs, including sales charges (loads) on purchases; and (2) ongoing costs, including management fees, distribution and service (12b-1) fees and other Fund expenses. These examples are intended to help you understand your ongoing costs (in dollars) of investing in the Funds and to compare these costs with the ongoing costs of investing in other mutual funds.
These examples are based on an investment of $1,000 invested at the beginning of the period and held for the entire period from January 1, 2020 through June 30, 2020.
The Actual Expense figures in the table below provide information about actual account values and actual expenses. You may use the information below, together with the amount you invested, to estimate the expenses that you paid over the period. Simply divide your account value by $1,000 (for example, an $8,600 account value divided by $1,000 = 8.6), then multiply the result by the number in the table under the heading entitled "Actual Expenses Paid During Period" to estimate the expenses you paid on your account during this period.
The Hypothetical Expense figures in the table below provide information about hypothetical account values and hypothetical expenses based on each Fund's actual expense ratio and an assumed rate of return of 5% per year before expenses, which is not the Fund's actual return. The hypothetical account values and expenses may not be used to estimate the actual ending account balance or expenses you paid for the period. You may use this information to compare this 5% hypothetical example with the 5% hypothetical examples that appear in shareholder reports of other funds.
Please note the expenses shown in the table are meant to highlight your ongoing costs only and do not reflect any transactional costs. Therefore, the table is useful in comparing ongoing costs only, and will not help you determine the relative total costs of owning different funds. In addition, if these transactional costs were included, your costs would have been higher.
| Beginning Account Value 1/1/20 | Actual Ending Account Value 6/30/20 | Hypothetical Ending Account Value 6/30/20 | Actual Expenses Paid During Period 1/1/20- 6/30/20* | Hypothetical Expenses Paid During Period 1/1/20- 6/30/20* | Annualized Expense Ratio During Period 1/1/20- 6/30/20 | ||||||||||||||||||||||
RS Small Cap Growth Fund | |||||||||||||||||||||||||||
Class A Shares | $ | 1,000.00 | $ | 1,028.80 | $ | 1,017.90 | $ | 7.06 | $ | 7.02 | 1.40 | % | |||||||||||||||
Class C Shares | 1,000.00 | 1,024.70 | 1,014.12 | 10.87 | 10.82 | 2.16 | % | ||||||||||||||||||||
Class R Shares | 1,000.00 | 1,026.40 | 1,015.61 | 9.37 | 9.32 | 1.86 | % | ||||||||||||||||||||
Class R6 Shares | 1,000.00 | 1,030.50 | 1,019.64 | 5.30 | 5.27 | 1.05 | % | ||||||||||||||||||||
Class Y Shares | 1,000.00 | 1,030.10 | 1,019.24 | 5.70 | 5.67 | 1.13 | % | ||||||||||||||||||||
57
Victory Portfolios | Supplemental Information — continued June 30, 2020 | ||||||
(Unaudited)
| Beginning Account Value 1/1/20 | Actual Ending Account Value 6/30/20 | Hypothetical Ending Account Value 6/30/20 | Actual Expenses Paid During Period 1/1/20- 6/30/20* | Hypothetical Expenses Paid During Period 1/1/20- 6/30/20* | Annualized Expense Ratio During Period 1/1/20- 6/30/20 | ||||||||||||||||||||||
RS Select Growth Fund | |||||||||||||||||||||||||||
Class A Shares | $ | 1,000.00 | $ | 1,060.00 | $ | 1,017.90 | $ | 7.17 | $ | 7.02 | 1.40 | % | |||||||||||||||
Class C Shares | 1,000.00 | 1,056.00 | 1,014.02 | 11.14 | 10.92 | 2.18 | % | ||||||||||||||||||||
Class R Shares | 1,000.00 | 1,057.10 | 1,015.37 | 9.77 | 9.57 | 1.91 | % | ||||||||||||||||||||
Class R6 Shares | 1,000.00 | 1,061.70 | 1,019.59 | 5.43 | 5.32 | 1.06 | % | ||||||||||||||||||||
Class Y Shares | 1,000.00 | 1,061.40 | 1,019.19 | 5.84 | 5.72 | 1.14 | % | ||||||||||||||||||||
RS Mid Cap Growth Fund | |||||||||||||||||||||||||||
Class A Shares | 1,000.00 | 1,048.90 | 1,018.90 | 6.11 | 6.02 | 1.20 | % | ||||||||||||||||||||
Class C Shares | 1,000.00 | 1,044.40 | 1,014.37 | 10.73 | 10.57 | 2.11 | % | ||||||||||||||||||||
Class R Shares | 1,000.00 | 1,045.90 | 1,015.91 | 9.16 | 9.02 | 1.80 | % | ||||||||||||||||||||
Class R6 Shares | 1,000.00 | 1,050.30 | 1,020.19 | 4.79 | 4.72 | 0.94 | % | ||||||||||||||||||||
Class Y Shares | 1,000.00 | 1,050.40 | 1,020.14 | 4.84 | 4.77 | 0.95 | % | ||||||||||||||||||||
RS Growth Fund | |||||||||||||||||||||||||||
Class A Shares | 1,000.00 | 1,077.50 | 1,019.39 | 5.68 | 5.52 | 1.10 | % | ||||||||||||||||||||
Class C Shares | 1,000.00 | 1,072.90 | 1,015.27 | 9.95 | 9.67 | 1.93 | % | ||||||||||||||||||||
Class R Shares | 1,000.00 | 1,074.00 | 1,016.36 | 8.82 | 8.57 | 1.71 | % | ||||||||||||||||||||
Class Y Shares | 1,000.00 | 1,079.10 | 1,020.74 | 4.29 | 4.17 | 0.83 | % | ||||||||||||||||||||
RS Science and Technology Fund | |||||||||||||||||||||||||||
Class A Shares | 1,000.00 | 1,184.40 | 1,017.45 | 8.09 | 7.47 | 1.49 | % | ||||||||||||||||||||
Class C Shares | 1,000.00 | 1,179.40 | 1,013.53 | 12.35 | 11.41 | 2.28 | % | ||||||||||||||||||||
Class R Shares | 1,000.00 | 1,181.60 | 1,015.27 | 10.47 | 9.67 | 1.93 | % | ||||||||||||||||||||
Class Y Shares | 1,000.00 | 1,185.70 | 1,018.70 | 6.74 | 6.22 | 1.24 | % | ||||||||||||||||||||
RS Small Cap Equity Fund | |||||||||||||||||||||||||||
Class A Shares | 1,000.00 | 1,026.80 | 1,018.45 | 6.50 | 6.47 | 1.29 | % | ||||||||||||||||||||
Class C Shares | 1,000.00 | 1,024.20 | 1,014.42 | 10.57 | 10.52 | 2.10 | % | ||||||||||||||||||||
Class R Shares | 1,000.00 | 1,024.40 | 1,016.16 | 8.81 | 8.77 | 1.75 | % | ||||||||||||||||||||
Class Y Shares | 1,000.00 | 1,027.80 | 1,019.39 | 5.55 | 5.52 | 1.10 | % | ||||||||||||||||||||
* Expenses are equal to the average account value multiplied by the Fund's annualized expense ratio multiplied by 182/366 (the number of days in the most recent fiscal half-year divided by the number of days in the fiscal year).
58
Victory Portfolios | Supplemental Information — continued June 30, 2020 | ||||||
(Unaudited)
Liquidity Risk Management Program:
The Victory Funds have adopted and implemented a written liquidity risk management program (the "LRMP") as required by Rule 22e-4 under the Act. The LRMP is reasonably designed to assess and manage each Fund's liquidity risk, taking into consideration each Fund's investment strategy and the liquidity of its portfolio investments during normal and reasonably foreseeable stressed market conditions; its short and long-term cash flow projections; and its cash holdings and access to other liquidity management tools such as available funding sources including the Victory Funds Complex Interfund Lending Facility and Line of Credit (discussed in the Notes to Financial Statements). The Board approved the appointment of VCM as the administrator of the LRMP. At an in-person meeting held on February 20, 2020, VCM provided an oral and written report to the Trustees on the operation and effectiveness of the LRMP during the previous year.
VCM manages liquidity risks associated with the Funds' investments by monitoring, among other things, cash and cash equivalents, any use of derivatives, the concentration of investments, the appropriateness of each Fund's investment strategy, and by classifying every fund investment as either highly liquid, moderately liquid, less liquid or illiquid on at least a monthly basis. To assist with the classification of Fund investments, VCM has retained a third-party provider of liquidity evaluation services. This provider determines preliminary liquidity classifications for all portfolio holdings based upon portfolio-level data and certain assumptions provided by VCM. VCM reviews the preliminary liquidity classifications and, when appropriate, considers other information including input from the Funds' portfolio managers (including the portfolio managers employed by any investment sub-advisers) in determining final liquidity classifications.
The report from VCM concluded that the Funds did not experience any significant liquidity challenges during the covered period, and the Funds' LRMP is reasonably designed to assess and manage its liquidity risk. The report also concluded that the LRMP continues to operate adequately and effectively to enable VCM to oversee and manage liquidity risk and ensure each Fund is able to meet redemption requests without significant dilution to the remaining investors' interest in each Fund. During the review period, each Fund's portfolio consisted primarily of highly liquid investments, which are defined as cash and any investments reasonably expected to be converted to cash in current market conditions in three business days or less without significantly changing the market value of the investment. Therefore, the Funds have not adopted a Highly Liquid Investment Minimum. The Funds' investments were below the limitation on illiquid investments during the review period. Additionally, VCM indicated that no events occurred that would require the filing of Form N-LIQUID and recommended no material changes to the LRMP.
59
Privacy Policy
Protecting the Privacy of Information
The Trust respects your right to privacy. We also know that you expect us to conduct and process your business in an accurate and efficient manner. To do so, we must collect and maintain certain personal information about you. This is the information we collect from you on applications or other forms, and from the transactions you make with us or third parties. It may include your name, address, social security number, account transactions and balances, and information about investment goals and risk tolerance.
We do not disclose any information about you or about former customers to anyone except as permitted or required by law. Specifically, we may disclose the information we collect to companies that perform services on our behalf, such as the transfer agent that processes shareholder accounts and printers and mailers that assist us in the distribution of investor materials. We may also disclose this information to companies that perform marketing services on our behalf. This allows us to continue to offer you Victory investment products and services that meet your investing needs, and to effect transactions that you request or authorize. These companies will use this information only in connection with the services for which we hired them. They are not permitted to use or share this information for any other purpose.
To protect your personal information internally, we permit access only by authorized employees and maintain physical, electronic and procedural safeguards to guard your personal information.*
* You may have received communications regarding information about privacy policies from other financial institutions which gave you the opportunity to "opt-out" of certain information sharing with companies which are not affiliated with that financial institution. The Trust does not share information with other companies for purposes of marketing solicitations for products other than the Trust. Therefore, the Trust does not provide opt-out options to their shareholders.
Victory Funds
P.O. Box 182593
Columbus, Ohio 43218-2593

Visit our website at: | Call Victory at: | ||||||
www.vcm.com | 800-539-FUND (800-539-3863) | ||||||
VPRSGF-SAR (6/20)

June 30, 2020
Semi Annual Report
Victory RS International Fund
Victory RS Global Fund
Victory Sophus Emerging Markets Fund
Victory Sophus Emerging Markets Small Cap Fund
Beginning January 1, 2021, as permitted by regulations adopted by the Securities and Exchange Commission, paper copies of the Victory Funds' shareholder reports will no longer be sent by mail, unless you specifically request paper copies of the reports from the Victory Funds or from your financial intermediary, such as a broker-dealer or bank. Instead, the reports will be made available on www.VictoryFunds.com, and you will be notified by mail each time a report is posted and provided with a website link to access the report. If you already elected to receive shareholder reports electronically, you will not be affected by this change, and you need not take any action.
You may elect to receive shareholder reports and other communications from the Victory Funds or your financial intermediary electronically sooner than January 1, 2021 by notifying your financial intermediary directly or, if you are a direct investor, by calling 800-539-3863 or by sending an e-mail request to TA.Processing@FISGlobal.com.
You may elect to receive all future reports in paper free of charge. If you invest through a financial intermediary, you can contact your financial intermediary to request that you continue to receive paper copies of your reports. If you invest directly with the Victory Funds, you can call 800-539-3863 or send an e-mail request to TA.Processing@FISGlobal.com. Your election to receive reports in paper will apply to all Victory Funds you hold directly or through your financial intermediary.
www.vcm.com
News, Information And Education 24 Hours A Day, 7 Days A Week
The Victory Funds site gives fund shareholders, prospective shareholders, and investment professionals a convenient way to access fund information, get guidance, and track fund performance anywhere they can access the Internet. The site includes:
• Detailed performance records
• Daily share prices
• The latest fund news
• Investment resources to help you become a better investor
• A section dedicated to investment professionals
Whether you're a potential investor searching for the fund that matches your investment philosophy, a seasoned investor interested in planning tools, or an investment professional, www.vcm.com has what you seek. Visit us anytime. We're always open.
Table of Contents
Financial Statements | |||||||
The Victory International Funds | |||||||
Victory RS International Fund | |||||||
Investment Objectives & Portfolio Holdings | 3 | ||||||
Schedule of Portfolio Investments | 4 | ||||||
Statements of Assets and Liabilities | 31-32 | ||||||
Statements of Operations | 35 | ||||||
Statements of Changes in Net Assets | 37-39 | ||||||
Financial Highlights | 44-47 | ||||||
Victory RS Global Fund | |||||||
Investment Objectives & Portfolio Holdings | 3 | ||||||
Schedule of Portfolio Investments | 10 | ||||||
Statements of Assets and Liabilities | 31-32 | ||||||
Statements of Operations | 35 | ||||||
Statements of Changes in Net Assets | 37-39 | ||||||
Financial Highlights | 48-51 | ||||||
Victory Sophus Emerging Markets Fund | |||||||
Investment Objectives & Portfolio Holdings | 3 | ||||||
Schedule of Portfolio Investments | 16 | ||||||
Statements of Assets and Liabilities | 33-34 | ||||||
Statements of Operations | 36 | ||||||
Statements of Changes in Net Assets | 40-42 | ||||||
Financial Highlights | 52-55 | ||||||
Victory Sophus Emerging Markets Small Cap Fund | |||||||
Investment Objectives & Portfolio Holdings | 3 | ||||||
Schedule of Portfolio Investments | 24 | ||||||
Statements of Assets and Liabilities | 33-34 | ||||||
Statements of Operations | 36 | ||||||
Statements of Changes in Net Assets | 40-42 | ||||||
Financial Highlights | 56-57 | ||||||
Notes to Financial Statements | 58 | ||||||
Supplemental Information | 68 | ||||||
Proxy Voting and Portfolio Holdings Information | 68 | ||||||
Expense Examples | 68 | ||||||
Liquidity Risk Management Program | 70 | ||||||
Privacy Policy (inside back cover) | |||||||
Victory Portfolios
1
The Funds are distributed by Victory Capital Services, Inc. Victory Capital Management Inc. is the investment adviser to the Funds and receives fees from the Funds for performing services for the Funds.
This report is not authorized for distribution to prospective investors unless preceded or accompanied by a current prospectus of the Victory Funds.
For additional information about any Victory Fund, including fees, expenses, and risks, view our prospectus online at www.vcm.com or call 800-539-3863. Read it carefully before you invest or send money.
The information in this semi annual report is based on data obtained from recognized services and sources and is believed to be reliable. Any opinions, projections, or recommendations in this report are subject to change without notice and are not intended as individual investment advice. Past investment performance of the Funds, markets or securities mentioned herein should not be considered to be indicative of future results.
• NOT FDIC INSURED • NO BANK GUARANTEE • MAY LOSE VALUE

Call Victory at:
800-539-FUND (800-539-3863)
Visit our website at:
www.vcm.com
2
Victory Portfolios | June 30, 2020 | ||||||
(Unaudited)
Investment Objectives & Portfolio Holdings:
Victory RS International Fund
Seeks to provide long-term capital appreciation.
Portfolio Holdings
As a Percentage of Total Investments

Victory RS Global Fund
Seeks to provide long-term capital appreciation.
Portfolio Holdings
As a Percentage of Total Investments
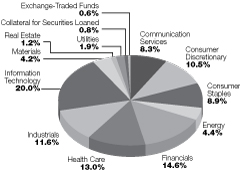
Victory Sophus Emerging Markets Fund
Seeks to provide long-term capital appreciation.
Portfolio Holdings
As a Percentage of Total Investments
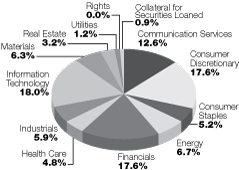
Victory Sophus Emerging Markets Small Cap
Fund
Seeks to provide long-term capital appreciation.
Portfolio Holdings
As a Percentage of Total Investments

3
| Victory Portfolios Victory RS International Fund | Schedule of Portfolio Investments June 30, 2020 | ||||||
(Unaudited)
Security Description | Shares | Value | |||||||||
Common Stocks (96.7%) | |||||||||||
Australia (5.8%): | |||||||||||
Financials (1.4%): | |||||||||||
Macquarie Group Ltd. | 49,490 | $ | 4,106,078 | ||||||||
Health Care (1.3%): | |||||||||||
CSL Ltd. | 20,007 | 3,978,006 | |||||||||
Materials (2.1%): | |||||||||||
BHP Group Ltd. | 262,453 | 6,532,613 | |||||||||
Real Estate (1.0%): | |||||||||||
Scentre Group | 2,077,236 | 3,152,617 | |||||||||
17,769,314 | |||||||||||
Belgium (1.0%): | |||||||||||
Information Technology (1.0%): | |||||||||||
Melexis NV | 39,661 | 3,016,694 | |||||||||
China (2.4%): | |||||||||||
Communication Services (1.5%): | |||||||||||
Tencent Holdings Ltd. | 71,500 | 4,581,689 | |||||||||
Financials (0.9%): | |||||||||||
China Merchants Bank Co. Ltd., Class H | 586,000 | 2,715,678 | |||||||||
7,297,367 | |||||||||||
Denmark (1.3%): | |||||||||||
Consumer Staples (1.3%): | |||||||||||
Royal Unibrew A/S (a) | 47,024 | 3,920,425 | |||||||||
France (9.9%): | |||||||||||
Consumer Discretionary (4.7%): | |||||||||||
Cie Generale des Etablissements Michelin SCA (a) (b) | 26,260 | 2,736,933 | |||||||||
Faurecia SE (a) | 82,790 | 3,252,432 | |||||||||
LVMH Moet Hennessy Louis Vuitton SE | 18,538 | 8,183,756 | |||||||||
14,173,121 | |||||||||||
Energy (1.8%): | |||||||||||
Gaztransport Et Technigaz SA | 23,471 | 1,800,969 | |||||||||
TOTAL SA (b) | 95,758 | 3,691,970 | |||||||||
5,492,939 | |||||||||||
Financials (0.2%): | |||||||||||
AXA SA (a) | 30,582 | 643,481 | |||||||||
Information Technology (1.5%): | |||||||||||
Capgemini SE | 39,960 | 4,611,059 | |||||||||
Materials (1.7%): | |||||||||||
Arkema SA | 55,182 | 5,303,870 | |||||||||
30,224,470 | |||||||||||
See notes to financial statements.
4
| Victory Portfolios Victory RS International Fund | Schedule of Portfolio Investments — continued June 30, 2020 | ||||||
(Unaudited)
Security Description | Shares | Value | |||||||||
Germany (7.3%): | |||||||||||
Financials (1.6%): | |||||||||||
Allianz SE | 23,666 | $ | 4,835,565 | ||||||||
Industrials (2.0%): | |||||||||||
Siemens AG, Registered Shares | 34,234 | 4,037,126 | |||||||||
Washtec AG (a) | 50,742 | 2,090,934 | |||||||||
6,128,060 | |||||||||||
Information Technology (2.6%): | |||||||||||
SAP SE | 57,277 | 8,006,056 | |||||||||
Real Estate (1.1%): | |||||||||||
Vonovia SE (a) | 52,882 | 3,232,040 | |||||||||
22,201,721 | |||||||||||
Hong Kong (2.1%): | |||||||||||
Financials (1.0%): | |||||||||||
AIA Group Ltd. | 333,400 | 3,119,906 | |||||||||
Real Estate (1.1%): | |||||||||||
CK Asset Holdings Ltd. | 573,000 | 3,436,252 | |||||||||
6,556,158 | |||||||||||
Ireland (1.1%): | |||||||||||
Industrials (1.1%): | |||||||||||
Experian PLC | 94,516 | 3,316,858 | |||||||||
Italy (4.7%): | |||||||||||
Financials (1.1%): | |||||||||||
Banca Generali SpA (a) | 107,690 | 3,237,825 | |||||||||
Health Care (1.2%): | |||||||||||
Recordati SpA | 75,173 | 3,761,243 | |||||||||
Utilities (2.4%): | |||||||||||
Enel SpA | 861,540 | 7,450,361 | |||||||||
14,449,429 | |||||||||||
Japan (22.8%): | |||||||||||
Communication Services (2.2%): | |||||||||||
Kakaku.com, Inc. | 97,600 | 2,486,631 | |||||||||
Nippon Telegraph & Telephone Corp. | 176,800 | 4,119,916 | |||||||||
6,606,547 | |||||||||||
Consumer Discretionary (3.9%): | |||||||||||
Hikari Tsushin, Inc. | 13,700 | 3,132,916 | |||||||||
Toyota Motor Corp. | 141,500 | 8,899,335 | |||||||||
12,032,251 | |||||||||||
Consumer Staples (1.8%): | |||||||||||
Kobe Bussan Co. Ltd. | 51,400 | 2,919,183 | |||||||||
Toyo Suisan Kaisha Ltd. | 44,400 | 2,481,145 | |||||||||
5,400,328 | |||||||||||
See notes to financial statements.
5
| Victory Portfolios Victory RS International Fund | Schedule of Portfolio Investments — continued June 30, 2020 | ||||||
(Unaudited)
Security Description | Shares | Value | |||||||||
Financials (2.3%): | |||||||||||
Jafco Co. Ltd. | 46,800 | $ | 1,582,857 | ||||||||
Mitsubishi UFJ Financial Group, Inc. | 709,100 | 2,791,069 | |||||||||
Tokio Marine Holdings, Inc. | 57,000 | 2,495,409 | |||||||||
6,869,335 | |||||||||||
Health Care (3.1%): | |||||||||||
Hoya Corp. | 56,200 | 5,382,403 | |||||||||
Shionogi & Co. Ltd. | 63,200 | 3,965,301 | |||||||||
9,347,704 | |||||||||||
Industrials (4.6%): | |||||||||||
en-japan, Inc. | 56,500 | 1,406,572 | |||||||||
Fuji Electric Co. Ltd. | 80,400 | 2,213,232 | |||||||||
Hitachi Construction Machinery Co. Ltd. | 108,800 | 3,022,767 | |||||||||
ITOCHU Corp. | 96,500 | 2,088,340 | |||||||||
Kyowa Exeo Corp. | 62,400 | 1,498,367 | |||||||||
OKUMA Corp. | 37,200 | 1,600,039 | |||||||||
Sanwa Holdings Corp. | 262,900 | 2,362,903 | |||||||||
14,192,220 | |||||||||||
Information Technology (3.1%): | |||||||||||
Fujitsu Ltd. | 39,600 | 4,637,145 | |||||||||
Oracle Corp. | 25,800 | 3,060,632 | |||||||||
Ulvac, Inc. | 61,000 | 1,771,184 | |||||||||
9,468,961 | |||||||||||
Real Estate (0.6%): | |||||||||||
Sumitomo Realty & Development Co. Ltd. | 65,800 | 1,816,509 | |||||||||
Utilities (1.2%): | |||||||||||
Chubu Electric Power Co., Inc. | 300,600 | 3,770,631 | |||||||||
69,504,486 | |||||||||||
Macau (0.7%): | |||||||||||
Consumer Discretionary (0.7%): | |||||||||||
Wynn Macau Ltd. | 1,180,800 | 2,048,073 | |||||||||
Netherlands (4.2%): | |||||||||||
Communication Services (1.0%): | |||||||||||
Koninklijke KPN NV | 1,107,228 | 2,944,888 | |||||||||
Financials (1.2%): | |||||||||||
ING Groep NV | 542,710 | 3,782,866 | |||||||||
Industrials (2.0%): | |||||||||||
Wolters Kluwer NV | 76,467 | 5,976,482 | |||||||||
12,704,236 | |||||||||||
New Zealand (0.9%): | |||||||||||
Health Care (0.9%): | |||||||||||
Fisher & Paykel Healthcare Corp. Ltd. | 126,934 | 2,923,244 | |||||||||
See notes to financial statements.
6
| Victory Portfolios Victory RS International Fund | Schedule of Portfolio Investments — continued June 30, 2020 | ||||||
(Unaudited)
Security Description | Shares | Value | |||||||||
Norway (1.4%): | |||||||||||
Energy (0.5%): | |||||||||||
Aker BP ASA | 84,569 | $ | 1,565,692 | ||||||||
Financials (0.9%): | |||||||||||
SpareBank 1 SMN | 324,583 | 2,655,554 | |||||||||
4,221,246 | |||||||||||
Russian Federation (0.6%): | |||||||||||
Materials (0.6%): | |||||||||||
Evraz PLC | 486,927 | 1,724,939 | |||||||||
Spain (1.5%): | |||||||||||
Communication Services (1.2%): | |||||||||||
Telefonica SA | 768,987 | 3,677,586 | |||||||||
Financials (0.3%): | |||||||||||
Banco Santander SA (b) | 398,468 | 974,756 | |||||||||
4,652,342 | |||||||||||
Sweden (2.5%): | |||||||||||
Industrials (2.5%): | |||||||||||
Atlas Copco AB, Class B | 160,174 | 5,953,733 | |||||||||
Epiroc AB, Class B | 135,119 | 1,659,967 | |||||||||
7,613,700 | |||||||||||
Switzerland (12.5%): | |||||||||||
Consumer Staples (4.2%): | |||||||||||
Nestle SA Registered Shares | 115,506 | 12,809,602 | |||||||||
Financials (1.9%): | |||||||||||
Cembra Money Bank AG | 22,243 | 2,174,900 | |||||||||
UBS Group AG, Registered Shares | 313,892 | 3,626,116 | |||||||||
5,801,016 | |||||||||||
Health Care (6.4%): | |||||||||||
Novartis AG, Registered Shares | 100,166 | 8,728,872 | |||||||||
Roche Holding AG | 31,674 | 10,976,339 | |||||||||
19,705,211 | |||||||||||
38,315,829 | |||||||||||
United Kingdom (14.0%): | |||||||||||
Consumer Discretionary (1.1%): | |||||||||||
Next PLC | 56,310 | 3,408,726 | |||||||||
Consumer Staples (3.9%): | |||||||||||
Diageo PLC | 137,889 | 4,582,312 | |||||||||
Imperial Brands PLC | 184,968 | 3,520,591 | |||||||||
Unilever PLC | 70,346 | 3,793,915 | |||||||||
11,896,818 | |||||||||||
See notes to financial statements.
7
| Victory Portfolios Victory RS International Fund | Schedule of Portfolio Investments — continued June 30, 2020 | ||||||
(Unaudited)
Security Description | Shares | Value | |||||||||
Energy (2.0%): | |||||||||||
| BP PLC | 646,038 | $ | 2,474,593 | ||||||||
Royal Dutch Shell PLC, Class A | 222,089 | 3,555,341 | |||||||||
6,029,934 | |||||||||||
Financials (2.4%): | |||||||||||
Close Brothers Group PLC | 164,726 | 2,254,823 | |||||||||
HSBC Holdings PLC | 384,893 | 1,788,530 | |||||||||
Legal & General Group PLC | 1,243,685 | 3,390,034 | |||||||||
7,433,387 | |||||||||||
Health Care (0.8%): | |||||||||||
Smith & Nephew PLC | 132,068 | 2,460,503 | |||||||||
Industrials (1.2%): | |||||||||||
RELX PLC | 151,446 | 3,504,758 | |||||||||
Materials (2.6%): | |||||||||||
Croda International PLC | 23,831 | 1,547,589 | |||||||||
Rio Tinto PLC | 115,617 | 6,505,457 | |||||||||
8,053,046 | |||||||||||
42,787,172 | |||||||||||
Total Common Stocks (Cost $302,706,103) | 295,247,703 | ||||||||||
Rights (0.0%) (c) | |||||||||||
Spain (0.0%): (c) | |||||||||||
Communication Services (0.0%): (c) | |||||||||||
Telefonica SA, Expires 7/16/20 (a) | 697,889 | 137,281 | |||||||||
Total Rights (Cost $150,791) | 137,281 | ||||||||||
Exchange-Traded Funds (1.2%) | |||||||||||
United States (1.2%): | |||||||||||
iShares MSCI EAFE ETF | 59,885 | 3,645,200 | |||||||||
Total Exchange-Traded Funds (Cost $3,340,339) | 3,645,200 | ||||||||||
Collateral for Securities Loaned^ (2.1%) | |||||||||||
United States (2.1%): | |||||||||||
BlackRock Liquidity Funds TempFund Portfolio, Institutional Class, 0.28% (d) | 106,823 | 106,823 | |||||||||
Fidelity Investments Money Market Government Portfolio, Class I, 0.09% (d) | 3,233,059 | 3,233,059 | |||||||||
| Goldman Sachs Financial Square Prime Obligations Fund, Institutional Class, 0.30% (d) | 742,842 | 742,842 | |||||||||
JPMorgan Prime Money Market Fund, Capital Class, 0.43% (d) | 425,075 | 425,075 | |||||||||
| Morgan Stanley Institutional Liquidity Prime Portfolio, Institutional Class, 0.41% (d) | 1,911,222 | 1,911,222 | |||||||||
Total Collateral for Securities Loaned (Cost $6,419,021) | 6,419,021 | ||||||||||
Total Investments (Cost $312,616,254) — 100.0% | 305,449,205 | ||||||||||
Liabilities in excess of other assets — 0.0% | (36,430 | ) | |||||||||
NET ASSETS — 100.00% | $ | 305,412,775 | |||||||||
See notes to financial statements.
8
| Victory Portfolios Victory RS International Fund | Schedule of Portfolio Investments — continued June 30, 2020 | ||||||
(Unaudited)
^ Purchased with cash collateral from securities on loan.
(a) Non-income producing security.
(b) All or a portion of this security is on loan.
(c) Amount represents less than 0.05% of net assets.
(d) Rate disclosed is the daily yield on June 30, 2020.
ETF — Exchange-Traded Fund
PLC — Public Limited Company
See notes to financial statements.
9
| Victory Portfolios Victory RS Global Fund | Schedule of Portfolio Investments June 30, 2020 | ||||||
(Unaudited)
Security Description | Shares | Value | |||||||||
Common Stocks (96.9%) | |||||||||||
Australia (1.6%): | |||||||||||
Financials (0.7%): | |||||||||||
Macquarie Group Ltd. | 9,457 | $ | 784,627 | ||||||||
Health Care (0.9%): | |||||||||||
CSL Ltd. | 5,300 | 1,053,803 | |||||||||
1,838,430 | |||||||||||
Belgium (0.6%): | |||||||||||
Information Technology (0.6%): | |||||||||||
Melexis NV | 8,434 | 641,507 | |||||||||
Bermuda (0.8%): | |||||||||||
Industrials (0.8%): | |||||||||||
Triton International Ltd. | 30,117 | 910,738 | |||||||||
Canada (2.1%): | |||||||||||
Energy (0.6%): | |||||||||||
Parex Resources, Inc. (a) | 53,128 | 640,323 | |||||||||
Industrials (0.9%): | |||||||||||
Canadian Pacific Railway Ltd. | 4,053 | 1,031,075 | |||||||||
Materials (0.6%): | |||||||||||
Kirkland Lake Gold Ltd. | 17,613 | 725,333 | |||||||||
2,396,731 | |||||||||||
China (3.6%): | |||||||||||
Communication Services (1.8%): | |||||||||||
Tencent Holdings Ltd. | 30,500 | 1,954,427 | |||||||||
Consumer Staples (0.8%): | |||||||||||
Foshan Haitan Flavouring & Food Co. Ltd., Class A | 52,849 | 930,885 | |||||||||
Financials (1.0%): | |||||||||||
Industrial & Commercial Bank of China Ltd., Class H | 1,875,000 | 1,133,595 | |||||||||
4,018,907 | |||||||||||
Denmark (1.0%): | |||||||||||
Consumer Staples (1.0%): | |||||||||||
Royal Unibrew A/S (a) | 12,847 | 1,071,064 | |||||||||
France (4.8%): | |||||||||||
Consumer Discretionary (1.8%): | |||||||||||
Faurecia SE (a) | 22,087 | 867,695 | |||||||||
LVMH Moet Hennessy Louis Vuitton SE | 2,549 | 1,125,277 | |||||||||
1,992,972 | |||||||||||
Energy (1.3%): | |||||||||||
Gaztransport Et Technigaz SA | 8,335 | 639,558 | |||||||||
TOTAL SA (b) | 20,433 | 787,799 | |||||||||
1,427,357 | |||||||||||
See notes to financial statements.
10
| Victory Portfolios Victory RS Global Fund | Schedule of Portfolio Investments — continued June 30, 2020 | ||||||
(Unaudited)
Security Description | Shares | Value | |||||||||
Financials (0.9%): | |||||||||||
BNP Paribas SA (a) | 26,084 | $ | 1,042,073 | ||||||||
Materials (0.8%): | |||||||||||
Arkema SA | 9,716 | 933,863 | |||||||||
5,396,265 | |||||||||||
Germany (0.5%): | |||||||||||
Industrials (0.5%): | |||||||||||
Washtec AG (a) | 14,142 | 582,752 | |||||||||
Hong Kong (0.7%): | |||||||||||
Energy (0.7%): | |||||||||||
CNOOC Ltd. | 731,957 | 821,517 | |||||||||
India (1.0%): | |||||||||||
Consumer Staples (1.0%): | |||||||||||
Nestle India Ltd. | 4,887 | 1,109,693 | |||||||||
Indonesia (0.8%): | |||||||||||
Communication Services (0.8%): | |||||||||||
PT Telekomunikasi Indonesia (Persero) Tbk | 4,101,700 | 883,272 | |||||||||
Ireland (1.2%): | |||||||||||
Industrials (1.2%): | |||||||||||
Eaton Corp. PLC | 15,271 | 1,335,907 | |||||||||
Italy (2.6%): | |||||||||||
Financials (0.7%): | |||||||||||
Banca Generali SpA (a) | 28,466 | 855,863 | |||||||||
Health Care (0.9%): | |||||||||||
Recordati SpA | 19,466 | 973,971 | |||||||||
Utilities (1.0%): | |||||||||||
Enel SpA | 126,209 | 1,091,421 | |||||||||
2,921,255 | |||||||||||
Japan (7.1%): | |||||||||||
Communication Services (0.5%): | |||||||||||
Kakaku.com, Inc. | 21,300 | 542,677 | |||||||||
Consumer Discretionary (1.7%): | |||||||||||
Hikari Tsushin, Inc. | 3,100 | 708,908 | |||||||||
Toyota Motor Corp. | 19,400 | 1,220,121 | |||||||||
1,929,029 | |||||||||||
Consumer Staples (0.5%): | |||||||||||
Kobe Bussan Co. Ltd. | 9,300 | 528,179 | |||||||||
Financials (0.9%): | |||||||||||
Jafco Co. Ltd. | 11,900 | 402,479 | |||||||||
Resona Holdings, Inc. | 196,796 | 673,508 | |||||||||
1,075,987 | |||||||||||
See notes to financial statements.
11
| Victory Portfolios Victory RS Global Fund | Schedule of Portfolio Investments — continued June 30, 2020 | ||||||
(Unaudited)
Security Description | Shares | Value | |||||||||
Health Care (1.5%): | |||||||||||
As One Corp. | 4,579 | $ | 500,033 | ||||||||
Hoya Corp. | 12,900 | 1,235,463 | |||||||||
1,735,496 | |||||||||||
Industrials (1.6%): | |||||||||||
en-japan, Inc. | 21,500 | 535,244 | |||||||||
Hitachi Construction Machinery Co. Ltd. | 21,500 | 597,330 | |||||||||
OKUMA Corp. | 14,900 | 640,876 | |||||||||
1,773,450 | |||||||||||
Information Technology (0.4%): | |||||||||||
Ulvac, Inc. | 14,900 | 432,633 | |||||||||
8,017,451 | |||||||||||
Korea, Republic Of (1.2%): | |||||||||||
Information Technology (1.2%): | |||||||||||
Samsung Electronics Co. Ltd. | 31,044 | 1,374,301 | |||||||||
Macau (0.6%): | |||||||||||
Consumer Discretionary (0.6%): | |||||||||||
Wynn Macau Ltd. | 370,800 | 643,145 | |||||||||
Mexico (0.3%): | |||||||||||
Industrials (0.3%): | |||||||||||
Promotora y Operadora de Infraestructura SAB de CV (a) | 54,278 | 391,063 | |||||||||
Netherlands (1.1%): | |||||||||||
Industrials (1.1%): | |||||||||||
Wolters Kluwer NV | 16,169 | 1,263,731 | |||||||||
New Zealand (0.8%): | |||||||||||
Health Care (0.8%): | |||||||||||
Fisher & Paykel Healthcare Corp. Ltd. | 41,513 | 956,029 | |||||||||
Norway (1.2%): | |||||||||||
Energy (0.5%): | |||||||||||
Aker BP ASA | 33,042 | 611,732 | |||||||||
Financials (0.7%): | |||||||||||
SpareBank 1 SMN | 92,081 | 753,355 | |||||||||
1,365,087 | |||||||||||
Russian Federation (0.7%): | |||||||||||
Materials (0.7%): | |||||||||||
Evraz PLC | 214,449 | 759,686 | |||||||||
Singapore (0.5%): | |||||||||||
Financials (0.5%): | |||||||||||
Singapore Exchange Ltd. | 93,600 | 563,375 | |||||||||
See notes to financial statements.
12
| Victory Portfolios Victory RS Global Fund | Schedule of Portfolio Investments — continued June 30, 2020 | ||||||
(Unaudited)
Security Description | Shares | Value | |||||||||
Sweden (1.7%): | |||||||||||
Industrials (1.7%): | |||||||||||
Atlas Copco AB, Class B | 27,036 | $ | 1,004,939 | ||||||||
Nolato AB, Class B (a) | 13,984 | 945,945 | |||||||||
1,950,884 | |||||||||||
Switzerland (2.1%): | |||||||||||
Health Care (2.1%): | |||||||||||
Roche Holding AG | 6,824 | 2,364,796 | |||||||||
Taiwan (1.0%): | |||||||||||
Financials (1.0%): | |||||||||||
Cathay Financial Holding Co. Ltd. | 818,000 | 1,163,968 | |||||||||
United Kingdom (4.5%): | |||||||||||
Consumer Discretionary (0.4%): | |||||||||||
Next PLC | 7,922 | 479,558 | |||||||||
Consumer Staples (1.2%): | |||||||||||
Diageo PLC | 18,466 | 613,660 | |||||||||
Imperial Brands PLC | 27,751 | 528,199 | |||||||||
Unilever PLC | 4,209 | 227,001 | |||||||||
1,368,860 | |||||||||||
Financials (0.5%): | |||||||||||
Close Brothers Group PLC | 33,692 | 461,187 | |||||||||
HSBC Holdings PLC | 29,427 | 136,742 | |||||||||
597,929 | |||||||||||
Industrials (0.4%): | |||||||||||
RELX PLC | 19,153 | 443,238 | |||||||||
Materials (2.0%): | |||||||||||
Croda International PLC | 6,418 | 416,786 | |||||||||
Rio Tinto PLC | 32,158 | 1,809,444 | |||||||||
2,226,230 | |||||||||||
5,115,815 | |||||||||||
United States (52.8%): | |||||||||||
Communication Services (5.1%): | |||||||||||
Alphabet, Inc., Class C (a) | 1,448 | 2,046,907 | |||||||||
Facebook, Inc., Class A (a) | 10,157 | 2,306,350 | |||||||||
Verizon Communications, Inc. | 25,187 | 1,388,560 | |||||||||
5,741,817 | |||||||||||
Consumer Discretionary (6.0%): | |||||||||||
Amazon.com, Inc. (a) | 1,176 | 3,244,373 | |||||||||
McDonald's Corp. | 7,496 | 1,382,787 | |||||||||
Ross Stores, Inc. | 12,475 | 1,063,369 | |||||||||
The TJX Cos., Inc. | 21,797 | 1,102,056 | |||||||||
6,792,585 | |||||||||||
See notes to financial statements.
13
| Victory Portfolios Victory RS Global Fund | Schedule of Portfolio Investments — continued June 30, 2020 | ||||||
(Unaudited)
Security Description | Shares | Value | |||||||||
Consumer Staples (4.4%): | |||||||||||
Colgate-Palmolive Co. | 23,091 | $ | 1,691,647 | ||||||||
PepsiCo, Inc. | 16,161 | 2,137,454 | |||||||||
The Estee Lauder Cos., Inc., Class A | 6,005 | 1,133,023 | |||||||||
4,962,124 | |||||||||||
Energy (1.3%): | |||||||||||
ConocoPhillips | 16,772 | 704,759 | |||||||||
Phillips 66 | 10,909 | 784,357 | |||||||||
1,489,116 | |||||||||||
Financials (6.6%): | |||||||||||
Bank of America Corp. | 73,662 | 1,749,472 | |||||||||
CME Group, Inc. | 3,022 | 491,196 | |||||||||
JPMorgan Chase & Co. | 20,621 | 1,939,611 | |||||||||
MSCI, Inc. | 2,567 | 856,916 | |||||||||
The PNC Financial Services Group, Inc. | 8,857 | 931,845 | |||||||||
The Progressive Corp. | 18,488 | 1,481,074 | |||||||||
7,450,114 | |||||||||||
Health Care (6.8%): | |||||||||||
Amedisys, Inc. (a) | 5,309 | 1,054,049 | |||||||||
Amgen, Inc. | 7,222 | 1,703,381 | |||||||||
CVS Health Corp. | 17,250 | 1,120,732 | |||||||||
Eli Lilly & Co. | 9,593 | 1,574,979 | |||||||||
Johnson & Johnson | 15,236 | 2,142,639 | |||||||||
7,595,780 | |||||||||||
Industrials (3.0%): | |||||||||||
3M Co. | 7,376 | 1,150,582 | |||||||||
HD Supply Holdings, Inc. (a) | 27,691 | 959,493 | |||||||||
Honeywell International, Inc. | 8,944 | 1,293,213 | |||||||||
3,403,288 | |||||||||||
Information Technology (17.4%): | |||||||||||
Apple, Inc. | 13,445 | 4,904,736 | |||||||||
Cisco Systems, Inc. | 42,280 | 1,971,939 | |||||||||
Mastercard, Inc., Class A | 9,518 | 2,814,473 | |||||||||
Microsoft Corp. | 29,217 | 5,945,952 | |||||||||
NVIDIA Corp. | 5,444 | 2,068,230 | |||||||||
Texas Instruments, Inc. | 15,495 | 1,967,400 | |||||||||
19,672,730 | |||||||||||
Real Estate (1.2%): | |||||||||||
Prologis, Inc. | 14,370 | 1,341,152 | |||||||||
Utilities (1.0%): | |||||||||||
MGE Energy, Inc. | 17,484 | 1,127,893 | |||||||||
59,576,599 | |||||||||||
Total Common Stocks (Cost $93,689,195) | 109,433,968 | ||||||||||
See notes to financial statements.
14
| Victory Portfolios Victory RS Global Fund | Schedule of Portfolio Investments — continued June 30, 2020 | ||||||
(Unaudited)
Security Description | Shares | Value | |||||||||
Preferred Stocks (0.8%) | |||||||||||
Brazil (0.8%): | |||||||||||
Financials (0.8%): | |||||||||||
Itau Unibanco Holding SA | 186,415 | $ | 872,556 | ||||||||
Total Preferred Stocks (Cost $928,742) | 872,556 | ||||||||||
Exchange-Traded Funds (0.6%) | |||||||||||
United States (0.6%): | |||||||||||
iShares MSCI ACWI ETF (b) | 9,134 | 673,358 | |||||||||
Total Exchange-Traded Funds (Cost $618,463) | 673,358 | ||||||||||
Collateral for Securities Loaned^ (0.7%) | |||||||||||
United States (0.7%): | |||||||||||
BlackRock Liquidity Funds TempFund Portfolio, Institutional Class, 0.28% (c) | 14,104 | 14,104 | |||||||||
| Fidelity Investments Money Market Government Portfolio, Class I, 0.09% (c) | 426,870 | 426,870 | |||||||||
| Goldman Sachs Financial Square Prime Obligations Fund, Institutional Class, 0.30% (c) | 98,080 | 98,080 | |||||||||
JPMorgan Prime Money Market Fund, Capital Class, 0.43% (c) | 56,124 | 56,124 | |||||||||
| Morgan Stanley Institutional Liquidity Prime Portfolio, Institutional Class, 0.41% (c) | 252,345 | 252,345 | |||||||||
Total Collateral for Securities Loaned (Cost $847,523) | 847,523 | ||||||||||
Total Investments (Cost $96,083,923) — 99.0% | 111,827,405 | ||||||||||
Other assets in excess of liabilities — 1.0% | 1,107,486 | ||||||||||
NET ASSETS — 100.00% | $ | 112,934,891 | |||||||||
^ Purchased with cash collateral from securities on loan.
(a) Non-income producing security.
(b) All or a portion of this security is on loan.
(c) Rate disclosed is the daily yield on June 30, 2020.
ETF — Exchange-Traded Fund
PLC — Public Limited Company
See notes to financial statements.
15
| Victory Portfolios Victory Sophus Emerging Markets Fund | Schedule of Portfolio Investments June 30, 2020 | ||||||
(Unaudited)
Security Description | Shares | Value | |||||||||
Common Stocks (97.4%) | |||||||||||
Brazil (6.0%): | |||||||||||
Communication Services (0.5%): | |||||||||||
TIM Participacoes SA | 606,300 | $ | 1,583,436 | ||||||||
Consumer Discretionary (0.6%): | |||||||||||
Afya Ltd., Class A (a) (b) | 89,137 | 2,089,371 | |||||||||
Energy (0.9%): | |||||||||||
Petroleo Brasileiro SA, ADR | 332,333 | 2,748,394 | |||||||||
Financials (1.6%): | |||||||||||
Banco Bradesco SA, ADR | 551,473 | 2,101,112 | |||||||||
Banco do Brasil SA | 534,600 | 3,161,074 | |||||||||
5,262,186 | |||||||||||
Industrials (0.8%): | |||||||||||
Cia de Locacao das Americas | 484,200 | 1,507,671 | |||||||||
JSL SA | 233,600 | 995,889 | |||||||||
2,503,560 | |||||||||||
Materials (0.9%): | |||||||||||
Vale SA | 266,500 | 2,740,874 | |||||||||
Utilities (0.7%): | |||||||||||
Neoenergia SA | 619,300 | 2,177,778 | |||||||||
19,105,599 | |||||||||||
Chile (0.0%): (c) | |||||||||||
Financials (0.0%): (c) | |||||||||||
Banco de Credito e Inversiones SA | 1 | 34 | |||||||||
China (37.7%): | |||||||||||
Communication Services (8.9%): | |||||||||||
JOYY, Inc., ADR (a) (b) | 16,768 | 1,484,806 | |||||||||
NetEase, Inc., ADR | 5,433 | 2,332,822 | |||||||||
Tencent Holdings Ltd. | 380,615 | 24,389,644 | |||||||||
28,207,272 | |||||||||||
Consumer Discretionary (12.3%): | |||||||||||
Alibaba Group Holding Ltd., ADR (a) | 110,644 | 23,865,911 | |||||||||
China East Education Holdings Ltd. (c) | 1,060,500 | 1,927,830 | |||||||||
China Yongda Automobiles Services Holdings Ltd. (a) | 1,654,000 | 2,002,665 | |||||||||
JD.com, Inc., ADR (a) | 58,802 | 3,538,704 | |||||||||
Meituan Dianping Class B (a) | 155,900 | 3,483,890 | |||||||||
Q Technology Group Co. Ltd. | 1,238,000 | 1,630,694 | |||||||||
Tongcheng-Elong Holdings Ltd. (a) | 1,339,200 | 2,431,937 | |||||||||
38,881,631 | |||||||||||
See notes to financial statements.
16
| Victory Portfolios Victory Sophus Emerging Markets Fund | Schedule of Portfolio Investments — continued June 30, 2020 | ||||||
(Unaudited)
Security Description | Shares | Value | |||||||||
Consumer Staples (2.2%): | |||||||||||
Ausnutria Dairy Corp. Ltd. | 933,000 | $ | 2,098,544 | ||||||||
Jonjee Hi-Tech Industrial and Commercial Holding Co. Ltd., Class A | 247,800 | 2,054,772 | |||||||||
Wuliangye Yibin Co. Ltd., Class A | 118,650 | 2,882,832 | |||||||||
7,036,148 | |||||||||||
Energy (1.5%): | |||||||||||
China Oilfield Services Ltd., Class H | 2,200,000 | 2,004,906 | |||||||||
CNOOC Ltd., ADR | 25,289 | 2,853,611 | |||||||||
4,858,517 | |||||||||||
Financials (5.3%): | |||||||||||
China Construction Bank Corp. Class H | 7,117,857 | 5,789,695 | |||||||||
China Galaxy Securities Co. Ltd., Class H (a) | 4,407,500 | 2,399,466 | |||||||||
China Merchants Bank Co. Ltd., Class H | 716,000 | 3,318,132 | |||||||||
Ping An Insurance Group Co. of China Ltd. (b) | 532,000 | 5,303,640 | |||||||||
16,810,933 | |||||||||||
Health Care (1.1%): | |||||||||||
Lepu Medical Technology Beijing Co. Ltd., Class A | 266,300 | 1,375,881 | |||||||||
Wuxi Biologics Cayman, Inc. (a) (c) | 112,500 | 2,065,060 | |||||||||
3,440,941 | |||||||||||
Industrials (1.5%): | |||||||||||
China Conch Venture Holdings Ltd. | 330,000 | 1,400,684 | |||||||||
Sany Heavy Industry Co. Ltd., Class A | 540,200 | 1,440,883 | |||||||||
Zoomlion Heavy Industry Science and Technology Co. Ltd., Class H (a) | 2,543,000 | 1,968,958 | |||||||||
4,810,525 | |||||||||||
Information Technology (1.9%): | |||||||||||
Beijing Sinnet Technology Co. Ltd., Class A | 296,700 | 1,103,673 | |||||||||
Beijing Thunisoft Corp. Ltd., Class A | 349,900 | 1,401,790 | |||||||||
Kingdee International Software Group Co. Ltd. | 625,000 | 1,462,465 | |||||||||
Xinyi Solar Holdings Ltd. | 2,150,000 | 2,067,564 | |||||||||
6,035,492 | |||||||||||
Materials (1.7%): | |||||||||||
Anhui Conch Cement Co. Ltd., Class H | 479,000 | 3,245,860 | |||||||||
Hengli Petrochemical Co. Ltd., Class A | 1,034,600 | 2,055,317 | |||||||||
5,301,177 | |||||||||||
Real Estate (1.3%): | |||||||||||
China SCE Group Holdings Ltd. | 5,183,000 | 2,264,254 | |||||||||
Sunac China Holdings Ltd. | 451,000 | 1,908,676 | |||||||||
4,172,930 | |||||||||||
119,555,566 | |||||||||||
Colombia (0.7%): | |||||||||||
Financials (0.7%): | |||||||||||
Bancolombia SA, ADR | 80,522 | 2,118,534 | |||||||||
See notes to financial statements.
17
| Victory Portfolios Victory Sophus Emerging Markets Fund | Schedule of Portfolio Investments — continued June 30, 2020 | ||||||
(Unaudited)
Security Description | Shares | Value | |||||||||
Greece (0.9%): | |||||||||||
Communication Services (0.4%): | |||||||||||
Hellenic Telecommunications Organization SA | 93,012 | $ | 1,256,302 | ||||||||
Financials (0.5%): | |||||||||||
National Bank of Greece SA (a) | 992,977 | 1,405,027 | |||||||||
2,661,329 | |||||||||||
Hong Kong (4.0%): | |||||||||||
Consumer Discretionary (0.6%): | |||||||||||
Geely Automobile Holdings Ltd. | 1,137,000 | 1,806,460 | |||||||||
Consumer Staples (0.6%): | |||||||||||
Hengan International Group Co. Ltd. | 256,000 | 2,015,083 | |||||||||
Energy (0.8%): | |||||||||||
Kunlun Energy Co. Ltd. | 3,710,000 | 2,429,842 | |||||||||
Health Care (0.6%): | |||||||||||
Sino Biopharmaceutical Ltd. | 963,000 | 1,815,106 | |||||||||
Information Technology (0.4%): | |||||||||||
Kingboard Laminates Holdings Ltd. | 1,380,500 | 1,395,159 | |||||||||
Real Estate (1.0%): | |||||||||||
Shimao Group Holdings Ltd. | 765,500 | 3,272,801 | |||||||||
12,734,451 | |||||||||||
India (9.3%): | |||||||||||
Consumer Discretionary (0.2%): | |||||||||||
Aditya Birla Fashion and Retail Ltd. (a) | 365,322 | 606,863 | |||||||||
Consumer Staples (1.0%): | |||||||||||
Hindustan Unilever Ltd. | 81,191 | 2,347,453 | |||||||||
Varun Beverages Ltd. | 107,364 | 970,143 | |||||||||
3,317,596 | |||||||||||
Energy (2.7%): | |||||||||||
Petronet LNG Ltd. | 698,819 | 2,391,704 | |||||||||
Reliance Industries Ltd. | 264,016 | 6,005,820 | |||||||||
8,397,524 | |||||||||||
Financials (2.1%): | |||||||||||
Axis Bank Ltd. | 248,119 | 1,342,356 | |||||||||
Cholamandalam Investment and Finance Co. Ltd. | 491,156 | 1,232,004 | |||||||||
Housing Development Finance Corp. Ltd. | 118,192 | 2,748,398 | |||||||||
Multi Commodity Exchange of India Ltd. | 75,061 | 1,278,019 | |||||||||
6,600,777 | |||||||||||
Health Care (1.0%): | |||||||||||
Dr. Reddy's Laboratories Ltd. | 31,085 | 1,628,335 | |||||||||
Sanofi India Ltd. | 14,926 | 1,557,177 | |||||||||
3,185,512 | |||||||||||
See notes to financial statements.
18
| Victory Portfolios Victory Sophus Emerging Markets Fund | Schedule of Portfolio Investments — continued June 30, 2020 | ||||||
(Unaudited)
Security Description | Shares | Value | |||||||||
Information Technology (1.2%): | |||||||||||
HCL Technologies Ltd. | 268,378 | $ | 1,980,738 | ||||||||
Infosys Technologies Ltd., ADR | 190,738 | 1,842,529 | |||||||||
3,823,267 | |||||||||||
Materials (1.1%): | |||||||||||
Asian Paints Ltd. | 56,968 | 1,273,730 | |||||||||
Vedanta Ltd. | 1,520,279 | 2,172,056 | |||||||||
3,445,786 | |||||||||||
29,377,325 | |||||||||||
Indonesia (0.7%): | |||||||||||
Financials (0.7%): | |||||||||||
PT Bank Negara Indonesia (Persero) Tbk | 6,563,400 | 2,131,852 | |||||||||
Isle of Man (0.5%): | |||||||||||
Real Estate (0.5%): | |||||||||||
NEPI Rockcastle PLC | 310,609 | 1,594,242 | |||||||||
Korea, Republic Of (13.2%): | |||||||||||
Communication Services (0.7%): | |||||||||||
NAVER Corp. | 9,374 | 2,109,081 | |||||||||
Consumer Discretionary (1.7%): | |||||||||||
F&F Co. Ltd. | 18,013 | 1,389,944 | |||||||||
Hyundai Mobis Co. Ltd. | 12,607 | 2,023,750 | |||||||||
Kia Motors Corp. | 67,707 | 1,829,693 | |||||||||
5,243,387 | |||||||||||
Consumer Staples (0.9%): | |||||||||||
GS Retail Co. Ltd. | 38,535 | 1,177,572 | |||||||||
Orion Corp. | 14,469 | 1,619,869 | |||||||||
2,797,441 | |||||||||||
Financials (1.8%): | |||||||||||
DB Insurance Co. Ltd. | 49,495 | 1,775,243 | |||||||||
Hana Financial Group, Inc. | 98,328 | 2,236,303 | |||||||||
Samsung Securities Co. Ltd. | 72,033 | 1,592,525 | |||||||||
5,604,071 | |||||||||||
Health Care (0.7%): | |||||||||||
Celltrion, Inc. (a) | 9,245 | 2,366,244 | |||||||||
Industrials (0.9%): | |||||||||||
Samsung Engineering Co. Ltd. (a) | 105,749 | 1,089,924 | |||||||||
SK Holdings Co. Ltd. | 7,709 | 1,874,924 | |||||||||
2,964,848 | |||||||||||
Information Technology (6.2%): | |||||||||||
Samsung Electro-Mechanics Co. Ltd. | 21,295 | 2,310,393 | |||||||||
Samsung Electronics Co. Ltd. | 291,359 | 12,898,309 | |||||||||
SK Hynix, Inc. | 63,312 | 4,520,571 | |||||||||
19,729,273 | |||||||||||
See notes to financial statements.
19
| Victory Portfolios Victory Sophus Emerging Markets Fund | Schedule of Portfolio Investments — continued June 30, 2020 | ||||||
(Unaudited)
Security Description | Shares | Value | |||||||||
Materials (0.3%): | |||||||||||
SK Materials Co. Ltd. | 6,628 | $ | 1,107,343 | ||||||||
41,921,688 | |||||||||||
Malaysia (0.6%): | |||||||||||
Health Care (0.6%): | |||||||||||
Top Glove Corp. Bhd | 462,900 | 1,747,970 | |||||||||
Mexico (2.2%): | |||||||||||
Consumer Staples (0.5%): | |||||||||||
Arca Continental SAB de CV | 364,073 | 1,596,249 | |||||||||
Financials (0.3%): | |||||||||||
Gentera SAB de CV | 2,139,523 | 1,025,112 | |||||||||
Industrials (0.9%): | |||||||||||
Controladora Vuela Cia de Aviacion SAB de CV, ADR (a) | 199,378 | 1,052,716 | |||||||||
Grupo Aeroportuario del Centro Norte SAB de CV, ADR (a) (b) | 49,963 | 1,856,125 | |||||||||
2,908,841 | |||||||||||
Real Estate (0.5%): | |||||||||||
Corp Inmobiliaria Vesta SAB de CV | 919,162 | 1,363,997 | |||||||||
6,894,199 | |||||||||||
Peru (0.6%): | |||||||||||
Financials (0.6%): | |||||||||||
Credicorp Ltd. | 15,017 | 2,007,322 | |||||||||
Philippines (1.1%): | |||||||||||
Financials (1.1%): | |||||||||||
BDO Unibank, Inc. | 1,092,710 | 2,156,650 | |||||||||
Metropolitan Bank & Trust Co. | 1,806,970 | 1,350,169 | |||||||||
3,506,819 | |||||||||||
Russian Federation (1.1%): | |||||||||||
Energy (0.8%): | |||||||||||
Rosneft Oil Co. PJSC, GDR | 509,265 | 2,559,420 | |||||||||
Materials (0.3%): | |||||||||||
MMC Norilsk Nickel PJSC, ADR | 39,750 | 1,046,617 | |||||||||
3,606,037 | |||||||||||
Saudi Arabia (0.7%): | |||||||||||
Consumer Discretionary (0.3%): | |||||||||||
Leejam Sports Co. JSC | 55,699 | 869,019 | |||||||||
Industrials (0.4%): | |||||||||||
Saudi Industrial Services Co. | 250,053 | 1,391,141 | |||||||||
2,260,160 | |||||||||||
South Africa (2.4%): | |||||||||||
Communication Services (1.3%): | |||||||||||
Naspers Ltd., Class N | 22,591 | 4,153,769 | |||||||||
See notes to financial statements.
20
| Victory Portfolios Victory Sophus Emerging Markets Fund | Schedule of Portfolio Investments — continued June 30, 2020 | ||||||
(Unaudited)
Security Description | Shares | Value | |||||||||
Financials (0.6%): | |||||||||||
Nedbank Group Ltd. | 346,708 | $ | 2,033,861 | ||||||||
Materials (0.5%): | |||||||||||
Gold Fields Ltd., ADR | 164,270 | 1,544,138 | |||||||||
7,731,768 | |||||||||||
Taiwan (11.6%): | |||||||||||
Consumer Discretionary (0.7%): | |||||||||||
Hotai Motor Co. Ltd. | 91,000 | 2,182,586 | |||||||||
Financials (1.7%): | |||||||||||
Chailease Holding Co. Ltd. | 530,608 | 2,262,769 | |||||||||
Yuanta Financial Holding Co. Ltd. | 5,524,000 | 3,288,546 | |||||||||
5,551,315 | |||||||||||
Health Care (0.7%): | |||||||||||
TaiDoc Technology Corp. | 113,000 | 1,052,642 | |||||||||
Universal Vision Biotechnology Co. Ltd. | 205,000 | 1,212,780 | |||||||||
2,265,422 | |||||||||||
Industrials (0.4%): | |||||||||||
Sunonwealth Electric Machine Industry Co. Ltd. | 663,000 | 1,162,240 | |||||||||
Information Technology (8.1%): | |||||||||||
Compeq Manufacturing Co. Ltd. | 1,804,000 | 2,945,430 | |||||||||
Formosa Sumco Technology Corp. | 326,000 | 1,521,804 | |||||||||
Hon Hai Precision Industry Co. Ltd. | 1,631,000 | 4,790,412 | |||||||||
Macronix International | 2,928,000 | 3,105,973 | |||||||||
Taiwan Semiconductor Manufacturing Co. Ltd. | 1,246,998 | 13,321,630 | |||||||||
25,685,249 | |||||||||||
36,846,812 | |||||||||||
Thailand (0.5%): | |||||||||||
Industrials (0.5%): | |||||||||||
Gunkul Engineering PCL | 19,056,400 | 1,610,702 | |||||||||
Turkey (1.6%): | |||||||||||
Communication Services (0.6%): | |||||||||||
Turk Telekomunikasyon A/S | 1,598,183 | 1,894,392 | |||||||||
Consumer Discretionary (0.5%): | |||||||||||
Tofas Turk Otomobil Fabrikasi A/S | 438,561 | 1,709,101 | |||||||||
Utilities (0.5%): | |||||||||||
Enerjisa Enerji A/S (c) | 1,140,076 | 1,432,546 | |||||||||
5,036,039 | |||||||||||
United Arab Emirates (0.6%): | |||||||||||
Financials (0.6%): | |||||||||||
Emirates NBD Bank PJSC | 797,504 | 1,943,052 | |||||||||
See notes to financial statements.
21
| Victory Portfolios Victory Sophus Emerging Markets Fund | Schedule of Portfolio Investments — continued June 30, 2020 | ||||||
(Unaudited)
Security Description | Shares | Value | |||||||||
United Kingdom (1.4%): | |||||||||||
Materials (1.4%): | |||||||||||
Anglo American PLC | 113,050 | $ | 2,605,737 | ||||||||
Antofagasta PLC | 151,220 | 1,749,987 | |||||||||
4,355,724 | |||||||||||
Total Common Stocks (Cost $281,448,986) | 308,747,224 | ||||||||||
Preferred Stocks (1.0%) | |||||||||||
Brazil (1.0%): | |||||||||||
Consumer Discretionary (0.6%): | |||||||||||
Lojas Americanas SA | 328,900 | 1,946,590 | |||||||||
Industrials (0.4%): | |||||||||||
Randon SA Implementos e Participacoes | 676,800 | 1,196,213 | |||||||||
3,142,803 | |||||||||||
Total Preferred Stocks (Cost $2,812,225) | 3,142,803 | ||||||||||
Rights (0.0%) | |||||||||||
India (0.0%): | |||||||||||
Consumer Discretionary (0.0%): | |||||||||||
Aditya Birla Fashion and Retail Ltd., Expires 7/23/20 (a) (d) (e) | 45,361 | — | |||||||||
Total Rights (Cost $—) | — | ||||||||||
Collateral for Securities Loaned^ (0.9%) | |||||||||||
United States (0.9%): | |||||||||||
BlackRock Liquidity Funds TempFund Portfolio, Institutional Class, 0.28% (f) | 49,072 | 49,072 | |||||||||
Fidelity Investments Money Market Government Portfolio, Class I, 0.09% (f) | 1,485,199 | 1,485,199 | |||||||||
| Goldman Sachs Financial Square Prime Obligations Fund, Institutional Class, 0.30% (f) | 341,246 | 341,246 | |||||||||
JPMorgan Prime Money Market Fund, Capital Class, 0.43% (f) | 195,271 | 195,271 | |||||||||
| Morgan Stanley Institutional Liquidity Prime Portfolio, Institutional Class, 0.41% (f) | 877,975 | 877,975 | |||||||||
Total Collateral for Securities Loaned (Cost $2,948,763) | 2,948,763 | ||||||||||
Total Investments (Cost $287,209,974) — 99.3% | 314,838,790 | ||||||||||
Other assets in excess of liabilities — 0.7% | 2,226,038 | ||||||||||
NET ASSETS — 100.00% | $ | 317,064,828 | |||||||||
^ Purchased with cash collateral from securities on loan.
(a) Non-income producing security.
(b) All or a portion of this security is on loan.
(c) Rule 144A security or other security that is restricted as to resale to institutional investors. The Fund's Adviser has deemed this security to be liquid based upon procedures approved by the Board of Trustees. As of June 30, 2020, the fair value of these securities was $5,425,436 and amounted to 1.7% of net assets.
See notes to financial statements.
22
| Victory Portfolios Victory Sophus Emerging Markets Fund | Schedule of Portfolio Investments — continued June 30, 2020 | ||||||
(Unaudited)
(d) The Fund's Adviser has deemed this security to be illiquid based upon procedures approved by the Board of Trustees. As of June 30, 2020, illiquid securities were 0.00% of the Fund's net assets.
(e) Security was fair valued based upon procedures approved by the Board of Trustees and represents 0.0% of the Fund's net assets as of June 30, 2020. This security is classified as Level 3 within the fair value hierarchy. (See Note 2)
(f) Rate disclosed is the daily yield on June 30, 2020.
ADR — American Depositary Receipt
GDR — Global Depositary Receipt
PCL — Public Company Limited
PLC — Public Limited Company
See notes to financial statements.
23
| Victory Portfolios Victory Sophus Emerging Markets Small Cap Fund | Schedule of Portfolio Investments June 30, 2020 | ||||||
(Unaudited)
Security Description | Shares | Value | |||||||||
Common Stocks (96.2%) | |||||||||||
Brazil (6.0%): | |||||||||||
Consumer Discretionary (2.5%): | |||||||||||
Afya Ltd., Class A (a) (b) | 1,675 | $ | 39,262 | ||||||||
Grupo SBF SA (a) | 6,600 | 39,705 | |||||||||
Tupy SA (a) | 12,300 | 43,208 | |||||||||
122,175 | |||||||||||
Health Care (0.7%): | |||||||||||
Qualicorp Consultoria e Corretora de Seguros SA | 6,300 | 33,602 | |||||||||
Industrials (1.5%): | |||||||||||
Cia de Locacao das Americas | 11,500 | 35,808 | |||||||||
JSL SA | 9,400 | 40,074 | |||||||||
75,882 | |||||||||||
Utilities (1.3%): | |||||||||||
Cia de Saneamento do Parana | 7,600 | 44,044 | |||||||||
Neoenergia SA | 5,700 | 20,044 | |||||||||
64,088 | |||||||||||
295,747 | |||||||||||
Canada (0.7%): | |||||||||||
Energy (0.7%): | |||||||||||
Parex Resources, Inc. (a) | 2,682 | 32,325 | |||||||||
China (16.4%): | |||||||||||
Consumer Discretionary (4.6%): | |||||||||||
China East Education Holdings Ltd. (c) | 16,500 | 29,994 | |||||||||
China Kepei Education Group Ltd. | 56,000 | 45,290 | |||||||||
China Yongda Automobiles Services Holdings Ltd. (a) | 33,500 | 40,562 | |||||||||
Hangzhou Robam Appliances Co. Ltd., Class A | 7,100 | 31,364 | |||||||||
Q Technology Group Co. Ltd. | 30,000 | 39,516 | |||||||||
Tongcheng-Elong Holdings Ltd. (a) | 20,800 | 37,772 | |||||||||
224,498 | |||||||||||
Consumer Staples (1.6%): | |||||||||||
Ausnutria Dairy Corp. Ltd. | 18,000 | 40,486 | |||||||||
Jonjee Hi-Tech Industrial and Commercial Holding Co. Ltd., Class A | 4,700 | 38,973 | |||||||||
79,459 | |||||||||||
Energy (0.8%): | |||||||||||
China Suntien Green Energy Corp. Ltd., Class H (a) | 170,000 | 39,122 | |||||||||
Health Care (0.8%): | |||||||||||
Tonghua Dongbao Pharmaceutical Co. Ltd., Class A | 15,500 | 38,329 | |||||||||
Industrials (1.3%): | |||||||||||
Binjiang Service Group Co. Ltd. | 17,500 | 28,937 | |||||||||
Zoomlion Heavy Industry Science and Technology Co. Ltd., Class H (a) | 46,000 | 35,616 | |||||||||
64,553 | |||||||||||
See notes to financial statements.
24
| Victory Portfolios Victory Sophus Emerging Markets Small Cap Fund | Schedule of Portfolio Investments — continued June 30, 2020 | ||||||
(Unaudited)
Security Description | Shares | Value | |||||||||
Information Technology (3.1%): | |||||||||||
21vianet Group, Inc., ADR (a) | 2,110 | $ | 50,345 | ||||||||
Beijing Sinnet Technology Co. Ltd., Class A | 7,900 | 29,387 | |||||||||
Beijing Thunisoft Corp. Ltd., Class A | 7,200 | 28,845 | |||||||||
Flat Glass Group Co. Ltd., Class H | 38,000 | 41,258 | |||||||||
149,835 | |||||||||||
Materials (1.3%): | |||||||||||
China Oriental Group Co. Ltd. | 92,000 | 25,230 | |||||||||
West China Cement Ltd. | 220,000 | 40,327 | |||||||||
65,557 | |||||||||||
Real Estate (2.9%): | |||||||||||
China SCE Group Holdings Ltd. | 83,000 | 36,260 | |||||||||
Powerlong Real Estate Holdings Ltd. | 53,000 | 29,882 | |||||||||
Times China Holdings Ltd. | 24,000 | 44,753 | |||||||||
Yuzhou Properties Co. Ltd. | 77,000 | 33,548 | |||||||||
144,443 | |||||||||||
805,796 | |||||||||||
Egypt (0.9%): | |||||||||||
Health Care (0.9%): | |||||||||||
Cleopatra Hospital (a) | 129,652 | 42,257 | |||||||||
Greece (1.8%): | |||||||||||
Financials (0.8%): | |||||||||||
National Bank of Greece SA (a) | 28,808 | 40,762 | |||||||||
Utilities (1.0%): | |||||||||||
Terna Energy SA | 4,540 | 49,019 | |||||||||
89,781 | |||||||||||
Hong Kong (0.7%): | |||||||||||
Information Technology (0.7%): | |||||||||||
Kingboard Laminates Holdings Ltd. | 32,500 | 32,845 | |||||||||
India (12.1%): | |||||||||||
Consumer Discretionary (0.3%): | |||||||||||
Aditya Birla Fashion and Retail Ltd. (a) | 9,065 | 15,059 | |||||||||
Consumer Staples (1.0%): | |||||||||||
Varun Beverages Ltd. | 5,456 | 49,301 | |||||||||
Energy (0.8%): | |||||||||||
Petronet LNG Ltd. | 11,786 | 40,337 | |||||||||
Financials (2.5%): | |||||||||||
Cholamandalam Investment and Finance Co. Ltd. | 14,740 | 36,974 | |||||||||
Manappuram Finance Ltd. | 22,605 | 45,479 | |||||||||
Multi Commodity Exchange of India Ltd. | 2,396 | 40,795 | |||||||||
123,248 | |||||||||||
See notes to financial statements.
25
| Victory Portfolios Victory Sophus Emerging Markets Small Cap Fund | Schedule of Portfolio Investments — continued June 30, 2020 | ||||||
(Unaudited)
Security Description | Shares | Value | |||||||||
Health Care (2.1%): | |||||||||||
Alkem Laboratories Ltd. | 995 | $ | 31,241 | ||||||||
Sanofi India Ltd. | 359 | 37,453 | |||||||||
Sequent Scientific Ltd. | 28,128 | 34,014 | |||||||||
102,708 | |||||||||||
Industrials (2.0%): | |||||||||||
Engineers India Ltd. | 46,806 | 46,764 | |||||||||
PNC Infratech Ltd. | 26,081 | 49,757 | |||||||||
96,521 | |||||||||||
Information Technology (1.1%): | |||||||||||
Mphasis Ltd. | 4,608 | 53,766 | |||||||||
Materials (1.3%): | |||||||||||
JK Lakshmi Cement Ltd. | 8,386 | 28,151 | |||||||||
Mishra Dhatu Nigam Ltd. (c) | 12,735 | 37,160 | |||||||||
65,311 | |||||||||||
Utilities (1.0%): | |||||||||||
CESC Ltd. | 6,003 | 49,482 | |||||||||
595,733 | |||||||||||
Indonesia (2.5%): | |||||||||||
Consumer Discretionary (0.9%): | |||||||||||
PT Mitra Adiperkasa Tbk (a) | 792,700 | 43,646 | |||||||||
Financials (0.7%): | |||||||||||
PT Bank Danamon Indonesia Tbk | 176,400 | 33,594 | |||||||||
Materials (0.9%): | |||||||||||
PT Merdeka Copper Gold Tbk (a) | 473,100 | 45,655 | |||||||||
122,895 | |||||||||||
Korea, Republic Of (18.7%): | |||||||||||
Consumer Discretionary (1.4%): | |||||||||||
F&F Co. Ltd. | 403 | 31,097 | |||||||||
Hyosung TNC Co. Ltd. | 402 | 37,724 | |||||||||
68,821 | |||||||||||
Consumer Staples (2.0%): | |||||||||||
GS Retail Co. Ltd. | 680 | 20,780 | |||||||||
Newtree Co. Ltd. | 1,704 | 39,793 | |||||||||
Orion Corp. | 312 | 34,930 | |||||||||
95,503 | |||||||||||
Financials (2.3%): | |||||||||||
DB Insurance Co. Ltd. | 858 | 30,774 | |||||||||
KIWOOM Securities Co. Ltd. | 650 | 47,525 | |||||||||
Woori Financial Group, Inc. | 4,877 | 35,950 | |||||||||
114,249 | |||||||||||
See notes to financial statements.
26
| Victory Portfolios Victory Sophus Emerging Markets Small Cap Fund | Schedule of Portfolio Investments — continued June 30, 2020 | ||||||
(Unaudited)
Security Description | Shares | Value | |||||||||
Health Care (5.0%): | |||||||||||
Caregen Co. Ltd. | 571 | $ | 32,851 | ||||||||
Classys, Inc. | 2,809 | 33,257 | |||||||||
Dong-A ST Co. Ltd. | 562 | 40,665 | |||||||||
Interojo Co. Ltd. | 2,113 | 41,761 | |||||||||
I-Sens, Inc. | 2,298 | 48,388 | |||||||||
Seegene, Inc. | 511 | 47,592 | |||||||||
244,514 | |||||||||||
Industrials (2.2%): | |||||||||||
Korea Line Corp. (a) | 2,778 | 40,103 | |||||||||
NICE Information Service Co. Ltd. | 2,463 | 37,636 | |||||||||
Samsung Engineering Co. Ltd. (a) | 3,077 | 31,714 | |||||||||
109,453 | |||||||||||
Information Technology (3.9%): | |||||||||||
Hanmi Semiconductor Co. Ltd. | 5,704 | 35,730 | |||||||||
HyVision System, Inc. | 5,751 | 45,136 | |||||||||
SFA Engineering Corp. | 1,328 | 36,335 | |||||||||
TES Co. Ltd. | 2,166 | 38,914 | |||||||||
Unitest, Inc. | 3,273 | 33,670 | |||||||||
189,785 | |||||||||||
Materials (1.9%): | |||||||||||
Hansol Chemical Co. Ltd. | 540 | 57,610 | |||||||||
SK Materials Co. Ltd. | 212 | 35,419 | |||||||||
93,029 | |||||||||||
915,354 | |||||||||||
Malaysia (0.8%): | |||||||||||
Health Care (0.8%): | |||||||||||
Top Glove Corp. Bhd | 10,100 | 38,139 | |||||||||
Mexico (4.0%): | |||||||||||
Financials (1.0%): | |||||||||||
Gentera SAB de CV | 97,073 | 46,511 | |||||||||
Industrials (2.3%): | |||||||||||
Controladora Vuela Cia de Aviacion SAB de CV, ADR (a) | 5,745 | 30,334 | |||||||||
Grupo Aeroportuario del Centro Norte SAB de CV, ADR (a) | 1,310 | 48,666 | |||||||||
Grupo Traxion SAB de CV (a) (c) | 58,658 | 35,814 | |||||||||
114,814 | |||||||||||
Real Estate (0.7%): | |||||||||||
Concentradora Fibra Danhos SA de CV | 37,743 | 35,872 | |||||||||
197,197 | |||||||||||
Peru (0.6%): | |||||||||||
Financials (0.6%): | |||||||||||
Intercorp Financial Services, Inc. (b) | 1,081 | 28,592 | |||||||||
See notes to financial statements.
27
| Victory Portfolios Victory Sophus Emerging Markets Small Cap Fund | Schedule of Portfolio Investments — continued June 30, 2020 | ||||||
(Unaudited)
Security Description | Shares | Value | |||||||||
Philippines (0.7%): | |||||||||||
Financials (0.7%): | |||||||||||
Metropolitan Bank & Trust Co. | 43,620 | $ | 32,593 | ||||||||
Romania (0.7%): | |||||||||||
Real Estate (0.7%): | |||||||||||
NEPI Rockcastle PLC | 7,001 | 35,934 | |||||||||
Saudi Arabia (1.6%): | |||||||||||
Consumer Discretionary (0.8%): | |||||||||||
Leejam Sports Co. JSC | 2,427 | 37,866 | |||||||||
Industrials (0.8%): | |||||||||||
Saudi Industrial Services Co. | 7,630 | 42,449 | |||||||||
80,315 | |||||||||||
Singapore (0.8%): | |||||||||||
Real Estate (0.8%): | |||||||||||
Ascendas India Trust | 40,900 | 39,669 | |||||||||
South Africa (2.2%): | |||||||||||
Financials (0.7%): | |||||||||||
Transaction Capital Ltd. | 29,587 | 31,831 | |||||||||
Materials (1.5%): | |||||||||||
Gold Fields Ltd., ADR | 4,419 | 41,538 | |||||||||
Impala Platinum Holdings Ltd. | 5,001 | 33,696 | |||||||||
75,234 | |||||||||||
107,065 | |||||||||||
Taiwan (20.4%): | |||||||||||
Communication Services (1.0%): | |||||||||||
International Games System Co. Ltd. | 2,000 | 50,058 | |||||||||
Consumer Discretionary (2.3%): | |||||||||||
Poya International Co. Ltd. | 2,000 | 39,536 | |||||||||
Tong Yang Industry Co. Ltd. | 28,000 | 34,889 | |||||||||
Topkey Corp. | 8,000 | 38,851 | |||||||||
113,276 | |||||||||||
Financials (0.7%): | |||||||||||
Chailease Holding Co. Ltd. | 7,743 | 33,021 | |||||||||
Health Care (1.7%): | |||||||||||
TaiDoc Technology Corp. | 4,000 | 37,262 | |||||||||
Universal Vision Biotechnology Co. Ltd. | 8,000 | 47,328 | |||||||||
84,590 | |||||||||||
Industrials (2.6%): | |||||||||||
Chicony Power Technology Co. Ltd. | 17,000 | 38,978 | |||||||||
Sunonwealth Electric Machine Industry Co. Ltd. | 25,000 | 43,825 | |||||||||
Taiwan Secom Co. Ltd. | 16,000 | 47,372 | |||||||||
130,175 | |||||||||||
See notes to financial statements.
28
| Victory Portfolios Victory Sophus Emerging Markets Small Cap Fund | Schedule of Portfolio Investments — continued June 30, 2020 | ||||||
(Unaudited)
Security Description | Shares | Value | |||||||||
Information Technology (11.2%): | |||||||||||
Compeq Manufacturing Co. Ltd. | 34,000 | $ | 55,512 | ||||||||
Ennoconn Corp. | 6,000 | 57,631 | |||||||||
FLEXium Interconnect, Inc. | 15,000 | 62,411 | |||||||||
Formosa Sumco Technology Corp. | 9,000 | 42,013 | |||||||||
Foxsemicon Integrated Technology, Inc. | 8,000 | 49,238 | |||||||||
General Interface Solution Holding Ltd. (a) | 10,000 | 38,449 | |||||||||
Lelon Electronics Corp. | 38,000 | 55,162 | |||||||||
Macronix International | 47,000 | 49,857 | |||||||||
Powertech Technology, Inc. | 10,000 | 36,515 | |||||||||
Sino-American Silicon Products, Inc. | 15,000 | 48,660 | |||||||||
Tripod Technology Corp. | 12,000 | 53,706 | |||||||||
549,154 | |||||||||||
Materials (0.9%): | |||||||||||
Taiwan Hon Chuan Enterprise Co. Ltd. | 23,000 | 42,994 | |||||||||
1,003,268 | |||||||||||
Taiwan, Province Of China (0.7%): | |||||||||||
Materials (0.7%): | |||||||||||
Tung Ho Steel Enterprise Corp. | 48,000 | 36,612 | |||||||||
Thailand (1.5%): | |||||||||||
Financials (0.6%): | |||||||||||
Kiatnakin Bank PCL, Class F | 23,800 | 30,956 | |||||||||
Industrials (0.9%): | |||||||||||
Gunkul Engineering PCL (b) | 510,500 | 43,149 | |||||||||
74,105 | |||||||||||
Turkey (2.4%): | |||||||||||
Communication Services (0.8%): | |||||||||||
Turk Telekomunikasyon A/S | 31,334 | 37,142 | |||||||||
Consumer Discretionary (0.8%): | |||||||||||
Tofas Turk Otomobil Fabrikasi A/S | 10,088 | 39,314 | |||||||||
Utilities (0.8%): | |||||||||||
Enerjisa Enerji A/S (c) | 32,424 | 40,742 | |||||||||
117,198 | |||||||||||
Total Common Stocks (Cost $4,731,345) | 4,723,420 | ||||||||||
Preferred Stocks (1.4%) | |||||||||||
Brazil (1.4%): | |||||||||||
Financials (0.7%): | |||||||||||
Banco do Estado do Rio Grande do Sul SA, Class B | 14,400 | 35,886 | |||||||||
Industrials (0.7%): | |||||||||||
Randon SA Implementos e Participacoes | 18,100 | 31,991 | |||||||||
67,877 | |||||||||||
Total Preferred Stocks (Cost $101,098) | 67,877 | ||||||||||
See notes to financial statements.
29
| Victory Portfolios Victory Sophus Emerging Markets Small Cap Fund | Schedule of Portfolio Investments — continued June 30, 2020 | ||||||
(Unaudited)
Security Description | Shares | Value | |||||||||
Rights (0.0%) | |||||||||||
India (0.0%): | |||||||||||
Consumer Discretionary (0.0%): | |||||||||||
Aditya Birla Fashion and Retail Ltd., Expires 7/23/20 (a) (d) (e) | 1,125 | $ | — | ||||||||
Total Rights (Cost $—) | — | ||||||||||
Collateral for Securities Loaned^ (1.4%) | |||||||||||
United States (1.4%): | |||||||||||
BlackRock Liquidity Funds TempFund Portfolio, Institutional Class, 0.28% (f) | 1,123 | 1,123 | |||||||||
Fidelity Investments Money Market Government Portfolio, Class I, 0.09% (f) | 33,994 | 33,994 | |||||||||
| Goldman Sachs Financial Square Prime Obligations Fund, Institutional Class, 0.30% (f) | 7,811 | 7,811 | |||||||||
JPMorgan Prime Money Market Fund, Capital Class, 0.43% (f) | 4,470 | 4,470 | |||||||||
| Morgan Stanley Institutional Liquidity Prime Portfolio, Institutional Class, 0.41% (f) | 20,095 | 20,095 | |||||||||
Total Collateral for Securities Loaned (Cost $67,493) | 67,493 | ||||||||||
Total Investments (Cost $4,899,936) — 99.0% | 4,858,790 | ||||||||||
Other assets in excess of liabilities — 1.0% | 47,716 | ||||||||||
NET ASSETS — 100.00% | $ | 4,906,506 | |||||||||
^ Purchased with cash collateral from securities on loan.
(a) Non-income producing security.
(b) All or a portion of this security is on loan.
(c) Rule 144A security or other security that is restricted as to resale to institutional investors. The Fund's Adviser has deemed this security to be liquid based upon procedures approved by the Board of Trustees. As of June 30, 2020, the fair value of these securities was $143,710 and amounted to 2.9% of net assets.
(d) The Fund's Adviser has deemed this security to be illiquid based upon procedures approved by the Board of Trustees. As of June 30, 2020, illiquid securities were 0.00% of the Fund's net assets.
(e) Security was fair valued based upon procedures approved by the Board of Trustees and represents 0.0% of the Fund's net assets as of June 30, 2020. This security is classified as Level 3 within the fair value hierarchy. (See Note 2)
(f) Rate disclosed is the daily yield on June 30, 2020.
ADR — American Depositary Receipt
PCL — Public Company Limited
PLC — Public Limited Company
See notes to financial statements.
30
Victory Portfolios | Statements of Assets and Liabilities June 30, 2020 | ||||||
(Unaudited)
| Victory RS International Fund | Victory RS Global Fund | ||||||||||
ASSETS: | |||||||||||
Investments, at value (Cost $312,616,254 and $96,083,923) | $ | 305,449,205 | (a) | $ | 111,827,405 | (b) | |||||
Foreign currency, at value (Cost $— and $19,797) | — | 19,700 | |||||||||
Cash and cash equivalents | 18,163,004 | 2,460,235 | |||||||||
Receivables: | |||||||||||
Interest and dividends | 263,816 | 189,377 | |||||||||
Capital shares issued | 70,151 | 137,230 | |||||||||
Investments sold | 11,771,539 | 445,212 | |||||||||
Reclaims | 372,490 | 57,832 | |||||||||
From Adviser | 81,595 | 100,396 | |||||||||
Prepaid expenses | 33,447 | 38,452 | |||||||||
Total Assets | 336,205,247 | 115,275,839 | |||||||||
LIABILITIES: | |||||||||||
Payables: | |||||||||||
Collateral received on loaned securities | 6,419,021 | 847,523 | |||||||||
Investments purchased | 23,230,562 | 1,300,331 | |||||||||
Capital shares redeemed | 157,543 | 48,456 | |||||||||
Foreign currency | 740,544 | — | |||||||||
Accrued foreign capital gains taxes | — | 35,257 | |||||||||
Accrued expenses and other payables: | |||||||||||
Investment advisory fees | 193,080 | 70,807 | |||||||||
Administration fees | 15,081 | 5,460 | |||||||||
Custodian fees | 8,764 | 5,013 | |||||||||
Transfer agent fees | 12,677 | 8,362 | |||||||||
Compliance fees | 191 | 83 | |||||||||
| 12b-1 fees | 3,287 | 5,659 | |||||||||
Other accrued expenses | 11,722 | 13,997 | |||||||||
Total Liabilities | 30,792,472 | 2,340,948 | |||||||||
NET ASSETS: | |||||||||||
Capital | 314,816,257 | 99,522,376 | |||||||||
Total distributable earnings/(loss) | (9,403,482 | ) | 13,412,515 | ||||||||
Net Assets | $ | 305,412,775 | $ | 112,934,891 | |||||||
Net Assets | |||||||||||
Class A Shares | $ | 22,344,745 | $ | 37,112,935 | |||||||
Class C Shares | 1,337,820 | 2,777,436 | |||||||||
Class R Shares | 2,223,373 | 3,726,307 | |||||||||
Class R6 Shares | 180,566,251 | 544,135 | |||||||||
Class Y Shares | 98,940,586 | 68,774,078 | |||||||||
Total | $ | 305,412,775 | $ | 112,934,891 | |||||||
| Shares (unlimited number of shares authorized with a par value of $0.001 per share): | |||||||||||
Class A Shares | 1,934,046 | 2,606,270 | |||||||||
Class C Shares | 160,512 | 202,376 | |||||||||
Class R Shares | 206,447 | 209,881 | |||||||||
Class R6 Shares | 18,855,997 | 51,223 | |||||||||
Class Y Shares | 8,679,747 | 4,869,525 | |||||||||
Total | 29,836,749 | 7,939,275 | |||||||||
(continues on next page)
See notes to financial statements.
31
Victory Portfolios | Statements of Assets and Liabilities June30, 2020 | ||||||
(Unaudited) (continued)
| Victory RS International Fund | Victory RS Global Fund | ||||||||||
| Net asset value, offering (except Class A Shares) and redemption price per share: | |||||||||||
Class A Shares | $ | 11.55 | $ | 14.24 | |||||||
Class C Shares (c) | 8.33 | 13.72 | |||||||||
Class R Shares | 10.77 | 17.75 | |||||||||
Class R6 Shares | 9.58 | 10.62 | |||||||||
Class Y Shares | 11.40 | 14.12 | |||||||||
Maximum Sales Charge — Class A Shares | 5.75 | % | 5.75 | % | |||||||
| Maximum offering price (100%/(100%-maximum sales charge) of net asset value adjusted to the nearest cent) per share — Class A Shares | $ | 12.25 | $ | 15.11 | |||||||
(a) Includes $6,065,938 of securities on loan.
(b) Includes $804,171 of securities on loan.
(c) Redemption price per share varies by the length of time shares are held.
See notes to financial statements.
32
Victory Portfolios | Statements of Assets and Liabilities June 30, 2020 | ||||||
(Unaudited)
Victory Sophus Emerging Markets Fund | Victory Sophus Emerging Markets Small Cap Fund | ||||||||||
ASSETS: | |||||||||||
Investments, at value (Cost $287,209,974 and $4,899,936) | $ | 314,838,790 | (a) | $ | 4,858,790 | (b) | |||||
Foreign currency, at value (Cost $209,536 and $29,438) | 210,119 | 29,457 | |||||||||
Cash and cash equivalents | 2,672,054 | 37,634 | |||||||||
Receivables: | |||||||||||
Interest and dividends | 1,337,596 | 18,158 | |||||||||
Capital shares issued | 185,721 | — | |||||||||
Investments sold | 3,359,592 | 25,190 | |||||||||
Reclaims | 5,005 | 596 | |||||||||
From Adviser | 183,570 | 27,761 | |||||||||
Prepaid expenses | 29,610 | 19,275 | |||||||||
Total Assets | 322,822,057 | 5,016,861 | |||||||||
LIABILITIES: | |||||||||||
Liabilities: | |||||||||||
Collateral received on loaned securities | 2,948,763 | 67,493 | |||||||||
Investments purchased | 1,233,691 | 12,063 | |||||||||
Capital shares redeemed | 1,151,703 | — | |||||||||
Accrued foreign capital gains taxes | — | 17 | |||||||||
Accrued expenses and other payables: | |||||||||||
Investment advisory fees | 262,413 | 5,094 | |||||||||
Administration fees | 15,899 | 249 | |||||||||
Custodian fees | 36,483 | 7,629 | |||||||||
Transfer agent fees | 61,423 | 98 | |||||||||
Compliance fees | 269 | 4 | |||||||||
| 12b-1 fees | 8,430 | 71 | |||||||||
Other accrued expenses | 38,155 | 17,637 | |||||||||
Total Liabilities | 5,757,229 | 110,355 | |||||||||
NET ASSETS: | |||||||||||
| Capital | 316,473,341 | 5,286,870 | |||||||||
Total distributable earnings/(loss) | 591,487 | (380,364 | ) | ||||||||
Net Assets | $ | 317,064,828 | $ | 4,906,506 | |||||||
Net Assets | |||||||||||
Class A Shares | $ | 48,506,850 | $ | 267,565 | |||||||
Class C Shares | 2,825,492 | 107,790 | |||||||||
Class R Shares | 11,380,720 | — | |||||||||
Class R6 Shares | 66,307,258 | — | |||||||||
Class Y Shares | 188,044,508 | 4,531,151 | |||||||||
Total | $ | 317,064,828 | $ | 4,906,506 | |||||||
| Shares (unlimited number of shares authorized with a par value of $0.001 per share): | |||||||||||
Class A Shares | 2,558,449 | 42,830 | |||||||||
Class C Shares | 200,561 | 19,059 | |||||||||
Class R Shares | 641,196 | — | |||||||||
Class R6 Shares | 3,439,810 | — | |||||||||
Class Y Shares | 9,849,090 | 727,537 | |||||||||
Total | 16,689,106 | 789,426 | |||||||||
(continues on next page)
See notes to financial statements.
33
Victory Portfolios | Statements of Assets and Liabilities June30, 2020 | ||||||
(Unaudited) (continued)
Victory Sophus Emerging Markets Fund | Victory Sophus Emerging Markets Small Cap Fund | ||||||||||
| Net asset value, offering (except Class A Shares) and redemption price per share: | |||||||||||
Class A Shares | $ | 18.96 | $ | 6.25 | |||||||
Class C Shares (c) | 14.09 | 5.66 | |||||||||
Class R Shares | 17.75 | — | |||||||||
Class R6 Shares | 19.28 | — | |||||||||
Class Y Shares | 19.09 | 6.23 | |||||||||
Maximum Sales Charge — Class A Shares | 5.75 | % | 5.75 | % | |||||||
| Maximum offering price (100%/(100%-maximum sales charge) of net asset value adjusted to the nearest cent) per share — Class A Shares | $ | 20.12 | $ | 6.63 | |||||||
(a) Includes $2,901,302 of securities on loan.
(b) Includes $63,347 of securities on loan.
(c) Redemption price per share varies by the length of time shares are held.
See notes to financial statements.
34
Victory Portfolios | Statements of Operations For the Six Months Ended June30, 2020 | ||||||
(Unaudited)
| Victory RS International Fund | Victory RS Global Fund | ||||||||||
Investment Income: | |||||||||||
Dividends | $ | 5,522,716 | $ | 1,260,020 | |||||||
Interest | 30,300 | 10,418 | |||||||||
Securities lending (net of fees) | 29,628 | 7,711 | |||||||||
Foreign tax withholding | (619,392 | ) | (77,706 | ) | |||||||
Total Income | 4,963,252 | 1,200,443 | |||||||||
Expenses: | |||||||||||
Investment advisory fees | 1,104,009 | 377,855 | |||||||||
Administration fees | 84,535 | 28,980 | |||||||||
Sub-Administration fees | 7,446 | 7,446 | |||||||||
12b-1 fees — Class A Shares | 25,838 | 41,826 | |||||||||
12b-1 fees — Class C Shares | 6,709 | 13,580 | |||||||||
12b-1 fees — Class R Shares | 5,569 | 8,161 | |||||||||
Custodian fees | 24,085 | 14,165 | |||||||||
Transfer agent fees — Class A Shares | 18,498 | 20,854 | |||||||||
Transfer agent fees — Class C Shares | 997 | 1,577 | |||||||||
Transfer agent fees — Class R Shares | 2,344 | 1,988 | |||||||||
Transfer agent fees — Class R6 Shares | 113 | 41 | |||||||||
Transfer agent fees — Class Y Shares | 43,950 | 29,379 | |||||||||
Trustees' fees | 10,649 | 3,834 | |||||||||
Compliance fees | 1,062 | 369 | |||||||||
Legal and audit fees | 15,312 | 9,749 | |||||||||
State registration and filing fees | 47,554 | 43,563 | |||||||||
Interfund lending fees | — | 32 | |||||||||
Other expenses | 26,949 | 13,609 | |||||||||
Total Expenses | 1,425,619 | 617,008 | |||||||||
Expenses waived/reimbursed by Adviser | (212,803 | ) | (269,550 | ) | |||||||
Net Expenses | 1,212,816 | 347,458 | |||||||||
Net Investment Income (Loss) | 3,750,436 | 852,985 | |||||||||
Realized/Unrealized Gains (Losses) from Investments: | |||||||||||
| Net realized gains (losses) from investment securities and foreign currency translations | (6,874,250 | ) | (2,106,714 | ) | |||||||
Foreign refunds (taxes) on realized gains | — | (506 | ) | ||||||||
| Net change in unrealized appreciation/depreciation on investment securities and foreign currency translations | (27,121,573 | ) | (2,723,017 | ) | |||||||
Net change in accrued foreign taxes on unrealized gains | — | (10,702 | ) | ||||||||
Net realized/unrealized gains (losses) on investments | (33,995,823 | ) | (4,840,939 | ) | |||||||
Change in net assets resulting from operations | $ | (30,245,387 | ) | $ | (3,987,954 | ) | |||||
See notes to financial statements.
35
Victory Portfolios | Statements of Operations For the Six Months Ended June30, 2020 | ||||||
(Unaudited)
| Victory Sophus Emerging Markets Fund | Victory Sophus Emerging Markets Small Cap Fund | ||||||||||
Investment Income: | |||||||||||
Dividends | $ | 3,314,318 | $ | 57,129 | |||||||
Interest | 10,203 | 354 | |||||||||
Securities lending (net of fees) | 7,782 | 483 | |||||||||
Foreign tax withholding | (281,584 | ) | (4,309 | ) | |||||||
Total Income | 3,050,719 | 53,657 | |||||||||
Expenses: | |||||||||||
Investment advisory fees | 1,687,543 | 30,876 | |||||||||
Administration fees | 103,045 | 1,511 | |||||||||
Sub-Administration fees | 7,446 | 7,446 | |||||||||
12b-1 fees — Class A Shares | 62,663 | 340 | |||||||||
12b-1 fees — Class C Shares | 19,806 | 570 | |||||||||
12b-1 fees — Class R Shares | 28,670 | — | |||||||||
Custodian fees | 116,995 | 25,707 | |||||||||
Transfer agent fees — Class A Shares | 44,219 | 271 | |||||||||
Transfer agent fees — Class C Shares | 3,490 | 125 | |||||||||
Transfer agent fees — Class R Shares | 10,052 | — | |||||||||
Transfer agent fees — Class R6 Shares | 729 | — | |||||||||
Transfer agent fees — Class Y Shares | 123,252 | 804 | |||||||||
Trustees' fees | 15,399 | 415 | |||||||||
Compliance fees | 1,461 | 21 | |||||||||
Legal and audit fees | 26,055 | 12,150 | |||||||||
State registration and filing fees | 45,033 | 22,839 | |||||||||
Interest expense on interfund lending | 111 | — | |||||||||
Other expenses | 50,899 | 12,069 | |||||||||
Total Expenses | 2,346,868 | 115,144 | |||||||||
Expenses waived/reimbursed by Adviser | (566,001 | ) | (77,202 | ) | |||||||
Net Expenses | 1,780,867 | 37,942 | |||||||||
Net Investment Income (Loss) | 1,269,852 | 15,715 | |||||||||
Realized/Unrealized Gains (Losses) from Investments: | |||||||||||
| Net realized gains (losses) from investment securities and foreign currency translations | (12,231,288 | ) | (302,041 | ) | |||||||
Foreign refunds (taxes) on realized gains | 50,088 | 7,999 | |||||||||
| Net change in unrealized appreciation/depreciation on investment securities and foreign currency translations | (39,821,162 | ) | (634,223 | ) | |||||||
Net change in accrued foreign taxes on unrealized gains | 110,426 | 2,288 | |||||||||
Net realized/unrealized gains (losses) on investments | (51,891,936 | ) | (925,977 | ) | |||||||
Change in net assets resulting from operations | $ | (50,622,084 | ) | $ | (910,262 | ) | |||||
See notes to financial statements.
36
Victory Portfolios | Statements of Changes in Net Assets | ||||||
| Victory RS International Fund | Victory RS Global Fund | ||||||||||||||||||
| Six Months Ended June 30, 2020 (unaudited) | Year Ended December 31, 2019 | Six Months Ended June 30, 2020 (unaudited) | Year Ended December 31, 2019 | ||||||||||||||||
From Investment Activities: | |||||||||||||||||||
Operations: | |||||||||||||||||||
Net investment income (loss) | $ | 3,750,436 | $ | 1,446,540 | $ | 852,985 | $ | 998,312 | |||||||||||
| Net realized gains (losses) from investments | (6,874,250 | ) | (113,975 | ) | (2,107,220 | ) | (626,741 | ) | |||||||||||
| Net change in unrealized appreciation/depreciation on investments | (27,121,573 | ) | 19,916,509 | (2,733,719 | ) | 13,988,831 | |||||||||||||
| Change in net assets resulting from operations | (30,245,387 | ) | 21,249,074 | (3,987,954 | ) | 14,360,402 | |||||||||||||
Distributions to Shareholders: | |||||||||||||||||||
Class A Shares | — | (14,432 | ) | — | (298,099 | ) | |||||||||||||
Class C Shares | — | (963 | ) | — | (18,415 | ) | |||||||||||||
Class R Shares | — | (1,332 | ) | — | (18,008 | ) | |||||||||||||
Class R6 Shares | — | (400,310 | ) | — | (1,870 | ) | |||||||||||||
Class Y Shares | — | (155,010 | ) | — | (719,354 | ) | |||||||||||||
| Change in net assets resulting from distributions to shareholders | — | (572,047 | ) | — | (1,055,746 | ) | |||||||||||||
| Change in net assets resulting from capital transactions | 54,844,947 | 235,953,255 | 32,321,157 | 35,779,871 | |||||||||||||||
Change in net assets | 24,599,560 | 256,630,282 | 28,333,203 | 49,084,527 | |||||||||||||||
Net Assets: | |||||||||||||||||||
Beginning of period | 280,813,215 | 24,182,933 | 84,601,688 | 35,517,161 | |||||||||||||||
End of period | $ | 305,412,775 | $ | 280,813,215 | $ | 112,934,891 | $ | 84,601,688 | |||||||||||
(continues on next page)
See notes to financial statements.
37
Victory Portfolios | Statements of Changes in Net Assets | ||||||
(continued)
| Victory RS International Fund | Victory RS Global Fund | ||||||||||||||||||
| Six Months Ended June 30, 2020 (unaudited) | Year Ended December 31, 2019 | Six Months Ended June 30, 2020 (unaudited) | Year Ended December 31, 2019 | ||||||||||||||||
Capital Transactions: | |||||||||||||||||||
Class A Shares | |||||||||||||||||||
Proceeds from shares issued | $ | 4,279,505 | $ | 6,373,842 | $ | 15,603,007 | $ | 20,850,831 | |||||||||||
Distributions reinvested | — | 14,244 | — | 297,840 | |||||||||||||||
Cost of shares redeemed | (2,263,520 | ) | (3,048,817 | ) | (3,272,963 | ) | (2,936,045 | ) | |||||||||||
Total Class A Shares | $ | 2,015,985 | $ | 3,339,269 | $ | 12,330,044 | $ | 18,212,626 | |||||||||||
Class C Shares | |||||||||||||||||||
Proceeds from shares issued | $ | 206,019 | $ | 819,811 | $ | 775,295 | $ | 795,903 | |||||||||||
Distributions reinvested | — | 960 | — | 17,374 | |||||||||||||||
Cost of shares redeemed | (178,728 | ) | (247,174 | ) | (917,827 | ) | (737,389 | ) | |||||||||||
Total Class C Shares | $ | 27,291 | $ | 573,597 | $ | (142,532 | ) | $ | 75,888 | ||||||||||
Class R Shares | |||||||||||||||||||
Proceeds from shares issued | $ | 308,489 | $ | 927,579 | $ | 1,802,297 | $ | 771,536 | |||||||||||
Distributions reinvested | — | 1,332 | — | 18,002 | |||||||||||||||
Cost of shares redeemed | (441,729 | ) | (477,688 | ) | (340,280 | ) | (869,410 | ) | |||||||||||
Total Class R Shares | $ | (133,240 | ) | $ | 451,223 | $ | 1,462,017 | $ | (79,872 | ) | |||||||||
Class R6 Shares | |||||||||||||||||||
Proceeds from shares issued | $ | 26,623,866 | $ | 173,919,837 | $ | 444,404 | $ | 116,672 | |||||||||||
Distributions reinvested | — | 397,374 | — | 1,870 | |||||||||||||||
Cost of shares redeemed | (6,820,763 | ) | (6,233,457 | ) | (43,777 | ) | — | ||||||||||||
Total Class R6 Shares | $ | 19,803,103 | $ | 168,083,754 | $ | 400,627 | $ | 118,542 | |||||||||||
Class Y Shares | |||||||||||||||||||
Proceeds from shares issued | $ | 55,397,902 | $ | 67,946,711 | $ | 31,478,456 | $ | 28,548,290 | |||||||||||
Distributions reinvested | — | 154,814 | — | 711,835 | |||||||||||||||
Cost of shares redeemed | (22,266,094 | ) | (4,596,113 | ) | (13,207,455 | ) | (11,807,438 | ) | |||||||||||
Total Class Y Shares | $ | 33,131,808 | $ | 63,505,412 | $ | 18,271,001 | $ | 17,452,687 | |||||||||||
| Change in net assets resulting from capital transactions | $ | 54,844,947 | $ | 235,953,255 | $ | 32,321,157 | $ | 35,779,871 | |||||||||||
(continues on next page)
See notes to financial statements.
38
Victory Portfolios | Statements of Changes in Net Assets | ||||||
(continued)
| Victory RS International Fund | Victory RS Global Fund | ||||||||||||||||||
| Six Months Ended June 30, 2020 (unaudited) | Year Ended December 31, 2019 | Six Months Ended June 30, 2020 (unaudited) | Year Ended December 31, 2019 | ||||||||||||||||
Share Transactions: | |||||||||||||||||||
Class A Shares | |||||||||||||||||||
Issued | 389,176 | 523,906 | 1,062,759 | 1,487,189 | |||||||||||||||
Reinvested | — | 1,104 | — | 20,145 | |||||||||||||||
Redeemed | (204,713 | ) | (253,679 | ) | (237,419 | ) | (220,393 | ) | |||||||||||
Total Class A Shares | 184,463 | 271,331 | 825,340 | 1,286,941 | |||||||||||||||
Class C Shares | |||||||||||||||||||
Issued | 24,088 | 95,902 | 56,473 | 59,708 | |||||||||||||||
Reinvested | — | 103 | — | 1,215 | |||||||||||||||
Redeemed | (21,652 | ) | (28,453 | ) | (69,746 | ) | (56,283 | ) | |||||||||||
Total Class C Shares | 2,436 | 67,552 | (13,273 | ) | 4,640 | ||||||||||||||
Class R Shares | |||||||||||||||||||
Issued | 29,667 | 83,638 | 102,679 | 45,802 | |||||||||||||||
Reinvested | — | 111 | — | 976 | |||||||||||||||
Redeemed | (43,015 | ) | (43,472 | ) | (20,272 | ) | (52,905 | ) | |||||||||||
Total Class R Shares | (13,348 | ) | 40,277 | 82,407 | (6,127 | ) | |||||||||||||
Class R6 Shares | |||||||||||||||||||
Issued | 2,881,700 | 17,284,970 | 44,414 | 10,988 | |||||||||||||||
Reinvested | — | 37,199 | — | 170 | |||||||||||||||
Redeemed | (726,048 | ) | (621,824 | ) | (4,349 | ) | — | ||||||||||||
Total Class R6 Shares | 2,155,652 | 16,700,345 | 40,065 | 11,158 | |||||||||||||||
Class Y Shares | |||||||||||||||||||
Issued | 4,790,176 | 5,719,982 | 2,330,806 | 2,167,090 | |||||||||||||||
Reinvested | — | 12,169 | — | 48,603 | |||||||||||||||
Redeemed | (2,025,981 | ) | (387,903 | ) | (1,029,889 | ) | (884,579 | ) | |||||||||||
Total Class Y Shares | 2,764,195 | 5,344,248 | 1,300,917 | 1,331,114 | |||||||||||||||
Change in Shares | 5,093,398 | 22,423,753 | 2,235,456 | 2,627,726 | |||||||||||||||
See notes to financial statements.
39
Victory Portfolios | Statements of Changes in Net Assets | ||||||
| Victory Sophus Emerging Markets Fund | Victory Sophus Emerging Markets Small Cap Fund | ||||||||||||||||||
| Six Months Ended June 30, 2020 (unaudited) | Year Ended December 31, 2019 | Six Months Ended June 30, 2020 (unaudited) | Year Ended December 31, 2019 | ||||||||||||||||
From Investment Activities: | |||||||||||||||||||
Operations: | |||||||||||||||||||
Net investment income (loss) | $ | 1,269,852 | $ | 8,164,402 | $ | 15,715 | $ | 61,545 | |||||||||||
| Net realized gains (losses) from investment transactions | (12,181,200 | ) | (6,776,933 | ) | (294,042 | ) | 118,618 | ||||||||||||
| Net change in unrealized appreciation/depreciation on investments | (39,710,736 | ) | 72,555,651 | (631,935 | ) | 785,941 | |||||||||||||
| Change in net assets resulting from operations | (50,622,084 | ) | 73,943,120 | (910,262 | ) | 966,104 | |||||||||||||
Distributions to Shareholders: | |||||||||||||||||||
Class A Shares | — | (277,823 | ) | — | (2,782 | ) | |||||||||||||
Class C Shares | — | — | — | (314 | ) | ||||||||||||||
Class R Shares | — | (39,217 | ) | — | — | ||||||||||||||
Class R6 Shares | — | (562,165 | ) | — | — | ||||||||||||||
Class Y Shares | — | (1,923,302 | ) | — | (56,360 | ) | |||||||||||||
| Change in net assets resulting from distributions to shareholders | — | (2,802,507 | ) | — | (59,456 | ) | |||||||||||||
| Change in net assets resulting from capital transactions | (41,881,831 | ) | 51,599,325 | 501,429 | 72,811 | ||||||||||||||
Change in net assets | (92,503,915 | ) | 122,739,938 | (408,833 | ) | 979,459 | |||||||||||||
Net Assets: | |||||||||||||||||||
Beginning of period | 409,568,743 | 286,828,805 | 5,315,339 | 4,335,880 | |||||||||||||||
End of period | $ | 317,064,828 | $ | 409,568,743 | $ | 4,906,506 | $ | 5,315,339 | |||||||||||
(continues on next page)
See notes to financial statements.
40
Victory Portfolios | Statements of Changes in Net Assets | ||||||
(continued)
| Victory Sophus Emerging Markets Fund | Victory Sophus Emerging Markets Small Cap Fund | ||||||||||||||||||
| Six Months Ended June 30, 2020 (unaudited) | Year Ended December 31, 2019 | Six Months Ended June 30, 2020 (unaudited) | Year Ended December 31, 2019 | ||||||||||||||||
Capital Transactions: | |||||||||||||||||||
Class A Shares | |||||||||||||||||||
Proceeds from shares issued | $ | 3,643,742 | $ | 9,482,029 | $ | 7,406 | $ | 32,131 | |||||||||||
Distributions reinvested | — | 271,641 | — | 2,782 | |||||||||||||||
Cost of shares redeemed | (10,316,305 | ) | (16,188,808 | ) | (26,807 | ) | (93,194 | ) | |||||||||||
Total Class A Shares | $ | (6,672,563 | ) | $ | (6,435,138 | ) | $ | (19,401 | ) | $ | (58,281 | ) | |||||||
Class C Shares | |||||||||||||||||||
Proceeds from shares issued | $ | 49,820 | $ | 530,542 | $ | — | $ | 18,900 | |||||||||||
Distributions reinvested | — | — | — | 314 | |||||||||||||||
Cost of shares redeemed | (2,247,956 | ) | (6,342,404 | ) | (10,204 | ) | (16,359 | ) | |||||||||||
Total Class C Shares | $ | (2,198,136 | ) | $ | (5,811,862 | ) | $ | (10,204 | ) | $ | 2,855 | ||||||||
Class R Shares | |||||||||||||||||||
Proceeds from shares issued | $ | 802,167 | $ | 1,606,429 | $ | — | $ | — | |||||||||||
Distributions reinvested | — | 39,076 | — | — | |||||||||||||||
Cost of shares redeemed | (1,685,752 | ) | (3,009,268 | ) | — | — | |||||||||||||
Total Class R Shares | $ | (883,585 | ) | $ | (1,363,763 | ) | $ | — | $ | — | |||||||||
Class R6 Shares | |||||||||||||||||||
Proceeds from shares issued | $ | 13,886,391 | $ | 44,467,648 | $ | — | $ | — | |||||||||||
Distributions reinvested | — | 562,165 | — | — | |||||||||||||||
Cost of shares redeemed | (12,551,969 | ) | (12,538,852 | ) | — | — | |||||||||||||
Total Class R6 Shares | $ | 1,334,422 | $ | 32,490,961 | $ | — | $ | — | |||||||||||
Class Y Shares | |||||||||||||||||||
Proceeds from shares issued | $ | 34,015,686 | $ | 111,480,099 | $ | 981,636 | $ | 944,047 | |||||||||||
Distributions reinvested | — | 1,893,634 | — | 56,360 | |||||||||||||||
Cost of shares redeemed | (67,477,655 | ) | (80,654,606 | ) | (450,602 | ) | (872,170 | ) | |||||||||||
Total Class Y Shares | $ | (33,461,969 | ) | $ | 32,719,127 | $ | 531,034 | $ | 128,237 | ||||||||||
| Change in net assets resulting from capital transactions | $ | (41,881,831 | ) | $ | 51,599,325 | $ | 501,429 | $ | 72,811 | ||||||||||
(continues on next page)
See notes to financial statements.
41
Victory Portfolios | Statements of Changes in Net Assets | ||||||
(continued)
| Victory Sophus Emerging Markets Fund | Victory Sophus Emerging Markets Small Cap Fund | ||||||||||||||||||
| Six Months Ended June 30, 2020 (unaudited) | Year Ended December 31, 2019 | Six Months Ended June 30, 2020 (unaudited) | Year Ended December 31, 2019 | ||||||||||||||||
Share Transactions: | |||||||||||||||||||
Class A Shares | |||||||||||||||||||
Issued | 192,833 | 497,792 | 1,562 | 4,925 | |||||||||||||||
Reinvested | — | 12,862 | — | 384 | |||||||||||||||
Redeemed | (551,636 | ) | (849,774 | ) | (4,619 | ) | (14,442 | ) | |||||||||||
Total Class A Shares | (358,803 | ) | (339,120 | ) | (3,057 | ) | (9,133 | ) | |||||||||||
Class C Shares | |||||||||||||||||||
Issued | 3,216 | 37,273 | — | 3,242 | |||||||||||||||
Reinvested | — | — | — | 48 | |||||||||||||||
Redeemed | (165,633 | ) | (450,593 | ) | (1,957 | ) | (2,616 | ) | |||||||||||
Total Class C Shares | (162,417 | ) | (413,320 | ) | (1,957 | ) | 674 | ||||||||||||
Class R Shares | |||||||||||||||||||
Issued | 47,404 | 89,819 | — | — | |||||||||||||||
Reinvested | — | 1,974 | — | — | |||||||||||||||
Redeemed | (95,936 | ) | (166,112 | ) | — | — | |||||||||||||
Total Class R Shares | (48,532 | ) | (74,319 | ) | — | — | |||||||||||||
Class R6 Shares | |||||||||||||||||||
Issued | 756,081 | 2,305,144 | — | — | |||||||||||||||
Reinvested | — | 26,252 | — | — | |||||||||||||||
Redeemed | (646,287 | ) | (654,118 | ) | — | — | |||||||||||||
Total Class R6 Shares | 109,794 | 1,677,278 | — | — | |||||||||||||||
Class Y Shares | |||||||||||||||||||
Issued | 1,812,373 | 5,878,564 | 138,973 | 142,497 | |||||||||||||||
Reinvested | — | 89,198 | — | 7,798 | |||||||||||||||
Redeemed | (3,852,146 | ) | (4,237,322 | ) | (74,948 | ) | (129,332 | ) | |||||||||||
Total Class Y Shares | (2,039,773 | ) | 1,730,440 | 64,025 | 20,963 | ||||||||||||||
Change in Shares | (2,499,731 | ) | 2,580,959 | 59,011 | 12,504 | ||||||||||||||
See notes to financial statements.
42
This page is intentionally left blank.
43
Victory Portfolios | Financial Highlights | ||||||
For a Share Outstanding Throughout Each Period
Investment Activities | Distributions to Shareholders From | ||||||||||||||||||||||||||||||
| Net Asset Value, Beginning of Period | Net Investment Income (Loss)(a) | Net Realized and Unrealized Gains (Losses) on Investments | Total from Investment Activities | Net Investment Income | Net Realized Gains from Investments | Total Distributions | |||||||||||||||||||||||||
Victory RS International Fund | |||||||||||||||||||||||||||||||
Class A | |||||||||||||||||||||||||||||||
| Six Months Ended 6/30/20 (unaudited) | $ | 12.93 | 0.14 | (1.52 | ) | (1.38 | ) | — | — | — | |||||||||||||||||||||
| Year Ended 12/31/19 | $ | 10.63 | 0.26 | 2.05 | 2.31 | — | (e) | (0.01 | ) | (0.01 | ) | ||||||||||||||||||||
| Year Ended 12/31/18 | $ | 12.12 | 0.23 | (1.52 | ) | (1.29 | ) | (0.20 | ) | — | (0.20 | ) | |||||||||||||||||||
| Year Ended 12/31/17 | $ | 9.84 | 0.19 | 2.29 | 2.48 | (0.20 | ) | — | (0.20 | ) | |||||||||||||||||||||
| Year Ended 12/31/16 | $ | 9.78 | 0.16 | (0.07 | ) | 0.09 | (0.17 | ) | — | (0.17 | ) | ||||||||||||||||||||
| Year Ended 12/31/15 | $ | 9.87 | 0.15 | (0.09 | ) | 0.06 | (0.15 | ) | — | (0.15 | ) | ||||||||||||||||||||
Class C | |||||||||||||||||||||||||||||||
| Six Months Ended 6/30/20 (unaudited) | $ | 9.36 | 0.07 | (1.10 | ) | (1.03 | ) | — | — | — | |||||||||||||||||||||
| Year Ended 12/31/19 | $ | 7.76 | 0.12 | 1.49 | 1.61 | — | (0.01 | ) | (0.01 | ) | |||||||||||||||||||||
| Year Ended 12/31/18 | $ | 8.89 | 0.11 | (1.11 | ) | (1.00 | ) | (0.13 | ) | — | (0.13 | ) | |||||||||||||||||||
| Year Ended 12/31/17 | $ | 7.26 | 0.08 | 1.68 | 1.76 | (0.13 | ) | — | (0.13 | ) | |||||||||||||||||||||
| Year Ended 12/31/16 | $ | 7.26 | 0.07 | (0.08 | ) | (0.01 | ) | (0.13 | ) | — | (0.13 | ) | |||||||||||||||||||
| Year Ended 12/31/15 | $ | 7.36 | 0.05 | (0.07 | ) | (0.02 | ) | (0.08 | ) | — | (0.08 | ) | |||||||||||||||||||
(a) Per share net investment income (loss) has been calculated using the average daily shares method.
(b) Not annualized for periods less than one year.
(c) Annualized for periods less than one year.
(d) Portfolio turnover is calculated on the basis of the Fund as a whole without distinguishing between the classes of shares issued.
(e) Amount is less than $0.005 per share.
(f) The Fund received monies related to a nonrecurring refund from the prior Custodian. The corresponding impact to the total return was 1.45% for the period shown. (See Note 8)
See notes to financial statements.
44
Victory Portfolios | Financial Highlights — continued | ||||||
For a Share Outstanding Throughout Each Period
Ratios to Average Net Assets | Supplemental Data | ||||||||||||||||||||||||||||||||||
| Capital Contribution from Prior Custodian, Net (See Note 8) | Net Asset Value, End of Period | Total Return (Excludes Sales Charge)(b) | Net Expenses(c) | Net Investment Income (Loss)(c) | Gross Expenses(c) | Net Assets, End of Period (000's) | Portfolio Turnover(b)(d) | ||||||||||||||||||||||||||||
Victory RS International Fund | |||||||||||||||||||||||||||||||||||
Class A | |||||||||||||||||||||||||||||||||||
| Six Months Ended 6/30/20 (unaudited) | — | $ | 11.55 | (10.67 | )% | 1.13 | % | 2.42 | % | 1.46 | % | $ | 22,345 | 24 | % | ||||||||||||||||||||
| Year Ended 12/31/19 | — | $ | 12.93 | 21.72 | % | 1.13 | % | 2.18 | % | 1.55 | % | $ | 22,620 | 20 | % | ||||||||||||||||||||
| Year Ended 12/31/18 | — | $ | 10.63 | (10.65 | )% | 1.13 | % | 1.97 | % | 1.61 | % | $ | 15,716 | 52 | % | ||||||||||||||||||||
| Year Ended 12/31/17 | — | $ | 12.12 | 25.26 | % | 1.20 | % | 1.66 | % | 1.81 | % | $ | 18,512 | 60 | % | ||||||||||||||||||||
| Year Ended 12/31/16 | 0.14 | $ | 9.84 | 2.41 | %(f) | 1.40 | % | 1.64 | % | 1.95 | % | $ | 16,799 | 103 | % | ||||||||||||||||||||
| Year Ended 12/31/15 | — | $ | 9.78 | 0.64 | % | 1.40 | % | 1.49 | % | 1.89 | % | $ | 19,416 | 117 | % | ||||||||||||||||||||
Class C | |||||||||||||||||||||||||||||||||||
| Six Months Ended 6/30/20 (unaudited) | — | $ | 8.33 | (11.00 | )% | 1.88 | % | 1.72 | % | 3.06 | % | $ | 1,338 | 24 | % | ||||||||||||||||||||
| Year Ended 12/31/19 | — | $ | 9.36 | 20.70 | % | 1.88 | % | 1.39 | % | 3.14 | % | $ | 1,480 | 20 | % | ||||||||||||||||||||
| Year Ended 12/31/18 | — | $ | 7.76 | (11.24 | )% | 1.88 | % | 1.23 | % | 3.52 | % | $ | 702 | 52 | % | ||||||||||||||||||||
| Year Ended 12/31/17 | — | $ | 8.89 | 24.25 | % | 1.95 | % | 0.92 | % | 3.26 | % | $ | 1,066 | 60 | % | ||||||||||||||||||||
| Year Ended 12/31/16 | 0.14 | $ | 7.26 | 1.77 | %(f) | 2.15 | % | 0.97 | % | 3.05 | % | $ | 1,228 | 103 | % | ||||||||||||||||||||
| Year Ended 12/31/15 | — | $ | 7.26 | (0.27 | )% | 2.27 | % | 0.65 | % | 2.82 | % | $ | 1,969 | 117 | % | ||||||||||||||||||||
(continues on next page)
See notes to financial statements.
45
Victory Portfolios | Financial Highlights | ||||||
For a Share Outstanding Throughout Each Period
Investment Activities | Distributions to Shareholders From | ||||||||||||||||||||||||||||||
| Net Asset Value, Beginning of Period | Net Investment Income (Loss)(a) | Net Realized and Unrealized Gains (Losses) on Investments | Total from Investment Activities | Net Investment Income | Net Realized Gains from Investments | Total Distributions | |||||||||||||||||||||||||
Victory RS International Fund | |||||||||||||||||||||||||||||||
Class R | |||||||||||||||||||||||||||||||
| Six Months Ended 6/30/20 (unaudited) | $ | 12.07 | 0.11 | (1.41 | ) | (1.30 | ) | — | — | — | |||||||||||||||||||||
| Year Ended 12/31/19 | $ | 9.95 | 0.21 | 1.92 | 2.13 | — | (0.01 | ) | (0.01 | ) | |||||||||||||||||||||
| Year Ended 12/31/18 | $ | 11.35 | 0.19 | (1.42 | ) | (1.23 | ) | (0.17 | ) | — | (0.17 | ) | |||||||||||||||||||
| Year Ended 12/31/17 | $ | 9.23 | 0.15 | 2.14 | 2.29 | (0.17 | ) | — | (0.17 | ) | |||||||||||||||||||||
| Year Ended 12/31/16 | $ | 9.18 | 0.11 | (0.06 | ) | 0.05 | (0.14 | ) | — | (0.14 | ) | ||||||||||||||||||||
| Year Ended 12/31/15 | $ | 9.27 | 0.11 | (0.09 | ) | 0.02 | (0.11 | ) | — | (0.11 | ) | ||||||||||||||||||||
Class R6 | |||||||||||||||||||||||||||||||
| Six Months Ended 6/30/20 (unaudited) | $ | 10.70 | 0.13 | (1.25 | ) | (1.12 | ) | — | — | — | |||||||||||||||||||||
| May 2, 2019(g) through 12/31/19 | $ | 10.00 | 0.06 | 0.67 | 0.73 | (0.02 | ) | (0.01 | ) | (0.03 | ) | ||||||||||||||||||||
Class Y | |||||||||||||||||||||||||||||||
| Six Months Ended 6/30/20 (unaudited) | $ | 12.74 | 0.15 | (1.49 | ) | (1.34 | ) | — | — | — | |||||||||||||||||||||
| Year Ended 12/31/19 | $ | 10.47 | 0.22 | 2.08 | 2.30 | (0.02 | ) | (0.01 | ) | (0.03 | ) | ||||||||||||||||||||
| Year Ended 12/31/18 | $ | 11.93 | 0.23 | (1.47 | ) | (1.24 | ) | (0.22 | ) | — | (0.22 | ) | |||||||||||||||||||
| Year Ended 12/31/17 | $ | 9.69 | 0.22 | 2.26 | 2.48 | (0.24 | ) | — | (0.24 | ) | |||||||||||||||||||||
| Year Ended 12/31/16 | $ | 9.62 | 0.18 | (0.06 | ) | 0.12 | (0.19 | ) | — | (0.19 | ) | ||||||||||||||||||||
| Year Ended 12/31/15 | $ | 9.70 | 0.18 | (0.09 | ) | 0.09 | (0.17 | ) | — | (0.17 | ) | ||||||||||||||||||||
(a) Per share net investment income (loss) has been calculated using the average daily shares method.
(b) Not annualized for periods less than one year.
(c) Annualized for periods less than one year.
(d) Portfolio turnover is calculated on the basis of the Fund as a whole without distinguishing between the classes of shares issued.
(e) Amount is less than $0.005 per share.
(f) The Fund received monies related to a nonrecurring refund from the prior Custodian. The corresponding impact to the total return was 1.45% for the period shown. (See Note 8)
(g) Commencement of operations.
See notes to financial statements.
46
Victory Portfolios | Financial Highlights — continued | ||||||
For a Share Outstanding Throughout Each Period (continued)
Ratios to Average Net Assets | Supplemental Data | ||||||||||||||||||||||||||||||||||
| Capital Contribution from Prior Custodian, Net (See Note 8) | Net Asset Value, End of Period | Total Return (Excludes Sales Charge)(b) | Net Expenses(c) | Net Investment Income (Loss)(c) | Gross Expenses(c) | Net Assets, End of Period (000's) | Portfolio Turnover(b)(d) | ||||||||||||||||||||||||||||
Victory RS International Fund | |||||||||||||||||||||||||||||||||||
Class R | |||||||||||||||||||||||||||||||||||
| Six Months Ended 6/30/20 (unaudited) | — | $ | 10.77 | (10.77 | )% | 1.38 | % | 2.15 | % | 2.25 | % | $ | 2,223 | 24 | % | ||||||||||||||||||||
| Year Ended 12/31/19 | — | $ | 12.07 | 21.37 | % | 1.38 | % | 1.87 | % | 2.32 | % | $ | 2,652 | 20 | % | ||||||||||||||||||||
| Year Ended 12/31/18 | — | $ | 9.95 | (10.85 | )% | 1.38 | % | 1.73 | % | 2.31 | % | $ | 1,786 | 52 | % | ||||||||||||||||||||
| Year Ended 12/31/17 | — | $ | 11.35 | 24.85 | % | 1.48 | % | 1.39 | % | 2.48 | % | $ | 2,522 | 60 | % | ||||||||||||||||||||
| Year Ended 12/31/16 | 0.14 | $ | 9.23 | 2.06 | %(f) | 1.80 | % | 1.26 | % | 2.29 | % | $ | 2,279 | 103 | % | ||||||||||||||||||||
| Year Ended 12/31/15 | — | $ | 9.18 | 0.22 | % | 1.86 | % | 1.10 | % | 2.28 | % | $ | 2,707 | 117 | % | ||||||||||||||||||||
Class R6 | |||||||||||||||||||||||||||||||||||
| Six Months Ended 6/30/20 (unaudited) | — | $ | 9.58 | (10.47 | )% | 0.83 | % | 2.74 | % | 0.94 | % | $ | 180,566 | 24 | % | ||||||||||||||||||||
| May 2, 2019(g) through 12/31/19 | — | $ | 10.70 | 7.24 | % | 0.83 | % | 0.92 | % | 0.97 | % | $ | 178,695 | 20 | % | ||||||||||||||||||||
Class Y | |||||||||||||||||||||||||||||||||||
| Six Months Ended 6/30/20 (unaudited) | — | $ | 11.40 | (10.52 | )% | 0.88 | % | 2.77 | % | 1.05 | % | $ | 98,941 | 24 | % | ||||||||||||||||||||
| Year Ended 12/31/19 | — | $ | 12.74 | 21.94 | % | 0.88 | % | 1.80 | % | 1.16 | % | $ | 75,366 | 20 | % | ||||||||||||||||||||
| Year Ended 12/31/18 | — | $ | 10.47 | (10.38 | )% | 0.88 | % | 1.97 | % | 1.62 | % | $ | 5,979 | 52 | % | ||||||||||||||||||||
| Year Ended 12/31/17 | — | $ | 11.93 | 25.56 | % | 0.94 | % | 1.98 | % | 1.85 | % | $ | 3,122 | 60 | % | ||||||||||||||||||||
| Year Ended 12/31/16 | 0.14 | $ | 9.69 | 2.69 | %(f) | 1.15 | % | 1.93 | % | 1.80 | % | $ | 2,626 | 103 | % | ||||||||||||||||||||
| Year Ended 12/31/15 | — | $ | 9.62 | 0.92 | % | 1.15 | % | 1.76 | % | 1.75 | % | $ | 3,904 | 117 | % | ||||||||||||||||||||
See notes to financial statements.
47
Victory Portfolios | Financial Highlights | ||||||
For a Share Outstanding Throughout Each Period
Investment Activities | Distributions to Shareholders From | ||||||||||||||||||||||||||||||
| Net Asset Value, Beginning of Period | Net Investment Income (Loss)(a) | Net Realized and Unrealized Gains (Losses) on Investments | Total from Investment Activities | Net Investment Income | Net Realized Gains from Investments | Return of Capital | |||||||||||||||||||||||||
Victory RS Global Fund | |||||||||||||||||||||||||||||||
Class A | |||||||||||||||||||||||||||||||
| Six Months Ended 6/30/20 (unaudited) | $ | 14.86 | 0.12 | (0.74 | ) | (0.62 | ) | — | — | — | |||||||||||||||||||||
| Year Ended 12/31/19 | $ | 11.53 | 0.21 | 3.29 | 3.50 | (0.16 | ) | (0.01 | ) | — | |||||||||||||||||||||
| Year Ended 12/31/18 | $ | 12.75 | 0.20 | (0.90 | ) | (0.70 | ) | (0.16 | ) | (0.36 | ) | — | |||||||||||||||||||
| Year Ended 12/31/17 | $ | 11.16 | 0.15 | 2.53 | 2.68 | — | (1.00 | ) | (0.09 | ) | |||||||||||||||||||||
| Year Ended 12/31/16 | $ | 11.56 | 0.13 | 0.65 | 0.78 | (0.03 | ) | (1.15 | ) | — | |||||||||||||||||||||
| Year Ended 12/31/15 | $ | 11.56 | 0.11 | 0.32 | 0.43 | (0.11 | ) | (0.32 | ) | — | |||||||||||||||||||||
Class C | |||||||||||||||||||||||||||||||
| Six Months Ended 6/30/20 (unaudited) | $ | 14.38 | 0.06 | (0.72 | ) | (0.66 | ) | — | — | — | |||||||||||||||||||||
| Year Ended 12/31/19 | $ | 11.17 | 0.14 | 3.16 | 3.30 | (0.08 | ) | (0.01 | ) | — | |||||||||||||||||||||
| Year Ended 12/31/18 | $ | 12.38 | 0.10 | (0.87 | ) | (0.77 | ) | (0.08 | ) | (0.36 | ) | — | |||||||||||||||||||
| Year Ended 12/31/17 | $ | 10.95 | 0.05 | 2.47 | 2.52 | — | (1.00 | ) | (0.09 | ) | |||||||||||||||||||||
| Year Ended 12/31/16 | $ | 11.42 | 0.05 | 0.63 | 0.68 | — | (1.15 | ) | — | ||||||||||||||||||||||
| Year Ended 12/31/15 | $ | 11.43 | 0.01 | 0.32 | 0.33 | (0.02 | ) | (0.32 | ) | — | |||||||||||||||||||||
(a) Per share net investment income (loss) has been calculated using the average daily shares method.
(b) Not annualized for periods less than one year.
(c) Annualized for periods less than one year.
(d) Portfolio turnover is calculated on the basis of the Fund as a whole without distinguishing between the classes of shares issued.
(e) During the period, the share class recognized certain expense reimbursements and due to the fluctuation in average net assets during the same period the total return reflected is significantly higher than the other share classes of the Fund. The total return would have been 6.39% had the expense reimbursements not occurred.
See notes to financial statements.
48
Victory Portfolios | Financial Highlights — continued | ||||||
For a Share Outstanding Throughout Each Period
Ratios to Average Net Assets | Supplemental Data | ||||||||||||||||||||||||||||||||||
Total Distributions | Net Asset Value, End of Period | Total Return (Excludes Sales Charge)(b) | Net Expenses(c) | Net Investment Income (Loss)(c) | Gross Expenses(c) | Net Assets, End of Period (000's) | Portfolio Turnover(b)(d) | ||||||||||||||||||||||||||||
Victory RS Global Fund | |||||||||||||||||||||||||||||||||||
Class A | |||||||||||||||||||||||||||||||||||
| Six Months Ended 6/30/20 (unaudited) | — | $ | 14.24 | (4.17 | )% | 0.85 | % | 1.71 | % | 1.38 | % | $ | 37,113 | 30 | % | ||||||||||||||||||||
| Year Ended 12/31/19 | (0.17 | ) | $ | 14.86 | 30.36 | % | 0.85 | % | 1.51 | % | 1.53 | % | $ | 26,471 | 46 | % | |||||||||||||||||||
| Year Ended 12/31/18 | (0.52 | ) | $ | 11.53 | (5.45 | )% | 0.94 | % | 1.51 | % | 1.75 | % | $ | 5,695 | 58 | % | |||||||||||||||||||
| Year Ended 12/31/17 | (1.09 | ) | $ | 12.75 | 24.48 | % | 1.17 | % | 1.24 | % | 1.90 | % | $ | 3,456 | 187 | % | |||||||||||||||||||
| Year Ended 12/31/16 | (1.18 | ) | $ | 11.16 | 6.67 | % | 1.40 | % | 1.12 | % | 1.71 | % | $ | 5,366 | 184 | % | |||||||||||||||||||
| Year Ended 12/31/15 | (0.43 | ) | $ | 11.56 | 3.68 | % | 1.36 | % | 0.90 | % | 1.57 | % | $ | 13,857 | 90 | % | |||||||||||||||||||
Class C | |||||||||||||||||||||||||||||||||||
| Six Months Ended 6/30/20 (unaudited) | — | $ | 13.72 | (4.59 | )% | 1.60 | % | 0.91 | % | 2.59 | % | $ | 2,777 | 30 | % | ||||||||||||||||||||
| Year Ended 12/31/19 | (0.09 | ) | $ | 14.38 | 29.52 | % | 1.60 | % | 1.07 | % | 2.59 | % | $ | 3,101 | 46 | % | |||||||||||||||||||
| Year Ended 12/31/18 | (0.44 | ) | $ | 11.17 | (6.20 | )% | 1.70 | % | 0.79 | % | 2.59 | % | $ | 2,358 | 58 | % | |||||||||||||||||||
| Year Ended 12/31/17 | (1.09 | ) | $ | 12.38 | 23.47 | % | 1.91 | % | 0.41 | % | 3.00 | % | $ | 2,167 | 187 | % | |||||||||||||||||||
| Year Ended 12/31/16 | (1.15 | ) | $ | 10.95 | 5.92 | % | 2.16 | % | 0.41 | % | 2.44 | % | $ | 1,270 | 184 | % | |||||||||||||||||||
| Year Ended 12/31/15 | (0.34 | ) | $ | 11.42 | 2.85 | % | 2.17 | % | 0.11 | % | 2.38 | % | $ | 7,367 | 90 | % | |||||||||||||||||||
(continues on next page)
See notes to financial statements.
49
Victory Portfolios | Financial Highlights | ||||||
For a Share Outstanding Throughout Each Period
Investment Activities | Distributions to Shareholders From | ||||||||||||||||||||||||||||||
| Net Asset Value, Beginning of Period | Net Investment Income (Loss)(a) | Net Realized and Unrealized Gains (Losses) on Investments | Total from Investment Activities | Net Investment Income | Net Realized Gains from Investments | Return of Capital | |||||||||||||||||||||||||
Victory RS Global Fund | |||||||||||||||||||||||||||||||
Class R | |||||||||||||||||||||||||||||||
| Six Months Ended 6/30/20 (unaudited) | $ | 18.55 | 0.12 | (0.92 | ) | (0.80 | ) | — | — | — | |||||||||||||||||||||
| Year Ended 12/31/19 | $ | 14.37 | 0.25 | 4.07 | 4.32 | (0.13 | ) | (0.01 | ) | — | |||||||||||||||||||||
| Year Ended 12/31/18 | $ | 15.76 | 0.20 | (1.10 | ) | (0.90 | ) | (0.13 | ) | (0.36 | ) | — | |||||||||||||||||||
| Year Ended 12/31/17 | $ | 13.62 | 0.05 | 3.18 | 3.23 | — | (1.00 | ) | (0.09 | ) | |||||||||||||||||||||
| Year Ended 12/31/16 | $ | 11.50 | 0.09 | 3.43 | 3.52 | (0.25 | ) | (1.15 | ) | — | |||||||||||||||||||||
| Year Ended 12/31/15 | $ | 11.50 | 0.06 | 0.32 | 0.38 | (0.06 | ) | (0.32 | ) | — | |||||||||||||||||||||
Class R6 | |||||||||||||||||||||||||||||||
| Six Months Ended 6/30/20 (unaudited) | $ | 11.07 | 0.11 | (0.56 | ) | (0.45 | ) | — | — | — | |||||||||||||||||||||
| May 2, 2019(f) through 12/31/19 | $ | 10.00 | 0.13 | 1.12 | 1.25 | (0.17 | ) | (0.01 | ) | — | |||||||||||||||||||||
Class Y | |||||||||||||||||||||||||||||||
| Six Months Ended 6/30/20 (unaudited) | $ | 14.72 | 0.13 | (0.73 | ) | (0.60 | ) | — | — | — | |||||||||||||||||||||
| Year Ended 12/31/19 | $ | 11.42 | 0.26 | 3.24 | 3.50 | (0.19 | ) | (0.01 | ) | — | |||||||||||||||||||||
| Year Ended 12/31/18 | $ | 12.63 | 0.23 | (0.89 | ) | (0.66 | ) | (0.19 | ) | (0.36 | ) | — | |||||||||||||||||||
| Year Ended 12/31/17 | $ | 11.04 | 0.18 | 2.50 | 2.68 | — | (1.00 | ) | (0.09 | ) | |||||||||||||||||||||
| Year Ended 12/31/16 | $ | 11.60 | 0.15 | 0.67 | 0.82 | (0.23 | ) | (1.15 | ) | — | |||||||||||||||||||||
| Year Ended 12/31/15 | $ | 11.59 | 0.15 | 0.31 | 0.46 | (0.13 | ) | (0.32 | ) | — | |||||||||||||||||||||
(a) Per share net investment income (loss) has been calculated using the average daily shares method.
(b) Not annualized for periods less than one year.
(c) Annualized for periods less than one year.
(d) Portfolio turnover is calculated on the basis of the Fund as a whole without distinguishing between the classes of shares issued.
(e) During the period, the share class recognized certain expense reimbursements and due to the fluctuation in average net assets during the same period the total return reflected is significantly higher than the other share classes of the Fund. The total return would have been 6.39% had the expense reimbursements not occurred.
(f) Commencement of operations.
See notes to financial statements.
50
Victory Portfolios | Financial Highlights — continued | ||||||
For a Share Outstanding Throughout Each Period (continued)
Ratios to Average Net Assets | Supplemental Data | ||||||||||||||||||||||||||||||||||
Total Distributions | Net Asset Value, End of Period | Total Return (Excludes Sales Charge)(b) | Net Expenses(c) | Net Investment Income (Loss)(c) | Gross Expenses(c) | Net Assets, End of Period (000's) | Portfolio Turnover(b)(d) | ||||||||||||||||||||||||||||
Victory RS Global Fund | |||||||||||||||||||||||||||||||||||
Class R | |||||||||||||||||||||||||||||||||||
| Six Months Ended 6/30/20 (unaudited) | — | $ | 17.75 | (4.31 | )% | 1.10 | % | 1.45 | % | 1.99 | % | $ | 3,726 | 30 | % | ||||||||||||||||||||
| Year Ended 12/31/19 | (0.14 | ) | $ | 18.55 | 30.10 | % | 1.10 | % | 1.53 | % | 2.34 | % | $ | 2,365 | 46 | % | |||||||||||||||||||
| Year Ended 12/31/18 | (0.49 | ) | $ | 14.37 | (5.68 | )% | 1.20 | % | 1.25 | % | 2.34 | % | $ | 1,920 | 58 | % | |||||||||||||||||||
| Year Ended 12/31/17 | (1.09 | ) | $ | 15.76 | 24.09 | % | 1.61 | % | 0.38 | % | 2.76 | % | $ | 2,281 | 187 | % | |||||||||||||||||||
| Year Ended 12/31/16 | (1.40 | ) | $ | 13.62 | 30.57 | %(e) | 1.68 | % | 0.74 | % | 1.81 | % | $ | 9,213 | 184 | % | |||||||||||||||||||
| Year Ended 12/31/15 | (0.38 | ) | $ | 11.50 | 3.23 | % | 1.78 | % | 0.50 | % | 2.00 | % | $ | 5,265 | 90 | % | |||||||||||||||||||
Class R6 | |||||||||||||||||||||||||||||||||||
| Six Months Ended 6/30/20 (unaudited) | — | $ | 10.62 | (4.07 | )% | 0.55 | % | 2.09 | % | 12.18 | % | $ | 544 | 30 | % | ||||||||||||||||||||
| May 2, 2019(f) through 12/31/19 | (0.18 | ) | $ | 11.07 | 12.47 | % | 0.55 | % | 1.85 | % | 28.85 | % | $ | 124 | 46 | % | |||||||||||||||||||
Class Y | |||||||||||||||||||||||||||||||||||
| Six Months Ended 6/30/20 (unaudited) | — | $ | 14.12 | (4.08 | )% | 0.60 | % | 1.93 | % | 1.11 | % | $ | 68,774 | 30 | % | ||||||||||||||||||||
| Year Ended 12/31/19 | (0.20 | ) | $ | 14.72 | 30.69 | % | 0.60 | % | 1.95 | % | 1.17 | % | $ | 52,541 | 46 | % | |||||||||||||||||||
| Year Ended 12/31/18 | (0.55 | ) | $ | 11.42 | (5.17 | )% | 0.70 | % | 1.80 | % | 1.20 | % | $ | 25,544 | 58 | % | |||||||||||||||||||
| Year Ended 12/31/17 | (1.09 | ) | $ | 12.63 | 24.75 | % | 0.88 | % | 1.44 | % | 1.32 | % | $ | 24,657 | 187 | % | |||||||||||||||||||
| Year Ended 12/31/16 | (1.38 | ) | $ | 11.04 | 7.01 | % | 1.09 | % | 1.30 | % | 1.36 | % | $ | 13,430 | 184 | % | |||||||||||||||||||
| Year Ended 12/31/15 | (0.45 | ) | $ | 11.60 | 3.96 | % | 1.09 | % | 1.21 | % | 1.36 | % | $ | 15,871 | 90 | % | |||||||||||||||||||
See notes to financial statements.
51
Victory Portfolios | Financial Highlights | ||||||
For a Share Outstanding Throughout Each Period
Investment Activities | Distributions to Shareholders From | ||||||||||||||||||||||||||||||
| Net Asset Value, Beginning of Period | Net Investment Income (Loss)(a) | Net Realized and Unrealized Gains (Losses) on Investments | Total from Investment Activities | Net Investment Income | Net Realized Gains from Investments | Total Distributions | |||||||||||||||||||||||||
Victory Sophus Emerging Markets Fund | |||||||||||||||||||||||||||||||
Class A | |||||||||||||||||||||||||||||||
| Six Months Ended 6/30/20 (unaudited) | $ | 21.37 | 0.04 | (2.45 | ) | (2.41 | ) | — | — | — | |||||||||||||||||||||
| Year Ended 12/31/19 | $ | 17.45 | 0.37 | 3.65 | 4.02 | (0.10 | ) | — | (0.10 | ) | |||||||||||||||||||||
| Year Ended 12/31/18 | $ | 22.52 | 0.24 | (4.54 | ) | (4.30 | ) | (0.13 | ) | (0.64 | ) | (0.77 | ) | ||||||||||||||||||
| Year Ended 12/31/17 | $ | 15.98 | 0.16 | 6.55 | 6.71 | (0.17 | ) | — | (0.17 | ) | |||||||||||||||||||||
| Year Ended 12/31/16 | $ | 14.60 | 0.11 | 1.38 | 1.49 | (0.15 | ) | — | (0.15 | ) | |||||||||||||||||||||
| Year Ended 12/31/15 | $ | 17.22 | 0.10 | (2.33 | ) | (2.23 | ) | — | (0.39 | ) | (0.39 | ) | |||||||||||||||||||
Class C | |||||||||||||||||||||||||||||||
| Six Months Ended 6/30/20 (unaudited) | $ | 15.94 | (0.04 | ) | (1.81 | ) | (1.85 | ) | — | — | — | ||||||||||||||||||||
| Year Ended 12/31/19 | $ | 13.06 | 0.14 | 2.74 | 2.88 | — | — | — | |||||||||||||||||||||||
| Year Ended 12/31/18 | $ | 17.07 | 0.05 | (3.42 | ) | (3.37 | ) | — | (f) | (0.64 | ) | (0.64 | ) | ||||||||||||||||||
| Year Ended 12/31/17 | $ | 12.17 | — | (f) | 4.97 | 4.97 | (0.07 | ) | — | (0.07 | ) | ||||||||||||||||||||
| Year Ended 12/31/16 | $ | 11.20 | (0.01 | ) | 1.05 | 1.04 | (0.11 | ) | — | (0.11 | ) | ||||||||||||||||||||
| Year Ended 12/31/15 | $ | 13.43 | (0.02 | ) | (1.82 | ) | (1.84 | ) | — | (0.39 | ) | (0.39 | ) | ||||||||||||||||||
(a) Per share net investment income (loss) has been calculated using the average daily shares method.
(b) Not annualized for periods less than one year.
(c) Annualized for periods less than one year.
(d) Portfolio turnover is calculated on the basis of the Fund as a whole without distinguishing between the classes of shares issued.
(e) The Fund received monies related to a nonrecurring refund from the prior Custodian. The corresponding impact to the total return was 1.45% for the period shown. (See Note 8)
(f) Amount is less than $0.005 per share.
(g) Amount is less than 0.005%.
See notes to financial statements.
52
Victory Portfolios | Financial Highlights — continued | ||||||
For a Share Outstanding Throughout Each Period
Ratios to Average Net Assets | Supplemental Data | ||||||||||||||||||||||||||||||||||
| Capital Contribution from Prior Custodian, Net (See Note 8) | Net Asset Value, End of Period | Total Return (Excludes Sales Charge)(b) | Net Expenses(c) | Net Investment Income (Loss)(c) | Gross Expenses(c) | Net Assets, End of Period (000's) | Portfolio Turnover(b)(d) | ||||||||||||||||||||||||||||
Victory Sophus Emerging Markets Fund | |||||||||||||||||||||||||||||||||||
Class A | |||||||||||||||||||||||||||||||||||
| Six Months Ended 6/30/20 (unaudited) | — | $ | 18.96 | (11.24 | )% | 1.34 | % | 0.47 | % | 1.66 | % | $ | 48,507 | 51 | % | ||||||||||||||||||||
| Year Ended 12/31/19 | — | $ | 21.37 | 22.96 | % | 1.34 | % | 1.95 | % | 1.62 | % | $ | 62,346 | 96 | % | ||||||||||||||||||||
| Year Ended 12/31/18 | — | $ | 17.45 | (19.08 | )% | 1.34 | % | 1.11 | % | 1.61 | % | $ | 56,823 | 118 | % | ||||||||||||||||||||
| Year Ended 12/31/17 | — | $ | 22.52 | 42.08 | % | 1.54 | % | 0.80 | % | 1.66 | % | $ | 76,485 | 113 | % | ||||||||||||||||||||
| Year Ended 12/31/16 | 0.04 | $ | 15.98 | 10.50 | %(e) | 1.65 | % | 0.73 | % | 1.67 | % | $ | 61,767 | 120 | % | ||||||||||||||||||||
| Year Ended 12/31/15 | — | $ | 14.60 | (12.94 | )% | 1.57 | % | 0.60 | % | 1.57 | % | $ | 74,837 | 111 | % | ||||||||||||||||||||
Class C | |||||||||||||||||||||||||||||||||||
| Six Months Ended 6/30/20 (unaudited) | — | $ | 14.09 | (11.61 | )% | 2.14 | % | (0.55 | )% | 2.71 | % | $ | 2,825 | 51 | % | ||||||||||||||||||||
| Year Ended 12/31/19 | — | $ | 15.94 | 22.05 | % | 2.14 | % | 0.99 | % | 2.48 | % | $ | 5,787 | 96 | % | ||||||||||||||||||||
| Year Ended 12/31/18 | — | $ | 13.06 | (19.75 | )% | 2.14 | % | 0.31 | % | 2.40 | % | $ | 10,141 | 118 | % | ||||||||||||||||||||
| Year Ended 12/31/17 | — | $ | 17.07 | 40.96 | % | 2.34 | % | — | %(g) | 2.46 | % | $ | 15,854 | 113 | % | ||||||||||||||||||||
| Year Ended 12/31/16 | 0.04 | $ | 12.17 | 9.62 | %(e) | 2.45 | % | (0.09 | )% | 2.48 | % | $ | 12,273 | 120 | % | ||||||||||||||||||||
| Year Ended 12/31/15 | — | $ | 11.20 | (13.68 | )% | 2.38 | % | (0.19 | )% | 2.38 | % | $ | 15,096 | 111 | % | ||||||||||||||||||||
(continues on next page)
See notes to financial statements.
53
Victory Portfolios | Financial Highlights | ||||||
For a Share Outstanding Throughout Each Period
Investment Activities | Distributions to Shareholders From | ||||||||||||||||||||||||||||||
| Net Asset Value, Beginning of Period | Net Investment Income (Loss)(a) | Net Realized and Unrealized Gains (Losses) on Investments | Total from Investment Activities | Net Investment Income | Net Realized Gains from Investments | Total Distributions | |||||||||||||||||||||||||
Victory Sophus Emerging Markets Fund | |||||||||||||||||||||||||||||||
Class R | |||||||||||||||||||||||||||||||
| Six Months Ended 6/30/20 (unaudited) | $ | 20.03 | 0.02 | (2.30 | ) | (2.28 | ) | — | — | — | |||||||||||||||||||||
| Year Ended 12/31/19 | $ | 16.37 | 0.31 | 3.41 | 3.72 | (0.06 | ) | — | (0.06 | ) | |||||||||||||||||||||
| Year Ended 12/31/18 | $ | 21.18 | 0.18 | (4.26 | ) | (4.08 | ) | (0.09 | ) | (0.64 | ) | (0.73 | ) | ||||||||||||||||||
| Year Ended 12/31/17 | $ | 15.03 | 0.09 | 6.17 | 6.26 | (0.11 | ) | — | (0.11 | ) | |||||||||||||||||||||
| Year Ended 12/31/16 | $ | 13.76 | 0.07 | 1.30 | 1.37 | (0.14 | ) | — | (0.14 | ) | |||||||||||||||||||||
| Year Ended 12/31/15 | $ | 16.31 | 0.05 | (2.21 | ) | (2.16 | ) | — | (0.39 | ) | (0.39 | ) | |||||||||||||||||||
Class R6 | |||||||||||||||||||||||||||||||
| Six Months Ended 6/30/20 (unaudited) | $ | 21.68 | 0.10 | (2.50 | ) | (2.40 | ) | — | — | — | |||||||||||||||||||||
| Year Ended 12/31/19 | $ | 17.68 | 0.52 | 3.65 | 4.17 | (0.17 | ) | — | (0.17 | ) | |||||||||||||||||||||
| Year Ended 12/31/18 | $ | 22.81 | 0.34 | (4.62 | ) | (4.28 | ) | (0.21 | ) | (0.64 | ) | (0.85 | ) | ||||||||||||||||||
| Year Ended 12/31/17 | $ | 16.16 | 0.34 | 6.57 | 6.91 | (0.26 | ) | — | (0.26 | ) | |||||||||||||||||||||
| November 15, 2016(h) through 12/31/16 | $ | 15.91 | 0.04 | 0.25 | 0.29 | (0.04 | ) | — | (0.04 | ) | |||||||||||||||||||||
Class Y | |||||||||||||||||||||||||||||||
| Six Months Ended 6/30/20 (unaudited) | $ | 21.48 | 0.07 | (2.46 | ) | (2.39 | ) | — | — | — | |||||||||||||||||||||
| Year Ended 12/31/19 | $ | 17.54 | 0.45 | 3.65 | 4.10 | (0.16 | ) | — | (0.16 | ) | |||||||||||||||||||||
| Year Ended 12/31/18 | $ | 22.64 | 0.35 | (4.61 | ) | (4.26 | ) | (0.20 | ) | (0.64 | ) | (0.84 | ) | ||||||||||||||||||
| Year Ended 12/31/17 | $ | 16.05 | 0.21 | 6.62 | 6.83 | (0.24 | ) | — | (0.24 | ) | |||||||||||||||||||||
| Year Ended 12/31/16 | $ | 14.61 | 0.18 | 1.37 | 1.55 | (0.15 | ) | — | (0.15 | ) | |||||||||||||||||||||
| Year Ended 12/31/15 | $ | 17.22 | 0.15 | (2.34 | ) | (2.19 | ) | (0.03 | ) | (0.39 | ) | (0.42 | ) | ||||||||||||||||||
(a) Per share net investment income (loss) has been calculated using the average daily shares method.
(b) Not annualized for periods less than one year.
(c) Annualized for periods less than one year.
(d) Portfolio turnover is calculated on the basis of the Fund as a whole without distinguishing between the classes of shares issued.
See notes to financial statements.
54
Victory Portfolios | Financial Highlights — continued | ||||||
For a Share Outstanding Throughout Each Period (continued)
Ratios to Average Net Assets | Supplemental Data | ||||||||||||||||||||||||||||||||||
| Capital Contribution from Prior Custodian, Net (See Note 8) | Net Asset Value, End of Period | Total Return (Excludes Sales Charge)(b) | Net Expenses(c) | Net Investment Income (Loss)(c) | Gross Expenses(c) | Net Assets, End of Period (000's) | Portfolio Turnover(b)(d) | ||||||||||||||||||||||||||||
Victory Sophus Emerging Markets Fund | |||||||||||||||||||||||||||||||||||
Class R | |||||||||||||||||||||||||||||||||||
| Six Months Ended 6/30/20 (unaudited) | — | $ | 17.75 | (11.34 | )% | 1.58 | % | 0.26 | % | 1.98 | % | $ | 11,381 | 51 | % | ||||||||||||||||||||
| Year Ended 12/31/19 | — | $ | 20.03 | 22.64 | % | 1.58 | % | 1.71 | % | 1.94 | % | $ | 13,817 | 96 | % | ||||||||||||||||||||
| Year Ended 12/31/18 | — | $ | 16.37 | (19.24 | )% | 1.58 | % | 0.89 | % | 1.91 | % | $ | 12,505 | 118 | % | ||||||||||||||||||||
| Year Ended 12/31/17 | — | $ | 21.18 | 41.69 | % | 1.83 | % | 0.50 | % | 2.00 | % | $ | 17,875 | 113 | % | ||||||||||||||||||||
| Year Ended 12/31/16 | 0.04 | $ | 15.03 | 10.26 | %(e) | 1.87 | % | 0.50 | % | 1.87 | % | $ | 15,923 | 120 | % | ||||||||||||||||||||
| Year Ended 12/31/15 | — | $ | 13.76 | (13.23 | )% | 1.87 | % | 0.33 | % | 1.87 | % | $ | 18,648 | 111 | % | ||||||||||||||||||||
Class R6 | |||||||||||||||||||||||||||||||||||
| Six Months Ended 6/30/20 (unaudited) | — | $ | 19.28 | (11.03 | )% | 0.89 | % | 1.02 | % | 1.22 | % | $ | 66,307 | 51 | % | ||||||||||||||||||||
| Year Ended 12/31/19 | — | $ | 21.68 | 23.55 | % | 0.89 | % | 2.69 | % | 1.22 | % | $ | 72,196 | 96 | % | ||||||||||||||||||||
| Year Ended 12/31/18 | — | $ | 17.68 | (18.73 | )% | 0.89 | % | 1.59 | % | 1.24 | % | $ | 29,228 | 118 | % | ||||||||||||||||||||
| Year Ended 12/31/17 | — | $ | 22.81 | 42.77 | % | 1.03 | % | 1.66 | % | 1.39 | % | $ | 18,762 | 113 | % | ||||||||||||||||||||
| November 15, 2016(h) through 12/31/16 | — | $ | 16.16 | 1.81 | % | 1.16 | % | 1.79 | % | 21.70 | % | $ | 64 | 120 | % | ||||||||||||||||||||
Class Y | |||||||||||||||||||||||||||||||||||
| Six Months Ended 6/30/20 (unaudited) | — | $ | 19.09 | (11.13 | )% | 0.99 | % | 0.79 | % | 1.32 | % | $ | 188,045 | 51 | % | ||||||||||||||||||||
| Year Ended 12/31/19 | — | $ | 21.48 | 23.40 | % | 0.99 | % | 2.32 | % | 1.30 | % | $ | 255,423 | 96 | % | ||||||||||||||||||||
| Year Ended 12/31/18 | — | $ | 17.54 | (18.77 | )% | 0.99 | % | 1.64 | % | 1.30 | % | $ | 178,132 | 118 | % | ||||||||||||||||||||
| Year Ended 12/31/17 | — | $ | 22.64 | 42.59 | % | 1.18 | % | 1.07 | % | 1.33 | % | $ | 100,902 | 113 | % | ||||||||||||||||||||
| Year Ended 12/31/16 | 0.04 | $ | 16.05 | 10.86 | %(e) | 1.32 | % | 1.17 | % | 1.38 | % | $ | 60,277 | 120 | % | ||||||||||||||||||||
| Year Ended 12/31/15 | — | $ | 14.61 | (12.73 | )% | 1.30 | % | 0.89 | % | 1.30 | % | $ | 98,634 | 111 | % | ||||||||||||||||||||
(e) The Fund received monies related to a nonrecurring refund from the prior Custodian. The corresponding impact to the total return was 1.45% for the period shown. (See Note 8)
(f) Amount is less than $0.005 per share.
(g) Amount is less than 0.005%.
(h) Commencement of operations.
See notes to financial statements.
55
Victory Portfolios | Financial Highlights | ||||||
For a Share Outstanding Throughout Each Period
Investment Activities | Distributions to Shareholders From | ||||||||||||||||||||||||||
| Net Asset Value, Beginning of Period | Net Investment Income (Loss)(a) | Net Realized and Unrealized Gains (Losses) on Investments | Total from Investment Activities | Net Investment Income | Net Realized Gains From Investments | ||||||||||||||||||||||
Victory Sophus Emerging Markets Small Cap Fund | |||||||||||||||||||||||||||
Class A | |||||||||||||||||||||||||||
| Six Months Ended 6/30/20 (unaudited) | $ | 7.32 | 0.01 | (1.08 | ) | (1.07 | ) | — | — | ||||||||||||||||||
| Year Ended 12/31/19 | $ | 6.07 | 0.06 | 1.25 | 1.31 | (0.05 | ) | (0.01 | ) | ||||||||||||||||||
| Year Ended 12/31/18 | $ | 10.13 | 0.04 | (2.27 | ) | (2.23 | ) | — | (1.83 | ) | |||||||||||||||||
| Year Ended 12/31/17 | $ | 9.75 | 0.12 | 3.86 | 3.98 | (0.12 | ) | (3.48 | ) | ||||||||||||||||||
| Year Ended 12/31/16 | $ | 9.69 | 0.04 | 0.02 | 0.06 | — | — | ||||||||||||||||||||
| Year Ended 12/31/15 | $ | 10.31 | 0.01 | (0.63 | ) | (0.62 | ) | — | — | ||||||||||||||||||
Class C | |||||||||||||||||||||||||||
| Six Months Ended 6/30/20 (unaudited) | $ | 6.66 | (0.01 | ) | (0.99 | ) | (1.00 | ) | — | — | |||||||||||||||||
| Year Ended 12/31/19 | $ | 5.53 | 0.02 | 1.12 | 1.14 | — | (0.01 | ) | |||||||||||||||||||
| Year Ended 12/31/18 | $ | 9.51 | 0.01 | (2.16 | ) | (2.15 | ) | — | (1.83 | ) | |||||||||||||||||
| Year Ended 12/31/17 | $ | 9.34 | (0.02 | ) | 3.75 | 3.73 | (0.08 | ) | (3.48 | ) | |||||||||||||||||
| Year Ended 12/31/16 | $ | 9.56 | (0.02 | ) | (0.20 | ) | (0.22 | ) | — | — | |||||||||||||||||
| Year Ended 12/31/15 | $ | 10.23 | (0.05 | ) | (0.62 | ) | (0.67 | ) | — | — | |||||||||||||||||
Class Y | |||||||||||||||||||||||||||
| Six Months Ended 6/30/20 (unaudited) | $ | 7.29 | 0.02 | (1.08 | ) | (1.06 | ) | — | — | ||||||||||||||||||
| Year Ended 12/31/19 | $ | 6.05 | 0.08 | 1.24 | 1.32 | (0.07 | ) | (0.01 | ) | ||||||||||||||||||
| Year Ended 12/31/18 | $ | 10.08 | 0.09 | (2.29 | ) | (2.20 | ) | — | (1.83 | ) | |||||||||||||||||
| Year Ended 12/31/17 | $ | 9.75 | 0.15 | 3.87 | 4.02 | (0.21 | ) | (3.48 | ) | ||||||||||||||||||
| Year Ended 12/31/16 | $ | 9.74 | 0.06 | 0.02 | 0.08 | (0.07 | ) | — | |||||||||||||||||||
| Year Ended 12/31/15 | $ | 10.32 | 0.06 | (0.64 | ) | (0.58 | ) | — | — | ||||||||||||||||||
* Includes adjustments in accordance with U.S. generally accepted accounting principles.
(a) Per share net investment income (loss) has been calculated using the average daily shares method.
(b) Not annualized for periods less than one year.
(c) Annualized for periods less than one year.
See notes to financial statements.
56
Victory Portfolios | Financial Highlights — continued | ||||||
For a Share Outstanding Throughout Each Period (continued)
Ratios to Average Net Assets | Supplemental Data | ||||||||||||||||||||||||||||||||||
| Total Distributions | Net Asset Value, End of Period | Total Return (Excludes Sales Charge)(b)* | Ratio of Net Expenses to Average Net Assets(c) | Ratio of Net Investment Income (Loss) to Average Net Assets(c) | Ratio of Gross Expenses to Average Net Assets(c) | Net Assets, End of Period (000's) | Portfolio Turnover(b)(d) | ||||||||||||||||||||||||||||
Victory Sophus Emerging Markets Small Cap Fund | |||||||||||||||||||||||||||||||||||
Class A | |||||||||||||||||||||||||||||||||||
| Six Months Ended 6/30/20 (unaudited) | — | $ | 6.25 | (14.50 | )% | 1.75 | % | 0.37 | % | 8.99 | % | $ | 268 | 71 | % | ||||||||||||||||||||
| Year Ended 12/31/19 | (0.06 | ) | $ | 7.32 | 21.44 | % | 1.75 | % | 0.94 | % | 8.02 | % | $ | 336 | 112 | % | |||||||||||||||||||
| Year Ended 12/31/18 | (1.83 | ) | $ | 6.07 | (21.76 | )% | 1.75 | % | 0.39 | % | 5.77 | % | $ | 334 | 200 | % | |||||||||||||||||||
| Year Ended 12/31/17 | (3.60 | ) | $ | 10.13 | 42.55 | % | 1.75 | % | 1.07 | % | 2.94 | % | $ | 1,456 | 227 | %(e) | |||||||||||||||||||
| Year Ended 12/31/16 | — | $ | 9.75 | 0.62 | % | 1.75 | % | 0.44 | % | 2.29 | % | $ | 2,552 | 141 | % | ||||||||||||||||||||
| Year Ended 12/31/15 | — | $ | 9.69 | (6.01 | )% | 1.92 | % | 0.08 | % | 2.44 | % | $ | 5,083 | 107 | % | ||||||||||||||||||||
Class C | |||||||||||||||||||||||||||||||||||
| Six Months Ended 6/30/20 (unaudited) | — | $ | 5.66 | (14.89 | )% | 2.50 | % | (0.40 | )% | 16.38 | % | $ | 108 | 71 | % | ||||||||||||||||||||
| Year Ended 12/31/19 | (0.01 | ) | $ | 6.66 | 20.53 | % | 2.50 | % | 0.25 | % | 13.26 | % | $ | 140 | 112 | % | |||||||||||||||||||
| Year Ended 12/31/18 | (1.83 | ) | $ | 5.53 | (22.31 | )% | 2.51 | % | 0.11 | % | 13.96 | % | $ | 112 | 200 | % | |||||||||||||||||||
| Year Ended 12/31/17 | (3.56 | ) | $ | 9.51 | 41.68 | % | 2.50 | % | (0.21 | )% | 32.34 | % | $ | 99 | 227 | %(e) | |||||||||||||||||||
| Year Ended 12/31/16 | — | $ | 9.34 | (2.30 | )% | 2.50 | % | (0.18 | )% | 3.12 | % | $ | 24 | 141 | % | ||||||||||||||||||||
| Year Ended 12/31/15 | — | $ | 9.56 | (6.55 | )% | 2.54 | % | (0.50 | )% | 3.05 | % | $ | 2,617 | 107 | % | ||||||||||||||||||||
Class Y | |||||||||||||||||||||||||||||||||||
| Six Months Ended 6/30/20 (unaudited) | — | $ | 6.23 | (14.42 | )% | 1.50 | % | 0.68 | % | 4.11 | % | $ | 4,531 | 71 | % | ||||||||||||||||||||
| Year Ended 12/31/19 | (0.08 | ) | $ | 7.29 | 21.76 | % | 1.50 | % | 1.25 | % | 4.02 | % | $ | 4,839 | 112 | % | |||||||||||||||||||
| Year Ended 12/31/18 | (1.83 | ) | $ | 6.05 | (21.57 | )% | 1.51 | % | 0.94 | % | 3.82 | % | $ | 3,890 | 200 | % | |||||||||||||||||||
| Year Ended 12/31/17 | (3.69 | ) | $ | 10.08 | 43.02 | % | 1.50 | % | 1.32 | % | 2.13 | % | $ | 5,685 | 227 | %(e) | |||||||||||||||||||
| Year Ended 12/31/16 | (0.07 | ) | $ | 9.75 | 0.79 | % | 1.50 | % | 0.62 | % | 1.98 | % | $ | 17,261 | 141 | % | |||||||||||||||||||
| Year Ended 12/31/15 | — | $ | 9.74 | (5.62 | )% | 1.50 | % | 0.53 | % | 2.01 | % | $ | 17,581 | 107 | % | ||||||||||||||||||||
(d) Portfolio turnover is calculated on the basis of the Fund as a whole without distinguishing between the classes of shares issued.
(e) Portfolio turnover increased due to change within portfolio holdings during the year.
See notes to financial statements.
57
Victory Portfolios | Notes to Financial Statements June 30, 2020 | ||||||
(Unaudited)
1. Organization:
Victory Portfolios (the "Trust") was organized on December 6, 1995 as a Delaware statutory trust as a successor to a company named "The Victory Portfolios," which was organized as a Massachusetts business trust on February 5, 1986. The Trust is registered under the Investment Company Act of 1940, as amended (the "1940 Act"), as an open-end investment company. The Trust is comprised of 42 funds and is authorized to issue an unlimited number of shares, which are units of beneficial interest with a par value of $0.001 per share. Each Fund is classified as diversified under the 1940 Act.
The accompanying financial statements are those of the following four Funds (collectively, the "Funds" and individually, a "Fund").
Funds (Legal Name) | Funds (Short Name) | Investment Share Classes Offered | |||||||||
Victory RS International Fund | RS International Fund | Classes A, C, R, R6* and Y | |||||||||
Victory RS Global Fund | RS Global Fund | Classes A, C, R, R6* and Y | |||||||||
| Victory Sophus Emerging Markets Fund | Sophus Emerging Market Fund | Classes A, C, R, R6 and Y | |||||||||
| Victory Sophus Emerging Markets Small Cap Fund | Sophus Emerging Markets | Classes A, C and Y Small Cap Fund | |||||||||
* RS International Fund and RS Global Fund Class R6 Shares commenced operations on May 2, 2019.
Each class of shares of a Fund has substantially identical rights and privileges except with respect to sales charges, fees paid under distribution plans, expenses allocable exclusively to each class of shares, voting rights on matters solely affecting a single class of shares, and the exchange privilege of each class of shares.
Under the Trust's organizational documents, its officers and trustees are indemnified against certain liabilities arising out of the performance of their duties to the Funds. In addition, in the normal course of business, the Funds enter into contracts with their vendors and others that provide for general indemnifications. The Funds' maximum exposure under these arrangements is unknown, as this would involve future claims that may be made against the Funds. However, based on experience, the Funds expect that risk of loss to be remote.
2. Significant Accounting Policies:
The following is a summary of significant accounting policies followed by the Trust in the preparation of its financial statements. The policies are in conformity with generally accepted accounting principles in the United States of America ("GAAP"). The preparation of financial statements in accordance with GAAP requires management to make estimates and assumptions that affect the reported amounts of assets and liabilities and disclosure of contingent assets and liabilities at the date of the financial statements and the reported amounts of income and expenses for the period. Actual results could differ from those estimates. The Funds follow the specialized accounting and reporting requirements under GAAP that are applicable to investment companies.
Investment Valuation:
The Funds record investments at fair value. Fair value is defined as the price that would be received to sell an asset or paid to transfer a liability in an orderly transaction between market participants at the measurement date.
The valuation techniques described below maximize the use of observable inputs and minimize the use of unobservable inputs in determining fair value. The inputs used for valuing the Funds' investments are summarized in the three broad levels listed below:
• Level 1 — quoted prices in active markets for identical securities
• Level 2 — other significant observable inputs (including quoted prices for similar securities or interest rates applicable to those securities, etc.)
58
Victory Portfolios | Notes to Financial Statements — continued June 30, 2020 | ||||||
(Unaudited)
• Level 3 — significant unobservable inputs (including the Funds' own assumptions in determining the fair value of investments)
Changes in valuation techniques may result in transfers in or out of an assigned level within the disclosure hierarchy. The inputs or methodologies used for valuation techniques are not necessarily an indication of the risk associated with entering into those investments.
Portfolio securities listed or traded on securities exchanges, including exchange-traded funds ("ETFs"), American Depositary Receipts ("ADRs") and Rights, are valued at the closing price on the exchange or system where the security is principally traded, if available, or at the Nasdaq Official Closing Price. If there have been no sales for that day on the exchange or system, then a security is valued at the last available bid quotation on the exchange or system where the security is principally traded. In each of these situations, valuations are typically categorized as Level 1 in the fair value hierarchy.
Investments for which there are no such quotations, or for which quotations do not appear reliable, are valued at fair value in accordance with procedures established by and under the general supervision and responsibility of the Trust's Board of Trustees (the "Board"). These valuations are typically categorized as Level 2 or Level 3 in the fair value hierarchy, based on the observability of inputs used to determine the fair value.
In accordance with procedures adopted by the Board, fair value pricing may be used if events materially affecting the value of foreign securities occur between the time the exchange on which they are traded closes and the time the Funds' net asset values are calculated. The Funds use a systematic valuation model, provided daily by an independent third party to fair value their international equity securities. These valuations are considered as Level 2 in the fair value hierarchy.
A summary of the valuations as of June 30, 2020, based upon the three levels defined above, is included in the table below while the breakdown, by category, of investments is disclosed on the Schedules of Portfolio Investments.
LEVEL 1 | LEVEL 2 | LEVEL 3 | TOTAL | ||||||||||||||||
RS International Fund | |||||||||||||||||||
Common Stocks | $ | — | $ | 295,247,703 | $ | — | $ | 295,247,703 | |||||||||||
Rights | 137,281 | — | — | 137,281 | |||||||||||||||
Exchange-Traded Funds | 3,645,200 | — | — | 3,645,200 | |||||||||||||||
Collateral for Securities Loaned | 6,419,021 | — | — | 6,419,021 | |||||||||||||||
Total | $ | 10,201,502 | $ | 295,247,703 | $ | — | $ | 305,449,205 | |||||||||||
RS Global Fund | |||||||||||||||||||
Common Stocks | $ | 64,611,038 | $ | 44,822,930 | $ | — | $ | 109,433,968 | |||||||||||
Preferred Stocks | 872,556 | — | — | 872,556 | |||||||||||||||
Exchange-Traded Funds | 673,358 | — | — | 673,358 | |||||||||||||||
Collateral for Securities Loaned | 847,523 | — | — | 847,523 | |||||||||||||||
Total | $ | 67,004,475 | $ | 44,822,930 | $ | — | $ | 111,827,405 | |||||||||||
Sophus Emerging Markets Fund | |||||||||||||||||||
Common Stocks | $ | 68,634,827 | $ | 240,112,397 | $ | — | $ | 308,747,224 | |||||||||||
Preferred Stocks | 3,142,803 | — | — | 3,142,803 | |||||||||||||||
Rights | — | — | — | (a) | — | ||||||||||||||
Collateral for Securities Loaned | 2,948,763 | — | — | 2,948,763 | |||||||||||||||
Total | $ | 74,726,393 | $ | 240,112,397 | $ | — | (a) | $ | 314,838,790 | ||||||||||
Sophus Emerging Markets Small Cap Fund | |||||||||||||||||||
Common Stocks | $ | 678,594 | $ | 4,044,826 | $ | — | $ | 4,723,420 | |||||||||||
Preferred Stocks | 67,877 | — | — | 67,877 | |||||||||||||||
Rights | — | — | — | (a) | — | ||||||||||||||
Collateral for Securities Loaned | 67,493 | — | — | 67,493 | |||||||||||||||
Total | $ | 813,964 | $ | 4,044,826 | $ | — | (a) | $ | 4,858,790 | ||||||||||
(a) Rights are categorized as Level 3 in the fair value hierarchy and are valued at zero as of June 30, 2020.
59
Victory Portfolios | Notes to Financial Statements — continued June 30, 2020 | ||||||
(Unaudited)
The following is a reconciliation of assets in which significant unobservable inputs (Level 3) were used in determining fair value:
| Sophus Emerging Markets Small Cap Fund | |||||||
Balance as of December 31, 2019 | $ | 33,999 | |||||
Accrued discount (premium) | — | ||||||
Realized Gain (Loss) | — | ||||||
Change in Unrealized Appreciation/Depreciation | — | ||||||
Purchases | — | ||||||
Sales Proceeds | — | ||||||
Transfers into Level 3 | — | ||||||
Transfers out of Level 3 | (33,999 | ) | |||||
Balance as of June 30, 2020 | $ | — | |||||
Real Estate Investment Trusts ("REITs"):
The Funds may invest in REITs, which report information on the source of their distributions annually. REITs are pooled investment vehicles that invest primarily in income-producing real estate or real-estate related loans or interests (such as mortgages). Certain distributions received from REITs during the year are recorded as realized gains or return of capital as estimated by the Funds or when such information becomes known.
Foreign Exchange Currency Contracts:
The Funds may enter into foreign exchange currency contracts to convert U.S. dollars to and from various foreign currencies. A foreign exchange currency contract is an obligation by a Fund to purchase or sell a specific currency at a future date at a price (in U.S. dollars) set at the time of the contract. The Funds do not engage in "cross-currency" foreign exchange contracts (i.e., contracts to purchase or sell one foreign currency in exchange for another foreign currency). The Funds' foreign exchange currency contracts might be considered spot contracts (typically a contract of one week or less) or forward contracts (typically a contract term over one week). A spot contract is entered into for purposes of hedging against foreign currency fluctuations relating to a specific portfolio transaction, such as the delay between a security transaction trade date and settlement date. Forward contracts are entered into for purposes of hedging portfolio holdings or concentrations of such holdings. Each foreign exchange currency contract is adjusted daily by the prevailing spot or forward rate of the underlying currency, and any appreciation or depreciation is recorded for financial statement purposes as unrealized until the contract settlement date, at which time the Fund records realized gains or losses equal to the difference between the value of a contract at the time it was opened and the value at the time it was closed. A Fund could be exposed to risk if a counterparty is unable to meet the terms of a foreign exchange currency contract or if the value of the foreign currency changes unfavorably. In addition, the use of foreign exchange currency contracts does not eliminate fluctuations in the underlying prices of the securities. As of June 30, 2020, the Funds had no open forward foreign exchange currency contracts.
Investment Transactions and Related Income:
Changes in holdings of investments are accounted for no later than one business day following the trade date. For financial reporting purposes, however, investment transactions are accounted for on trade date on the last business day of the reporting period. Interest income is determined on the basis of coupon interest accrued using the effective interest method which adjusts, where applicable, the amortization of premiums or accretion of discounts. Dividend income is recorded on the ex-dividend date. Gains or losses realized on sales of securities are recorded on the identified cost basis.
Withholding taxes on interest, dividends and gains as a result of certain investments in ADRs by the Funds have been provided for in accordance with each investment's applicable country's tax rules and rates.
60
Victory Portfolios | Notes to Financial Statements — continued June 30, 2020 | ||||||
(Unaudited)
Securities Lending:
The Trust has entered into a Master Securities Lending Agreement ("MSLA") with Citibank, N.A. ("Citibank" or the "Agent"). Under the terms of the MSLA, the Funds may lend securities to certain broker-dealers and banks in exchange for collateral in the amount of at least 102% of the value of U.S. securities loaned or at least 105% of the value of non-U.S. securities loaned, marked-to-market daily. Any collateral shortfalls associated with increases in the valuation of the securities loaned are adjusted the next business day. The collateral can be received in the form of cash collateral and/or non-cash collateral. Non-cash collateral can include U.S. Government Securities, letters of credit and certificates of deposit. The cash collateral is invested in short-term instruments or cash equivalents, primarily open-end investment companies, as noted on the Funds' Schedules of Portfolio Investments. The Trust does not have effective control of the non-cash collateral and therefore it is not disclosed on the Funds' Schedules of Portfolio Investments. During the time portfolio securities are on loan, the borrower will pay the Funds any dividends or interest paid on such securities plus any fee negotiated between the parties to the lending agreement. The Funds also earn a return from the collateral. The Funds pay the Agent various fees in connection with the investment of cash collateral and fees based on the investment income received from securities lending activities. Securities lending income (net of these fees) is disclosed on the Statements of Operations. Although risk is mitigated by the collateral, the Funds could experience a delay in recovering their securities and possible loss of income or value if the borrower fails to return them.
Securities lending transactions are entered into by a Fund under the MSLA, which permits the Fund, under certain circumstances such as an event of default, to offset amounts payable by the Fund to the same counterparty against amounts receivable from the counterparty to create a net payment due to or from the Fund.
The following table is a summary of the Funds' securities lending transactions which are subject to offset under the MSLA as of June 30, 2020. These transactions are accounted for as secured borrowings with an overnight and continuous contractual maturity for cash collateral and greater than overnight and continuous contractual maturity for non-cash collateral.
| Gross Amount of Recognized Assets | Value of | Value of Non-cash Collateral Received by Maturity | |||||||||||||||||||||||||
(Value of | Cash | ||||||||||||||||||||||||||
| Securities on Loan) | Collateral Received* | <30 Days | Between 30 & 90 days | >90 Days | Net Amount | ||||||||||||||||||||||
RS International Fund | $ | 6,065,938 | $ | 6,065,938 | $ | — | $ | — | $ | — | $ | — | |||||||||||||||
RS Global Fund | 804,171 | 804,171 | — | — | — | — | |||||||||||||||||||||
| Sophus Emerging Markets Fund | 2,901,302 | 2,901,302 | — | — | — | — | |||||||||||||||||||||
| Sophus Emerging Markets Small Cap Fund | 63,347 | 63,347 | — | — | — | — | |||||||||||||||||||||
* Collateral received in excess of the market value of securities on loan is not presented in this table. The total cash collateral received by each Fund is disclosed on the Statements of Assets and Liabilities.
Foreign Currency Translations:
The accounting records of the Funds are maintained in U.S. dollars. Investment securities and other assets and liabilities of a Fund denominated in a foreign currency are translated into U.S. dollars at current exchange rates. Purchases and sales of securities, income receipts and expense payments are translated into U.S. dollars at the exchange rates on the date of the transactions. The Funds do not isolate the portion of the results of operations resulting from changes in foreign exchange rates on investments from fluctuations arising from changes in market prices of securities held. Such fluctuations are disclosed as Net change in unrealized appreciation/depreciation on investment securities and foreign currency translations on the Statements of Operations. Any realized gains or losses from these fluctuations are disclosed as Net realized gains (losses) from investment securities and foreign currency translations on the Statements of Operations.
61
Victory Portfolios | Notes to Financial Statements — continued June 30, 2020 | ||||||
(Unaudited)
Foreign Taxes:
The Funds may be subject to foreign taxes related to foreign income received (a portion of which may be reclaimable), capital gains on the sale of securities, and certain foreign currency transactions. All foreign taxes are recorded in accordance with the applicable regulations and rates that exist in the foreign jurisdictions in which the Funds invest.
Distributions to Shareholders:
Dividends from net investment income, if any, are declared and paid quarterly for the Funds. Distributable net realized gains, if any, are declared and distributed at least annually from each Fund. The amounts of dividends from net investment income and distributions from net realized gains (collectively, distributions to shareholders) are determined in accordance with federal income tax regulations, which may differ from GAAP. To the extent these "book/tax" differences are permanent in nature (e.g., net operating loss and distribution reclassification), such amounts are reclassified within the components of net assets based on their federal tax-basis treatment; temporary differences (e.g., wash sales) do not require reclassification. To the extent dividends and distributions exceed net investment income and net realized gains for tax purposes, they are reported as distributions of capital. Net investment losses incurred by a Fund may be reclassified as an offset to capital on the accompanying Statements of Assets and Liabilities.
Federal Income Taxes:
It is the policy of each Fund to continue to qualify as a regulated investment company by complying with the provisions available to certain investment companies, as defined in applicable sections of the Internal Revenue Code, and to make distributions of net investment income and net realized gains sufficient to relieve it from all, or substantially all, federal income taxes. Accordingly, no provision for federal income taxes is required in the financial statements. The Funds have a tax year end of December 31.
Management of the Funds has reviewed tax positions taken in tax years that remain subject to examination by all major tax jurisdictions, including federal (i.e., the last four tax years, which includes the current fiscal tax year end). Management believes that there is no tax liability resulting from unrecognized tax benefits related to uncertain tax positions taken.
Allocations:
Expenses directly attributable to a Fund are charged to the Fund, while expenses which are attributable to more than one fund in the Trust, or jointly with an affiliated trust, are allocated among the respective funds in the Trust and/or affiliated trust based upon net assets or another appropriate basis.
Income, expenses (other than class-specific expenses such as transfer agent fees, state registration fees, printing fees and 12b-1 fees), and realized and unrealized gains or losses on investments are allocated to each class of shares based on its relative net assets on the date income is earned or expenses and realized and unrealized gains and losses are incurred.
3. Purchases and Sales of Securities:
Purchases and sales of securities (excluding securities maturing less than one year from acquisition) for the six months ended June 30, 2020 were as follows:
Purchases | Sales | ||||||||||
RS International Fund | $ | 127,127,856 | $ | 65,354,770 | |||||||
RS Global Fund | 60,206,616 | 27,527,751 | |||||||||
Sophus Emerging Markets Fund | 169,934,403 | 208,908,123 | |||||||||
Sophus Emerging Markets Small Cap Fund | 3,938,313 | 3,441,604 | |||||||||
For the six months ended June 30, 2020, there were no purchases or sales of U.S. Government Securities.
62
Victory Portfolios | Notes to Financial Statements — continued June 30, 2020 | ||||||
(Unaudited)
4. Fees and Transactions with Affiliates and Related Parties:
Investment advisory services are provided to the Funds by Victory Capital Management Inc. ("VCM" or the "Adviser"), a New York corporation registered as an investment adviser with the Securities and Exchange Commission ("SEC"). The Adviser is a wholly owned indirect subsidiary of Victory Capital Holdings, Inc., a publicly traded Delaware corporation and a wholly owned direct subsidiary of Victory Capital Operating, LLC.
Under the terms of the Investment Advisory Agreement, the Adviser is entitled to receive fees based on a percentage of the average daily net assets of each Fund. The rates at which the Adviser is paid by each Fund are included in the table below. The Adviser may use its resources to assist with the Funds' distribution and marketing expenses.
Flat Rate | |||||||
RS International Fund | 0.80 | % | |||||
RS Global Fund | 0.80 | % | |||||
Sophus Emerging Markets Fund | 1.00 | % | |||||
Sophus Emerging Markets Small Cap Fund | 1.25 | % | |||||
VCM also serves as the Funds' administrator and fund accountant. Under an Administration and Fund Accounting Agreement, VCM is paid for its services an annual fee at a rate of 0.08% of the first $15 billion in average daily net assets of the Trust, Victory Variable Insurance Funds and Victory Portfolios II (collectively, the "Victory Funds Complex"), 0.05% of the average daily net assets above $15 billion to $30 billion of the Victory Funds Complex and 0.04% of the average daily net assets over $30 billion of the Victory Funds Complex.
Citi Fund Services Ohio, Inc. ("Citi"), an affiliate of Citibank, acts as sub-administrator and sub-fund accountant to the Funds pursuant to a Sub-Administration and Sub-Fund Accounting Services Agreement between VCM and Citi. VCM pays Citi a fee for providing these services. The Funds reimburse VCM and Citi for reasonable out-of-pocket expenses incurred in providing these services and certain other expenses specifically allocated to the Funds under the Fund Administration, Servicing, and Accounting Agreement. Amounts paid by the Funds to reimburse VCM for expenses incurred during the six months ended June 30, 2020, are reflected on the Statements of Operations as Sub-Administration fees.
Citibank acts as the custodian of the Funds' assets pursuant to the Global Custodial Services Agreement (the "Custody Agreement"). Citibank's responsibilities include safeguarding and controlling the Funds' cash and securities, handling the receipt and delivery of securities, and collecting interest and dividends on the Funds' investments. Pursuant to the Custody Agreement, Citibank also maintains original entry documents and books of record and general ledgers; posts cash receipts and disbursements; and records purchases and sales based upon communications from the Adviser. Citibank may, with the approval of a Fund and at its own expense, open and maintain a sub-custody account or accounts on behalf of a Fund, provided that it shall remain liable for the performance of all of its duties under the Custody Agreement.
FIS Investor Services, LLC ("FIS") serves as the Funds' transfer agent. Under the Transfer Agent Agreement, the Trust pays FIS a fee for its services and reimburses FIS for all of their reasonable out-of-pocket expenses incurred in providing these services.
The Chief Compliance Officer ("CCO") is an employee of the Adviser, which pays the compensation of the CCO and his support staff. The Trust has entered into an agreement to provide compliance services with the Adviser, pursuant to which the Adviser furnishes its compliance personnel, including the services of the CCO, and other resources reasonably necessary to provide the Trust with compliance oversight services related to the design, administration and oversight of a compliance program for the Trust in accordance with Rule 38a-1 under the 1940 Act. The Funds in the Victory Funds Complex, in aggregate, compensate the Adviser for these services.
The Victory Funds Complex pays an annual retainer to each Independent Trustee, plus an additional annual retainer to the Chairman of the Board. The aggregate amount of the fees and expenses of the Independent Trustees are allocated amongst all the funds in the Victory Funds Complex and are presented on the Statements of Operations.
63
Victory Portfolios | Notes to Financial Statements — continued June 30, 2020 | ||||||
(Unaudited)
Sidley Austin LLP provides legal services to the Trust.
Victory Capital Services, Inc. (the "Distributor"), an affiliate of the Adviser, serves as distributor for the continuous offering of the shares of the Funds pursuant to a Distribution Agreement between the Distributor and the Trust. Effective June 30, 2020, the Distributor's name was changed from Victory Capital Advisers, Inc.
Pursuant to the Distribution and Service Plans adopted in accordance with Rule 12b-1 under the 1940 Act, the Distributor may receive a monthly distribution and service fee, at an annual rate of up to 0.25% of the average daily net assets of Class A Shares, at an annual rate of up to 0.50% of the average daily net assets of Class R Shares and 1.00% of the average daily net assets of Class C Shares of the Funds. The distribution and service fees paid to the Distributor may be used by the Distributor to pay for activities primarily intended to result in the sale of Class A, Class R or Class C Shares of the Funds.
In addition, the Distributor is entitled to receive commissions on sales of the Class A Shares of the Funds. For the six months ended June 30, 2020, the Distributor received approximately $7,104 from commissions earned on sales of Class A Shares of the Funds.
The Adviser has entered into expense limitation agreements with certain Funds. Under the terms of the agreements, the Adviser has agreed to waive fees or reimburse certain expenses to the extent that ordinary operating expenses incurred by certain classes of a Fund in any fiscal year exceed the expense limit for such classes of the Fund. Such excess amounts will be the liability of the Adviser. Interest, taxes, brokerage commissions, other expenditures which are capitalized in accordance with GAAP, and other extraordinary expenses not incurred in the ordinary course of a Fund's business are excluded from the expense limits. As of June 30, 2020, the expense limits (excluding voluntary waivers) are as follows:
In effect May 1, 2020 until April 30, 2021 | |||||||||||||||||||||||
| Class A Shares | Class C Shares | Class R Shares | Class R6 Shares | Class Y Shares | |||||||||||||||||||
RS International Fund | 1.13 | % | 1.88 | % | 1.38 | % | 0.83 | % | 0.88 | % | |||||||||||||
RS Global Fund | 0.85 | % | 1.60 | % | 1.10 | % | 0.55 | % | 0.60 | % | |||||||||||||
Sophus Emerging Markets Fund | 1.34 | % | 2.14 | % | 1.58 | % | 0.89 | % | 0.99 | % | |||||||||||||
Sophus Emerging Markets Small Cap Fund | 1.75 | % | 2.50 | % | N/A | N/A | 1.50 | % | |||||||||||||||
The Funds have agreed to repay fees and expenses that were waived or reimbursed by the Adviser for a period up to three fiscal years after such waiver or reimbursement was made to the extent such payments or repayments would not cause the expenses of a class to exceed the original expense limitation in place at the time of the waiver or reimbursement or any expense limitation agreement in place at the time of repayment. Amounts repaid to the Adviser during the six months ended June 30, 2020, if any, are reflected on the Statements of Operations as Recoupment of prior expenses waived/reimbursed by Adviser.
As of June 30, 2020, the following amounts are available to be repaid to the Adviser:
| Expires 12/31/20 | Expires 12/31/21 | Expires 12/31/22 | Expires 12/31/23 | Total | |||||||||||||||||||
RS International Fund | $ | 178,334 | $ | 152,046 | $ | 266,869 | $ | 212,803 | $ | 810,052 | |||||||||||||
RS Global Fund | 181,379 | 205,996 | 359,812 | 269,550 | 1,016,737 | ||||||||||||||||||
Sophus Emerging Markets Fund | 287,244 | 879,454 | 1,124,230 | 566,001 | 2,856,929 | ||||||||||||||||||
| Sophus Emerging Markets Small Cap Fund | 157,277 | 143,951 | 151,458 | 77,202 | 529,888 | ||||||||||||||||||
The Adviser may voluntarily waive or reimburse additional fees to assist the Funds in maintaining competitive expense ratios. Voluntary waivers and reimbursements applicable to the Funds are not available to be recouped at a future time. There were no voluntary waivers or reimbursements for the six months ended June 30, 2020.
Certain officers and/or interested trustees of the Funds are also officers and/or employees of the Adviser, Administrator, Fund Accountant, Sub-Administrator, Sub-Fund Accountant, and Legal Counsel.
64
Victory Portfolios | Notes to Financial Statements — continued June 30, 2020 | ||||||
(Unaudited)
5. Risks:
Each Fund may be subject to other risks in addition to these identified risks.
An investment in the Funds' shares represents an indirect investment in the securities owned by the Funds, some of which will be traded on a national securities exchange or in the over-the-counter markets. The value of the securities in which the Funds invest, like other market investments, may move up or down, sometimes rapidly and unpredictably. The value of the securities in which the Funds invest may affect the value of the Funds' shares. An investment in the Funds' shares at any point in time may be worth less than the original investment, even after taking into account the reinvestment of the Funds' distributions.
The Funds will be subject to credit risk with respect to the amount each expects to receive from counterparties for financial instruments entered into by the Funds. The Funds may be negatively impacted if a counterparty becomes bankrupt or otherwise fails to perform its obligations due to financial difficulties. The Funds may experience significant delays in obtaining any recovery in bankruptcy or other reorganization proceeding and the Funds may obtain only limited recovery or may obtain no recovery in such circumstances. The Funds typically enter into transactions with counterparties whose credit ratings are investment grade, as determined by a nationally recognized statistical rating organization or, if unrated, judged by the Adviser to be of comparable quality.
An outbreak of respiratory disease called COVID-19 was first detected in China in December 2019 and subsequently spread internationally. The transmission of COVID-19 and efforts to contain its spread have resulted in international, national and local border closings and other significant travel restrictions and disruptions, significant disruptions to business operations, supply chains and consumer activity, significant challenges in healthcare service preparation and delivery, quarantines and general concern and uncertainty. These negative impacts have caused significant volatility and declines in global financial markets, which have caused losses for Fund investors during and subsequent to period end. The impact of the COVID-19 pandemic may be short term or may last for an extended period of time, and in either case could result in a substantial economic downturn or recession. Public health crises may exacerbate other pre-existing political, social, economic, market and financial risks. The extent of the impact to the financial performance of the Funds' investments will depend on future developments, including (i) the duration and spread of the outbreak, (ii) the restrictions and advisories, (iii) the effects on the financial markets, and (iv) the effects on the economy overall, all of which are highly uncertain and cannot be predicted.
6. Borrowing and Interfund Lending:
Line of Credit:
For the six months ended June 30, 2020, the Victory Funds Complex participated in a short-term demand note "Line of Credit" agreement with Citibank. The Line of Credit agreement with Citibank was renewed on June 29, 2020 with a termination date of June 28, 2021. Under the agreement with Citibank, the Victory Funds Complex and USAA Mutual Funds Complex, combined, may borrow up to $600 million, of which $300 million is committed and $300 million is uncommitted. $40 million of the Line of Credit is reserved for use by the Victory Floating Rate Fund (herein, the "Fund"), another series of the Victory Funds Complex, with that Fund paying the related commitment fees for that amount. The purpose of the agreement is to meet temporary or emergency cash needs. For the six months ended June 30, 2020, Citibank received an annual commitment fee of 0.15% on $300 million for providing the Line of Credit. For the six months ended June 30, 2020, Citibank earned approximately $225 thousand in commitment fees from the combined Victory Funds Complex and USAA Mutual Funds Complex. Each fund in the Victory Funds Complex pays a pro-rata portion of the commitment fees plus any interest (one month LIBOR plus one percent) on amounts borrowed. Effective June 29, 2020, under an amended Line of Credit agreement, Citibank will also receive an annual upfront fee of 0.10% on the $300 million committed line of credit. Each fund in the Victory Funds Complex will pay a pro-rata portion of the upfront fee. Interest charged to each Fund during the period, if applicable, is presented on the Statements of Operations under Line of credit fees.
The Funds didn't utilize the Line of Credit during the six months ended June 30, 2020.
65
Victory Portfolios | Notes to Financial Statements — continued June 30, 2020 | ||||||
(Unaudited)
Interfund Lending:
The Trust and Adviser rely on an exemptive order granted by the SEC in March 2017 (the "Order"), permitting the establishment and operation of an Interfund Lending Facility (the "Facility"). The Facility allows each Fund to directly lend money to and borrow money from any other Victory Fund relying upon the Order at rates beneficial to both the borrowing and lending funds. Advances under the Facility are allowed for temporary or emergency purposes, including the meeting of redemption requests that otherwise might require the untimely disposition of securities, and are subject to each Fund's borrowing restrictions. The interfund loan rate is determined, as specified in the Order, by averaging the current repurchase agreement rate and the current bank loan rate. As a Borrower, interest charged to each Fund during the period, if applicable, is presented on the Statements of Operations under Interest expense on interfund lending. As a Lender, interest earned by each Fund during the period, if applicable, is presented on the Statements of Operations under Interfund lending income.
The average borrowing and lending for the days outstanding and average interest rate for each Fund during the six months ended June 30, 2020 were as follows:
| Borrower or Lender | Amount Outstanding at June 30, 2020 | Average Borrowing* | Days Borrowing Outstanding | Average Interest Rate* | Maximum Borrowing During the Period | ||||||||||||||||||||||
RS Global Fund | Borrower | $ | — | $ | 1,001,000 | 1 | 1.18 | % | $ | 1,001,000 | |||||||||||||||||
| Sophus Emerging Markets Fund | Borrower | — | 1,909,000 | 1 | 2.12 | % | 1,909,000 | ||||||||||||||||||||
* For the six months ended June 30, 2020, based on the number of days borrowings were outstanding.
7. Federal Income Tax Information:
The tax character of distributions paid and the tax basis of current components of accumulated earnings (deficit) will be determined at the end of the current tax year ending December 31, 2020.
At December 31, 2019, the following Funds had net capital loss carryforwards as summarized in the table below.
| Short-Term Amount | Long-Term Amount | Total | |||||||||||||
Sophus Emerging Markets Fund | $ | 16,782,597 | $ | 1,221,783 | $ | 18,004,380 | |||||||||
Sophus Emerging Markets Small Cap Fund | 54,327 | — | 54,327 | ||||||||||||
8. Capital Contribution from Prior Custodian:
During 2016, certain Funds received notification from their prior custodian, State Street Bank and Trust ("State Street"), concerning issues related to billing on certain categories of expenses during the approximately 16-year period from 1998 through October 31, 2014. The over-billing primarily related to categories of expenses that involved an allocation of general costs among multiple clients.
State Street paid the refunded amounts during January 2017. Based on billing information received during 2016 from State Street and an analysis of any expense limitation agreements that were in place during the period of the activities in question, including the application of any recoupment provisions in such agreements, the Adviser received a portion of the refund.
The portion of the refund retained by the Funds was accounted for as a capital contribution and is reflected on the Financial Highlights as Capital Contribution from Prior Custodian, Net.
66
Victory Portfolios | Notes to Financial Statements — continued June 30, 2020 | ||||||
(Unaudited)
9. Fund Ownership:
Ownership of more than 25% of the voting securities of a fund creates presumptions of control of the fund, under section 2(a)(9) of the 1940 Act. As of June 30, 2020, the shareholders listed below held more than 25% of the shares outstanding of the Funds and may be deemed to control those Funds. Shareholders of record may hold Fund shares for the benefit of their customers.
Shareholder | Percent | ||||||||||
Sophus Emerging Markets Fund | Gerlach Company | 56.0 | % | ||||||||
Sophus Emerging Markets Fund | National Financial Services | 25.4 | % | ||||||||
Sophus Emerging Markets Small Cap Fund | Gerlach Company | 34.3 | % | ||||||||
Sophus Emerging Markets Small Cap Fund | UBS Financial Services | 39.7 | % | ||||||||
67
Victory Portfolios | Supplemental Information June 30, 2020 | ||||||
(Unaudited)
Proxy Voting and Portfolio Holdings Information
Proxy Voting:
Information regarding the policies and procedures each Fund uses to determine how to vote proxies relating to portfolio securities is available without charge, upon request, by calling 800-539-3863. The information is also included in the Funds' Statement of Additional Information, which is available on the SEC's website at www.sec.gov.
Information relating to how the Funds voted proxies relating to portfolio securities held during the most recent twelve months ended June 30 is available on the SEC's website at www.sec.gov.
Availability of Schedules of Portfolio Investments:
The Trust files a complete list of Schedules of Portfolio Investments with the SEC for the first and third quarter of each fiscal year on Form N-PORT. Forms N-PORT are available on the SEC's web site at www.sec.gov.
Expense Examples
As a shareholder of the Funds, you may incur two types of costs: (1) transaction costs, including sales charges (loads) on purchases; and (2) ongoing costs, including management fees, distribution and service (12b-1) fees and other Fund expenses. These examples are intended to help you understand your ongoing costs (in dollars) of investing in the Funds and to compare these costs with the ongoing costs of investing in other mutual funds.
These examples are based on an investment of $1,000 invested at the beginning of the period and held for the entire period from January 1, 2020 through June 30, 2020.
The Actual Expense figures in the table below provide information about actual account values and actual expenses. You may use the information below, together with the amount you invested, to estimate the expenses that you paid over the period. Simply divide your account value by $1,000 (for example, an $8,600 account value divided by $1,000 = 8.6), then multiply the result by the number in the table under the heading entitled "Actual Expenses Paid During Period" to estimate the expenses you paid on your account during this period.
The Hypothetical Expense figures in the table below provide information about hypothetical account values and hypothetical expenses based on each Fund's actual expense ratio and an assumed rate of return of 5% per year before expenses, which is not the Fund's actual return. The hypothetical account values and expenses may not be used to estimate the actual ending account balance or expenses you paid for the period. You may use this information to compare this 5% hypothetical example with the 5% hypothetical examples that appear in shareholder reports of other funds.
Please note the expenses shown in the table are meant to highlight your ongoing costs only and do not reflect any transactional costs. Therefore, the table is useful in comparing ongoing costs only, and will not help you determine the relative total costs of owning different funds. In addition, if these transactional costs were included, your costs would have been higher.
| Beginning Account Value 1/1/20 | Actual Ending Account Value 6/30/20 | Hypothetical Ending Account Value 6/30/20 | Actual Expenses Paid During Period 1/1/20- 6/30/20* | Hypothetical Expenses Paid During Period 1/1/20- 6/30/20* | Annualized Expense Ratio During Period 1/1/20- 6/30/20 | ||||||||||||||||||||||
RS International Fund | |||||||||||||||||||||||||||
Class A Shares | $ | 1,000.00 | $ | 893.30 | $ | 1,019.24 | $ | 5.32 | $ | 5.67 | 1.13 | % | |||||||||||||||
Class C Shares | 1,000.00 | 890.00 | 1,015.51 | 8.83 | 9.42 | 1.88 | % | ||||||||||||||||||||
Class R Shares | 1,000.00 | 892.30 | 1,018.00 | 6.49 | 6.92 | 1.38 | % | ||||||||||||||||||||
Class R6 Shares | 1,000.00 | 895.30 | 1,020.74 | 3.91 | 4.17 | 0.83 | % | ||||||||||||||||||||
Class Y Shares | 1,000.00 | 894.80 | 1,020.49 | 4.15 | 4.42 | 0.88 | % | ||||||||||||||||||||
68
Victory Portfolios | Supplemental Information — continued June 30, 2020 | ||||||
(Unaudited)
| Beginning Account Value 1/1/20 | Actual Ending Account Value 6/30/20 | Hypothetical Ending Account Value 6/30/20 | Actual Expenses Paid During Period 1/1/20- 6/30/20* | Hypothetical Expenses Paid During Period 1/1/20- 6/30/20* | Annualized Expense Ratio During Period 1/1/20- 6/30/20 | ||||||||||||||||||||||
RS Global Fund | |||||||||||||||||||||||||||
Class A Shares | $ | 1,000.00 | $ | 958.30 | $ | 1,020.64 | $ | 4.14 | $ | 4.27 | 0.85 | % | |||||||||||||||
Class C Shares | 1,000.00 | 954.10 | 1,016.91 | 7.77 | 8.02 | 1.60 | % | ||||||||||||||||||||
Class R Shares | 1,000.00 | 956.90 | 1,019.39 | 5.35 | 5.52 | 1.10 | % | ||||||||||||||||||||
Class R6 Shares | 1,000.00 | 959.30 | 1,022.13 | 2.68 | 2.77 | 0.55 | % | ||||||||||||||||||||
Class Y Shares | 1,000.00 | 959.20 | 1,021.88 | 2.92 | 3.02 | 0.60 | % | ||||||||||||||||||||
Sophus Emerging Markets Fund | |||||||||||||||||||||||||||
Class A Shares | 1,000.00 | 887.60 | 1,018.20 | 6.29 | 6.72 | 1.34 | % | ||||||||||||||||||||
Class C Shares | 1,000.00 | 883.90 | 1,014.22 | 10.02 | 10.72 | 2.14 | % | ||||||||||||||||||||
Class R Shares | 1,000.00 | 886.60 | 1,017.01 | 7.41 | 7.92 | 1.58 | % | ||||||||||||||||||||
Class R6 Shares | 1,000.00 | 889.70 | 1,020.44 | 4.18 | 4.47 | 0.89 | % | ||||||||||||||||||||
Class Y Shares | 1,000.00 | 888.70 | 1,019.94 | 4.65 | 4.97 | 0.99 | % | ||||||||||||||||||||
Sophus Emerging Markets Small Cap Fund | |||||||||||||||||||||||||||
Class A Shares | 1,000.00 | 855.00 | 1,016.16 | 8.07 | 8.77 | 1.75 | % | ||||||||||||||||||||
Class C Shares | 1,000.00 | 851.10 | 1,012.43 | 11.51 | 12.51 | 2.50 | % | ||||||||||||||||||||
Class Y Shares | 1,000.00 | 855.80 | 1,017.40 | 6.92 | 7.52 | 1.50 | % | ||||||||||||||||||||
* Expenses are equal to the average account value multiplied by the Fund's annualized expense ratio multiplied by 182/366 (the number of days in the most recent fiscal half-year divided by the number of days in the fiscal year).
69
Victory Portfolios | Supplemental Information — continued June 30, 2020 | ||||||
(Unaudited)
Liquidity Risk Management Program:
The Victory Funds have adopted and implemented a written liquidity risk management program (the "LRMP") as required by Rule 22e-4 under the Act. The LRMP is reasonably designed to assess and manage each Fund's liquidity risk, taking into consideration each Fund's investment strategy and the liquidity of its portfolio investments during normal and reasonably foreseeable stressed market conditions; its short and long-term cash flow projections; and its cash holdings and access to other liquidity management tools such as available funding sources including the Victory Funds Complex Interfund Lending Facility and Line of Credit (discussed in the Notes to Financial Statements). The Board approved the appointment of VCM as the administrator of the LRMP. At an in-person meeting held on February 20, 2020, VCM provided an oral and written report to the Trustees on the operation and effectiveness of the LRMP during the previous year.
VCM manages liquidity risks associated with the Funds' investments by monitoring, among other things, cash and cash equivalents, any use of derivatives, the concentration of investments, the appropriateness of each Fund's investment strategy, and by classifying every fund investment as either highly liquid, moderately liquid, less liquid or illiquid on at least a monthly basis. To assist with the classification of Fund investments, VCM has retained a third-party provider of liquidity evaluation services. This provider determines preliminary liquidity classifications for all portfolio holdings based upon portfolio-level data and certain assumptions provided by VCM. VCM reviews the preliminary liquidity classifications and, when appropriate, considers other information including input from the Funds' portfolio managers (including the portfolio managers employed by any investment sub-advisers) in determining final liquidity classifications.
The report from VCM concluded that the Funds did not experience any significant liquidity challenges during the covered period, and the Funds' LRMP is reasonably designed to assess and manage its liquidity risk. The report also concluded that the LRMP continues to operate adequately and effectively to enable VCM to oversee and manage liquidity risk and ensure each Fund is able to meet redemption requests without significant dilution to the remaining investors' interest in each Fund. During the review period, each Fund's portfolio consisted primarily of highly liquid investments, which are defined as cash and any investments reasonably expected to be converted to cash in current market conditions in three business days or less without significantly changing the market value of the investment. Therefore, the Funds have not adopted a Highly Liquid Investment Minimum. The Funds' investments were below the limitation on illiquid investments during the review period. Additionally, VCM indicated that no events occurred that would require the filing of Form N-LIQUID and recommended no material changes to the LRMP.
70
Privacy Policy
Protecting the Privacy of Information
The Trust respects your right to privacy. We also know that you expect us to conduct and process your business in an accurate and efficient manner. To do so, we must collect and maintain certain personal information about you. This is the information we collect from you on applications or other forms, and from the transactions you make with us or third parties. It may include your name, address, social security number, account transactions and balances, and information about investment goals and risk tolerance.
We do not disclose any information about you or about former customers to anyone except as permitted or required by law. Specifically, we may disclose the information we collect to companies that perform services on our behalf, such as the transfer agent that processes shareholder accounts and printers and mailers that assist us in the distribution of investor materials. We may also disclose this information to companies that perform marketing services on our behalf. This allows us to continue to offer you Victory investment products and services that meet your investing needs, and to effect transactions that you request or authorize. These companies will use this information only in connection with the services for which we hired them. They are not permitted to use or share this information for any other purpose.
To protect your personal information internally, we permit access only by authorized employees and maintain physical, electronic and procedural safeguards to guard your personal information.*
* You may have received communications regarding information about privacy policies from other financial institutions which gave you the opportunity to "opt-out" of certain information sharing with companies which are not affiliated with that financial institution. The Trust does not share information with other companies for purposes of marketing solicitations for products other than the Trust. Therefore, the Trust does not provide opt-out options to their shareholders.
Victory Funds
P.O. Box 182593
Columbus, Ohio 43218-2593

Visit our website at: | Call Victory at: | ||||||
www.vcm.com | 800-539-FUND (800-539-3863) | ||||||
VPRSIF-SAR (6/20)

June 30, 2020
Semi Annual Report
Victory RS Partners Fund
Victory RS Value Fund
Victory RS Large Cap Alpha Fund
Victory RS Investors Fund
Victory Global Natural Resources Fund
Beginning January 1, 2021, as permitted by regulations adopted by the Securities and Exchange Commission, paper copies of the Victory Funds' shareholder reports will no longer be sent by mail, unless you specifically request paper copies of the reports from the Victory Funds or from your financial intermediary, such as a broker-dealer or bank. Instead, the reports will be made available on www.VictoryFunds.com, and you will be notified by mail each time a report is posted and provided with a website link to access the report. If you already elected to receive shareholder reports electronically, you will not be affected by this change, and you need not take any action.
You may elect to receive shareholder reports and other communications from the Victory Funds or your financial intermediary electronically sooner than January 1, 2021 by notifying your financial intermediary directly or, if you are a direct investor, by calling 800-539-3863 or by sending an e-mail request to TA.Processing@FISGlobal.com.
You may elect to receive all future reports in paper free of charge. If you invest through a financial intermediary, you can contact your financial intermediary to request that you continue to receive paper copies of your reports. If you invest directly with the Victory Funds, you can call 800-539-3863 or send an e-mail request to TA.Processing@FISGlobal.com. Your election to receive reports in paper will apply to all Victory Funds you hold directly or through your financial intermediary.
www.vcm.com
News, Information And Education 24 Hours A Day, 7 Days A Week
The Victory Funds site gives fund shareholders, prospective shareholders, and investment professionals a convenient way to access fund information, get guidance, and track fund performance anywhere they can access the Internet. The site includes:
• Detailed performance records
• Daily share prices
• The latest fund news
• Investment resources to help you become a better investor
• A section dedicated to investment professionals
Whether you're a potential investor searching for the fund that matches your investment philosophy, a seasoned investor interested in planning tools, or an investment professional, www.vcm.com has what you seek. Visit us anytime. We're always open.
Victory Portfolios
Table of Contents
Financial Statements | |||||||
The Victory Value Funds | |||||||
Victory RS Partners Fund | |||||||
Investment Objectives & Portfolio Holdings | 3 | ||||||
Schedule of Portfolio Investments | 5 | ||||||
Statements of Assets and Liabilities | 18 | ||||||
Statements of Operations | 20 | ||||||
Statements of Changes in Net Assets | 22-24 | ||||||
Financial Highlights | 28-29 | ||||||
Victory RS Value Fund | |||||||
Investment Objectives & Portfolio Holdings | 3 | ||||||
Schedule of Portfolio Investments | 8 | ||||||
Statements of Assets and Liabilities | 18 | ||||||
Statements of Operations | 20 | ||||||
Statements of Changes in Net Assets | 22-24 | ||||||
Financial Highlights | 30-33 | ||||||
Victory RS Large Cap Alpha Fund | |||||||
Investment Objectives & Portfolio Holdings | 3 | ||||||
Schedule of Portfolio Investments | 11 | ||||||
Statements of Assets and Liabilities | 18 | ||||||
Statements of Operations | 20 | ||||||
Statements of Changes in Net Assets | 22-24 | ||||||
Financial Highlights | 34-37 | ||||||
Victory RS Investors Fund | |||||||
Investment Objectives & Portfolio Holdings | 3 | ||||||
Schedule of Portfolio Investments | 14 | ||||||
Statements of Assets and Liabilities | 19 | ||||||
Statements of Operations | 21 | ||||||
Statements of Changes in Net Assets | 25-27 | ||||||
Financial Highlights | 38-39 | ||||||
Victory Global Natural Resources Fund | |||||||
Investment Objectives & Portfolio Holdings | 4 | ||||||
Schedule of Portfolio Investments | 16 | ||||||
Statements of Assets and Liabilities | 19 | ||||||
Statements of Operations | 21 | ||||||
Statements of Changes in Net Assets | 25-27 | ||||||
Financial Highlights | 40-41 | ||||||
Notes to Financial Statements | 42 | ||||||
Supplemental Information | 51 | ||||||
Proxy Voting and Portfolio Holdings Information | 51 | ||||||
Expense Examples | 51 | ||||||
Liquidity Risk Management Program | 53 | ||||||
Privacy Policy (inside back cover) | |||||||
1
The Funds are distributed by Victory Capital Services, Inc. Victory Capital Management Inc. is the investment adviser to the Funds and receives fees from the Funds for performing services for the Funds.
This report is not authorized for distribution to prospective investors unless preceded or accompanied by a current prospectus of the Victory Funds.
For additional information about any Victory Fund, including fees, expenses, and risks, view our prospectus online at www.vcm.com or call 800-539-3863. Read it carefully before you invest or send money.
The information in this semi annual report is based on data obtained from recognized services and sources and is believed to be reliable. Any opinions, projections, or recommendations in this report are subject to change without notice and are not intended as individual investment advice. Past investment performance of the Funds, markets or securities mentioned herein should not be considered to be indicative of future results.
• NOT FDIC INSURED • NO BANK GUARANTEE • MAY LOSE VALUE

Call Victory at:
800-539-FUND (800-539-3863)
Visit our website at:
www.vcm.com
2
Victory Portfolios | June 30, 2020 | ||||||
(Unaudited)
Investment Objectives & Portfolio Holdings:
| Victory RS Partners Fund The Fund seeks to provide long-term capital appreciation. | |||
Portfolio Holdings
As a Percentage of Total Investments

| Victory RS Value Fund The Fund seeks to provide long-term capital appreciation. | |||
Portfolio Holdings
As a Percentage of Total Investments
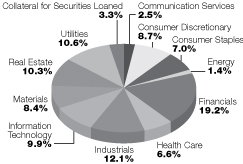
| Victory RS Large Cap Alpha Fund The Fund seeks to provide long-term capital appreciation. | |||
Portfolio Holdings
As a Percentage of Total Investments
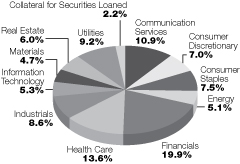
| Victory RS Investors Fund The Fund seeks to provide long-term capital appreciation. | |||
Portfolio Holdings
As a Percentage of Total Investments
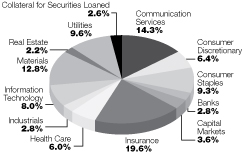
3
Victory Portfolios | June 30, 2020 | ||||||
(Unaudited)
Investment Objectives & Portfolio Holdings: (continued)
Victory Global Natural Resources Fund
The Fund seeks to provide long-term
capital appreciation.
Portfolio Holdings
As a Percentage of Total Investments
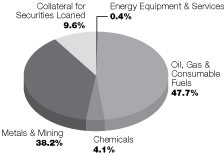
4
| Victory Portfolios Victory RS Partners Fund | Schedule of Portfolio Investments June 30, 2020 | ||||||
(Unaudited)
Security Description | Shares | Value | |||||||||
Common Stocks (95.4%) | |||||||||||
Banks (9.5%): | |||||||||||
Ameris Bancorp | 58,020 | $ | 1,368,692 | ||||||||
Associated Bancorp | 164,120 | 2,245,162 | |||||||||
Berkshire Hills Bancorp, Inc. | 56,310 | 620,536 | |||||||||
Columbia Banking System, Inc. | 108,466 | 3,074,468 | |||||||||
FNB Corp. | 369,860 | 2,773,950 | |||||||||
Independent Bank Corp. | 43,710 | 2,932,504 | |||||||||
Investors Bancorp, Inc. | 486,430 | 4,134,654 | |||||||||
Pinnacle Financial Partners, Inc. (a) | 53,620 | 2,251,504 | |||||||||
South State Corp. | 58,910 | 2,807,651 | |||||||||
TCF Financial Corp. | 52,445 | 1,542,932 | |||||||||
UMB Financial Corp. | 58,692 | 3,025,573 | |||||||||
Umpqua Holdings Corp. | 132,260 | 1,407,246 | |||||||||
28,184,872 | |||||||||||
Communication Services (2.3%): | |||||||||||
World Wrestling Entertainment, Inc., Class A (a) | 159,310 | 6,922,020 | |||||||||
Consumer Discretionary (6.6%): | |||||||||||
Carter's, Inc. | 11,720 | 945,804 | |||||||||
Dana, Inc. | 207,420 | 2,528,450 | |||||||||
Meritage Homes Corp. (b) | 34,230 | 2,605,588 | |||||||||
Penske Automotive Group, Inc. | 161,361 | 6,246,284 | |||||||||
ServiceMaster Global Holdings, Inc. (b) | 57,630 | 2,056,815 | |||||||||
Wolverine World Wide, Inc. | 122,070 | 2,906,487 | |||||||||
Zumiez, Inc. (b) | 78,310 | 2,144,128 | |||||||||
19,433,556 | |||||||||||
Consumer Staples (6.8%): | |||||||||||
Hostess Brands, Inc. (b) | 731,411 | 8,937,842 | |||||||||
Nomad Foods Ltd. (b) | 249,110 | 5,343,410 | |||||||||
TreeHouse Foods, Inc. (a) (b) | 133,900 | 5,864,820 | |||||||||
20,146,072 | |||||||||||
Energy (1.8%): | |||||||||||
Magnolia Oil & Gas Corp., Class A (b) | 906,280 | 5,492,057 | |||||||||
Health Care (3.1%): | |||||||||||
Halozyme Therapeutics, Inc. (b) | 179,900 | 4,823,119 | |||||||||
HMS Holdings Corp. (b) | 135,270 | 4,381,395 | |||||||||
9,204,514 | |||||||||||
Industrials (13.4%): | |||||||||||
Altra Industrial Motion Corp. | 49,560 | 1,578,982 | |||||||||
American Woodmark Corp. (b) | 56,270 | 4,256,826 | |||||||||
Applied Industrial Technologies, Inc. | 24,070 | 1,501,727 | |||||||||
Atkore International Group, Inc. (b) | 247,650 | 6,773,228 | |||||||||
Crane Co. | 53,550 | 3,184,083 | |||||||||
Finning International, Inc. | 189,430 | 2,583,136 | |||||||||
GMS, Inc. (b) | 73,300 | 1,802,447 | |||||||||
Regal Beloit Corp. | 34,238 | 2,989,662 | |||||||||
See notes to financial statements.
5
| Victory Portfolios Victory RS Partners Fund | Schedule of Portfolio Investments — continued June 30, 2020 | ||||||
(Unaudited)
Security Description | Shares | Value | |||||||||
Rush Enterprises, Inc., Class A | 62,140 | $ | 2,576,325 | ||||||||
TFI International, Inc. | 197,430 | 7,009,100 | |||||||||
The Timken Co. | 125,750 | 5,720,367 | |||||||||
39,975,883 | |||||||||||
Information Technology (11.4%): | |||||||||||
Euronet Worldwide, Inc. (b) | 61,010 | 5,845,978 | |||||||||
NCR Corp. (b) | 255,540 | 4,425,953 | |||||||||
Talend SA, ADR (a) (b) | 298,450 | 10,344,277 | |||||||||
Verint Systems, Inc .(b) | 291,920 | 13,188,945 | |||||||||
33,805,153 | |||||||||||
Insurance (19.8%): | |||||||||||
Alleghany Corp. | 15,380 | 7,522,973 | |||||||||
Globe Life, Inc. | 80,130 | 5,948,050 | |||||||||
Kemper Corp. | 44,830 | 3,251,072 | |||||||||
Primerica, Inc. (a) | 51,063 | 5,953,946 | |||||||||
Safety Insurance Group, Inc. | 98,130 | 7,483,394 | |||||||||
Selective Insurance Group, Inc. | 186,280 | 9,824,406 | |||||||||
Stewart Information Services Corp. | 292,020 | 9,493,570 | |||||||||
The Hanover Insurance Group, Inc. | 92,630 | 9,386,198 | |||||||||
58,863,609 | |||||||||||
Materials (6.3%): | |||||||||||
Graphic Packaging Holding Co. | 847,100 | 11,850,929 | |||||||||
Hecla Mining Co. | 472,570 | 1,545,304 | |||||||||
Summit Materials, Inc., Class A (b) | 334,897 | 5,385,144 | |||||||||
18,781,377 | |||||||||||
Real Estate (9.1%): | |||||||||||
Corporate Office Properties Trust (a) | 67,730 | 1,716,278 | |||||||||
Equity Commonwealth | 294,341 | 9,477,779 | |||||||||
Four Corners Property Trust, Inc. | 255,690 | 6,238,836 | |||||||||
Jones Lang LaSalle, Inc. | 34,840 | 3,604,547 | |||||||||
Kennedy-Wilson Holdings, Inc. | 207,270 | 3,154,649 | |||||||||
Washington Real Estate Investment Trust | 129,770 | 2,880,894 | |||||||||
27,072,983 | |||||||||||
Thrifts & Mortgage Finance (1.8%): | |||||||||||
PCSB Financial Corp. | 125,790 | 1,595,017 | |||||||||
TFS Financial Corp .(a) | 253,480 | 3,627,299 | |||||||||
5,222,316 | |||||||||||
Utilities (3.5%): | |||||||||||
Black Hills Corp. | 66,645 | 3,776,106 | |||||||||
NorthWestern Corp. | 67,750 | 3,693,730 | |||||||||
South Jersey Industries, Inc. (a) | 124,460 | 3,110,255 | |||||||||
10,580,091 | |||||||||||
Total Common Stocks (Cost $271,641,711) | 283,684,503 | ||||||||||
See notes to financial statements.
6
| Victory Portfolios Victory RS Partners Fund | Schedule of Portfolio Investments — continued June 30, 2020 | ||||||
(Unaudited)
Security Description | Shares | Value | |||||||||
Preferred Stocks (0.2%) | |||||||||||
Health Care (0.2%): | |||||||||||
WellDoc, Inc. (c) (d) | 1,587,483 | $ | 587,369 | ||||||||
Total Preferred Stocks (Cost $1,942,920) | 587,369 | ||||||||||
Collateral for Securities Loaned^ (3.4%) | |||||||||||
BlackRock Liquidity Funds TempFund Portfolio, Institutional Class, 0.28% (e) | 167,417 | 167,417 | |||||||||
Fidelity Investments Money Market Government Portfolio, Class I, 0.09% (e) | 5,066,982 | 5,066,982 | |||||||||
| Goldman Sachs Financial Square Prime Obligations Fund, Institutional Class, 0.30% (e) | 1,164,212 | 1,164,212 | |||||||||
JPMorgan Prime Money Market Fund, Capital Class, 0.43% (e) | 666,196 | 666,196 | |||||||||
| Morgan Stanley Institutional Liquidity Prime Portfolio, Institutional Class, 0.41% (e) | 2,995,345 | 2,995,345 | |||||||||
Total Collateral for Securities Loaned (Cost $10,060,152) | 10,060,152 | ||||||||||
Total Investments (Cost $283,644,783) — 99.0% | 294,332,024 | ||||||||||
Other assets in excess of liabilities — 1.0% | 3,063,054 | ||||||||||
NET ASSETS — 100.00% | $ | 297,395,078 | |||||||||
^ Purchased with cash collateral from securities on loan.
(a) All or a portion of this security is on loan.
(b) Non-income producing security.
(c) The Fund's Adviser has deemed this security to be illiquid based upon procedures approved by the Board of Trustees. As of June 30, 2020, illiquid securities were 0.2% of the Fund's net assets.
(d) Security was fair valued based upon procedures approved by the Board of Trustees and represents 0.2% of the Fund's net assets as of June 30, 2020. This security is classified as Level 3 within the fair value hierarchy. (See Note 2)
(e) Rate disclosed is the daily yield on June 30, 2020.
ADR — American Depositary Receipt
See notes to financial statements.
7
| Victory Portfolios Victory RS Value Fund | Schedule of Portfolio Investments June 30, 2020 | ||||||
(Unaudited)
Security Description | Shares | Value | |||||||||
Common Stocks (99.0%) | |||||||||||
Communication Services (2.5%): | |||||||||||
World Wrestling Entertainment, Inc., Class A (a) | 162,390 | $ | 7,055,846 | ||||||||
Consumer Discretionary (8.9%): | |||||||||||
AutoZone, Inc. (b) | 1,510 | 1,703,461 | |||||||||
Dollar Tree, Inc .(b) | 47,830 | 4,432,884 | |||||||||
LKQ Corp. (b) | 442,520 | 11,594,024 | |||||||||
Magna International, Inc. | 48,000 | 2,137,440 | |||||||||
Penske Automotive Group, Inc. | 78,910 | 3,054,606 | |||||||||
ServiceMaster Global Holdings, Inc. (b) | 45,060 | 1,608,191 | |||||||||
24,530,606 | |||||||||||
Consumer Staples (7.2%): | |||||||||||
Hostess Brands, Inc. (b) | 314,300 | 3,840,746 | |||||||||
Keurig Dr Pepper, Inc. | 213,985 | 6,077,174 | |||||||||
Nomad Foods Ltd. (b) | 208,860 | 4,480,047 | |||||||||
TreeHouse Foods, Inc. (a) (b) | 127,550 | 5,586,690 | |||||||||
19,984,657 | |||||||||||
Energy (1.4%): | |||||||||||
Magnolia Oil & Gas Corp., Class A (b) | 642,980 | 3,896,459 | |||||||||
Financials (19.6%): | |||||||||||
Aflac, Inc. | 79,670 | 2,870,510 | |||||||||
Alleghany Corp. | 10,980 | 5,370,757 | |||||||||
Arthur J. Gallagher & Co. | 30,600 | 2,983,194 | |||||||||
Brown & Brown, Inc. | 213,570 | 8,705,114 | |||||||||
Cboe Global Markets, Inc. | 30,200 | 2,817,056 | |||||||||
Citizens Financial Group, Inc. | 86,530 | 2,184,017 | |||||||||
First American Financial Corp. | 86,460 | 4,151,809 | |||||||||
Kearny Financial Corp. | 173,570 | 1,419,803 | |||||||||
Kemper Corp. | 43,500 | 3,154,620 | |||||||||
KeyCorp | 174,060 | 2,120,051 | |||||||||
RenaissanceRe Holdings Ltd. | 68,490 | 11,713,845 | |||||||||
TCF Financial Corp. | 46,910 | 1,380,092 | |||||||||
Voya Financial, Inc. (a) | 122,200 | 5,700,630 | |||||||||
54,571,498 | |||||||||||
Health Care (6.7%): | |||||||||||
AmerisourceBergen Corp. | 30,690 | 3,092,631 | |||||||||
Humana, Inc. | 19,460 | 7,545,615 | |||||||||
Quest Diagnostics, Inc. | 37,100 | 4,227,916 | |||||||||
Zimmer Biomet Holdings, Inc. | 33,230 | 3,966,333 | |||||||||
18,832,495 | |||||||||||
See notes to financial statements.
8
| Victory Portfolios Victory RS Value Fund | Schedule of Portfolio Investments — continued June 30, 2020 | ||||||
(Unaudited)
Security Description | Shares | Value | |||||||||
Industrials (12.3%): | |||||||||||
Allison Transmission Holdings, Inc. | 62,920 | $ | 2,314,198 | ||||||||
Carrier Global Corp. | 65,910 | 1,464,520 | |||||||||
Crane Co. | 76,370 | 4,540,960 | |||||||||
Curtiss-Wright Corp. | 35,650 | 3,182,832 | |||||||||
Huntington Ingalls Industries, Inc. | 11,390 | 1,987,441 | |||||||||
Kansas City Southern | 9,730 | 1,452,592 | |||||||||
Sensata Technologies Holding PLC (b) | 116,130 | 4,323,520 | |||||||||
Textron, Inc. | 20,070 | 660,504 | |||||||||
TFI International, Inc. | 186,680 | 6,617,806 | |||||||||
The Timken Co. | 133,010 | 6,050,625 | |||||||||
United Rentals, Inc. (b) | 13,080 | 1,949,443 | |||||||||
34,544,441 | |||||||||||
Information Technology (10.2%): | |||||||||||
Euronet Worldwide, Inc. (b) | 59,153 | 5,668,040 | |||||||||
Leidos Holdings, Inc. | 20,650 | 1,934,286 | |||||||||
NCR Corp. (b) | 172,050 | 2,979,906 | |||||||||
Talend SA, ADR (a) (b) | 188,750 | 6,542,075 | |||||||||
Verint Systems, Inc. (b) | 249,210 | 11,259,308 | |||||||||
28,383,615 | |||||||||||
Materials (8.6%): | |||||||||||
Graphic Packaging Holding Co. | 720,290 | 10,076,857 | |||||||||
Sealed Air Corp. | 324,290 | 10,652,927 | |||||||||
Summit Materials, Inc., Class A (b) | 203,380 | 3,270,350 | |||||||||
24,000,134 | |||||||||||
Real Estate (10.8%): | |||||||||||
Corporate Office Properties Trust | 146,350 | 3,708,509 | |||||||||
Equity Commonwealth | 157,933 | 5,085,443 | |||||||||
Healthcare Trust of America, Inc., Class A | 196,210 | 5,203,489 | |||||||||
Healthpeak Properties, Inc. | 96,540 | 2,660,642 | |||||||||
Highwoods Properties, Inc. | 73,630 | 2,748,608 | |||||||||
Invitation Homes, Inc. | 182,960 | 5,036,889 | |||||||||
MGM Growth Properties LLC, Series A | 195,420 | 5,317,377 | |||||||||
29,760,957 | |||||||||||
Utilities (10.8%): | |||||||||||
American Electric Power Co., Inc. | 31,460 | 2,505,474 | |||||||||
Atmos Energy Corp. | 16,839 | 1,676,828 | |||||||||
FirstEnergy Corp. | 164,560 | 6,381,637 | |||||||||
The AES Corp. | 511,510 | 7,411,780 | |||||||||
Vistra Corp. | 653,600 | 12,170,032 | |||||||||
30,145,751 | |||||||||||
Total Common Stocks (Cost $273,803,249) | 275,706,459 | ||||||||||
See notes to financial statements.
9
| Victory Portfolios Victory RS Value Fund | Schedule of Portfolio Investments — continued June 30, 2020 | ||||||
(Unaudited)
Security Description | Shares | Value | |||||||||
Collateral for Securities Loaned^ (3.4%) | |||||||||||
BlackRock Liquidity Funds TempFund Portfolio, Institutional Class, 0.28% (c) | 157,041 | $ | 157,041 | ||||||||
Fidelity Investments Money Market Government Portfolio, Class I, 0.09% (c) | 4,752,959 | 4,752,959 | |||||||||
| Goldman Sachs Financial Square Prime Obligations Fund, Institutional Class, 0.30% (c) | 1,092,061 | 1,092,061 | |||||||||
JPMorgan Prime Money Market Fund, Capital Class, 0.43% (c) | 624,909 | 624,909 | |||||||||
| Morgan Stanley Institutional Liquidity Prime Portfolio, Institutional Class, 0.41% (c) | 2,809,710 | 2,809,710 | |||||||||
Total Collateral for Securities Loaned (Cost $9,436,680) | 9,436,680 | ||||||||||
Total Investments (Cost $283,239,929) — 102.4% | 285,143,139 | ||||||||||
Liabilities in excess of other assets — (2.4)% | (6,651,710 | ) | |||||||||
NET ASSETS — 100.00% | $ | 278,491,429 | |||||||||
^ Purchased with cash collateral from securities on loan.
(a) All or a portion of this security is on loan.
(b) Non-income producing security.
(c) Rate disclosed is the daily yield on June 30, 2020.
ADR — American Depositary Receipt
LLC — Limited Liability Company
PLC — Public Limited Company
See notes to financial statements.
10
| Victory Portfolios Victory RS Large Cap Alpha Fund | Schedule of Portfolio Investments June 30, 2020 | ||||||
(Unaudited)
Security Description | Shares | Value | |||||||||
Common Stocks (98.5%) | |||||||||||
Communication Services (10.9%): | |||||||||||
Alphabet, Inc., Class A (a) | 14,240 | $ | 20,193,031 | ||||||||
Facebook, Inc., Class A (a) | 87,690 | 19,911,768 | |||||||||
Verizon Communications, Inc. | 106,210 | 5,855,357 | |||||||||
45,960,156 | |||||||||||
Consumer Discretionary (7.0%): | |||||||||||
AutoZone, Inc. (a) | 2,930 | 3,305,392 | |||||||||
Dollar Tree, Inc. (a) | 49,970 | 4,631,219 | |||||||||
LKQ Corp. (a) | 414,350 | 10,855,970 | |||||||||
McDonald's Corp. | 27,490 | 5,071,080 | |||||||||
O'Reilly Automotive, Inc. (a) | 7,890 | 3,326,976 | |||||||||
Target Corp. | 18,920 | 2,269,076 | |||||||||
29,459,713 | |||||||||||
Consumer Staples (7.6%): | |||||||||||
Keurig Dr Pepper, Inc. | 574,310 | 16,310,404 | |||||||||
Mondelez International, Inc., Class A | 301,660 | 15,423,876 | |||||||||
31,734,280 | |||||||||||
Energy (5.1%): | |||||||||||
Chevron Corp. | 122,865 | 10,963,244 | |||||||||
Enterprise Products Partners LP | 583,210 | 10,596,926 | |||||||||
21,560,170 | |||||||||||
Financials (20.1%): | |||||||||||
Aflac, Inc. | 116,290 | 4,189,929 | |||||||||
Bank of America Corp. | 214,290 | 5,089,388 | |||||||||
Brown & Brown, Inc. (b) | 270,420 | 11,022,318 | |||||||||
Cboe Global Markets, Inc. | 44,710 | 4,170,549 | |||||||||
Chubb Ltd. | 57,450 | 7,274,319 | |||||||||
Citigroup, Inc. | 74,420 | 3,802,862 | |||||||||
JPMorgan Chase & Co. | 112,020 | 10,536,601 | |||||||||
Marsh & McLennan Cos., Inc. | 61,150 | 6,565,676 | |||||||||
RenaissanceRe Holdings Ltd. | 97,330 | 16,646,350 | |||||||||
The Progressive Corp. | 84,450 | 6,765,290 | |||||||||
U.S. Bancorp | 113,240 | 4,169,497 | |||||||||
Voya Financial, Inc. | 87,250 | 4,070,213 | |||||||||
84,302,992 | |||||||||||
Health Care (13.7%): | |||||||||||
Cigna Corp. | 65,420 | 12,276,063 | |||||||||
Humana, Inc. | 30,300 | 11,748,825 | |||||||||
Johnson & Johnson | 85,270 | 11,991,520 | |||||||||
Pfizer, Inc. | 240,480 | 7,863,696 | |||||||||
Quest Diagnostics, Inc. | 48,430 | 5,519,083 | |||||||||
UnitedHealth Group, Inc. | 27,895 | 8,227,630 | |||||||||
57,626,817 | |||||||||||
See notes to financial statements.
11
| Victory Portfolios Victory RS Large Cap Alpha Fund | Schedule of Portfolio Investments — continued June 30, 2020 | ||||||
(Unaudited)
Security Description | Shares | Value | |||||||||
Industrials (8.8%): | |||||||||||
Dover Corp. (b) | 21,340 | $ | 2,060,590 | ||||||||
Eaton Corp. PLC | 104,170 | 9,112,792 | |||||||||
Johnson Controls International PLC | 125,850 | 4,296,519 | |||||||||
Parker-Hannifin Corp. | 47,540 | 8,712,656 | |||||||||
Raytheon Technologies Corp. | 113,272 | 6,979,821 | |||||||||
Union Pacific Corp. | 31,900 | 5,393,333 | |||||||||
36,555,711 | |||||||||||
Information Technology (5.3%): | |||||||||||
Broadridge Financial Solutions, Inc. | 59,940 | 7,563,829 | |||||||||
Leidos Holdings, Inc. | 81,760 | 7,658,459 | |||||||||
Visa, Inc., Class A (b) | 37,420 | 7,228,421 | |||||||||
22,450,709 | |||||||||||
Materials (4.7%): | |||||||||||
Newmont Corp. | 79,580 | 4,913,269 | |||||||||
Sealed Air Corp. (b) | 452,002 | 14,848,266 | |||||||||
19,761,535 | |||||||||||
Real Estate (6.0%): | |||||||||||
Equity Commonwealth | 385,760 | 12,421,472 | |||||||||
Equity LifeStyle Properties, Inc. | 141,610 | 8,847,793 | |||||||||
Invitation Homes, Inc. | 149,570 | 4,117,662 | |||||||||
25,386,927 | |||||||||||
Utilities (9.3%): | |||||||||||
Duke Energy Corp. (b) | 90,120 | 7,199,687 | |||||||||
Exelon Corp. | 243,690 | 8,843,510 | |||||||||
FirstEnergy Corp. | 206,180 | 7,995,660 | |||||||||
Vistra Corp. (b) | 806,030 | 15,008,279 | |||||||||
39,047,136 | |||||||||||
Total Common Stocks (Cost $375,005,713) | 413,846,146 | ||||||||||
See notes to financial statements.
12
| Victory Portfolios Victory RS Large Cap Alpha Fund | Schedule of Portfolio Investments — continued June 30, 2020 | ||||||
(Unaudited)
Security Description | Shares | Value | |||||||||
Collateral for Securities Loaned^ (2.2%) | |||||||||||
| BlackRock Liquidity Funds TempFund Portfolio, Institutional Class, 0.28% (c) | 156,439 | $ | 156,439 | ||||||||
Fidelity Investments Money Market Government Portfolio, Class I, 0.09% (c) | 4,734,720 | 4,734,720 | |||||||||
| Goldman Sachs Financial Square Prime Obligations Fund, Institutional Class, 0.30% (c) | 1,087,870 | 1,087,870 | |||||||||
JPMorgan Prime Money Market Fund, Capital Class, 0.43% (c) | 622,511 | 622,511 | |||||||||
| Morgan Stanley Institutional Liquidity Prime Portfolio, Institutional Class, 0.41% (c) | 2,798,928 | 2,798,928 | |||||||||
Total Collateral for Securities Loaned (Cost $9,400,468) | 9,400,468 | ||||||||||
Total Investments (Cost $384,406,181) — 100.7% | 423,246,614 | ||||||||||
Liabilities in excess of other assets — (0.7)% | (3,112,819 | ) | |||||||||
NET ASSETS — 100.00% | $ | 420,133,795 | |||||||||
^ Purchased with cash collateral from securities on loan.
(a) Non-income producing security.
(b) All or a portion of this security is on loan.
(c) Rate disclosed is the daily yield on June 30, 2020.
LP — Limited Partnership
PLC — Public Limited Company
See notes to financial statements.
13
| Victory Portfolios Victory RS Investors Fund | Schedule of Portfolio Investments June 30, 2020 | ||||||
(Unaudited)
Security Description | Shares | Value | |||||||||
Common Stocks (94.8%) | |||||||||||
Banks (2.8%): | |||||||||||
JPMorgan Chase & Co. | 7,570 | $ | 712,034 | ||||||||
Capital Markets (3.5%): | |||||||||||
Cboe Global Markets, Inc. | 9,550 | 890,824 | |||||||||
Communication Services (13.9%): | |||||||||||
Alphabet, Inc., Class A (a) | 1,002 | 1,420,886 | |||||||||
Facebook, Inc., Class A (a) | 5,590 | 1,269,321 | |||||||||
World Wrestling Entertainment, Inc., Class A | 20,200 | 877,690 | |||||||||
3,567,897 | |||||||||||
Consumer Discretionary (6.2%): | |||||||||||
LKQ Corp. (a) | 61,140 | 1,601,868 | |||||||||
Consumer Staples (9.2%): | |||||||||||
Keurig Dr Pepper, Inc. | 43,900 | 1,246,760 | |||||||||
Nomad Foods Ltd. (a) | 25,960 | 556,842 | |||||||||
TreeHouse Foods, Inc. (a) | 12,060 | 528,228 | |||||||||
2,331,830 | |||||||||||
Health Care (5.9%): | |||||||||||
Cigna Corp. | 3,300 | 619,245 | |||||||||
Humana, Inc. | 1,330 | 515,708 | |||||||||
Zimmer Biomet Holdings, Inc. | 3,120 | 372,403 | |||||||||
1,507,356 | |||||||||||
Industrials (2.7%): | |||||||||||
TFI International, Inc. (b) | 19,750 | 701,158 | |||||||||
Information Technology (7.8%): | |||||||||||
Euronet Worldwide, Inc. (a) | 7,040 | 674,573 | |||||||||
Verint Systems, Inc. (a) | 29,480 | 1,331,906 | |||||||||
2,006,479 | |||||||||||
Insurance (18.9%): | |||||||||||
Alleghany Corp. | 1,600 | 782,624 | |||||||||
Brown & Brown, Inc. (b) | 30,620 | 1,248,072 | |||||||||
RenaissanceRe Holdings Ltd. | 8,370 | 1,431,521 | |||||||||
Safety Insurance Group, Inc. | 8,520 | 649,735 | |||||||||
Stewart Information Services Corp. | 23,370 | 759,759 | |||||||||
4,871,711 | |||||||||||
Materials (12.4%): | |||||||||||
Graphic Packaging Holding Co. | 110,690 | 1,548,553 | |||||||||
Sealed Air Corp. | 50,150 | 1,647,428 | |||||||||
3,195,981 | |||||||||||
Real Estate (2.1%): | |||||||||||
Equity Commonwealth | 16,910 | 544,502 | |||||||||
See notes to financial statements.
14
| Victory Portfolios Victory RS Investors Fund | Schedule of Portfolio Investments — continued June 30, 2020 | ||||||
(Unaudited)
Security Description | Shares | Value | |||||||||
Utilities (9.4%): | |||||||||||
The AES Corp. | 33,500 | $ | 485,415 | ||||||||
Vistra Corp. | 102,920 | 1,916,370 | |||||||||
2,401,785 | |||||||||||
Total Common Stocks (Cost $22,022,496) | 24,333,425 | ||||||||||
Collateral for Securities Loaned^ (2.5%) | |||||||||||
BlackRock Liquidity Funds TempFund Portfolio, Institutional Class, 0.28% (c) | 10,868 | 10,868 | |||||||||
Fidelity Investments Money Market Government Portfolio, Class I, 0.09% (c) | 328,939 | 328,939 | |||||||||
| Goldman Sachs Financial Square Prime Obligations Fund, Institutional Class, 0.30% (c) | 75,579 | 75,579 | |||||||||
JPMorgan Prime Money Market Fund, Capital Class, 0.43% (c) | 43,248 | 43,248 | |||||||||
| Morgan Stanley Institutional Liquidity Prime Portfolio, Institutional Class, 0.41% (c) | 194,453 | 194,453 | |||||||||
Total Collateral for Securities Loaned (Cost $653,087) | 653,087 | ||||||||||
Total Investments (Cost $22,675,583) — 97.3% | 24,986,512 | ||||||||||
Other assets in excess of liabilities — 2.7% | 686,929 | ||||||||||
NET ASSETS — 100.00% | $ | 25,673,441 | |||||||||
^ Purchased with cash collateral from securities on loan.
(a) Non-income producing security.
(b) All or a portion of this security is on loan.
(c) Rate disclosed is the daily yield on June 30, 2020.
See notes to financial statements.
15
| Victory Portfolios Victory Global Natural Resources Fund | Schedule of Portfolio Investments June 30, 2020 | ||||||
(Unaudited)
Security Description | Shares | Value | |||||||||
Common Stocks (95.3%) | |||||||||||
Chemicals (4.4%): | |||||||||||
Sociedad Quimica y Minera de Chile SA, ADR (a) | 179,595 | $ | 4,682,042 | ||||||||
Energy Equipment & Services (0.4%): | |||||||||||
Covia Holdings Corp. (a) (b) (c) (d) | 1,782,824 | 427,878 | |||||||||
Metals & Mining (40.2%): | |||||||||||
Antofagasta PLC (c) | 203,947 | 2,364,833 | |||||||||
First Quantum Minerals Ltd. | 1,631,752 | 13,006,893 | |||||||||
Newmont Corp. | 72,320 | 4,465,037 | |||||||||
Rio Tinto PLC, ADR | 44,499 | 2,499,954 | |||||||||
Turquoise Hill Resources Ltd. (a) (b) | 28,287,840 | 20,740,644 | |||||||||
43,077,361 | |||||||||||
Oil, Gas & Consumable Fuels (50.3%): | |||||||||||
Antero Resources Corp. (b) | 1,440,597 | 3,659,116 | |||||||||
ARC Resources Ltd. (a) | 1,064,970 | 3,577,621 | |||||||||
Berry Petroleum Corp. | 381,078 | 1,840,607 | |||||||||
Centennial Resource Development, Inc., Class A (a) (b) | 1,479,561 | 1,316,809 | |||||||||
Cheniere Energy, Inc. (b) | 59,982 | 2,898,330 | |||||||||
Concho Resources, Inc. | 52,747 | 2,716,471 | |||||||||
EOG Resources, Inc. | 31,088 | 1,574,918 | |||||||||
Noble Energy, Inc. | 125,551 | 1,124,937 | |||||||||
PDC Energy, Inc. (b) | 363,440 | 4,521,194 | |||||||||
Peyto Exploration & Development Corp. | 3,515,775 | 4,636,244 | |||||||||
Range Resources Corp. | 3,062,953 | 17,244,425 | |||||||||
Tourmaline Oil Corp. (a) | 421,496 | 3,685,839 | |||||||||
Whitecap Resources, Inc. | 3,124,705 | 5,133,411 | |||||||||
53,929,922 | |||||||||||
Total Common Stocks (Cost $246,399,734) | 102,117,203 | ||||||||||
See notes to financial statements.
16
| Victory Portfolios Victory Global Natural Resources Fund | Schedule of Portfolio Investments — continued June 30, 2020 | ||||||
(Unaudited)
Security Description | Shares | Value | |||||||||
Collateral for Securities Loaned^ (10.2%) | |||||||||||
| BlackRock Liquidity Funds TempFund Portfolio, Institutional Class, 0.28% (e) | 181,437 | $ | 181,437 | ||||||||
| Fidelity Investments Money Market Government Portfolio, Class I, 0.09% (e) | 5,491,304 | 5,491,304 | |||||||||
| Goldman Sachs Financial Square Prime Obligations Fund, Institutional Class, 0.30% (e) | 1,261,706 | 1,261,706 | |||||||||
JPMorgan Prime Money Market Fund, Capital Class, 0.43% (e) | 721,984 | 721,984 | |||||||||
| Morgan Stanley Institutional Liquidity Prime Portfolio, Institutional Class, 0.41% (e) | 3,246,183 | 3,246,183 | |||||||||
Total Collateral for Securities Loaned (Cost $10,902,614) | 10,902,614 | ||||||||||
Total Investments (Cost $257,302,348) — 105.5% | 113,019,817 | ||||||||||
Liabilities in excess of other assets — (5.5)% | (5,859,823 | ) | |||||||||
NET ASSETS — 100.00% | $ | 107,159,994 | |||||||||
^ Purchased with cash collateral from securities on loan.
(a) All or a portion of this security is on loan.
(b) Non-income producing security.
(c) Security was fair valued based upon procedures approved by the Board of Trustees and represents 2.6% of the Fund's net assets as of June 30, 2020.
(d) The company has filed for bankruptcy.
(e) Rate disclosed is the daily yield on June 30, 2020.
ADR — American Depositary Receipt
PLC — Public Limited Company
See notes to financial statements.
17
Victory Portfolios | Statements of Assets and Liabilities June 30, 2020 | ||||||
(Unaudited)
| Victory RS Partners Fund | Victory RS Value Fund | Victory RS Large Cap Alpha Fund | |||||||||||||
ASSETS: | |||||||||||||||
| Investments, at value (Cost $283,644,783, $283,239,929 and $384,406,181) | $ | 294,332,024 | (a) | $ | 285,143,139 | (b) | $ | 423,246,614 | (c) | ||||||
Cash and cash equivalents | 11,132,210 | 2,185,427 | 6,915,519 | ||||||||||||
Receivables: | |||||||||||||||
Interest and dividends | 413,063 | 261,850 | 315,218 | ||||||||||||
Capital shares issued | 24,580 | 84,346 | 14,173 | ||||||||||||
Investments sold | 3,554,353 | 798,528 | 5,382,518 | ||||||||||||
From Adviser | 61,691 | 42,699 | 60,745 | ||||||||||||
Prepaid expenses | 26,070 | 9,602 | 19,891 | ||||||||||||
Total Assets | 309,543,991 | 288,525,591 | 435,954,678 | ||||||||||||
LIABILITIES: | |||||||||||||||
Payables: | |||||||||||||||
Collateral received on loaned securities | 10,060,152 | 9,436,680 | 9,400,468 | ||||||||||||
Investments purchased | 1,384,316 | — | 5,419,830 | ||||||||||||
Capital shares redeemed | 317,396 | 268,871 | 645,226 | ||||||||||||
Accrued expenses and other payables: | |||||||||||||||
Investment advisory fees | 248,382 | 200,061 | 179,360 | ||||||||||||
Administration fees | 14,712 | 13,995 | 21,471 | ||||||||||||
Custodian fees | 782 | 1,884 | 3,658 | ||||||||||||
Transfer agent fees | 75,068 | 75,232 | 76,430 | ||||||||||||
Compliance fees | 264 | 248 | 379 | ||||||||||||
| 12b-1 fees | 13,547 | 16,268 | 46,648 | ||||||||||||
Other accrued expenses | 34,294 | 20,923 | 27,413 | ||||||||||||
Total Liabilities | 12,148,913 | 10,034,162 | 15,820,883 | ||||||||||||
NET ASSETS: | |||||||||||||||
Capital | 318,368,338 | 297,794,147 | 392,181,577 | ||||||||||||
Total distributable earnings/(loss) | (20,973,260 | ) | (19,302,718 | ) | 27,952,218 | ||||||||||
Net Assets | $ | 297,395,078 | $ | 278,491,429 | $ | 420,133,795 | |||||||||
Net Assets | |||||||||||||||
Class A Shares | $ | 131,473,209 | $ | 145,857,378 | $ | 388,240,615 | |||||||||
Class C Shares | — | 2,762,146 | 12,019,918 | ||||||||||||
Class R Shares | 1,149,456 | 661,231 | 5,724,649 | ||||||||||||
Class Y Shares | 164,772,413 | 129,210,674 | 14,148,613 | ||||||||||||
Total | $ | 297,395,078 | $ | 278,491,429 | $ | 420,133,795 | |||||||||
| Shares (unlimited number of shares authorized with a par value of $0.001 per share): | |||||||||||||||
Class A Shares | 7,156,715 | 7,608,618 | 9,048,220 | ||||||||||||
Class C Shares | — | 164,126 | 334,210 | ||||||||||||
Class R Shares | 69,705 | 36,556 | 134,381 | ||||||||||||
Class Y Shares | 8,374,629 | 6,559,465 | 330,883 | ||||||||||||
Total | 15,601,049 | 14,368,765 | 9,847,694 | ||||||||||||
| Net asset value, offering (except Class A Shares) and redemption price per share: | |||||||||||||||
Class A Shares | $ | 18.37 | $ | 19.17 | $ | 42.91 | |||||||||
Class C Shares (d) | $ | — | $ | 16.83 | $ | 35.97 | |||||||||
Class R Shares | $ | 16.49 | $ | 18.09 | $ | 42.60 | |||||||||
Class Y Shares | $ | 19.68 | $ | 19.70 | $ | 42.76 | |||||||||
Maximum Sales Charge — Class A Shares | 5.75 | % | 5.75 | % | 5.75 | % | |||||||||
| Maximum offering price (100%/(100%-maximum sales charge) of net asset value adjusted to the nearest cent) per share — Class A Shares | $ | 19.49 | $ | 20.34 | $ | 45.53 | |||||||||
(a) Includes $9,838,236 of securities on loan.
(b) Includes $9,216,929 of securities on loan.
(c) Includes $9,238,063 of securities on loan.
(d) Redemption price per share varies by the length of time shares are held.
See notes to financial statements.
18
Victory Portfolios | Statements of Assets and Liabilities June 30, 2020 | ||||||
(Unaudited)
| Victory RS Investors Fund | Victory Global Natural Resources Fund | ||||||||||
ASSETS: | |||||||||||
Investments, at value (Cost $22,675,583 and $257,302,348) | $ | 24,986,512 | (a) | $ | 113,019,817 | (b) | |||||
Foreign currency, at value (Cost $— and $31,154) | — | 31,124 | |||||||||
Cash and cash equivalents | 1,183,737 | 4,891,611 | |||||||||
Receivables: | |||||||||||
Interest and dividends | 13,353 | 94,623 | |||||||||
Capital shares issued | 449 | 15,830 | |||||||||
Investments sold | 199,646 | 300,953 | |||||||||
From Adviser | 25,493 | 34,397 | |||||||||
Prepaid expenses | 182 | 415 | |||||||||
Total Assets | 26,409,372 | 118,388,770 | |||||||||
LIABILITIES: | |||||||||||
Payables: | |||||||||||
Collateral received on loaned securities | 653,087 | 10,902,614 | |||||||||
Capital shares redeemed | 26,934 | 115,610 | |||||||||
Accrued expenses and other payables: | |||||||||||
Investment advisory fees | 21,976 | 92,301 | |||||||||
Administration fees | 1,296 | 5,005 | |||||||||
Custodian fees | 349 | 1,875 | |||||||||
Transfer agent fees | 9,679 | 70,574 | |||||||||
Compliance fees | 23 | 164 | |||||||||
Trustees' fees | — | 493 | |||||||||
| 12b-1 fees | 3,072 | 3,343 | |||||||||
Other accrued expenses | 19,515 | 36,797 | |||||||||
Total Liabilities | 735,931 | 11,228,776 | |||||||||
NET ASSETS: | |||||||||||
Capital | 27,750,566 | 2,092,655,415 | |||||||||
Total distributable earnings/(loss) | (2,077,125 | ) | (1,985,495,421 | ) | |||||||
Net Assets | $ | 25,673,441 | $ | 107,159,994 | |||||||
Net Assets | |||||||||||
Class A Shares | $ | 10,554,507 | $ | 24,271,387 | |||||||
Class C Shares | 4,363,965 | 1,836,664 | |||||||||
Class R Shares | 687,267 | 360,557 | |||||||||
Class Y Shares | 10,067,702 | 80,691,386 | |||||||||
Total | $ | 25,673,441 | $ | 107,159,994 | |||||||
| Shares (unlimited number of shares authorized with a par value of $0.001 per share): | |||||||||||
Class A Shares | 1,018,469 | 3,139,856 | |||||||||
Class C Shares | 479,757 | 265,873 | |||||||||
Class R Shares | 74,358 | 49,526 | |||||||||
Class Y Shares | 943,513 | 10,011,069 | |||||||||
Total | 2,516,097 | 13,466,324 | |||||||||
| Net asset value, offering (except Class A Shares) and redemption price per share: | |||||||||||
Class A Shares | $ | 10.36 | $ | 7.73 | |||||||
Class C Shares (c) | $ | 9.10 | $ | 6.91 | |||||||
Class R Shares | $ | 9.24 | $ | 7.28 | |||||||
Class Y Shares | $ | 10.67 | $ | 8.06 | |||||||
Maximum Sales Charge — Class A Shares | 5.75 | % | 5.75 | % | |||||||
| Maximum offering price (100%/(100%-maximum sales charge) of net asset value adjusted to the nearest cent) per share — Class A Shares | $ | 10.99 | $ | 8.20 | |||||||
(a) Includes $649,190 of securities on loan.
(b) Includes $7,940,378 of securities on loan.
(c) Redemption price per share varies by the length of time shares are held.
See notes to financial statements.
19
Victory Portfolios | Statements of Operations For the Six Months Ended June 30, 2020 | ||||||
(Unaudited)
| Victory RS Partners Fund | Victory RS Value Fund | Victory RS Large Cap Alpha Fund | |||||||||||||
Investment Income: | |||||||||||||||
Dividends | $ | 2,958,626 | $ | 2,542,921 | $ | 5,407,429 | |||||||||
Interest | 53,528 | 51,963 | 68,614 | ||||||||||||
Securities lending (net of fees) | 40,232 | 40,104 | 15,373 | ||||||||||||
Foreign tax withholding | (14,256 | ) | (7,065 | ) | (13,733 | ) | |||||||||
Total Income | 3,038,130 | 2,627,923 | 5,477,683 | ||||||||||||
Expenses: | |||||||||||||||
Investment advisory fees | 1,663,077 | 1,309,144 | 1,158,294 | ||||||||||||
Administration fees | 101,394 | 93,964 | 141,472 | ||||||||||||
Sub-Administration fees | 7,446 | 7,311 | 5,904 | ||||||||||||
12b-1 fees — Class A Shares | 184,456 | 203,360 | 534,156 | ||||||||||||
12b-1 fees — Class C Shares | — | 17,318 | 68,730 | ||||||||||||
12b-1 fees — Class R Shares | 3,058 | 2,007 | 15,272 | ||||||||||||
Custodian fees | 11,898 | 9,726 | 12,336 | ||||||||||||
Transfer agent fees — Class A Shares | 118,907 | 119,654 | 215,795 | ||||||||||||
Transfer agent fees — Class C Shares | — | 2,577 | 5,868 | ||||||||||||
Transfer agent fees — Class R Shares | 1,319 | 1,173 | 5,977 | ||||||||||||
Transfer agent fees — Class Y Shares | 82,682 | 86,896 | 9,262 | ||||||||||||
Trustees' fees | 16,022 | 14,639 | 21,486 | ||||||||||||
Compliance fees | 1,464 | 1,351 | 2,015 | ||||||||||||
Legal and audit fees | 17,473 | 16,429 | 22,768 | ||||||||||||
State registration and filing fees | 32,574 | 39,153 | 36,145 | ||||||||||||
Other expenses | 56,409 | 43,523 | 28,388 | ||||||||||||
Total Expenses | 2,298,179 | 1,968,225 | 2,283,868 | ||||||||||||
Expenses waived/reimbursed by Adviser | (192,532 | ) | (124,201 | ) | (176,480 | ) | |||||||||
Net Expenses | 2,105,647 | 1,844,024 | 2,107,388 | ||||||||||||
Net Investment Income (Loss) | 932,483 | 783,899 | 3,370,295 | ||||||||||||
| Realized/Unrealized Gains (Losses) from Investments: | |||||||||||||||
| Net realized gains (losses) from investment securities and foreign currency translations | (37,151,901 | ) | (27,690,397 | ) | (34,635,475 | ) | |||||||||
| Net change in unrealized appreciation/ depreciation on investment securities | (70,069,497 | ) | (60,695,971 | ) | (75,482,785 | ) | |||||||||
| Net realized/unrealized gains (losses) on investments | (107,221,398 | ) | (88,386,368 | ) | (110,118,260 | ) | |||||||||
Change in net assets resulting from operations | $ | (106,288,915 | ) | $ | (87,602,469 | ) | $ | (106,747,965 | ) | ||||||
See notes to financial statements.
20
Victory Portfolios | Statements of Operations For the Six Months Ended June 30, 2020 | ||||||
(Unaudited)
| Victory RS Investors Fund | Victory Global Natural Resources Fund | ||||||||||
Investment Income: | |||||||||||
Dividends | $ | 185,314 | $ | 902,545 | |||||||
Interest | 6,190 | 19,473 | |||||||||
Securities lending (net of fees) | 886 | 21,480 | |||||||||
Foreign tax withholding | (563 | ) | (89,515 | ) | |||||||
Total Income | 191,827 | 853,983 | |||||||||
Expenses: | |||||||||||
Investment advisory fees | 159,755 | 513,049 | |||||||||
Administration fees | 9,721 | 31,305 | |||||||||
Sub-Administration fees | 5,904 | 5,896 | |||||||||
12b-1 fees — Class A Shares | 15,722 | 28,520 | |||||||||
12b-1 fees — Class C Shares | 26,467 | 9,696 | |||||||||
12b-1 fees — Class R Shares | 1,766 | 998 | |||||||||
Custodian fees | 1,657 | 6,872 | |||||||||
Transfer agent fees — Class A Shares | 8,918 | 45,661 | |||||||||
Transfer agent fees — Class C Shares | 3,732 | 4,561 | |||||||||
Transfer agent fees — Class R Shares | 857 | 661 | |||||||||
Transfer agent fees — Class Y Shares | 10,109 | 71,724 | |||||||||
Trustees' fees | 1,704 | 6,219 | |||||||||
Compliance fees | 142 | 533 | |||||||||
Legal and audit fees | 5,028 | 8,321 | |||||||||
State registration and filing fees | 36,240 | 42,395 | |||||||||
Interfund lending fees | 185 | — | |||||||||
Other expenses | 6,552 | 20,053 | |||||||||
Total Expenses | 294,459 | 796,464 | |||||||||
Expenses waived/reimbursed by Adviser | (79,415 | ) | (158,007 | ) | |||||||
Net Expenses | 215,044 | 638,457 | |||||||||
Net Investment Income (Loss) | (23,217 | ) | 215,526 | ||||||||
Realized/Unrealized Gains (Losses) from Investments: | |||||||||||
| Net realized gains (losses) from investment securities and foreign currency translations | (4,310,066 | ) | (88,743,513 | ) | |||||||
| Net change in unrealized appreciation/depreciation on investment securities and foreign currency translations | (4,887,968 | ) | 56,442,193 | ||||||||
Net realized/unrealized gains (losses) on investments | (9,198,034 | ) | (32,301,320 | ) | |||||||
Change in net assets resulting from operations | $ | (9,221,251 | ) | $ | (32,085,794 | ) | |||||
See notes to financial statements.
21
Victory Portfolios | Statements of Changes in Net Assets | ||||||
| Victory RS Partners Fund | Victory RS Value Fund | Victory RS Large Cap Alpha Fund | |||||||||||||||||||||||||
| Six Months Ended June 30, 2020 (Unaudited) | Year Ended December 31, 2019 | Six Months Ended June 30, 2020 (Unaudited) | Year Ended December 31, 2019 | Six Months Ended June 30, 2020 (Unaudited) | Year Ended December 31, 2019 | ||||||||||||||||||||||
From Investment Activities: | |||||||||||||||||||||||||||
Operations: | |||||||||||||||||||||||||||
| Net investment income (loss) | $ | 932,483 | $ | 2,920,104 | $ | 783,899 | $ | 1,449,500 | $ | 3,370,295 | $ | 5,431,363 | |||||||||||||||
| Net realized gains (losses) from investments | (37,151,901 | ) | 40,883,294 | (27,690,397 | ) | 34,077,370 | (34,635,475 | ) | 27,752,926 | ||||||||||||||||||
| Net change in unrealized appreciation/ depreciation on investments | (70,069,497 | ) | 74,331,906 | (60,695,971 | ) | 69,785,270 | (75,482,785 | ) | 109,044,824 | ||||||||||||||||||
| Change in net assets resulting from operations | (106,288,915 | ) | 118,135,304 | (87,602,469 | ) | 105,312,140 | (106,747,965 | ) | 142,229,113 | ||||||||||||||||||
| Distributions to Shareholders: | |||||||||||||||||||||||||||
Class A Shares | — | (18,545,144 | ) | — | (14,419,529 | ) | — | (19,425,553 | ) | ||||||||||||||||||
Class C Shares | — | — | — | (350,766 | ) | — | (621,209 | ) | |||||||||||||||||||
Class R Shares | — | (152,466 | ) | — | (70,532 | ) | — | (249,827 | ) | ||||||||||||||||||
Class Y Shares | — | (23,073,509 | ) | — | (12,497,492 | ) | — | (786,292 | ) | ||||||||||||||||||
| Change in net assets resulting from distributions to shareholders | — | (41,771,119 | ) | — | (27,338,319 | ) | — | (21,082,881 | ) | ||||||||||||||||||
| Change in net assets resulting from capital transactions | (23,887,883 | ) | (76,430,849 | ) | (23,749,886 | ) | (44,649,999 | ) | (37,558,450 | ) | (42,142,778 | ) | |||||||||||||||
Change in net assets | (130,176,798 | ) | (66,664 | ) | (111,352,355 | ) | 33,323,822 | (144,306,415 | ) | 79,003,454 | |||||||||||||||||
Net Assets: | |||||||||||||||||||||||||||
Beginning of period | 427,571,876 | 427,638,540 | 389,843,784 | 356,519,962 | 564,440,210 | 485,436,756 | |||||||||||||||||||||
End of period | $ | 297,395,078 | $ | 427,571,876 | $ | 278,491,429 | $ | 389,843,784 | $ | 420,133,795 | $ | 564,440,210 | |||||||||||||||
(continues on next page)
See notes to financial statements.
22
Victory Portfolios | Statements of Changes in Net Assets | ||||||
| Victory RS Partners Fund | Victory RS Value Fund | Victory RS Large Cap Alpha Fund | |||||||||||||||||||||||||
| Six Months Ended June 30, 2020 (Unaudited) | Year Ended December 31, 2019 | Six Months Ended June 30, 2020 (Unaudited) | Year Ended December 31, 2019 | Six Months Ended June 30, 2020 (Unaudited) | Year Ended December 31, 2019 | ||||||||||||||||||||||
Capital Transactions: | |||||||||||||||||||||||||||
Class A Shares | |||||||||||||||||||||||||||
| Proceeds from shares issued | $ | 4,379,753 | $ | 16,579,793 | $ | 7,093,639 | $ | 13,105,632 | $ | 6,960,271 | $ | 17,052,317 | |||||||||||||||
Distributions reinvested | — | 18,238,219 | — | 14,014,003 | — | 18,921,963 | |||||||||||||||||||||
Cost of shares redeemed | (19,079,512 | ) | (48,748,054 | ) | (21,450,148 | ) | (38,839,092 | ) | (40,793,232 | ) | (65,297,079 | ) | |||||||||||||||
Total Class A Shares | $ | (14,699,759 | ) | $ | (13,930,042 | ) | $ | (14,356,509 | ) | $ | (11,719,457 | ) | $ | (33,832,961 | ) | $ | (29,322,799 | ) | |||||||||
Class C Shares | |||||||||||||||||||||||||||
| Proceeds from shares issued | $ | — | $ | — | $ | 51,212 | $ | 576,327 | $ | 142,770 | $ | 612,718 | |||||||||||||||
Distributions reinvested | — | — | — | 332,779 | — | 578,811 | |||||||||||||||||||||
Cost of shares redeemed | — | — | (1,102,215 | ) | (7,244,004 | ) | (1,909,485 | ) | (6,481,288 | ) | |||||||||||||||||
Total Class C Shares | $ | — | $ | — | $ | (1,051,003 | ) | $ | (6,334,898 | ) | $ | (1,766,715 | ) | $ | (5,289,759 | ) | |||||||||||
Class R Shares | |||||||||||||||||||||||||||
| Proceeds from shares issued | $ | 108,999 | $ | 150,948 | $ | 37,630 | $ | 97,915 | $ | 495,977 | $ | 546,882 | |||||||||||||||
Distributions reinvested | — | 152,466 | — | 70,532 | — | 247,948 | |||||||||||||||||||||
Cost of shares redeemed | (91,922 | ) | (207,402 | ) | (165,087 | ) | (380,522 | ) | (611,224 | ) | (1,453,937 | ) | |||||||||||||||
Total Class R Shares | $ | 17,077 | $ | 96,012 | $ | (127,457 | ) | $ | (212,075 | ) | $ | (115,247 | ) | $ | (659,107 | ) | |||||||||||
Class Y Shares | |||||||||||||||||||||||||||
| Proceeds from shares issued | $ | 21,068,141 | $ | 42,480,816 | $ | 12,411,760 | $ | 17,702,861 | $ | 1,431,855 | $ | 4,219,718 | |||||||||||||||
Distributions reinvested | — | 22,957,985 | — | 12,251,365 | — | 759,111 | |||||||||||||||||||||
Cost of shares redeemed | (30,273,342 | ) | (128,035,620 | ) | (20,626,677 | ) | (56,337,795 | ) | (3,275,382 | ) | (11,849,942 | ) | |||||||||||||||
Total Class Y Shares | $ | (9,205,201 | ) | $ | (62,596,819 | ) | $ | (8,214,917 | ) | $ | (26,383,569 | ) | $ | (1,843,527 | ) | $ | (6,871,113 | ) | |||||||||
| Change in net assets resulting from capital transactions | $ | (23,887,883 | ) | $ | (76,430,849 | ) | $ | (23,749,886 | ) | $ | (44,649,999 | ) | $ | (37,558,450 | ) | $ | (42,142,778 | ) | |||||||||
(continues on next page)
See notes to financial statements.
23
Victory Portfolios | Statements of Changes in Net Assets | ||||||
| Victory RS Partners Fund | Victory RS Value Fund | Victory RS Large Cap Alpha Fund | |||||||||||||||||||||||||
| Six Months Ended June 30, 2020 (Unaudited) | Year Ended December 31, 2019 | Six Months Ended June 30, 2020 (Unaudited) | Year Ended December 31, 2019 | Six Months Ended June 30, 2020 (Unaudited) | Year Ended December 31, 2019 | ||||||||||||||||||||||
Share Transactions: | |||||||||||||||||||||||||||
Class A Shares | |||||||||||||||||||||||||||
Issued | 230,422 | 691,105 | 375,677 | 542,728 | 153,171 | 343,113 | |||||||||||||||||||||
Reinvested | — | 758,032 | — | 567,685 | — | 357,509 | |||||||||||||||||||||
Redeemed | (986,472 | ) | (2,042,889 | ) | (1,123,611 | ) | (1,607,052 | ) | (898,711 | ) | (1,309,527 | ) | |||||||||||||||
Total Class A Shares | (756,050 | ) | (593,752 | ) | (747,934 | ) | (496,639 | ) | (745,540 | ) | (608,905 | ) | |||||||||||||||
Class C Shares | |||||||||||||||||||||||||||
Issued | — | — | 2,910 | 27,312 | 3,774 | 14,939 | |||||||||||||||||||||
Reinvested | — | — | — | 15,378 | — | 13,077 | |||||||||||||||||||||
Redeemed | — | — | (61,756 | ) | (341,331 | ) | (50,546 | ) | (156,432 | ) | |||||||||||||||||
Total Class C Shares | — | — | (58,846 | ) | (298,641 | ) | (46,772 | ) | (128,416 | ) | |||||||||||||||||
Class R Shares | |||||||||||||||||||||||||||
Issued | 6,325 | 6,910 | 2,011 | 4,276 | 10,918 | 11,149 | |||||||||||||||||||||
Reinvested | — | 7,039 | — | 3,033 | — | 4,724 | |||||||||||||||||||||
Redeemed | (5,237 | ) | (9,594 | ) | (9,034 | ) | (16,629 | ) | (13,436 | ) | (30,091 | ) | |||||||||||||||
Total Class R Shares | 1,088 | 4,355 | (7,023 | ) | (9,320 | ) | (2,518 | ) | (14,218 | ) | |||||||||||||||||
Class Y Shares | |||||||||||||||||||||||||||
Issued | 1,004,614 | 1,651,373 | 652,863 | 717,334 | 29,412 | 84,116 | |||||||||||||||||||||
Reinvested | — | 895,516 | — | 482,657 | — | 14,386 | |||||||||||||||||||||
Redeemed | (1,513,254 | ) | (5,089,360 | ) | (1,038,733 | ) | (2,273,518 | ) | (77,183 | ) | (239,430 | ) | |||||||||||||||
Total Class Y Shares | (508,640 | ) | (2,542,471 | ) | (385,870 | ) | (1,073,527 | ) | (47,771 | ) | (140,928 | ) | |||||||||||||||
Change in Shares | (1,263,602 | ) | (3,131,868 | ) | (1,199,673 | ) | (1,878,127 | ) | (842,601 | ) | (892,467 | ) | |||||||||||||||
See notes to financial statements.
24
Victory Portfolios | Statements of Changes in Net Assets | ||||||
| Victory RS Investors Fund | Victory Global Natural Resources Fund | ||||||||||||||||||
| Six Months Ended June 30, 2020 (Unaudited) | Year Ended December 31, 2019 | Six Months Ended June 30, 2020 (Unaudited) | Year Ended December 31, 2019 | ||||||||||||||||
From Investment Activities: | |||||||||||||||||||
Operations: | |||||||||||||||||||
Net investment income (loss) | $ | (23,217 | ) | $ | (12,611 | ) | $ | 215,526 | $ | 698,765 | |||||||||
| Net realized gains (losses) from investments | (4,310,066 | ) | 1,944,737 | (88,743,513 | ) | (302,104,028 | ) | ||||||||||||
| Net change in unrealized appreciation/depreciation on investments | (4,887,968 | ) | 8,148,148 | 56,442,193 | 187,635,480 | ||||||||||||||
| Change in net assets resulting from operations | (9,221,251 | ) | 10,080,274 | (32,085,794 | ) | (113,769,783 | ) | ||||||||||||
Distributions to Shareholders: | |||||||||||||||||||
Class A Shares | — | (721,644 | ) | — | — | ||||||||||||||
Class C Shares | — | (330,965 | ) | — | — | ||||||||||||||
Class R Shares | — | (38,858 | ) | — | — | ||||||||||||||
Class Y Shares | — | (779,678 | ) | — | (294,977 | ) | |||||||||||||
| Change in net assets resulting from distributions to shareholders | — | (1,871,145 | ) | — | (294,977 | ) | |||||||||||||
| Change in net assets resulting from capital transactions | (8,898,621 | ) | (2,879,723 | ) | (11,926,065 | ) | (200,204,338 | ) | |||||||||||
Change in net assets | (18,119,872 | ) | 5,329,406 | (44,011,859 | ) | (314,269,098 | ) | ||||||||||||
Net Assets: | |||||||||||||||||||
Beginning of period | 43,793,313 | 38,463,907 | 151,171,853 | 465,440,951 | |||||||||||||||
End of period | $ | 25,673,441 | $ | 43,793,313 | $ | 107,159,994 | $ | 151,171,853 | |||||||||||
(continues on next page)
See notes to financial statements.
25
Victory Portfolios | Statements of Changes in Net Assets | ||||||
| Victory RS Investors Fund | Victory Global Natural Resources Fund | ||||||||||||||||||
| Six Months Ended June 30, 2020 (Unaudited) | Year Ended December 31, 2019 | Six Months Ended June 30, 2020 (Unaudited) | Year Ended December 31, 2019 | ||||||||||||||||
Capital Transactions: | |||||||||||||||||||
Class A Shares | |||||||||||||||||||
Proceeds from shares issued | $ | 646,036 | $ | 1,270,985 | $ | 3,135,730 | $ | 9,391,402 | |||||||||||
Distributions reinvested | — | 698,892 | — | — | |||||||||||||||
Cost of shares redeemed | (3,185,246 | ) | (4,140,546 | ) | (4,685,991 | ) | (26,068,909 | ) | |||||||||||
Total Class A Shares | $ | (2,539,210 | ) | $ | (2,170,669 | ) | $ | (1,550,261 | ) | $ | (16,677,507 | ) | |||||||
Class C Shares | |||||||||||||||||||
Proceeds from shares issued | $ | 58,965 | $ | 400,138 | $ | 86,995 | $ | 177,189 | |||||||||||
Distributions reinvested | — | 279,002 | — | — | |||||||||||||||
Cost of shares redeemed | (1,162,397 | ) | (2,558,469 | ) | (570,218 | ) | (2,812,027 | ) | |||||||||||
Total Class C Shares | $ | (1,103,432 | ) | $ | (1,879,329 | ) | $ | (483,223 | ) | $ | (2,634,838 | ) | |||||||
Class R Shares | |||||||||||||||||||
Proceeds from shares issued | $ | 25,572 | $ | 47,252 | $ | 94,605 | $ | 264,804 | |||||||||||
Distributions reinvested | — | 38,858 | — | — | |||||||||||||||
Cost of shares redeemed | (3,278 | ) | (243,184 | ) | (212,333 | ) | (350,859 | ) | |||||||||||
Total Class R Shares | $ | 22,294 | $ | (157,074 | ) | $ | (117,728 | ) | $ | (86,055 | ) | ||||||||
Class Y Shares | |||||||||||||||||||
Proceeds from shares issued | $ | 1,111,244 | $ | 7,332,552 | $ | 12,896,182 | $ | 106,594,493 | |||||||||||
Distributions reinvested | — | 760,887 | — | 250,255 | |||||||||||||||
Cost of shares redeemed | (6,389,517 | ) | (6,766,090 | ) | (22,671,035 | ) | (287,650,686 | ) | |||||||||||
Total Class Y Shares | $ | (5,278,273 | ) | $ | 1,327,349 | $ | (9,774,853 | ) | $ | (180,805,938 | ) | ||||||||
| Change in net assets resulting from capital transactions | $ | (8,898,621 | ) | $ | (2,879,723 | ) | $ | (11,926,065 | ) | $ | (200,204,338 | ) | |||||||
(continues on next page)
See notes to financial statements.
26
Victory Portfolios | Statements of Changes in Net Assets | ||||||
| Victory RS Investors Fund | Victory Global Natural Resources Fund | ||||||||||||||||||
| Six Months Ended June 30, 2020 (Unaudited) | Year Ended December 31, 2019 | Six Months Ended June 30, 2020 (Unaudited) | Year Ended December 31, 2019 | ||||||||||||||||
Share Transactions: | |||||||||||||||||||
Class A Shares | |||||||||||||||||||
Issued | 58,881 | 99,510 | 445,240 | 851,433 | |||||||||||||||
Reinvested | — | 53,885 | — | — | |||||||||||||||
Redeemed | (331,393 | ) | (331,114 | ) | (664,962 | ) | (2,468,125 | ) | |||||||||||
Total Class A Shares | (272,512 | ) | (177,719 | ) | (219,722 | ) | (1,616,692 | ) | |||||||||||
Class C Shares | |||||||||||||||||||
Issued | 6,519 | 35,207 | 19,259 | 16,952 | |||||||||||||||
Reinvested | — | 24,409 | — | — | |||||||||||||||
Redeemed | (124,701 | ) | (225,759 | ) | (91,766 | ) | (275,087 | ) | |||||||||||
Total Class C Shares | (118,182 | ) | (166,143 | ) | (72,507 | ) | (258,135 | ) | |||||||||||
Class R Shares | |||||||||||||||||||
Issued | 2,756 | 4,134 | 14,213 | 28,305 | |||||||||||||||
Reinvested | — | 3,347 | — | — | |||||||||||||||
Redeemed | (408 | ) | (21,490 | ) | (32,460 | ) | (36,060 | ) | |||||||||||
Total Class R Shares | 2,348 | (14,009 | ) | (18,247 | ) | (7,755 | ) | ||||||||||||
Class Y Shares | |||||||||||||||||||
Issued | 104,792 | 550,472 | 1,721,011 | 8,945,033 | |||||||||||||||
Reinvested | — | 57,038 | — | 25,407 | |||||||||||||||
Redeemed | (583,158 | ) | (526,955 | ) | (3,080,798 | ) | (27,015,945 | ) | |||||||||||
Total Class Y Shares | (478,366 | ) | 80,555 | (1,359,787 | ) | (18,045,505 | ) | ||||||||||||
Change in Shares | (866,712 | ) | (277,316 | ) | (1,670,263 | ) | (19,928,087 | ) | |||||||||||
See notes to financial statements.
27
Victory Portfolios | Financial Highlights | ||||||
For a Share Outstanding Throughout Each Period
Investment Activities | Distributions to Shareholders From | ||||||||||||||||||||||||||
| Net Asset Value, Beginning of Period | Net Investment Income (Loss)(a) | Net Realized and Unrealized Gains (Losses) on Investments | Total from Investment Activities | Net Investment Income | Net Realized Gains from Investments | ||||||||||||||||||||||
Victory RS Partners Fund | |||||||||||||||||||||||||||
Class A | |||||||||||||||||||||||||||
| Six Months Ended 6/30/20 (unaudited) | $ | 24.47 | 0.04 | (6.14 | ) | (6.10 | ) | — | — | ||||||||||||||||||
Year Ended 12/31/19 | $ | 20.66 | 0.12 | 6.12 | 6.24 | (0.21 | ) | (2.22 | ) | ||||||||||||||||||
Year Ended 12/31/18 | $ | 29.21 | 0.04 | (3.52 | ) | (3.48 | ) | (0.08 | ) | (4.99 | ) | ||||||||||||||||
Year Ended 12/31/17 | $ | 31.58 | (0.25 | ) | 4.78 | 4.53 | — | (6.90 | ) | ||||||||||||||||||
Year Ended 12/31/16 | $ | 26.89 | (0.12 | ) | 6.59 | 6.47 | — | (1.78 | ) | ||||||||||||||||||
Year Ended 12/31/15 | $ | 31.08 | (0.11 | ) | (3.22 | ) | (3.33 | ) | — | (0.86 | ) | ||||||||||||||||
Class R | |||||||||||||||||||||||||||
| Six Months Ended 6/30/20 (unaudited) | $ | 22.01 | — | (e) | (5.52 | ) | (5.52 | ) | — | — | |||||||||||||||||
Year Ended 12/31/19 | $ | 18.79 | 0.03 | 5.55 | 5.58 | (0.14 | ) | (2.22 | ) | ||||||||||||||||||
Year Ended 12/31/18 | $ | 27.09 | (0.04 | ) | (3.27 | ) | (3.31 | ) | — | (4.99 | ) | ||||||||||||||||
Year Ended 12/31/17 | $ | 29.84 | (0.44 | ) | 4.59 | 4.15 | — | (6.90 | ) | ||||||||||||||||||
Year Ended 12/31/16 | $ | 25.57 | (0.21 | ) | 6.26 | 6.05 | — | (1.78 | ) | ||||||||||||||||||
Year Ended 12/31/15 | $ | 29.72 | (0.21 | ) | (3.08 | ) | (3.29 | ) | — | (0.86 | ) | ||||||||||||||||
Class Y | |||||||||||||||||||||||||||
| Six Months Ended 6/30/20 (unaudited) | $ | 26.17 | 0.07 | (6.56 | ) | (6.49 | ) | — | — | ||||||||||||||||||
Year Ended 12/31/19 | $ | 21.94 | 0.21 | 6.52 | 6.73 | (0.28 | ) | (2.22 | ) | ||||||||||||||||||
Year Ended 12/31/18 | $ | 30.67 | 0.14 | (3.71 | ) | (3.57 | ) | (0.17 | ) | (4.99 | ) | ||||||||||||||||
Year Ended 12/31/17 | $ | 32.75 | (0.04 | ) | 4.86 | 4.82 | — | (6.90 | ) | ||||||||||||||||||
Year Ended 12/31/16 | $ | 27.75 | (0.03 | ) | 6.81 | 6.78 | — | (1.78 | ) | ||||||||||||||||||
Year Ended 12/31/15 | $ | 31.95 | (0.02 | ) | (3.32 | ) | (3.34 | ) | — | (0.86 | ) | ||||||||||||||||
(a) Per share net investment income (loss) has been calculated using the average daily shares method.
(b) Not annualized for periods less than one year.
(c) Annualized for periods less than one year.
(d) Portfolio turnover is calculated on the basis of the Fund as a whole without distinguishing between the classes of shares issued.
(e) Amount is less than $0.005 per share.
See notes to financial statements.
28
Victory Portfolios | Financial Highlights — continued | ||||||
For a Share Outstanding Throughout Each Period (continued)
Ratios to Average Net Assets | Supplemental Data | ||||||||||||||||||||||||||||||||||
| Total Distributions | Net Asset Value, End of Period | Total Return (Excludes Sales Charge)(b) | Net Expenses(c) | Net Investment Income (Loss)(c) | Gross Expenses(c) | Net Assets, End of Period (000's) | Portfolio Turnover(b)(d) | ||||||||||||||||||||||||||||
Victory RS Partners Fund | |||||||||||||||||||||||||||||||||||
Class A | |||||||||||||||||||||||||||||||||||
| Six Months Ended 6/30/20 (unaudited) | — | $ | 18.37 | (24.93 | )% | 1.45 | % | 0.38 | % | 1.56 | % | $ | 131,473 | 65 | % | ||||||||||||||||||||
Year Ended 12/31/19 | (2.43 | ) | $ | 24.47 | 30.69 | % | 1.45 | % | 0.49 | % | 1.52 | % | $ | 193,630 | 57 | % | |||||||||||||||||||
Year Ended 12/31/18 | (5.07 | ) | $ | 20.66 | (12.04 | )% | 1.45 | % | 0.14 | % | 1.52 | % | $ | 175,723 | 62 | % | |||||||||||||||||||
Year Ended 12/31/17 | (6.90 | ) | $ | 29.21 | 14.21 | % | 1.45 | % | (0.75 | )% | 1.50 | % | $ | 259,050 | 38 | % | |||||||||||||||||||
Year Ended 12/31/16 | (1.78 | ) | $ | 31.58 | 24.04 | % | 1.45 | % | (0.44 | )% | 1.53 | % | $ | 378,695 | 60 | % | |||||||||||||||||||
Year Ended 12/31/15 | (0.86 | ) | $ | 26.89 | (10.74 | )% | 1.42 | % | (0.35 | )% | 1.42 | % | $ | 475,722 | 42 | % | |||||||||||||||||||
Class R | |||||||||||||||||||||||||||||||||||
| Six Months Ended 6/30/20 (unaudited) | — | $ | 16.49 | (25.08 | )% | 1.81 | % | 0.03 | % | 2.94 | % | $ | 1,149 | 65 | % | ||||||||||||||||||||
Year Ended 12/31/19 | (2.36 | ) | $ | 22.01 | 30.26 | % | 1.81 | % | 0.12 | % | 2.63 | % | $ | 1,510 | 57 | % | |||||||||||||||||||
Year Ended 12/31/18 | (4.99 | ) | $ | 18.79 | (12.39 | )% | 1.81 | % | (0.16 | )% | 2.37 | % | $ | 1,207 | 62 | % | |||||||||||||||||||
Year Ended 12/31/17 | (6.90 | ) | $ | 27.09 | 13.81 | % | 1.81 | % | (1.40 | )% | 2.28 | % | $ | 2,168 | 38 | % | |||||||||||||||||||
Year Ended 12/31/16 | (1.78 | ) | $ | 29.84 | 23.64 | % | 1.81 | % | (0.78 | )% | 1.81 | % | $ | 2,452 | 60 | % | |||||||||||||||||||
Year Ended 12/31/15 | (0.86 | ) | $ | 25.57 | (11.09 | )% | 1.81 | % | (0.74 | )% | 1.81 | % | $ | 2,365 | 42 | % | |||||||||||||||||||
Class Y | |||||||||||||||||||||||||||||||||||
| Six Months Ended 6/30/20 (unaudited) | — | $ | 19.68 | (24.80 | )% | 1.12 | % | 0.71 | % | 1.24 | % | $ | 164,772 | 65 | % | ||||||||||||||||||||
Year Ended 12/31/19 | (2.50 | ) | $ | 26.17 | 31.18 | % | 1.12 | % | 0.82 | % | 1.21 | % | $ | 232,432 | 57 | % | |||||||||||||||||||
Year Ended 12/31/18 | (5.16 | ) | $ | 21.94 | (11.77 | )% | 1.12 | % | 0.48 | % | 1.19 | % | $ | 250,709 | 62 | % | |||||||||||||||||||
Year Ended 12/31/17 | (6.90 | ) | $ | 30.67 | 14.59 | % | 1.12 | % | (0.11 | )% | 1.21 | % | $ | 349,022 | 38 | % | |||||||||||||||||||
Year Ended 12/31/16 | (1.78 | ) | $ | 32.75 | 24.41 | % | 1.12 | % | (0.11 | )% | 1.22 | % | $ | 378,271 | 60 | % | |||||||||||||||||||
Year Ended 12/31/15 | (0.86 | ) | $ | 27.75 | (10.47 | )% | 1.12 | % | (0.05 | )% | 1.18 | % | $ | 542,595 | 42 | % | |||||||||||||||||||
See notes to financial statements.
29
Victory Portfolios | Financial Highlights | ||||||
For a Share Outstanding Throughout Each Period
Investment Activities | Distributions to Shareholders From | ||||||||||||||||||||||||||||||
| Net Asset Value, Beginning of Period | Net Investment Income (Loss)(a) | Net Realized and Unrealized Gains (Losses) on Investments | Total from Investment Activities | Net Investment Income | Net Realized Gains from Investments | Total Distributions | |||||||||||||||||||||||||
Victory RS Value Fund | |||||||||||||||||||||||||||||||
Class A | |||||||||||||||||||||||||||||||
| Six Months Ended 6/30/20 (unaudited) | $ | 24.79 | 0.04 | (5.66 | ) | (5.62 | ) | — | — | — | |||||||||||||||||||||
| Year Ended 12/31/19 | $ | 20.28 | 0.07 | 6.28 | 6.35 | (0.14 | ) | (1.70 | ) | (1.84 | ) | ||||||||||||||||||||
| Year Ended 12/31/18 | $ | 26.21 | 0.06 | (2.85 | ) | (2.79 | ) | (0.14 | ) | (3.00 | ) | (3.14 | ) | ||||||||||||||||||
| Year Ended 12/31/17 | $ | 27.94 | 0.03 | 4.80 | 4.83 | (0.04 | ) | (6.52 | ) | (6.56 | ) | ||||||||||||||||||||
| Year Ended 12/31/16 | $ | 28.33 | — | (e) | 3.09 | 3.09 | (0.13 | ) | (3.35 | ) | (3.48 | ) | |||||||||||||||||||
| Year Ended 12/31/15 | $ | 33.04 | (0.08 | ) | (1.98 | ) | (2.06 | ) | — | (e) | (2.65 | ) | (2.65 | ) | |||||||||||||||||
Class C | |||||||||||||||||||||||||||||||
| Six Months Ended 6/30/20 (unaudited) | $ | 21.85 | (0.04 | ) | (4.98 | ) | (5.02 | ) | — | — | — | ||||||||||||||||||||
| Year Ended 12/31/19 | $ | 18.08 | (0.11 | ) | 5.58 | 5.47 | — | (1.70 | ) | (1.70 | ) | ||||||||||||||||||||
| Year Ended 12/31/18 | $ | 23.76 | (0.13 | ) | (2.55 | ) | (2.68 | ) | — | (3.00 | ) | (3.00 | ) | ||||||||||||||||||
| Year Ended 12/31/17 | $ | 26.01 | (0.08 | ) | 4.35 | 4.27 | — | (6.52 | ) | (6.52 | ) | ||||||||||||||||||||
| Year Ended 12/31/16 | $ | 26.69 | (0.21 | ) | 2.88 | 2.67 | — | (3.35 | ) | (3.35 | ) | ||||||||||||||||||||
| Year Ended 12/31/15 | $ | 31.54 | (0.32 | ) | (1.88 | ) | (2.20 | ) | — | (2.65 | ) | (2.65 | ) | ||||||||||||||||||
(a) Per share net investment income (loss) has been calculated using the average daily shares method.
(b) Not annualized for periods less than one year.
(c) Annualized for periods less than one year.
(d) Portfolio turnover is calculated on the basis of the Fund as a whole without distinguishing between the classes of shares issued.
(e) Amount is less than $0.005 per share.
(f) The Fund received monies related to a nonrecurring refund from the prior Custodian. The corresponding impact to the total return was less than 0.005% for the period shown. (See Note 8)
See notes to financial statements.
30
Victory Portfolios | Financial Highlights — continued | ||||||
For a Share Outstanding Throughout Each Period (continued)
Ratios to Average Net Assets | Supplemental Data | ||||||||||||||||||||||||||||||||||
| Capital Contributions from Prior Custodian, Net (See Note 8) | Net Asset Value, End of Period | Total Return (Excludes Sales Charge)(b) | Net Expenses(c) | Net Investment Income (Loss)(c) | Gross Expenses(c) | Net Assets, End of Period (000's) | Portfolio Turnover(b)(d) | ||||||||||||||||||||||||||||
Victory RS Value Fund | |||||||||||||||||||||||||||||||||||
Class A | |||||||||||||||||||||||||||||||||||
| Six Months Ended 6/30/20 (unaudited) | — | $ | 19.17 | (22.67 | )% | 1.30 | % | 0.41 | % | 1.38 | % | $ | 145,857 | 47 | % | ||||||||||||||||||||
| Year Ended 12/31/19 | — | $ | 24.79 | 31.35 | % | 1.30 | % | 0.28 | % | 1.35 | % | $ | 207,200 | 54 | % | ||||||||||||||||||||
| Year Ended 12/31/18 | — | $ | 20.28 | (10.75 | )% | 1.30 | % | 0.24 | % | 1.34 | % | $ | 179,535 | 65 | % | ||||||||||||||||||||
| Year Ended 12/31/17 | — | $ | 26.21 | 17.41 | % | 1.30 | % | 0.09 | % | 1.33 | % | $ | 239,994 | 64 | % | ||||||||||||||||||||
| Year Ended 12/31/16 | — | (e) | $ | 27.94 | 10.92 | %(f) | 1.30 | % | (0.01 | )% | 1.35 | % | $ | 268,979 | 67 | % | |||||||||||||||||||
| Year Ended 12/31/15 | — | $ | 28.33 | (6.18 | )% | 1.26 | % | (0.24 | )% | 1.26 | % | $ | 352,205 | 55 | % | ||||||||||||||||||||
Class C | |||||||||||||||||||||||||||||||||||
| Six Months Ended 6/30/20 (unaudited) | — | $ | 16.83 | (22.97 | )% | 2.07 | % | (0.39 | )% | 2.59 | % | $ | 2,762 | 47 | % | ||||||||||||||||||||
| Year Ended 12/31/19 | — | $ | 21.85 | 30.32 | % | 2.07 | % | (0.50 | )% | 2.29 | % | $ | 4,872 | 54 | % | ||||||||||||||||||||
| Year Ended 12/31/18 | — | $ | 18.08 | (11.41 | )% | 2.07 | % | (0.54 | )% | 2.14 | % | $ | 9,428 | 65 | % | ||||||||||||||||||||
| Year Ended 12/31/17 | — | $ | 23.76 | 16.53 | % | 2.07 | % | (0.30 | )% | 2.08 | % | $ | 16,916 | 64 | % | ||||||||||||||||||||
| Year Ended 12/31/16 | — | (e) | $ | 26.01 | 10.01 | %(f) | 2.07 | % | (0.78 | )% | 2.13 | % | $ | 19,943 | 67 | % | |||||||||||||||||||
| Year Ended 12/31/15 | — | $ | 26.69 | (6.92 | )% | 2.04 | % | (1.03 | )% | 2.04 | % | $ | 24,714 | 55 | % | ||||||||||||||||||||
(continues on next page)
See notes to financial statements.
31
Victory Portfolios | Financial Highlights | ||||||
For a Share Outstanding Throughout Each Period
Investment Activities | Distributions to Shareholders From | ||||||||||||||||||||||||||||||
| Net Asset Value, Beginning of Period | Net Investment Income (Loss)(a) | Net Realized and Unrealized Gains (Losses) on Investments | Total from Investment Activities | Net Investment Income | Net Realized Gains from Investments | Total Distributions | |||||||||||||||||||||||||
Victory RS Value Fund | |||||||||||||||||||||||||||||||
Class R | |||||||||||||||||||||||||||||||
| Six Months Ended 6/30/20 (unaudited) | $ | 23.44 | — | (e) | (5.35 | ) | (5.35 | ) | — | — | — | ||||||||||||||||||||
| Year Ended 12/31/19 | $ | 19.26 | (0.03 | ) | 5.95 | 5.92 | (0.04 | ) | (1.70 | ) | (1.74 | ) | |||||||||||||||||||
| Year Ended 12/31/18 | $ | 25.06 | (0.03 | ) | (2.72 | ) | (2.75 | ) | (0.05 | ) | (3.00 | ) | (3.05 | ) | |||||||||||||||||
| Year Ended 12/31/17 | $ | 27.03 | (0.03 | ) | 4.58 | 4.55 | — | (6.52 | ) | (6.52 | ) | ||||||||||||||||||||
| Year Ended 12/31/16 | $ | 27.51 | (0.09 | ) | 2.96 | 2.87 | — | (3.35 | ) | (3.35 | ) | ||||||||||||||||||||
| Year Ended 12/31/15 | $ | 32.29 | (0.21 | ) | (1.92 | ) | (2.13 | ) | — | (2.65 | ) | (2.65 | ) | ||||||||||||||||||
Class Y | |||||||||||||||||||||||||||||||
| Six Months Ended 6/30/20 (unaudited) | $ | 25.45 | 0.07 | (5.82 | ) | (5.75 | ) | — | — | — | |||||||||||||||||||||
| Year Ended 12/31/19 | $ | 20.77 | 0.13 | 6.44 | 6.57 | (0.19 | ) | (1.70 | ) | (1.89 | ) | ||||||||||||||||||||
| Year Ended 12/31/18 | $ | 26.77 | 0.13 | (2.92 | ) | (2.79 | ) | (0.21 | ) | (3.00 | ) | (3.21 | ) | ||||||||||||||||||
| Year Ended 12/31/17 | $ | 28.40 | 0.06 | 4.94 | 5.00 | (0.11 | ) | (6.52 | ) | (6.63 | ) | ||||||||||||||||||||
| Year Ended 12/31/16 | $ | 28.57 | 0.08 | 3.10 | 3.18 | — | (3.35 | ) | (3.35 | ) | |||||||||||||||||||||
| Year Ended 12/31/15 | $ | 33.23 | (0.02 | ) | (1.99 | ) | (2.01 | ) | — | (2.65 | ) | (2.65 | ) | ||||||||||||||||||
(a) Per share net investment income (loss) has been calculated using the average daily shares method.
(b) Not annualized for periods less than one year.
(c) Annualized for periods less than one year.
(d) Portfolio turnover is calculated on the basis of the Fund as a whole without distinguishing between the classes of shares issued.
(e) Amount is less than $0.005 per share.
(f) The Fund received monies related to a nonrecurring refund from the prior Custodian. The corresponding impact to the total return was less than 0.005% for the period shown. (See Note 8)
See notes to financial statements.
32
Victory Portfolios | Financial Highlights — continued | ||||||
For a Share Outstanding Throughout Each Period (continued)
Ratios to Average Net Assets | Supplemental Data | ||||||||||||||||||||||||||||||||||
| Capital Contributions from Prior Custodian, Net (See Note 8) | Net Asset Value, End of Period | Total Return (Excludes Sales Charge)(b) | Net Expenses(c) | Net Investment Income (Loss)(c) | Gross Expenses(c) | Net Assets, End of Period (000's) | Portfolio Turnover(b)(d) | ||||||||||||||||||||||||||||
Victory RS Value Fund | |||||||||||||||||||||||||||||||||||
Class R | |||||||||||||||||||||||||||||||||||
| Six Months Ended 6/30/20 (unaudited) | — | $ | 18.09 | (22.82 | )% | 1.69 | % | 0.01 | % | 3.91 | % | $ | 661 | 47 | % | ||||||||||||||||||||
| Year Ended 12/31/19 | — | $ | 23.44 | 30.89 | % | 1.69 | % | (0.13 | )% | 3.47 | % | $ | 1,022 | 54 | % | ||||||||||||||||||||
| Year Ended 12/31/18 | — | $ | 19.26 | (11.12 | )% | 1.69 | % | (0.11 | )% | 2.82 | % | $ | 1,019 | 65 | % | ||||||||||||||||||||
| Year Ended 12/31/17 | — | $ | 25.06 | 16.95 | % | 1.69 | % | (0.11 | )% | 2.29 | % | $ | 1,625 | 64 | % | ||||||||||||||||||||
| Year Ended 12/31/16 | — | (e) | $ | 27.03 | 10.45 | %(f) | 1.69 | % | (0.34 | )% | 1.80 | % | $ | 1,670 | 67 | % | |||||||||||||||||||
| Year Ended 12/31/15 | — | $ | 27.51 | (6.54 | )% | 1.65 | % | (0.64 | )% | 1.65 | % | $ | 3,456 | 55 | % | ||||||||||||||||||||
Class Y | |||||||||||||||||||||||||||||||||||
| Six Months Ended 6/30/20 (unaudited) | — | $ | 19.70 | (22.59 | )% | 1.06 | % | 0.65 | % | 1.12 | % | $ | 129,211 | 47 | % | ||||||||||||||||||||
| Year Ended 12/31/19 | — | $ | 25.45 | 31.69 | % | 1.06 | % | 0.51 | % | 1.07 | % | $ | 176,749 | 54 | % | ||||||||||||||||||||
| Year Ended 12/31/18 | — | $ | 20.77 | (10.54 | )% | 1.06 | % | 0.49 | % | 1.06 | % | $ | 166,538 | 65 | % | ||||||||||||||||||||
| Year Ended 12/31/17 | — | $ | 26.77 | 17.71 | % | 1.06 | % | 0.20 | % | 1.06 | % | $ | 247,528 | 64 | % | ||||||||||||||||||||
| Year Ended 12/31/16 | — | (e) | $ | 28.40 | 11.14 | %(f) | 1.06 | % | 0.26 | % | 1.19 | % | $ | 260,818 | 67 | % | |||||||||||||||||||
| Year Ended 12/31/15 | — | $ | 28.57 | (5.99 | )% | 1.06 | % | (0.05 | )% | 1.11 | % | $ | 724,715 | 55 | % | ||||||||||||||||||||
See notes to financial statements.
33
Victory Portfolios | Financial Highlights | ||||||
For a Share Outstanding Throughout Each Period
Investment Activities | Distributions to Shareholders From | ||||||||||||||||||||||||||||||
| Net Asset Value, Beginning of Period | Net Investment Income (Loss)(a) | Net Realized and Unrealized Gains (Losses) on Investments | Total from Investment Activities | Net Investment Income | Net Realized Gains from Investments | Total Distributions | |||||||||||||||||||||||||
Victory RS Large Cap Alpha Fund | |||||||||||||||||||||||||||||||
Class A | |||||||||||||||||||||||||||||||
| Six Months Ended 6/30/20 (unaudited) | $ | 53.11 | 0.33 | (10.53 | ) | (10.20 | ) | — | — | — | |||||||||||||||||||||
| Year Ended 12/31/19 | $ | 42.20 | 0.51 | 12.44 | 12.95 | (0.37 | ) | (1.67 | ) | (2.04 | ) | ||||||||||||||||||||
| Year Ended 12/31/18 | $ | 56.61 | 0.44 | (5.67 | ) | (5.23 | ) | (0.38 | ) | (8.80 | ) | (9.18 | ) | ||||||||||||||||||
| Year Ended 12/31/17 | $ | 51.86 | 0.38 | 9.10 | 9.48 | — | (e) | (4.73 | ) | (4.73 | ) | ||||||||||||||||||||
| Year Ended 12/31/16 | $ | 50.98 | 0.40 | 4.01 | 4.41 | (0.42 | ) | (3.12 | ) | (3.54 | ) | ||||||||||||||||||||
| Year Ended 12/31/15 | $ | 59.25 | 0.50 | (1.74 | ) | (1.24 | ) | (0.57 | ) | (6.46 | ) | (7.03 | ) | ||||||||||||||||||
Class C | |||||||||||||||||||||||||||||||
| Six Months Ended 6/30/20 (unaudited) | $ | 44.70 | 0.13 | (8.86 | ) | (8.73 | ) | — | — | — | |||||||||||||||||||||
| Year Ended 12/31/19 | $ | 35.78 | 0.10 | 10.50 | 10.60 | (0.01 | ) | (1.67 | ) | (1.68 | ) | ||||||||||||||||||||
| Year Ended 12/31/18 | $ | 49.50 | (0.03 | ) | (4.89 | ) | (4.92 | ) | — | (e) | (8.80 | ) | (8.80 | ) | |||||||||||||||||
| Year Ended 12/31/17 | $ | 46.22 | (0.04 | ) | 8.05 | 8.01 | — | (4.73 | ) | (4.73 | ) | ||||||||||||||||||||
| Year Ended 12/31/16 | $ | 45.80 | — | (e) | 3.57 | 3.57 | (0.04 | ) | (3.12 | ) | (3.16 | ) | |||||||||||||||||||
| Year Ended 12/31/15 | $ | 53.96 | 0.03 | (1.58 | ) | (1.55 | ) | (0.15 | ) | (6.46 | ) | (6.61 | ) | ||||||||||||||||||
(a) Per share net investment income (loss) has been calculated using the average daily shares method.
(b) Not annualized for periods less than one year.
(c) Annualized for periods less than one year.
(d) Portfolio turnover is calculated on the basis of the Fund as a whole without distinguishing between the classes of shares issued.
(e) Amount is less than $0.005 per share.
(f) The Fund received monies related to a nonrecurring refund from the prior Custodian. The corresponding impact to the total return was less than 0.01% for the period shown. (See Note 8)
See notes to financial statements.
34
Victory Portfolios | Financial Highlights — continued | ||||||
For a Share Outstanding Throughout Each Period (continued)
Ratios to Average Net Assets | Supplemental Data | ||||||||||||||||||||||||||||||||||
| Capital Contributions from Prior Custodian, Net (See Note 8) | Net Asset Value, End of Period | Total Return (Excludes Sales Charge)(b) | Net Expenses(c) | Net Investment Income (Loss)(c) | Gross Expenses(c) | Net Assets, End of Period (000's) | Portfolio Turnover(b)(d) | ||||||||||||||||||||||||||||
Victory RS Large Cap Alpha Fund | |||||||||||||||||||||||||||||||||||
Class A | |||||||||||||||||||||||||||||||||||
| Six Months Ended 6/30/20 (unaudited) | — | $ | 42.91 | (19.21 | )% | 0.89 | % | 1.48 | % | 0.96 | % | $ | 388,241 | 57 | % | ||||||||||||||||||||
| Year Ended 12/31/19 | — | $ | 53.11 | 30.73 | % | 0.89 | % | 1.03 | % | 0.95 | % | $ | 520,159 | 51 | % | ||||||||||||||||||||
| Year Ended 12/31/18 | — | $ | 42.20 | (9.31 | )% | 0.89 | % | 0.77 | % | 0.93 | % | $ | 439,035 | 59 | % | ||||||||||||||||||||
| Year Ended 12/31/17 | — | $ | 56.61 | 18.32 | % | 0.89 | % | 0.68 | % | 0.94 | % | $ | 540,762 | 55 | % | ||||||||||||||||||||
| Year Ended 12/31/16 | 0.01 | $ | 51.86 | 8.67 | %(f) | 0.89 | % | 0.79 | % | 0.92 | % | $ | 522,593 | 79 | % | ||||||||||||||||||||
| Year Ended 12/31/15 | — | $ | 50.98 | (2.03 | )% | 0.89 | % | 0.86 | % | 0.89 | % | $ | 556,204 | 39 | % | ||||||||||||||||||||
Class C | |||||||||||||||||||||||||||||||||||
| Six Months Ended 6/30/20 (unaudited) | — | $ | 35.97 | (19.55 | )% | 1.69 | % | 0.68 | % | 1.79 | % | $ | 12,020 | 57 | % | ||||||||||||||||||||
| Year Ended 12/31/19 | — | $ | 44.70 | 29.70 | % | 1.69 | % | 0.24 | % | 1.74 | % | $ | 17,028 | 51 | % | ||||||||||||||||||||
| Year Ended 12/31/18 | — | $ | 35.78 | (10.03 | )% | 1.69 | % | (0.06 | )% | 1.75 | % | $ | 18,227 | 59 | % | ||||||||||||||||||||
| Year Ended 12/31/17 | — | $ | 49.50 | 17.36 | % | 1.69 | % | (0.08 | )% | 1.71 | % | $ | 29,771 | 55 | % | ||||||||||||||||||||
| Year Ended 12/31/16 | 0.01 | $ | 46.22 | 7.80 | %(f) | 1.69 | % | (0.01 | )% | 1.71 | % | $ | 28,801 | 79 | % | ||||||||||||||||||||
| Year Ended 12/31/15 | — | $ | 45.80 | (2.80 | )% | 1.69 | % | 0.06 | % | 1.69 | % | $ | 33,608 | 39 | % | ||||||||||||||||||||
(continues on next page)
See notes to financial statements.
35
Victory Portfolios | Financial Highlights | ||||||
For a Share Outstanding Throughout Each Period
Investment Activities | Distributions to Shareholders From | ||||||||||||||||||||||||||||||
| Net Asset Value, Beginning of Period | Net Investment Income (Loss)(a) | Net Realized and Unrealized Gains (Losses) on Investments | Total from Investment Activities | Net Investment Income | Net Realized Gains from Investments | Total Distributions | |||||||||||||||||||||||||
Victory RS Large Cap Alpha Fund | |||||||||||||||||||||||||||||||
Class R | |||||||||||||||||||||||||||||||
| Six Months Ended 6/30/20 (unaudited) | $ | 52.83 | 0.25 | (10.48 | ) | (10.23 | ) | — | — | — | |||||||||||||||||||||
| Year Ended 12/31/19 | $ | 42.01 | 0.32 | 12.36 | 12.68 | (0.19 | ) | (1.67 | ) | (1.86 | ) | ||||||||||||||||||||
| Year Ended 12/31/18 | $ | 56.35 | 0.22 | (5.61 | ) | (5.39 | ) | (0.15 | ) | (8.80 | ) | (8.95 | ) | ||||||||||||||||||
| Year Ended 12/31/17 | $ | 51.83 | 0.18 | 9.07 | 9.25 | — | (4.73 | ) | (4.73 | ) | |||||||||||||||||||||
| Year Ended 12/31/16 | $ | 50.93 | 0.23 | 3.99 | 4.22 | (0.21 | ) | (3.12 | ) | (3.33 | ) | ||||||||||||||||||||
| Year Ended 12/31/15 | $ | 59.15 | 0.29 | (1.74 | ) | (1.45 | ) | (0.31 | ) | (6.46 | ) | (6.77 | ) | ||||||||||||||||||
Class Y | |||||||||||||||||||||||||||||||
| Six Months Ended 6/30/20 (unaudited) | $ | 52.87 | 0.38 | (10.49 | ) | (10.11 | ) | — | — | — | |||||||||||||||||||||
| Year Ended 12/31/19 | $ | 42.01 | 0.61 | 12.38 | 12.99 | (0.46 | ) | (1.67 | ) | (2.13 | ) | ||||||||||||||||||||
| Year Ended 12/31/18 | $ | 56.38 | 0.55 | (5.64 | ) | (5.09 | ) | (0.48 | ) | (8.80 | ) | (9.28 | ) | ||||||||||||||||||
| Year Ended 12/31/17 | $ | 51.66 | 0.49 | 9.07 | 9.56 | (0.11 | ) | (4.73 | ) | (4.84 | ) | ||||||||||||||||||||
| Year Ended 12/31/16 | $ | 50.82 | 0.51 | 4.00 | 4.51 | (0.56 | ) | (3.12 | ) | (3.68 | ) | ||||||||||||||||||||
| Year Ended 12/31/15 | $ | 59.08 | 0.62 | (1.74 | ) | (1.12 | ) | (0.68 | ) | (6.46 | ) | (7.14 | ) | ||||||||||||||||||
(a) Per share net investment income (loss) has been calculated using the average daily shares method.
(b) Not annualized for periods less than one year.
(c) Annualized for periods less than one year.
(d) Portfolio turnover is calculated on the basis of the Fund as a whole without distinguishing between the classes of shares issued.
(e) Amount is less than $0.005 per share.
(f) The Fund received monies related to a nonrecurring refund from the prior Custodian. The corresponding impact to the total return was less than 0.01% for the period shown. (See Note 8)
See notes to financial statements.
36
Victory Portfolios | Financial Highlights — continued | ||||||
For a Share Outstanding Throughout Each Period (continued)
Ratios to Average Net Assets | Supplemental Data | ||||||||||||||||||||||||||||||||||
| Capital Contributions from Prior Custodian, Net (See Note 8) | Net Asset Value, End of Period | Total Return (Excludes Sales Charge)(b) | Net Expenses(c) | Net Investment Income (Loss)(c) | Gross Expenses(c) | Net Assets, End of Period (000's) | Portfolio Turnover(b)(d) | ||||||||||||||||||||||||||||
Victory RS Large Cap Alpha Fund | |||||||||||||||||||||||||||||||||||
Class R | |||||||||||||||||||||||||||||||||||
| Six Months Ended 6/30/20 (unaudited) | — | $ | 42.60 | (19.36 | )% | 1.26 | % | 1.11 | % | 1.52 | % | $ | 5,725 | 57 | % | ||||||||||||||||||||
| Year Ended 12/31/19 | — | $ | 52.83 | 30.23 | % | 1.26 | % | 0.66 | % | 1.48 | % | $ | 7,232 | 51 | % | ||||||||||||||||||||
| Year Ended 12/31/18 | — | $ | 42.01 | (9.63 | )% | 1.26 | % | 0.38 | % | 1.40 | % | $ | 6,348 | 59 | % | ||||||||||||||||||||
| Year Ended 12/31/17 | — | $ | 56.35 | 17.87 | % | 1.26 | % | 0.33 | % | 1.42 | % | $ | 10,229 | 55 | % | ||||||||||||||||||||
| Year Ended 12/31/16 | 0.01 | $ | 51.83 | 8.30 | %(f) | 1.23 | % | 0.45 | % | 1.23 | % | $ | 10,631 | 79 | % | ||||||||||||||||||||
| Year Ended 12/31/15 | — | $ | 50.93 | (2.38 | )% | 1.26 | % | 0.49 | % | 1.26 | % | $ | 12,402 | 39 | % | ||||||||||||||||||||
Class Y | |||||||||||||||||||||||||||||||||||
| Six Months Ended 6/30/20 (unaudited) | — | $ | 42.76 | (19.12 | )% | 0.68 | % | 1.69 | % | 0.84 | % | $ | 14,149 | 57 | % | ||||||||||||||||||||
| Year Ended 12/31/19 | — | $ | 52.87 | 30.99 | % | 0.68 | % | 1.24 | % | 0.78 | % | $ | 20,021 | 51 | % | ||||||||||||||||||||
| Year Ended 12/31/18 | — | $ | 42.01 | (9.11 | )% | 0.68 | % | 0.96 | % | 0.75 | % | $ | 21,827 | 59 | % | ||||||||||||||||||||
| Year Ended 12/31/17 | — | $ | 56.38 | 18.56 | % | 0.68 | % | 0.88 | % | 0.72 | % | $ | 33,638 | 55 | % | ||||||||||||||||||||
| Year Ended 12/31/16 | 0.01 | $ | 51.66 | 8.89 | %(f) | 0.68 | % | 1.00 | % | 0.69 | % | $ | 31,840 | 79 | % | ||||||||||||||||||||
| Year Ended 12/31/15 | — | $ | 50.82 | (1.82 | )% | 0.68 | % | 1.05 | % | 0.68 | % | $ | 31,662 | 39 | % | ||||||||||||||||||||
See notes to financial statements.
37
Victory Portfolios | Financial Highlights | ||||||
For a Share Outstanding Throughout Each Period
Investment Activities | Distributions to Shareholders From | ||||||||||||||||||||||||||
| Net Asset Value, Beginning of Period | Net Investment Income (Loss)(a) | Net Realized and Unrealized Gains (Losses) on Investments | Total from Investment Activities | Net Investment Income | Net Realized Gains From Investments | ||||||||||||||||||||||
Victory RS Investors Fund | |||||||||||||||||||||||||||
Class A | |||||||||||||||||||||||||||
| Six Months Ended 6/30/20 (unaudited) | $ | 13.10 | (0.01 | ) | (2.73 | ) | (2.74 | ) | — | — | |||||||||||||||||
Year Ended 12/31/19 | $ | 10.68 | — | (e) | 2.99 | 2.99 | — | (0.57 | ) | ||||||||||||||||||
Year Ended 12/31/18 | $ | 13.86 | — | (e) | (1.27 | ) | (1.27 | ) | — | (1.91 | ) | ||||||||||||||||
Year Ended 12/31/17 | $ | 13.65 | (0.03 | ) | 2.23 | 2.20 | — | (1.99 | ) | ||||||||||||||||||
Year Ended 12/31/16 | $ | 12.42 | — | (e) | 1.23 | 1.23 | — | — | |||||||||||||||||||
Year Ended 12/31/15 | $ | 12.95 | (0.04 | ) | (0.49 | ) | (0.53 | ) | — | — | |||||||||||||||||
Class C | |||||||||||||||||||||||||||
| Six Months Ended 6/30/20 (unaudited) | $ | 11.54 | (0.04 | ) | (2.40 | ) | (2.44 | ) | — | — | |||||||||||||||||
Year Ended 12/31/19 | $ | 9.53 | (0.08 | ) | 2.66 | 2.58 | — | (0.57 | ) | ||||||||||||||||||
Year Ended 12/31/18 | $ | 12.68 | (0.10 | ) | (1.14 | ) | (1.24 | ) | — | (1.91 | ) | ||||||||||||||||
Year Ended 12/31/17 | $ | 12.73 | (0.19 | ) | 2.13 | 1.94 | — | (1.99 | ) | ||||||||||||||||||
Year Ended 12/31/16 | $ | 11.67 | (0.09 | ) | 1.15 | 1.06 | — | — | |||||||||||||||||||
Year Ended 12/31/15 | $ | 12.26 | (0.12 | ) | (0.47 | ) | (0.59 | ) | — | — | |||||||||||||||||
Class R | |||||||||||||||||||||||||||
| Six Months Ended 6/30/20 (unaudited) | $ | 11.72 | (0.04 | ) | (2.44 | ) | (2.48 | ) | — | — | |||||||||||||||||
Year Ended 12/31/19 | $ | 9.66 | (0.07 | ) | 2.70 | 2.63 | — | (0.57 | ) | ||||||||||||||||||
Year Ended 12/31/18 | $ | 12.81 | (0.08 | ) | (1.16 | ) | (1.24 | ) | — | (1.91 | ) | ||||||||||||||||
Year Ended 12/31/17 | $ | 12.83 | (0.17 | ) | 2.14 | 1.97 | — | (1.99 | ) | ||||||||||||||||||
Year Ended 12/31/16 | $ | 11.73 | (0.06 | ) | 1.16 | 1.10 | — | — | |||||||||||||||||||
Year Ended 12/31/15 | $ | 12.30 | (0.09 | ) | (0.48 | ) | (0.57 | ) | — | — | |||||||||||||||||
Class Y | |||||||||||||||||||||||||||
| Six Months Ended 6/30/20 (unaudited) | $ | 13.47 | 0.01 | (2.81 | ) | (2.80 | ) | — | — | ||||||||||||||||||
Year Ended 12/31/19 | $ | 10.94 | 0.03 | 3.07 | 3.10 | — | (0.57 | ) | |||||||||||||||||||
Year Ended 12/31/18 | $ | 14.10 | 0.03 | (1.28 | ) | (1.25 | ) | — | (1.91 | ) | |||||||||||||||||
Year Ended 12/31/17 | $ | 13.82 | 0.03 | 2.24 | 2.27 | — | (1.99 | ) | |||||||||||||||||||
Year Ended 12/31/16 | $ | 12.55 | 0.04 | 1.24 | 1.28 | (0.01 | ) | — | |||||||||||||||||||
Year Ended 12/31/15 | $ | 13.05 | — | (0.50 | ) | (0.50 | ) | — | — | ||||||||||||||||||
(a) Per share net investment income (loss) has been calculated using the average daily shares method.
(b) Not annualized for periods less than one year.
(c) Annualized for periods less than one year.
(d) Portfolio turnover is calculated on the basis of the Fund as a whole without distinguishing between the classes of shares issued.
(e) Amount is less than $0.005 per share.
See notes to financial statements.
38
Victory Portfolios | Financial Highlights — continued | ||||||
For a Share Outstanding Throughout Each Period (continued)
Ratios to Average Net Assets | Supplemental Data | ||||||||||||||||||||||||||||||||||
| Total Distributions | Net Asset Value, End of Period | Total Return (Excludes Sales charge)(b) | Net Expenses(c) | Net Investment Income (Loss)(c) | Gross Expenses(c) | Net Assets, End of Period (000's) | Portfolio Turnover(b)(d) | ||||||||||||||||||||||||||||
Victory RS Investors Fund | |||||||||||||||||||||||||||||||||||
Class A | |||||||||||||||||||||||||||||||||||
| Six Months Ended 6/30/20 (unaudited) | — | $ | 10.36 | (20.92 | )% | 1.33 | % | (0.11 | )% | 1.71 | % | $ | 10,555 | 43 | % | ||||||||||||||||||||
Year Ended 12/31/19 | (0.57 | ) | $ | 13.10 | 28.01 | % | 1.33 | % | 0.03 | % | 1.62 | % | $ | 16,906 | 64 | % | |||||||||||||||||||
Year Ended 12/31/18 | (1.91 | ) | $ | 10.68 | (9.36 | )% | 1.33 | % | (0.03 | )% | 1.58 | % | $ | 15,682 | 56 | % | |||||||||||||||||||
Year Ended 12/31/17 | (1.99 | ) | $ | 13.86 | 16.28 | % | 1.33 | % | (0.24 | )% | 1.54 | % | $ | 20,419 | 80 | % | |||||||||||||||||||
Year Ended 12/31/16 | — | $ | 13.65 | 9.90 | % | 1.33 | % | 0.02 | % | 1.56 | % | $ | 28,022 | 92 | % | ||||||||||||||||||||
Year Ended 12/31/15 | — | $ | 12.42 | (4.09 | )% | 1.33 | % | (0.28 | )% | 1.51 | % | $ | 41,556 | 50 | % | ||||||||||||||||||||
Class C | |||||||||||||||||||||||||||||||||||
| Six Months Ended 6/30/20 (unaudited) | — | $ | 9.10 | (21.14 | )% | 2.07 | % | (0.86 | )% | 2.70 | % | $ | 4,364 | 43 | % | ||||||||||||||||||||
Year Ended 12/31/19 | (0.57 | ) | $ | 11.54 | 27.08 | % | 2.07 | % | (0.73 | )% | 2.54 | % | $ | 6,898 | 64 | % | |||||||||||||||||||
Year Ended 12/31/18 | (1.91 | ) | $ | 9.53 | (10.08 | )% | 2.07 | % | (0.82 | )% | 2.44 | % | $ | 7,282 | 56 | % | |||||||||||||||||||
Year Ended 12/31/17 | (1.99 | ) | $ | 12.68 | 15.48 | % | 2.07 | % | (1.42 | )% | 2.35 | % | $ | 11,149 | 80 | % | |||||||||||||||||||
Year Ended 12/31/16 | — | $ | 12.73 | 9.08 | % | 2.07 | % | (0.72 | )% | 2.35 | % | $ | 14,517 | 92 | % | ||||||||||||||||||||
Year Ended 12/31/15 | — | $ | 11.67 | (4.81 | )% | 2.07 | % | (1.01 | )% | 2.29 | % | $ | 21,654 | 50 | % | ||||||||||||||||||||
Class R | |||||||||||||||||||||||||||||||||||
| Six Months Ended 6/30/20 (unaudited) | — | $ | 9.24 | (21.16 | )% | 1.95 | % | (0.73 | )% | 4.39 | % | $ | 687 | 43 | % | ||||||||||||||||||||
Year Ended 12/31/19 | (0.57 | ) | $ | 11.72 | 27.24 | % | 1.95 | % | (0.59 | )% | 3.85 | % | $ | 844 | 64 | % | |||||||||||||||||||
Year Ended 12/31/18 | (1.91 | ) | $ | 9.66 | (9.91 | )% | 1.95 | % | (0.64 | )% | 3.15 | % | $ | 831 | 56 | % | |||||||||||||||||||
Year Ended 12/31/17 | (1.99 | ) | $ | 12.81 | 15.50 | % | 1.95 | % | (1.27 | )% | 2.72 | % | $ | 1,379 | 80 | % | |||||||||||||||||||
Year Ended 12/31/16 | — | $ | 12.83 | 9.38 | % | 1.92 | % | (0.50 | )% | 1.92 | % | $ | 1,314 | 92 | % | ||||||||||||||||||||
Year Ended 12/31/15 | — | $ | 11.73 | (4.63 | )% | 1.84 | % | (0.78 | )% | 1.90 | % | $ | 1,771 | 50 | % | ||||||||||||||||||||
Class Y | |||||||||||||||||||||||||||||||||||
| Six Months Ended 6/30/20 (unaudited) | — | $ | 10.67 | (20.79 | )% | 1.05 | % | 0.13 | % | 1.50 | % | $ | 10,068 | 43 | % | ||||||||||||||||||||
Year Ended 12/31/19 | (0.57 | ) | $ | 13.47 | 28.35 | % | 1.05 | % | 0.27 | % | 1.43 | % | $ | 19,146 | 64 | % | |||||||||||||||||||
Year Ended 12/31/18 | (1.91 | ) | $ | 10.94 | (9.06 | )% | 1.05 | % | 0.18 | % | 1.37 | % | $ | 14,669 | 56 | % | |||||||||||||||||||
Year Ended 12/31/17 | (1.99 | ) | $ | 14.10 | 16.59 | % | 1.05 | % | 0.19 | % | 1.25 | % | $ | 27,131 | 80 | % | |||||||||||||||||||
Year Ended 12/31/16 | (0.01 | ) | $ | 13.82 | 10.17 | % | 1.05 | % | 0.28 | % | 1.24 | % | $ | 50,013 | 92 | % | |||||||||||||||||||
Year Ended 12/31/15 | — | $ | 12.55 | (3.83 | )% | 1.05 | % | (0.01 | )% | 1.21 | % | $ | 80,290 | 50 | % | ||||||||||||||||||||
See notes to financial statements.
39
Victory Portfolios | Financial Highlights | ||||||
For a Share Outstanding Throughout Each Period
Investment Activities | Distributions to Shareholders From | ||||||||||||||||||||||||||
| Net Asset Value, Beginning of Period | Net Investment Income (Loss)(a) | Net Realized and Unrealized Gains (Losses) on Investments | Total from Investment Activities | Net Investment Income | Total Distributions | ||||||||||||||||||||||
Victory Global Natural Resources Fund | |||||||||||||||||||||||||||
Class A | |||||||||||||||||||||||||||
| Six Months Ended 6/30/20 (unaudited) | $ | 9.71 | 0.01 | (1.99 | ) | (1.98 | ) | — | — | ||||||||||||||||||
Year Ended 12/31/19 | $ | 12.86 | — | (e) | (3.15 | ) | (3.15 | ) | — | — | |||||||||||||||||
Year Ended 12/31/18 | $ | 23.73 | (0.14 | ) | (10.73 | ) | (10.87 | ) | — | — | |||||||||||||||||
Year Ended 12/31/17 | $ | 23.49 | (0.22 | ) | 0.46 | 0.24 | — | — | |||||||||||||||||||
Year Ended 12/31/16 | $ | 15.34 | (0.10 | ) | 8.25 | 8.15 | — | — | |||||||||||||||||||
Year Ended 12/31/15 | $ | 24.81 | (0.11 | ) | (9.36 | ) | (9.47 | ) | — | — | |||||||||||||||||
Class C | |||||||||||||||||||||||||||
| Six Months Ended 6/30/20 (unaudited) | $ | 8.71 | (0.02 | ) | (1.78 | ) | (1.80 | ) | — | — | |||||||||||||||||
Year Ended 12/31/19 | $ | 11.63 | (0.08 | ) | (2.84 | ) | (2.92 | ) | — | — | |||||||||||||||||
Year Ended 12/31/18 | $ | 21.63 | (0.28 | ) | (9.72 | ) | (10.00 | ) | — | — | |||||||||||||||||
Year Ended 12/31/17 | $ | 21.59 | (0.36 | ) | 0.40 | 0.04 | — | — | |||||||||||||||||||
Year Ended 12/31/16 | $ | 14.21 | (0.24 | ) | 7.62 | 7.38 | — | — | |||||||||||||||||||
Year Ended 12/31/15 | $ | 23.17 | (0.27 | ) | (8.69 | ) | (8.96 | ) | — | — | |||||||||||||||||
Class R | |||||||||||||||||||||||||||
| Six Months Ended 6/30/20 (unaudited) | $ | 9.16 | (0.01 | ) | (1.87 | ) | (1.88 | ) | — | — | |||||||||||||||||
Year Ended 12/31/19 | $ | 12.18 | (0.04 | ) | (2.98 | ) | (3.02 | ) | — | — | |||||||||||||||||
Year Ended 12/31/18 | $ | 22.56 | (0.20 | ) | (10.18 | ) | (10.38 | ) | — | — | |||||||||||||||||
Year Ended 12/31/17 | $ | 22.42 | (0.29 | ) | 0.43 | 0.14 | — | — | |||||||||||||||||||
Year Ended 12/31/16 | $ | 14.68 | (0.15 | ) | 7.89 | 7.74 | — | — | |||||||||||||||||||
Year Ended 12/31/15 | $ | 23.82 | (0.18 | ) | (8.96 | ) | (9.14 | ) | — | — | |||||||||||||||||
Class Y | |||||||||||||||||||||||||||
| Six Months Ended 6/30/20 (unaudited) | $ | 10.11 | 0.02 | (2.07 | ) | (2.05 | ) | — | — | ||||||||||||||||||
Year Ended 12/31/19 | $ | 13.38 | 0.03 | (3.27 | ) | (3.24 | ) | (0.03 | ) | (0.03 | ) | ||||||||||||||||
Year Ended 12/31/18 | $ | 24.60 | (0.06 | ) | (11.16 | ) | (11.22 | ) | — | — | |||||||||||||||||
Year Ended 12/31/17 | $ | 24.28 | (0.14 | ) | 0.46 | 0.32 | — | — | |||||||||||||||||||
Year Ended 12/31/16 | $ | 15.80 | (0.04 | ) | 8.52 | 8.48 | — | — | |||||||||||||||||||
Year Ended 12/31/15 | $ | 25.48 | (0.05 | ) | (9.63 | ) | (9.68 | ) | — | — | |||||||||||||||||
* Includes adjustments in accordance with U.S. Generally Accepted Accounting Principles.
(a) Per share net investment income (loss) has been calculated using the average daily shares method.
(b) Not annualized for periods less than one year.
(c) Annualized for periods less than one year.
(d) Portfolio turnover is calculated on the basis of the Fund as a whole without distinguishing between the classes of shares issued.
(e) Amount is less than $0.005 per share.
(f) Amount is less than 0.005%.
(g) Portfolio turnover increased due to change within the portfolio holdings during the year.
See notes to financial statements.
40
Victory Portfolios | Financial Highlights — continued | ||||||
For a Share Outstanding Throughout Each Period (continued)
Ratios to Average Net Assets | Supplemental Data | ||||||||||||||||||||||||||||||||||
| Capital Contributions from Prior Custodian, Net (See Note 8) | Net Asset Value, End of Period | Total Return (Excludes Sales Charge)*(b) | Net Expenses(c) | Net Investment Income (Loss)(c) | Gross Expenses(c) | Net Assets, End of Period (000's) | Portfolio Turnover(b)(d) | ||||||||||||||||||||||||||||
Victory Global Natural Resources Fund | |||||||||||||||||||||||||||||||||||
Class A | |||||||||||||||||||||||||||||||||||
| Six Months Ended 6/30/20 (unaudited) | — | $ | 7.73 | (20.39 | )% | 1.48 | % | 0.20 | % | 1.90 | % | $ | 24,271 | 20 | % | ||||||||||||||||||||
Year Ended 12/31/19 | — | $ | 9.71 | (24.49 | )% | 1.48 | % | — | %(f) | 1.69 | % | $ | 32,630 | 24 | % | ||||||||||||||||||||
Year Ended 12/31/18 | — | $ | 12.86 | (45.81 | )% | 1.48 | % | (0.65 | )% | 1.54 | % | $ | 64,001 | 26 | % | ||||||||||||||||||||
Year Ended 12/31/17 | — | $ | 23.73 | 1.02 | % | 1.48 | % | (0.93 | )% | 1.55 | % | $ | 262,455 | 57 | %(g) | ||||||||||||||||||||
Year Ended 12/31/16 | — | (e) | $ | 23.49 | 53.13 | %(h) | 1.48 | % | (0.51 | )% | 1.48 | % | $ | 545,778 | 29 | % | |||||||||||||||||||
Year Ended 12/31/15 | — | $ | 15.34 | (38.17 | )% | 1.45 | % | (0.52 | )% | 1.45 | % | $ | 332,598 | 33 | % | ||||||||||||||||||||
Class C | |||||||||||||||||||||||||||||||||||
| Six Months Ended 6/30/20 (unaudited) | — | $ | 6.91 | (20.67 | )% | 2.28 | % | (0.61 | )% | 3.47 | % | $ | 1,837 | 20 | % | ||||||||||||||||||||
Year Ended 12/31/19 | — | $ | 8.71 | (25.11 | )% | 2.28 | % | (0.81 | )% | 2.75 | % | $ | 2,949 | 24 | % | ||||||||||||||||||||
Year Ended 12/31/18 | — | $ | 11.63 | (46.26 | )% | 2.28 | % | (1.42 | )% | 2.38 | % | $ | 6,939 | 26 | % | ||||||||||||||||||||
Year Ended 12/31/17 | — | $ | 21.63 | 0.23 | % | 2.28 | % | (1.72 | )% | 2.35 | % | $ | 20,428 | 57 | %(g) | ||||||||||||||||||||
Year Ended 12/31/16 | — | (e) | $ | 21.59 | 51.94 | %(h) | 2.28 | % | (1.32 | )% | 2.31 | % | $ | 30,789 | 29 | % | |||||||||||||||||||
Year Ended 12/31/15 | — | $ | 14.21 | (38.67 | )% | 2.25 | % | (1.33 | )% | 2.25 | % | $ | 26,501 | 33 | % | ||||||||||||||||||||
Class R | |||||||||||||||||||||||||||||||||||
| Six Months Ended 6/30/20 (unaudited) | — | $ | 7.28 | (20.52 | )% | 1.86 | % | (0.18 | )% | 6.33 | % | $ | 361 | 20 | % | ||||||||||||||||||||
Year Ended 12/31/19 | — | $ | 9.16 | (24.79 | )% | 1.86 | % | (0.37 | )% | 4.31 | % | $ | 621 | 24 | % | ||||||||||||||||||||
Year Ended 12/31/18 | — | $ | 12.18 | (46.01 | )% | 1.86 | % | (0.99 | )% | 2.50 | % | $ | 920 | 26 | % | ||||||||||||||||||||
Year Ended 12/31/17 | — | $ | 22.56 | 0.62 | % | 1.86 | % | (1.31 | )% | 2.20 | % | $ | 2,442 | 57 | %(g) | ||||||||||||||||||||
Year Ended 12/31/16 | — | (e) | $ | 22.42 | 52.72 | %(h) | 1.74 | % | (0.80 | )% | 1.74 | % | $ | 4,611 | 29 | % | |||||||||||||||||||
Year Ended 12/31/15 | — | $ | 14.68 | (38.37 | )% | 1.78 | % | (0.85 | )% | 1.78 | % | $ | 3,427 | 33 | % | ||||||||||||||||||||
Class Y | |||||||||||||||||||||||||||||||||||
| Six Months Ended 6/30/20 (unaudited) | — | $ | 8.06 | (20.28 | )% | 1.15 | % | 0.52 | % | 1.38 | % | $ | 80,691 | 20 | % | ||||||||||||||||||||
Year Ended 12/31/19 | — | $ | 10.11 | (24.25 | )% | 1.15 | % | 0.27 | % | 1.26 | % | $ | 114,972 | 24 | % | ||||||||||||||||||||
Year Ended 12/31/18 | — | $ | 13.38 | (45.63 | )% | 1.15 | % | (0.29 | )% | 1.20 | % | $ | 393,581 | 26 | % | ||||||||||||||||||||
Year Ended 12/31/17 | — | $ | 24.60 | 1.36 | % | 1.15 | % | (0.58 | )% | 1.19 | % | $ | 1,126,533 | 57 | %(g) | ||||||||||||||||||||
Year Ended 12/31/16 | — | (e) | $ | 24.28 | 53.67 | %(h) | 1.15 | % | (0.19 | )% | 1.17 | % | $ | 1,300,024 | 29 | % | |||||||||||||||||||
Year Ended 12/31/15 | — | $ | 15.80 | (37.99 | )% | 1.14 | % | (0.21 | )% | 1.14 | % | $ | 1,174,590 | 33 | % | ||||||||||||||||||||
(h) The Fund received monies related to a nonrecurring refund from the prior Custodian. The corresponding impact to the total return was less than 0.005% for the period shown. (See Note 8)
See notes to financial statements.
41
Victory Portfolios | Notes to Financial Statements June 30, 2020 | ||||||
(Unaudited)
1. Organization:
Victory Portfolios (the "Trust") was organized on December 6, 1995 as a Delaware statutory trust as a successor to a company named "The Victory Portfolios," which was organized as a Massachusetts business trust on February 5, 1986. The Trust is registered under the Investment Company Act of 1940, as amended (the "1940 Act"), as an open-end investment company. The Trust is comprised of 42 funds and is authorized to issue an unlimited number of shares, which are units of beneficial interest with a par value of $0.001 per share. Each Fund is classified as diversified under the 1940 Act.
The accompanying financial statements are those of the following five Funds (collectively, the "Funds" and individually, a "Fund").
Funds (Legal Name) | Funds (Short Name) | Investment Share Classes Offered | |||||||||
Victory RS Partners Fund | RS Partners Fund | Classes A, R and Y | |||||||||
Victory RS Value Fund | RS Value Fund | Classes A, C, R and Y | |||||||||
Victory RS Large Cap Alpha Fund | RS Large Cap Alpha Fund | Classes A, C, R and Y | |||||||||
Victory RS Investors Fund | RS Investors Fund | Classes A, C, R and Y | |||||||||
Victory Global Natural Resources Fund | Global Natural Resources Fund | Classes A, C, R and Y | |||||||||
Each class of shares of a Fund has substantially identical rights and privileges except with respect to sales charges, fees paid under distribution plans, expenses allocable exclusively to each class of shares, voting rights on matters solely affecting a single class of shares, and the exchange privilege of each class of shares.
Under the Trust's organizational documents, its officers and trustees are indemnified against certain liabilities arising out of the performance of their duties to the Funds. In addition, in the normal course of business, the Funds enter into contracts with their vendors and others that provide for general indemnifications. The Funds' maximum exposure under these arrangements is unknown, as this would involve future claims that may be made against the Funds. However, based on experience, the Funds expect that risk of loss to be remote.
2. Significant Accounting Policies:
The following is a summary of significant accounting policies followed by the Trust in the preparation of its financial statements. The policies are in conformity with generally accepted accounting principles in the United States of America ("GAAP"). The preparation of financial statements in accordance with GAAP requires management to make estimates and assumptions that affect the reported amounts of assets and liabilities and disclosure of contingent assets and liabilities at the date of the financial statements and the reported amounts of income and expenses for the period. Actual results could differ from those estimates. The Funds follow the specialized accounting and reporting requirements under GAAP that are applicable to investment companies.
Investment Valuation:
The Funds record investments at fair value. Fair value is defined as the price that would be received to sell an asset or paid to transfer a liability in an orderly transaction between market participants at the measurement date.
The valuation techniques described below maximize the use of observable inputs and minimize the use of unobservable inputs in determining fair value. The inputs used for valuing the Funds' investments are summarized in the three broad levels listed below:
• Level 1 — quoted prices in active markets for identical securities
• Level 2 — other significant observable inputs (including quoted prices for similar securities or interest rates applicable to those securities, etc.)
• Level 3 — significant unobservable inputs (including the Funds' own assumptions in determining the fair value of investments)
42
Victory Portfolios | Notes to Financial Statements — continued June 30, 2020 | ||||||
(Unaudited)
Changes in valuation techniques may result in transfers in or out of an assigned level within the disclosure hierarchy. The inputs or methodologies used for valuation techniques are not necessarily an indication of the risk associated with entering into those investments.
Portfolio securities listed or traded on securities exchanges, including American Depositary Receipts ("ADRs") and Rights, are valued at the closing price on the exchange or system where the security is principally traded, if available, or at the Nasdaq Official Closing Price. If there have been no sales for that day on the exchange or system, then a security is valued at the last available bid quotation on the exchange or system where the security is principally traded. In each of these situations, valuations are typically categorized as Level 1 in the fair value hierarchy.
Investments for which there are no such quotations, or for which quotations do not appear reliable, are valued at fair value in accordance with procedures established by and under the general supervision and responsibility of the Trust's Board of Trustees (the "Board"). These valuations are typically categorized as Level 2 or Level 3 in the fair value hierarchy, based on the observability of inputs used to determine the fair value.
A summary of the valuations as of June 30, 2020, based upon the three levels defined above, is included in the table below while the breakdown, by category, of investments is disclosed on the Schedules of Portfolio Investments.
LEVEL 1 | LEVEL 2 | LEVEL 3 | Total | ||||||||||||||||
RS Partners Fund | |||||||||||||||||||
Common Stocks | $ | 283,684,503 | $ | — | $ | — | $ | 283,684,503 | |||||||||||
Preferred Stocks | — | — | 587,369 | 587,369 | |||||||||||||||
Collateral for Securities Loaned | 10,060,152 | — | — | 10,060,152 | |||||||||||||||
Total | $ | 293,744,655 | $ | — | $ | 587,369 | $ | 294,332,024 | |||||||||||
RS Value Fund | |||||||||||||||||||
Common Stocks | $ | 275,706,459 | $ | — | $ | — | $ | 275,706,459 | |||||||||||
Collateral for Securities Loaned | 9,436,680 | — | — | 9,436,680 | |||||||||||||||
Total | $ | 285,143,139 | $ | — | $ | — | $ | 285,143,139 | |||||||||||
RS Large Cap Alpha Fund | |||||||||||||||||||
Common Stocks | $ | 413,846,146 | $ | — | $ | — | $ | 413,846,146 | |||||||||||
Collateral for Securities Loaned | 9,400,468 | — | — | 9,400,468 | |||||||||||||||
Total | $ | 423,246,614 | $ | — | $ | — | $ | 423,246,614 | |||||||||||
RS Investors Fund | |||||||||||||||||||
Common Stocks | $ | 24,333,425 | $ | — | $ | — | $ | 24,333,425 | |||||||||||
Collateral for Securities Loaned | 653,087 | — | — | 653,087 | |||||||||||||||
Total | $ | 24,986,512 | $ | — | $ | — | $ | 24,986,512 | |||||||||||
Global Natural Resources Fund | |||||||||||||||||||
Common Stocks | $ | 99,324,492 | $ | 2,792,711 | $ | — | $ | 102,117,203 | |||||||||||
Collateral for Securities Loaned | 10,902,614 | — | — | 10,902,614 | |||||||||||||||
Total | $ | 110,227,106 | $ | 2,792,711 | $ | — | $ | 113,019,817 | |||||||||||
For the six months ended June 30, 2020, there were no transfers in or out of the Level 3 fair value hierarchy.
Real Estate Investment Trusts ("REITs"):
The Funds may invest in REITs, which report information on the source of their distributions annually. REITs are pooled investment vehicles that invest primarily in income-producing real estate or real estate-related loans or interests (such as mortgages). Certain distributions received from REITs during the year are recorded as realized gains or return of capital as estimated by the Funds or when such information becomes known.
43
Victory Portfolios | Notes to Financial Statements — continued June 30, 2020 | ||||||
(Unaudited)
Investment Transactions and Related Income:
Changes in holdings of investments are accounted for no later than one business day following the trade date. For financial reporting purposes, however, investment transactions are accounted for on trade date on the last business day of the reporting period. Interest income is determined on the basis of coupon interest accrued using the effective interest method which adjusts, where applicable, the amortization of premiums or accretion of discounts. Dividend income is recorded on the ex-dividend date. Gains or losses realized on sales of securities are recorded on the identified cost basis.
Withholding taxes on interest, dividends and gains as a result of certain investments in ADRs by the Funds have been provided for in accordance with each investment's applicable country's tax rules and rates.
Securities Lending:
The Trust has entered into a Master Securities Lending Agreement ("MSLA") with Citibank, N.A. ("Citibank" or the "Agent"). Under the terms of the MSLA, the Funds may lend securities to certain broker-dealers and banks in exchange for collateral in the amount of at least 102% of the value of U.S. securities loaned or at least 105% of the value of non-U.S. securities loaned, marked-to-market daily. Any collateral shortfalls associated with increases in the valuation of the securities loaned are adjusted the next business day. The collateral can be received in the form of cash collateral and/or non-cash collateral. Non-cash collateral can include U.S. Government Securities, letters of credit and certificates of deposit. The cash collateral is invested in short-term instruments or cash equivalents, primarily open-end investment companies, as noted on the Funds' Schedules of Portfolio Investments. The Trust does not have effective control of the non-cash collateral and therefore it is not disclosed on the Funds' Schedules of Portfolio Investments. During the time portfolio securities are on loan, the borrower will pay the Funds any dividends or interest paid on such securities plus any fee negotiated between the parties to the lending agreement. The Funds also earn a return from the collateral. The Funds pay the Agent various fees in connection with the investment of cash collateral and fees based on the investment income received from securities lending activities. Securities lending income (net of these fees) is disclosed on the Statements of Operations. Although risk is mitigated by the collateral, the Funds could experience a delay in recovering their securities and possible loss of income or value if the borrower fails to return them.
Securities lending transactions are entered into by a Fund under the MSLA, which permits the Fund, under certain circumstances such as an event of default, to offset amounts payable by the Fund to the same counterparty against amounts receivable from the counterparty to create a net payment due to or from the Fund.
The following table is a summary of the Funds' securities lending transactions which are subject to offset under the MSLA as of June 30, 2020. These transactions are accounted for as secured borrowings with an overnight and continuous contractual maturity for cash collateral and greater than overnight and continuous contractual maturity for non-cash collateral.
| Gross Amount of Recognized Assets (Value of | Value of Cash | Value of Non-cash Collateral Received by Maturity | |||||||||||||||||||||||||
| Securities on Loan) | Collateral Received* | <30 Days | Between 30 & 90 Days | >90 Days | Net Amount | ||||||||||||||||||||||
RS Partners Fund | $ | 9,838,236 | $ | 9,838,236 | $ | — | $ | — | $ | — | $ | — | |||||||||||||||
RS Value Fund | 9,216,929 | 9,216,929 | — | — | — | — | |||||||||||||||||||||
RS Large Cap Alpha Fund | 9,238,063 | 9,238,063 | — | — | — | — | |||||||||||||||||||||
RS Investors Fund | 649,190 | 649,190 | — | — | — | — | |||||||||||||||||||||
Global Natural Resources Fund | 7,940,378 | 7,940,378 | — | — | — | — | |||||||||||||||||||||
* Collateral received in excess of the market value of securities on loan is not presented in this table. The total cash collateral received by each Fund is disclosed on the Statements of Assets and Liabilities.
44
Victory Portfolios | Notes to Financial Statements — continued June 30, 2020 | ||||||
(Unaudited)
Foreign Currency Translations:
The accounting records of the Funds are maintained in U.S. dollars. Investment securities and other assets and liabilities of a Fund denominated in a foreign currency are translated into U.S. dollars at current exchange rates. Purchases and sales of securities, income receipts and expense payments are translated into U.S. dollars at the exchange rates on the date of the transactions. The Funds do not isolate the portion of the results of operations resulting from changes in foreign exchange rates on investments from fluctuations arising from changes in market prices of securities held. Such fluctuations are disclosed as Net change in unrealized appreciation/depreciation on investment securities and foreign currency translations on the Statements of Operations. Any realized gains or losses from these fluctuations are disclosed as Net realized gains (losses) from investment securities and foreign currency translations on the Statements of Operations.
Distributions to Shareholders:
Dividends from net investment income, if any, are declared and paid annually for the Funds. Distributable net realized gains, if any, are declared and distributed at least annually from each Fund. The amounts of dividends from net investment income and distributions from net realized gains (collectively, distributions to shareholders) are determined in accordance with federal income tax regulations, which may differ from GAAP. To the extent these "book/tax" differences are permanent in nature (e.g., net operating loss and distribution reclassification), such amounts are reclassified within the components of net assets based on their federal tax-basis treatment; temporary differences (e.g., wash sales) do not require reclassification. To the extent dividends and distributions exceed net investment income and net realized gains for tax purposes, they are reported as distributions of capital. Net investment losses incurred by a Fund may be reclassified as an offset to capital on the accompanying Statements of Assets and Liabilities.
Federal Income Taxes:
It is the policy of each Fund to continue to qualify as a regulated investment company by complying with the provisions available to certain investment companies, as defined in applicable sections of the Internal Revenue Code, and to make distributions of net investment income and net realized gains sufficient to relieve it from all, or substantially all, federal income taxes. Accordingly, no provision for federal income taxes is required in the financial statements. The Funds have a tax year end of December 31.
Management of the Funds has reviewed tax positions taken in tax years that remain subject to examination by all major tax jurisdictions, including federal (i.e., the last four tax years, which includes the current fiscal tax year end). Management believes that there is no tax liability resulting from unrecognized tax benefits related to uncertain tax positions taken.
Allocations:
Expenses directly attributable to a Fund are charged to the Fund, while expenses which are attributable to more than one fund in the Trust, or jointly with an affiliated trust, are allocated among the respective funds in the Trust and/or affiliated trust based upon net assets or another appropriate basis.
Income, expenses (other than class-specific expenses such as transfer agent fees, state registration fees, printing fees and 12b-1 fees), and realized and unrealized gains or losses on investments are allocated to each class of shares based on its relative net assets on the date income is earned or expenses and realized and unrealized gains and losses are incurred.
45
Victory Portfolios | Notes to Financial Statements — continued June 30, 2020 | ||||||
(Unaudited)
3. Purchases and Sales of Securities:
Purchases and sales of securities (excluding securities maturing less than one year from acquisition) for the six months ended June 30, 2020 were as follows:
Purchases | Sales | ||||||||||
RS Partners Fund | $ | 212,769,685 | $ | 234,942,536 | |||||||
RS Value Fund | 140,312,826 | 149,518,882 | |||||||||
RS Large Cap Alpha Fund | 258,709,856 | 279,245,765 | |||||||||
RS Investors Fund | 13,372,426 | 22,193,650 | |||||||||
Global Natural Resources Fund | 20,231,046 | 30,485,294 | |||||||||
For the six months ended June 30, 2020, there were no purchases or sales of U.S. Government Securities.
4. Fees and Transactions with Affiliates and Related Parties:
Investment advisory services are provided to the Funds by Victory Capital Management Inc. ("VCM" or the "Adviser"), a New York corporation registered as an investment adviser with the Securities and Exchange Commission ("SEC"). The Adviser is a wholly owned indirect subsidiary of Victory Capital Holdings, Inc., a publicly traded Delaware corporation and a wholly owned direct subsidiary of Victory Capital Operating, LLC.
VCM has entered into a Sub-Advisory Agreement with SailingStone Capital Partners LLC ("SailingStone"). SailingStone is responsible for providing day-to-day investment advisory services to the Global Natural Resources Fund, subject to the oversight of the Board. Sub-investment advisory fees paid by VCM to SailingStone do not represent a separate or additional expense to the Funds.
Under the terms of the Investment Advisory Agreement, the Adviser is entitled to receive fees based on a percentage of the average daily net assets of each Fund. The rates at which the Adviser is paid by each Fund are included in the table below. The Adviser may use its resources to assist with the Funds' distribution and marketing expenses.
Flat Rate | |||||||
RS Partners Fund | 1.00 | % | |||||
RS Value Fund | 0.85 | % | |||||
RS Large Cap Alpha Fund | 0.50 | % | |||||
RS Investors Fund | 1.00 | % | |||||
Global Natural Resources Fund | 1.00 | % | |||||
VCM also serves as the Funds' administrator and fund accountant. Under an Administration and Fund Accounting Agreement, VCM is paid for its services an annual fee at a rate of 0.08% of the first $15 billion in average daily net assets of the Trust, Victory Variable Insurance Funds and Victory Portfolios II (collectively, the "Victory Funds Complex"), 0.05% of the average daily net assets above $15 billion to $30 billion of the Victory Funds Complex and 0.04% of the average daily net assets over $30 billion of the Victory Funds Complex.
Citi Fund Services Ohio, Inc. ("Citi"), an affiliate of Citibank, acts as sub-administrator and sub-fund accountant to the Funds pursuant to a Sub-Administration and Sub-Fund Accounting Services Agreement between VCM and Citi. VCM pays Citi a fee for providing these services. The Funds reimburse VCM and Citi for reasonable out-of-pocket expenses incurred in providing these services and certain other expenses specifically allocated to the Funds under the Fund Administration, Servicing, and Accounting Agreement. Amounts paid by the Funds to reimburse VCM for expenses incurred during the six months ended June 30, 2020, are reflected on the Statements of Operations as Sub-Administration fees.
Citibank acts as the custodian of the Funds' assets pursuant to the Global Custodial Services Agreement (the "Custody Agreement"). Citibank's responsibilities include safeguarding and controlling the Funds' cash and securities, handling the receipt and delivery of securities, and collecting interest and dividends on the Funds' investments. Pursuant to the Custody Agreement, Citibank also maintains original entry documents and books of record and general ledgers; posts cash receipts and disbursements; and records
46
Victory Portfolios | Notes to Financial Statements — continued June 30, 2020 | ||||||
(Unaudited)
purchases and sales based upon communications from the Adviser. Citibank may, with the approval of a Fund and at its own expense, open and maintain a sub-custody account or accounts on behalf of a Fund, provided that it shall remain liable for the performance of all of its duties under the Custody Agreement.
FIS Investor Services, LLC ("FIS") serves as the Funds' transfer agent. Under the Transfer Agent Agreement, the Trust pays FIS a fee for its services and reimburses FIS for all of their reasonable out-of-pocket expenses incurred in providing these services.
The Chief Compliance Officer ("CCO") is an employee of the Adviser, which pays the compensation of the CCO and his support staff. The Trust has entered into an Agreement to provide compliance services with the Adviser, pursuant to which the Adviser furnishes its compliance personnel, including the services of the CCO, and other resources reasonably necessary to provide the Trust with compliance oversight services related to the design, administration and oversight of a compliance program for the Trust in accordance with Rule 38a-1 under the 1940 Act. The Funds in the Victory Funds Complex, in aggregate, compensate the Adviser for these services.
The Victory Funds Complex pays an annual retainer to each Independent Trustee, plus an additional annual retainer to the Chairman of the Board. The aggregate amount of the fees and expenses of the Independent Trustees are allocated amongst all the funds in the Victory Funds Complex and are presented on the Statements of Operations.
Sidley Austin LLP provides legal services to the Trust.
Victory Capital Services, Inc. (the "Distributor"), an affiliate of the Adviser, serves as distributor for the continuous offering of the shares of the Funds pursuant to a Distribution Agreement between the Distributor and the Trust. Effective June 30, 2020, the Distributor's name was changed from Victory Capital Advisers, Inc.
Pursuant to the Distribution and Service Plans adopted in accordance with Rule 12b-1 under the 1940 Act, the Distributor may receive a monthly distribution and service fee, at an annual rate of up to 0.25% of the average daily net assets of Class A Shares, at an annual rate of up to 0.50% of the average daily net assets of Class R Shares and 1.00% of the average daily net assets of Class C Shares of the Funds. The distribution and service fees paid to the Distributor may be used by the Distributor to pay for activities primarily intended to result in the sale of Class A, Class R or Class C Shares of the Funds.
In addition, the Distributor is entitled to receive commissions on sales of the Class A Shares of the Funds. For the six months ended June 30, 2020, the Distributor received approximately $11,831 from commissions earned on sales of Class A Shares of the Funds.
The Adviser has entered into expense limitation agreements with certain Funds. Under the terms of the agreements, the Adviser has agreed to waive fees or reimburse certain expenses to the extent that ordinary operating expenses incurred by certain classes of a Fund in any fiscal year exceed the expense limit for such classes of the Fund. Such excess amounts will be the liability of the Adviser. Interest, taxes, brokerage commissions, other expenditures which are capitalized in accordance with GAAP, and other extraordinary expenses not incurred in the ordinary course of a Fund's business are excluded from the expense limits. As of June 30, 2020, the expense limits (excluding voluntary waivers) are as follows:
In effect May 1, 2020 until April 30, 2021 | |||||||||||||||||||
| Class A Shares | Class C Shares | Class R Shares | Class Y Shares | ||||||||||||||||
RS Partners Fund | 1.45 | % | N/A | 1.81 | % | 1.12 | % | ||||||||||||
RS Value Fund | 1.30 | % | 2.07 | % | 1.69 | % | 1.06 | % | |||||||||||
RS Large Cap Alpha Fund | 0.89 | % | 1.69 | % | 1.26 | % | 0.68 | % | |||||||||||
RS Investors Fund | 1.33 | % | 2.07 | % | 1.95 | % | 1.05 | % | |||||||||||
Global Natural Resources Fund | 1.48 | % | 2.28 | % | 1.86 | % | 1.15 | % | |||||||||||
The Funds have agreed to repay fees and expenses that were waived or reimbursed by the Adviser for a period up to three fiscal years after such waiver or reimbursement was made to the extent such
47
Victory Portfolios | Notes to Financial Statements — continued June 30, 2020 | ||||||
(Unaudited)
payments or repayments would not cause the expenses of a class to exceed the original expense limitation in place at the time of the waiver or reimbursement or any expense limitation agreement in place at the time of repayment. Amounts repaid to the Adviser during the six months ended June 30, 2020, if any, are reflected on the Statements of Operations as Recoupment of prior expenses waived/reimbursed by Adviser.
As of June 30, 2020, the following amounts are available to be repaid to the Adviser:
| Expires 12/31/20 | Expires 12/31/21 | Expires 12/31/22 | Expires 12/31/23 | Total | |||||||||||||||||||
RS Partners Fund | $ | 487,905 | $ | 386,406 | $ | 344,191 | $ | 192,532 | $ | 1,411,034 | |||||||||||||
RS Value Fund | 94,907 | 116,096 | 154,554 | 124,201 | 489,758 | ||||||||||||||||||
RS Large Cap Alpha Fund | 283,005 | 236,137 | 327,684 | 176,480 | 1,023,306 | ||||||||||||||||||
RS Investors Fund | 179,335 | 163,946 | 162,310 | 79,415 | 585,006 | ||||||||||||||||||
Global Natural Resources Fund | 697,524 | 577,205 | 429,505 | 158,007 | 1,862,241 | ||||||||||||||||||
The Adviser may voluntarily waive or reimburse additional fees to assist the Funds in maintaining competitive expense ratios. Voluntary waivers and reimbursements applicable to the Funds are not available to be recouped at a future time. There were no voluntary waivers or reimbursements for the six months ended June 30, 2020.
Certain officers and/or interested trustees of the Funds are also officers and/or employees of the Adviser, Administrator, Fund Accountant, Sub-Administrator, Sub-Fund Accountant, and Legal Counsel.
5. Risks:
Each Fund may be subject to other risks in addition to these identified risks.
An investment in the Funds' shares represents an indirect investment in the securities owned by the Funds, some of which will be traded on a national securities exchange or in the over-the-counter markets. The value of the securities in which the Funds invest, like other market investments, may move up or down, sometimes rapidly and unpredictably. The value of the securities in which the Funds invest may affect the value of the Funds' shares. An investment in the Funds' shares at any point in time may be worth less than the original investment, even after taking into account the reinvestment of the Funds' distributions.
The Funds will be subject to credit risk with respect to the amount each expects to receive from counterparties for financial instruments entered into by the Funds. The Funds may be negatively impacted if a counterparty becomes bankrupt or otherwise fails to perform its obligations due to financial difficulties. The Funds may experience significant delays in obtaining any recovery in bankruptcy or other reorganization proceeding and the Funds may obtain only limited recovery or may obtain no recovery in such circumstances. The Funds typically enter into transactions with counterparties whose credit ratings are investment grade, as determined by a nationally recognized statistical rating organization or, if unrated, judged by the Adviser to be of comparable quality.
For the Global Natural Resources Fund (herein, the "Fund"), concentrating investments in the natural resources sector increases the risk of loss because the stocks of many or all of the companies in the sector may decline in value due to developments adversely affecting the sector. In addition, investors may buy or sell substantial amounts of the Fund's shares in response to factors affecting or expected to affect the natural resources sector, resulting in extreme inflows and outflows of cash into and out of the Fund. Such inflows or outflows might affect management of the Fund adversely to the extent they cause the Fund's cash position or cash requirements to exceed normal levels.
An outbreak of respiratory disease called COVID-19 was first detected in China in December 2019 and subsequently spread internationally. The transmission of COVID-19 and efforts to contain its spread have resulted in international, national and local border closings and other significant travel restrictions and disruptions, significant disruptions to business operations, supply chains and consumer activity, significant challenges in healthcare service preparation and delivery, quarantines and general concern and uncertainty. These negative impacts have caused significant volatility and declines in global financial markets, which have caused losses for Fund investors during and subsequent to period end. The impact
48
Victory Portfolios | Notes to Financial Statements — continued June 30, 2020 | ||||||
(Unaudited)
of the COVID-19 pandemic may be short term or may last for an extended period of time, and in either case could result in a substantial economic downturn or recession. Public health crises may exacerbate other pre-existing political, social, economic, market and financial risks. The extent of the impact to the financial performance of the Funds' investments will depend on future developments, including (i) the duration and spread of the outbreak, (ii) the restrictions and advisories, (iii) the effects on the financial markets, and (iv) the effects on the economy overall, all of which are highly uncertain and cannot be predicted.
6. Borrowing and Interfund Lending:
Line of Credit:
For the six months ended June 30, 2020, the Victory Funds Complex participated in a short-term demand note "Line of Credit" agreement with Citibank. The Line of Credit agreement with Citibank was renewed on June 29, 2020 with a termination date of June 28, 2021. Under the agreement with Citibank, the Victory Funds Complex and USAA Mutual Funds Complex, combined, may borrow up to $600 million, of which $300 million is committed and $300 million is uncommitted. $40 million of the Line of Credit is reserved for use by the Victory Floating Rate Fund (herein, the "Fund"), another series of the Victory Funds Complex, with that Fund paying the related commitment fees for that amount. The purpose of the agreement is to meet temporary or emergency cash needs. For the six months ended June 30, 2020, Citibank received an annual commitment fee of 0.15% on $300 million for providing the Line of Credit. For the six months ended June 30, 2020, Citibank earned approximately $225 thousand in commitment fees from the combined Victory Funds Complex and USAA Mutual Funds Complex. Each fund in the Victory Funds Complex pays a pro-rata portion of the commitment fees plus any interest (one month LIBOR plus one percent) on amounts borrowed. Effective June 29, 2020, under an amended Line of Credit agreement, Citibank will also receive an annual upfront fee of 0.10% on the $300 million committed line of credit. Each fund in the Victory Funds Complex will pay a pro-rata portion of the upfront fee. Interest charged to each Fund during the period, if applicable, is presented on the Statements of Operations under Line of credit fees.
The Funds did not utilize the Line of Credit during the six months ended June 30, 2020.
Interfund Lending:
The Trust and Adviser rely on an exemptive order granted by the SEC in March 2017 (the "Order"), permitting the establishment and operation of an Interfund Lending Facility (the "Facility"). The Facility allows each Fund to directly lend and borrow money to or from any other Victory Fund relying upon the Order at rates beneficial to both the borrowing and lending funds. Advances under the Facility are allowed for temporary or emergency purposes, including the meeting of redemption requests that otherwise might require the untimely disposition of securities, and are subject to each fund's borrowing restrictions. The interfund loan rate is determined, as specified in the Order, by averaging the current repurchase agreement rate and the current bank loan rate. As a Borrower, interest charged to each Fund during the period, if applicable, is presented on the Statements of Operations under Interfund lending fees. As a Lender, interest earned by each Fund during the period, if applicable, is presented on the Statements of Operations under Interfund lending income.
The average borrowing and lending for the days outstanding and average interest rate for each Fund during the six months ended June 30, 2020 were as follows:
| Borrower or Lender | Amount Outstanding at June 30, 2020 | Average Borrowing* | Days Borrowing Outstanding | Average Interest Rate* | Maximum Borrowing During the Period | ||||||||||||||||||||||
RS Investors Fund | Borrower | $ | — | $ | 1,916,000 | 2 | 1.76 | % | $ | 1,948,000 | |||||||||||||||||
* For the six months ended June 30, 2020, based on the number of days borrowings were outstanding.
49
Victory Portfolios | Notes to Financial Statements — continued June 30, 2020 | ||||||
(Unaudited)
7. Federal Income Tax Information:
The tax character of distributions paid and the tax basis of current components of accumulated earnings (deficit) will be determined at the end of the current tax year ending December 31, 2020.
At December 31, 2019, the following Fund had net capital loss carryforwards as summarized in the table below:
| Short-Term Amount | Long-Term Amount | Total | |||||||||||||
Global Natural Resources Fund | $ | 11,399,572 | $ | 1,653,590,949 | $ | 1,664,990,521 | |||||||||
8. Capital Contribution from Prior Custodian:
During 2016, certain Funds received notification from their prior custodian, State Street Bank and Trust ("State Street"), concerning issues related to billing on certain categories of expenses during the approximately 16-year period from 1998 through October 31, 2014. The over-billing primarily related to categories of expenses that involved an allocation of general costs among multiple clients.
State Street paid the refunded amounts during January 2017. Based on billing information received during 2016 from State Street and an analysis of any expense limitation agreements that were in place during the period of the activities in question, including the application of any recoupment provisions in such agreements, the Adviser received a portion of the refund.
The portion of the refund retained by the Funds was accounted for as a capital contribution and is reflected on the Financial Highlights as Capital Contribution from Prior Custodian, Net.
9. Fund Ownership:
Ownership of more than 25% of the voting securities of a fund creates presumptions of control of the fund, under section 2(a)(9) of the 1940 Act. As of June 30, 2020, the shareholders listed below held more than 25% of the shares outstanding of the Funds and may be deemed to control those Funds. Shareholders of record may hold Fund shares for the benefit of their customers.
Shareholder | Percent | ||||||||||
RS Partners Fund | National Financial Services, LLC | 31.2 | % | ||||||||
Global Natural Resources Fund | Charles Schwab & Co., Inc. | 33.5 | % | ||||||||
50
Victory Portfolios | Supplemental Information June 30, 2020 | ||||||
(Unaudited)
Proxy Voting and Portfolio Holdings Information
Proxy Voting:
Information regarding the policies and procedures each Fund uses to determine how to vote proxies relating to portfolio securities is available without charge, upon request, by calling 800-539-3863. The information is also included in the Funds' Statement of Additional Information, which is available on the SEC's website at www.sec.gov.
Information relating to how the Funds voted proxies relating to portfolio securities held during the most recent twelve months ended June 30 is available on the SEC's website at www.sec.gov.
Availability of Schedules of Portfolio Investments:
The Trust files a complete list of Schedules of Portfolio Investments with the SEC for the first and third quarter of each fiscal year on Form N-PORT. Forms N-PORT are available on the SEC's website at www.sec.gov.
Expense Examples
As a shareholder of the Funds, you may incur two types of costs: (1) transaction costs, including sales charges (loads) on purchases; and (2) ongoing costs, including management fees, distribution and service (12b-1) fees and other Fund expenses. These examples are intended to help you understand your ongoing costs (in dollars) of investing in the Funds and to compare these costs with the ongoing costs of investing in other mutual funds.
These examples are based on an investment of $1,000 invested at the beginning of the period and held for the entire period from January 1, 2020 through June 30, 2020.
The Actual Expense figures in the table below provide information about actual account values and actual expenses. You may use the information below, together with the amount you invested, to estimate the expenses that you paid over the period. Simply divide your account value by $1,000 (for example, an $8,600 account value divided by $1,000 = 8.6), then multiply the result by the number in the table under the heading entitled "Actual Expenses Paid During Period" to estimate the expenses you paid on your account during this period.
The Hypothetical Expense figures in the table below provide information about hypothetical account values and hypothetical expenses based on each Fund's actual expense ratio and an assumed rate of return of 5% per year before expenses, which is not the Fund's actual return. The hypothetical account values and expenses may not be used to estimate the actual ending account balance or expenses you paid for the period. You may use this information to compare this 5% hypothetical example with the 5% hypothetical examples that appear in shareholder reports of other funds.
Please note the expenses shown in the table are meant to highlight your ongoing costs only and do not reflect any transactional costs. Therefore, the table is useful in comparing ongoing costs only, and will not help you determine the relative total costs of owning different funds. In addition, if these transactional costs were included, your costs would have been higher.
| Beginning Account Value 1/1/20 | Actual Ending Account Value 6/30/20 | Hypothetical Ending Account Value 6/30/20 | Actual Expenses Paid During Period 1/1/20- 6/30/20* | Hypothetical Expenses Paid During Period 1/1/20- 6/30/20* | Annualized Expense Ratio During Period 1/1/20- 6/30/20 | ||||||||||||||||||||||
RS Partners Fund | |||||||||||||||||||||||||||
Class A Shares | $ | 1,000.00 | $ | 750.70 | $ | 1,017.65 | $ | 6.31 | $ | 7.27 | 1.45 | % | |||||||||||||||
Class R Shares | 1,000.00 | 749.20 | 1,015.86 | 7.87 | 9.07 | 1.81 | % | ||||||||||||||||||||
Class Y Shares | 1,000.00 | 752.00 | 1,019.29 | 4.88 | 5.62 | 1.12 | % | ||||||||||||||||||||
RS Value Fund | |||||||||||||||||||||||||||
Class A Shares | 1,000.00 | 773.30 | 1,018.40 | 5.73 | 6.52 | 1.30 | % | ||||||||||||||||||||
Class C Shares | 1,000.00 | 770.30 | 1,014.57 | 9.11 | 10.37 | 2.07 | % | ||||||||||||||||||||
Class R Shares | 1,000.00 | 771.80 | 1,016.46 | 7.44 | 8.47 | 1.69 | % | ||||||||||||||||||||
Class Y Shares | 1,000.00 | 774.10 | 1,019.59 | 4.68 | 5.32 | 1.06 | % | ||||||||||||||||||||
51
Victory Portfolios | Supplemental Information — continued June 30, 2020 | ||||||
(Unaudited)
| Beginning Account Value 1/1/20 | Actual Ending Account Value 6/30/20 | Hypothetical Ending Account Value 6/30/20 | Actual Expenses Paid During Period 1/1/20- 6/30/20* | Hypothetical Expenses Paid During Period 1/1/20- 6/30/20* | Annualized Expense Ratio During Period 1/1/20- 6/30/20 | ||||||||||||||||||||||
RS Large Cap Alpha Fund | |||||||||||||||||||||||||||
Class A Shares | $ | 1,000.00 | $ | 807.90 | $ | 1,020.44 | $ | 4.00 | $ | 4.47 | 0.89 | % | |||||||||||||||
Class C Shares | 1,000.00 | 804.50 | 1,016.46 | 7.58 | 8.47 | 1.69 | % | ||||||||||||||||||||
Class R Shares | 1,000.00 | 806.40 | 1,018.60 | 5.66 | 6.32 | 1.26 | % | ||||||||||||||||||||
Class Y Shares | 1,000.00 | 808.80 | 1,021.48 | 3.06 | 3.42 | 0.68 | % | ||||||||||||||||||||
RS Investors Fund | |||||||||||||||||||||||||||
Class A Shares | 1,000.00 | 790.80 | 1,018.25 | 5.92 | 6.67 | 1.33 | % | ||||||||||||||||||||
Class C Shares | 1,000.00 | 788.60 | 1,014.57 | 9.21 | 10.37 | 2.07 | % | ||||||||||||||||||||
Class R Shares | 1,000.00 | 788.40 | 1,015.17 | 8.67 | 9.77 | 1.95 | % | ||||||||||||||||||||
Class Y Shares | 1,000.00 | 792.10 | 1,019.64 | 4.68 | 5.27 | 1.05 | % | ||||||||||||||||||||
Global Natural Resources Fund | |||||||||||||||||||||||||||
Class A Shares | 1,000.00 | 796.10 | 1,017.50 | 6.61 | 7.42 | 1.48 | % | ||||||||||||||||||||
Class C Shares | 1,000.00 | 793.30 | 1,013.53 | 10.17 | 11.41 | 2.28 | % | ||||||||||||||||||||
Class R Shares | 1,000.00 | 794.80 | 1,015.61 | 8.30 | 9.32 | 1.86 | % | ||||||||||||||||||||
Class Y Shares | 1,000.00 | 797.20 | 1,019.14 | 5.14 | 5.77 | 1.15 | % | ||||||||||||||||||||
* Expenses are equal to the average account value multiplied by the Fund's annualized expense ratio multiplied by 182/366 (the number of days in the most recent fiscal half-year divided by the number of days in the fiscal
52
Victory Portfolios | Supplemental Information — continued June 30, 2020 | ||||||
(Unaudited)
Liquidity Risk Management Program:
The Victory Funds have adopted and implemented a written liquidity risk management program (the "LRMP") as required by Rule 22e-4 under the Act. The LRMP is reasonably designed to assess and manage each Fund's liquidity risk, taking into consideration each Fund's investment strategy and the liquidity of its portfolio investments during normal and reasonably foreseeable stressed market conditions; its short and long-term cash flow projections; and its cash holdings and access to other liquidity management tools such as available funding sources including the Victory Funds Complex Interfund Lending Facility and Line of Credit (discussed in the Notes to Financial Statements). The Board approved the appointment of VCM as the administrator of the LRMP. At an in-person meeting held on February 20, 2020, VCM provided an oral and written report to the Trustees on the operation and effectiveness of the LRMP during the previous year.
VCM manages liquidity risks associated with the Funds' investments by monitoring, among other things, cash and cash equivalents, any use of derivatives, the concentration of investments, the appropriateness of each Fund's investment strategy, and by classifying every fund investment as either highly liquid, moderately liquid, less liquid or illiquid on at least a monthly basis. To assist with the classification of Fund investments, VCM has retained a third-party provider of liquidity evaluation services. This provider determines preliminary liquidity classifications for all portfolio holdings based upon portfolio-level data and certain assumptions provided by VCM. VCM reviews the preliminary liquidity classifications and, when appropriate, considers other information including input from the Funds' portfolio managers (including the portfolio managers employed by any investment sub-advisers) in determining final liquidity classifications.
The report from VCM concluded that the Funds did not experience any significant liquidity challenges during the covered period, and the Funds' LRMP is reasonably designed to assess and manage its liquidity risk. The report also concluded that the LRMP continues to operate adequately and effectively to enable VCM to oversee and manage liquidity risk and ensure each Fund is able to meet redemption requests without significant dilution to the remaining investors' interest in each Fund. During the review period, each Fund's portfolio consisted primarily of highly liquid investments, which are defined as cash and any investments reasonably expected to be converted to cash in current market conditions in three business days or less without significantly changing the market value of the investment. Therefore, the Funds have not adopted a Highly Liquid Investment Minimum. The Funds' investments were below the limitation on illiquid investments during the review period. Additionally, VCM indicated that no events occurred that would require the filing of Form N-LIQUID and recommended no material changes to the LRMP.
53
Privacy Policy
Protecting the Privacy of Information
The Trust respects your right to privacy. We also know that you expect us to conduct and process your business in an accurate and efficient manner. To do so, we must collect and maintain certain personal information about you. This is the information we collect from you on applications or other forms, and from the transactions you make with us or third parties. It may include your name, address, social security number, account transactions and balances, and information about investment goals and risk tolerance.
We do not disclose any information about you or about former customers to anyone except as permitted or required by law. Specifically, we may disclose the information we collect to companies that perform services on our behalf, such as the transfer agent that processes shareholder accounts and printers and mailers that assist us in the distribution of investor materials. We may also disclose this information to companies that perform marketing services on our behalf. This allows us to continue to offer you Victory investment products and services that meet your investing needs, and to effect transactions that you request or authorize. These companies will use this information only in connection with the services for which we hired them. They are not permitted to use or share this information for any other purpose.
To protect your personal information internally, we permit access only by authorized employees and maintain physical, electronic and procedural safeguards to guard your personal information.*
* You may have received communications regarding information about privacy policies from other financial institutions which gave you the opportunity to "opt-out" of certain information sharing with companies which are not affiliated with that financial institution. The Trust does not share information with other companies for purposes of marketing solicitations for products other than the Trust. Therefore, the Trust does not provide opt-out options to their shareholders.
Victory Funds
P.O. Box 182593
Columbus, Ohio 43218-2593

Visit our website at: | Call Victory at: | ||||||
www.vcm.com | 800-539-FUND (800-539-3863) | ||||||
VPRSVF-SAR (6/20)
Item 2. Code of Ethics.
Not applicable — only for annual reports.
Item 3. Audit Committee Financial Expert.
Not applicable — only for annual reports.
Item 4. Principal Accountant Fees and Services.
Not applicable — only for annual reports.
Item 5. Audit Committee of Listed Registrants.
Not applicable.
Item 6. Investments.
(a) Not applicable.
(b) Not applicable.
Item 7. Disclosure of Proxy Voting Policies and Procedures for Closed-End Management Investment Companies.
Not applicable.
Item 8. Portfolio Managers of Closed-End Management Investment Companies.
Not applicable.
Item 9. Purchases of Equity Securities by Closed-End Management Investment Company and Affiliated Purchasers.
Not applicable.
Item 10. Submission of Matters to a Vote of Security Holders.
Not applicable.
Item 11. Controls and Procedures.
| (a) | The registrant’s principal executive officer and principal financial officer have concluded, based on their evaluation of the registrant's disclosure controls and procedures as conducted within 90 days of the filing date of this report, that these disclosure controls and procedures are adequately designed and are operating effectively to ensure that information required to be disclosed by the registrant on Form N-CSR is recorded, processed, summarized and reported within the time periods specified in the Securities and Exchange Commission's rules and forms. |
| (b) | There were no changes in the registrant’s internal control over financial reporting (as defined in Rule 30a-3(d) under the Investment Company Act of 1940 (17 CFR 270.30a-3(d)) that occurred during the period covered by this report that have materially affected or are reasonably likely to materially affect, the registrant’s internal control over financial reporting. |
Item 12. Disclosure of Securities Lending Activities for Closed-End Management Investment Companies.
(a)(1) Not applicable.
(a)(2) Not applicable.
(a)(3) Not applicable.
(a)(4) Not applicable.
(b) Not applicable.
Item 13. Exhibits.
(a)(1) Not applicable.
(a)(2) Certifications pursuant to Rule 30a-2(a) are attached hereto.
(a)(3) Not applicable.
(b) Certifications pursuant to Rule 30a-2(b) are furnished herewith.
SIGNATURES
Pursuant to the requirements of the Securities Exchange Act of 1934 and the Investment Company Act of 1940, the registrant has duly caused this report to be signed on its behalf by the undersigned, thereunto duly authorized.
| (Registrant) | Victory Portfolios |
| By (Signature and Title)* | /s/ Allan Shaer | |
| Allan Shaer, Principal Financial Officer |
| Date | September 3, 2020 |
Pursuant to the requirements of the Securities Exchange Act of 1934 and the Investment Company Act of 1940, this report has been signed below by the following persons on behalf of the registrant and in the capacities and on the dates indicated.
| By (Signature and Title)* | /s/ Christopher K. Dyer | |
| Christopher K. Dyer, Principal Executive Officer |
| Date | September 3, 2020 |
| By (Signature and Title)* | /s/ Allan Shaer | |
| Allan Shaer, Principal Financial Officer |
| Date | September 3, 2020 |