UNITED STATES
SECURITIES AND EXCHANGE COMMISSION
Washington, D.C. 20549
FORM N-CSR
CERTIFIED SHAREHOLDER REPORT OF REGISTERED
MANAGEMENT INVESTMENT COMPANIES
Investment Company Act file number: 811-04852
Victory Portfolios
(Exact name of registrant as specified in charter)
| 4900 Tiedeman Road, 4th Floor, Brooklyn, Ohio | 44144 |
| (Address of principal executive offices) | (Zip code) |
Citi Fund Services Ohio, Inc., 4400 Easton Commons, Suite 200, Columbus, Ohio 43219
(Name and address of agent for service)
Registrant’s telephone number, including area code: 800-539-3863
Date of fiscal year end: December 31
Date of reporting period: December 31, 2022
Item 1. Reports to Stockholders.

December 31, 2022
Annual Report
Victory RS Partners Fund
Victory RS Value Fund
Victory RS Large Cap Alpha Fund
Victory RS Investors Fund
Victory Global Energy Transition Fund
vcm.com
News, Information And Education 24 Hours A Day, 7 Days A Week
The Victory Capital website gives fund shareholders, prospective shareholders, and investment professionals a convenient way to access fund information, get guidance, and track fund performance anywhere they can access the Internet. The site includes:
• Detailed performance records
• Daily share prices
• The latest fund news
• Investment resources to help you become a better investor
• A section dedicated to investment professionals
Whether you're a potential investor searching for the fund that matches your investment philosophy, a seasoned investor interested in planning tools, or an investment professional, vcm.com has what you seek. Visit us anytime. We're always open.
Victory Portfolios
TABLE OF CONTENTS
Shareholder Letter (Unaudited) | 3 | ||||||
| Managers' Commentary / Investment Overview (Unaudited) | 5 | ||||||
| Investment Objective and Portfolio Holdings (Unaudited) | 19 | ||||||
Schedules of Portfolio Investments | |||||||
Victory RS Partners Fund | 24 | ||||||
Victory RS Value Fund | 27 | ||||||
Victory RS Large Cap Alpha Fund | 29 | ||||||
Victory RS Investors Fund | 31 | ||||||
Victory Global Energy Transition Fund | 33 | ||||||
Financial Statements | |||||||
Statements of Assets and Liabilities | 35 | ||||||
Statements of Operations | 37 | ||||||
Statements of Changes in Net Assets | 39 | ||||||
Financial Highlights | 44 | ||||||
Notes to Financial Statements | 64 | ||||||
| Report of Independent Registered Public Accounting Firm | 77 | ||||||
Supplemental Information (Unaudited) | 78 | ||||||
Trustee and Officer Information | 78 | ||||||
Proxy Voting and Portfolio Holdings Information | 81 | ||||||
Expense Examples | 81 | ||||||
Additional Federal Income Tax Information | 83 | ||||||
Advisory Contract Approval | 84 | ||||||
Privacy Policy (inside back cover) | |||||||
1
IRA DISTRIBUTION WITHHOLDING DISCLOSURE
We generally must withhold federal income tax at a rate of 10% of the taxable portion of your distribution and, if you live in a state that requires state income tax withholding, at your state's tax rate. However, you may elect not to have withholding apply or to have income tax withheld at a higher rate. Any withholding election that you make will apply to any subsequent distribution unless and until you change or revoke the election. If you wish to make a withholding election, or change or revoke a prior withholding election, call 800-539-3863 (800-235-8396 for Member Class) and form W-4P (OMB No. 1545-0074 withholding certificate for pension or annuity payments) will be electronically sent.
If you do not have a withholding election in place by the date of a distribution, federal income tax will be withheld from the taxable portion of your distribution at a rate of 10%. If you must pay estimated taxes, you may be subject to estimated tax penalties if your estimated tax payments are not sufficient and sufficient tax is not withheld from your distribution.
For more specific information, please consult your tax adviser.
The Funds are distributed by Victory Capital Services, Inc. Victory Capital Management Inc. is the investment adviser to the Funds and receives fees from the Funds for performing services for the Funds.
This report is not authorized for distribution to prospective investors unless preceded or accompanied by a current prospectus of the Victory Funds.
For additional information about any Victory Fund, including fees, expenses, and risks, view our prospectus online at vcm.com or call 800-539-3863 (800-235-8396 for Member Class). Read it carefully before you invest or send money.
The information in this report is based on data obtained from recognized services and sources and is believed to be reliable. Any opinions, projections, or recommendations in this report are subject to change without notice and are not intended as individual investment advice. Past investment performance of the Funds, markets or securities mentioned herein should not be considered to be indicative of future results.
• NOT FDIC INSURED • NO BANK GUARANTEE • MAY LOSE VALUE

Call Victory at:
800-539-FUND (800-539-3863)
800-235-8396 for Member Class
Visit our website at:
vcm.com
2
Victory Funds Letter to Shareholders
(Unaudited)
Dear Shareholder,
Our most recent annual reporting period ending December 31, 2022, was filled with epic challenges. Even the most seasoned investors who have been through more than one economic cycle have not witnessed financial markets like this in a long time, if ever.
Consider what transpired and how the investing backdrop changed so abruptly. The year began well enough with ample liquidity and an encouraging outlook for corporate profits. But that optimism faded early and was punctuated by the start of a terrible war in Eastern Europe. This fueled rising energy prices and intensified an inflation problem that was proving to be more than "transitory."
The inflation data was particularly troublesome and surprised many with some of the highest readings since the 1970s. In response, the U.S. Federal Reserve (the "Fed") pivoted to a far more restrictive monetary policy than anyone anticipated. Over the course of 2022, the Fed boosted the Fed funds interest rate on seven different occasions by a total of 4.5 percentage points. And if that wasn't enough, zero-Covid policies in China further exacerbated supply chain issues and dampened the outlook for global growth.
As one might expect, all of these obstacles ratcheted up volatility across financial markets. Broad market stock indices pulled back substantially around the world. The S&P 500® Index, the bell-weather proxy for our domestic stock market, delivered a negative total return of more than 18% for our annual reporting period.
Perhaps what made 2022 even more difficult was the performance of fixed income markets, which normally are considered a safe haven in times of equity turmoil. But not this past year. In fact, the Bloomberg US Aggregate Bond Index—a proxy for a diversified fixed income portfolio and one that many investors and institutions follow closely—delivered a negative total return of approximately 13%, its worst annual performance since the 1970s. That's not exactly the offset to equity performance that many investors were expecting from bonds.
It was a tough year, and we fully acknowledge that the steady drumbeat of bad news and bouts of stomach-churning volatility can take a toll on investors' psyche. Nobody likes opening their account statements during declining markets; and even when markets snap back sharply (as happened this past July and October), investors often wonder if they have missed an opportunity.
Through all of the challenges in our most recent annual reporting period, we are reminded of two enduring realities: 1) financial markets are dynamic and apt to change abruptly; 2) it's vital that we remain calm and rational whenever faced with those inevitable bouts of turmoil.
Fortunately, we think that investors can take comfort knowing that all of our independent investment franchises have experience managing portfolios through a wide variety of market environments. Our investment professionals remain calm during turbulent financial markets, and we think it's imperative that investors do the same.
3
We still believe that a long-term plan, a well-diversified portfolio across asset classes and investment types, and a clear understanding of individual risk tolerances are the key ingredients for staying the course and progressing on investment goals. Moreover, all our investment professionals continually monitor the environment and work hard to position portfolios opportunistically no matter what the markets bring. Remember, turmoil can also create opportunity.
On the following pages you will find information relating to your Victory Funds investment. If you have any questions, we encourage you to contact your financial advisor. If you invest with us directly, you may call 800-539-3863 (800-235-8396 for Member Class) or visit our website at vcm.com.
From all of us here at Victory Capital, thank you for your ongoing confidence and for letting us help you work toward your investment goals.

Christopher K. Dyer, CFA
President,
Victory Funds
4
Victory RS Partners Fund
Managers' Commentary
(Unaudited)
What were the market conditions during the reporting period?
The fourth quarter of 2022 certainly began well enough, even as the year ended on a downbeat. Financial markets had been languishing all year and were in the doldrums as summer ended, but most segments of the equity market bounced back sharply in October and November thanks to better-than-expected earnings and signs that inflation may have peaked. Value stocks led the way, with the Russell 1000® Value Index up 10.25% in October and an additional 6.25% in November, while the Russell 2000® Value Index was up 12.59% in October and 3.06% in November. Unfortunately, that euphoria was short-lived.
Sentiment soured once again in December as investors began to digest how hawkish the U.S. Federal Reserve (the "Fed") really intended to be, given its repeated statements that it would not stop hiking the Fed funds interest rate until inflation was well in check irrespective of the impact to the broader economy. Some investors and corporate leaders began to question whether Fed Chair Jerome Powell was up to the task of maintaining an economic environment supportive of corporate growth while still taming inflation.
These growing concerns turned into a full-fledged market sell-off in December, with the Russell 1000® Value Index shedding 4.03% and the Russell 2000® Value Index falling 6.56%. This reflected some poor earnings guidance by corporations and ongoing hawkish comments by Chairman Powell. In fact, the Chairman bluntly told market participants, "Fed hikes and volatility have been central themes of 2022, and investors should expect both — along with hits to corporate earnings — as we enter the new year." On top of that, he braced investors for the possibility of a recession in 2023. All this economic uncertainty merely exacerbated the interest rate backdrop and highlighted the difficulties facing the Fed in carrying out its dual monetary policy goals.
Yet despite the volatility and challenges in the fourth quarter, it was not all bad news as we closed out 2022. For starters, we believe the worst inflation numbers are behind us. Demand for goods has decreased, as evidenced by higher inventories among retailers and a continued decline in energy prices globally. This should eventually provide some relief for battered markets. There are even reasons for optimism within certain sectors of the economy (and individual companies). Chief among these is the fact that select corporate operations (and earnings) have come in better than expected, which means the market decline has improved valuations and may be creating a more favorable risk-reward tradeoff going forward.
In terms of the overall numbers for our area of focus — domestic value-oriented strategies — the Russell 3000® Value Index was up 12.18% during the fourth quarter and was down 7.98% for the full year. In terms of market capitalizations, small-cap value stocks, as represented by the Russell 2000® Value Index (the "Index"), declined 14.48% for the year. The Russell Midcap® Value Index declined by 12.03% for the full year, while large-cap value stocks, as represented by the Russell 1000® Value Index, posted an annual decline of 7.54%.
Looking ahead, many investors are not only wondering just how restrictive monetary policy will become, but also how healthy the economy really is. Of course, nobody can answer these questions with absolute certainty, but we can definitively say that the current investment landscape continues to be polarizing, and we would not be surprised to see further bouts of elevated volatility in 2023.
5
Victory RS Partners Fund
Managers' Commentary (continued)
How did Victory RS Partners Fund (the "Fund") perform during the reporting period?
The Fund returned -4.54% (Class A at net asset value) for the fiscal year ended December 31, 2022, outperforming the Index, which returned -14.48% for the reporting period.
What strategies did you employ during the reporting period?
The Fund outperformed the Index primarily through stock selection in the Financials and Industrials sectors. Our focus on businesses that have the potential for long-term value creation while limiting our downside paid off during 2022. For the year, the stocks that provided positive contribution tended to be undergoing a unique structural change, but also holding a competitive advantage. Within the Financials sector, Globe Life, Inc. and White Mountains Insurance Group Ltd. were significant positive contributors to performance. The Industrials sector provided other names that benefitted the portfolio. Meritor, Inc. and Fluor Corp. led performance. Where we struggled was in a couple of our holdings in the Technology sector. NCR Corp. saw its share price fall as supply chain issues, coupled with uncertainty surrounding the company's strategic review, pressured the share price. Euronet Worldwide, Inc. continued to experience pressure on the travel segment of its ATM business, which impacted the share price. At the end of the day, we managed to outperform the Index in 2022, and we remain confident in our process and feel it will provide us with the discipline which leads to longer-term performance which will benefit our investors over time.
We continue to believe that the current environment is creating potential pockets of opportunity for astute, long-term investors. Our experience has taught us that any tumultuous market backdrop (and the subsequent short-term price dislocations) can be an advantage for active managers. Our team continues to seek and identify companies that share two vital traits: a trend of improving their ROIC (return on invested capital), and stock prices trading at what we perceive as a deep discount to intrinsic value. We believe that allocating to these types of companies is a means to generate attractive risk-adjusted returns over longer time periods, and this continues to be a primary focus for us.
6
Victory RS Partners Fund
Investment Overview
(Unaudited)
Average Annual Total Return
Year Ended December 31, 2022
Class A | Class R | Class Y | Member Class | ||||||||||||||||||||||||
INCEPTION DATE | 7/12/95 | 10/13/06 | 5/1/07 | 11/2/20 | |||||||||||||||||||||||
| Net Asset Value | Maximum Offering Price | Net Asset Value | Net Asset Value | Net Asset Value | Russell 2000® Value Index1 | ||||||||||||||||||||||
One Year | –4.54 | % | –10.04 | % | –4.86 | % | –4.23 | % | –4.36 | % | –14.48 | % | |||||||||||||||
Five Year | 7.40 | % | 6.13 | % | �� | 7.01 | % | 7.75 | % | N/A | 4.13 | % | |||||||||||||||
Ten Year | 9.46 | % | 8.81 | % | 9.07 | % | 9.82 | % | N/A | 8.48 | % | ||||||||||||||||
Since Inception | N/A | N/A | N/A | N/A | 22.68 | % | N/A | ||||||||||||||||||||
The performance data quoted represents past performance and current returns may be lower or higher. The investment return and principal value will fluctuate so that an investor's shares, when redeemed, may be worth more or less than the original cost. To obtain performance information current to the most recent month's end, please visit vcm.com.
The maximum offering price figures reflect a maximum sales charge of 5.75% for Class A. Net Asset Value does not reflect sales charges. Total return measures the price change in a share assuming the reinvestment of all net investment income and realized capital gain distributions, if any. The total returns quoted do not reflect adjustments made to the enclosed financial statements in accordance with U.S. Generally Accepted Accounting Principles or the deduction of taxes that a shareholder would pay on net investment income and realized capital gain distributions, including reinvested distributions, or redemptions of shares. The total return figures set forth above include all waivers of fees. Without such fee waivers, the total returns would have been lower.
Victory RS Partners Fund — Growth of $10,000
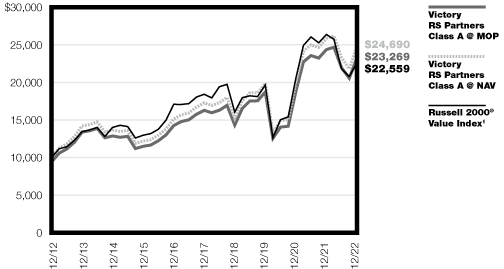
1The Russell 2000® Value Index is an unmanaged index that measures the performance of the small-cap value segment of the U.S. equity universe. It includes those Russell 2000® companies with lower price-to-book ratios and lower forecasted growth values. Index results assume the reinvestment of dividends paid on the stocks constituting the index. This index does not include the effect of sales charges, commissions, expenses, or taxes, is not representative of the Fund, and it is not possible to invest directly in an index.
The graph reflects investment of growth of a hypothetical $10,000 investment in the Fund.
The graph and table do not reflect the deduction of taxes that a shareholder would pay on Fund distributions or the redemption of shares.
Past performance is not indicative of future results.
7
Victory RS Value Fund
Managers' Commentary
(Unaudited)
What were the market conditions during the reporting period?
The fourth quarter of 2022 certainly began well enough, even as the year ended on a downbeat. Financial markets had been languishing all year and were in the doldrums as summer ended, but most segments of the equity market bounced back sharply in October and November thanks to better-than-expected earnings and signs that inflation may have peaked. Value stocks led the way, with the Russell 1000® Value Index up 10.25% in October and an additional 6.25% in November, while the Russell 2000® Value Index was up 12.59% in October and 3.06% in November. Unfortunately, that euphoria was short-lived.
Sentiment soured once again in December as investors began to digest how hawkish the U.S. Federal Reserve (the "Fed") really intended to be, given its repeated statements that it would not stop hiking the Fed funds interest rate until inflation was well in check irrespective of the impact to the broader economy. Some investors and corporate leaders began to question whether Fed Chair Jerome Powell was up to the task of maintaining an economic environment supportive of corporate growth while still taming inflation.
These growing concerns turned into a full-fledged market sell-off in December, with the Russell 1000® Value Index shedding 4.03% and the Russell 2000® Value Index falling 6.56%. This reflected some poor earnings guidance by corporations and ongoing hawkish comments by Chairman Powell. In fact, the Chairman bluntly told market participants, "Fed hikes and volatility have been central themes of 2022, and investors should expect both — along with hits to corporate earnings — as we enter the new year." On top of that, he braced investors for the possibility of a recession in 2023. All this economic uncertainty merely exacerbated the interest rate backdrop and highlighted the difficulties facing the Fed in carrying out its dual monetary policy goals.
Yet despite the volatility and challenges in the fourth quarter, it was not all bad news as we closed out 2022. For starters, we believe the worst inflation numbers are behind us. Demand for goods has decreased, as evidenced by higher inventories among retailers and a continued decline in energy prices globally. This should eventually provide some relief for battered markets. There are even reasons for optimism within certain sectors of the economy (and individual companies). Chief among these is the fact that select corporate operations (and earnings) have come in better than expected, which means the market decline has improved valuations and may be creating a more favorable risk-reward tradeoff going forward.
In terms of the overall numbers for our area of focus — domestic value-oriented strategies — the Russell 3000® Value Index was up 12.18% during the fourth quarter and was down 7.98% for the full year. In terms of market capitalizations, small-cap value stocks, as represented by the Russell 2000® Value Index, declined 14.48% for the year. The Russell Midcap® Value Index (the "Index") declined by 12.03% for the full year, while large-cap value stocks, as represented by the Russell 1000® Value Index, posted an annual decline of 7.54%.
Looking ahead, many investors are not only wondering just how restrictive monetary policy will become, but also how healthy the economy really is. Of course, nobody can answer these questions with absolute certainty, but we can definitively say that the current investment landscape continues to be polarizing, and we would not be surprised to see further bouts of elevated volatility in 2023.
8
Victory RS Value Fund
Managers' Commentary (continued)
How did Victory RS Value Fund (the "Fund") perform during the reporting period?
The Fund returned -2.97% (Class A at net asset value) for the fiscal year ended December 31, 2022, outperforming the Index, which returned -12.03% for the reporting period.
What strategies did you employ during the reporting period?
The Fund outperformed the Index primarily through stock selection in the Financials and Industrials sectors. Our focus on businesses that have the potential for long-term value creation while limiting our downside paid off during 2022. For the year, the stocks that provided positive contribution tended to be undergoing a unique structural change, but also holding a competitive advantage. Within the Financials sector, Globe Life, Inc. and Progressive Corp. were significant positive contributors to performance. The Industrials sector provided other names that benefitted the portfolio. Fluor Corp. and Curtiss-Wright Corp. led performance. Where we struggled was in a couple of our holdings in the Technology sector. NCR Corp. saw its share price fall as supply chain issues, coupled with uncertainty surrounding the company's strategic review, pressured the share price. Euronet Worldwide, Inc. continued to experience pressure on the travel segment of its ATM business, which impacted the share price. At the end of the day, we managed to outperform the Index in 2022, and we remain confident in our process and feel it will provide us with the discipline which leads to longer-term performance, which will benefit our investors over time.
We continue to believe that the current environment is creating potential pockets of opportunity for astute, long-term investors. Our experience has taught us that any tumultuous market backdrop (and the subsequent short-term price dislocations) can be an advantage for active managers. Our team continues to seek and identify companies that share two vital traits: a trend of improving their ROIC (return on invested capital), and stock prices trading at what we perceive as a deep discount to intrinsic value. We believe that allocating to these types of companies is a means to generate attractive risk-adjusted returns over longer time periods, and this continues to be a primary focus for us.
9
Victory RS Value Fund
Investment Overview
(Unaudited)
Average Annual Total Return
Year Ended December 31, 2022
Class A | Class C | Class R | Class Y | ||||||||||||||||||||||||||||
INCEPTION DATE | 6/30/93 | 5/1/07 | 12/4/06 | 5/1/07 | |||||||||||||||||||||||||||
| Net Asset Value | Maximum Offering Price | Net Asset Value | Contingent Deferred Charges | Net Asset Value | Net Asset Value | Russell Midcap® Value Index1 | |||||||||||||||||||||||||
One Year | –2.97 | % | –8.56 | % | –3.71 | % | –4.61 | % | –3.38 | % | –2.71 | % | –12.03 | % | |||||||||||||||||
Five Year | 7.12 | % | 5.86 | % | 6.29 | % | 6.29 | % | 6.70 | % | 7.38 | % | 5.72 | % | |||||||||||||||||
Ten Year | 10.23 | % | 9.58 | % | 9.55 | % | 9.55 | % | 9.79 | % | 10.49 | % | 10.11 | % | |||||||||||||||||
The performance data quoted represents past performance and current returns may be lower or higher. The investment return and principal value will fluctuate so that an investor's shares, when redeemed, may be worth more or less than the original cost. To obtain performance information current to the most recent month's end, please visit vcm.com.
The maximum offering price figures reflect a maximum sales charge of 5.75% for Class A. Class C is not subject to an initial sales charge, but is subject to a deferred sales charge of 1.00% on shares redeemed within one year of purchase. Net Asset Value does not reflect sales charges. Total return measures the price change in a share assuming the reinvestment of all net investment income and realized capital gain distributions, if any. The total returns quoted do not reflect adjustments made to the enclosed financial statements in accordance with U.S. Generally Accepted Accounting Principles or the deduction of taxes that a shareholder would pay on net investment income and realized capital gain distributions, including reinvested distributions, or redemptions of shares. The total return figures set forth above include all waivers of fees. Without such fee waivers, the total returns would have been lower.
Victory RS Value Fund — Growth of $10,000

1The Russell Midcap® Value Index is an unmanaged Index that measures the performance of the mid-cap value segment of the U.S. equity universe. It includes those Russell Midcap® Index companies with relatively lower price-to-book ratios and lower forecasted growth values. Index results assume the reinvestment of dividends paid on the stocks constituting the index. This index does not include the effect of sales charges, commissions, expenses, or taxes, is not representative of the Fund, and it is not possible to invest directly in an index.
The graph reflects investment of growth of a hypothetical $10,000 investment in the Fund.
The graph and table do not reflect the deduction of taxes that a shareholder would pay on Fund distributions or the redemption of shares.
Past performance is not indicative of future results.
10
Victory RS Large Cap Alpha Fund
Managers' Commentary
(Unaudited)
What were the market conditions during the reporting period?
The fourth quarter of 2022 certainly began well enough, even as the year ended on a downbeat. Financial markets had been languishing all year and were in the doldrums as summer ended, but most segments of the equity market bounced back sharply in October and November thanks to better-than-expected earnings and signs that inflation may have peaked. Value stocks led the way, with the Russell 1000® Value Index up 10.25% in October and an additional 6.25% in November, while the Russell 2000® Value Index was up 12.59% in October and 3.06% in November. Unfortunately, that euphoria was short-lived.
Sentiment soured once again in December as investors began to digest how hawkish the U.S. Federal Reserve (the "Fed") really intended to be, given its repeated statements that it would not stop hiking the Fed funds interest rate until inflation was well in check irrespective of the impact to the broader economy. Some investors and corporate leaders began to question whether Fed Chair Jerome Powell was up to the task of maintaining an economic environment supportive of corporate growth while still taming inflation.
These growing concerns turned into a full-fledged market sell-off in December, with the Russell 1000® Value Index shedding 4.03% and the Russell 2000® Value Index falling 6.56%. This reflected some poor earnings guidance by corporations and ongoing hawkish comments by Chairman Powell. In fact, the Chairman bluntly told market participants, "Fed hikes and volatility have been central themes of 2022, and investors should expect both — along with hits to corporate earnings — as we enter the new year." On top of that, he braced investors for the possibility of a recession in 2023. All this economic uncertainty merely exacerbated the interest rate backdrop and highlighted the difficulties facing the Fed in carrying out its dual monetary policy goals.
Yet despite the volatility and challenges in the fourth quarter, it was not all bad news as we closed out 2022. For starters, it really does seem to us that the worst inflation numbers are behind us. Demand for goods has decreased, as evidenced by higher inventories among retailers and a continued decline in energy prices globally. This should eventually provide some relief for battered markets. There are even reasons for optimism within certain sectors of the economy (and individual companies). Chief among these is the fact that select corporate operations (and earnings) have come in better than expected, which means the market decline has improved valuations and may be creating a more favorable risk-reward tradeoff going forward.
In terms of the overall numbers for our area of focus — domestic value-oriented strategies — the Russell 3000® Value Index was up 12.18% during the fourth quarter and was down 7.98% for the full year. In terms of market capitalizations, small-cap value stocks, as represented by the Russell 2000® Value Index, declined 14.48% for the year. The Russell Midcap® Value Index declined by 12.03% for the full year, while large-cap value stocks, as represented by the Russell 1000® Value Index (the "Index"), posted an annual decline of 7.54%.
Looking ahead, many investors are not only wondering just how restrictive monetary policy will become, but also how healthy the economy really is. Of course, nobody can answer these questions with absolute certainty, but we can definitively say that the current investment landscape continues to be polarizing, and we would not be surprised to see further bouts of elevated volatility in 2023.
11
Victory RS Large Cap Alpha Fund
Managers' Commentary (continued)
How did Victory RS Large Cap Alpha Fund (the "Fund") perform during the reporting period?
The Fund returned -4.62% (Class A at net asset value) for the fiscal year ended December 31, 2022, outperforming the Index, which returned -7.54% for the reporting period.
What strategies did you employ during the reporting period?
The Fund outperformed the Index primarily through stock selection in the Financials and Utilities sectors. Our focus on businesses that have the potential for long-term value creation while limiting our downside paid off during 2022. For the year, the stocks that provided positive contributions tended to be undergoing a unique structural change, but also holding a competitive advantage. Within the Financials sector, Fairfax Financial and The Progressive Corp. were significant positive contributors to performance. The Utilities sector provided other names that benefitted the portfolio. Constellation Energy and Vistra Corporation led performance. Where we struggled was in a couple of our holdings in the Materials sector. Sealed Air Corp. saw its share price fall as rising input costs impacted profitability. Similarly, PPG Industries, Inc. saw its margins impacted as price increases could not offset rising energy costs. At the end of the day, we managed to outperform the Index in 2022 and we remain confident in our process and feel it will provide us with the discipline which leads to longer-term performance which will benefit our investors over time.
We continue to believe that the current environment is creating potential pockets of opportunity for astute, long-term investors. Our experience has taught us that any tumultuous market backdrop (and the subsequent short-term price dislocations) can be an advantage for active managers. Our team continues to seek and identify companies that share two vital traits: a trend of improving their ROIC (return on invested capital), and stock prices trading at what we perceive as a deep discount to intrinsic value. We believe that allocating to these types of companies is a means to generate attractive risk-adjusted returns over longer time periods, and this continues to be a primary focus for us.
12
Victory RS Large Cap Alpha Fund
Investment Overview
(Unaudited)
Average Annual Total Return
Year Ended December 31, 2022
Class A | Class C | Class R | Class Y | ||||||||||||||||||||||||||||||||
INCEPTION DATE | 6/1/72 | 8/7/00 | 5/15/01 | 5/1/07 | |||||||||||||||||||||||||||||||
| Net Asset Value | Maximum Offering Price | Net Asset Value | Contingent Deferred Charges | Net Asset Value | Net Asset Value | Russell 1000® Value Index1 | S&P 500® Index2 | ||||||||||||||||||||||||||||
One Year | –4.62 | % | –10.11 | % | –5.39 | % | –6.24 | % | –4.97 | % | –4.43 | % | –7.54 | % | –18.11 | % | |||||||||||||||||||
Five Year | 6.60 | % | 5.35 | % | 5.75 | % | 5.75 | % | 6.21 | % | 6.82 | % | 6.67 | % | 9.42 | % | |||||||||||||||||||
Ten Year | 10.48 | % | 9.83 | % | 9.77 | % | 9.77 | % | 10.07 | % | 10.72 | % | 10.29 | % | 12.56 | % | |||||||||||||||||||
The performance data quoted represents past performance and current returns may be lower or higher. The investment return and principal value will fluctuate so that an investor's shares, when redeemed, may be worth more or less than the original cost. To obtain performance information current to the most recent month's end, please visit vcm.com.
The maximum offering price figures reflect a maximum sales charge of 5.75% for Class A. Class C is not subject to an initial sales charge, but is subject to a deferred sales charge of 1.00% on shares redeemed within one year of purchase. Net Asset Value does not reflect sales charges. Total return measures the price change in a share assuming the reinvestment of all net investment income and realized capital gain distributions, if any. The total returns quoted do not reflect adjustments made to the enclosed financial statements in accordance with U.S. Generally Accepted Accounting Principles or the deduction of taxes that a shareholder would pay on net investment income and realized capital gain distributions, including reinvested distributions, or redemptions of shares. The total return figures set forth above include all waivers of fees. Without such fee waivers, the total returns would have been lower.
Victory RS Large Cap Alpha Fund — Growth of $10,000
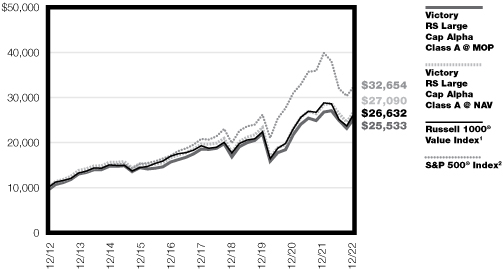
1The Russell 1000® Value Index is made up of about 1,000 of the largest companies in the U.S. equity market. It represents top companies by market capitalization. It's made up of about 90% of the total market capitalization of all U.S. stocks. This index does not include the effect of sales charges, commissions, expenses, or taxes, is not representative of the Fund, and it is not possible to invest directly in an index.
2The S&P 500® Index is an unmanaged index comprised of 500 domestically traded common stocks, is weighted according to the market value of each common stock in the index, and includes reinvestment of dividends. This index does not include the effect of sales charges, commissions, expenses, or taxes, is not representative of the Fund, and it is not possible to invest directly in an index.
The graph reflects investment of growth of a hypothetical $10,000 investment in the Fund.
The graph and table do not reflect the deduction of taxes that a shareholder would pay on Fund distributions or the redemption of shares.
Past performance is not indicative of future results.
13
Victory RS Investors Fund
Managers' Commentary
(Unaudited)
What were the market conditions during the reporting period?
The fourth quarter of 2022 certainly began well enough, even as the year ended on a downbeat. Financial markets had been languishing all year and were in the doldrums as summer ended, but most segments of the equity market bounced back sharply in October and November thanks to better-than-expected earnings and signs that inflation may have peaked. Value stocks led the way, with the Russell 1000® Value Index up 10.25% in October and an additional 6.25% in November, while the Russell 2000® Value Index was up 12.59% in October and 3.06% in November. Unfortunately, that euphoria was short-lived.
Sentiment soured once again in December as investors began to digest how hawkish the U.S. Federal Reserve (the "Fed") really intended to be, given its repeated statements that it would not stop hiking the Fed funds interest rate until inflation was well in check irrespective of the impact to the broader economy. Some investors and corporate leaders began to question whether Fed Chair Jerome Powell was up to the task of maintaining an economic environment supportive of corporate growth while still taming inflation.
These growing concerns turned into a full-fledged market sell-off in December, with the Russell 1000® Value Index shedding 4.03% and the Russell 2000® Value Index falling 6.56%. This reflected some poor earnings guidance by corporations and ongoing hawkish comments by Chairman Powell. In fact, the Chairman bluntly told market participants, "Fed hikes and volatility have been central themes of 2022, and investors should expect both — along with hits to corporate earnings — as we enter the new year." On top of that, he braced investors for the possibility of a recession in 2023. All this economic uncertainty merely exacerbated the interest rate backdrop and highlighted the difficulties facing the Fed in carrying out its dual monetary policy goals.
Yet despite the volatility and challenges in the fourth quarter, it was not all bad news as we closed out 2022. For starters, we believe the worst inflation numbers are behind us. Demand for goods has decreased, as evidenced by higher inventories among retailers and a continued decline in energy prices globally. This should eventually provide some relief for battered markets. There are even reasons for optimism within certain sectors of the economy (and individual companies). Chief among these is the fact that select corporate operations (and earnings) have come in better than expected, which means the market decline has improved valuations and may be creating a more favorable risk-reward tradeoff going forward.
In terms of the overall numbers for our area of focus — domestic value-oriented strategies — the Russell 3000® Value Index (the "Index") was up 12.18% during the fourth quarter and was down 7.98% for the full year. In terms of market capitalizations, small-cap value stocks, as represented by the Russell 2000® Value Index, declined 14.48% for the year. The Russell Midcap® Value Index declined by 12.03% for the full year, while large-cap value stocks, as represented by the Russell 1000® Value Index, posted an annual decline of 7.54%.
Looking ahead, many investors are not only wondering just how restrictive monetary policy will become, but also how healthy the economy really is. Of course, nobody can answer these questions with absolute certainty, but we can definitively say that the current investment landscape continues to be polarizing, and we would not be surprised to see further bouts of elevated volatility in 2023.
14
Victory RS Investors Fund
Managers' Commentary (continued)
How did Victory RS Investors Fund (the "Fund") perform during the reporting period?
The Fund returned -2.01% (Class A at net asset value) for the fiscal year ended December 31, 2022, outperforming the Index, which returned -7.98% for the reporting period.
What strategies did you employ during the reporting period?
The Fund outperformed the Index primarily through stock selection in the Financials and Industrials sectors. Our focus on businesses that have the potential for long-term value creation while limiting our downside paid off during 2022. For the year, the stocks that provided positive contribution tended to be undergoing a unique structural change, but also holding a competitive advantage. Within the Financials sector, White Mountains Insurance Group and The Progressive Corp. were significant positive contributors to performance. The Industrials sector provided other holdings that benefitted the portfolio. Fluor Corp. and Meritor, Inc. led performance. Where we struggled was in a couple of our holdings in the Technology sector. NCR Corp. saw its share price fall as supply chain issues, coupled with uncertainty surrounding the company's strategic review, pressured the shares. Euronet Worldwide, Inc. continued to experience pressure on the travel segment of its ATM business, which impacted the share price. At the end of the day, we managed to outperform the Index in 2022 and we remain confident in our process and feel it will provide us with the discipline which leads to longer-term performance which will benefit our investors over time.
We continue to believe that the current environment is creating potential pockets of opportunity for astute, long-term investors. Our experience has taught us that any tumultuous market backdrop (and the subsequent short-term price dislocations) can be an advantage for active managers. Our team continues to seek and identify companies that share two vital traits: a trend of improving their ROIC (return on invested capital), and stock prices trading at what we perceive as a deep discount to intrinsic value. We believe that allocating to these types of companies is a means to generate attractive risk-adjusted returns over longer time periods, and this continues to be a primary focus for us.
15
Victory RS Investors Fund
Investment Overview
(Unaudited)
Average Annual Total Return
Year Ended December 31, 2022
Class A | Class C | Class R | Class Y | ||||||||||||||||||||||||||||
INCEPTION DATE | 11/15/05 | 7/24/07 | 1/3/07 | 5/1/07 | |||||||||||||||||||||||||||
| Net Asset Value | Maximum Offering Price | Net Asset Value | Contingent Deferred Charges | Net Asset Value | Net Asset Value | Russell 3000® Value Index1 | |||||||||||||||||||||||||
One Year | –2.01 | % | –7.66 | % | –2.69 | % | –3.62 | % | –2.63 | % | –1.73 | % | –7.98 | % | |||||||||||||||||
Five Year | 7.05 | % | 5.78 | % | 6.25 | % | 6.25 | % | 6.39 | % | 7.35 | % | 6.50 | % | |||||||||||||||||
Ten Year | 10.14 | % | 9.48 | % | 9.48 | % | 9.48 | % | 9.52 | % | 10.45 | % | 10.16 | % | |||||||||||||||||
The performance data quoted represents past performance and current returns may be lower or higher. The investment return and principal value will fluctuate so that an investor's shares, when redeemed, may be worth more or less than the original cost. To obtain performance information current to the most recent month's end, please visit vcm.com.
The maximum offering price figures reflect a maximum sales charge of 5.75% for Class A. Class C is not subject to an initial sales charge, but is subject to a deferred sales charge of 1.00% on shares redeemed within one year of purchase. Net Asset Value does not reflect sales charges. Total return measures the price change in a share assuming the reinvestment of all net investment income and realized capital gain distributions, if any. The total returns quoted do not reflect adjustments made to the enclosed financial statements in accordance with U.S. Generally Accepted Accounting Principles or the deduction of taxes that a shareholder would pay on net investment income and realized capital gain distributions, including reinvested distributions, or redemptions of shares. The total return figures set forth above include all waivers of fees. Without such fee waivers, the total returns would have been lower.
Victory RS Investors Fund — Growth of $10,000

1The Russell 3000® Value Index measures the performance of those Russell 3000® Index companies with lower price-to-book ratios and lower forecasted growth values. The stocks in this index are also members of either the Russell 1000® Value or the Russell 2000® Value indexes. Index results assume the reinvestment of dividends paid on the stocks constituting the index. This index does not include the effect of sales charges, commissions, expenses, or taxes, is not representative of the Fund and it is not possible to invest directly in an index.
The graph reflects investment of growth of a hypothetical $10,000 investment in the Fund.
The graph and table do not reflect the deduction of taxes that a shareholder would pay on Fund distributions or the redemption of shares.
Past performance is not indicative of future results.
16
Victory Global Energy Transition Fund
Managers' Commentary
(Unaudited)
What were the market conditions during the reporting period?
After a prolonged period of subdued inflation and low interest rates, inflation spiked in 2022, prompting a series of rate hikes by the U.S. Federal Reserve. Commodity prices continued to recover from COVID-19-related fears of a demand shock, reflecting tight inventories and limited spare capacity. In addition, improved capital discipline by producers resulted in market-leading free-cash flow yields for natural resource stocks. As a result, natural resource equities led the market for the second year in a row. Investors who had pared back or eliminated inflation hedges or inflation-sensitive exposure in their portfolio were left with little protection as equity and bond markets sold off in tandem while commodity prices spiked.
How did Victory Global Energy Transition Fund (the "Fund") perform during the reporting period?
The Fund returned 35.01% (Class A at net asset value) for the fiscal year ended December 31, 2022, outperforming the MSCI World Commodity Producers Index, which returned 32.13% for the reporting period.
What strategies did you employ during the reporting period?
We stuck to our longstanding process during the reporting period. We seek to identify companies that, over a market cycle for commodity prices, have the potential to provide favorable long-term investment performance in any of the natural resources industries that we believe will be required for the Energy Transition, which refers to efforts designed to develop energy systems with zero carbon emissions and expand access to affordable, sustainable energy services around the world. We seek exposure to "advantaged producers" of those natural resources who are favorably positioned on the supply cost curve and can generate an intrinsic rate of return in excess of raw commodity beta. We underwrite our investment universe at the asset level based on proved reserves and conservative commodity price assumptions. We seek to own securities trading at a discount to our underwriting of net asset value. We view this underwriting process and the intrinsic return generated by structurally advantaged producers as the primary driver of returns for our portfolio. While we believe decarbonization efforts are adding inflationary pressures to many supply-constrained commodities, we do not attempt to forecast commodity price or demand increases and view these catalysts as additional upside potential for the investors in our strategy. Consistent with this approach, the majority of our absolute and relative returns versus different indices were a function of stock selection as opposed to commodity mix, a fact reinforced by strong performance in oil and oil-related stocks and our general lack of ownership in that space.
17
Victory Global Energy Transition Fund
Investment Overview
(Unaudited)
Average Annual Total Return
Year Ended December 31, 2022
Class A | Class C | Class R | Class Y | ||||||||||||||||||||||||||||||||||||
INCEPTION DATE | 11/15/95 | 5/1/07 | 12/4/06 | 5/1/07 | |||||||||||||||||||||||||||||||||||
| Net Asset Value | Maximum Offering Price | Net Asset Value | Contingent Deferred Charges | Net Asset Value | Net Asset Value | MSCI World Commodity Producers Index1 | S&P North American Natural Resources Sector Index2 | S&P 500® Index3 | |||||||||||||||||||||||||||||||
One Year | 35.01 | % | 27.24 | % | 33.94 | % | 32.94 | % | 34.44 | % | 35.46 | % | 32.13 | % | 34.07 | % | –18.11 | % | |||||||||||||||||||||
Five Year | 5.18 | % | 3.94 | % | 4.34 | % | 4.34 | % | 4.79 | % | 5.52 | % | 7.28 | % | 7.13 | % | 9.42 | % | |||||||||||||||||||||
Ten Year | –0.57 | % | –1.16 | % | –1.20 | % | –1.20 | % | –0.93 | % | –0.24 | % | 3.90 | % | 4.05 | % | 12.56 | % | |||||||||||||||||||||
The performance data quoted represents past performance and current returns may be lower or higher. The investment return and principal value will fluctuate so that an investor's shares, when redeemed, may be worth more or less than the original cost. To obtain performance information current to the most recent month's end, please visit vcm.com.
The maximum offering price figures reflect a maximum sales charge of 5.75% for Class A. Class C is not subject to an initial sales charge, but is subject to a deferred sales charge of 1.00% on shares redeemed within one year of purchase. Net Asset Value does not reflect sales charges. Total return measures the price change in a share assuming the reinvestment of all net investment income and realized capital gain distributions, if any. The total returns quoted do not reflect adjustments made to the enclosed financial statements in accordance with U.S. Generally Accepted Accounting Principles or the deduction of taxes that a shareholder would pay on net investment income and realized capital gain distributions, including reinvested distributions, or redemptions of shares. The total return figures set forth above include all waivers of fees. Without such fee waivers, the total returns would have been lower.
Victory Global Energy Transition Fund — Growth of $10,000
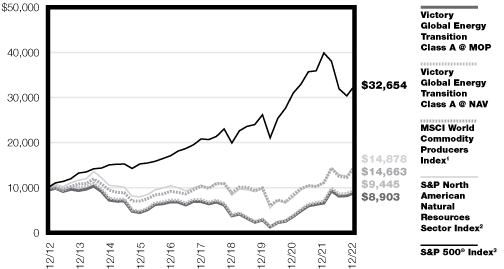
1The MSCI World Commodity Producers Index is an equity-based index designed to reflect the performance related to stocks of commodity producers. The index is a free float-adjusted market-capitalization-weighted index composed of commodity producer companies based on the Global Industry Classification Standard (GICS). The index reflects the reinvestment of dividends paid on the stocks constituting the index, net of withholding taxes. This index does not include the effect of sales charges, commissions, expenses, or taxes, is not representative of the Fund, and it is not possible to invest directly in an index.
2The S&P North American Natural Resources Sector Index is a modified capitalization-weighted index designed as a benchmark for U.S.-traded securities in the natural resources sector. The index includes companies involved in the following categories: extractive industries, energy companies, owners and operations or timber tracts, forestry services, producers of pulp and paper, and owners of plantations. Index results assume the reinvestment of dividends paid on the stocks constituting the index. This index does not include the effect of sales charges, commissions, expenses, or taxes, is not representative of the Fund, and it is not possible to invest directly in an index.
3The S&P 500® Index is an unmanaged index comprised of 500 domestically traded common stocks, is weighted according to the market value of each common stock in the index, and includes reinvestment of dividends. This index does not include the effect of sales charges, commissions, expenses, or taxes, is not representative of the Fund, and it is not possible to invest directly in an index.
The graph reflects investment of growth of a hypothetical $10,000 investment in the Fund.
The graph and table do not reflect the deduction of taxes that a shareholder would pay on Fund distributions or the redemption of shares.
Past performance is not indicative of future results.
18
| Victory Portfolios Victory RS Partners Fund | December 31, 2022 | ||||||
(Unaudited)
Investment Objective and Portfolio Holdings:
The Fund seeks to provide long-term capital appreciation.
Top 10 Holdings*:
December 31, 2022
(% of Net Assets)
Globe Life, Inc. | 3.7 | % | |||||
Primerica, Inc. | 3.4 | % | |||||
Federated Hermes, Inc. | 3.3 | % | |||||
Kemper Corp. | 3.2 | % | |||||
White Mountains Insurance Group Ltd. | 2.8 | % | |||||
Graphic Packaging Holding Co. | 2.6 | % | |||||
Verint Systems, Inc. | 2.5 | % | |||||
Equity Commonwealth | 2.5 | % | |||||
Four Corners Property Trust, Inc. | 2.4 | % | |||||
U.S. Foods Holding Corp. | 2.4 | % | |||||
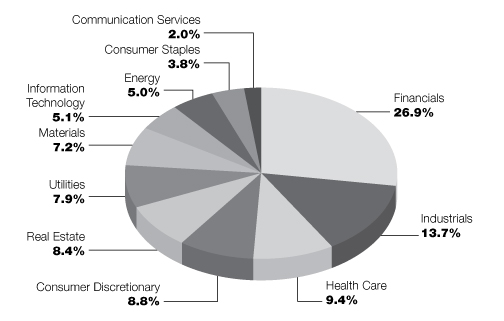
Sector Allocation*:
December 31, 2022
(% of Net Assets)
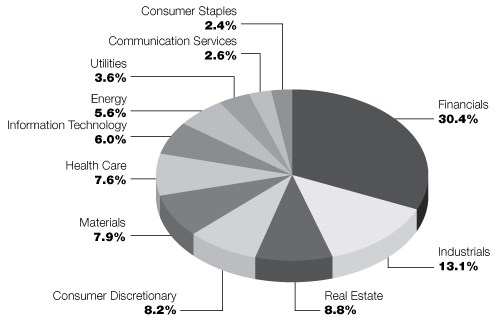
* Does not include futures contracts, money market instruments, and short-term investments purchased with cash collateral from securities loaned.
Percentages are of the net assets of the Fund and may not equal 100%.
Refer to the Schedule of Portfolio Investments for a complete list of securities.
19
| Victory Portfolios Victory RS Value Fund | December 31, 2022 | ||||||
(Unaudited)
Investment Objective and Portfolio Holdings:
The Fund seeks to provide long-term capital appreciation.
Top 10 Holdings*:
December 31, 2022
(% of Net Assets)
Fairfax Financial Holdings Ltd. | 4.0 | % | |||||
Vistra Corp. | 3.4 | % | |||||
Globe Life, Inc. | 3.3 | % | |||||
Markel Corp. | 3.1 | % | |||||
Federated Hermes, Inc. | 2.9 | % | |||||
The Progressive Corp. | 2.8 | % | |||||
Brown & Brown, Inc. | 2.6 | % | |||||
Graphic Packaging Holding Co. | 2.6 | % | |||||
Fiserv, Inc. | 2.5 | % | |||||
Humana, Inc. | 2.5 | % | |||||
Sector Allocation*:
December 31, 2022
(% of Net Assets)
* Does not include futures contracts, money market instruments, and short-term investments purchased with cash collateral from securities loaned.
Percentages are of the net assets of the Fund and may not equal 100%.
Refer to the Schedule of Portfolio Investments for a complete list of securities.
20
| Victory Portfolios Victory RS Large Cap Alpha Fund | December 31, 2022 | ||||||
(Unaudited)
Investment Objective and Portfolio Holdings:
The Fund seeks to provide long-term capital appreciation.
Top 10 Holdings*:
December 31, 2022
(% of Net Assets)
Fairfax Financial Holdings Ltd. | 5.4 | % | |||||
Markel Corp. | 4.6 | % | |||||
The Progressive Corp. | 3.7 | % | |||||
Vistra Corp. | 3.7 | % | |||||
Merck & Co., Inc. | 3.2 | % | |||||
Cboe Global Markets, Inc. | 3.1 | % | |||||
Brown & Brown, Inc. | 3.1 | % | |||||
AbbVie, Inc. | 2.9 | % | |||||
Fidelity National Information Services, Inc. | 2.8 | % | |||||
UnitedHealth Group, Inc. | 2.6 | % | |||||
Sector Allocation*:
December 31, 2022
(% of Net Assets)

* Does not include futures contracts, money market instruments, and short-term investments purchased with cash collateral from securities loaned.
Percentages are of the net assets of the Fund and may not equal 100%.
Refer to the Schedule of Portfolio Investments for a complete list of securities.
21
| Victory Portfolios Victory RS Investors Fund | December 31, 2022 | ||||||
(Unaudited)
Investment Objective and Portfolio Holdings:
The Fund seeks to provide long-term capital appreciation.
Top 10 Holdings*:
December 31, 2022
(% of Net Assets)
Markel Corp. | 4.8 | % | |||||
Fairfax Financial Holdings Ltd. | 4.7 | % | |||||
Vistra Corp. | 4.5 | % | |||||
Brown & Brown, Inc. | 4.4 | % | |||||
Cboe Global Markets, Inc. | 4.1 | % | |||||
Federated Hermes, Inc. | 4.0 | % | |||||
The Progressive Corp. | 4.0 | % | |||||
White Mountains Insurance Group Ltd. | 3.9 | % | |||||
Willis Towers Watson PLC | 3.6 | % | |||||
Verint Systems, Inc. | 3.5 | % | |||||
Sector Allocation*:
December 31, 2022
(% of Net Assets)

* Does not include futures contracts, money market instruments, and short-term investments purchased with cash collateral from securities loaned.
Percentages are of the net assets of the Fund and may not equal 100%.
Refer to the Schedule of Portfolio Investments for a complete list of securities.
22
| Victory Portfolios Victory Global Energy Transition Fund | December 31, 2022 | ||||||
(Unaudited)
Investment Objective and Portfolio Holdings:
The Fund seeks to provide long-term capital appreciation.
Top 10 Holdings*:
December 31, 2022
(% of Net Assets)
Whitecap Resources, Inc. | 14.5 | % | |||||
First Quantum Minerals Ltd. | 9.2 | % | |||||
Cameco Corp. | 8.0 | % | |||||
Ivanhoe | 5.1 | % | |||||
Newmont Corp. | 5.0 | % | |||||
Linde PLC | 4.7 | % | |||||
NextEra Energy, Inc. | 4.6 | % | |||||
Iluka Resources Ltd. | 4.6 | % | |||||
Enterprise Products Partners LP | 4.3 | % | |||||
Norsk Hydro ASA | 4.3 | % | |||||
Sector Allocation*:
December 31, 2022
(% of Net Assets)
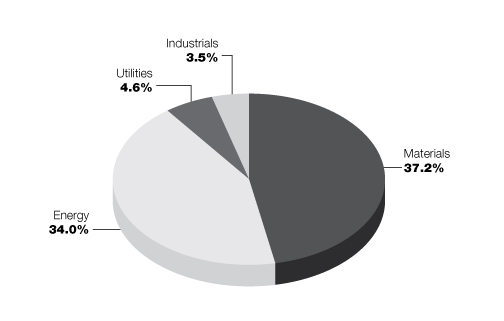
* Does not include futures contracts, money market instruments, and short-term investments purchased with cash collateral from securities loaned.
Percentages are of the net assets of the Fund and may not equal 100%.
Refer to the Schedule of Portfolio Investments for a complete list of securities.
23
| Victory Portfolios Victory RS Partners Fund | Schedule of Portfolio Investments December 31, 2022 | ||||||
Security Description | Shares | Value | |||||||||
Common Stocks (96.0%) | |||||||||||
Banks (11.0%): | |||||||||||
Banner Corp. | 51,620 | $ | 3,262,384 | ||||||||
Eastern Bankshares, Inc. | 437,770 | 7,551,532 | |||||||||
First Bancorp/Puerto Rico | 395,710 | 5,033,431 | |||||||||
SouthState Corp. | 90,270 | 6,893,017 | |||||||||
Synovus Financial Corp. | 93,980 | 3,528,949 | |||||||||
The Bank of NT Butterfield & Son Ltd. | 262,760 | 7,832,876 | |||||||||
UMB Financial Corp. | 53,182 | 4,441,761 | |||||||||
38,543,950 | |||||||||||
Capital Markets (5.1%): | |||||||||||
Federated Hermes, Inc. | 319,930 | 11,616,658 | |||||||||
PJT Partners, Inc., Class A | 84,260 | 6,209,120 | |||||||||
17,825,778 | |||||||||||
Communication Services (2.6%): | |||||||||||
Madison Square Garden Sports Corp. | 42,980 | 7,879,523 | |||||||||
World Wrestling Entertainment, Inc., Class A | 17,976 | 1,231,716 | |||||||||
9,111,239 | |||||||||||
Consumer Discretionary (8.2%): | |||||||||||
Bloomin' Brands, Inc. | 168,910 | 3,398,469 | |||||||||
Carter's, Inc. | 56,370 | 4,205,766 | |||||||||
Columbia Sportswear Co. | 49,220 | 4,310,688 | |||||||||
Light & Wonder, Inc. (a) | 62,490 | 3,661,914 | |||||||||
Taylor Morrison Home Corp. (a) | 145,520 | 4,416,532 | |||||||||
The Wendy's Co. | 168,070 | 3,803,424 | |||||||||
Under Armour, Inc., Class C (a) | 540,350 | 4,819,922 | |||||||||
28,616,715 | |||||||||||
Consumer Staples (2.4%): | |||||||||||
U.S. Foods Holding Corp. (a) | 245,120 | 8,338,982 | |||||||||
Energy (5.6%): | |||||||||||
California Resources Corp. | 90,060 | 3,918,511 | |||||||||
Comstock Resources, Inc. | 102,000 | 1,398,420 | |||||||||
Northern Oil and Gas, Inc. | 179,980 | 5,546,983 | |||||||||
PDC Energy, Inc. | 53,060 | 3,368,249 | |||||||||
Plains GP Holdings, LP, Class A | 434,550 | 5,405,802 | |||||||||
19,637,965 | |||||||||||
Health Care (7.4%): | |||||||||||
Encompass Health Corp. | 127,350 | 7,616,804 | |||||||||
Halozyme Therapeutics, Inc. (a) | 139,360 | 7,929,584 | |||||||||
The Ensign Group, Inc. | 77,790 | 7,359,712 | |||||||||
Zimvie, Inc. (a) | 302,880 | 2,828,899 | |||||||||
25,734,999 | |||||||||||
Industrials (13.1%): | |||||||||||
Applied Industrial Technologies, Inc. | 44,500 | 5,608,335 | |||||||||
Atkore, Inc. (a) | 35,250 | 3,998,055 | |||||||||
See notes to financial statements.
24
| Victory Portfolios Victory RS Partners Fund | Schedule of Portfolio Investments — continued December 31, 2022 | ||||||
Security Description | Shares | Value | |||||||||
Finning International, Inc. | 161,540 | $ | 4,016,425 | ||||||||
Fluor Corp. (a) | 157,420 | 5,456,177 | |||||||||
Granite Construction, Inc. | 114,880 | 4,028,842 | |||||||||
H&E Equipment Services, Inc. | 107,060 | 4,860,524 | |||||||||
IAA, Inc. (a) | 42,320 | 1,692,800 | |||||||||
ICF International, Inc. | 40,130 | 3,974,876 | |||||||||
McGrath RentCorp | 22,440 | 2,215,726 | |||||||||
Mueller Water Products, Inc., Class A | 320,980 | 3,453,745 | |||||||||
The Timken Co. | 54,870 | 3,877,663 | |||||||||
Triton International Ltd. | 34,950 | 2,403,861 | |||||||||
45,587,029 | |||||||||||
Information Technology (6.0%): | |||||||||||
ACI Worldwide, Inc. (a) | 292,720 | 6,732,560 | |||||||||
Belden, Inc. | 34,490 | 2,479,831 | |||||||||
Verint Systems, Inc. (a) | 236,990 | 8,597,997 | |||||||||
Verra Mobility Corp. (a) | 237,430 | 3,283,657 | |||||||||
21,094,045 | |||||||||||
Insurance (14.3%): | |||||||||||
Globe Life, Inc. | 106,470 | 12,834,958 | |||||||||
Kemper Corp. | 228,060 | 11,220,552 | |||||||||
Primerica, Inc. | 84,103 | 11,927,487 | |||||||||
Safety Insurance Group, Inc. | 25,210 | 2,124,195 | |||||||||
Selective Insurance Group, Inc. | 23,130 | 2,049,549 | |||||||||
White Mountains Insurance Group Ltd. | 6,820 | 9,645,731 | |||||||||
49,802,472 | |||||||||||
Materials (7.9%): | |||||||||||
Axalta Coating Systems Ltd. (a) | 148,970 | 3,794,266 | |||||||||
Constellium SE (a) | 300,220 | 3,551,603 | |||||||||
Graphic Packaging Holding Co. | 406,230 | 9,038,617 | |||||||||
Olin Corp. | 130,320 | 6,899,141 | |||||||||
Summit Materials, Inc., Class A (a) | 151,662 | 4,305,684 | |||||||||
27,589,311 | |||||||||||
Real Estate (8.8%): | |||||||||||
Corporate Office Properties Trust | 265,310 | 6,882,141 | |||||||||
Equity Commonwealth | 341,680 | 8,531,750 | |||||||||
Four Corners Property Trust, Inc. | 323,360 | 8,384,725 | |||||||||
Kennedy-Wilson Holdings, Inc. | 222,760 | 3,504,015 | |||||||||
The Howard Hughes Corp. (a) | 42,260 | 3,229,509 | |||||||||
30,532,140 | |||||||||||
Utilities (3.6%): | |||||||||||
ALLETE, Inc. | 27,040 | 1,744,350 | |||||||||
Black Hills Corp. | 78,655 | 5,532,593 | |||||||||
ONE Gas, Inc. | 69,120 | 5,233,766 | |||||||||
12,510,709 | |||||||||||
Total Common Stocks (Cost $285,644,090) | 334,925,334 | ||||||||||
See notes to financial statements.
25
| Victory Portfolios Victory RS Partners Fund | Schedule of Portfolio Investments — continued December 31, 2022 | ||||||
Security Description | Shares | Value | |||||||||
Preferred Stocks (0.2%) | |||||||||||
Health Care (0.2%): | |||||||||||
WellDoc, Inc. Series B (b) (c) | 1,587,483 | $ | 587,369 | ||||||||
Total Preferred Stocks (Cost $1,942,920) | 587,369 | ||||||||||
Total Investments (Cost $287,587,010) — 96.2% | 335,512,703 | ||||||||||
Other assets in excess of liabilities — 3.8% | 13,199,774 | ||||||||||
NET ASSETS — 100.00% | $ | 348,712,477 | |||||||||
(a) Non-income producing security.
(b) The Fund's Adviser has deemed this security to be illiquid based upon procedures approved by the Board of Trustees. As of December 31, 2022, illiquid securities were 0.2% of net assets.
(c) Security was fair valued based upon procedures approved by the Board of Trustees and represents 0.2% of net assets as of December 31, 2022. This security is classified as Level 3 within the fair value hierarchy. (See Note 2 in the Notes to Financial Statements)
LP — Limited Partnership
See notes to financial statements.
26
| Victory Portfolios Victory RS Value Fund | Schedule of Portfolio Investments December 31, 2022 | ||||||
Security Description | Shares | Value | |||||||||
Common Stocks (98.2%) | |||||||||||
Banks (0.8%): | |||||||||||
KeyCorp | 129,920 | $ | 2,263,206 | ||||||||
Capital Markets (8.3%): | |||||||||||
Cboe Global Markets, Inc. | 51,090 | 6,410,262 | |||||||||
Federated Hermes, Inc. | 237,840 | 8,635,970 | |||||||||
Interactive Brokers Group, Inc. | 86,330 | 6,245,976 | |||||||||
State Street Corp. | 40,530 | 3,143,912 | |||||||||
24,436,120 | |||||||||||
Communication Services (2.0%): | |||||||||||
Liberty Media Corp.-Liberty SiriusXM, Class C (a) | 129,780 | 5,078,292 | |||||||||
World Wrestling Entertainment, Inc., Class A | 13,160 | 901,723 | |||||||||
5,980,015 | |||||||||||
Consumer Discretionary (8.8%): | |||||||||||
Carter's, Inc. | 44,100 | 3,290,301 | |||||||||
Columbia Sportswear Co. | 19,920 | 1,744,594 | |||||||||
Darden Restaurants, Inc. | 29,800 | 4,122,234 | |||||||||
LKQ Corp. | 85,620 | 4,572,964 | |||||||||
Mattel, Inc. (a) | 254,730 | 4,544,383 | |||||||||
The Wendy's Co. | 234,570 | 5,308,319 | |||||||||
Toll Brothers, Inc. | 49,220 | 2,457,062 | |||||||||
26,039,857 | |||||||||||
Consumer Staples (3.8%): | |||||||||||
Keurig Dr Pepper, Inc. | 131,755 | 4,698,383 | |||||||||
U.S. Foods Holding Corp. (a) | 195,230 | 6,641,725 | |||||||||
11,340,108 | |||||||||||
Energy (5.0%): | |||||||||||
Baker Hughes Co. | 108,320 | 3,198,690 | |||||||||
Chesapeake Energy Corp. | 24,020 | 2,266,767 | |||||||||
Marathon Oil Corp. | 160,980 | 4,357,729 | |||||||||
Ovintiv, Inc. | 59,410 | 3,012,681 | |||||||||
The Williams Cos., Inc. | 62,250 | 2,048,025 | |||||||||
14,883,892 | |||||||||||
Health Care (9.4%): | |||||||||||
Charles River Laboratories International, Inc. (a) | 14,950 | 3,257,605 | |||||||||
Encompass Health Corp. | 106,830 | 6,389,502 | |||||||||
Halozyme Therapeutics, Inc. (a) | 78,940 | 4,491,686 | |||||||||
Humana, Inc. | 14,190 | 7,267,976 | |||||||||
Zimmer Biomet Holdings, Inc. | 48,500 | 6,183,750 | |||||||||
27,590,519 | |||||||||||
Industrials (13.7%): | |||||||||||
AGCO Corp. | 38,070 | 5,279,928 | |||||||||
Crane Holdings Co. | 33,310 | 3,345,990 | |||||||||
Curtiss-Wright Corp. | 17,530 | 2,927,335 | |||||||||
Fluor Corp. (a) | 131,760 | 4,566,802 | |||||||||
IAA, Inc. (a) | 27,900 | 1,116,000 | |||||||||
L3Harris Technologies, Inc. | 7,340 | 1,528,261 | |||||||||
See notes to financial statements.
27
| Victory Portfolios Victory RS Value Fund | Schedule of Portfolio Investments — continued December 31, 2022 | ||||||
Security Description | Shares | Value | |||||||||
Leidos Holdings, Inc. | 48,450 | $ | 5,096,455 | ||||||||
nVent Electric PLC | 81,280 | 3,126,842 | |||||||||
Parker-Hannifin Corp. | 12,130 | 3,529,830 | |||||||||
Sensata Technologies Holding PLC | 125,240 | 5,057,191 | |||||||||
The Timken Co. | 69,510 | 4,912,272 | |||||||||
40,486,906 | |||||||||||
Information Technology (5.1%): | |||||||||||
Fiserv, Inc. (a) | 72,430 | 7,320,500 | |||||||||
Global Payments, Inc. | 15,760 | 1,565,283 | |||||||||
Verint Systems, Inc. (a) | 171,730 | 6,230,365 | |||||||||
15,116,148 | |||||||||||
Insurance (17.8%): | |||||||||||
Brown & Brown, Inc. | 136,450 | 7,773,557 | |||||||||
Fairfax Financial Holdings Ltd. | 19,780 | 11,718,824 | |||||||||
Globe Life, Inc. | 80,180 | 9,665,699 | |||||||||
Markel Corp. (a) | 6,810 | 8,972,107 | |||||||||
The Progressive Corp. | 64,470 | 8,362,404 | |||||||||
White Mountains Insurance Group Ltd. | 4,210 | 5,954,329 | |||||||||
52,446,920 | |||||||||||
Materials (7.2%): | |||||||||||
Graphic Packaging Holding Co. | 343,630 | 7,645,768 | |||||||||
Olin Corp. | 87,910 | 4,653,955 | |||||||||
Sealed Air Corp. | 124,040 | 6,187,115 | |||||||||
Summit Materials, Inc., Class A (a) | 95,943 | 2,723,822 | |||||||||
21,210,660 | |||||||||||
Real Estate (8.4%): | |||||||||||
Alexandria Real Estate Equities, Inc. | 43,530 | 6,341,015 | |||||||||
Equity Commonwealth | 232,530 | 5,806,274 | |||||||||
Equity LifeStyle Properties, Inc. | 45,480 | 2,938,008 | |||||||||
Invitation Homes, Inc. | 115,360 | 3,419,270 | |||||||||
National Retail Properties, Inc. | 135,430 | 6,197,277 | |||||||||
24,701,844 | |||||||||||
Utilities (7.9%): | |||||||||||
Constellation Energy Corp. | 17,690 | 1,525,055 | |||||||||
Evergy, Inc. | 54,480 | 3,428,426 | |||||||||
FirstEnergy Corp. | 65,580 | 2,750,425 | |||||||||
The AES Corp. | 189,110 | 5,438,804 | |||||||||
Vistra Corp. | 432,160 | 10,026,112 | |||||||||
23,168,822 | |||||||||||
Total Common Stocks (Cost $243,501,097) | 289,665,017 | ||||||||||
Total Investments (Cost $243,501,097) — 98.2% | 289,665,017 | ||||||||||
Other assets in excess of liabilities — 1.8% | 5,254,059 | ||||||||||
NET ASSETS — 100.00% | $ | 294,919,076 | |||||||||
(a) Non-income producing security.
PLC — Public Limited Company
See notes to financial statements.
28
| Victory Portfolios Victory RS Large Cap Alpha Fund | Schedule of Portfolio Investments December 31, 2022 | ||||||
Security Description | Shares | Value | |||||||||
Common Stocks (97.2%) | |||||||||||
Banks (1.5%): | |||||||||||
JPMorgan Chase & Co. | 52,680 | $ | 7,064,388 | ||||||||
Capital Markets (7.3%): | |||||||||||
Cboe Global Markets, Inc. | 117,500 | 14,742,725 | |||||||||
Interactive Brokers Group, Inc. | 159,690 | 11,553,572 | |||||||||
State Street Corp. | 103,260 | 8,009,878 | |||||||||
34,306,175 | |||||||||||
Communication Services (1.7%): | |||||||||||
Alphabet, Inc., Class A (a) | 92,630 | 8,172,745 | |||||||||
Consumer Discretionary (3.9%): | |||||||||||
Darden Restaurants, Inc. | 39,420 | 5,452,968 | |||||||||
LKQ Corp. | 157,790 | 8,427,564 | |||||||||
Mattel, Inc. (a) | 248,320 | 4,430,029 | |||||||||
18,310,561 | |||||||||||
Consumer Staples (7.6%): | |||||||||||
Keurig Dr Pepper, Inc. | 265,360 | 9,462,738 | |||||||||
Lamb Weston Holdings, Inc. | 60,620 | 5,417,003 | |||||||||
Mondelez International, Inc., Class A | 175,300 | 11,683,745 | |||||||||
U.S. Foods Holding Corp. (a) | 271,130 | 9,223,842 | |||||||||
35,787,328 | |||||||||||
Energy (8.1%): | |||||||||||
Enterprise Products Partners LP | 402,790 | 9,715,295 | |||||||||
Hess Corp. | 63,370 | 8,987,133 | |||||||||
Marathon Oil Corp. | 394,330 | 10,674,513 | |||||||||
Ovintiv, Inc. | 167,430 | 8,490,375 | |||||||||
37,867,316 | |||||||||||
Health Care (19.0%): | |||||||||||
AbbVie, Inc. | 82,650 | 13,357,066 | |||||||||
Cigna Corp. | 33,690 | 11,162,845 | |||||||||
Humana, Inc. | 23,120 | 11,841,833 | |||||||||
Johnson & Johnson | 47,780 | 8,440,337 | |||||||||
McKesson Corp. | 14,040 | 5,266,685 | |||||||||
Medtronic PLC | 151,930 | 11,807,999 | |||||||||
Merck & Co., Inc. | 132,680 | 14,720,846 | |||||||||
UnitedHealth Group, Inc. | 23,155 | 12,276,318 | |||||||||
88,873,929 | |||||||||||
Industrials (11.9%): | |||||||||||
Eaton Corp. PLC | 37,260 | 5,847,957 | |||||||||
FedEx Corp. | 24,360 | 4,219,152 | |||||||||
Johnson Controls International PLC | 140,860 | 9,015,040 | |||||||||
L3Harris Technologies, Inc. | 24,040 | 5,005,369 | |||||||||
Leidos Holdings, Inc. | 84,170 | 8,853,842 | |||||||||
PACCAR, Inc. | 38,650 | 3,825,191 | |||||||||
Raytheon Technologies Corp. | 59,462 | 6,000,905 | |||||||||
See notes to financial statements.
29
| Victory Portfolios Victory RS Large Cap Alpha Fund | Schedule of Portfolio Investments — continued December 31, 2022 | ||||||
Security Description | Shares | Value | |||||||||
Sensata Technologies Holding PLC | 204,940 | $ | 8,275,477 | ||||||||
Union Pacific Corp. | 21,560 | 4,464,429 | |||||||||
55,507,362 | |||||||||||
Information Technology (4.5%): | |||||||||||
Fidelity National Information Services, Inc. | 188,780 | 12,808,723 | |||||||||
FleetCor Technologies, Inc. (a) | 30,080 | 5,525,094 | |||||||||
Global Payments, Inc. | 25,130 | 2,495,912 | |||||||||
20,829,729 | |||||||||||
Insurance (16.8%): | |||||||||||
Brown & Brown, Inc. | 258,240 | 14,711,933 | |||||||||
Fairfax Financial Holdings Ltd. | 42,320 | 25,072,834 | |||||||||
Markel Corp. (a) | 16,310 | 21,488,262 | |||||||||
The Progressive Corp. | 133,420 | 17,305,908 | |||||||||
78,578,937 | |||||||||||
Materials (3.9%): | |||||||||||
PPG Industries, Inc. | 64,690 | 8,134,121 | |||||||||
Sealed Air Corp. | 206,982 | 10,324,262 | |||||||||
18,458,383 | |||||||||||
Real Estate (4.4%): | |||||||||||
Alexandria Real Estate Equities, Inc. | 62,510 | 9,105,832 | |||||||||
Equity LifeStyle Properties, Inc. | 73,120 | 4,723,552 | |||||||||
Invitation Homes, Inc. | 229,660 | 6,807,122 | |||||||||
20,636,506 | |||||||||||
Utilities (6.6%): | |||||||||||
Constellation Energy Corp. | 57,463 | 4,953,885 | |||||||||
Exelon Corp. | 199,280 | 8,614,875 | |||||||||
Vistra Corp. | 741,030 | 17,191,896 | |||||||||
30,760,656 | |||||||||||
Total Common Stocks (Cost $385,954,723) | 455,154,015 | ||||||||||
Total Investments (Cost $385,954,723) — 97.2% | 455,154,015 | ||||||||||
Other assets in excess of liabilities — 2.8% | 13,130,483 | ||||||||||
NET ASSETS — 100.00% | $ | 468,284,498 | |||||||||
(a) Non-income producing security.
LP — Limited Partnership
PLC — Public Limited Company
See notes to financial statements.
30
| Victory Portfolios Victory RS Investors Fund | Schedule of Portfolio Investments December 31, 2022 | ||||||
Security Description | Shares | Value | |||||||||
Common Stocks (95.2%) | |||||||||||
Banks (3.2%): | |||||||||||
Comerica, Inc. | 7,830 | $ | 523,436 | ||||||||
The Bank of NT Butterfield & Son Ltd. | 30,940 | 922,321 | |||||||||
1,445,757 | |||||||||||
Capital Markets (8.1%): | |||||||||||
Cboe Global Markets, Inc. | 14,680 | 1,841,900 | |||||||||
Federated Hermes, Inc. | 49,510 | 1,797,708 | |||||||||
3,639,608 | |||||||||||
Communication Services (2.1%): | |||||||||||
Alphabet, Inc., Class A (a) | 10,590 | 934,356 | |||||||||
Consumer Discretionary (2.5%): | |||||||||||
LKQ Corp. | 21,020 | 1,122,678 | |||||||||
Consumer Staples (6.8%): | |||||||||||
Keurig Dr Pepper, Inc. | 41,730 | 1,488,092 | |||||||||
U.S. Foods Holding Corp. (a) | 45,950 | 1,563,219 | |||||||||
3,051,311 | |||||||||||
Energy (5.1%): | |||||||||||
Northern Oil and Gas, Inc. | 40,060 | 1,234,649 | |||||||||
PDC Energy, Inc. | 16,860 | 1,070,273 | |||||||||
2,304,922 | |||||||||||
Health Care (14.4%): | |||||||||||
Encompass Health Corp. | 24,180 | 1,446,206 | |||||||||
Humana, Inc. | 2,560 | 1,311,206 | |||||||||
Medtronic PLC | 13,450 | 1,045,334 | |||||||||
Merck & Co., Inc. | 12,830 | 1,423,488 | |||||||||
Zimmer Biomet Holdings, Inc. | 10,160 | 1,295,400 | |||||||||
6,521,634 | |||||||||||
Industrials (4.9%): | |||||||||||
Fluor Corp. (a) | 33,020 | 1,144,473 | |||||||||
Sensata Technologies Holding PLC | 26,750 | 1,080,165 | |||||||||
2,224,638 | |||||||||||
Information Technology (6.6%): | |||||||||||
Fidelity National Information Services, Inc. | 20,910 | 1,418,744 | |||||||||
Verint Systems, Inc. (a) | 43,630 | 1,582,896 | |||||||||
3,001,640 | |||||||||||
Insurance (25.4%): | |||||||||||
Brown & Brown, Inc. | 34,830 | 1,984,265 | |||||||||
Fairfax Financial Holdings Ltd. | 3,620 | 2,144,699 | |||||||||
Markel Corp. (a) | 1,630 | 2,147,509 | |||||||||
The Progressive Corp. | 13,790 | 1,788,701 | |||||||||
White Mountains Insurance Group Ltd. | 1,250 | 1,767,912 | |||||||||
Willis Towers Watson PLC | 6,720 | 1,643,578 | |||||||||
11,476,664 | |||||||||||
See notes to financial statements.
31
| Victory Portfolios Victory RS Investors Fund | Schedule of Portfolio Investments — continued December 31, 2022 | ||||||
Security Description | Shares | Value | |||||||||
Materials (9.2%): | |||||||||||
Graphic Packaging Holding Co. | 64,710 | $ | 1,439,797 | ||||||||
Olin Corp. | 26,490 | 1,402,381 | |||||||||
Sealed Air Corp. | 25,930 | 1,293,388 | |||||||||
4,135,566 | |||||||||||
Real Estate (2.4%): | |||||||||||
Four Corners Property Trust, Inc. | 41,730 | 1,082,059 | |||||||||
Utilities (4.5%): | |||||||||||
Vistra Corp. | 87,780 | 2,036,496 | |||||||||
Total Common Stocks (Cost $38,983,266) | 42,977,329 | ||||||||||
Total Investments (Cost $38,983,266) — 95.2% | 42,977,329 | ||||||||||
Other assets in excess of liabilities — 4.8% | 2,166,096 | ||||||||||
NET ASSETS — 100.00% | $ | 45,143,425 | |||||||||
(a) Non-income producing security.
PLC — Public Limited Company
See notes to financial statements.
32
| Victory Portfolios Victory Global Energy Transition Fund | Schedule of Portfolio Investments December 31, 2022 | ||||||
Security Description | Shares | Value | |||||||||
Common Stocks (79.3%) | |||||||||||
Chemicals (4.7%): | |||||||||||
Linde PLC | 58,902 | $ | 19,212,655 | ||||||||
Energy (0.2%): | |||||||||||
Energy Vault SA (a) (c) (d) (e) | 248,310 | 774,727 | |||||||||
Industrials (3.5%): | |||||||||||
Energy Vault Holdings, Inc. (a) (b) | 2,242,117 | 6,995,404 | |||||||||
NuScale Power Corp. (a) | 563,808 | 5,784,670 | |||||||||
NuScale Power Corp. (a) (b) | 142,608 | 1,463,158 | |||||||||
14,243,232 | |||||||||||
Materials (5.1%): | |||||||||||
Ivanhoe (a) (c) (d) (e) | 1,719,859 | 20,896,287 | |||||||||
Metals & Mining (27.4%): | |||||||||||
First Quantum Minerals Ltd. | 1,812,914 | 37,883,984 | |||||||||
Iluka Resources Ltd. | 2,892,440 | 18,763,412 | |||||||||
Ivanhoe Electric, Inc. (a) (b) | 848,615 | 10,310,672 | |||||||||
Newmont Corp. | 431,075 | 20,346,740 | |||||||||
Norsk Hydro ASA | 2,323,078 | 17,407,771 | |||||||||
Sunrise Energy Metals Ltd. (a) (b) | 5,786,876 | 7,563,102 | |||||||||
112,275,681 | |||||||||||
Oil, Gas & Consumable Fuels (33.8%): | |||||||||||
Antero Resources Corp. (a) | 262,984 | 8,149,874 | |||||||||
Cameco Corp. | 1,454,770 | 32,978,941 | |||||||||
Cheniere Energy, Inc. | 24,196 | 3,628,432 | |||||||||
Enterprise Products Partners LP | 744,130 | 17,948,416 | |||||||||
Peyto Exploration & Development Corp. | 428,461 | 4,389,684 | |||||||||
Range Resources Corp. | 148,744 | 3,721,575 | |||||||||
Tourmaline Oil Corp. | 172,104 | 8,685,290 | |||||||||
Whitecap Resources, Inc. | 7,463,872 | 59,212,576 | |||||||||
138,714,788 | |||||||||||
Utilities (4.6%): | |||||||||||
NextEra Energy, Inc. | 226,960 | 18,973,856 | |||||||||
Total Common Stocks (Cost $258,528,102) | 325,091,226 | ||||||||||
Collateral for Securities Loaned (2.4%)^ | |||||||||||
| Goldman Sachs Financial Square Government Fund, Institutional Shares, 4.14% (f) | 2,428,128 | 2,428,128 | |||||||||
HSBC U.S. Government Money Market Fund, Institutional Shares, 4.13% (f) | 2,585,364 | 2,585,364 | |||||||||
Invesco Government & Agency Portfolio, Institutional Shares, 4.22% (f) | 2,585,364 | 2,585,364 | |||||||||
See notes to financial statements.
33
| Victory Portfolios Victory Global Energy Transition Fund | Schedule of Portfolio Investments — continued December 31, 2022 | ||||||
Security Description | Shares | Value | |||||||||
| Morgan Stanley Institutional Liquidity Government Portfolio, Institutional Shares, 4.08% (f) | 2,393,401 | $ | 2,393,401 | ||||||||
Total Collateral for Securities Loaned (Cost $9,992,257) | 9,992,257 | ||||||||||
Total Investments (Cost $268,520,359) — 81.7% | 335,083,483 | ||||||||||
Other assets in excess of liabilities — 18.3% | 74,805,516 | ||||||||||
NET ASSETS — 100.00% | $ | 409,888,999 | |||||||||
^ Purchased with cash collateral from securities on loan.
(a) Non-income producing security.
(b) All or a portion of this security is on loan.
(c) The Fund's Adviser has deemed this security to be illiquid based upon procedures approved by the Board of Trustees. As of December 31, 2022, illiquid securities were 5.3% of net assets.
(d) Restricted security that is not registered under the Securities Act of 1933.
(e) The following table details the earliest acquisition date and cost of the Fund's restricted securities at December 31, 2022:
Security Name | Acquisition Date | Cost | |||||||||
Energy Vault SA | 8/24/2021 | $ | 2,323,956 | ||||||||
Ivanhoe | 7/28/2021 | 13,005,355 | |||||||||
(f) Rate disclosed is the daily yield on December 31, 2022.
LP — Limited Partnership
PLC — Public Limited Company
See notes to financial statements.
34
Victory Portfolios | Statements of Assets and Liabilities December 31, 2022 | ||||||
| Victory RS Partners Fund | Victory RS Value Fund | Victory RS Large Cap Alpha Fund | |||||||||||||
Assets: | |||||||||||||||
| Investments, at value (Cost $287,587,010 $243,501,097 and $385,954,723) | $ | 335,512,703 | $ | 289,665,017 | $ | 455,154,015 | |||||||||
Cash | 13,500,879 | 5,267,696 | 13,258,047 | ||||||||||||
Receivables: | |||||||||||||||
Interest and dividends | 432,455 | 170,054 | 728,261 | ||||||||||||
Capital shares issued | 165,822 | 389,745 | 20,373 | ||||||||||||
From Adviser | 53,716 | 3,877 | 22,936 | ||||||||||||
Prepaid expenses | 26,951 | 27,427 | 26,069 | ||||||||||||
Total Assets | 349,692,526 | 295,523,816 | 469,209,701 | ||||||||||||
Liabilities: | |||||||||||||||
Payables: | |||||||||||||||
Capital shares redeemed | 520,800 | 262,155 | 540,648 | ||||||||||||
Accrued expenses and other payables: | |||||||||||||||
Investment advisory fees | 300,398 | 215,418 | 201,394 | ||||||||||||
Administration fees | 16,043 | 13,584 | 21,586 | ||||||||||||
Custodian fees | 4,569 | 3,863 | 5,728 | ||||||||||||
Transfer agent fees | 83,614 | 60,144 | 71,282 | ||||||||||||
Compliance fees | 268 | 226 | 359 | ||||||||||||
Trustees' fees | 113 | 112 | 119 | ||||||||||||
| 12b-1 fees | 18,861 | 19,497 | 50,806 | ||||||||||||
Other accrued expenses | 35,383 | 29,741 | 33,281 | ||||||||||||
Total Liabilities | 980,049 | 604,740 | 925,203 | ||||||||||||
Net Assets: | |||||||||||||||
| Capital | 303,340,860 | 247,684,746 | 394,485,974 | ||||||||||||
Total accumulated earnings/(loss) | 45,371,617 | 47,234,330 | 73,798,524 | ||||||||||||
Net Assets | $ | 348,712,477 | $ | 294,919,076 | $ | 468,284,498 | |||||||||
Net Assets | |||||||||||||||
Class A | $ | 169,627,658 | $ | 172,406,309 | $ | 437,854,920 | |||||||||
Class C | — | 1,281,877 | 3,594,843 | ||||||||||||
Class R | 1,518,570 | 647,537 | 5,765,200 | ||||||||||||
Class Y | 172,847,146 | 120,583,353 | 21,069,535 | ||||||||||||
Member Class | 4,719,103 | — | — | ||||||||||||
Total | $ | 348,712,477 | $ | 294,919,076 | $ | 468,284,498 | |||||||||
| Shares (unlimited number of shares authorized with a par value of $0.001 per share): | |||||||||||||||
Class A | 7,206,396 | 7,172,833 | 9,137,210 | ||||||||||||
Class C | — | 63,576 | 94,674 | ||||||||||||
Class R | 74,976 | 29,061 | 121,351 | ||||||||||||
Class Y | 6,692,182 | 4,837,976 | 441,969 | ||||||||||||
Member Class | 200,121 | — | — | ||||||||||||
Total | 14,173,675 | 12,103,446 | 9,795,204 | ||||||||||||
| Net asset value, offering (except Class A) and redemption price per share: | |||||||||||||||
Class A | $ | 23.54 | $ | 24.04 | $ | 47.92 | |||||||||
Class C (a) | — | 20.16 | 37.97 | ||||||||||||
Class R | 20.25 | 22.28 | 47.51 | ||||||||||||
Class Y | 25.83 | 24.92 | 47.67 | ||||||||||||
Member Class | 23.58 | — | — | ||||||||||||
Maximum Sales Charge — Class A | 5.75 | % | 5.75 | % | 5.75 | % | |||||||||
| Maximum offering price (100%/(100%-maximum sales charge) of net asset value adjusted to the nearest cent) per share — Class A | $ | 24.98 | $ | 25.51 | $ | 50.84 | |||||||||
(a) Redemption price per share varies by the length of time shares are held.
See notes to financial statements.
35
Victory Portfolios | Statements of Assets and Liabilities December 31, 2022 | ||||||
| Victory RS Investors Fund | Victory Global Energy Transition Fund | ||||||||||
Assets: | |||||||||||
Investments, at value (Cost $38,983,266 and $268,520,359) | $ | 42,977,329 | $ | 335,083,483 | (a) | ||||||
Foreign currency, at value (Cost $— and $27,016) | — | 27,016 | |||||||||
Cash | 2,094,601 | 76,073,699 | |||||||||
Receivables: | |||||||||||
Interest and dividends | 73,029 | 124,127 | |||||||||
Capital shares issued | 6,042 | 274,102 | |||||||||
Investments sold | — | 8,943,867 | |||||||||
From Adviser | 26,883 | 34,941 | |||||||||
Prepaid expenses | 30,771 | 37,244 | |||||||||
Total Assets | 45,208,655 | 420,598,479 | |||||||||
Liabilities: | |||||||||||
Payables: | |||||||||||
Collateral received on loaned securities | — | 9,992,257 | |||||||||
Capital shares redeemed | 67 | 221,506 | |||||||||
Accrued expenses and other payables: | |||||||||||
Investment advisory fees | 38,642 | 350,010 | |||||||||
Administration fees | 2,085 | 18,633 | |||||||||
Custodian fees | 1,102 | 8,581 | |||||||||
Transfer agent fees | 8,335 | 77,666 | |||||||||
Compliance fees | 34 | 306 | |||||||||
Trustees' fees | 101 | 115 | |||||||||
| 12b-1 fees | 2,248 | 11,453 | |||||||||
Other accrued expenses | 12,616 | 28,953 | |||||||||
Total Liabilities | 65,230 | 10,709,480 | |||||||||
Net Assets: | |||||||||||
| Capital | 41,121,602 | 2,108,650,899 | |||||||||
Total accumulated earnings/(loss) | 4,021,823 | (1,698,761,900 | ) | ||||||||
Net Assets | $ | 45,143,425 | $ | 409,888,999 | |||||||
Net Assets | |||||||||||
Class A | $ | 15,250,214 | $ | 91,520,661 | |||||||
Class C | 908,711 | 2,396,497 | |||||||||
Class R | 841,579 | 1,863,900 | |||||||||
Class Y | 28,142,921 | 314,107,941 | |||||||||
Total | $ | 45,143,425 | $ | 409,888,999 | |||||||
| Shares (unlimited number of shares authorized with a par value of $0.001 per share): | |||||||||||
Class A | 1,164,053 | 3,020,264 | |||||||||
Class C | 83,129 | 89,562 | |||||||||
Class R | 75,194 | 65,784 | |||||||||
Class Y | 2,067,267 | 9,915,645 | |||||||||
Total | 3,389,643 | 13,091,255 | |||||||||
| Net asset value, offering (except Class A) and redemption price per share: | |||||||||||
Class A | $ | 13.10 | $ | 30.30 | |||||||
Class C (b) | 10.93 | 26.76 | |||||||||
Class R | 11.19 | 28.33 | |||||||||
Class Y | 13.61 | 31.68 | |||||||||
Maximum Sales Charge — Class A | 5.75 | % | 5.75 | % | |||||||
| Maximum offering price (100%/(100%-maximum sales charge) of net asset value adjusted to the nearest cent) per share — Class A | $ | 13.90 | $ | 32.15 | |||||||
(a) Includes $10,037,738 of securities on loan.
(b) Redemption price per share varies by the length of time shares are held.
See notes to financial statements.
36
Victory Portfolios | Statements of Operations For the Year Ended December 31, 2022 | ||||||
| Victory RS Partners Fund | Victory RS Value Fund | Victory RS Large Cap Alpha Fund | |||||||||||||
Investment Income: | |||||||||||||||
Dividends | $ | 6,498,507 | $ | 4,305,246 | $ | 8,059,664 | |||||||||
Interest | 65,433 | 45,000 | 82,069 | ||||||||||||
Securities lending (net of fees) | 3,156 | 5,501 | 503 | ||||||||||||
Foreign tax withholding | (45,104 | ) | (6,689 | ) | — | ||||||||||
Total Income | 6,521,992 | 4,349,058 | 8,142,236 | ||||||||||||
Expenses: | |||||||||||||||
Investment advisory fees | 3,655,409 | 2,595,474 | 2,469,739 | ||||||||||||
Administration fees | 199,060 | 166,264 | 268,951 | ||||||||||||
Sub-Administration fees | 17,000 | 17,000 | 13,708 | ||||||||||||
| 12b-1 fees — Class A | 447,354 | 437,039 | 1,155,404 | ||||||||||||
| 12b-1 fees — Class C | — | 11,627 | 45,165 | ||||||||||||
| 12b-1 fees — Class R | 7,436 | 3,225 | 30,567 | ||||||||||||
Custodian fees | 19,540 | 12,432 | 23,891 | ||||||||||||
Transfer agent fees — Class A | 242,986 | 207,250 | 363,118 | ||||||||||||
Transfer agent fees — Class C | — | 892 | 3,328 | ||||||||||||
Transfer agent fees — Class R | 2,671 | 1,343 | 10,242 | ||||||||||||
Transfer agent fees — Class Y | 176,063 | 129,288 | 16,074 | ||||||||||||
Transfer agent fees — Member Class | 7,545 | — | — | ||||||||||||
Trustees' fees | 23,147 | 19,615 | 30,328 | ||||||||||||
Compliance fees | 2,939 | 2,456 | 3,970 | ||||||||||||
Legal and audit fees | 32,384 | 28,696 | 41,002 | ||||||||||||
State registration and filing fees | 77,729 | 57,596 | 56,607 | ||||||||||||
Other expenses | 51,640 | 35,414 | 44,022 | ||||||||||||
| Recoupment of prior expenses waived/reimbursed by Adviser | — | 4,358 | 430 | ||||||||||||
Total Expenses | 4,962,903 | 3,729,969 | 4,576,546 | ||||||||||||
Expenses waived/reimbursed by Adviser | (263,864 | ) | (59,177 | ) | (167,620 | ) | |||||||||
Net Expenses | 4,699,039 | 3,670,792 | 4,408,926 | ||||||||||||
Net Investment Income (Loss) | 1,822,953 | 678,266 | 3,733,310 | ||||||||||||
| Realized/Unrealized Gains (Losses) from Investments: | |||||||||||||||
| Net realized gains (losses) from investment securities and foreign currency transactions | 20,984,463 | 8,930,820 | 20,320,447 | ||||||||||||
| Net change in unrealized appreciation/depreciation on investment securities | (41,210,672 | ) | (19,220,752 | ) | (48,052,387 | ) | |||||||||
| Net realized/unrealized gains (losses) on investments | (20,226,209 | ) | (10,289,932 | ) | (27,731,940 | ) | |||||||||
Change in net assets resulting from operations | $ | (18,403,256 | ) | $ | (9,611,666 | ) | $ | (23,998,630 | ) | ||||||
See notes to financial statements.
37
Victory Portfolios | Statements of Operations For the Year Ended December 31, 2022 | ||||||
| Victory RS Investors Fund | Victory Global Energy Transition Fund | ||||||||||
Investment Income: | |||||||||||
Dividends | $ | 445,470 | $ | 8,145,048 | |||||||
Non-cash dividends | — | 748,454 | |||||||||
Interest | 14,499 | 393,224 | |||||||||
Securities lending (net of fees) | 10 | 1,331,333 | |||||||||
Foreign tax withholding | — | (1,115,838 | ) | ||||||||
Total Income | 459,979 | 9,502,221 | |||||||||
Expenses: | |||||||||||
Investment advisory fees | 350,994 | 3,980,795 | |||||||||
Administration fees | 19,141 | 216,832 | |||||||||
Sub-Administration fees | 13,500 | 13,500 | |||||||||
| 12b-1 fees — Class A | 37,493 | 239,320 | |||||||||
| 12b-1 fees — Class C | 15,047 | 28,493 | |||||||||
| 12b-1 fees — Class R | 4,112 | 8,245 | |||||||||
Custodian fees | 4,210 | 36,821 | |||||||||
Transfer agent fees — Class A | 15,711 | 149,099 | |||||||||
Transfer agent fees — Class C | 1,999 | 3,772 | |||||||||
Transfer agent fees — Class R | 1,476 | 2,090 | |||||||||
Transfer agent fees — Class Y | 17,811 | 265,276 | |||||||||
Trustees' fees | 3,711 | 22,466 | |||||||||
Compliance fees | 276 | 3,123 | |||||||||
Legal and audit fees | 11,078 | 34,673 | |||||||||
State registration and filing fees | 45,473 | 74,781 | |||||||||
Other expenses | 14,093 | 51,924 | |||||||||
Recoupment of prior expenses waived/reimbursed by Adviser | 187 | 35 | |||||||||
Total Expenses | 556,312 | 5,131,245 | |||||||||
Expenses waived/reimbursed by Adviser | (122,672 | ) | (189,737 | ) | |||||||
Net Expenses | 433,640 | 4,941,508 | |||||||||
Net Investment Income (Loss) | 26,339 | 4,560,713 | |||||||||
Realized/Unrealized Gains (Losses) from Investments: | |||||||||||
| Net realized gains (losses) from investment securities and foreign currency transactions | 1,702,383 | 134,414,758 | |||||||||
| Net change in unrealized appreciation/depreciation on investment securities and foreign currency translations | (1,723,505 | ) | (39,895,610 | ) | |||||||
Net realized/unrealized gains (losses) on investments | (21,122 | ) | 94,519,148 | ||||||||
Change in net assets resulting from operations | $ | 5,217 | $ | 99,079,861 | |||||||
See notes to financial statements.
38
Victory Portfolios | Statements of Changes in Net Assets | ||||||
| Victory RS Partners Fund | Victory RS Value Fund | Victory RS Large Cap Alpha Fund | |||||||||||||||||||||||||
| Year Ended December 31, 2022 | Year Ended December 31, 2021 | Year Ended December 31, 2022 | Year Ended December 31, 2021 | Year Ended December 31, 2022 | Year Ended December 31, 2021 | ||||||||||||||||||||||
From Investment Activities: | |||||||||||||||||||||||||||
Operations: | |||||||||||||||||||||||||||
| Net Investment Income (Loss) | $ | 1,822,953 | $ | (449,102 | ) | $ | 678,266 | $ | 748,848 | $ | 3,733,310 | $ | 5,769,360 | ||||||||||||||
| Net realized gains (losses) | 20,984,463 | 80,047,267 | 8,930,820 | 67,085,450 | 20,320,447 | 79,181,305 | |||||||||||||||||||||
| Net change in unrealized appreciation/ depreciation | (41,210,672 | ) | 13,032,470 | (19,220,752 | ) | 11,836,881 | (48,052,387 | ) | 20,032,914 | ||||||||||||||||||
| Change in net assets resulting from operations | (18,403,256 | ) | 92,630,635 | (9,611,666 | ) | 79,671,179 | (23,998,630 | ) | 104,983,579 | ||||||||||||||||||
| Distributions to Shareholders: | |||||||||||||||||||||||||||
Class A | (14,065,471 | ) | (28,047,422 | ) | (10,380,392 | ) | (23,751,997 | ) | (40,238,962 | ) | (55,880,468 | ) | |||||||||||||||
Class C | — | — | (78,057 | ) | (199,127 | ) | (381,095 | ) | (812,225 | ) | |||||||||||||||||
Class R | (139,039 | ) | (261,917 | ) | (39,545 | ) | (83,609 | ) | (512,985 | ) | (699,959 | ) | |||||||||||||||
Class Y | (13,746,011 | ) | (24,006,515 | ) | (7,328,104 | ) | (17,934,828 | ) | (2,018,146 | ) | (2,330,388 | ) | |||||||||||||||
Member Class | (395,123 | ) | (434,976 | ) | — | — | — | — | |||||||||||||||||||
| Change in net assets resulting from distributions to shareholders | (28,345,644 | ) | (52,750,830 | ) | (17,826,098 | ) | (41,969,561 | ) | (43,151,188 | ) | (59,723,040 | ) | |||||||||||||||
| Change in net assets resulting from capital transactions | 18,483,829 | 10,857,122 | (12,342,276 | ) | (10,957,822 | ) | 6,717,073 | 5,894,424 | |||||||||||||||||||
Change in net assets | (28,265,071 | ) | 50,736,927 | (39,780,040 | ) | 26,743,796 | (60,432,745 | ) | 51,154,963 | ||||||||||||||||||
Net Assets: | |||||||||||||||||||||||||||
Beginning of period | 376,977,548 | 326,240,621 | 334,699,116 | 307,955,320 | 528,717,243 | 477,562,280 | |||||||||||||||||||||
End of period | $ | 348,712,477 | $ | 376,977,548 | $ | 294,919,076 | $ | 334,699,116 | $ | 468,284,498 | $ | 528,717,243 | |||||||||||||||
(continues on next page)
See notes to financial statements.
39
Victory Portfolios | Statements of Changes in Net Assets | ||||||
(continued)
| Victory RS Partners Fund | Victory RS Value Fund | Victory RS Large Cap Alpha Fund | |||||||||||||||||||||||||
| Year Ended December 31, 2022 | Year Ended December 31, 2021 | Year Ended December 31, 2022 | Year Ended December 31, 2021 | Year Ended December 31, 2022 | Year Ended December 31, 2021 | ||||||||||||||||||||||
Capital Transactions: | |||||||||||||||||||||||||||
Class A | |||||||||||||||||||||||||||
| Proceeds from shares issued | $ | 12,294,532 | $ | 32,378,102 | $ | 8,885,625 | $ | 12,582,595 | $ | 11,263,699 | $ | 18,537,698 | |||||||||||||||
| Distributions reinvested | 13,743,907 | 27,357,527 | 10,159,035 | 23,208,972 | 39,263,142 | 54,292,632 | |||||||||||||||||||||
| Cost of shares redeemed | (28,715,098 | ) | (38,380,359 | ) | (19,542,267 | ) | (27,845,087 | ) | (45,886,188 | ) | (63,635,769 | ) | |||||||||||||||
Total Class A | $ | (2,676,659 | ) | $ | 21,355,270 | $ | (497,607 | ) | $ | 7,946,480 | $ | 4,640,653 | $ | 9,194,561 | |||||||||||||
Class C | |||||||||||||||||||||||||||
| Proceeds from shares issued | $ | — | $ | — | $ | 440,819 | $ | 93,397 | $ | 502,720 | $ | 183,579 | |||||||||||||||
| Distributions reinvested | — | — | 78,057 | 199,127 | 366,127 | 784,649 | |||||||||||||||||||||
| Cost of shares redeemed | — | — | (506,372 | ) | (1,731,042 | ) | (2,850,908 | ) | (6,904,121 | ) | |||||||||||||||||
Total Class C | $ | — | $ | — | $ | 12,504 | $ | (1,438,518 | ) | $ | (1,982,061 | ) | $ | (5,935,893 | ) | ||||||||||||
Class R | |||||||||||||||||||||||||||
| Proceeds from shares issued | $ | 133,590 | $ | 102,925 | $ | 84,996 | $ | 79,653 | $ | 516,818 | $ | 569,839 | |||||||||||||||
| Distributions reinvested | 139,039 | 261,917 | 38,186 | 78,836 | 511,021 | 695,951 | |||||||||||||||||||||
| Cost of shares redeemed | (187,821 | ) | (278,653 | ) | (53,416 | ) | (280,742 | ) | (851,859 | ) | (1,527,178 | ) | |||||||||||||||
Total Class R | $ | 84,808 | $ | 86,189 | $ | 69,766 | $ | (122,253 | ) | $ | 175,980 | $ | (261,388 | ) | |||||||||||||
Class Y | |||||||||||||||||||||||||||
| Proceeds from shares issued | $ | 67,817,832 | $ | 64,038,117 | $ | 8,544,926 | $ | 12,404,934 | $ | 5,469,114 | $ | 4,827,781 | |||||||||||||||
| Distributions reinvested | 13,720,213 | 23,949,470 | 7,239,739 | 17,722,595 | 1,977,089 | 2,275,335 | |||||||||||||||||||||
| Cost of shares redeemed | (62,763,872 | ) | (101,782,209 | ) | (27,711,604 | ) | (47,471,060 | ) | (3,563,702 | ) | (4,205,972 | ) | |||||||||||||||
Total Class Y | $ | 18,774,173 | $ | (13,794,622 | ) | $ | (11,926,939 | ) | $ | (17,343,531 | ) | $ | 3,882,501 | $ | 2,897,144 | ||||||||||||
Member Class | |||||||||||||||||||||||||||
| Proceeds from shares issued | $ | 2,720,707 | $ | 4,042,884 | $ | — | $ | — | $ | — | $ | — | |||||||||||||||
| Distributions reinvested | 395,123 | 434,976 | — | — | — | — | |||||||||||||||||||||
| Cost of shares redeemed | (814,323 | ) | (1,267,575 | ) | — | — | — | — | |||||||||||||||||||
| Total Member Class | $ | 2,301,507 | $ | 3,210,285 | $ | — | $ | — | $ | — | $ | — | |||||||||||||||
| Change in net assets resulting from capital transactions | $ | 18,483,829 | $ | 10,857,122 | $ | (12,342,276 | ) | $ | (10,957,822 | ) | $ | 6,717,073 | $ | 5,894,424 | |||||||||||||
(continues on next page)
See notes to financial statements.
40
Victory Portfolios | Statements of Changes in Net Assets | ||||||
(continued)
| Victory RS Partners Fund | Victory RS Value Fund | Victory RS Large Cap Alpha Fund | |||||||||||||||||||||||||
| Year Ended December 31, 2022 | Year Ended December 31, 2021 | Year Ended December 31, 2022 | Year Ended December 31, 2021 | Year Ended December 31, 2022 | Year Ended December 31, 2021 | ||||||||||||||||||||||
Share Transactions: | |||||||||||||||||||||||||||
Class A | |||||||||||||||||||||||||||
Issued | 481,262 | 1,071,551 | 355,513 | 459,952 | 211,002 | 327,763 | |||||||||||||||||||||
Reinvested | 571,496 | 1,045,777 | 416,820 | 900,018 | 801,682 | 1,000,925 | |||||||||||||||||||||
Redeemed | (1,118,378 | ) | (1,316,022 | ) | (773,903 | ) | (1,031,826 | ) | (864,956 | ) | (1,117,937 | ) | |||||||||||||||
Total Class A | (65,620 | ) | 801,306 | (1,570 | ) | 328,144 | 147,728 | 210,751 | |||||||||||||||||||
Class C | |||||||||||||||||||||||||||
Issued | — | — | 21,134 | 3,951 | 11,796 | 3,697 | |||||||||||||||||||||
Reinvested | — | — | 3,832 | 9,118 | 9,478 | 17,967 | |||||||||||||||||||||
Redeemed | — | — | (23,831 | ) | (77,404 | ) | (65,919 | ) | (151,544 | ) | |||||||||||||||||
Total Class C | — | — | 1,135 | (64,335 | ) | (44,645 | ) | (129,880 | ) | ||||||||||||||||||
Class R | |||||||||||||||||||||||||||
Issued | 6,032 | 3,946 | 3,628 | 3,060 | 9,762 | 10,041 | |||||||||||||||||||||
Reinvested | 6,728 | 11,467 | 1,694 | 3,293 | 10,550 | 12,969 | |||||||||||||||||||||
Redeemed | (8,341 | ) | (10,507 | ) | (2,254 | ) | (10,767 | ) | (16,389 | ) | (26,224 | ) | |||||||||||||||
Total Class R | 4,419 | 4,906 | 3,068 | (4,414 | ) | 3,923 | (3,214 | ) | |||||||||||||||||||
Class Y | |||||||||||||||||||||||||||
Issued | 2,441,288 | 1,974,973 | 329,333 | 451,850 | 101,669 | 81,687 | |||||||||||||||||||||
Reinvested | 519,303 | 839,425 | 286,099 | 663,195 | 40,522 | 42,077 | |||||||||||||||||||||
Redeemed | (2,338,046 | ) | (3,210,913 | ) | (1,057,340 | ) | (1,681,077 | ) | (67,594 | ) | (74,261 | ) | |||||||||||||||
Total Class Y | 622,545 | (396,515 | ) | (441,908 | ) | (566,032 | ) | 74,597 | 49,503 | ||||||||||||||||||
Member Class | |||||||||||||||||||||||||||
Issued | 104,185 | 132,546 | — | — | — | — | |||||||||||||||||||||
Reinvested | 16,381 | 16,583 | — | — | — | — | |||||||||||||||||||||
Redeemed | (31,891 | ) | (41,908 | ) | — | — | — | — | |||||||||||||||||||
Total Member Class | 88,675 | 107,221 | — | — | — | — | |||||||||||||||||||||
Change in Shares | 650,019 | 516,918 | (439,275 | ) | (306,637 | ) | 181,603 | 127,160 | |||||||||||||||||||
See notes to financial statements.
41
Victory Portfolios | Statements of Changes in Net Assets | ||||||
| Victory RS Investors Fund | Victory Global Energy Transition Fund | ||||||||||||||||||
| Year Ended December 31, 2022 | Year Ended December 31, 2021 | Year Ended December 31, 2022 | Year Ended December 31, 2021 | ||||||||||||||||
From Investment Activities: | |||||||||||||||||||
Operations: | |||||||||||||||||||
Net Investment Income (Loss) | $ | 26,339 | $ | 45,520 | $ | 4,560,713 | $ | 12,401 | |||||||||||
Net realized gains (losses) | 1,702,383 | 6,937,784 | 134,414,758 | 8,906,170 | |||||||||||||||
| Net change in unrealized appreciation/depreciation | (1,723,505 | ) | (144,539 | ) | (39,895,610 | ) | 121,511,876 | ||||||||||||
| Change in net assets resulting from operations | 5,217 | 6,838,765 | 99,079,861 | 130,430,447 | |||||||||||||||
Distributions to Shareholders: | |||||||||||||||||||
Class A | (593,474 | ) | (2,084,214 | ) | (714,418 | ) | — | ||||||||||||
Class C | (41,908 | ) | (430,072 | ) | (189 | ) | — | ||||||||||||
Class R | (37,686 | ) | (124,797 | ) | (11,014 | ) | — | ||||||||||||
Class Y | (1,114,859 | ) | (1,716,122 | ) | (3,323,209 | ) | (86,748 | ) | |||||||||||
| Change in net assets resulting from distributions to shareholders | (1,787,927 | ) | (4,355,205 | ) | (4,048,830 | ) | (86,748 | ) | |||||||||||
| Change in net assets resulting from capital transactions | 15,802,450 | 762,677 | 21,689,145 | 3,720,084 | |||||||||||||||
Change in net assets | 14,019,740 | 3,246,237 | 116,720,176 | 134,063,783 | |||||||||||||||
Net Assets: | |||||||||||||||||||
Beginning of period | 31,123,685 | 27,877,448 | 293,168,823 | 159,105,040 | |||||||||||||||
End of period | $ | 45,143,425 | $ | 31,123,685 | $ | 409,888,999 | $ | 293,168,823 | |||||||||||
(continues on next page)
See notes to financial statements.
42
Victory Portfolios | Statements of Changes in Net Assets | ||||||
(continued)
| Victory RS Investors Fund | Victory Global Energy Transition Fund | ||||||||||||||||||
| Year Ended December 31, 2022 | Year Ended December 31, 2021 | Year Ended December 31, 2022 | Year Ended December 31, 2021 | ||||||||||||||||
Capital Transactions: | |||||||||||||||||||
Class A | |||||||||||||||||||
Proceeds from shares issued | $ | 2,946,002 | $ | 1,456,481 | $ | 42,038,478 | $ | 45,428,214 | |||||||||||
Distributions reinvested | 564,633 | 1,959,510 | 689,192 | — | |||||||||||||||
Cost of shares redeemed | (2,406,749 | ) | (2,154,752 | ) | (55,481,662 | ) | (36,106,014 | ) | |||||||||||
Total Class A | $ | 1,103,886 | $ | 1,261,239 | $ | (12,753,992 | ) | $ | 9,322,200 | ||||||||||
Class C | |||||||||||||||||||
Proceeds from shares issued | $ | 120,210 | $ | 115,128 | $ | 242,268 | $ | 1,198,233 | |||||||||||
Distributions reinvested | 41,908 | 430,072 | 189 | — | |||||||||||||||
Cost of shares redeemed | (1,839,725 | ) | (1,412,389 | ) | (1,979,269 | ) | (1,858,895 | ) | |||||||||||
Total Class C | $ | (1,677,607 | ) | $ | (867,189 | ) | $ | (1,736,812 | ) | $ | (660,662 | ) | |||||||
Class R | |||||||||||||||||||
Proceeds from shares issued | $ | 88,122 | $ | 37,764 | $ | 675,055 | $ | 1,274,162 | |||||||||||
Distributions reinvested | 37,686 | 124,797 | 11,014 | — | |||||||||||||||
Cost of shares redeemed | (32,776 | ) | (47,693 | ) | (167,974 | ) | (1,575,801 | ) | |||||||||||
Total Class R | $ | 93,032 | $ | 114,868 | $ | 518,095 | $ | (301,639 | ) | ||||||||||
Class Y | |||||||||||||||||||
Proceeds from shares issued | $ | 19,799,022 | $ | 1,797,156 | $ | 169,662,076 | $ | 102,421,824 | |||||||||||
Distributions reinvested | 1,113,618 | 1,711,171 | 2,993,315 | 81,976 | |||||||||||||||
Cost of shares redeemed | (4,629,501 | ) | (3,254,568 | ) | (136,993,537 | ) | (107,143,615 | ) | |||||||||||
Total Class Y | $ | 16,283,139 | $ | 253,759 | $ | 35,661,854 | $ | (4,639,815 | ) | ||||||||||
| Change in net assets resulting from capital transactions | $ | 15,802,450 | $ | 762,677 | $ | 21,689,145 | $ | 3,720,084 | |||||||||||
Share Transactions: | |||||||||||||||||||
Class A | |||||||||||||||||||
Issued | 217,087 | 99,952 | 1,436,545 | 2,394,815 | |||||||||||||||
Reinvested | 42,556 | 143,240 | 23,011 | — | |||||||||||||||
Redeemed | (177,774 | ) | (147,295 | ) | (1,901,168 | ) | (1,910,846 | ) | |||||||||||
Total Class A | 81,869 | 95,897 | (441,612 | ) | 483,969 | ||||||||||||||
Class C | |||||||||||||||||||
Issued | 10,737 | 9,121 | 9,549 | 78,427 | |||||||||||||||
Reinvested | 3,786 | 37,139 | 7 | — | |||||||||||||||
Redeemed | (161,053 | ) | (111,183 | ) | (82,155 | ) | (133,023 | ) | |||||||||||
Total Class C | (146,530 | ) | (64,923 | ) | (72,599 | ) | (54,596 | ) | |||||||||||
Class R | |||||||||||||||||||
Issued | 7,591 | 2,913 | 23,316 | 83,535 | |||||||||||||||
Reinvested | 3,323 | 10,549 | 393 | — | |||||||||||||||
Redeemed | (2,781 | ) | (3,805 | ) | (6,335 | ) | (93,632 | ) | |||||||||||
Total Class R | 8,133 | 9,657 | 17,374 | (10,097 | ) | ||||||||||||||
Class Y | |||||||||||||||||||
Issued | 1,441,483 | 117,213 | 5,366,764 | 5,277,694 | |||||||||||||||
Reinvested | 80,652 | 120,357 | 95,633 | 3,515 | |||||||||||||||
Redeemed | (327,694 | ) | (214,659 | ) | (4,455,045 | ) | (5,630,485 | ) | |||||||||||
Total Class Y | 1,194,441 | 22,911 | 1,007,352 | (349,276 | ) | ||||||||||||||
Change in Shares | 1,137,913 | 63,542 | 510,515 | 70,000 | |||||||||||||||
See notes to financial statements.
43
Victory Portfolios | Financial Highlights | ||||||
For a Share Outstanding Throughout Each Period
Victory RS Partners Fund | |||||||||||||||||||||||
Class A | |||||||||||||||||||||||
| Year Ended December 31, 2022 | Year Ended December 31, 2021 | Year Ended December 31, 2020 | Year Ended December 31, 2019 | Year Ended December 31, 2018 | |||||||||||||||||||
Net Asset Value, Beginning of Period | $ | 26.82 | $ | 24.21 | $ | 24.47 | $ | 20.66 | $ | 29.21 | |||||||||||||
Investment Activities: | |||||||||||||||||||||||
Net investment income (loss) (a) | 0.08 | (0.09 | ) | 0.04 | 0.12 | 0.04 | |||||||||||||||||
| Net realized and unrealized gains (losses) | (1.26 | ) | 7.14 | 0.07 | 6.12 | (3.52 | ) | ||||||||||||||||
| Total from Investment Activities | (1.18 | ) | 7.05 | 0.11 | 6.24 | (3.48 | ) | ||||||||||||||||
Distributions to Shareholders From: | |||||||||||||||||||||||
Net investment income | (0.12 | ) | — | — | (0.21 | ) | (0.08 | ) | |||||||||||||||
Net realized gains | (1.98 | ) | (4.44 | ) | (0.37 | ) | (2.22 | ) | (4.99 | ) | |||||||||||||
Total Distributions | (2.10 | ) | (4.44 | ) | (0.37 | ) | (2.43 | ) | (5.07 | ) | |||||||||||||
Net Asset Value, End of Period | $ | 23.54 | $ | 26.82 | $ | 24.21 | $ | 24.47 | $ | 20.66 | |||||||||||||
Total Return (excludes sales charge) (b) | (4.54 | )% | 29.58 | % | 0.46 | % | 30.69 | % | (12.04 | )% | |||||||||||||
Ratios to Average Net Assets: | |||||||||||||||||||||||
Net Expenses (c) | 1.45 | % | 1.45 | % | 1.45 | % | 1.45 | % | 1.45 | % | |||||||||||||
Net Investment Income (Loss) | 0.33 | % | (0.29 | )% | 0.20 | % | 0.49 | % | 0.14 | % | |||||||||||||
Gross Expenses (c) | 1.49 | % | 1.49 | % | 1.53 | % | 1.52 | % | 1.52 | % | |||||||||||||
Supplemental Data: | |||||||||||||||||||||||
Net Assets at end of period (000's) | $ | 169,628 | $ | 195,053 | $ | 156,629 | $ | 193,630 | $ | 175,723 | |||||||||||||
Portfolio Turnover (d) | 98 | % | 64 | % | 108 | %(e) | 57 | % | 62 | % | |||||||||||||
(continues on next page)
See notes to financial statements.
44
Victory Portfolios | Financial Highlights — continued | ||||||
For a Share Outstanding Throughout Each Period
Victory RS Partners Fund | |||||||||||||||||||||||
Class R | |||||||||||||||||||||||
| Year Ended December 31, 2022 | Year Ended December 31, 2021 | Year Ended December 31, 2020 | Year Ended December 31, 2019 | Year Ended December 31, 2018 | |||||||||||||||||||
Net Asset Value, Beginning of Period | $ | 23.41 | $ | 21.65 | $ | 22.01 | $ | 18.79 | $ | 27.09 | |||||||||||||
Investment Activities: | |||||||||||||||||||||||
Net investment income (loss) (a) | (0.01 | ) | (0.17 | ) | (0.03 | ) | 0.03 | (0.04 | ) | ||||||||||||||
| Net realized and unrealized gains (losses) | (1.10 | ) | 6.37 | 0.04 | 5.55 | (3.27 | ) | ||||||||||||||||
| Total from Investment Activities | (1.11 | ) | 6.20 | 0.01 | 5.58 | (3.31 | ) | ||||||||||||||||
Distributions to Shareholders From: | |||||||||||||||||||||||
Net investment income | (0.07 | ) | — | — | (0.14 | ) | — | ||||||||||||||||
Net realized gains | (1.98 | ) | (4.44 | ) | (0.37 | ) | (2.22 | ) | (4.99 | ) | |||||||||||||
Total Distributions | (2.05 | ) | (4.44 | ) | (0.37 | ) | (2.36 | ) | (4.99 | ) | |||||||||||||
Net Asset Value, End of Period | $ | 20.25 | $ | 23.41 | $ | 21.65 | $ | 22.01 | $ | 18.79 | |||||||||||||
Total Return (b) | (4.86 | )% | 29.15 | % | 0.06 | % | 30.26 | % | (12.39 | )% | |||||||||||||
Ratios to Average Net Assets: | |||||||||||||||||||||||
Net Expenses (c) | 1.81 | % | 1.81 | % | 1.81 | % | 1.81 | % | 1.81 | % | |||||||||||||
Net Investment Income (Loss) | (0.03 | )% | (0.65 | )% | (0.15 | )% | 0.12 | % | (0.16 | )% | |||||||||||||
Gross Expenses (c) | 2.54 | % | 2.48 | % | 2.87 | % | 2.63 | % | 2.37 | % | |||||||||||||
Supplemental Data: | |||||||||||||||||||||||
Net Assets at end of period (000's) | $ | 1,519 | $ | 1,652 | $ | 1,421 | $ | 1,510 | $ | 1,207 | |||||||||||||
Portfolio Turnover (d) | 98 | % | 64 | % | 108 | %(e) | 57 | % | 62 | % | |||||||||||||
(continues on next page)
See notes to financial statements.
45
Victory Portfolios | Financial Highlights — continued | ||||||
For a Share Outstanding Throughout Each Period
Victory RS Partners Fund | |||||||||||||||||||||||
Class Y | |||||||||||||||||||||||
| Year Ended December 31, 2022 | Year Ended December 31, 2021 | Year Ended December 31, 2020 | Year Ended December 31, 2019 | Year Ended December 31, 2018 | |||||||||||||||||||
Net Asset Value, Beginning of Period | $ | 29.21 | $ | 25.99 | $ | 26.17 | $ | 21.94 | $ | 30.67 | |||||||||||||
Investment Activities: | |||||||||||||||||||||||
Net investment income (loss) (a) | 0.19 | 0.02 | 0.12 | 0.21 | 0.14 | ||||||||||||||||||
| Net realized and unrealized gains (losses) | (1.39 | ) | 7.69 | 0.07 | 6.52 | (3.71 | ) | ||||||||||||||||
| Total from Investment Activities | (1.20 | ) | 7.71 | 0.19 | 6.73 | (3.57 | ) | ||||||||||||||||
Distributions to Shareholders From: | |||||||||||||||||||||||
Net investment income | (0.20 | ) | (0.05 | ) | — | (0.28 | ) | (0.17 | ) | ||||||||||||||
Net realized gains | (1.98 | ) | (4.44 | ) | (0.37 | ) | (2.22 | ) | (4.99 | ) | |||||||||||||
Total Distributions | (2.18 | ) | (4.49 | ) | (0.37 | ) | (2.50 | ) | (5.16 | ) | |||||||||||||
Net Asset Value, End of Period | $ | 25.83 | $ | 29.21 | $ | 25.99 | $ | 26.17 | $ | 21.94 | |||||||||||||
Total Return (b) | (4.23 | )% | 30.03 | % | 0.77 | % | 31.18 | % | (11.77 | )% | |||||||||||||
Ratios to Average Net Assets: | |||||||||||||||||||||||
Net Expenses (c) | 1.12 | % | 1.12 | % | 1.12 | % | 1.12 | % | 1.12 | % | |||||||||||||
Net Investment Income (Loss) | 0.67 | % | 0.05 | % | 0.54 | % | 0.82 | % | 0.48 | % | |||||||||||||
Gross Expenses (c) | 1.21 | % | 1.19 | % | 1.23 | % | 1.21 | % | 1.19 | % | |||||||||||||
Supplemental Data: | |||||||||||||||||||||||
Net Assets at end of period (000's) | $ | 172,847 | $ | 177,278 | $ | 168,087 | $ | 232,432 | $ | 250,709 | |||||||||||||
Portfolio Turnover (d) | 98 | % | 64 | % | 108 | %(e) | 57 | % | 62 | % | |||||||||||||
(continues on next page)
See notes to financial statements.
46
Victory Portfolios | Financial Highlights — continued | ||||||
For a Share Outstanding Throughout Each Period
Victory RS Partners Fund | |||||||||||||||
Member Class | |||||||||||||||
| Year Ended December 31, 2022 | Year Ended December 31, 2021 | November 3, 2020(f) through December 31, 2020 | |||||||||||||
Net Asset Value, Beginning of Period | $ | 26.87 | $ | 24.22 | $ | 19.64 | |||||||||
Investment Activities: | |||||||||||||||
Net investment income (loss) (a) | 0.15 | (0.04 | ) | 0.01 | |||||||||||
Net realized and unrealized gains (losses) | (1.29 | ) | 7.17 | 4.94 | |||||||||||
Total from Investment Activities | (1.14 | ) | 7.13 | 4.95 | |||||||||||
Distributions to Shareholders From: | |||||||||||||||
Net investment income | (0.17 | ) | (0.04 | ) | — | ||||||||||
Net realized gains | (1.98 | ) | (4.44 | ) | (0.37 | ) | |||||||||
Total Distributions | (2.15 | ) | (4.48 | ) | (0.37 | ) | |||||||||
Net Asset Value, End of Period | $ | 23.58 | $ | 26.87 | $ | 24.22 | |||||||||
Total Return (b) (g) | (4.36 | )% | 29.90 | % | 25.22 | % | |||||||||
Ratios to Average Net Assets: | |||||||||||||||
Net Expenses (c) (h) | 1.25 | % | 1.25 | % | 1.25 | % | |||||||||
Net Investment Income (Loss) (h) | 0.59 | % | (0.14 | )% | 0.36 | % | |||||||||
Gross Expenses (c) (h) | 1.78 | % | 3.05 | % | 33.63 | % | |||||||||
Supplemental Data: | |||||||||||||||
Net Assets at end of period (000's) | $ | 4,719 | $ | 2,994 | $ | 102 | |||||||||
Portfolio Turnover (d) (g) | 98 | % | 64 | % | 108 | % | |||||||||
(a) Per share net investment income (loss) has been calculated using the average daily shares method.
(b) Assumes reinvestment of all net investment income and realized capital gain distributions, if any, during the period. Includes adjustments in accordance with U.S. Generally Accepted Accounting Principles and could differ from the reported total return.
(c) Does not include acquired fund fees and expenses, if any.
(d) Portfolio turnover is calculated on the basis of the Fund as a whole without distinguishing between the classes of shares.
(e) Reflects an increase in trading activity due to asset allocation shifts.
(f) Commencement of operations.
(g) Not annualized for periods less than one year.
(h) Annualized for periods less than one year.
See notes to financial statements.
47
Victory Portfolios | Financial Highlights | ||||||
For a Share Outstanding Throughout Each Period
Victory RS Value Fund | |||||||||||||||||||||||
Class A | |||||||||||||||||||||||
| Year Ended December 31, 2022 | Year Ended December 31, 2021 | Year Ended December 31, 2020 | Year Ended December 31, 2019 | Year Ended December 31, 2018 | |||||||||||||||||||
Net Asset Value, Beginning of Period | $ | 26.33 | $ | 23.68 | $ | 24.79 | $ | 20.28 | $ | 26.21 | |||||||||||||
Investment Activities: | |||||||||||||||||||||||
Net investment income (loss) (a) | 0.03 | 0.03 | 0.03 | 0.07 | 0.06 | ||||||||||||||||||
| Net realized and unrealized gains (losses) | (0.80 | ) | 6.34 | (0.68 | ) | 6.28 | (2.85 | ) | |||||||||||||||
| Total from Investment Activities | (0.77 | ) | 6.37 | (0.65 | ) | 6.35 | (2.79 | ) | |||||||||||||||
Distributions to Shareholders From: | |||||||||||||||||||||||
Net investment income | (0.12 | ) | (0.11 | ) | — | (0.14 | ) | (0.14 | ) | ||||||||||||||
Net realized gains | (1.40 | ) | (3.61 | ) | (0.46 | ) | (1.70 | ) | (3.00 | ) | |||||||||||||
Total Distributions | (1.52 | ) | (3.72 | ) | (0.46 | ) | (1.84 | ) | (3.14 | ) | |||||||||||||
Net Asset Value, End of Period | $ | 24.04 | $ | 26.33 | $ | 23.68 | $ | 24.79 | $ | 20.28 | |||||||||||||
Total Return (excludes sales charge) (b) | (2.97 | )% | 27.31 | % | (2.59 | )% | 31.35 | % | (10.75 | )% | |||||||||||||
Ratios to Average Net Assets: | |||||||||||||||||||||||
Net Expenses (c) | 1.30 | % | 1.30 | % | 1.30 | % | 1.30 | % | 1.30 | % | |||||||||||||
Net Investment Income (Loss) | 0.13 | % | 0.12 | % | 0.14 | % | 0.28 | % | 0.24 | % | |||||||||||||
Gross Expenses (c) | 1.32 | % | 1.34 | % | 1.37 | % | 1.35 | % | 1.34 | % | |||||||||||||
Supplemental Data: | |||||||||||||||||||||||
Net Assets at end of period (000's) | $ | 172,406 | $ | 188,881 | $ | 162,145 | $ | 207,200 | $ | 179,535 | |||||||||||||
Portfolio Turnover (d) | 71 | % | 69 | % | 73 | % | 54 | % | 65 | % | |||||||||||||
(continues on next page)
See notes to financial statements.
48
Victory Portfolios | Financial Highlights — continued | ||||||
For a Share Outstanding Throughout Each Period
Victory RS Value Fund | |||||||||||||||||||||||
Class C | |||||||||||||||||||||||
| Year Ended December 31, 2022 | Year Ended December 31, 2021 | Year Ended December 31, 2020 | Year Ended December 31, 2019 | Year Ended December 31, 2018 | |||||||||||||||||||
Net Asset Value, Beginning of Period | $ | 22.38 | $ | 20.65 | $ | 21.85 | $ | 18.08 | $ | 23.76 | |||||||||||||
Investment Activities: | |||||||||||||||||||||||
Net investment income (loss) (a) | (0.14 | ) | (0.16 | ) | (0.11 | ) | (0.11 | ) | (0.13 | ) | |||||||||||||
| Net realized and unrealized gains (losses) | (0.68 | ) | 5.50 | (0.63 | ) | 5.58 | (2.55 | ) | |||||||||||||||
| Total from Investment Activities | (0.82 | ) | 5.34 | (0.74 | ) | 5.47 | (2.68 | ) | |||||||||||||||
Distributions to Shareholders From: | |||||||||||||||||||||||
Net realized gains | (1.40 | ) | (3.61 | ) | (0.46 | ) | (1.70 | ) | (3.00 | ) | |||||||||||||
Total Distributions | (1.40 | ) | (3.61 | ) | (0.46 | ) | (1.70 | ) | (3.00 | ) | |||||||||||||
Net Asset Value, End of Period | $ | 20.16 | $ | 22.38 | $ | 20.65 | $ | 21.85 | $ | 18.08 | |||||||||||||
| Total Return (excludes contingent deferred sales charge) (b) | (3.71 | )% | 26.28 | % | (3.35 | )% | 30.32 | % | (11.41 | )% | |||||||||||||
Ratios to Average Net Assets: | |||||||||||||||||||||||
Net Expenses (c) | 2.07 | % | 2.07 | % | 2.07 | % | 2.07 | % | 2.07 | % | |||||||||||||
Net Investment Income (Loss) | (0.65 | )% | (0.67 | )% | (0.62 | )% | (0.50 | )% | (0.54 | )% | |||||||||||||
Gross Expenses (c) | 3.00 | % | 2.33 | % | 2.60 | % | 2.29 | % | 2.14 | % | |||||||||||||
Supplemental Data: | |||||||||||||||||||||||
Net Assets at end of period (000's) | $ | 1,282 | $ | 1,398 | $ | 2,618 | $ | 4,872 | $ | 9,428 | |||||||||||||
Portfolio Turnover (d) | 71 | % | 69 | % | 73 | % | 54 | % | 65 | % | |||||||||||||
(continues on next page)
See notes to financial statements.
49
Victory Portfolios | Financial Highlights — continued | ||||||
For a Share Outstanding Throughout Each Period
Victory RS Value Fund | |||||||||||||||||||||||
Class R | |||||||||||||||||||||||
| Year Ended December 31, 2022 | Year Ended December 31, 2021 | Year Ended December 31, 2020 | Year Ended December 31, 2019 | Year Ended December 31, 2018 | |||||||||||||||||||
Net Asset Value, Beginning of Period | $ | 24.54 | $ | 22.27 | $ | 23.44 | $ | 19.26 | $ | 25.06 | |||||||||||||
Investment Activities: | |||||||||||||||||||||||
Net investment income (loss) (a) | (0.06 | ) | (0.07 | ) | (0.05 | ) | (0.03 | ) | (0.03 | ) | |||||||||||||
| Net realized and unrealized gains (losses) | (0.75 | ) | 5.95 | (0.66 | ) | 5.95 | (2.72 | ) | |||||||||||||||
| Total from Investment Activities | (0.81 | ) | 5.88 | (0.71 | ) | 5.92 | (2.75 | ) | |||||||||||||||
Distributions to Shareholders From: | |||||||||||||||||||||||
Net investment income | (0.05 | ) | — | (e) | — | (0.04 | ) | (0.05 | ) | ||||||||||||||
Net realized gains | (1.40 | ) | (3.61 | ) | (0.46 | ) | (1.70 | ) | (3.00 | ) | |||||||||||||
Total Distributions | (1.45 | ) | (3.61 | ) | (0.46 | ) | (1.74 | ) | (3.05 | ) | |||||||||||||
Net Asset Value, End of Period | $ | 22.28 | $ | 24.54 | $ | 22.27 | $ | 23.44 | $ | 19.26 | |||||||||||||
Total Return (b) | (3.38 | )% | 26.77 | % | (2.95 | )% | 30.89 | % | (11.12 | )% | |||||||||||||
Ratios to Average Net Assets: | |||||||||||||||||||||||
Net Expenses (c) | 1.69 | % | 1.69 | % | 1.69 | % | 1.69 | % | 1.69 | % | |||||||||||||
Net Investment Income (Loss) | (0.26 | )% | (0.27 | )% | (0.23 | )% | (0.13 | )% | (0.11 | )% | |||||||||||||
Gross Expenses (c) | 3.07 | % | 1.80 | % | 4.03 | % | 3.47 | % | 2.82 | % | |||||||||||||
Supplemental Data: | |||||||||||||||||||||||
Net Assets at end of period (000's) | $ | 648 | $ | 638 | $ | 677 | $ | 1,022 | $ | 1,019 | |||||||||||||
Portfolio Turnover (d) | 71 | % | 69 | % | 73 | % | 54 | % | 65 | % | |||||||||||||
(continues on next page)
See notes to financial statements.
50
Victory Portfolios | Financial Highlights — continued | ||||||
For a Share Outstanding Throughout Each Period
Victory RS Value Fund | |||||||||||||||||||||||
Class Y | |||||||||||||||||||||||
| Year Ended December 31, 2022 | Year Ended December 31, 2021 | Year Ended December 31, 2020 | Year Ended December 31, 2019 | Year Ended December 31, 2018 | |||||||||||||||||||
Net Asset Value, Beginning of Period | $ | 27.23 | $ | 24.38 | $ | 25.45 | $ | 20.77 | $ | 26.77 | |||||||||||||
Investment Activities: | |||||||||||||||||||||||
Net investment income (loss) (a) | 0.09 | 0.10 | 0.08 | 0.13 | 0.13 | ||||||||||||||||||
| Net realized and unrealized gains (losses) | (0.82 | ) | 6.53 | (0.69 | ) | 6.44 | (2.92 | ) | |||||||||||||||
| Total from Investment Activities | (0.73 | ) | 6.63 | (0.61 | ) | 6.57 | (2.79 | ) | |||||||||||||||
Distributions to Shareholders From: | |||||||||||||||||||||||
Net investment income | (0.18 | ) | (0.17 | ) | — | (0.19 | ) | (0.21 | ) | ||||||||||||||
Net realized gains | (1.40 | ) | (3.61 | ) | (0.46 | ) | (1.70 | ) | (3.00 | ) | |||||||||||||
Total Distributions | (1.58 | ) | (3.78 | ) | (0.46 | ) | (1.89 | ) | (3.21 | ) | |||||||||||||
Net Asset Value, End of Period | $ | 24.92 | $ | 27.23 | $ | 24.38 | $ | 25.45 | $ | 20.77 | |||||||||||||
Total Return (b) | (2.71 | )% | 27.57 | % | (2.37 | )% | 31.69 | % | (10.54 | )% | |||||||||||||
Ratios to Average Net Assets: | |||||||||||||||||||||||
Net Expenses (c) | 1.06 | % | 1.06 | % | 1.06 | % | 1.06 | % | 1.06 | % | |||||||||||||
Net Investment Income (Loss) | 0.36 | % | 0.36 | % | 0.38 | % | 0.51 | % | 0.49 | % | |||||||||||||
Gross Expenses (c) | 1.06 | % | 1.06 | % | 1.10 | % | 1.07 | % | 1.06 | % | |||||||||||||
Supplemental Data: | |||||||||||||||||||||||
Net Assets at end of period (000's) | $ | 120,583 | $ | 143,783 | $ | 142,515 | $ | 176,749 | $ | 166,538 | |||||||||||||
Portfolio Turnover (d) | 71 | % | 69 | % | 73 | % | 54 | % | 65 | % | |||||||||||||
(a) Per share net investment income (loss) has been calculated using the average daily shares method.
(b) Assumes reinvestment of all net investment income and realized capital gain distributions, if any, during the period. Includes adjustments in accordance with U.S. Generally Accepted Accounting Principles and could differ from the reported total return.
(c) Does not include acquired fund fees and expenses, if any.
(d) Portfolio turnover is calculated on the basis of the Fund as a whole without distinguishing between the classes of shares.
(e) Amount is less than $0.005 per share.
See notes to financial statements.
51
Victory Portfolios | Financial Highlights | ||||||
For a Share Outstanding Throughout Each Period
Victory RS Large Cap Alpha Fund | |||||||||||||||||||||||
Class A | |||||||||||||||||||||||
| Year Ended December 31, 2022 | Year Ended December 31, 2021 | Year Ended December 31, 2020 | Year Ended December 31, 2019 | Year Ended December 31, 2018 | |||||||||||||||||||
Net Asset Value, Beginning of Period | $ | 55.16 | $ | 50.59 | $ | 53.11 | $ | 42.20 | $ | 56.61 | |||||||||||||
Investment Activities: | |||||||||||||||||||||||
Net investment income (loss) (a) | 0.40 | 0.65 | 0.52 | 0.51 | 0.44 | ||||||||||||||||||
| Net realized and unrealized gains (losses) | (2.88 | ) | 10.81 | (1.12 | ) | 12.44 | (5.67 | ) | |||||||||||||||
| Total from Investment Activities | (2.48 | ) | 11.46 | (0.60 | ) | 12.95 | (5.23 | ) | |||||||||||||||
Distributions to Shareholders From: | |||||||||||||||||||||||
Net investment income | (0.43 | ) | (0.57 | ) | (0.15 | ) | (0.37 | ) | (0.38 | ) | |||||||||||||
Net realized gains | (4.33 | ) | (6.32 | ) | (1.77 | ) | (1.67 | ) | (8.80 | ) | |||||||||||||
Total Distributions | (4.76 | ) | (6.89 | ) | (1.92 | ) | (2.04 | ) | (9.18 | ) | |||||||||||||
Net Asset Value, End of Period | $ | 47.92 | $ | 55.16 | $ | 50.59 | $ | 53.11 | $ | 42.20 | |||||||||||||
Total Return (excludes sales charge) (b) | (4.62 | )% | 23.00 | % | (1.03 | )% | 30.73 | % | (9.31 | )% | |||||||||||||
Ratios to Average Net Assets: | |||||||||||||||||||||||
Net Expenses (c) | 0.89 | % | 0.89 | % | 0.89 | % | 0.89 | % | 0.89 | % | |||||||||||||
Net Investment Income (Loss) | 0.76 | % | 1.13 | % | 1.13 | % | 1.03 | % | 0.77 | % | |||||||||||||
Gross Expenses (c) | 0.92 | % | 0.93 | % | 0.95 | % | 0.95 | % | 0.93 | % | |||||||||||||
Supplemental Data: | |||||||||||||||||||||||
Net Assets at end of period (000's) | $ | 437,855 | $ | 495,890 | $ | 444,160 | $ | 520,159 | $ | 439,035 | |||||||||||||
Portfolio Turnover (d) | 61 | % | 52 | % | 95 | % | 51 | % | 59 | % | |||||||||||||
(continues on next page)
See notes to financial statements.
52
Victory Portfolios | Financial Highlights — continued | ||||||
For a Share Outstanding Throughout Each Period
Victory RS Large Cap Alpha Fund | |||||||||||||||||||||||
Class C | |||||||||||||||||||||||
| Year Ended December 31, 2022 | Year Ended December 31, 2021 | Year Ended December 31, 2020 | Year Ended December 31, 2019 | Year Ended December 31, 2018 | |||||||||||||||||||
Net Asset Value, Beginning of Period | $ | 44.72 | $ | 42.07 | $ | 44.70 | $ | 35.78 | $ | 49.50 | |||||||||||||
Investment Activities: | |||||||||||||||||||||||
Net investment income (loss) (a) | (0.03 | ) | 0.13 | 0.14 | 0.10 | (0.03 | ) | ||||||||||||||||
| Net realized and unrealized gains (losses) | (2.32 | ) | 8.97 | (1.00 | ) | 10.50 | (4.89 | ) | |||||||||||||||
| Total from Investment Activities | (2.35 | ) | 9.10 | (0.86 | ) | 10.60 | (4.92 | ) | |||||||||||||||
Distributions to Shareholders From: | |||||||||||||||||||||||
Net investment income | (0.07 | ) | (0.13 | ) | — | (0.01 | ) | — | (e) | ||||||||||||||
Net realized gains | (4.33 | ) | (6.32 | ) | (1.77 | ) | (1.67 | ) | (8.80 | ) | |||||||||||||
Total Distributions | (4.40 | ) | (6.45 | ) | (1.77 | ) | (1.68 | ) | (8.80 | ) | |||||||||||||
Net Asset Value, End of Period | $ | 37.97 | $ | 44.72 | $ | 42.07 | $ | 44.70 | $ | 35.78 | |||||||||||||
| Total Return (excludes contingent deferred sales charge) (b) | (5.39 | )% | 22.05 | % | (1.85 | )% | 29.70 | % | (10.03 | )% | |||||||||||||
Ratios to Average Net Assets: | |||||||||||||||||||||||
Net Expenses (c) | 1.69 | % | 1.69 | % | 1.69 | % | 1.69 | % | 1.69 | % | |||||||||||||
Net Investment Income (Loss) | (0.07 | )% | 0.27 | % | 0.37 | % | 0.24 | % | (0.06 | )% | |||||||||||||
Gross Expenses (c) | 1.92 | % | 1.80 | % | 1.79 | % | 1.74 | % | 1.75 | % | |||||||||||||
Supplemental Data: | |||||||||||||||||||||||
Net Assets at end of period (000's) | $ | 3,595 | $ | 6,230 | $ | 11,326 | $ | 17,028 | $ | 18,227 | |||||||||||||
Portfolio Turnover (d) | 61 | % | 52 | % | 95 | % | 51 | % | 59 | % | |||||||||||||
(continues on next page)
See notes to financial statements.
53
Victory Portfolios | Financial Highlights — continued | ||||||
For a Share Outstanding Throughout Each Period
Victory RS Large Cap Alpha Fund | |||||||||||||||||||||||
Class R | |||||||||||||||||||||||
| Year Ended December 31, 2022 | Year Ended December 31, 2021 | Year Ended December 31, 2020 | Year Ended December 31, 2019 | Year Ended December 31, 2018 | |||||||||||||||||||
Net Asset Value, Beginning of Period | $ | 54.74 | $ | 50.28 | $ | 52.83 | $ | 42.01 | $ | 56.35 | |||||||||||||
Investment Activities: | |||||||||||||||||||||||
Net investment income (loss) (a) | 0.21 | 0.43 | 0.35 | 0.32 | 0.22 | ||||||||||||||||||
| Net realized and unrealized gains (losses) | (2.86 | ) | 10.73 | (1.13 | ) | 12.36 | (5.61 | ) | |||||||||||||||
| Total from Investment Activities | (2.65 | ) | 11.16 | (0.78 | ) | 12.68 | (5.39 | ) | |||||||||||||||
Distributions to Shareholders From: | |||||||||||||||||||||||
Net investment income | (0.25 | ) | (0.38 | ) | — | (0.19 | ) | (0.15 | ) | ||||||||||||||
Net realized gains | (4.33 | ) | (6.32 | ) | (1.77 | ) | (1.67 | ) | (8.80 | ) | |||||||||||||
Total Distributions | (4.58 | ) | (6.70 | ) | (1.77 | ) | (1.86 | ) | (8.95 | ) | |||||||||||||
Net Asset Value, End of Period | $ | 47.51 | $ | 54.74 | $ | 50.28 | $ | 52.83 | $ | 42.01 | |||||||||||||
Total Return (b) | (4.97 | )% | 22.55 | % | (1.41 | )% | 30.23 | % | (9.63 | )% | |||||||||||||
Ratios to Average Net Assets: | |||||||||||||||||||||||
Net Expenses (c) | 1.26 | % | 1.26 | % | 1.26 | % | 1.26 | % | 1.26 | % | |||||||||||||
Net Investment Income (Loss) | 0.39 | % | 0.75 | % | 0.77 | % | 0.66 | % | 0.38 | % | |||||||||||||
Gross Expenses (c) | 1.44 | % | 1.44 | % | 1.50 | % | 1.48 | % | 1.40 | % | |||||||||||||
Supplemental Data: | |||||||||||||||||||||||
Net Assets at end of period (000's) | $ | 5,765 | $ | 6,428 | $ | 6,066 | $ | 7,232 | $ | 6,348 | |||||||||||||
Portfolio Turnover (d) | 61 | % | 52 | % | 95 | % | 51 | % | 59 | % | |||||||||||||
(continues on next page)
See notes to financial statements.
54
Victory Portfolios | Financial Highlights — continued | ||||||
For a Share Outstanding Throughout Each Period
Victory RS Large Cap Alpha Fund | |||||||||||||||||||||||
Class Y | |||||||||||||||||||||||
| Year Ended December 31, 2022 | Year Ended December 31, 2021 | Year Ended December 31, 2020 | Year Ended December 31, 2019 | Year Ended December 31, 2018 | |||||||||||||||||||
Net Asset Value, Beginning of Period | $ | 54.90 | $ | 50.37 | $ | 52.87 | $ | 42.01 | $ | 56.38 | |||||||||||||
Investment Activities: | |||||||||||||||||||||||
Net investment income (loss) (a) | 0.52 | 0.78 | 0.62 | 0.61 | 0.55 | ||||||||||||||||||
| Net realized and unrealized gains (losses) | (2.89 | ) | 10.76 | (1.10 | ) | 12.38 | (5.64 | ) | |||||||||||||||
| Total from Investment Activities | (2.37 | ) | 11.54 | (0.48 | ) | 12.99 | (5.09 | ) | |||||||||||||||
Distributions to Shareholders From: | |||||||||||||||||||||||
Net investment income | (0.53 | ) | (0.69 | ) | (0.25 | ) | (0.46 | ) | (0.48 | ) | |||||||||||||
Net realized gains | (4.33 | ) | (6.32 | ) | (1.77 | ) | (1.67 | ) | (8.80 | ) | |||||||||||||
Total Distributions | (4.86 | ) | (7.01 | ) | (2.02 | ) | (2.13 | ) | (9.28 | ) | |||||||||||||
Net Asset Value, End of Period | $ | 47.67 | $ | 54.90 | $ | 50.37 | $ | 52.87 | $ | 42.01 | |||||||||||||
Total Return (b) | (4.43 | )% | 23.28 | % | (0.83 | )% | 30.99 | % | (9.11 | )% | |||||||||||||
Ratios to Average Net Assets: | |||||||||||||||||||||||
Net Expenses (c) | 0.68 | % | 0.68 | % | 0.68 | % | 0.68 | % | 0.68 | % | |||||||||||||
Net Investment Income (Loss) | 0.98 | % | 1.35 | % | 1.34 | % | 1.24 | % | 0.96 | % | |||||||||||||
Gross Expenses (c) | 0.71 | % | 0.68 | % | 0.82 | % | 0.78 | % | 0.75 | % | |||||||||||||
Supplemental Data: | |||||||||||||||||||||||
Net Assets at end of period (000's) | $ | 21,070 | $ | 20,169 | $ | 16,011 | $ | 20,021 | $ | 21,827 | |||||||||||||
Portfolio Turnover (d) | 61 | % | 52 | % | 95 | % | 51 | % | 59 | % | |||||||||||||
(a) Per share net investment income (loss) has been calculated using the average daily shares method.
(b) Assumes reinvestment of all net investment income and realized capital gain distributions, if any, during the period. Includes adjustments in accordance with U.S. Generally Accepted Accounting Principles and could differ from the reported total return.
(c) Does not include acquired fund fees and expenses, if any.
(d) Portfolio turnover is calculated on the basis of the Fund as a whole without distinguishing between the classes of shares.
(e) Amount is less than $0.005 per share.
See notes to financial statements.
55
Victory Portfolios | Financial Highlights | ||||||
For a Share Outstanding Throughout Each Period
Victory RS Investors Fund | |||||||||||||||||||||||
Class A | |||||||||||||||||||||||
| Year Ended December 31, 2022 | Year Ended December 31, 2021 | Year Ended December 31, 2020 | Year Ended December 31, 2019 | Year Ended December 31, 2018 | |||||||||||||||||||
Net Asset Value, Beginning of Period | $ | 13.90 | $ | 12.84 | $ | 13.10 | $ | 10.68 | $ | 13.86 | |||||||||||||
Investment Activities: | |||||||||||||||||||||||
Net investment income (loss) (a) | (0.01 | ) | 0.02 | (0.01 | ) | — | (b) | — | (b) | ||||||||||||||
| Net realized and unrealized gains (losses) | (0.26 | ) | 3.25 | (0.21 | ) | 2.99 | (1.27 | ) | |||||||||||||||
| Total from Investment Activities | (0.27 | ) | 3.27 | (0.22 | ) | 2.99 | (1.27 | ) | |||||||||||||||
Distributions to Shareholders From: | |||||||||||||||||||||||
Net investment income | (0.01 | ) | — | (b) | — | — | — | ||||||||||||||||
Net realized gains | (0.52 | ) | (2.21 | ) | (0.04 | ) | (0.57 | ) | (1.91 | ) | |||||||||||||
Total Distributions | (0.53 | ) | (2.21 | ) | (0.04 | ) | (0.57 | ) | (1.91 | ) | |||||||||||||
Net Asset Value, End of Period | $ | 13.10 | $ | 13.90 | $ | 12.84 | $ | 13.10 | $ | 10.68 | |||||||||||||
Total Return (excludes sales charge) (c) | (2.01 | )% | 25.74 | % | (1.68 | )% | 28.01 | % | (9.36 | )% | |||||||||||||
Ratios to Average Net Assets: | |||||||||||||||||||||||
Net Expenses (d) | 1.33 | % | 1.33 | % | 1.33 | % | 1.33 | % | 1.33 | % | |||||||||||||
Net Investment Income (Loss) | (0.05 | )% | 0.13 | % | (0.08 | )% | 0.03 | % | (0.03 | )% | |||||||||||||
Gross Expenses (d) | 1.64 | % | 1.66 | % | 1.71 | % | 1.62 | % | 1.58 | % | |||||||||||||
Supplemental Data: | |||||||||||||||||||||||
Net Assets at end of period (000's) | $ | 15,250 | $ | 15,039 | $ | 12,663 | $ | 16,906 | $ | 15,682 | |||||||||||||
Portfolio Turnover (e) | 69 | % | 68 | % | 66 | % | 64 | % | 56 | % | |||||||||||||
(continues on next page)
See notes to financial statements.
56
Victory Portfolios | Financial Highlights — continued | ||||||
For a Share Outstanding Throughout Each Period
Victory RS Investors Fund | |||||||||||||||||||||||
Class C | |||||||||||||||||||||||
| Year Ended December 31, 2022 | Year Ended December 31, 2021 | Year Ended December 31, 2020 | Year Ended December 31, 2019 | Year Ended December 31, 2018 | |||||||||||||||||||
Net Asset Value, Beginning of Period | $ | 11.76 | $ | 11.22 | $ | 11.54 | $ | 9.53 | $ | 12.68 | |||||||||||||
Investment Activities: | |||||||||||||||||||||||
Net investment income (loss) (a) | (0.10 | ) | (0.08 | ) | (0.08 | ) | (0.08 | ) | (0.10 | ) | |||||||||||||
| Net realized and unrealized gains (losses) | (0.21 | ) | 2.83 | (0.20 | ) | 2.66 | (1.14 | ) | |||||||||||||||
| Total from Investment Activities | (0.31 | ) | 2.75 | (0.28 | ) | 2.58 | (1.24 | ) | |||||||||||||||
Distributions to Shareholders From: | |||||||||||||||||||||||
Net realized gains | (0.52 | ) | (2.21 | ) | (0.04 | ) | (0.57 | ) | (1.91 | ) | |||||||||||||
Total Distributions | (0.52 | ) | (2.21 | ) | (0.04 | ) | (0.57 | ) | (1.91 | ) | |||||||||||||
Net Asset Value, End of Period | $ | 10.93 | $ | 11.76 | $ | 11.22 | $ | 11.54 | $ | 9.53 | |||||||||||||
| Total Return (excludes contingent deferred sales charge) (c) | (2.69 | )% | 24.78 | % | (2.43 | )% | 27.08 | % | (10.08 | )% | |||||||||||||
Ratios to Average Net Assets: | |||||||||||||||||||||||
Net Expenses (d) | 2.07 | % | 2.07 | % | 2.07 | % | 2.07 | % | 2.07 | % | |||||||||||||
Net Investment Income (Loss) | (0.90 | )% | (0.64 | )% | (0.85 | )% | (0.73 | )% | (0.82 | )% | |||||||||||||
Gross Expenses (d) | 2.95 | % | 2.42 | % | 2.75 | % | 2.54 | % | 2.44 | % | |||||||||||||
Supplemental Data: | |||||||||||||||||||||||
Net Assets at end of period (000's) | $ | 909 | $ | 2,702 | $ | 3,306 | $ | 6,898 | $ | 7,282 | |||||||||||||
Portfolio Turnover (e) | 69 | % | 68 | % | 66 | % | 64 | % | 56 | % | |||||||||||||
(continues on next page)
See notes to financial statements.
57
Victory Portfolios | Financial Highlights — continued | ||||||
For a Share Outstanding Throughout Each Period
Victory RS Investors Fund | |||||||||||||||||||||||
Class R | |||||||||||||||||||||||
| Year Ended December 31, 2022 | Year Ended December 31, 2021 | Year Ended December 31, 2020 | Year Ended December 31, 2019 | Year Ended December 31, 2018 | |||||||||||||||||||
Net Asset Value, Beginning of Period | $ | 12.02 | $ | 11.41 | $ | 11.72 | $ | 9.66 | $ | 12.81 | |||||||||||||
Investment Activities: | |||||||||||||||||||||||
Net investment income (loss) (a) | (0.08 | ) | (0.06 | ) | (0.07 | ) | (0.07 | ) | (0.08 | ) | |||||||||||||
| Net realized and unrealized gains (losses) | (0.23 | ) | 2.88 | (0.20 | ) | 2.70 | (1.16 | ) | |||||||||||||||
| Total from Investment Activities | (0.31 | ) | 2.82 | (0.27 | ) | 2.63 | (1.24 | ) | |||||||||||||||
Distributions to Shareholders From: | |||||||||||||||||||||||
Net realized gains | (0.52 | ) | (2.21 | ) | (0.04 | ) | (0.57 | ) | (1.91 | ) | |||||||||||||
Total Distributions | (0.52 | ) | (2.21 | ) | (0.04 | ) | (0.57 | ) | (1.91 | ) | |||||||||||||
Net Asset Value, End of Period | $ | 11.19 | $ | 12.02 | $ | 11.41 | $ | 11.72 | $ | 9.66 | |||||||||||||
Total Return (c) | (2.63 | )% | 25.00 | % | (2.30 | )% | 27.24 | % | (9.91 | )% | |||||||||||||
Ratios to Average Net Assets: | |||||||||||||||||||||||
Net Expenses (d) | 1.95 | % | 1.95 | % | 1.95 | % | 1.95 | % | 1.95 | % | |||||||||||||
Net Investment Income (Loss) | (0.67 | )% | (0.49 | )% | (0.71 | )% | (0.59 | )% | (0.64 | )% | |||||||||||||
Gross Expenses (d) | 2.98 | % | 1.96 | % | 4.41 | % | 3.85 | % | 3.15 | % | |||||||||||||
Supplemental Data: | |||||||||||||||||||||||
Net Assets at end of period (000's) | $ | 842 | $ | 806 | $ | 655 | $ | 844 | $ | 831 | |||||||||||||
Portfolio Turnover (e) | 69 | % | 68 | % | 66 | % | 64 | % | 56 | % | |||||||||||||
(continues on next page)
See notes to financial statements.
58
Victory Portfolios | Financial Highlights — continued | ||||||
For a Share Outstanding Throughout Each Period
Victory RS Investors Fund | |||||||||||||||||||||||
Class Y | |||||||||||||||||||||||
| Year Ended December 31, 2022 | Year Ended December 31, 2021 | Year Ended December 31, 2020 | Year Ended December 31, 2019 | Year Ended December 31, 2018 | |||||||||||||||||||
Net Asset Value, Beginning of Period | $ | 14.41 | $ | 13.24 | $ | 13.47 | $ | 10.94 | $ | 14.10 | |||||||||||||
Investment Activities: | |||||||||||||||||||||||
Net investment income (loss) (a) | 0.04 | 0.06 | 0.02 | 0.03 | 0.03 | ||||||||||||||||||
| Net realized and unrealized gains (losses) | (0.28 | ) | 3.36 | (0.21 | ) | 3.07 | (1.28 | ) | |||||||||||||||
| Total from Investment Activities | (0.24 | ) | 3.42 | (0.19 | ) | 3.10 | (1.25 | ) | |||||||||||||||
Distributions to Shareholders From: | |||||||||||||||||||||||
Net investment income | (0.04 | ) | (0.04 | ) | — | — | — | ||||||||||||||||
Net realized gains | (0.52 | ) | (2.21 | ) | (0.04 | ) | (0.57 | ) | (1.91 | ) | |||||||||||||
Total Distributions | (0.56 | ) | (2.25 | ) | (0.04 | ) | (0.57 | ) | (1.91 | ) | |||||||||||||
Net Asset Value, End of Period | $ | 13.61 | $ | 14.41 | $ | 13.24 | $ | 13.47 | $ | 10.94 | |||||||||||||
Total Return (c) | (1.73 | )% | 26.07 | % | (1.41 | )% | 28.35 | % | (9.06 | )% | |||||||||||||
Ratios to Average Net Assets: | |||||||||||||||||||||||
Net Expenses (d) | 1.05 | % | 1.05 | % | 1.05 | % | 1.05 | % | 1.05 | % | |||||||||||||
Net Investment Income (Loss) | 0.30 | % | 0.40 | % | 0.17 | % | 0.27 | % | 0.18 | % | |||||||||||||
Gross Expenses (d) | 1.36 | % | 1.32 | % | 1.50 | % | 1.43 | % | 1.37 | % | |||||||||||||
Supplemental Data: | |||||||||||||||||||||||
Net Assets at end of period (000's) | $ | 28,143 | $ | 12,577 | $ | 11,253 | $ | 19,146 | $ | 14,669 | |||||||||||||
Portfolio Turnover (e) | 69 | % | 68 | % | 66 | % | 64 | % | 56 | % | |||||||||||||
(a) Per share net investment income (loss) has been calculated using the average daily shares method.
(b) Amount is less than $0.005 per share.
(c) Assumes reinvestment of all net investment income and realized capital gain distributions, if any, during the period. Includes adjustments in accordance with U.S. Generally Accepted Accounting Principles and could differ from the reported total return.
(d) Does not include acquired fund fees and expenses, if any.
(e) Portfolio turnover is calculated on the basis of the Fund as a whole without distinguishing between the classes of shares.
See notes to financial statements.
59
Victory Portfolios | Financial Highlights | ||||||
For a Share Outstanding Throughout Each Period
Victory Global Energy Transition Fund | |||||||||||||||||||||||
Class A | |||||||||||||||||||||||
| Year Ended December 31, 2022 | Year Ended December 31, 2021 | Year Ended December 31, 2020 | Year Ended December 31, 2019 | Year Ended December 31, 2018 | |||||||||||||||||||
Net Asset Value, Beginning of Period | $ | 22.62 | $ | 12.36 | $ | 9.71 | $ | 12.86 | $ | 23.73 | |||||||||||||
Investment Activities: | |||||||||||||||||||||||
Net investment income (loss) (a) | 0.25 | (0.04 | ) | (0.01 | ) | — | (b) | (0.14 | ) | ||||||||||||||
| Net realized and unrealized gains (losses) | 7.67 | 10.30 | 2.67 | (3.15 | ) | (10.73 | ) | ||||||||||||||||
| Total from Investment Activities | 7.92 | 10.26 | 2.66 | (3.15 | ) | (10.87 | ) | ||||||||||||||||
Distributions to Shareholders From: | |||||||||||||||||||||||
Net investment income | (0.24 | ) | — | (0.01 | ) | — | — | ||||||||||||||||
Total Distributions | (0.24 | ) | — | (0.01 | ) | — | — | ||||||||||||||||
Net Asset Value, End of Period | $ | 30.30 | $ | 22.62 | $ | 12.36 | $ | 9.71 | $ | 12.86 | |||||||||||||
Total Return (excludes sales charge) (c) | 35.01 | % | 83.01 | % | 27.35 | % | (24.49 | )% | (45.81 | )% | |||||||||||||
Ratios to Average Net Assets: | |||||||||||||||||||||||
Net Expenses (d) | 1.48 | % | 1.48 | % | 1.48 | % | 1.48 | % | 1.48 | % | |||||||||||||
Net Investment Income (Loss) | 0.88 | % | (0.21 | )% | (0.15 | )% | — | %(e) | (0.65 | )% | |||||||||||||
Gross Expenses (d) | 1.53 | % | 1.58 | % | 1.79 | % | 1.69 | % | 1.54 | % | |||||||||||||
Supplemental Data: | |||||||||||||||||||||||
Net Assets at end of period (000's) | $ | 91,521 | $ | 78,317 | $ | 36,803 | $ | 32,630 | $ | 64,001 | |||||||||||||
Portfolio Turnover (f) | 64 | % | 79 | % | 46 | % | 24 | % | 26 | % | |||||||||||||
(continues on next page)
See notes to financial statements.
60
Victory Portfolios | Financial Highlights — continued | ||||||
For a Share Outstanding Throughout Each Period
Victory Global Energy Transition Fund | |||||||||||||||||||||||
Class C | |||||||||||||||||||||||
| Year Ended December 31, 2022 | Year Ended December 31, 2021 | Year Ended December 31, 2020 | Year Ended December 31, 2019 | Year Ended December 31, 2018 | |||||||||||||||||||
Net Asset Value, Beginning of Period | $ | 19.98 | $ | 11.00 | $ | 8.71 | $ | 11.63 | $ | 21.63 | |||||||||||||
Investment Activities: | |||||||||||||||||||||||
Net investment income (loss) (a) | 0.01 | (0.17 | ) | (0.07 | ) | (0.08 | ) | (0.28 | ) | ||||||||||||||
| Net realized and unrealized gains (losses) | 6.77 | 9.15 | 2.36 | (2.84 | ) | (9.72 | ) | ||||||||||||||||
| Total from Investment Activities | 6.78 | 8.98 | 2.29 | (2.92 | ) | (10.00 | ) | ||||||||||||||||
Distributions to Shareholders From: | |||||||||||||||||||||||
Net investment income | — | (b) | — | — | — | — | |||||||||||||||||
Total Distributions | — | (b) | — | — | — | — | |||||||||||||||||
Net Asset Value, End of Period | $ | 26.76 | $ | 19.98 | $ | 11.00 | $ | 8.71 | $ | 11.63 | |||||||||||||
| Total Return (excludes contingent deferred sales charge) (c) | 33.94 | % | 81.64 | % | 26.29 | % | (25.11 | )% | (46.26 | )% | |||||||||||||
Ratios to Average Net Assets: | |||||||||||||||||||||||
Net Expenses (d) | 2.28 | % | 2.28 | % | 2.28 | % | 2.28 | % | 2.28 | % | |||||||||||||
Net Investment Income (Loss) | 0.03 | % | (1.02 | )% | (0.92 | )% | (0.81 | )% | (1.42 | )% | |||||||||||||
Gross Expenses (d) | 2.64 | % | 2.41 | % | 3.32 | % | 2.75 | % | 2.38 | % | |||||||||||||
Supplemental Data: | |||||||||||||||||||||||
Net Assets at end of period (000's) | $ | 2,396 | $ | 3,240 | $ | 2,385 | $ | 2,949 | $ | 6,939 | |||||||||||||
Portfolio Turnover (f) | 64 | % | 79 | % | 46 | % | 24 | % | 26 | % | |||||||||||||
(continues on next page)
See notes to financial statements.
61
Victory Portfolios | Financial Highlights — continued | ||||||
For a Share Outstanding Throughout Each Period
Victory Global Energy Transition Fund | |||||||||||||||||||||||
Class R | |||||||||||||||||||||||
| Year Ended December 31, 2022 | Year Ended December 31, 2021 | Year Ended December 31, 2020 | Year Ended December 31, 2019 | Year Ended December 31, 2018 | |||||||||||||||||||
Net Asset Value, Beginning of Period | $ | 21.19 | $ | 11.62 | $ | 9.16 | $ | 12.18 | $ | 22.56 | |||||||||||||
Investment Activities: | |||||||||||||||||||||||
Net investment income (loss) (a) | 0.16 | (0.12 | ) | (0.04 | ) | (0.04 | ) | (0.20 | ) | ||||||||||||||
| Net realized and unrealized gains (losses) | 7.15 | 9.69 | 2.50 | (2.98 | ) | (10.18 | ) | ||||||||||||||||
| Total from Investment Activities | 7.31 | 9.57 | 2.46 | (3.02 | ) | (10.38 | ) | ||||||||||||||||
Distributions to Shareholders From: | |||||||||||||||||||||||
Net investment income | (0.17 | ) | — | — | — | — | |||||||||||||||||
Total Distributions | (0.17 | ) | — | — | — | — | |||||||||||||||||
Net Asset Value, End of Period | $ | 28.33 | $ | 21.19 | $ | 11.62 | $ | 9.16 | $ | 12.18 | |||||||||||||
Total Return (c) | 34.50 | % | 82.36 | % | 26.86 | % | (24.79 | )% | (46.01 | )% | |||||||||||||
Ratios to Average Net Assets: | |||||||||||||||||||||||
Net Expenses (d) | 1.86 | % | 1.86 | % | 1.86 | % | 1.86 | % | 1.86 | % | |||||||||||||
Net Investment Income (Loss) | 0.57 | % | (0.70 | )% | (0.51 | )% | (0.37 | )% | (0.99 | )% | |||||||||||||
Gross Expenses (d) | 2.32 | % | 1.89 | % | 5.74 | % | 4.31 | % | 2.50 | % | |||||||||||||
Supplemental Data: | |||||||||||||||||||||||
Net Assets at end of period (000's) | $ | 1,864 | $ | 1,026 | $ | 680 | $ | 621 | $ | 920 | |||||||||||||
Portfolio Turnover (f) | 64 | % | 79 | % | 46 | % | 24 | % | 26 | % | |||||||||||||
(continues on next page)
See notes to financial statements.
62
Victory Portfolios | Financial Highlights — continued | ||||||
For a Share Outstanding Throughout Each Period
Victory Global Energy Transition Fund | |||||||||||||||||||||||
Class Y | |||||||||||||||||||||||
| Year Ended December 31, 2022 | Year Ended December 31, 2021 | Year Ended December 31, 2020 | Year Ended December 31, 2019 | Year Ended December 31, 2018 | |||||||||||||||||||
Net Asset Value, Beginning of Period | $ | 23.64 | $ | 12.88 | $ | 10.11 | $ | 13.38 | $ | 24.60 | |||||||||||||
Investment Activities: | |||||||||||||||||||||||
Net investment income (loss) (a) | 0.38 | 0.02 | 0.02 | 0.03 | (0.06 | ) | |||||||||||||||||
| Net realized and unrealized gains (losses) | 8.00 | 10.75 | 2.78 | (3.27 | ) | (11.16 | ) | ||||||||||||||||
| Total from Investment Activities | 8.38 | 10.77 | 2.80 | (3.24 | ) | (11.22 | ) | ||||||||||||||||
Distributions to Shareholders From: | |||||||||||||||||||||||
Net investment income | (0.34 | ) | (0.01 | ) | (0.03 | ) | (0.03 | ) | — | ||||||||||||||
Total Distributions | (0.34 | ) | (0.01 | ) | (0.03 | ) | (0.03 | ) | — | ||||||||||||||
Net Asset Value, End of Period | $ | 31.68 | $ | 23.64 | $ | 12.88 | $ | 10.11 | $ | 13.38 | |||||||||||||
Total Return (c) | 35.46 | % | 83.62 | % | 27.73 | % | (24.25 | )% | (45.63 | )% | |||||||||||||
Ratios to Average Net Assets: | |||||||||||||||||||||||
Net Expenses (d) | 1.15 | % | 1.15 | % | 1.15 | % | 1.15 | % | 1.15 | % | |||||||||||||
Net Investment Income (Loss) | 1.24 | % | 0.10 | % | 0.18 | % | 0.27 | % | (0.29 | )% | |||||||||||||
Gross Expenses (d) | 1.19 | % | 1.21 | % | 1.28 | % | 1.26 | % | 1.20 | % | |||||||||||||
Supplemental Data: | |||||||||||||||||||||||
Net Assets at end of period (000's) | $ | 314,108 | $ | 210,586 | $ | 119,237 | $ | 114,972 | $ | 393,581 | |||||||||||||
Portfolio Turnover (f) | 64 | % | 79 | % | 46 | % | 24 | % | 26 | % | |||||||||||||
(a) Per share net investment income (loss) has been calculated using the average daily shares method.
(b) Amount is less than $0.005 per share.
(c) Assumes reinvestment of all net investment income and realized capital gain distributions, if any, during the period. Includes adjustments in accordance with U.S. Generally Accepted Accounting Principles and could differ from the reported total return.
(d) Does not include acquired fund fees and expenses, if any.
(e) Amount is less than 0.005%.
(f) Portfolio turnover is calculated on the basis of the Fund as a whole without distinguishing between the classes of shares.
See notes to financial statements.
63
Victory Portfolios | Notes to Financial Statements December 31, 2022 | ||||||
1. Organization:
Victory Portfolios (the "Trust") is organized as a Delaware statutory trust and the Trust is registered under the Investment Company Act of 1940, as amended (the "1940 Act"), as an open-end investment company. The Trust is comprised of 37 funds and is authorized to issue an unlimited number of shares, which are units of beneficial interest with a par value of $0.001 per share.
The accompanying financial statements are those of the following five Funds (collectively, the "Funds" and individually, a "Fund"). Each Fund, with the exception of Victory RS Investors Fund and Victory Global Energy Transition Fund, is classified as diversified under the 1940 Act.
Funds (Legal Name) | Funds (Short Name) | Investment Share Classes Offered | |||||||||
Victory RS Partners Fund | RS Partners Fund | A, C, R, Y, and Member Class | |||||||||
Victory RS Value Fund | RS Value Fund | A, C, R, and Y | |||||||||
Victory RS Large Cap Alpha Fund | RS Large Cap Alpha Fund | A, C, R, and Y | |||||||||
Victory RS Investors Fund | RS Investors Fund | A, C, R, and Y | |||||||||
Victory Global Energy Transition Fund | Global Energy Transition Fund | A, C, R, and Y | |||||||||
Each class of shares of a Fund has substantially identical rights and privileges except with respect to sales charges, fees paid under distribution plans, expenses allocable exclusively to each class of shares, voting rights on matters solely affecting a single class of shares, and the exchange privilege of each class of shares.
Victory Capital Management Inc. ("VCM" or the "Adviser") is an indirect wholly owned subsidiary of Victory Capital Holdings, Inc., a publicly traded Delaware corporation, and a wholly owned direct subsidiary of Victory Capital Operating, LLC.
Under the Trust's organizational documents, its officers and trustees are indemnified against certain liabilities arising out of the performance of their duties to the Funds. In addition, in the normal course of business, the Funds enter into contracts with their vendors and others that provide for general indemnifications. The Funds' maximum exposure under these arrangements is unknown, as this would involve future claims that may be made against the Funds. However, based on experience, the Funds expect that risk of loss to be remote.
2. Significant Accounting Policies:
The following is a summary of significant accounting policies followed by the Trust in the preparation of its financial statements. The policies are in conformity with U.S. Generally Accepted Accounting Principles ("GAAP"). The preparation of financial statements in accordance with GAAP requires management to make estimates and assumptions that affect the reported amounts of assets and liabilities and disclosure of contingent assets and liabilities at the date of the financial statements and the reported amounts of income and expenses for the period. Actual results could differ from those estimates. The Funds follow the specialized accounting and reporting requirements under GAAP that are applicable to investment companies under Accounting Standards Codification Topic 946.
Investment Valuation:
The Funds record investments at fair value. Fair value is defined as the price that would be received to sell an asset or paid to transfer a liability in an orderly transaction between market participants at the measurement date.
The valuation techniques described below maximize the use of observable inputs and minimize the use of unobservable inputs in determining fair value. The inputs used for valuing the Funds' investments are summarized in the three broad levels listed below:
• Level 1 — quoted prices (unadjusted) in active markets for identical securities
• Level 2 — other significant observable inputs (including quoted prices for similar securities, interest rates, or credit spreads, applicable to those securities, etc.)
• Level 3 — significant unobservable inputs (including the Adviser's assumptions in determining the fair value of investments)
64
Victory Portfolios | Notes to Financial Statements — continued December 31, 2022 | ||||||
Changes in valuation techniques may result in transfers in or out of an assigned level within the disclosure hierarchy. The inputs or methodologies used for valuation techniques are not necessarily an indication of the risk associated with entering into those investments.
The Adviser, appointed as the valuation designee by the Trust's Board of Trustees' (the "Board"), has established the Pricing and Liquidity Committee (the "Committee"), and subject to Board oversight, the Committee administers and oversees the Funds' valuation policies and procedures, which are approved by the Board.
Portfolio securities listed or traded on securities exchanges, including Exchange-Traded Funds ("ETFs"), and American Depositary Receipts ("ADRs"), are valued at the closing price on the exchange or system where the security is principally traded, if available, or at the Nasdaq Official Closing Price. If there have been no sales for that day on the exchange or system, then a security is valued at the last available bid quotation on the exchange or system where the security is principally traded. In each of these situations, valuations are typically categorized as Level 1 in the fair value hierarchy.
Investments in open-end investment companies, other than ETFs, are valued at their net asset value ("NAV"). These valuations are typically categorized as Level 1 in the fair value hierarchy.
In the event that price quotations or valuations are not readily available, investments are valued at fair value in accordance with procedures established by and under the general supervision and responsibility of the Board. These valuations are typically categorized as Level 2 or Level 3 in the fair value hierarchy, based on the observability of inputs used to determine the fair value. The effect of fair value pricing is that securities may not be priced on the basis of quotations from the primary market in which they are traded and the actual price realized from the sale of a security may differ materially from the fair value price. Valuing these securities at fair value is intended to cause the Fund's NAV to be more reliable than it otherwise would be.
A summary of the valuations as of December 31, 2022, based upon the three levels defined above, is included in the table below while the breakdown, by category, of investments is disclosed on the Schedules of Portfolio Investments:
Level 1 | Level 2 | Level 3 | Total | ||||||||||||||||
RS Partners Fund | |||||||||||||||||||
Common Stocks | $ | 334,925,334 | $ | — | $ | — | $ | 334,925,334 | |||||||||||
Preferred Stocks | — | — | 587,369 | 587,369 | |||||||||||||||
Total | $ | 334,925,334 | $ | — | $ | 587,369 | $ | 335,512,703 | |||||||||||
RS Value Fund | |||||||||||||||||||
Common Stocks | $ | 289,665,017 | $ | — | $ | — | $ | 289,665,017 | |||||||||||
Total | $ | 289,665,017 | $ | — | $ | — | $ | 289,665,017 | |||||||||||
RS Large Cap Alpha Fund | |||||||||||||||||||
Common Stocks | $ | 455,154,015 | $ | — | $ | — | $ | 455,154,015 | |||||||||||
Total | $ | 455,154,015 | $ | — | $ | — | $ | 455,154,015 | |||||||||||
RS Investors Fund | |||||||||||||||||||
Common Stocks | $ | 42,977,329 | $ | — | $ | — | $ | 42,977,329 | |||||||||||
Total | $ | 42,977,329 | $ | — | $ | — | $ | 42,977,329 | |||||||||||
Global Energy Transition Fund | |||||||||||||||||||
Common Stocks | $ | 325,091,226 | $ | — | $ | — | $ | 325,091,226 | |||||||||||
Collateral for Securities Loaned | 9,992,257 | — | — | 9,992,257 | |||||||||||||||
Total | $ | 335,083,483 | $ | — | $ | — | $ | 335,083,483 | |||||||||||
65
Victory Portfolios | Notes to Financial Statements — continued December 31, 2022 | ||||||
As of December 31, 2022, there were no significant transfers into/out of Level 3, except for Global Energy Transition Fund, which had transfers out of Level 3 of 2.01% of net assets, which were a result of this Fund entering into several private placements for equity and convertible securities that began trading and subsequently converted into common stock upon effective registration.
The following is a reconciliation of assets in which significant unobservable inputs (Level 3) were used in determining fair value:
Global Energy Transition Fund | |||||||
Balance as of December 31, 2021 | $ | 8,231,397 | |||||
Accrued Discount (Premium) | — | ||||||
Realized Gain (Loss) | — | ||||||
| Change in Unrealized Appreciation/Depreciation | 1,727,943 | ||||||
| Purchases | — | ||||||
| Sales Proceeds | — | ||||||
Transfers into Level 3 | — | ||||||
| Transfers out of Level 3 | (9,959,340 | ) | |||||
Balance as of December 31, 2022 | $ | — | |||||
Real Estate Investment Trusts ("REITs"):
The Funds may invest in REITs, which report information on the source of their distributions annually. REITs are pooled investment vehicles that invest primarily in income-producing real estate or real-estate related loans or interests (such as mortgages). Certain distributions received from REITs during the year are recorded as realized gains or return of capital as estimated by the Funds or when such information becomes known.
Investment Companies:
Open-End Funds:
The Funds may invest in portfolios of open-end investment companies. These investment companies value securities in their portfolios for which market quotations are readily available at their market values (generally the last reported sale price) and all other securities and assets at their fair value by the methods established by the board of directors of the underlying funds.
Special Purpose Acquisition Companies ("SPACs"):
The Funds may invest in stock, warrants and other securities of SPACs. A SPAC typically is a publicly traded company that raises funds through an initial public offering ("IPO") for the purpose of acquiring or merging with another company to be identified subsequent to the SPAC's IPO. If the Fund purchases shares of a SPAC in an IPO it generally will bear a sales commission, which may be significant. The securities of a SPAC are often issued in "units" that include one share of common stock and one right or warrant (or partial right or warrant) conveying the right to purchase additional shares or partial shares. Unless and until a transaction is completed, a SPAC generally invests its assets (less a portion retained to cover expenses) in U.S. government securities, money market funds and similar investments whose returns or yields may be significantly lower than those of the Funds' other investments. If an acquisition or merger that meets the requirements for the SPAC is not completed within a pre-established period of time, the invested funds are returned to the SPAC's shareholders, less certain permitted expenses, and any rights or warrants issued by the SPAC will expire worthless.
Private Investments in Public Equities:
The Funds may acquire common stock or a security convertible into common stock, such as a warrant or convertible preferred stock, directly from an issuer seeking to raise capital in a private placement pursuant to Regulation D under the 1933 Act. These transactions are commonly referred to as a private placement in a publicly held company, or "PIPE." The issuer's common stock is usually publicly traded on a U.S. securities exchange or in the over-the-counter market, but the securities acquired will be subject to restrictions on resale imposed by U.S. securities laws absent an effective registration
66
Victory Portfolios | Notes to Financial Statements — continued December 31, 2022 | ||||||
statement. In recognition of the illiquid nature of the securities being acquired, the purchase price paid in a PIPE transaction (or the conversion price of the convertible securities being acquired) will typically be fixed at a discount to the prevailing market price of the issuer's common stock at the time of the transaction. As part of a PIPE transaction, the issuer usually will be contractually obligated to seek to register, within an agreed upon period of time for public resale under the U.S. securities laws, the common stock or the shares of common stock issuable upon conversion of the convertible securities. PIPE transactions typically involve the purchase of securities directly from a publicly traded company or its affiliates in a private placement transaction, including through a SPAC, typically at a discount to the market price of the issuer's securities. If the issuer fails to so register the shares within that period, the buyer may be entitled to additional consideration from the issuer (e.g., warrants to acquire additional shares of common stock), but the buyer may not be able to sell its shares unless and until the registration process is successfully completed. Thus, PIPE transactions present certain risks not associated with open market purchases of equities.
Derivative Instruments:
Foreign Exchange Currency Contracts:
The Funds may enter into foreign exchange currency contracts to convert U.S. dollars to and from various foreign currencies. A foreign exchange currency contract is an obligation by a Fund to purchase or sell a specific currency at a future date at a price (in U.S. dollars) set at the time of the contract. The Funds do not engage in "cross-currency" foreign exchange contracts (i.e., contracts to purchase or sell one foreign currency in exchange for another foreign currency). The Funds' foreign exchange currency contracts might be considered spot contracts (typically a contract of one week or less) or forward contracts (typically a contract term over one week). A spot contract is entered into for purposes of hedging against foreign currency fluctuations relating to a specific portfolio transaction, such as the delay between a security transaction trade date and settlement date. Forward contracts are entered into for purposes of hedging portfolio holdings or concentrations of such holdings. The Funds enter into foreign exchange currency contracts solely for spot or forward hedging purposes, and not for speculative purposes (i.e., the Funds do not enter into such contracts solely for the purpose of earning foreign currency gains). Each foreign exchange currency contract is adjusted daily by the prevailing spot or forward rate of the underlying currency, and any appreciation or depreciation is recorded for financial statement purposes as unrealized until the contract settlement date, at which time the Funds record realized gains or losses equal to the difference between the value of a contract at the time it was opened and the value at the time it was closed. The Funds could be exposed to risk if a counterparty is unable to meet the terms of a foreign exchange currency contract or if the value of the foreign currency changes unfavorably. In addition, the use of foreign exchange currency contracts does not eliminate fluctuations in the underlying prices of the securities. For the year ended December 31, 2022, the Funds had no open forward foreign exchange currency contracts.
Investment Transactions and Related Income:
Changes in holdings of investments are accounted for no later than one business day following the trade date. For financial reporting purposes, however, investment transactions are accounted for on trade date or the last business day of the reporting period. Interest income is determined on the basis of coupon interest accrued using the effective interest method which adjusts, where applicable, the amortization of premiums or accretion of discounts. Dividend income is recorded on the ex-dividend date. Gains or losses realized on sales of securities are recorded on the identified cost basis.
Litigation income received during the year is recorded as realized gains by the Funds when such information becomes known. Gains of this type are infrequent to the Funds and are not expected to reoccur on a consistent basis. Class action litigation income received by the RS Investors Fund for the year amounted to $332,485 and is reflected on the Statements of Operations within Net realized gains (losses) from investment securities and foreign currency transactions.
Withholding taxes on interest, dividends, and gains as a result of certain investments by the Funds have been provided for in accordance with each investment's applicable country's tax rules and rates.
67
Victory Portfolios | Notes to Financial Statements — continued December 31, 2022 | ||||||
Securities Lending:
The Funds, through a Securities Lending Agreement with Citibank, N.A. ("Citibank"), may lend their securities to qualified financial institutions, such as certain broker-dealers and banks, to earn additional income, net of income retained by Citibank. Borrowers are required to initially secure their loans for collateral in the amount of at least 102% of the value of U.S. securities loaned or at least 105% of the value of non-U.S. securities loaned, marked-to-market daily. Any collateral shortfalls associated with increases in the valuation of the securities loaned are generally cured the next business day. The collateral can be received in the form of cash collateral and/or non-cash collateral. Non-cash collateral can include U.S. Government Securities and other securities as permitted by Securities and Exchange Commission ("SEC") guidelines. The cash collateral is invested in short-term instruments or cash equivalents, primarily open-end investment companies, as noted on the Funds' Schedules of Portfolio Investments. The Funds effectively do not have control of the non-cash collateral and therefore it is not disclosed on the Funds' Schedules of Portfolio Investments. Collateral requirements are determined daily based on the value of the Funds' securities on loan as of the end of the prior business day. During the time portfolio securities are on loan, the borrower will pay the Funds any dividends or interest paid on such securities plus any fee negotiated between the parties to the lending agreement. The Funds also earn a return from the collateral. The Funds pay Citibank various fees in connection with the investment of cash collateral and fees based on the investment income received from securities lending activities. Securities lending income (net of these fees) is disclosed on the Statements of Operations. Loans are terminable upon demand and the borrower must return the loaned securities within the lesser of one standard settlement period or five business days. Although risk is mitigated by the collateral, a Fund could experience a delay in recovering its securities and possible loss of income or value if the borrower fails to return them. In addition, there is a risk that the value of the short-term investments will be less than the amount of cash collateral required to be returned to the borrower.
The Funds' agreement with Citibank does not include master netting provisions. Non-cash collateral received by the Funds may not be sold or repledged, except to satisfy borrower default.
The following table is a summary of the Funds' securities lending transactions as of December 31, 2022.
| Value of Securities on Loan | Non-Cash Collateral | Cash Collateral | |||||||||||||
Global Energy Transition Fund | $ | 10,037,738 | $ | — | $ | 9,992,257 | |||||||||
Foreign Currency Translations:
The accounting records of the Funds are maintained in U.S. dollars. Investment securities and other assets and liabilities of a Fund denominated in a foreign currency are translated into U.S. dollars at current exchange rates. Purchases and sales of securities, income receipts and expense payments are translated into U.S. dollars at the exchange rates on the date of the transactions. The Funds do not isolate the portion of the results of operations resulting from changes in foreign exchange rates on investments from fluctuations arising from changes in market prices of securities held. Such fluctuations are disclosed as Net change in unrealized appreciation/depreciation on investment securities and foreign currency translations on the Statements of Operations. Any realized gains or losses from these fluctuations are disclosed as Net realized gains (losses) from investment securities and foreign currency transactions on the Statements of Operations.
Federal Income Taxes:
Each Fund intends to continue to qualify as a regulated investment company by complying with the provisions available to certain investment companies, as defined in applicable sections of the Internal Revenue Code, and to make distributions of net investment income and net realized gains sufficient to relieve it from all, or substantially all, federal income taxes. Accordingly, no provision for federal income taxes is required in the financial statements. The Funds have a tax year end of December 31.
For the year ended December 31, 2022, the Funds did not incur any income tax, interest, or penalties, and have recorded no liability for net unrecognized tax benefits relating to uncertain tax positions.
68
Victory Portfolios | Notes to Financial Statements — continued December 31, 2022 | ||||||
Management of the Funds has reviewed tax positions taken in tax years that remain subject to examination by all major tax jurisdictions, including federal (i.e., the last four tax years, which includes the current fiscal tax year end). Management believes that there is no tax liability resulting from unrecognized tax benefits related to uncertain tax positions taken.
Allocations:
Expenses directly attributable to a Fund are charged to that Fund, while expenses that are attributable to more than one fund in the Trust, or jointly with an affiliated trust, are allocated among the respective funds in the Trust and/or an affiliated trust based upon net assets or another appropriate basis.
Income, expenses (other than class-specific expenses such as transfer agent fees, state registration fees, printing fees, and 12b-1 fees), and realized and unrealized gains or losses on investments are allocated to each class of shares based on its relative net assets on the date income is earned or expenses and realized and unrealized gains and losses are incurred.
3. Purchases and Sales:
Purchases and sales of securities (excluding securities maturing less than one year from acquisition) for the year ended December 31, 2022, were as follows:
| Excluding U.S. Government Securities | |||||||||||
Purchases | Sales | ||||||||||
RS Partners Fund | $ | 343,824,818 | $ | 355,884,156 | |||||||
RS Value Fund | 210,183,964 | 236,551,857 | |||||||||
RS Large Cap Alpha Fund | 292,426,808 | 319,392,923 | |||||||||
RS Investors Fund | 35,537,854 | 22,731,954 | |||||||||
Global Energy Transition Fund | 218,982,174 | 266,439,697 | |||||||||
4. Affiliated Fund Ownership:
The Funds offer shares for investment by other funds. The fund-of-funds do not invest in the underlying funds for the purpose of exercising management or control, and the affiliated fund-of-funds' annual and semi-annual reports may be viewed at vcm.com. As of December 31, 2022, certain fund-of-funds owned total outstanding shares of the Funds as follows:
Global Energy Transition Fund | Ownership % | ||||||
Victory Strategic Allocation Fund | 0.4 | ||||||
RS Partners Fund | Ownership % | ||||||
Victory Strategic Allocation Fund | 0.2 | ||||||
5. Fees and Transactions with Affiliates and Related Parties:
Investment Advisory Fees:
Investment advisory services are provided to the Funds by the Adviser, which is a New York corporation registered as an investment adviser with the SEC.
VCM has entered into a Sub-Advisory Agreement with SailingStone Capital Partners LLC ("SailingStone"). SailingStone is responsible for providing day-to-day investment advisory services to the Global Energy Transition Fund, subject to the oversight of the Board. Sub-investment advisory fees paid by VCM to SailingStone do not represent a separate or additional expense to the Funds.
69
Victory Portfolios | Notes to Financial Statements — continued December 31, 2022 | ||||||
Under the terms of the Investment Advisory Agreement, the Adviser is entitled to receive fees based on a percentage of the average daily net assets of each Fund. The rates at which the Adviser is paid by each Fund are included in the table below.
Flat Rate | |||||||
RS Partners Fund | 1.00 | % | |||||
RS Value Fund | 0.85 | % | |||||
RS Large Cap Alpha Fund | 0.50 | % | |||||
RS Investors Fund | 1.00 | % | |||||
Global Energy Transition Fund | 1.00 | % | |||||
Amounts incurred and paid to VCM for the year ended December 31, 2022, are reflected on the Statements of Operations as Investment advisory fees.
Administration and Servicing Fees:
VCM also serves as the Funds' administrator and fund accountant. Under the Administration and Fund Accounting Agreement, VCM is entitled to receive fees based on a percentage of the average daily net assets of the Trust, Victory Variable Insurance Funds and Victory Portfolios II. The tiered rates at which VCM is paid by the Funds are shown in the table below:
Net Assets | |||||||||||
Up to $15 billion | $15 billion – $30 billion | Over $30 billion | |||||||||
0.08 | %, plus | 0.05 | %, plus | 0.04 | % | ||||||
Amounts incurred for the year ended December 31, 2022, are reflected on the Statements of Operations as Administration fees.
Citi Fund Services Ohio, Inc. ("Citi"), an affiliate of Citibank, acts as sub-administrator and sub-fund accountant to the Funds pursuant to the Sub-Administration and Sub-Fund Accounting Services Agreement between VCM and Citi. VCM pays Citi a fee for providing these services. The Funds reimburse VCM and Citi for out-of-pocket expenses incurred in providing these services and certain other expenses specifically allocated to the Funds. Amounts incurred for the year ended December 31, 2022, are reflected on the Statements of Operations as Sub-Administration fees.
The Funds (as part of the Trust) have entered into an agreement with the Adviser to provide compliance services, pursuant to which the Adviser furnishes its compliance personnel, including the services of the Chief Compliance Officer ("CCO"), and other resources reasonably necessary to provide the Trust with compliance oversight services related to the design, administration, and oversight of a compliance program for the Trust in accordance with Rule 38a-1 under the 1940 Act. The CCO is an employee of the Adviser, which pays the compensation of the CCO and support staff. The funds in the Trust, Victory Variable Insurance Funds, Victory Portfolios II and USAA Mutual Funds (collectively, the "Victory Funds Complex"), in aggregate, compensate the Adviser for these services. Amounts incurred for the year ended December 31, 2022, are reflected on the Statements of Operations as Compliance fees.
Transfer Agency Fees:
FIS Investor Services, LLC ("FIS") serves as the Funds' transfer agent. Under the Transfer Agent Agreement, the Trust pays FIS a fee for its services and reimburses FIS for all of their reasonable out-of-pocket expenses incurred in providing these services. Amounts incurred for the year ended December 31, 2022, are reflected on the Statements of Operations as Transfer agent fees.
Victory Capital Transfer Agency, Inc., an affiliate of the Adviser, serves as sub-transfer agent for the Member Class. Amounts incurred for the year ended December 31, 2022, are reflected on the Statements of Operations as Transfer agent fees.
70
Victory Portfolios | Notes to Financial Statements — continued December 31, 2022 | ||||||
Distributor/Underwriting Services:
Victory Capital Services, Inc. (the "Distributor"), an affiliate of the Adviser, serves as Distributor for the continuous offering of the shares of the Funds pursuant to a Distribution Agreement between the Distributor and the Trust.
Pursuant to the Distribution and Service Plans adopted in accordance with Rule 12b-1 under the 1940 Act, the Distributor may receive a monthly distribution and service fee up to the annual rate shown in the table below:
Class A | Class C | Class R | |||||||||||||
RS Partners Fund | 0.25 | % | N/A | 0.50 | % | ||||||||||
RS Value Fund | 0.25 | % | 1.00 | % | 0.50 | % | |||||||||
RS Large Cap Alpha Fund | 0.25 | % | 1.00 | % | 0.50 | % | |||||||||
RS Investors Fund | 0.25 | % | 1.00 | % | 0.50 | % | |||||||||
Global Energy Transition Fund | 0.25 | % | 1.00 | % | 0.50 | % | |||||||||
The distribution and service fees paid to the Distributor may be used by the Distributor to pay for activities primarily intended to result in the sale of Class A, Class C, and Class R. Amounts incurred for the year ended December 31, 2022, are reflected on the Statements of Operations as 12b-1 fees.
In addition, the Distributor is entitled to receive commissions in connection with sales of the Class A. For the year ended December 31, 2022, the Distributor received $19,471 from commissions earned in connection with sales of Class A.
Other Fees:
Citibank serves as the Funds' custodian. The Funds pay Citibank a fee for providing these services. Amounts incurred for the year ended December 31, 2022, are reflected on the Statements of Operations as Custodian fees.
Sidley Austin LLP provides legal services to the Trust.
The Adviser has entered into expense limitation agreements with the Funds. Under the terms of the agreements, the Adviser has agreed to waive fees or reimburse certain expenses to the extent that ordinary operating expenses incurred by certain classes of a Fund in any fiscal year exceed the expense limit for such classes of the Fund. Such excess amounts will be the liability of the Adviser. Acquired fund fees and expenses, interest, taxes, brokerage commissions, other expenditures which are capitalized in accordance with GAAP, and other extraordinary expenses not incurred in the ordinary course of the Fund's business are excluded from the expense limits. As of December 31, 2022, the expense limits (excluding voluntary waivers) are as follows:
In effect until April 30, 2023 | |||||||||||||||||||||||
Class A | Class C | Class R | Class Y | Member Class | |||||||||||||||||||
RS Partners Fund | 1.45 | % | N/A | 1.81 | % | 1.12 | % | 1.25 | % | ||||||||||||||
RS Value Fund | 1.30 | % | 2.07 | % | 1.69 | % | 1.06 | % | N/A | ||||||||||||||
RS Large Cap Alpha Fund | 0.89 | % | 1.69 | % | 1.26 | % | 0.68 | % | N/A | ||||||||||||||
RS Investors Fund | 1.33 | % | 2.07 | % | 1.95 | % | 1.05 | % | N/A | ||||||||||||||
Global Energy Transition Fund | 1.48 | % | 2.28 | % | 1.86 | % | 1.15 | % | N/A | ||||||||||||||
Under the terms of the expense limitation agreements, the Funds have agreed to repay fees and expenses that were waived or reimbursed by the Adviser for a period of up to three years (thirty six (36) months) after the waiver or reimbursement took place, subject to the lesser of any operating expense limits in effect at the time of: (a) the original waiver or expense reimbursement; or (b) the recoupment, after giving effect to the recoupment amount.
71
Victory Portfolios | Notes to Financial Statements — continued December 31, 2022 | ||||||
As of December 31, 2022, the following amounts are available to be repaid to the Adviser. The Funds have not recorded any amounts available to be repaid as a liability due to an assessment that such repayments are not probable at December 31, 2022.
| Expires 2023 | Expires 2024 | Expires 2025 | Total | ||||||||||||||||
RS Partners Fund | $ | 316,786 | $ | 229,651 | $ | 263,864 | $ | 810,301 | |||||||||||
RS Value Fund | 194,789 | 70,218 | 59,177 | 324,184 | |||||||||||||||
RS Large Cap Alpha Fund | 314,607 | 211,774 | 167,620 | 694,001 | |||||||||||||||
RS Investors Fund | 146,600 | 90,433 | 122,672 | 359,705 | |||||||||||||||
Global Energy Transition Fund | 234,015 | 186,151 | 189,737 | 609,903 | |||||||||||||||
The Adviser may voluntarily waive or reimburse additional fees to assist the Funds in maintaining competitive expense ratios. Voluntary waivers and reimbursements applicable to the Funds are not available to be recouped at a future time. There were no voluntary waivers or reimbursements for the year ended December 31, 2022.
Certain officers and/or interested trustees of the Funds are also officers and/or employees of the Adviser, administrator, fund accountant, sub-administrator, sub-fund accountant, custodian, legal counsel, and Distributor.
6. Risks:
The Funds may be subject to other risks in addition to these identified risks.
Equity Risk — The value of the equity securities in which the Funds invest may decline in response to developments affecting individual companies and/or general, economic conditions in the United States or abroad. A company's earnings or dividends may not increase as expected (or may decline) because of poor management, competitive pressures, reliance on particular suppliers or geographical regions, labor problems or shortages, corporate restructurings, fraudulent disclosures, man-made or natural disasters, military confrontations or wars, terrorism, public health crises, or other events, conditions, and factors. Price changes may be temporary or last for extended periods.
Private Investments in Public Equities Risk — The risks associated with PIPE transactions that the RS Science and Technology Fund invests is that the issuer may be unable to register the shares for public resale in a timely manner or at all, in which case the shares may be sold only in a privately negotiated transaction, typically at a price less than that paid, assuming a suitable buyer can be found. Disposing of the securities may involve time-consuming negotiation and legal expenses, and selling them promptly at an acceptable price may be difficult or impossible. Even if the shares are registered for public resale, the market for the issuer's securities may nevertheless be "thin" or illiquid, making the sale of securities at desired prices or in desired quantities difficult or impossible. While private placements may offer attractive opportunities not otherwise available in the open market, the securities purchased are usually "restricted securities" or are "not readily marketable." Restricted securities cannot be sold without being registered under the 1933 Act, unless they are sold pursuant to an exemption from registration (such as Rules 144 or 144A under the 1933 Act). Securities that are not readily marketable are subject to other legal or contractual restrictions on resale.
Special Purpose Acquisition Company Risk — An investment in a SPAC is subject to a variety of risks, including that (1) a portion of the monies raised by the SPAC for the purpose of effecting an acquisition or merger may be expended prior to the transaction for payment of taxes and other expenses; (2) the Fund generally will not receive significant income from its investments in SPACs (both prior to and after any acquisition or merger) and, therefore, the Fund's investments in SPACs will not significantly contribute to the Fund's distributions to shareholders; (3) an attractive acquisition or merger target may not be identified at all or a proposed merger or acquisition may be unable to obtain the requisite approval, if any, of SPAC shareholders and/or antitrust and securities regulators; (4) the warrants or other rights with respect to the SPAC held by the Fund may expire worthless or may be redeemed by
72
Victory Portfolios | Notes to Financial Statements — continued December 31, 2022 | ||||||
the SPAC at an unfavorable price; (5) the Fund may be subject to opportunity costs to the extent that alternative investments would have produced higher returns; (6) an acquisition or merger once effected may prove unsuccessful and an investment in the SPAC may lose value; (7) while a SPAC is seeking a transaction target, its stock may be thinly traded and/or illiquid and there can be no assurance that a market will develop, leaving the Fund unable to sell its interest in a SPAC or to sell its interest only at a price below what the Fund believes is the SPAC interest's intrinsic value, (8) an investment in a SPAC may be diluted by additional later offerings of interests in the SPAC or by other investors exercising existing rights to purchase shares of the SPAC; and (9) the values of investments in SPACs may be highly volatile and may depreciate significantly over time. The proceeds of a SPAC IPO that are placed in trust are subject to risks, including the risk of insolvency of the custodian of the funds, fraud by the trustee, interest rate risk and credit and liquidity risk relating to the securities and money market funds in which the proceeds are invested.
Sector Focus Risk — To the extent the Funds focus in one or more sectors, market or economic factors impacting those sectors could have a significant effect on the value of the Funds' investments and could make the Funds' performance more volatile. For example, the values of companies in the Information Technology sector are particularly vulnerable to economic downturns, short product cycles and aggressive pricing, market competition and changes in government regulation.
Concentration Risk — The Global Energy Transition Fund (herein, the Fund) may concentrate its investments in a particular industry, as the term "concentration is used in the 1940 Act. Concentrating investments in the Natural Resources sector increases the risk of loss because the stocks of many or all of the companies in the sector may decline in value due to developments adversely affecting the sector. In addition, investors may buy or sell substantial amounts of the Fund's shares in response to factors affecting or expected to affect the natural resources sector, resulting in extreme inflows and outflows of cash into and out of the Fund. Such inflows or outflows might affect management of the Fund adversely to the extent they cause the Fund's cash position or cash requirements to exceed normal levels.
Natural Resources Investment Risk — Investment in companies in natural resources industries (including those in the energy sector) can be significantly affected by (often rapid) changes in supply of, or demand for, various natural resources. They may also be affected by changes in energy prices, international political and economic developments, environmental incidents, energy conservation, the success of exploration projects, changes in commodity prices, and tax and other government regulations. For example, the COVID-19 pandemic has drastically reduced the demand for various natural resources and has drastically increased the price volatility of natural resources and companies within the natural resources industry. An extended period of reduced (or negative) prices may significantly lengthen the time that companies within the natural resources industries would need to recover after a stabilization of prices. Investments in interests in gas or mineral exploration or development programs, including pipelines, may be held through master limited partnerships, which are generally subject to many of the risks that apply to partnerships and may also be subject to certain tax risks.
Market Risk — Overall market risks may affect the value of the Funds. Domestic and international factors such as political events, war, terrorism, trade disputes, inflation rates, interest rate levels and other fiscal and monetary policy changes, cybersecurity incidents, pandemics and other public health crises, sanctions against a particular foreign country, its nationals, businesses or industries and related geopolitical events, as well as environmental disasters such as earthquakes, fires, and floods or other catastrophes, may add to instability in global economies and markets generally, and may lead to increased market volatility. Global economies and financial markets are highly interconnected, which increases the possibility that conditions in one country or region might adversely affect issuers in another country or region. The impact of these and other factors may be short-term or may last for extended periods.
73
Victory Portfolios | Notes to Financial Statements — continued December 31, 2022 | ||||||
7. Borrowing and Interfund Lending:
Line of Credit:
The Victory Funds Complex participates in a short-term demand note "Line of Credit" agreement with Citibank. The Line of Credit agreement with Citibank was renewed on June 27, 2022, with a termination date of June 26, 2023. Under the agreement with Citibank, the Victory Funds Complex may borrow up to $600 million, of which $300 million is committed and $300 million is uncommitted. $40 million of the Line of Credit is reserved for use by the Victory Floating Rate Fund, another series of the Victory Funds Complex, with Victory Floating Rate Fund paying the related commitment fees for that amount. The purpose of the Line of Credit is to meet temporary or emergency cash needs. For the year ended December 31, 2022, Citibank received an annual commitment fee of 0.15% on $300 million for providing the Line of Credit. Each fund in the Victory Funds Complex paid a pro-rata portion of the commitment fees plus any interest on amounts borrowed. For the period from January 1, 2022, through June 27, 2022, interest was based on the one-month London Interbank Offered Rate ("LIBOR") plus one percent. Effective with the renewal, for the period from June 28, 2022, through December 31, 2022, interest was based on the one-month Secured Overnight Financing Rate (SOFR) plus 1.10 percent. The Funds did not experience a material financial impact transitioning from LIBOR to SOFR. Interest charged to each fund during the period, if applicable, is reflected on the Statements of Operations under Line of credit fees.
The Funds had no borrowings under the Line of Credit agreement during the year ended December 31, 2022.
Interfund Lending:
The Trust and the Adviser rely on an exemptive order granted by the SEC in March 2017 (the "Order"), permitting the establishment and operation of an Interfund Lending Facility (the "Facility"). The Facility allows each Fund to directly lend and borrow money to or from any other fund in the Victory Funds Complex that is permitted to participate in the Facility, relying upon the Order at rates beneficial to both the borrowing and lending funds. Advances under the Facility are allowed for temporary or emergency purposes, including the meeting of redemption requests that otherwise might require the untimely disposition of securities, and are subject to each Fund's borrowing restrictions. The interfund loan rate is determined, as specified in the Order, by averaging the current repurchase agreement rate and the current bank loan rate. As a Borrower, interest charged to each Fund, if any, during the period, is reflected on the Statements of Operations under Interfund lending fees. As a Lender, interest earned by each Fund, if any, during the period, is reflected on the Statements of Operations under Interfund lending.
The Funds did not utilize or participate in the Facility during the year ended December 31, 2022.
8. Federal Income Tax Information:
Dividends from net investment income, if any, are declared and paid as noted in the table below. Distributable net realized gains, if any, are declared and distributed at least annually from each Fund.
Declared | Paid | ||||||||||
RS Partners Fund | Annually | Annually | |||||||||
RS Value Fund | Annually | Annually | |||||||||
RS Large Cap Alpha Fund | Annually | Annually | |||||||||
RS Investors Fund | Annually | Annually | |||||||||
Global Energy Transition Fund | Annually | Annually | |||||||||
The amounts of dividends from net investment income and distributions from net realized gains (collectively, distributions to shareholders) are determined in accordance with federal income tax regulations, which may differ from GAAP. To the extent these "book/tax" differences are permanent in nature (e.g., net operating loss and distribution reclassification), such amounts are reclassified within the components of net assets based on their federal tax-basis treatment; temporary differences (e.g., wash sales) do not require reclassification. To the extent dividends and distributions exceed net
74
Victory Portfolios | Notes to Financial Statements — continued December 31, 2022 | ||||||
investment income and net realized gains for tax purposes, they are reported as distributions of capital. Net investment losses incurred by the Funds may be reclassified as an offset to capital on the accompanying Statements of Assets and Liabilities.
As of December 31, 2022, on the Statements of Assets and Liabilities, as a result of permanent book-to-tax differences, reclassification adjustments were as follows:
| Total Accumulated Earnings/(Loss) | Capital | |||||||||
RS Partners Fund | $ | (3,456,660 | ) | $ | 3,456,660 | ||||||
RS Value Fund | (818,538 | ) | 818,538 | ||||||||
RS Large Cap Alpha Fund | (1,527,850 | ) | 1,527,850 | ||||||||
RS Investors Fund | 6,123 | (6,123 | ) | ||||||||
The tax character of distributions paid during the tax years ended, as noted below, were as follows (total distributions paid may differ from the Statements of Changes in Net Assets because, for tax purposes, dividends are recognized when actually paid).
| Year Ended December 31, 2022 | ||||||||||||||
| Distributions Paid From: |
| |||||||||||||
| Ordinary Income | Net Long-Term Capital Gains | Total Distributions Paid | ||||||||||||
RS Partners Fund | $ | 1,850,259 | $ | 26,495,385 | $ | 28,345,644 | |||||||||
RS Value Fund | 2,379,283 | 15,446,815 | 17,826,098 | ||||||||||||
RS Large Cap Alpha Fund | 8,169,416 | 34,981,772 | 43,151,188 | ||||||||||||
RS Investors Fund | 216,610 | 1,571,317 | 1,787,927 | ||||||||||||
Global Energy Transition Fund | 4,048,830 | — | 4,048,830 | ||||||||||||
Year Ended December 31, 2021 | |||||||||||||||
Distributions Paid From: | |||||||||||||||
| Ordinary Income | Net Long-Term Capital Gains | Total Distributions Paid | |||||||||||||
RS Partners Fund | $ | 21,530,003 | $ | 31,220,827 | $ | 52,750,830 | |||||||||
RS Value Fund | 10,573,513 | 31,396,048 | 41,969,561 | ||||||||||||
RS Large Cap Alpha Fund | 27,811,743 | 31,911,297 | 59,723,040 | ||||||||||||
RS Investors Fund | 1,283,871 | 3,071,334 | 4,355,205 | ||||||||||||
| Global Energy Transition Fund | 86,748 | — | 86,748 | ||||||||||||
As of December 31, 2022, the components of accumulated earnings/(loss) on a tax basis were as follows:
| Undistributed Ordinary Income | Undistributed Long-Term Capital Gains | Accumulated Earnings | Accumulated Capital and Other Losses | Unrealized Appreciation (Depreciation)* | Total Accumulated Earnings (Loss) | |||||||||||||||||||||
RS Partners Fund | $ | — | $ | 1,091,701 | $ | 1,091,701 | $ | — | $ | 44,279,916 | $ | 45,371,617 | |||||||||||||||
RS Value Fund | — | 2,754,915 | 2,754,915 | — | 44,479,415 | 47,234,330 | |||||||||||||||||||||
| RS Large Cap Alpha Fund | 3,552,560 | 2,314,135 | 5,866,695 | — | 67,931,829 | 73,798,524 | |||||||||||||||||||||
RS Investors Fund | 79,413 | — | 79,413 | — | 3,942,410 | 4,021,823 | |||||||||||||||||||||
| Global Energy Transition Fund | 315,243 | — | 315,243 | (1,752,284,601 | ) | 53,207,458 | (1,698,761,900 | ) | |||||||||||||||||||
* The difference between the book-basis and tax-basis unrealized appreciation (depreciation) is attributable primarily to tax deferral of losses on wash sales, and partnership basis adjustments.
75
Victory Portfolios | Notes to Financial Statements — continued December 31, 2022 | ||||||
As of December 31, 2022, the Funds had net capital loss carryforwards as shown in the table below. It is unlikely that the Board will authorize a distribution of capital gains realized in the future until the capital loss carryforwards have been used.
| Short-Term Amount | Long-Term Amount | Total | ||||||||||||
Global Energy Transition Fund | $ | — | $ | 1,752,284,601 | $ | 1,752,284,601 | |||||||||
During the tax year ended December 31, 2022, the following Funds utilized capital loss carryforwards:
Global Energy Transition Fund | $ | 70,905,204 | |||||
As of December 31, 2022, the cost basis for federal income tax purposes, gross unrealized appreciation, gross unrealized depreciation, and net unrealized appreciation (depreciation) for investments were as follows:
| Cost of Investments for Federal Tax Purposes | Net Gross Unrealized Appreciation | Gross Unrealized Depreciation | Net Unrealized Appreciation (Depreciation) | |||||||||||||||
RS Partners Fund | $ | 291,232,787 | $ | 57,623,792 | $ | (13,343,876 | ) | $ | 44,279,916 | ||||||||||
RS Value Fund | 245,185,602 | 48,597,190 | (4,117,775 | ) | 44,479,415 | ||||||||||||||
RS Large Cap Alpha Fund | 387,222,186 | 89,523,019 | (21,591,190 | ) | 67,931,829 | ||||||||||||||
RS Investors Fund | 39,034,919 | 5,401,636 | (1,459,226 | ) | 3,942,410 | ||||||||||||||
Global Energy Transition Fund | 281,976,709 | 81,786,501 | (28,679,727 | ) | 53,106,774 | ||||||||||||||
76
REPORT OF INDEPENDENT REGISTERED PUBLIC ACCOUNTING FIRM
To the Shareholders and Board of Trustees of Victory Portfolios
Opinion on the Financial Statements
We have audited the accompanying statements of assets and liabilities, including the schedules of portfolio investments, of Victory RS Partners Fund, Victory RS Value Fund, Victory RS Large Cap Alpha Fund, Victory RS Investors Fund, and Victory Global Energy Transition Fund (the "Funds"), each a series of Victory Portfolios, as of December 31, 2022, the related statements of operations for the year then ended, the statements of changes in net assets for each of the two years in the period then ended, the related notes, and the financial highlights for each of the four years in the period then ended (collectively referred to as the "financial statements"). In our opinion, the financial statements present fairly, in all material respects, the financial position of the Funds as of December 31, 2022, the results of their operations for the year then ended, the changes in net assets for each of the two years in the period then ended, and the financial highlights for each of the four years in the period then ended, in conformity with accounting principles generally accepted in the United States of America.
The Funds' financial highlights for the year ended December 31, 2018, were audited by other auditors whose report dated February 26, 2019, expressed an unqualified opinion on those financial highlights.
Basis for Opinion
These financial statements are the responsibility of the Funds' management. Our responsibility is to express an opinion on the Funds' financial statements based on our audits. We are a public accounting firm registered with the Public Company Accounting Oversight Board (United States) ("PCAOB") and are required to be independent with respect to the Funds in accordance with the U.S. federal securities laws and the applicable rules and regulations of the Securities and Exchange Commission and the PCAOB.
We conducted our audits in accordance with the standards of the PCAOB. Those standards require that we plan and perform the audit to obtain reasonable assurance about whether the financial statements are free of material misstatement whether due to error or fraud.
Our audits included performing procedures to assess the risks of material misstatement of the financial statements, whether due to error or fraud, and performing procedures that respond to those risks. Such procedures included examining, on a test basis, evidence regarding the amounts and disclosures in the financial statements. Our procedures included confirmation of securities owned as of December 31, 2022, by correspondence with the custodian and brokers; when replies were not received from brokers, we performed other auditing procedures. Our audits also included evaluating the accounting principles used and significant estimates made by management, as well as evaluating the overall presentation of the financial statements. We believe that our audits provide a reasonable basis for our opinion.
We have served as the auditor of one or more of the investment companies advised by Victory Capital Management, Inc. since 2015.

COHEN & COMPANY, LTD.
Cleveland, Ohio
February 23, 2023
77
Victory Portfolios | Supplemental Information December 31, 2022 | ||||||
(Unaudited)
Trustee and Officer Information
Board of Trustees:
Overall responsibility for management of the Trust rests with the Board. The Trust is managed by the Board in accordance with the laws of the State of Delaware. There are currently nine Trustees, eight of whom are not "interested persons" of the Trust within the meaning of that term under the 1940 Act ("Independent Trustees") and one of whom is an "interested person" of the Trust within the meaning of that term under the 1940 Act ("Interested Trustee"). The Trustees, in turn, elect the officers of the Trust to actively supervise its day-to-day operations.
The following tables list the Trustees, their date of birth, their position with the Trust, their commencement of service, their principal occupations during the past five years, and any directorships of other investment companies or companies whose securities are registered under the Securities Exchange Act of 1934, as amended, or who file reports under that Act. Each Trustee oversees 37 portfolios in the Trust, 6 portfolios in Victory Variable Insurance Funds, and 25 portfolios in Victory Portfolios II, each a registered investment company that, together with the Trust, comprise the Victory Fund Complex. David C. Brown is a Trustee of USAA Mutual Funds and oversees 45 portfolios of the USAA Mutual Funds Trust. Each Trustee's address is c/o Victory Portfolios, 4900 Tiedeman Road, 4th Floor, Brooklyn, Ohio 44144. Each Trustee has an indefinite term.
Name and Date of Birth | Position Held with the Trust | Date Commenced Service | Principal Occupation During Past 5 Years | Other Directorships Held During Past 5 Years | |||||||||||||||
Independent Trustees. | |||||||||||||||||||
| David Brooks Adcock, October 1951 | Trustee | May 2005 | Consultant (since 2006). | Chairman, Board of Trustees, Turner Funds (December 2016-December 2017). | |||||||||||||||
| Nigel D. T. Andrews, April 1947 | Trustee | August 2002 | Retired. | Director, Carlyle Secured Lending, Inc. (formerly TCG BDC I, Inc.) (since 2012); Director, Carlyle Credit Solutions, Inc. (formerly TCG BDC II, Inc.) (since 2017); Trustee, Carlyle Secured Lending III (since 2021). | |||||||||||||||
| E. Lee Beard,* August 1951 | Trustee | May 2005 | Retired. | None. | |||||||||||||||
| Dennis M. Bushe, January 1944 | Trustee | July 2016 | Retired. | None. | |||||||||||||||
78
Victory Portfolios | Supplemental Information — continued December 31, 2022 | ||||||
(Unaudited)
Name and Date of Birth | Position Held with the Trust | Date Commenced Service | Principal Occupation During Past 5 Years | Other Directorships Held During Past 5 Years | |||||||||||||||
| John L. Kelly, April 1953 | Chair and Trustee | February 2015 | Partner, McCarvill Capital Partners (September 2016- September 2017). | Director, Caledonia Mining Corporation (since May 2012). | |||||||||||||||
| David L. Meyer, April 1957 | Trustee | December 2008 | Retired. | None. | |||||||||||||||
| Gloria S. Nelund, May 1961 | Trustee | July 2016 | Chair, CEO and Co-Founder of TriLinc Global, LLC, an investment firm. | TriLinc Global Impact Fund, LLC (since 2012). | |||||||||||||||
| Timothy Pettee, April 1958 | Advisory Trustee | January 2023 | Chief Investment Officer, Hoya Capital Real Estate LLC (since February 2022); Chief Investment Officer, Sun America Asset Management Corp., (January 2003-July 2021). | None. | |||||||||||||||
| Leigh A. Wilson, December 1944 | Trustee | November 1994 | Private Investor. | Chair (since 2013), Caledonia Mining Corporation. | |||||||||||||||
Interested Trustee. | |||||||||||||||||||
| David C. Brown,** May 1972 | Trustee | May 2008 | Chief Executive Officer and Chairman (since 2013), the Adviser; Chief Executive Officer and Chairman (since 2013), Victory Capital Holdings, Inc.; Director (since 2013), Victory Capital Services, Inc.; Director (since 2019), Victory Capital Transfer Agency, Inc. | Trustee, USAA Mutual Funds Trust; Board Member, Victory Capital Services, Inc. | |||||||||||||||
* The Board has designated Ms. Beard as its Audit Committee Financial Expert.
** Mr. Brown is an "Interested Person" by reason of his relationship with the Adviser.
The Statement of Additional Information includes additional information about the Trustees of the Trust and is available, without charge, by calling 800-539-3863.
79
Victory Portfolios | Supplemental Information — continued December 31, 2022 | ||||||
(Unaudited)
Officers:
The officers of the Trust, their date of birth, their commencement of service, and their principal occupations during the past five years, are detailed in the following table. Each officer serves until the earlier of his or her resignation, removal, retirement, death, or the election of a successor. The mailing address of each officer of the Trust is 4900 Tiedeman Road, 4th Floor, Brooklyn, Ohio 44144. The officers of the Trust receive no compensation directly from the Trust for performing the duties of their offices.
Name and Date of Birth | Position with the Trust | Date Commenced Service | Principal Occupation During Past 5 Years | ||||||||||||
| Christopher K. Dyer, February 1962 | President | February 2006 | Director of Mutual Fund Administration, the Adviser (since 2004); Chief Operating Officer, Victory Capital Services, Inc. (since 2020); Vice President, Victory Capital Transfer Agency, Inc. (since 2019). | ||||||||||||
| Scott A. Stahorsky, July 1969 | Vice President | December 2014 | Manager, Fund Administration, the Adviser. (since 2015). | ||||||||||||
| Thomas Dusenberry, July 1977 | Secretary | May 2022 | Manager, Fund Administration, the Adviser (since 2022); Treasurer and Principal Financial Officer (2020-2022), Assistant Treasurer (2019), Salient MF Trust, Salient Midstream, MLP Fund and Forward Funds; Principal Financial Officer (2018-2021) and Treasurer (2020-2021), Salient Private Access Funds and Endowment PMF Funds; Senior Vice President of Fund Accounting and Operations, Salient Partners (2020-2022); Director of Fund Operations, Salient Partners (2016-2019). | ||||||||||||
| Allan Shaer, March 1965 | Treasurer | May 2017 | Senior Vice President, Financial Administration, Citi Fund Services Ohio, Inc. (since 2016). | ||||||||||||
| Christopher A. Ponte, March 1984 | Assistant Treasurer | December 2017 | Manager, Fund Administration, the Adviser (since 2017); Chief Financial Officer, Victory Capital Services, Inc. (since 2018). | ||||||||||||
| Sean Fox, September 1976 | Chief Compliance Officer | June 2022 | Sr. Compliance Officer, the Adviser (since 2019); Compliance Officer, the Adviser (2015-2019). | ||||||||||||
| Charles Booth, April 1960 | Anti-Money Laundering Compliance Officer and Identity Theft Officer | May 2015 | Director, Regulatory Administration and CCO Support Services, Citi Fund Services Ohio, Inc. (since 2007). | ||||||||||||
| Jay G. Baris, January 1954 | Assistant Secretary | December 1997 | Partner, Sidley Austin LLP (since 2020); Partner, Shearman & Sterling LLP (2018-2020). | ||||||||||||
80
Victory Portfolios | Supplemental Information — continued December 31, 2022 | ||||||
(Unaudited)
Proxy Voting and Portfolio Holdings Information
Proxy Voting:
Information regarding the policies and procedures each Fund uses to determine how to vote proxies relating to portfolio securities is available without charge, upon request, by calling 800-539-3863. The information is also included in the Funds' Statement of Additional Information, which is available on the SEC's website at sec.gov.
Information relating to how the Funds voted proxies relating to portfolio securities held during the most recent 12 months ended June 30 is available on the SEC's website at sec.gov.
Availability of Schedules of Portfolio Investments:
The Trust files a complete list of Schedules of Portfolio Investments with the SEC for the first and third quarter of each fiscal year on Form N-PORT. Forms N-PORT are available on the SEC's website at sec.gov.
Expense Examples
As a shareholder of the Funds, you may incur two types of costs: (1) transaction costs, including sales charges (loads) on purchases; and (2) ongoing costs, including management fees and other Fund expenses. These examples are intended to help you understand your ongoing costs (in dollars) of investing in the Fund and to compare these costs with the ongoing costs of investing in other mutual funds.
These examples are based on an investment of $1,000 invested at the beginning of the period and held for the entire period from July 1, 2022, through December 31, 2022.
The Actual Expense figures in the table below provide information about actual account values and actual expenses. You may use the information below, together with the amount you invested, to estimate the expenses that you paid over the period. Simply divide your account value by $1,000 (for example, an $8,600 account value divided by $1,000 = 8.6), then multiply the result by the number in the table under the heading entitled "Actual Expenses Paid During Period" to estimate the expenses you paid on your account during this period.
The Hypothetical Expense figures in the table below provide information about hypothetical account values and hypothetical expenses based on the Fund's actual expense ratio and an assumed rate of return of 5% per year before expenses, which is not the Fund's actual return. The hypothetical account values and expenses may not be used to estimate the actual ending account balance or expenses you paid for the period. You may use this information to compare this 5% hypothetical example with the 5% hypothetical examples that appear in shareholder reports of other funds.
Please note the expenses shown in the table below are meant to highlight your ongoing costs only and do not reflect any transactional costs. Therefore, the hypothetical expenses in the table are useful in comparing ongoing costs only and will not help you determine the relative total costs of owning different funds. In addition, if these transactional costs were included, your costs would have been higher.
| Beginning Account Value 7/1/22 | Actual Ending Account Value 12/31/22 | Hypothetical Ending Account Value 12/31/22 | Actual Expenses Paid During Period 7/1/22-12/31/22* | Hypothetical Expenses Paid During Period 7/1/22-12/31/22* | Annualized Expense Ratio During Period 7/1/22-12/31/22 | ||||||||||||||||||||||
RS Partners Fund | |||||||||||||||||||||||||||
Class A | $ | 1,000.00 | $ | 1,059.30 | $ | 1,017.90 | $ | 7.53 | $ | 7.38 | 1.45 | % | |||||||||||||||
Class R | 1,000.00 | 1,057.60 | 1,016.08 | 9.39 | 9.20 | 1.81 | % | ||||||||||||||||||||
Class Y | 1,000.00 | 1,061.20 | 1,019.56 | 5.82 | 5.70 | 1.12 | % | ||||||||||||||||||||
Member Class | 1,000.00 | 1,060.60 | 1,018.90 | 6.49 | 6.36 | 1.25 | % | ||||||||||||||||||||
RS Value Fund | |||||||||||||||||||||||||||
Class A | 1,000.00 | 1,070.30 | 1,018.65 | 6.78 | 6.61 | 1.30 | % | ||||||||||||||||||||
Class C | 1,000.00 | 1,065.70 | 1,014.77 | 10.78 | 10.51 | 2.07 | % | ||||||||||||||||||||
Class R | 1,000.00 | 1,067.60 | 1,016.69 | 8.81 | 8.59 | 1.69 | % | ||||||||||||||||||||
Class Y | 1,000.00 | 1,071.20 | 1,019.86 | 5.53 | 5.40 | 1.06 | % | ||||||||||||||||||||
81
Victory Portfolios | Supplemental Information — continued December 31, 2022 | ||||||
(Unaudited)
| Beginning Account Value 7/1/22 | Actual Ending Account Value 12/31/22 | Hypothetical Ending Account Value 12/31/22 | Actual Expenses Paid During Period 7/1/22-12/31/22* | Hypothetical Expenses Paid During Period 7/1/22-12/31/22* | Annualized Expense Ratio During Period 7/1/22-12/31/22 | ||||||||||||||||||||||
RS Large Cap Alpha Fund | |||||||||||||||||||||||||||
Class A | $ | 1,000.00 | $ | 1,026.40 | $ | 1,020.72 | $ | 4.55 | $ | 4.53 | 0.89 | % | |||||||||||||||
Class C | 1,000.00 | 1,022.20 | 1,016.69 | 8.61 | 8.59 | 1.69 | % | ||||||||||||||||||||
Class R | 1,000.00 | 1,024.40 | 1,018.85 | 6.43 | 6.41 | 1.26 | % | ||||||||||||||||||||
Class Y | 1,000.00 | 1,027.40 | 1,021.78 | 3.47 | 3.47 | 0.68 | % | ||||||||||||||||||||
RS Investors Fund | |||||||||||||||||||||||||||
Class A | 1,000.00 | 1,027.20 | 1,018.50 | 6.80 | 6.77 | 1.33 | % | ||||||||||||||||||||
Class C | 1,000.00 | 1,023.60 | 1,014.77 | 10.56 | 10.51 | 2.07 | % | ||||||||||||||||||||
Class R | 1,000.00 | 1,023.90 | 1,015.38 | 9.95 | 9.91 | 1.95 | % | ||||||||||||||||||||
Class Y | 1,000.00 | 1,028.30 | 1,019.91 | 5.37 | 5.35 | 1.05 | % | ||||||||||||||||||||
Global Energy Transition Fund | |||||||||||||||||||||||||||
Class A | 1,000.00 | 1,096.50 | 1,017.74 | 7.82 | 7.53 | 1.48 | % | ||||||||||||||||||||
Class C | 1,000.00 | 1,092.30 | 1,013.71 | 12.02 | 11.57 | 2.28 | % | ||||||||||||||||||||
Class R | 1,000.00 | 1,094.50 | 1,015.83 | 9.82 | 9.45 | 1.86 | % | ||||||||||||||||||||
Class Y | 1,000.00 | 1,098.50 | 1,019.41 | 6.08 | 5.85 | 1.15 | % | ||||||||||||||||||||
* Expenses are equal to the average account value multiplied by the Fund's annualized expense ratio multiplied by 184/365 (the number of days in the most recent fiscal half-year divided by the number of days in the fiscal year).
82
Victory Portfolios | Supplemental Information — continued December 31, 2022 | ||||||
(Unaudited)
Additional Federal Income Tax Information
For the year ended December 31, 2022, the following Funds paid qualified dividend income for the purposes of reduced individual federal income tax rates of:
| Percent | ||||||
RS Partners Fund | 100 | % | |||||
RS Value Fund | 66 | % | |||||
RS Large Cap Alpha Fund | 37 | % | |||||
RS Investors Fund | 100 | % | |||||
Global Energy Transition Fund | 100 | % | |||||
Dividends qualified for corporate dividends received deductions of:
| Percent | ||||||
RS Partners Fund | 100 | % | |||||
RS Value Fund | 65 | % | |||||
RS Large Cap Alpha Fund | 32 | % | |||||
RS Investors Fund | 100 | % | |||||
Global Energy Transition Fund | 24 | % | |||||
For the year ended December 31, 2022, the following Funds designated short-term capital gain distributions:
| Amount | ||||||
RS Value Fund | $ | 1,213,263 | |||||
RS Large Cap Alpha Fund | 3,984,945 | ||||||
RS Investors Fund | 136,561 | ||||||
For the year ended December 31, 2022, the following Funds designated long-term capital gain distributions:
| Amount | ||||||
RS Partners Fund | $ | 29,960,736 | |||||
RS Value Fund | 16,333,856 | ||||||
RS Large Cap Alpha Fund | 36,656,645 | ||||||
RS Investors Fund | 1,571,317 | ||||||
The following Funds intend to elect to pass through to shareholders the income tax credit for taxes paid to foreign countries. Foreign source income and foreign tax expense per outstanding share on December 31, 2022, were as follows:
| Foreign Source Income | Foreign Tax Expense | |||||||||
Global Energy Transition Fund | $ | 0.55 | $ | 0.08 | |||||||
83
Victory Portfolios | Supplemental Information — continued December 31, 2022 | ||||||
(Unaudited)
Considerations of the Board in Continuing the Investment Advisory Agreements
The Board approved the advisory agreement with the Adviser, on behalf of each of the Funds (the "Advisory Agreement"), and the sub-advisory agreement between SailingStone Capital Partners LLC (the "Sub-Adviser") and the Adviser, on behalf of the Global Energy Transition Fund (the "Sub-Advisory Agreement" and together with the Advisory Agreement, the "Agreements"), at a meeting, which was called for that purpose, on December 6, 2022. The Board also considered information relating to the Funds and the Agreements provided throughout the year and, more specifically, at the meetings on October 18, 2022 and December 6, 2022. In considering whether to approve the Agreement, the Board requested, and the Adviser and Sub-Adviser provided, information that the Board believed to be reasonably necessary to reach its conclusions.
The Board, including the Independent Trustees, evaluated this information along with other information obtained throughout the year and was advised by legal counsel to the Funds and independent legal counsel to the Independent Trustees. In addition, the Independent Trustees considered a past review of their overall process for conducting the annual review of the Funds' advisory arrangements by a consultant retained through their counsel.
The Board considered each Fund's advisory fee, expense ratio and investment performance as significant factors in determining whether the Agreements should be continued. The Board reviewed numbers factors with respect to each Fund, including the services to be provided by the Sub-Adviser. In considering whether the compensation paid to the Adviser was fair and reasonable, the Board also evaluated, among other things, the following factors:
• The requirements of the Funds for the services provided by the Adviser;
• The nature, quality and extent of the services provided and expected to be provided;
• The performance of the Funds as compared to comparable funds;
• The fees payable for the services and whether the fee arrangements provided for economies of scale that would benefit Fund shareholders as the Funds grow (acknowledging that economies of scale can be complex to assess and typically are not directly measurable);
• Whether the fee would be sufficient to enable the Adviser to attract and retain experienced personnel and continue to provide quality services to the Funds;
• The fees paid by other clients of the Adviser whose accounts are managed in a similar investment style and any differences in the services provided to the other clients compared to those provided to the Funds;
• The total expenses of each Fund;
• Management's commitment to operating the Funds at competitive expense levels;
• The profitability of the Adviser (as reflected by comparing fees earned against an estimate of the Adviser's costs) with respect to the Adviser's relationship with the Funds;
• Research and other service benefits received by the Adviser obtained through payment of client commissions for securities transactions;
• Other benefits received by the Adviser, and its affiliates, including revenues paid to the Adviser, or its affiliates, by the Funds for administration and fund accounting services, shareholder services and distribution;
• The capabilities and financial condition of the Adviser;
• Current economic and industry trends; and
• The historical relationship between each Fund and the Adviser.
In considering whether the compensation paid to the Sub-Adviser was fair and reasonable, the Board also evaluated, among other things, the following factors:
• The requirements of the Fund for the services provided by the Sub-Adviser;
• The nature, quality and extent of the services provided and expected to be provided;
84
Victory Portfolios | Supplemental Information — continued December 31, 2022 | ||||||
(Unaudited)
• The fees payable for the services;
• Representations by the Adviser that the sub-advisory fee for the Fund is within the range of fees agreed to in the market for similar services;
• Whether the fee would be sufficient to enable the Sub-Adviser to attract and retain experienced personnel and continue to provide quality services to the Fund;
• Management's commitment to operating the Fund at competitive expense levels;
• Research and other service benefits received by the Sub-Adviser obtained through payment of client commissions for securities transactions;
• Other benefits received by the Sub-Adviser as a result of its sub-advisory relationship with the Fund;
• The capabilities and financial condition of the Sub-Adviser;
• The nature, quality and extent of the oversight and compliance services provided by the Adviser;
• Current economic and industry trends; and
• The historical relationship between the Fund and the Sub-Adviser.
The Board reviewed each Fund's current management fee, comprised of the advisory fee plus the administrative services fee paid to the Adviser, in the context of the Adviser's profitability with respect to each Fund individually. The Board retained an independent, third-party consultant to provide comparative information about fees, expenses and performance, and to design and maintain a database of relevant information designed to assist the Board in retrieving and analyzing comparative information. The Board met with the consultant to review its inputs and methodologies, among other things. The Board compared each Fund's gross management fee and total operating expense ratio on a net and gross basis with the median gross management fee and median expense ratio of a universe of comparable mutual funds compiled by the consultant, and a peer group of funds with similar investment strategies selected by that consultant from the universe of comparable funds. The Board reviewed the factors and methodology used by the consultant in the selection of each Fund's peer group, including the consultant's selection of a broad universe of funds, the more specific universe of comparable funds, and peer groups of funds with comparable investment strategies and asset levels, among other factors. The Board also reviewed any changes to the consultant's methodology as compared to the prior year, including those resulting from the Adviser's input, if any. With respect to certain Funds, the Board also reviewed fees and other information related to the Adviser's management of similarly managed institutional or private accounts, and the differences in the services provided to the other accounts. The Board noted that none of the advisory fee arrangements for the Funds included breakpoints, which would be a structure that results in reduced fees as a fund grows. The Board also considered the Adviser's commitment to limit expenses as discussed in more detail below.
For Funds with total net expense ratios that ranked within the fourth quartile (most expensive) in relation to their peers as evaluated by a consultant, the Board requested, and the Adviser provided, supplemental information about the level of fees and the nature of the services provided. The Adviser reviewed additional relevant circumstances, which included, among other things, specialized strategies, small or decreasing assets, or rapid or recent changes in peer expense ratios.
The Board also reviewed the compliance and administrative services provided to the Funds by the Adviser and its affiliates, including the Adviser's oversight of the Funds' day-to-day operations and oversight of Fund accounting, assistance in meeting legal and regulatory requirements, and other services necessary for the operation of the Funds and the Trust.
With respect to the Global Energy Transition Fund, the Board also considered information concerning the fee paid to the Sub-Adviser under the Sub-Advisory Agreement. The Board considered the relative roles and responsibilities of the Adviser and Sub-Adviser with respect to the Fund and noted that, among other things: (1) the sub-advisory fees for the Fund are paid by the Adviser and, therefore, are not a direct expense of the Fund; and (2) the Adviser supervises the Sub-Adviser. The Board also considered the Adviser's representation that the fees to be paid to the Sub-Adviser are within the range of sub-advisory fees paid to other sub-advisers for similar services. The Board reviewed fees and other information related to the Sub-Adviser's management of similarly managed institutional or private
85
Victory Portfolios | Supplemental Information — continued December 31, 2022 | ||||||
(Unaudited)
accounts, and the differences in the services provided to the other accounts. The Board recognized that because the sub-advisory fees are paid by the Adviser, any arrangement by the Sub-Adviser to either increase or reduce its fee would have no direct impact on the Fund or its shareholders.
The Board found that the gross annual management fee paid by each Fund was within the range of management fees paid by each Fund's respective peer group. The Board also found that each Fund's Class A net annual expense ratio, taking into account any shareholder servicing or distribution fees, was reasonable as compared with each Fund's respective peer group. The Board considered the Adviser's contractual agreement with each Fund to waive its fees and reimburse expenses of certain classes for a specified period of time, as described in the Fund's prospectus.
The Board reviewed each Fund's performance over one-, three-, five- and ten-year periods (as applicable) against the performance of the Fund's selected peer group and benchmark index. The Board recognized that the performance of the Fund and the peer group funds are net of expenses, while the performance of the benchmark index reflects gross returns.
The Board reviewed various other specific factors with respect to each Fund, as described below. In their deliberations, the Trustees did not rank the importance of any particular information or factor considered and each Trustee may have attributed different weights to various factors.
RS Partners Fund:
The Board compared the Fund's Class A performance for the one-, three-, five- and ten-year periods ended June 30, 2022, to that of the median performance of the Fund's peer group and benchmark index for the same periods and considered the fact that the Fund outperformed both the benchmark index and the peer group median for all of the periods reviewed.
Having considered, among other things: (1) the Fund's management fee compared to comparable mutual funds; (2) the Fund's total expense ratio compared to comparable mutual funds; (3) that the Adviser's willingness to limit the expenses of certain classes for a period of time would provide stability to the Fund's expenses for those share classes during that period; and (4) the Fund's performance during the periods reviewed, the Board concluded that the Agreement continued to be in the best interests of the Fund's shareholders.
RS Value Fund:
The Board compared the Fund's Class A performance for the one-, three-, five- and ten-year periods ended June 30, 2022, to that of the median performance of the Fund's peer group and benchmark index for the same periods and considered the fact that the Fund outperformed both the benchmark index and peer group median for the one-, five- and ten-year periods and underperformed both the benchmark index and the peer group median for the three-year period.
Having considered, among other things: (1) the Fund's management fee compared to comparable mutual funds; (2) the Fund's total expense ratio compared to comparable mutual funds; (3) that the Adviser's willingness to limit the expenses of certain classes for a period of time would provide stability to the Fund's expenses for those share classes during that period; and (4) the Fund's performance during the periods reviewed, the Board concluded that the Agreement continued to be in the best interests of the Fund's shareholders.
RS Large Cap Alpha Fund:
The Board compared the Fund's Class A performance for the one-, three-, five- and ten-year periods ended June 30, 2022, to that of the median performance of the Fund's peer group and benchmark index for the same periods and considered the fact that the Fund outperformed both the benchmark index and the peer group median for all of the periods reviewed.
Having considered, among other things: (1) the Fund's management fee compared to comparable mutual funds; (2) the Fund's total expense ratio compared to comparable mutual fund; (3) that the Adviser's willingness to limit the expenses of certain classes for a period of time would provide stability to the Fund's expenses for those share classes during that period; and (4) the Fund's performance
86
Victory Portfolios | Supplemental Information — continued December 31, 2022 | ||||||
(Unaudited)
during the periods reviewed, the Board concluded that the Agreement continued to be in the best interests of the Fund's shareholders.
RS Investors Fund:
The Board compared the Fund's Class A performance for the one-, three-, five- and ten-year periods ended June 30, 2022, to that of the median performance of the Fund's peer group and benchmark index for the same periods and considered the fact that the Fund outperformed both the benchmark index and the peer group median for all of the periods reviewed.
Having considered, among other things: (1) the Fund's management fee compared to comparable mutual funds; (2) the Fund's total expense ratio compared to comparable mutual fund; (3) that the Adviser's willingness to limit the expenses of certain classes for a period of time would provide stability to the Fund's expenses for those share classes during that period; and (4) the Fund's performance during the periods reviewed, the Board concluded that the Agreement continued to be in the best interests of the Fund's shareholders.
Global Energy Transition Fund:
The Board noted that effective May 1, 2021, the Fund changed its principal investment strategy and name. The Board compared the Fund's Class A performance for the one-, three-, five- and ten-year periods ended June 30, 2022, to that of the median performance of the Fund's peer group and benchmark index for the same periods and considered the fact that the Fund outperformed both the benchmark index and the peer group median for the one- and three-year periods, and underperformed both the benchmark index and peer group median for the five- and ten-year periods.
Having considered, among other things: (1) the Fund's management fee compared to comparable mutual funds; (2) the Fund's total expense ratio compared to comparable mutual funds; (3) that the Adviser's willingness to limit the expenses of certain classes for a period of time would provide stability to the Fund's expenses for those share classes during that period; and (4) the Fund's performance during the periods reviewed, the Board concluded that the Agreement continued to be in the best interests of the Fund's shareholders.
Conclusion:
Based on its review of the information requested and provided, and following extended discussions, the Board determined that the Agreement, on behalf of the Funds discussed above, was consistent with the best interests of each Fund and its shareholders, and the Board unanimously approved the Agreement, on behalf of each Fund, for an additional annual period on the basis of the foregoing review and discussions and the following considerations, among others:
• The fairness and reasonableness of the investment advisory fee payable to the Adviser under the Agreement in light of the investment advisory services provided, the costs of these services, the profitability of the Adviser's relationship with the Fund and the comparability of the fee paid to the fees paid by other investment companies;
• The nature, quality and extent of the investment advisory services provided by the Adviser;
• The Adviser's entrepreneurial commitment to the management of the Funds and the creation of a broad-based family of funds, which entails a substantial commitment of the Adviser's resources to the successful operation of the Funds;
• The Adviser's representations regarding its staffing and capabilities to manage the Funds, including the retention of personnel with relevant portfolio management experience;
• The Adviser's efforts to enhance investment results by, among other things, developing and supporting quality portfolio management teams;
• The Adviser's oversight of the Sub-Adviser; and
• The overall high quality of the personnel, operations, financial condition, investment management capabilities, methodologies and performance of the Adviser.
87
Victory Portfolios | Supplemental Information — continued December 31, 2022 | ||||||
(Unaudited)
Based on its review of the information requested and provided, and following extended discussions, the Board concluded, among other things, that the Sub-Advisory Agreement, with respect to the Global Energy Transition Fund, was consistent with the best interests of the Fund and its shareholders and unanimously approved the Sub-Advisory Agreement (including the fees to be charged for services thereunder), on the basis of the foregoing review and discussions and the following considerations, among others:
• The fairness and reasonableness of the investment advisory fee payable to the Sub-Adviser under the Sub-Advisory Agreement in light of the investment advisory services provided, the costs of these services and the estimated profitability of the Sub-Adviser's relationship with the Fund;
• The relative roles and responsibilities of the Adviser and the Sub-Adviser under the Sub-Advisory Agreement;
• The nature, quality and extent of the investment advisory services provided by the portfolio management team of the Sub-Adviser, which have resulted in the Fund achieving its stated investment objective;
• The Sub-Adviser's representations regarding its staffing and capabilities to manage the Fund; and
• The overall high quality of the personnel, operations, financial condition, investment management capabilities, methodologies and performance of the Sub-Adviser.
88
Privacy Policy
Protecting the Privacy of Information
The Trust respects your right to privacy. We also know that you expect us to conduct and process your business in an accurate and efficient manner. To do so, we must collect and maintain certain personal information about you. This is the information we collect from you on applications or other forms, and from the transactions you make with us or third parties. It may include your name, address, social security number, account transactions and balances, and information about investment goals and risk tolerance.
We do not disclose any information about you or about former customers to anyone except as permitted or required by law. Specifically, we may disclose the information we collect to companies that perform services on our behalf, such as the transfer agent that processes shareholder accounts and printers and mailers that assist us in the distribution of investor materials. We may also disclose this information to companies that perform marketing services on our behalf. This allows us to continue to offer you Victory investment products and services that meet your investing needs, and to effect transactions that you request or authorize. These companies will use this information only in connection with the services for which we hired them. They are not permitted to use or share this information for any other purpose.
To protect your personal information internally, we permit access only by authorized employees and maintain physical, electronic, and procedural safeguards to guard your personal information.*
* You may have received communications regarding information about privacy policies from other financial institutions which gave you the opportunity to "opt-out" of certain information sharing with companies which are not affiliated with that financial institution. The Trust does not share information with other companies for purposes of marketing solicitations for products other than the Trust. Therefore, the Trust does not provide opt-out options to their shareholders.
Victory Funds
P.O. Box 182593
Columbus, Ohio 43218-2593

Visit our website at: | Call Victory at: | ||||||
vcm.com | 800-539-FUND (800-539-3863) | ||||||
| 800-235-8396 for Member Class | |||||||
VPRSVF-AR (12/22)

December 31, 2022
Annual Report
Victory RS Small Cap Growth Fund
Victory RS Select Growth Fund
Victory RS Mid Cap Growth Fund
Victory RS Growth Fund
Victory RS Science and Technology Fund
Victory RS Small Cap Equity Fund
vcm.com
News, Information And Education 24 Hours A Day, 7 Days A Week
The Victory Capital website gives fund shareholders, prospective shareholders, and investment professionals a convenient way to access fund information, get guidance, and track fund performance anywhere they can access the Internet. The site includes:
• Detailed performance records
• Daily share prices
• The latest fund news
• Investment resources to help you become a better investor
• A section dedicated to investment professionals
Whether you're a potential investor searching for the fund that matches your investment philosophy, a seasoned investor interested in planning tools, or an investment professional, vcm.com has what you seek. Visit us anytime. We're always open.
Victory Portfolios
TABLE OF CONTENTS
Shareholder Letter (Unaudited) | 3 | ||||||
| Manager's Commentary / Investment Overview (Unaudited) | 5 | ||||||
| Investment Objective and Portfolio Holdings (Unaudited) | 35 | ||||||
Schedules of Portfolio Investments | |||||||
| Victory RS Small Cap Growth Fund | 41 | ||||||
Victory RS Select Growth Fund | 44 | ||||||
Victory RS Mid Cap Growth Fund | 46 | ||||||
Victory RS Growth Fund | 49 | ||||||
Victory RS Science and Technology Fund | 51 | ||||||
Victory RS Small Cap Equity Fund | 55 | ||||||
Financial Statements | |||||||
Statements of Assets and Liabilities | 57 | ||||||
Statements of Operations | 59 | ||||||
Statements of Changes in Net Assets | 61 | ||||||
Financial Highlights | 67 | ||||||
Notes to Financial Statements | 96 | ||||||
| Report of Independent Registered Public Accounting Firm | 107 | ||||||
Supplemental Information (Unaudited) | 108 | ||||||
Trustee and Officer Information | 108 | ||||||
Proxy Voting and Portfolio Holdings Information | 111 | ||||||
Expense Examples | 111 | ||||||
Additional Federal Income Tax Information | 113 | ||||||
Advisory Contract Approval | 114 | ||||||
Privacy Policy (inside back cover) | |||||||
1
IRA DISTRIBUTION WITHHOLDING DISCLOSURE
We generally must withhold federal income tax at a rate of 10% of the taxable portion of your distribution and, if you live in a state that requires state income tax withholding, at your state's tax rate. However, you may elect not to have withholding apply or to have income tax withheld at a higher rate. Any withholding election that you make will apply to any subsequent distribution unless and until you change or revoke the election. If you wish to make a withholding election, or change or revoke a prior withholding election, call 800-539-3863 (800-235-8396 for Member Class) and form W-4P (OMB No. 1545-0074 withholding certificate for pension or annuity payments) will be electronically sent.
If you do not have a withholding election in place by the date of a distribution, federal income tax will be withheld from the taxable portion of your distribution at a rate of 10%. If you must pay estimated taxes, you may be subject to estimated tax penalties if your estimated tax payments are not sufficient and sufficient tax is not withheld from your distribution.
For more specific information, please consult your tax adviser.
The Funds are distributed by Victory Capital Services, Inc. Victory Capital Management Inc. is the investment adviser to the Funds and receives fees from the Funds for performing services for the Funds.
This report is not authorized for distribution to prospective investors unless preceded or accompanied by a current prospectus of the Victory Funds.
For additional information about any Victory Fund, including fees, expenses, and risks, view our prospectus online at vcm.com or call 800-539-3863 (800-235-8396 for Member Class). Read it carefully before you invest or send money.
The information in this report is based on data obtained from recognized services and sources and is believed to be reliable. Any opinions, projections, or recommendations in this report are subject to change without notice and are not intended as individual investment advice. Past investment performance of the Funds, markets or securities mentioned herein should not be considered to be indicative of future results.
• NOT FDIC INSURED • NO BANK GUARANTEE • MAY LOSE VALUE

Call Victory at:
800-539-FUND (800-539-3863)
800-235-8396 for Member Class
Visit our website at:
vcm.com
2
Victory Funds Letter to Shareholders
(Unaudited)
Dear Shareholder,
Our most recent annual reporting period ending December 31, 2022, was filled with epic challenges. Even the most seasoned investors who have been through more than one economic cycle have not witnessed financial markets like this in a long time, if ever.
Consider what transpired and how the investing backdrop changed so abruptly. The year began well enough with ample liquidity and an encouraging outlook for corporate profits. But that optimism faded early and was punctuated by the start of a terrible war in Eastern Europe. This fueled rising energy prices and intensified an inflation problem that was proving to be more than "transitory."
The inflation data was particularly troublesome and surprised many with some of the highest readings since the 1970s. In response, the U.S. Federal Reserve (the "Fed") pivoted to a far more restrictive monetary policy than anyone anticipated. Over the course of 2022, the Fed boosted the Fed funds interest rate on seven different occasions by a total of 4.5 percentage points. And if that wasn't enough, zero-Covid policies in China further exacerbated supply chain issues and dampened the outlook for global growth.
As one might expect, all of these obstacles ratcheted up volatility across financial markets. Broad market stock indices pulled back substantially around the world. The S&P 500® Index, the bell-weather proxy for our domestic stock market, delivered a negative total return of more than 18% for our annual reporting period.
Perhaps what made 2022 even more difficult was the performance of fixed income markets, which normally are considered a safe haven in times of equity turmoil. But not this past year. In fact, the Bloomberg US Aggregate Bond Index—a proxy for a diversified fixed income portfolio and one that many investors and institutions follow closely—delivered a negative total return of approximately 13%, its worst annual performance since the 1970s. That's not exactly the offset to equity performance that many investors were expecting from bonds.
It was a tough year, and we fully acknowledge that the steady drumbeat of bad news and bouts of stomach-churning volatility can take a toll on investors' psyche. Nobody likes opening their account statements during declining markets; and even when markets snap back sharply (as happened this past July and October), investors often wonder if they have missed an opportunity.
Through all of the challenges in our most recent annual reporting period, we are reminded of two enduring realities: 1) financial markets are dynamic and apt to change abruptly; 2) it's vital that we remain calm and rational whenever faced with those inevitable bouts of turmoil.
Fortunately, we think that investors can take comfort knowing that all of our independent investment franchises have experience managing portfolios through a wide variety of market environments. Our investment professionals remain calm during turbulent financial markets, and we think it's imperative that investors do the same.
3
We still believe that a long-term plan, a well-diversified portfolio across asset classes and investment types, and a clear understanding of individual risk tolerances are the key ingredients for staying the course and progressing on investment goals. Moreover, all our investment professionals continually monitor the environment and work hard to position portfolios opportunistically no matter what the markets bring. Remember, turmoil can also create opportunity.
On the following pages you will find information relating to your Victory Funds investment. If you have any questions, we encourage you to contact your financial advisor. If you invest with us directly, you may call 800-539-3863 (800-235-8396 for Member Class) or visit our website at vcm.com.
From all of us here at Victory Capital, thank you for your ongoing confidence and for letting us help you work toward your investment goals.

Christopher K. Dyer, CFA
President,
Victory Funds
4
Victory RS Small Cap Growth Fund
Managers' Commentary
(Unaudited)
What were the market conditions during the reporting period?
Following robust calendar year returns during 2019, 2020, and 2021, the S&P 500® Index registered its seventh worst loss in the last 100 years, down 18.11% in 2022. The index, though, has still provided positive returns in 12 of the past 14 years. This challenging period was driven by a number of factors, including the global impact of COVID-19 and the Russian invasion of Ukraine on corporate fundamentals, an unprecedented reversal in monetary response, global logistical challenges, the highest levels of inflation since the 1980s, and changing consumer behavior. Despite all of this, we have also seen a resilient U.S. economy that continues to have low levels of unemployment and high levels of earnings in the face of adversity. Yet underlying this negative market performance were interesting differences among investment styles and market capitalizations, which we feel have created an opportunity.
While markets were broadly challenged across all styles at the start of the year, the underlying theme for U.S. equity markets for the first six months of the year was that value-oriented stocks with pricing power, such as those within the Energy, Utilities, and Consumer Staples sectors, were the place to allocate, and they materially outperformed growth-oriented secular stocks (defined as stocks that are taking market share from legacy companies, and thus are less sensitive to short-term economic output). Markets bounced back sharply during the summer from what had been a challenging first six months of the year as corporations reported better-than-expected earnings and signs emerged that inflation may have peaked. Growth stocks led the rebound, with the Russell 1000® Growth Index up 12.00% and the Russell 2000® Growth Index (the "Index") up 11.20% in July. But the euphoria was short-lived. Concerns re-emerged in August as investors began to digest how hawkish the U.S. Federal Reserve (the "Fed") really was, given its repeated statements confirming that it would not stop hiking the Fed funds interest rate until inflation was well in check, irrespective of the impact to the economy.
Markets again bounced back in October and November. Value stocks led the way, with the Russell 1000® Value Index up 10.25% in October and 6.25% in November, while the Russell 2000® Value Index was up 12.59% and 3.06% in these months. But once again, the buoyant mood dampened in December as interest rates were projected to be headed even higher; investors and corporate leaders began to loudly question whether Fed Chair Jerome Powell was up to the task of maintaining an economic environment supportive of corporate growth while simultaneously taming inflation. Many pundits suggested that the Fed was possibly making both problems worse.
For the full year, U.S. stock performance was mixed, yet negative across market caps and styles, with value stocks outperforming growth, as measured by the Russell family of indices. In the broader context, however, growth stocks, as measured by the Russell 3000® Growth Index, have maintained their dominance versus value stocks, as measured by the Russell 3000® Value Index, over the past 3, 5, 10, and 15 years. Although we expect this cyclical versus secular, as well as large-cap versus small-cap, tug-of-war to continue, we believe the longer-term outperformance of growth versus value, which has been supported by stronger underlying fundamentals, will come back. Technology-oriented growth companies have excelled and were largely insulated from the economic slowdown that took place the past few years relative to more traditional value companies. Although it appears that growth stocks were perhaps a bit ahead of themselves from a relative valuation standpoint at the
5
Victory RS Small Cap Growth Fund
Managers' Commentary (continued)
depths of the economic slowdown, this is no longer the case, especially as we look at smaller-cap stocks. We believe the recent underperformance of companies that are materially better off over the secular horizon, given their potential to take market share, is an opportunity for investors.
How did Victory RS Small Cap Growth Fund (the "Fund") perform during the reporting period?
The Fund returned -37.07% (Class A at net asset value) for the fiscal year ended December 31, 2022, underperforming the Index, which returned -26.36% for the reporting period.
What strategies did you employ during the reporting period?
The Fund's relative performance was due to underperformance within the Health Care, Industrials, Information Technology, and Consumer Discretionary sectors.
Within the Health Care sector, one of the largest drivers of underperformance was health care facilities holding Surgery Partners, Inc. Surgery Partners, Inc. owns and operates a network of surgical facilities and ancillary services that offer nonemergency surgical procedures in various specialties. The stock was acquired given the large, fragmented, addressable market that could be consolidated as surgical cases moved to outpatient settings, driven by Medicare initiatives to shift volume, while the company has several near- and long-term catalysts to grow, including physician recruitment, expansion programs, and investment in innovative technologies. Despite strong execution, highlighted by top-line and earnings growth that was driven by well-managed labor and supply costs, growth did miss expectation early in the year for what we felt were explainable issues, such as increased vacations and noise from recent acquisitions. The company was subsequently downgraded in mid-June on concerns of the high leverage and potential impact higher interest rates would have on future capital needs. Given the company has $500 million in liquidity and has become free-cash-flow positive in 2022, we believe the market overreacted to these concerns, confirmed in part by a solid quarter to finish the year.
Within the Information Technology sector, the largest driver of underperformance was information technology holding Avaya Holdings Corp ("Avaya"). Avaya is a global business communications company that we initially allocated to following its partnership with RingCentral that provided it with a strong position in the Unified Communications as a Service (UCaaS) space. Avaya collects royalties from its partnership with RingCentral in return for providing RingCentral with access to its large existing client base, resulting in higher margin revenue and long-term growth prospects. Unfortunately, Avaya reported disappointing revenue that was below guidance and EBITDA that was materially less than expected, as strong cloud revenue was offset by lower revenue recognition and the negative impact on the company's Russia and Ukraine exposure. Sales and management turnover gave us pause to underwrite the sustainability of their growth despite the opportunity. As a result, we decided to move on from the position.
Within the Information Technology sector, another detractor was Bandwidth Inc. ("Bandwidth"). Bandwidth is a Communications Platform as a Service (CPaaS) solution focused on communications for enterprises. Some popular applications that use Bandwidth on the market today include Google, Skype, and RingCentral. The software allows businesses
6
Victory RS Small Cap Growth Fund
Managers' Commentary (continued)
to easily enhance their products and services with advanced text and voice capabilities, providing enterprises with end-to-end communications. We owned shares of Bandwidth given its large and growing market that we felt was still in the early days, as well as its best-in-class nationwide all-IP network, which provides a unique competitive moat in the communications platform market. The stock was challenged at the start the year, as the company's customers failed to return at the volume expected following a Distributed Denial-of-Service (DDOS) attack at the end of 2021, with some larger customers also renegotiating terms. While the company was transparent about the issues, our view that they were primed for clean growth going forward at a bargain price following a challenging 2021 appears to have been optimistic. As a result, we decided to move on from the holding.
One contributor to performance within the Technology sector was holding MACOM Technology Solutions Holdings, Inc. ("MACOM"). MACOM designs and manufactures analog semiconductor solutions for use in wireless and wireline applications across the radio frequency, microwave, millimeter wave, and lightwave spectrum. We initially purchased the stock given their leading technology in high-performance analog and compound semiconductors and completion of their business turnaround as they restructured the company to focus on growth opportunities. The stock performed well during the year, with steady beat-and-raises highlighted by revenues that were up double digits year-over-year and ahead of expectations, driven primarily by their execution within industrial and defense and wider gross margins. Going forward, we believe the company is further supported by the Creating Helpful Incentives to Produce Semiconductors (CHIPS) Act that will "make transformative investments to restore and advance our Nation's leadership in the research, development, and manufacturing of semiconductors," given the company owns their own domestic fabrication and has strong government agency relationships.
The largest driver of relative outperformance within the Materials sector was building materials holding AAON, Inc. AAON, Inc. engages in the engineering, manufacturing, marketing, and sale of air conditioning and heating equipment. We initially purchased the stock given the strong secular trends for the industry that include increased demand for high-performance air quality and energy efficiency, as well as the company's investments in new products that have been in high demand given improved manufacturing efficiency. Operationally, the company has performed well, and sales have been strong since they realigned sales channels with an all-independent sales force. The stock outperformed as earnings and revenue materially exceeded estimates on wider gross profit margins, while the company reported a record backlog, up more than 180% from a year ago on outsized demand for their products.
A top performer within the Energy sector was crude producers holding Ranger Oil Corp. Ranger Oil Corp., rebranded from Penn Virginia Corporation, is an independent oil & gas production company. We initially purchased the stock given its high-quality pure play on the Eagle Ford basin, which is a very strong asset base that we believe is insulated from risks of federal leasing/permitting issues given that all operations are located on private land in Texas. The company has significant resource potential and strong free-cash-flow generation, has made capital efficiency improvements, and has an experienced management team. The stock performed well, driven by strong execution ahead of plan. The company exceeded expectations in the most recent quarter and raised the guidance for the year on lower capital expenditures while generating record free cash flow. As a result, they are initiating a
7
Victory RS Small Cap Growth Fund
Managers' Commentary (continued)
first-ever dividend, executing a $100 million buyback, and they announced mergers and acquisitions that will add three locations to their Eagle Ford position and enhance their depth of inventory, bolstering their position and diluting the "inventory duration" question while adding accretion to earnings.
Given the renewed concerns over forward economic growth given tighter monetary policy in the face of elevated inflation and sluggish growth, along with the continued global impact of COVID-19 and the Russian invasion of Ukraine on corporate fundamentals, we believe there is continued uncertainty among investors that is likely to cause continued periods of elevated volatility (both to the upside and downside) and divergence as new companies emerge, while others struggle to retain their previous leadership. We feel this will create an abundance of opportunities across sectors, industries, and markets in coming quarters and years as the economy and markets transition and recover.
We do not have a clear view or projection as to how large or prolonged any impact will be given the uncertainty regarding the continued unfolding of events abroad and the resulting economic impact, politicization, and potential scale of incremental or contractionary fiscal and monetary stimulus, but we do believe there are clear pockets of the economy that remain better positioned than others to adjust to any future state given the ability of their workers to remain productive and end-customer demand to remain steady irrespective of the forward economic environment.
Within the growth universe, the current opportunity set appears especially pronounced for secular growth companies, rather than those more cyclical in nature, given the continued strength in underlying fundamentals and relative underperformance by secular growth companies since early November 2020, when market leadership abruptly shifted from companies with better long-term sustainable growth opportunities to areas that had been more challenged by COVID-19 or that could benefit from inflationary pressures experienced over the past year. As a result, we believe we can now allocate to companies with clearer paths of outsized growth with much improved relative valuations as compared to almost any other period of the last 10+ years.
8
Victory RS Small Cap Growth Fund
Investment Overview
(Unaudited)
Average Annual Total Return
Year Ended December 31, 2022
Class A | Class C | Class R | Class R6 | Class Y | |||||||||||||||||||||||||||||||
INCEPTION DATE | 11/30/87 | 9/6/07 | 1/22/07 | 7/12/17 | 5/1/07 | ||||||||||||||||||||||||||||||
| Net Asset Value | Maximum Offering Price | Net Asset Value | Contingent Deferred Charges | Net Asset Value | Net Asset Value | Net Asset Value | Russell 2000® Growth Index1 | ||||||||||||||||||||||||||||
One Year | –37.07 | % | –40.69 | % | –37.55 | % | –38.13 | % | –37.35 | % | –36.86 | % | –36.90 | % | –26.36 | % | |||||||||||||||||||
Five Year | –0.64 | % | –1.81 | % | –1.39 | % | –1.39 | % | –1.11 | % | –0.29 | % | –0.37 | % | 3.51 | % | |||||||||||||||||||
Ten Year | 8.12 | % | 7.49 | % | 7.45 | % | 7.45 | % | 7.65 | % | N/A | 8.42 | % | 9.20 | % | ||||||||||||||||||||
Since Inception | N/A | N/A | N/A | N/A | N/A | 2.51 | % | N/A | N/A | ||||||||||||||||||||||||||
The performance data quoted represents past performance and current returns may be lower or higher. The investment return and principal value will fluctuate so that an investor's shares, when redeemed, may be worth more or less than the original cost. To obtain performance information current to the most recent month's end, please visit vcm.com.
The maximum offering price figures reflect a maximum sales charge of 5.75% for Class A. Class C is not subject to an initial sales charge, but is subject to a deferred sales charge of 1.00% on shares redeemed within one year of purchase. Net Asset Value does not reflect sales charges. Total return measures the price change in a share assuming the reinvestment of all net investment income and realized capital gain distributions, if any. The total returns quoted do not reflect adjustments made to the enclosed financial statements in accordance with U.S. Generally Accepted Accounting Principles or the deduction of taxes that a shareholder would pay on net investment income and realized capital gain distributions, including reinvested distributions, or redemptions of shares. The total return figures set forth above include all waivers of fees. Without such fee waivers, the total returns would have been lower.
Victory RS Small Cap Growth Fund — Growth of $10,000

1The Russell 2000® Growth Index is an unmanaged market-capitalization-weighted index that measures the performance of those companies in the Russell 2000® Index with higher price-to-book ratios and higher forecasted growth values. Index results assume the reinvestment of dividends paid on the stocks constituting the index. This index does not include the effect of sales charges, commissions, expenses, or taxes, is not representative of the Fund, and it is not possible to invest directly in an index.
The graph reflects investment of growth of a hypothetical $10,000 investment in the Fund.
The graph and table do not reflect the deduction of taxes that a shareholder would pay on Fund distributions or the redemption of shares.
Past performance is not indicative of future results.
9
Victory RS Select Growth Fund
Managers' Commentary
(Unaudited)
What were the market conditions during the reporting period?
Following robust calendar year returns during 2019, 2020, and 2021, the S&P 500® Index registered its seventh worst loss in the last 100 years, down 18.11% in 2022. The index, though, has still provided positive returns in 12 of the past 14 years. This challenging period was driven by a number of factors, including the global impact of COVID-19 and the Russian invasion of Ukraine on corporate fundamentals, an unprecedented reversal in monetary response, global logistical challenges, the highest levels of inflation since the 1980s, and changing consumer behavior. Despite all of this, we have also seen a resilient U.S. economy that continues to have low levels of unemployment and high levels of earnings in the face of adversity. Yet underlying this negative market performance were interesting differences among investment styles and market capitalizations, which we feel have created an opportunity.
While markets were broadly challenged across all styles at the start of the year, the underlying theme for U.S. equity markets for the first six months of the year was that value-oriented stocks with pricing power, such as those within the Energy, Utilities, and Consumer Staples sectors, were the place to allocate, and they materially outperformed growth-oriented secular stocks (defined as stocks that are taking market share from legacy companies, and thus are less sensitive to short-term economic output). Markets bounced back sharply during the summer from what had been a challenging first six months of the year as corporations reported better-than-expected earnings and signs emerged that inflation may have peaked. Growth stocks led the rebound, with the Russell 1000® Growth Index up 12.00% and the Russell 2000® Growth Index up 11.20% in July. But the euphoria was short-lived. Concerns re-emerged in August as investors began to digest how hawkish the U.S. Federal Reserve (the "Fed") really was, given its repeated statements confirming that it would not stop hiking the Fed funds interest rate until inflation was well in check, irrespective of the impact to the economy.
Markets again bounced back in October and November. Value stocks led the way, with the Russell 1000® Value Index up 10.25% in October and 6.25% in November, while the Russell 2000® Value Index was up 12.59% and 3.06% in these months. But once again, the buoyant mood dampened in December as interest rates were projected to be headed even higher; investors and corporate leaders began to loudly question whether Fed Chair Jerome Powell was up to the task of maintaining an economic environment supportive of corporate growth while simultaneously taming inflation. Many pundits suggested that the Fed was possibly making both problems worse.
For the full year, U.S. stock performance was mixed, yet negative across market caps and styles, with value stocks outperforming growth, as measured by the Russell family of indices. In the broader context, however, growth stocks, as measured by the Russell 3000® Growth Index, have maintained their dominance versus value stocks, as measured by the Russell 3000® Value Index, over the past 3, 5, 10, and 15 years. Although we expect this cyclical versus secular, as well as large-cap versus small-cap, tug-of-war to continue, we believe the longer-term outperformance of growth versus value, which has been supported by stronger underlying fundamentals, will come back. Technology-oriented growth companies have excelled and were largely insulated from the economic slowdown that took place the past few years relative to more traditional value companies. Although it appears that growth stocks were perhaps a bit ahead of themselves from a relative valuation standpoint at the
10
Victory RS Select Growth Fund
Managers' Commentary (continued)
depths of the economic slowdown, this is no longer the case, especially as we look at smaller-cap stocks. We believe the recent underperformance of companies that are materially better off over the secular horizon, given their potential to take market share, is an opportunity for investors.
How did Victory RS Select Growth Fund (the "Fund") perform during the reporting period?
The Fund returned -32.43% (Class A at net asset value) for the fiscal year ended December 31, 2022, underperforming the Russell 2500TM Growth Index, which returned -26.21% for the reporting period.
What strategies did you employ during the reporting period?
The Fund's relative underperformance was driven by stock selection within the Financial Services and Industrials sectors. Stock selection in the Health Care and Energy sectors offset a portion of the Fund's underperformance.
Within the Technology sector, the largest driver of underperformance was information technology holding Avaya Holdings Corp ("Avaya"). Avaya is a global business communications company that we initially allocated to following its partnership with RingCentral that provided it with a strong position in the Unified Communications as a Service (UCaaS) space. Avaya collects royalties from its partnership with RingCentral in return for providing RingCentral with access to its large existing client base, resulting in higher margin revenue and long-term growth prospects. Unfortunately, Avaya reported disappointing revenue that was below guidance and EBITDA that was materially less than expected, as strong cloud revenue was offset by lower revenue recognition and the negative impact on the company's Russia and Ukraine exposure. Sales and management turnover gave us pause to underwrite the sustainability of their growth despite the opportunity. As a result, we decided to move on from the position.
Within the Information Technology sector, another detractor was Bandwidth Inc. ("Bandwith"). Bandwidth is a Communications Platform as a Service (CPaaS) solution focused on communications for enterprises. Some popular applications that use Bandwidth on the market today include Google, Skype, and RingCentral. The software allows businesses to easily enhance their products and services with advanced text and voice capabilities, providing enterprises with end-to-end communications. We owned shares of Bandwidth given its large and growing market that we felt was still in the early days, as well as its best-in-class nationwide all-IP network, which provides a unique competitive moat in the communications platform market. The stock was challenged at the start the year, as the company's customers failed to return at the volume expected following a Distributed Denial-of-Service (DDOS) attack at the end of 2021, with some larger customers also renegotiating terms. While Bandwidth remains a key input into the cloudification of communications, we moved on from the position given their poor execution and attacks that resulted in an inability to capture the opportunity to which we believed they had access
Within the Financial Services sector, another driver of underperformance was consumer finance and credit services holding Payoneer Global, Inc. ("Payoneer"). Payoneer simplifies the process for businesses to pay and get paid globally with their global payments/commerce platform that provides services to both sides of a two-sided commerce network. We initially purchased shares of Payoneer given the growth in their digital marketplace given the
11
Victory RS Select Growth Fund
Managers' Commentary (continued)
convenience they provide consumers, as well as the expanded customer base they offer to merchants. We had the view that estimates for the company are too low given the large float they hold on behalf of customers that can now earn a material interest in the higher interest rate environment. The stock underwhelmed in the calendar year, despite strong execution driven by the company's growth and increased penetration of the company's offerings, due to a higher-than-expected ramp in forecasted expenses in 2023 and overall sentiment for the payments category.
Within the Energy sector, the largest driver of relative outperformance was non-renewable energy holding Diamondback Energy, Inc. ("Diamondback"), an independent oil and natural gas company focused on the acquisition, development, exploration, and exploitation of unconventional onshore oil and natural gas reserves in the Permian Basin in West Texas. We initially purchased shares of Diamondback given our view that the stock was materially undervalued given its market leadership as a best-in-class operator in the Permian Basin, proven ability to grow via acquisition, strong cash flow, and priority to generate cash returns vs. growth. Despite some angst due to weather and service cost inflation, Diamondback solidly beat expectations and raised guidance by exceeding production targets with lower capital expenditure, while remaining committed to the capital return plan which has been underway for several quarters.
Within the Health Care sector, a contributor to performance was pharmaceuticals and biotechnology company Halozyme Therapeutics, Inc. ("Halozyme"). Halozyme is a biotechnology company that has developed a proprietary recombinant enzyme-based therapeutic product (called Hylenex) and an enzyme-based, patent-protected formulation technology platform called Enhanze, which temporarily degrades hyaluronan in the skin to allow for larger molecules to pass through, enabling IV drugs to be delivered in a subcutaneous injection (a shot into the fatty tissues just beneath the skin for medications that must be absorbed into the bloodstream slowly and steadily). We purchased the stock given it is a lower risk biotechnology play given the broader environment as it is a proven technology, the drug is on trend as BioPharma has shifted away from small-molecule-based approaches and toward antibody-based approaches, and there is no competition for their core products. The stock performed well in the calendar year as revenues increased 80% year-over-year, driven by strong royalty payments and product sales following the acquisition of Antares Pharma in May, while forward partnerships with five partners using their Enhanze technology appear on track.
Within the Technology sector, a contributor to performance was computer services software and systems holding Paylocity Holding Corp. ("Paylocity"). Paylocity is a cloud-based provider of payroll and human capital management (HCM) software solutions, including its flagship payroll along with core HR, performance management, time and attendance, and benefits management modules. We initially purchased the stock given the large addressable market and the ability of Paylocity to focus on smaller businesses where larger vendors are not involved. We view the increasing complexity of the regulatory environment as a tailwind, while employment trends have remained stable despite broader economic issues. The stock performed relatively well in the calendar year, with strong revenue and earnings results as well as guidance well ahead of expectations, driven by a healthy demand environment and a product that has resonated with customers.
12
Victory RS Select Growth Fund
Managers' Commentary (continued)
Given the renewed concerns over forward economic growth given tighter monetary policy in the face of elevated inflation and sluggish growth, along with the continued global impact of COVID-19 and the Russian invasion of Ukraine on corporate fundamentals, we believe there is continued uncertainty among investors that is likely to cause continued periods of elevated volatility (both to the upside and downside) and divergence as new companies emerge, while others struggle to retain their previous leadership. We feel this will create an abundance of opportunities across sectors, industries, and markets in coming quarters and years as the economy and markets transition and recover.
We do not have a clear view or projection as to how large or prolonged any impact will be given the uncertainty regarding the continued unfoldment of events abroad and the resulting economic impact, politicization, and potential scale of incremental or contractionary fiscal and monetary stimulus, but we do believe there are clear pockets of the economy that remain better positioned than others to adjust to any future state given the ability of their workers to remain productive and end-customer demand to remain steady irrespective of the forward economic environment.
Within the growth universe, the current opportunity set appears especially pronounced for secular growth companies, rather than those more cyclical in nature, given the continued strength in underlying fundamentals and relative underperformance by secular growth companies since early November 2020, when market leadership abruptly shifted from companies with better long-term sustainable growth opportunities to areas that had been more challenged by COVID-19 or that could benefit from inflationary pressures experienced over the past year. As a result, we believe we can now allocate to companies with clearer paths of outsized growth with much improved relative valuations as compared to almost any other period of the last 10+ years.
13
Victory RS Select Growth Fund
Investment Overview
(Unaudited)
Average Annual Total Return
Year Ended December 31, 2022
Class A | Class C | Class R | Class R6 | Class Y | |||||||||||||||||||||||||||||||||||
INCEPTION DATE | 8/1/96 | 11/15/07 | 2/12/07 | 11/15/16 | 5/1/09 | ||||||||||||||||||||||||||||||||||
| Net Asset Value | Maximum Offering Price | Net Asset Value | Contingent Deferred Charges | Net Asset Value | Net Asset Value | Net Asset Value | Russell 2500TM Growth Index1 | Russell 2000® Growth Index2 | |||||||||||||||||||||||||||||||
One Year | –32.43 | % | –36.32 | % | –32.94 | % | –33.34 | % | –32.77 | % | –32.21 | % | –32.27 | % | –26.21 | % | –26.36 | % | |||||||||||||||||||||
Five Year | 3.38 | % | 2.16 | % | 2.57 | % | 2.57 | % | 2.85 | % | 3.72 | % | 3.64 | % | 5.97 | % | 3.51 | % | |||||||||||||||||||||
Ten Year | 7.45 | % | 6.81 | % | 6.78 | % | 6.78 | % | 6.91 | % | N/A | 7.73 | % | 10.62 | % | 9.20 | % | ||||||||||||||||||||||
| Since Inception | N/A | N/A | N/A | N/A | N/A | 6.14 | % | N/A | N/A | N/A | |||||||||||||||||||||||||||||
The performance data quoted represents past performance and current returns may be lower or higher. The investment return and principal value will fluctuate so that an investor's shares, when redeemed, may be worth more or less than the original cost. To obtain performance information current to the most recent month's end, please visit vcm.com.
The maximum offering price figures reflect a maximum sales charge of 5.75% for Class A. Class C is not subject to an initial sales charge, but is subject to a deferred sales charge of 1.00% on shares redeemed within one year of purchase. Net Asset Value does not reflect sales charges. Total return measures the price change in a share assuming the reinvestment of all net investment income and realized capital gain distributions, if any. The total returns quoted do not reflect adjustments made to the enclosed financial statements in accordance with U.S. Generally Accepted Accounting Principles or the deduction of taxes that a shareholder would pay on net investment income and realized capital gain distributions, including reinvested distributions, or redemptions of shares. The total return figures set forth above include all waivers of fees. Without such fee waivers, the total returns would have been lower.
Victory RS Select Growth Fund — Growth of $10,000

1The Russell 2500TM Growth Index is an unmanaged market capitalization-weighted index that measures the performance of those companies in the Russell 2500TM Index with a higher price-to-book ratios and higher forecasted growth values. (The Russell 2500TM Index measures the performance of the 2,500 smallest companies in the Russell 3000® Index, which consists of the 3,000 largest U.S. companies based on total market capitalization.) Index results assume the reinvestment of dividends paid on the stocks constituting the index. This index does not include the effect of sales charges, commissions, expenses, or taxes, is not representative of the Fund, and it is not possible to invest directly in an index.
2The Russell 2000® Growth Index is an unmanaged market-capitalization-weighted index that measures the performance of those companies in the Russell 2000® Index with higher price-to-book ratios and higher forecasted growth values. Index results assume the reinvestment of dividends paid on the stocks constituting the index. This index does not include the effect of sales charges, commissions, expenses, or taxes, is not representative of the Fund, and it is not possible to invest directly in an index.
The graph reflects investment of growth of a hypothetical $10,000 investment in the Fund.
The graph and table do not reflect the deduction of taxes that a shareholder would pay on Fund distributions or the redemption of shares.
Past performance is not indicative of future results.
14
Victory RS Mid Cap Growth Fund
Managers' Commentary
(Unaudited)
What were the market conditions during the reporting period?
Following robust calendar year returns during 2019, 2020, and 2021, the S&P 500® Index registered its seventh worst loss in the last 100 years, down 18.11% in 2022. The index, though, has still provided positive returns in 12 of the past 14 years. This challenging period was driven by a number of factors, including the global impact of COVID-19 and the Russian invasion of Ukraine on corporate fundamentals, an unprecedented reversal in monetary response, global logistical challenges, the highest levels of inflation since the 1980s, and changing consumer behavior. Despite all of this, we have also seen a resilient U.S. economy that continues to have low levels of unemployment and high levels of earnings in the face of adversity. Yet underlying this negative market performance were interesting differences among investment styles and market capitalizations, which we feel have created an opportunity.
While markets were broadly challenged across all styles at the start of the year, the underlying theme for U.S. equity markets for the first six months of the year was that value-oriented stocks with pricing power, such as those within the Energy, Utilities, and Consumer Staples sectors, were the place to allocate, and they materially outperformed growth-oriented secular stocks (defined as stocks that are taking market share from legacy companies, and thus are less sensitive to short-term economic output). Markets bounced back sharply during the summer from what had been a challenging first six months of the year as corporations reported better-than-expected earnings and signs emerged that inflation may have peaked. Growth stocks led the rebound, with the Russell 1000® Growth Index up 12.00% and the Russell 2000® Growth Index up 11.20% in July. But the euphoria was short-lived. Concerns re-emerged in August as investors began to digest how hawkish the U.S. Federal Reserve (the "Fed") really was, given its repeated statements confirming that it would not stop hiking the Fed funds interest rate until inflation was well in check, irrespective of the impact to the economy.
Markets again bounced back in October and November. Value stocks led the way, with the Russell 1000® Value Index up 10.25% in October and 6.25% in November, while the Russell 2000® Value Index was up 12.59% and 3.06% in these months. But once again, the buoyant mood dampened in December as interest rates were projected to be headed even higher; investors and corporate leaders began to loudly question whether Fed Chair Jerome Powell was up to the task of maintaining an economic environment supportive of corporate growth while simultaneously taming inflation. Many pundits suggested that the Fed was possibly making both problems worse.
For the full year, U.S. stock performance was mixed, yet negative across market caps and styles, with value stocks outperforming growth, as measured by the Russell family of indices. In the broader context, however, growth stocks, as measured by the Russell 3000® Growth Index, have maintained their dominance versus value stocks, as measured by the Russell 3000® Value Index, over the past 3, 5, 10, and 15 years. Although we expect this cyclical versus secular, as well as large-cap versus small-cap, tug-of-war to continue, we believe the longer-term outperformance of growth versus value, which has been supported by stronger underlying fundamentals, will come back. Technology-oriented growth companies have excelled and were largely insulated from the economic slowdown that took place the past few years relative to more traditional value companies. Although it appears that growth stocks were perhaps a bit ahead of themselves from a relative valuation standpoint at the
15
Victory RS Mid Cap Growth Fund
Managers' Commentary (continued)
depths of the economic slowdown, this is no longer the case, especially as we look at smaller-cap stocks. We believe the recent underperformance of companies that are materially better off over the secular horizon, given their potential to take market share, is an opportunity for investors.
How did Victory RS Mid Cap Growth Fund (the "Fund") perform during the reporting period?
The Fund returned -34.68% (Class A at net asset value) for the fiscal year ended December 31, 2022, underperforming the Russell Midcap® Growth Index, which returned -26.72% for the reporting period.
What strategies did you employ during the reporting period?
The Fund's relative underperformance was driven by stock selection within the Technology, Industrials, and Health Care sectors, while stock selection in Consumer Discretionary offset a portion of the Fund's negative relative performance.
Within the Information Technology sector, the largest detractor was RingCentral, Inc. ("RingCentral"), a provider of software-as-a-service solutions for businesses to support modern communications. We initially purchased the stock in early 2014 given the thesis that RingCentral operates in a huge approximately $50 billion global market (with approximately $15 billion in the United States alone) that was only 10% penetrated by cloud offerings. The company has executed very well due to their industry-leading technology driven by a large research and development budget which, combined with aggressive marketing, has allowed the company to take market share. In late 2019, RingCentral announced a commercial agreement with Avaya Holdings Corp. ("Avaya"), a global leader in communications, whereby RingCentral gained access to Avaya's installed base of 100 million customers in exchange for a new RingCentral product on Avaya's Cloud Office. Despite strong growth in the calendar year, highlighted by revenue acceleration at the start of the year, the stock underwhelmed as investors viewed competition as picking up, which has elicited fear that the company will not be able to grow or price as well as it has in the past, especially in a slowing economy.
Within the Consumer Discretionary sector, a driver of relative underperformance was leisure holding YETI Holdings, Inc., a company that designs, markets, and distributes products for the outdoor and recreation market. We initially purchased the stock given their ability to expand product categories in their five "tentpole" categories: coolers, drinkware, cargo/storage, bags, and outdoor. The company has benefited immensely from their distribution shift from wholesale to direct-to-consumer given the strength of their brand, which has resulted in more control as well as wider margins. The company reported solid results to start the year, with sales and earnings ahead of consensus, but the stock struggled throughout the year given concerns that consumer spending on goods would slow due to the roll-off of stimulus and a shift to services from goods. Given additional concerns that their earlier move to the higher-margin direct-to-consumer channel was shifting back toward wholesale distribution, we decided to move on from the name.
Within the Health Care sector, a driver of relative underperformance was medical component provider West Pharmaceutical Services, Inc. ("West Pharmaceutical"), a global leader in the manufacture of components used for injectable drug packaging and delivery systems. We initially purchased West Pharmaceutical given its pure-play exposure in the niche market
16
Victory RS Mid Cap Growth Fund
Managers' Commentary (continued)
for injectable drug packaging components that has created a significant barrier to entry. Its pharmaceutical systems segment has over 70% market share in pharma and 95% in biotech, and its products are baked into the FDA label. The stock underwhelmed in the period despite strong execution early in the year that led to earnings that exceeded expectations, coupled with a guidance increase. While the selloff was tied largely to a lack of news, the poor sentiment for diagnostics within health care led us to reduce our exposure to the industry.
Within the Financial Services sector, the largest contributor to outperformance was diversified financial services holding LPL Financial Holdings, Inc. ("LPL"), an integrated platform of brokerage and investment advisory services to independent financial advisors and financial advisors at financial institutions. Over the years, LPL Financial has grown its business and organization both organically and through several acquisitions of other financial advisory firms. We initially purchased the stock given its positioning as a pure-play advisor, unconflicted with product manufacturing or distribution, which has reduced the business model cyclicality given the shift to advisory and away from brokerage. The stock performed well in the most recent calendar year given strong execution and an upbeat outlook, despite lower revenue given lower equity markets as cash balances and service fees offset higher expenses.
Within the Health Care sector, the largest driver of relative outperformance was biotechnology holding Jazz Pharmaceuticals PLC, a global biopharmaceutical company dedicated to developing and commercializing life-changing medicines. We initially purchased the stock given the strength of Xywav, an alternative to their $1.6 billion drug Xyrem that faces genericization in the beginning of 2023. We believe The Street's concerns on Xyrem revenue reliance were unfounded, as the switch to Xywav is well underway and will drive franchise revenue longevity given the new formulation's lower-sodium benefit to patients. In addition, we believe recent acquisitions will accelerate revenue diversification and growth prospects. The stock performed well, driven by long-term guidance on strong conversion of Xyrem to Xywav and by short-term guidance that exceeded expectations, easing concerns that there would be earnings contractions before growth resumed.
Within the Energy sector, the largest contributor to outperformance was non-renewable energy holding Matador Resources Co. ("Matador"). Matador engages in the exploration, development, production, and acquisition of oil and natural gas resources. We purchased the stock given it is a high-quality pure-play energy and producer play in the Delaware Basin, with more than 220,000 gross acres of proven reserves, strong production growth, best-in-class return on average capital employed, and capital efficiency improvements. The stock performed very well toward year-end, beating production estimates and earnings materially despite reduced capex, fulfilling investor desires for "best of all worlds" possibilities. The company also surprised to the upside on their production guide, making Matador the fastest growing producer of 2022 due to the quality of rock, rather than unnecessary aggressiveness.
Given the renewed concerns over forward economic growth given tighter monetary policy in the face of elevated inflation and sluggish growth, along with the continued global impact of COVID-19 and the Russian invasion of Ukraine on corporate fundamentals, we believe there is continued uncertainty among investors that is likely to cause continued periods of elevated volatility (both to the upside and downside) and divergence as new companies emerge, while others struggle to retain their previous leadership. We feel this will create an
17
Victory RS Mid Cap Growth Fund
Managers' Commentary (continued)
abundance of opportunities across sectors, industries, and markets in coming quarters and years as the economy and markets transition and recover.
We do not have a clear view or projection as to how large or prolonged any impact will be given the uncertainty regarding the continued unfoldment of events abroad and the resulting economic impact, politicization, and potential scale of incremental or contractionary fiscal and monetary stimulus, but we do believe there are clear pockets of the economy that remain better positioned than others to adjust to any future state given the ability of their workers to remain productive and end-customer demand to remain steady irrespective of the forward economic environment.
Within the growth universe, the current opportunity set appears especially pronounced for secular growth companies, rather than those more cyclical in nature, given the continued strength in underlying fundamentals and relative underperformance by secular growth companies since early November 2020, when market leadership abruptly shifted from companies with better long-term sustainable growth opportunities to areas that had been more challenged by COVID-19 or that could benefit from inflationary pressures experienced over the past year. As a result, we believe we can now allocate to companies with clearer paths of outsized growth with much improved relative valuations as compared to almost any other period of the last 10+ years.
18
Victory RS Mid Cap Growth Fund
Investment Overview
(Unaudited)
Average Annual Total Return
Year Ended December 31, 2022
Class A | Class C | Class R | Class R6 | Class Y | Member Class | ||||||||||||||||||||||||||||||||||
INCEPTION DATE | 7/12/95 | 5/21/07 | 12/4/06 | 11/15/16 | 5/1/07 | 11/2/20 | |||||||||||||||||||||||||||||||||
| Net Asset Value | Maximum Offering Price | Net Asset Value | Contingent Deferred Charges | Net Asset Value | Net Asset Value | Net Asset Value | Net Asset Value | Russell Midcap® Growth Index1 | |||||||||||||||||||||||||||||||
One Year | –34.68 | % | –38.43 | % | –35.24 | % | –35.86 | % | –35.06 | % | –34.49 | % | –34.53 | % | –34.61 | % | –26.72 | % | |||||||||||||||||||||
Five Year | 1.75 | % | 0.56 | % | 0.84 | % | 0.84 | % | 1.15 | % | 2.02 | % | 2.00 | % | N/A | 7.64 | % | ||||||||||||||||||||||
Ten Year | 7.96 | % | 7.32 | % | 7.20 | % | 7.20 | % | 7.37 | % | N/A | 8.23 | % | N/A | 11.41 | % | |||||||||||||||||||||||
| Since Inception | N/A | N/A | N/A | N/A | N/A | 5.37 | % | N/A | –9.35 | % | N/A | ||||||||||||||||||||||||||||
The performance data quoted represents past performance and current returns may be lower or higher. The investment return and principal value will fluctuate so that an investor's shares, when redeemed, may be worth more or less than the original cost. To obtain performance information current to the most recent month's end, please visit vcm.com.
The maximum offering price figures reflect a maximum sales charge of 5.75% for Class A. Class C is not subject to an initial sales charge, but is subject to a deferred sales charge of 1.00% on shares redeemed within one year of purchase. Net Asset Value does not reflect sales charges. Total return measures the price change in a share assuming the reinvestment of all net investment income and realized capital gain distributions, if any. The total returns quoted do not reflect adjustments made to the enclosed financial statements in accordance with U.S. Generally Accepted Accounting Principles or the deduction of taxes that a shareholder would pay on net investment income and realized capital gain distributions, including reinvested distributions, or redemptions of shares. The total return figures set forth above include all waivers of fees. Without such fee waivers, the total returns would have been lower.
Victory RS Mid Cap Growth Fund — Growth of $10,000
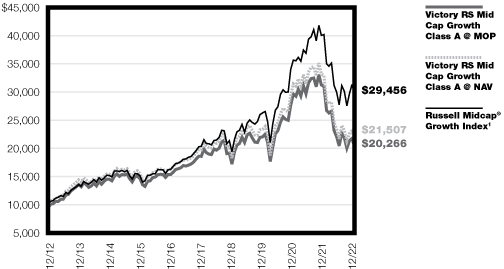
1The Russell Midcap® Growth Index is an unmanaged market capitalization-weighted index that measures the performance of those companies in the Russell Midcap® Index with higher price-to-book ratios and higher forecasted growth values. Index results assume the reinvestment of dividends paid on the stocks constituting the index. This index does not include the effect of sales charges, commissions, expenses, or taxes, is not representative of the Fund, and it is not possible to invest directly in an index.
The graph reflects investment of growth of a hypothetical $10,000 investment in the Fund.
The graph and table do not reflect the deduction of taxes that a shareholder would pay on Fund distributions or the redemption of shares.
Past performance is not indicative of future results.
19
Victory RS Growth Fund
Managers' Commentary
(Unaudited)
What were the market conditions during the reporting period?
Following robust calendar year returns during 2019, 2020, and 2021, the S&P 500® Index registered its seventh worst loss in the last 100 years, down 18.11% in 2022. The index, though, has still provided positive returns in 12 of the past 14 years. This challenging period was driven by a number of factors, including the global impact of COVID-19 and the Russian invasion of Ukraine on corporate fundamentals, an unprecedented reversal in monetary response, global logistical challenges, the highest levels of inflation since the 1980s, and changing consumer behavior. Despite all of this, we have also seen a resilient U.S. economy that continues to have low levels of unemployment and high levels of earnings in the face of adversity. Yet underlying this negative market performance were interesting differences among investment styles and market capitalizations, which we feel have created an opportunity.
While markets were broadly challenged across all styles at the start of the year, the underlying theme for U.S. equity markets for the first six months of the year was that value-oriented stocks with pricing power, such as those within the Energy, Utilities, and Consumer Staples sectors, were the place to allocate, and they materially outperformed growth-oriented secular stocks (defined as stocks that are taking market share from legacy companies, and thus are less sensitive to short-term economic output). Markets bounced back sharply during the summer from what had been a challenging first six months of the year as corporations reported better-than-expected earnings and signs emerged that inflation may have peaked. Growth stocks led the rebound, with the Russell 1000® Growth Index (the "Index") up 12.00% and the Russell 2000® Growth Index up 11.20% in July. But the euphoria was short-lived. Concerns re-emerged in August as investors began to digest how hawkish the U.S. Federal Reserve (the "Fed") really was, given its repeated statements confirming that it would not stop hiking the Fed funds interest rate until inflation was well in check, irrespective of the impact to the economy.
Markets again bounced back in October and November. Value stocks led the way, with the Russell 1000® Value Index up 10.25% in October and 6.25% in November, while the Russell 2000® Value Index was up 12.59% and 3.06% in these months. But once again, the buoyant mood dampened in December as interest rates were projected to be headed even higher; investors and corporate leaders began to loudly question whether Fed Chair Jerome Powell was up to the task of maintaining an economic environment supportive of corporate growth while simultaneously taming inflation. Many pundits suggested that the Fed was possibly making both problems worse.
For the full year, U.S. stock performance was mixed, yet negative across market caps and styles, with value stocks outperforming growth, as measured by the Russell family of indices. In the broader context, however, growth stocks, as measured by the Russell 3000® Growth Index, have maintained their dominance versus value stocks, as measured by the Russell 3000® Value Index, over the past 3, 5, 10, and 15 years. Although we expect this cyclical versus secular, as well as large-cap versus small-cap, tug-of-war to continue, we believe the longer-term outperformance of growth versus value, which has been supported by stronger underlying fundamentals, will come back. Technology-oriented growth companies have excelled and were largely insulated from the economic slowdown that took place the past few years relative to more traditional value companies. Although it appears that growth stocks were perhaps a bit ahead of themselves from a relative valuation standpoint at the
20
Victory RS Growth Fund
Managers' Commentary (continued)
depths of the economic slowdown, this is no longer the case, especially as we look at smaller-cap stocks. We believe the recent underperformance of companies that are materially better off over the secular horizon, given their potential to take market share, is an opportunity for investors.
How did Victory RS Growth Fund (the "Fund") perform during the reporting period?
The Fund returned -33.31% (Class A at net asset value) for the fiscal year ended December 31, 2022, underperforming the Index, which returned -29.14% for the reporting period.
What strategies did you employ during the reporting period?
The Fund's relative underperformance was driven by stock selection within the Information Technology, Industrials, and Health Care sectors, offset in part by stock selection within the Financial Services and Consumer Discretionary sectors.
Within the Technology sector, an underperformer driving performance was computer services software and systems holding ServiceNow, Inc., a cloud-based services provider that automates enterprise information technology operations. We initially purchased the stock given the company's strong enterprise installed base, large runway for growth, and verticalization strategy that has allowed the company to create out-of-the-box functionality and go-to-market solutions faster than competitors. The stock was challenged as the company missed expectations toward year-end and lowered fiscal year guidance due to deal slippage and an elongated sales cycle. In our view, these deals have not been lost. Rather, given the economic cycle, they now require more signoffs from C-suite executives. The CEO also outlined how a longer sales cycle may be leading to larger deal sizes, which likely has some merit to it in the long run despite the noise in the near term.
Within the Industrials sector, the largest driver of relative underperformance was power transmissions equipment producer Generac Holdings, Inc. ("Generac"). Generac is a leading global designer and manufacturer of power generation equipment and other power products serving residential, light commercial, and industrial markets. We initially purchased Generac given its shift to a more holistic power storage and generation company, large organic growth runway, market leadership within the standby generator market, and vast distribution network. The stock underwhelmed in the calendar year despite reporting strong earnings and an increased fiscal year guide mid-year, which we initially felt was notable given the weakening sector sentiment in consumer durable goods. We moved on from the position as we approached year-end as the stock continued to underwhelm and growth visibility began to contract, with a materially reduced backlog.
Within the Information Technology sector, another detractor was RingCentral, Inc. ("RingCentral"), a provider of software-as-a-service solutions for businesses to support modern communications. We initially purchased the stock in early 2014 given the thesis that RingCentral operates in a huge approximately $50 billion global market (with approximately $15 billion in the United States alone) that was only 10% penetrated by cloud offerings. The company has executed very well due to their industry-leading technology driven by a large research and development budget which, combined with aggressive marketing, has allowed the company to take market share. In late 2019, RingCentral announced a commercial agreement with Avaya Holdings Corp. ("Avaya"), a global leader in communications, whereby
21
Victory RS Growth Fund
Managers' Commentary (continued)
RingCentral gained access to Avaya's installed base of 100 million customers in exchange for a new RingCentral product on Avaya's Cloud Office. Despite strong growth in the calendar year, highlighted by revenue acceleration at the start of the year, the stock underwhelmed as investors viewed competition as picking up, which has elicited fear that the company will not be able to grow or price as well as it has in the past, especially into a slowing economy.
The largest contributor to outperformance within Consumer Discretionary was specialty retail holding O'Reilly Automotive, Inc., a retailer and supplier of automotive aftermarket parts, tools, supplies, equipment, and accessories. We initially purchased the stock given the fragmented, yet large, addressable market, older inventory of cars on the road, and strong execution. The stock performed well in the calendar year as margins beat expectations and the outlook has improved relative to other segments of retail given its defensive business model. In fact, we believe the company should benefit from inflation through higher pricing and the demand for its products irrespective of the economic environment.
Within the Health Care sector, a large driver of relative outperformance was biotechnology holding Jazz Pharmaceuticals PLC, a global biopharmaceutical company dedicated to developing and commercializing life-changing medicines. We initially purchased the stock given the strength of Xywav, an alternative to their $1.6 billion drug Xyrem that faces genericization in the beginning of 2023. We believed The Street's concerns on Xyrem revenue reliance were unfounded, as the switch to Xywav is well underway and will drive franchise revenue longevity given the new formulation's lower-sodium benefit to patients. In addition, we believe recent acquisitions will accelerate revenue diversification and growth prospects. The stock performed well in the year, driven by long-term guidance on strong conversion of Xyrem to Xywav and by short-term guidance that exceeded expectations, easing concerns that there would be earnings contractions before growth resumed.
The largest contributor to outperformance within Energy was non-renewable energy holding Diamondback Energy, Inc., an independent oil and natural gas company focused on the acquisition, development, exploration, and exploitation of unconventional onshore oil and natural gas reserves in the Permian Basin in West Texas. We purchased the stock given their pure-play exposure to the Midland side of the Permian Basin, strong return profile, low-cost production, and strong management team. The stock performed exceptionally well in the calendar year and beat expectations, driven by strong production and lower expenses which more than offset slightly lower commodity price realizations as the company approached year-end and higher cash taxes. Management remains committed to returning at least 75% of free cash flow through a combination of dividends and buybacks. The company is managing inflation better than peers, with spending tracking toward the upper end of their long-term capital expenditures budget, which is a key differentiator vs. peers, who have mostly increased capex spend by 10%-15% since the start of the fiscal year.
Given the renewed concerns over forward economic growth given tighter monetary policy in the face of elevated inflation and sluggish growth, along with the continued global impact of COVID-19 and the Russian invasion of Ukraine on corporate fundamentals, we believe there is continued uncertainty among investors that is likely to cause continued periods of elevated volatility (both to the upside and downside) and divergence as new companies emerge, while others struggle to retain their previous leadership. We feel this will create an abundance of opportunities across sectors, industries, and markets in coming quarters and years as the economy and markets transition and recover.
22
Victory RS Growth Fund
Managers' Commentary (continued)
We do not have a clear view or projection as to how large or prolonged any impact will be given the uncertainty regarding the continued unfoldment of events abroad and the resulting economic impact, politicization, and potential scale of incremental or contractionary fiscal and monetary stimulus, but we do believe there are clear pockets of the economy that remain better positioned than others to adjust to any future state given the ability of their workers to remain productive and end-customer demand to remain steady irrespective of the forward economic environment.
Within the growth universe, the current opportunity set appears especially pronounced for secular growth companies, rather than those more cyclical in nature, given the continued strength in underlying fundamentals and relative underperformance by secular growth companies since early November 2020, when market leadership abruptly shifted from companies with better long-term sustainable growth opportunities to areas that had been more challenged by COVID-19 or that could benefit from inflationary pressures experienced over the past year. As a result, we believe we can now allocate to companies with clearer paths of outsized growth with much improved relative valuations as compared to almost any other period of the last 10+ years.
23
Victory RS Growth Fund
Investment Overview
(Unaudited)
Average Annual Total Return
Year Ended December 31, 2022
Class A | Class C | Class R | Class Y | ||||||||||||||||||||||||||||
INCEPTION DATE | 5/12/92 | 6/30/07 | 11/27/06 | 5/1/07 | |||||||||||||||||||||||||||
| Net Asset Value | Maximum Offering Price | Net Asset Value | Contingent Deferred Charges | Net Asset Value | Net Asset Value | Russell 1000® Growth Index1 | |||||||||||||||||||||||||
One Year | –33.31 | % | –37.13 | % | –33.89 | % | –34.53 | % | –33.72 | % | –33.13 | % | –29.14 | % | |||||||||||||||||
Five Year | 5.59 | % | 4.34 | % | 4.72 | % | 4.72 | % | 4.95 | % | 5.88 | % | 10.96 | % | |||||||||||||||||
Ten Year | 11.20 | % | 10.55 | % | 10.45 | % | 10.45 | % | 10.53 | % | 11.49 | % | 14.10 | % | |||||||||||||||||
The performance data quoted represents past performance and current returns may be lower or higher. The investment return and principal value will fluctuate so that an investor's shares, when redeemed, may be worth more or less than the original cost. To obtain performance information current to the most recent month's end, please visit vcm.com.
The maximum offering price figures reflect a maximum sales charge of 5.75% for Class A. Class C is not subject to an initial sales charge, but is subject to a deferred sales charge of 1.00% on shares redeemed within one year of purchase. Net Asset Value does not reflect sales charges. Total return measures the price change in a share assuming the reinvestment of all net investment income and realized capital gain distributions, if any. The total returns quoted do not reflect adjustments made to the enclosed financial statements in accordance with U.S. Generally Accepted Accounting Principles or the deduction of taxes that a shareholder would pay on net investment income and realized capital gain distributions, including reinvested distributions, or redemptions of shares. The total return figures set forth above include all waivers of fees. Without such fee waivers, the total returns would have been lower.
Victory RS Growth Fund — Growth of $10,000

1The Russell 1000® Growth Index is an unmanaged index that measures the performance of those Russell 1000 companies with higher price-to-book ratios and higher forecasted growth values. This index does not include the effect of sales charges, commissions, expenses, or taxes, is not representative of the Fund, and it is not possible to invest directly in an index.
The graph reflects investment of growth of a hypothetical $10,000 investment in the Fund.
The graph and table do not reflect the deduction of taxes that a shareholder would pay on Fund distributions or the redemption of shares.
Past performance is not indicative of future results.
24
Victory RS Science and Technology Fund
Managers' Commentary
(Unaudited)
What were the market conditions during the reporting period?
Following robust calendar year returns during 2019, 2020, and 2021, the S&P 500® Index registered its seventh worst loss in the last 100 years, down 18.11% in 2022. The index, though, has still provided positive returns in 12 of the past 14 years. This challenging period was driven by a number of factors, including the global impact of COVID-19 and the Russian invasion of Ukraine on corporate fundamentals, an unprecedented reversal in monetary response, global logistical challenges, the highest levels of inflation since the 1980s, and changing consumer behavior. Despite all of this, we have also seen a resilient U.S. economy that continues to have low levels of unemployment and high levels of earnings in the face of adversity. Yet underlying this negative market performance were interesting differences among investment styles and market capitalizations, which we feel have created an opportunity.
While markets were broadly challenged across all styles at the start of the year, the underlying theme for U.S. equity markets for the first six months of the year was that value-oriented stocks with pricing power, such as those within the Energy, Utilities, and Consumer Staples sectors, were the place to allocate, and they materially outperformed growth-oriented secular stocks (defined as stocks that are taking market share from legacy companies, and thus are less sensitive to short-term economic output). Markets bounced back sharply during the summer from what had been a challenging first six months of the year as corporations reported better-than-expected earnings and signs emerged that inflation may have peaked. Growth stocks led the rebound, with the Russell 1000® Growth Index up 12.00% and the Russell 2000® Growth Index up 11.20% in July. But the euphoria was short-lived. Concerns re-emerged in August as investors began to digest how hawkish the U.S. Federal Reserve (the "Fed") really was, given its repeated statements confirming that it would not stop hiking the Fed funds interest rate until inflation was well in check, irrespective of the impact to the economy.
Markets again bounced back in October and November. Value stocks led the way, with the Russell 1000® Value Index up 10.25% in October and 6.25% in November, while the Russell 2000® Value Index was up 12.59% and 3.06% in these months. But once again, the buoyant mood dampened in December as interest rates were projected to be headed even higher; investors and corporate leaders began to loudly question whether Fed Chair Jerome Powell was up to the task of maintaining an economic environment supportive of corporate growth while simultaneously taming inflation. Many pundits suggested that the Fed was possibly making both problems worse.
For the full year, U.S. stock performance was mixed, yet negative across market caps and styles, with value stocks outperforming growth, as measured by the Russell family of indices. In the broader context, however, growth stocks, as measured by the Russell 3000® Growth Index, have maintained their dominance versus value stocks, as measured by the Russell 3000® Value Index, over the past 3, 5, 10, and 15 years. Although we expect this cyclical versus secular, as well as large-cap versus small-cap, tug-of-war to continue, we believe the longer-term outperformance of growth versus value, which has been supported by stronger underlying fundamentals, will come back. Technology-oriented growth companies have excelled and were largely insulated from the economic slowdown that took place the past few years relative to more traditional value companies. Although it appears that growth stocks were perhaps a bit ahead of themselves from a relative valuation standpoint at the
25
Victory RS Science and Technology Fund
Managers' Commentary (continued)
depths of the economic slowdown, this is no longer the case, especially as we look at smaller-cap stocks. We believe the recent underperformance of companies that are materially better off over the secular horizon, given their potential to take market share, is an opportunity for investors.
How did Victory RS Science and Technology Fund (the "Fund") perform during the reporting period?
The Fund returned -43.51% (Class A at net asset value) for the fiscal year ended December 31, 2022, underperforming the S&P North American Technology Sector Index (the "Index"), which returned -35.36% for the reporting period and the broader S&P 500® Index, which returned -18.11% for the reporting period.
What strategies did you employ during the reporting period?
The Fund's relative performance was hindered by exposure to innovative companies within the Health Care sector, as well as a tilt toward smaller-cap companies relative to the Index.
Within the Technology sector, a detractor was RingCentral, Inc. ("RingCentral"), a provider of software-as-a-service solutions for businesses to support modern communications. We initially purchased the stock in early 2014 given the thesis that RingCentral operates in a huge approximately $50 billion global market (with approximately $15 billion in the United States alone) that was only 10% penetrated by cloud offerings. The company has executed very well due to their industry-leading technology driven by a large research and development budget which, combined with aggressive marketing, has allowed the company to take market share. In late 2019, RingCentral announced a commercial agreement with Avaya Holdings Corp. ("Avaya"), a global leader in communications, whereby RingCentral gained access to Avaya's installed base of 100 million customers in exchange for a new RingCentral product on Avaya's Cloud Office. Despite strong growth in the calendar year, highlighted by revenue acceleration at the start of the year, the stock underwhelmed as investors viewed competition as picking up, which has elicited fear that the company will not be able to grow or price as well as it has in the past, especially into a slowing economy.
Within the Technology sector, another driver of underperformance was information technology holding Avaya. Avaya is a global business communications company that we initially allocated to following its partnership with RingCentral that provided it with a strong position in the Unified Communications as a Service (UCaaS) space. Avaya collects royalties from its partnership with RingCentral in return for providing RingCentral with access to its large existing client base, resulting in higher margin revenue and long-term growth prospects. Unfortunately, Avaya reported disappointing revenue that came in below guidance and EBITDA that was materially less than expected, as strong cloud revenue was offset by lower revenue recognition and the negative impact on the company's Russia and Ukraine exposure. Sales and management turnovers gave us pause to underwrite the sustainability of their growth despite the opportunity. As a result, we decided to move on from the position.
Within the Technology sector, another driver of relative underperformance was information technology holding Twilio, Inc. ("Twilio"). Twilio provides a cloud communications platform that enables developers to build, scale, and operate communications within software applications. We own shares of Twilio given its leading position in a rapidly growing market, driven by the company's broad and deep functionality, strong developer focus, and
26
Victory RS Science and Technology Fund
Managers' Commentary (continued)
comprehensive documentation. In addition, the company has a compelling model for top-line growth, driven by its high net expansion rate among existing customers and rapid customer growth. The stock had a challenging 2022 given a deceleration in growth given tough comps compared to 2021, as well as a challenging macroeconomic environment that resulted in reduced gross margins. In addition, the company had departures of key executives such as their Chief Operating Officer in 2021 and Chief Revenue Officer in early 2022. We continue to hold the position given the belief that margins can once again expand, and the company can reaccelerate growth given strong organic growth prospects for their services.
Within the Technology sector, the largest driver of outperformance was semiconductors and components holding Impinj, Inc. ("Impinj"). Impinj engages in the development and sale of RAIN, a radio frequency identification solution. Its platform allows inventory management, patient safety, asset tracking, and item authentication for the retail, healthcare, supply chain and logistics, hospitality, food and beverage, and industrial manufacturing industries. We initially purchased Impinj as the company is the market leader for RAIN RFID tags, with approximately 47% market share, while they operate in a huge, open-ended growth opportunity as RFID technology has been around for a while, but penetration is still low. There were approximately 20 billion RFID tags produced in 2020 vs. a potential 10 trillion annual unit TAM, implying <0.2% penetration. Impinj was up sharply on a big beat-and-raise driven by continued strong demand for RFIDs and wafer upside from TSM. Demand continues to outpace supply by >50% for the sixth consecutive quarter, and management believes the supply/demand imbalance will continue through the end of 2023. The company also launched a new cloud-based platform for cryptographically authenticating items (such as luxury handbags), which expands RFID use cases and could also open a new recurring revenue stream for the company over time.
Another contributor to performance within the Technology sector was holding MACOM Technology Solutions Holdings, Inc. ("MACOM"). MACOM designs and manufactures analog semiconductor solutions for use in wireless and wireline applications across the radio frequency, microwave, millimeter wave, and lightwave spectrum. We initially purchased the stock given their leading technology in high-performance analog and compound semiconductors and completion of their business turnaround as they restructured the company to focus on growth opportunities. The stock performed well during the year, with steady beat-and-raises highlighted by revenues that were up double digits year-over-year and ahead of expectations, driven primarily by their execution within industrial and defense and wider gross margins. Going forward, we believe the company is further supported by the Creating Helpful Incentives to Produce Semiconductors (CHIPS) Act that will "make transformative investments to restore and advance our Nation's leadership in the research, development, and manufacturing of semiconductors," given the company owns their own domestic fabrication and has strong government agency relationships.
Within the Health Care sector, a material contributor was biotechnology holding Apellis Pharmaceuticals, Inc. ("Apellis"). Apellis is a commercial-stage biopharmaceutical company focused on the discovery, development, and commercialization of therapeutic compounds to treat autoimmune and inflammatory diseases through the inhibition of the complement system, which is an integral component of the immune system. We initially purchased the stock for exposure to the company's lead product, Empaveli (pegcetacoplan), currently used to treat paroxysmal nocturnal hemoglobinuria (PNH), a life-threatening blood disease, and
27
Victory RS Science and Technology Fund
Managers' Commentary (continued)
now in Phase III clinical trials for the treatment of geographic atrophy (GA) secondary to age-related macular degeneration. The stock performed well in the calendar year given strong trial results, which showed early signs of functional benefit at 24 months. As the stock rallied on the news, we took some profits. This proved timely as sales of Empaveli came in below consensus as year-end approached, while it was announced that the company would accept a six-week delay in the launch and a three-month delay would occur in getting a J-Code (used by Medicare and other managed care organizations and issued quarterly), which would erode a portion of their first-mover advantage.
Given the renewed concerns over forward economic growth given tighter monetary policy in the face of elevated inflation and sluggish growth, along with the continued global impact of COVID-19 and the Russian invasion of Ukraine on corporate fundamentals, we believe there is continued uncertainty among investors that is likely to cause continued periods of elevated volatility (both to the upside and downside) and divergence as new companies emerge, while others struggle to retain their previous leadership. We feel this will create an abundance of opportunities across sectors, industries, and markets in coming quarters and years as the economy and markets transition and recover.
We do not have a clear view or projection as to how large or prolonged any impact will be given the uncertainty regarding the continued unfoldment of events abroad and the resulting economic impact, politicization, and potential scale of incremental or contractionary fiscal and monetary stimulus, but we do believe there are clear pockets of the economy that remain better positioned than others to adjust to any future state given the ability of their workers to remain productive and end-customer demand to remain steady irrespective of the forward economic environment.
Within the growth universe, the current opportunity set appears especially pronounced for secular growth companies, rather than those more cyclical in nature, given the continued strength in underlying fundamentals and relative underperformance by secular growth companies since early November 2020, when market leadership abruptly shifted from companies with better long-term sustainable growth opportunities to areas that had been more challenged by COVID-19 or that could benefit from inflationary pressures experienced over the past year. As a result, we believe we can now allocate to companies with clearer paths of outsized growth with much improved relative valuations as compared to almost any other period of the last 10+ years.
28
Victory RS Science and Technology Fund
Investment Overview
(Unaudited)
Average Annual Total Return
Year Ended December 31, 2022
Class A | Class C | Class R | Class Y | ||||||||||||||||||||||||||||||||
INCEPTION DATE | 11/15/95 | 5/2/07 | 1/19/07 | 5/1/07 | |||||||||||||||||||||||||||||||
| Net Asset Value | Maximum Offering Price | Net Asset Value | Contingent Deferred Charges | Net Asset Value | Net Asset Value | S&P North American Technology Sector Index1 | S&P 500® Index2 | ||||||||||||||||||||||||||||
One Year | –43.51 | % | –46.76 | % | –43.95 | % | –44.47 | % | –43.79 | % | –43.38 | % | –35.36 | % | –18.11 | % | |||||||||||||||||||
Five Year | 3.19 | % | 1.97 | % | 2.36 | % | 2.36 | % | 2.72 | % | 3.43 | % | 11.73 | % | 9.42 | % | |||||||||||||||||||
Ten Year | 12.08 | % | 11.42 | % | 11.36 | % | 11.36 | % | 11.56 | % | 12.35 | % | 16.60 | % | 12.56 | % | |||||||||||||||||||
The performance data quoted represents past performance and current returns may be lower or higher. The investment return and principal value will fluctuate so that an investor's shares, when redeemed, may be worth more or less than the original cost. To obtain performance information current to the most recent month's end, please visit vcm.com.
The maximum offering price figures reflect a maximum sales charge of 5.75% for Class A. Class C is not subject to an initial sales charge, but is subject to a deferred sales charge of 1.00% on shares redeemed within one year of purchase. Net Asset Value does not reflect sales charges. Total return measures the price change in a share assuming the reinvestment of all net investment income and realized capital gain distributions, if any. The total returns quoted do not reflect adjustments made to the enclosed financial statements in accordance with U.S. Generally Accepted Accounting Principles or the deduction of taxes that a shareholder would pay on net investment income and realized capital gain distributions, including reinvested distributions, or redemptions of shares. The total return figures set forth above include all waivers of fees. Without such fee waivers, the total returns would have been lower.
Victory RS Science and Technology Fund — Growth of $10,000

1The S&P North American Technology Sector Index provides investors with a benchmark that represents U.S. securities classified under the Global Industry Classification System (GICS® ) technology sector and internet retail sub-industry. This index does not include the effect of sales charges, commissions, expenses, or taxes, is not representative of the Fund, and it is not possible to invest directly in an index.
2The S&P 500® Index is an unmanaged index comprised of 500 domestically traded common stocks, is weighted according to the market value of each common stock in the index, and includes reinvestment of dividends. This index does not include the effect of sales charges, commissions, expenses, or taxes, is not representative of the Fund, and it is not possible to invest directly in an index.
The graph reflects investment of growth of a hypothetical $10,000 investment in the Fund.
The graph and table do not reflect the deduction of taxes that a shareholder would pay on Fund distributions or the redemption of shares.
Past performance is not indicative of future results.
29
Victory RS Small Cap Equity Fund
Managers' Commentary
(Unaudited)
What were the market conditions during the reporting period?
Following robust calendar year returns during 2019, 2020, and 2021, the S&P 500® Index registered its seventh worst loss in the last 100 years, down 18.11% in 2022. The index, though, has still provided positive returns in 12 of the past 14 years. This challenging period was driven by a number of factors, including the global impact of COVID-19 and the Russian invasion of Ukraine on corporate fundamentals, an unprecedented reversal in monetary response, global logistical challenges, the highest levels of inflation since the 1980s, and changing consumer behavior. Despite all of this, we have also seen a resilient U.S. economy that continues to have low levels of unemployment and high levels of earnings in the face of adversity. Yet underlying this negative market performance were interesting differences among investment styles and market capitalizations, which we feel have created an opportunity.
While markets were broadly challenged across all styles at the start of the year, the underlying theme for U.S. equity markets for the first six months of the year was that value-oriented stocks with pricing power, such as those within the Energy, Utilities, and Consumer Staples sectors, were the place to allocate, and they materially outperformed growth-oriented secular stocks (defined as stocks that are taking market share from legacy companies, and thus are less sensitive to short-term economic output). Markets bounced back sharply during the summer from what had been a challenging first six months of the year as corporations reported better-than-expected earnings and signs emerged that inflation may have peaked. Growth stocks led the rebound, with the Russell 1000® Growth Index up 12.00% and the Russell 2000® Growth Index (the "Index") up 11.20% in July. But the euphoria was short-lived. Concerns re-emerged in August as investors began to digest how hawkish the U.S. Federal Reserve (the "Fed") really was, given its repeated statements confirming that it would not stop hiking the Fed funds interest rate until inflation was well in check, irrespective of the impact to the economy.
Markets again bounced back in October and November. Value stocks led the way, with the Russell 1000® Value Index up 10.25% in October and 6.25% in November, while the Russell 2000® Value Index was up 12.59% and 3.06% in these months. But once again, the buoyant mood dampened in December as interest rates were projected to be headed even higher; investors and corporate leaders began to loudly question whether Fed Chair Jerome Powell was up to the task of maintaining an economic environment supportive of corporate growth while simultaneously taming inflation. Many pundits suggested that the Fed was possibly making both problems worse.
For the full year, U.S. stock performance was mixed, yet negative across market caps and styles, with value stocks outperforming growth, as measured by the Russell family of indices. In the broader context, however, growth stocks, as measured by the Russell 3000® Growth Index, have maintained their dominance versus value stocks, as measured by the Russell 3000® Value Index, over the past 3, 5, 10, and 15 years. Although we expect this cyclical versus secular, as well as large-cap versus small-cap, tug-of-war to continue, we believe the longer-term outperformance of growth versus value, which has been supported by stronger underlying fundamentals, will come back. Technology-oriented growth companies have excelled and were largely insulated from the economic slowdown that took place the past few years relative to more traditional value companies. Although it appears that growth
30
Victory RS Small Cap Equity Fund
Managers' Commentary (continued)
stocks were perhaps a bit ahead of themselves from a relative valuation standpoint at the depths of the economic slowdown, this is no longer the case, especially as we look at smaller-cap stocks. We believe the recent underperformance of companies that are materially better off over the secular horizon, given their potential to take market share, is an opportunity for investors.
How did Victory RS Small Cap Equity Fund (the "Fund") perform during the reporting period?
The Fund returned -37.21% (Class A at net asset value) for the fiscal year ended December 31, 2022, underperforming the Index, which returned -26.36% for the reporting period.
What strategies did you employ during the reporting period?
The Fund's relative underperformance was driven by stock selection within the Financial Services and Industrials sectors, while stock selection in the Information Technology sector offset some of the Fund's relative underperformance.
Within the Information Technology sector, the largest driver of underperformance was information technology holding Avaya Holdings Corp. ("Avaya"). Avaya is a global business communications company that we initially allocated to following its partnership with RingCentral that provided it with a strong position in the Unified Communications as a Service (UCaaS) space. Avaya collects royalties from its partnership with RingCentral in return for providing RingCentral with access to its large existing client base, resulting in higher margin revenue and long-term growth prospects. Unfortunately, Avaya reported disappointing results with revenue below guidance and EBITDA that was materially less than expected, as strong cloud revenue was offset by lower revenue recognition and the negative impact on the company's Russia and Ukraine exposure. Sales and management turnover gave us pause to underwrite the sustainability of their growth despite the opportunity. As a result, we decided to move on from the position.
Within the Financial Services sector, a material driver of underperformance was financial data and systems holding Green Dot Corp. ("Green Dot"). Green Dot is a financial technology company with roots as the dominant provider of general-purpose debit cards and cash reload processing services that has transitioned from a mono-line product company to a "FinTech" Banking-as-a-Service (BaaS) platform. We purchased the stock given the company's dominant market position in prepaid debt cards that has been a cash cow to fund investments into new products and focus on the underbanked and millennial population in the United States. Their BaaS business has taken off in recent years, with strong customer acquisition and a strong pipeline of new products and technology. The stock was challenged in the most recent calendar year as the company became embroiled in a dispute with Uber over the obligations owed to Green Dot, and it was announced that "several" of its BaaS customers declined to renew their contracts.
Within the Financial Services sector, another driver of underperformance was consumer finance and credit services holding Payoneer Global, Inc. ("Payoneer"). Payoneer simplifies the process for businesses to pay and get paid globally with their global payments/commerce platform that provides services to both sides of a two-sided commerce network. We initially purchased shares of Payoneer given the growth in their digital marketplace given the
31
Victory RS Small Cap Equity Fund
Managers' Commentary (continued)
convenience they provide consumers, as well as the expanded customer base they offer to merchants. We had the view that estimates for the company are too low given the large float they hold on behalf of customers that can now earn a material interest in the higher interest rate environment. The stock underwhelmed in the calendar year, despite strong execution driven by the company's growth and increased penetration of the company's offerings, due to a higher-than-expected ramp in forecasted expenses in 2023 and overall sentiment for the payments category.
Within the Information Technology sector, the largest driver of outperformance was semiconductors and components holding Impinj, Inc. ("Impinj"). Impinj engages in the development and sale of RAIN, a radio frequency identification solution. Its platform allows inventory management, patient safety, asset tracking, and item authentication for the retail, healthcare, supply chain and logistics, hospitality, food and beverage, and industrial manufacturing industries. We initially purchased Impinj as the company is the market leader for RAIN RFID tags, with approximately 47% market share, while they operate in a huge, open-ended growth opportunity as RFID technology has been around for a while, but penetration is still low. There were approximately 20 billion RFID tags produced in 2020 vs. a potential 10 trillion annual unit TAM, implying <0.2% penetration. Impinj was up sharply on a big beat-and-raise driven by continued strong demand for RFIDs and wafer upside from TSM. Despite the upside, demand continues to outpace supply by >50% for the sixth consecutive quarter, and management believes the supply/demand imbalance will continue through the end of 2023. The company also launched a new cloud-based platform for cryptographically authenticating items (such as luxury handbags), which expands RFID use cases and could also open a new recurring revenue stream for the company over time.
Within the Health Care sector, a material driver of sector outperformance was medical equipment and services holding Inspire Medical Systems, Inc. ("Inspire"). Inspire is a medical technology company focused on the development and commercialization of minimally invasive solutions for patients with obstructive sleep apnea. We initially purchased the stock given its product's appeal as an alternative to existing invasive and uncomfortable treatments, large underpenetrated market, and lack of real competition. The stock performed well in the calendar year, as company revenue exceeded expectations and they were able to raise guidance by more than the excess growth achieved in the year. The company continues to execute well, and its product remains the only approved implantable for sleep apnea on the market.
A top performer within the Utilities sector was scientific instruments holding Evoqua Water Technologies Corp. ("Evoqua"). Evoqua provides water treatment equipment and services, such as filter presses, intake rebuilds, and electrocatalytic services, as well as sludge dryers, digester covers, captivator systems, and other related technologies to the industrial, commercial, and municipal water treatment markets. We purchased shares of Evoqua given its significant exposure to services, aftermarket and repair markets, which provides the company with a diverse and large set of end markets. The company has experienced accelerating organic growth and has clear margin drivers after completing a long cycle of tuck-in acquisitions. The stock performed relatively well in the calendar year given strong earnings that beat expectations. We believe the stock is poised to continue to outperform as The Street recognizes the company's growth inflection and reasonable valuation.
32
Victory RS Small Cap Equity Fund
Managers' Commentary (continued)
Given the renewed concerns over forward economic growth given tighter monetary policy in the face of elevated inflation and sluggish growth, along with the continued global impact of COVID-19 and the Russian invasion of Ukraine on corporate fundamentals, we believe there is continued uncertainty among investors that is likely to cause continued periods of elevated volatility (both to the upside and downside) and divergence as new companies emerge, while others struggle to retain their previous leadership. We feel this will create an abundance of opportunities across sectors, industries, and markets in coming quarters and years as the economy and markets transition and recover.
We do not have a clear view or projection as to how large or prolonged any impact will be given the uncertainty regarding the continued unfolding of events abroad and the resulting economic impact, politicization, and potential scale of incremental or contractionary fiscal and monetary stimulus, but we do believe there are clear pockets of the economy that remain better positioned than others to adjust to any future state given the ability of their workers to remain productive and end-customer demand to remain steady irrespective of the forward economic environment.
Within the growth universe, the current opportunity set appears especially pronounced for secular growth companies, rather than those more cyclical in nature, given the continued strength in underlying fundamentals and relative underperformance by secular growth companies since early November 2020, when market leadership abruptly shifted from companies with better long-term sustainable growth opportunities to areas that had been more challenged by COVID-19 or that could benefit from inflationary pressures experienced over the past year. As a result, we believe we can now allocate to companies with clearer paths of outsized growth with much improved relative valuations as compared to almost any other period of the last 10+ years.
33
Victory RS Small Cap Equity Fund
Investment Overview
(Unaudited)
Average Annual Total Return
Year Ended December 31, 2022
Class A | Class C | Class R | Class Y | Member Class | |||||||||||||||||||||||||||||||
INCEPTION DATE | 5/1/97 | 8/7/00 | 5/15/01 | 5/1/07 | 11/2/20 | ||||||||||||||||||||||||||||||
| Net Asset Value | Maximum Offering Price | Net Asset Value | Contingent Deferred Charges | Net Asset Value | Net Asset Value | Net Asset Value | Russell 2000® Growth Index1 | ||||||||||||||||||||||||||||
One Year | –37.21 | % | –40.81 | % | –37.71 | % | –38.27 | % | –37.41 | % | –37.02 | % | –37.08 | % | –26.36 | % | |||||||||||||||||||
Five Year | 0.36 | % | –0.81 | % | –0.51 | % | –0.51 | % | –0.11 | % | 0.55 | % | N/A | 3.51 | % | ||||||||||||||||||||
Ten Year | 8.90 | % | 8.26 | % | 8.15 | % | 8.15 | % | 8.42 | % | 9.07 | % | N/A | 9.20 | % | ||||||||||||||||||||
Since Inception | N/A | N/A | N/A | N/A | N/A | N/A | –13.59 | % | N/A | ||||||||||||||||||||||||||
The performance data quoted represents past performance and current returns may be lower or higher. The investment return and principal value will fluctuate so that an investor's shares, when redeemed, may be worth more or less than the original cost. To obtain performance information current to the most recent month's end, please visit vcm.com.
The maximum offering price figures reflect a maximum sales charge of 5.75% for Class A. Class C is not subject to an initial sales charge, but is subject to a deferred sales charge of 1.00% on shares redeemed within one year of purchase. Net Asset Value does not reflect sales charges. Total return measures the price change in a share assuming the reinvestment of all net investment income and realized capital gain distributions, if any. The total returns quoted do not reflect adjustments made to the enclosed financial statements in accordance with U.S. Generally Accepted Accounting Principles or the deduction of taxes that a shareholder would pay on net investment income and realized capital gain distributions, including reinvested distributions, or redemptions of shares. The total return figures set forth above include all waivers of fees. Without such fee waivers, the total returns would have been lower.
Victory RS Small Cap Equity Fund — Growth of $10,000

1The Russell 2000® Growth Index is an unmanaged market-capitalization-weighted index that measures the performance of those companies in the Russell 2000® Index with higher price-to-book ratios and higher forecasted growth values. Index results assume the reinvestment of dividends paid on the stocks constituting the index. This index does not include the effect of sales charges, commissions, expenses, or taxes, is not representative of the Fund, and it is not possible to invest directly in an index.
The graph reflects investment of growth of a hypothetical $10,000 investment in the Fund.
The graph and table do not reflect the deduction of taxes that a shareholder would pay on Fund distributions or the redemption of shares.
Past performance is not indicative of future results.
34
| Victory Portfolios Victory RS Small Cap Growth Fund | December 31, 2022 | ||||||
(Unaudited)
Investment Objective and Portfolio Holdings:
The Fund seeks to provide long-term capital growth.
Top 10 Holdings*:
December 31, 2022
(% of Net Assets)
MACOM Technology Solutions Holdings, Inc. | 3.3 | % | |||||
BellRing Brands, Inc. | 2.9 | % | |||||
Evoqua Water Technologies Corp. | 2.7 | % | |||||
WNS Holdings Ltd. | 2.3 | % | |||||
Inspire Medical Systems, Inc. | 2.2 | % | |||||
Advanced Energy Industries, Inc. | 2.2 | % | |||||
Acadia Healthcare Co., Inc. | 2.2 | % | |||||
Sprout Social, Inc., Class A | 2.1 | % | |||||
Denbury, Inc. | 2.0 | % | |||||
AAON, Inc. | 1.9 | % | |||||
Sector Allocation*:
December 31, 2022
(% of Net Assets)
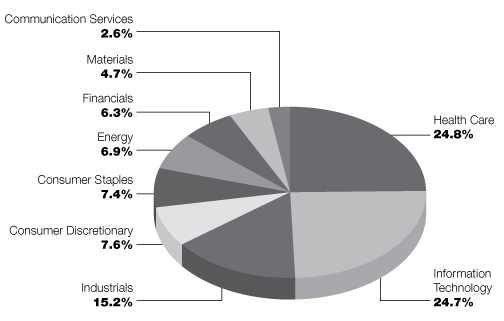
* Does not include futures contracts, money market instruments, and short-term investments purchased with cash collateral from securities loaned.
Percentages are of the net assets of the Fund and may not equal 100%.
Refer to the Schedule of Portfolio Investments for a complete list of securities.
35
| Victory Portfolios Victory RS Select Growth Fund | December 31, 2022 | ||||||
(Unaudited)
Investment Objective and Portfolio Holdings:
The Fund seeks to provide long-term capital growth.
Top 10 Holdings*:
December 31, 2022
(% of Net Assets)
Jazz Pharmaceuticals PLC | 4.2 | % | |||||
MACOM Technology Solutions Holdings, Inc. | 3.1 | % | |||||
Dynatrace, Inc. | 2.8 | % | |||||
Evoqua Water Technologies Corp. | 2.8 | % | |||||
Halozyme Therapeutics, Inc. | 2.7 | % | |||||
Acadia Healthcare Co., Inc. | 2.7 | % | |||||
Graphic Packaging Holding Co. | 2.5 | % | |||||
Lattice Semiconductor Corp. | 2.4 | % | |||||
Paylocity Holding Corp. | 2.3 | % | |||||
Applied Industrial Technologies, Inc. | 2.3 | % | |||||
Sector Allocation*:
December 31, 2022
(% of Net Assets)

* Does not include futures contracts, money market instruments, and short-term investments purchased with cash collateral from securities loaned.
Percentages are of the net assets of the Fund and may not equal 100%.
Refer to the Schedule of Portfolio Investments for a complete list of securities.
36
| Victory Portfolios Victory RS Mid Cap Growth Fund | December 31, 2022 | ||||||
(Unaudited)
Investment Objective and Portfolio Holdings:
The Fund seeks to provide long-term capital growth.
Top 10 Holdings*:
December 31, 2022
(% of Net Assets)
Synopsys, Inc. | 3.8 | % | |||||
Lattice Semiconductor Corp. | 3.2 | % | |||||
Agilent Technologies, Inc. | 3.0 | % | |||||
Dexcom, Inc. | 2.6 | % | |||||
Graphic Packaging Holding Co. | 2.4 | % | |||||
Enphase Energy, Inc. | 2.3 | % | |||||
Sarepta Therapeutics, Inc. | 2.3 | % | |||||
Insulet Corp. | 2.2 | % | |||||
Mettler-Toledo International, Inc. | 2.1 | % | |||||
AmerisourceBergen Corp. | 2.1 | % | |||||
Sector Allocation*:
December 31, 2022
(% of Net Assets)
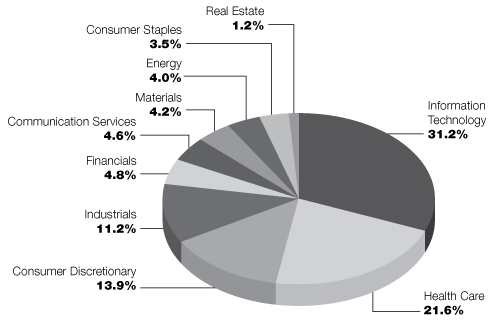
* Does not include futures contracts, money market instruments, and short-term investments purchased with cash collateral from securities loaned.
Percentages are of the net assets of the Fund and may not equal 100%.
Refer to the Schedule of Portfolio Investments for a complete list of securities.
37
| Victory Portfolios Victory RS Growth Fund | December 31, 2022 | ||||||
(Unaudited)
Investment Objective and Portfolio Holdings:
The Fund seeks to provide long-term capital growth.
Top 10 Holdings*:
December 31, 2022
(% of Net Assets)
Microsoft Corp. | 11.6 | % | |||||
Apple, Inc. | 10.2 | % | |||||
Visa, Inc., Class A | 5.1 | % | |||||
Alphabet, Inc., Class C | 4.8 | % | |||||
Amazon.com, Inc. | 3.9 | % | |||||
Vertex Pharmaceuticals, Inc. | 3.4 | % | |||||
NVIDIA Corp. | 3.1 | % | |||||
UnitedHealth Group, Inc. | 3.0 | % | |||||
Constellation Brands, Inc., Class A | 2.7 | % | |||||
ServiceNow, Inc. | 2.1 | % | |||||
Sector Allocation*:
December 31, 2022
(% of Net Assets)

* Does not include futures contracts, money market instruments, and short-term investments purchased with cash collateral from securities loaned.
Percentages are of the net assets of the Fund and may not equal 100%.
Refer to the Schedule of Portfolio Investments for a complete list of securities.
38
| Victory Portfolios Victory RS Science and Technology Fund | December 31, 2022 | ||||||
(Unaudited)
Investment Objective and Portfolio Holdings:
The Fund seeks to provide long-term capital growth.
Top 10 Holdings*:
December 31, 2022
(% of Net Assets)
Microsoft Corp. | 9.6 | % | |||||
Vertex Pharmaceuticals, Inc. | 5.0 | % | |||||
MACOM Technology Solutions Holdings, Inc. | 3.8 | % | |||||
Impinj, Inc. | 3.6 | % | |||||
Amazon.com, Inc. | 3.0 | % | |||||
Lattice Semiconductor Corp. | 2.7 | % | |||||
Jazz Pharmaceuticals PLC | 2.5 | % | |||||
Varonis Systems, Inc. | 2.4 | % | |||||
Fair Isaac Corp. | 2.3 | % | |||||
Visa, Inc., Class A | 2.3 | % | |||||
Sector Allocation*:
December 31, 2022
(% of Net Assets)

* Does not include futures contracts, money market instruments, and short-term investments purchased with cash collateral from securities loaned.
Percentages are of the net assets of the Fund and may not equal 100%.
Refer to the Schedule of Portfolio Investments for a complete list of securities.
39
| Victory Portfolios Victory RS Small Cap Equity Fund | December 31, 2022 | ||||||
(Unaudited)
Investment Objective and Portfolio Holdings:
The Fund seeks to provide long-term capital growth.
Top 10 Holdings*:
December 31, 2022
(% of Net Assets)
Evoqua Water Technologies Corp. | 6.1 | % | |||||
Shift4 Payments, Inc., Class A | 5.8 | % | |||||
Flywire Corp. | 4.9 | % | |||||
Denbury, Inc. | 4.8 | % | |||||
Payoneer Global, Inc. | 4.3 | % | |||||
Chart Industries, Inc. | 3.9 | % | |||||
MACOM Technology Solutions Holdings, Inc. | 3.9 | % | |||||
PRA Group, Inc. | 3.8 | % | |||||
Grocery Outlet Holding Corp. | 3.8 | % | |||||
Trupanion, Inc. | 3.8 | % | |||||
Sector Allocation*:
December 31, 2022
(% of Net Assets)

* Does not include futures contracts, money market instruments, and short-term investments purchased with cash collateral from securities loaned.
Percentages are of the net assets of the Fund and may not equal 100%.
Refer to the Schedule of Portfolio Investments for a complete list of securities.
40
| Victory Portfolios Victory RS Small Cap Growth Fund | Schedule of Portfolio Investments December 31, 2022 | ||||||
Security Description | Shares | Value | |||||||||
Common Stocks (100.2%) | |||||||||||
Communication Services (2.6%): | |||||||||||
World Wrestling Entertainment, Inc., Class A | 122,100 | $ | 8,366,292 | ||||||||
ZipRecruiter, Inc. (a) | 633,790 | 10,406,832 | |||||||||
18,773,124 | |||||||||||
Consumer Discretionary (7.6%): | |||||||||||
Acushnet Holdings Corp. | 204,480 | 8,682,221 | |||||||||
Columbia Sportswear Co. | 101,980 | 8,931,409 | |||||||||
Fox Factory Holding Corp. (a) | 80,370 | 7,332,155 | |||||||||
Ollie's Bargain Outlet Holdings, Inc. (a) | 120,410 | 5,640,004 | |||||||||
Ralph Lauren Corp. | 96,690 | 10,217,232 | |||||||||
Texas Roadhouse, Inc. | 63,030 | 5,732,579 | |||||||||
Wingstop, Inc. | 67,970 | 9,354,031 | |||||||||
55,889,631 | |||||||||||
Consumer Staples (7.4%): | |||||||||||
BellRing Brands, Inc. (a) | 810,870 | 20,790,707 | |||||||||
Celsius Holdings, Inc. (a) | 85,340 | 8,878,774 | |||||||||
e.l.f. Beauty, Inc. (a) | 78,580 | 4,345,474 | |||||||||
Grocery Outlet Holding Corp. (a) | 476,680 | 13,914,289 | |||||||||
The Simply Good Foods Co. (a) | 152,420 | 5,796,532 | |||||||||
53,725,776 | |||||||||||
Energy (6.9%): | |||||||||||
Callon Petroleum Co. (a) | 89,820 | 3,331,424 | |||||||||
Denbury, Inc. (a) | 166,480 | 14,487,090 | |||||||||
Matador Resources Co. | 170,580 | 9,763,999 | |||||||||
Permian Resources Corp. | 999,770 | 9,397,838 | |||||||||
Ranger Oil Corp. | 329,950 | 13,339,878 | |||||||||
50,320,229 | |||||||||||
Financials (6.3%): | |||||||||||
FirstCash Holdings, Inc. | 65,620 | 5,703,034 | |||||||||
Focus Financial Partners, Inc., Class A (a) | 144,730 | 5,394,087 | |||||||||
Kinsale Capital Group, Inc. | 40,800 | 10,670,016 | |||||||||
PRA Group, Inc. (a) | 361,700 | 12,218,226 | |||||||||
Wintrust Financial Corp. | 144,190 | 12,186,939 | |||||||||
46,172,302 | |||||||||||
Health Care (24.8%): | |||||||||||
Acadia Healthcare Co., Inc. (a) | 193,230 | 15,906,694 | |||||||||
Agios Pharmaceuticals, Inc. (a) | 287,530 | 8,073,843 | |||||||||
Apellis Pharmaceuticals, Inc. (a) | 137,630 | 7,116,847 | |||||||||
Axonics, Inc. (a) | 128,060 | 8,007,592 | |||||||||
BioCryst Pharmaceuticals, Inc. (a) | 670,610 | 7,698,603 | |||||||||
Chinook Therapeutics, Inc. (a) | 383,770 | 10,054,774 | |||||||||
Equillium, Inc. (a) (b) | 1,391,951 | 1,531,146 | |||||||||
Evolent Health, Inc., Class A (a) | 393,040 | 11,036,563 | |||||||||
Fate Therapeutics, Inc. (a) | 255,870 | 2,581,728 | |||||||||
Halozyme Therapeutics, Inc. (a) | 185,110 | 10,532,759 | |||||||||
See notes to financial statements.
41
| Victory Portfolios Victory RS Small Cap Growth Fund | Schedule of Portfolio Investments — continued December 31, 2022 | ||||||
Security Description | Shares | Value | |||||||||
HealthEquity, Inc. (a) | 217,490 | $ | 13,406,084 | ||||||||
Inspire Medical Systems, Inc. (a) | 64,090 | 16,142,989 | |||||||||
Krystal Biotech, Inc. (a) | 110,820 | 8,779,161 | |||||||||
Kura Oncology, Inc. (a) | 478,200 | 5,934,462 | |||||||||
LivaNova PLC (a) | 153,700 | 8,536,498 | |||||||||
Opthea Ltd., ADR (a) (c) | 420,920 | 2,357,152 | |||||||||
Option Care Health, Inc. (a) | 312,760 | 9,410,948 | |||||||||
PROCEPT BioRobotics Corp. (a) | 58,590 | 2,433,829 | |||||||||
Prometheus Biosciences, Inc. (a) | 34,520 | 3,797,200 | |||||||||
Replimune Group, Inc. (a) | 171,440 | 4,663,168 | |||||||||
Shockwave Medical, Inc. (a) | 50,610 | 10,405,922 | |||||||||
SpringWorks Therapeutics, Inc. (a) (b) | 212,940 | 5,538,569 | |||||||||
Surgery Partners, Inc. (a) | 272,720 | 7,597,979 | |||||||||
181,544,510 | |||||||||||
Industrials (15.2%): | |||||||||||
AAON, Inc. | 186,520 | 14,048,686 | |||||||||
AAR Corp. (a) | 229,840 | 10,319,816 | |||||||||
Applied Industrial Technologies, Inc. | 108,220 | 13,638,967 | |||||||||
Bloom Energy Corp., Class A (a) | 626,430 | 11,977,342 | |||||||||
Chart Industries, Inc. (a) | 66,789 | 7,696,097 | |||||||||
Clean Harbors, Inc. (a) | 111,720 | 12,749,486 | |||||||||
Evoqua Water Technologies Corp. (a) | 500,570 | 19,822,572 | |||||||||
Saia, Inc. (a) | 54,350 | 11,396,108 | |||||||||
Shoals Technologies Group, Inc., Class A (a) | 186,390 | 4,598,241 | |||||||||
Simpson Manufacturing Co., Inc. | 57,890 | 5,132,527 | |||||||||
111,379,842 | |||||||||||
Information Technology (24.7%): | |||||||||||
Advanced Energy Industries, Inc. | 188,180 | 16,142,081 | |||||||||
Badger Meter, Inc. | 27,140 | 2,959,074 | |||||||||
Box, Inc., Class A (a) | 386,600 | 12,034,858 | |||||||||
Braze, Inc., Class A (a) (b) | 107,230 | 2,925,234 | |||||||||
CyberArk Software Ltd. (a) | 71,220 | 9,233,673 | |||||||||
Digi International, Inc. (a) | 162,060 | 5,923,293 | |||||||||
DigitalOcean Holdings, Inc. (a) | 215,620 | 5,491,841 | |||||||||
Flywire Corp. (a) | 347,270 | 8,497,697 | |||||||||
Gitlab, Inc., Class A (a) (b) | 136,430 | 6,199,379 | |||||||||
Impinj, Inc. (a) | 99,080 | 10,817,555 | |||||||||
Jamf Holding Corp. (a) | 180,480 | 3,844,224 | |||||||||
MACOM Technology Solutions Holdings, Inc. (a) | 388,303 | 24,455,323 | |||||||||
Marqeta, Inc., Class A (a) | 465,890 | 2,846,588 | |||||||||
Paya Holdings, Inc. (a) | 566,330 | 4,457,017 | |||||||||
Paycor HCM, Inc. (a) | 429,760 | 10,516,227 | |||||||||
Payoneer Global, Inc. (a) | 1,598,570 | 8,744,178 | |||||||||
Shift4 Payments, Inc., Class A (a) | 99,300 | 5,553,849 | |||||||||
Smartsheet, Inc., Class A (a) | 90,360 | 3,556,570 | |||||||||
Sprout Social, Inc., Class A (a) | 275,820 | 15,572,797 | |||||||||
Varonis Systems, Inc. (a) | 176,230 | 4,218,946 | |||||||||
WNS Holdings Ltd., ADR (a) | 212,097 | 16,965,639 | |||||||||
180,956,043 | |||||||||||
See notes to financial statements.
42
| Victory Portfolios Victory RS Small Cap Growth Fund | Schedule of Portfolio Investments — continued December 31, 2022 | ||||||
Security Description | Shares | Value | |||||||||
Materials (4.7%): | |||||||||||
Avient Corp. | 177,890 | $ | 6,005,566 | ||||||||
Livent Corp. (a) | 274,720 | 5,458,686 | |||||||||
Silgan Holdings, Inc. | 265,800 | 13,779,072 | |||||||||
Summit Materials, Inc., Class A (a) | 314,696 | 8,934,220 | |||||||||
34,177,544 | |||||||||||
Total Common Stocks (Cost $680,356,036) | 732,939,001 | ||||||||||
Collateral for Securities Loaned (0.9%)^ | |||||||||||
| Goldman Sachs Financial Square Government Fund, Institutional Shares, 4.14% (d) | 1,644,840 | 1,644,840 | |||||||||
HSBC U.S. Government Money Market Fund, Institutional Shares, 4.13% (d) | 1,644,840 | 1,644,840 | |||||||||
Invesco Government & Agency Portfolio, Institutional Shares, 4.22% (d) | 1,644,840 | 1,644,840 | |||||||||
| Morgan Stanley Institutional Liquidity Government Portfolio, Institutional Shares, 4.08% (d) | 1,644,840 | 1,644,840 | |||||||||
Total Collateral for Securities Loaned (Cost $6,579,360) | 6,579,360 | ||||||||||
Total Investments (Cost $686,935,396) — 101.1% | 739,518,361 | ||||||||||
Liabilities in excess of other assets — (1.1)% | (7,740,952 | ) | |||||||||
NET ASSETS — 100.00% | $ | 731,777,409 | |||||||||
^ Purchased with cash collateral from securities on loan.
(a) Non-income producing security.
(b) All or a portion of this security is on loan.
(c) The Fund's Adviser has deemed this security to be illiquid based upon procedures approved by the Board of Trustees. As of December 31, 2022, illiquid securities were 0.3% of net assets.
(d) Rate disclosed is the daily yield on December 31, 2022.
ADR — American Depositary Receipt
PLC — Public Limited Company
See notes to financial statements.
43
| Victory Portfolios Victory RS Select Growth Fund | Schedule of Portfolio Investments December 31, 2022 | ||||||
Security Description | Shares | Value | |||||||||
Common Stocks (98.1%) | |||||||||||
Communication Services (3.2%): | |||||||||||
World Wrestling Entertainment, Inc., Class A | 23,040 | $ | 1,578,701 | ||||||||
ZoomInfo Technologies, Inc. (a) | 58,190 | 1,752,101 | |||||||||
3,330,802 | |||||||||||
Consumer Discretionary (9.1%): | |||||||||||
Churchill Downs, Inc. | 10,970 | 2,319,387 | |||||||||
Five Below, Inc. (a) | 10,140 | 1,793,462 | |||||||||
Mattel, Inc. (a) | 76,520 | 1,365,117 | |||||||||
Ollie's Bargain Outlet Holdings, Inc. (a) | 22,190 | 1,039,380 | |||||||||
Ralph Lauren Corp. | 15,380 | 1,625,204 | |||||||||
Wingstop, Inc. | 9,650 | 1,328,033 | |||||||||
9,470,583 | |||||||||||
Consumer Staples (5.7%): | |||||||||||
BellRing Brands, Inc. (a) | 86,830 | 2,226,321 | |||||||||
Freshpet, Inc. (a) | 22,710 | 1,198,407 | |||||||||
Grocery Outlet Holding Corp. (a) | 71,500 | 2,087,085 | |||||||||
Hostess Brands, Inc. (a) | 20,290 | 455,308 | |||||||||
5,967,121 | |||||||||||
Energy (5.4%): | |||||||||||
Denbury, Inc. (a) | 26,680 | 2,321,694 | |||||||||
Diamondback Energy, Inc. | 11,910 | 1,629,050 | |||||||||
Matador Resources Co. | 29,230 | 1,673,125 | |||||||||
5,623,869 | |||||||||||
Financials (6.5%): | |||||||||||
FactSet Research Systems, Inc. | 4,040 | 1,620,888 | |||||||||
Focus Financial Partners, Inc., Class A (a) | 25,230 | 940,322 | |||||||||
Kinsale Capital Group, Inc. | 7,480 | 1,956,170 | |||||||||
LPL Financial Holdings, Inc. | 5,650 | 1,221,360 | |||||||||
Wintrust Financial Corp. | 13,230 | 1,118,200 | |||||||||
6,856,940 | |||||||||||
Health Care (20.1%): | |||||||||||
Acadia Healthcare Co., Inc. (a) | 34,620 | 2,849,918 | |||||||||
BioCryst Pharmaceuticals, Inc. (a) | 120,980 | 1,388,850 | |||||||||
Evolent Health, Inc., Class A (a) | 37,760 | 1,060,301 | |||||||||
Halozyme Therapeutics, Inc. (a) | 50,240 | 2,858,656 | |||||||||
Insulet Corp. (a) | 5,350 | 1,574,987 | |||||||||
Jazz Pharmaceuticals PLC (a) | 27,520 | 4,384,211 | |||||||||
Option Care Health, Inc. (a) | 50,500 | 1,519,545 | |||||||||
Penumbra, Inc. (a) | 7,610 | 1,692,921 | |||||||||
Repligen Corp. (a) | 7,840 | 1,327,390 | |||||||||
Shockwave Medical, Inc. (a) | 5,430 | 1,116,462 | |||||||||
Tenet Healthcare Corp. (a) | 25,050 | 1,222,190 | |||||||||
20,995,431 | |||||||||||
Industrials (16.0%): | |||||||||||
Advanced Drainage Systems, Inc. | 14,700 | 1,204,959 | |||||||||
Applied Industrial Technologies, Inc. | 19,020 | 2,397,090 | |||||||||
See notes to financial statements.
44
| Victory Portfolios Victory RS Select Growth Fund | Schedule of Portfolio Investments — continued December 31, 2022 | ||||||
Security Description | Shares | Value | |||||||||
Axon Enterprise, Inc. (a) | 4,300 | $ | 713,499 | ||||||||
Builders FirstSource, Inc. (a) | 9,910 | 642,961 | |||||||||
Chart Industries, Inc. (a) | 10,770 | 1,241,027 | |||||||||
Clean Harbors, Inc. (a) | 18,700 | 2,134,044 | |||||||||
Evoqua Water Technologies Corp. (a) | 74,090 | 2,933,964 | |||||||||
Ritchie Bros Auctioneers, Inc. | 18,250 | 1,055,397 | |||||||||
Saia, Inc. (a) | 9,550 | 2,002,444 | |||||||||
Trex Co., Inc. (a) | 14,530 | 615,055 | |||||||||
WillScot Mobile Mini Holdings Corp. (a) | 38,680 | 1,747,176 | |||||||||
16,687,616 | |||||||||||
IT Services (8.0%): | |||||||||||
DigitalOcean Holdings, Inc. (a) | 26,290 | 669,606 | |||||||||
Genpact Ltd. | 26,340 | 1,220,069 | |||||||||
Globant SA (a) | 6,330 | 1,064,453 | |||||||||
Jack Henry & Associates, Inc. | 10,410 | 1,827,579 | |||||||||
Payoneer Global, Inc. (a) | 302,740 | 1,655,988 | |||||||||
Shift4 Payments, Inc., Class A (a) | 34,660 | 1,938,534 | |||||||||
8,376,229 | |||||||||||
Materials (5.1%): | |||||||||||
Graphic Packaging Holding Co. | 117,000 | 2,603,250 | |||||||||
Livent Corp. (a) | 36,770 | 730,620 | |||||||||
Silgan Holdings, Inc. | 38,080 | 1,974,067 | |||||||||
5,307,937 | |||||||||||
Semiconductors & Semiconductor Equipment (8.6%): | |||||||||||
Enphase Energy, Inc. (a) | 8,290 | 2,196,519 | |||||||||
Entegris, Inc. | 15,900 | 1,042,881 | |||||||||
Lattice Semiconductor Corp. (a) | 38,810 | 2,517,993 | |||||||||
MACOM Technology Solutions Holdings, Inc. (a) | 51,130 | 3,220,167 | |||||||||
8,977,560 | |||||||||||
Software (10.4%): | |||||||||||
Aspen Technology, Inc. (a) | 3,170 | 651,118 | |||||||||
Check Point Software Technologies Ltd. (a) | 13,770 | 1,737,223 | |||||||||
Dynatrace, Inc. (a) | 77,650 | 2,973,995 | |||||||||
Fair Isaac Corp. (a) | 2,740 | 1,640,109 | |||||||||
Five9, Inc. (a) | 8,590 | 582,917 | |||||||||
Paylocity Holding Corp. (a) | 12,560 | 2,439,906 | |||||||||
Varonis Systems, Inc. (a) | 35,950 | 860,643 | |||||||||
10,885,911 | |||||||||||
Total Common Stocks (Cost $95,132,721) | 102,479,999 | ||||||||||
Total Investments (Cost $95,132,721) — 98.1% | 102,479,999 | ||||||||||
Other assets in excess of liabilities — 1.9% | 1,965,132 | ||||||||||
NET ASSETS — 100.00% | $ | 104,445,131 | |||||||||
(a) Non-income producing security.
PLC — Public Limited Company
See notes to financial statements.
45
| Victory Portfolios Victory RS Mid Cap Growth Fund | Schedule of Portfolio Investments December 31, 2022 | ||||||
Security Description | Shares | Value | |||||||||
Common Stocks (100.2%) | |||||||||||
Communication Services (4.6%): | |||||||||||
Pinterest, Inc., Class A (a) | 41,880 | $ | 1,016,846 | ||||||||
Take-Two Interactive Software, Inc. (a) | 6,320 | 658,102 | |||||||||
The Trade Desk, Inc., Class A (a) | 22,570 | 1,011,813 | |||||||||
ZoomInfo Technologies, Inc. (a) | 37,210 | 1,120,393 | |||||||||
3,807,154 | |||||||||||
Communications Equipment (1.0%): | |||||||||||
Arista Networks, Inc. (a) | 6,870 | 833,675 | |||||||||
Consumer Discretionary (13.9%): | |||||||||||
Chipotle Mexican Grill, Inc. (a) | 1,060 | 1,470,739 | |||||||||
Churchill Downs, Inc. | 7,760 | 1,640,697 | |||||||||
Dollar Tree, Inc. (a) | 9,080 | 1,284,275 | |||||||||
Five Below, Inc. (a) | 7,570 | 1,338,906 | |||||||||
Mattel, Inc. (a) | 39,670 | 707,713 | |||||||||
O'Reilly Automotive, Inc. (a) | 1,760 | 1,485,493 | |||||||||
Ralph Lauren Corp. | 4,790 | 506,159 | |||||||||
Tractor Supply Co. | 6,470 | 1,455,556 | |||||||||
Ulta Beauty, Inc. (a) | 2,740 | 1,285,252 | |||||||||
Yum! Brands, Inc. | 2,670 | 341,973 | |||||||||
11,516,763 | |||||||||||
Consumer Staples (3.5%): | |||||||||||
Constellation Brands, Inc., Class A | 6,050 | 1,402,088 | |||||||||
The Hershey Co. | 6,630 | 1,535,309 | |||||||||
2,937,397 | |||||||||||
Electronic Equipment, Instruments & Components (1.1%): | |||||||||||
Keysight Technologies, Inc. (a) | 5,390 | 922,067 | |||||||||
Energy (4.0%): | |||||||||||
Cheniere Energy, Inc. | 5,680 | 851,773 | |||||||||
Diamondback Energy, Inc. | 9,340 | 1,277,525 | |||||||||
Matador Resources Co. | 13,810 | 790,484 | |||||||||
Range Resources Corp. | 15,780 | 394,816 | |||||||||
3,314,598 | |||||||||||
Financials (4.8%): | |||||||||||
FactSet Research Systems, Inc. | 2,920 | 1,171,533 | |||||||||
Kinsale Capital Group, Inc. | 2,510 | 656,415 | |||||||||
LPL Financial Holdings, Inc. | 4,030 | 871,165 | |||||||||
MSCI, Inc. | 2,720 | 1,265,263 | |||||||||
3,964,376 | |||||||||||
Health Care (21.6%): | |||||||||||
Agilent Technologies, Inc. | 16,360 | 2,448,274 | |||||||||
AmerisourceBergen Corp. | 10,380 | 1,720,070 | |||||||||
Dexcom, Inc. (a) | 19,190 | 2,173,075 | |||||||||
Incyte Corp. (a) | 11,380 | 914,042 | |||||||||
Insulet Corp. (a) | 6,060 | 1,784,003 | |||||||||
Jazz Pharmaceuticals PLC (a) | 9,970 | 1,588,321 | |||||||||
See notes to financial statements.
46
| Victory Portfolios Victory RS Mid Cap Growth Fund | Schedule of Portfolio Investments — continued December 31, 2022 | ||||||
Security Description | Shares | Value | |||||||||
Mettler-Toledo International, Inc. (a) | 1,220 | $ | 1,763,449 | ||||||||
ResMed, Inc. | 6,060 | 1,261,268 | |||||||||
Sarepta Therapeutics, Inc. (a) | 14,320 | 1,855,586 | |||||||||
Tenet Healthcare Corp. (a) | 17,190 | 838,700 | |||||||||
Veeva Systems, Inc., Class A (a) | 9,430 | 1,521,813 | |||||||||
17,868,601 | |||||||||||
Industrials (11.2%): | |||||||||||
Advanced Drainage Systems, Inc. | 7,600 | 622,972 | |||||||||
Axon Enterprise, Inc. (a) | 3,400 | 564,162 | |||||||||
Chart Industries, Inc. (a) | 7,110 | 819,285 | |||||||||
Clean Harbors, Inc. (a) | 14,810 | 1,690,117 | |||||||||
CoStar Group, Inc. (a) | 8,520 | 658,426 | |||||||||
Evoqua Water Technologies Corp. (a) | 32,450 | 1,285,020 | |||||||||
HEICO Corp., Class A | 11,330 | 1,357,901 | |||||||||
Saia, Inc. (a) | 3,000 | 629,040 | |||||||||
Verisk Analytics, Inc. | 5,790 | 1,021,472 | |||||||||
WillScot Mobile Mini Holdings Corp. (a) | 13,220 | 597,147 | |||||||||
9,245,542 | |||||||||||
IT Services (6.1%): | |||||||||||
Gartner, Inc. (a) | 3,760 | 1,263,886 | |||||||||
Genpact Ltd. | 18,090 | 837,929 | |||||||||
Jack Henry & Associates, Inc. | 9,160 | 1,608,130 | |||||||||
Okta, Inc. (a) | 12,400 | 847,292 | |||||||||
Toast, Inc., Class A (a) | 26,060 | 469,862 | |||||||||
5,027,099 | |||||||||||
Materials (4.2%): | |||||||||||
Albemarle Corp. | 1,670 | 362,156 | |||||||||
CF Industries Holdings, Inc. | 13,110 | 1,116,972 | |||||||||
Graphic Packaging Holding Co. | 88,850 | 1,976,913 | |||||||||
3,456,041 | |||||||||||
Real Estate (1.2%): | |||||||||||
SBA Communications Corp. | 3,640 | 1,020,328 | |||||||||
Semiconductors & Semiconductor Equipment (7.9%): | |||||||||||
Enphase Energy, Inc. (a) | 7,140 | 1,891,814 | |||||||||
Entegris, Inc. | 15,670 | 1,027,795 | |||||||||
Lattice Semiconductor Corp. (a) | 40,720 | 2,641,914 | |||||||||
Monolithic Power Systems, Inc. | 2,680 | 947,675 | |||||||||
6,509,198 | |||||||||||
Software (15.1%): | |||||||||||
Bill.com Holdings, Inc. (a) | 6,740 | 734,390 | |||||||||
Confluent, Inc., Class A (a) | 18,530 | 412,107 | |||||||||
Datadog, Inc., Class A (a) | 9,220 | 677,670 | |||||||||
Dropbox, Inc., Class A (a) | 44,360 | 992,777 | |||||||||
Dynatrace, Inc. (a) | 34,320 | 1,314,456 | |||||||||
Fair Isaac Corp. (a) | 1,990 | 1,191,174 | |||||||||
Five9, Inc. (a) | 7,290 | 494,699 | |||||||||
Palo Alto Networks, Inc. (a) | 6,140 | 856,776 | |||||||||
See notes to financial statements.
47
| Victory Portfolios Victory RS Mid Cap Growth Fund | Schedule of Portfolio Investments — continued December 31, 2022 | ||||||
Security Description | Shares | Value | |||||||||
Paycom Software, Inc. (a) | 5,510 | $ | 1,709,808 | ||||||||
Splunk, Inc. (a) | 5,730 | 493,296 | |||||||||
Synopsys, Inc. (a) | 9,890 | 3,157,778 | |||||||||
Zscaler, Inc. (a) | 4,470 | 500,193 | |||||||||
12,535,124 | |||||||||||
Total Common Stocks (Cost $71,354,810) | 82,957,963 | ||||||||||
Total Investments (Cost $71,354,810) — 100.2% | 82,957,963 | ||||||||||
Liabilities in excess of other assets — (0.2)% | (146,658 | ) | |||||||||
NET ASSETS — 100.00% | $ | 82,811,305 | |||||||||
(a) Non-income producing security.
PLC — Public Limited Company
See notes to financial statements.
48
| Victory Portfolios Victory RS Growth Fund | Schedule of Portfolio Investments December 31, 2022 | ||||||
Security Description | Shares | Value | |||||||||
Common Stocks (100.0%) | |||||||||||
Communication Services (7.1%): | |||||||||||
Alphabet, Inc., Class C (a) | 111,730 | $ | 9,913,803 | ||||||||
Meta Platforms, Inc., Class A (a) | 18,400 | 2,214,256 | |||||||||
Netflix, Inc. (a) | 8,780 | 2,589,046 | |||||||||
14,717,105 | |||||||||||
Consumer Discretionary (13.9%): | |||||||||||
Amazon.com, Inc. (a) | 95,490 | 8,021,160 | |||||||||
Booking Holdings, Inc. (a) | 1,080 | 2,176,502 | |||||||||
Chipotle Mexican Grill, Inc. (a) | 1,040 | 1,442,990 | |||||||||
Dollar Tree, Inc. (a) | 26,150 | 3,698,656 | |||||||||
O'Reilly Automotive, Inc. (a) | 2,790 | 2,354,844 | |||||||||
Tesla, Inc. (a) | 20,420 | 2,515,336 | |||||||||
Tractor Supply Co. | 18,220 | 4,098,953 | |||||||||
Ulta Beauty, Inc. (a) | 8,010 | 3,757,251 | |||||||||
Yum! Brands, Inc. | 6,530 | 836,362 | |||||||||
28,902,054 | |||||||||||
Consumer Staples (6.0%): | |||||||||||
Constellation Brands, Inc., Class A | 24,800 | 5,747,400 | |||||||||
Costco Wholesale Corp. | 8,170 | 3,729,605 | |||||||||
The Hershey Co. | 13,440 | 3,112,301 | |||||||||
12,589,306 | |||||||||||
Energy (1.7%): | |||||||||||
Cheniere Energy, Inc. | 8,810 | 1,321,148 | |||||||||
Diamondback Energy, Inc. | 15,750 | 2,154,285 | |||||||||
3,475,433 | |||||||||||
Financials (3.2%): | |||||||||||
LPL Financial Holdings, Inc. | 5,150 | 1,113,276 | |||||||||
MSCI, Inc. | 4,290 | 1,995,579 | |||||||||
The Progressive Corp. | 27,180 | 3,525,518 | |||||||||
6,634,373 | |||||||||||
Health Care (13.8%): | |||||||||||
Agilent Technologies, Inc. | 20,280 | 3,034,902 | |||||||||
Dexcom, Inc. (a) | 28,890 | 3,271,504 | |||||||||
Intuitive Surgical, Inc. (a) | 3,550 | 941,992 | |||||||||
Jazz Pharmaceuticals PLC (a) | 26,100 | 4,157,991 | |||||||||
Moderna, Inc. (a) | 14,270 | 2,563,177 | |||||||||
Tenet Healthcare Corp. (a) | 35,130 | 1,713,993 | |||||||||
UnitedHealth Group, Inc. | 11,650 | 6,176,597 | |||||||||
Vertex Pharmaceuticals, Inc. (a) | 24,290 | 7,014,466 | |||||||||
28,874,622 | |||||||||||
Industrials (7.2%): | |||||||||||
CoStar Group, Inc. (a) | 24,570 | 1,898,770 | |||||||||
Deere & Co. | 4,670 | 2,002,309 | |||||||||
HEICO Corp., Class A | 32,350 | 3,877,148 | |||||||||
See notes to financial statements.
49
| Victory Portfolios Victory RS Growth Fund | Schedule of Portfolio Investments — continued December 31, 2022 | ||||||
Security Description | Shares | Value | |||||||||
Old Dominion Freight Line, Inc. | 5,480 | $ | 1,555,114 | ||||||||
Quanta Services, Inc. | 23,080 | 3,288,900 | |||||||||
Verisk Analytics, Inc. | 13,620 | 2,402,840 | |||||||||
15,025,081 | |||||||||||
IT Services (8.5%): | |||||||||||
Block, Inc. (a) | 15,050 | 945,742 | |||||||||
Gartner, Inc. (a) | 7,470 | 2,510,966 | |||||||||
Snowflake, Inc., Class A (a) | 12,250 | 1,758,365 | |||||||||
Toast, Inc., Class A (a) | 104,460 | �� | 1,883,414 | ||||||||
Visa, Inc., Class A | 50,947 | 10,584,749 | |||||||||
17,683,236 | |||||||||||
Materials (1.3%): | |||||||||||
Graphic Packaging Holding Co. | 125,390 | 2,789,928 | |||||||||
Real Estate (0.7%): | |||||||||||
SBA Communications Corp. | 5,130 | 1,437,990 | |||||||||
Semiconductors & Semiconductor Equipment (8.6%): | |||||||||||
Advanced Micro Devices, Inc. (a) | 22,040 | 1,427,531 | |||||||||
Enphase Energy, Inc. (a) | 9,590 | 2,540,966 | |||||||||
KLA Corp. | 4,720 | 1,779,582 | |||||||||
Lam Research Corp. | 7,510 | 3,156,453 | |||||||||
Monolithic Power Systems, Inc. | 7,360 | 2,602,570 | |||||||||
NVIDIA Corp. | 44,130 | 6,449,158 | |||||||||
17,956,260 | |||||||||||
Software (17.8%): | |||||||||||
Intuit, Inc. | 6,600 | 2,568,852 | |||||||||
Microsoft Corp. | 101,200 | 24,269,784 | |||||||||
Palo Alto Networks, Inc. (a) | 11,210 | 1,564,243 | |||||||||
ServiceNow, Inc. (a) | 11,390 | 4,422,395 | |||||||||
Synopsys, Inc. (a) | 8,780 | 2,803,366 | |||||||||
Workday, Inc., Class A (a) | 9,650 | 1,614,734 | |||||||||
37,243,374 | |||||||||||
Technology Hardware, Storage & Peripherals (10.2%): | |||||||||||
Apple, Inc. | 162,788 | 21,151,045 | |||||||||
Total Common Stocks (Cost $147,944,366) | 208,479,807 | ||||||||||
Total Investments (Cost $147,944,366) — 100.0% | 208,479,807 | ||||||||||
Liabilities in excess of other assets — 0.0% | (78,459 | ) | |||||||||
NET ASSETS — 100.00% | $ | 208,401,348 | |||||||||
(a) Non-income producing security.
PLC — Public Limited Company
See notes to financial statements.
50
| Victory Portfolios Victory RS Science and Technology Fund | Schedule of Portfolio Investments December 31, 2022 | ||||||
Security Description | Shares | Value | |||||||||
Common Stocks (100.2%) | |||||||||||
Biotechnology (24.0%): | |||||||||||
Agios Pharmaceuticals, Inc. (a) | 36,840 | $ | 1,034,467 | ||||||||
Aldeyra Therapeutics, Inc. (a) | 118,360 | 823,786 | |||||||||
Amicus Therapeutics, Inc. (a) | 100,670 | 1,229,181 | |||||||||
Apellis Pharmaceuticals, Inc. (a) | 18,513 | 957,307 | |||||||||
Ardelyx, Inc. (a) | 194,710 | 554,923 | |||||||||
Athenex, Inc. (a) | 682,424 | 100,658 | |||||||||
BioCryst Pharmaceuticals, Inc. (a) | 132,970 | 1,526,496 | |||||||||
Bridgebio Pharma, Inc. (a) | 47,790 | 364,160 | |||||||||
Chinook Therapeutics, Inc. (a) | 57,730 | 1,512,526 | |||||||||
Crinetics Pharmaceuticals, Inc. (a) | 44,098 | 806,993 | |||||||||
Cullinan Oncology, Inc. (a) | 27,770 | 292,974 | |||||||||
Cytokinetics, Inc. (a) | 32,870 | 1,506,103 | |||||||||
Equillium, Inc. (a) | 237,401 | 261,141 | |||||||||
Fate Therapeutics, Inc. (a) | 30,110 | 303,810 | |||||||||
FibroGen, Inc. (a) | 29,940 | 479,639 | |||||||||
IGM Biosciences, Inc. (a) (b) | 59,410 | 1,010,564 | |||||||||
Inhibrx, Inc. (a) | 29,270 | 721,213 | |||||||||
Kiniksa Pharmaceuticals Ltd., Class A (a) | 43,640 | 653,727 | |||||||||
Kinnate Biopharma, Inc. (a) (b) | 47,490 | 289,689 | |||||||||
Krystal Biotech, Inc. (a) | 19,810 | 1,569,348 | |||||||||
Kura Oncology, Inc. (a) | 73,830 | 916,230 | |||||||||
Merus NV (a) | 28,000 | 433,160 | |||||||||
Moderna, Inc. (a) | 16,650 | 2,990,673 | |||||||||
Nuvalent, Inc., Class A (a) | 49,030 | 1,460,113 | |||||||||
Opthea Ltd., ADR (a) (c) | 80,050 | 448,280 | |||||||||
Prometheus Biosciences, Inc. (a) | 6,080 | 668,800 | |||||||||
PTC Therapeutics, Inc. (a) | 7,770 | 296,581 | |||||||||
Regulus Therapeutics, Inc. (a) | 176,848 | 242,282 | |||||||||
Relay Therapeutics, Inc. (a) | 29,880 | 446,407 | |||||||||
Replimune Group, Inc. (a) | 36,170 | 983,824 | |||||||||
REVOLUTION Medicines, Inc. (a) | 31,890 | 759,620 | |||||||||
Sarepta Therapeutics, Inc. (a) | 19,830 | 2,569,571 | |||||||||
SpringWorks Therapeutics, Inc. (a) | 51,110 | 1,329,371 | |||||||||
Vaxcyte, Inc. (a) | 34,220 | 1,640,849 | |||||||||
Vertex Pharmaceuticals, Inc. (a) | 28,150 | 8,129,157 | |||||||||
39,313,623 | |||||||||||
Communication Services (6.6%): | |||||||||||
Bandwidth, Inc., Class A (a) | 35,570 | 816,332 | |||||||||
Match Group, Inc. (a) | 18,286 | 758,686 | |||||||||
Meta Platforms, Inc., Class A (a) | 29,340 | 3,530,776 | |||||||||
Netflix, Inc. (a) | 3,150 | 928,872 | |||||||||
Snap, Inc., Class A (a) | 96,100 | 860,095 | |||||||||
Take-Two Interactive Software, Inc. (a) | 19,270 | 2,006,585 | |||||||||
ZoomInfo Technologies, Inc. (a) | 64,240 | 1,934,266 | |||||||||
10,835,612 | |||||||||||
See notes to financial statements.
51
| Victory Portfolios Victory RS Science and Technology Fund | Schedule of Portfolio Investments — continued December 31, 2022 | ||||||
Security Description | Shares | Value | |||||||||
Communications Equipment (0.5%): | |||||||||||
Harmonic, Inc. (a) | 68,090 | $ | 891,979 | ||||||||
Consumer Discretionary (4.8%): | |||||||||||
2U, Inc. (a) | 152,710 | 957,492 | |||||||||
Amazon.com, Inc. (a) | 58,360 | 4,902,240 | |||||||||
Booking Holdings, Inc. (a) | 790 | 1,592,071 | |||||||||
Peloton Interactive, Inc., Class A (a) | 50,030 | 397,238 | |||||||||
7,849,041 | |||||||||||
Financials (0.6%): | |||||||||||
Panacea Acquisition Corp. II (a) (b) | 95,610 | 964,705 | |||||||||
Health Care Technology (0.9%): | |||||||||||
Veeva Systems, Inc., Class A (a) | 8,580 | 1,384,640 | |||||||||
IT Services (7.0%): | |||||||||||
Backblaze, Inc., Class A (a) | 36,080 | 221,892 | |||||||||
GoDaddy, Inc., Class A (a) | 37,180 | 2,781,808 | |||||||||
MongoDB, Inc. (a) | 5,910 | 1,163,324 | |||||||||
Shift4 Payments, Inc., Class A (a) | 26,160 | 1,463,129 | |||||||||
Twilio, Inc., Class A (a) | 20,170 | 987,523 | |||||||||
Visa, Inc., Class A | 17,680 | 3,673,197 | |||||||||
Wix.com Ltd. (a) | 14,860 | 1,141,694 | |||||||||
11,432,567 | |||||||||||
Life Sciences Tools & Services (1.6%): | |||||||||||
Agilent Technologies, Inc. | 11,430 | 1,710,499 | |||||||||
Mettler-Toledo International, Inc. (a) | 610 | 881,725 | |||||||||
2,592,224 | |||||||||||
Pharmaceuticals (4.9%): | |||||||||||
Cara Therapeutics, Inc. (a) | 106,260 | 1,141,232 | |||||||||
Intra-Cellular Therapies, Inc. (a) | 17,510 | 926,629 | |||||||||
Jazz Pharmaceuticals PLC (a) | 25,760 | 4,103,826 | |||||||||
Provention Bio, Inc. (a) | 32,700 | 345,639 | |||||||||
Revance Therapeutics, Inc. (a) | 20,620 | 380,645 | |||||||||
Theravance Biopharma, Inc. (a) | 104,880 | 1,176,754 | |||||||||
8,074,725 | |||||||||||
Semiconductors & Semiconductor Equipment (23.0%): | |||||||||||
Ambarella, Inc. (a) | 35,460 | 2,915,876 | |||||||||
Applied Materials, Inc. | 29,310 | 2,854,208 | |||||||||
Impinj, Inc. (a) | 53,270 | 5,816,019 | |||||||||
Lam Research Corp. | 5,950 | 2,500,785 | |||||||||
Lattice Semiconductor Corp. (a) | 69,420 | 4,503,970 | |||||||||
MACOM Technology Solutions Holdings, Inc. (a) | 99,900 | 6,291,702 | |||||||||
Marvell Technology, Inc. | 48,100 | 1,781,624 | |||||||||
MaxLinear, Inc. (a) | 44,870 | 1,523,336 | |||||||||
Monolithic Power Systems, Inc. | 8,780 | 3,104,696 | |||||||||
NVIDIA Corp. | 15,470 | 2,260,786 | |||||||||
ON Semiconductor Corp. (a) | 18,650 | 1,163,200 | |||||||||
See notes to financial statements.
52
| Victory Portfolios Victory RS Science and Technology Fund | Schedule of Portfolio Investments — continued December 31, 2022 | ||||||
Security Description | Shares | Value | |||||||||
Semtech Corp. (a) | 37,940 | $ | 1,088,499 | ||||||||
Silicon Motion Technology Corp., ADR | 17,370 | 1,128,876 | |||||||||
Wolfspeed, Inc. (a) | 11,110 | 767,034 | |||||||||
37,700,611 | |||||||||||
Software (26.3%): | |||||||||||
AppLovin Corp., Class A (a) | 45,140 | 475,324 | |||||||||
Datadog, Inc., Class A (a) | 14,530 | 1,067,955 | |||||||||
Domo, Inc., Class B (a) | 55,260 | 786,902 | |||||||||
Dropbox, Inc., Class A (a) | 123,270 | 2,758,783 | |||||||||
Dynatrace, Inc. (a) | 41,210 | 1,578,343 | |||||||||
Fair Isaac Corp. (a) | 6,230 | 3,729,153 | |||||||||
Gitlab, Inc., Class A (a) (b) | 23,880 | 1,085,107 | |||||||||
Microsoft Corp. | 65,820 | 15,784,953 | |||||||||
Monday.com Ltd. (a) | 14,790 | 1,804,380 | |||||||||
Paycom Software, Inc. (a) | 11,590 | 3,596,493 | |||||||||
RingCentral, Inc., Class A (a) | 27,720 | 981,288 | |||||||||
ServiceNow, Inc. (a) | 9,160 | 3,556,553 | |||||||||
Sprout Social, Inc., Class A (a) | 31,420 | 1,773,973 | |||||||||
Varonis Systems, Inc. (a) | 168,020 | 4,022,399 | |||||||||
43,001,606 | |||||||||||
Total Common Stocks (Cost $132,428,236) | 164,041,333 | ||||||||||
Warrants (0.0%) (d) | |||||||||||
Health Care (0.0%): | |||||||||||
Athenex, Inc. (c) | 1,346,518 | — | (e) | ||||||||
Nuvation Bio, Inc. | 43,670 | 6,311 | |||||||||
Regulus Therapeutics, Inc. (a) (c) (f) (g) | 132,637 | — | (e) | ||||||||
6,311 | |||||||||||
Total Warrants (Cost $179,261) | 6,311 | ||||||||||
Collateral for Securities Loaned (1.0%)^ | |||||||||||
| Goldman Sachs Financial Square Government Fund, Institutional Shares, 4.14% (h) | 418,005 | 418,005 | |||||||||
HSBC U.S. Government Money Market Fund, Institutional Shares, 4.13% (h) | 418,005 | 418,005 | |||||||||
Invesco Government & Agency Portfolio, Institutional Shares, 4.22% (h) | 418,005 | 418,005 | |||||||||
| Morgan Stanley Institutional Liquidity Government Portfolio, Institutional Shares, 4.08% (h) | 418,005 | 418,005 | |||||||||
Total Collateral for Securities Loaned (Cost $1,672,020) | 1,672,020 | ||||||||||
Total Investments (Cost $134,279,517) — 101.2% | 165,719,664 | ||||||||||
Liabilities in excess of other assets — (1.2)% | (1,890,394 | ) | |||||||||
NET ASSETS — 100.00% | $ | 163,829,270 | |||||||||
^ Purchased with cash collateral from securities on loan.
(a) Non-income producing security.
(b) All or a portion of this security is on loan.
See notes to financial statements.
53
| Victory Portfolios Victory RS Science and Technology Fund | Schedule of Portfolio Investments — continued December 31, 2022 | ||||||
(c) The Fund's Adviser has deemed this security to be illiquid based upon procedures approved by the Board of Trustees. As of December 31, 2022, illiquid securities were 0.3% of net assets.
(d) Amount represents less than 0.05% of net assets.
(e) Rounds to less than $1.
(f) Restricted security that is not registered under the Securities Act of 1933.
(g) The following table details the earliest acquisition date and cost of the Fund's restricted securities at December 31, 2022:
Security Name | Acquisition Date | Cost | |||||||||
Regulus Therapeutics, Inc. | 12/3/2020 | $ | 165,796 | ||||||||
(h) Rate disclosed is the daily yield on December 31, 2022.
ADR — American Depositary Receipt
PLC — Public Limited Company
See notes to financial statements.
54
| Victory Portfolios Victory RS Small Cap Equity Fund | Schedule of Portfolio Investments December 31, 2022 | ||||||
Security Description | Shares | Value | |||||||||
Common Stocks (96.0%) | |||||||||||
Communications Equipment (5.8%): | |||||||||||
Digi International, Inc. (a) | 30,340 | $ | 1,108,927 | ||||||||
Harmonic, Inc. (a) | 85,280 | 1,117,168 | |||||||||
2,226,095 | |||||||||||
Consumer Discretionary (3.2%): | |||||||||||
Acushnet Holdings Corp. | 11,090 | 470,882 | |||||||||
Ralph Lauren Corp. | 7,330 | 774,561 | |||||||||
1,245,443 | |||||||||||
Consumer Staples (6.5%): | |||||||||||
BellRing Brands, Inc. (a) | 40,250 | 1,032,010 | |||||||||
Grocery Outlet Holding Corp. (a) | 50,490 | 1,473,803 | |||||||||
2,505,813 | |||||||||||
Energy (4.8%): | |||||||||||
Denbury, Inc. (a) | 21,130 | 1,838,733 | |||||||||
Financials (7.6%): | |||||||||||
PRA Group, Inc. (a) | 43,660 | 1,474,835 | |||||||||
Trupanion, Inc. (a) (b) | 30,680 | 1,458,220 | |||||||||
2,933,055 | |||||||||||
Health Care (12.4%): | |||||||||||
Agios Pharmaceuticals, Inc. (a) | 14,180 | 398,175 | |||||||||
Apellis Pharmaceuticals, Inc. (a) | 6,410 | 331,461 | |||||||||
BioCryst Pharmaceuticals, Inc. (a) | 45,890 | 526,817 | |||||||||
Evolent Health, Inc., Class A (a) | 15,130 | 424,850 | |||||||||
Halozyme Therapeutics, Inc. (a) | 11,760 | 669,144 | |||||||||
Inspire Medical Systems, Inc. (a) | 3,840 | 967,219 | |||||||||
Intra-Cellular Therapies, Inc. (a) | 5,900 | 312,228 | |||||||||
Kura Oncology, Inc. (a) | 43,410 | 538,718 | |||||||||
Replimune Group, Inc. (a) | 22,040 | 599,488 | |||||||||
4,768,100 | |||||||||||
Industrials (21.6%): | |||||||||||
Ameresco, Inc., Class A (a) | 9,030 | 515,974 | |||||||||
Axon Enterprise, Inc. (a) | 2,230 | 370,024 | |||||||||
Bloom Energy Corp., Class A (a) | 51,560 | 985,827 | |||||||||
CBIZ, Inc. (a) | 23,710 | 1,110,814 | |||||||||
ChargePoint Holdings, Inc. (a) (b) | 35,030 | 333,836 | |||||||||
Chart Industries, Inc. (a) | 12,960 | 1,493,381 | |||||||||
Evoqua Water Technologies Corp. (a) | 59,470 | 2,355,012 | |||||||||
Shoals Technologies Group, Inc., Class A (a) | 47,370 | 1,168,618 | |||||||||
8,333,486 | |||||||||||
IT Services (20.0%): | |||||||||||
Flywire Corp. (a) | 76,920 | 1,882,232 | |||||||||
Marqeta, Inc., Class A (a) | 31,150 | 190,327 | |||||||||
Paya Holdings, Inc. (a) | 109,180 | 859,247 | |||||||||
Paymentus Holdings, Inc., Class A (a) (b) | 111,910 | 896,399 | |||||||||
See notes to financial statements.
55
| Victory Portfolios Victory RS Small Cap Equity Fund | Schedule of Portfolio Investments — continued December 31, 2022 | ||||||
Security Description | Shares | Value | |||||||||
Payoneer Global, Inc. (a) | 302,570 | $ | 1,655,058 | ||||||||
Shift4 Payments, Inc., Class A (a) | 40,080 | 2,241,674 | |||||||||
7,724,937 | |||||||||||
Materials (2.4%): | |||||||||||
Livent Corp. (a) | 47,760 | 948,991 | |||||||||
Semiconductors & Semiconductor Equipment (6.7%): | |||||||||||
Impinj, Inc. (a) | 10,060 | 1,098,351 | |||||||||
MACOM Technology Solutions Holdings, Inc. (a) | 23,690 | 1,491,996 | |||||||||
2,590,347 | |||||||||||
Software (5.0%): | |||||||||||
Paycor HCM, Inc. (a) | 42,080 | 1,029,698 | |||||||||
Sprout Social, Inc., Class A (a) | 15,660 | 884,163 | |||||||||
1,913,861 | |||||||||||
Total Common Stocks (Cost $38,327,244) | 37,028,861 | ||||||||||
Collateral for Securities Loaned (1.7%)^ | |||||||||||
| Goldman Sachs Financial Square Government Fund, Institutional Shares, 4.14% (c) | 160,828 | 160,828 | |||||||||
HSBC U.S. Government Money Market Fund, Institutional Shares, 4.13% (c) | 160,828 | 160,828 | |||||||||
Invesco Government & Agency Portfolio, Institutional Shares, 4.22% (c) | 160,828 | 160,828 | |||||||||
| Morgan Stanley Institutional Liquidity Government Portfolio, Institutional Shares, 4.08% (c) | 160,828 | 160,828 | |||||||||
Total Collateral for Securities Loaned (Cost $643,312) | 643,312 | ||||||||||
Total Investments (Cost $38,970,556) — 97.7% | 37,672,173 | ||||||||||
Other assets in excess of liabilities — 2.3% | 889,948 | ||||||||||
NET ASSETS — 100.00% | $ | 38,562,121 | |||||||||
^ Purchased with cash collateral from securities on loan.
(a) Non-income producing security.
(b) All or a portion of this security is on loan.
(c) Rate disclosed is the daily yield on December 31, 2022.
See notes to financial statements.
56
Victory Portfolios | Statements of Assets and Liabilities December 31, 2022 | ||||||
| Victory RS Small Cap Growth Fund | Victory RS Select Growth Fund | Victory RS Mid Cap Growth Fund | |||||||||||||
Assets: | |||||||||||||||
| Investments, at value (Cost $686,935,396, $95,132,721 and $71,354,810) | $ | 739,518,361 | (a) | $ | 102,479,999 | $ | 82,957,963 | ||||||||
Cash | 2,080,624 | 2,115,786 | — | ||||||||||||
Receivables: | |||||||||||||||
Interest and dividends | 117,205 | 31,698 | 25,641 | ||||||||||||
Capital shares issued | 607,139 | 6,284 | 13,540 | ||||||||||||
Investments sold | 5,711,694 | 197,962 | 1,064,438 | ||||||||||||
From Adviser | — | 22,389 | 48,155 | ||||||||||||
Prepaid expenses | 37,431 | 29,563 | 35,414 | ||||||||||||
Total Assets | 748,072,454 | 104,883,681 | 84,145,151 | ||||||||||||
Liabilities: | |||||||||||||||
Payables: | |||||||||||||||
Collateral received on loaned securities | 6,579,360 | — | — | ||||||||||||
Investments purchased | 1,938,151 | 132,273 | — | ||||||||||||
To custodian | — | — | 248,745 | ||||||||||||
Capital shares redeemed | 6,758,151 | 150,117 | 921,596 | ||||||||||||
Accrued expenses and other payables: | |||||||||||||||
Investment advisory fees | 696,980 | 93,202 | 65,236 | ||||||||||||
Administration fees | 36,206 | 4,993 | 4,097 | ||||||||||||
Custodian fees | — | 1,682 | 19,306 | ||||||||||||
Transfer agent fees | 164,671 | 27,894 | 40,975 | ||||||||||||
Compliance fees | 605 | 86 | 71 | ||||||||||||
Trustees' fees | 157 | 105 | 3 | ||||||||||||
| 12b-1 fees | 36,840 | 9,046 | 6,966 | ||||||||||||
Other accrued expenses | 83,924 | 19,152 | 26,851 | ||||||||||||
Total Liabilities | 16,295,045 | 438,550 | 1,333,846 | ||||||||||||
Net Assets: | |||||||||||||||
| Capital | 1,036,027,376 | 117,871,176 | 103,196,902 | ||||||||||||
Total accumulated earnings/(loss) | (304,249,967 | ) | (13,426,045 | ) | (20,385,597 | ) | |||||||||
Net Assets | $ | 731,777,409 | $ | 104,445,131 | $ | 82,811,305 | |||||||||
Net Assets | |||||||||||||||
Class A | $ | 303,669,301 | $ | 68,906,819 | $ | 47,664,438 | |||||||||
Class C | 5,126,437 | 3,081,849 | 3,311,502 | ||||||||||||
Class R | 2,589,269 | 330,730 | 372,557 | ||||||||||||
Class R6 | 114,850,002 | 593,757 | 2,360,330 | ||||||||||||
Class Y | 305,542,400 | 31,531,976 | 28,191,857 | ||||||||||||
Member Class | — | — | 910,621 | ||||||||||||
Total | $ | 731,777,409 | $ | 104,445,131 | $ | 82,811,305 | |||||||||
| Shares (unlimited number of shares authorized with a par value of $0.001 per share): | |||||||||||||||
Class A | 6,937,193 | 4,443,732 | 3,070,625 | ||||||||||||
Class C | 155,864 | 372,736 | 279,129 | ||||||||||||
Class R | 69,481 | 37,044 | 28,362 | ||||||||||||
Class R6 | 2,418,061 | 33,182 | 141,495 | ||||||||||||
Class Y | 6,470,233 | 1,783,294 | 1,693,179 | ||||||||||||
Member Class | — | — | 58,403 | ||||||||||||
Total | 16,050,832 | 6,669,988 | 5,271,193 | ||||||||||||
| Net asset value, offering (except Class A) and redemption price per share: | |||||||||||||||
Class A | $ | 43.77 | $ | 15.51 | $ | 15.52 | |||||||||
Class C (b) | 32.89 | 8.27 | 11.86 | ||||||||||||
Class R | 37.27 | 8.93 | 13.14 | ||||||||||||
Class R6 | 47.50 | 17.89 | 16.68 | ||||||||||||
Class Y | 47.22 | 17.68 | 16.65 | ||||||||||||
Member Class | — | — | 15.59 | ||||||||||||
Maximum Sales Charge — Class A | 5.75 | % | 5.75 | % | 5.75 | % | |||||||||
| Maximum offering price (100%/(100%-maximum sales charge) of net asset value adjusted to the nearest cent) per share — Class A | $ | 46.44 | $ | 16.46 | $ | 16.47 | |||||||||
(a) Includes $6,600,581 of securities on loan.
(b) Redemption price per share varies by the length of time shares are held.
See notes to financial statements.
57
Victory Portfolios | Statements of Assets and Liabilities December 31, 2022 | ||||||
| Victory RS Growth Fund | Victory RS Science and Technology Fund | Victory RS Small Cap Equity Fund | |||||||||||||
Assets: | |||||||||||||||
| Investments, at value (Cost $147,944,366, $134,279,517 and $38,970,556) | $ | 208,479,807 | $ | 165,719,664 | (a) | $ | 37,672,173 | (c) | |||||||
Cash | — | 459,945 | 1,275,755 | ||||||||||||
Receivables: | |||||||||||||||
Interest and dividends | 42,991 | 20,156 | 6,328 | ||||||||||||
Capital shares issued | 21,975 | 451,922 | 23,659 | ||||||||||||
Investments sold | 2,531,693 | — | 265,979 | ||||||||||||
From Adviser | 33,336 | 394 | 9,188 | ||||||||||||
Prepaid expenses | 29,697 | 32,206 | 24,583 | ||||||||||||
Total Assets | 211,139,499 | 166,684,287 | 39,277,665 | ||||||||||||
Liabilities: | |||||||||||||||
Payables: | |||||||||||||||
Collateral received on loaned securities | — | 1,672,020 | 643,312 | ||||||||||||
To affiliate on interfund lending | 1,968,000 | — | — | ||||||||||||
To custodian | 411 | — | — | ||||||||||||
Investments purchased | 229,644 | 140,402 | — | ||||||||||||
Capital shares redeemed | 309,560 | 810,707 | 16,420 | ||||||||||||
Accrued expenses and other payables: | |||||||||||||||
Investment advisory fees | 139,820 | 144,342 | 25,136 | ||||||||||||
Administration fees | 9,963 | 7,767 | 1,792 | ||||||||||||
Custodian fees | 2,800 | 3,201 | 784 | ||||||||||||
Transfer agent fees | 35,209 | 38,115 | 11,948 | ||||||||||||
Compliance fees | 167 | 127 | 30 | ||||||||||||
Trustees' fees | 106 | 108 | 102 | ||||||||||||
| 12b-1 fees | 21,486 | 16,548 | 4,080 | ||||||||||||
Other accrued expenses | 20,985 | 21,680 | 11,940 | ||||||||||||
Total Liabilities | 2,738,151 | 2,855,017 | 715,544 | ||||||||||||
Net Assets: | |||||||||||||||
| Capital | 156,713,489 | 177,086,493 | 62,710,439 | ||||||||||||
Total accumulated earnings/(loss) | 51,687,859 | (13,257,223 | ) | (24,148,318 | ) | ||||||||||
Net Assets | $ | 208,401,348 | $ | 163,829,270 | $ | 38,562,121 | |||||||||
Net Assets | |||||||||||||||
Class A | $ | 189,041,954 | $ | 130,060,252 | $ | 33,526,509 | |||||||||
Class C | 688,573 | 4,725,359 | 169,116 | ||||||||||||
Class R | 385,160 | 540,725 | 1,575,094 | ||||||||||||
Class Y | 18,285,661 | 28,502,934 | 1,837,521 | ||||||||||||
Member Class | — | — | 1,453,881 | ||||||||||||
Total | $ | 208,401,348 | $ | 163,829,270 | $ | 38,562,121 | |||||||||
| Shares (unlimited number of shares authorized with a par value of $0.001 per share): | |||||||||||||||
Class A | 11,081,555 | 8,524,680 | 4,428,598 | ||||||||||||
Class C | 53,750 | 464,831 | 22,212 | ||||||||||||
Class R | 26,244 | 45,557 | 352,564 | ||||||||||||
Class Y | 1,007,608 | 1,669,172 | 229,481 | ||||||||||||
Member Class | — | — | 191,387 | ||||||||||||
Total | 12,169,157 | 10,704,240 | 5,224,242 | ||||||||||||
| Net asset value, offering (except Class A) and redemption price per share: | |||||||||||||||
Class A | $ | 17.06 | $ | 15.26 | $ | 7.57 | |||||||||
Class C (b) | 12.81 | 10.17 | 7.61 | ||||||||||||
Class R | 14.68 | 11.87 | 4.47 | ||||||||||||
Class Y | 18.15 | 17.08 | 8.01 | ||||||||||||
Member Class | — | — | 7.60 | ||||||||||||
Maximum Sales Charge — Class A | 5.75 | % | 5.75 | % | 5.75 | % | |||||||||
| Maximum offering price (100%/(100%-maximum sales charge) of net asset value adjusted to the nearest cent) per share — Class A | $ | 18.10 | $ | 16.19 | $ | 8.03 | |||||||||
(a) Includes $1,639,291 of securities on loan.
(b) Redemption price per share varies by the length of time shares are held.
(c) Includes $642,562 of securities on loan.
See notes to financial statements.
58
Victory Portfolios | Statements of Operations For the Year Ended December 31, 2022 | ||||||
| Victory RS Small Cap Growth Fund | Victory RS Select Growth Fund | Victory RS Mid Cap Growth Fund | |||||||||||||
Investment Income: | |||||||||||||||
Dividends | $ | 3,807,840 | $ | 500,857 | $ | 896,670 | |||||||||
Interest | 76,964 | 16,130 | 8,993 | ||||||||||||
Securities lending (net of fees) | 108,786 | 1,780 | 4,975 | ||||||||||||
Foreign tax withholding | — | (1,662 | ) | (2,006 | ) | ||||||||||
Total Income | 3,993,590 | 517,105 | 908,632 | ||||||||||||
Expenses: | |||||||||||||||
Investment advisory fees | 11,799,287 | 1,362,946 | 1,809,982 | ||||||||||||
Administration fees | 675,148 | 74,157 | 115,733 | ||||||||||||
Sub-Administration fees | 17,000 | 17,000 | 17,000 | ||||||||||||
| 12b-1 fees — Class A | 1,014,777 | 213,674 | 149,672 | ||||||||||||
| 12b-1 fees — Class C | 69,481 | 50,091 | 67,094 | ||||||||||||
| 12b-1 fees — Class R | 16,295 | 1,971 | 2,140 | ||||||||||||
Custodian fees | 40,362 | 7,525 | 27,964 | ||||||||||||
Transfer agent fees — Class A | 553,855 | 102,472 | 89,304 | ||||||||||||
Transfer agent fees — Class C | 9,185 | 6,300 | 6,353 | ||||||||||||
Transfer agent fees — Class R | 5,845 | 923 | 1,126 | ||||||||||||
Transfer agent fees — Class R6 | 24,801 | 176 | 481 | ||||||||||||
Transfer agent fees — Class Y | 542,812 | 41,452 | 186,403 | ||||||||||||
Transfer agent fees — Member Class | — | — | 2,581 | ||||||||||||
Trustees' fees | 92,850 | 10,922 | 18,039 | ||||||||||||
Compliance fees | 10,661 | 1,136 | 1,861 | ||||||||||||
Legal and audit fees | 72,169 | 16,751 | 18,066 | ||||||||||||
State registration and filing fees | 93,534 | 61,304 | 81,177 | ||||||||||||
Line of credit fees | 4,932 | — | 3,431 | ||||||||||||
Interfund lending | 12,947 | 988 | 10,487 | ||||||||||||
Other expenses | 163,213 | 28,680 | 55,499 | ||||||||||||
| Recoupment of prior expenses waived/reimbursed by Adviser | 144,945 | 105 | 101 | ||||||||||||
Total Expenses | 15,364,099 | 1,998,573 | 2,664,494 | ||||||||||||
Expenses waived/reimbursed by Adviser | (392,843 | ) | (170,568 | ) | (404,134 | ) | |||||||||
Net Expenses | 14,971,256 | 1,828,005 | 2,260,360 | ||||||||||||
Net Investment Income (Loss) | (10,977,666 | ) | (1,310,900 | ) | (1,351,728 | ) | |||||||||
| Realized/Unrealized Gains (Losses) from Investments: | |||||||||||||||
| Net realized gains (losses) from investment securities | (319,455,871 | ) | (19,910,007 | ) | (22,935,468 | ) | |||||||||
| Net change in unrealized appreciation/depreciation on investment securities | (390,066,889 | ) | (39,567,478 | ) | (89,765,514 | ) | |||||||||
| Net realized/unrealized gains (losses) on investments | (709,522,760 | ) | (59,477,485 | ) | (112,700,982 | ) | |||||||||
Change in net assets resulting from operations | $ | (720,500,426 | ) | $ | (60,788,385 | ) | $ | (114,052,710 | ) | ||||||
See notes to financial statements.
59
Victory Portfolios | Statements of Operations For the Year Ended December 31, 2022 | ||||||
| Victory RS Growth Fund | Victory RS Science and Technology Fund | Victory RS Small Cap Equity Fund | |||||||||||||
Investment Income: | |||||||||||||||
Dividends | $ | 1,449,327 | $ | 395,289 | $ | 37,138 | |||||||||
Interest | 9,658 | 19,321 | 7,552 | ||||||||||||
Securities lending (net of fees) | 1,523 | 167,825 | 9,727 | ||||||||||||
Total Income | 1,460,508 | 582,435 | 54,417 | ||||||||||||
Expenses: | |||||||||||||||
Investment advisory fees | 1,928,561 | 2,122,684 | 346,139 | ||||||||||||
Administration fees | 139,941 | 115,473 | 25,117 | ||||||||||||
Sub-Administration fees | 14,000 | 17,000 | 13,500 | ||||||||||||
| 12b-1 fees — Class A | 579,434 | 403,974 | 101,441 | ||||||||||||
| 12b-1 fees — Class C | 10,132 | 63,599 | 2,139 | ||||||||||||
| 12b-1 fees — Class R | 2,115 | 3,206 | 9,088 | ||||||||||||
Custodian fees | 12,174 | 11,976 | 3,692 | ||||||||||||
Transfer agent fees — Class A | 184,849 | 175,687 | 42,800 | ||||||||||||
Transfer agent fees — Class C | 1,239 | 8,921 | 431 | ||||||||||||
Transfer agent fees — Class R | 860 | 1,509 | 3,338 | ||||||||||||
Transfer agent fees — Class Y | 16,742 | 51,543 | 2,484 | ||||||||||||
Transfer agent fees — Member Class | — | — | 4,334 | ||||||||||||
Trustees' fees | 17,947 | 16,566 | 4,927 | ||||||||||||
Compliance fees | 2,111 | 1,790 | 384 | ||||||||||||
Legal and audit fees | 24,599 | 20,642 | 10,784 | ||||||||||||
State registration and filing fees | 46,152 | 58,684 | 65,585 | ||||||||||||
Interfund lending | 1,280 | — | — | ||||||||||||
Other expenses | 27,716 | 24,071 | 14,972 | ||||||||||||
| Recoupment of prior expenses waived/reimbursed by Adviser | 290 | 13,380 | 227 | ||||||||||||
Total Expenses | 3,010,142 | 3,110,705 | 651,382 | ||||||||||||
Expenses waived/reimbursed by Adviser | (237,938 | ) | (38,832 | ) | (45,282 | ) | |||||||||
Net Expenses | 2,772,204 | 3,071,873 | 606,100 | ||||||||||||
Net Investment Income (Loss) | (1,311,696 | ) | (2,489,438 | ) | (551,683 | ) | |||||||||
| Realized/Unrealized Gains (Losses) from Investments: | |||||||||||||||
| Net realized gains (losses) from investment securities | (6,795,394 | ) | (37,644,194 | ) | (22,242,472 | ) | |||||||||
| Net change in unrealized appreciation/depreciation on investment securities | (104,028,974 | ) | (104,458,880 | ) | (1,954,158 | ) | |||||||||
| Net realized/unrealized gains (losses) on investments | (110,824,368 | ) | (142,103,074 | ) | (24,196,630 | ) | |||||||||
Change in net assets resulting from operations | $ | (112,136,064 | ) | $ | (144,592,512 | ) | $ | (24,748,313 | ) | ||||||
See notes to financial statements.
60
Victory Portfolios | Statements of Changes in Net Assets | ||||||
| Victory RS Small Cap Growth Fund | Victory RS Select Growth Fund | Victory RS Mid Cap Growth Fund | |||||||||||||||||||||||||
| Year Ended December 31, 2022 | Year Ended December 31, 2021 | Year Ended December 31, 2022 | Year Ended December 31, 2021 | Year Ended December 31, 2022 | Year Ended December 31, 2021 | ||||||||||||||||||||||
| From Investment Activities: | |||||||||||||||||||||||||||
Operations: | |||||||||||||||||||||||||||
| Net Investment Income (Loss) | $ | (10,977,666 | ) | $ | (29,372,395 | ) | $ | (1,310,900 | ) | $ | (2,675,366 | ) | $ | (1,351,728 | ) | $ | (4,087,360 | ) | |||||||||
| Net realized gains (losses) | (319,455,871 | ) | 337,188,044 | (19,910,007 | ) | 49,019,375 | (22,935,468 | ) | 141,961,315 | ||||||||||||||||||
| Net change in unrealized appreciation/ depreciation | (390,066,889 | ) | (616,704,361 | ) | (39,567,478 | ) | (30,101,172 | ) | (89,765,514 | ) | (112,254,382 | ) | |||||||||||||||
| Change in net assets resulting from operations | (720,500,426 | ) | (308,888,712 | ) | (60,788,385 | ) | 16,242,837 | (114,052,710 | ) | 25,619,573 | |||||||||||||||||
| Distributions to Shareholders: | |||||||||||||||||||||||||||
Class A | (18,502,414 | ) | (93,199,400 | ) | (20,035,467 | ) | (26,927,629 | ) | (2,078,565 | ) | (26,057,513 | ) | |||||||||||||||
Class C | (405,085 | ) | (2,137,568 | ) | (1,370,578 | ) | (3,086,031 | ) | (212,297 | ) | (4,637,294 | ) | |||||||||||||||
Class R | (177,925 | ) | (815,659 | ) | (133,557 | ) | (117,749 | ) | (18,549 | ) | (194,304 | ) | |||||||||||||||
Class R6 | (7,105,818 | ) | (88,002,280 | ) | (148,822 | ) | (257,285 | ) | (102,056 | ) | (6,204,984 | ) | |||||||||||||||
Class Y | (17,565,941 | ) | (137,845,800 | ) | (8,460,125 | ) | (15,262,714 | ) | (1,258,394 | ) | (88,979,683 | ) | |||||||||||||||
Member Class | — | — | — | — | (38,952 | ) | (223,742 | ) | |||||||||||||||||||
| From return of capital: | |||||||||||||||||||||||||||
Class A | (4,376 | ) | — | — | — | (1,216 | ) | — | |||||||||||||||||||
Class C | (196 | ) | — | — | — | (92 | ) | — | |||||||||||||||||||
Class R | (154 | ) | — | — | — | (8 | ) | — | |||||||||||||||||||
Class R6 | (1,539 | ) | — | — | — | (68 | ) | — | |||||||||||||||||||
Class Y | (2,518 | ) | — | — | — | (441 | ) | — | |||||||||||||||||||
Member Class | — | — | — | — | (17 | ) | — | ||||||||||||||||||||
| Change in net assets resulting from distributions to shareholders | (43,765,966 | ) | (322,000,707 | ) | (30,148,549 | ) | (45,651,408 | ) | (3,710,655 | ) | (126,297,520 | ) | |||||||||||||||
| Change in net assets resulting from capital transactions | (751,488,082 | ) | (58,863,607 | ) | (3,300,884 | ) | (5,812,343 | ) | (170,214,981 | ) | (133,837,034 | ) | |||||||||||||||
Change in net assets | (1,515,754,474 | ) | (689,753,026 | ) | (94,237,818 | ) | (35,220,914 | ) | (287,978,346 | ) | (234,514,981 | ) | |||||||||||||||
Net Assets: | |||||||||||||||||||||||||||
Beginning of period | 2,247,531,883 | 2,937,284,909 | 198,682,949 | 233,903,863 | 370,789,651 | 605,304,632 | |||||||||||||||||||||
End of period | $ | 731,777,409 | $ | 2,247,531,883 | $ | 104,445,131 | $ | 198,682,949 | $ | 82,811,305 | $ | 370,789,651 | |||||||||||||||
(continues on next page)
See notes to financial statements.
61
Victory Portfolios | Statements of Changes in Net Assets | ||||||
(continued)
| Victory RS Small Cap Growth Fund | Victory RS Select Growth Fund | Victory RS Mid Cap Growth Fund | |||||||||||||||||||||||||
| Year Ended December 31, 2022 | Year Ended December 31, 2021 | Year Ended December 31, 2022 | Year Ended December 31, 2021 | Year Ended December 31, 2022 | Year Ended December 31, 2021 | ||||||||||||||||||||||
Capital Transactions: | |||||||||||||||||||||||||||
Class A | |||||||||||||||||||||||||||
| Proceeds from shares issued | $ | 34,689,019 | $ | 89,844,368 | $ | 8,975,605 | $ | 17,921,964 | $ | 3,967,445 | $ | 6,325,210 | |||||||||||||||
| Distributions reinvested | 17,776,055 | 89,403,944 | 19,333,593 | 25,918,091 | 1,979,617 | 24,440,661 | |||||||||||||||||||||
| Cost of shares redeemed | (142,233,424 | ) | (186,733,595 | ) | (19,380,348 | ) | (22,842,642 | ) | (15,120,901 | ) | (13,937,984 | ) | |||||||||||||||
Total Class A | $ | (89,768,350 | ) | $ | (7,485,283 | ) | $ | 8,928,850 | $ | 20,997,413 | $ | (9,173,839 | ) | $ | 16,827,887 | ||||||||||||
Class C | |||||||||||||||||||||||||||
| Proceeds from shares issued | $ | 625,784 | $ | 2,244,719 | $ | 187,845 | $ | 306,365 | $ | 71,372 | $ | 259,376 | |||||||||||||||
| Distributions reinvested | 394,946 | 2,073,757 | 1,369,191 | 3,077,902 | 204,364 | 4,489,037 | |||||||||||||||||||||
| Cost of shares redeemed | (3,024,781 | ) | (9,438,427 | ) | (4,364,410 | ) | (15,624,585 | ) | (5,142,350 | ) | (6,018,465 | ) | |||||||||||||||
Total Class C | $ | (2,004,051 | ) | $ | (5,119,951 | ) | $ | (2,807,374 | ) | $ | (12,240,318 | ) | $ | (4,866,614 | ) | $ | (1,270,052 | ) | |||||||||
Class R | |||||||||||||||||||||||||||
| Proceeds from shares issued | $ | 745,476 | $ | 2,591,119 | $ | 210,485 | $ | 57,546 | $ | 25,260 | $ | 38,547 | |||||||||||||||
| Distributions reinvested | 178,079 | 815,659 | 121,460 | 102,008 | 18,557 | 194,304 | |||||||||||||||||||||
| Cost of shares redeemed | (1,456,593 | ) | (5,227,473 | ) | (97,394 | ) | (172,852 | ) | (57,069 | ) | (49,826 | ) | |||||||||||||||
Total Class R | $ | (533,038 | ) | $ | (1,820,695 | ) | $ | 234,551 | $ | (13,298 | ) | $ | (13,252 | ) | $ | 183,025 | |||||||||||
Class R6 | |||||||||||||||||||||||||||
| Proceeds from shares issued | $ | 96,889,445 | $ | 253,929,075 | $ | 85,855 | $ | 694,851 | $ | 653,898 | $ | 6,226,411 | |||||||||||||||
| Distributions reinvested | 5,086,947 | 58,606,415 | 100,398 | 203,176 | 47,220 | 2,271,808 | |||||||||||||||||||||
| Cost of shares redeemed | (418,030,431 | ) | (210,549,047 | ) | (319,771 | ) | (204,355 | ) | (13,908,862 | ) | (11,402,846 | ) | |||||||||||||||
Total Class R6 | $ | (316,054,039 | ) | $ | 101,986,443 | $ | (133,518 | ) | $ | 693,672 | $ | (13,207,744 | ) | $ | (2,904,627 | ) | |||||||||||
Class Y | |||||||||||||||||||||||||||
| Proceeds from shares issued | $ | 109,974,218 | $ | 289,808,108 | $ | 3,558,329 | $ | 8,159,436 | $ | 28,779,430 | $ | 46,902,971 | |||||||||||||||
| Distributions reinvested | 16,535,887 | 125,873,133 | 8,356,319 | 14,112,648 | 1,158,317 | 86,573,237 | |||||||||||||||||||||
| Cost of shares redeemed | (469,638,709 | ) | (562,105,362 | ) | (21,438,041 | ) | (37,521,896 | ) | (173,334,330 | ) | (281,200,740 | ) | |||||||||||||||
Total Class Y | $ | (343,128,604 | ) | $ | (146,424,121 | ) | $ | (9,523,393 | ) | $ | (15,249,812 | ) | $ | (143,396,583 | ) | $ | (147,724,532 | ) | |||||||||
Member Class | |||||||||||||||||||||||||||
| Proceeds from shares issued | $ | — | $ | — | $ | — | $ | — | $ | 907,948 | $ | 1,578,737 | |||||||||||||||
| Distributions reinvested | — | — | — | — | 38,969 | 223,742 | |||||||||||||||||||||
| Cost of shares redeemed | — | — | — | — | (503,866 | ) | (751,214 | ) | |||||||||||||||||||
| Total Member Class | $ | — | $ | — | $ | — | $ | — | $ | 443,051 | $ | 1,051,265 | |||||||||||||||
| Change in net assets resulting from capital transactions | $ | (751,488,082 | ) | $ | (58,863,607 | ) | $ | (3,300,884 | ) | $ | (5,812,343 | ) | $ | (170,214,981 | ) | $ | (133,837,034 | ) | |||||||||
(continues on next page)
See notes to financial statements.
62
Victory Portfolios | Statements of Changes in Net Assets | ||||||
(continued)
| Victory RS Small Cap Growth Fund | Victory RS Select Growth Fund | Victory RS Mid Cap Growth Fund | |||||||||||||||||||||||||
| Year Ended December 31, 2022 | Year Ended December 31, 2021 | Year Ended December 31, 2022 | Year Ended December 31, 2021 | Year Ended December 31, 2022 | Year Ended December 31, 2021 | ||||||||||||||||||||||
Share Transactions: | |||||||||||||||||||||||||||
Class A | |||||||||||||||||||||||||||
Issued | 642,504 | 936,234 | 423,722 | 466,310 | 216,108 | 197,364 | |||||||||||||||||||||
Reinvested | 388,211 | 1,268,501 | 1,189,874 | 872,076 | 121,154 | 980,063 | |||||||||||||||||||||
Redeemed | (2,695,351 | ) | (2,017,589 | ) | (908,860 | ) | (610,699 | ) | (822,712 | ) | (442,275 | ) | |||||||||||||||
Total Class A | (1,664,636 | ) | 187,146 | 704,736 | 727,687 | (485,450 | ) | 735,152 | |||||||||||||||||||
Class C | |||||||||||||||||||||||||||
Issued | 14,959 | 29,248 | 11,998 | 10,395 | 5,143 | 11,496 | |||||||||||||||||||||
Reinvested | 11,475 | 38,142 | 158,105 | 156,239 | 16,362 | 226,635 | |||||||||||||||||||||
Redeemed | (70,838 | ) | (124,132 | ) | (271,514 | ) | (527,470 | ) | (365,714 | ) | (232,518 | ) | |||||||||||||||
Total Class C | (44,404 | ) | (56,742 | ) | (101,411 | ) | (360,836 | ) | (344,209 | ) | 5,613 | ||||||||||||||||
Class R | |||||||||||||||||||||||||||
Issued | 16,278 | 30,001 | 11,044 | 2,155 | 1,657 | 1,297 | |||||||||||||||||||||
Reinvested | 4,567 | 13,371 | 12,990 | 4,957 | 1,342 | 9,044 | |||||||||||||||||||||
Redeemed | (30,824 | ) | (62,252 | ) | (5,834 | ) | (5,456 | ) | (3,376 | ) | (1,602 | ) | |||||||||||||||
Total Class R | (9,979 | ) | (18,880 | ) | 18,200 | 1,656 | (377 | ) | 8,739 | ||||||||||||||||||
Class R6 | |||||||||||||||||||||||||||
Issued | 1,671,138 | 2,569,766 | 4,014 | 16,988 | 30,747 | 187,579 | |||||||||||||||||||||
Reinvested | 102,416 | 772,458 | 5,360 | 6,164 | 2,689 | 85,017 | |||||||||||||||||||||
Redeemed | (7,055,471 | ) | (2,189,573 | ) | (11,644 | ) | (4,924 | ) | (637,517 | ) | (333,844 | ) | |||||||||||||||
Total Class R6 | (5,281,917 | ) | 1,152,651 | (2,270 | ) | 18,228 | (604,081 | ) | (61,248 | ) | |||||||||||||||||
Class Y | |||||||||||||||||||||||||||
Issued | 1,844,212 | 2,889,358 | 134,761 | 196,234 | 1,431,519 | 1,505,331 | |||||||||||||||||||||
Reinvested | 334,804 | 1,666,973 | 451,449 | 431,711 | 66,077 | 3,196,451 | |||||||||||||||||||||
Redeemed | (8,186,782 | ) | (5,767,523 | ) | (841,670 | ) | (876,979 | ) | (9,239,741 | ) | (8,783,601 | ) | |||||||||||||||
Total Class Y | (6,007,766 | ) | (1,211,192 | ) | (255,460 | ) | (249,034 | ) | (7,742,145 | ) | (4,081,819 | ) | |||||||||||||||
Member Class | |||||||||||||||||||||||||||
Issued | — | — | — | — | 46,392 | 48,341 | |||||||||||||||||||||
Reinvested | — | — | — | — | 2,375 | 9,137 | |||||||||||||||||||||
Redeemed | — | — | — | — | (28,882 | ) | (22,262 | ) | |||||||||||||||||||
| Total Member Class | — | — | — | — | 19,885 | 35,216 | |||||||||||||||||||||
Change in Shares | (13,008,702 | ) | 52,983 | 363,795 | 137,701 | (9,156,377 | ) | (3,358,347 | ) | ||||||||||||||||||
See notes to financial statements.
63
Victory Portfolios | Statements of Changes in Net Assets | ||||||
| Victory RS Growth Fund | Victory RS Science and Technology Fund | Victory RS Small Cap Equity Fund | |||||||||||||||||||||||||
| Year Ended December 31, 2022 | Year Ended December 31, 2021 | Year Ended December 31, 2022 | Year Ended December 31, 2021 | Year Ended December 31, 2022 | Year Ended December 31, 2021 | ||||||||||||||||||||||
From Investment Activities: | |||||||||||||||||||||||||||
Operations: | |||||||||||||||||||||||||||
| Net Investment Income (Loss) | $ | (1,311,696 | ) | $ | (2,257,413 | ) | $ | (2,489,438 | ) | $ | (5,282,484 | ) | $ | (551,683 | ) | $ | (949,053 | ) | |||||||||
| Net realized gains (losses) | (6,795,394 | ) | 34,175,683 | (37,644,194 | ) | 62,995,967 | (22,242,472 | ) | 12,976,234 | ||||||||||||||||||
| Net change in unrealized appreciation/ depreciation | (104,028,974 | ) | 27,407,434 | (104,458,880 | ) | (94,329,136 | ) | (1,954,158 | ) | (17,969,992 | ) | ||||||||||||||||
| Change in net assets resulting from operations | (112,136,064 | ) | 59,325,704 | (144,592,512 | ) | (36,615,653 | ) | (24,748,313 | ) | (5,942,811 | ) | ||||||||||||||||
| Distributions to Shareholders: | |||||||||||||||||||||||||||
Class A | (4,384,332 | ) | (25,870,624 | ) | (6,552,743 | ) | (34,393,562 | ) | (3,365,864 | ) | (11,807,040 | ) | |||||||||||||||
Class C | (20,160 | ) | (185,893 | ) | (350,891 | ) | (2,079,381 | ) | (16,789 | ) | (74,046 | ) | |||||||||||||||
Class R | (10,161 | ) | (49,973 | ) | (33,888 | ) | (176,750 | ) | (247,981 | ) | (801,530 | ) | |||||||||||||||
Class Y | (401,226 | ) | (2,769,379 | ) | (1,342,160 | ) | (10,284,801 | ) | (181,269 | ) | (754,635 | ) | |||||||||||||||
Member Class | — | — | — | — | (138,235 | ) | (248,472 | ) | |||||||||||||||||||
| Change in net assets resulting from distributions to shareholders | (4,815,879 | ) | (28,875,869 | ) | (8,279,682 | ) | (46,934,494 | ) | (3,950,138 | ) | (13,685,723 | ) | |||||||||||||||
| Change in net assets resulting from capital transactions | (19,356,756 | ) | 5,846,536 | (27,125,371 | ) | (22,173,579 | ) | (1,256,231 | ) | 3,027,200 | |||||||||||||||||
Change in net assets | (136,308,699 | ) | 36,296,371 | (179,997,565 | ) | (105,723,726 | ) | (29,954,682 | ) | (16,601,334 | ) | ||||||||||||||||
Net Assets: | |||||||||||||||||||||||||||
Beginning of period | 344,710,047 | 308,413,676 | 343,826,835 | 449,550,561 | 68,516,803 | 85,118,137 | |||||||||||||||||||||
End of period | $ | 208,401,348 | $ | 344,710,047 | $ | 163,829,270 | $ | 343,826,835 | $ | 38,562,121 | $ | 68,516,803 | |||||||||||||||
(continues on next page)
See notes to financial statements.
64
Victory Portfolios | Statements of Changes in Net Assets | ||||||
(continued)
| Victory RS Growth Fund | Victory RS Science and Technology Fund | Victory RS Small Cap Equity Fund | |||||||||||||||||||||||||
| Year Ended December 31, 2022 | Year Ended December 31, 2021 | Year Ended December 31, 2022 | Year Ended December 31, 2021 | Year Ended December 31, 2022 | Year Ended December 31, 2021 | ||||||||||||||||||||||
Capital Transactions: | |||||||||||||||||||||||||||
Class A | |||||||||||||||||||||||||||
| Proceeds from shares issued | $ | 4,167,043 | $ | 8,581,742 | $ | 15,185,266 | $ | 39,004,944 | $ | 1,336,251 | $ | 6,230,569 | |||||||||||||||
| Distributions reinvested | 4,245,969 | 25,028,143 | 6,247,783 | 32,658,932 | 3,311,927 | 11,648,399 | |||||||||||||||||||||
| Cost of shares redeemed | (22,830,119 | ) | (26,382,488 | ) | (27,288,651 | ) | (80,772,344 | ) | (6,588,878 | ) | (16,789,674 | ) | |||||||||||||||
Total Class A | $ | (14,417,107 | ) | $ | 7,227,397 | $ | (5,855,602 | ) | $ | (9,108,468 | ) | $ | (1,940,700 | ) | $ | 1,089,294 | |||||||||||
Class C | |||||||||||||||||||||||||||
| Proceeds from shares issued | $ | 57,563 | $ | 35,326 | $ | 445,137 | $ | 1,707,463 | $ | 10,390 | $ | 287,897 | |||||||||||||||
| Distributions reinvested | 20,117 | 185,474 | 350,538 | 2,077,315 | 16,789 | 74,046 | |||||||||||||||||||||
| Cost of shares redeemed | (600,243 | ) | (2,443,080 | ) | (2,346,110 | ) | (7,751,009 | ) | (92,428 | ) | (383,060 | ) | |||||||||||||||
Total Class C | $ | (522,563 | ) | $ | (2,222,280 | ) | $ | (1,550,435 | ) | $ | (3,966,231 | ) | $ | (65,249 | ) | $ | (21,117 | ) | |||||||||
Class R | |||||||||||||||||||||||||||
| Proceeds from shares issued | $ | 78,198 | $ | 44,677 | $ | 142,859 | $ | 339,728 | $ | 107,572 | $ | 135,914 | |||||||||||||||
| Distributions reinvested | 10,161 | 49,973 | 33,888 | 176,750 | 247,981 | 801,530 | |||||||||||||||||||||
| Cost of shares redeemed | (49,319 | ) | (6,705 | ) | (242,176 | ) | (401,462 | ) | (472,276 | ) | (247,781 | ) | |||||||||||||||
Total Class R | $ | 39,040 | $ | 87,945 | $ | (65,429 | ) | $ | 115,016 | $ | (116,723 | ) | $ | 689,663 | |||||||||||||
Class Y | |||||||||||||||||||||||||||
| Proceeds from shares issued | $ | 1,658,485 | $ | 4,167,842 | $ | 9,412,717 | $ | 23,988,683 | $ | 785,431 | $ | 1,018,845 | |||||||||||||||
| Distributions reinvested | 385,722 | 2,657,237 | 1,286,976 | 9,629,680 | 181,126 | 752,967 | |||||||||||||||||||||
| Cost of shares redeemed | (6,500,333 | ) | (6,071,605 | ) | (30,353,598 | ) | (42,832,259 | ) | (929,618 | ) | (2,043,606 | ) | |||||||||||||||
Total Class Y | $ | (4,456,126 | ) | $ | 753,474 | $ | (19,653,905 | ) | $ | (9,213,896 | ) | $ | 36,939 | $ | (271,794 | ) | |||||||||||
Member Class | |||||||||||||||||||||||||||
| Proceeds from shares issued | $ | — | $ | — | $ | — | $ | — | $ | 891,336 | $ | 3,375,015 | |||||||||||||||
| Distributions reinvested | — | — | — | — | 138,235 | 248,472 | |||||||||||||||||||||
| Cost of shares redeemed | — | — | — | — | (200,069 | ) | (2,082,333 | ) | |||||||||||||||||||
| Total Member Class | $ | — | $ | — | $ | — | $ | — | $ | 829,502 | $ | 1,541,154 | |||||||||||||||
| Change in net assets resulting from capital transactions | $ | (19,356,756 | ) | $ | 5,846,536 | $ | (27,125,371 | ) | $ | (22,173,579 | ) | $ | (1,256,231 | ) | $ | 3,027,200 | |||||||||||
(continues on next page)
See notes to financial statements.
65
Victory Portfolios | Statements of Changes in Net Assets | ||||||
(continued)
| Victory RS Growth Fund | Victory RS Science and Technology Fund | Victory RS Small Cap Equity Fund | |||||||||||||||||||||||||
| Year Ended December 31, 2022 | Year Ended December 31, 2021 | Year Ended December 31, 2022 | Year Ended December 31, 2021 | Year Ended December 31, 2022 | Year Ended December 31, 2021 | ||||||||||||||||||||||
Share Transactions: | |||||||||||||||||||||||||||
Class A | |||||||||||||||||||||||||||
Issued | 201,829 | 331,479 | 778,358 | 1,081,400 | 135,071 | 357,336 | |||||||||||||||||||||
Reinvested | 233,654 | 986,288 | 386,149 | 1,203,351 | 416,071 | 919,369 | |||||||||||||||||||||
Redeemed | (1,159,967 | ) | (1,018,990 | ) | (1,478,555 | ) | (2,265,845 | ) | (679,387 | ) | (971,778 | ) | |||||||||||||||
Total Class A | (724,484 | ) | 298,777 | (314,048 | ) | 18,906 | (128,245 | ) | 304,927 | ||||||||||||||||||
Class C | |||||||||||||||||||||||||||
Issued | 3,767 | 1,742 | 34,476 | 63,027 | 1,018 | 14,861 | (a) | ||||||||||||||||||||
Reinvested | 1,474 | 9,590 | 32,517 | 111,205 | 2,096 | 5,771 | (a) | ||||||||||||||||||||
Redeemed | (38,402 | ) | (122,847 | ) | (175,396 | ) | (287,361 | ) | (9,053 | ) | (20,482 | )(a) | |||||||||||||||
Total Class C | (33,161 | ) | (111,515 | ) | (108,403 | ) | (113,129 | ) | (5,939 | ) | 150 | (a) | |||||||||||||||
Class R | |||||||||||||||||||||||||||
Issued | 4,408 | 1,987 | 10,203 | 11,369 | 18,650 | 11,074 | |||||||||||||||||||||
Reinvested | 650 | 2,268 | 2,693 | 8,213 | 52,762 | 100,191 | |||||||||||||||||||||
Redeemed | (2,702 | ) | (287 | ) | (15,852 | ) | (13,534 | ) | (69,318 | ) | (20,803 | ) | |||||||||||||||
Total Class R | 2,356 | 3,968 | (2,956 | ) | 6,048 | 2,094 | 90,462 | ||||||||||||||||||||
Class Y | |||||||||||||||||||||||||||
Issued | 74,901 | 159,034 | 448,635 | 604,120 | 83,100 | 56,893 | |||||||||||||||||||||
Reinvested | 19,955 | 98,559 | 71,104 | 319,286 | 21,511 | 56,614 | |||||||||||||||||||||
Redeemed | (306,355 | ) | (227,354 | ) | (1,425,501 | ) | (1,098,885 | ) | (96,462 | ) | (129,973 | ) | |||||||||||||||
Total Class Y | (211,499 | ) | 30,239 | (905,762 | ) | (175,479 | ) | 8,149 | (16,466 | ) | |||||||||||||||||
Member Class | |||||||||||||||||||||||||||
Issued | — | — | — | — | 92,568 | 188,543 | |||||||||||||||||||||
Reinvested | — | — | — | — | 17,301 | 19,580 | |||||||||||||||||||||
Redeemed | — | — | — | — | (22,922 | ) | (115,794 | ) | |||||||||||||||||||
| Total Member Class | — | — | — | — | 86,947 | 92,329 | |||||||||||||||||||||
Change in Shares | (966,788 | ) | 221,469 | (1,331,169 | ) | (263,654 | ) | (36,994 | ) | 471,402 | |||||||||||||||||
(a) As described in Note 8 of the accompanying notes to financial statements, Victory RS Small Cap Equity Fund Class C share amounts were adjusted for a 1:12 reverse stock split.
See notes to financial statements.
66
Victory Portfolios | Financial Highlights | ||||||
For a Share Outstanding Throughout Each Period
Victory RS Small Cap Growth Fund | |||||||||||||||||||||||
Class A | |||||||||||||||||||||||
| Year Ended December 31, 2022 | Year Ended December 31, 2021 | Year Ended December 31, 2020 | Year Ended December 31, 2019 | Year Ended December 31, 2018 | |||||||||||||||||||
Net Asset Value, Beginning of Period | $ | 73.73 | $ | 97.45 | $ | 77.19 | $ | 61.11 | $ | 80.96 | |||||||||||||
Investment Activities: | |||||||||||||||||||||||
Net investment income (loss) (a) | (0.57 | ) | (1.20 | ) | (0.97 | ) | (0.80 | ) | (0.83 | ) | |||||||||||||
| Net realized and unrealized gains (losses) | (26.65 | ) | (10.15 | ) | 30.04 | 23.84 | (6.54 | ) | |||||||||||||||
| Total from Investment Activities | (27.22 | ) | (11.35 | ) | 29.07 | 23.04 | (7.37 | ) | |||||||||||||||
Distributions to Shareholders From: | |||||||||||||||||||||||
Net realized gains from investments | (2.74 | ) | (12.37 | ) | (8.81 | ) | (6.96 | ) | (12.48 | ) | |||||||||||||
Return of capital | — | (b) | — | — | — | — | |||||||||||||||||
Total Distributions | (2.74 | ) | (12.37 | ) | (8.81 | ) | (6.96 | ) | (12.48 | ) | |||||||||||||
Net Asset Value, End of Period | $ | 43.77 | $ | 73.73 | $ | 97.45 | $ | 77.19 | $ | 61.11 | |||||||||||||
Total Return (excludes sales charge) (c) | (37.07 | )% | (11.06 | )% | 37.84 | % | 37.91 | % | (8.97 | )% | |||||||||||||
Ratios to Average Net Assets: | |||||||||||||||||||||||
Net Expenses (d) | 1.40 | % | 1.40 | % | 1.40 | % | 1.40 | % | 1.40 | % | |||||||||||||
Net Investment Income (Loss) | (1.08 | )% | (1.27 | )% | (1.20 | )% | (1.06 | )% | (0.94 | )% | |||||||||||||
Gross Expenses (d) | 1.44 | % | 1.42 | % | 1.43 | % | 1.44 | % | 1.45 | % | |||||||||||||
Supplemental Data: | |||||||||||||||||||||||
Net Assets at end of period (000's) | $ | 303,669 | $ | 634,204 | $ | 820,006 | $ | 687,425 | $ | 499,350 | |||||||||||||
Portfolio Turnover (e) | 105 | % | 92 | % | 72 | % | 100 | % | 86 | % | |||||||||||||
(continues on next page)
See notes to financial statements.
67
Victory Portfolios | Financial Highlights — continued | ||||||
For a Share Outstanding Throughout Each Period
Victory RS Small Cap Growth Fund | |||||||||||||||||||||||
Class C | |||||||||||||||||||||||
| Year Ended December 31, 2022 | Year Ended December 31, 2021 | Year Ended December 31, 2020 | Year Ended December 31, 2019 | Year Ended December 31, 2018 | |||||||||||||||||||
Net Asset Value, Beginning of Period | $ | 56.86 | $ | 79.07 | $ | 64.34 | $ | 52.19 | $ | 71.70 | |||||||||||||
Investment Activities: | |||||||||||||||||||||||
Net investment income (loss) (a) | (0.75 | ) | (1.55 | ) | (1.30 | ) | (1.17 | ) | (1.31 | ) | |||||||||||||
| Net realized and unrealized gains (losses) | (20.48 | ) | (8.29 | ) | 24.84 | 20.28 | (5.72 | ) | |||||||||||||||
| Total from Investment Activities | (21.23 | ) | (9.84 | ) | 23.54 | 19.11 | (7.03 | ) | |||||||||||||||
Distributions to Shareholders From: | |||||||||||||||||||||||
Net realized gains from investments | (2.74 | ) | (12.37 | ) | (8.81 | ) | (6.96 | ) | (12.48 | ) | |||||||||||||
Return of capital | — | (b) | — | — | — | — | |||||||||||||||||
Total Distributions | (2.74 | ) | (12.37 | ) | (8.81 | ) | (6.96 | ) | (12.48 | ) | |||||||||||||
Net Asset Value, End of Period | $ | 32.89 | $ | 56.86 | $ | 79.07 | $ | 64.34 | $ | 52.19 | |||||||||||||
| Total Return (excludes contingent deferred sales charge) (c) | (37.55 | )% | (11.73 | )% | 36.78 | % | 36.88 | % | (9.66 | )% | |||||||||||||
Ratios to Average Net Assets: | |||||||||||||||||||||||
Net Expenses (d) | 2.16 | % | 2.16 | % | 2.16 | % | 2.16 | % | 2.16 | % | |||||||||||||
Net Investment Income (Loss) | (1.84 | )% | (2.03 | )% | (1.96 | )% | (1.82 | )% | (1.71 | )% | |||||||||||||
Gross Expenses (d) | 2.31 | % | 2.16 | % | 2.26 | % | 2.27 | % | 2.26 | % | |||||||||||||
Supplemental Data: | |||||||||||||||||||||||
Net Assets at end of period (000's) | $ | 5,126 | $ | 11,387 | $ | 20,323 | $ | 18,581 | $ | 13,602 | |||||||||||||
Portfolio Turnover (e) | 105 | % | 92 | % | 72 | % | 100 | % | 86 | % | |||||||||||||
(continues on next page)
See notes to financial statements.
68
Victory Portfolios | Financial Highlights — continued | ||||||
For a Share Outstanding Throughout Each Period
Victory RS Small Cap Growth Fund | |||||||||||||||||||||||
Class R | |||||||||||||||||||||||
| Year Ended December 31, 2022 | Year Ended December 31, 2021 | Year Ended December 31, 2020 | Year Ended December 31, 2019 | Year Ended December 31, 2018 | |||||||||||||||||||
Net Asset Value, Beginning of Period | $ | 63.68 | $ | 86.56 | $ | 69.61 | $ | 55.87 | $ | 75.55 | |||||||||||||
Investment Activities: | |||||||||||||||||||||||
Net investment income (loss) (a) | (0.70 | ) | (1.45 | ) | (1.20 | ) | (1.05 | ) | (1.15 | ) | |||||||||||||
| Net realized and unrealized gains (losses) | (22.97 | ) | (9.06 | ) | 26.96 | 21.75 | (6.05 | ) | |||||||||||||||
| Total from Investment Activities | (23.67 | ) | (10.51 | ) | 25.76 | 20.70 | (7.20 | ) | |||||||||||||||
Distributions to Shareholders From: | |||||||||||||||||||||||
Net realized gains from investments | (2.74 | ) | (12.37 | ) | (8.81 | ) | (6.96 | ) | (12.48 | ) | |||||||||||||
Return of capital | — | (b) | — | — | — | — | |||||||||||||||||
Total Distributions | (2.74 | ) | (12.37 | ) | (8.81 | ) | (6.96 | ) | (12.48 | ) | |||||||||||||
Net Asset Value, End of Period | $ | 37.27 | $ | 63.68 | $ | 86.56 | $ | 69.61 | $ | 55.87 | |||||||||||||
Total Return (c) | (37.36 | )% | (11.51 | )% | 37.20 | % | 37.28 | % | (9.39 | )% | |||||||||||||
Ratios to Average Net Assets: | |||||||||||||||||||||||
Net Expenses (d) | 1.86 | % | 1.86 | % | 1.86 | % | 1.86 | % | 1.86 | % | |||||||||||||
Net Investment Income (Loss) | (1.54 | )% | (1.73 | )% | (1.66 | )% | (1.52 | )% | (1.40 | )% | |||||||||||||
Gross Expenses (d) | 2.02 | % | 1.86 | % | 1.97 | % | 1.93 | % | 1.87 | % | |||||||||||||
Supplemental Data: | |||||||||||||||||||||||
Net Assets at end of period (000's) | $ | 2,589 | $ | 5,060 | $ | 8,513 | $ | 8,012 | $ | 7,285 | |||||||||||||
Portfolio Turnover (e) | 105 | % | 92 | % | 72 | % | 100 | % | 86 | % | |||||||||||||
(continues on next page)
See notes to financial statements.
69
Victory Portfolios | Financial Highlights — continued | ||||||
For a Share Outstanding Throughout Each Period
Victory RS Small Cap Growth Fund | |||||||||||||||||||||||
Class R6 | |||||||||||||||||||||||
| Year Ended December 31, 2022 | Year Ended December 31, 2021 | Year Ended December 31, 2020 | Year Ended December 31, 2019 | Year Ended December 31, 2018 | |||||||||||||||||||
Net Asset Value, Beginning of Period | $ | 79.37 | $ | 103.42 | $ | 81.24 | $ | 63.83 | $ | 83.67 | |||||||||||||
Investment Activities: | |||||||||||||||||||||||
Net investment income (loss) (a) | (0.43 | ) | (0.91 | ) | (0.73 | ) | (0.58 | ) | (0.58 | ) | |||||||||||||
| Net realized and unrealized gains (losses) | (28.70 | ) | (10.77 | ) | 31.72 | 24.95 | (6.78 | ) | |||||||||||||||
| Total from Investment Activities | (29.13 | ) | (11.68 | ) | 30.99 | 24.37 | (7.36 | ) | |||||||||||||||
Distributions to Shareholders From: | |||||||||||||||||||||||
Net realized gains from investments | (2.74 | ) | (12.37 | ) | (8.81 | ) | (6.96 | ) | (12.48 | ) | |||||||||||||
Return of capital | — | (b) | — | — | — | — | |||||||||||||||||
Total Distributions | (2.74 | ) | (12.37 | ) | (8.81 | ) | (6.96 | ) | (12.48 | ) | |||||||||||||
Net Asset Value, End of Period | $ | 47.50 | $ | 79.37 | $ | 103.42 | $ | 81.24 | $ | 63.83 | |||||||||||||
Total Return (c) | (36.86 | )% | (10.74 | )% | 38.32 | % | 38.38 | % | (8.66 | )% | |||||||||||||
Ratios to Average Net Assets: | |||||||||||||||||||||||
Net Expenses (d) | 1.05 | % | 1.04 | % | 1.06 | % | 1.06 | % | 1.06 | % | |||||||||||||
Net Investment Income (Loss) | (0.74 | )% | (0.91 | )% | (0.86 | )% | (0.72 | )% | (0.64 | )% | |||||||||||||
Gross Expenses (d) | 1.05 | % | 1.04 | % | 1.06 | % | 1.06 | % | 1.10 | % | |||||||||||||
Supplemental Data: | |||||||||||||||||||||||
Net Assets at end of period (000's) | $ | 114,850 | $ | 611,157 | $ | 677,128 | $ | 441,471 | $ | 113,288 | |||||||||||||
Portfolio Turnover (e) | 105 | % | 92 | % | 72 | % | 100 | % | 86 | % | |||||||||||||
(continues on next page)
See notes to financial statements.
70
Victory Portfolios | Financial Highlights — continued | ||||||
For a Share Outstanding Throughout Each Period
Victory RS Small Cap Growth Fund | |||||||||||||||||||||||
Class Y | |||||||||||||||||||||||
| Year Ended December 31, 2022 | Year Ended December 31, 2021 | Year Ended December 31, 2020 | Year Ended December 31, 2019 | Year Ended December 31, 2018 | |||||||||||||||||||
Net Asset Value, Beginning of Period | $ | 79.00 | $ | 103.10 | $ | 81.06 | $ | 63.75 | $ | 83.64 | |||||||||||||
Investment Activities: | |||||||||||||||||||||||
Net investment income (loss) (a) | (0.47 | ) | (1.00 | ) | (0.79 | ) | (0.62 | ) | (0.61 | ) | |||||||||||||
| Net realized and unrealized gains (losses) | (28.57 | ) | (10.73 | ) | 31.64 | 24.89 | (6.80 | ) | |||||||||||||||
| Total from Investment Activities | (29.04 | ) | (11.73 | ) | 30.85 | 24.27 | (7.41 | ) | |||||||||||||||
Distributions to Shareholders From: | |||||||||||||||||||||||
Net realized gains from investments | (2.74 | ) | (12.37 | ) | (8.81 | ) | (6.96 | ) | (12.48 | ) | |||||||||||||
Return of capital | — | (b) | — | — | — | — | |||||||||||||||||
Total Distributions | (2.74 | ) | (12.37 | ) | (8.81 | ) | (6.96 | ) | (12.48 | ) | |||||||||||||
Net Asset Value, End of Period | $ | 47.22 | $ | 79.00 | $ | 103.10 | $ | 81.06 | $ | 63.75 | |||||||||||||
Total Return (c) | (36.92 | )% | (10.82 | )% | 38.21 | % | 38.29 | % | (8.72 | )% | |||||||||||||
Ratios to Average Net Assets: | |||||||||||||||||||||||
Net Expenses (d) | 1.13 | % | 1.13 | % | 1.13 | % | 1.13 | % | 1.13 | % | |||||||||||||
Net Investment Income (Loss) | (0.81 | )% | (1.00 | )% | (0.93 | )% | (0.79 | )% | (0.67 | )% | |||||||||||||
Gross Expenses (d) | 1.17 | % | 1.14 | % | 1.15 | % | 1.15 | % | 1.15 | % | |||||||||||||
Supplemental Data: | |||||||||||||||||||||||
Net Assets at end of period (000's) | $ | 305,542 | $ | 985,724 | $ | 1,411,316 | $ | 1,131,648 | $ | 967,112 | |||||||||||||
Portfolio Turnover (e) | 105 | % | 92 | % | 72 | % | 100 | % | 86 | % | |||||||||||||
(a) Per share net investment income (loss) has been calculated using the average daily shares method.
(b) Amount is less than $0.005.
(c) Assumes reinvestment of all net investment income and realized capital gain distributions, if any, during the period. Includes adjustments in accordance with U.S. Generally Accepted Accounting Principles and could differ from the reported total return.
(d) Does not include acquired fund fees and expenses, if any.
(e) Portfolio turnover is calculated on the basis of the Fund as a whole without distinguishing between the classes of shares.
See notes to financial statements.
71
Victory Portfolios | Financial Highlights | ||||||
For a Share Outstanding Throughout Each Period
Victory RS Select Growth Fund | |||||||||||||||||||||||
Class A | |||||||||||||||||||||||
| Year Ended December 31, 2022 | Year Ended December 31, 2021 | Year Ended December 31, 2020 | Year Ended December 31, 2019 | Year Ended December 31, 2018 | |||||||||||||||||||
Net Asset Value, Beginning of Period | $ | 31.30 | $ | 38.19 | $ | 33.81 | $ | 28.96 | $ | 46.03 | |||||||||||||
Investment Activities: | |||||||||||||||||||||||
Net investment income (loss) (a) | (0.24 | ) | (0.49 | ) | (0.40 | ) | (0.37 | ) | (0.42 | ) | |||||||||||||
| Net realized and unrealized gains (losses) | (9.65 | ) | 2.64 | 11.43 | 9.68 | (3.12 | ) | ||||||||||||||||
| Total from Investment Activities | (9.89 | ) | 2.15 | 11.03 | 9.31 | (3.54 | ) | ||||||||||||||||
Distributions to Shareholders From: | |||||||||||||||||||||||
Net realized gains from investments | (5.90 | ) | (9.04 | ) | (6.65 | ) | (4.46 | ) | (13.53 | ) | |||||||||||||
Total Distributions | (5.90 | ) | (9.04 | ) | (6.65 | ) | (4.46 | ) | (13.53 | ) | |||||||||||||
Net Asset Value, End of Period | $ | 15.51 | $ | 31.30 | $ | 38.19 | $ | 33.81 | $ | 28.96 | |||||||||||||
Total Return (excludes sales charge) (b) | (32.43 | )% | 6.89 | % | 33.22 | % | 32.29 | % | (7.23 | )% | |||||||||||||
Ratios to Average Net Assets: | |||||||||||||||||||||||
Net Expenses (c) | 1.40 | % | 1.40 | % | 1.40 | % | 1.40 | % | 1.40 | % | |||||||||||||
Net Investment Income (Loss) | (1.02 | )% | (1.21 | )% | (1.14 | )% | (1.06 | )% | (0.86 | )% | |||||||||||||
Gross Expenses (c) | 1.51 | % | 1.48 | % | 1.49 | % | 1.52 | % | 1.50 | % | |||||||||||||
Supplemental Data: | |||||||||||||||||||||||
Net Assets at end of period (000's) | $ | 68,907 | $ | 117,017 | $ | 115,014 | $ | 97,337 | $ | 94,393 | |||||||||||||
Portfolio Turnover (d) | 131 | %(e) | 75 | % | 73 | % | 74 | % | 79 | % | |||||||||||||
(continues on next page)
See notes to financial statements.
72
Victory Portfolios | Financial Highlights — continued | ||||||
For a Share Outstanding Throughout Each Period
Victory RS Select Growth Fund | |||||||||||||||||||||||
Class C | |||||||||||||||||||||||
| Year Ended December 31, 2022 | Year Ended December 31, 2021 | Year Ended December 31, 2020 | Year Ended December 31, 2019 | Year Ended December 31, 2018 | |||||||||||||||||||
Net Asset Value, Beginning of Period | $ | 20.74 | $ | 28.54 | $ | 26.77 | $ | 23.82 | $ | 40.80 | |||||||||||||
Investment Activities: | |||||||||||||||||||||||
Net investment income (loss) (a) | (0.28 | ) | (0.59 | ) | (0.53 | ) | (0.53 | ) | (0.70 | ) | |||||||||||||
| Net realized and unrealized gains (losses) | (6.29 | ) | 1.83 | 8.95 | 7.94 | (2.75 | ) | ||||||||||||||||
| Total from Investment Activities | (6.57 | ) | 1.24 | 8.42 | 7.41 | (3.45 | ) | ||||||||||||||||
Distributions to Shareholders From: | |||||||||||||||||||||||
Net realized gains from investments | (5.90 | ) | (9.04 | ) | (6.65 | ) | (4.46 | ) | (13.53 | ) | |||||||||||||
Total Distributions | (5.90 | ) | (9.04 | ) | (6.65 | ) | (4.46 | ) | (13.53 | ) | |||||||||||||
Net Asset Value, End of Period | $ | 8.27 | $ | 20.74 | $ | 28.54 | $ | 26.77 | $ | 23.82 | |||||||||||||
| Total Return (excludes contingent deferred sales charge) (b) | (32.94 | )% | 6.02 | % | 32.20 | % | 31.28 | % | (7.98 | )% | |||||||||||||
Ratios to Average Net Assets: | |||||||||||||||||||||||
Net Expenses (c) | 2.18 | % | 2.18 | % | 2.18 | % | 2.18 | % | 2.18 | % | |||||||||||||
Net Investment Income (Loss) | (1.82 | )% | (1.99 | )% | (1.92 | )% | (1.84 | )% | (1.64 | )% | |||||||||||||
Gross Expenses (c) | 2.42 | % | 2.24 | % | 2.29 | % | 2.30 | % | 2.25 | % | |||||||||||||
Supplemental Data: | |||||||||||||||||||||||
Net Assets at end of period (000's) | $ | 3,082 | $ | 9,835 | $ | 23,831 | $ | 26,988 | $ | 31,754 | |||||||||||||
Portfolio Turnover (d) | 131 | %(e) | 75 | % | 73 | % | 74 | % | 79 | % | |||||||||||||
(continues on next page)
See notes to financial statements.
73
Victory Portfolios | Financial Highlights — continued | ||||||
For a Share Outstanding Throughout Each Period
Victory RS Select Growth Fund | |||||||||||||||||||||||
Class R | |||||||||||||||||||||||
| Year Ended December 31, 2022 | Year Ended December 31, 2021 | Year Ended December 31, 2020 | Year Ended December 31, 2019 | Year Ended December 31, 2018 | |||||||||||||||||||
Net Asset Value, Beginning of Period | $ | 21.67 | $ | 29.34 | $ | 27.30 | $ | 24.16 | $ | 41.06 | |||||||||||||
Investment Activities: | |||||||||||||||||||||||
Net investment income (loss) (a) | (0.24 | ) | (0.53 | ) | (0.46 | ) | (0.45 | ) | (0.59 | ) | |||||||||||||
| Net realized and unrealized gains (losses) | (6.60 | ) | 1.90 | 9.15 | 8.05 | (2.78 | ) | ||||||||||||||||
| Total from Investment Activities | (6.84 | ) | 1.37 | 8.69 | 7.60 | (3.37 | ) | ||||||||||||||||
Distributions to Shareholders From: | |||||||||||||||||||||||
Net realized gains from investments | (5.90 | ) | (9.04 | ) | (6.65 | ) | (4.46 | ) | (13.53 | ) | |||||||||||||
Total Distributions | (5.90 | ) | (9.04 | ) | (6.65 | ) | (4.46 | ) | (13.53 | ) | |||||||||||||
Net Asset Value, End of Period | $ | 8.93 | $ | 21.67 | $ | 29.34 | $ | 27.30 | $ | 24.16 | |||||||||||||
Total Return (b) | (32.77 | )% | 6.31 | % | 32.57 | % | 31.63 | % | (7.70 | )% | |||||||||||||
Ratios to Average Net Assets: | |||||||||||||||||||||||
Net Expenses (c) | 1.91 | % | 1.91 | % | 1.91 | % | 1.91 | % | 1.91 | % | |||||||||||||
Net Investment Income (Loss) | (1.53 | )% | (1.72 | )% | (1.64 | )% | (1.57 | )% | (1.38 | )% | |||||||||||||
Gross Expenses (c) | 4.17 | % | 2.18 | % | 5.35 | % | 4.35 | % | 3.60 | % | |||||||||||||
Supplemental Data: | |||||||||||||||||||||||
Net Assets at end of period (000's) | $ | 331 | $ | 408 | $ | 504 | $ | 604 | $ | 701 | |||||||||||||
Portfolio Turnover (d) | 131 | %(e) | 75 | % | 73 | % | 74 | % | 79 | % | |||||||||||||
(continues on next page)
See notes to financial statements.
74
Victory Portfolios | Financial Highlights — continued | ||||||
For a Share Outstanding Throughout Each Period
Victory RS Select Growth Fund | |||||||||||||||||||||||
Class R6 | |||||||||||||||||||||||
| Year Ended December 31, 2022 | Year Ended December 31, 2021 | Year Ended December 31, 2020 | Year Ended December 31, 2019 | Year Ended December 31, 2018 | |||||||||||||||||||
Net Asset Value, Beginning of Period | $ | 34.71 | $ | 41.25 | $ | 35.99 | $ | 30.50 | $ | 47.53 | |||||||||||||
Investment Activities: | |||||||||||||||||||||||
Net investment income (loss) (a) | (0.18 | ) | (0.38 | ) | (0.31 | ) | (0.27 | ) | (0.29 | ) | |||||||||||||
| Net realized and unrealized gains (losses) | (10.74 | ) | 2.88 | 12.22 | 10.22 | (3.21 | ) | ||||||||||||||||
| Total from Investment Activities | (10.92 | ) | 2.50 | 11.91 | 9.95 | (3.50 | ) | ||||||||||||||||
Distributions to Shareholders From: | |||||||||||||||||||||||
Net realized gains from investments | (5.90 | ) | (9.04 | ) | (6.65 | ) | (4.46 | ) | (13.53 | ) | |||||||||||||
Total Distributions | (5.90 | ) | (9.04 | ) | (6.65 | ) | (4.46 | ) | (13.53 | ) | |||||||||||||
Net Asset Value, End of Period | $ | 17.89 | $ | 34.71 | $ | 41.25 | $ | 35.99 | $ | 30.50 | |||||||||||||
Total Return (b) | (32.21 | )% | 7.23 | % | 33.65 | % | 32.76 | % | (6.92 | )% | |||||||||||||
Ratios to Average Net Assets: | |||||||||||||||||||||||
Net Expenses (c) | 1.06 | % | 1.06 | % | 1.06 | % | 1.06 | % | 1.06 | % | |||||||||||||
Net Investment Income (Loss) | (0.69 | )% | (0.88 | )% | (0.80 | )% | (0.72 | )% | (0.59 | )% | |||||||||||||
Gross Expenses (c) | 2.65 | % | 1.83 | % | 4.52 | % | 5.46 | % | 6.33 | % | |||||||||||||
Supplemental Data: | |||||||||||||||||||||||
Net Assets at end of period (000's) | $ | 594 | $ | 1,231 | $ | 710 | $ | 302 | $ | 239 | |||||||||||||
Portfolio Turnover (d) | 131 | %(e) | 75 | % | 73 | % | 74 | % | 79 | % | |||||||||||||
(continues on next page)
See notes to financial statements.
75
Victory Portfolios | Financial Highlights — continued | ||||||
For a Share Outstanding Throughout Each Period
Victory RS Select Growth Fund | |||||||||||||||||||||||
Class Y | |||||||||||||||||||||||
| Year Ended December 31, 2022 | Year Ended December 31, 2021 | Year Ended December 31, 2020 | Year Ended December 31, 2019 | Year Ended December 31, 2018 | |||||||||||||||||||
Net Asset Value, Beginning of Period | $ | 34.43 | $ | 41.02 | $ | 35.84 | $ | 30.41 | $ | 47.47 | |||||||||||||
Investment Activities: | |||||||||||||||||||||||
Net investment income (loss) (a) | (0.20 | ) | (0.41 | ) | (0.33 | ) | (0.29 | ) | (0.30 | ) | |||||||||||||
| Net realized and unrealized gains (losses) | (10.65 | ) | 2.86 | 12.16 | 10.18 | (3.23 | ) | ||||||||||||||||
| Total from Investment Activities | (10.85 | ) | 2.45 | 11.83 | 9.89 | (3.53 | ) | ||||||||||||||||
Distributions to Shareholders From: | |||||||||||||||||||||||
Net realized gains from investments | (5.90 | ) | (9.04 | ) | (6.65 | ) | (4.46 | ) | (13.53 | ) | |||||||||||||
Total Distributions | (5.90 | ) | (9.04 | ) | (6.65 | ) | (4.46 | ) | (13.53 | ) | |||||||||||||
Net Asset Value, End of Period | $ | 17.68 | $ | 34.43 | $ | 41.02 | $ | 35.84 | $ | 30.41 | |||||||||||||
Total Return (b) | (32.27 | )% | 7.15 | % | 33.57 | % | 32.66 | % | (7.02 | )% | |||||||||||||
Ratios to Average Net Assets: | |||||||||||||||||||||||
Net Expenses (c) | 1.14 | % | 1.14 | % | 1.14 | % | 1.14 | % | 1.14 | % | |||||||||||||
Net Investment Income (Loss) | (0.76 | )% | (0.95 | )% | (0.88 | )% | (0.80 | )% | (0.59 | )% | |||||||||||||
Gross Expenses (c) | 1.24 | % | 1.21 | % | 1.24 | % | 1.23 | % | 1.21 | % | |||||||||||||
Supplemental Data: | |||||||||||||||||||||||
Net Assets at end of period (000's) | $ | 31,532 | $ | 70,192 | $ | 93,844 | $ | 94,933 | $ | 120,696 | |||||||||||||
Portfolio Turnover (d) | 131 | %(e) | 75 | % | 73 | % | 74 | % | 79 | % | |||||||||||||
(a) Per share net investment income (loss) has been calculated using the average daily shares method.
(b) Assumes reinvestment of all net investment income and realized capital gain distributions, if any, during the period. Includes adjustments in accordance with U.S. Generally Accepted Accounting Principles and could differ from the reported total return.
(c) Does not include acquired fund fees and expenses, if any.
(d) Portfolio turnover is calculated on the basis of the Fund as a whole without distinguishing between the classes of shares.
(e) Current year rate reflects an increase in trading activity due to asset allocation shift.
See notes to financial statements.
76
Victory Portfolios | Financial Highlights | ||||||
For a Share Outstanding Throughout Each Period
Victory RS Mid Cap Growth Fund | |||||||||||||||||||||||
Class A | |||||||||||||||||||||||
| Year Ended December 31, 2022 | Year Ended December 31, 2021 | Year Ended December 31, 2020 | Year Ended December 31, 2019 | Year Ended December 31, 2018 | |||||||||||||||||||
Net Asset Value, Beginning of Period | $ | 24.76 | $ | 32.99 | $ | 25.56 | $ | 19.96 | $ | 25.77 | |||||||||||||
Investment Activities: | |||||||||||||||||||||||
Net investment income (loss) (a) | (0.14 | ) | (0.33 | ) | (0.20 | ) | (0.17 | ) | (0.14 | ) | |||||||||||||
| Net realized and unrealized gains (losses) | (8.41 | ) | 1.60 | 8.98 | 5.77 | (1.79 | ) | ||||||||||||||||
| Total from Investment Activities | (8.55 | ) | 1.27 | 8.78 | 5.60 | (1.93 | ) | ||||||||||||||||
Distributions to Shareholders From: | |||||||||||||||||||||||
Net realized gains from investments | (0.69 | ) | (9.50 | ) | (1.35 | ) | — | (3.00 | ) | ||||||||||||||
Return of capital | — | (b) | — | — | — | (0.88 | ) | ||||||||||||||||
Total Distributions | (0.69 | ) | (9.50 | ) | (1.35 | ) | — | (3.88 | ) | ||||||||||||||
Net Asset Value, End of Period | $ | 15.52 | $ | 24.76 | $ | 32.99 | $ | 25.56 | $ | 19.96 | |||||||||||||
Total Return (excludes sales charge) (c) | (34.68 | )% | 4.68 | % | 34.47 | % | 28.06 | % | (7.37 | )% | |||||||||||||
Ratios to Average Net Assets: | |||||||||||||||||||||||
Net Expenses (d) | 1.21 | %(e) | 1.20 | % | 1.20 | % | 1.20 | % | 1.20 | % | |||||||||||||
Net Investment Income (Loss) | (0.76 | )% | (0.98 | )% | (0.75 | )% | (0.67 | )% | (0.53 | )% | |||||||||||||
Gross Expenses (d) | 1.40 | % | 1.33 | % | 1.35 | % | 1.35 | % | 1.34 | % | |||||||||||||
Supplemental Data: | |||||||||||||||||||||||
Net Assets at end of period (000's) | $ | 47,664 | $ | 88,064 | $ | 93,072 | $ | 82,888 | $ | 75,451 | |||||||||||||
Portfolio Turnover (f) | 133 | % | 90 | % | 92 | % | 86 | % | 126 | % | |||||||||||||
(continues on next page)
See notes to financial statements.
77
Victory Portfolios | Financial Highlights — continued | ||||||
For a Share Outstanding Throughout Each Period
Victory RS Mid Cap Growth Fund | |||||||||||||||||||||||
Class C | |||||||||||||||||||||||
| Year Ended December 31, 2022 | Year Ended December 31, 2021 | Year Ended December 31, 2020 | Year Ended December 31, 2019 | Year Ended December 31, 2018 | |||||||||||||||||||
Net Asset Value, Beginning of Period | $ | 19.34 | $ | 28.05 | $ | 22.08 | $ | 17.40 | $ | 23.22 | |||||||||||||
Investment Activities: | |||||||||||||||||||||||
Net investment income (loss) (a) | (0.25 | ) | (0.52 | ) | (0.38 | ) | (0.34 | ) | (0.35 | ) | |||||||||||||
| Net realized and unrealized gains (losses) | (6.54 | ) | 1.31 | 7.70 | 5.02 | (1.59 | ) | ||||||||||||||||
| Total from Investment Activities | (6.79 | ) | 0.79 | 7.32 | 4.68 | (1.94 | ) | ||||||||||||||||
Distributions to Shareholders From: | |||||||||||||||||||||||
Net realized gains from investments | (0.69 | ) | (9.50 | ) | (1.35 | ) | — | (3.65 | ) | ||||||||||||||
Return of capital | — | (b) | — | — | — | (0.23 | ) | ||||||||||||||||
Total Distributions | (0.69 | ) | (9.50 | ) | (1.35 | ) | — | (3.88 | ) | ||||||||||||||
Net Asset Value, End of Period | $ | 11.86 | $ | 19.34 | $ | 28.05 | $ | 22.08 | $ | 17.40 | |||||||||||||
| Total Return (excludes contingent deferred sales charge) (c) | (35.30 | )% | 3.75 | % | 33.30 | % | 26.90 | % | (8.23 | )% | |||||||||||||
Ratios to Average Net Assets: | |||||||||||||||||||||||
Net Expenses (d) | 2.12 | %(e) | 2.09 | % | 2.11 | % | 2.11 | % | 2.11 | % | |||||||||||||
Net Investment Income (Loss) | (1.69 | )% | (1.87 | )% | (1.65 | )% | (1.58 | )% | (1.44 | )% | |||||||||||||
Gross Expenses (d) | 2.25 | % | 2.09 | % | 2.14 | % | 2.12 | % | 2.12 | % | |||||||||||||
Supplemental Data: | |||||||||||||||||||||||
Net Assets at end of period (000's) | $ | 3,312 | $ | 12,054 | $ | 17,325 | $ | 20,266 | $ | 18,072 | |||||||||||||
Portfolio Turnover (f) | 133 | % | 90 | % | 92 | % | 86 | % | 126 | % | |||||||||||||
(continues on next page)
See notes to financial statements.
78
Victory Portfolios | Financial Highlights — continued | ||||||
For a Share Outstanding Throughout Each Period
Victory RS Mid Cap Growth Fund | |||||||||||||||||||||||
Class R | |||||||||||||||||||||||
| Year Ended December 31, 2022 | Year Ended December 31, 2021 | Year Ended December 31, 2020 | Year Ended December 31, 2019 | Year Ended December 31, 2018 | |||||||||||||||||||
Net Asset Value, Beginning of Period | $ | 21.24 | $ | 29.79 | $ | 23.32 | $ | 18.31 | $ | 24.14 | |||||||||||||
Investment Activities: | |||||||||||||||||||||||
Net investment income (loss) (a) | (0.21 | ) | (0.47 | ) | (0.33 | ) | (0.28 | ) | (0.29 | ) | |||||||||||||
| Net realized and unrealized gains (losses) | (7.20 | ) | 1.42 | 8.15 | 5.29 | (1.66 | ) | ||||||||||||||||
| Total from Investment Activities | (7.41 | ) | 0.95 | 7.82 | 5.01 | (1.95 | ) | ||||||||||||||||
Distributions to Shareholders From: | |||||||||||||||||||||||
Net realized gains from investments | (0.69 | ) | (9.50 | ) | (1.35 | ) | — | (3.86 | ) | ||||||||||||||
Return of capital | — | (b) | — | — | — | (0.02 | ) | ||||||||||||||||
Total Distributions | (0.69 | ) | (9.50 | ) | (1.35 | ) | — | (3.88 | ) | ||||||||||||||
Net Asset Value, End of Period | $ | 13.14 | $ | 21.24 | $ | 29.79 | $ | 23.32 | $ | 18.31 | |||||||||||||
Total Return (c) | (35.06 | )% | 4.09 | % | 33.67 | % | 27.36 | % | (7.99 | )% | |||||||||||||
Ratios to Average Net Assets: | |||||||||||||||||||||||
Net Expenses (d) | 1.81 | %(e) | 1.80 | % | 1.80 | % | 1.80 | % | 1.80 | % | |||||||||||||
Net Investment Income (Loss) | (1.36 | )% | (1.58 | )% | (1.34 | )% | (1.26 | )% | (1.13 | )% | |||||||||||||
Gross Expenses (d) | 3.89 | % | 1.93 | % | 4.13 | % | 3.41 | % | 2.68 | % | |||||||||||||
Supplemental Data: | |||||||||||||||||||||||
Net Assets at end of period (000's) | $ | 373 | $ | 610 | $ | 596 | $ | 927 | $ | 1,144 | |||||||||||||
Portfolio Turnover (f) | 133 | % | 90 | % | 92 | % | 86 | % | 126 | % | |||||||||||||
(continues on next page)
See notes to financial statements.
79
Victory Portfolios | Financial Highlights — continued | ||||||
For a Share Outstanding Throughout Each Period
Victory RS Mid Cap Growth Fund | |||||||||||||||||||||||
Class R6 | |||||||||||||||||||||||
| Year Ended December 31, 2022 | Year Ended December 31, 2021 | Year Ended December 31, 2020 | Year Ended December 31, 2019 | Year Ended December 31, 2018 | |||||||||||||||||||
Net Asset Value, Beginning of Period | $ | 26.46 | $ | 34.53 | $ | 26.63 | $ | 20.74 | $ | 26.55 | |||||||||||||
Investment Activities: | |||||||||||||||||||||||
Net investment income (loss) (a) | (0.11 | ) | (0.25 | ) | (0.14 | ) | (0.11 | ) | (0.07 | ) | |||||||||||||
| Net realized and unrealized gains (losses) | (8.98 | ) | 1.68 | 9.39 | 6.00 | (1.86 | ) | ||||||||||||||||
| Total from Investment Activities | (9.09 | ) | 1.43 | 9.25 | 5.89 | (1.93 | ) | ||||||||||||||||
Distributions to Shareholders From: | |||||||||||||||||||||||
Net realized gains from investments | (0.69 | ) | (9.50 | ) | (1.35 | ) | — | (3.84 | ) | ||||||||||||||
Return of capital | — | (b) | — | — | — | (0.04 | ) | ||||||||||||||||
Total Distributions | (0.69 | ) | (9.50 | ) | (1.35 | ) | — | (3.88 | ) | ||||||||||||||
Net Asset Value, End of Period | $ | 16.68 | $ | 26.46 | $ | 34.53 | $ | 26.63 | $ | 20.74 | |||||||||||||
Total Return (c) | (34.49 | )% | 4.95 | % | 34.86 | % | 28.40 | % | (7.15 | )% | |||||||||||||
Ratios to Average Net Assets: | |||||||||||||||||||||||
Net Expenses (d) | 0.95 | %(e) | 0.94 | % | 0.94 | % | 0.94 | % | 0.94 | % | |||||||||||||
Net Investment Income (Loss) | (0.54 | )% | (0.73 | )% | (0.49 | )% | (0.44 | )% | (0.26 | )% | |||||||||||||
Gross Expenses (d) | 1.16 | % | 0.98 | % | 1.01 | % | 1.05 | % | 1.32 | % | |||||||||||||
Supplemental Data: | |||||||||||||||||||||||
Net Assets at end of period (000's) | $ | 2,360 | $ | 19,731 | $ | 27,861 | $ | 20,321 | $ | 3,793 | |||||||||||||
Portfolio Turnover (f) | 133 | % | 90 | % | 92 | % | 86 | % | 126 | % | |||||||||||||
(continues on next page)
See notes to financial statements.
80
Victory Portfolios | Financial Highlights — continued | ||||||
For a Share Outstanding Throughout Each Period
Victory RS Mid Cap Growth Fund | |||||||||||||||||||||||
Class Y | |||||||||||||||||||||||
| Year Ended December 31, 2022 | Year Ended December 31, 2021 | Year Ended December 31, 2020 | Year Ended December 31, 2019 | Year Ended December 31, 2018 | |||||||||||||||||||
Net Asset Value, Beginning of Period | $ | 26.43 | $ | 34.50 | $ | 26.61 | $ | 20.73 | $ | 26.54 | |||||||||||||
Investment Activities: | |||||||||||||||||||||||
Net investment income (loss) (a) | (0.11 | ) | (0.26 | ) | (0.14 | ) | (0.11 | ) | (0.08 | ) | |||||||||||||
| Net realized and unrealized gains (losses) | (8.98 | ) | 1.69 | 9.38 | 5.99 | (1.85 | ) | ||||||||||||||||
| Total from Investment Activities | (9.09 | ) | 1.43 | 9.24 | 5.88 | (1.93 | ) | ||||||||||||||||
Distributions to Shareholders From: | |||||||||||||||||||||||
Net realized gains from investments | (0.69 | ) | (9.50 | ) | (1.35 | ) | — | (1.17 | ) | ||||||||||||||
Return of capital | — | (b) | — | — | — | (2.71 | ) | ||||||||||||||||
Total Distributions | (0.69 | ) | (9.50 | ) | (1.35 | ) | — | (3.88 | ) | ||||||||||||||
Net Asset Value, End of Period | $ | 16.65 | $ | 26.43 | $ | 34.50 | $ | 26.61 | $ | 20.73 | |||||||||||||
Total Return (c) | (34.53 | )% | 4.96 | % | 34.84 | % | 28.36 | % | (7.15 | )% | |||||||||||||
Ratios to Average Net Assets: | |||||||||||||||||||||||
Net Expenses (d) | 0.96 | %(e) | 0.95 | % | 0.95 | % | 0.95 | % | 0.95 | % | |||||||||||||
Net Investment Income (Loss) | (0.53 | )% | (0.73 | )% | (0.50 | )% | (0.43 | )% | (0.27 | )% | |||||||||||||
Gross Expenses (d) | 1.13 | % | 1.09 | % | 1.10 | % | 1.10 | % | 1.05 | % | |||||||||||||
Supplemental Data: | |||||||||||||||||||||||
Net Assets at end of period (000's) | $ | 28,192 | $ | 249,373 | $ | 466,342 | $ | 395,586 | $ | 243,009 | |||||||||||||
Portfolio Turnover (f) | 133 | % | 90 | % | 92 | % | 86 | % | 126 | % | |||||||||||||
(continues on next page)
See notes to financial statements.
81
Victory Portfolios | Financial Highlights — continued | ||||||
For a Share Outstanding Throughout Each Period
Victory RS Mid Cap Growth Fund | |||||||||||||||
Member Class | |||||||||||||||
| Year Ended December 31, 2022 | Year Ended December 31, 2021 | November 3, 2020(g) through December 31, 2020 | |||||||||||||
Net Asset Value, Beginning of Period | $ | 24.84 | $ | 33.00 | $ | 29.16 | |||||||||
Investment Activities: | |||||||||||||||
Net investment income (loss) (a) | (0.11 | ) | (0.28 | ) | (0.04 | ) | |||||||||
| Net realized and unrealized gains (losses) | (8.45 | ) | 1.62 | 5.23 | |||||||||||
Total from Investment Activities | (8.56 | ) | 1.34 | 5.19 | |||||||||||
Distributions to Shareholders From: | |||||||||||||||
Net realized gains from investments | (0.69 | ) | (9.50 | ) | (1.35 | ) | |||||||||
Return of capital | — | (b) | — | — | |||||||||||
Total Distributions | (0.69 | ) | (9.50 | ) | (1.35 | ) | |||||||||
Net Asset Value, End of Period | $ | 15.59 | $ | 24.84 | $ | 33.00 | |||||||||
Total Return (c) (h) | (34.61 | )% | 4.88 | % | 17.94 | % | |||||||||
Ratios to Average Net Assets: | |||||||||||||||
Net Expenses (d) (i) | 1.05 | % | 1.05 | % | 1.05 | % | |||||||||
Net Investment Income (Loss) (i) | (0.58 | )% | (0.85 | )% | (0.71 | )% | |||||||||
Gross Expenses (d) (i) | 2.60 | % | 5.66 | % | 31.23 | % | |||||||||
Supplemental Data: | |||||||||||||||
Net Assets at end of period (000's) | $ | 911 | $ | 957 | $ | 109 | |||||||||
Portfolio Turnover (f) (h) | 133 | % | 90 | % | 92 | % | |||||||||
(a) Per share net investment income (loss) has been calculated using the average daily shares method.
(b) Amount is less than $0.005.
(c) Assumes reinvestment of all net investment income and realized capital gain distributions, if any, during the period. Includes adjustments in accordance with U.S. Generally Accepted Accounting Principles and could differ from the reported total return.
(d) Does not include acquired fund fees and expenses, if any.
(e) Includes impact of Interfund lending fees. Without these Interfund lending fees, the net expense ratio would have been at the contractual expense cap. (See Note 4 in the Notes to Financial Statements)
(f) Portfolio turnover is calculated on the basis of the Fund as a whole without distinguishing between the classes of shares.
(g) Commencement of operations.
(h) Not annualized for periods less than one year.
(i) Annualized for periods less than one year.
See notes to financial statements.
82
Victory Portfolios | Financial Highlights | ||||||
For a Share Outstanding Throughout Each Period
Victory RS Growth Fund | |||||||||||||||||||||||
Class A | |||||||||||||||||||||||
| Year Ended December 31, 2022 | Year Ended December 31, 2021 | Year Ended December 31, 2020 | Year Ended December 31, 2019 | Year Ended December 31, 2018 | |||||||||||||||||||
Net Asset Value, Beginning of Period | $ | 26.14 | $ | 23.84 | $ | 19.22 | $ | 16.40 | $ | 20.60 | |||||||||||||
Investment Activities: | |||||||||||||||||||||||
Net investment income (loss) (a) | (0.11 | ) | (0.18 | ) | (0.08 | ) | (0.03 | ) | (0.06 | ) | |||||||||||||
| Net realized and unrealized gains (losses) | (8.57 | ) | 4.85 | 6.89 | 4.90 | (1.36 | ) | ||||||||||||||||
Total from Investment Activities | (8.68 | ) | 4.67 | 6.81 | 4.87 | (1.42 | ) | ||||||||||||||||
Distributions to Shareholders From: | |||||||||||||||||||||||
Net investment income | — | (0.02 | ) | — | — | — | |||||||||||||||||
Net realized gains from investments | (0.40 | ) | (2.35 | ) | (2.19 | ) | (2.05 | ) | (2.78 | ) | |||||||||||||
Total Distributions | (0.40 | ) | (2.37 | ) | (2.19 | ) | (2.05 | ) | (2.78 | ) | |||||||||||||
Net Asset Value, End of Period | $ | 17.06 | $ | 26.14 | $ | 23.84 | $ | 19.22 | $ | 16.40 | |||||||||||||
Total Return (excludes sales charge) (b) | (33.31 | )% | 19.91 | % | 35.64 | % | 29.83 | % | (6.81 | )% | |||||||||||||
Ratios to Average Net Assets: | |||||||||||||||||||||||
Net Expenses (c) | 1.10 | % | 1.10 | % | 1.10 | % | 1.10 | % | 1.10 | % | |||||||||||||
Net Investment Income (Loss) | (0.53 | )% | (0.71 | )% | (0.37 | )% | (0.16 | )% | (0.28 | )% | |||||||||||||
Gross Expenses (c) | 1.18 | % | 1.17 | % | 1.19 | % | 1.19 | % | 1.19 | % | |||||||||||||
Supplemental Data: | |||||||||||||||||||||||
Net Assets at end of period (000's) | $ | 189,042 | $ | 308,663 | $ | 274,388 | $ | 223,503 | $ | 188,220 | |||||||||||||
Portfolio Turnover (d) | 96 | % | 62 | % | 73 | % | 95 | % | 87 | % | |||||||||||||
(continues on next page)
See notes to financial statements.
83
Victory Portfolios | Financial Highlights — continued | ||||||
For a Share Outstanding Throughout Each Period
Victory RS Growth Fund | |||||||||||||||||||||||
Class C | |||||||||||||||||||||||
| Year Ended December 31, 2022 | Year Ended December 31, 2021 | Year Ended December 31, 2020 | Year Ended December 31, 2019 | Year Ended December 31, 2018 | |||||||||||||||||||
Net Asset Value, Beginning of Period | $ | 19.94 | $ | 18.80 | $ | 15.63 | $ | 13.75 | $ | 17.90 | |||||||||||||
Investment Activities: | |||||||||||||||||||||||
Net investment income (loss) (a) | (0.21 | ) | (0.31 | ) | (0.20 | ) | (0.16 | ) | (0.21 | ) | |||||||||||||
| Net realized and unrealized gains (losses) | (6.52 | ) | 3.80 | 5.56 | 4.09 | (1.16 | ) | ||||||||||||||||
Total from Investment Activities | (6.73 | ) | 3.49 | 5.36 | 3.93 | (1.37 | ) | ||||||||||||||||
Distributions to Shareholders From: | |||||||||||||||||||||||
Net realized gains from investments | (0.40 | ) | (2.35 | ) | (2.19 | ) | (2.05 | ) | (2.78 | ) | |||||||||||||
Total Distributions | (0.40 | ) | (2.35 | ) | (2.19 | ) | (2.05 | ) | (2.78 | ) | |||||||||||||
Net Asset Value, End of Period | $ | 12.81 | $ | 19.94 | $ | 18.80 | $ | 15.63 | $ | 13.75 | |||||||||||||
| Total Return (excludes contingent deferred sales charge) (b) | (33.89 | )% | 18.95 | % | 34.55 | % | 28.74 | % | (7.56 | )% | |||||||||||||
Ratios to Average Net Assets: | |||||||||||||||||||||||
Net Expenses (c) | 1.93 | % | 1.93 | % | 1.93 | % | 1.93 | % | 1.93 | % | |||||||||||||
Net Investment Income (Loss) | (1.37 | )% | (1.54 | )% | (1.20 | )% | (0.99 | )% | (1.10 | )% | |||||||||||||
Gross Expenses (c) | 2.78 | % | 1.99 | % | 2.43 | % | 2.33 | % | 2.20 | % | |||||||||||||
Supplemental Data: | |||||||||||||||||||||||
Net Assets at end of period (000's) | $ | 689 | $ | 1,733 | $ | 3,731 | $ | 4,240 | $ | 4,409 | |||||||||||||
Portfolio Turnover (d) | 96 | % | 62 | % | 73 | % | 95 | % | 87 | % | |||||||||||||
(continues on next page)
See notes to financial statements.
84
Victory Portfolios | Financial Highlights — continued | ||||||
For a Share Outstanding Throughout Each Period
Victory RS Growth Fund | |||||||||||||||||||||||
Class R | |||||||||||||||||||||||
| Year Ended December 31, 2022 | Year Ended December 31, 2021 | Year Ended December 31, 2020 | Year Ended December 31, 2019 | Year Ended December 31, 2018 | |||||||||||||||||||
Net Asset Value, Beginning of Period | $ | 22.71 | $ | 21.09 | $ | 17.29 | $ | 15.00 | $ | 19.22 | |||||||||||||
Investment Activities: | |||||||||||||||||||||||
Net investment income (loss) (a) | (0.20 | ) | (0.30 | ) | (0.19 | ) | (0.14 | ) | (0.18 | ) | |||||||||||||
| Net realized and unrealized gains (losses) | (7.43 | ) | 4.27 | 6.18 | 4.48 | (1.26 | ) | ||||||||||||||||
Total from Investment Activities | (7.63 | ) | 3.97 | 5.99 | 4.34 | (1.44 | ) | ||||||||||||||||
Distributions to Shareholders From: | |||||||||||||||||||||||
Net realized gains from investments | (0.40 | ) | (2.35 | ) | (2.19 | ) | (2.05 | ) | (2.78 | ) | |||||||||||||
Total Distributions | (0.40 | ) | (2.35 | ) | (2.19 | ) | (2.05 | ) | (2.78 | ) | |||||||||||||
Net Asset Value, End of Period | $ | 14.68 | $ | 22.71 | $ | 21.09 | $ | 17.29 | $ | 15.00 | |||||||||||||
Total Return (b) | (33.72 | )% | 19.17 | % | 34.87 | % | 29.08 | % | (7.41 | )% | |||||||||||||
Ratios to Average Net Assets: | |||||||||||||||||||||||
Net Expenses (c) | 1.71 | % | 1.71 | % | 1.71 | % | 1.71 | % | 1.71 | % | |||||||||||||
Net Investment Income (Loss) | (1.14 | )% | (1.32 | )% | (0.98 | )% | (0.77 | )% | (0.88 | )% | |||||||||||||
Gross Expenses (c) | 3.68 | % | 1.71 | % | 6.08 | % | 5.41 | % | 3.49 | % | |||||||||||||
Supplemental Data: | |||||||||||||||||||||||
Net Assets at end of period (000's) | $ | 385 | $ | 542 | $ | 420 | $ | 438 | $ | 516 | |||||||||||||
Portfolio Turnover (d) | 96 | % | 62 | % | 73 | % | 95 | % | 87 | % | |||||||||||||
(continues on next page)
See notes to financial statements.
85
Victory Portfolios | Financial Highlights — continued | ||||||
For a Share Outstanding Throughout Each Period
Victory RS Growth Fund | |||||||||||||||||||||||
Class Y | |||||||||||||||||||||||
| Year Ended December 31, 2022 | Year Ended December 31, 2021 | Year Ended December 31, 2020 | Year Ended December 31, 2019 | Year Ended December 31, 2018 | |||||||||||||||||||
Net Asset Value, Beginning of Period | $ | 27.70 | $ | 25.13 | $ | 20.11 | $ | 17.04 | $ | 21.23 | |||||||||||||
Investment Activities: | |||||||||||||||||||||||
Net investment income (loss) (a) | (0.06 | ) | (0.12 | ) | (0.02 | ) | 0.02 | — | (e) | ||||||||||||||
| Net realized and unrealized gains (losses) | (9.09 | ) | 5.13 | 7.23 | 5.10 | (1.41 | ) | ||||||||||||||||
Total from Investment Activities | (9.15 | ) | 5.01 | 7.21 | 5.12 | (1.41 | ) | ||||||||||||||||
Distributions to Shareholders From: | |||||||||||||||||||||||
Net investment income | — | (0.09 | ) | — | — | — | |||||||||||||||||
Net realized gains from investments | (0.40 | ) | (2.35 | ) | (2.19 | ) | (2.05 | ) | (2.78 | ) | |||||||||||||
Total Distributions | (0.40 | ) | (2.44 | ) | (2.19 | ) | (2.05 | ) | (2.78 | ) | |||||||||||||
Net Asset Value, End of Period | $ | 18.15 | $ | 27.70 | $ | 25.13 | $ | 20.11 | $ | 17.04 | |||||||||||||
Total Return (b) | (33.13 | )% | 20.22 | % | 36.06 | % | 30.18 | % | (6.56 | )% | |||||||||||||
Ratios to Average Net Assets: | |||||||||||||||||||||||
Net Expenses (c) | 0.83 | % | 0.83 | % | 0.83 | % | 0.83 | % | 0.83 | % | |||||||||||||
Net Investment Income (Loss) | (0.26 | )% | (0.44 | )% | (0.09 | )% | 0.11 | % | (0.01 | )% | |||||||||||||
Gross Expenses (c) | 0.95 | % | 0.91 | % | 0.99 | % | 0.98 | % | 0.97 | % | |||||||||||||
Supplemental Data: | |||||||||||||||||||||||
Net Assets at end of period (000's) | $ | 18,286 | $ | 33,772 | $ | 29,875 | $ | 31,473 | $ | 26,457 | |||||||||||||
Portfolio Turnover (d) | 96 | % | 62 | % | 73 | % | 95 | % | 87 | % | |||||||||||||
(a) Per share net investment income (loss) has been calculated using the average daily shares method.
(b) Assumes reinvestment of all net investment income and realized capital gain distributions, if any, during the period. Includes adjustments in accordance with U.S. Generally Accepted Accounting Principles and could differ from the reported total return.
(c) Does not include acquired fund fees and expenses, if any.
(d) Portfolio turnover is calculated on the basis of the Fund as a whole without distinguishing between the classes of shares.
(e) Amount is less than $0.005 per share.
See notes to financial statements.
86
Victory Portfolios | Financial Highlights | ||||||
For a Share Outstanding Throughout Each Period
Victory RS Science and Technology Fund | |||||||||||||||||||||||
Class A | |||||||||||||||||||||||
| Year Ended December 31, 2022 | Year Ended December 31, 2021 | Year Ended December 31, 2020 | Year Ended December 31, 2019 | Year Ended December 31, 2018 | |||||||||||||||||||
Net Asset Value, Beginning of Period | $ | 28.34 | $ | 36.35 | $ | 23.37 | $ | 18.34 | $ | 21.56 | |||||||||||||
Investment Activities: | |||||||||||||||||||||||
Net investment income (loss) (a) | (0.22 | ) | (0.46 | ) | (0.34 | ) | (0.26 | ) | (0.27 | ) | |||||||||||||
| Net realized and unrealized gains (losses) | (12.07 | ) | (3.10 | ) | 15.48 | 7.43 | 0.06 | ||||||||||||||||
Total from Investment Activities | (12.29 | ) | (3.56 | ) | 15.14 | 7.17 | (0.21 | ) | |||||||||||||||
Distributions to Shareholders From: | |||||||||||||||||||||||
Net realized gains from investments | (0.79 | ) | (4.45 | ) | (2.16 | ) | (2.14 | ) | (3.01 | ) | |||||||||||||
Total Distributions | (0.79 | ) | (4.45 | ) | (2.16 | ) | (2.14 | ) | (3.01 | ) | |||||||||||||
Net Asset Value, End of Period | $ | 15.26 | $ | 28.34 | $ | 36.35 | $ | 23.37 | $ | 18.34 | |||||||||||||
Total Return (excludes sales charge) (b) | (43.51 | )% | (9.25 | )% | 65.03 | % | 39.32 | % | (0.73 | )% | |||||||||||||
Ratios to Average Net Assets: | |||||||||||||||||||||||
Net Expenses (c) | 1.47 | % | 1.47 | % | 1.48 | % | 1.48 | % | 1.47 | % | |||||||||||||
Net Investment Income (Loss) | (1.20 | )% | (1.28 | )% | (1.22 | )% | (1.14 | )% | (1.10 | )% | |||||||||||||
Gross Expenses (c) | 1.48 | % | 1.47 | % | 1.48 | % | 1.48 | % | 1.47 | % | |||||||||||||
Supplemental Data: | |||||||||||||||||||||||
Net Assets at end of period (000's) | $ | 130,060 | $ | 250,490 | $ | 320,605 | $ | 199,591 | $ | 140,389 | |||||||||||||
Portfolio Turnover (d) | 56 | % | 46 | % | 30 | % | 88 | % | 83 | % | |||||||||||||
(continues on next page)
See notes to financial statements.
87
Victory Portfolios | Financial Highlights — continued | ||||||
For a Share Outstanding Throughout Each Period
Victory RS Science and Technology Fund | |||||||||||||||||||||||
Class C | |||||||||||||||||||||||
| Year Ended December 31, 2022 | Year Ended December 31, 2021 | Year Ended December 31, 2020 | Year Ended December 31, 2019 | Year Ended December 31, 2018 | |||||||||||||||||||
Net Asset Value, Beginning of Period | $ | 19.48 | $ | 26.81 | $ | 17.73 | $ | 14.40 | $ | 17.73 | |||||||||||||
Investment Activities: | |||||||||||||||||||||||
Net investment income (loss) (a) | (0.26 | ) | (0.55 | ) | (0.41 | ) | (0.35 | ) | (0.38 | ) | |||||||||||||
| Net realized and unrealized gains (losses) | (8.26 | ) | (2.33 | ) | 11.65 | 5.82 | 0.06 | ||||||||||||||||
Total from Investment Activities | (8.52 | ) | (2.88 | ) | 11.24 | 5.47 | (0.32 | ) | |||||||||||||||
Distributions to Shareholders From: | |||||||||||||||||||||||
Net realized gains from investments | (0.79 | ) | (4.45 | ) | (2.16 | ) | (2.14 | ) | (3.01 | ) | |||||||||||||
Total Distributions | (0.79 | ) | (4.45 | ) | (2.16 | ) | (2.14 | ) | (3.01 | ) | |||||||||||||
Net Asset Value, End of Period | $ | 10.17 | $ | 19.48 | $ | 26.81 | $ | 17.73 | $ | 14.40 | |||||||||||||
| Total Return (excludes contingent deferred sales charge) (b) | (43.95 | )% | (10.03 | )% | 63.71 | % | 38.27 | % | (1.58 | )% | |||||||||||||
Ratios to Average Net Assets: | |||||||||||||||||||||||
Net Expenses (c) | 2.28 | % | 2.28 | % | 2.28 | % | 2.28 | % | 2.28 | % | |||||||||||||
Net Investment Income (Loss) | (2.01 | )% | (2.09 | )% | (2.03 | )% | (1.94 | )% | (1.91 | )% | |||||||||||||
Gross Expenses (c) | 2.40 | % | 2.28 | % | 2.32 | % | 2.34 | % | 2.31 | % | |||||||||||||
Supplemental Data: | |||||||||||||||||||||||
Net Assets at end of period (000's) | $ | 4,725 | $ | 11,168 | $ | 18,398 | $ | 14,054 | $ | 11,857 | |||||||||||||
Portfolio Turnover (d) | 56 | % | 46 | % | 30 | % | 88 | % | 83 | % | |||||||||||||
(continues on next page)
See notes to financial statements.
88
Victory Portfolios | Financial Highlights — continued | ||||||
For a Share Outstanding Throughout Each Period
Victory RS Science and Technology Fund | |||||||||||||||||||||||
Class R | |||||||||||||||||||||||
| Year Ended December 31, 2022 | Year Ended December 31, 2021 | Year Ended December 31, 2020 | Year Ended December 31, 2019 | Year Ended December 31, 2018 | |||||||||||||||||||
Net Asset Value, Beginning of Period | $ | 22.45 | $ | 29.99 | $ | 19.60 | $ | 15.70 | $ | 18.99 | |||||||||||||
Investment Activities: | |||||||||||||||||||||||
Net investment income (loss) (a) | (0.25 | ) | (0.51 | ) | (0.39 | ) | (0.31 | ) | (0.33 | ) | |||||||||||||
| Net realized and unrealized gains (losses) | (9.54 | ) | (2.58 | ) | 12.94 | 6.35 | 0.05 | ||||||||||||||||
Total from Investment Activities | (9.79 | ) | (3.09 | ) | 12.55 | 6.04 | (0.28 | ) | |||||||||||||||
Distributions to Shareholders From: | |||||||||||||||||||||||
Net realized gains from investments | (0.79 | ) | (4.45 | ) | (2.16 | ) | (2.14 | ) | (3.01 | ) | |||||||||||||
Total Distributions | (0.79 | ) | (4.45 | ) | (2.16 | ) | (2.14 | ) | (3.01 | ) | |||||||||||||
Net Asset Value, End of Period | $ | 11.87 | $ | 22.45 | $ | 29.99 | $ | 19.60 | $ | 15.70 | |||||||||||||
Total Return (b) | (43.79 | )% | (9.66 | )% | 64.32 | % | 38.73 | % | (1.20 | )% | |||||||||||||
Ratios to Average Net Assets: | |||||||||||||||||||||||
Net Expenses (c) | 1.93 | % | 1.93 | % | 1.93 | % | 1.93 | % | 1.93 | % | |||||||||||||
Net Investment Income (Loss) | (1.66 | )% | (1.74 | )% | (1.68 | )% | (1.59 | )% | (1.56 | )% | |||||||||||||
Gross Expenses (c) | 3.29 | % | 1.93 | % | 3.69 | % | 4.28 | % | 2.75 | % | |||||||||||||
Supplemental Data: | |||||||||||||||||||||||
Net Assets at end of period (000's) | $ | 541 | $ | 1,089 | $ | 1,273 | $ | 681 | $ | 707 | |||||||||||||
Portfolio Turnover (d) | 56 | % | 46 | % | 30 | % | 88 | % | 83 | % | |||||||||||||
(continues on next page)
See notes to financial statements.
89
Victory Portfolios | Financial Highlights — continued | ||||||
For a Share Outstanding Throughout Each Period
Victory RS Science and Technology Fund | |||||||||||||||||||||||
Class Y | |||||||||||||||||||||||
| Year Ended December 31, 2022 | Year Ended December 31, 2021 | Year Ended December 31, 2020 | Year Ended December 31, 2019 | Year Ended December 31, 2018 | |||||||||||||||||||
Net Asset Value, Beginning of Period | $ | 31.49 | $ | 39.73 | $ | 25.36 | $ | 19.72 | $ | 22.90 | |||||||||||||
Investment Activities: | |||||||||||||||||||||||
Net investment income (loss) (a) | (0.20 | ) | (0.41 | ) | (0.29 | ) | (0.22 | ) | (0.22 | ) | |||||||||||||
| Net realized and unrealized gains (losses) | (13.42 | ) | (3.38 | ) | 16.82 | 8.00 | 0.05 | ||||||||||||||||
Total from Investment Activities | (13.62 | ) | (3.79 | ) | 16.53 | 7.78 | (0.17 | ) | |||||||||||||||
Distributions to Shareholders From: | |||||||||||||||||||||||
Net realized gains from investments | (0.79 | ) | (4.45 | ) | (2.16 | ) | (2.14 | ) | (3.01 | ) | |||||||||||||
Total Distributions | (0.79 | ) | (4.45 | ) | (2.16 | ) | (2.14 | ) | (3.01 | ) | |||||||||||||
Net Asset Value, End of Period | $ | 17.08 | $ | 31.49 | $ | 39.73 | $ | 25.36 | $ | 19.72 | |||||||||||||
Total Return (b) | (43.38 | )% | (9.04 | )% | 65.40 | % | 39.66 | % | (0.51 | )% | |||||||||||||
Ratios to Average Net Assets: | |||||||||||||||||||||||
Net Expenses (c) | 1.24 | % | 1.23 | % | 1.24 | % | 1.24 | % | 1.24 | % | |||||||||||||
Net Investment Income (Loss) | (0.97 | )% | (1.05 | )% | (0.99 | )% | (0.89 | )% | (0.85 | )% | |||||||||||||
Gross Expenses (c) | 1.28 | % | 1.23 | % | 1.26 | % | 1.26 | % | 1.25 | % | |||||||||||||
Supplemental Data: | |||||||||||||||||||||||
Net Assets at end of period (000's) | $ | 28,503 | $ | 81,080 | $ | 109,275 | $ | 77,998 | $ | 53,395 | |||||||||||||
Portfolio Turnover (d) | 56 | % | 46 | % | 30 | % | 88 | % | 83 | % | |||||||||||||
(a) Per share net investment income (loss) has been calculated using the average daily shares method.
(b) Assumes reinvestment of all net investment income and realized capital gain distributions, if any, during the period. Includes adjustments in accordance with U.S. Generally Accepted Accounting Principles and could differ from the reported total return.
(c) Does not include acquired fund fees and expenses, if any.
(d) Portfolio turnover is calculated on the basis of the Fund as a whole without distinguishing between the classes of shares.
See notes to financial statements.
90
Victory Portfolios | Financial Highlights | ||||||
For a Share Outstanding Throughout Each Period
Victory RS Small Cap Equity Fund | |||||||||||||||||||||||
Class A | |||||||||||||||||||||||
| Year Ended December 31, 2022 | Year Ended December 31, 2021 | Year Ended December 31, 2020 | Year Ended December 31, 2019 | Year Ended December 31, 2018 | |||||||||||||||||||
Net Asset Value, Beginning of Period | $ | 13.32 | $ | 18.02 | $ | 16.05 | $ | 12.97 | $ | 18.88 | |||||||||||||
Investment Activities: | |||||||||||||||||||||||
Net investment income (loss) (a) | (0.11 | ) | (0.21 | ) | (0.19 | ) | (0.15 | ) | (0.16 | ) | |||||||||||||
| Net realized and unrealized gains (losses) | (4.81 | ) | (1.28 | ) | 6.17 | 5.11 | (1.47 | ) | |||||||||||||||
Total from Investment Activities | (4.92 | ) | (1.49 | ) | 5.98 | 4.96 | (1.63 | ) | |||||||||||||||
Distributions to Shareholders From: | |||||||||||||||||||||||
Net realized gains from investments | (0.83 | ) | (3.21 | ) | (4.01 | ) | (1.88 | ) | (4.28 | ) | |||||||||||||
Total Distributions | (0.83 | ) | (3.21 | ) | (4.01 | ) | (1.88 | ) | (4.28 | ) | |||||||||||||
Net Asset Value, End of Period | $ | 7.57 | $ | 13.32 | $ | 18.02 | $ | 16.05 | $ | 12.97 | |||||||||||||
Total Return (excludes sales charge) (b) | (37.21 | )% | (7.36 | )% | 37.99 | % | 38.49 | % | (8.39 | )% | |||||||||||||
Ratios to Average Net Assets: | |||||||||||||||||||||||
Net Expenses (c) | 1.31 | % | 1.25 | % | 1.29 | % | 1.26 | % | 1.22 | % | |||||||||||||
Net Investment Income (Loss) | (1.19 | )% | (1.18 | )% | (1.14 | )% | (0.93 | )% | (0.78 | )% | |||||||||||||
Gross Expenses (c) | 1.31 | % | 1.25 | % | 1.29 | % | 1.26 | % | 1.22 | % | |||||||||||||
Supplemental Data: | |||||||||||||||||||||||
Net Assets at end of period (000's) | $ | 33,527 | $ | 60,699 | $ | 76,611 | $ | 63,247 | $ | 51,619 | |||||||||||||
Portfolio Turnover (d) | 151 | % | 113 | % | 157 | %(e) | 89 | % | 77 | % | |||||||||||||
(continues on next page)
See notes to financial statements.
91
Victory Portfolios | Financial Highlights — continued | ||||||
For a Share Outstanding Throughout Each Period
Victory RS Small Cap Equity Fund | |||||||||||||||||||||||
Class C | |||||||||||||||||||||||
| Year Ended December 31, 2022 | Year Ended December 31, 2021(f) | Year Ended December 31, 2020(f) | Year Ended December 31, 2019(f) | Year Ended December 31, 2018(f) | |||||||||||||||||||
Net Asset Value, Beginning of Period | $ | 13.49 | $ | 18.39 | $ | 49.61 | $ | 52.83 | $ | 115.36 | |||||||||||||
Investment Activities: | |||||||||||||||||||||||
Net investment income (loss) (a) | (0.19 | ) | (0.37 | ) | (0.84 | ) | (1.08 | ) | (2.04 | ) | |||||||||||||
| Net realized and unrealized gains (losses) | (4.86 | ) | (1.32 | ) | 17.74 | 20.42 | (9.13 | ) | |||||||||||||||
Total from Investment Activities | (5.05 | ) | (1.69 | ) | 16.90 | 19.34 | (11.17 | ) | |||||||||||||||
Distributions to Shareholders From: | |||||||||||||||||||||||
Net realized gains from investments | (0.83 | ) | (3.21 | ) | (48.12 | ) | (22.56 | ) | (51.36 | ) | |||||||||||||
Total Distributions | (0.83 | ) | (3.21 | ) | (48.12 | ) | (22.56 | ) | (51.36 | ) | |||||||||||||
Net Asset Value, End of Period | $ | 7.61 | $ | 13.49 | $ | 18.39 | $ | 49.61 | $ | 52.83 | |||||||||||||
| Total Return (excludes contingent deferred sales charge) (b) | (37.71 | )% | (8.14 | )% | 36.75 | % | 37.26 | % | (9.23 | )% | |||||||||||||
Ratios to Average Net Assets: | |||||||||||||||||||||||
Net Expenses (c) | 2.10 | % | 2.10 | % | 2.10 | % | 2.10 | % | 2.10 | % | |||||||||||||
Net Investment Income (Loss) | (1.99 | )% | (2.04 | )% | (1.94 | )% | (1.76 | )% | (1.71 | )% | |||||||||||||
Gross Expenses (c) | 7.52 | % | 4.32 | % | 5.26 | % | 3.86 | % | 4.24 | % | |||||||||||||
Supplemental Data: | |||||||||||||||||||||||
Net Assets at end of period (000's) | $ | 169 | $ | 380 | $ | 515 | $ | 478 | $ | 616 | |||||||||||||
Portfolio Turnover (d) | 151 | % | 113 | % | 157 | %(e) | 89 | % | 77 | % | |||||||||||||
(continues on next page)
See notes to financial statements.
92
Victory Portfolios | Financial Highlights — continued | ||||||
For a Share Outstanding Throughout Each Period
Victory RS Small Cap Equity Fund | |||||||||||||||||||||||
Class R | |||||||||||||||||||||||
| Year Ended December 31, 2022 | Year Ended December 31, 2021 | Year Ended December 31, 2020 | Year Ended December 31, 2019 | Year Ended December 31, 2018 | |||||||||||||||||||
Net Asset Value, Beginning of Period | $ | 8.41 | $ | 12.79 | $ | 12.32 | $ | 10.32 | $ | 16.08 | |||||||||||||
Investment Activities: | |||||||||||||||||||||||
Net investment income (loss) (a) | (0.10 | ) | (0.21 | ) | (0.20 | ) | (0.18 | ) | (0.23 | ) | |||||||||||||
| Net realized and unrealized gains (losses) | (3.01 | ) | (0.96 | ) | 4.68 | 4.06 | (1.25 | ) | |||||||||||||||
Total from Investment Activities | (3.11 | ) | (1.17 | ) | 4.48 | 3.88 | (1.48 | ) | |||||||||||||||
Distributions to Shareholders From: | |||||||||||||||||||||||
Net realized gains from investments | (0.83 | ) | (3.21 | ) | (4.01 | ) | (1.88 | ) | (4.28 | ) | |||||||||||||
Total Distributions | (0.83 | ) | (3.21 | ) | (4.01 | ) | (1.88 | ) | (4.28 | ) | |||||||||||||
Net Asset Value, End of Period | $ | 4.47 | $ | 8.41 | $ | 12.79 | $ | 12.32 | $ | 10.32 | |||||||||||||
Total Return (b) | (37.41 | )% | (7.87 | )% | 37.31 | % | 37.91 | % | (8.92 | )% | |||||||||||||
Ratios to Average Net Assets: | |||||||||||||||||||||||
Net Expenses (c) | 1.75 | % | 1.75 | % | 1.75 | % | 1.75 | % | 1.75 | % | |||||||||||||
Net Investment Income (Loss) | (1.63 | )% | (1.68 | )% | (1.59 | )% | (1.42 | )% | (1.30 | )% | |||||||||||||
Gross Expenses (c) | 2.23 | % | 1.89 | % | 2.05 | % | 2.05 | % | 1.88 | % | |||||||||||||
Supplemental Data: | |||||||||||||||||||||||
Net Assets at end of period (000's) | $ | 1,575 | $ | 2,949 | $ | 3,325 | $ | 2,874 | $ | 2,303 | |||||||||||||
Portfolio Turnover (d) | 151 | % | 113 | % | 157 | %(e) | 89 | % | 77 | % | |||||||||||||
(continues on next page)
See notes to financial statements.
93
Victory Portfolios | Financial Highlights — continued | ||||||
For a Share Outstanding Throughout Each Period
Victory RS Small Cap Equity Fund | |||||||||||||||||||||||
Class Y | |||||||||||||||||||||||
| Year Ended December 31, 2022 | Year Ended December 31, 2021 | Year Ended December 31, 2020 | Year Ended December 31, 2019 | Year Ended December 31, 2018 | |||||||||||||||||||
Net Asset Value, Beginning of Period | $ | 13.98 | $ | 18.71 | $ | 16.52 | $ | 13.29 | $ | 19.20 | |||||||||||||
Investment Activities: | |||||||||||||||||||||||
Net investment income (loss) (a) | (0.10 | ) | (0.19 | ) | (0.16 | ) | (0.13 | ) | (0.14 | ) | |||||||||||||
| Net realized and unrealized gains (losses) | (5.04 | ) | (1.33 | ) | 6.36 | 5.24 | (1.49 | ) | |||||||||||||||
Total from Investment Activities | (5.14 | ) | (1.52 | ) | 6.20 | 5.11 | (1.63 | ) | |||||||||||||||
Distributions to Shareholders From: | |||||||||||||||||||||||
Net realized gains from investments | (0.83 | ) | (3.21 | ) | (4.01 | ) | (1.88 | ) | (4.28 | ) | |||||||||||||
Total Distributions | (0.83 | ) | (3.21 | ) | (4.01 | ) | (1.88 | ) | (4.28 | ) | |||||||||||||
Net Asset Value, End of Period | $ | 8.01 | $ | 13.98 | $ | 18.71 | $ | 16.52 | $ | 13.29 | |||||||||||||
Total Return (b) | (37.02 | )% | (7.25 | )% | 38.24 | % | 38.69 | % | (8.23 | )% | |||||||||||||
Ratios to Average Net Assets: | |||||||||||||||||||||||
Net Expenses (c) | 1.10 | % | 1.10 | % | 1.10 | % | 1.10 | % | 1.10 | % | |||||||||||||
Net Investment Income (Loss) | (0.98 | )% | (1.03 | )% | (0.95 | )% | (0.77 | )% | (0.69 | )% | |||||||||||||
Gross Expenses (c) | 1.44 | % | 1.10 | % | 1.58 | % | 1.43 | % | 1.68 | % | |||||||||||||
Supplemental Data: | |||||||||||||||||||||||
Net Assets at end of period (000's) | $ | 1,838 | $ | 3,095 | $ | 4,449 | $ | 3,275 | $ | 2,750 | |||||||||||||
Portfolio Turnover (d) | 151 | % | 113 | % | 157 | %(e) | 89 | % | 77 | % | |||||||||||||
(continues on next page)
See notes to financial statements.
94
Victory Portfolios | Financial Highlights — continued | ||||||
For a Share Outstanding Throughout Each Period
Victory RS Small Cap Equity Fund | |||||||||||||||
Member Class | |||||||||||||||
| Year Ended December 31, 2022 | Year Ended December 31, 2021 | November 3, 2020(g) through December 31, 2020 | |||||||||||||
Net Asset Value, Beginning of Period | $ | 13.34 | $ | 18.04 | $ | 17.72 | |||||||||
Investment Activities: | |||||||||||||||
Net investment income (loss) (a) | (0.10 | ) | (0.19 | ) | (0.04 | ) | |||||||||
Net realized and unrealized gains (losses) | (4.81 | ) | (1.30 | ) | 4.37 | ||||||||||
Total from Investment Activities | (4.91 | ) | (1.49 | ) | 4.33 | ||||||||||
Distributions to Shareholders From: | |||||||||||||||
Net realized gains from investments | (0.83 | ) | (3.21 | ) | (4.01 | ) | |||||||||
Total Distributions | (0.83 | ) | (3.21 | ) | (4.01 | ) | |||||||||
Net Asset Value, End of Period | $ | 7.60 | $ | 13.34 | $ | 18.04 | |||||||||
Total Return (b) (h) | (37.08 | )% | (7.35 | )% | 25.09 | % | |||||||||
Ratios to Average Net Assets: | |||||||||||||||
Net Expenses (c) (i) | 1.15 | % | 1.15 | % | 1.15 | % | |||||||||
Net Investment Income (Loss) (i) | (1.03 | )% | (1.08 | )% | (1.14 | )% | |||||||||
Gross Expenses (c) (i) | 2.44 | % | 3.55 | % | 23.73 | % | |||||||||
Supplemental Data: | |||||||||||||||
Net Assets at end of period (000's) | $ | 1,454 | $ | 1,394 | $ | 218 | |||||||||
Portfolio Turnover (d) (h) | 151 | % | 113 | % | 157 | %(e) | |||||||||
(a) Per share net investment income (loss) has been calculated using the average daily shares method.
(b) Assumes reinvestment of all net investment income and realized capital gain distributions, if any, during the period. Includes adjustments in accordance with U.S. Generally Accepted Accounting Principles and could differ from the reported total return.
(c) Does not include acquired fund fees and expenses, if any.
(d) Portfolio turnover is calculated on the basis of the Fund as a whole without distinguishing between the classes of shares.
(e) Reflects increased trading activity due to changes in allocation strategies
(f) As described in Note 8 of the accompanying Notes to Financial Statements, per share amounts were adjusted for a 1:12 reverse stock split.
(g) Commencement of operations.
(h) Not annualized for periods less than one year.
(i) Annualized for periods less than one year.
See notes to financial statements.
95
Victory Portfolios | Notes to Financial Statements December 31, 2022 | ||||||
1. Organization:
Victory Portfolios (the "Trust") is organized as a Delaware statutory trust and the Trust is registered under the Investment Company Act of 1940, as amended (the "1940 Act"), as an open-end investment company. The Trust is comprised of 37 funds and is authorized to issue an unlimited number of shares, which are units of beneficial interest with a par value of $0.001 per share.
The accompanying financial statements are those of the following six Funds (collectively, the "Funds" and individually, a "Fund"). Each Fund is classified as diversified under the 1940 Act.
Funds (Legal Name) | Funds (Short Name) | Investment Share Classes Offered | |||||||||
Victory RS Small Cap Growth Fund | RS Small Cap Growth Fund | A, C, R, R6, and Y | |||||||||
Victory RS Select Growth Fund | RS Select Growth Fund | A, C, R, R6, and Y | |||||||||
| Victory RS Mid Cap Growth Fund | RS Mid Cap Growth Fund | A, C, R, R6, Y, and Member Class | |||||||||
Victory RS Growth Fund | RS Growth Fund | A, C, R, and Y | |||||||||
| Victory RS Science and Technology Fund | RS Science and Technology Fund | A, C, R, and Y | |||||||||
| Victory RS Small Cap Equity Fund | RS Small Cap Equity Fund | A, C, R, Y, and Member Class | |||||||||
Each class of shares of a Fund has substantially identical rights and privileges except with respect to sales charges, fees paid under distribution plans, expenses allocable exclusively to each class of shares, voting rights on matters solely affecting a single class of shares, and the exchange privilege of each class of shares.
Victory Capital Management Inc. ("VCM" or the "Adviser") is an indirect wholly owned subsidiary of Victory Capital Holdings, Inc., a publicly traded Delaware corporation, and a wholly owned direct subsidiary of Victory Capital Operating, LLC.
Under the Trust's organizational documents, its officers and trustees are indemnified against certain liabilities arising out of the performance of their duties to the Funds. In addition, in the normal course of business, the Funds enter into contracts with their vendors and others that provide for general indemnifications. The Funds' maximum exposure under these arrangements is unknown, as this would involve future claims that may be made against the Funds. However, based on experience, the Funds expect that risk of loss to be remote.
2. Significant Accounting Policies:
The following is a summary of significant accounting policies followed by the Trust in the preparation of its financial statements. The policies are in conformity with U.S. Generally Accepted Accounting Principles ("GAAP"). The preparation of financial statements in accordance with GAAP requires management to make estimates and assumptions that affect the reported amounts of assets and liabilities and disclosure of contingent assets and liabilities at the date of the financial statements and the reported amounts of income and expenses for the period. Actual results could differ from those estimates. The Funds follow the specialized accounting and reporting requirements under GAAP that are applicable to investment companies under Accounting Standards Codification Topic 946.
Investment Valuation:
The Funds record investments at fair value. Fair value is defined as the price that would be received to sell an asset or paid to transfer a liability in an orderly transaction between market participants at the measurement date.
96
Victory Portfolios | Notes to Financial Statements — continued December 31, 2022 | ||||||
The valuation techniques described below maximize the use of observable inputs and minimize the use of unobservable inputs in determining fair value. The inputs used for valuing the Funds' investments are summarized in the three broad levels listed below:
• Level 1 — quoted prices (unadjusted) in active markets for identical securities
• Level 2 — other significant observable inputs (including quoted prices for similar securities, interest rates, or credit spreads, applicable to those securities, etc.)
• Level 3 — significant unobservable inputs (including the Adviser's assumptions in determining the fair value of investments)
Changes in valuation techniques may result in transfers in or out of an assigned level within the disclosure hierarchy. The inputs or methodologies used for valuation techniques are not necessarily an indication of the risk associated with entering into those investments.
The Adviser, appointed as the valuation designee by the Trust's Board of Trustees' (the "Board"), has established the Pricing and Liquidity Committee (the "Committee"), and subject to Board oversight, the Committee administers and oversees the Funds' valuation policies and procedures, which are approved by the Board.
Portfolio securities listed or traded on securities exchanges, including Exchange-Traded Funds ("ETFs"), and American Depositary Receipts ("ADRs"), are valued at the closing price on the exchange or system where the security is principally traded, if available, or at the Nasdaq Official Closing Price. If there have been no sales for that day on the exchange or system, then a security is valued at the last available bid quotation on the exchange or system where the security is principally traded. In each of these situations, valuations are typically categorized as Level 1 in the fair value hierarchy.
Investments in open-end investment companies, other than ETFs, are valued at their net asset value ("NAV"). These valuations are typically categorized as Level 1 in the fair value hierarchy.
In the event that price quotations or valuations are not readily available, investments are valued at fair value in accordance with procedures established by and under the general supervision and responsibility of the Board. These valuations are typically categorized as Level 2 or Level 3 in the fair value hierarchy, based on the observability of inputs used to determine the fair value. The effect of fair value pricing is that securities may not be priced on the basis of quotations from the primary market in which they are traded and the actual price realized from the sale of a security may differ materially from the fair value price. Valuing these securities at fair value is intended to cause the Fund's NAV to be more reliable than it otherwise would be.
A summary of the valuations as of December 31, 2022, based upon the three levels defined above, is included in the table below while the breakdown, by category, of investments is disclosed on the Schedules of Portfolio Investments:
Level 1 | Level 2 | Level 3 | Total | ||||||||||||||||
RS Small Cap Growth Fund | |||||||||||||||||||
Common Stocks | $ | 732,939,001 | $ | — | $ | — | $ | 732,939,001 | |||||||||||
Collateral for Securities Loaned | 6,579,360 | — | — | 6,579,360 | |||||||||||||||
Total | $ | 739,518,361 | $ | — | $ | — | $ | 739,518,361 | |||||||||||
RS Select Growth Fund | |||||||||||||||||||
Common Stocks | $ | 102,479,999 | $ | — | $ | — | $ | 102,479,999 | |||||||||||
Total | $ | 102,479,999 | $ | — | $ | — | $ | 102,479,999 | |||||||||||
RS Mid Cap Growth Fund | |||||||||||||||||||
Common Stocks | $ | 82,957,963 | $ | — | $ | — | $ | 82,957,963 | |||||||||||
Total | $ | 82,957,963 | $ | — | $ | — | $ | 82,957,963 | |||||||||||
97
Victory Portfolios | Notes to Financial Statements — continued December 31, 2022 | ||||||
Level 1 | Level 2 | Level 3 | Total | ||||||||||||||||
Growth Fund | |||||||||||||||||||
Common Stocks | $ | 208,479,807 | $ | — | $ | — | $ | 208,479,807 | |||||||||||
Total | $ | 208,479,807 | $ | — | $ | — | $ | 208,479,807 | |||||||||||
RS Science and Technology Fund | |||||||||||||||||||
Common Stocks | $ | 164,041,333 | $ | — | $ | — | $ | 164,041,333 | |||||||||||
Warrants | 6,311 | — | (a) | — | 6,311 | ||||||||||||||
Collateral for Securities Loaned | 1,672,020 | — | — | 1,672,020 | |||||||||||||||
Total | $ | 165,719,664 | $ | — | (a) | $ | — | $ | 165,719,664 | ||||||||||
RS Small Cap Equity Fund | |||||||||||||||||||
Common Stocks | $ | 37,028,861 | $ | — | $ | — | $ | 37,028,861 | |||||||||||
Collateral for Securities Loaned | 643,312 | — | — | 643,312 | |||||||||||||||
Total | $ | 37,672,173 | $ | — | $ | — | $ | 37,672,173 | |||||||||||
(a) Rounds to less than $1.
As of December 31, 2022, there were no transfers into/out of Level 3.
Real Estate Investment Trusts ("REITs"):
The Funds may invest in REITs, which report information on the source of their distributions annually. REITs are pooled investment vehicles that invest primarily in income-producing real estate or real-estate related loans or interests (such as mortgages). Certain distributions received from REITs during the year are recorded as realized gains or return of capital as estimated by the Funds or when such information becomes known.
Investment Companies:
Open-End Funds:
The Funds may invest in portfolios of open-end investment companies. These investment companies value securities in their portfolios for which market quotations are readily available at their market values (generally the last reported sale price) and all other securities and assets at their fair value by the methods established by the board of directors of the underlying funds.
Investment Transactions and Related Income:
Changes in holdings of investments are accounted for no later than one business day following the trade date. For financial reporting purposes, however, investment transactions are accounted for on trade date or the last business day of the reporting period. Interest income is determined on the basis of coupon interest accrued using the effective interest method which adjusts, where applicable, the amortization of premiums or accretion of discounts. Dividend income is recorded on the ex-dividend date. Gains or losses realized on sales of securities are recorded on the identified cost basis.
Securities Lending:
The Funds, through a Securities Lending Agreement with Citibank, N.A. ("Citibank"), may lend their securities to qualified financial institutions, such as certain broker-dealers and banks, to earn additional income, net of income retained by Citibank. Borrowers are required to initially secure their loans for collateral in the amount of at least 102% of the value of U.S. securities loaned or at least 105% of the value of non-U.S. securities loaned, marked-to-market daily. Any collateral shortfalls associated with increases in the valuation of the securities loaned are generally cured the next business day. The collateral can be received in the form of cash collateral and/or non-cash collateral. Non-cash collateral can include U.S. Government Securities and other securities as permitted by Securities and Exchange Commission ("SEC") guidelines. The cash collateral is invested in short-term instruments or cash
98
Victory Portfolios | Notes to Financial Statements — continued December 31, 2022 | ||||||
equivalents, primarily open-end investment companies, as noted on the Funds' Schedules of Portfolio Investments. The Funds effectively do not have control of the non-cash collateral and therefore it is not disclosed on the Funds' Schedules of Portfolio Investments. Collateral requirements are determined daily based on the value of the Funds' securities on loan as of the end of the prior business day. During the time portfolio securities are on loan, the borrower will pay the Funds any dividends or interest paid on such securities plus any fee negotiated between the parties to the lending agreement. The Funds also earn a return from the collateral. The Funds pay Citibank various fees in connection with the investment of cash collateral and fees based on the investment income received from securities lending activities. Securities lending income (net of these fees) is disclosed on the Statements of Operations. Loans are terminable upon demand and the borrower must return the loaned securities within the lesser of one standard settlement period or five business days. Although risk is mitigated by the collateral, a Fund could experience a delay in recovering its securities and possible loss of income or value if the borrower fails to return them. In addition, there is a risk that the value of the short-term investments will be less than the amount of cash collateral required to be returned to the borrower.
The Funds' agreement with Citibank does not include master netting provisions. Non-cash collateral received by the Funds may not be sold or repledged, except to satisfy borrower default.
The following table is a summary of the Funds' securities lending transactions as of December 31, 2022.
| Value of Securities on Loan | Non-Cash Collateral | Cash Collateral | |||||||||||||
RS Small Cap Growth Fund | $ | 6,600,581 | $ | — | $ | 6,579,360 | |||||||||
RS Science and Technology Fund | 1,639,291 | — | 1,672,020 | ||||||||||||
RS Small Cap Equity Fund | 642,562 | — | 643,312 | ||||||||||||
Federal Income Taxes:
Each Fund intends to continue to qualify as a regulated investment company by complying with the provisions available to certain investment companies, as defined in applicable sections of the Internal Revenue Code, and to make distributions of net investment income and net realized gains sufficient to relieve it from all, or substantially all, federal income taxes. Accordingly, no provision for federal income taxes is required in the financial statements. The Funds have a tax year end of December 31.
For the year ended December 31, 2022, the Funds did not incur any income tax, interest, or penalties, and have recorded no liability for net unrecognized tax benefits relating to uncertain tax positions.
Management of the Funds has reviewed tax positions taken in tax years that remain subject to examination by all major tax jurisdictions, including federal (i.e., the last four tax years, which includes the current fiscal tax year end). Management believes that there is no tax liability resulting from unrecognized tax benefits related to uncertain tax positions taken.
Allocations:
Expenses directly attributable to a Fund are charged to that Fund, while expenses that are attributable to more than one fund in the Trust, or jointly with an affiliated trust, are allocated among the respective funds in the Trust and/or an affiliated trust based upon net assets or another appropriate basis.
Income, expenses (other than class-specific expenses such as transfer agent fees, state registration fees, printing fees, and 12b-1 fees), and realized and unrealized gains or losses on investments are allocated to each class of shares based on its relative net assets on the date income is earned or expenses and realized and unrealized gains and losses are incurred.
99
Victory Portfolios | Notes to Financial Statements — continued December 31, 2022 | ||||||
3. Purchases and Sales:
Purchases and sales of securities (excluding securities maturing less than one year from acquisition) for the year ended December 31, 2022, were as follows:
| Excluding U.S. Government Securities | |||||||||||
Purchases | Sales | ||||||||||
RS Small Cap Growth Fund | $ | 1,317,120,801 | $ | 2,122,517,621 | |||||||
RS Select Growth Fund | 177,191,198 | 213,427,113 | |||||||||
RS Mid Cap Growth Fund | 284,309,853 | 454,712,273 | |||||||||
RS Growth Fund | 248,411,625 | 273,075,849 | |||||||||
RS Science and Technology Fund | 120,918,331 | 156,348,961 | |||||||||
RS Small Cap Equity Fund | 69,883,579 | 75,961,789 | |||||||||
4. Fees and Transactions with Affiliates and Related Parties:
Investment Advisory Fees:
Investment advisory services are provided to the Funds by the Adviser, which is a New York corporation registered as an investment adviser with the SEC.
Under the terms of the Investment Advisory Agreement, the Adviser is entitled to receive fees based on a percentage of the average daily net assets of each Fund. The rates at which the Adviser is paid by each Fund are included in the table below.
Flat Rate | |||||||
RS Small Cap Growth Fund | 0.95 | % | |||||
RS Select Growth Fund | 1.00 | % | |||||
RS Mid Cap Growth Fund | 0.85 | % | |||||
RS Growth Fund | 0.75 | % | |||||
RS Science and Technology Fund | 1.00 | % | |||||
RS Small Cap Equity Fund | 0.75 | % | |||||
Amounts incurred and paid to VCM for the year ended December 31, 2022, are reflected on the Statements of Operations as Investment advisory fees.
Administration and Servicing Fees:
VCM also serves as the Funds' administrator and fund accountant. Under the Administration and Fund Accounting Agreement, VCM is entitled to receive fees based on a percentage of the average daily net assets of the Trust, Victory Variable Insurance Funds and Victory Portfolios II. The tiered rates at which VCM is paid by the Funds are shown in the table below:
Net Assets | |||||||||||
Up to $15 billion | $15 billion – $30 billion | Over $30 billion | |||||||||
0.08 | %, plus | 0.05 | %, plus | 0.04 | % | ||||||
Amounts incurred for the year ended December 31, 2022, are reflected on the Statements of Operations as Administration fees.
Citi Fund Services Ohio, Inc. ("Citi"), an affiliate of Citibank, acts as sub-administrator and sub-fund accountant to the Funds pursuant to the Sub-Administration and Sub-Fund Accounting Services Agreement between VCM and Citi. VCM pays Citi a fee for providing these services. The Trust reimburses VCM and Citi for out-of-pocket expenses incurred in providing these services and certain other expenses specifically allocated to the Funds. Amounts incurred for the year ended December 31, 2022, are reflected on the Statements of Operations as Sub-Administration fees.
100
Victory Portfolios | Notes to Financial Statements — continued December 31, 2022 | ||||||
The Funds (as part of the Trust) have entered into an agreement with the Adviser to provide compliance services, pursuant to which the Adviser furnishes its compliance personnel, including the services of the Chief Compliance Officer ("CCO"), and other resources reasonably necessary to provide the Trust with compliance oversight services related to the design, administration, and oversight of a compliance program for the Trust in accordance with Rule 38a-1 under the 1940 Act. The CCO is an employee of the Adviser, which pays the compensation of the CCO and support staff. The funds in the Trust, Victory Variable Insurance Funds, Victory Portfolios II and USAA Mutual Funds (collectively, the "Victory Funds Complex"), in aggregate, compensate the Adviser for these services. Amounts incurred for the year ended December 31, 2022, are reflected on the Statements of Operations as Compliance fees.
Transfer Agency Fees:
FIS Investor Services, LLC ("FIS") serves as the Funds' transfer agent. Under the Transfer Agent Agreement, the Trust pays FIS a fee for its services and reimburses FIS for all of their reasonable out-of-pocket expenses incurred in providing these services. Amounts incurred for the year ended December 31, 2022, are reflected on the Statements of Operations as Transfer agent fees.
Victory Capital Transfer Agency, Inc., an affiliate of the Adviser, serves as sub-transfer agent for the Member Class. Amounts incurred for the year ended December 31, 2022, are reflected on the Statements of Operations as Transfer agent fees.
Distributor/Underwriting Services:
Victory Capital Services, Inc. (the "Distributor"), an affiliate of the Adviser, serves as Distributor for the continuous offering of the shares of the Funds pursuant to a Distribution Agreement between the Distributor and the Trust.
Pursuant to the Distribution and Service Plans adopted in accordance with Rule 12b-1 under the 1940 Act, the Distributor may receive a monthly distribution and service fee up to the annual rate shown in the table below:
Class A | Class C | Class R | |||||||||||||
RS Small Cap Growth Fund | 0.25 | % | 1.00 | % | 0.50 | % | |||||||||
RS Select Growth Fund | 0.25 | % | 1.00 | % | 0.50 | % | |||||||||
RS Mid Cap Growth Fund | 0.25 | % | 1.00 | % | 0.50 | % | |||||||||
RS Growth Fund | 0.25 | % | 1.00 | % | 0.50 | % | |||||||||
RS Science and Technology Fund | 0.25 | % | 1.00 | % | 0.50 | % | |||||||||
RS Small Cap Equity Fund | 0.25 | % | 1.00 | % | 0.50 | % | |||||||||
The distribution and service fees paid to the Distributor may be used by the Distributor to pay for activities primarily intended to result in the sale of Class A, Class C, and Class R. Amounts incurred for the year ended December 31, 2022, are reflected on the Statements of Operations as 12b-1 fees.
In addition, the Distributor is entitled to receive commissions in connection with sales of the Class A. For the year ended December 31, 2022, the Distributor received $18,144 from commissions earned in connection with sales of Class A.
Other Fees:
Citibank serves as the Funds' custodian. The Funds pay Citibank a fee for providing these services. Amounts incurred for the year ended December 31, 2022, are reflected on the Statements of Operations as Custodian fees.
Sidley Austin LLP provides legal services to the Trust.
The Adviser has entered into expense limitation agreements with the Funds. Under the terms of the agreements, the Adviser has agreed to waive fees or reimburse certain expenses to the extent that ordinary operating expenses incurred by certain classes of a Fund in any fiscal year exceed the expense
101
Victory Portfolios | Notes to Financial Statements — continued December 31, 2022 | ||||||
limit for such classes of the Fund. Such excess amounts will be the liability of the Adviser. Acquired fund fees and expenses, interest, taxes, brokerage commissions, other expenditures which are capitalized in accordance with GAAP, and other extraordinary expenses not incurred in the ordinary course of the Fund's business are excluded from the expense limits. As of December 31, 2022, the expense limits (excluding voluntary waivers) are as follows:
In effect until April 30, 2023 | |||||||||||||||||||||||||||
Class A | Class C | Class R | Class R6 | Class Y | Member Class | ||||||||||||||||||||||
RS Small Cap Growth Fund | 1.40 | % | 2.16 | % | 1.86 | % | 1.06 | % | 1.13 | % | N/A | ||||||||||||||||
RS Select Growth Fund | 1.40 | % | 2.18 | % | 1.91 | % | 1.06 | % | 1.14 | % | N/A | ||||||||||||||||
RS Mid Cap Growth Fund | 1.20 | % | 2.11 | % | 1.80 | % | 0.94 | % | 0.95 | % | 1.05 | % | |||||||||||||||
RS Growth Fund | 1.10 | % | 1.93 | % | 1.71 | % | N/A | 0.83 | % | N/A | |||||||||||||||||
RS Science and Technology Fund | 1.49 | % | 2.28 | % | 1.93 | % | N/A | 1.24 | % | N/A | |||||||||||||||||
RS Small Cap Equity Fund | 1.35 | % | 2.10 | % | 1.75 | % | N/A | 1.10 | % | 1.15 | % | ||||||||||||||||
Under the terms of the expense limitation agreements, the Funds have agreed to repay fees and expenses that were waived or reimbursed by the Adviser for a period of up to three years (thirty-six (36) months) after the waiver or reimbursement took place, subject to the lesser of any operating expense limits in effect at the time of: (a) the original waiver or expense reimbursement; or (b) the recoupment, after giving effect to the recoupment amount.
As of December 31, 2022, the following amounts are available to be repaid to the Adviser. The Funds have not recorded any amounts available to be repaid as a liability due to an assessment that such repayments are not probable at December 31, 2022.
| Expires 2023 | Expires 2024 | Expires 2025 | Total | ||||||||||||||||
RS Small Cap Growth Fund | $ | 420,525 | $ | 315,198 | $ | 392,843 | $ | 1,128,566 | |||||||||||
RS Select Growth Fund | 227,571 | 180,839 | 170,568 | 578,978 | |||||||||||||||
RS Mid Cap Growth Fund | 755,044 | 678,326 | 404,134 | 1,837,504 | |||||||||||||||
RS Growth Fund | 294,950 | 240,370 | 237,938 | 773,258 | |||||||||||||||
RS Science and Technology Fund | 32,689 | — | 31,991 | 64,680 | |||||||||||||||
RS Small Cap Equity Fund | 40,673 | 42,087 | 45,282 | 128,042 | |||||||||||||||
The Adviser may voluntarily waive or reimburse additional fees to assist the Funds in maintaining competitive expense ratios. Voluntary waivers and reimbursements applicable to the Funds are not available to be recouped at a future time. There were no voluntary waivers or reimbursements for the year ended December 31, 2022.
Certain officers and/or interested trustees of the Funds are also officers and/or employees of the Adviser, administrator, fund accountant, sub-administrator, sub-fund accountant, custodian, legal counsel, and Distributor.
5. Risks:
The Funds may be subject to other risks in addition to these identified risks.
Equity Risk — The values of the equity securities in which the Funds invest may decline in response to developments affecting individual companies and/or general economic conditions in the United States or abroad. A company's earnings or dividends may not increase as expected (or map decline) because of poor management, competitive pressures, reliance on particular suppliers or geographical regions, labor problems or shortages, corporate restructurings, fraudulent disclosures, man-made or natural disasters, military confrontations or wars, terrorism, public health crises, or other events, conditions, and factors. Price changes may be temporary or last for extended periods.
Market Risk — Overall market risks may affect the value of the Funds. Domestic and international factors such as political events, war, terrorism, trade disputes, inflation rates, interest rate levels and other fiscal and monetary policy changes, cybersecurity incidents, pandemics and other public health
102
Victory Portfolios | Notes to Financial Statements — continued December 31, 2022 | ||||||
crises, sanctions against a particular foreign country, its nationals, businesses or industries and related geopolitical events, as well as environmental disasters such as earthquakes, fires, and floods or other catastrophes, may add to instability in global economies and markets generally, and may lead to increased market volatility. Global economies and financial markets are highly interconnected, which increases the possibility that conditions in one country or region might adversely affect issuers in another country or region. The impact of these and other factors may be short-term or may last for extended periods.
Sector Focus Risk — To the extent the Funds focus in one or more sectors, market or economic factors impacting those sectors could have a significant effect on the value of the Funds' investments and could make the Funds' performance more volatile. For example, the values of companies in the Information Technology sector are particularly vulnerable to economic downturns, short product cycles and aggressive pricing, market competition and changes in government regulation.
Concentration Risk — The RS Science and Technology Fund (herein, the "Fund") may concentrate its investments in a particular industry, as the term "concentration" is used in the 1940 Act. Concentrating investments in the Science and Technology-related sectors increases the risk of loss because the stocks of many or all of the companies in the sectors may decline in value due to developments adversely affecting the sectors. In addition, investors may buy or sell substantial amounts of the Fund's shares in response to factors affecting or expected to affect the sectors, resulting in extreme inflows and outflows of cash into and out of the Fund. Such inflows or outflows might affect management of the Fund adversely to the extent they cause the Fund's cash position or cash requirements to exceed normal levels.
Smaller-Capitalization Stock Risk — Small- and mid-sized capitalization companies are subject to a number of risks not associated with larger, more established companies, potentially making their stock prices more volatile and increasing the risk of loss. Smaller companies may have limited markets, product lines, or financial resources and lack management experience and may experience higher failure rates than larger companies.
6. Borrowing and Interfund Lending:
Line of Credit:
The Victory Funds Complex participates in a short-term demand note "Line of Credit" agreement with Citibank. The Line of Credit agreement with Citibank was renewed on June 27, 2022, with a termination date of June 26, 2023. Under the agreement with Citibank, the Victory Funds Complex may borrow up to $600 million, of which $300 million is committed and $300 million is uncommitted. $40 million of the Line of Credit is reserved for use by the Victory Floating Rate Fund, another series of the Victory Funds Complex, with Victory Floating Rate Fund paying the related commitment fees for that amount. The purpose of the Line of Credit is to meet temporary or emergency cash needs. For the year ended December 31, 2022, Citibank received an annual commitment fee of 0.15% on $300 million for providing the Line of Credit. Each fund in the Victory Funds Complex paid a pro-rata portion of the commitment fees plus any interest on amounts borrowed. For the period from January 1, 2022, through June 27, 2022, interest was based on the one-month London Interbank Offered Rate ("LIBOR") plus one percent. Effective with the renewal, for the period June 28, 2022, through December 31, 2022, interest was based on the one-month Secured Overnight Financing Rate (SOFR) plus 1.10 percent. The Funds did not experience a material financial impact transitioning from LIBOR to SOFR. Interest charged to each fund during the period, if applicable, is reflected on the Statement of Operations under Line of credit fees.
103
Victory Portfolios | Notes to Financial Statements — continued December 31, 2022 | ||||||
The average borrowing for the days outstanding and average interest rate for the Funds during the year ended December 31, 2022, were as follows
| Amount Outstanding at December 31, 2022 | Average Borrowing* | Days Borrowing Outstanding | Average Interest Rate* | Maximum Borrowing During the Period | ||||||||||||||||||
| RS Mid Cap Growth Fund | $ | — | $ | 16,400,000 | 6 | 4.87 | % | $ | 19,600,000 | ||||||||||||||
* For the year ended December 31, 2022, based on the number of days borrowings were outstanding.
Interfund Lending:
The Trust and the Adviser rely on an exemptive order granted by the SEC in March 2017 (the "Order"), permitting the establishment and operation of an Interfund Lending Facility (the "Facility"). The Facility allows each Fund to directly lend and borrow money to or from any other fund in the Victory Funds Complex that is permitted to participate in the Facility, relying upon the Order at rates beneficial to both the borrowing and lending funds. Advances under the Facility are allowed for temporary or emergency purposes, including the meeting of redemption requests that otherwise might require the untimely disposition of securities, and are subject to each Fund's borrowing restrictions. The interfund loan rate is determined, as specified in the Order, by averaging the current repurchase agreement rate and the current bank loan rate. As a Borrower, interest charged to each Fund, if any, during the period, is reflected on the Statements of Operations under Interfund lending fees. As a Lender, interest earned by each Fund, if any, during the period, is reflected on the Statements of Operations under Interfund lending.
The average borrowing or lending for the days outstanding and average interest rate for the Funds that utilized this Facility during the year ended December 31, 2022, were as follows:
| Borrower or Lender | Amount Outstanding at December 31, 2022 | Average Borrowing* | Days Borrowing Outstanding | Average Interest Rate* | Maximum Borrowing During the Period | ||||||||||||||||||||||
| RS Small Cap Growth Fund | Borrower | $ | — | $ | 14,029,773 | 22 | 2.07 | % | $ | 53,069,000 | |||||||||||||||||
| RS Select Growth Fund | Borrower | — | 1,883,500 | 4 | 4.79 | % | 1,894,000 | ||||||||||||||||||||
| RS Mid Cap Growth Fund | Borrower | — | 4,549,833 | 24 | 3.07 | % | 19,000,000 | ||||||||||||||||||||
RS Growth Fund | Borrower | 1,968,000 | 1,930,400 | 5 | 4.84 | % | 1,968,000 | ||||||||||||||||||||
* For the year ended December 31, 2022, based on the number of days borrowings were outstanding.
7. Federal Income Tax Information:
Dividends from net investment income, if any, are declared and paid as noted in the table below. Distributable net realized gains, if any, are declared and distributed at least annually from each Fund.
Declared | Paid | ||||||||||
RS Small Cap Growth Fund | Annually | Annually | |||||||||
RS Select Growth Fund | Annually | Annually | |||||||||
RS Mid Cap Growth Fund | Annually | Annually | |||||||||
RS Growth Fund | Annually | Annually | |||||||||
RS Science and Technology Fund | Annually | Annually | |||||||||
RS Small Cap Equity Fund | Annually | Annually | |||||||||
104
Victory Portfolios | Notes to Financial Statements — continued December 31, 2022 | ||||||
The amounts of dividends from net investment income and distributions from net realized gains (collectively, distributions to shareholders) are determined in accordance with federal income tax regulations, which may differ from GAAP. To the extent these "book/tax" differences are permanent in nature (e.g., net operating loss and distribution reclassification), such amounts are reclassified within the components of net assets based on their federal tax-basis treatment; temporary differences (e.g., wash sales) do not require reclassification. To the extent dividends and distributions exceed net investment income and net realized gains for tax purposes, they are reported as distributions of capital. Net investment losses incurred by the Funds may be reclassified as an offset to capital on the accompanying Statements of Assets and Liabilities.
As of December 31, 2022, on the Statement of Assets and Liabilities, as a result of permanent book-to-tax differences, reclassification adjustments were as follows:
| Total Accumulated Earnings/(Loss) | Capital | ||||||||||
RS Small Cap Growth Fund | $ | 10,980,929 | $ | (10,980,929 | ) | ||||||
| RS Select Growth Fund | 1,310,904 | (1,310,904 | ) | ||||||||
| RS Mid Cap Growth Fund | 1,351,728 | (1,351,728 | ) | ||||||||
| RS Growth Fund | 1,311,555 | (1,311,555 | ) | ||||||||
| RS Science and Technology Fund | 2,473,190 | (2,473,190 | ) | ||||||||
| RS Small Cap Equity Fund | 551,687 | (551,687 | ) | ||||||||
The tax character of current year distributions paid and the tax basis of the current components of accumulated earnings (loss) will be determined at the end of the current tax year ending December 31, 2022.
| Year Ended December 31, 2022 | ||||||||||||||||||||||
| Distributions Paid From: |
| |||||||||||||||||||||
| Ordinary Income | Net Long-Term Capital Gains | Total Taxable Distributions | Return of Capital | Total Distributions Paid | ||||||||||||||||||
RS Small Cap Growth Fund | $ | — | $ | 43,757,183 | $ | 43,757,183 | $ | 8,783 | $ | 43,765,966 | |||||||||||||
RS Select Growth Fund | 4,809,209 | 25,339,340 | 30,148,549 | — | 30,148,549 | ||||||||||||||||||
RS Mid Cap Growth Fund | — | 3,708,813 | 3,708,813 | 1,842 | 3,710,655 | ||||||||||||||||||
RS Growth Fund | — | 4,815,879 | 4,815,879 | — | 4,815,879 | ||||||||||||||||||
RS Science and Technology Fund | — | 8,279,682 | 8,279,682 | — | 8,279,682 | ||||||||||||||||||
RS Small Cap Equity Fund | 2,905,298 | 1,044,840 | 3,950,138 | — | 3,950,138 | ||||||||||||||||||
Year Ended December 31, 2021 | |||||||||||||||
Distributions Paid From: | |||||||||||||||
| Ordinary Income | Net Long-Term Capital Gains | Total Distributions Paid | |||||||||||||
RS Small Cap Growth Fund | $ | — | $ | 322,000,707 | $ | 322,000,707 | |||||||||
RS Select Growth Fund | — | 45,651,408 | 45,651,408 | ||||||||||||
| RS Mid Cap Growth Fund | 27,743,023 | 98,554,497 | 126,297,520 | ||||||||||||
RS Growth Fund | 7,459,930 | 21,415,939 | 28,875,869 | ||||||||||||
RS Science and Technology Fund | — | 46,934,494 | 46,934,494 | ||||||||||||
RS Small Cap Equity Fund | 3,798,901 | 9,886,822 | 13,685,723 | ||||||||||||
105
Victory Portfolios | Notes to Financial Statements — continued December 31, 2022 | ||||||
As of December 31, 2022, the components of accumulated earnings (loss) on a tax basis were as follows:
| Accumulated Capital and Other Losses | Unrealized Appreciation (Depreciation)* | Total Accumulated Earnings (Loss) | ||||||||||||
RS Small Cap Growth Fund | $ | (337,946,591 | ) | $ | 33,696,624 | $ | (304,249,967 | ) | |||||||
RS Select Growth Fund | (16,832,034 | ) | 3,405,989 | (13,426,045 | ) | ||||||||||
RS Mid Cap Growth Fund | (26,817,470 | ) | 6,431,873 | (20,385,597 | ) | ||||||||||
RS Growth Fund | (6,366,788 | ) | 58,054,647 | 51,687,859 | |||||||||||
RS Science and Technology Fund | (44,515,672 | ) | 31,258,449 | (13,257,223 | ) | ||||||||||
RS Small Cap Equity Fund | (20,776,014 | ) | (3,372,304 | ) | (24,148,318 | ) | |||||||||
* The difference between the book-basis and tax-basis unrealized appreciation (depreciation) is attributable primarily to tax deferral of losses on wash sales.
As of December 31, 2022, the Funds had net capital loss carryforwards as shown in the table below. It is unlikely that the Board will authorize a distribution of capital gains realized in the future until the capital loss carryforwards have been used.
| Short-Term Amount | Long-Term Amount | Total | ||||||||||||
RS Small Cap Growth Fund | $ | 331,471,936 | $ | 6,474,655 | $ | 337,946,591 | |||||||||
RS Select Growth Fund | 16,832,034 | — | 16,832,034 | ||||||||||||
RS Mid Cap Growth Fund | 26,817,470 | — | 26,817,470 | ||||||||||||
RS Growth Fund | 6,366,788 | — | 6,366,788 | ||||||||||||
RS Science and Technology Fund | 44,515,672 | — | 44,515,672 | ||||||||||||
RS Small Cap Equity Fund | 14,376,656 | 6,399,358 | 20,776,014 | ||||||||||||
As of December 31, 2022, the cost basis for federal income tax purposes, gross unrealized appreciation, gross unrealized depreciation, and net unrealized appreciation (depreciation) for investments were as follows:
| Cost of Investments for Federal Tax Purposes | Net Gross Unrealized Appreciation | Gross Unrealized Depreciation | Net Unrealized Appreciation (Depreciation) | |||||||||||||||
RS Small Cap Growth Fund | $ | 705,821,737 | $ | 117,241,108 | $ | (83,544,484 | ) | $ | 33,696,624 | ||||||||||
RS Select Growth Fund | 99,074,010 | 12,970,147 | (9,564,158 | ) | 3,405,989 | ||||||||||||||
RS Mid Cap Growth Fund | 76,526,090 | 14,925,617 | (8,493,744 | ) | 6,431,873 | ||||||||||||||
RS Growth Fund | 150,425,160 | 67,002,106 | (8,947,459 | ) | 58,054,647 | ||||||||||||||
RS Science and Technology Fund | 134,461,215 | 48,623,091 | (17,364,642 | ) | 31,258,449 | ||||||||||||||
RS Small Cap Equity Fund | 41,044,477 | 3,086,143 | (6,458,447 | ) | (3,372,304 | ) | |||||||||||||
8. Stock Split:
Effective December 3, 2021, the RS Small Cap Equity Fund underwent a 12-for-1 reverse stock split of the issued and outstanding Class C shares of the Fund. The reverse stock split was not a taxable event, nor did it have an impact on the Fund's holdings or performance, and was intended to reduce marketplace confusion and bring greater uniformity to the ratio of capital gains to the NAV across all share classes of the Fund. No changes are contemplated at this time for the other share classes offered by the Fund.
106
REPORT OF INDEPENDENT REGISTERED PUBLIC ACCOUNTING FIRM
To the Shareholders and Board of Trustees of Victory Portfolios
Opinion on the Financial Statements
We have audited the accompanying statements of assets and liabilities, including the schedules of portfolio investments, Victory RS Small Cap Growth Fund, Victory RS Select Growth Fund, Victory RS Mid Cap Growth Fund, Victory RS Growth Fund, Victory RS Science and Technology Fund, and Victory RS Small Cap Equity Fund (the "Funds"), each a series of Victory Portfolios, as of December 31, 2022, the related statements of operations for the year then ended, the statements of changes in net assets for each of the two years in the period then ended, the related notes, and the financial highlights for each of the four years in the period then ended (collectively referred to as the "financial statements"). In our opinion, the financial statements present fairly, in all material respects, the financial position of the Funds as of December 31, 2022, the results of their operations for the year then ended, the changes in net assets for each of the two years in the period then ended, and the financial highlights for each of the four years in the period then ended, in conformity with accounting principles generally accepted in the United States of America.
The Funds' financial highlights for the year ended December 31, 2018, were audited by other auditors whose report dated February 26, 2019, expressed an unqualified opinion on those financial highlights.
Basis for Opinion
These financial statements are the responsibility of the Funds' management. Our responsibility is to express an opinion on the Funds' financial statements based on our audits. We are a public accounting firm registered with the Public Company Accounting Oversight Board (United States) ("PCAOB") and are required to be independent with respect to the Funds in accordance with the U.S. federal securities laws and the applicable rules and regulations of the Securities and Exchange Commission and the PCAOB.
We conducted our audits in accordance with the standards of the PCAOB. Those standards require that we plan and perform the audit to obtain reasonable assurance about whether the financial statements are free of material misstatement whether due to error or fraud.
Our audits included performing procedures to assess the risks of material misstatement of the financial statements, whether due to error or fraud, and performing procedures that respond to those risks. Such procedures included examining, on a test basis, evidence regarding the amounts and disclosures in the financial statements. Our procedures included confirmation of securities owned as of December 31, 2022, by correspondence with the custodian and brokers; when replies were not received from brokers, we performed other auditing procedures. Our audits also included evaluating the accounting principles used and significant estimates made by management, as well as evaluating the overall presentation of the financial statements. We believe that our audits provide a reasonable basis for our opinion.
We have served as the auditor of one or more of the investment companies advised by Victory Capital Management, Inc. since 2015.

COHEN & COMPANY, LTD.
Cleveland, Ohio
February 23, 2023
107
Victory Portfolios | Supplemental Information December 31, 2022 | ||||||
(Unaudited)
Trustee and Officer Information
Board of Trustees:
Overall responsibility for management of the Trust rests with the Board. The Trust is managed by the Board in accordance with the laws of the State of Delaware. There are currently nine Trustees, eight of whom are not "interested persons" of the Trust within the meaning of that term under the 1940 Act ("Independent Trustees") and one of whom is an "interested person" of the Trust within the meaning of that term under the 1940 Act ("Interested Trustee"). The Trustees, in turn, elect the officers of the Trust to actively supervise its day-to-day operations.
The following tables list the Trustees, their date of birth, their position with the Trust, their commencement of service, their principal occupations during the past five years, and any directorships of other investment companies or companies whose securities are registered under the Securities Exchange Act of 1934, as amended, or who file reports under that Act. Each Trustee oversees 37 portfolios in the Trust, 6 portfolios in Victory Variable Insurance Funds, and 25 portfolios in Victory Portfolios II, each a registered investment company that, together with the Trust, comprise the Victory Fund Complex. David C. Brown is a Trustee of USAA Mutual Funds and oversees 45 portfolios of the USAA Mutual Funds Trust. Each Trustee's address is c/o Victory Portfolios, 4900 Tiedeman Road, 4th Floor, Brooklyn, Ohio 44144. Each Trustee has an indefinite term.
Name and Date of Birth | Position Held with the Trust | Date Commenced Service | Principal Occupation During Past 5 Years | Other Directorships Held During Past 5 Years | |||||||||||||||
Independent Trustees. | |||||||||||||||||||
| David Brooks Adcock, October 1951 | Trustee | May 2005 | Consultant (since 2006). | Chairman, Board of Trustees, Turner Funds (December 2016-December 2017). | |||||||||||||||
| Nigel D. T. Andrews, April 1947 | Trustee | August 2002 | Retired. | Director, Carlyle Secured Lending, Inc. (formerly TCG BDC I, Inc.) (since 2012); Director, Carlyle Credit Solutions, Inc. (formerly TCG BDC II, Inc.) (since 2017); Trustee, Carlyle Secured Lending III (since 2021). | |||||||||||||||
| E. Lee Beard,* August 1951 | Trustee | May 2005 | Retired. | None. | |||||||||||||||
| Dennis M. Bushe, January 1944 | Trustee | July 2016 | Retired. | None. | |||||||||||||||
108
Victory Portfolios | Supplemental Information — continued December 31, 2022 | ||||||
(Unaudited)
Name and Date of Birth | Position Held with the Trust | Date Commenced Service | Principal Occupation During Past 5 Years | Other Directorships Held During Past 5 Years | |||||||||||||||
| John L. Kelly, April 1953 | Chair and Trustee | February 2015 | Partner, McCarvill Capital Partners (September 2016- September 2017). | Director, Caledonia Mining Corporation (since May 2012). | |||||||||||||||
| David L. Meyer, April 1957 | Trustee | December 2008 | Retired. | None. | |||||||||||||||
| Gloria S. Nelund, May 1961 | Trustee | July 2016 | Chair, CEO and Co-Founder of TriLinc Global, LLC, an investment firm. | TriLinc Global Impact Fund, LLC (since 2012). | |||||||||||||||
| Timothy Pettee, April 1958 | Advisory Trustee | January 2023 | Chief Investment Officer, Hoya Capital Real Estate LLC (since February 2022); Chief Investment Officer, Sun America Asset Management Corp., (January 2003-July 2021). | None. | |||||||||||||||
| Leigh A. Wilson, December 1944 | Trustee | November 1994 | Private Investor. | Chair (since 2013), Caledonia Mining Corporation. | |||||||||||||||
Interested Trustee. | |||||||||||||||||||
| David C. Brown,** May 1972 | Trustee | May 2008 | Chief Executive Officer and Chairman (since 2013), the Adviser; Chief Executive Officer and Chairman (since 2013), Victory Capital Holdings, Inc.; Director (since 2013), Victory Capital Services, Inc.; Director (since 2019), Victory Capital Transfer Agency, Inc. | Trustee, USAA Mutual Funds Trust; Board Member, Victory Capital Services, Inc. | |||||||||||||||
* The Board has designated Ms. Beard as its Audit Committee Financial Expert.
** Mr. Brown is an "Interested Person" by reason of his relationship with the Adviser.
The Statement of Additional Information includes additional information about the Trustees of the Trust and is available, without charge, by calling 800-539-3863.
109
Victory Portfolios | Supplemental Information — continued December 31, 2022 | ||||||
(Unaudited)
Officers:
The officers of the Trust, their date of birth, their commencement of service, and their principal occupations during the past five years, are detailed in the following table. Each officer serves until the earlier of his or her resignation, removal, retirement, death, or the election of a successor. The mailing address of each officer of the Trust is 4900 Tiedeman Road, 4th Floor, Brooklyn, Ohio 44144. The officers of the Trust receive no compensation directly from the Trust for performing the duties of their offices.
Name and Date of Birth | Position with the Trust | Date Commenced Service | Principal Occupation During Past 5 Years | ||||||||||||
| Christopher K. Dyer, February 1962 | President | February 2006 | Director of Mutual Fund Administration, the Adviser (since 2004); Chief Operating Officer, Victory Capital Services, Inc. (since 2020); Vice President, Victory Capital Transfer Agency, Inc. (since 2019). | ||||||||||||
| Scott A. Stahorsky, July 1969 | Vice President | December 2014 | Manager, Fund Administration, the Adviser. (since 2015). | ||||||||||||
| Thomas Dusenberry, July 1977 | Secretary | May 2022 | Manager, Fund Administration, the Adviser (since 2022); Treasurer and Principal Financial Officer (2020-2022), Assistant Treasurer (2019), Salient MF Trust, Salient Midstream, MLP Fund and Forward Funds; Principal Financial Officer (2018-2021) and Treasurer (2020-2021), Salient Private Access Funds and Endowment PMF Funds; Senior Vice President of Fund Accounting and Operations, Salient Partners (2020-2022); Director of Fund Operations, Salient Partners (2016-2019). | ||||||||||||
| Allan Shaer, March 1965 | Treasurer | May 2017 | Senior Vice President, Financial Administration, Citi Fund Services Ohio, Inc. (since 2016). | ||||||||||||
| Christopher A. Ponte, March 1984 | Assistant Treasurer | December 2017 | Manager, Fund Administration, the Adviser (since 2017); Chief Financial Officer, Victory Capital Services, Inc. (since 2018). | ||||||||||||
| Sean Fox, September 1976 | Chief Compliance Officer | June 2022 | Sr. Compliance Officer, the Adviser (since 2019); Compliance Officer, the Adviser (2015-2019). | ||||||||||||
| Charles Booth, April 1960 | Anti-Money Laundering Compliance Officer and Identity Theft Officer | May 2015 | Director, Regulatory Administration and CCO Support Services, Citi Fund Services Ohio, Inc. (since 2007). | ||||||||||||
| Jay G. Baris, January 1954 | Assistant Secretary | December 1997 | Partner, Sidley Austin LLP (since 2020); Partner, Shearman & Sterling LLP (2018-2020). | ||||||||||||
110
Victory Portfolios | Supplemental Information — continued December 31, 2022 | ||||||
(Unaudited)
Proxy Voting and Portfolio Holdings Information
Proxy Voting:
Information regarding the policies and procedures each Fund uses to determine how to vote proxies relating to portfolio securities is available without charge, upon request, by calling 800-539-3863. The information is also included in the Funds' Statement of Additional Information, which is available on the SEC's website at sec.gov.
Information relating to how the Funds voted proxies relating to portfolio securities held during the most recent 12 months ended June 30 is available on the SEC's website at sec.gov.
Availability of Schedules of Portfolio Investments:
The Trust files a complete list of Schedules of Portfolio Investments with the SEC for the first and third quarter of each fiscal year on Form N-PORT. Forms N-PORT are available on the SEC's website at sec.gov.
Expense Examples
As a shareholder of the Funds, you may incur two types of costs: (1) transaction costs, including sales charges (loads) on purchases; and (2) ongoing costs, including management fees and other Fund expenses. These examples are intended to help you understand your ongoing costs (in dollars) of investing in the Fund and to compare these costs with the ongoing costs of investing in other mutual funds.
These examples are based on an investment of $1,000 invested at the beginning of the period and held for the entire period from July 1, 2022, through December 31, 2022.
The Actual Expense figures in the table below provide information about actual account values and actual expenses. You may use the information below, together with the amount you invested, to estimate the expenses that you paid over the period. Simply divide your account value by $1,000 (for example, an $8,600 account value divided by $1,000 = 8.6), then multiply the result by the number in the table under the heading entitled "Actual Expenses Paid During Period" to estimate the expenses you paid on your account during this period.
The Hypothetical Expense figures in the table below provide information about hypothetical account values and hypothetical expenses based on the Fund's actual expense ratio and an assumed rate of return of 5% per year before expenses, which is not the Fund's actual return. The hypothetical account values and expenses may not be used to estimate the actual ending account balance or expenses you paid for the period. You may use this information to compare this 5% hypothetical example with the 5% hypothetical examples that appear in shareholder reports of other funds.
Please note the expenses shown in the table below are meant to highlight your ongoing costs only and do not reflect any transactional costs. Therefore, the hypothetical expenses in the table are useful in comparing ongoing costs only and will not help you determine the relative total costs of owning different funds. In addition, if these transactional costs were included, your costs would have been higher.
| Beginning Account Value 7/1/22 | Actual Ending Account Value 12/31/22 | Hypothetical Ending Account Value 12/31/22 | Actual Expenses Paid During Period 7/1/22- 12/31/22* | Hypothetical Expenses Paid During Period 7/1/22- 12/31/22* | Annualized Expense Ratio During Period 7/1/22- 12/31/22 | ||||||||||||||||||||||
RS Small Cap Growth Fund | |||||||||||||||||||||||||||
Class A | $ | 1,000.00 | $ | 1,000.20 | $ | 1,018.15 | $ | 7.06 | $ | 7.12 | 1.40 | % | |||||||||||||||
Class C | 1,000.00 | 996.00 | 1,014.32 | 10.87 | 10.97 | 2.16 | % | ||||||||||||||||||||
Class R | 1,000.00 | 997.70 | 1,015.83 | 9.37 | 9.45 | 1.86 | % | ||||||||||||||||||||
Class R6 | 1,000.00 | 1,001.80 | 1,019.91 | 5.30 | 5.35 | 1.05 | % | ||||||||||||||||||||
Class Y | 1,000.00 | 1,001.10 | 1,019.51 | 5.70 | 5.75 | 1.13 | % | ||||||||||||||||||||
RS Select Growth Fund | |||||||||||||||||||||||||||
Class A | 1,000.00 | 1,013.80 | 1,018.15 | 7.11 | 7.12 | 1.40 | % | ||||||||||||||||||||
Class C | 1,000.00 | 1,010.00 | 1,014.22 | 11.04 | 11.07 | 2.18 | % | ||||||||||||||||||||
Class R | 1,000.00 | 1,011.00 | 1,015.58 | 9.68 | 9.70 | 1.91 | % | ||||||||||||||||||||
Class R6 | 1,000.00 | 1,015.10 | 1,019.86 | 5.38 | 5.40 | 1.06 | % | ||||||||||||||||||||
Class Y | 1,000.00 | 1,014.80 | 1,019.46 | 5.79 | 5.80 | 1.14 | % | ||||||||||||||||||||
111
Victory Portfolios | Supplemental Information — continued December 31, 2022 | ||||||
(Unaudited)
| Beginning Account Value 7/1/22 | Actual Ending Account Value 12/31/22 | Hypothetical Ending Account Value 12/31/22 | Actual Expenses Paid During Period 7/1/22- 12/31/22* | Hypothetical Expenses Paid During Period 7/1/22- 12/31/22* | Annualized Expense Ratio During Period 7/1/22- 12/31/22 | ||||||||||||||||||||||
RS Mid Cap Growth Fund | |||||||||||||||||||||||||||
Class A | $ | 1,000.00 | $ | 991.60 | $ | 1,019.16 | $ | 6.02 | $ | 6.11 | 1.20 | % | |||||||||||||||
Class C | 1,000.00 | 986.80 | 1,014.57 | 10.57 | 10.71 | 2.11 | % | ||||||||||||||||||||
Class R | 1,000.00 | 989.50 | 1,016.13 | 9.03 | 9.15 | 1.80 | % | ||||||||||||||||||||
Class R6 | 1,000.00 | 993.30 | 1,020.47 | 4.72 | 4.79 | 0.94 | % | ||||||||||||||||||||
Class Y | 1,000.00 | 993.30 | 1,020.47 | 4.72 | 4.79 | 0.94 | % | ||||||||||||||||||||
Member Class | 1,000.00 | 992.30 | 1,019.91 | 5.27 | 5.35 | 1.05 | % | ||||||||||||||||||||
RS Growth Fund | |||||||||||||||||||||||||||
Class A | 1,000.00 | 946.40 | 1,019.66 | 5.40 | 5.60 | 1.10 | % | ||||||||||||||||||||
Class C | 1,000.00 | 942.30 | 1,015.48 | 9.45 | 9.80 | 1.93 | % | ||||||||||||||||||||
Class R | 1,000.00 | 943.80 | 1,016.59 | 8.38 | 8.69 | 1.71 | % | ||||||||||||||||||||
Class Y | 1,000.00 | 947.50 | 1,021.02 | 4.07 | 4.23 | 0.83 | % | ||||||||||||||||||||
RS Science and Technology Fund | |||||||||||||||||||||||||||
Class A | 1,000.00 | 970.90 | 1,017.90 | 7.20 | 7.38 | 1.45 | % | ||||||||||||||||||||
Class C | 1,000.00 | 967.20 | 1,013.71 | 11.31 | 11.57 | 2.28 | % | ||||||||||||||||||||
Class R | 1,000.00 | 968.50 | 1,015.48 | 9.58 | 9.80 | 1.93 | % | ||||||||||||||||||||
Class Y | 1,000.00 | 972.20 | 1,018.95 | 6.16 | 6.31 | 1.24 | % | ||||||||||||||||||||
RS Small Cap Equity Fund | |||||||||||||||||||||||||||
Class A | 1,000.00 | 1,021.20 | 1,018.65 | 6.62 | 6.61 | 1.30 | % | ||||||||||||||||||||
Class C | 1,000.00 | 1,016.10 | 1,014.62 | 10.67 | 10.66 | 2.10 | % | ||||||||||||||||||||
Class R | 1,000.00 | 1,020.10 | 1,016.38 | 8.91 | 8.89 | 1.75 | % | ||||||||||||||||||||
Class Y | 1,000.00 | 1,022.50 | 1,019.66 | 5.61 | 5.60 | 1.10 | % | ||||||||||||||||||||
Member Class | 1,000.00 | 1,022.40 | 1,019.41 | 5.86 | 5.85 | 1.15 | % | ||||||||||||||||||||
* Expenses are equal to the average account value multiplied by the Fund's annualized expense ratio multiplied by 184/365 (the number of days in the most recent fiscal half-year divided by the number of days in the fiscal year).
112
Victory Portfolios | Supplemental Information — continued December 31, 2022 | ||||||
(Unaudited)
Additional Federal Income Tax Information
For the year ended December 31, 2022, the following Funds paid qualified dividend income for the purposes of reduced individual federal income tax rates of:
| Percent | ||||||
RS Small Cap Equity Fund | — | %(a) | |||||
Dividends qualified for corporate dividends received deductions of:
| Percent | ||||||
RS Small Cap Equity Fund | — | %(a) | |||||
For the year ended December 31, 2022, the following Funds designated short-term capital gain distributions:
| Amount | ||||||
RS Select Growth Fund | $ | 4,809,209 | |||||
RS Small Cap Equity Fund | 2,905,295 | ||||||
For the year ended December 31, 2022, the following Funds designated long-term capital gain distributions:
| Amount | ||||||
RS Small Cap Growth Fund | $ | 43,757,183 | |||||
RS Select Growth Fund | 25,339,340 | ||||||
RS Mid Cap Growth Fund | 3,708,813 | ||||||
RS Growth Fund | 4,816,020 | ||||||
RS Science and Technology Fund | 8,279,682 | ||||||
RS Small Cap Equity Fund | 1,044,840 | ||||||
(a) Rounds to less than 0.5%.
113
Victory Portfolios | Supplemental Information — continued December 31, 2022 | ||||||
(Unaudited)
Considerations of the Board in Continuing the Investment Advisory Agreement (the "Agreement")
The Board approved the Agreement on behalf of each of the Funds at a meeting, which was called for that purpose, on December 6, 2022. The Board also considered information relating to the Funds and the Agreement provided throughout the year and, more specifically, at the meetings on October 18, 2022 and December 6, 2022. In considering whether to approve the Agreement, the Board requested, and the Adviser provided, information that the Board believed to be reasonably necessary to reach its conclusions.
The Board, including the Independent Trustees, evaluated this information along with other information obtained throughout the year and was advised by legal counsel to the Funds and independent legal counsel to the Independent Trustees. In addition, the Independent Trustees considered a past review of their overall process for conducting the annual review of the Funds' advisory arrangements by a consultant retained through their counsel.
The Board considered each Fund's advisory fee, expense ratio and investment performance as significant factors in determining whether the Agreement should be continued. In considering whether the compensation paid to the Adviser was fair and reasonable, the Board also evaluated, among other things, the following factors:
• The requirements of the Funds for the services provided by the Adviser;
• The nature, quality and extent of the services provided and expected to be provided;
• The performance of the Funds as compared to comparable funds;
• The fees payable for the services and whether the fee arrangements provided for economies of scale that would benefit Fund shareholders as the Funds grow (acknowledging that economies of scale can be complex to assess and typically are not directly measurable);
• Whether the fee would be sufficient to enable the Adviser to attract and retain experienced personnel and continue to provide quality services to the Funds;
• The fees paid by other clients of the Adviser whose accounts are managed in a similar investment style and any differences in the services provided to the other clients compared to those provided to the Funds;
• The total expenses of each Fund;
• Management's commitment to operating the Funds at competitive expense levels;
• The profitability of the Adviser (as reflected by comparing fees earned against an estimate of the Adviser's costs) with respect to the Adviser's relationship with the Funds;
• Research and other service benefits received by the Adviser obtained through payment of client commissions for securities transactions;
• Other benefits received by the Adviser, and its affiliates, including revenues paid to the Adviser, or its affiliates, by the Funds for administration and fund accounting services, shareholder services and distribution;
• The capabilities and financial condition of the Adviser;
• Current economic and industry trends; and
• The historical relationship between each Fund and the Adviser.
The Board reviewed each Fund's current management fee, comprised of the advisory fee plus the administrative services fee paid to the Adviser, in the context of the Adviser's profitability with respect to each Fund individually. The Board retained an independent, third-party consultant to provide comparative information about fees, expenses and performance, and to design and maintain a database of relevant information designed to assist the Board in retrieving and analyzing comparative information. The Board met with the consultant to review its inputs and methodologies, among other things. The Board compared each Fund's gross management fee and total operating expense ratio on a net and gross basis with the median gross management fee and median expense ratio of a universe of comparable mutual funds compiled by the consultant, and a peer group of funds with similar investment strategies selected by that consultant from the universe. The Board reviewed the factors and methodology used by the consultant in the selection of each Fund's peer group, including the consultant's selection of a broad universe of funds, the more specific universe of comparable funds, and peer groups of funds
114
Victory Portfolios | Supplemental Information — continued December 31, 2022 | ||||||
(Unaudited)
with comparable investment strategies and asset levels, among other factors. The Board also reviewed any changes to the consultant's methodology as compared to the prior year, including those resulting from the Adviser's input, if any. With respect to certain Funds, the Board also reviewed fees and other information related to the Adviser's management of similarly managed institutional or private accounts, and the differences in the services provided to the other accounts. The Board noted that none of the advisory fee arrangements for the Funds included breakpoints, which would be a structure that results in reduced fees as a fund grows. The Board also considered the Adviser's commitment to limit expenses as discussed in more detail below.
For Funds with total net expense ratios that ranked within the fourth quartile (most expensive) in relation to their peers as evaluated by a consultant, the Board requested, and the Adviser provided, supplemental information about the level of fees and the nature of the services provided. The Adviser reviewed additional relevant circumstances, which included, among other things, specialized strategies, small or decreasing assets, or rapid or recent changes in peer expense ratios.
The Board also reviewed the compliance and administrative services provided to the Funds by the Adviser and its affiliates, including the Adviser's oversight of the Funds' day-to-day operations and oversight of Fund accounting, assistance in meeting legal and regulatory requirements, and other services necessary for the operation of the Funds and the Trust.
The Board found that the gross annual management fee paid by each Fund was within the range of management fees paid by each Fund's respective peer group. The Board also found that each Fund's Class A net annual expense ratio, taking into account any shareholder servicing or distribution fees, was reasonable as compared with each Fund's respective peer group. The Board considered the Adviser's contractual agreement with each Fund to waive its fees and reimburse expenses of certain classes for a specified period of time, as described in the Fund's prospectus.
The Board reviewed each Fund's performance over one-, three-, five- and ten-year periods (as applicable) against the performance of the Fund's selected peer group and benchmark index. The Board recognized that the performance of the Fund and the peer group funds are net of expenses, while the performance of the benchmark index reflects gross returns.
The Board reviewed various other specific factors with respect to each Fund, as described below. In their deliberations, the Trustees did not rank the importance of any particular information or factor considered and each Trustee may have attributed different weights to various factors.
RS Small Cap Growth Fund:
The Board compared the Fund's Class A performance for the one-, three-, five- and ten-year periods ended June 30, 2022, to that of the median performance of the Fund's peer group and benchmark index for the same periods and considered the fact that the Fund underperformed both the benchmark index and the peer group median for all of the periods reviewed. The Board discussed with management the Fund's underperformance and expense profile, and any steps by the Adviser that had been or could be taken to enhance performance in the future.
Having considered, among other things: (1) the Fund's management fee compared to comparable mutual funds; (2) the Fund's total expense ratio compared to comparable mutual funds; (3) that the Adviser's willingness to limit the expenses of certain classes for a period of time would provide stability to the Fund's expenses for those share classes during that period; and (4) the Fund's performance during the periods reviewed, the Board concluded that the Agreement continued to be in the best interests of the Fund's shareholders.
RS Select Growth Fund:
The Board compared the Fund's Class A performance for the one-, three-, five- and ten-year periods ended June 30, 2022, to that of the median performance of the Fund's peer group and benchmark index for the same periods and considered the fact that the Fund underperformed the benchmark index for all of the periods reviewed, outperformed the peer group median for the one-year period, and underperformed the peer group median for the three-, five- and ten-year periods. The Board discussed with management the Fund's underperformance and expense profile, including and any steps by the Adviser that had been or could be taken to enhance performance in the future.
115
Victory Portfolios | Supplemental Information — continued December 31, 2022 | ||||||
(Unaudited)
Having considered, among other things: (1) the Fund's management fee compared to comparable mutual funds; (2) the Fund's total expense ratio compared to comparable mutual funds; (3) that the Adviser's willingness to limit the expenses of certain classes for a period of time would provide stability to the Fund's expenses for those share classes during that period; and (4) the Fund's performance during the periods reviewed, the Board concluded that the Agreement continued to be in the best interests of the Fund's shareholders.
RS Mid Cap Growth Fund:
The Board compared the Fund's Class A performance for the one-, three-, five- and ten-year periods ended June 30, 2022, to that of the median performance of the Fund's peer group and benchmark index for the same periods and considered the fact that the Fund underperformed both the benchmark index and the peer group median for all of the periods reviewed. The Board discussed with management the Fund's underperformance and expense profile, including and any steps by the Adviser that had been or could be taken to enhance performance in the future.
Having considered, among other things: (1) the Fund's management fee compared to comparable mutual funds; (2) the Fund's total expense ratio compared to comparable mutual funds; (3) that the Adviser's willingness to limit the expenses of certain classes for a period of time would provide stability to the Fund's expenses for those share classes during that period; and (4) the Fund's performance during the periods reviewed, the Board concluded that the Agreement continued to be in the best interests of the Fund's shareholders.
RS Growth Fund:
The Board compared the Fund's Class A performance for the one-, three-, five- and ten-year periods ended June 30, 2022, to that of the median performance of the Fund's peer group and benchmark index for the same periods and considered the fact that the Fund underperformed the benchmark index for all of the periods reviewed, matched the peer group median for the one-year period, and underperformed the peer group median for the three-, five- and ten-year periods. The Board discussed with management the Fund's underperformance and expense profile, including and any steps by the Adviser that had been or could be taken to enhance performance in the future.
Having considered, among other things: (1) the Fund's management fee compared to comparable mutual funds; (2) the Fund's total expense ratio compared to comparable mutual funds; (3) that the Adviser's willingness to limit the expenses of certain classes for a period of time would provide stability to the Fund's expenses for those share classes during that period; and (4) the Fund's performance during the periods reviewed, the Board concluded that the Agreement continued to be in the best interests of the Fund's shareholders.
RS Science and Technology Fund:
The Board compared the Fund's Class A performance for the one-, three-, five- and ten-year periods ended June 30, 2022, to that of the median performance of the Fund's peer group and benchmark index for the same periods and considered that the Fund underperformed both the benchmark index and the peer group median for all of the periods reviewed. The Board discussed with management the Fund's underperformance and expense profile, including and any steps by the Adviser that had been or could be taken to enhance performance in the future.
Having considered, among other things: (1) the Fund's management fee compared to comparable mutual funds; (2) the Fund's total expense ratio compared to comparable mutual funds; (3) that the Adviser's willingness to limit the expenses of certain classes for a period of time would provide stability to the Fund's expenses for those share classes during that period; and (4) the Fund's performance during the periods reviewed, the Board concluded that the Agreement continued to be in the best interests of the Fund's shareholders.
RS Small Cap Equity Fund:
The Board compared the Fund's Class A performance for the one-, three-, five- and ten-year periods ended June 30, 2022, to that of the median performance of the Fund's peer group and benchmark index for the same periods and considered that the Fund underperformed both the benchmark index and the peer group median for all of the periods reviewed. The Board discussed with management the Fund's underperformance and expense profile, including and any steps by the Adviser that had been or could be taken to enhance performance in the future.
116
Victory Portfolios | Supplemental Information — continued December 31, 2022 | ||||||
(Unaudited)
Having considered, among other things: (1) the Fund's management fee compared to comparable mutual funds; (2) the Fund's total expense ratio compared to comparable mutual funds; (3) that the Adviser's willingness to limit the expenses of certain classes for a period of time would provide stability to the Fund's expenses for those share classes during that period; and (4) the Fund's performance during the periods reviewed, the Board concluded that the Agreement continued to be in the best interests of the Fund's shareholders.
Conclusion:
Based on its review of the information requested and provided, and following extended discussions, the Board determined that the Agreement, on behalf of the Funds discussed above, was consistent with the best interests of each Fund and its shareholders, and the Board unanimously approved the Agreement, on behalf of each Fund, for an additional annual period on the basis of the foregoing review and discussions and the following considerations, among others:
• The fairness and reasonableness of the investment advisory fee payable to the Adviser under the Agreement in light of the investment advisory services provided, the costs of these services, the profitability of the Adviser's relationship with the Fund and the comparability of the fee paid to the fees paid by other investment companies;
• The nature, quality and extent of the investment advisory services provided by the Adviser;
• The Adviser's entrepreneurial commitment to the management of the Funds and the creation of a broad-based family of funds, which entails a substantial commitment of the Adviser's resources to the successful operation of the Funds;
• The Adviser's representations regarding its staffing and capabilities to manage the Funds, including the retention of personnel with relevant portfolio management experience;
• The Adviser's efforts to enhance investment results by, among other things, developing and supporting quality portfolio management teams; and
• The overall high quality of the personnel, operations, financial condition, investment management capabilities, methodologies and performance of the Adviser.
117
Privacy Policy
Protecting the Privacy of Information
The Trust respects your right to privacy. We also know that you expect us to conduct and process your business in an accurate and efficient manner. To do so, we must collect and maintain certain personal information about you. This is the information we collect from you on applications or other forms, and from the transactions you make with us or third parties. It may include your name, address, social security number, account transactions and balances, and information about investment goals and risk tolerance.
We do not disclose any information about you or about former customers to anyone except as permitted or required by law. Specifically, we may disclose the information we collect to companies that perform services on our behalf, such as the transfer agent that processes shareholder accounts and printers and mailers that assist us in the distribution of investor materials. We may also disclose this information to companies that perform marketing services on our behalf. This allows us to continue to offer you Victory investment products and services that meet your investing needs, and to effect transactions that you request or authorize. These companies will use this information only in connection with the services for which we hired them. They are not permitted to use or share this information for any other purpose.
To protect your personal information internally, we permit access only by authorized employees and maintain physical, electronic, and procedural safeguards to guard your personal information.*
* You may have received communications regarding information about privacy policies from other financial institutions which gave you the opportunity to "opt-out" of certain information sharing with companies which are not affiliated with that financial institution. The Trust does not share information with other companies for purposes of marketing solicitations for products other than the Trust. Therefore, the Trust does not provide opt-out options to their shareholders.
Victory Funds
P.O. Box 182593
Columbus, Ohio 43218-2593

Visit our website at: | Call Victory at: | ||||||
vcm.com | 800-539-FUND (800-539-3863) | ||||||
| 800-235-8396 for Member Class | |||||||
VPRSGF-AR (12/22)

December 31, 2022
Annual Report
Victory RS International Fund
Victory RS Global Fund
Victory Sophus Emerging Markets Fund
vcm.com
News, Information And Education 24 Hours A Day, 7 Days A Week
The Victory Capital website gives fund shareholders, prospective shareholders, and investment professionals a convenient way to access fund information, get guidance, and track fund performance anywhere they can access the Internet. The site includes:
• Detailed performance records
• Daily share prices
• The latest fund news
• Investment resources to help you become a better investor
• A section dedicated to investment professionals
Whether you're a potential investor searching for the fund that matches your investment philosophy, a seasoned investor interested in planning tools, or an investment professional, vcm.com has what you seek. Visit us anytime. We're always open.
Victory Portfolios
TABLE OF CONTENTS
Shareholder Letter (Unaudited) | 3 | ||||||
| Manager's Commentary / Investment Overview (Unaudited) | 5 | ||||||
| Investment Objectives and Portfolio Holdings (Unaudited) | 13 | ||||||
Schedules of Portfolio Investments | |||||||
Victory RS International Fund | 16 | ||||||
Victory RS Global Fund | 21 | ||||||
Victory Sophus Emerging Markets Fund | 27 | ||||||
Financial Statements | |||||||
Statements of Assets and Liabilities | 34 | ||||||
Statements of Operations | 36 | ||||||
Statements of Changes in Net Assets | 37 | ||||||
Financial Highlights | 40 | ||||||
Notes to Financial Statements | 55 | ||||||
| Report of Independent Registered Public Accounting Firm | 66 | ||||||
Supplemental Information (Unaudited) | 67 | ||||||
Trustee and Officer Information | 67 | ||||||
Proxy Voting and Portfolio Holdings Information | 70 | ||||||
Expense Examples | 70 | ||||||
Additional Federal Income Tax Information | 72 | ||||||
Advisory Contract Approval | 73 | ||||||
Privacy Policy (inside back cover) | |||||||
1
IRA DISTRIBUTION WITHHOLDING DISCLOSURE
We generally must withhold federal income tax at a rate of 10% of the taxable portion of your distribution and, if you live in a state that requires state income tax withholding, at your state's tax rate. However, you may elect not to have withholding apply or to have income tax withheld at a higher rate. Any withholding election that you make will apply to any subsequent distribution unless and until you change or revoke the election. If you wish to make a withholding election, or change or revoke a prior withholding election, call 800-539-3863 and form W-4P (OMB No. 1545-0074 withholding certificate for pension or annuity payments) will be electronically sent.
If you do not have a withholding election in place by the date of a distribution, federal income tax will be withheld from the taxable portion of your distribution at a rate of 10%. If you must pay estimated taxes, you may be subject to estimated tax penalties if your estimated tax payments are not sufficient and sufficient tax is not withheld from your distribution.
For more specific information, please consult your tax adviser.
The Funds are distributed by Victory Capital Services, Inc. Victory Capital Management Inc. is the investment adviser to the Funds and receives fees from the Funds for performing services for the Funds.
This report is not authorized for distribution to prospective investors unless preceded or accompanied by a current prospectus of the Victory Funds.
For additional information about any Victory Fund, including fees, expenses, and risks, view our prospectus online at vcm.com or call 800-539-3863. Read it carefully before you invest or send money.
The information in this report is based on data obtained from recognized services and sources and is believed to be reliable. Any opinions, projections, or recommendations in this report are subject to change without notice and are not intended as individual investment advice. Past investment performance of the Funds, markets or securities mentioned herein should not be considered to be indicative of future results.
• NOT FDIC INSURED • NO BANK GUARANTEE • MAY LOSE VALUE

Call Victory at:
800-539-FUND (800-539-3863)
Visit our website at:
vcm.com
2
Victory Funds Letter to Shareholders
(Unaudited)
Dear Shareholder,
Our most recent annual reporting period ending December 31, 2022, was filled with epic challenges. Even the most seasoned investors who have been through more than one economic cycle have not witnessed financial markets like this in a long time, if ever.
Consider what transpired and how the investing backdrop changed so abruptly. The year began well enough with ample liquidity and an encouraging outlook for corporate profits. But that optimism faded early and was punctuated by the start of a terrible war in Eastern Europe. This fueled rising energy prices and intensified an inflation problem that was proving to be more than "transitory."
The inflation data was particularly troublesome and surprised many with some of the highest readings since the 1970s. In response, the U.S. Federal Reserve (the "Fed") pivoted to a far more restrictive monetary policy than anyone anticipated. Over the course of 2022, the Fed boosted the Fed funds interest rate on seven different occasions by a total of 4.5 percentage points. And if that wasn't enough, zero-Covid policies in China further exacerbated supply chain issues and dampened the outlook for global growth.
As one might expect, all of these obstacles ratcheted up volatility across financial markets. Broad market stock indices pulled back substantially around the world. The S&P 500® Index, the bell-weather proxy for our domestic stock market, delivered a negative total return of more than 18% for our annual reporting period.
Perhaps what made 2022 even more difficult was the performance of fixed income markets, which normally are considered a safe haven in times of equity turmoil. But not this past year. In fact, the Bloomberg US Aggregate Bond Index—a proxy for a diversified fixed income portfolio and one that many investors and institutions follow closely—delivered a negative total return of approximately 13%, its worst annual performance since the 1970s. That's not exactly the offset to equity performance that many investors were expecting from bonds.
It was a tough year, and we fully acknowledge that the steady drumbeat of bad news and bouts of stomach-churning volatility can take a toll on investors' psyche. Nobody likes opening their account statements during declining markets; and even when markets snap back sharply (as happened this past July and October), investors often wonder if they have missed an opportunity.
Through all of the challenges in our most recent annual reporting period, we are reminded of two enduring realities: 1) financial markets are dynamic and apt to change abruptly; 2) it's vital that we remain calm and rational whenever faced with those inevitable bouts of turmoil.
Fortunately, we think that investors can take comfort knowing that all of our independent investment franchises have experience managing portfolios through a wide variety of market environments. Our investment professionals remain calm during turbulent financial markets, and we think it's imperative that investors do the same.
3
We still believe that a long-term plan, a well-diversified portfolio across asset classes and investment types, and a clear understanding of individual risk tolerances are the key ingredients for staying the course and progressing on investment goals. Moreover, all our investment professionals continually monitor the environment and work hard to position portfolios opportunistically no matter what the markets bring. Remember, turmoil can also create opportunity.
On the following pages you will find information relating to your Victory Funds investment. If you have any questions, we encourage you to contact your financial advisor. If you invest with us directly, you may call 800-539-3863 or visit our website at vcm.com.
From all of us here at Victory Capital, thank you for your ongoing confidence and for letting us help you work toward your investment goals.

Christopher K. Dyer, CFA
President,
Victory Funds
4
Victory RS International Fund
Managers' Commentary
(Unaudited)
What were the market conditions during the reporting period?
After posting strong gains in 2021, international equities (as measured by the MSCI EAFE Index (the "Index")) declined 14.45% over the year ended December 31, 2022, as persistent inflation, rising interest rates and fears of a possible recession weighed heavily on stocks. Russia's invasion of Ukraine and new outbreaks of COVID-19 in China unsettled markets in the first quarter of 2022, frustrating supply chains and exacerbating rising costs for food and fuel. Recession fears took hold in the second quarter as aggressive central bank action to combat inflation threatened economic growth, causing international equities to decline over 14% during the period. After a July rally, markets again turned negative, declining for a third consecutive quarter as central banks confirmed their intent to prioritize curbing inflation over promoting growth, increasing the likelihood of recession. In the fourth quarter, signs of peaking inflation, a deceleration of central bank rate hikes and the moderation of COVID-19-related restrictions in China invited cautious optimism from investors as international market returns finished up more than 17% for the period.
How did Victory RS International Fund (the "Fund") perform during the reporting period?
The Fund returned -15.89% (Class A at net asset value) for the fiscal year ended December 31, 2022, underperforming the Index, which returned -14.45% for the reporting period.
What strategies did you employ during the reporting period?
We employ a blended investment approach that relies on both rigorous quantitative techniques and experienced analyst judgement. At the heart of the investment process is our proprietary QVS (Quality, Value and Sentiment) Model (the "Model"), which is designed to identify companies that have the potential to consistently create shareholder value, are reasonably valued, and exhibit favorable market sentiment. The Model helps us focus our resources, as we conduct additional research only on companies with the strongest Model recommendations. Making correct macro allocation calls can be immensely challenging; therefore, we do not forecast regional performance and seek to remain sector- and region-neutral in constructing our portfolios. In our view, stock selection can be far more impactful to strategy performance than allocation.
Negative stock selection in the Financials and Health Care sectors detracted from the Fund's performance relative to the Index for the period. On the other hand, stock selection was positive in the Real Estate and Information Technology sectors. From a regional perspective, negative stock selection in the United Kingdom and Asia/Pacific ex Japan detracted from relative results, while stock selection was positive in Europe. Country-level detractors included Italy, France and New Zealand, while country contributors included the Netherlands, Germany and Switzerland.
Individual detractors from relative performance for the period included United Kingdom-based specialty chemical manufacturer Croda International PLC, as well as Japanese medical equipment supplier HOYA Corp. The Fund also lost relative performance from not owning United Kingdom-based pharmaceutical manufacturer AstraZeneca PLC, which performed well within the Index. Positive contributors to relative performance included Japanese video game publisher Capcom Co., Ltd., as well as multinational tobacco company Imperial Brands, and oil and gas provider BP PLC, both based in the United Kingdom.
5
Victory RS International Fund
Investment Overview
(Unaudited)
Average Annual Total Return
Year Ended December 31, 2022
Class A | Class C | Class R | Class R6 | Class Y | |||||||||||||||||||||||||||||||
INCEPTION DATE | 2/16/93 | 8/7/00 | 5/15/01 | 5/2/19 | 3/10/09 | ||||||||||||||||||||||||||||||
| Net Asset Value | Maximum Offering Price | Net Asset Value | Contingent Deferred Charges | Net Asset Value | Net Asset Value | Net Asset Value | MSCI EAFE Index1 | ||||||||||||||||||||||||||||
One Year | –15.89 | % | –20.72 | % | –16.50 | % | –17.32 | % | –16.09 | % | –15.57 | % | –15.71 | % | –14.45 | % | |||||||||||||||||||
Five Year | 1.95 | % | 0.75 | % | 1.19 | % | 1.19 | % | 1.69 | % | N/A | 2.20 | % | 1.54 | % | ||||||||||||||||||||
Ten Year | 4.46 | % | 3.85 | % | 3.74 | % | 3.74 | % | 4.10 | % | N/A | 4.76 | % | 4.67 | % | ||||||||||||||||||||
Since Inception | N/A | N/A | N/A | N/A | N/A | 2.53 | % | N/A | N/A | ||||||||||||||||||||||||||
The performance data quoted represents past performance and current returns may be lower or higher. The investment return and principal value will fluctuate so that an investor's shares, when redeemed, may be worth more or less than the original cost. To obtain performance information current to the most recent month's end, please visit vcm.com.
The maximum offering price figures reflect a maximum sales charge of 5.75% for Class A. Class C is not subject to an initial sales charge, but is subject to a deferred sales charge of 1.00% on shares redeemed within one year of purchase. Net Asset Value does not reflect sales charges. Total return measures the price change in a share assuming the reinvestment of all net investment income and realized capital gain distributions, if any. The total returns quoted do not reflect adjustments made to the enclosed financial statements in accordance with U.S. Generally Accepted Accounting Principles or the deduction of taxes that a shareholder would pay on net investment income and realized capital gain distributions, including reinvested distributions, or redemptions of shares. The total return figures set forth above include all waivers of fees. Without such fee waivers, the total returns would have been lower.
Victory RS International Fund — Growth of $10,000
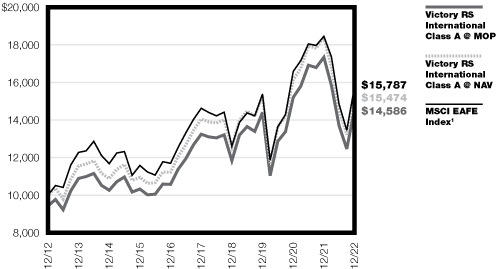
1The MSCI EAFE Index is an equity index that captures large-cap and mid-cap representation across Developed Markets countries around the world. The index reflects the reinvestment of dividends paid on the stocks constituting the index, net of withholding taxes. This index does not include the effect of sales charges, commissions, expenses, or taxes, is not representative of the Fund, and is not possible to invest directly in an index.
The graph reflects investment of growth of a hypothetical $10,000 investment in the Fund.
The graph and table do not reflect the deduction of taxes that a shareholder would pay on Fund distributions or the redemption of shares.
Past performance is not indicative of future results.
6
Victory RS Global Fund
Managers' Commentary
(Unaudited)
What were the market conditions during the reporting period?
After posting strong gains in 2021, global equities (as measured by the MSCI All Country World Index (the "Index")) declined 18.36% over the year ended December 31, 2022, as persistent inflation, rising interest rates and fears of a possible recession weighed heavily on stocks. Russia's invasion of Ukraine and new outbreaks of COVID-19 in China unsettled markets in the first quarter of 2022, frustrating supply chains and exacerbating rising costs for food and fuel. Recession fears took hold in the second quarter as aggressive central bank action to combat inflation threatened economic growth, causing global equities to decline over 15% during the period. After a July rally, markets again turned negative, declining for a third consecutive quarter as central banks confirmed their intent to prioritize curbing inflation over promoting growth, increasing the likelihood of recession. In the fourth quarter, signs of peaking inflation, a deceleration of central bank rate hikes and the moderation of COVID-19-related restrictions in China invited cautious optimism from investors as market returns finished in positive territory for the period.
How did Victory RS Global Fund (the "Fund") perform during the reporting period?
The Fund returned -18.99% (Class A at net asset value) for the fiscal year ended December 31, 2022, underperforming the Index, which returned -18.36% for the reporting period.
What strategies did you employ during the reporting period?
We employ a blended investment approach that relies on both rigorous quantitative techniques and experienced analyst judgement. At the heart of the investment process is our proprietary QVS (Quality, Value and Sentiment) Model (the "Model"), which is designed to identify companies that have the potential to consistently create shareholder value, are reasonably valued, and exhibit favorable market sentiment. The Model helps us focus our resources, as we conduct additional research only on companies with the strongest Model recommendations. Making correct macro allocation calls can be immensely challenging; therefore, we do not forecast regional performance and seek to remain sector- and region-neutral in constructing our portfolios. In our view, stock selection can be far more impactful to strategy performance than allocation.
Negative stock selection in the Financials and Materials sectors detracted from the Fund's performance relative to the Index for the period. On the other hand, stock selection was positive in the Information Technology and Consumer Discretionary sectors. From a regional perspective, negative stock selection in the United Kingdom and Europe detracted from relative results, while stock selection was positive in North America and Japan. Country-level detractors included Switzerland, Australia and Italy, while additional country contributors included the United States, Canada and Spain.
Individual detractors from relative performance for the period included social media technology conglomerate Meta Platforms, Inc., and graphics processor manufacturer NVIDIA Corp., both based in the United States. The Fund also lost relative performance from not owning U.S.-based integrated oil multinational Exxon Mobil Corporation, which performed well within the Index. Positive contributors to relative performance included multinational oil producer ConocoPhillips, pharmaceutical manufacturer Eli Lilly and Co., and investment broker-dealer LPL Financial Holdings, Inc., all based in the United States.
7
Victory RS Global Fund
Investment Overview
(Unaudited)
Average Annual Total Return
Year Ended December 31, 2022
Class A | Class C | Class R | Class R6 | Class Y | |||||||||||||||||||||||||||||||
INCEPTION DATE | 5/16/11 | 5/16/11 | 5/16/11 | 5/2/19 | 5/16/11 | ||||||||||||||||||||||||||||||
| Net Asset Value | Maximum Offering Price | Net Asset Value | Contingent Deferred Charges | Net Asset Value | Net Asset Value | Net Asset Value | MSCI All Country World Index1 | ||||||||||||||||||||||||||||
One Year | –18.99 | % | –23.65 | % | –19.61 | % | –20.41 | % | –19.19 | % | –18.81 | % | –18.82 | % | –18.36 | % | |||||||||||||||||||
Five Year | 7.41 | % | 6.14 | % | 6.62 | % | 6.62 | % | 7.16 | % | N/A | 7.70 | % | 5.23 | % | ||||||||||||||||||||
Ten Year | 10.27 | % | 9.62 | % | 9.60 | % | 9.60 | % | 12.21 | % | N/A | 10.59 | % | 7.98 | % | ||||||||||||||||||||
Since Inception | N/A | N/A | N/A | N/A | N/A | 7.76 | % | N/A | N/A | ||||||||||||||||||||||||||
The performance data quoted represents past performance and current returns may be lower or higher. The investment return and principal value will fluctuate so that an investor's shares, when redeemed, may be worth more or less than the original cost. To obtain performance information current to the most recent month's end, please visit vcm.com.
The maximum offering price figures reflect a maximum sales charge of 5.75% for Class A. Class C is not subject to an initial sales charge, but is subject to a deferred sales charge of 1.00% on shares redeemed within one year of purchase. Net Asset Value does not reflect sales charges. Total return measures the price change in a share assuming the reinvestment of all net investment income and realized capital gain distributions, if any. The total returns quoted do not reflect adjustments made to the enclosed financial statements in accordance with U.S. Generally Accepted Accounting Principles or the deduction of taxes that a shareholder would pay on net investment income and realized capital gain distributions, including reinvested distributions, or redemptions of shares. The total return figures set forth above include all waivers of fees. Without such fee waivers, the total returns would have been lower.
Victory RS Global Fund — Growth of $10,000

1The MSCI All Country World Index is a free float-adjusted market capitalization weighted index that is designed to measure the equity market performance of developed and emerging markets. This index does not include the effect of sales charges, commissions, expenses, or taxes, is not representative of the Fund, and it is not possible to invest directly in an index.
The graph reflects investment of growth of a hypothetical $10,000 investment in the Fund.
The graph and table do not reflect the deduction of taxes that a shareholder would pay on Fund distributions or the redemption of shares.
Past performance is not indicative of future results.
8
Victory Sophus Emerging Markets Fund
Managers' Commentary
(Unaudited)
What were the market conditions during the reporting period?
Emerging markets, as measured by the MSCI Emerging Markets Index (the "Index"), underperformed developed markets in 2022, returning -20.1%, versus the MSCI World Index and the S&P 500® Index, which returned -18.4% and -18.1%, respectively.
Latin America ("LatAm") outperformed all regions globally in 2022, gaining 8.9%, driven by valuations and terms of trade. After a period of underperformance in 2021, LatAm benefited from higher commodity prices due to the war in Ukraine in the first quarter of 2022 and sustained that strength throughout the year. Chile (+19.4%) and Brazil (+14.2%) outperformed other emerging markets significantly, both benefiting from a positive commodity cycle and diligent monetary policies deployed to contain inflation. Politics continued to play a significant role in 2022. LatAm is now almost entirely ruled by leftist governments (Ecuador is the main exception). However, few markets have emerged from this "pink" wave unscathed, with Brazil and Peru the most recent to struggle from related uncertainties: seemingly free reign over fiscal accounts and a failed coup respectively. Overall, Brazil struggled to digest mounting fiscal uncertainties in response to proposals by the incoming Lula Administration which include: the approval of the Spending Bill (which raised the amount exempted from the spending ceiling) by a wide margin in Congress, the appointment of former Sao Paulo Mayor Fernando Haddad to the position of Finance Minister, and the unexpected changing of the State Owned Enterprise legislation in a "rushed" session, all of which were received negatively by markets towards the end of the year.
Asia, down 21.1%, was perhaps the most volatile region in the period, whipsawed by news in China, which happens to be the largest part of the Index, accounting for over 30% of the emerging markets benchmark. China was one of the worst-performing markets in emerging markets overall in 2022, down 21.9%. After underperforming for the first four months of the year, China rallied hard beginning in mid-May and carried through to the end of June, on expectations of re-opening and de-regulation. After a short, sharp rally the market rolled over again on geopolitical tension, regulation, threats of further decoupling, real estate defaults, a zero-COVID-19 policy, etc. which all weighed heavily on investor sentiment, in particular that of foreign flows. Then in November alone, China advanced 30% after announcing its COVID-19 policy recalibration and housing market stabilization measures. However, economic data from China was effectively weak throughout the year, as were foreign investor flows. Both points matter and look set to turn positive in 2023.
China is currently trading on roughly 9X CAPE (Cyclically Adjusted Price-to-Earnings Ratio) versus a longer-term average of 11X 2023 earnings, well below historical valuations. President Xi expressed his concern about the present situation: growth is subpar, confidence is low, and his party's credibility has been dented. Xi indicated that he will prioritize economic recovery, consumption, and the property market in equal measure. For the first time since 2019, domestic macro policies and COVID-19 management are aligned to support a growth recovery. ASEAN markets (Association of Southeast Asian Nations) witnessed historically high inflows in 2022. Thailand, which returned 5.0%, presents a compelling setup heading into next year, as the biggest beneficiary globally of a fall in freight rates and oil and the comeback of Asian tourism. The Philippines and Indonesia remain more defensive options in the event of lower world trade volume growth.
9
Victory Sophus Emerging Markets Fund
Managers' Commentary (continued)
Russia's invasion of Ukraine drove underperformance in EEMEA (Europe, the Middle East, and Africa), down 28.3% for the year. Russia faced an onslaught of sanctions from a united West, with enormous economic implications. After an extended period of market closure, Russian securities were effectively removed from major indices and valued at zero. While local markets have resumed trading activity, they remain virtually closed to foreign investors of "unfriendly" nations. The war in Ukraine drove inflationary pressure and rising account imbalances (for some), alongside sharply tightening financial conditions in core markets across the region. Turkey continues to make new highs; the best-performing market globally, up 90.4% in 2022. However, this rally has been fueled by domestic investors' search for real returns, which makes its sustainability questionable.
The MENA (the Middle East and North Africa) region got off to a strong start in 2022 with the war in Ukraine sparking higher energy prices driving higher growth in the region. However, the Gulf markets sold off in profit taking in the last part of the year. Saudi Arabia was one of the worst performing emerging markets in the fourth quarter, weighed down by cheaper oil and a weaker U.S. dollar. While the underlying vulnerabilities remain, MENA, and Saudi Arabia in particular, head into the new year with confidence high, inflation low, and activity still building momentum, backed by strong public finances, falling debt, and a trade-driven account surplus.
How did Victory Sophus Emerging Markets Fund (the "Fund") perform during the reporting period?
The Fund returned -22.41% (Class A at net asset value) for the fiscal year ended December 31, 2022, underperforming the Index, which returned -20.09% for the reporting period.
What strategies did you employ during the reporting period?
We employ a disciplined, bottom-up approach utilizing both quantitative and fundamental processes to invest in companies that we believe have the potential for strong and sustainable earnings growth at attractive valuations, with revisions as the catalyst. By investing in companies with these characteristics, coupled with our risk-managed approach, we seek to provide consistent excess returns over time.
Stock selection in the Energy sector was the largest detractor from performance overall in 2022, given swift sanctions imposed by the West upon Russian equities following its invasion of Ukraine on February 24th. Stock selection in the Utilities sector was another significant detractor to performance, as a result of both poor performers we held, like China Longyuan Power Group Corp., Ltd., and to strong performers we did not own, particularly those in the Indian market.
From a country perspective, Russia and India were the two largest detractors from performance in 2022; the former, due to negative stock selection and our slightly overweight position compared to the Index as a result of heavy pressure imposed by the West in response to the invasion of Ukraine. Consequently, Russian equities (four were held in this portfolio) became uninvestable, all removed from the Index due to liquidity issues. For India, negative stock selection detracted from performance, due to both poor performers which we owned (e.g., Infosys) and strong performers which we did not own (e.g., Reliance Industries).
10
Victory Sophus Emerging Markets Fund
Managers' Commentary (continued)
China also detracted from performance in the full year, as a result of more defensive positioning heading into the most recent November rally, best illustrated by holdings such as pharmaceutical company Wuxi Biologics Cayman, Inc.; Tongwei Solar, a dominant solar products manufacturer in the global new-energy space; China Longyuan Power Group Corp., Ltd., the largest wind-farm operator in Asia; and IT service provider Chinasoft International Ltd. We reacted methodically and reduced risk exposure within the portfolio to capture alpha amidst this rally. We saw improving macroeconomic factors and fundamentals around China's exit from zero-COVID-19, supportive efforts implemented for the property market, and President Xi setting out a more pro-growth tone for 2023.
The most positive sector contributor to performance in the period was Communication Services, driven by stock selection, namely our position in JYP Entertainment Corp., as well as our moderate underweight sector position more broadly relative to the Index. On a country basis, the most positive contribution came from Greece, due to our moderate overweight position compared to the Index, thanks to holdings such as Mytilineos SA and National Bank of Greece, which benefited from the economic turnaround as tourist arrivals breached new highs helping boost the positive current account and earnings.
11
Victory Fixed Income Funds
Victory Sophus Emerging Markets Fund
Investment Overview
(Unaudited)
Average Annual Total Return
Year Ended December 31, 2022
Class A | Class C | Class R | Class R6 | Class Y | |||||||||||||||||||||||||||||||
INCEPTION DATE | 5/1/97 | 8/7/00 | 5/15/01 | 11/15/16 | 3/10/09 | ||||||||||||||||||||||||||||||
| Net Asset Value | Maximum Offering Price | Net Asset Value | Contingent Deferred Charges | Net Asset Value | Net Asset Value | Net Asset Value | MSCI Emerging Markets Index1 | ||||||||||||||||||||||||||||
One Year | –22.41 | % | –26.85 | % | –23.01 | % | –23.76 | % | –22.62 | % | –22.06 | % | –22.15 | % | –20.09 | % | |||||||||||||||||||
Five Year | –2.93 | % | –4.07 | % | –3.70 | % | –3.70 | % | –3.16 | % | –2.48 | % | –2.59 | % | –1.40 | % | |||||||||||||||||||
Ten Year | 0.80 | % | 0.20 | % | 0.16 | % | 0.16 | % | 0.54 | % | N/A | 1.15 | % | 1.44 | % | ||||||||||||||||||||
Since Inception | N/A | N/A | N/A | N/A | N/A | 4.13 | % | N/A | N/A | ||||||||||||||||||||||||||
The performance data quoted represents past performance and current returns may be lower or higher. The investment return and principal value will fluctuate so that an investor's shares, when redeemed, may be worth more or less than the original cost. To obtain performance information current to the most recent month's end, please visit vcm.com.
The maximum offering price figures reflect a maximum sales charge of 5.75% for Class A. Class C is not subject to an initial sales charge, but is subject to a deferred sales charge of 1.00% on shares redeemed within one year of purchase. Net Asset Value does not reflect sales charges. Total return measures the price change in a share assuming the reinvestment of all net investment income and realized capital gain distributions, if any. The total returns quoted do not reflect adjustments made to the enclosed financial statements in accordance with U.S. Generally Accepted Accounting Principles or the deduction of taxes that a shareholder would pay on net investment income and realized capital gain distributions, including reinvested distributions, or redemptions of shares. The total return figures set forth above include all waivers of fees. Without such fee waivers, the total returns would have been lower.
Victory Sophus Emerging Markets Fund — Growth of $10,000
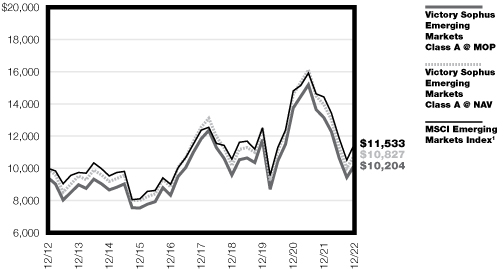
1The unmanaged MSCI Emerging Markets Index is a free-float-adjusted market capitalization index designed to measure equity market performance in the global emerging markets. The index reflects the reinvestment of dividends paid on the stocks constituting the index, net of withholding taxes. This index does not include the effect of sales charges, commissions, expenses, or taxes, is not representative of the Fund, and it is not possible to invest directly in an index.
The graph reflects investment of growth of a hypothetical $10,000 investment in the Fund.
The graph and table do not reflect the deduction of taxes that a shareholder would pay on Fund distributions or the redemption of shares.
Past performance is not indicative of future results.
12
| Victory Portfolios Victory RS International Fund | December 31, 2022 | ||||||
(Unaudited)
Investment Objective and Portfolio Holdings:
The Fund seeks to provide long-term capital appreciation.
Top 10 Holdings*:
December 31, 2022
(% of Net Assets)
Nestle SA, Registered Shares | 4.2 | % | |||||
Novo Nordisk A/S, Class B | 3.4 | % | |||||
Roche Holding AG | 3.4 | % | |||||
LVMH Moet Hennessy Louis Vuitton SE | 3.3 | % | |||||
Novartis AG, Registered Shares | 2.5 | % | |||||
Shell PLC | 2.4 | % | |||||
BHP Group Ltd. | 2.4 | % | |||||
Toyota Motor Corp. | 2.2 | % | |||||
Rio Tinto PLC | 2.1 | % | |||||
Diageo PLC | 2.0 | % | |||||
Sector Allocation*:
December 31, 2022
(% of Net Assets)
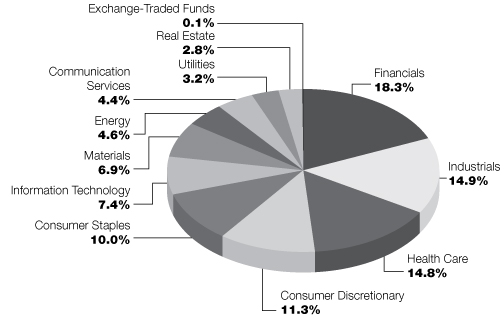
* Does not include futures contracts, money market instruments, and short-term investments purchased with cash collateral from securities loaned.
Percentages are of the net assets of the Fund and may not equal 100%.
Refer to the Schedule of Portfolio Investments for a complete list of securities.
13
| Victory Portfolios Victory RS Global Fund | December 31, 2022 | ||||||
(Unaudited)
Investment Objective and Portfolio Holdings:
The Fund seeks to provide long-term capital appreciation.
Top 10 Holdings*:
December 31, 2022
(% of Net Assets)
Apple, Inc. | 4.4 | % | |||||
Microsoft Corp. | 4.0 | % | |||||
PepsiCo, Inc. | 2.3 | % | |||||
McDonald's Corp. | 2.2 | % | |||||
Eli Lilly & Co. | 1.9 | % | |||||
Alphabet, Inc., Class C | 1.9 | % | |||||
Johnson & Johnson | 1.7 | % | |||||
Colgate-Palmolive Co. | 1.7 | % | |||||
Mastercard, Inc., Class A | 1.7 | % | |||||
Novo Nordisk A/S, Class B | 1.6 | % | |||||
Sector Allocation*:
December 31, 2022
(% of Net Assets)

* Does not include futures contracts, money market instruments, and short-term investments purchased with cash collateral from securities loaned.
Percentages are of the net assets of the Fund and may not equal 100%.
Refer to the Schedule of Portfolio Investments for a complete list of securities.
14
| Victory Portfolios Victory Sophus Emerging Markets Fund | December 31, 2022 | ||||||
(Unaudited)
Investment Objective and Portfolio Holdings:
The Fund seeks to provide long-term capital appreciation.
Top 10 Holdings*:
December 31, 2022
(% of Net Assets)
Taiwan Semiconductor Manufacturing Co. Ltd. | 7.1 | % | |||||
Tencent Holdings Ltd. | 3.7 | % | |||||
Samsung Electronics Co. Ltd. | 3.6 | % | |||||
Alibaba Group Holding Ltd. | 3.1 | % | |||||
ICICI Bank Ltd. | 2.9 | % | |||||
JD.com, Inc., Class A | 2.3 | % | |||||
Meituan, Class B | 1.8 | % | |||||
Larsen & Toubro Ltd. | 1.8 | % | |||||
Pinduoduo, Inc. | 1.6 | % | |||||
Mahindra & Mahindra Ltd. | 1.4 | % | |||||
Sector Allocation*:
December 31, 2022
(% of Net Assets)

* Does not include futures contracts, money market instruments, and short-term investments purchased with cash collateral from securities loaned.
Percentages are of the net assets of the Fund and may not equal 100%.
Refer to the Schedule of Portfolio Investments for a complete list of securities.
15
| Victory Portfolios Victory RS International Fund | Schedules of Portfolio Investments December 31, 2022 | ||||||
Security Description | Shares | Value | |||||||||
Common Stocks (98.6%) | |||||||||||
Australia (7.7%): | |||||||||||
Consumer Discretionary (0.9%): | |||||||||||
Aristocrat Leisure Ltd. | 143,344 | $ | 2,953,060 | ||||||||
Financials (1.4%): | |||||||||||
Macquarie Group Ltd. | 41,126 | 4,641,614 | |||||||||
Health Care (2.0%): | |||||||||||
CSL Ltd. | 33,822 | 6,593,619 | |||||||||
Materials (2.4%): | |||||||||||
BHP Group Ltd. | 264,276 | 8,184,637 | |||||||||
Real Estate (1.0%): | |||||||||||
Scentre Group | 1,766,413 | 3,437,663 | |||||||||
25,810,593 | |||||||||||
Belgium (0.8%): | |||||||||||
Information Technology (0.8%): | |||||||||||
Melexis NV | 31,108 | 2,707,440 | |||||||||
China (0.9%): | |||||||||||
Communication Services (0.9%): | |||||||||||
Tencent Holdings Ltd. | 67,700 | 2,870,670 | |||||||||
Denmark (4.3%): | |||||||||||
Consumer Discretionary (0.9%): | |||||||||||
Pandora A/S | 40,744 | 2,880,344 | |||||||||
Health Care (3.4%): | |||||||||||
Novo Nordisk A/S, Class B | 84,235 | 11,442,401 | |||||||||
14,322,745 | |||||||||||
France (9.4%): | |||||||||||
Consumer Discretionary (4.6%): | |||||||||||
La Francaise des Jeux SAEM (a) | 109,843 | 4,419,290 | |||||||||
LVMH Moet Hennessy Louis Vuitton SE | 15,115 | 10,997,513 | |||||||||
15,416,803 | |||||||||||
Energy (0.6%): | |||||||||||
Gaztransport Et Technigaz SA | 18,791 | 2,007,935 | |||||||||
Industrials (1.7%): | |||||||||||
Safran SA | 44,176 | 5,532,430 | |||||||||
Information Technology (1.2%): | |||||||||||
Capgemini SE | 24,169 | 4,039,905 | |||||||||
Materials (1.3%): | |||||||||||
Arkema SA | 50,233 | 4,517,558 | |||||||||
31,514,631 | |||||||||||
Germany (7.5%): | |||||||||||
Consumer Discretionary (0.9%): | |||||||||||
Volkswagen AG, Preference Shares | 23,345 | 2,895,527 | |||||||||
See notes to financial statements.
16
| Victory Portfolios Victory RS International Fund | Schedules of Portfolio Investments — continued December 31, 2022 | ||||||
Security Description | Shares | Value | |||||||||
Financials (1.8%): | |||||||||||
Allianz SE, Registered Shares | 28,895 | $ | 6,169,872 | ||||||||
Industrials (2.0%): | |||||||||||
Siemens AG, Registered Shares | 49,707 | 6,851,197 | |||||||||
Information Technology (1.5%): | |||||||||||
SAP SE | 50,246 | 5,186,693 | |||||||||
Utilities (1.3%): | |||||||||||
RWE AG | 95,300 | 4,212,395 | |||||||||
25,315,684 | |||||||||||
Hong Kong (2.8%): | |||||||||||
Financials (1.6%): | |||||||||||
AIA Group Ltd. | 495,400 | 5,471,212 | |||||||||
Real Estate (1.2%): | |||||||||||
CK Asset Holdings Ltd. | 641,000 | 3,931,591 | |||||||||
9,402,803 | |||||||||||
Italy (1.2%): | |||||||||||
Utilities (1.2%): | |||||||||||
Snam SpA | 832,144 | 4,034,357 | |||||||||
Japan (21.7%): | |||||||||||
Communication Services (1.9%): | |||||||||||
Capcom Co. Ltd. | 112,000 | 3,575,640 | |||||||||
Kakaku.com, Inc. | 171,400 | 2,750,645 | |||||||||
6,326,285 | |||||||||||
Consumer Discretionary (3.3%): | |||||||||||
Toyota Motor Corp. | 546,800 | 7,460,881 | |||||||||
ZOZO, Inc. | 140,800 | 3,477,692 | |||||||||
10,938,573 | |||||||||||
Consumer Staples (1.1%): | |||||||||||
Toyo Suisan Kaisha Ltd. | 93,000 | 3,583,461 | |||||||||
Financials (3.1%): | |||||||||||
Mitsubishi UFJ Financial Group, Inc. | 807,300 | 5,420,567 | |||||||||
Tokio Marine Holdings, Inc. | 240,000 | 5,127,756 | |||||||||
10,548,323 | |||||||||||
Health Care (2.5%): | |||||||||||
Hoya Corp. | 54,200 | 5,191,991 | |||||||||
Shionogi & Co. Ltd. | 64,900 | 3,238,558 | |||||||||
8,430,549 | |||||||||||
See notes to financial statements.
17
| Victory Portfolios Victory RS International Fund | Schedules of Portfolio Investments — continued December 31, 2022 | ||||||
Security Description | Shares | Value | |||||||||
Industrials (5.5%): | |||||||||||
Fuji Electric Co. Ltd. | 112,900 | $ | 4,261,414 | ||||||||
MISUMI Group, Inc. | 122,800 | 2,669,381 | |||||||||
Mitsubishi Heavy Industries Ltd. | 99,300 | 3,924,592 | |||||||||
Nippon Yusen KK (b) | 85,000 | 2,004,660 | |||||||||
OKUMA Corp. | 58,900 | 2,086,665 | |||||||||
Sanwa Holdings Corp. | 395,500 | 3,641,910 | |||||||||
18,588,622 | |||||||||||
Information Technology (3.0%): | |||||||||||
Fujitsu Ltd. | 27,100 | 3,613,459 | |||||||||
Oracle Corp. | 51,300 | 3,336,112 | |||||||||
Ulvac, Inc. | 75,100 | 3,130,255 | |||||||||
10,079,826 | |||||||||||
Real Estate (0.6%): | |||||||||||
Sumitomo Realty & Development Co. Ltd. | 92,400 | 2,178,010 | |||||||||
Utilities (0.7%): | |||||||||||
Chubu Electric Power Co., Inc. | 220,700 | 2,282,494 | |||||||||
72,956,143 | |||||||||||
Netherlands (5.8%): | |||||||||||
Communication Services (1.6%): | |||||||||||
Koninklijke KPN NV | 1,744,260 | 5,398,162 | |||||||||
Financials (1.7%): | |||||||||||
ING Groep NV | 457,837 | 5,576,191 | |||||||||
Industrials (1.6%): | |||||||||||
Wolters Kluwer NV | 50,634 | 5,297,348 | |||||||||
Information Technology (0.9%): | |||||||||||
ASM International NV | 12,153 | 3,083,197 | |||||||||
19,354,898 | |||||||||||
New Zealand (0.7%): | |||||||||||
Health Care (0.7%): | |||||||||||
Fisher & Paykel Healthcare Corp. Ltd. | 159,763 | 2,285,180 | |||||||||
Norway (1.1%): | |||||||||||
Energy (0.3%): | |||||||||||
Aker BP ASA | 39,534 | 1,230,363 | |||||||||
Financials (0.8%): | |||||||||||
SpareBank 1 SMN | 201,661 | 2,622,921 | |||||||||
3,853,284 | |||||||||||
Spain (1.8%): | |||||||||||
Financials (1.8%): | |||||||||||
Banco Bilbao Vizcaya Argentaria SA | 1,012,749 | 6,099,188 | |||||||||
See notes to financial statements.
18
| Victory Portfolios Victory RS International Fund | Schedules of Portfolio Investments — continued December 31, 2022 | ||||||
Security Description | Shares | Value | |||||||||
Sweden (2.7%): | |||||||||||
Industrials (2.7%): | |||||||||||
Atlas Copco AB, Class B | 580,692 | $ | 6,199,196 | ||||||||
Nibe Industrier AB, Class B | 305,176 | 2,850,017 | |||||||||
9,049,213 | |||||||||||
Switzerland (13.6%): | |||||||||||
Consumer Staples (5.1%): | |||||||||||
Coca-Cola HBC AG | 132,288 | 3,126,465 | |||||||||
Nestle SA, Registered Shares | 120,325 | 13,902,431 | |||||||||
17,028,896 | |||||||||||
Financials (2.6%): | |||||||||||
Partners Group Holding AG | 4,488 | 3,975,126 | |||||||||
UBS Group AG | 265,085 | 4,928,263 | |||||||||
8,903,389 | |||||||||||
Health Care (5.9%): | |||||||||||
Novartis AG, Registered Shares | 93,193 | 8,436,010 | |||||||||
Roche Holding AG | 35,866 | 11,273,492 | |||||||||
19,709,502 | |||||||||||
45,641,787 | |||||||||||
United Kingdom (16.6%): | |||||||||||
Consumer Discretionary (0.7%): | |||||||||||
Next PLC | 34,266 | 2,400,534 | |||||||||
Consumer Staples (3.8%): | |||||||||||
Diageo PLC | 158,018 | 6,915,273 | |||||||||
Imperial Brands PLC | 239,803 | 5,972,496 | |||||||||
12,887,769 | |||||||||||
Energy (3.7%): | |||||||||||
| BP PLC | 733,756 | 4,232,829 | |||||||||
Shell PLC | 291,940 | 8,228,277 | |||||||||
12,461,106 | |||||||||||
Financials (3.5%): | |||||||||||
Barclays PLC | 2,207,130 | 4,198,862 | |||||||||
HSBC Holdings PLC | 945,107 | 5,856,091 | |||||||||
Legal & General Group PLC | 587,809 | 1,761,956 | |||||||||
11,816,909 | |||||||||||
Health Care (0.3%): | |||||||||||
CVS Group PLC | 40,703 | 949,220 | |||||||||
Industrials (1.4%): | |||||||||||
Ashtead Group PLC | 80,844 | 4,591,350 | |||||||||
Materials (3.2%): | |||||||||||
Croda International PLC | 47,376 | 3,769,313 | |||||||||
Rio Tinto PLC | 98,828 | 6,954,435 | |||||||||
10,723,748 | |||||||||||
55,830,636 | |||||||||||
Total Common Stocks (Cost $319,040,935) | 331,049,252 | ||||||||||
See notes to financial statements.
19
| Victory Portfolios Victory RS International Fund | Schedules of Portfolio Investments — continued December 31, 2022 | ||||||
Security Description | Shares | Value | |||||||||
Exchange-Traded Funds (0.1%) | |||||||||||
United States (0.1%): | |||||||||||
iShares MSCI EAFE ETF | 5,223 | $ | 342,838 | ||||||||
Total Exchange-Traded Funds (Cost $345,188) | 342,838 | ||||||||||
Collateral for Securities Loaned (0.6%)^ | |||||||||||
United States (0.6%): | |||||||||||
| Goldman Sachs Financial Square Government Fund, Institutional Shares, 4.14% (c) | 503,573 | 503,573 | |||||||||
HSBC U.S. Government Money Market Fund, Institutional Shares, 4.13% (c) | 503,573 | 503,573 | |||||||||
Invesco Government & Agency Portfolio, Institutional Shares, 4.22% (c) | 503,573 | 503,573 | |||||||||
| Morgan Stanley Institutional Liquidity Government Portfolio, Institutional Shares, 4.08% (c) | 503,573 | 503,573 | |||||||||
Total Collateral for Securities Loaned (Cost $2,014,292) | 2,014,292 | ||||||||||
Total Investments (Cost $321,400,415) — 99.3% | 333,406,382 | ||||||||||
Other assets in excess of liabilities — 0.7% | 2,329,593 | ||||||||||
NET ASSETS — 100.00% | $ | 335,735,975 | |||||||||
^ Purchased with cash collateral from securities on loan.
(a) Rule 144A security or other security that is restricted as to resale to institutional investors. The Fund's Adviser has deemed this security to be liquid (unless otherwise noted as illiquid) based upon procedures approved by the Board of Trustees. As of December 31, 2022, the fair value of these securities was $4,419,290 and amounted to 1.3% of net assets.
(b) All or a portion of this security is on loan.
(c) Rate disclosed is the daily yield on December 31, 2022.
ETF — Exchange-Traded Fund
PLC — Public Limited Company
See notes to financial statements.
20
| Victory Portfolios Victory RS Global Fund | Schedules of Portfolio Investments December 31, 2022 | ||||||
Security Description | Shares | Value | |||||||||
Common Stocks (95.7%) | |||||||||||
Australia (1.9%): | |||||||||||
Consumer Discretionary (0.6%): | |||||||||||
Aristocrat Leisure Ltd. | 122,393 | $ | 2,521,444 | ||||||||
Financials (0.8%): | |||||||||||
Macquarie Group Ltd. | 31,819 | 3,591,196 | |||||||||
Health Care (0.5%): | |||||||||||
CSL Ltd. | 10,264 | 2,000,973 | |||||||||
8,113,613 | |||||||||||
Belgium (0.5%): | |||||||||||
Information Technology (0.5%): | |||||||||||
Melexis NV | 26,440 | 2,301,167 | |||||||||
Bermuda (0.9%): | |||||||||||
Industrials (0.9%): | |||||||||||
Triton International Ltd. | 52,760 | 3,628,833 | |||||||||
Canada (4.6%): | |||||||||||
Consumer Staples (0.9%): | |||||||||||
Alimentation Couche-Tard, Inc. | 90,547 | 3,979,573 | |||||||||
Energy (0.7%): | |||||||||||
Parex Resources, Inc. | 189,280 | 2,817,249 | |||||||||
Industrials (0.9%): | |||||||||||
Canadian Pacific Railway Ltd. | 54,254 | 4,045,606 | |||||||||
Information Technology (1.4%): | |||||||||||
Constellation Software, Inc. | 3,718 | 5,805,661 | |||||||||
Materials (0.7%): | |||||||||||
Aginco Eagle Mines Ltd. | 53,550 | 2,783,113 | |||||||||
19,431,202 | |||||||||||
China (2.8%): | |||||||||||
Communication Services (1.5%): | |||||||||||
Tencent Holdings Ltd. | 152,100 | 6,449,467 | |||||||||
Consumer Staples (0.6%): | |||||||||||
Foshan Haitian Flavouring & Food Co. Ltd., Class A | 212,179 | 2,424,139 | |||||||||
Financials (0.7%): | |||||||||||
Industrial & Commercial Bank of China Ltd., Class H | 5,484,000 | 2,812,849 | |||||||||
11,686,455 | |||||||||||
Denmark (2.3%): | |||||||||||
Consumer Discretionary (0.7%): | |||||||||||
Pandora A/S | 38,929 | 2,752,035 | |||||||||
Health Care (1.6%): | |||||||||||
Novo Nordisk A/S, Class B | 50,420 | 6,849,004 | |||||||||
9,601,039 | |||||||||||
See notes to financial statements.
21
| Victory Portfolios Victory RS Global Fund | Schedules of Portfolio Investments — continued December 31, 2022 | ||||||
Security Description | Shares | Value | |||||||||
France (2.9%): | |||||||||||
Consumer Discretionary (0.7%): | |||||||||||
La Francaise des Jeux SAEM (a) | 71,858 | $ | 2,891,048 | ||||||||
Energy (0.7%): | |||||||||||
Gaztransport Et Technigaz SA | 28,037 | 2,995,928 | |||||||||
Industrials (0.7%): | |||||||||||
Safran SA | 24,410 | 3,057,013 | |||||||||
Materials (0.8%): | |||||||||||
Arkema SA | 34,541 | 3,106,344 | |||||||||
12,050,333 | |||||||||||
Germany (1.3%): | |||||||||||
Consumer Discretionary (0.6%): | |||||||||||
Volkswagen AG, Preference Shares | 19,386 | 2,404,484 | |||||||||
Utilities (0.7%): | |||||||||||
RWE AG | 68,398 | 3,023,289 | |||||||||
5,427,773 | |||||||||||
Indonesia (1.0%): | |||||||||||
Communication Services (1.0%): | |||||||||||
PT Telkom Indonesia Persero Tbk | 18,365,000 | 4,423,227 | |||||||||
Ireland (1.4%): | |||||||||||
Industrials (1.4%): | |||||||||||
Eaton Corp. PLC | 36,518 | 5,731,500 | |||||||||
Italy (0.6%): | |||||||||||
Utilities (0.6%): | |||||||||||
Snam SpA | 522,465 | 2,532,987 | |||||||||
Japan (5.6%): | |||||||||||
Communication Services (1.3%): | |||||||||||
Capcom Co. Ltd. | 110,400 | 3,524,560 | |||||||||
Kakaku.com, Inc. | 125,300 | 2,010,827 | |||||||||
5,535,387 | |||||||||||
Consumer Discretionary (0.8%): | |||||||||||
ZOZO, Inc. | 141,300 | 3,490,042 | |||||||||
Consumer Staples (0.7%): | |||||||||||
Toyo Suisan Kaisha Ltd. | 74,800 | 2,882,182 | |||||||||
Financials (0.9%): | |||||||||||
Mitsubishi UFJ Financial Group, Inc. | 572,900 | 3,846,702 | |||||||||
Health Care (0.5%): | |||||||||||
Hoya Corp. | 23,500 | 2,251,140 | |||||||||
Industrials (1.0%): | |||||||||||
Fuji Electric Co. Ltd. | 40,800 | 1,539,998 | |||||||||
Nippon Yusen KK (b) | 108,300 | 2,554,173 | |||||||||
4,094,171 | |||||||||||
See notes to financial statements.
22
| Victory Portfolios Victory RS Global Fund | Schedules of Portfolio Investments — continued December 31, 2022 | ||||||
Security Description | Shares | Value | |||||||||
Information Technology (0.4%): | |||||||||||
Ulvac, Inc. | 42,100 | $ | 1,754,777 | ||||||||
23,854,401 | |||||||||||
Korea, Republic Of (0.7%): | |||||||||||
Information Technology (0.7%): | |||||||||||
Samsung Electronics Co. Ltd. | 70,235 | 3,083,086 | |||||||||
Netherlands (0.5%): | |||||||||||
Information Technology (0.5%): | |||||||||||
ASM International NV | 8,658 | 2,196,521 | |||||||||
New Zealand (0.5%): | |||||||||||
Health Care (0.5%): | |||||||||||
Fisher & Paykel Healthcare Corp. Ltd. | 148,397 | 2,122,605 | |||||||||
Norway (0.8%): | |||||||||||
Energy (0.5%): | |||||||||||
Aker BP ASA | 66,429 | 2,067,379 | |||||||||
Financials (0.3%): | |||||||||||
SpareBank 1 SMN | 106,717 | 1,388,024 | |||||||||
3,455,403 | |||||||||||
Singapore (0.5%): | |||||||||||
Financials (0.5%): | |||||||||||
Singapore Exchange Ltd. | 336,300 | 2,249,304 | |||||||||
South Africa (0.4%): | |||||||||||
Consumer Discretionary (0.4%): | |||||||||||
Mr Price Group Ltd. | 200,051 | 1,856,172 | |||||||||
Spain (1.0%): | |||||||||||
Financials (1.0%): | |||||||||||
Banco Bilbao Vizcaya Argentaria SA | 702,103 | 4,228,351 | |||||||||
Sweden (1.3%): | |||||||||||
Industrials (1.3%): | |||||||||||
Atlas Copco AB, Class B | 285,046 | 3,043,018 | |||||||||
Nibe Industrier AB, Class B | 260,012 | 2,428,233 | |||||||||
5,471,251 | |||||||||||
Switzerland (3.5%): | |||||||||||
Consumer Staples (0.6%): | |||||||||||
Nestle SA, Registered Shares | 23,023 | 2,660,093 | |||||||||
Financials (1.6%): | |||||||||||
Chubb Ltd. | 18,451 | 4,070,290 | |||||||||
Partners Group Holding AG | 2,762 | 2,446,368 | |||||||||
6,516,658 | |||||||||||
See notes to financial statements.
23
| Victory Portfolios Victory RS Global Fund | Schedules of Portfolio Investments — continued December 31, 2022 | ||||||
Security Description | Shares | Value | |||||||||
Health Care (1.3%): | |||||||||||
Roche Holding AG | 17,772 | $ | 5,586,140 | ||||||||
14,762,891 | |||||||||||
Taiwan (1.6%): | |||||||||||
Financials (0.9%): | |||||||||||
Cathay Financial Holding Co. Ltd. | 2,827,000 | 3,671,127 | |||||||||
Information Technology (0.7%): | |||||||||||
Lite-On Technology Corp. | 1,541,000 | 3,185,089 | |||||||||
6,856,216 | |||||||||||
United Kingdom (4.6%): | |||||||||||
Consumer Discretionary (0.4%): | |||||||||||
Next PLC | 24,274 | 1,700,536 | |||||||||
Consumer Staples (0.7%): | |||||||||||
Imperial Brands PLC | 120,242 | 2,994,728 | |||||||||
Financials (1.1%): | |||||||||||
Barclays PLC | 1,102,573 | 2,097,544 | |||||||||
HSBC Holdings PLC | 426,063 | 2,639,980 | |||||||||
4,737,524 | |||||||||||
Industrials (0.5%): | |||||||||||
Ashtead Group PLC | 33,532 | 1,904,373 | |||||||||
Materials (1.9%): | |||||||||||
Croda International PLC | 36,288 | 2,887,134 | |||||||||
Rio Tinto PLC | 75,640 | 5,322,717 | |||||||||
8,209,851 | |||||||||||
19,547,012 | |||||||||||
United States (54.5%): | |||||||||||
Communication Services (2.9%): | |||||||||||
Alphabet, Inc., Class C (c) | 88,597 | 7,861,212 | |||||||||
Meta Platforms, Inc., Class A (c) | 35,215 | 4,237,773 | |||||||||
12,098,985 | |||||||||||
Consumer Discretionary (6.8%): | |||||||||||
Amazon.com, Inc. (c) | 63,851 | 5,363,484 | |||||||||
McDonald's Corp. | 35,682 | 9,403,278 | |||||||||
PulteGroup, Inc. | 94,068 | 4,282,916 | |||||||||
Ross Stores, Inc. | 46,363 | 5,381,353 | |||||||||
Target Corp. | 14,257 | 2,124,863 | |||||||||
Tesla, Inc. (c) | 18,203 | 2,242,246 | |||||||||
28,798,140 | |||||||||||
Consumer Staples (5.2%): | |||||||||||
Colgate-Palmolive Co. | 91,574 | 7,215,115 | |||||||||
PepsiCo., Inc. | 53,528 | 9,670,369 | |||||||||
The Estee Lauder Cos., Inc. | 21,512 | 5,337,342 | |||||||||
22,222,826 | |||||||||||
See notes to financial statements.
24
| Victory Portfolios Victory RS Global Fund | Schedules of Portfolio Investments — continued December 31, 2022 | ||||||
Security Description | Shares | Value | |||||||||
Energy (2.9%): | |||||||||||
APA Corp. | 85,718 | $ | 4,001,316 | ||||||||
Cactus, Inc., Class A | 32,295 | 1,623,147 | |||||||||
ConocoPhillips | 56,014 | 6,609,652 | |||||||||
12,234,115 | |||||||||||
Financials (7.3%): | |||||||||||
Bank of America Corp. | 164,043 | 5,433,104 | |||||||||
JPMorgan Chase & Co. | 47,725 | 6,399,923 | |||||||||
LPL Financial Holdings, Inc. | 20,571 | 4,446,833 | |||||||||
S&P Global, Inc. | 15,974 | 5,350,332 | |||||||||
Synchrony Financial | 75,772 | 2,489,868 | |||||||||
The PNC Financial Services Group, Inc. | 14,482 | 2,287,287 | |||||||||
Unum Group | 109,241 | 4,482,158 | |||||||||
30,889,505 | |||||||||||
Health Care (7.8%): | |||||||||||
Amgen, Inc. | 22,540 | 5,919,906 | |||||||||
CVS Health Corp. | 48,615 | 4,530,432 | |||||||||
Eli Lilly & Co. | 21,549 | 7,883,486 | |||||||||
IDEXX Laboratories, Inc. (c) | 12,031 | 4,908,167 | |||||||||
Johnson & Johnson | 41,051 | 7,251,659 | |||||||||
UnitedHealth Group, Inc. | 5,042 | 2,673,167 | |||||||||
33,166,817 | |||||||||||
Industrials (2.2%): | |||||||||||
Delta Air Lines, Inc. (c) | 106,104 | 3,486,577 | |||||||||
Honeywell International, Inc. | 27,719 | 5,940,182 | |||||||||
9,426,759 | |||||||||||
Information Technology (15.3%): | |||||||||||
Apple, Inc. | 142,549 | 18,521,392 | |||||||||
Cisco Systems, Inc. | 120,340 | 5,732,998 | |||||||||
Fortinet, Inc. (c) | 82,996 | 4,057,674 | |||||||||
Mastercard, Inc., Class A | 20,267 | 7,047,444 | |||||||||
Microsoft Corp. | 70,975 | 17,021,224 | |||||||||
NVIDIA Corp. | 43,858 | 6,409,408 | |||||||||
Texas Instruments, Inc. | 34,988 | 5,780,717 | |||||||||
64,570,857 | |||||||||||
Materials (0.8%): | |||||||||||
Alcoa Corp. | 72,497 | 3,296,439 | |||||||||
Real Estate (1.4%): | |||||||||||
Prologis, Inc. | 51,018 | 5,751,259 | |||||||||
Utilities (1.9%): | |||||||||||
Constellation Energy Corp. | 53,447 | 4,607,666 | |||||||||
MGE Energy, Inc. | 46,719 | 3,289,017 | |||||||||
7,896,683 | |||||||||||
230,352,385 | |||||||||||
Total Common Stocks (Cost $377,516,307) | 404,963,727 | ||||||||||
See notes to financial statements.
25
| Victory Portfolios Victory RS Global Fund | Schedules of Portfolio Investments — continued December 31, 2022 | ||||||
Security Description | Shares | Value | |||||||||
Exchange-Traded Funds (1.2%) | |||||||||||
United States (1.2%): | |||||||||||
iShares MSCI ACWI ETF | 58,925 | $ | 5,001,554 | ||||||||
Total Exchange-Traded Funds (Cost $4,899,454) | 5,001,554 | ||||||||||
Collateral for Securities Loaned (0.6%)^ | |||||||||||
United States (0.6%): | |||||||||||
| Goldman Sachs Financial Square Government Fund, Institutional Shares, 4.14% (d) | 645,103 | 645,103 | |||||||||
HSBC U.S. Government Money Market Fund, Institutional Shares, 4.13% (d) | 645,103 | 645,103 | |||||||||
Invesco Government & Agency Portfolio, Institutional Shares, 4.22% (d) | 645,103 | 645,103 | |||||||||
| Morgan Stanley Institutional Liquidity Government Portfolio, Institutional Shares, 4.08% (d) | 645,103 | 645,103 | |||||||||
Total Collateral for Securities Loaned (Cost $2,580,412) | 2,580,412 | ||||||||||
Total Investments (Cost $384,996,173) — 97.5% | 412,545,693 | ||||||||||
Other assets in excess of liabilities — 2.5% | 10,391,108 | ||||||||||
NET ASSETS — 100.00% | $ | 422,936,801 | |||||||||
^ Purchased with cash collateral from securities on loan.
(a) Rule 144A security or other security that is restricted as to resale to institutional investors. The Fund's Adviser has deemed this security to be liquid (unless otherwise noted as illiquid) based upon procedures approved by the Board of Trustees. As of December 31, 2022, the fair value of these securities was $2,891,048 and amounted to 0.7% of net assets.
(b) All or a portion of this security is on loan.
(c) Non-income producing security.
(d) Rate disclosed is the daily yield on December 31, 2022.
ETF — Exchange-Traded Fund
PLC — Public Limited Company
See notes to financial statements.
26
| Victory Portfolios Victory Sophus Emerging Markets Fund | Schedules of Portfolio Investments December 31, 2022 | ||||||
Security Description | Shares | Value | |||||||||
Common Stocks (99.0%) | |||||||||||
Brazil (5.5%): | |||||||||||
Consumer Discretionary (1.1%): | |||||||||||
Grupo SBF SA | 426,655 | $ | 1,033,197 | ||||||||
Lojas Renner SA | 381,200 | 1,477,624 | |||||||||
Vibra Energia SA | 633,285 | 1,856,990 | |||||||||
4,367,811 | |||||||||||
Consumer Staples (1.0%): | |||||||||||
Sao Martinho SA | 368,100 | 1,849,601 | |||||||||
Sendas Distribuidora SA | 594,073 | 2,195,547 | |||||||||
4,045,148 | |||||||||||
Energy (0.6%): | |||||||||||
Petroleo Brasileiro SA, ADR | 212,372 | 2,261,762 | |||||||||
Financials (1.1%): | |||||||||||
Itau Unibanco Holding SA, ADR | 911,645 | 4,293,848 | |||||||||
Health Care (0.6%): | |||||||||||
Hypera SA | 305,600 | 2,620,723 | |||||||||
Industrials (0.2%): | |||||||||||
SIMPAR SA | 703,764 | 901,517 | |||||||||
Materials (0.5%): | |||||||||||
Gerdau SA, Preference Shares | 337,300 | 1,854,252 | |||||||||
Real Estate (0.4%): | |||||||||||
Multiplan Empreendimentos Imobiliarios SA | 352,000 | 1,458,649 | |||||||||
21,803,710 | |||||||||||
Canada (0.4%): | |||||||||||
Energy (0.4%): | |||||||||||
Parex Resources, Inc. | 120,413 | 1,792,231 | |||||||||
Chile (0.0%): (a) | |||||||||||
Financials (0.0%): | |||||||||||
Banco de Credito e Inversiones SA | 1 | 29 | |||||||||
China (32.2%): | |||||||||||
Communication Services (4.6%): | |||||||||||
Baidu, Inc., Class A (b) | 245,896 | 3,506,861 | |||||||||
Tencent Holdings Ltd. | 355,715 | 15,083,315 | |||||||||
18,590,176 | |||||||||||
Consumer Discretionary (11.3%): | |||||||||||
Alibaba Group Holding Ltd. (b) | 1,143,972 | 12,553,430 | |||||||||
BYD Co. Ltd., Class H | 162,500 | 3,987,005 | |||||||||
Fuyao Glass Industry Group Co. Ltd., Class A | 418,600 | 2,107,907 | |||||||||
Hisense Home Appliances Group Co. Ltd., Class A | 1,102,800 | 2,085,360 | |||||||||
JD.com, Inc., Class A | 326,226 | 9,107,659 | |||||||||
Meituan, Class B (b) (c) | 323,700 | 7,172,257 | |||||||||
Pinduoduo, Inc., ADR (b) | 76,034 | 6,200,573 | |||||||||
See notes to financial statements.
27
| Victory Portfolios Victory Sophus Emerging Markets Fund | Schedules of Portfolio Investments — continued December 31, 2022 | ||||||
Security Description | Shares | Value | |||||||||
Yadea Group Holdings Ltd. (c) | 1,120,000 | $ | 1,864,885 | ||||||||
45,079,076 | |||||||||||
Consumer Staples (2.5%): | |||||||||||
Chacha Food Co. Ltd., Class A | 413,078 | 2,964,854 | |||||||||
Chenguang Biotech Group Co. Ltd., Class A | 889,000 | 2,262,528 | |||||||||
Inner Mongolia Yili Industrial Group Co. Ltd., Class A | 518,700 | 2,306,637 | |||||||||
Tongwei Co. Ltd., Class A | 420,000 | 2,324,707 | |||||||||
9,858,726 | |||||||||||
Energy (1.2%): | |||||||||||
PetroChina Co. Ltd., Class H | 10,434,000 | 4,766,459 | |||||||||
Financials (3.2%): | |||||||||||
China Merchants Bank Co. Ltd., Class H | 608,500 | 3,367,546 | |||||||||
CITIC Securities Co. Ltd., Class A | 672,200 | 1,920,891 | |||||||||
Industrial & Commercial Bank of China Ltd., Class H | 9,772,000 | 5,012,247 | |||||||||
PICC Property & Casualty Co. Ltd., Class H | 2,822,000 | 2,668,343 | |||||||||
12,969,027 | |||||||||||
Health Care (2.9%): | |||||||||||
CSPC Pharmaceutical Group Ltd. | 3,452,000 | 3,593,994 | |||||||||
Hygeia Healthcare Holdings Co. Ltd. (b) (c) | 418,800 | 2,988,209 | |||||||||
Pharmaron Beijing Co. Ltd., Class H (c) | 271,050 | 1,862,583 | |||||||||
Shenzhen Mindray Bio-Medical Electronics Co. Ltd., Class A | 67,300 | 3,052,125 | |||||||||
11,496,911 | |||||||||||
Industrials (1.1%): | |||||||||||
China Railway Group Ltd., Class H | 4,523,000 | 2,375,095 | |||||||||
Xinte Energy Co. Ltd., Class H | 1,140,400 | 2,101,907 | |||||||||
4,477,002 | |||||||||||
Information Technology (1.8%): | |||||||||||
Glodon Co. Ltd., Class A | 323,000 | 2,779,982 | |||||||||
Luxshare Precision Industry Co. Ltd., Class A | 590,000 | 2,688,410 | |||||||||
WUS Printed Circuit Kunshan Co. Ltd., Class A | 1,025,050 | 1,752,835 | |||||||||
7,221,227 | |||||||||||
Materials (1.9%): | |||||||||||
Shandong Nanshan Aluminum Co. Ltd., Class A | 4,842,000 | 2,270,847 | |||||||||
Tianqi Lithium Corp., Class A (b) | 175,100 | 1,985,976 | |||||||||
Wanhua Chemical Group Co. Ltd., Class A | 255,400 | 3,395,945 | |||||||||
7,652,768 | |||||||||||
Real Estate (1.1%): | |||||||||||
Longfor Group Holdings Ltd. (c) | 867,500 | 2,669,598 | |||||||||
Seazen Group Ltd. (b) | 4,412,000 | 1,614,905 | |||||||||
4,284,503 | |||||||||||
Utilities (0.6%): | |||||||||||
China Longyuan Power Group Corp. Ltd., Class H | 1,972,000 | 2,397,280 | |||||||||
128,793,155 | |||||||||||
See notes to financial statements.
28
| Victory Portfolios Victory Sophus Emerging Markets Fund | Schedules of Portfolio Investments — continued December 31, 2022 | ||||||
Security Description | Shares | Value | |||||||||
Greece (1.7%): | |||||||||||
Financials (0.7%): | |||||||||||
National Bank of Greece SA (b) | 746,353 | $ | 2,992,521 | ||||||||
Industrials (1.0%): | |||||||||||
Mytilineos SA | 176,657 | 3,837,443 | |||||||||
6,829,964 | |||||||||||
Hong Kong (1.6%): | |||||||||||
Consumer Discretionary (0.7%): | |||||||||||
Bosideng International Holdings Ltd. | 5,542,000 | 2,626,346 | |||||||||
Real Estate (0.9%): | |||||||||||
China Resources Land Ltd. | 796,000 | 3,621,506 | |||||||||
6,247,852 | |||||||||||
India (14.3%): | |||||||||||
Consumer Discretionary (1.9%): | |||||||||||
Mahindra & Mahindra Ltd. | 377,306 | 5,680,587 | |||||||||
Raymond Ltd. | 98,715 | 1,752,000 | |||||||||
7,432,587 | |||||||||||
Consumer Staples (1.4%): | |||||||||||
Dabur India Ltd. | 383,359 | 2,597,463 | |||||||||
Varun Beverages Ltd. | 200,726 | 3,203,533 | |||||||||
5,800,996 | |||||||||||
Financials (5.4%): | |||||||||||
Axis Bank Ltd. | 281,628 | 3,169,533 | |||||||||
Cholamandalam Investment & Finance Co. Ltd. | 443,165 | 3,865,178 | |||||||||
ICICI Bank Ltd., ADR | 524,614 | 11,483,800 | |||||||||
Manappuram Finance Ltd. | 2,231,759 | 3,130,227 | |||||||||
21,648,738 | |||||||||||
Health Care (1.0%): | |||||||||||
Apollo Hospitals Enterprise Ltd. | 71,977 | 3,889,738 | |||||||||
Industrials (1.8%): | |||||||||||
Larsen & Toubro Ltd. | 278,565 | 7,001,968 | |||||||||
Information Technology (1.6%): | |||||||||||
Infosys Ltd., ADR | 269,959 | 4,861,962 | |||||||||
WNS Holdings Ltd., ADR (b) | 20,092 | 1,607,159 | |||||||||
6,469,121 | |||||||||||
Materials (0.5%): | |||||||||||
JK Paper Ltd. | 439,905 | 2,170,050 | |||||||||
Utilities (0.7%): | |||||||||||
Power Grid Corp. of India Ltd. | 1,100,902 | 2,838,524 | |||||||||
57,251,722 | |||||||||||
See notes to financial statements.
29
| Victory Portfolios Victory Sophus Emerging Markets Fund | Schedules of Portfolio Investments — continued December 31, 2022 | ||||||
Security Description | Shares | Value | |||||||||
Indonesia (1.7%): | |||||||||||
Energy (0.6%): | |||||||||||
PT Adaro Energy Indonesia Tbk | 9,764,700 | $ | 2,419,230 | ||||||||
Financials (1.1%): | |||||||||||
PT Bank Mandiri Persero Tbk | 7,155,300 | 4,563,630 | |||||||||
6,982,860 | |||||||||||
Korea, Republic Of (14.2%): | |||||||||||
Communication Services (1.9%): | |||||||||||
JYP Entertainment Corp. | 85,788 | 4,609,002 | |||||||||
KT Corp. | 115,783 | 3,099,211 | |||||||||
7,708,213 | |||||||||||
Consumer Discretionary (2.2%): | |||||||||||
Hyundai Mobis Co. Ltd. | 15,029 | 2,384,064 | |||||||||
Kia Corp. | 55,596 | 2,616,027 | |||||||||
Shinsegae, Inc. | 20,193 | 3,530,583 | |||||||||
8,530,674 | |||||||||||
Consumer Staples (0.3%): | |||||||||||
BGF retail Co. Ltd. | 7,795 | 1,304,608 | |||||||||
Financials (2.6%): | |||||||||||
Hana Financial Group, Inc. | 124,835 | 4,157,224 | |||||||||
Samsung Securities Co. Ltd. | 105,817 | 2,641,192 | |||||||||
Woori Financial Group, Inc. | 394,046 | 3,600,025 | |||||||||
10,398,441 | |||||||||||
Health Care (0.9%): | |||||||||||
Samsung Biologics Co. Ltd. (b) (c) | 5,205 | 3,384,638 | |||||||||
Industrials (0.5%): | |||||||||||
CJ Corp. | 30,101 | 2,010,892 | |||||||||
Information Technology (5.8%): | |||||||||||
Innox Advanced Materials Co. Ltd. | 79,449 | 1,913,867 | |||||||||
Samsung Electro-Mechanics Co. Ltd. | 26,137 | 2,714,615 | |||||||||
Samsung Electronics Co. Ltd. | 329,421 | 14,460,500 | |||||||||
SK Hynix, Inc. | 70,271 | 4,192,984 | |||||||||
23,281,966 | |||||||||||
56,619,432 | |||||||||||
Malaysia (1.6%): | |||||||||||
Financials (1.0%): | |||||||||||
Public Bank Bhd | 4,023,400 | 3,949,642 | |||||||||
Materials (0.6%): | |||||||||||
Petronas Chemicals Group Bhd | 1,218,100 | 2,382,251 | |||||||||
6,331,893 | |||||||||||
Mexico (3.3%): | |||||||||||
Consumer Discretionary (0.5%): | |||||||||||
Alsea SAB de CV (b) | 996,448 | 1,885,273 | |||||||||
See notes to financial statements.
30
| Victory Portfolios Victory Sophus Emerging Markets Fund | Schedules of Portfolio Investments — continued December 31, 2022 | ||||||
Security Description | Shares | Value | |||||||||
Consumer Staples (0.8%): | |||||||||||
Fomento Economico Mexicano SAB de CV, ADR | 41,921 | $ | 3,274,869 | ||||||||
Financials (1.4%): | |||||||||||
Grupo Financiero Banorte SAB de CV, Class O | 753,264 | 5,409,538 | |||||||||
Industrials (0.6%): | |||||||||||
Grupo Aeroportuario del Pacifico SAB de CV, Class B | 179,296 | 2,569,049 | |||||||||
13,138,729 | |||||||||||
Peru (1.0%): | |||||||||||
Financials (1.0%): | |||||||||||
Credicorp Ltd. | 28,449 | 3,859,391 | |||||||||
Qatar (0.6%): | |||||||||||
Industrials (0.6%): | |||||||||||
Industries Qatar QSC | 670,668 | 2,367,453 | |||||||||
Russian Federation (0.0%): (a) | |||||||||||
Consumer Staples (0.0%): | |||||||||||
Magnit PJSC (b) (d) (e) (f) (g) | 41,301 | 509 | |||||||||
Energy (0.0%): | |||||||||||
Gazprom PJSC (b) (d) (e) (f) (g) | 1,511,910 | 49,632 | |||||||||
Rosneft Oil Co. PJSC, GDR (b) (d) (e) (f) (g) | 677,591 | 31,752 | |||||||||
81,384 | |||||||||||
Financials (0.0%): (a) | |||||||||||
Sberbank of Russia PJSC, ADR (b) (d) (e) (f) (g) | 446,943 | 2,990 | |||||||||
84,883 | |||||||||||
Saudi Arabia (2.7%): | |||||||||||
Financials (1.1%): | |||||||||||
The Saudi National Bank | 335,170 | 4,512,434 | |||||||||
Materials (1.6%): | |||||||||||
SABIC Agri-Nutrients Co. | 107,255 | 4,187,608 | |||||||||
Saudi Arabian Mining Co. (b) | 133,015 | 2,284,212 | |||||||||
6,471,820 | |||||||||||
10,984,254 | |||||||||||
South Africa (2.6%): | |||||||||||
Communication Services (1.0%): | |||||||||||
MTN Group Ltd. | 530,702 | 3,966,143 | |||||||||
Financials (1.1%): | |||||||||||
Absa Group Ltd. | 372,878 | 4,236,891 | |||||||||
Industrials (0.5%): | |||||||||||
The Bidvest Group Ltd. | 161,826 | 2,032,485 | |||||||||
10,235,519 | |||||||||||
Taiwan (12.3%): | |||||||||||
Consumer Discretionary (0.8%): | |||||||||||
Fulgent Sun International Holding Co. Ltd. | 599,000 | 2,952,987 | |||||||||
See notes to financial statements.
31
| Victory Portfolios Victory Sophus Emerging Markets Fund | Schedules of Portfolio Investments — continued December 31, 2022 | ||||||
Security Description | Shares | Value | |||||||||
Health Care (0.9%): | |||||||||||
Lotus Pharmaceutical Co. Ltd. | 254,000 | $ | 2,026,935 | ||||||||
Universal Vision Biotechnology Co. Ltd. | 156,350 | 1,517,812 | |||||||||
3,544,747 | |||||||||||
Information Technology (10.2%): | |||||||||||
Gold Circuit Electronics Ltd. | 1,142,100 | 3,209,266 | |||||||||
Hon Hai Precision Industry Co. Ltd. | 1,230,000 | 3,987,170 | |||||||||
Taiwan Semiconductor Manufacturing Co. Ltd. | 1,942,998 | 28,222,274 | |||||||||
Unimicron Technology Corp. | 340,000 | 1,320,093 | |||||||||
Wiwynn Corp. | 162,000 | 4,190,676 | |||||||||
40,929,479 | |||||||||||
Materials (0.4%): | |||||||||||
Formosa Plastics Corp. | 573,000 | 1,616,055 | |||||||||
49,043,268 | |||||||||||
Thailand (1.3%): | |||||||||||
Materials (0.7%): | |||||||||||
Indorama Ventures PCL | 2,535,800 | 2,977,924 | |||||||||
Real Estate (0.6%): | |||||||||||
AP Thailand PCL | 7,070,700 | 2,366,780 | |||||||||
5,344,704 | |||||||||||
United Kingdom (1.5%): | |||||||||||
Materials (1.5%): | |||||||||||
Anglo American PLC | 87,075 | 3,409,122 | |||||||||
Mondi PLC | 142,705 | 2,412,758 | |||||||||
5,821,880 | |||||||||||
United States (0.5%): | |||||||||||
Consumer Discretionary (0.5%): | |||||||||||
Samsonite International SA (b) (c) | 817,800 | 2,147,427 | |||||||||
Total Common Stocks (Cost $427,696,354) | 395,680,356 | ||||||||||
Total Investments (Cost $427,696,354) — 99.0% | 395,680,356 | ||||||||||
Other assets in excess of liabilities — 1.0% | 4,182,135 | ||||||||||
NET ASSETS — 100.00% | $ | 399,862,491 | |||||||||
(a) Amount represents less than 0.05% of net assets.
(b) Non-income producing security.
(c) Rule 144A security or other security that is restricted as to resale to institutional investors. The Fund's Adviser has deemed this security to be liquid (unless otherwise noted as illiquid) based upon procedures approved by the Board of Trustees. As of December 31, 2022, the fair value of these securities was $22,089,597 and amounted to 5.5% of net assets.
(d) The Fund's Adviser has deemed this security to be illiquid based upon procedures approved by the Board of Trustees. As of December 31, 2022, illiquid securities were less than 0.05% of net assets.
(e) Security was fair valued based upon procedures approved by the Board of Trustees and represents less than 0.05% of net assets as of December 31, 2022. This security is classified as Level 3 within the fair value hierarchy. (See Note 2 in the Notes to Financial Statements)
See notes to financial statements.
32
| Victory Portfolios Victory Sophus Emerging Markets Fund | Schedules of Portfolio Investments — continued December 31, 2022 | ||||||
(f) Restricted security due to trading restrictions. Russian sanctioned entity by the United States Government.
(g) The following table details the earliest acquisition date and cost of the Fund's Russian sanctioned restricted securities at December 31, 2022.
Security Name | Acquisition Date | Cost | |||||||||
Magnit PJSC | 9/16/2021 | $ | 3,251,080 | ||||||||
Gazprom PJSC | 7/28/2021 | 5,922,464 | |||||||||
Rosneft Oil Co. PJSC, GDR | 3/6/2020 | 4,383,338 | |||||||||
Sberbank of Russia PJSC, ADR | 11/11/2020 | 6,053,328 | |||||||||
ADR — American Depositary Receipt
GDR — Global Depositary Receipt
PCL — Public Company Limited
PLC — Public Limited Company
See notes to financial statements.
33
Victory Portfolios | Statements of Assets and Liabilities December 31, 2022 | ||||||
| Victory RS International Fund | Victory RS Global Fund | Victory Sophus Emerging Markets Fund | |||||||||||||
Assets: | |||||||||||||||
| Investments, at value (Cost $321,400,415, $384,996,173 and $427,696,354) | $ | 333,406,382 | (a) | $ | 412,545,693 | (b) | $ | 395,680,356 | |||||||
| Foreign currency, at value (Cost $228,486, $569,363 and $55,059) | 231,715 | 569,575 | 55,061 | ||||||||||||
Cash | 2,709,747 | 10,725,198 | 4,357,986 | ||||||||||||
Receivables: | |||||||||||||||
Interest and dividends | 378,046 | 457,538 | 1,940,046 | ||||||||||||
Capital shares issued | 86,888 | 2,781,832 | 398,086 | ||||||||||||
Reclaims | 1,349,174 | 264,840 | 4,309 | ||||||||||||
From Adviser | 59,165 | 168,619 | 215,456 | ||||||||||||
Prepaid expenses | 27,491 | 18,246 | 25,211 | ||||||||||||
Total Assets | 338,248,608 | 427,531,541 | 402,676,511 | ||||||||||||
Liabilities: | |||||||||||||||
Payables: | |||||||||||||||
Collateral received on loaned securities | 2,014,292 | 2,580,412 | — | ||||||||||||
Investments purchased | — | 1,379,800 | — | ||||||||||||
Capital shares redeemed | 172,653 | 268,297 | 1,563,943 | ||||||||||||
Accrued foreign capital gains taxes | — | — | 674,970 | ||||||||||||
Accrued expenses and other payables: | |||||||||||||||
Investment advisory fees | 232,835 | 212,975 | 346,320 | ||||||||||||
Administration fees | 15,570 | 19,056 | 18,484 | ||||||||||||
Custodian fees | 11,050 | 12,481 | 80,023 | ||||||||||||
Transfer agent fees | 22,003 | 67,817 | 60,484 | ||||||||||||
Compliance fees | 259 | 313 | 309 | ||||||||||||
Trustees' fees | 114 | 113 | 116 | ||||||||||||
| 12b-1 fees | 3,420 | 11,305 | 6,730 | ||||||||||||
Other accrued expenses | 40,437 | 42,171 | 62,641 | ||||||||||||
Total Liabilities | 2,512,633 | 4,594,740 | 2,814,020 | ||||||||||||
Net Assets: | |||||||||||||||
Capital | 339,199,555 | 418,081,863 | 475,800,747 | ||||||||||||
Total accumulated earnings/(loss) | (3,463,580 | ) | 4,854,938 | (75,938,256 | ) | ||||||||||
Net Assets | $ | 335,735,975 | $ | 422,936,801 | $ | 399,862,491 | |||||||||
Net Assets | |||||||||||||||
Class A | $ | 20,077,459 | $ | 78,372,664 | $ | 39,819,357 | |||||||||
Class C | 1,967,265 | 3,871,563 | 752,257 | ||||||||||||
Class R | 1,652,998 | 5,129,513 | 9,063,522 | ||||||||||||
Class R6 | 245,238,814 | 138,664,980 | 159,001,125 | ||||||||||||
Class Y | 66,799,439 | 196,898,081 | 191,226,230 | ||||||||||||
Total | $ | 335,735,975 | $ | 422,936,801 | $ | 399,862,491 | |||||||||
(continues on next page)
See notes to financial statements.
34
Victory Portfolios | Statements of Assets and Liabilities December 31, 2022 | ||||||
(continued)
| Victory RS International Fund | Victory RS Global Fund | Victory Sophus Emerging Markets Fund | |||||||||||||
| Shares (unlimited number of shares authorized with a par value of $0.001 per share): | |||||||||||||||
Class A | 1,649,802 | 4,776,209 | 2,328,860 | ||||||||||||
Class C | 231,499 | 244,576 | 60,233 | ||||||||||||
Class R | 146,335 | 248,085 | 568,958 | ||||||||||||
Class R6 | 24,757,022 | 11,494,537 | 9,140,515 | ||||||||||||
Class Y | 5,575,051 | 12,096,128 | 11,117,547 | ||||||||||||
Total | 32,359,709 | 28,859,535 | 23,216,113 | ||||||||||||
| Net asset value, offering (except Class A) and redemption price per share: | |||||||||||||||
Class A | $ | 12.17 | $ | 16.41 | $ | 17.10 | |||||||||
Class C (c) | 8.50 | 15.83 | 12.49 | ||||||||||||
Class R | 11.30 | 20.68 | 15.93 | ||||||||||||
Class R6 | 9.91 | 12.06 | 17.40 | ||||||||||||
Class Y | 11.98 | 16.28 | 17.20 | ||||||||||||
Maximum Sales Charge — Class A | 5.75 | % | 5.75 | % | 5.75 | % | |||||||||
| Maximum offering price (100%/(100%-maximum sales charge) of net asset value adjusted to the nearest cent) per share — Class A | $ | 12.91 | $ | 17.41 | $ | 18.14 | |||||||||
(a) Includes $1,937,422 of securities on loan.
(b) Includes $2,481,935 of securities on loan.
(c) Redemption price per share varies by the length of time shares are held.
See notes to financial statements.
35
Victory Portfolios | Statements of Operations For the Year Ended December 31, 2022 | ||||||
| Victory RS International Fund | Victory RS Global Fund | Victory Sophus Emerging Markets Fund | |||||||||||||
Investment Income: | |||||||||||||||
Dividends | $ | 13,551,602 | $ | 9,010,137 | $ | 16,447,293 | |||||||||
Non-cash dividends | 979,866 | — | 658,377 | ||||||||||||
Interest | 29,390 | 58,676 | 15,783 | ||||||||||||
Securities lending (net of fees) | 76,196 | 20,228 | 10,034 | ||||||||||||
Foreign tax withholding | (1,625,493 | ) | (710,221 | ) | (1,743,743 | ) | |||||||||
Total Income | 13,011,561 | 8,378,820 | 15,387,744 | ||||||||||||
Expenses: | |||||||||||||||
Investment advisory fees | 2,849,766 | 2,222,080 | 4,447,354 | ||||||||||||
Administration fees | 193,896 | 201,748 | 242,087 | ||||||||||||
Sub-Administration fees | 17,000 | 17,000 | 17,000 | ||||||||||||
| 12b-1 fees — Class A | 52,293 | 168,029 | 109,782 | ||||||||||||
| 12b-1 fees — Class C | 11,760 | 46,241 | 11,039 | ||||||||||||
| 12b-1 fees — Class R | 8,188 | 25,801 | 49,796 | ||||||||||||
Custodian fees | 51,982 | 54,025 | 343,578 | ||||||||||||
Transfer agent fees — Class A | 39,405 | 114,434 | 73,715 | ||||||||||||
Transfer agent fees — Class C | 1,344 | 6,509 | 2,063 | ||||||||||||
Transfer agent fees — Class R | 3,214 | 6,755 | 15,430 | ||||||||||||
Transfer agent fees — Class R6 | 753 | 5,127 | 8,124 | ||||||||||||
Transfer agent fees — Class Y | 87,519 | 208,009 | 256,309 | ||||||||||||
Trustees' fees | 23,279 | 22,028 | 28,615 | ||||||||||||
Compliance fees | 2,884 | 2,938 | 3,610 | ||||||||||||
Legal and audit fees | 33,572 | 43,550 | 45,832 | ||||||||||||
State registration and filing fees | 75,408 | 100,541 | 76,820 | ||||||||||||
Interfund lending | 392 | — | 845 | ||||||||||||
Other expenses | 64,856 | 62,491 | 126,654 | ||||||||||||
Total Expenses | 3,517,511 | 3,307,306 | 5,858,653 | ||||||||||||
Expenses waived/reimbursed by Adviser | (438,795 | ) | (899,922 | ) | (1,401,240 | ) | |||||||||
Net Expenses | 3,078,716 | 2,407,384 | 4,457,413 | ||||||||||||
Net Investment Income (Loss) | 9,932,845 | 5,971,436 | 10,930,331 | ||||||||||||
| Realized/Unrealized Gains (Losses) from Investments: | |||||||||||||||
| Net realized gains (losses) from investment securities and foreign currency transactions | (13,548,228 | ) | (19,307,822 | ) | (39,488,935 | ) | |||||||||
Foreign tax refunds on realized gains | — | 156 | 20,544 | ||||||||||||
| Net change in unrealized appreciation/ depreciation on investment securities and foreign currency translations | (63,990,594 | ) | (64,195,136 | ) | (88,124,976 | ) | |||||||||
| Net change in accrued foreign taxes on unrealized gains | — | — | (41,005 | ) | |||||||||||
| Net realized/unrealized gains (losses) on investments | (77,538,822 | ) | (83,502,802 | ) | (127,634,372 | ) | |||||||||
Change in net assets resulting from operations | $ | (67,605,977 | ) | $ | (77,531,366 | ) | $ | (116,704,041 | ) | ||||||
See notes to financial statements.
36
Victory Portfolios | Statements of Changes in Net Assets | ||||||
| Victory RS International Fund | Victory RS Global Fund | Victory Sophus Emerging Markets Fund | |||||||||||||||||||||||||
| Year Ended December 31, 2022 | Year Ended December 31, 2021 | Year Ended December 31, 2022 | Year Ended December 31, 2021 | Year Ended December 31, 2022 | Year Ended December 31, 2021 | ||||||||||||||||||||||
| From Investment Activities: | |||||||||||||||||||||||||||
Operations: | |||||||||||||||||||||||||||
| Net Investment Income (Loss) | $ | 9,932,845 | $ | 8,400,111 | $ | 5,971,436 | $ | 3,496,440 | $ | 10,930,331 | $ | 5,449,839 | |||||||||||||||
| Net realized gains (losses) | (13,548,228 | ) | 18,558,540 | (19,307,666 | ) | 8,197,474 | (39,468,391 | ) | 41,475,953 | ||||||||||||||||||
| Net change in unrealized appreciation/ depreciation | (63,990,594 | ) | 27,076,805 | (64,195,136 | ) | 43,710,135 | (88,165,981 | ) | (72,829,809 | ) | |||||||||||||||||
| Change in net assets resulting from operations | (67,605,977 | ) | 54,035,456 | (77,531,366 | ) | 55,404,049 | (116,704,041 | ) | (25,904,017 | ) | |||||||||||||||||
Distributions to Shareholders: | |||||||||||||||||||||||||||
Class A | (401,148 | ) | (1,039,350 | ) | (813,457 | ) | (2,189,789 | ) | (1,172,326 | ) | (2,138,975 | ) | |||||||||||||||
Class C | (51,514 | ) | (57,816 | ) | (7,807 | ) | (108,980 | ) | (21,170 | ) | (71,226 | ) | |||||||||||||||
Class R | (32,085 | ) | (80,118 | ) | (27,664 | ) | (124,953 | ) | (259,268 | ) | (470,900 | ) | |||||||||||||||
Class R6 | (6,839,367 | ) | (15,469,430 | ) | (2,306,054 | ) | (4,331,090 | ) | (5,253,274 | ) | (7,458,475 | ) | |||||||||||||||
Class Y | (1,538,125 | ) | (4,887,821 | ) | (2,418,034 | ) | (5,612,312 | ) | (6,241,858 | ) | (11,195,767 | ) | |||||||||||||||
From return of capital: | |||||||||||||||||||||||||||
Class A | — | — | (142 | ) | — | — | (26,869 | ) | |||||||||||||||||||
Class C | — | — | (1 | ) | — | — | (311 | ) | |||||||||||||||||||
Class R | — | — | (5 | ) | — | — | (5,030 | ) | |||||||||||||||||||
Class R6 | — | — | (401 | ) | — | — | (115,990 | ) | |||||||||||||||||||
Class Y | — | — | (421 | ) | — | — | (170,813 | ) | |||||||||||||||||||
| Change in net assets resulting from distributions to shareholders | (8,862,239 | ) | (21,534,535 | ) | (5,573,986 | ) | (12,367,124 | ) | (12,947,896 | ) | (21,654,356 | ) | |||||||||||||||
| Change in net assets resulting from capital transactions | (25,178,437 | ) | 23,244,315 | 155,146,559 | 87,147,589 | 29,395,837 | 74,677,705 | ||||||||||||||||||||
Change in net assets | (101,646,653 | ) | 55,745,236 | 72,041,207 | 130,184,514 | (100,256,100 | ) | 27,119,332 | |||||||||||||||||||
Net Assets: | |||||||||||||||||||||||||||
Beginning of period | 437,382,628 | 381,637,392 | 350,895,594 | 220,711,080 | 500,118,591 | 472,999,259 | |||||||||||||||||||||
End of period | $ | 335,735,975 | $ | 437,382,628 | $ | 422,936,801 | $ | 350,895,594 | $ | 399,862,491 | $ | 500,118,591 | |||||||||||||||
(continues on next page)
See notes to financial statements.
37
Victory Portfolios | Statements of Changes in Net Assets | ||||||
(continued)
| Victory RS International Fund | Victory RS Global Fund | Victory Sophus Emerging Markets Fund | |||||||||||||||||||||||||
| Year Ended December 31, 2022 | Year Ended December 31, 2021 | Year Ended December 31, 2022 | Year Ended December 31, 2021 | Year Ended December 31, 2022 | Year Ended December 31, 2021 | ||||||||||||||||||||||
Capital Transactions: | |||||||||||||||||||||||||||
Class A | |||||||||||||||||||||||||||
| Proceeds from shares issued | $ | 1,690,027 | $ | 3,782,204 | $ | 39,389,148 | $ | 30,273,412 | $ | 8,314,583 | $ | 12,169,687 | |||||||||||||||
| Distributions reinvested | 395,811 | 1,026,274 | 813,527 | 2,189,490 | 1,155,447 | 2,131,142 | |||||||||||||||||||||
| Cost of shares redeemed | (3,119,573 | ) | (5,581,683 | ) | (18,779,808 | ) | (19,928,713 | ) | (11,156,508 | ) | (15,751,498 | ) | |||||||||||||||
Total Class A | $ | (1,033,735 | ) | $ | (773,205 | ) | $ | 21,422,867 | $ | 12,534,189 | $ | (1,686,478 | ) | $ | (1,450,669 | ) | |||||||||||
Class C | |||||||||||||||||||||||||||
| Proceeds from shares issued | $ | 1,117,282 | $ | — | $ | 1,963,521 | $ | 681,553 | $ | 23,894 | $ | 72,763 | |||||||||||||||
| Distributions reinvested | 51,514 | 57,816 | 7,808 | 108,980 | 21,170 | 71,469 | |||||||||||||||||||||
| Cost of shares redeemed | (101,535 | ) | (237,775 | ) | (1,247,720 | ) | (669,835 | ) | (637,096 | ) | (1,633,676 | ) | |||||||||||||||
Total Class C | $ | 1,067,261 | $ | (179,959 | ) | $ | 723,609 | $ | 120,698 | $ | (592,032 | ) | $ | (1,489,444 | ) | ||||||||||||
Class R | |||||||||||||||||||||||||||
| Proceeds from shares issued | $ | 163,571 | $ | 209,980 | $ | 1,367,975 | $ | 420,305 | $ | 1,311,260 | $ | 1,691,004 | |||||||||||||||
| Distributions reinvested | 32,085 | 80,117 | 27,669 | 124,953 | 258,905 | 475,168 | |||||||||||||||||||||
| Cost of shares redeemed | (161,472 | ) | (518,332 | ) | (559,408 | ) | (385,111 | ) | (1,440,944 | ) | (2,910,119 | ) | |||||||||||||||
Total Class R | $ | 34,184 | $ | (228,235 | ) | $ | 836,236 | $ | 160,147 | $ | 129,221 | $ | (743,947 | ) | |||||||||||||
Class R6 | |||||||||||||||||||||||||||
| Proceeds from shares issued | $ | 21,656,628 | $ | 22,800,521 | $ | 66,746,148 | $ | 43,038,792 | $ | 53,778,877 | $ | 94,833,979 | |||||||||||||||
| Distributions reinvested | 6,786,564 | 15,408,131 | 2,305,114 | 4,327,185 | 5,020,928 | 7,283,778 | |||||||||||||||||||||
| Cost of shares redeemed | (27,352,642 | ) | (13,779,137 | ) | (6,266,606 | ) | (4,663,447 | ) | (24,922,793 | ) | (24,889,733 | ) | |||||||||||||||
Total Class R6 | $ | 1,090,550 | $ | 24,429,515 | $ | 62,784,656 | $ | 42,702,530 | $ | 33,877,012 | $ | 77,228,024 | |||||||||||||||
Class Y | |||||||||||||||||||||||||||
| Proceeds from shares issued | $ | 15,741,255 | $ | 32,525,272 | $ | 154,466,134 | $ | 53,808,588 | $ | 84,328,718 | $ | 83,395,279 | |||||||||||||||
| Distributions reinvested | 1,536,904 | 4,884,864 | 2,416,346 | 5,608,671 | 6,227,753 | 11,334,737 | |||||||||||||||||||||
| Cost of shares redeemed | (43,614,856 | ) | (37,413,937 | ) | (87,503,289 | ) | (27,787,234 | ) | (92,888,357 | ) | (93,596,275 | ) | |||||||||||||||
Total Class Y | $ | (26,336,697 | ) | $ | (3,801 | ) | $ | 69,379,191 | $ | 31,630,025 | $ | (2,331,886 | ) | $ | 1,133,741 | ||||||||||||
| Change in net assets resulting from capital transactions | $ | (25,178,437 | ) | $ | 23,244,315 | $ | 155,146,559 | $ | 87,147,589 | $ | 29,395,837 | $ | 74,677,705 | ||||||||||||||
(continues on next page)
See notes to financial statements.
38
Victory Portfolios | Statements of Changes in Net Assets | ||||||
(continued)
| Victory RS International Fund | Victory RS Global Fund | Victory Sophus Emerging Markets Fund | |||||||||||||||||||||||||
| Year Ended December 31, 2022 | Year Ended December 31, 2021 | Year Ended December 31, 2022 | Year Ended December 31, 2021 | Year Ended December 31, 2022 | Year Ended December 31, 2021 | ||||||||||||||||||||||
Share Transactions: | |||||||||||||||||||||||||||
Class A | |||||||||||||||||||||||||||
Issued | 137,801 | 260,078 | 2,308,724 | 1,528,049 | 437,770 | 476,833 | |||||||||||||||||||||
Reinvested | 32,172 | 69,890 | 49,185 | 108,460 | 67,255 | 94,077 | |||||||||||||||||||||
Redeemed | (251,549 | ) | (378,820 | ) | (1,088,064 | ) | (1,087,051 | ) | (564,435 | ) | (619,797 | ) | |||||||||||||||
Total Class A | (81,576 | ) | (48,852 | ) | 1,269,845 | 549,458 | (59,410 | ) | (48,887 | ) | |||||||||||||||||
Class C | |||||||||||||||||||||||||||
Issued | 127,652 | — | 108,783 | 36,053 | 1,782 | 3,730 | |||||||||||||||||||||
Reinvested | 5,987 | 5,554 | 489 | 5,629 | 1,687 | 4,307 | |||||||||||||||||||||
Redeemed | (11,928 | ) | (23,450 | ) | (78,594 | ) | (36,997 | ) | (44,129 | ) | (84,587 | ) | |||||||||||||||
Total Class C | 121,711 | (17,896 | ) | 30,678 | 4,685 | (40,660 | ) | (76,550 | ) | ||||||||||||||||||
Class R | |||||||||||||||||||||||||||
Issued | 14,207 | 15,426 | 60,592 | 17,638 | 74,569 | 72,211 | |||||||||||||||||||||
Reinvested | 2,809 | 5,866 | 1,327 | 4,939 | 16,171 | 22,482 | |||||||||||||||||||||
Redeemed | (13,403 | ) | (37,328 | ) | (27,086 | ) | (15,790 | ) | (80,662 | ) | (120,823 | ) | |||||||||||||||
Total Class R | 3,613 | (16,036 | ) | 34,833 | 6,787 | 10,078 | (26,130 | ) | |||||||||||||||||||
Class R6 | |||||||||||||||||||||||||||
Issued | 2,172,195 | 1,830,467 | 5,211,428 | 3,002,088 | 2,576,780 | 3,586,805 | |||||||||||||||||||||
Reinvested | 677,709 | 1,278,135 | 189,565 | 289,548 | 287,238 | 315,585 | |||||||||||||||||||||
Redeemed | (2,624,499 | ) | (1,169,870 | ) | (506,633 | ) | (325,083 | ) | (1,272,024 | ) | (961,564 | ) | |||||||||||||||
Total Class R6 | 225,405 | 1,938,732 | 4,894,360 | 2,966,553 | 1,591,994 | 2,940,826 | |||||||||||||||||||||
Class Y | |||||||||||||||||||||||||||
Issued | 1,227,865 | 2,230,794 | 8,844,273 | 2,820,014 | 4,338,691 | 3,187,741 | |||||||||||||||||||||
Reinvested | 126,922 | 337,332 | 147,248 | 279,776 | 360,402 | 496,566 | |||||||||||||||||||||
Redeemed | (3,518,895 | ) | (2,563,951 | ) | (5,252,065 | ) | (1,454,945 | ) | (4,891,207 | ) | (3,656,296 | ) | |||||||||||||||
Total Class Y | (2,164,108 | ) | 4,175 | 3,739,456 | 1,644,845 | (192,114 | ) | 28,011 | |||||||||||||||||||
Change in Shares | (1,894,955 | ) | 1,860,123 | 9,969,172 | 5,172,328 | 1,309,888 | 2,817,270 | ||||||||||||||||||||
See notes to financial statements.
39
Victory Portfolios | Financial Highlights | ||||||
For a Share Outstanding Throughout Each Period
Victory RS International Fund | |||||||||||||||||||||||
Class A | |||||||||||||||||||||||
| Year Ended December 31, 2022 | Year Ended December 31, 2021 | Year Ended December 31, 2020 | Year Ended December 31, 2019 | Year Ended December 31, 2018 | |||||||||||||||||||
Net Asset Value, Beginning of Period | $ | 14.76 | $ | 13.49 | $ | 12.93 | $ | 10.63 | $ | 12.12 | |||||||||||||
Investment Activities: | |||||||||||||||||||||||
Net investment income (loss) (a) | 0.32 | 0.27 | 0.21 | 0.26 | 0.23 | ||||||||||||||||||
| Net realized and unrealized gains (losses) | (2.66 | ) | 1.62 | 0.51 | 2.05 | (1.52 | ) | ||||||||||||||||
| Total from Investment Activities | (2.34 | ) | 1.89 | 0.72 | 2.31 | (1.29 | ) | ||||||||||||||||
Distributions to Shareholders From: | |||||||||||||||||||||||
Net investment income | (0.22 | ) | (0.25 | ) | (0.13 | ) | — | (b) | (0.20 | ) | |||||||||||||
Net realized gains from investments | (0.03 | ) | (0.37 | ) | (0.03 | ) | (0.01 | ) | — | ||||||||||||||
Total Distributions | (0.25 | ) | (0.62 | ) | (0.16 | ) | (0.01 | ) | (0.20 | ) | |||||||||||||
Net Asset Value, End of Period | $ | 12.17 | $ | 14.76 | $ | 13.49 | $ | 12.93 | $ | 10.63 | |||||||||||||
Total Return (excludes sales charge) (c) | (15.89 | )% | 14.05 | % | 5.55 | % | 21.72 | % | (10.65 | )% | |||||||||||||
Ratios to Average Net Assets: | |||||||||||||||||||||||
Net Expenses (d) | 1.13 | % | 1.13 | % | 1.13 | % | 1.13 | % | 1.13 | % | |||||||||||||
Net Investment Income (Loss) | 2.53 | % | 1.80 | % | 1.79 | % | 2.18 | % | 1.97 | % | |||||||||||||
Gross Expenses (d) | 1.41 | % | 1.40 | % | 1.47 | % | 1.55 | % | 1.61 | % | |||||||||||||
Supplemental Data: | |||||||||||||||||||||||
Net Assets at end of period (000's) | $ | 20,077 | $ | 25,555 | $ | 24,010 | $ | 22,620 | $ | 15,716 | |||||||||||||
Portfolio Turnover (e) | 29 | % | 43 | % | 52 | % | 20 | % | 52 | % | |||||||||||||
(continues on next page)
See notes to financial statements.
40
Victory Portfolios | Financial Highlights — continued | ||||||
For a Share Outstanding Throughout Each Period
Victory RS International Fund | |||||||||||||||||||||||
Class C | |||||||||||||||||||||||
| Year Ended December 31, 2022 | Year Ended December 31, 2021 | Year Ended December 31, 2020 | Year Ended December 31, 2019 | Year Ended December 31, 2018 | |||||||||||||||||||
Net Asset Value, Beginning of Period | $ | 10.45 | $ | 9.72 | $ | 9.36 | $ | 7.76 | $ | 8.89 | |||||||||||||
Investment Activities: | |||||||||||||||||||||||
Net investment income (loss) (a) | 0.14 | 0.11 | 0.10 | 0.12 | 0.11 | ||||||||||||||||||
| Net realized and unrealized gains (losses) | (1.86 | ) | 1.17 | 0.34 | 1.49 | (1.11 | ) | ||||||||||||||||
| Total from Investment Activities | (1.72 | ) | 1.28 | 0.44 | 1.61 | (1.00 | ) | ||||||||||||||||
Distributions to Shareholders From: | |||||||||||||||||||||||
Net investment income | (0.20 | ) | (0.18 | ) | (0.05 | ) | — | (0.13 | ) | ||||||||||||||
Net realized gains from investments | (0.03 | ) | (0.37 | ) | (0.03 | ) | (0.01 | ) | — | ||||||||||||||
Total Distributions | (0.23 | ) | (0.55 | ) | (0.08 | ) | (0.01 | ) | (0.13 | ) | |||||||||||||
Net Asset Value, End of Period | $ | 8.50 | $ | 10.45 | $ | 9.72 | $ | 9.36 | $ | 7.76 | |||||||||||||
| Total Return (excludes contingent deferred sales charge) (c) | (16.50 | )% | 13.24 | % | 4.76 | % | 20.70 | % | (11.24 | )% | |||||||||||||
Ratios to Average Net Assets: | |||||||||||||||||||||||
Net Expenses (d) | 1.88 | % | 1.88 | % | 1.88 | % | 1.88 | % | 1.88 | % | |||||||||||||
Net Investment Income (Loss) | 1.61 | % | 1.03 | % | 1.14 | % | 1.39 | % | 1.23 | % | |||||||||||||
Gross Expenses (d) | 3.00 | % | 3.07 | % | 3.07 | % | 3.14 | % | 3.52 | % | |||||||||||||
Supplemental Data: | |||||||||||||||||||||||
Net Assets at end of period (000's) | $ | 1,967 | $ | 1,147 | $ | 1,241 | $ | 1,480 | $ | 702 | |||||||||||||
Portfolio Turnover (e) | 29 | % | 43 | % | 52 | % | 20 | % | 52 | % | |||||||||||||
(continues on next page)
See notes to financial statements.
41
Victory Portfolios | Financial Highlights — continued | ||||||
For a Share Outstanding Throughout Each Period
Victory RS International Fund | |||||||||||||||||||||||
Class R | |||||||||||||||||||||||
| Year Ended December 31, 2022 | Year Ended December 31, 2021 | Year Ended December 31, 2020 | Year Ended December 31, 2019 | Year Ended December 31, 2018 | |||||||||||||||||||
Net Asset Value, Beginning of Period | $ | 13.73 | $ | 12.58 | $ | 12.07 | $ | 9.95 | $ | 11.35 | |||||||||||||
Investment Activities: | |||||||||||||||||||||||
Net investment income (loss) (a) | 0.26 | 0.22 | 0.18 | 0.21 | 0.19 | ||||||||||||||||||
| Net realized and unrealized gains (losses) | (2.47 | ) | 1.51 | 0.45 | 1.92 | (1.42 | ) | ||||||||||||||||
| Total from Investment Activities | (2.21 | ) | 1.73 | 0.63 | 2.13 | (1.23 | ) | ||||||||||||||||
Distributions to Shareholders From: | |||||||||||||||||||||||
Net investment income | (0.19 | ) | (0.21 | ) | (0.09 | ) | — | (0.17 | ) | ||||||||||||||
Net realized gains from investments | (0.03 | ) | (0.37 | ) | (0.03 | ) | (0.01 | ) | — | ||||||||||||||
Total Distributions | (0.22 | ) | (0.58 | ) | (0.12 | ) | (0.01 | ) | (0.17 | ) | |||||||||||||
Net Asset Value, End of Period | $ | 11.30 | $ | 13.73 | $ | 12.58 | $ | 12.07 | $ | 9.95 | |||||||||||||
Total Return (c) | (16.09 | )% | 13.85 | % | 5.21 | % | 21.37 | % | (10.85 | )% | |||||||||||||
Ratios to Average Net Assets: | |||||||||||||||||||||||
Net Expenses (d) | 1.38 | % | 1.38 | % | 1.38 | % | 1.38 | % | 1.38 | % | |||||||||||||
Net Investment Income (Loss) | 2.24 | % | 1.58 | % | 1.60 | % | 1.87 | % | 1.73 | % | |||||||||||||
Gross Expenses (d) | 2.30 | % | 2.16 | % | 2.24 | % | 2.32 | % | 2.31 | % | |||||||||||||
Supplemental Data: | |||||||||||||||||||||||
Net Assets at end of period (000's) | $ | 1,653 | $ | 1,959 | $ | 1,998 | $ | 2,652 | $ | 1,786 | |||||||||||||
Portfolio Turnover (e) | 29 | % | 43 | % | 52 | % | 20 | % | 52 | % | |||||||||||||
(continues on next page)
See notes to financial statements.
42
Victory Portfolios | Financial Highlights — continued | ||||||
For a Share Outstanding Throughout Each Period
Victory RS International Fund | |||||||||||||||||||
Class R6 | |||||||||||||||||||
| Year Ended December 31, 2022 | Year Ended December 31, 2021 | Year Ended December 31, 2020 | May 2, 2019(f) through December 31, 2019 | ||||||||||||||||
Net Asset Value, Beginning of Period | $ | 12.07 | $ | 11.14 | $ | 10.70 | $ | 10.00 | |||||||||||
Investment Activities: | |||||||||||||||||||
Net investment income (loss) (a) | 0.29 | 0.25 | 0.20 | 0.06 | |||||||||||||||
Net realized and unrealized gains (losses) | (2.17 | ) | 1.34 | 0.43 | 0.67 | ||||||||||||||
Total from Investment Activities | (1.88 | ) | 1.59 | 0.63 | 0.73 | ||||||||||||||
Distributions to Shareholders From: | |||||||||||||||||||
Net investment income | (0.25 | ) | (0.29 | ) | (0.16 | ) | (0.02 | ) | |||||||||||
Net realized gains from investments | (0.03 | ) | (0.37 | ) | (0.03 | ) | (0.01 | ) | |||||||||||
Total Distributions | (0.28 | ) | (0.66 | ) | (0.19 | ) | (0.03 | ) | |||||||||||
Net Asset Value, End of Period | $ | 9.91 | $ | 12.07 | $ | 11.14 | $ | 10.70 | |||||||||||
Total Return (c) (g) | (15.57 | )% | 14.32 | % | 5.90 | % | 7.24 | % | |||||||||||
Ratios to Average Net Assets: | |||||||||||||||||||
Net Expenses (d) (h) | 0.83 | % | 0.83 | % | 0.83 | % | 0.83 | % | |||||||||||
Net Investment Income (Loss) (h) | 2.80 | % | 2.06 | % | 2.03 | % | 0.92 | % | |||||||||||
Gross Expenses (d) (h) | 0.92 | % | 0.91 | % | 0.93 | % | 0.97 | % | |||||||||||
Supplemental Data: | |||||||||||||||||||
Net Assets at end of period (000's) | $ | 245,239 | $ | 296,211 | $ | 251,586 | $ | 178,695 | |||||||||||
Portfolio Turnover (e) (g) | 29 | % | 43 | % | 52 | % | 20 | % | |||||||||||
(continues on next page)
See notes to financial statements.
43
Victory Portfolios | Financial Highlights — continued | ||||||
For a Share Outstanding Throughout Each Period
Victory RS International Fund | |||||||||||||||||||||||
Class Y | |||||||||||||||||||||||
| Year Ended December 31, 2022 | Year Ended December 31, 2021 | Year Ended December 31, 2020 | Year Ended December 31, 2019 | Year Ended December 31, 2018 | |||||||||||||||||||
Net Asset Value, Beginning of Period | $ | 14.54 | $ | 13.29 | $ | 12.74 | $ | 10.47 | $ | 11.93 | |||||||||||||
Investment Activities: | |||||||||||||||||||||||
Net investment income (loss) (a) | 0.35 | 0.30 | 0.25 | 0.22 | 0.23 | ||||||||||||||||||
| Net realized and unrealized gains (losses) | (2.63 | ) | 1.60 | 0.49 | 2.08 | (1.47 | ) | ||||||||||||||||
| Total from Investment Activities | (2.28 | ) | 1.90 | 0.74 | 2.30 | (1.24 | ) | ||||||||||||||||
Distributions to Shareholders From: | |||||||||||||||||||||||
Net investment income | (0.25 | ) | (0.28 | ) | (0.16 | ) | (0.02 | ) | (0.22 | ) | |||||||||||||
Net realized gains from investments | (0.03 | ) | (0.37 | ) | (0.03 | ) | (0.01 | ) | — | ||||||||||||||
Total Distributions | (0.28 | ) | (0.65 | ) | (0.19 | ) | (0.03 | ) | (0.22 | ) | |||||||||||||
Net Asset Value, End of Period | $ | 11.98 | $ | 14.54 | $ | 13.29 | $ | 12.74 | $ | 10.47 | |||||||||||||
Total Return (c) | (15.71 | )% | 14.38 | % | 5.80 | % | 21.94 | % | (10.38 | )% | |||||||||||||
Ratios to Average Net Assets: | |||||||||||||||||||||||
Net Expenses (d) | 0.88 | % | 0.88 | % | 0.88 | % | 0.88 | % | 0.88 | % | |||||||||||||
Net Investment Income (Loss) | 2.85 | % | 2.02 | % | 2.11 | % | 1.80 | % | 1.97 | % | |||||||||||||
Gross Expenses (d) | 1.05 | % | 1.02 | % | 1.09 | % | 1.16 | % | 1.62 | % | |||||||||||||
Supplemental Data: | |||||||||||||||||||||||
Net Assets at end of period (000's) | $ | 66,799 | $ | 112,511 | $ | 102,803 | $ | 75,366 | $ | 5,979 | |||||||||||||
Portfolio Turnover (e) | 29 | % | 43 | % | 52 | % | 20 | % | 52 | % | |||||||||||||
(a) Per share net investment income (loss) has been calculated using the average daily shares method.
(b) Amount is less than $0.005 per share.
(c) Assumes reinvestment of all net investment income and realized capital gain distributions, if any, during the period. Includes adjustments in accordance with U.S. Generally Accepted Accounting Principles and could differ from the reported total return.
(d) Does not include acquired fund fees and expenses, if any.
(e) Portfolio turnover is calculated on the basis of the Fund as a whole without distinguishing between the classes of shares.
(f) Commencement of operations.
(g) Not annualized for periods less than one year.
(h) Annualized for periods less than one year.
See notes to financial statements.
44
Victory Portfolios | Financial Highlights | ||||||
For a Share Outstanding Throughout Each Period
Victory RS Global Fund | |||||||||||||||||||||||
Class A | |||||||||||||||||||||||
| Year Ended December 31, 2022 | Year Ended December 31, 2021 | Year Ended December 31, 2020 | Year Ended December 31, 2019 | Year Ended December 31, 2018 | |||||||||||||||||||
Net Asset Value, Beginning of Period | $ | 20.47 | $ | 17.27 | $ | 14.86 | $ | 11.53 | $ | 12.75 | |||||||||||||
Investment Activities: | |||||||||||||||||||||||
Net investment income (loss) (a) | 0.24 | 0.20 | 0.18 | 0.21 | 0.20 | ||||||||||||||||||
| Net realized and unrealized gains (losses) | (4.13 | ) | 3.65 | 2.35 | 3.29 | (0.90 | ) | ||||||||||||||||
| Total from Investment Activities | (3.89 | ) | 3.85 | 2.53 | 3.50 | (0.70 | ) | ||||||||||||||||
Distributions to Shareholders From: | |||||||||||||||||||||||
Net investment income | (0.17 | ) | (0.18 | ) | (0.11 | ) | (0.16 | ) | (0.16 | ) | |||||||||||||
Net realized gains from investments | — | (0.47 | ) | (0.01 | ) | (0.01 | ) | (0.36 | ) | ||||||||||||||
Return of capital | — | (b) | — | — | — | — | |||||||||||||||||
Total Distributions | (0.17 | ) | (0.65 | ) | (0.12 | ) | (0.17 | ) | (0.52 | ) | |||||||||||||
Net Asset Value, End of Period | $ | 16.41 | $ | 20.47 | $ | 17.27 | $ | 14.86 | $ | 11.53 | |||||||||||||
Total Return (excludes sales charge) (c) | (18.99 | )% | 22.39 | % | 17.00 | % | 30.36 | % | (5.45 | )% | |||||||||||||
Ratios to Average Net Assets: | |||||||||||||||||||||||
Net Expenses (d) | 0.85 | % | 0.85 | % | 0.85 | % | 0.85 | % | 0.94 | % | |||||||||||||
Net Investment Income (Loss) | 1.39 | % | 1.05 | % | 1.22 | % | 1.51 | % | 1.51 | % | |||||||||||||
Gross Expenses (d) | 1.17 | % | 1.34 | % | 1.40 | % | 1.53 | % | 1.75 | % | |||||||||||||
Supplemental Data: | |||||||||||||||||||||||
Net Assets at end of period (000's) | $ | 78,373 | $ | 71,792 | $ | 51,066 | $ | 26,471 | $ | 5,695 | |||||||||||||
Portfolio Turnover (e) | 29 | % | 38 | % | 71 | % | 46 | % | 58 | % | |||||||||||||
(continues on next page)
See notes to financial statements.
45
Victory Portfolios | Financial Highlights — continued | ||||||
For a Share Outstanding Throughout Each Period
Victory RS Global Fund | |||||||||||||||||||||||
Class C | |||||||||||||||||||||||
| Year Ended December 31, 2022 | Year Ended December 31, 2021 | Year Ended December 31, 2020 | Year Ended December 31, 2019 | Year Ended December 31, 2018 | |||||||||||||||||||
Net Asset Value, Beginning of Period | $ | 19.73 | $ | 16.68 | $ | 14.38 | $ | 11.17 | $ | 12.38 | |||||||||||||
Investment Activities: | |||||||||||||||||||||||
Net investment income (loss) (a) | 0.11 | 0.06 | 0.07 | 0.14 | 0.10 | ||||||||||||||||||
| Net realized and unrealized gains (losses) | (3.98 | ) | 3.52 | 2.24 | 3.16 | (0.87 | ) | ||||||||||||||||
| Total from Investment Activities | (3.87 | ) | 3.58 | 2.31 | 3.30 | (0.77 | ) | ||||||||||||||||
Distributions to Shareholders From: | |||||||||||||||||||||||
Net investment income | (0.03 | ) | (0.06 | ) | — | (b) | (0.08 | ) | (0.08 | ) | |||||||||||||
Net realized gains from investments | — | (0.47 | ) | (0.01 | ) | (0.01 | ) | (0.36 | ) | ||||||||||||||
Return of capital | — | (b) | — | — | — | — | |||||||||||||||||
Total Distributions | (0.03 | ) | (0.53 | ) | (0.01 | ) | (0.09 | ) | (0.44 | ) | |||||||||||||
Net Asset Value, End of Period | $ | 15.83 | $ | 19.73 | $ | 16.68 | $ | 14.38 | $ | 11.17 | |||||||||||||
| Total Return (excludes contingent deferred sales charge) (c) | (19.61 | )% | 21.52 | % | 16.06 | % | 29.52 | % | (6.20 | )% | |||||||||||||
Ratios to Average Net Assets: | |||||||||||||||||||||||
Net Expenses (d) | 1.60 | % | 1.60 | % | 1.60 | % | 1.60 | % | 1.70 | % | |||||||||||||
Net Investment Income (Loss) | 0.68 | % | 0.35 | % | 0.48 | % | 1.07 | % | 0.79 | % | |||||||||||||
Gross Expenses (d) | 2.09 | % | 2.33 | % | 2.53 | % | 2.59 | % | 2.59 | % | |||||||||||||
Supplemental Data: | |||||||||||||||||||||||
Net Assets at end of period (000's) | $ | 3,872 | $ | 4,221 | $ | 3,491 | $ | 3,101 | $ | 2,358 | |||||||||||||
Portfolio Turnover (e) | 29 | % | 38 | % | 71 | % | 46 | % | 58 | % | |||||||||||||
(continues on next page)
See notes to financial statements.
46
Victory Portfolios | Financial Highlights — continued | ||||||
For a Share Outstanding Throughout Each Period
Victory RS Global Fund | |||||||||||||||||||||||
Class R | |||||||||||||||||||||||
| Year Ended December 31, 2022 | Year Ended December 31, 2021 | Year Ended December 31, 2020 | Year Ended December 31, 2019 | Year Ended December 31, 2018 | |||||||||||||||||||
Net Asset Value, Beginning of Period | $ | 25.73 | $ | 21.57 | $ | 18.55 | $ | 14.37 | $ | 15.76 | |||||||||||||
Investment Activities: | |||||||||||||||||||||||
Net investment income (loss) (a) | 0.25 | 0.21 | 0.18 | 0.25 | 0.20 | ||||||||||||||||||
| Net realized and unrealized gains (losses) | (5.19 | ) | 4.55 | 2.92 | 4.07 | (1.10 | ) | ||||||||||||||||
| Total from Investment Activities | (4.94 | ) | 4.76 | 3.10 | 4.32 | (0.90 | ) | ||||||||||||||||
Distributions to Shareholders From: | |||||||||||||||||||||||
Net investment income | (0.11 | ) | (0.13 | ) | (0.07 | ) | (0.13 | ) | (0.13 | ) | |||||||||||||
Net realized gains from investments | — | (0.47 | ) | (0.01 | ) | (0.01 | ) | (0.36 | ) | ||||||||||||||
Return of capital | — | (b) | — | — | — | — | |||||||||||||||||
Total Distributions | (0.11 | ) | (0.60 | ) | (0.08 | ) | (0.14 | ) | (0.49 | ) | |||||||||||||
Net Asset Value, End of Period | $ | 20.68 | $ | 25.73 | $ | 21.57 | $ | 18.55 | $ | 14.37 | |||||||||||||
Total Return (c) | (19.19 | )% | 22.12 | % | 16.70 | % | 30.10 | % | (5.68 | )% | |||||||||||||
Ratios to Average Net Assets: | |||||||||||||||||||||||
Net Expenses (d) | 1.10 | % | 1.10 | % | 1.10 | % | 1.10 | % | 1.20 | % | |||||||||||||
Net Investment Income (Loss) | 1.16 | % | 0.85 | % | 0.98 | % | 1.53 | % | 1.25 | % | |||||||||||||
Gross Expenses (d) | 1.57 | % | 1.70 | % | 1.93 | % | 2.34 | % | 2.34 | % | |||||||||||||
Supplemental Data: | |||||||||||||||||||||||
Net Assets at end of period (000's) | $ | 5,130 | $ | 5,488 | $ | 4,454 | $ | 2,365 | $ | 1,920 | |||||||||||||
Portfolio Turnover (e) | 29 | % | 38 | % | 71 | % | 46 | % | 58 | % | |||||||||||||
(continues on next page)
See notes to financial statements.
47
Victory Portfolios | Financial Highlights — continued | ||||||
For a Share Outstanding Throughout Each Period
Victory RS Global Fund | |||||||||||||||||||
Class R6 | |||||||||||||||||||
| Year Ended December 31, 2022 | Year Ended December 31, 2021 | Year Ended December 31, 2020 | May 2, 2019(f) through December 31, 2019 | ||||||||||||||||
Net Asset Value, Beginning of Period | $ | 15.11 | $ | 12.87 | $ | 11.07 | $ | 10.00 | |||||||||||
Investment Activities: | |||||||||||||||||||
Net investment income (loss) (a) | 0.22 | 0.20 | 0.08 | 0.13 | |||||||||||||||
Net realized and unrealized gains (losses) | (3.06 | ) | 2.73 | 1.83 | 1.12 | ||||||||||||||
Total from Investment Activities | (2.84 | ) | 2.93 | 1.91 | 1.25 | ||||||||||||||
Distributions to Shareholders From: | |||||||||||||||||||
Net investment income | (0.21 | ) | (0.22 | ) | (0.10 | ) | (0.17 | ) | |||||||||||
Net realized gains from investments | — | (0.47 | ) | (0.01 | ) | (0.01 | ) | ||||||||||||
Return of capital | — | (b) | — | — | — | ||||||||||||||
Total Distributions | (0.21 | ) | (0.69 | ) | (0.11 | ) | (0.18 | ) | |||||||||||
Net Asset Value, End of Period | $ | 12.06 | $ | 15.11 | $ | 12.87 | $ | 11.07 | |||||||||||
Total Return (c) (g) | (18.81 | )% | 22.84 | % | 17.27 | % | 12.47 | % | |||||||||||
Ratios to Average Net Assets: | |||||||||||||||||||
Net Expenses (d) (h) | 0.55 | % | 0.55 | % | 0.55 | % | 0.55 | % | |||||||||||
Net Investment Income (Loss) (h) | 1.70 | % | 1.35 | % | 0.64 | % | 1.85 | % | |||||||||||
Gross Expenses (d) (h) | 0.73 | % | 0.85 | % | 1.16 | % | 28.85 | % | |||||||||||
Supplemental Data: | |||||||||||||||||||
Net Assets at end of period (000's) | $ | 138,665 | $ | 99,708 | $ | 46,776 | $ | 124 | |||||||||||
Portfolio Turnover (e) (g) | 29 | % | 38 | % | 71 | % | 46 | % | |||||||||||
(continues on next page)
See notes to financial statements.
48
Victory Portfolios | Financial Highlights — continued | ||||||
For a Share Outstanding Throughout Each Period
Victory RS Global Fund | |||||||||||||||||||||||
Class Y | |||||||||||||||||||||||
| Year Ended December 31, 2022 | Year Ended December 31, 2021 | Year Ended December 31, 2020 | Year Ended December 31, 2019 | Year Ended December 31, 2018 | |||||||||||||||||||
Net Asset Value, Beginning of Period | $ | 20.31 | $ | 17.12 | $ | 14.72 | $ | 11.42 | $ | 12.63 | |||||||||||||
Investment Activities: | |||||||||||||||||||||||
Net investment income (loss) (a) | 0.29 | 0.26 | 0.20 | 0.26 | 0.23 | ||||||||||||||||||
| Net realized and unrealized gains (losses) | (4.11 | ) | 3.62 | 2.34 | 3.24 | (0.89 | ) | ||||||||||||||||
| Total from Investment Activities | (3.82 | ) | 3.88 | 2.54 | 3.50 | (0.66 | ) | ||||||||||||||||
Distributions to Shareholders From: | |||||||||||||||||||||||
Net investment income | (0.21 | ) | (0.22 | ) | (0.13 | ) | (0.19 | ) | (0.19 | ) | |||||||||||||
Net realized gains from investments | — | (0.47 | ) | (0.01 | ) | (0.01 | ) | (0.36 | ) | ||||||||||||||
Return of capital | — | (b) | — | — | — | — | |||||||||||||||||
Total Distributions | (0.21 | ) | (0.69 | ) | (0.14 | ) | (0.20 | ) | (0.55 | ) | |||||||||||||
Net Asset Value, End of Period | $ | 16.28 | $ | 20.31 | $ | 17.12 | $ | 14.72 | $ | 11.42 | |||||||||||||
Total Return (c) | (18.82 | )% | 22.78 | % | 17.27 | % | 30.69 | % | (5.17 | )% | |||||||||||||
Ratios to Average Net Assets: | |||||||||||||||||||||||
Net Expenses (d) | 0.60 | % | 0.60 | % | 0.60 | % | 0.60 | % | 0.70 | % | |||||||||||||
Net Investment Income (Loss) | 1.67 | % | 1.34 | % | 1.38 | % | 1.95 | % | 1.80 | % | |||||||||||||
Gross Expenses (d) | 0.84 | % | 0.96 | % | 1.10 | % | 1.17 | % | 1.20 | % | |||||||||||||
Supplemental Data: | |||||||||||||||||||||||
Net Assets at end of period (000's) | $ | 196,898 | $ | 169,687 | $ | 114,925 | $ | 52,541 | $ | 25,544 | |||||||||||||
Portfolio Turnover (e) | 29 | % | 38 | % | 71 | % | 46 | % | 58 | % | |||||||||||||
(a) Per share net investment income (loss) has been calculated using the average daily shares method.
(b) Amount is less than $0.005 per share.
(c) Assumes reinvestment of all net investment income and realized capital gain distributions, if any, during the period. Includes adjustments in accordance with U.S. Generally Accepted Accounting Principles and could differ from the reported total return.
(d) Does not include acquired fund fees and expenses, if any.
(e) Portfolio turnover is calculated on the basis of the Fund as a whole without distinguishing between the classes of shares.
(f) Commencement of operations.
(g) Not annualized for periods less than one year.
(h) Annualized for periods less than one year.
See notes to financial statements.
49
Victory Portfolios | Financial Highlights | ||||||
For a Share Outstanding Throughout Each Period
Victory Sophus Emerging Markets Fund | |||||||||||||||||||||||
Class A | |||||||||||||||||||||||
| Year Ended December 31, 2022 | Year Ended December 31, 2021 | Year Ended December 31, 2020 | Year Ended December 31, 2019 | Year Ended December 31, 2018 | |||||||||||||||||||
Net Asset Value, Beginning of Period | $ | 22.69 | $ | 24.70 | $ | 21.37 | $ | 17.45 | $ | 22.52 | |||||||||||||
Investment Activities: | |||||||||||||||||||||||
Net investment income (loss) (a) | 0.40 | 0.18 | 0.10 | 0.37 | 0.24 | ||||||||||||||||||
| Net realized and unrealized gains (losses) | (5.48 | ) | (1.26 | ) | 3.45 | 3.65 | (4.54 | ) | |||||||||||||||
| Total from Investment Activities | (5.08 | ) | (1.08 | ) | 3.55 | 4.02 | (4.30 | ) | |||||||||||||||
Distributions to Shareholders From: | |||||||||||||||||||||||
Net investment income | (0.51 | ) | (0.26 | ) | (0.22 | ) | (0.10 | ) | (0.13 | ) | |||||||||||||
Net realized gains from investments | — | (0.66 | ) | — | — | (0.64 | ) | ||||||||||||||||
Return of capital | — | (0.01 | ) | — | — | — | |||||||||||||||||
Total Distributions | (0.51 | ) | (0.93 | ) | (0.22 | ) | (0.10 | ) | (0.77 | ) | |||||||||||||
Net Asset Value, End of Period | $ | 17.10 | $ | 22.69 | $ | 24.70 | $ | 21.37 | $ | 17.45 | |||||||||||||
Total Return (excludes sales charge) (b) | (22.41 | )% | (4.35 | )% | 16.73 | % | 22.96 | % | (19.08 | )% | |||||||||||||
Ratios to Average Net Assets: | |||||||||||||||||||||||
Net Expenses (c) | 1.34 | % | 1.34 | % | 1.34 | % | 1.34 | % | 1.34 | % | |||||||||||||
Net Investment Income (Loss) | 2.08 | % | 0.69 | % | 0.47 | % | 1.95 | % | 1.11 | % | |||||||||||||
Gross Expenses (c) | 1.63 | % | 1.60 | % | 1.64 | % | 1.62 | % | 1.61 | % | |||||||||||||
Supplemental Data: | |||||||||||||||||||||||
Net Assets at end of period (000's) | $ | 39,819 | $ | 54,194 | $ | 60,206 | $ | 62,346 | $ | 56,823 | |||||||||||||
Portfolio Turnover (d) | 58 | % | 85 | % | 109 | % | 96 | % | 118 | % | |||||||||||||
(continues on next page)
See notes to financial statements.
50
Victory Portfolios | Financial Highlights — continued | ||||||
For a Share Outstanding Throughout Each Period
Victory Sophus Emerging Markets Fund | |||||||||||||||||||||||
Class C | |||||||||||||||||||||||
| Year Ended December 31, 2022 | Year Ended December 31, 2021 | Year Ended December 31, 2020 | Year Ended December 31, 2019 | Year Ended December 31, 2018 | |||||||||||||||||||
Net Asset Value, Beginning of Period | $ | 16.69 | $ | 18.38 | $ | 15.94 | $ | 13.06 | $ | 17.07 | |||||||||||||
Investment Activities: | |||||||||||||||||||||||
Net investment income (loss) (a) | 0.17 | (0.03 | ) | (0.07 | ) | 0.14 | 0.05 | ||||||||||||||||
| Net realized and unrealized gains (losses) | (4.01 | ) | (0.92 | ) | 2.58 | 2.74 | (3.42 | ) | |||||||||||||||
| Total from Investment Activities | (3.84 | ) | (0.95 | ) | 2.51 | 2.88 | (3.37 | ) | |||||||||||||||
Distributions to Shareholders From: | |||||||||||||||||||||||
Net investment income | (0.36 | ) | (0.08 | ) | (0.07 | ) | — | — | (e) | ||||||||||||||
Net realized gains from investments | — | (0.66 | ) | — | — | (0.64 | ) | ||||||||||||||||
Return of capital | — | — | (e) | — | — | — | |||||||||||||||||
Total Distributions | (0.36 | ) | (0.74 | ) | (0.07 | ) | — | (0.64 | ) | ||||||||||||||
Net Asset Value, End of Period | $ | 12.49 | $ | 16.69 | $ | 18.38 | $ | 15.94 | $ | 13.06 | |||||||||||||
| Total Return (excludes contingent deferred sales charge) (b) | (23.01 | )% | (5.16 | )% | 15.79 | % | 22.05 | % | (19.75 | )% | |||||||||||||
Ratios to Average Net Assets: | |||||||||||||||||||||||
Net Expenses (c) | 2.14 | % | 2.14 | % | 2.14 | % | 2.14 | % | 2.14 | % | |||||||||||||
Net Investment Income (Loss) | 1.18 | % | (0.17 | )% | (0.45 | )% | 0.99 | % | 0.31 | % | |||||||||||||
Gross Expenses (c) | 3.39 | % | 2.77 | % | 2.69 | % | 2.48 | % | 2.40 | % | |||||||||||||
Supplemental Data: | |||||||||||||||||||||||
Net Assets at end of period (000's) | $ | 752 | $ | 1,684 | $ | 3,261 | $ | 5,787 | $ | 10,141 | |||||||||||||
Portfolio Turnover (d) | 58 | % | 85 | % | 109 | % | 96 | % | 118 | % | |||||||||||||
(continues on next page)
See notes to financial statements.
51
Victory Portfolios | Financial Highlights — continued | ||||||
For a Share Outstanding Throughout Each Period
Victory Sophus Emerging Markets Fund | |||||||||||||||||||||||
Class R | |||||||||||||||||||||||
| Year Ended December 31, 2022 | Year Ended December 31, 2021 | Year Ended December 31, 2020 | Year Ended December 31, 2019 | Year Ended December 31, 2018 | |||||||||||||||||||
Net Asset Value, Beginning of Period | $ | 21.19 | $ | 23.13 | $ | 20.03 | $ | 16.37 | $ | 21.18 | |||||||||||||
Investment Activities: | |||||||||||||||||||||||
Net investment income (loss) (a) | 0.33 | 0.11 | 0.05 | 0.31 | 0.18 | ||||||||||||||||||
| Net realized and unrealized gains (losses) | (5.12 | ) | (1.18 | ) | 3.23 | 3.41 | (4.26 | ) | |||||||||||||||
| Total from Investment Activities | (4.79 | ) | (1.07 | ) | 3.28 | 3.72 | (4.08 | ) | |||||||||||||||
Distributions to Shareholders From: | |||||||||||||||||||||||
Net investment income | (0.47 | ) | (0.20 | ) | (0.18 | ) | (0.06 | ) | (0.09 | ) | |||||||||||||
Net realized gains from investments | — | (0.66 | ) | — | — | (0.64 | ) | ||||||||||||||||
Return of capital | — | (0.01 | ) | — | — | — | |||||||||||||||||
Total Distributions | (0.47 | ) | (0.87 | ) | (0.18 | ) | (0.06 | ) | (0.73 | ) | |||||||||||||
Net Asset Value, End of Period | $ | 15.93 | $ | 21.19 | $ | 23.13 | $ | 20.03 | $ | 16.37 | |||||||||||||
Total Return (b) | (22.62 | )% | (4.57 | )% | 16.46 | % | 22.64 | % | (19.24 | )% | |||||||||||||
Ratios to Average Net Assets: | |||||||||||||||||||||||
Net Expenses (c) | 1.58 | % | 1.58 | % | 1.58 | % | 1.58 | % | 1.58 | % | |||||||||||||
Net Investment Income (Loss) | 1.85 | % | 0.44 | % | 0.25 | % | 1.71 | % | 0.89 | % | |||||||||||||
Gross Expenses (c) | 1.94 | % | 1.91 | % | 1.95 | % | 1.94 | % | 1.91 | % | |||||||||||||
Supplemental Data: | |||||||||||||||||||||||
Net Assets at end of period (000's) | $ | 9,064 | $ | 11,840 | $ | 13,531 | $ | 13,817 | $ | 12,505 | |||||||||||||
Portfolio Turnover (d) | 58 | % | 85 | % | 109 | % | 96 | % | 118 | % | |||||||||||||
(continues on next page)
See notes to financial statements.
52
Victory Portfolios | Financial Highlights — continued | ||||||
For a Share Outstanding Throughout Each Period
Victory Sophus Emerging Markets Fund | |||||||||||||||||||||||
Class R6 | |||||||||||||||||||||||
| Year Ended December 31, 2022 | Year Ended December 31, 2021 | Year Ended December 31, 2020 | Year Ended December 31, 2019 | Year Ended December 31, 2018 | |||||||||||||||||||
Net Asset Value, Beginning of Period | $ | 23.08 | $ | 25.10 | $ | 21.68 | $ | 17.68 | $ | 22.81 | |||||||||||||
Investment Activities: | |||||||||||||||||||||||
Net investment income (loss) (a) | 0.50 | 0.31 | 0.20 | 0.52 | 0.34 | ||||||||||||||||||
| Net realized and unrealized gains (losses) | (5.59 | ) | (1.30 | ) | 3.52 | 3.65 | (4.62 | ) | |||||||||||||||
| Total from Investment Activities | (5.09 | ) | (0.99 | ) | 3.72 | 4.17 | (4.28 | ) | |||||||||||||||
Distributions to Shareholders From: | |||||||||||||||||||||||
Net investment income | (0.59 | ) | (0.35 | ) | (0.30 | ) | (0.17 | ) | (0.21 | ) | |||||||||||||
Net realized gains from investments | — | (0.66 | ) | — | — | (0.64 | ) | ||||||||||||||||
Return of capital | — | (0.02 | ) | — | — | — | |||||||||||||||||
Total Distributions | (0.59 | ) | (1.03 | ) | (0.30 | ) | (0.17 | ) | (0.85 | ) | |||||||||||||
Net Asset Value, End of Period | $ | 17.40 | $ | 23.08 | $ | 25.10 | $ | 21.68 | $ | 17.68 | |||||||||||||
Total Return (b) | (22.06 | )% | (3.93 | )% | 17.28 | % | 23.55 | % | (18.73 | )% | |||||||||||||
Ratios to Average Net Assets: | |||||||||||||||||||||||
Net Expenses (c) | 0.89 | % | 0.89 | % | 0.89 | % | 0.89 | % | 0.89 | % | |||||||||||||
Net Investment Income (Loss) | 2.58 | % | 1.17 | % | 0.95 | % | 2.69 | % | 1.59 | % | |||||||||||||
Gross Expenses (c) | 1.19 | % | 1.17 | % | 1.21 | % | 1.22 | % | 1.24 | % | |||||||||||||
Supplemental Data: | |||||||||||||||||||||||
Net Assets at end of period (000's) | $ | 159,001 | $ | 174,198 | $ | 115,637 | $ | 72,196 | $ | 29,228 | |||||||||||||
Portfolio Turnover (d) | 58 | % | 85 | % | 109 | % | 96 | % | 118 | % | |||||||||||||
(continues on next page)
See notes to financial statements.
53
Victory Portfolios | Financial Highlights — continued | ||||||
For a Share Outstanding Throughout Each Period
Victory Sophus Emerging Markets Fund | |||||||||||||||||||||||
Class Y | |||||||||||||||||||||||
| Year Ended December 31, 2022 | Year Ended December 31, 2021 | Year Ended December 31, 2020 | Year Ended December 31, 2019 | Year Ended December 31, 2018 | |||||||||||||||||||
Net Asset Value, Beginning of Period | $ | 22.83 | $ | 24.85 | $ | 21.48 | $ | 17.54 | $ | 22.64 | �� | ||||||||||||
Investment Activities: | |||||||||||||||||||||||
Net investment income (loss) (a) | 0.48 | 0.27 | 0.16 | 0.45 | 0.35 | ||||||||||||||||||
| Net realized and unrealized gains (losses) | (5.53 | ) | (1.27 | ) | 3.50 | 3.65 | (4.61 | ) | |||||||||||||||
| Total from Investment Activities | (5.05 | ) | (1.00 | ) | 3.66 | 4.10 | (4.26 | ) | |||||||||||||||
Distributions to Shareholders From: | |||||||||||||||||||||||
Net investment income | (0.58 | ) | (0.34 | ) | (0.29 | ) | (0.16 | ) | (0.20 | ) | |||||||||||||
Net realized gains from investments | — | (0.66 | ) | — | — | (0.64 | ) | ||||||||||||||||
Return of capital | — | (0.02 | ) | — | — | — | |||||||||||||||||
Total Distributions | (0.58 | ) | (1.02 | ) | (0.29 | ) | (0.16 | ) | (0.84 | ) | |||||||||||||
Net Asset Value, End of Period | $ | 17.20 | $ | 22.83 | $ | 24.85 | $ | 21.48 | $ | 17.54 | |||||||||||||
Total Return (b) | (22.15 | )% | (4.01 | )% | 17.10 | % | 23.40 | % | (18.77 | )% | |||||||||||||
Ratios to Average Net Assets: | |||||||||||||||||||||||
Net Expenses (c) | 0.99 | % | 0.99 | % | 0.99 | % | 0.99 | % | 0.99 | % | |||||||||||||
Net Investment Income (Loss) | 2.48 | % | 1.05 | % | 0.79 | % | 2.32 | % | 1.64 | % | |||||||||||||
Gross Expenses (c) | 1.32 | % | 1.29 | % | 1.31 | % | 1.30 | % | 1.30 | % | |||||||||||||
Supplemental Data: | |||||||||||||||||||||||
Net Assets at end of period (000's) | $ | 191,226 | $ | 258,201 | $ | 280,364 | $ | 255,423 | $ | 178,132 | |||||||||||||
Portfolio Turnover (d) | 58 | % | 85 | % | 109 | % | 96 | % | 118 | % | |||||||||||||
(a) Per share net investment income (loss) has been calculated using the average daily shares method.
(b) Assumes reinvestment of all net investment income and realized capital gain distributions, if any, during the period. Includes adjustments in accordance with U.S. Generally Accepted Accounting Principles and could differ from the reported total return.
(c) Does not include acquired fund fees and expenses, if any.
(d) Portfolio turnover is calculated on the basis of the Fund as a whole without distinguishing between the classes of shares.
(e) Amount is less than $0.005 per share.
See notes to financial statements.
54
Victory Portfolios | Notes to Financial Statements December 31, 2022 | ||||||
1. Organization:
Victory Portfolios (the "Trust") is organized as a Delaware statutory trust and the Trust is registered under the Investment Company Act of 1940, as amended (the "1940 Act"), as an open-end investment company. The Trust is comprised of 37 funds and is authorized to issue an unlimited number of shares, which are units of beneficial interest with a par value of $0.001 per share.
The accompanying financial statements are those of the following three Funds (collectively, the "Funds" and individually, a "Fund"). Each Fund is classified as diversified under the 1940 Act.
| Investment Share Funds (Legal Name) | Funds (Short Name) | Classes Offered | |||||||||
Victory RS International | RS International | A, C, R, R6 and Y | |||||||||
Victory RS Global Fund | RS Global Fund | A, C, R, R6 and Y | |||||||||
Victory Sophus Emerging Markets Fund | Sophus Emerging Markets Fund | A, C, R, R6 and Y | |||||||||
Each class of shares of a Fund has substantially identical rights and privileges except with respect to sales charges, fees paid under distribution plans, expenses allocable exclusively to each class of shares, voting rights on matters solely affecting a single class of shares, and the exchange privilege of each class of shares.
Victory Capital Management Inc. ("VCM" or the "Adviser") is an indirect wholly owned subsidiary of Victory Capital Holdings, Inc., a publicly traded Delaware corporation, and a wholly owned direct subsidiary of Victory Capital Operating, LLC.
Under the Trust's organizational documents, its officers and trustees are indemnified against certain liabilities arising out of the performance of their duties to the Funds. In addition, in the normal course of business, the Funds enter into contracts with their vendors and others that provide for general indemnifications. The Funds' maximum exposure under these arrangements is unknown, as this would involve future claims that may be made against the Funds. However, based on experience, the Funds expect that risk of loss to be remote.
2. Significant Accounting Policies:
The following is a summary of significant accounting policies followed by the Trust in the preparation of its financial statements. The policies are in conformity with U.S. Generally Accepted Accounting Principles ("GAAP"). The preparation of financial statements in accordance with GAAP requires management to make estimates and assumptions that affect the reported amounts of assets and liabilities and disclosure of contingent assets and liabilities at the date of the financial statements and the reported amounts of income and expenses for the period. Actual results could differ from those estimates. The Funds follow the specialized accounting and reporting requirements under GAAP that are applicable to investment companies under Accounting Standards Codification Topic 946.
Investment Valuation:
The Funds record investments at fair value. Fair value is defined as the price that would be received to sell an asset or paid to transfer a liability in an orderly transaction between market participants at the measurement date.
The valuation techniques described below maximize the use of observable inputs and minimize the use of unobservable inputs in determining fair value. The inputs used for valuing the Funds' investments are summarized in the three broad levels listed below:
• Level 1 — quoted prices (unadjusted) in active markets for identical securities
• Level 2 — other significant observable inputs (including quoted prices for similar securities, interest rates, or credit spreads, applicable to those securities, etc.)
• Level 3 — significant unobservable inputs (including the Adviser's assumptions in determining the fair value of investments)
55
Victory Portfolios | Notes to Financial Statements — continued December 31, 2022 | ||||||
Changes in valuation techniques may result in transfers in or out of an assigned level within the disclosure hierarchy. The inputs or methodologies used for valuation techniques are not necessarily an indication of the risk associated with entering into those investments.
The Adviser, appointed as the valuation designee by the Trust's Board of Trustees' (the "Board"), has established the Pricing and Liquidity Committee (the "Committee"), and subject to Board oversight, the Committee administers and oversees the Funds' valuation policies and procedures, which are approved by the Board.
Portfolio securities listed or traded on securities exchanges, including Exchange-Traded Funds ("ETFs"), and American Depositary Receipts ("ADRs"), are valued at the closing price on the exchange or system where the security is principally traded, if available, or at the Nasdaq Official Closing Price. If there have been no sales for that day on the exchange or system, then a security is valued at the last available bid quotation on the exchange or system where the security is principally traded. In each of these situations, valuations are typically categorized as Level 1 in the fair value hierarchy.
Investments in open-end investment companies, other than ETFs, are valued at their net asset value ("NAV"). These valuations are typically categorized as Level 1 in the fair value hierarchy.
In the event that price quotations or valuations are not readily available, investments are valued at fair value in accordance with procedures established by and under the general supervision and responsibility of the Board. These valuations are typically categorized as Level 2 or Level 3 in the fair value hierarchy, based on the observability of inputs used to determine the fair value. The effect of fair value pricing is that securities may not be priced on the basis of quotations from the primary market in which they are traded and the actual price realized from the sale of a security may differ materially from the fair value price. Valuing these securities at fair value is intended to cause the Fund's NAV to be more reliable than it otherwise would be.
In accordance with procedures adopted by the Board, fair value pricing may be used if events materially affecting the value of foreign securities occur between the time the exchange on which they are traded closes and the time the Funds' NAV is calculated. The Funds use a systematic valuation model, provided daily by an independent third party to fair value their international equity securities. These valuations are categorized as Level 2 in the fair value hierarchy.
A summary of the valuations as of December 31, 2022, based upon the three levels defined above, is included in the table below while the breakdown, by category, of investments is disclosed on the Schedules of Portfolio Investments:
Level 1 | Level 2 | Level 3 | Total | ||||||||||||||||
RS International Fund | |||||||||||||||||||
Common Stocks | $ | — | $ | 331,049,252 | $ | — | $ | 331,049,252 | |||||||||||
Exchange-Traded Funds | 342,838 | — | — | 342,838 | |||||||||||||||
Collateral for Securities Loaned | 2,014,292 | — | — | 2,014,292 | |||||||||||||||
Total | $ | 2,357,130 | $ | 331,049,252 | $ | — | $ | 333,406,382 | |||||||||||
RS Global Fund | |||||||||||||||||||
Common Stocks | $ | 263,214,210 | $ | 141,749,517 | $ | — | $ | 404,963,727 | |||||||||||
Exchange-Traded Funds | 5,001,554 | — | — | 5,001,554 | |||||||||||||||
Collateral for Securities Loaned | 2,580,412 | — | — | 2,580,412 | |||||||||||||||
Total | $ | 270,796,176 | $ | 141,749,517 | $ | — | $ | 412,545,693 | |||||||||||
Sophus Emerging Markets Fund | |||||||||||||||||||
Common Stocks | $ | 49,499,455 | $ | 346,096,018 | $ | 84,883 | $ | 395,680,356 | |||||||||||
Total | $ | 49,499,455 | $ | 346,096,018 | $ | 84,883 | $ | 395,680,356 | |||||||||||
As of December 31, 2022, there were no significant transfers into/out of Level 3. The transfers into Level 3 investments for the Sophus Emerging Markets Fund were immaterial, although the change in unrealized appreciation/(depreciation) on these investments was $(22,348,388). These securities were
56
Victory Portfolios | Notes to Financial Statements — continued December 31, 2022 | ||||||
impacted by the invasion of Ukraine and sanctions on market conditions in Russia. From the start of the conflict in Ukraine until December 31, 2022, Russian-held investments were valued at an approximately 99 percent discount from their last traded prices.
Real Estate Investment Trusts ("REITs"):
The Funds may invest in REITs, which report information on the source of their distributions annually. REITs are pooled investment vehicles that invest primarily in income-producing real estate or real-estate related loans or interests (such as mortgages). Certain distributions received from REITs during the year are recorded as realized gains or return of capital as estimated by the Funds or when such information becomes known.
Investment Companies:
Exchange-Traded Funds:
The Funds may invest in ETFs, the shares of which are bought and sold on a securities exchange. An ETF trades like common stock and represents a fixed portfolio of securities often designed to track the performance and dividend yield of a particular domestic of foreign market index. The Funds may purchase shares of ETFs for a variety of purposes, including in connection with pursuing their investment programs to temporarily gain exposure to a portion of the U.S. or a foreign market, and for cash management and other purposes. The risks of owning an ETF generally reflect the risks of owning the underlying securities they are designed to track, although the lack of liquidity of an ETF could result in it being more volatile. Additionally, ETFs have fees and expenses that reduce their value.
Open-End Funds:
The Funds may invest in portfolios of open-end investment companies. These investment companies value securities in their portfolios for which market quotations are readily available at their market values (generally the last reported sale price) and all other securities and assets at their fair value by the methods established by the board of directors of the underlying funds.
Derivative Instruments:
Foreign Exchange Currency Contracts:
The Funds may enter into foreign exchange currency contracts to convert U.S. dollars to and from various foreign currencies. A foreign exchange currency contract is an obligation by a Fund to purchase or sell a specific currency at a future date at a price (in U.S. dollars) set at the time of the contract. The Funds do not engage in "cross-currency" foreign exchange contracts (i.e., contracts to purchase or sell one foreign currency in exchange for another foreign currency). The Funds' foreign exchange currency contracts might be considered spot contracts (typically a contract of one week or less) or forward contracts (typically a contract term over one week). A spot contract is entered into for purposes of hedging against foreign currency fluctuations relating to a specific portfolio transaction, such as the delay between a security transaction trade date and settlement date. Forward contracts are entered into for purposes of hedging portfolio holdings or concentrations of such holdings. The Funds enter into foreign exchange currency contracts solely for spot or forward hedging purposes, and not for speculative purposes (i.e., the Funds do not enter into such contracts solely for the purpose of earning foreign currency gains). Each foreign exchange currency contract is adjusted daily by the prevailing spot or forward rate of the underlying currency, and any appreciation or depreciation is recorded for financial statement purposes as unrealized until the contract settlement date, at which time the Funds record realized gains or losses equal to the difference between the value of a contract at the time it was opened and the value at the time it was closed. The Funds could be exposed to risk if a counterparty is unable to meet the terms of a foreign exchange currency contract or if the value of the foreign currency changes unfavorably. In addition, the use of foreign exchange currency contracts does not eliminate fluctuations in the underlying prices of the securities. For the year ended December 31, 2022, the Funds had no open forward foreign exchange currency contracts.
57
Victory Portfolios | Notes to Financial Statements — continued December 31, 2022 | ||||||
Investment Transactions and Related Income:
Changes in holdings of investments are accounted for no later than one business day following the trade date. For financial reporting purposes, however, investment transactions are accounted for on trade date or the last business day of the reporting period. Interest income is determined on the basis of coupon interest accrued using the effective interest method which adjusts, where applicable, the amortization of premiums or accretion of discounts. Dividend income is recorded on the ex-dividend date. Gains or losses realized on sales of securities are recorded on the identified cost basis.
Withholding taxes on interest, dividends, and gains as a result of certain investments by the Funds have been provided for in accordance with each investment's applicable country's tax rules and rates.
Securities Lending:
The Funds, through a Securities Lending Agreement with Citibank, N.A. ("Citibank"), may lend their securities to qualified financial institutions, such as certain broker-dealers and banks, to earn additional income, net of income retained by Citibank. Borrowers are required to initially secure their loans for collateral in the amount of at least 102% of the value of U.S. securities loaned or at least 105% of the value of non-U.S. securities loaned, marked-to-market daily. Any collateral shortfalls associated with increases in the valuation of the securities loaned are generally cured the next business day. The collateral can be received in the form of cash collateral and/or non-cash collateral. Non-cash collateral can include U.S. Government Securities and other securities as permitted by Securities and Exchange Commission ("SEC") guidelines. The cash collateral is invested in short-term instruments or cash equivalents, primarily open-end investment companies, as noted on the Funds' Schedules of Portfolio Investments. The Funds effectively do not have control of the non-cash collateral and therefore it is not disclosed on the Funds' Schedules of Portfolio Investments. Collateral requirements are determined daily based on the value of the Funds' securities on loan as of the end of the prior business day. During the time portfolio securities are on loan, the borrower will pay the Funds any dividends or interest paid on such securities plus any fee negotiated between the parties to the lending agreement. The Funds also earn a return from the collateral. The Funds pay Citibank various fees in connection with the investment of cash collateral and fees based on the investment income received from securities lending activities. Securities lending income (net of these fees) is disclosed on the Statements of Operations. Loans are terminable upon demand and the borrower must return the loaned securities within the lesser of one standard settlement period or five business days. Although risk is mitigated by the collateral, a Fund could experience a delay in recovering its securities and possible loss of income or value if the borrower fails to return them. In addition, there is a risk that the value of the short-term investments will be less than the amount of cash collateral required to be returned to the borrower.
The Funds' agreement with Citibank does not include master netting provisions. Non-cash collateral received by the Funds may not be sold or repledged, except to satisfy borrower default.
The following table is a summary of the Funds' securities lending transactions as of December 31, 2022.
| Value of Securities on Loan | Non-Cash Collateral | Cash Collateral | |||||||||||||
RS International Fund | $ | 1,937,422 | $ | — | $ | 2,014,292 | |||||||||
RS Global Fund | 2,481,935 | — | 2,580,412 | ||||||||||||
Foreign Currency Translations:
The accounting records of the Funds are maintained in U.S. dollars. Investment securities and other assets and liabilities of a Fund denominated in a foreign currency are translated into U.S. dollars at current exchange rates. Purchases and sales of securities, income receipts and expense payments are translated into U.S. dollars at the exchange rates on the date of the transactions. The Funds do not isolate the portion of the results of operations resulting from changes in foreign exchange rates on investments from fluctuations arising from changes in market prices of securities held. Such fluctuations
58
Victory Portfolios | Notes to Financial Statements — continued December 31, 2022 | ||||||
are disclosed as Net change in unrealized appreciation/depreciation on investment securities and foreign currency translations on the Statements of Operations. Any realized gains or losses from these fluctuations are disclosed as Net realized gains (losses) from investment securities and foreign currency transactions on the Statements of Operations.
Foreign Taxes:
The Funds may be subject to foreign taxes related to foreign income received (a portion of which may be reclaimable), capital gains on the sale of securities, and certain foreign currency transactions. All foreign taxes are recorded in accordance with the applicable regulations and rates that exist in the foreign jurisdictions in which the Funds invest.
Federal Income Taxes:
Each Fund intends to continue to qualify as a regulated investment company by complying with the provisions available to certain investment companies, as defined in applicable sections of the Internal Revenue Code, and to make distributions of net investment income and net realized gains sufficient to relieve it from all, or substantially all, federal income taxes. Accordingly, no provision for federal income taxes is required in the financial statements. The Funds have a tax year end of December 31.
For the year ended December 31, 2022, the Funds did not incur any income tax, interest, or penalties, and have recorded no liability for net unrecognized tax benefits relating to uncertain tax positions.
Management of the Funds has reviewed tax positions taken in tax years that remain subject to examination by all major tax jurisdictions, including federal (i.e., the last four tax years, which includes the current fiscal tax year end). Management believes that there is no tax liability resulting from unrecognized tax benefits related to uncertain tax positions taken.
Allocations:
Expenses directly attributable to a Fund are charged to that Fund, while expenses that are attributable to more than one fund in the Trust, or jointly with an affiliated trust, are allocated among the respective funds in the Trust and/or an affiliated trust based upon net assets or another appropriate basis.
Income, expenses (other than class-specific expenses such as transfer agent fees, state registration fees, printing fees, and 12b-1 fees), and realized and unrealized gains or losses on investments are allocated to each class of shares based on its relative net assets on the date income is earned or expenses and realized and unrealized gains and losses are incurred.
3. Purchases and Sales:
Purchases and sales of securities (excluding securities maturing less than one year from acquisition) for the year ended December 31, 2022, were as follows:
| Excluding U.S. Government Securities | |||||||||||
Purchases | Sales | ||||||||||
RS International Fund | $ | 102,757,834 | $ | 119,855,903 | |||||||
RS Global Fund | 258,305,914 | 105,749,072 | |||||||||
Sophus Emerging Markets Fund | 283,223,061 | 256,277,147 | |||||||||
4. Affiliated Fund Ownership:
The Funds offer shares for investment by other funds. The fund-of-funds do not invest in the underlying funds for the purpose of exercising management or control, and the affiliated fund-of-funds, annual
59
Victory Portfolios | Notes to Financial Statements — continued December 31, 2022 | ||||||
and semi-annual reports may be viewed at vcm.com. As of December 31, 2022, certain fund-of-funds owned total outstanding shares of the Funds as follows:
RS International Fund | Ownership % | ||||||
USAA Target Retirement Income Fund | 7.0 | ||||||
USAA Target Retirement 2030 Fund | 16.7 | ||||||
USAA Target Retirement 2040 Fund | 27.0 | ||||||
USAA Target Retirement 2050 Fund | 17.9 | ||||||
USAA Target Retirement 2060 Fund | 2.7 | ||||||
RS Global Fund | Ownership % | ||||||
Victory Strategic Allocation Fund | 1.3 | ||||||
Sophus Emerging Markets Fund | Ownership % | ||||||
USAA Target Retirement Income Fund | 1.1 | ||||||
USAA Target Retirement 2030 Fund | 2.2 | ||||||
USAA Target Retirement 2040 Fund | 3.2 | ||||||
USAA Target Retirement 2050 Fund | 2.6 | ||||||
USAA Target Retirement 2060 Fund | 0.4 | ||||||
Victory Strategic Allocation Fund | 0.5 | ||||||
5. Fees and Transactions with Affiliates and Related Parties:
Investment Advisory Fees:
Investment advisory services are provided to the Funds by the Adviser, which is a New York corporation registered as an investment adviser with the SEC.
Under the terms of the Investment Advisory Agreement, the Adviser is entitled to receive fees based on a percentage of the average daily net assets of each Fund. The rates at which the Adviser is paid by each Fund are included in the table below.
Flat Rate | |||||||
RS International Fund | 0.80 | % | |||||
RS Global Fund | 0.60 | % | |||||
Sophus Emerging Markets Fund | 1.00 | % | |||||
Amounts incurred and paid to VCM for the year ended December 31, 2022, are reflected on the Statements of Operations as Investment advisory fees.
Administration and Servicing Fees:
VCM also serves as the Funds' administrator and fund accountant. Under the Administration and Fund Accounting Agreement, VCM is entitled to receive fees based on a percentage of the average daily net assets of the Trust, Victory Variable Insurance Funds and Victory Portfolios II. The tiered rates at which VCM is paid by the Funds are shown in the table below:
Net Assets | |||||||||||
Up to $15 billion | $15 billion – $30 billion | Over $30 billion | |||||||||
0.08 | %, plus | 0.05 | %, plus | 0.04 | % | ||||||
Amounts incurred for the year ended December 31, 2022, are reflected on the Statements of Operations as Administration fees.
Citi Fund Services Ohio, Inc. ("Citi"), an affiliate of Citibank, acts as sub-administrator and sub-fund accountant to the Funds pursuant to the Sub-Administration and Sub-Fund Accounting Services Agreement between VCM and Citi. VCM pays Citi a fee for providing these services. The Funds reimburse VCM and Citi for out-of-pocket expenses incurred in providing these services and certain other expenses
60
Victory Portfolios | Notes to Financial Statements — continued December 31, 2022 | ||||||
specifically allocated to the Funds. Amounts incurred for the year ended December 31, 2022, are reflected on the Statements of Operations as Sub-Administration fees.
The Funds (as part of the Trust) have entered into an agreement with the Adviser to provide compliance services, pursuant to which the Adviser furnishes its compliance personnel, including the services of the Chief Compliance Officer ("CCO"), and other resources reasonably necessary to provide the Trust with compliance oversight services related to the design, administration, and oversight of a compliance program for the Trust in accordance with Rule 38a-1 under the 1940 Act. The CCO is an employee of the Adviser, which pays the compensation of the CCO and support staff. The funds in the Trust, Victory Variable Insurance Funds, Victory Portfolios II and USAA Mutual Funds (collectively, the "Victory Funds Complex"), in aggregate, compensate the Adviser for these services. Amounts incurred for the year ended December 31, 2022, are reflected on the Statements of Operations as Compliance fees.
Transfer Agency Fees:
FIS Investor Services, LLC ("FIS") serves as the Funds' transfer agent. Under the Transfer Agent Agreement, the Trust pays FIS a fee for its services and reimburses FIS for all of their reasonable out-of-pocket expenses incurred in providing these services. Amounts incurred for the year ended December 31, 2022, are reflected on the Statements of Operations as Transfer agent fees.
Distributor/Underwriting Services:
Victory Capital Services, Inc. (the "Distributor"), an affiliate of the Adviser, serves as Distributor for the continuous offering of the shares of the Funds pursuant to a Distribution Agreement between the Distributor and the Trust.
Pursuant to the Distribution and Service Plans adopted in accordance with Rule 12b-1 under the 1940 Act, the Distributor may receive a monthly distribution and service fee up to the annual rate shown in the table below:
Class A | Class C | Class R | |||||||||||||
RS International Fund | 0.25 | % | 1.00 | % | 0.50 | % | |||||||||
RS Global Fund | 0.25 | % | 1.00 | % | 0.50 | % | |||||||||
Sophus Emerging Markets Fund | 0.25 | % | 1.00 | % | 0.50 | % | |||||||||
The distribution and service fees paid to the Distributor may be used by the Distributor to pay for activities primarily intended to result in the sale of Class A, Class C, and Class R. Amounts incurred for the year ended December 31, 2022, are reflected on the Statements of Operations as 12b-1 fees.
In addition, the Distributor is entitled to receive commissions in connection with sales of the Class A. For the year ended December 31, 2022, the Distributor received $2,861 from commissions earned in connection with sales of Class A.
Other Fees:
Citibank serves as the Funds' custodian. The Funds pay Citibank a fee for providing these services. Amounts incurred for the year ended December 31, 2022, are reflected on the Statements of Operations as Custodian fees.
Sidley Austin LLP provides legal services to the Trust.
The Adviser has entered into expense limitation agreements with the Funds. Under the terms of the agreements, the Adviser has agreed to waive fees or reimburse certain expenses to the extent that ordinary operating expenses incurred by certain classes of a Fund in any fiscal year exceed the expense limit for such classes of the Fund. Such excess amounts will be the liability of the Adviser. Acquired fund fees and expenses, interest, taxes, brokerage commissions, other expenditures which are capitalized in accordance with GAAP, and other extraordinary expenses not incurred in the ordinary
61
Victory Portfolios | Notes to Financial Statements — continued December 31, 2022 | ||||||
course of the Fund's business are excluded from the expense limits. As of December 31, 2022, the expense limits (excluding voluntary waivers) are as follows:
In effect until April 30, 2023 | |||||||||||||||||||||||
Class A | Class C | Class R | Class R6 | Class Y | |||||||||||||||||||
RS International | 1.13 | % | 1.88 | % | 1.38 | % | 0.83 | % | 0.88 | % | |||||||||||||
RS Global Fund | 0.85 | % | 1.60 | % | 1.10 | % | 0.55 | % | 0.60 | % | |||||||||||||
Sophus Emerging Markets Fund | 1.34 | % | 2.14 | % | 1.58 | % | 0.89 | % | 0.99 | % | |||||||||||||
Under the terms of the expense limitation agreements, the Funds have agreed to repay fees and expenses that were waived or reimbursed by the Adviser for a period of up to three years (thirty-six (36) months) after the waiver or reimbursement took place, subject to the lesser of any operating expense limits in effect at the time of: (a) the original waiver or expense reimbursement; or (b) the recoupment, after giving effect to the recoupment amount.
As of December 31, 2022, the following amounts are available to be repaid to the Adviser. The Funds have not recorded any amounts available to be repaid as a liability due to an assessment that such repayments are not probable at December 31, 2022.
| Expires 2023 | Expires 2024 | Expires 2025 | Total | ||||||||||||||||
RS International Fund | $ | 491,864 | $ | 478,133 | $ | 438,795 | $ | 1,408,792 | |||||||||||
RS Global Fund | 690,062 | 1,055,677 | 899,922 | 2,645,661 | |||||||||||||||
Sophus Emerging Markets Fund | 1,137,721 | 1,536,446 | 1,401,240 | 4,075,407 | |||||||||||||||
The Adviser may voluntarily waive or reimburse additional fees to assist the Funds in maintaining competitive expense ratios. Voluntary waivers and reimbursements applicable to the Funds are not available to be recouped at a future time. There were no voluntary waivers or reimbursement for the year ended December 31, 2022.
Certain officers and/or interested trustees of the Funds are also officers and/or employees of the Adviser, administrator, fund accountant, sub-administrator, sub-fund accountant, custodian, legal counsel, and Distributor.
6. Risks:
The Funds may be subject to other risks in addition to these identified risks.
Equity Risk — The value of the equity securities in which the Funds invest may decline in response to developments affecting individual companies and/or general, economic conditions in the United States or abroad. A company's earnings or dividends may not increase as expected (or may decline) because of poor management, competitive pressures, reliance on particular suppliers or geographical regions, labor problems or shortages, corporate restructurings, fraudulent disclosures, man-made or natural disasters, military confrontations or wars, terrorism, public health crises, or other events, conditions, and factors. Price changes may be temporary or last for extended periods.
Foreign Securities Risk — Foreign securities (including depositary receipts) are subject to political, regulatory, and economic risks not present in domestic investments. Foreign securities could be affected by factors not present in the U.S., including expropriation, confiscation of property, and difficulties in enforcing contracts. Compared to U.S. companies, there generally is less publicly available information about foreign companies and there may be less governmental regulation and supervision of foreign companies. Foreign securities generally experience more volatility than their domestic counterparts. In addition, to the extent investments are made in a limited number of countries, events in those countries will have a more significant impact on the Fund. Fluctuations in the exchange rates between the U.S. dollar and foreign currencies, currency exchange control regulations, and restrictions or prohibitions on the repatriation of foreign currencies may negatively affect an investment.
Emerging Markets Risk — The risks related to investing in foreign securities are generally greater with respect to securities of companies that conduct their business activities in emerging markets or
62
Victory Portfolios | Notes to Financial Statements — continued December 31, 2022 | ||||||
whose securities are traded principally in emerging markets. The risks of investing in emerging markets include the risks of illiquidity, increased price volatility, smaller market capitalizations, less government regulation, less extensive and less frequent accounting, financial and other reporting requirements, risk of loss resulting from problems in share registration and custody, substantial economic and political disruptions and the nationalization of foreign deposits or assets.
Market Risk — Overall market risks may affect the value of the Funds. Domestic and international factors such as political events, war, terrorism, trade disputes, inflation rates, interest rate levels and other fiscal and monetary policy changes, cybersecurity incidents, pandemics and other public health crises, sanctions against a particular foreign country, its nationals, businesses or industries and related geopolitical events, as well as environmental disasters such as earthquakes, fires, and floods or other catastrophes, may add to instability in global economies and markets generally, and may lead to increased market volatility. Global economies and financial markets are highly interconnected, which increases the possibility that conditions in one country or region might adversely affect issuers in another country or region. The impact of these and other factors may be short-term or may last for extended periods.
7. Borrowing and Interfund Lending:
Line of Credit:
The Victory Funds Complex participates in a short-term demand note "Line of Credit" agreement with Citibank. The Line of Credit agreement with Citibank was renewed on June 27, 2022, with a termination date of June 26, 2023. Under the agreement with Citibank, the Victory Funds Complex may borrow up to $600 million, of which $300 million is committed and $300 million is uncommitted. $40 million of the Line of Credit is reserved for use by the Victory Floating Rate Fund, another series of the Victory Funds Complex, with Victory Floating Rate Fund paying the related commitment fees for that amount. The purpose of the Line of Credit is to meet temporary or emergency cash needs. For the year ended December 31, 2022, Citibank received an annual commitment fee of 0.15% on $300 million for providing the Line of Credit. Each fund in the Victory Funds Complex paid a pro-rata portion of the commitment fees plus any interest on amounts borrowed. For the period from January 1, 2022, through June 27, 2022, interest was based on the one-month London Interbank Offered Rate ("LIBOR") plus one percent. Effective with the renewal, for the period from June 28, 2022, through December 31, 2022, interest was based on the one-month Secured Overnight Financing Rate (SOFR) plus 1.10 percent. The Funds did not experience a material financial impact transitioning from LIBOR to SOFR. Interest charged to each fund during the period, if applicable, is reflected on the Statements of Operations under Line of credit fees.
The average borrowing for the days outstanding and average interest rate for the Funds during the year ended December 31, 2022, were as follows
| Amount Outstanding at December 31, 2022 | Average Borrowing* | Days Borrowing Outstanding | Average Interest Rate* | Maximum Borrowing During the Period | |||||||||||||||||||
| Sophus Emerging Markets Fund | $ | — | $ | 3,952,097 | 12 | 3.46 | % | $ | 5,187,838 | ||||||||||||||
* For the year ended December 31, 2022, based on the number of days borrowings were outstanding.
Interfund Lending:
The Trust and the Adviser rely on an exemptive order granted by the SEC in March 2017 (the "Order"), permitting the establishment and operation of an Interfund Lending Facility (the "Facility"). The Facility
63
Victory Portfolios | Notes to Financial Statements — continued December 31, 2022 | ||||||
allows each Fund to directly lend and borrow money to or from any other fund in the Victory Funds Complex that is permitted to participate in the Facility, relying upon the Order at rates beneficial to both the borrowing and lending funds. Advances under the Facility are allowed for temporary or emergency purposes, including the meeting of redemption requests that otherwise might require the untimely disposition of securities, and are subject to each Fund's borrowing restrictions. The interfund loan rate is determined, as specified in the Order, by averaging the current repurchase agreement rate and the current bank loan rate. As a Borrower, interest charged to each Fund, if any, during the period, is reflected on the Statements of Operations under Interfund lending fees. As a Lender, interest earned by each Fund, if any, during the period, is reflected on the Statements of Operations under Interfund lending.
The average borrowing or lending for the days outstanding and average interest rate for the Funds that utilized this Facility during the year ended December 31, 2022, were as follows:
| Borrower or Lender | Amount Outstanding at December 31, 2022 | Average Borrowing* | Days Borrowing Outstanding | Average Interest Rate* | Maximum Borrowing During the Period | |||||||||||||||||||||
RS International Fund | Borrower | $ | — | $ | 7,352,500 | 2 | 0.97 | % | $ | 7,521,000 | |||||||||||||||||
| Sophus Emerging Markets Fund | Borrower | — | 2,708,875 | 8 | 1.50 | % | 3,347,000 | ||||||||||||||||||||
* For the year ended December 31, 2022, based on the number of days borrowings were outstanding.
8. Federal Income Tax Information:
Dividends from net investment income, if any, are declared and paid as noted in the table below. Distributable net realized gains, if any, are declared and distributed at least annually from each Fund.
Declared | Paid | ||||||||||
RS International Fund | Annually | Annually | |||||||||
RS Global Fund | Annually | Annually | |||||||||
Sophus Emerging Markets Fund | Annually | Annually | |||||||||
The amounts of dividends from net investment income and distributions from net realized gains (collectively, distributions to shareholders) are determined in accordance with federal income tax regulations, which may differ from GAAP. To the extent these "book/tax" differences are permanent in nature (e.g., net operating loss and distribution reclassification), such amounts are reclassified within the components of net assets based on their federal tax-basis treatment; temporary differences (e.g., wash sales) do not require reclassification. To the extent dividends and distributions exceed net investment income and net realized gains for tax purposes, they are reported as distributions of capital. Net investment losses incurred by the Funds may be reclassified as an offset to capital on the accompanying Statements of Assets and Liabilities.
As of December 31, 2022, on the Statements of Assets and Liabilities, there were no permanent book-to-tax difference reclassification adjustments.
The tax character of distributions paid during the tax years ended, as noted below, were as follows (total distributions paid may differ from the Statements of Changes in Net Assets because, for tax purposes, dividends are recognized when actually paid).
Year Ended December 31, 2022 | |||||||||||||||||||||||
| Distributions Paid From: |
| |||||||||||||||||||||
| Ordinary Income | Net Long-Term Capital Gains | Total Taxable Distributions | Return of Capital | Total Distributions Paid | ||||||||||||||||||
RS International Fund | $ | 8,084,993 | $ | 777,246 | $ | 777,246 | $ | — | $ | 8,862,239 | |||||||||||||
RS Global Fund | 5,573,016 | — | 5,573,016 | 970 | 5,573,986 | ||||||||||||||||||
Sophus Emerging Markets Fund | 12,947,896 | — | 12,947,896 | — | 12,947,896 | ||||||||||||||||||
64
Victory Portfolios | Notes to Financial Statements — continued December 31, 2022 | ||||||
Year Ended December 31, 2021 | |||||||||||||||||||||||
Distributions Paid From: | |||||||||||||||||||||||
| Ordinary Income | Net Long-Term Capital Gains | Total Taxable Distributions | Return of Capital | Total Distributions Paid | |||||||||||||||||||
RS International Fund | $ | 11,266,524 | $ | 10,268,011 | $ | 21,534,535 | $ | — | $ | 21,534,535 | |||||||||||||
RS Global Fund | 8,707,700 | 3,659,424 | 12,367,124 | — | 12,367,124 | ||||||||||||||||||
Sophus Emerging Markets Fund | 9,828,717 | 11,506,626 | 21,335,343 | 319,013 | 21,654,356 | ||||||||||||||||||
As of December 31, 2022, the components of accumulated earnings/(loss) on a tax basis were as follows:
| Undistributed Ordinary Income | Accumulated Earnings | Accumulated Capital and Other Losses | Unrealized Appreciation (Depreciation)* | Total Accumulated Earnings (Loss) | ||||||||||||||||||
RS International Fund | $ | 4,068,160 | $ | 4,068,160 | $ | (12,855,233 | ) | $ | 5,323,493 | $ | (3,463,580 | ) | |||||||||||
RS Global Fund | — | — | (12,098,493 | ) | 16,953,431 | 4,854,938 | |||||||||||||||||
Sophus Emerging Markets Fund | 178,741 | 178,741 | (38,428,766 | ) | (37,688,231 | ) | (75,938,256 | ) | |||||||||||||||
* The difference between the book-basis and tax-basis unrealized appreciation (depreciation) is attributable primarily to tax deferral of losses on wash sales, derivatives and passive foreign investment company adjustments.
As of December 31, 2022, the Funds had net capital loss carryforwards as shown in the table below. It is unlikely that the Board will authorize a distribution of capital gains realized in the future until the capital loss carryforwards have been used.
| Short-Term Amount | Long-Term Amount | Total | ||||||||||||
RS International Fund | $ | 4,844,835 | $ | 8,010,398 | $ | 12,855,233 | |||||||||
RS Global Fund | 9,064,090 | 3,034,403 | 12,098,493 | ||||||||||||
Sophus Emerging Markets Fund | 30,127,105 | 8,301,661 | 38,428,766 | ||||||||||||
As of December 31, 2022, the cost basis for federal income tax purposes, gross unrealized appreciation, gross unrealized depreciation, and net unrealized appreciation (depreciation) for investments were as follows:
| Cost of Investments for Federal Tax Purposes | Net Gross Unrealized Appreciation | Gross Unrealized Depreciation | Net Unrealized Appreciation (Depreciation) | |||||||||||||||
| RS International Fund | $ | 328,081,848 | $ | 31,638,013 | $ | (26,313,479 | ) | $ | 5,324,534 | ||||||||||
| RS Global Fund | 395,586,674 | 48,299,925 | (31,340,906 | ) | 16,959,019 | ||||||||||||||
| Sophus Emerging Markets Fund | 432,606,969 | 37,592,264 | (74,518,877 | ) | (36,926,613 | ) | |||||||||||||
65
REPORT OF INDEPENDENT REGISTERED PUBLIC ACCOUNTING FIRM
To the Shareholders and Board of Trustees of Victory Portfolios
Opinion on the Financial Statements
We have audited the accompanying statements of assets and liabilities, including the schedules of portfolio investments, of Victory RS International Fund, Victory RS Global Fund, and Victory Sophus Emerging Markets Fund (the "Funds"), each a series of Victory Portfolios, as of December 31, 2022, the related statements of operations for the year then ended, the statements of changes in net assets for each of the two years in the period then ended, the related notes, and the financial highlights for each of the four years in the period then ended (collectively referred to as the "financial statements"). In our opinion, the financial statements present fairly, in all material respects, the financial position of the Funds as of December 31, 2022, the results of their operations for the year then ended, the changes in net assets for each of the two years in the period then ended, and the financial highlights for each of the four years in the period then ended, in conformity with accounting principles generally accepted in the United States of America.
The Funds' financial highlights for the year ended December 31, 2018, were audited by other auditors whose report dated February 26, 2019, expressed an unqualified opinion on those financial highlights.
Basis for Opinion
These financial statements are the responsibility of the Funds' management. Our responsibility is to express an opinion on the Funds' financial statements based on our audits. We are a public accounting firm registered with the Public Company Accounting Oversight Board (United States) ("PCAOB") and are required to be independent with respect to the Funds in accordance with the U.S. federal securities laws and the applicable rules and regulations of the Securities and Exchange Commission and the PCAOB.
We conducted our audits in accordance with the standards of the PCAOB. Those standards require that we plan and perform the audit to obtain reasonable assurance about whether the financial statements are free of material misstatement whether due to error or fraud.
Our audits included performing procedures to assess the risks of material misstatement of the financial statements, whether due to error or fraud, and performing procedures that respond to those risks. Such procedures included examining, on a test basis, evidence regarding the amounts and disclosures in the financial statements. Our procedures included confirmation of securities owned as of December 31, 2022, by correspondence with the custodian and brokers; when replies were not received from brokers, we performed other auditing procedures. Our audits also included evaluating the accounting principles used and significant estimates made by management, as well as evaluating the overall presentation of the financial statements. We believe that our audits provide a reasonable basis for our opinion.
We have served as the auditor of one or more of the investment companies advised by Victory Capital Management, Inc. since 2015.

COHEN & COMPANY, LTD.
Cleveland, Ohio
February 23, 2023
66
Victory Portfolios | Supplemental Information December 31, 2022 | ||||||
(Unaudited)
Trustee and Officer Information
Board of Trustees:
Overall responsibility for management of the Trust rests with the Board. The Trust is managed by the Board in accordance with the laws of the State of Delaware. There are currently nine Trustees, eight of whom are not "interested persons" of the Trust within the meaning of that term under the 1940 Act ("Independent Trustees") and one of whom is an "interested person" of the Trust within the meaning of that term under the 1940 Act ("Interested Trustee"). The Trustees, in turn, elect the officers of the Trust to actively supervise its day-to-day operations.
The following tables list the Trustees, their date of birth, their position with the Trust, their commencement of service, their principal occupations during the past five years, and any directorships of other investment companies or companies whose securities are registered under the Securities Exchange Act of 1934, as amended, or who file reports under that Act. Each Trustee oversees 37 portfolios in the Trust, 6 portfolios in Victory Variable Insurance Funds, and 25 portfolios in Victory Portfolios II, each a registered investment company that, together with the Trust, comprise the Victory Fund Complex. David C. Brown is a Trustee of USAA Mutual Funds and oversees 45 portfolios of the USAA Mutual Funds Trust. Each Trustee's address is c/o Victory Portfolios, 4900 Tiedeman Road, 4th Floor, Brooklyn, Ohio 44144. Each Trustee has an indefinite term.
Name and Date of Birth | Position Held with the Trust | Date Commenced Service | Principal Occupation During Past 5 Years | Other Directorships Held During Past 5 Years | |||||||||||||||
Independent Trustees. | |||||||||||||||||||
| David Brooks Adcock, October 1951 | Trustee | May 2005 | Consultant (since 2006). | Chairman, Board of Trustees, Turner Funds (December 2016-December 2017). | |||||||||||||||
| Nigel D. T. Andrews, April 1947 | Trustee | August 2002 | Retired. | Director, Carlyle Secured Lending, Inc. (formerly TCG BDC I, Inc.) (since 2012); Director, Carlyle Credit Solutions, Inc. (formerly TCG BDC II, Inc.) (since 2017); Trustee, Carlyle Secured Lending III (since 2021). | |||||||||||||||
| E. Lee Beard,* August 1951 | Trustee | May 2005 | Retired. | None. | |||||||||||||||
| Dennis M. Bushe, January 1944 | Trustee | July 2016 | Retired. | None. | |||||||||||||||
67
Victory Portfolios | Supplemental Information — continued December 31, 2022 | ||||||
(Unaudited)
Name and Date of Birth | Position Held with the Trust | Date Commenced Service | Principal Occupation During Past 5 Years | Other Directorships Held During Past 5 Years | |||||||||||||||
| John L. Kelly, April 1953 | Chair and Trustee | February 2015 | Partner, McCarvill Capital Partners (September 2016- September 2017). | Director, Caledonia Mining Corporation (since May 2012). | |||||||||||||||
| David L. Meyer, April 1957 | Trustee | December 2008 | Retired. | None. | |||||||||||||||
| Gloria S. Nelund, May 1961 | Trustee | July 2016 | Chair, CEO and Co-Founder of TriLinc Global, LLC, an investment firm. | TriLinc Global Impact Fund, LLC (since 2012). | |||||||||||||||
| Timothy Pettee, April 1958 | Advisory Trustee | January 2023 | Chief Investment Officer, Hoya Capital Real Estate LLC (since February 2022); Chief Investment Officer, Sun America Asset Management Corp., (January 2003-July 2021). | None. | |||||||||||||||
| Leigh A. Wilson, December 1944 | Trustee | November 1994 | Private Investor. | Chair (since 2013), Caledonia Mining Corporation. | |||||||||||||||
Interested Trustee. | |||||||||||||||||||
| David C. Brown,** May 1972 | Trustee | May 2008 | Chief Executive Officer and Chairman (since 2013), the Adviser; Chief Executive Officer and Chairman (since 2013), Victory Capital Holdings, Inc.; Director (since 2013), Victory Capital Services, Inc.; Director (since 2019), Victory Capital Transfer Agency, Inc. | Trustee, USAA Mutual Funds Trust; Board Member, Victory Capital Services, Inc. | |||||||||||||||
* The Board has designated Ms. Beard as its Audit Committee Financial Expert.
** Mr. Brown is an "Interested Person" by reason of his relationship with the Adviser.
The Statement of Additional Information includes additional information about the Trustees of the Trust and is available, without charge, by calling 800-539-3863.
68
Victory Portfolios | Supplemental Information — continued December 31, 2022 | ||||||
(Unaudited)
Officers:
The officers of the Trust, their date of birth, their commencement of service, and their principal occupations during the past five years, are detailed in the following table. Each officer serves until the earlier of his or her resignation, removal, retirement, death, or the election of a successor. The mailing address of each officer of the Trust is 4900 Tiedeman Road, 4th Floor, Brooklyn, Ohio 44144. The officers of the Trust receive no compensation directly from the Trust for performing the duties of their offices.
Name and Date of Birth | Position with the Trust | Date Commenced Service | Principal Occupation During Past 5 Years | ||||||||||||
| Christopher K. Dyer, February 1962 | President | February 2006 | Director of Mutual Fund Administration, the Adviser (since 2004); Chief Operating Officer, Victory Capital Services, Inc. (since 2020); Vice President, Victory Capital Transfer Agency, Inc. (since 2019). | ||||||||||||
| Scott A. Stahorsky, July 1969 | Vice President | December 2014 | Manager, Fund Administration, the Adviser. (since 2015). | ||||||||||||
| Thomas Dusenberry, July 1977 | Secretary | May 2022 | Manager, Fund Administration, the Adviser (since 2022); Treasurer and Principal Financial Officer (2020-2022), Assistant Treasurer (2019), Salient MF Trust, Salient Midstream, MLP Fund and Forward Funds; Principal Financial Officer (2018-2021) and Treasurer (2020-2021), Salient Private Access Funds and Endowment PMF Funds; Senior Vice President of Fund Accounting and Operations, Salient Partners (2020-2022); Director of Fund Operations, Salient Partners (2016-2019). | ||||||||||||
| Allan Shaer, March 1965 | Treasurer | May 2017 | Senior Vice President, Financial Administration, Citi Fund Services Ohio, Inc. (since 2016). | ||||||||||||
| Christopher A. Ponte, March 1984 | Assistant Treasurer | December 2017 | Manager, Fund Administration, the Adviser (since 2017); Chief Financial Officer, Victory Capital Services, Inc. (since 2018). | ||||||||||||
| Sean Fox, September 1976 | Chief Compliance Officer | June 2022 | Sr. Compliance Officer, the Adviser (since 2019); Compliance Officer, the Adviser (2015-2019). | ||||||||||||
| Charles Booth, April 1960 | Anti-Money Laundering Compliance Officer and Identity Theft Officer | May 2015 | Director, Regulatory Administration and CCO Support Services, Citi Fund Services Ohio, Inc. (since 2007). | ||||||||||||
| Jay G. Baris, January 1954 | Assistant Secretary | December 1997 | Partner, Sidley Austin LLP (since 2020); Partner, Shearman & Sterling LLP (2018-2020). | ||||||||||||
69
Victory Portfolios | Supplemental Information — continued December 31, 2022 | ||||||
(Unaudited)
Proxy Voting and Portfolio Holdings Information
Proxy Voting:
Information regarding the policies and procedures each Fund uses to determine how to vote proxies relating to portfolio securities is available without charge, upon request, by calling 800-539-3863. The information is also included in the Funds' Statement of Additional Information, which is available on the SEC's website at sec.gov.
Information relating to how the Funds voted proxies relating to portfolio securities held during the most recent 12 months ended June 30 is available on the SEC's website at sec.gov.
Availability of Schedules of Portfolio Investments:
The Trust files a complete list of Schedules of Portfolio Investments with the SEC for the first and third quarter of each fiscal year on Form N-PORT. Forms N-PORT are available on the SEC's website at sec.gov.
Expense Examples
As a shareholder of the Funds, you may incur two types of costs: (1) transaction costs, including sales charges (loads) on purchases; and (2) ongoing costs, including management fees and other Fund expenses. These examples are intended to help you understand your ongoing costs (in dollars) of investing in the Fund and to compare these costs with the ongoing costs of investing in other mutual funds.
These examples are based on an investment of $1,000 invested at the beginning of the period and held for the entire period from July 1, 2022, through December 31, 2022.
The Actual Expense figures in the table below provide information about actual account values and actual expenses. You may use the information below, together with the amount you invested, to estimate the expenses that you paid over the period. Simply divide your account value by $1,000 (for example, an $8,600 account value divided by $1,000 = 8.6), then multiply the result by the number in the table under the heading entitled "Actual Expenses Paid During Period" to estimate the expenses you paid on your account during this period.
The Hypothetical Expense figures in the table below provide information about hypothetical account values and hypothetical expenses based on the Fund's actual expense ratio and an assumed rate of return of 5% per year before expenses, which is not the Fund's actual return. The hypothetical account values and expenses may not be used to estimate the actual ending account balance or expenses you paid for the period. You may use this information to compare this 5% hypothetical example with the 5% hypothetical examples that appear in shareholder reports of other funds.
Please note the expenses shown in the table below are meant to highlight your ongoing costs only and do not reflect any transactional costs. Therefore, the hypothetical expenses in the table are useful in comparing ongoing costs only and will not help you determine the relative total costs of owning different funds. In addition, if these transactional costs were included, your costs would have been higher.
| Beginning Account Value 7/1/22 | Actual Ending Account Value 12/31/22 | Hypothetical Ending Account Value 12/31/22 | Actual Expenses Paid During Period 7/1/22-12/31/22* | Hypothetical Expenses Paid During Period 7/1/22-12/31/22* | Annualized Expense Ratio During Period 7/1/22-12/31/22 | ||||||||||||||||||||||
RS International Fund | |||||||||||||||||||||||||||
Class A | $ | 1,000.00 | $ | 1,064.80 | $ | 1,019.51 | $ | 5.88 | $ | 5.75 | 1.13 | % | |||||||||||||||
Class C | 1,000.00 | 1,061.50 | 1,015.73 | 9.77 | 9.55 | 1.88 | % | ||||||||||||||||||||
Class R | 1,000.00 | 1,063.80 | 1,018.25 | 7.18 | 7.02 | 1.38 | % | ||||||||||||||||||||
Class R6 | 1,000.00 | 1,067.10 | 1,021.02 | 4.32 | 4.23 | 0.83 | % | ||||||||||||||||||||
Class Y | 1,000.00 | 1,065.80 | 1,020.77 | 4.58 | 4.48 | 0.88 | % | ||||||||||||||||||||
70
Victory Portfolios | Supplemental Information — continued December 31, 2022 | ||||||
(Unaudited)
| Beginning Account Value 7/1/22 | Actual Ending Account Value 12/31/22 | Hypothetical Ending Account Value 12/31/22 | Actual Expenses Paid During Period 7/1/22-12/31/22* | Hypothetical Expenses Paid During Period 7/1/22-12/31/22* | Annualized Expense Ratio During Period 7/1/22-12/31/22 | ||||||||||||||||||||||
RS Global Fund | |||||||||||||||||||||||||||
Class A | $ | 1,000.00 | $ | 1,039.00 | $ | 1,020.92 | $ | 4.37 | $ | 4.33 | 0.85 | % | |||||||||||||||
Class C | 1,000.00 | 1,034.70 | 1,017.14 | 8.21 | 8.13 | 1.60 | % | ||||||||||||||||||||
Class R | 1,000.00 | 1,037.50 | 1,019.66 | 5.65 | 5.60 | 1.10 | % | ||||||||||||||||||||
Class R6 | 1,000.00 | 1,040.50 | 1,022.43 | 2.83 | 2.80 | 0.55 | % | ||||||||||||||||||||
Class Y | 1,000.00 | 1,040.30 | 1,022.18 | 3.09 | 3.06 | 0.60 | % | ||||||||||||||||||||
Sophus Emerging Markets Fund | |||||||||||||||||||||||||||
Class A | 1,000.00 | 956.90 | 1,018.45 | 6.61 | 6.82 | 1.34 | % | ||||||||||||||||||||
Class C | 1,000.00 | 952.50 | 1,014.42 | 10.53 | 10.87 | 2.14 | % | ||||||||||||||||||||
Class R | 1,000.00 | 955.50 | 1,017.24 | 7.79 | 8.03 | 1.58 | % | ||||||||||||||||||||
Class R6 | 1,000.00 | 958.90 | 1,020.72 | 4.39 | 4.53 | 0.89 | % | ||||||||||||||||||||
Class Y | 1,000.00 | 958.10 | 1,020.21 | 4.89 | 5.04 | 0.99 | % | ||||||||||||||||||||
* Expenses are equal to the average account value multiplied by the Fund's annualized expense ratio multiplied by 184/365 (the number of days in the most recent fiscal half-year divided by the number of days in the fiscal year).
71
Victory Portfolios | Supplemental Information — continued December 31, 2022 | ||||||
(Unaudited)
Additional Federal Income Tax Information
For the year ended December 31, 2022, the following Funds paid qualified dividend income for the purposes of reduced individual federal income tax rates of:
Percent | |||||||
| RS International Fund | 98 | % | |||||
| RS Global Fund | 100 | % | |||||
| Sophus Emerging Markets Fund | 69 | % | |||||
Dividends qualified for corporate dividends received deductions of:
Percent | |||||||
| RS Global Fund | 54 | % | |||||
For the year ended December 31, 2022, the following Funds designated short-term capital gain distributions:
Amount | |||||||
RS International Fund | $ | 251,185 | |||||
For the year ended December 31, 2022, the following Funds designated long-term capital gain distributions:
Amount | |||||||
| RS International Fund | $ | 777,246 | |||||
The following Funds intend to elect to pass through to shareholders the income tax credit for taxes paid to foreign countries. Foreign source income and foreign tax expense per outstanding share on December 31, 2022, were as follows:
| Foreign Source Income | Foreign Tax Expense | |||||||||
RS International Fund | $ | 0.38 | $ | 0.04 | |||||||
Sophus Emerging Markets Fund | 0.71 | 0.07 | |||||||||
72
Victory Portfolios | Supplemental Information — continued December 31, 2022 | ||||||
(Unaudited)
Considerations of the Board in Continuing the Investment Advisory Agreement (the "Agreement")
The Board approved the Agreement on behalf of each of the Funds at a meeting, which was called for that purpose, on December 6, 2022. The Board also considered information relating to the Funds and the Agreement provided throughout the year and, more specifically, at the meetings on October 18, 2022 and December 6, 2022. In considering whether to approve the Agreement, the Board requested, and the Adviser provided, information that the Board believed to be reasonably necessary to reach its conclusions.
The Board, including the Independent Trustees, evaluated this information along with other information obtained throughout the year and was advised by legal counsel to the Funds and independent legal counsel to the Independent Trustees. In addition, the Independent Trustees considered a past review of their overall process for conducting the annual review of the Funds' advisory arrangements by a consultant retained through their counsel.
The Board considered each Fund's advisory fee, expense ratio and investment performance as significant factors in determining whether the Agreement should be continued. In considering whether the compensation paid to the Adviser was fair and reasonable, the Board also evaluated, among other things, the following factors:
• The requirements of the Funds for the services provided by the Adviser;
• The nature, quality and extent of the services provided and expected to be provided;
• The performance of the Funds as compared to comparable funds;
• The fees payable for the services and whether the fee arrangements provided for economies of scale that would benefit Fund shareholders as the Funds grow (acknowledging that economies of scale can be complex to assess and typically are not directly measurable);
• Whether the fee would be sufficient to enable the Adviser to attract and retain experienced personnel and continue to provide quality services to the Funds;
• The fees paid by other clients of the Adviser whose accounts are managed in a similar investment style and any differences in the services provided to the other clients compared to those provided to the Funds;
• The total expenses of each Fund;
• Management's commitment to operating the Funds at competitive expense levels;
• The profitability of the Adviser (as reflected by comparing fees earned against an estimate of the Adviser's costs) with respect to the Adviser's relationship with the Funds;
• Research and other service benefits received by the Adviser obtained through payment of client commissions for securities transactions;
• Other benefits received by the Adviser, and its affiliates, including revenues paid to the Adviser, or its affiliates, by the Funds for administration and fund accounting services, and distribution;
• The capabilities and financial condition of the Adviser;
• Current economic and industry trends; and
• The historical relationship between each Fund and the Adviser.
The Board reviewed each Fund's current management fee, comprised of the advisory fee plus the administrative services fee paid to the Adviser, in the context of the Adviser's profitability with respect to each Fund individually. The Board retained an independent, third-party consultant to provide comparative information about fees, expenses and performance, and to design and maintain a database of relevant information designed to assist the Board in retrieving and analyzing comparative information. The Board met with the consultant to review its inputs and methodologies, among other things. The Board compared each Fund's gross management fee and total operating expense ratio on a net and gross basis with the median gross management fee and median expense ratio of a universe of comparable mutual funds compiled by the consultant and a peer group of funds with similar investment strategies selected by that consultant from the universe. The Board reviewed the factors and methodology used by the consultant in the selection of each Fund's peer group, including the consultant's selection of a broad universe of funds, the more specific universe of comparable funds, and peer groups of funds
73
Victory Portfolios | Supplemental Information — continued December 31, 2022 | ||||||
(Unaudited)
with comparable investment strategies and asset levels, among other factors. The Board also reviewed any changes to the consultant's methodology as compared to the prior year, including those resulting from the Adviser's input, if any. With respect to certain Funds, the Board also reviewed fees and other information related to the Adviser's management of similarly managed institutional or private accounts, and the differences in the services provided to the other accounts. The Board noted that none of the advisory fee arrangements for the Funds included breakpoints, which would be a structure that results in reduced fees as a fund grows. The Board also considered the Adviser's commitment to limit expenses as discussed in more detail below.
The Board also reviewed the compliance and administrative services provided to the Funds by the Adviser and its affiliates, including the Adviser's oversight of the Funds' day-to-day operations and oversight of Fund accounting, assistance in meeting legal and regulatory requirements, and other services necessary for the operation of the Funds and the Trust.
The Board found that the gross annual management fee paid by each Fund was within the range of management fees paid by each Fund's respective peer group. The Board also found that each Fund's Class A net annual expense ratio, taking into account any shareholder servicing or distribution fees, was reasonable as compared with each Fund's respective peer group. The Board considered the Adviser's contractual agreement with each Fund to waive its fees and reimburse expenses of certain classes for a specified period of time, as described in the Fund's prospectus.
The Board reviewed each Fund's performance over one-, three-, five- and ten-year periods (as applicable) against the performance of the Fund's selected peer group and benchmark index. The Board recognized that the performance of the Fund and the peer group funds are net of expenses, while the performance of the benchmark index reflects gross returns.
The Board reviewed various other specific factors with respect to each Fund, as described below. In their deliberations, the Trustees did not rank the importance of any particular information or factor considered and each Trustee may have attributed different weights to various factors.
RS International Fund:
The Board compared the Fund's Class A performance for the one-, three-, five- and ten-year periods ended June 30, 2022, to that of the median performance of the Fund's peer group and benchmark index for the same periods and considered the fact that the Fund underperformed the benchmark index for the one-, three- and ten-year periods, outperformed the benchmark index for the five-year period, and outperformed the peer group median for all of the periods reviewed.
Having considered, among other things: (1) the Fund's management fee compared to comparable mutual funds; (2) the Fund's total expense ratio compared to comparable mutual funds; (3) that the Adviser's willingness to limit the expenses of certain classes for a period of time would provide stability to the Fund's expenses for those share classes during that period; and (4) the Fund's performance during the periods reviewed, the Board concluded that the Agreement continued to be in the best interests of the Fund's shareholders.
RS Global Fund:
The Board compared the Fund's Class A performance for the one-, three- and five-year periods ended June 30, 2022, to that of the median performance of the Fund's peer group and benchmark index for the same periods and considered the fact that the Fund outperformed the benchmark index for all of the periods reviewed, underperformed the peer median group for the one-year period, and outperformed the peer group median for the three-, five- and ten-year periods.
Having considered, among other things: (1) the Fund's management compared to comparable mutual funds; (2) the Fund's total expense ratio compared to comparable mutual funds; (3) that the Adviser's willingness to limit the expenses of certain classes for a period of time would provide stability to the Fund's expenses for those share classes during that period; and (4) the Fund's performance during the periods reviewed, the Board concluded that the Agreement continued to be in the best interests of the Fund's shareholders.
74
Victory Portfolios | Supplemental Information — continued December 31, 2022 | ||||||
(Unaudited)
Sophus Emerging Markets Fund:
The Board compared the Fund's Class A performance for the one-, three-, five- and ten-year periods ended June 30, 2022, to that of the median performance of the Fund's peer group and benchmark index for the same periods and considered the fact that the Fund underperformed the benchmark index for all of the periods reviewed, underperformed the peer group median for the one-, five- and ten-year periods, and matched the peer group median for the three-year period.
Having considered, among other things: (1) the Fund's management fee compared to comparable mutual funds; (2) the Fund's total expense ratio compared to comparable mutual funds; (3) that the Adviser's willingness to limit the expenses of certain classes for a period of time would provide stability to the Fund's expenses for those share classes during that period; and (4) the Fund's performance during the periods reviewed, the Board concluded that the Agreement continued to be in the best interests of the Fund's shareholders.
Conclusion:
Based on its review of the information requested and provided, and following extended discussions, the Board determined that the Agreement, on behalf of the Funds discussed above, was consistent with the best interests of each Fund and its shareholders, and the Board unanimously approved the Agreement, on behalf of each Fund, for an additional annual period on the basis of the foregoing review and discussions and the following considerations, among others:
• The fairness and reasonableness of the investment advisory fee payable to the Adviser under the Agreement in light of the investment advisory services provided, the costs of these services, the profitability of the Adviser's relationship with the Fund and the comparability of the fee paid to the fees paid by other investment companies;
• The nature, quality and extent of the investment advisory services provided by the Adviser;
• The Adviser's entrepreneurial commitment to the management of the Funds and the creation of a broad-based family of funds, which entails a substantial commitment of the Adviser's resources to the successful operation of the Funds;
• The Adviser's representations regarding its staffing and capabilities to manage the Funds, including the retention of personnel with relevant portfolio management experience;
• The Adviser's efforts to enhance investment results by, among other things, developing and supporting quality portfolio management teams; and
• The overall high quality of the personnel, operations, financial condition, investment management capabilities, methodologies and performance of the Adviser.
75
Privacy Policy
Protecting the Privacy of Information
The Trust respects your right to privacy. We also know that you expect us to conduct and process your business in an accurate and efficient manner. To do so, we must collect and maintain certain personal information about you. This is the information we collect from you on applications or other forms, and from the transactions you make with us or third parties. It may include your name, address, social security number, account transactions and balances, and information about investment goals and risk tolerance.
We do not disclose any information about you or about former customers to anyone except as permitted or required by law. Specifically, we may disclose the information we collect to companies that perform services on our behalf, such as the transfer agent that processes shareholder accounts and printers and mailers that assist us in the distribution of investor materials. We may also disclose this information to companies that perform marketing services on our behalf. This allows us to continue to offer you Victory investment products and services that meet your investing needs, and to effect transactions that you request or authorize. These companies will use this information only in connection with the services for which we hired them. They are not permitted to use or share this information for any other purpose.
To protect your personal information internally, we permit access only by authorized employees and maintain physical, electronic, and procedural safeguards to guard your personal information.*
* You may have received communications regarding information about privacy policies from other financial institutions which gave you the opportunity to "opt-out" of certain information sharing with companies which are not affiliated with that financial institution. The Trust does not share information with other companies for purposes of marketing solicitations for products other than the Trust. Therefore, the Trust does not provide opt-out options to their shareholders.
Victory Funds
P.O. Box 182593
Columbus, Ohio 43218-2593

Visit our website at: | Call Victory at: | ||||||
vcm.com | 800-539-FUND (800-539-3863) | ||||||
VPRSIF-AR (12/22)

December 31, 2022
Annual Report
Victory INCORE Low Duration Bond Fund
Victory High Yield Fund
Victory Tax-Exempt Fund
Victory High Income Municipal Bond Fund
Victory Floating Rate Fund
vcm.com
News, Information And Education 24 Hours A Day, 7 Days A Week
The Victory Capital website gives fund shareholders, prospective shareholders, and investment professionals a convenient way to access fund information, get guidance, and track fund performance anywhere they can access the Internet. The site includes:
• Detailed performance records
• Daily share prices
• The latest fund news
• Investment resources to help you become a better investor
• A section dedicated to investment professionals
Whether you're a potential investor searching for the fund that matches your investment philosophy, a seasoned investor interested in planning tools, or an investment professional, vcm.com has what you seek. Visit us anytime. We're always open.
Victory Portfolios
TABLE OF CONTENTS
Shareholder Letter (Unaudited) | 3 | ||||||
| Managers' Commentary / Investment Overview (Unaudited) | 5 | ||||||
| Investment Objectives and Portfolio Holdings (Unaudited) | 17 | ||||||
Schedules of Portfolio Investments | |||||||
Victory INCORE Low Duration Bond Fund | 22 | ||||||
Victory High Yield Fund | 31 | ||||||
Victory Tax-Exempt Fund | 37 | ||||||
Victory High Income Municipal Bond Fund | 41 | ||||||
Victory Floating Rate Fund | 46 | ||||||
Financial Statements | |||||||
Statements of Assets and Liabilities | 54 | ||||||
Statements of Operations | 56 | ||||||
Statements of Changes in Net Assets | 58 | ||||||
Financial Highlights | 64 | ||||||
Notes to Financial Statements | 84 | ||||||
| Report of Independent Registered Public Accounting Firm | 100 | ||||||
Supplemental Information (Unaudited) | 101 | ||||||
Trustee and Officer Information | 101 | ||||||
Proxy Voting and Portfolio Holdings Information | 104 | ||||||
Expense Examples | 104 | ||||||
Additional Federal Income Tax Information | 106 | ||||||
Advisory Contract Approval | 107 | ||||||
Privacy Policy (inside back cover) | |||||||
1
IRA DISTRIBUTION WITHHOLDING DISCLOSURE
We generally must withhold federal income tax at a rate of 10% of the taxable portion of your distribution and, if you live in a state that requires state income tax withholding, at your state's tax rate. However, you may elect not to have withholding apply or to have income tax withheld at a higher rate. Any withholding election that you make will apply to any subsequent distribution unless and until you change or revoke the election. If you wish to make a withholding election, or change or revoke a prior withholding election, call 800-539-3863 (800-235-8396 for Member Class) and form W-4P (OMB No. 1545-0074 withholding certificate for pension or annuity payments) will be electronically sent.
If you do not have a withholding election in place by the date of a distribution, federal income tax will be withheld from the taxable portion of your distribution at a rate of 10%. If you must pay estimated taxes, you may be subject to estimated tax penalties if your estimated tax payments are not sufficient and sufficient tax is not withheld from your distribution.
For more specific information, please consult your tax adviser.
The Funds are distributed by Victory Capital Services, Inc. Victory Capital Management Inc. is the investment adviser to the Funds and receives fees from the Funds for performing services for the Funds.
This report is not authorized for distribution to prospective investors unless preceded or accompanied by a current prospectus of the Victory Funds.
For additional information about any Victory Fund, including fees, expenses, and risks, view our prospectus online at vcm.com or call 800-539-3863 (800-235-8396 for Member Class). Read it carefully before you invest or send money.
The information in this report is based on data obtained from recognized services and sources and is believed to be reliable. Any opinions, projections, or recommendations in this report are subject to change without notice and are not intended as individual investment advice. Past investment performance of the Funds, markets or securities mentioned herein should not be considered to be indicative of future results.
• NOT FDIC INSURED • NO BANK GUARANTEE • MAY LOSE VALUE

Call Victory at:
800-539-FUND (800-539-3863)
800-235-8396 for Member Class
Visit our website at:
vcm.com
2
Victory Funds Letter to Shareholders
(Unaudited)
Dear Shareholder,
Our most recent annual reporting period ending December 31, 2022, was filled with epic challenges. Even the most seasoned investors who have been through more than one economic cycle have not witnessed financial markets like this in a long time, if ever.
Consider what transpired and how the investing backdrop changed so abruptly. The year began well enough with ample liquidity and an encouraging outlook for corporate profits. But that optimism faded early and was punctuated by the start of a terrible war in Eastern Europe. This fueled rising energy prices and intensified an inflation problem that was proving to be more than "transitory."
The inflation data was particularly troublesome and surprised many with some of the highest readings since the 1970s. In response, the U.S. Federal Reserve (the "Fed") pivoted to a far more restrictive monetary policy than anyone anticipated. Over the course of 2022, the Fed boosted the Fed funds interest rate on seven different occasions by a total of 4.5 percentage points. And if that wasn't enough, zero-Covid policies in China further exacerbated supply chain issues and dampened the outlook for global growth.
As one might expect, all of these obstacles ratcheted up volatility across financial markets. Broad market stock indices pulled back substantially around the world. The S&P 500® Index, the bell-weather proxy for our domestic stock market, delivered a negative total return of more than 18% for our annual reporting period.
Perhaps what made 2022 even more difficult was the performance of fixed income markets, which normally are considered a safe haven in times of equity turmoil. But not this past year. In fact, the Bloomberg US Aggregate Bond Index—a proxy for a diversified fixed income portfolio and one that many investors and institutions follow closely—delivered a negative total return of approximately 13%, its worst annual performance since the 1970s. That's not exactly the offset to equity performance that many investors were expecting from bonds.
It was a tough year, and we fully acknowledge that the steady drumbeat of bad news and bouts of stomach-churning volatility can take a toll on investors' psyche. Nobody likes opening their account statements during declining markets; and even when markets snap back sharply (as happened this past July and October), investors often wonder if they have missed an opportunity.
Through all of the challenges in our most recent annual reporting period, we are reminded of two enduring realities: 1) financial markets are dynamic and apt to change abruptly; 2) it's vital that we remain calm and rational whenever faced with those inevitable bouts of turmoil.
Fortunately, we think that investors can take comfort knowing that all of our independent investment franchises have experience managing portfolios through a wide variety of market environments. Our investment professionals remain calm during turbulent financial markets, and we think it's imperative that investors do the same.
3
We still believe that a long-term plan, a well-diversified portfolio across asset classes and investment types, and a clear understanding of individual risk tolerances are the key ingredients for staying the course and progressing on investment goals. Moreover, all our investment professionals continually monitor the environment and work hard to position portfolios opportunistically no matter what the markets bring. Remember, turmoil can also create opportunity.
On the following pages you will find information relating to your Victory Funds investment. If you have any questions, we encourage you to contact your financial advisor. If you invest with us directly, you may call 800-539-3863 (800-235-8396 for Member Class) or visit our website at vcm.com.
From all of us here at Victory Capital, thank you for your ongoing confidence and for letting us help you work toward your investment goals.

Christopher K. Dyer, CFA
President,
Victory Funds
4
Victory INCORE Low Duration Bond Fund
Managers' Commentary
(Unaudited)
What were the market conditions during the reporting period?
The U.S. Federal Reserve (the "Fed"), reacting to elevated and more persistent than expected inflation, raised the Fed funds interest rate by 425 basis points (a basis point is 1/100th of a percentage point) in 2022, while shrinking the Fed balance sheet (quantitative tightening) by $358 billion from its peak in April. The U.S. Treasury yield curve bear-flattened and inverted in anticipation of a recession as short rates moved dramatically higher. In spread markets, investment-grade corporate bonds underperformed U.S. Treasury securities on a duration-adjusted basis by -1.25%. The Bloomberg US Aggregate Index finished the year down 13.01%, the worst year in index history. Even Treasury Inflation Protected Securities (TIPS) offered no respite, returning -11.85% during the year. The Bloomberg U.S. High Yield Index underperformed U.S. Treasury securities on a duration-adjusted basis by -3.71%, and finished the year down 11.19%, while the ICE BofA Investment Grade U.S. Convertible Index was down 7.74%. As the Fed outpaced most of the rest of the globe in rate hikes in 2022, the U.S. dollar appreciated against other major global currencies by 8.21%. Labor scarcity, inefficient regulatory policy ("greenflation"), war in Ukraine, and deglobalization (trading blocs now aligning based on geo-political alliance as well as some onshoring), contributed to persistent inflation in the United States and globally.
How did Victory INCORE Low Duration Bond Fund (the "Fund") perform during the reporting period?
The Fund returned -3.62% (Class A at net asset value), outperforming the Bloomberg U.S. Government 1-3 Year Bond Index, which returned -3.81% for the reporting period.
What strategies did you employ during the reporting period?
The Fund's shorter relative duration position (meaning less interest rate risk than the Index) provided the bulk of positive relative performance, with a long dollar position contributing as well. Allocations to corporate bonds, asset-backed securities, and collateralized mortgage obligations contributed negatively to relative performance. We maintain overweight positions in corporate credit, high yield, and investment-grade convertible bonds, in companies we believe have solid balance sheets where the business model can withstand higher interest costs. In addition, the Fund's employment of a derivatives strategy overlay to efficiently manage the overall portfolio risks associated with the Fund's strategy contributed positively to performance during the year.
5
Victory INCORE Low Duration Bond Fund
Investment Overview
(Unaudited)
Average Annual Total Return
Year Ended December 31, 2022
Class A | Class C | Class R | Class Y | ||||||||||||||||||||||||||||
INCEPTION DATE | 7/30/03 | 7/30/03 | 7/30/03 | 5/12/09 | |||||||||||||||||||||||||||
| Net Asset Value | Maximum Offering Price | Net Asset Value | Contingent Deferred Charges | Net Asset Value | Net Asset Value | Bloomberg U.S. Government 1-3 Year Bond Index1 | |||||||||||||||||||||||||
One Year | –3.62 | % | –5.76 | % | –4.26 | % | –5.21 | % | –4.03 | % | –3.30 | % | –3.81 | % | |||||||||||||||||
Five Year | 1.00 | % | 0.54 | % | 0.26 | % | 0.26 | % | 0.59 | % | 1.25 | % | 0.74 | % | |||||||||||||||||
Ten Year | 0.94 | % | 0.71 | % | 0.33 | % | 0.33 | % | 0.53 | % | 1.19 | % | 0.66 | % | |||||||||||||||||
The performance data quoted represents past performance and current returns may be lower or higher. The investment return and principal value will fluctuate so that an investor's shares, when redeemed, may be worth more or less than the original cost. To obtain performance information current to the most recent month's end, please visit vcm.com.
The maximum offering price figures reflect a maximum sales charge of 2.25% for Class A. Class C is not subject to an initial sales charge, but is subject to a deferred sales charge of 1.00% on shares redeemed within one year of purchase. Net Asset Value does not reflect sales charges. Total return measures the price change in a share assuming the reinvestment of all net investment income and realized capital gain distributions, if any. The total returns quoted do not reflect adjustments made to the enclosed financial statements in accordance with U.S. Generally Accepted Accounting Principles or the deduction of taxes that a shareholder would pay on net investment income and realized capital gain distributions, including reinvested distributions, or redemptions of shares. The total return figures set forth above include all waivers of fees. Without such fee waivers, the total returns would have been lower.
Victory INCORE Low Duration Bond Fund — Growth of $10,000

1The Bloomberg U.S. Government 1-3 Year Bond Index is generally considered to be representative of U.S. government bonds with maturities between one and three years. This index does not include the effect of sales charges, commissions, expenses, or taxes, is not representative of the Fund, and it is not possible to invest directly in an index.
The graph reflects investment of growth of a hypothetical $10,000 investment in the Fund.
The graph and table do not reflect the deduction of taxes that a shareholder would pay on Fund distributions or the redemption of shares.
Past performance is not indicative of future results.
6
Victory High Yield Fund
Managers' Commentary
(Unaudited)
What were the market conditions during the reporting period?
Riskier asset classes were punished in 2022, with the S&P 500® Index returning -18.11% for the year and multiple fixed income classes registering their worst returns ever. The 10-year U.S. Treasury returned -16.5%, the Bloomberg US Aggregate Bond Index returned -13.01% and the Bloomberg U.S. Corporate High Yield Index (the "Index") returned -11.19%. The year started with duration risk concerns, quickly passed to geo-political risks and faced steep inflation and recession worries the remainder of the year. U.S. high yield bonds outperformed U.S. Treasury bonds and investment-grade debt on shorter duration metrics and higher current yields even in a year of spread widening.
The U.S. Federal Reserve had to play catch up all year with rising rates against persistent inflation pressure. Economic growth slowed, and despite full employment, the corporate earnings results were choppy. Labor shortages and wage pressure, more supply chain imbalances, resurging COVID-19 implications and uneven fiscal policy responses all weighed heavily at different intervals throughout the year.
Through it all, companies in the below-investment-grade space reported decent earnings, considering the factors above and improved their credit metrics. Credit rating downgrades increased after the 18-month upgrade cycle post COVID-19, and the default rate inched higher but remains well below long-term averages.
The default rate typically has been the biggest driver of returns in the below-investment-grade space, and we agree with strategists' calls for it to continue higher in 2023 but not to levels of previous recessions or non-recessionary averages.
How did Victory High Yield Bond Fund (the "Fund") perform during the reporting period?
The Fund returned -16.87% (Class A at net asset value) for the fiscal year ended December 31, 2022, underperforming the Index, which returned -11.19% for the reporting period.
What strategies did you employ during the reporting period?
The Fund's management team takes a bottom-up and credit-by-credit approach to evaluating investments. We look for companies with strong free cash flow or situations in which our analysis finds less risk and more potential positive catalysts than the market is pricing in. We combine this credit selection with our larger market views, favoring some sectors for their cyclical strength during an economic rebound and others because of more secular, long-term trends.
The Fund had exposure to some sectors that were particularly volatile at certain times during the year. An overweight position, and security selection, in the Health Care sector detracted from performance relative to the Index, which is normally a very defensive sector during pre-recessionary periods. Revenues and demand were not the issues, but labor shortages and severe wage inflation were. Select investments in the Consumer Products and Building Materials sectors also hindered the Fund's relative performance. However, security selection in the Energy and Retail sectors contributed to the Fund's performance in addition to exposure in the out-of-index floating rate loan asset class to capture the rising coupon rate.
7
Victory High Yield Fund
Managers' Commentary (continued)
Even as volatility remains high and concern is mounting for a recessionary environment, we still believe there are attractive opportunities in U.S. high yield bonds. The high trailing 12-month yield of 8.15%, combined with total return potential of bonds trading near 85% of par, help to mitigate many of these risks. We expect default rates will rise but not spike, from a starting point of strong credit fundamentals and investor demand for yield.
8
Victory High Yield Fund
Investment Overview
(Unaudited)
Average Annual Total Return
Year Ended December 31, 2022
Class A | Class C | Class R | Class Y | ||||||||||||||||||||||||||||
INCEPTION DATE | 9/1/98 | 8/7/00 | 5/15/01 | 5/12/09 | |||||||||||||||||||||||||||
| Net Asset Value | Maximum Offering Price | Net Asset Value | Contingent Deferred Charges | Net Asset Value | Net Asset Value | Bloomberg U.S. Corporate High Yield Index1 | |||||||||||||||||||||||||
One Year | –16.87 | % | –18.79 | % | –17.41 | % | –18.19 | % | –17.07 | % | –16.58 | % | –11.19 | % | |||||||||||||||||
Five Year | 1.57 | % | 1.11 | % | 0.88 | % | 0.88 | % | 1.24 | % | 1.86 | % | 2.31 | % | |||||||||||||||||
Ten Year | 3.33 | % | 3.09 | % | 2.73 | % | 2.73 | % | 2.97 | % | 3.60 | % | 4.03 | % | |||||||||||||||||
The performance data quoted represents past performance and current returns may be lower or higher. The investment return and principal value will fluctuate so that an investor's shares, when redeemed, may be worth more or less than the original cost. To obtain performance information current to the most recent month's end, please visit vcm.com.
The maximum offering price figures reflect a maximum sales charge of 2.25% for Class A. Class C is not subject to an initial sales charge, but is subject to a deferred sales charge of 1.00% on shares redeemed within one year of purchase. Net Asset Value does not reflect sales charges. Total return measures the price change in a share assuming the reinvestment of all net investment income and realized capital gain distributions, if any. The total returns quoted do not reflect adjustments made to the enclosed financial statements in accordance with U.S. Generally Accepted Accounting Principles or the deduction of taxes that a shareholder would pay on net investment income and realized capital gain distributions, including reinvested distributions, or redemptions of shares. The total return figures set forth above include all waivers of fees. Without such fee waivers, the total returns would have been lower.
Victory High Yield Fund — Growth of $10,000

1The Bloomberg U.S. Corporate High Yield Index is generally considered to be representative of the investable universe of the U.S.-dominated high yield debt market. This index does not include the effect of sales charges, commissions, expenses, or taxes, is not representative of the Fund, and it is not possible to invest directly in an index.
The graph reflects investment of growth of a hypothetical $10,000 investment in the Fund.
The graph and table do not reflect the deduction of taxes that a shareholder would pay on Fund distributions or the redemption of shares.
Past performance is not indicative of future results.
9
Victory Tax-Exempt Fund
Managers' Commentary
(Unaudited)
What were the market conditions during the reporting period?
Like most fixed income asset classes, the municipal market posted negative returns in 2022. The Bloomberg Municipal Bond Index (the "Index") returned -8.53% for the year, marking the lowest calendar year return for the index since the early 1980s. As a result of the U.S. Federal Reserve's fight to reduce inflation, there was a significant increase in both U.S. Treasury and AAA Municipal rates in 2022. This increase in rates was a primary driver of the poor returns in municipal bonds. The municipal market was also hampered by significant investor outflows from municipal mutual funds. This decrease in demand combined with rising rates to drive municipal returns materially negative for the year. While the increase in rates in 2022 was painful in the short term, we believe the now higher rates bode well for future returns, as starting yield typically has been a good predictor for long-term fixed income returns. The starting yield of the Index increased from 1.11% to 3.55% for the year. We believe the new yield levels offer investors a better entry point into the municipal market and the levels are even more attractive when you consider the tax-free treatment of most municipal bonds.
How did Victory Tax-Exempt Fund (the "Fund") perform during the reporting period?
The Fund returned -11.70% (Class A at net asset value) for the fiscal year ended December 31, 2022, underperforming the Index, which returned -8.53% for the reporting period.
What strategies did you employ during the reporting period?
The Fund tends to be more credit-heavy than the Index, holding more BBB-rated (the lowest category, highest risk level of investment grade) bonds than the Index. We overweight these credits to provide additional tax-free income to our investors. These bonds performed poorly in 2022, as their prices decreased even more than AAA-rated bonds due to investors wanting to decrease risk in a down market. This dynamic helped drive the Fund's relative underperformance in 2022. However, as alluded to above, we believe our overweight to these bonds will serve investors well in the long term.
We remain committed to our core competency of evaluating, taking, and managing credit risk in the municipal market. We continue to build our portfolios bond-by-bond, relying on our assessment of fundamental credit risk and attempting to capture and distribute incremental yield that will drive higher long-term income to our investors. While there might be some volatility in the municipal market in the short term, we remain confident that the right approach is to focus on what matters in the long term.
10
Victory Tax-Exempt Fund
Investment Overview
(Unaudited)
Average Annual Total Return
Year Ended December 31, 2022
Class A | Class C | Class Y | |||||||||||||||||||||||||
INCEPTION DATE | 2/16/93 | 8/7/00 | 5/12/09 | ||||||||||||||||||||||||
| Net Asset Value | Maximum Offering Price | Net Asset Value | Contingent Deferred Charges | Net Asset Value | Bloomberg Municipal Bond Index1 | ||||||||||||||||||||||
One Year | –11.70 | % | –13.73 | % | –12.40 | % | –13.25 | % | –11.60 | % | –8.53 | % | |||||||||||||||
Five Year | 1.17 | % | 0.71 | % | 0.39 | % | 0.39 | % | 1.30 | % | 1.25 | % | |||||||||||||||
Ten Year | 1.82 | % | 1.58 | % | 1.18 | % | 1.18 | % | 1.94 | % | 2.13 | % | |||||||||||||||
The performance data quoted represents past performance and current returns may be lower or higher. The investment return and principal value will fluctuate so that an investor's shares, when redeemed, may be worth more or less than the original cost. To obtain performance information current to the most recent month's end, please visit vcm.com.
The maximum offering price figures reflect a maximum sales charge of 2.25% for Class A. Class C is not subject to an initial sales charge, but is subject to a deferred sales charge of 1.00% on shares redeemed within one year of purchase. Net Asset Value does not reflect sales charges. Total return measures the price change in a share assuming the reinvestment of all net investment income and realized capital gain distributions, if any. The total returns quoted do not reflect adjustments made to the enclosed financial statements in accordance with U.S. Generally Accepted Accounting Principles or the deduction of taxes that a shareholder would pay on net investment income and realized capital gain distributions, including reinvested distributions, or redemptions of shares. The total return figures set forth above include all waivers of fees. Without such fee waivers, the total returns would have been lower.
Victory Tax-Exempt Fund — Growth of $10,000
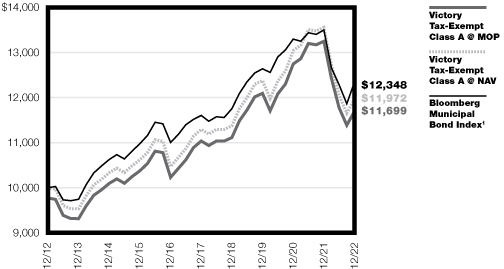
1The unmanaged Bloomberg Municipal Bond Index is generally considered to be representative of the municipal bond market. This index does not include the effect of sales charges, commissions, expenses, or taxes, is not representative of the Fund, and is not possible to invest directly in an index.
The graph reflects investment of growth of a hypothetical $10,000 investment in the Fund.
The graph and table do not reflect the deduction of taxes that a shareholder would pay on Fund distributions or the redemption of shares.
Past performance is not indicative of future results.
11
Victory High Income Municipal Bond Fund
Managers' Commentary
(Unaudited)
What were the market conditions during the reporting period?
Like most fixed income asset classes, the municipal market posted negative returns in 2022. The Bloomberg Municipal Bond Index (the "Index") returned -8.53% for the year, marking the lowest calendar year return for the Index since the early 1980s. As a result of the U.S. Federal Reserve's fight to reduce inflation, there was a significant increase in both U.S. Treasury and AAA Municipal rates in 2022. This increase in rates was a primary driver of the poor returns in municipal bonds. The municipal market was also hampered by significant investor outflows from municipal mutual funds. This decrease in demand combined with rising rates to drive municipal returns materially negative for the year. While the increase in rates in 2022 was painful in the short term, we believe the now higher rates bode well for future returns, as starting yield typically has been a good predictor for long-term fixed income returns. The starting yield of the Index increased from 1.11% to 3.55% for the year. We believe the new yield levels offer investors a better entry point into the municipal market and the levels are even more attractive when you consider the tax-free treatment of most municipal bonds.
How did Victory High Income Municipal Bond Fund (the "Fund") perform during the reporting period?
The Fund returned -14.48% (Class A at net asset value) for the fiscal year ended December 31, 2022, underperforming the Index, which returned -8.53% for the reporting period.
What strategies did you employ during the reporting period?
The Fund tends to be more credit-heavy than the Index, holding more BBB-rated (the lowest category, highest risk level of investment grade) bonds than the Index. We overweight these credits to provide additional tax-free income to our investors. These bonds performed poorly in 2022, as their prices decreased even more than AAA-rated bonds due to investors wanting to decrease risk in a down market. This dynamic helped drive the Fund's relative underperformance in 2022. However, as alluded to above, we believe our overweight to these bonds will serve investors well in the long term.
We remain committed to our core competency of evaluating, taking, and managing credit risk in the municipal market. We continue to build our portfolios bond-by-bond, relying on our assessment of fundamental credit risk and attempting to capture and distribute incremental yield that will drive higher long-term income to our investors. While there might be some volatility in the municipal market in the short term, we remain confident that the right approach is to focus on what matters in the long term.
12
Victory High Income Municipal Bond Fund
Investment Overview
(Unaudited)
Average Annual Total Return
Year Ended December 31, 2022
Class A | Class C | Class Y | Member Class | ||||||||||||||||||||||||||||||||
INCEPTION DATE | 12/31/09 | 12/31/09 | 12/31/09 | 11/2/20 | |||||||||||||||||||||||||||||||
| Net Asset Value | Maximum Offering Price | Net Asset Value | Contingent Deferred Charges | Net Asset Value | Net Asset Value | Bloomberg Municipal Bond Index1 | Bloomberg High Yield Municipal Bond Index2 | ||||||||||||||||||||||||||||
One Year | –14.48 | % | –16.44 | % | –15.14 | % | –15.96 | % | –14.29 | % | –14.35 | % | –8.53 | % | –13.10 | % | |||||||||||||||||||
Five Year | 0.71 | % | 0.25 | % | –0.05 | % | –0.05 | % | 0.94 | % | N/A | 1.25 | % | 2.63 | % | ||||||||||||||||||||
Ten Year | 2.09 | % | 1.86 | % | 1.47 | % | 1.47 | % | 2.33 | % | N/A | 2.13 | % | 3.49 | % | ||||||||||||||||||||
Since Inception | N/A | N/A | N/A | N/A | N/A | –2.55 | % | N/A | N/A | ||||||||||||||||||||||||||
The performance data quoted represents past performance and current returns may be lower or higher. The investment return and principal value will fluctuate so that an investor's shares, when redeemed, may be worth more or less than the original cost. To obtain performance information current to the most recent month's end, please visit vcm.com.
The maximum offering price figures reflect a maximum sales charge of 2.25% for Class A. Class C is not subject to an initial sales charge, but is subject to a deferred sales charge of 1.00% on shares redeemed within one year of purchase. Net Asset Value does not reflect sales charges. Total return measures the price change in a share assuming the reinvestment of all net investment income and realized capital gain distributions, if any. The total returns quoted do not reflect adjustments made to the enclosed financial statements in accordance with U.S. Generally Accepted Accounting Principles or the deduction of taxes that a shareholder would pay on net investment income and realized capital gain distributions, including reinvested distributions, or redemptions of shares. The total return figures set forth above include all waivers of fees. Without such fee waivers, the total returns would have been lower.
Victory High Income Municipal Bond Fund — Growth of $10,000
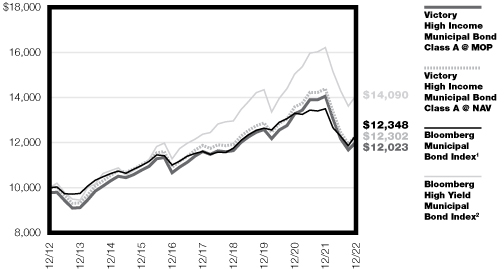
1The unmanaged Bloomberg Municipal Bond Index is generally considered to be representative of the municipal bond market. This index does not include the effect of sales charges, commissions, expenses, or taxes, is not representative of the Fund, and is not possible to invest directly in an index.
2The Bloomberg High Yield Municipal Bond Index is generally considered to be representative of the investable universe of the U.S. high-yield municipal debt market. This index does not include the effect of sales charges, commissions, expenses, or taxes, is not representative of the Fund, and it is not possible to invest directly in an index.
The graph reflects investment of growth of a hypothetical $10,000 investment in the Fund.
The graph and table do not reflect the deduction of taxes that a shareholder would pay on Fund distributions or the redemption of shares.
Past performance is not indicative of future results.
13
Victory Floating Rate Fund
Managers' Commentary
(Unaudited)
What were the market conditions during the reporting period?
Riskier asset classes were punished in 2022, with the S&P 500® Index returning -18.11% for the year and multiple fixed income classes registering their worst returns ever. The 10-year U.S. Treasury returned -16.5%, the Bloomberg US Aggregate Bond Index returned -13.01% and the Bloomberg U.S. Corporate High Yield Index returned -11.19%. The year started with duration risk concerns, quickly passed to geo-political risks and faced steep inflation and recession worries the remainder of the year. The Morningstar LSTA US Leveraged Loan Index (the "Index") returned -0.60%, a relative outlier as their current yields mitigated duration and inflation risk.
The U.S. Federal Reserve had to play catch up all year with rising rates against persistent inflation pressure. Economic growth slowed, and despite full employment, the corporate earnings results were choppy. Labor shortages and wage pressure, more supply chain imbalances, resurging COVID-19 implications and uneven fiscal policy responses all weighed heavily at different intervals throughout the year.
Through it all, companies in the below-investment-grade space reported decent earnings considering the factors above and improved their credit metrics. Credit rating downgrades increased after the 18-month upgrade cycle post COVID-19, and the default rate inched higher to 0.7%, but this is well below long-term averages.
The default rate typically has been the biggest driver of returns in the below-investment-grade space, and we agree with strategists' calls for it to continue higher in 2023 but not to levels of previous recessions or non-recessionary averages.
How did Victory Floating Rate Fund (the "Fund") perform during the reporting period?
The Fund returned -7.01% (Class A at net asset value) for the fiscal year ended December 31, 2022, underperforming the Index, which returned -0.60% for the reporting period.
What strategies did you employ during the reporting period?
The Fund's management team takes a bottom-up and credit-by-credit approach to evaluating investments. We look for companies with strong free cash flow or situations in which our analysis finds less risk and more potential positive catalysts than the market is pricing in. We combine this credit selection with our larger market views, favoring some sectors for their cyclical strength during an economic rebound and others because of more secular, long-term trends.
The Fund had exposure to some sectors that were particularly volatile at certain times during the year. An overweight position, and security selection, in the Health Care sector detracted from performance relative to the Index, which is normally a very defensive sector during pre-recessionary periods. Revenues and demand were not the issues, but labor shortages and severe wage inflation were. Select investments in the Retail and Building Materials sectors also hindered the Fund's relative performance, along with an allocation to fixed rate bonds in the first half of the year. However, security selection in the Energy and Chemicals sectors contributed to the Fund's performance in addition to exposure in the Industrials sector.
14
Victory Floating Rate Fund
Managers' Commentary (continued)
Even as floating bank loan rates remain elevated, pressuring some heavily indebted companies, we still believe there are attractive opportunities given the high current income, below average trading price of loans and very short duration. We believe default rates will rise but not spike, due to a starting point of strong credit fundamentals and investor demand for floating rate loans if short-term rates continue to rise.
15
Victory Floating Rate Fund
Investment Overview
(Unaudited)
Average Annual Total Return
Year Ended December 31, 2022
Class A | Class C | Class R | Class Y | Member Class | |||||||||||||||||||||||||||||||
INCEPTION DATE | 12/31/09 | 12/31/09 | 12/31/09 | 12/31/09 | 11/2/20 | ||||||||||||||||||||||||||||||
| Net Asset Value | Maximum Offering Price | Net Asset Value | Contingent Deferred Charges | Net Asset Value | Net Asset Value | Net Asset Value | Morningstar LSTA US Leveraged Loan Index1 | ||||||||||||||||||||||||||||
One Year | –7.01 | % | –9.06 | % | –7.77 | % | –8.65 | % | –7.55 | % | –6.80 | % | –6.87 | % | –0.60 | % | |||||||||||||||||||
Five Year | 2.16 | % | 1.70 | % | 1.32 | % | 1.32 | % | 1.59 | % | 2.36 | % | N/A | 3.31 | % | ||||||||||||||||||||
Ten Year | 2.72 | % | 2.48 | % | 2.07 | % | 2.07 | % | 2.18 | % | 2.94 | % | N/A | 3.67 | % | ||||||||||||||||||||
Since Inception | N/A | N/A | N/A | N/A | N/A | N/A | 0.53 | % | N/A | ||||||||||||||||||||||||||
The performance data quoted represents past performance and current returns may be lower or higher. The investment return and principal value will fluctuate so that an investor's shares, when redeemed, may be worth more or less than the original cost. To obtain performance information current to the most recent month's end, please visit vcm.com.
The maximum offering price figures reflect a maximum sales charge of 2.25% for Class A. Class C is not subject to an initial sales charge, but is subject to a deferred sales charge of 1.00% on shares redeemed within one year of purchase. Net Asset Value does not reflect sales charges. Total return measures the price change in a share assuming the reinvestment of all net investment income and realized capital gain distributions, if any. The total returns quoted do not reflect adjustments made to the enclosed financial statements in accordance with U.S. Generally Accepted Accounting Principles or the deduction of taxes that a shareholder would pay on net investment income and realized capital gain distributions, including reinvested distributions, or redemptions of shares. The total return figures set forth above include all waivers of fees. Without such fee waivers, the total returns would have been lower.
Victory Floating Rate Fund — Growth of $10,000

1The Morningstar LSTA US Leveraged Loan Index covers more than 1,100 loan facilities and reflects the market-value-weighted performance of U.S. dollar-denominated institutional leverages loans. This index does not include the effect of sales charges, commissions, expenses, or taxes, is not representative of the Fund, and it is not possible to invest directly in an index. Effective at the close of business August 26, 2022, the index was rebranded from S&P/LSTA U.S. Leveraged Loan Index.
The graph reflects investment of growth of a hypothetical $10,000 investment in the Fund.
The graph and table do not reflect the deduction of taxes that a shareholder would pay on Fund distributions or the redemption of shares.
Past performance is not indicative of future results.
16
| Victory Portfolios Victory INCORE Low Duration Bond Fund | December 31, 2022 | ||||||
(Unaudited)
Investment Objective and Portfolio Holdings:
The Fund seeks to provide a high level of current income consistent with preservation of capital.
Asset Allocation*:
December 31, 2022
(% of Net Assets)

* Does not include futures contracts, money market instruments, and short-term investments purchased with cash collateral from securities loaned.
Percentages are of the net assets of the Fund and may not equal 100%.
Refer to the Schedule of Portfolio Investments for a complete list of securities.
17
| Victory Portfolios Victory High Yield Fund | December 31, 2022 | ||||||
(Unaudited)
Investment Objective and Portfolio Holdings:
The Fund seeks to provide current income. Capital appreciation is a secondary objective.
Asset Allocation*:
December 31, 2022
(% of Net Assets)

* Does not include futures contracts, money market instruments, and short-term investments purchased with cash collateral from securities loaned.
Percentages are of the net assets of the Fund and may not equal 100%.
Refer to the Schedule of Portfolio Investments for a complete list of securities.
18
| Victory Portfolios Victory Tax-Exempt Fund | December 31, 2022 | ||||||
(Unaudited)
Investment Objective and Portfolio Holdings:
The Fund seeks to maximize current income exempt from federal income taxes, consistent with the preservation of capital.
Asset Allocation*:
December 31, 2022
(% of Net Assets)
* Does not include futures contracts, money market instruments, and short-term investments purchased with cash collateral from securities loaned.
Percentages are of the net assets of the Fund and may not equal 100%.
Refer to the Schedule of Portfolio Investments for a complete list of securities.
19
| Victory Portfolios Victory High Income Municipal Bond Fund | December 31, 2022 | ||||||
(Unaudited)
Investment Objective and Portfolio Holdings:
The Fund seeks to provide a high current income exempt from federal income tax with a secondary objective of capital appreciation.
Asset Allocation*:
December 31, 2022
(% of Net Assets)

* Does not include futures contracts, money market instruments, and short-term investments purchased with cash collateral from securities loaned.
Percentages are of the net assets of the Fund and may not equal 100%.
Refer to the Schedule of Portfolio Investments for a complete list of securities.
20
| Victory Portfolios Victory Floating Rate Fund | December 31, 2022 | ||||||
(Unaudited)
Investment Objective and Portfolio Holdings:
The Fund seeks to provide a high level of current income.
Top 10 Holdings*:
December 31, 2022
(% of Net Assets)
WestJet Airlines Ltd., Initial Term Loan, First Lien | 1.7 | % | |||||
Fertitta Entertainment LLC, Initial B Term Loan, First Lien | 1.7 | % | |||||
AAdvantage Loyalty IP Ltd., Initial Term Loan, First Lien | 1.6 | % | |||||
iHeartCommunications, Inc., Term Loans, First Lien | 1.6 | % | |||||
19th Holdings Golf LLC, Initial Term Loans, First Lien | 1.6 | % | |||||
Intelsat Jackson Holdings SA, Term B loan, First Lien | 1.5 | % | |||||
Delta Air Lines, Inc. and Skymiles IP Ltd., Initial Term Loan, First Lien | 1.5 | % | |||||
Mileage Plus Holdings LLC, Initial Term Loan, First Lien | 1.5 | % | |||||
Petco Health and Wellness Co., Inc., Initial Term Loans, First Lien | 1.5 | % | |||||
Harbor Purchaser, Inc. | 1.4 | % | |||||
Sector Allocation*:
December 31, 2022
(% of Net Assets)
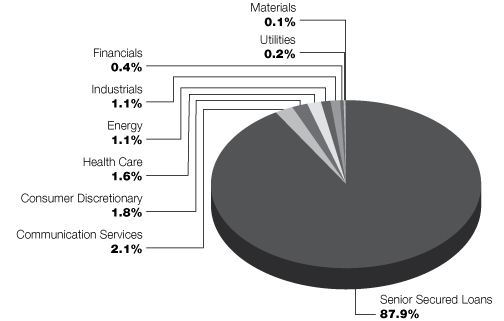
* Does not include futures contracts, money market instruments, and short-term investments purchased with cash collateral from securities loaned.
Percentages are of the net assets of the Fund and may not equal 100%.
Refer to the Schedule of Portfolio Investments for a complete list of securities.
21
| Victory Portfolios Victory INCORE Low Duration Bond Fund | Schedule of Portfolio Investments December 31, 2022 | ||||||
Security Description | Principal Amount | Value | |||||||||
Asset-Backed Securities (7.4%) | |||||||||||
| AmeriCredit Automobile Receivables Trust, Series 2021-1, Class C, 0.89%, 10/19/26, Callable 2/18/25 @ 100 | $ | 1,815,000 | $ | 1,666,561 | |||||||
| CarMax Auto Owner Trust, Series 2020-4, Class B, 0.85%, 6/15/26, Callable 12/15/24 @ 100 | 434,000 | 399,973 | |||||||||
| GM Financial Automobile Leasing Trust, Series 2021-1, Class C, 0.70%, 2/20/25, Callable 8/20/23 @ 100 | 1,168,000 | 1,136,201 | |||||||||
| GM Financial Consumer Automobile Receivables Trust, Series 2021-2, Class C, 1.28%, 1/19/27, Callable 4/16/25 @ 100 | 886,000 | 797,426 | |||||||||
| JPMorgan Chase Bank NA, Series 2021-2, Class B, 0.89%, 12/26/28, Callable 6/25/25 @ 100 (a) | 474,128 | 453,125 | |||||||||
| Santander Drive Auto Receivables Trust, Series 2021-1, Class C, 0.75%, 2/17/26, Callable 9/15/24 @ 100 | 937,635 | 921,343 | |||||||||
| Santander Drive Auto Receivables Trust, Series 2021-2, Class C, 0.90%, 6/15/26, Callable 12/15/24 @ 100 | 1,125,000 | 1,092,523 | |||||||||
| Santander Drive Auto Receivables Trust, Series 2021-3, Class C, 0.95%, 9/15/27, Callable 11/15/24 @ 100 | 915,000 | 882,628 | |||||||||
| Santander Retail Auto Lease Trust, Series 2021-A, Class C, 1.14%, 3/20/26, Callable 4/20/24 @ 100 (a) | 2,200,000 | 2,079,442 | |||||||||
| United Auto Credit Securitization Trust, Series 2022-1, Class C, 2.61%, 6/10/27, Callable 1/10/25 @ 100 (a) | 731,000 | 702,722 | |||||||||
| Westlake Automobile Receivables Trust, Series 2021-1A, Class C, 0.95%, 3/16/26, Callable 11/15/24 @ 100 (a) | 1,230,000 | 1,178,725 | |||||||||
| Westlake Automobile Receivables Trust, Series 2021-2A, Class C, 0.89%, 7/15/26, Callable 2/15/25 @ 100 (a) | 1,223,000 | 1,152,945 | |||||||||
| Westlake Automobile Receivables Trust, Series 2022-1A, Class C, 3.11%, 3/15/27, Callable 6/15/25 @ 100 (a) | 1,000,000 | 947,453 | |||||||||
Total Asset-Backed Securities (Cost $14,126,934) | 13,411,067 | ||||||||||
Collateralized Mortgage Obligations (16.3%) | |||||||||||
| Banc of America Commercial Mortgage Trust, Series 2015-UBS7, Class A4, 3.71%, 9/15/48, Callable 9/15/25 @ 100 | 1,000,000 | 950,401 | |||||||||
| CFCRE Commercial Mortgage Trust, Series 2016-C3, Class A3, 3.87%, 1/10/48, Callable 1/10/26 @ 100 | 925,000 | 881,155 | |||||||||
| CFCRE Commercial Mortgage Trust, Series 2016-C3, Class A2, 3.60%, 1/10/48, Callable 1/10/26 @ 100 | 494,860 | 468,988 | |||||||||
| CFCRE Commercial Mortgage Trust, Series 2016-C4, Class A2, 3.28%, 5/10/58, Callable 5/10/26 @ 100 | 489,000 | 454,101 | |||||||||
| Citigroup Commercial Mortgage Trust, Series 2015-GC29, Class A4, 3.19%, 4/10/48, Callable 4/10/25 @ 100 | 465,000 | 440,838 | |||||||||
| Citigroup Commercial Mortgage Trust, Series 2016-P4, Class A4, 2.90%, 7/10/49, Callable 7/10/26 @ 100 | 1,226,000 | 1,124,708 | |||||||||
| Citigroup Commercial Mortgage Trust, Series 2015-GC33, Class A4, 3.78%, 9/10/58, Callable 5/10/26 @ 100 | 1,502,000 | 1,432,112 | |||||||||
| Citigroup Commercial Mortgage Trust, Series 2015-P1, Class A5, 3.72%, 9/15/48, Callable 5/15/26 @ 100 | 1,662,000 | 1,583,427 | |||||||||
| COMM Mortgage Trust, Series 2013-CR10, Class A4, 4.21%, 8/10/46, Callable 8/10/23 @ 100 (b) | 2,000,000 | 1,982,606 | |||||||||
See notes to financial statements.
22
| Victory Portfolios Victory INCORE Low Duration Bond Fund | Schedule of Portfolio Investments — continued December 31, 2022 | ||||||
Security Description | Principal Amount | Value | |||||||||
| COMM Mortgage Trust, Series 2015-CR25, Class A4, 3.76%, 8/10/48, Callable 8/10/25 @ 100 | $ | 1,219,000 | $ | 1,164,706 | |||||||
| CSAIL Commercial Mortgage Trust, Series 2016-C6, Class A5, 3.09%, 1/15/49, Callable 5/15/26 @ 100 | 696,000 | 641,101 | |||||||||
| CSAIL Commercial Mortgage Trust, Series 2015-C3, Class A4, 3.72%, 8/15/48, Callable 8/15/25 @ 100 | 1,280,899 | 1,222,790 | |||||||||
| CSAIL Commercial Mortgage Trust, Series 2015-C2, Class A4, 3.50%, 6/15/57, Callable 5/15/25 @ 100 | 667,000 | 630,589 | |||||||||
| CSAIL Commercial Mortgage Trust, Series 2015-C4, Class A4, 3.81%, 11/15/48, Callable 11/15/25 @ 100 | 832,000 | 793,239 | |||||||||
| GS Mortgage Securities Trust, Series 2015-GC30, Class A4, 3.38%, 5/10/50, Callable 5/10/25 @ 100 | 1,624,000 | 1,541,516 | |||||||||
| GS Mortgage Securities Trust, Series 2016-GS2, Class A4, 3.05%, 5/10/49, Callable 5/10/26 @ 100 | 1,778,000 | 1,650,260 | |||||||||
| GS Mortgage Securities Trust, Series 2015-GC32, Class A4, 3.76%, 7/10/48, Callable 7/10/25 @ 100 | 1,098,000 | 1,046,868 | |||||||||
| JPMBB Commercial Mortgage Securities Trust, Series 2015-C33, Class A4, 3.77%, 12/15/48, Callable 11/15/25 @ 100 | 1,938,000 | 1,850,461 | |||||||||
| JPMBB Commercial Mortgage Securities Trust, Series 2015-C28, Class A4, 3.23%, 10/15/48, Callable 4/15/25 @ 100 | 1,191,000 | 1,131,192 | |||||||||
| JPMBB Commercial Mortgage Securities Trust, Series 2015-C31, Class A3, 3.80%, 8/15/48, Callable 8/15/25 @ 100 | 453,164 | 434,363 | |||||||||
| JPMBB Commercial Mortgage Securities Trust, Series 2016-C1, Class A5, 3.58%, 3/17/49, Callable 2/15/26 @ 100 | 1,321,000 | 1,246,913 | |||||||||
| Morgan Stanley Bank of America Merrill Lynch Trust, Series 2016-C29, Class A4, 3.33%, 5/15/49, Callable 5/15/26 @ 100 | 2,018,000 | 1,884,144 | |||||||||
| Wells Fargo Commercial Mortgage Trust, Series 2015-C29, Class A4, 3.64%, 6/15/48, Callable 6/15/25 @ 100 | 1,092,000 | 1,041,424 | |||||||||
| Wells Fargo Commercial Mortgage Trust, Series 2015-C31, Class A4, 3.70%, 11/15/48, Callable 11/15/25 @ 100 | 1,593,000 | 1,513,711 | |||||||||
| Wells Fargo Commercial Mortgage Trust, Series 2015-C28, Class A4, 3.54%, 5/15/48, Callable 5/15/25 @ 100 | 732,000 | 694,147 | |||||||||
| Wells Fargo Commercial Mortgage Trust, Series 2015-P2, Class A4, 3.81%, 12/15/48, Callable 12/15/25 @ 100 | 532,000 | 506,067 | |||||||||
| Wells Fargo Commercial Mortgage Trust, Series 2015-C30, Class A4, 3.66%, 9/15/58, Callable 8/15/25 @ 100 | 1,248,000 | 1,188,287 | |||||||||
Total Collateralized Mortgage Obligations (Cost $31,051,174) | 29,500,114 | ||||||||||
Convertible Corporate Bonds (5.5%) | |||||||||||
Consumer Discretionary (0.8%): | |||||||||||
Booking Holdings, Inc., 0.75%, 5/1/25 (c) | 525,000 | 703,652 | |||||||||
Expedia Group, Inc., 2/15/26 (d) | 590,000 | 512,521 | |||||||||
Ford Motor Co., 3/15/26 (d) | 290,000 | 274,427 | |||||||||
1,490,600 | |||||||||||
Energy (0.8%): | |||||||||||
Pioneer Natural Resources Co., 0.25%, 5/15/25 | 565,000 | 1,318,744 | |||||||||
See notes to financial statements.
23
| Victory Portfolios Victory INCORE Low Duration Bond Fund | Schedule of Portfolio Investments — continued December 31, 2022 | ||||||
Security Description | Shares or Principal Amount | Value | |||||||||
Financials (1.2%): | |||||||||||
Ares Capital Corp., 4.63%, 3/1/24 | $ | 730,000 | $ | 772,289 | |||||||
| Barclays Bank PLC 2/4/25 (d) | 270,000 | 349,326 | |||||||||
2/18/25 (d) | 230,000 | 239,260 | |||||||||
JPMorgan Chase Financial Co. LLC, 0.25%, 5/1/23 (a) | 800,000 | 813,152 | |||||||||
2,174,027 | |||||||||||
Health Care (0.7%): | |||||||||||
Anthem, Inc., 2.75%, 10/15/42 | 110,000 | 804,709 | |||||||||
Illumina, Inc., 8/15/23 (d) | 530,000 | 512,913 | |||||||||
1,317,622 | |||||||||||
Industrials (0.5%): | |||||||||||
Southwest Airlines Co., 1.25%, 5/1/25 (c) | 710,000 | 856,224 | |||||||||
Information Technology (1.3%): | |||||||||||
Akamai Technologies, Inc., 0.13%, 5/1/25 | 375,000 | 395,951 | |||||||||
Block, Inc., 0.25%, 11/1/27 | 195,000 | 147,654 | |||||||||
Euronet Worldwide, Inc., 0.75%, 3/15/49, Callable 3/20/25 @ 100 | 730,000 | 692,157 | |||||||||
Vishay Intertechnology, Inc., 2.25%, 6/15/25 | 225,000 | 218,093 | |||||||||
Western Digital Corp., 1.50%, 2/1/24 | 995,000 | 949,618 | |||||||||
2,403,473 | |||||||||||
Real Estate (0.2%): | |||||||||||
Kite Realty Group LP, 0.75%, 4/1/27 (a) | 435,000 | 401,979 | |||||||||
Total Convertible Corporate Bonds (Cost $9,300,675) | 9,962,669 | ||||||||||
Convertible Preferred Stocks (1.7%) | |||||||||||
Financials (1.0%): | |||||||||||
Bank of America Corp., Series L, 7.25% (e) | 655 | 759,800 | |||||||||
KKR & Co., Inc., Series C, 9/15/23, 6.00% | 6,495 | 371,839 | |||||||||
Wells Fargo & Co., Series L, 7.50% (e) | 550 | 651,750 | |||||||||
1,783,389 | |||||||||||
Health Care (0.1%): | |||||||||||
Danaher Corp., Series B, 4/15/23, 5.00% (c) | 146 | 198,056 | |||||||||
Utilities (0.6%): | |||||||||||
American Electric Power Co., Inc., 8/15/23, 6.13% | 3,530 | 182,077 | |||||||||
NextEra Energy, Inc., 3/1/23, 5.28% | 14,070 | 713,349 | |||||||||
NiSource, Inc., 3/1/24, 7.75% | 1,710 | 176,575 | |||||||||
1,072,001 | |||||||||||
Total Convertible Preferred Stocks (Cost $3,360,039) | 3,053,446 | ||||||||||
Corporate Bonds (37.3%) | |||||||||||
Communication Services (1.5%): | |||||||||||
| Charter Communications Operating LLC/Charter Communications Operating Capital, 4.50%, 2/1/24, Callable 1/1/24 @ 100 | $ | 496,000 | 490,018 | ||||||||
Fox Corp., 4.03%, 1/25/24, Callable 12/25/23 @ 100 | 1,388,000 | 1,371,400 | |||||||||
See notes to financial statements.
24
| Victory Portfolios Victory INCORE Low Duration Bond Fund | Schedule of Portfolio Investments — continued December 31, 2022 | ||||||
Security Description | Principal Amount | Value | |||||||||
Hughes Satellite Systems Corp., 6.63%, 8/1/26 | $ | 550,000 | $ | 513,375 | |||||||
Verizon Communications, Inc., 3.38%, 2/15/25 | 354,000 | 343,157 | |||||||||
2,717,950 | |||||||||||
Consumer Discretionary (3.9%): | |||||||||||
D.R. Horton, Inc., 4.75%, 2/15/23, Callable 2/6/23 @ 100 | 3,027,000 | 3,025,184 | |||||||||
General Motors Co., 4.88%, 10/2/23 | 1,297,000 | 1,295,781 | |||||||||
General Motors Financial Co., Inc., 5.10%, 1/17/24, Callable 12/17/23 @ 100 | 1,549,000 | 1,544,523 | |||||||||
Kohl's Corp., 4.25%, 7/17/25, Callable 4/17/25 @ 100 | 1,194,000 | 1,119,160 | |||||||||
6,984,648 | |||||||||||
Consumer Staples (0.8%): | |||||||||||
Altria Group, Inc., 4.40%, 2/14/26, Callable 12/14/25 @ 100 (c) | 322,000 | 315,637 | |||||||||
Tyson Foods, Inc., 3.95%, 8/15/24, Callable 5/15/24 @ 100 | 1,170,000 | 1,151,116 | |||||||||
1,466,753 | |||||||||||
Energy (1.9%): | |||||||||||
| Continental Resources, Inc. 4.50%, 4/15/23, Callable 2/6/23 @ 100 | 801,000 | 798,189 | |||||||||
2.27%, 11/15/26, Callable 11/15/23 @ 100 (a) | 797,000 | 691,174 | |||||||||
HollyFrontier Corp., 2.63%, 10/1/23 | 971,000 | 940,860 | |||||||||
Plains All American Pipeline LP/PAA Finance Corp., 2.85%, 1/31/23 | 1,010,000 | 1,008,071 | |||||||||
3,438,294 | |||||||||||
Financials (15.2%): | |||||||||||
| Bank of America Corp. 4.20%, 8/26/24, MTN | 1,660,000 | 1,634,353 | |||||||||
5.16% (SOFR+105bps), 2/4/28, Callable 2/4/27 @ 100 (f) | 2,016,000 | 1,941,972 | |||||||||
| Capital One Financial Corp. 3.30%, 10/30/24, Callable 9/30/24 @ 100 | 684,000 | 660,149 | |||||||||
1.34% (SOFR+69bps), 12/6/24, Callable 12/6/23 @ 100 (f) | 1,695,000 | 1,623,539 | |||||||||
2.64% (SOFR+129bps), 3/3/26, Callable 3/3/25 @ 100 (f) | 2,052,000 | 1,923,955 | |||||||||
Citigroup, Inc., 3.11% (SOFR+284bps), 4/8/26, Callable 4/8/25 @ 100 (f) | 2,772,000 | 2,621,869 | |||||||||
| Dana Financing Luxembourg Sarl, 5.75%, 4/15/25, Callable 2/6/23 @ 101.44 (a) | 772,000 | 761,115 | |||||||||
| Fifth Third Bancorp 1.63%, 5/5/23, Callable 4/5/23 @ 100 | 1,660,000 | 1,640,910 | |||||||||
3.65%, 1/25/24, Callable 12/25/23 @ 100 | 799,000 | 787,239 | |||||||||
| Harley-Davidson Financial Services, Inc., 3.35%, 2/15/23, Callable 2/6/23 @ 100 (a) | 1,488,000 | 1,483,387 | |||||||||
| JPMorgan Chase & Co. 2.30% (SOFR+116bps), 10/15/25, Callable 10/15/24 @ 100 (f) | 1,000,000 | 941,350 | |||||||||
2.60% (SOFR+92bps), 2/24/26, Callable 2/24/25 @ 100 (f) | 933,000 | 877,589 | |||||||||
| JPMorgan Chase Co., 5.38% (SOFRRATE+118bps), 2/24/28, Callable 2/24/27 @ 100 (f) | 1,350,000 | 1,308,164 | |||||||||
Morgan Stanley, 0.53%, 1/25/24, Callable 1/25/23 @ 100 | 2,575,000 | 2,559,112 | |||||||||
State Street Corp., 5.75% (SOFR+135bps), 11/4/26, Callable 11/4/25 @ 100 (f) | 1,907,000 | 1,958,832 | |||||||||
| The Bank of New York Mellon Corp., 4.41% (SOFR+135bps), 7/24/26, Callable 7/24/25 @ 100 (c) (f) | 1,783,000 | 1,757,271 | |||||||||
See notes to financial statements.
25
| Victory Portfolios Victory INCORE Low Duration Bond Fund | Schedule of Portfolio Investments — continued December 31, 2022 | ||||||
Security Description | Principal Amount | Value | |||||||||
| The Goldman Sachs Group, Inc., 6.17% (SOFR+185bps), 3/15/28, Callable 3/15/27 @ 100 (c) (f) | $ | 500,000 | $ | 492,395 | |||||||
| Wells Fargo & Co. 0.81% (SOFR+51bps), 5/19/25, Callable 5/19/24 @ 100, MTN (f) | 585,000 | 547,712 | |||||||||
2.41% (SOFR+109bps), 10/30/25, Callable 10/30/24 @ 100, MTN (f) | 2,077,000 | 1,966,898 | |||||||||
27,487,811 | |||||||||||
Health Care (3.7%): | |||||||||||
Centene Corp., 4.25%, 12/15/27, Callable 1/23/23 @ 102.13 | 621,000 | 583,150 | |||||||||
HCA, Inc., 5.00%, 3/15/24 | 2,479,000 | 2,465,415 | |||||||||
Mylan, Inc., 3.13%, 1/15/23 (a) | 2,479,000 | 2,476,025 | |||||||||
Universal Health Services, Inc., 1.65%, 9/1/26, Callable 8/1/26 @ 100 (a) | 1,387,000 | 1,190,518 | |||||||||
6,715,108 | |||||||||||
Industrials (1.0%): | |||||||||||
Delta Air Lines, Inc., 3.80%, 4/19/23, Callable 3/19/23 @ 100 | 1,115,000 | 1,105,690 | |||||||||
EnPro Industries, Inc., 5.75%, 10/15/26, Callable 2/6/23 @ 102.88 | 725,000 | 708,274 | |||||||||
1,813,964 | |||||||||||
Information Technology (3.3%): | |||||||||||
| Broadcom Corp./Broadcom Cayman Finance Ltd., 3.63%, 1/15/24, Callable 11/15/23 @ 100 | 2,175,000 | 2,137,829 | |||||||||
Cadence Design Systems, Inc., 4.38%, 10/15/24, Callable 7/15/24 @ 100 | 1,173,000 | 1,161,821 | |||||||||
KLA Corp., 4.65%, 11/1/24, Callable 8/1/24 @ 100 | 144,000 | 143,753 | |||||||||
Marvell Technology Group Ltd., 4.20%, 6/22/23, Callable 5/22/23 @ 100 | 941,000 | 931,985 | |||||||||
NCR Corp., 5.00%, 10/1/28, Callable 10/1/23 @ 102.5 (a) | 642,000 | 550,862 | |||||||||
Seagate HDD Cayman, 4.88%, 3/1/24, Callable 1/1/24 @ 100 | 1,000,000 | 981,790 | |||||||||
5,908,040 | |||||||||||
Materials (1.1%): | |||||||||||
Southern Copper Corp., 3.88%, 4/23/25 | 2,050,000 | 1,990,611 | |||||||||
Real Estate (2.7%): | |||||||||||
American Tower Corp., 3.00%, 6/15/23 | 1,000,000 | 989,740 | |||||||||
Equinix, Inc., 1.25%, 7/15/25, Callable 6/15/25 @ 100 | 700,000 | 634,053 | |||||||||
Iron Mountain, Inc., 5.25%, 7/15/30, Callable 7/15/25 @ 102.63 (a) | 638,000 | 554,071 | |||||||||
Piedmont Operating Partnership LP, 3.40%, 6/1/23, Callable 3/1/23 @ 100 | 1,629,000 | 1,613,085 | |||||||||
Regency Centers, LP, 3.90%, 11/1/25, Callable 8/1/25 @ 100 | 1,194,000 | 1,130,157 | |||||||||
4,921,106 | |||||||||||
Utilities (2.2%): | |||||||||||
Ameren Corp., 2.50%, 9/15/24, Callable 8/15/24 @ 100 | 588,000 | 561,805 | |||||||||
Exelon Corp., 3.95%, 6/15/25, Callable 3/15/25 @ 100 | 591,000 | 577,242 | |||||||||
WEC Energy Group, Inc., 5.00%, 9/27/25, Callable 8/27/25 @ 100 | 2,870,000 | 2,874,649 | |||||||||
4,013,696 | |||||||||||
Total Corporate Bonds (Cost $70,116,721) | 67,457,981 | ||||||||||
See notes to financial statements.
26
| Victory Portfolios Victory INCORE Low Duration Bond Fund | Schedule of Portfolio Investments — continued December 31, 2022 | ||||||
Security Description | Principal Amount | Value | |||||||||
Residential Mortgage-Backed Securities (0.8%) | |||||||||||
GSR Mortgage Loan Trust, Series 2004-15F, Class 5A1, 5.50%, 10/25/20 | $ | 15,008 | $ | 14,016 | |||||||
| JPMorgan Mortgage Trust, Series 2014-5, Class A11, 2.79%, 10/25/29, Callable 2/25/24 @ 100 (a) (b) | 1,086,285 | 1,023,804 | |||||||||
| JPMorgan Mortgage Trust, Series 2017-3, Class 2A2, 2.50%, 8/25/47, Callable 4/25/28 @ 100 (a) (b) | 579,811 | 480,960 | |||||||||
Total Residential Mortgage-Backed Securities (Cost $1,685,156) | 1,518,780 | ||||||||||
Yankee Dollars (9.1%) | |||||||||||
Communication Services (0.3%): | |||||||||||
SES SA, 3.60%, 4/4/23 (a) | 503,000 | 499,902 | |||||||||
Consumer Discretionary (1.1%): | |||||||||||
Stellantis NV, 5.25%, 4/15/23 | 2,048,000 | 2,044,027 | |||||||||
Consumer Staples (2.6%): | |||||||||||
Barry Callebaut Services NV, 5.50%, 6/15/23 (a) | 2,346,000 | 2,329,508 | |||||||||
| Kerry Group Financial Services Unlimited Co., 3.20%, 4/9/23, Callable 2/6/23 @ 100 (a) | 2,391,000 | 2,367,401 | |||||||||
4,696,909 | |||||||||||
Energy (1.1%): | |||||||||||
Canadian Natural Resources Ltd., 3.80%, 4/15/24, Callable 1/15/24 @ 100 | 1,180,000 | 1,158,335 | |||||||||
Ecopetrol SA, 5.88%, 9/18/23 | 846,000 | 841,212 | |||||||||
1,999,547 | |||||||||||
Financials (1.8%): | |||||||||||
| AerCap Ireland Capital DAC/AerCap Global Aviation Trust, 1.75%, 1/30/26, Callable 12/30/25 @ 100 | 1,100,000 | 969,452 | |||||||||
| HSBC Holdings PLC, 1.16% (SOFR+58bps), 11/22/24, Callable 11/22/23 @ 100 (f) | 1,000,000 | 951,480 | |||||||||
The Toronto-Dominion Bank, 2.35%, 3/8/24 (c) | 1,359,000 | 1,317,917 | |||||||||
3,238,849 | |||||||||||
Industrials (0.3%): | |||||||||||
Sensata Technologies BV, 4.00%, 4/15/29, Callable 4/15/24 @ 102 (a) | 606,000 | 522,699 | |||||||||
Materials (1.5%): | |||||||||||
Anglo American Capital PLC, 3.63%, 9/11/24 (a) | 2,880,000 | 2,785,680 | |||||||||
Utilities (0.4%): | |||||||||||
Enel Generacion Chile SA, 4.25%, 4/15/24, Callable 1/15/24 @ 100 | 655,000 | 643,498 | |||||||||
Total Yankee Dollars (Cost $17,195,019) | 16,431,111 | ||||||||||
See notes to financial statements.
27
| Victory Portfolios Victory INCORE Low Duration Bond Fund | Schedule of Portfolio Investments — continued December 31, 2022 | ||||||
Security Description | Shares or Principal Amount | Value | |||||||||
U.S. Government Mortgage-Backed Agencies (3.1%) | |||||||||||
| Federal Home Loan Mortgage Corp. 5.00%, 6/15/23 – 8/1/40 | $ | 373,844 | $ | 378,446 | |||||||
5.50%, 10/25/23 | 400 | 397 | |||||||||
7.00%, 9/1/38 | 2,135 | 2,293 | |||||||||
Series 4320, Class AP, 3.50%, 7/15/39 | 599,622 | 579,909 | |||||||||
Series 3713, Class PA, 2.00%, 2/15/40 – 3/15/40 | 1,254,093 | 1,217,166 | |||||||||
Series 4444, Class CH, 3.00%, 1/15/41 | 71,563 | 71,128 | |||||||||
2,249,339 | |||||||||||
| Federal National Mortgage Association 6.00%, 2/1/37 | 643,230 | 674,630 | |||||||||
Series 2013-33, Class UD, 2.50%, 4/25/39 | 131,096 | 129,004 | |||||||||
Series 2011-21, Class PA, 4.50%, 5/25/40 | 1,176,537 | 1,167,945 | |||||||||
5.00%, 2/1/41 – 10/1/41 | 1,490,321 | 1,507,152 | |||||||||
3,478,731 | |||||||||||
Total U.S. Government Mortgage-Backed Agencies (Cost $6,074,484) | 5,728,070 | ||||||||||
U.S. Treasury Obligations (14.7%) | |||||||||||
| U.S. Treasury Notes 4.38%, 10/31/24 | 8,500,000 | 8,475,430 | |||||||||
3.50%, 9/15/25 | 18,553,000 | 18,184,839 | |||||||||
Total U.S. Treasury Obligations (Cost $26,752,995) | 26,660,269 | ||||||||||
Collateral for Securities Loaned (1.2%)^ | |||||||||||
| Goldman Sachs Financial Square Government Fund, Institutional Shares, 4.14% (g) | 528,624 | 528,624 | |||||||||
HSBC U.S. Government Money Market Fund, Institutional Shares, 4.13% (g) | 528,624 | 528,624 | |||||||||
Invesco Government & Agency Portfolio, Institutional Shares, 4.22% (g) | 528,624 | 528,624 | |||||||||
| Morgan Stanley Institutional Liquidity Government Portfolio, Institutional Shares, 4.08% (g) | 528,624 | 528,624 | |||||||||
Total Collateral for Securities Loaned (Cost $2,114,496) | 2,114,496 | ||||||||||
Total Investments (Cost $181,777,693) — 97.1% | 175,838,003 | ||||||||||
Other assets in excess of liabilities — 2.9% | 5,165,231 | ||||||||||
NET ASSETS — 100.00% | $ | 181,003,234 | |||||||||
^ Purchased with cash collateral from securities on loan.
(a) Rule 144A security or other security that is restricted as to resale to institutional investors. The Fund's Adviser has deemed this security to be liquid (unless otherwise noted as illiquid) based upon procedures approved by the Board of Trustees. As of December 31, 2022, the fair value of these securities was $25,446,649 and amounted to 14.1% of net assets.
(b) The rate for certain asset-backed and mortgage-backed securities may vary based on factors relating to the pool of assets underlying the security. The rate disclosed is the rate in effect at December 31, 2022.
(c) All or a portion of this security is on loan.
(d) Zero-coupon bond.
See notes to financial statements.
28
| Victory Portfolios Victory INCORE Low Duration Bond Fund | Schedule of Portfolio Investments — continued December 31, 2022 | ||||||
(e) Security is perpetual and has no final maturity date but may be subject to calls at various dates in the future.
(f) Variable or Floating-Rate Security. Rate disclosed is as of December 31, 2022.
(g) Rate disclosed is the daily yield on December 31, 2022.
bps — Basis points
LLC — Limited Liability Company
LP — Limited Partnership
MTN — Medium Term Note
PLC — Public Limited Company
SOFR — Secured Overnight Financing Rate
Futures Contracts Purchased
| Number of Contracts | Expiration Date | Notional Amount | Value | Unrealized Appreciation (Depreciation) | |||||||||||||||||||
2-Year U.S. Treasury Note Futures | 181 | 3/31/23 | $ | 37,114,583 | $ | 37,119,141 | $ | 4,558 | |||||||||||||||
British Pound Futures | 32 | 3/13/23 | 2,479,601 | 2,416,800 | (62,801 | ) | |||||||||||||||||
Mexican Peso Futures | 56 | 3/13/23 | 1,402,521 | 1,417,360 | 14,839 | ||||||||||||||||||
$ | (43,404 | ) | |||||||||||||||||||||
Futures Contracts Sold
| Number of Contracts | Expiration Date | Notional Amount | Value | Unrealized Appreciation (Depreciation) | |||||||||||||||||||
10-Year U.S. Treasury Note Futures | 22 | 3/22/23 | $ | 2,483,345 | $ | 2,470,531 | $ | 12,814 | |||||||||||||||
5-Year U.S. Treasury Note Futures | 41 | 3/31/23 | 4,429,459 | 4,425,117 | 4,342 | ||||||||||||||||||
Australian Dollar Futures | 16 | 3/13/23 | 1,101,200 | 1,092,560 | 8,640 | ||||||||||||||||||
Micro E-Mini S&P 500 Index Futures | 168 | 3/17/23 | 3,353,156 | 3,243,240 | 109,916 | ||||||||||||||||||
| Ultra Long Term U.S. Treasury Bond Futures | 4 | 3/22/23 | 542,892 | 537,250 | 5,642 | ||||||||||||||||||
$ | 141,354 | ||||||||||||||||||||||
Total unrealized appreciation | $ | 160,751 | |||||||||||||||||||||
Total unrealized depreciation | (62,801 | ) | |||||||||||||||||||||
Total net unrealized appreciation (depreciation) | $ | 97,950 | |||||||||||||||||||||
See notes to financial statements.
29
| Victory Portfolios Victory INCORE Low Duration Bond Fund | Schedule of Portfolio Investments — continued December 31, 2022 | ||||||
Centrally Cleared
Credit Default Swap Agreements — Sell Protection (a)
| Underlying Instruments | Fixed Deal Receive Rate | Maturity Date | Payment Frequency | Implied Credit Spread at December 31, 2022 (b) | Notional Amount (c) | Value | Premiums Paid (Received) | Unrealized Appreciation (Depreciation) | |||||||||||||||||||||||||||
| CDX North America High Yield Index; Series 39 | 5.00 | % | 12/20/27 | Quarterly | 4.82 | % | $ | 11,000,000 | $ | 74,587 | $ | (322,500 | ) | $ | 397,087 | ||||||||||||||||||||
$ | 74,587 | $ | (322,500 | ) | $ | 397,087 | |||||||||||||||||||||||||||||
(a) When a credit event occurs as defined under the terms of the swap agreement, the Fund as a seller of credit protection will either (i) pay to the buyer of protection an amount equal to the par value of the defaulted reference entity or (ii) pay a net amount equal to the par value of the defaulted reference entity less its recovery value.
(b) Implied credit spread, represented in absolute terms, utilized in determining the value of the credit default swap agreements as of period end will serve as an indicator of the current status of the payment/performance risk and represent the likelihood or risk of default for the credit derivative. The implied credit spread of a referenced entity reflects the cost of buying/selling protection and may include payments required to be made to enter into the agreement. Generally, wider credit spreads represent a perceived deterioration of the referenced entity's credit soundness and a greater likelihood or risk of default or other credit event occurring as defined under the terms of the swap agreement.
(c) The notional amount represents the maximum potential amount the Fund could be required to pay as a seller of credit protection if a credit event occurs, as defined under the terms of the swap agreement, for each security included in the CDX North America High Yield Index.
See notes to financial statements.
30
| Victory Portfolios Victory High Yield Fund | Schedule of Portfolio Investments December 31, 2022 | ||||||
Security Description | Shares or Principal Amount | Value | |||||||||
Common Stocks (0.5%) | |||||||||||
Communication Services (0.3%): | |||||||||||
Altice USA, Inc., Class A (a) | 38,825 | $ | 178,595 | ||||||||
iHeartMedia, Inc., Class A (a) | 30,500 | 186,965 | |||||||||
Sinclair Broadcast Group, Inc., Class A | 17,500 | 271,425 | |||||||||
636,985 | |||||||||||
Consumer Discretionary (0.1%): | |||||||||||
Men's Wearhouse, Inc. (f) | 31,563 | 226,212 | |||||||||
Health Care (0.1%): | |||||||||||
Surgery Partners, Inc. (a) | 9,390 | 261,605 | |||||||||
Total Common Stocks (Cost $1,959,997) | 1,124,802 | ||||||||||
Senior Secured Loans (15.3%) | |||||||||||
| 19th Holdings Golf LLC, Initial Term Loans, First Lien, 7.28% (SOFR01M+300bps), 1/27/29 (b) | $ | 2,238,750 | 2,048,456 | ||||||||
| Air Methods Corp., Initial Term Loans, First Lien, 7.17% (LIBOR03M+350bps), 4/21/24 (b) | 1,938,461 | 1,080,692 | |||||||||
| Bausch Health Cos., Inc., Second Amendment Term Loan, First Lien, 9.57% (SOFR01M+525bps), 2/1/27 (b) | 2,925,000 | 2,213,260 | |||||||||
| Clear Channel Outdoor Holdings, Inc., Term B Loan, First Lien, 7.91% (LIBOR03M+350bps), 8/21/26 (b) | 2,742,912 | 2,493,115 | |||||||||
| Covis Pharma Holdings S.a.r.l., Dollar Term B Loans, First Lien, 10.05% (SOFR03M+650bps), 2/14/27 (b) | 2,646,875 | 1,429,313 | |||||||||
| CP Altas Buyer, Inc., Term B Loans, First Lien, 7.57% (LIBOR01M+350bps), 11/23/27 (b) | 1,975,532 | 1,725,035 | |||||||||
| Diamond Sports Group LLC, Term Loan, First Lien, 12.32% (SOFR01M+810bps), 5/25/26 (b) | 519,695 | 490,681 | |||||||||
| Diamond Sports Group LLC, Term Loan, Second Lien, 7.57% (SOFR01M+335bps), 8/24/26 (b) | 7,004,250 | 840,510 | |||||||||
| Envision Healthcare Corp., First Out Term Loan, First Lien, 11.91% (SOFR01M+788bps), 7/22/27 (b) | 311,172 | 275,777 | |||||||||
| Envision Healthcare Corp., Third Out term Loans, First Lien, 7.87% (SOFR01M+375bps), 3/31/27 (b) | 864,021 | 216,005 | |||||||||
| Intelsat Jackson Holdings SA, Term B loan, First Lien, 7.19% (SOFR06M+425bps), 2/1/29 (b) | 3,807,311 | 3,668,611 | |||||||||
| Jo-Ann Stores LLC, Term B-1 Loan, First Lien, 9.08% (LIBOR03M+475bps), 6/30/28 (b) | 1,566,635 | 1,052,262 | |||||||||
| Knight Health Holdings LLC, Term B Loans, First Lien, 9.32% (LIBOR01M+525bps), 12/17/28 (b) | 3,960,000 | 2,306,700 | |||||||||
| LifeScan Global Corp., Initial Term Loan, First Lien, 9.74% (LIBOR03M+600bps), 10/1/24 (b) | 3,638,868 | 2,608,850 | |||||||||
| Neptune BidCo US, Inc., Dollar Term B Loan, First Lien, 8.82% (SOFR03M+500bps), 4/11/29 (b) | 1,500,000 | 1,335,945 | |||||||||
| Petco Health and Wellness Co., Inc., Initial Term Loans, First Lien, 6.92% (LIBOR03M+325bps), 3/4/28 (b) | 1,438,908 | 1,394,993 | |||||||||
| Radiology Partners, Inc., Term Loan New, First Lien, 8.64% (LIBOR01M+425bps), 7/9/25 (b) | 2,000,000 | 1,672,500 | |||||||||
See notes to financial statements.
31
| Victory Portfolios Victory High Yield Fund | Schedule of Portfolio Investments — continued December 31, 2022 | ||||||
Security Description | Principal Amount | Value | |||||||||
| SWF Holdings Corp. I, Initial Term Loans, First Lien, 8.75% (LIBOR03M+400bps), 10/6/28 (b) | $ | 2,332,375 | $ | 1,899,719 | |||||||
| Team Health Holdings, Inc., Facility Extending Term Loan B, First Lien, 9.34% (SOFR01M+525bps), 2/2/27 (b) | 2,283,664 | 1,707,039 | |||||||||
| The Michaels Cos., Inc., Term B Loans, First Lien, 7.92% (LIBOR03M+425bps), 4/15/28 (b) | 3,943,703 | 3,393,793 | |||||||||
| Traverse Midstream Partners LLC, Advance, First Lien, 8.80% (SOFR01M+425bps), 9/27/24 (b) | 1,751,585 | 1,745,560 | |||||||||
| United Airlines, Inc., Class B Term Loans, First Lien, 8.11% (LIBOR03M+375bps), 4/21/28 (b) | 1,972,481 | 1,943,998 | |||||||||
Total Senior Secured Loans (Cost $47,710,176) | 37,542,814 | ||||||||||
Corporate Bonds (72.3%) | |||||||||||
Communication Services (12.8%): | |||||||||||
Audacy Capital Corp., 6.50%, 5/1/27, Callable 1/23/23 @ 104.88 (c) | 3,500,000 | 664,370 | |||||||||
CSC Holdings LLC, 5.75%, 1/15/30, Callable 1/15/25 @ 102.88 (c) | 5,500,000 | 3,109,810 | |||||||||
| Cumulus Media New Holdings, Inc., 6.75%, 7/1/26, Callable 2/6/23 @ 103.38 (c) (d) | 4,960,000 | 4,165,656 | |||||||||
Entercom Media Corp., 6.75%, 3/31/29, Callable 3/31/24 @ 103.38 (c) (d) | 4,200,000 | 743,064 | |||||||||
| Frontier Communications Holdings LLC, 5.00%, 5/1/28, Callable 5/1/24 @ 102.5 (c) | 3,250,000 | 2,834,065 | |||||||||
| Gray Television, Inc. 7.00%, 5/15/27, Callable 1/17/23 @ 105.25 (c) | 3,000,000 | 2,664,600 | |||||||||
4.75%, 10/15/30, Callable 10/15/25 @ 102.38 (c) | 2,250,000 | 1,627,988 | |||||||||
iHeartCommunications, Inc., 8.38%, 5/1/27, Callable 1/23/23 @ 104.19 (d) | 4,510,000 | 3,841,167 | |||||||||
Nexstar Broadcasting, Inc., 5.63%, 7/15/27, Callable 1/17/23 @ 104.22 (c) | 2,000,000 | 1,836,900 | |||||||||
Scripps Escrow II, Inc., 5.38%, 1/15/31, Callable 1/15/26 @ 102.69 (c) (d) | 2,600,000 | 2,092,454 | |||||||||
Sinclair Television Group, Inc., 5.50%, 3/1/30, Callable 12/1/24 @ 102.75 (c) (d) | 3,500,000 | 2,450,035 | |||||||||
TEGNA, Inc., 5.00%, 9/15/29, Callable 9/15/24 @ 102.5 | 3,000,000 | 2,840,040 | |||||||||
Univision Communications, Inc., 5.13%, 2/15/25, Callable 1/17/23 @ 100.85 (c) | 2,500,000 | 2,381,650 | |||||||||
31,251,799 | |||||||||||
Consumer Discretionary (19.3%): | |||||||||||
Academy Ltd., 6.00%, 11/15/27, Callable 11/15/23 @ 103 (c) | 1,800,000 | 1,728,990 | |||||||||
| American Axle & Manufacturing, Inc., 5.00%, 10/1/29, Callable 10/1/24 @ 102.5 (d) | 4,100,000 | 3,288,528 | |||||||||
| Avis Budget Car Rental LLC/Avis Budget Finance, Inc., 5.38%, 3/1/29, Callable 3/1/24 @ 102.69 (c) (d) | 2,000,000 | 1,717,200 | |||||||||
Beazer Homes USA, Inc., 5.88%, 10/15/27, Callable 1/23/23 @ 102.94 | 2,000,000 | 1,763,780 | |||||||||
Caesars Entertainment, Inc., 8.13%, 7/1/27, Callable 7/1/23 @ 104.06 (c) | 2,505,000 | 2,463,567 | |||||||||
Cinemark USA, Inc., 5.25%, 7/15/28, Callable 7/15/24 @ 102.63 (c) | 3,000,000 | 2,228,340 | |||||||||
| Clarios Global LP/Clarios US Finance Co., 8.50%, 5/15/27, Callable 2/6/23 @ 104.25 (c) | 3,000,000 | 2,934,960 | |||||||||
Ford Motor Co., 6.10%, 8/19/32, Callable 5/19/32 @ 100 | 2,500,000 | 2,316,150 | |||||||||
LBM Acquisition LLC, 6.25%, 1/15/29, Callable 1/15/24 @ 103.13 (c) | 3,550,000 | 2,302,388 | |||||||||
Life Time, Inc., 5.75%, 1/15/26, Callable 2/6/23 @ 102.88 (c) | 4,000,000 | 3,728,560 | |||||||||
MGM Resorts International, 5.50%, 4/15/27, Callable 1/15/27 @ 100 | 3,475,000 | 3,229,943 | |||||||||
| MIWD Holdco II LLC/MIWD Finance Corp., 5.50%, 2/1/30, Callable 2/1/25 @ 102.75 (c) | 900,000 | 723,177 | |||||||||
See notes to financial statements.
32
| Victory Portfolios Victory High Yield Fund | Schedule of Portfolio Investments — continued December 31, 2022 | ||||||
Security Description | Principal Amount | Value | |||||||||
| PetSmart, Inc./PetSmart Finance Corp., 7.75%, 2/15/29, Callable 2/15/24 @ 103.88 (c) | $ | 3,600,000 | $ | 3,358,440 | |||||||
| Premier Entertainment Sub LLC/Premier Entertainment Finance Corp. 5.63%, 9/1/29, Callable 9/1/24 @ 102.81 (c) | 2,000,000 | 1,471,580 | |||||||||
5.88%, 9/1/31, Callable 9/1/26 @ 102.98 (c) | 4,800,000 | 3,386,256 | |||||||||
| Scientific Games Holdings LP/Scientific Games US FinCo., Inc., 6.63%, 3/1/30, Callable 3/1/25 @ 103.31 (c) | 3,000,000 | 2,533,230 | |||||||||
The Hertz Corp., 5.00%, 12/1/29, Callable 12/1/24 @ 102.5 (c) | 5,000,000 | 3,792,250 | |||||||||
The Michaels Cos., Inc., 7.88%, 5/1/29, Callable 5/1/24 @ 103.94 (c) (d) | 2,350,000 | 1,585,992 | |||||||||
Viking Cruises Ltd., 13.00%, 5/15/25, Callable 1/23/23 @ 109.75 (c) | 2,700,000 | 2,862,054 | |||||||||
47,415,385 | |||||||||||
Consumer Staples (0.8%): | |||||||||||
Post Holdings, Inc., 4.50%, 9/15/31, Callable 9/15/26 @ 102.25 (c) | 1,000,000 | 844,660 | |||||||||
| Simmons Foods, Inc./Simmons prepared Foods, Inc./Simmons Pet Food, Inc./Simmons Feed, 4.63%, 3/1/29, Callable 3/1/24 @ 102.31 (c) | 1,370,000 | 1,120,975 | |||||||||
1,965,635 | |||||||||||
Energy (9.2%): | |||||||||||
| Antero Midstream Partners LP/Antero Midstream Finance Corp., 5.38%, 6/15/29, Callable 6/15/24 @ 102.69 (c) | 3,450,000 | 3,155,818 | |||||||||
Antero Resources Corp., 7.63%, 2/1/29, Callable 2/1/24 @ 103.81 (c) | 2,500,000 | 2,532,450 | |||||||||
Callon Petroleum Co., 8.00%, 8/1/28, Callable 8/1/24 @ 104 (c) (d) | 1,223,000 | 1,160,786 | |||||||||
CITGO Holding, Inc., 9.25%, 8/1/24, Callable 2/6/23 @ 102.31 (c) | 3,500,000 | 3,510,395 | |||||||||
CITGO Petroleum Corp., 7.00%, 6/15/25, Callable 2/6/23 @ 103.5 (c) | 2,500,000 | 2,443,775 | |||||||||
Comstock Resources, Inc., 6.75%, 3/1/29, Callable 3/1/24 @ 103.38 (c) | 4,776,000 | 4,312,012 | |||||||||
| PBF Holding Co. LLC/PBF Finance Corp., 6.00%, 2/15/28, Callable 2/15/23 @ 103 (d) | 3,750,000 | 3,318,825 | |||||||||
Talos Production, Inc., 12.00%, 1/15/26, Callable 1/23/23 @ 106 | 2,000,000 | 2,109,840 | |||||||||
22,543,901 | |||||||||||
Financials (4.8%): | |||||||||||
AmWINS Group, Inc., 4.88%, 6/30/29, Callable 6/30/24 @ 102.44 (c) | 1,500,000 | 1,287,855 | |||||||||
| Compass Group Diversified Holdings LLC, 5.25%, 4/15/29, Callable 4/15/24 @ 102.63 (c) | 2,200,000 | 1,886,610 | |||||||||
Gray Escrow II, Inc., 5.38%, 11/15/31, Callable 11/15/26 @ 102.69 (c) | 1,950,000 | 1,411,313 | |||||||||
Midas OpCo Holdings LLC, 5.63%, 8/15/29, Callable 8/15/24 @ 102.81 (c) | 3,250,000 | 2,679,267 | |||||||||
Victors Merger Corp., 6.38%, 5/15/29, Callable 5/15/24 @ 103.19 (c) (d) | 4,800,000 | 2,654,160 | |||||||||
White Capital Parent LLC, 8.25%, 3/15/26, Callable 2/6/23 @ 102 (c) | 2,100,000 | 1,814,421 | |||||||||
11,733,626 | |||||||||||
Health Care (6.7%): | |||||||||||
Air Methods Corp., 8.00%, 5/15/25, Callable 2/6/23 @ 100 (c) | 3,125,000 | 178,625 | |||||||||
Bausch Health Cos., Inc., 5.25%, 1/30/30, Callable 1/30/25 @ 102.63 (c) | 2,250,000 | 1,086,997 | |||||||||
| CHS/Community Health Systems, Inc., 6.13%, 4/1/30, Callable 4/1/25 @ 103.06 (c) (d) | 5,450,000 | 2,744,184 | |||||||||
| Cloud Software Group Holdings, Inc., 6.50%, 3/31/29, Callable 9/30/25 @ 103.25 (c) | 2,250,000 | 1,905,188 | |||||||||
LifePoint Health, Inc., 5.38%, 1/15/29, Callable 1/15/24 @ 102.69 (c) | 3,500,000 | 1,981,455 | |||||||||
Radiology Partners, Inc., 9.25%, 2/1/28, Callable 2/6/23 @ 104.63 (c) | 3,685,000 | 2,072,297 | |||||||||
See notes to financial statements.
33
| Victory Portfolios Victory High Yield Fund | Schedule of Portfolio Investments — continued December 31, 2022 | ||||||
Security Description | Principal Amount | Value | |||||||||
Team Health Holdings, Inc., 6.38%, 2/1/25, Callable 1/23/23 @ 100 (c) (d) | $ | 3,250,000 | $ | 1,877,817 | |||||||
Tenet Healthcare Corp., 6.13%, 10/1/28, Callable 10/1/23 @ 103.06 (c) | 4,000,000 | 3,589,480 | |||||||||
U.S. Renal Care, Inc., 10.63%, 7/15/27, Callable 2/6/23 @ 105.31 (c) | 4,390,000 | 922,646 | |||||||||
16,358,689 | |||||||||||
Industrials (12.5%): | |||||||||||
American Airlines, Inc., 11.75%, 7/15/25 (c) | 3,500,000 | 3,765,440 | |||||||||
Aramark Services, Inc., 6.38%, 5/1/25, Callable 2/6/23 @ 103.19 (c) | 1,000,000 | 990,160 | |||||||||
Chart Industries, Inc., 7.50%, 1/1/30, Callable 1/1/26 @ 103.75 (c) | 1,125,000 | 1,129,669 | |||||||||
| Cornerstone Building Brands, Inc., 6.13%, 1/15/29, Callable 9/15/23 @ 103.06 (c) | 3,000,000 | 2,114,670 | |||||||||
Madison IAQ LLC, 5.88%, 6/30/29, Callable 6/30/24 @ 102.94 (c) | 2,800,000 | 1,925,952 | |||||||||
NESCO Holdings II, Inc., 5.50%, 4/15/29, Callable 4/15/24 @ 102.75 (c) | 2,050,000 | 1,807,588 | |||||||||
Pike Corp., 5.50%, 9/1/28, Callable 9/1/23 @ 102.75 (c) | 2,000,000 | 1,748,200 | |||||||||
| SRS Distribution, Inc. 6.13%, 7/1/29, Callable 7/1/24 @ 103.06 (c) | 1,125,000 | 913,106 | |||||||||
6.00%, 12/1/29, Callable 12/1/24 @ 103 (c) | 4,100,000 | 3,279,098 | |||||||||
TransDigm, Inc., 4.63%, 1/15/29, Callable 1/15/24 @ 102.31 | 3,325,000 | 2,921,611 | |||||||||
Triumph Group, Inc., 6.25%, 9/15/24, Callable 2/6/23 @ 100 (c) (d) | 3,525,000 | 3,332,147 | |||||||||
| United Rentals North America, Inc., 6.00%, 12/15/29, Callable 12/15/25 @ 103 (c) | 2,000,000 | 1,990,000 | |||||||||
Wabash National Corp., 4.50%, 10/15/28, Callable 10/15/24 @ 102.25 (c) | 3,000,000 | 2,543,850 | |||||||||
WESCO Distribution, Inc., 7.25%, 6/15/28, Callable 6/15/23 @ 103.63 (c) | 2,250,000 | 2,281,162 | |||||||||
| 30,742,653 | ||||||||||
Information Technology (0.4%): | |||||||||||
Black Knight InfoServ LLC, 3.63%, 9/1/28, Callable 9/1/23 @ 101.81 (c) | 1,250,000 | 1,090,000 | |||||||||
Materials (2.8%): | |||||||||||
Allegheny Technologies, Inc., 5.13%, 10/1/31, Callable 10/1/26 @ 102.56 | 3,000,000 | 2,632,230 | |||||||||
| CVR Partners LP/CVR Nitrogen Finance Corp., 6.13%, 6/15/28, Callable 6/15/24 @ 103.06 (c) | 1,800,000 | 1,617,606 | |||||||||
| Mauser Packaging Solutions Holding Co., 5.50%, 4/15/24, Callable 2/6/23 @ 100 (c) | 2,700,000 | 2,626,992 | |||||||||
6,876,828 | |||||||||||
Real Estate (1.2%): | |||||||||||
Adams Homes, Inc., 7.50%, 2/15/25, Callable 1/23/23 @ 103.75 (c) | 3,371,000 | 2,861,136 | |||||||||
Utilities (1.8%): | |||||||||||
Calpine Corp., 5.13%, 3/15/28, Callable 3/15/23 @ 102.56 (c) | 5,000,000 | 4,475,650 | |||||||||
Total Corporate Bonds (Cost $222,191,755) | 177,315,302 | ||||||||||
Yankee Dollars (8.6%) | |||||||||||
Communication Services (1.2%): | |||||||||||
Telesat Canada/Telesat LLC, 5.63%, 12/6/26, Callable 12/6/23 @ 102.81 (c) (d) | 6,050,000 | 2,827,589 | |||||||||
Consumer Discretionary (0.8%): | |||||||||||
| International Game Technology PLC, 5.25%, 1/15/29, Callable 1/15/24 @ 102.63 (c) | 2,000,000 | 1,877,240 | |||||||||
Energy (0.7%): | |||||||||||
TechnipFMC PLC, 6.50%, 2/1/26, Callable 2/6/23 @ 103.25 (c) | 1,800,000 | 1,758,618 | |||||||||
See notes to financial statements.
34
| Victory Portfolios Victory High Yield Fund | Schedule of Portfolio Investments — continued December 31, 2022 | ||||||
Security Description | Shares or Principal Amount | Value | |||||||||
Industrials (4.1%): | |||||||||||
Bombardier, Inc., 7.88%, 4/15/27, Callable 2/6/23 @ 103.94 (c) | $ | 4,500,000 | $ | 4,381,065 | |||||||
| Titan Acquisition Ltd./Titan Co-Borrower LLC, 7.75%, 4/15/26, Callable 2/6/23 @ 101.94 (c) | 2,000,000 | 1,806,020 | |||||||||
| VistaJet Malta Finance PLC/XO Management Holding, Inc., 6.38%, 2/1/30, Callable 2/1/25 @ 103.19 (c) | 4,750,000 | 3,815,675 | |||||||||
10,002,760 | |||||||||||
Information Technology (0.8%): | |||||||||||
| ION Trading Technologies Sarl, 5.75%, 5/15/28, Callable 5/15/24 @ 102.88 (c) (d) | 2,500,000 | 2,086,800 | |||||||||
Materials (1.0%): | |||||||||||
| Trinseo Materials Operating SCA/Trinseo Materials Finance, Inc., 5.13%, 4/1/29, Callable 4/1/24 @ 102.56 (c) (d) | 3,900,000 | 2,528,760 | |||||||||
Total Yankee Dollars (Cost $26,429,885) | 21,081,767 | ||||||||||
Exchange-Traded Funds (0.4%) | |||||||||||
iShares iBoxx High Yield Corporate Bond ETF (d) | 13,450 | 990,324 | |||||||||
Total Exchange-Traded Funds (Cost $999,066) | 990,324 | ||||||||||
Collateral for Securities Loaned (9.8%)^ | |||||||||||
| Goldman Sachs Financial Square Government Fund, Institutional Shares, 4.14% (e) | 6,018,634 | 6,018,634 | |||||||||
HSBC U.S. Government Money Market Fund, Institutional Shares, 4.13% (e) | 6,018,634 | 6,018,634 | |||||||||
Invesco Government & Agency Portfolio, Institutional Shares, 4.22% (e) | 6,018,634 | 6,018,634 | |||||||||
| Morgan Stanley Institutional Liquidity Government Portfolio, Institutional Shares, 4.08% (e) | 6,018,634 | 6,018,634 | |||||||||
Total Collateral for Securities Loaned (Cost $24,074,536) | 24,074,536 | ||||||||||
Total Investments (Cost $323,365,415) — 106.9% | 262,129,545 | ||||||||||
Liabilities in excess of other assets — (6.9)% | (17,002,902 | ) | |||||||||
NET ASSETS — 100.00% | $ | 245,126,643 | |||||||||
^ Purchased with cash collateral from securities on loan.
(a) Non-income producing security.
(b) Variable or Floating-Rate Security. Rate disclosed is as of December 31, 2022.
(c) Rule 144A security or other security that is restricted as to resale to institutional investors. The Fund's Adviser has deemed this security to be liquid (unless otherwise noted as illiquid) based upon procedures approved by the Board of Trustees. As of December 31, 2022, the fair value of these securities was $170,134,955 and amounted to 69.4% of net assets.
(d) All or a portion of this security is on loan.
(e) Rate disclosed is the daily yield on December 31, 2022.
(f) This security is classified as Level 3 within the fair value hierarchy. (See Note 2 in the Notes to Financial Statements)
bps — Basis points
ETF — Exchange-Traded Fund
See notes to financial statements.
35
| Victory Portfolios Victory High Yield Fund | Schedule of Portfolio Investments — continued December 31, 2022 | ||||||
LIBOR — London Interbank Offered Rate
LIBOR01M — 1 Month US Dollar LIBOR, rate disclosed as of December 31, 2022, based on the last reset date of the security
LIBOR03M — 3 Month US Dollar LIBOR, rate disclosed as of December 31, 2022, based on the last reset date of the security
LLC — Limited Liability Company
LP — Limited Partnership
PLC — Public Limited Company
SOFR — Secured Overnight Financing Rate
SOFR01M — 1 Month SOFR, rate disclosed as of December 31, 2022.
SOFR03M — 3 Month SOFR, rate disclosed as of December 31, 2022.
SOFR06M — 6 Month SOFR, rate disclosed as of December 31, 2022.
See notes to financial statements.
36
| Victory Portfolios Victory Tax-Exempt Fund | Schedule of Portfolio Investments December 31, 2022 | ||||||
Security Description | Principal Amount | Value | |||||||||
Municipal Bonds (107.3%) | |||||||||||
Arizona (1.5%): | |||||||||||
| City of Phoenix Civic Improvement Corp. Revenue AMT, Series B, 5.00%, 7/1/44, Continuously Callable @100 | $ | 540,000 | $ | 546,909 | |||||||
Arkansas (2.0%): | |||||||||||
| Arkansas Development Finance Authority Revenue, 3.20%, 12/1/49, Continuously Callable @100 | 750,000 | 546,526 | |||||||||
| University of Central Arkansas Revenue, Series A, 3.00%, 11/1/49, Continuously Callable @100 | 265,000 | 195,908 | |||||||||
742,434 | |||||||||||
California (1.2%): | |||||||||||
| San Francisco City & County Airport Comm-San Francisco International Airport Revenue, 4.00%, 5/1/52, Continuously Callable @100 | 500,000 | 424,592 | |||||||||
Colorado (3.3%): | |||||||||||
| Colorado Health Facilities Authority Revenue, 4.00%, 12/1/50, Continuously Callable @103 | 750,000 | 602,832 | |||||||||
| Gold Hill Mesa Metropolitan, GO, 5.50%, 12/1/47, Continuously Callable @100 | 585,000 | 616,873 | |||||||||
1,219,705 | |||||||||||
Florida (12.6%): | |||||||||||
| Capital Trust Agency, Inc. Revenue, 5.00%, 8/1/55, Continuously Callable @100 | 400,000 | 364,641 | |||||||||
| City of Pompano Beach Revenue, 4.00%, 9/1/50, Continuously Callable @103 | 500,000 | 379,834 | |||||||||
| County of Miami-Dade Seaport Department Revenue AMT, 4.00%, 10/1/50, Continuously Callable @100 | 500,000 | 443,546 | |||||||||
| Florida Development Finance Corp. Revenue, Series A, 5.00%, 6/15/55, Continuously Callable @100 | 500,000 | 469,510 | |||||||||
| Hillsborough County IDA Revenue, 4.00%, 8/1/50, Continuously Callable @100 | 500,000 | 421,546 | |||||||||
| Miami-Dade County Public Facilities Revenue, Series A, 5.00%, 6/1/33, Continuously Callable @100 | 2,000,000 | 2,090,518 | |||||||||
| St. Johns County IDA Revenue, 4.00%, 8/1/55, Continuously Callable @103 | 500,000 | 429,936 | |||||||||
4,599,531 | |||||||||||
Georgia (1.4%): | |||||||||||
| Private Colleges & Universities Authority Revenue, 5.25%, 10/1/51, Continuously Callable @100 | 500,000 | 522,105 | |||||||||
Guam (2.8%): | |||||||||||
| Port Authority of Guam Revenue, Series A, 5.00%, 7/1/48, Continuously Callable @100 | 1,000,000 | 1,010,894 | |||||||||
Illinois (28.6%): | |||||||||||
| Chicago Board of Education Revenue, 6.00%, 4/1/46, Continuously Callable @100 | 2,275,000 | 2,331,029 | |||||||||
| Chicago Transit Authority Sales Tax Receipts Revenue, 5.00%, 12/1/44, Continuously Callable @100 | 1,450,000 | 1,483,538 | |||||||||
See notes to financial statements.
37
| Victory Portfolios Victory Tax-Exempt Fund | Schedule of Portfolio Investments — continued December 31, 2022 | ||||||
Security Description | Principal Amount | Value | |||||||||
| City of Chicago Wastewater Transmission Revenue Series A, 5.00%, 01/01/2047, Continuously Callable @100 | $ | 1,000,000 | $ | 1,011,029 | |||||||
Series C, 5.00%, 01/01/2034, Continuously Callable @100 | 1,000,000 | 1,033,973 | |||||||||
City of Chicago, GO, Series A, 5.50%, 1/1/49, Continuously Callable @100 | 1,000,000 | 1,021,362 | |||||||||
Illinois, GO, 5.50%, 7/1/27, Continuously Callable @100 | 2,000,000 | 2,016,976 | |||||||||
| Sales Tax Securitization Corp. Revenue, Series 2018 C, 5.00%, 1/1/43, Continuously Callable @100 | 1,500,000 | 1,529,199 | |||||||||
10,427,106 | |||||||||||
Indiana (1.4%): | |||||||||||
| Indiana Finance Authority Revenue, Series A, 5.50%, 7/1/52, Continuously Callable @100 | 500,000 | 528,779 | |||||||||
Iowa (0.9%): | |||||||||||
| Iowa Finance Authority Revenue, Series A-1, 4.00%, 5/15/55, Continuously Callable @103 | 500,000 | 327,488 | |||||||||
Kansas (0.5%): | |||||||||||
| Wyandotte County-Kansas City Unified Government Tax Allocation, 5.75%, 3/1/41, Continuously Callable @103 (a) | 200,000 | 190,886 | |||||||||
Maryland (0.7%): | |||||||||||
| City of Gaithersburg Maryland Revenue, 5.13%, 1/1/42, Continuously Callable @103 | 250,000 | 242,032 | |||||||||
Massachusetts (2.3%): | |||||||||||
| University of Massachusetts Building Authority Revenue 5.00%, 11/1/2039, Pre-refunded 11/1/24 @ 100 | 220,000 | 228,864 | |||||||||
Series 1-2021, 5.00%, 11/1/2039, Continuously Callable @100 | 410,000 | 427,047 | |||||||||
Series 1-2021, 5.00%, 11/1/2039, Pre-refunded 11/1/24 @ 100 | 190,000 | 197,656 | |||||||||
853,567 | |||||||||||
Michigan (1.2%): | |||||||||||
| Michigan Finance Authority Revenue, 4.00%, 12/1/51, Continuously Callable @100 | 500,000 | 423,902 | |||||||||
Missouri (2.9%): | |||||||||||
| Health & Educational Facilities Authority of the State of Missouri Revenue, 4.25%, 12/1/42, Continuously Callable @100 (a) | 1,150,000 | 1,051,488 | |||||||||
New Jersey (4.3%): | |||||||||||
| New Jersey Economic Development Authority Biomedical Research Facilities Revenue, Series 2016 A, 5.00%, 7/15/29, Continuously Callable @100 | 885,000 | 934,126 | |||||||||
| New Jersey Transportation Trust Fund Authority Revenue Series A, 12/15/2038 (b) | 1,000,000 | 457,613 | |||||||||
Series BB, 3.50%, 6/15/2046, Continuously Callable @100 | 200,000 | 159,026 | |||||||||
1,550,765 | |||||||||||
New York (15.7%): | |||||||||||
| Metropolitan Transportation Authority Dedicated Tax Green Fund Revenue, Series 2016 B1, 5.00%, 11/15/56, Continuously Callable @100 | 1,545,000 | 1,584,486 | |||||||||
| Metropolitan Transportation Authority Revenue, Series D-3, 4.00%, 11/15/49, Continuously Callable @100 | 500,000 | 400,740 | |||||||||
| New York Counties Tobacco Trust II Revenue, 5.75%, 6/1/43, Continuously Callable @100 | 200,000 | 200,102 | |||||||||
See notes to financial statements.
38
| Victory Portfolios Victory Tax-Exempt Fund | Schedule of Portfolio Investments — continued December 31, 2022 | ||||||
Security Description | Principal Amount | Value | |||||||||
| New York State Dormitory Authority Revenue, 6.00%, 7/1/40, Continuously Callable @100 (a) (c) | $ | 330,000 | $ | 278,929 | |||||||
| Port Authority of New York & New Jersey Revenue AMT, 5.00%, 12/1/32, Continuously Callable @100 | 1,000,000 | 1,013,892 | |||||||||
| Schenectady County Capital Resource Corp. Revenue, 5.25%, 7/1/52, Continuously Callable @100 | 200,000 | 213,850 | |||||||||
TSASC, Inc. Revenue, Series A, 5.00%, 6/1/41, Continuously Callable @100 | 2,000,000 | 2,020,888 | |||||||||
5,712,887 | |||||||||||
North Carolina (1.8%): | |||||||||||
| North Carolina Medical Care Commission Revenue Series A, 4.00%, 9/1/2050, Continuously Callable @100 | 500,000 | 377,707 | |||||||||
Series A, 4.00%, 10/01/2050, Continuously Callable @103 | 350,000 | 273,870 | |||||||||
651,577 | |||||||||||
Ohio (8.8%): | |||||||||||
| Buckeye Tobacco Settlement Financing Authority Revenue, Series B-2, 5.00%, 6/1/55, Continuously Callable @100 | 900,000 | 777,960 | |||||||||
| County of Franklin Revenue, Series B, 5.00%, 7/1/45, Continuously Callable @103 | 500,000 | 482,270 | |||||||||
| County of Hardin Economic Development Facilities Revenue, 5.00%, 5/1/30, Continuously Callable @103 | 350,000 | 338,152 | |||||||||
| Logan Elm Local School District, GO, 4.00%, 11/1/55, Continuously Callable @100 | 1,500,000 | 1,357,138 | |||||||||
| Ohio Higher Educational Facility Commission Revenue, 6.00%, 9/1/47, Continuously Callable @100 | 250,000 | 262,627 | |||||||||
3,218,147 | |||||||||||
Pennsylvania (6.3%): | |||||||||||
| Philadelphia School District, GO, Series A, 5.00%, 9/1/44, Continuously Callable @100 | 1,000,000 | 1,046,392 | |||||||||
| The Philadelphia School District, GO, Series A, 5.00%, 9/1/38, Continuously Callable @100 | 1,200,000 | 1,255,964 | |||||||||
2,302,356 | |||||||||||
Texas (1.1%): | |||||||||||
| City of Arlington Tax Allocation, 4.00%, 8/15/50, Continuously Callable @100 | 500,000 | 412,276 | |||||||||
Utah (5.0%): | |||||||||||
| Jordanelle Special Service District Special Assessment, Series C, 12.00%, 8/1/30, Continuously Callable @100 (a) | 368,503 | 369,261 | |||||||||
| Military Installation Development Authority Revenue, Series A-1, 4.00%, 6/1/41, Continuously Callable @103 | 250,000 | 197,211 | |||||||||
| Utah Charter School Finance Authority Revenue, Series A, 5.63%, 6/15/42, Continuously Callable @100 (a) | 250,000 | 250,385 | |||||||||
| Utah Infrastructure Agency Revenue, Series A, 5.00%, 10/15/40, Continuously Callable @100 | 1,000,000 | 1,016,414 | |||||||||
1,833,271 | |||||||||||
See notes to financial statements.
39
| Victory Portfolios Victory Tax-Exempt Fund | Schedule of Portfolio Investments — continued December 31, 2022 | ||||||
Security Description | Principal Amount | Value | |||||||||
Wisconsin (1.0%): | |||||||||||
| Wisconsin Health & Educational Facilities Authority Revenue, 4.00%, 1/1/47, Continuously Callable @103 | $ | 500,000 | $ | 373,027 | |||||||
Total Municipal Bonds (Cost $42,070,464) | 39,165,724 | ||||||||||
Total Investments (Cost $42,070,464) — 107.3% | 39,165,724 | ||||||||||
Liabilities in excess of other assets — (7.3)% | (2,668,293 | ) | |||||||||
NET ASSETS — 100.00% | $ | 36,497,431 | |||||||||
(a) Rule 144A security or other security that is restricted as to resale to institutional investors. The Fund's Adviser has deemed this security to be liquid (unless otherwise noted as illiquid) based upon procedures approved by the Board of Trustees. As of December 31, 2022, the fair value of these securities was $2,140,949 and amounted to 5.9% of net assets.
(b) Zero-coupon bond.
(c) The Fund's Adviser has deemed this security to be illiquid based upon procedures approved by the Board of Trustees. As of December 31, 2022, illiquid securities were 0.8% of net assets.
AMT — Alternative Minimum Tax
GO — General Obligation
IDA — Industrial Development Authority
See notes to financial statements.
40
| Victory Portfolios Victory High Income Municipal Bond Fund | Schedule of Portfolio Investments December 31, 2022 | ||||||
Security Description | Principal Amount | Value | |||||||||
Municipal Bonds (95.6%) | |||||||||||
Arizona (7.3%): | |||||||||||
| Arizona IDA Revenue 4.00%, 7/15/2051, Continuously Callable @100 (a) | $ | 500,000 | $ | 364,534 | |||||||
4.00%, 12/15/2051, Continuously Callable @100 (a) | 700,000 | 547,321 | |||||||||
La Paz County IDA Revenue, 4.00%, 2/15/51, Continuously Callable @100 | 280,000 | 214,310 | |||||||||
| Maricopa County IDA Revenue AMT, 4.00%, 10/15/47, Continuously Callable @104 (a) | 500,000 | 410,019 | |||||||||
| The IDA of the City of Phoenix Revenue, 4.00%, 12/1/51, Continuously Callable @100 (a) | 1,000,000 | 722,306 | |||||||||
| The IDA of the County of Pima Revenue 4.00%, 06/15/2051, Continuously Callable @100 (a) | 500,000 | 366,846 | |||||||||
Series A, 6.88%, 11/15/2052, Continuously Callable @103 (a) | 250,000 | 255,860 | |||||||||
2,881,196 | |||||||||||
California (0.5%): | |||||||||||
| California County Tobacco Securitization Agency Revenue, Series B-1, 5.00%, 6/1/49, Continuously Callable @100 | 195,000 | 195,173 | |||||||||
Delaware (0.9%): | |||||||||||
| Delaware State Economic Development Authority Revenue, 4.00%, 6/1/52, Continuously Callable @100 | 500,000 | 370,412 | |||||||||
District of Columbia (0.5%): | |||||||||||
| District of Columbia Tobacco Settlement Financing Corp. Revenue, 6.50%, 5/15/33 | 195,000 | 197,060 | |||||||||
Florida (9.1%): | |||||||||||
| Escambia County Health Facilities Authority Revenue, 3.00%, 8/15/50, Continuously Callable @100 | 1,000,000 | 694,308 | |||||||||
| Florida Development Finance Corp. Revenue 4.00%, 07/01/2055, Continuously Callable @100 | 500,000 | 375,979 | |||||||||
5.25%, 10/1/2056, Continuously Callable @100 (a) | 500,000 | 457,569 | |||||||||
| Pinellas County Educational Facilities Authority Revenue, Series A, 4.00%, 6/1/46, Continuously Callable @100 (a) | 500,000 | 401,406 | |||||||||
| Seminole County IDA Revenue, 4.00%, 6/15/56, Continuously Callable @100 (a) | 705,000 | 516,451 | |||||||||
| Sumter County Village Community Development District No. 10 Special Assessment Revenue, Series 2014, 5.75%, 5/1/31, Continuously Callable @100 | 1,145,000 | 1,150,764 | |||||||||
3,596,477 | |||||||||||
Illinois (7.7%): | |||||||||||
| Chicago Board of Education Revenue, 6.00%, 4/1/46, Continuously Callable @100 | 1,500,000 | 1,536,942 | |||||||||
| Chicago O Hare International Airport Revenue AMT, 4.63%, 1/1/53, Continuously Callable @100 | 500,000 | 474,940 | |||||||||
| City of Chicago, GO, Series A, 5.50%, 1/1/49, Continuously Callable @100 | 1,000,000 | 1,021,362 | |||||||||
3,033,244 | |||||||||||
See notes to financial statements.
41
| Victory Portfolios Victory High Income Municipal Bond Fund | Schedule of Portfolio Investments — continued December 31, 2022 | ||||||
Security Description | Principal Amount | Value | |||||||||
Indiana (3.6%): | |||||||||||
| Indiana Finance Authority Revenue 4.13%, 12/1/2026 | $ | 1,000,000 | $ | 979,748 | |||||||
Series A, 5.00%, 7/1/2055, Continuously Callable @100 | 500,000 | 440,552 | |||||||||
1,420,300 | |||||||||||
Iowa (1.9%): | |||||||||||
| Iowa Finance Authority Revenue Series A, 5.00%, 5/15/2048, Continuously Callable @100 | 500,000 | 416,891 | |||||||||
Series A-1, 4.00%, 5/15/2055, Continuously Callable @103 | 500,000 | 327,488 | |||||||||
744,379 | |||||||||||
Kansas (0.5%): | |||||||||||
| Wyandotte County-Kansas City Unified Government Tax Allocation, 5.75%, 3/1/41, Continuously Callable @103 (a) | 200,000 | 190,886 | |||||||||
Kentucky (1.2%): | |||||||||||
| Louisville Jefferson County Metropolitan Government Revenue, Series A, 5.00%, 5/15/52, Continuously Callable @100 | 500,000 | 493,487 | |||||||||
Maryland (0.4%): | |||||||||||
| Maryland Economic Development Corp. Revenue, 4.25%, 7/1/50, Continuously Callable @100 | 200,000 | 167,619 | |||||||||
Massachusetts (0.8%): | |||||||||||
| Massachusetts Development Finance Agency Revenue, 4.00%, 10/1/32, Continuously Callable @105 (a) | 300,000 | 303,011 | |||||||||
Minnesota (0.7%): | |||||||||||
City of Woodbury Revenue, 4.00%, 7/1/51, Continuously Callable @103 | 400,000 | 290,288 | |||||||||
Missouri (1.2%): | |||||||||||
| Health & Educational Facilities Authority of the State of Missouri Revenue, 4.25%, 12/1/42, Continuously Callable @100 (a) | 500,000 | 457,168 | |||||||||
New Hampshire (1.0%): | |||||||||||
| New Hampshire Business Finance Authority Revenue, 4.00%, 1/1/51, Continuously Callable @103 | 500,000 | 388,309 | |||||||||
New Jersey (4.1%): | |||||||||||
| New Jersey Economic Development Motor Vehicle Surcharges Subordinate Revenue, Series A, 5.00%, 7/1/33, Continuously Callable @100 | 500,000 | 519,478 | |||||||||
| New Jersey Transportation Trust Fund Authority Revenue Series A, 12/15/2038 (b) | 1,500,000 | 686,419 | |||||||||
Series BB, 3.50%, 6/15/2046, Continuously Callable @100 | 500,000 | 397,565 | |||||||||
1,603,462 | |||||||||||
New Mexico (2.1%): | |||||||||||
| New Mexico Hospital Equipment Loan Council Revenue, Series LA, 5.00%, 7/1/49, Continuously Callable @102 | 500,000 | 400,487 | |||||||||
| Winrock Town Center Tax Increment Development District Tax Allocation, 4.25%, 5/1/40, Continuously Callable @103 (a) | 500,000 | 413,241 | |||||||||
813,728 | |||||||||||
See notes to financial statements.
42
| Victory Portfolios Victory High Income Municipal Bond Fund | Schedule of Portfolio Investments — continued December 31, 2022 | ||||||
Security Description | Principal Amount | Value | |||||||||
New York (11.1%): | |||||||||||
| Build Nyc Resource Corp. Revenue 5.75%, 06/01/2052, Continuously Callable @100 (a) | $ | 250,000 | $ | 246,988 | |||||||
5.75%, 06/01/2062, Continuously Callable @100 (a) | 250,000 | 241,803 | |||||||||
| Build NYC Resource Corp. Revenue 4.00%, 6/15/2051, Continuously Callable @100 | 500,000 | 376,775 | |||||||||
Series A, 5.00%, 6/15/2051, Continuously Callable @100 (a) | 100,000 | 91,495 | |||||||||
Huntington Local Development Corp. Revenue, Series S, 3.00%, 7/1/25 | 340,000 | 325,533 | |||||||||
| Metropolitan Transportation Authority Revenue Series A-2, 5.00%, 11/15/2045, (Put Date 5/15/30) (c) | 365,000 | 387,734 | |||||||||
Series D-3, 4.00%, 11/15/2049, Continuously Callable @100 | 500,000 | 400,740 | |||||||||
| New York State Dormitory Authority Revenue 6.00%, 7/1/2040, Continuously Callable @100 (a) (d) | 1,000,000 | 845,240 | |||||||||
4.00%, 7/1/2040, Continuously Callable @100 | 200,000 | 175,357 | |||||||||
| New York Transportation Development Corp. Revenue AMT, 5.00%, 10/1/40, Continuously Callable @100 | 750,000 | 721,468 | |||||||||
| Onondaga Civic Development Corp. Revenue, 5.00%, 10/1/40, Continuously Callable @100 | 250,000 | 231,803 | |||||||||
| Western Regional Off-Track Betting Corp. Revenue, 4.13%, 12/1/41, Continuously Callable @100 (a) | 500,000 | 363,550 | |||||||||
4,408,486 | |||||||||||
North Carolina (0.6%): | |||||||||||
| North Carolina Medical Care Commission Revenue, 5.00%, 10/1/50, Continuously Callable @103 | 250,000 | 219,283 | |||||||||
North Dakota (2.3%): | |||||||||||
| Grand Forks, North Dakota Senior Housing and Nursing Facility Revenue, 5.00%, 12/1/36, Continuously Callable @100 | 1,000,000 | 923,477 | |||||||||
Ohio (2.3%): | |||||||||||
County of Hardin Revenue, 5.50%, 5/1/50, Continuously Callable @103 | 500,000 | 445,620 | |||||||||
| Northeast Ohio Medical University Revenue, Series A, 4.00%, 12/1/45, Continuously Callable @100 | 225,000 | 198,547 | |||||||||
| Ohio Higher Educational Facility Commission Revenue, 6.00%, 9/1/47, Continuously Callable @100 | 250,000 | 262,627 | |||||||||
906,794 | |||||||||||
Oregon (1.9%): | |||||||||||
| Clackamas County Hospital Facility Authority Revenue Series A, 5.00%, 11/15/2052, Continuously Callable @102 | 500,000 | 465,301 | |||||||||
Series A, 5.38%, 11/15/2055, Continuously Callable @102 | 100,000 | 90,159 | |||||||||
| Yamhill County Hospital Authority Revenue, Series A, 5.00%, 11/15/51, Continuously Callable @103 | 250,000 | 194,501 | |||||||||
749,961 | |||||||||||
Pennsylvania (3.7%): | |||||||||||
Bucks County IDA Revenue, 5.00%, 7/1/54, Continuously Callable @100 | 500,000 | 423,630 | |||||||||
| Chester County IDA Revenue, 6.00%, 10/15/52, Continuously Callable @100 (a) | 500,000 | 491,208 | |||||||||
See notes to financial statements.
43
| Victory Portfolios Victory High Income Municipal Bond Fund | Schedule of Portfolio Investments — continued December 31, 2022 | ||||||
Security Description | Principal Amount | Value | |||||||||
| Pennsylvania Economic Development Financing Authority Revenue AMT, 9.00%, 4/1/51 (a) | $ | 500,000 | $ | 567,901 | |||||||
1,482,739 | |||||||||||
South Carolina (4.8%): | |||||||||||
| County of Richland SC Special Assessment, 3.63%, 11/1/31, Continuously Callable @103 (a) | 290,000 | 234,485 | |||||||||
| Lancaster County Walnut Creek Improvement District Assessment Refunding Revenue, Series 2016 A-1, 5.00%, 12/1/37, Continuously Callable @100 | 1,675,000 | 1,681,593 | |||||||||
1,916,078 | |||||||||||
Texas (4.2%): | |||||||||||
| City of Houston Texas Airport System Revenue AMT, Series C, 4.00%, 7/15/41, Continuously Callable @100 | 750,000 | 638,047 | |||||||||
| Texas Private Activity Bond Surface Transportation Corp. Revenue, NTE Mobility Partners Segments 3 LLC — Segments 3A & 3B Facility AMT, Series 2013, 7.00%, 12/31/38, Continuously Callable @100 | 1,000,000 | 1,017,557 | |||||||||
1,655,604 | |||||||||||
Utah (8.3%): | |||||||||||
| Jordanelle Special Service District Special Assessment, Series C, 12.00%, 8/1/30, Continuously Callable @100 (a) | 1,155,348 | 1,157,723 | |||||||||
| Military Installation Development Authority Revenue Series A-1, 4.00%, 06/01/2041, Continuously Callable @103 | 250,000 | 197,211 | |||||||||
Series A-1, 4.00%, 06/01/2052, Continuously Callable @103 | 250,000 | 176,930 | |||||||||
| Utah Charter School Finance Authority Revenue 2.75%, 4/15/2050, Continuously Callable @100 | 525,000 | 326,338 | |||||||||
Series A, 5.63%, 06/15/2042, Continuously Callable @100 (a) | 250,000 | 250,385 | |||||||||
| Utah Infrastructure Agency Revenue, Series A, 5.38%, 10/15/40, Continuously Callable @100 | 1,150,000 | 1,187,718 | |||||||||
3,296,305 | |||||||||||
Vermont (2.8%): | |||||||||||
| Vermont Economic Development Authority Revenue, 4.00%, 5/1/45, Continuously Callable @103 | 500,000 | 381,263 | |||||||||
| Vermont Educational & Health Buildings Financing Agency Revenue, 5.00%, 10/15/46, Continuously Callable @100 | 750,000 | 717,217 | |||||||||
1,098,480 | |||||||||||
West Virginia (2.6%): | |||||||||||
| The County Commission of Monongalia County, WV Special District Excise Tax Revenue, Series 2017 A, 5.75%, 6/1/43, Continuously Callable @100 (a) | 1,000,000 | 1,023,212 | |||||||||
Wisconsin (7.5%): | |||||||||||
| Public Finance Authority Revenue 4.00%, 4/1/2052, Continuously Callable @100 (a) | 500,000 | 369,272 | |||||||||
5.88%, 6/1/2052, Continuously Callable @100 (a) | 250,000 | 237,954 | |||||||||
Series A, 4.25%, 12/1/2051, Continuously Callable @100 (a) | 500,000 | 399,670 | |||||||||
Series A, 5.25%, 3/1/2055, Continuously Callable @100 (a) | 500,000 | 435,116 | |||||||||
Series A, 5.00%, 7/1/2055, Continuously Callable @100 (a) | 500,000 | 429,273 | |||||||||
Series A-1, 4.00%, 07/01/2051, Continuously Callable @100 (a) | 500,000 | 372,764 | |||||||||
See notes to financial statements.
44
| Victory Portfolios Victory High Income Municipal Bond Fund | Schedule of Portfolio Investments — continued December 31, 2022 | ||||||
Security Description | Principal Amount | Value | |||||||||
| Wisconsin Health & Educational Facilities Authority Revenue 4.00%, 01/01/2047, Continuously Callable @103 | $ | 500,000 | $ | 373,027 | |||||||
4.00%, 12/01/2051, Continuously Callable @100 | 500,000 | 348,752 | |||||||||
2,965,828 | |||||||||||
Total Municipal Bonds (Cost $43,439,581) | 37,792,446 | ||||||||||
Total Investments (Cost $43,439,581) — 95.6% | 37,792,446 | ||||||||||
Other assets in excess of liabilities — 4.4% | 1,737,732 | ||||||||||
NET ASSETS — 100.00% | $ | 39,530,178 | |||||||||
(a) Rule 144A security or other security that is restricted as to resale to institutional investors. The Fund's Adviser has deemed this security to be liquid (unless otherwise noted as illiquid) based upon procedures approved by the Board of Trustees. As of December 31, 2022, the fair value of these securities was $13,164,657 and amounted to 33.3% of net assets.
(b) Zero-coupon bond.
(c) Put bond.
(d) The Fund's Adviser has deemed this security to be illiquid based upon procedures approved by the Board of Trustees. As of December 31, 2022, illiquid securities were 2.1% of net assets.
AMT — Alternative Minimum Tax
GO — General Obligation
IDA — Industrial Development Authority
LLC — Limited Liability Company
See notes to financial statements.
45
| Victory Portfolios Victory Floating Rate Fund | Schedule of Portfolio Investments December 31, 2022 | ||||||
Security Description | Shares or Principal Amount | Value | |||||||||
Common Stocks (0.0%) (a) | |||||||||||
Consumer Discretionary (0.0%): | |||||||||||
Men's Wearhouse, Inc. (e) | 51,299 | $ | 367,660 | ||||||||
Total Common Stocks (Cost $192,371) | 367,660 | ||||||||||
Warrants (0.0%) | |||||||||||
Communication Services (0.0%): | |||||||||||
Cineworld Group PLC | 377,856 | — | |||||||||
Total Warrants (Cost $—) | — | ||||||||||
Senior Secured Loans (87.9%) | |||||||||||
| 19th Holdings Golf LLC, Initial Term Loans, First Lien, 7.28% (SOFR01M+300bps), 1/27/29 (b) | $ | 21,626,288 | 19,788,053 | ||||||||
| AAdvantage Loyalty IP Ltd., Initial Term Loan, First Lien, 8.99% (LIBOR03M+475bps), 4/20/28 (b) | 20,334,127 | 20,222,899 | |||||||||
| Accelerated Health Systems LLC, Initial Term B Loans, First Lien, 7.80% (SOFR03M+425bps), 2/2/29 (b) | 3,977,506 | 3,216,808 | |||||||||
| ACProducts, Inc., Initial Term Loans, First Lien, 7.92% (LIBOR03M+425bps), 5/17/28 (b) | 4,106,966 | 3,057,349 | |||||||||
| ACProducts, Inc., Initial Term Loans, First Lien, 7.13% (LIBOR06M+425bps), 5/17/28 (b) | 18,445,530 | 13,731,406 | |||||||||
| Acrisure LLC, Term Loan B 2020, First Lien, 7.57% (LIBOR01M+350bps), 2/15/27 (b) | 6,125,698 | 5,735,185 | |||||||||
| Air Canada, Term Loan, First Lien, 8.13% (LIBOR03M+350bps), 8/11/28 (b) | 15,892,569 | 15,674,046 | |||||||||
| Air Medical Group Holdings, Inc., Incremental Term Loan B, First Lien, 8.32% (LIBOR01M+425bps), 3/14/25 (b) | 7,772,144 | 5,469,647 | |||||||||
| Air Methods Corp., Initial Term Loans, First Lien, 7.17% (LIBOR03M+350bps), 4/21/24 (b) | 19,442,593 | 10,839,246 | |||||||||
| Albaugh LLC, Term Loan B, First Lien, 7.59% (SOFR03M+350bps), 12/21/24 (b) | 13,566,252 | 13,340,103 | |||||||||
| Alliance Laundry Systems LLC, Initial Term B Loans, First Lien, 7.41% (LIBOR03M+350bps), 10/8/27 (b) | 9,743,352 | 9,541,178 | |||||||||
| Alterra Mountain Co., Facility 2028 Term Loan B, First Lien, 7.57% (LIBOR01M+350bps), 8/17/28 (b) | 12,874,736 | 12,689,726 | |||||||||
| American Axle Manufacturing, Inc., 7.80% (SOFR01M+350bps), 12/8/29 (b) | 2,750,000 | 2,685,842 | |||||||||
| Amneal Pharmaceuticals LLC, Initial Term Loans, First Lien, 7.63% (LIBOR01M+350bps), 3/23/25 (b) | 18,481,914 | 16,511,558 | |||||||||
| Anchor Packaging LLC, Initial Term Loans, First Lien, 8.07% (LIBOR01M+400bps), 7/18/26 (b) | 6,851,601 | 6,534,714 | |||||||||
| Apex Tool Group LLC, Initial Term Loan, First Lien, 9.57% (SOFR01M+525bps), 2/8/29 (b) | 5,862,402 | 5,004,088 | |||||||||
| Avis Budget Car Rental LLC, Tranche C Term Loan, First Lien, 7.59% (SOFR01M+350bps), 3/16/29 (b) | 2,977,500 | 2,923,548 | |||||||||
| AZZ, Inc., Initial Term Loan, First Lien, 8.34% (SOFR01M+425bps), 5/6/29 (b) | 10,335,000 | 10,322,081 | |||||||||
See notes to financial statements.
46
| Victory Portfolios Victory Floating Rate Fund | Schedule of Portfolio Investments — continued December 31, 2022 | ||||||
Security Description | Principal Amount | Value | |||||||||
| Bally's Corp., Term B Facility Loans, First Lien, 7.54% (LIBOR01M+325bps), 10/1/28 (b) | $ | 11,865,075 | $ | 10,948,498 | |||||||
| Bausch Health Cos., Inc., Term B, First Lien, 9.57% (SOFR01M+525bps), 1/27/27 (b) | 18,375,000 | 13,903,811 | |||||||||
| Brand Energy and Infrastructure Services, Inc., Initial Term Loan, First Lien, 8.61% (LIBOR03M+425bps), 6/21/24 (b) | 7,563,293 | 6,750,239 | |||||||||
| BW NHHC Holdco, Inc., Term Loan Lien 2, Second Lien, 13.67% (LIBOR03M+900bps), 5/15/26 (b) | 3,000,000 | 900,000 | |||||||||
| Caesars Resort Collection LLC, 1st Lien Term Loan B, 6.82% (LIBOR01M+275bps), 12/22/24 (b) | 2,276,540 | 2,269,324 | |||||||||
| Caesars Resort Collection LLC, Term B-1 Loans, First Lien, 7.57% (LIBOR01M+350bps), 6/19/25 (b) | 4,468,640 | 4,453,402 | |||||||||
| Chariot Buyer LLC, Initial Term Loans, First Lien, 7.32% (LIBOR01M+325bps), 11/3/28 (b) | 6,885,113 | 6,477,721 | |||||||||
Chart Industries, Inc., 12/8/29 (c) | 1,250,000 | 1,235,162 | |||||||||
| Chassix, Inc., Term Loan B, First Lien, 9.81% (LIBOR03M+550bps), 11/10/23 (b) | 3,785,642 | 3,161,011 | |||||||||
| Cinemark USA, Inc., Term Loan B, First Lien, 6.17% (LIBOR03M+175bps), 3/29/25 (b) | 1,115,278 | 1,069,697 | |||||||||
| Cinemark USA, Inc., Term Loan B, First Lien, 5.83% (LIBOR01M+175bps), 3/29/25 (b) | 2,842,823 | 2,726,637 | |||||||||
| Clear Channel Outdoor Holdings, Inc., Term B Loan, First Lien, 7.91% (LIBOR03M+350bps), 8/21/26 (b) | 10,933,254 | 9,937,563 | |||||||||
| Clydesdale Acquisition Holdings LLC, Term B Loans, First Lien, 8.36% (SOFR01M+418bps), 4/13/29 (b) | 3,945,088 | 3,749,490 | |||||||||
| Cornerstone Building Brands, Inc., New Term Loan B, First Lien, 7.57% (LIBOR01M+325bps), 4/12/28 (b) | 16,518,219 | 14,766,132 | |||||||||
| Covis Pharma Holdings S.a.r.l., Dollar Term B Loans, First Lien, 10.05% (SOFR03M+650bps), 2/14/27 (b) | 16,362,500 | 8,835,750 | |||||||||
| CP Altas Buyer, Inc., Term B Loans, First Lien, 7.57% (LIBOR01M+350bps), 11/23/27 (b) | 18,744,243 | 16,367,473 | |||||||||
| CPM Holdings, Inc., 2nd Lien Initial Term Loans, Second Lien, 12.37% (LIBOR01M+825bps), 11/16/26 (b) | 1,595,960 | 1,550,746 | |||||||||
| CPM Holdings, Inc., Initial Term Loans, First Lien, 7.62% (LIBOR01M+350bps), 11/17/25 (b) | 2,879,982 | 2,822,383 | |||||||||
| Cumulus Media New Holdings, Inc., Initial Term Loan, First Lien, 7.82% (LIBOR01M+375bps), 3/31/26 (b) | 19,164,544 | 17,899,684 | |||||||||
| Delta Air Lines, Inc. and Skymiles IP Ltd., Initial Term Loan, First Lien, 7.99% (LIBOR03M+375bps), 10/20/27 (b) | 18,911,595 | 19,252,004 | |||||||||
| Diamond Sports Group LLC, Term Loan, First Lien, 12.32% (SOFR01M+810bps), 5/25/26 (b) | 1,448,737 | 1,367,854 | |||||||||
| Diamond Sports Group LLC, Term Loan, Second Lien, 7.57% (SOFR01M+335bps), 8/24/26 (b) | 19,801,150 | 2,376,138 | |||||||||
| Dynasty Acquisition Co., Inc., 2020 Specified Refi Term B-1 Loans, First Lien, 7.57% (LIBOR01M+350bps), 4/8/26 (b) | 2,757,062 | 2,622,931 | |||||||||
| Entercom Media Corp., New Term Loan, First Lien, 6.89% (LIBOR01M+250bps), 11/17/24 (b) | 14,706,476 | 10,412,774 | |||||||||
| Envision Healthcare Corp., First Out Term Loan, First Lien, 11.91% (SOFR01M+788bps), 7/22/27 (b) | 1,418,947 | 1,257,541 | |||||||||
See notes to financial statements.
47
| Victory Portfolios Victory Floating Rate Fund | Schedule of Portfolio Investments — continued December 31, 2022 | ||||||
Security Description | Principal Amount | Value | |||||||||
| Envision Healthcare Corp., Third Out term Loans, First Lien, 7.87% (SOFR01M+375bps), 3/31/27 (b) | $ | 3,939,937 | $ | 984,984 | |||||||
| Eyemart Express LLC, Term B-1 Loan, First Lien, 7.35% (LIBOR01M+300bps), 8/5/27 (b) | 19,644,011 | 16,697,410 | |||||||||
| Fertitta Entertainment LLC, Initial B Term Loan, First Lien, 8.09% (SOFR01M+400bps), 1/27/29 (b) | 22,331,250 | 21,189,676 | |||||||||
| First Brands Group LLC, 2021 Term Loans, First Lien, 8.37% (SOFR06M+500bps), 3/24/27 (b) | 6,393,656 | 6,035,611 | |||||||||
| Frontier Communications Corp., Refinancing Term Loans, First Lien, 7.44% (LIBOR03M+375bps), 10/8/27 (b) | 15,764,547 | 15,004,538 | |||||||||
| Gates Global LLC, Initial B-3 Dollar Term Loan, First Lien, 6.57% (LIBOR01M+250bps), 3/31/27 (b) | 10,818,526 | 10,571,431 | |||||||||
| Global Medical Response, Inc., 2020 Term Loan, First Lien, 8.42% (LIBOR01M+425bps), 10/2/25 (b) | 10,799,674 | 7,526,077 | |||||||||
| Graham Packaging Co., Inc., New Term Loans, First Lien, 7.07% (LIBOR01M+300bps), 8/4/27 (b) | 9,595,347 | 9,411,404 | |||||||||
| Great Outdoors Group LLC, Term B1, First Lien, 7.82% (LIBOR01M+375bps), 3/5/28 (b) | 13,977,540 | 13,400,966 | |||||||||
Harbor Purchaser, Inc., 9.34% (SOFR01M+525bps), 4/4/29 (b) | 18,952,500 | 17,963,369 | |||||||||
| Hertz Corp., Initial Term B Loans, First Lien, 7.33% (LIBOR01M+325bps), 6/30/28 (b) | 16,661,610 | 16,298,220 | |||||||||
| Hertz Corp., Initial Term C Loan, First Lien, 7.33% (LIBOR01M+325bps), 6/30/28 (b) | 3,187,891 | 3,118,363 | |||||||||
| Holley Purchaser, Inc., Initial Term Loan, First Lien, 8.42% (LIBOR03M+375bps), 11/10/28 (b) | 13,450,821 | 11,609,808 | |||||||||
| Hunter Douglas, Inc., Tranche B-1 Term Loans, First Lien, 7.86% (SOFR03M+350bps), 2/9/29 (b) | 16,907,519 | 14,809,127 | |||||||||
| iHeartCommunications, Inc., Second Amendment Incremental Term Loan, First Lien, 7.32% (LIBOR01M+325bps), 5/1/26 (b) | 6,189,535 | 5,688,554 | |||||||||
| iHeartCommunications, Inc., Term Loans, First Lien, 7.07% (LIBOR01M+300bps), 5/1/26 (b) | 22,024,463 | 20,145,556 | |||||||||
| Innio North America Holding, Inc., Facility B USD, First Lien, 7.03% (LIBOR06M+275bps), 11/6/25 (b) | 8,756,957 | 8,072,864 | |||||||||
| Intelsat Jackson Holdings SA, Term B loan, First Lien, 7.19% (SOFR06M+425bps), 2/1/29 (b) | 19,986,219 | 19,258,121 | |||||||||
| Janus International Group LLC, Amendment No 3 Refinancing Term Loans, First Lien, 7.32% (LIBOR01M+325bps), 2/15/25 (b) | 13,372,071 | 12,915,148 | |||||||||
| Jo-Ann Stores LLC, Term B-1 Loan, First Lien, 9.08% (LIBOR03M+475bps), 6/30/28 (b) | 18,258,850 | 12,263,922 | |||||||||
| Knight Health Holdings LLC, Term B Loans, First Lien, 9.32% (LIBOR01M+525bps), 12/17/28 (b) | 23,265,000 | 13,551,862 | |||||||||
| LBM Acquisition LLC, Initial Term Loan, First Lien, 7.12% (LIBOR03M+375bps), 12/17/27 (b) | 19,331,888 | 16,716,090 | |||||||||
| Leslie's Poolmart, Inc., Term Loan B, First Lien, 6.57% (LIBOR01M+250bps), 3/9/28 (b) | 9,981,327 | 9,748,463 | |||||||||
| Life Time, Inc., 2021 Refinancing Term Loan, First Lien, 9.48% (LIBOR03M+475bps), 12/15/24 (b) | 8,682,191 | 8,625,236 | |||||||||
| Lifepoint Health, Inc., Term B Loans, First Lien, 8.16% (LIBOR03M+375bps), 11/16/25 (b) | 8,231,875 | 7,742,079 | |||||||||
See notes to financial statements.
48
| Victory Portfolios Victory Floating Rate Fund | Schedule of Portfolio Investments — continued December 31, 2022 | ||||||
Security Description | Principal Amount | Value | |||||||||
| LifeScan Global Corp., Initial Term Loan, First Lien, 9.74% (LIBOR03M+600bps), 10/1/24 (b) | $ | 20,692,674 | $ | 14,835,406 | |||||||
| LifeScan Global Corp., Initial Term Loan, Second Lien, 13.24% (LIBOR03M+950bps), 6/19/25 (b) | 3,750,000 | 2,475,000 | |||||||||
| LSF11 A5 Holdco LLC, Term Loans, First Lien, 7.59% (SOFR01M+350bps), 10/15/28 (b) | 13,895,000 | 13,405,201 | |||||||||
| Madison IAQ LLC, Initial Term Loans, First Lien, 7.99% (LIBOR03M+325bps), 6/16/28 (b) | 12,137,767 | 11,265,425 | |||||||||
| McGraw Hill Education, Inc., Initial Term Loan, First Lien, 8.32% (LIBOR06M+475bps), 7/30/28 (b) | 18,512,975 | 17,384,794 | |||||||||
| MHI Holdings LLC, Initial Term Loans, First Lien, 9.07% (LIBOR01M+500bps), 9/20/26 (b) | 5,492,580 | 5,430,788 | |||||||||
| Mileage Plus Holdings LLC, Initial Term Loan, First Lien, 10.00% (LIBOR03M+525bps), 6/20/27 (b) | 18,710,526 | 19,220,388 | |||||||||
| Navicure, Inc., Initial Term Loans, First Lien, 8.07% (LIBOR01M+400bps), 10/23/26 (b) | 7,792,625 | 7,643,241 | |||||||||
| Neptune BidCo US, Inc., Dollar Term B Loan, First Lien, 8.82% (SOFR03M+500bps), 4/11/29 (b) | 3,500,000 | 3,117,205 | |||||||||
| NorthRiver Midstream Finance LP, Initial Term Loan B, First Lien, 6.92% (LIBOR03M+325bps), 10/1/25 (b) | 11,656,268 | 11,558,472 | |||||||||
| Park River Holdings, Inc., Initial Term Loans, First Lien, 6.99% (LIBOR03M+325bps), 1/20/28 (b) | 9,849,921 | 8,581,743 | |||||||||
| Peraton Corp., Term B Loans, First Lien, 7.82% (LIBOR01M+375bps), 2/1/28 (b) | 8,100,798 | 7,896,577 | |||||||||
| Petco Health and Wellness Co., Inc., Initial Term Loans, First Lien, 6.92% (LIBOR03M+325bps), 3/4/28 (b) | 19,396,304 | 18,804,329 | |||||||||
| PetSmart, Inc., Initial Term Loans, First Lien, 7.82% (LIBOR01M+375bps), 2/12/28 (b) | 14,885,301 | 14,536,389 | |||||||||
| PG&E CORP., Term Loans, First Lien, 7.13% (LIBOR01M+300bps), 6/23/25 (b) | 10,739,698 | 10,642,397 | |||||||||
| Radiology Partners, Inc., Term Loan New, First Lien, 8.64% (LIBOR01M+425bps), 7/9/25 (b) | 17,451,802 | 14,594,070 | |||||||||
| Reynolds Group Holdings, Inc., Tranche B-2 U.S. Term Loans, First Lien, 7.32% (LIBOR01M+325bps), 2/5/26 (b) | 4,474,573 | 4,414,435 | |||||||||
| Ring Container Technologies Group LLC, Initial Term Loans, First Lien, 7.57% (LIBOR01M+350bps), 8/5/28 (b) | 5,440,038 | 5,361,864 | |||||||||
| Rising Tide Holdings, Inc., Initial Term Loan, First Lien, 9.48% (LIBOR03M+475bps), 6/1/28 (b) | 10,852,306 | 4,883,537 | |||||||||
| Robertshaw U.S. Holding Corp., 2nd Lien Initial Term Loans, Second Lien, 12.13% (LIBOR01M+800bps), 2/15/26 (b) | 4,000,000 | 2,060,000 | |||||||||
| Robertshaw U.S. Holding Corp., Term Loan B, First Lien, 7.63% (LIBOR01M+350bps), 2/28/25 (b) | 6,304,836 | 4,236,850 | |||||||||
| Scientific Games International, Inc., Initial Term B Loans, First Lien, 7.42% (SOFR01M+300bps), 4/16/29 (b) | 5,970,000 | 5,874,062 | |||||||||
| Sedgwick Claims Management Services, Inc., Initial Term Loans, First Lien, 7.32% (LIBOR01M+325bps), 12/31/25 (b) | 2,900,257 | 2,817,339 | |||||||||
| Sinclair Television Group, Inc., Term Loan B-3, First Lien, 7.08% (LIBOR01M+300bps), 3/25/28 (b) | 15,814,485 | 14,976,317 | |||||||||
See notes to financial statements.
49
| Victory Portfolios Victory Floating Rate Fund | Schedule of Portfolio Investments — continued December 31, 2022 | ||||||
Security Description | Principal Amount | Value | |||||||||
| Sparta U.S. Holdco LLC, Initial Term Loan, First Lien, 7.39% (LIBOR01M+325bps), 4/30/28 (b) | $ | 3,960,000 | $ | 3,842,863 | |||||||
| SRS Distribution, Inc., 2021 Refinancing Term Loans, First Lien, 7.57% (LIBOR01M+350bps), 6/4/28 (b) | 17,221,101 | 16,430,824 | |||||||||
| Standard Aero Ltd., 2020 SPCFD Refi Term B-2 Loans, First Lien, 7.57% (LIBOR01M+350bps), 4/8/26 (b) | 1,482,292 | 1,410,178 | |||||||||
| Station Casinos LLC, Term B-1 Facility Loans, First Lien, 6.33% (LIBOR01M+225bps), 2/8/27 (b) | 8,222,559 | 8,012,719 | |||||||||
| Surgery Center Holdings, Inc., 2021 New Term Loans, First Lien, 8.05% (LIBOR01M+375bps), 8/31/26 (b) | 14,647,237 | 14,444,226 | |||||||||
| SWF Holdings Corp. I, Initial Term Loans, First Lien, 8.75% (LIBOR03M+400bps), 10/6/28 (b) | 18,053,313 | 14,704,424 | |||||||||
| Tailwind Smith Cooper Intermediate Corp., 2nd Lien Initial Term Loans, Second Lien, 13.42% (LIBOR03M+900bps), 5/28/27 (b) | 3,000,000 | 2,541,570 | |||||||||
| Team Health Holdings, Inc., Facility Extending TLB, First Lien, 9.34% (SOFR01M+525bps), 2/2/27 (b) | 21,312,921 | 15,931,409 | |||||||||
| The Michaels Cos., Inc., Term B Loans, First Lien, 7.92% (LIBOR03M+425bps), 4/15/28 (b) | 17,196,117 | 14,798,290 | |||||||||
| TIBCO Software Inc., Dollar Term B Loan, First Lien, 8.05% (SOFR03M+450bps), 3/20/29 (b) | 6,250,000 | 5,570,312 | |||||||||
| Titan Acquisition Ltd., Initial Term Loan, First Lien, 5.88% (LIBOR06M+300bps), 3/28/25 (b) | 5,116,519 | 4,768,749 | |||||||||
| Transdigm, Inc., Tranche F Refinancing Term Loan, First Lien, 5.92% (LIBOR03M+225bps), 12/9/25 (b) | 7,740,309 | 7,636,434 | |||||||||
| Traverse Midstream Partners LLC, Advance, First Lien, 8.80% (SOFR01M+425bps), 9/27/24 (b) | 12,914,362 | 12,869,936 | |||||||||
| Trident TPI Holdings, Inc., Tranche B-3 DDTL Commitments, First Lien, 8.07% (LIBOR01M+400bps), 9/17/28 (b) | 927,228 | 888,813 | |||||||||
| Trident TPI Holdings, Inc., Tranche B-3 Initial Term Loans, First Lien, 7.67% (LIBOR03M+400bps), 9/17/28 (b) | 6,508,674 | 6,239,020 | |||||||||
| Triton Water Holdings, Inc., Initial Term Loan, First Lien, 7.17% (LIBOR03M+350bps), 3/31/28 (b) | 3,369,380 | 3,121,731 | |||||||||
| U.S. Renal Care, Inc., Initial Term Loan, First Lien, 9.13% (LIBOR01M+500bps), 7/26/26 (b) | 22,540,275 | 12,487,989 | |||||||||
| United Airlines, Inc., Class B Term Loans, First Lien, 8.11% (LIBOR03M+375bps), 4/21/28 (b) | 10,712,442 | 10,557,754 | |||||||||
| Univision Communications, Inc., 2021 Replacement New First-Lien Term, First Lien, 7.32% (LIBOR01M+325bps), 3/24/26 (b) | 10,150,299 | 9,974,496 | |||||||||
| Univision Communications, Inc., Initial First-Lien Term Loans, First Lien, 7.32% (LIBOR01M+325bps), 5/7/28 (b) | 5,443,788 | 5,269,151 | |||||||||
| Upstream Rehabilitation, August 2021 Incremental TL, First Lien, 8.06% (SOFR03M+425bps), 11/20/26 (b) | 4,919,988 | 4,227,106 | |||||||||
| Verscend Holding Corp., New Term Loan B-1 Facility, First Lien, 8.07% (LIBOR01M+400bps), 8/27/25 (b) | 6,746,225 | 6,689,624 | |||||||||
| WestJet Airlines Ltd., Initial Term Loan, First Lien, 7.35% (LIBOR01M+300bps), 12/11/26 (b) | 23,693,364 | 21,641,361 | |||||||||
| White Cap Buyer LLC, Initial Closing Date Term Loan, First Lien, 7.84% (SOFR01M+375bps), 10/19/27 (b) | 11,280,904 | 10,890,133 | |||||||||
| WireCo WorldGroup, Inc., Initial Term Loan, First Lien, 8.94% (LIBOR03M+425bps), 11/13/28 (b) | 9,204,452 | 8,939,824 | |||||||||
See notes to financial statements.
50
| Victory Portfolios Victory Floating Rate Fund | Schedule of Portfolio Investments — continued December 31, 2022 | ||||||
Security Description | Principal Amount | Value | |||||||||
| WP CPP Holdings LLC, Term Loan Second Lien, Second Lien, 12.17% (LIBOR03M+775bps), 4/30/26 (b) | $ | 2,000,000 | $ | 1,663,760 | |||||||
| WP CPP Holdings LLC, Term Loans, First Lien, 8.17% (LIBOR03M+375bps), 4/30/25 (b) | 9,718,337 | 8,420,259 | |||||||||
Total Senior Secured Loans (Cost $1,247,043,511) | 1,103,739,105 | ||||||||||
Corporate Bonds (7.8%) | |||||||||||
Communication Services (1.9%): | |||||||||||
Audacy Capital Corp., 6.50%, 5/1/27, Callable 1/23/23 @ 104.88 (d) | 3,000,000 | 569,460 | |||||||||
CSC Holdings LLC, 5.75%, 1/15/30, Callable 1/15/25 @ 102.88 (d) | 2,250,000 | 1,272,195 | |||||||||
| Cumulus Media New Holdings, Inc., 6.75%, 7/1/26, Callable 2/6/23 @ 103.38 (d) | 8,247,000 | 6,926,243 | |||||||||
| iHeartCommunications, Inc., 8.38%, 5/1/27, Callable 1/23/23 @ 104.19 | 5,500,000 | 4,684,350 | |||||||||
| Sinclair Television Group, Inc., 5.50%, 3/1/30, Callable 12/1/24 @ 102.75 (d) | 8,850,000 | 6,195,088 | |||||||||
TEGNA, Inc., 5.00%, 9/15/29, Callable 9/15/24 @ 102.5 | 5,000,000 | 4,733,400 | |||||||||
24,380,736 | |||||||||||
Consumer Discretionary (1.8%) | |||||||||||
| Avis Budget Car Rental LLC/Avis Budget Finance, Inc., 5.38%, 3/1/29, Callable 3/1/24 @ 102.69 (d) | 4,000,000 | 3,434,400 | |||||||||
| Caesars Entertainment, Inc. 6.25%, 7/1/25, Callable 1/17/23 @ 103.13 (d) | 2,400,000 | 2,335,008 | |||||||||
8.13%, 7/1/27, Callable 7/1/23 @ 104.06 (d) | 1,800,000 | 1,770,228 | |||||||||
Cinemark USA, Inc., 5.25%, 7/15/28, Callable 7/15/24 @ 102.63 (d) | 1,000,000 | 742,780 | |||||||||
Ford Motor Co., 6.10%, 8/19/32, Callable 5/19/32 @ 100 | 3,500,000 | 3,242,610 | |||||||||
| Premier Entertainment Sub LLC/Premier Entertainment Finance Corp., 5.88%, 9/1/31, Callable 9/1/26 @ 102.98 (d) | 6,000,000 | 4,232,820 | |||||||||
The Hertz Corp., 5.00%, 12/1/29, Callable 12/1/24 @ 102.5 (d) | 5,200,000 | 3,943,940 | |||||||||
The Michaels Cos., Inc., 7.88%, 5/1/29, Callable 5/1/24 @ 103.94 (d) | 2,070,000 | 1,397,022 | |||||||||
Viking Cruises Ltd., 13.00%, 5/15/25, Callable 1/23/23 @ 109.75 (d) | 2,000,000 | 2,120,040 | |||||||||
23,218,848 | |||||||||||
Energy (1.1%): | |||||||||||
| Antero Midstream Partners LP/Antero Midstream Finance Corp., 5.38%, 6/15/29, Callable 6/15/24 @ 102.69 (d) | 2,334,000 | 2,134,980 | |||||||||
Callon Petroleum Co., 8.00%, 8/1/28, Callable 8/1/24 @ 104 (d) | 2,000,000 | 1,898,260 | |||||||||
Comstock Resources, Inc., 5.88%, 1/15/30, Callable 1/15/25 @ 102.94 (d) | 4,500,000 | 3,891,510 | |||||||||
| PBF Holding Co. LLC/PBF Finance Corp., 6.00%, 2/15/28, Callable 2/15/23 @ 103 | 6,258,000 | 5,538,455 | |||||||||
13,463,205 | |||||||||||
Financials (0.4%): | |||||||||||
| Compass Group Diversified Holdings LLC, 5.25%, 4/15/29, Callable 4/15/24 @ 102.63 (d) | 4,000,000 | 3,430,200 | |||||||||
Gray Escrow II, Inc., 5.38%, 11/15/31, Callable 11/15/26 @ 102.69 (d) | 2,000,000 | 1,447,500 | |||||||||
4,877,700 | |||||||||||
See notes to financial statements.
51
| Victory Portfolios Victory Floating Rate Fund | Schedule of Portfolio Investments — continued December 31, 2022 | ||||||
Security Description | Principal Amount | Value | |||||||||
Health Care (1.6%): | |||||||||||
Air Methods Corp., 8.00%, 5/15/25, Callable 2/6/23 @ 100 (d) | $ | 14,250,000 | $ | 814,530 | |||||||
Bausch Health Cos., Inc., 5.25%, 1/30/30, Callable 1/30/25 @ 102.63 (d) | 8,466,000 | 4,090,009 | |||||||||
| CHS/Community Health Systems, Inc., 6.13%, 4/1/30, Callable 4/1/25 @ 103.06 (d) | 6,500,000 | 3,272,880 | |||||||||
| Cloud Software Group Holdings, Inc., 6.50%, 3/31/29, Callable 9/30/25 @ 103.25 (d) | 1,000,000 | 846,750 | |||||||||
LifePoint Health, Inc., 5.38%, 1/15/29, Callable 1/15/24 @ 102.69 (d) | 2,450,000 | 1,387,019 | |||||||||
Radiology Partners, Inc., 9.25%, 2/1/28, Callable 2/6/23 @ 104.63 (d) | 3,200,000 | 1,799,552 | |||||||||
| Surgery Center Holdings, Inc., 10.00%, 4/15/27, Callable 2/6/23 @ 105 (d) | 2,436,000 | 2,476,072 | |||||||||
Team Health Holdings, Inc., 6.38%, 2/1/25, Callable 1/23/23 @ 100 (d) | 8,383,000 | 4,843,614 | |||||||||
U.S. Renal Care, Inc., 10.63%, 7/15/27, Callable 2/6/23 @ 105.31 (d) | 1,120,000 | 235,390 | |||||||||
19,765,816 | |||||||||||
Industrials (0.8%): | |||||||||||
American Airlines, Inc., 11.75%, 7/15/25 (d) | 5,320,000 | 5,723,469 | |||||||||
Chart Industries, Inc., 7.50%, 1/1/30, Callable 1/1/26 @ 103.75 (d) | 1,250,000 | 1,255,188 | |||||||||
Wabash National Corp., 4.50%, 10/15/28, Callable 10/15/24 @ 102.25 (d) | 2,950,000 | 2,501,452 | |||||||||
9,480,109 | |||||||||||
Utilities (0.2%): | |||||||||||
Calpine Corp., 5.13%, 3/15/28, Callable 3/15/23 @ 102.56 (d) | 2,500,000 | 2,237,825 | |||||||||
Total Corporate Bonds (Cost $135,022,747) | 97,424,239 | ||||||||||
Yankee Dollars (0.6%) | |||||||||||
Communication Services (0.2%): | |||||||||||
| Telesat Canada/Telesat LLC, 5.63%, 12/6/26, Callable 12/6/23 @ 102.81 (d) | 4,350,000 | 2,033,060 | |||||||||
Industrials (0.3%): | |||||||||||
Bombardier, Inc., 7.88%, 4/15/27, Callable 2/6/23 @ 103.94 (d) | 4,000,000 | 3,894,280 | |||||||||
Materials (0.1%): | |||||||||||
| Trinseo Materials Operating SCA/Trinseo Materials Finance, Inc., 5.13%, 4/1/29, Callable 4/1/24 @ 102.56 (d) | 2,000,000 | 1,296,800 | |||||||||
Total Yankee Dollars (Cost $8,828,039) | 7,224,140 | ||||||||||
Total Investments (Cost $1,391,086,668) — 96.3% | 1,208,755,144 | ||||||||||
Other assets in excess of liabilities — 3.7% | 46,886,022 | ||||||||||
NET ASSETS — 100.00% | $ | 1,255,641,166 | |||||||||
(a) Amount represents less than 0.05% of net assets.
(b) Variable or Floating-Rate Security. Rate disclosed is as of December 31, 2022.
(c) The rates for this senior secured loan will be known on settlement date of the loan, subsequent to this report date. Senior secured loans have rates that will fluctuate over time in line with prevailing interest rates.
See notes to financial statements.
52
| Victory Portfolios Victory Floating Rate Fund | Schedule of Portfolio Investments — continued December 31, 2022 | ||||||
(d) Rule 144A security or other security that is restricted as to resale to institutional investors. The Fund's Adviser has deemed this security to be liquid (unless otherwise noted as illiquid) based upon procedures approved by the Board of Trustees. As of December 31, 2022, the fair value of these securities was $86,449,564 and amounted to 6.9% of net assets.
(e) This security is classified as Level 3 within the fair value hierarchy. (See Note 2 in the Notes to Financial Statements)
bps — Basis points
LIBOR — London Interbank Offered Rate
LIBOR01M — 1 Month US Dollar LIBOR, rate disclosed as of December 31, 2022, based on the last reset date of the security
LIBOR03M — 3 Month US Dollar LIBOR, rate disclosed as of December 31, 2022, based on the last reset date of the security
LIBOR06M — 6 Month US Dollar LIBOR, rate disclosed as of December 31, 2022, based on the last reset date of the security
LLC — Limited Liability Company
LP — Limited Partnership
PLC — Public Limited Company
SOFR — Secured Overnight Financing Rate
SOFR01M — 1 Month SOFR, rate disclosed as of December 31, 2022.
SOFR03M — 3 Month SOFR, rate disclosed as of December 31, 2022.
SOFR06M — 6 Month SOFR, rate disclosed as of December 31, 2022.
See notes to financial statements.
53
Victory Portfolios | Statements of Assets and Liabilities December 31, 2022 | ||||||
| Victory INCORE Low Duration Bond Fund | Victory High Yield Fund | Victory Tax-Exempt Fund | |||||||||||||
Assets: | |||||||||||||||
| Investments, at value (Cost $181,777,693, $323,365,415 and $42,070,464) | $ | 175,838,003 | (a) | $ | 262,129,545 | (b) | $ | 39,165,724 | |||||||
Cash | 3,984,560 | 164,195 | — | ||||||||||||
Deposit with broker for futures contracts | 1,002,147 | — | — | ||||||||||||
Deposit with broker for swap agreements | 1,811,899 | — | — | ||||||||||||
Receivables: | |||||||||||||||
Interest and dividends | 1,272,464 | 5,272,755 | 544,877 | ||||||||||||
Capital shares issued | 235,454 | 183,709 | 2,531 | ||||||||||||
Investments sold | — | 3,504,591 | — | ||||||||||||
Variation margin on open swap agreements | 2,714 | — | — | ||||||||||||
From Adviser | 26,151 | 41,395 | 23,251 | ||||||||||||
Prepaid expenses | 22,149 | 21,788 | 19,764 | ||||||||||||
Total Assets | 184,195,541 | 271,317,978 | 39,756,147 | ||||||||||||
Liabilities: | |||||||||||||||
Payables: | |||||||||||||||
Collateral received on loaned securities | 2,114,496 | 24,074,536 | — | ||||||||||||
Distributions | 87,139 | 246,678 | 7,157 | ||||||||||||
To affiliate on interfund lending | — | — | 2,866,000 | ||||||||||||
To custodian | — | — | 175 | ||||||||||||
Investments purchased | — | 275,000 | — | ||||||||||||
Capital shares redeemed | 809,198 | 1,340,730 | 337,008 | ||||||||||||
Variation margin on open futures contracts | 25,194 | — | — | ||||||||||||
Accrued expenses and other payables: | |||||||||||||||
Investment advisory fees | 68,462 | 128,777 | 17,750 | ||||||||||||
Administration fees | 8,129 | 11,427 | 1,889 | ||||||||||||
Custodian fees | 3,870 | 5,954 | 1,582 | ||||||||||||
Transfer agent fees | 39,783 | 56,714 | 9,736 | ||||||||||||
Compliance fees | 133 | 191 | 32 | ||||||||||||
Trustees' fees | 107 | 111 | 102 | ||||||||||||
| 12b-1 fees | 9,552 | 17,413 | 3,628 | ||||||||||||
Other accrued expenses | 26,244 | 33,804 | 13,657 | ||||||||||||
Total Liabilities | 3,192,307 | 26,191,335 | 3,258,716 | ||||||||||||
Net Assets: | |||||||||||||||
| Capital | 218,070,749 | 321,802,870 | 40,518,445 | ||||||||||||
Total accumulated earnings/(loss) | (37,067,515 | ) | (76,676,227 | ) | (4,021,014 | ) | |||||||||
Net Assets | $ | 181,003,234 | $ | 245,126,643 | $ | 36,497,431 | |||||||||
Net Assets | |||||||||||||||
Class A | $ | 70,418,689 | $ | 28,508,175 | $ | 24,745,126 | |||||||||
Class C | 3,841,087 | 23,975,860 | 926,636 | ||||||||||||
Class R | 1,090,458 | 15,266,807 | — | ||||||||||||
Class Y | 105,653,000 | 177,375,801 | 10,825,669 | ||||||||||||
Total | $ | 181,003,234 | $ | 245,126,643 | $ | 36,497,431 | |||||||||
| Shares (unlimited number of shares authorized with a par value of $0.001 per share): | |||||||||||||||
Class A | 7,302,296 | 5,418,077 | 2,990,668 | ||||||||||||
Class C | 398,217 | 4,545,163 | 112,049 | ||||||||||||
Class R | 113,089 | 2,893,339 | — | ||||||||||||
Class Y | 10,952,622 | 33,872,754 | 1,308,898 | ||||||||||||
Total | 18,766,224 | 46,729,333 | 4,411,615 | ||||||||||||
| Net asset value, offering (except Class A) and redemption price per share: | |||||||||||||||
Class A | $ | 9.64 | $ | 5.26 | $ | 8.27 | |||||||||
Class C (c) | 9.65 | 5.28 | 8.27 | ||||||||||||
Class R | 9.64 | 5.28 | — | ||||||||||||
Class Y | 9.65 | 5.24 | 8.27 | ||||||||||||
Maximum Sales Charge — Class A | 2.25 | % | 2.25 | % | 2.25 | % | |||||||||
| Maximum offering price (100%/(100%-maximum sales charge) of net asset value adjusted to the nearest cent) per share — Class A | $ | 9.86 | $ | 5.38 | $ | 8.46 | |||||||||
(a) Includes $2,073,844 of securities on loan.
(b) Includes $23,078,966 of securities on loan.
(c) Redemption price per share varies by the length of time shares are held.
See notes to financial statements.
54
Victory Portfolios | Statements of Assets and Liabilities December 31, 2022 | ||||||
| Victory High Income Municipal Bond Fund | Victory Floating Rate Fund | ||||||||||
Assets: | |||||||||||
Investments, at value (Cost $43,439,581 and $1,391,086,668) | $ | 37,792,446 | $ | 1,208,755,144 | |||||||
Cash | 890,612 | 10,784,242 | |||||||||
Receivables: | |||||||||||
Interest and dividends | 541,906 | 10,226,570 | |||||||||
Capital shares issued | 391,371 | 3,250,109 | |||||||||
Investments sold | — | 35,062,946 | |||||||||
From Adviser | 24,888 | 124,305 | |||||||||
Prepaid expenses | 28,328 | 44,981 | |||||||||
Total Assets | 39,669,551 | 1,268,248,297 | |||||||||
Liabilities: | |||||||||||
Payables: | |||||||||||
Distributions | 8,368 | 1,527,681 | |||||||||
Investments purchased | — | 2,695,602 | |||||||||
Capital shares redeemed | 85,534 | 7,024,275 | |||||||||
Accrued expenses and other payables: | |||||||||||
Investment advisory fees | 17,181 | 736,369 | |||||||||
Administration fees | 1,831 | 60,751 | |||||||||
Custodian fees | 1,668 | 63,847 | |||||||||
Transfer agent fees | 8,007 | 294,575 | |||||||||
Compliance fees | 34 | 1,041 | |||||||||
Trustees' fees | 101 | 174 | |||||||||
| 12b-1 fees | 2,995 | 54,791 | |||||||||
Other accrued expenses | 13,654 | 148,025 | |||||||||
Total Liabilities | 139,373 | 12,607,131 | |||||||||
Net Assets: | |||||||||||
Capital | 46,022,557 | 1,725,324,180 | |||||||||
Total accumulated earnings/(loss) | (6,492,379 | ) | (469,683,014 | ) | |||||||
Net Assets | $ | 39,530,178 | $ | 1,255,641,166 | |||||||
Net Assets | |||||||||||
Class A | $ | 21,746,921 | $ | 252,903,758 | |||||||
Class C | 1,259,240 | 58,606,070 | |||||||||
Class R | — | 537,336 | |||||||||
Class Y | 12,547,783 | 939,243,911 | |||||||||
Member Class | 3,976,234 | 4,350,091 | |||||||||
Total | $ | 39,530,178 | $ | 1,255,641,166 | |||||||
| Shares (unlimited number of shares authorized with a par value of $0.001 per share): | |||||||||||
Class A | 2,397,387 | 30,865,736 | |||||||||
Class C | 138,815 | 7,148,881 | |||||||||
Class R | — | 65,587 | |||||||||
Class Y | 1,382,972 | 114,575,045 | |||||||||
Member Class | 438,259 | 531,037 | |||||||||
Total | 4,357,433 | 153,186,286 | |||||||||
| Net asset value, offering (except Class A) and redemption price per share: | |||||||||||
Class A | $ | 9.07 | $ | 8.19 | |||||||
Class C (a) | 9.07 | 8.20 | |||||||||
Class R | — | 8.19 | |||||||||
Class Y | 9.07 | 8.20 | |||||||||
Member Class | 9.07 | 8.19 | |||||||||
Maximum Sales Charge — Class A | 2.25 | % | 2.25 | % | |||||||
| Maximum offering price (100%/(100%-maximum sales charge) of net asset value adjusted to the nearest cent) per share — Class A | $ | 9.28 | $ | 8.38 | |||||||
(a) Redemption price per share varies by the length of time shares are held.
See notes to financial statements.
55
Victory Portfolios | Statements of Operations For the Year Ended December 31, 2022 | ||||||
| Victory INCORE Low Duration Bond Fund | Victory High Yield Fund | Victory Tax-Exempt Fund | |||||||||||||
Investment Income: | |||||||||||||||
Dividends | $ | 285,398 | $ | 98,828 | $ | 15,840 | |||||||||
Interest | 3,714,996 | 22,373,129 | 1,826,434 | ||||||||||||
Securities lending (net of fees) | 37,295 | 341,290 | — | ||||||||||||
Total Income | 4,037,689 | 22,813,247 | 1,842,274 | ||||||||||||
Expenses: | |||||||||||||||
Investment advisory fees | 900,066 | 1,768,493 | 237,287 | ||||||||||||
Administration fees | 108,904 | 160,393 | 25,839 | ||||||||||||
Sub-Administration fees | 18,476 | 17,553 | 17,000 | ||||||||||||
| 12b-1 fees — Class A | 192,720 | 94,760 | 80,199 | ||||||||||||
| 12b-1 fees — Class C | 47,182 | 291,185 | 15,212 | ||||||||||||
| 12b-1 fees — Class R | 5,721 | 84,754 | — | ||||||||||||
Custodian fees | 16,465 | 25,056 | 5,485 | ||||||||||||
Transfer agent fees — Class A | 101,549 | 33,886 | 25,763 | ||||||||||||
Transfer agent fees — Class C | 4,892 | 15,771 | 1,832 | ||||||||||||
Transfer agent fees — Class R | 1,887 | 4,341 | — | ||||||||||||
Transfer agent fees — Class Y | 82,965 | 266,454 | 14,267 | ||||||||||||
Trustees' fees | 13,355 | 19,607 | 4,687 | ||||||||||||
Compliance fees | 1,610 | 2,388 | 385 | ||||||||||||
Legal and audit fees | 24,258 | 31,138 | 12,176 | ||||||||||||
State registration and filing fees | 60,665 | 83,684 | 47,119 | ||||||||||||
Interfund lending | 255 | 138 | 1,520 | ||||||||||||
Other expenses | 34,589 | 54,790 | 14,946 | ||||||||||||
| Recoupment of prior expenses waived/reimbursed by Adviser | 3,148 | — | — | ||||||||||||
Total Expenses | 1,618,707 | 2,954,391 | 503,717 | ||||||||||||
Expenses waived/reimbursed by Adviser | (148,134 | ) | (261,892 | ) | (125,945 | ) | |||||||||
Net Expenses | 1,470,573 | 2,692,499 | 377,772 | ||||||||||||
Net Investment Income (Loss) | 2,567,116 | 20,120,748 | 1,464,502 | ||||||||||||
| Realized/Unrealized Gains (Losses) from Investments: | |||||||||||||||
| Net realized gains (losses) from investment securities | (3,894,607 | ) | (12,799,167 | ) | (266,141 | ) | |||||||||
Net realized gains (losses) from futures contracts | 1,898,589 | — | — | ||||||||||||
Net realized gains (losses) from swap agreements | (272,851 | ) | — | — | |||||||||||
| Net change in unrealized appreciation/depreciation on investment securities | (8,349,748 | ) | (64,592,741 | ) | (7,310,013 | ) | |||||||||
| Net change in unrealized appreciation/depreciation on futures contracts | 102,253 | — | — | ||||||||||||
| Net change in unrealized appreciation/depreciation on swap agreements | 355,576 | — | — | ||||||||||||
Net realized/unrealized gains (losses) on investments | (10,160,788 | ) | (77,391,908 | ) | (7,576,154 | ) | |||||||||
Change in net assets resulting from operations | $ | (7,593,672 | ) | $ | (57,271,160 | ) | $ | (6,111,652 | ) | ||||||
See notes to financial statements.
56
Victory Portfolios | Statements of Operations For the Year Ended December 31, 2022 | ||||||
| Victory High Income Municipal Bond Fund | Victory Floating Rate Fund | ||||||||||
Investment Income: | |||||||||||
Dividends | $ | 14,987 | $ | 598,536 | |||||||
Interest | 2,047,576 | 125,692,387 | |||||||||
Total Income | 2,062,563 | 126,290,923 | |||||||||
Expenses: | |||||||||||
Investment advisory fees | 227,544 | 12,839,028 | |||||||||
Administration fees | 24,773 | 1,074,286 | |||||||||
Sub-Administration fees | 17,500 | 17,554 | |||||||||
| 12b-1 fees — Class A | 73,341 | 789,838 | |||||||||
| 12b-1 fees — Class C | 16,485 | 736,776 | |||||||||
| 12b-1 fees — Class R | — | 2,871 | |||||||||
Custodian fees | 5,761 | 256,474 | |||||||||
Transfer agent fees — Class A | 14,936 | 301,565 | |||||||||
Transfer agent fees — Class C | 3,439 | 66,496 | |||||||||
Transfer agent fees — Class R | — | 1,041 | |||||||||
Transfer agent fees — Class Y | 7,814 | 1,332,800 | |||||||||
Transfer agent fees — Member Class | 2,633 | 6,009 | |||||||||
Trustees' fees | 4,581 | 122,685 | |||||||||
Compliance fees | 371 | 16,063 | |||||||||
Legal and audit fees | 12,236 | 180,813 | |||||||||
State registration and filing fees | 59,357 | 174,323 | |||||||||
Interfund lending | 124 | 143,800 | |||||||||
Other expenses | 17,526 | 289,128 | |||||||||
Recoupment of prior expenses waived/reimbursed by Adviser | — | 15,514 | |||||||||
Total Expenses | 488,421 | 18,367,064 | |||||||||
Expenses waived/reimbursed by Adviser | (142,621 | ) | (1,383,846 | ) | |||||||
Net Expenses | 345,800 | 16,983,218 | |||||||||
Net Investment Income (Loss) | 1,716,763 | 109,307,705 | |||||||||
Realized/Unrealized Gains (Losses) from Investments: | |||||||||||
Net realized gains (losses) from investment securities | (538,945 | ) | (103,162,620 | ) | |||||||
| Net change in unrealized appreciation/depreciation on investment securities | (8,833,268 | ) | (170,669,010 | ) | |||||||
Net realized/unrealized gains (losses) on investments | (9,372,213 | ) | (273,831,630 | ) | |||||||
Change in net assets resulting from operations | $ | (7,655,450 | ) | $ | (164,523,925 | ) | |||||
See notes to financial statements.
57
Victory Portfolios | Statements of Changes in Net Assets | ||||||
| Victory INCORE Low Duration Bond Fund | Victory High Yield Fund | Victory Tax-Exempt Fund | |||||||||||||||||||||||||
| Year Ended December 31, 2022 | Year Ended December 31, 2021 | Year Ended December 31, 2022 | Year Ended December 31, 2021 | Year Ended December 31, 2022 | Year Ended December 31, 2021 | ||||||||||||||||||||||
From Investment Activities: | |||||||||||||||||||||||||||
Operations: | |||||||||||||||||||||||||||
| Net Investment Income (Loss) | $ | 2,567,116 | $ | 2,291,642 | $ | 20,120,748 | $ | 15,725,344 | $ | 1,464,502 | $ | 1,441,183 | |||||||||||||||
| Net realized gains (losses) | (2,268,869 | ) | 2,765,191 | (12,799,167 | ) | 5,672,619 | (266,141 | ) | 1,382,468 | ||||||||||||||||||
| Net change in unrealized appreciation/ depreciation | (7,891,919 | ) | (3,020,467 | ) | (64,592,741 | ) | (7,935,627 | ) | (7,310,013 | ) | (770,070 | ) | |||||||||||||||
| Change in net assets resulting from operations | (7,593,672 | ) | 2,036,366 | (57,271,160 | ) | 13,462,336 | (6,111,652 | ) | 2,053,581 | ||||||||||||||||||
Distributions to Shareholders: | |||||||||||||||||||||||||||
Class A | (1,184,967 | ) | (879,844 | ) | (2,582,986 | ) | (2,461,269 | ) | (1,359,219 | ) | (1,954,076 | ) | |||||||||||||||
Class C | (33,971 | ) | (21,804 | ) | (1,793,155 | ) | (1,335,016 | ) | (48,903 | ) | (103,696 | ) | |||||||||||||||
Class R | (12,816 | ) | (7,637 | ) | (1,117,459 | ) | (979,672 | ) | — | — | |||||||||||||||||
Class Y | (2,056,953 | ) | (1,922,795 | ) | (15,051,058 | ) | (11,295,501 | ) | (594,628 | ) | (814,249 | ) | |||||||||||||||
| Change in net assets resulting from distributions to shareholders | (3,288,707 | ) | (2,832,080 | ) | (20,544,658 | ) | (16,071,458 | ) | (2,002,750 | ) | (2,872,021 | ) | |||||||||||||||
| Change in net assets resulting from capital transactions | (25,401,306 | ) | (42,237,361 | ) | (15,844,877 | ) | 88,777,937 | (6,707,385 | ) | (9,358,432 | ) | ||||||||||||||||
Change in net assets | (36,283,685 | ) | (43,033,075 | ) | (93,660,695 | ) | 86,168,815 | (14,821,787 | ) | (10,176,872 | ) | ||||||||||||||||
Net Assets: | |||||||||||||||||||||||||||
Beginning of period | 217,286,919 | 260,319,994 | 338,787,338 | 252,618,523 | 51,319,218 | 61,496,090 | |||||||||||||||||||||
End of period | $ | 181,003,234 | $ | 217,286,919 | $ | 245,126,643 | $ | 338,787,338 | $ | 36,497,431 | $ | 51,319,218 | |||||||||||||||
(continues on next page)
See notes to financial statements.
58
Victory Portfolios | Statements of Changes in Net Assets | ||||||
(continued)
| Victory INCORE Low Duration Bond Fund | Victory High Yield Fund | Victory Tax-Exempt Fund | |||||||||||||||||||||||||
| Year Ended December 31, 2022 | Year Ended December 31, 2021 | Year Ended December 31, 2022 | Year Ended December 31, 2021 | Year Ended December 31, 2022 | Year Ended December 31, 2021 | ||||||||||||||||||||||
Capital Transactions: | |||||||||||||||||||||||||||
Class A | |||||||||||||||||||||||||||
| Proceeds from shares issued | $ | 31,077,464 | $ | 27,443,659 | $ | 4,620,240 | $ | 18,887,212 | $ | 9,954,581 | $ | 7,231,915 | |||||||||||||||
| Distributions reinvested | 1,069,427 | 797,627 | 1,725,144 | 1,668,744 | 1,271,336 | 1,806,265 | |||||||||||||||||||||
| Cost of shares redeemed | (34,520,760 | ) | (21,402,058 | ) | (17,029,134 | ) | (9,668,773 | ) | (16,407,801 | ) | (5,160,768 | ) | |||||||||||||||
Total Class A | $ | (2,373,869 | ) | $ | 6,839,228 | $ | (10,683,750 | ) | $ | 10,887,183 | $ | (5,181,884 | ) | $ | 3,877,412 | ||||||||||||
Class C | |||||||||||||||||||||||||||
| Proceeds from shares issued | $ | 1,880,995 | $ | 1,947,527 | $ | 3,482,445 | $ | 10,304,554 | $ | 333,464 | $ | 212,297 | |||||||||||||||
| Distributions reinvested | 32,476 | 20,254 | 1,032,069 | 672,575 | 46,307 | 99,658 | |||||||||||||||||||||
| Cost of shares redeemed | (3,338,417 | ) | (19,935,340 | ) | (5,904,434 | ) | (3,823,976 | ) | (1,205,436 | ) | (4,766,843 | ) | |||||||||||||||
Total Class C | $ | (1,424,946 | ) | $ | (17,967,559 | ) | $ | (1,389,920 | ) | $ | 7,153,153 | $ | (825,665 | ) | $ | (4,454,888 | ) | ||||||||||
Class R | |||||||||||||||||||||||||||
| Proceeds from shares issued | $ | 199,890 | $ | 250,815 | $ | 421,438 | $ | 979,946 | $ | — | $ | — | |||||||||||||||
| Distributions reinvested | 12,815 | 7,615 | 137,188 | 107,948 | — | — | |||||||||||||||||||||
| Cost of shares redeemed | (274,569 | ) | (169,252 | ) | (143,786 | ) | (984,832 | ) | — | — | |||||||||||||||||
Total Class R | $ | (61,864 | ) | $ | 89,178 | $ | 414,840 | $ | 103,062 | $ | — | $ | — | ||||||||||||||
Class Y | |||||||||||||||||||||||||||
| Proceeds from shares issued | $ | 55,691,544 | $ | 70,433,564 | $ | 173,422,368 | $ | 189,927,452 | $ | 9,356,843 | $ | 7,289,073 | |||||||||||||||
| Distributions reinvested | 1,663,223 | 1,562,121 | 15,032,014 | 11,280,860 | 577,178 | 789,622 | |||||||||||||||||||||
| Cost of shares redeemed | (78,895,394 | ) | (103,193,893 | ) | (192,640,429 | ) | (130,573,773 | ) | (10,633,857 | ) | (16,859,651 | ) | |||||||||||||||
Total Class Y | $ | (21,540,627 | ) | $ | (31,198,208 | ) | $ | (4,186,047 | ) | $ | 70,634,539 | $ | (699,836 | ) | $ | (8,780,956 | ) | ||||||||||
| Change in net assets resulting from capital transactions | $ | (25,401,306 | ) | $ | (42,237,361 | ) | $ | (15,844,877 | ) | $ | 88,777,937 | $ | (6,707,385 | ) | $ | (9,358,432 | ) | ||||||||||
(continues on next page)
See notes to financial statements.
59
Victory Portfolios | Statements of Changes in Net Assets | ||||||
(continued)
| Victory INCORE Low Duration Bond Fund | Victory High Yield Fund | Victory Tax-Exempt Fund | |||||||||||||||||||||||||
| Year Ended December 31, 2022 | Year Ended December 31, 2021 | Year Ended December 31, 2022 | Year Ended December 31, 2021 | Year Ended December 31, 2022 | Year Ended December 31, 2021 | ||||||||||||||||||||||
Share Transactions: | |||||||||||||||||||||||||||
Class A | |||||||||||||||||||||||||||
Issued | 3,166,353 | 2,689,921 | 783,246 | 2,747,182 | 1,145,635 | 722,275 | |||||||||||||||||||||
Reinvested | 109,743 | 78,254 | 296,774 | 243,419 | 147,649 | 182,127 | |||||||||||||||||||||
Redeemed | (3,541,453 | ) | (2,097,475 | ) | (2,913,037 | ) | (1,409,340 | ) | (1,912,426 | ) | (514,040 | ) | |||||||||||||||
Total Class A | (265,357 | ) | 670,700 | (1,833,017 | ) | 1,581,261 | (619,142 | ) | 390,362 | ||||||||||||||||||
Class C | |||||||||||||||||||||||||||
Issued | 191,685 | 191,248 | 573,020 | 1,495,332 | 35,794 | 21,295 | |||||||||||||||||||||
Reinvested | 3,342 | 1,986 | 178,458 | 97,913 | 5,338 | 10,059 | |||||||||||||||||||||
Redeemed | (340,742 | ) | (1,954,241 | ) | (1,035,733 | ) | (555,259 | ) | (137,452 | ) | (476,876 | ) | |||||||||||||||
Total Class C | (145,715 | ) | (1,761,007 | ) | (284,255 | ) | 1,037,986 | (96,320 | ) | (445,522 | ) | ||||||||||||||||
Class R | |||||||||||||||||||||||||||
Issued | 20,168 | 24,662 | 69,477 | 141,863 | — | — | |||||||||||||||||||||
Reinvested | 1,317 | 747 | 23,822 | 15,703 | — | — | |||||||||||||||||||||
Redeemed | (27,860 | ) | (16,595 | ) | (24,383 | ) | (143,250 | ) | — | — | |||||||||||||||||
Total Class R | (6,375 | ) | 8,814 | 68,916 | 14,316 | — | — | ||||||||||||||||||||
Class Y | |||||||||||||||||||||||||||
Issued | 5,674,795 | 6,908,185 | 29,095,639 | 27,774,023 | 1,044,358 | 723,170 | |||||||||||||||||||||
Reinvested | 170,445 | 153,191 | 2,610,339 | 1,654,148 | 66,989 | 79,624 | |||||||||||||||||||||
Redeemed | (8,040,501 | ) | (10,114,574 | ) | (32,937,648 | ) | (19,136,526 | ) | (1,231,080 | ) | (1,688,841 | ) | |||||||||||||||
Total Class Y | (2,195,261 | ) | (3,053,198 | ) | (1,231,670 | ) | 10,291,645 | (119,733 | ) | (886,047 | ) | ||||||||||||||||
Change in Shares | (2,612,708 | ) | (4,134,691 | ) | (3,280,026 | ) | 12,925,208 | (835,195 | ) | (941,207 | ) | ||||||||||||||||
See notes to financial statements.
60
Victory Portfolios | Statements of Changes in Net Assets | ||||||
| Victory High Income Municipal Bond Fund | Victory Floating Rate Fund | ||||||||||||||||||
| Year Ended December 31, 2022 | Year Ended December 31, 2021 | Year Ended December 31, 2022 | Year Ended December 31, 2021 | ||||||||||||||||
From Investment Activities: | |||||||||||||||||||
Operations: | |||||||||||||||||||
Net investment income (loss) | $ | 1,716,763 | $ | 1,590,070 | $ | 109,307,705 | $ | 65,098,792 | |||||||||||
Net realized gains (losses) | (538,945 | ) | 209,201 | (103,162,620 | ) | 408,615 | |||||||||||||
| Net change in unrealized appreciation/depreciation | (8,833,268 | ) | 1,002,109 | (170,669,010 | ) | (12,438,598 | ) | ||||||||||||
| Change in net assets resulting from operations | (7,655,450 | ) | 2,801,380 | (164,523,925 | ) | 53,068,809 | |||||||||||||
Distributions to Shareholders: | |||||||||||||||||||
Class A | (1,271,803 | ) | (1,162,366 | ) | (17,479,036 | ) | (11,345,229 | ) | |||||||||||
Class C | (58,566 | ) | (78,359 | ) | (3,482,234 | ) | (2,286,259 | ) | |||||||||||
Class R | — | — | (29,001 | ) | (16,736 | ) | |||||||||||||
Class Y | (521,176 | ) | (435,742 | ) | (88,352,703 | ) | (51,994,941 | ) | |||||||||||
Member Class | (153,672 | ) | (45,997 | ) | (255,361 | ) | (35,024 | ) | |||||||||||
| Change in net assets resulting from distributions to shareholders | (2,005,217 | ) | (1,722,464 | ) | (109,598,335 | ) | (65,678,189 | ) | |||||||||||
| Change in net assets resulting from capital transactions | (4,293,890 | ) | 6,876,625 | (672,675,949 | ) | 1,551,086,684 | |||||||||||||
Change in net assets | (13,954,557 | ) | 7,955,541 | (946,798,209 | ) | 1,538,477,304 | |||||||||||||
Net Assets: | |||||||||||||||||||
Beginning of period | 53,484,735 | 45,529,194 | 2,202,439,375 | 663,962,071 | |||||||||||||||
End of period | $ | 39,530,178 | $ | 53,484,735 | $ | 1,255,641,166 | $ | 2,202,439,375 | |||||||||||
(continues on next page)
See notes to financial statements.
61
Victory Portfolios | Statements of Changes in Net Assets | ||||||
(continued)
| Victory High Income Municipal Bond Fund | Victory Floating Rate Fund | ||||||||||||||||||
| Year Ended December 31, 2022 | Year Ended December 31, 2021 | Year Ended December 31, 2022 | Year Ended December 31, 2021 | ||||||||||||||||
Capital Transactions: | |||||||||||||||||||
Class A | |||||||||||||||||||
Proceeds from shares issued | $ | 10,294,150 | $ | 9,753,917 | $ | 97,770,885 | $ | 266,345,825 | |||||||||||
Distributions reinvested | 1,179,354 | 1,080,764 | 15,235,706 | 10,126,690 | |||||||||||||||
Cost of shares redeemed | (17,909,597 | ) | (3,548,527 | ) | (167,236,180 | ) | (90,141,473 | ) | |||||||||||
Total Class A | $ | (6,436,093 | ) | $ | 7,286,154 | $ | (54,229,589 | ) | $ | 186,331,042 | |||||||||
Class C | |||||||||||||||||||
Proceeds from shares issued | $ | 28,108 | $ | 234,228 | $ | 14,847,278 | $ | 48,665,824 | |||||||||||
Distributions reinvested | 58,388 | 74,083 | 3,095,076 | 2,087,262 | |||||||||||||||
Cost of shares redeemed | (660,750 | ) | (7,590,095 | ) | (30,677,125 | ) | (64,541,146 | ) | |||||||||||
Total Class C | $ | (574,254 | ) | $ | (7,281,784 | ) | $ | (12,734,771 | ) | $ | (13,788,060 | ) | |||||||
Class R | |||||||||||||||||||
Proceeds from shares issued | $ | — | $ | — | $ | 188,702 | $ | 370,964 | |||||||||||
Distributions reinvested | — | — | 28,901 | 16,539 | |||||||||||||||
Cost of shares redeemed | — | — | (205,368 | ) | (82,647 | ) | |||||||||||||
Total Class R | $ | — | $ | — | $ | 12,235 | $ | 304,856 | |||||||||||
Class Y | |||||||||||||||||||
Proceeds from shares issued | $ | 8,755,236 | $ | 5,118,372 | $ | 1,087,901,526 | $ | 1,691,635,496 | |||||||||||
Distributions reinvested | 509,091 | 423,799 | 73,528,356 | 45,070,085 | |||||||||||||||
Cost of shares redeemed | (8,291,509 | ) | (1,382,882 | ) | (1,769,959,405 | ) | (360,535,842 | ) | |||||||||||
Total Class Y | $ | 972,818 | $ | 4,159,289 | $ | (608,529,523 | ) | $ | 1,376,169,739 | ||||||||||
Member Class | |||||||||||||||||||
Proceeds from shares issued | $ | 2,638,043 | $ | 2,791,673 | $ | 4,026,377 | $ | 2,614,800 | |||||||||||
Distributions reinvested | 153,672 | 45,997 | 255,361 | 35,024 | |||||||||||||||
Cost of shares redeemed | (1,048,076 | ) | (124,704 | ) | (1,476,039 | ) | (580,717 | ) | |||||||||||
Total Member Class | $ | 1,743,639 | $ | 2,712,966 | $ | 2,805,699 | $ | 2,069,107 | |||||||||||
| Change in net assets resulting from capital transactions | $ | (4,293,890 | ) | $ | 6,876,625 | $ | (672,675,949 | ) | $ | 1,551,086,684 | |||||||||
(continues on next page)
See notes to financial statements.
62
Victory Portfolios | Statements of Changes in Net Assets | ||||||
(continued)
| Victory High Income Municipal Bond Fund | Victory Floating Rate Fund | ||||||||||||||||||
| Year Ended December 31, 2022 | Year Ended December 31, 2021 | Year Ended December 31, 2022 | Year Ended December 31, 2021 | ||||||||||||||||
Share Transactions: | |||||||||||||||||||
Class A | |||||||||||||||||||
Issued | 1,095,148 | 892,208 | 10,891,955 | 28,352,164 | |||||||||||||||
Reinvested | 123,326 | 97,863 | 1,777,071 | 1,079,897 | |||||||||||||||
Redeemed | (1,919,547 | ) | (321,447 | ) | (19,287,321 | ) | (9,602,493 | ) | |||||||||||
Total Class A | (701,073 | ) | 668,624 | (6,618,295 | ) | 19,829,568 | |||||||||||||
Class C | |||||||||||||||||||
Issued | 2,973 | 21,158 | 1,648,414 | 5,176,179 | |||||||||||||||
Reinvested | 6,095 | 6,716 | 361,824 | 222,482 | |||||||||||||||
Redeemed | (67,991 | ) | (695,638 | ) | (3,552,036 | ) | (6,865,599 | ) | |||||||||||
Total Class C | (58,923 | ) | (667,764 | ) | (1,541,798 | ) | (1,466,938 | ) | |||||||||||
Class R | |||||||||||||||||||
Issued | — | — | 20,892 | 39,473 | |||||||||||||||
Reinvested | — | — | 3,384 | 1,764 | |||||||||||||||
Redeemed | — | — | (23,243 | ) | (8,787 | ) | |||||||||||||
Total Class R | — | — | 1,033 | 32,450 | |||||||||||||||
Class Y | |||||||||||||||||||
Issued | 932,072 | 464,246 | 122,271,204 | 179,923,304 | |||||||||||||||
Reinvested | 53,109 | 38,361 | 8,535,580 | 4,805,331 | |||||||||||||||
Redeemed | (872,754 | ) | (125,470 | ) | (205,741,941 | ) | (38,433,801 | ) | |||||||||||
Total Class Y | 112,427 | 377,137 | (74,935,157 | ) | 146,294,834 | ||||||||||||||
Member Class | |||||||||||||||||||
Issued | 271,855 | 251,536 | 446,286 | 278,912 | |||||||||||||||
Reinvested | 16,200 | 4,154 | 29,978 | 3,741 | |||||||||||||||
Redeemed | (107,086 | ) | (11,298 | ) | (172,741 | ) | (61,820 | ) | |||||||||||
Total Member Class | 180,969 | 244,392 | 303,523 | 220,833 | |||||||||||||||
Change in Shares | (466,600 | ) | 622,389 | (82,790,694 | ) | 164,910,747 | |||||||||||||
See notes to financial statements.
63
Victory Portfolios | Financial Highlights | ||||||
For a Share Outstanding Throughout Each Period
Victory INCORE Low Duration Bond Fund | |||||||||||||||||||||||
Class A | |||||||||||||||||||||||
| Year Ended December 31, 2022 | Year Ended December 31, 2021 | Year Ended December 31, 2020 | Year Ended December 31, 2019 | Year Ended December 31, 2018 | |||||||||||||||||||
Net Asset Value, Beginning of Period | $ | 10.16 | $ | 10.20 | $ | 9.99 | $ | 9.86 | $ | 9.99 | |||||||||||||
Investment Activities: | |||||||||||||||||||||||
Net investment income (loss) (a) | 0.12 | 0.09 | 0.14 | 0.19 | 0.16 | ||||||||||||||||||
| Net realized and unrealized gains (losses) | (0.49 | ) | (0.02 | ) | 0.24 | 0.15 | (0.08 | ) | |||||||||||||||
Total from Investment Activities | (0.37 | ) | 0.07 | 0.38 | 0.34 | 0.08 | |||||||||||||||||
Distributions to Shareholders From: | |||||||||||||||||||||||
Net investment income | (0.15 | ) | (0.11 | ) | (0.14 | ) | (0.20 | ) | (0.21 | ) | |||||||||||||
Return of capital | — | — | (0.03 | ) | (0.01 | ) | — | ||||||||||||||||
Total Distributions | (0.15 | ) | (0.11 | ) | (0.17 | ) | (0.21 | ) | (0.21 | ) | |||||||||||||
Net Asset Value, End of Period | $ | 9.64 | $ | 10.16 | $ | 10.20 | $ | 9.99 | $ | 9.86 | |||||||||||||
Total Return (excludes sales charge) (b) | (3.62 | )% | 0.71 | % | 3.85 | % | 3.51 | % | 0.73 | % | |||||||||||||
Ratios to Average Net Assets: | |||||||||||||||||||||||
Net Expenses (c) | 0.85 | % | 0.85 | % | 0.85 | % | 0.85 | % | 0.85 | % | |||||||||||||
Net Investment Income (Loss) | 1.18 | % | 0.87 | % | 1.39 | % | 1.93 | % | 1.66 | % | |||||||||||||
Gross Expenses (c) | 0.96 | % | 0.95 | % | 0.95 | % | 0.95 | % | 0.90 | % | |||||||||||||
Supplemental Data: | |||||||||||||||||||||||
Net Assets at end of period (000's) | $ | 70,419 | $ | 76,901 | $ | 70,357 | $ | 61,972 | $ | 96,210 | |||||||||||||
Portfolio Turnover (d) | 81 | % | 58 | % | 85 | % | 50 | % | 45 | % | |||||||||||||
(continues on next page)
See notes to financial statements.
64
Victory Portfolios | Financial Highlights — continued | ||||||
For a Share Outstanding Throughout Each Period
Victory INCORE Low Duration Bond Fund | |||||||||||||||||||||||
Class C | |||||||||||||||||||||||
| Year Ended December 31, 2022 | Year Ended December 31, 2021 | Year Ended December 31, 2020 | Year Ended December 31, 2019 | Year Ended December 31, 2018 | |||||||||||||||||||
Net Asset Value, Beginning of Period | $ | 10.16 | $ | 10.20 | $ | 9.99 | $ | 9.85 | $ | 9.99 | |||||||||||||
Investment Activities: | |||||||||||||||||||||||
Net investment income (loss) (a) | 0.04 | 0.01 | 0.08 | 0.12 | 0.09 | ||||||||||||||||||
| Net realized and unrealized gains (losses) | (0.47 | ) | (0.02 | ) | 0.22 | 0.16 | (0.09 | ) | |||||||||||||||
Total from Investment Activities | (0.43 | ) | (0.01 | ) | 0.30 | 0.28 | — | (e) | |||||||||||||||
Distributions to Shareholders From: | |||||||||||||||||||||||
Net investment income | (0.08 | ) | (0.03 | ) | (0.07 | ) | (0.14 | ) | (0.14 | ) | |||||||||||||
Return of capital | — | — | (0.02 | ) | — | (e) | — | ||||||||||||||||
Total Distributions | (0.08 | ) | (0.03 | ) | (0.09 | ) | (0.14 | ) | (0.14 | ) | |||||||||||||
Net Asset Value, End of Period | $ | 9.65 | $ | 10.16 | $ | 10.20 | $ | 9.99 | $ | 9.85 | |||||||||||||
| Total Return (excludes contingent deferred sales charge) (b) | (4.26 | )% | (0.07 | )% | 3.05 | % | 2.81 | % | (0.04 | )% | |||||||||||||
Ratios to Average Net Assets: | |||||||||||||||||||||||
Net Expenses (c) | 1.62 | % | 1.62 | % | 1.62 | % | 1.62 | % | 1.62 | % | |||||||||||||
Net Investment Income (Loss) | 0.37 | % | 0.10 | % | 0.76 | % | 1.17 | % | 0.88 | % | |||||||||||||
Gross Expenses (c) | 1.91 | % | 1.91 | % | 1.72 | % | 1.70 | % | 1.68 | % | |||||||||||||
Supplemental Data: | |||||||||||||||||||||||
Net Assets at end of period (000's) | $ | 3,841 | $ | 5,528 | $ | 23,504 | $ | 38,969 | $ | 62,103 | |||||||||||||
Portfolio Turnover (d) | 81 | % | 58 | % | 85 | % | 50 | % | 45 | % | |||||||||||||
(continues on next page)
See notes to financial statements.
65
Victory Portfolios | Financial Highlights — continued | ||||||
For a Share Outstanding Throughout Each Period
Victory INCORE Low Duration Bond Fund | |||||||||||||||||||||||
Class R | |||||||||||||||||||||||
| Year Ended December 31, 2022 | Year Ended December 31, 2021 | Year Ended December 31, 2020 | Year Ended December 31, 2019 | Year Ended December 31, 2018 | |||||||||||||||||||
Net Asset Value, Beginning of Period | $ | 10.16 | $ | 10.20 | $ | 9.99 | $ | 9.86 | $ | 9.99 | |||||||||||||
Investment Activities: | |||||||||||||||||||||||
Net investment income (loss) (a) | 0.07 | 0.05 | 0.10 | 0.15 | 0.12 | ||||||||||||||||||
| Net realized and unrealized gains (losses) | (0.48 | ) | (0.02 | ) | 0.24 | 0.15 | (0.08 | ) | |||||||||||||||
Total from Investment Activities | (0.41 | ) | 0.03 | 0.34 | 0.30 | 0.04 | |||||||||||||||||
Distributions to Shareholders From: | |||||||||||||||||||||||
Net investment income | (0.11 | ) | (0.07 | ) | (0.10 | ) | (0.16 | ) | (0.17 | ) | |||||||||||||
Return of capital | — | — | (0.03 | ) | (0.01 | ) | — | ||||||||||||||||
Total Distributions | (0.11 | ) | (0.07 | ) | (0.13 | ) | (0.17 | ) | (0.17 | ) | |||||||||||||
Net Asset Value, End of Period | $ | 9.64 | $ | 10.16 | $ | 10.20 | $ | 9.99 | $ | 9.86 | |||||||||||||
Total Return (b) | (4.03 | )% | 0.29 | % | 3.41 | % | 3.17 | % | 0.31 | % | |||||||||||||
Ratios to Average Net Assets: | |||||||||||||||||||||||
Net Expenses (c) | 1.27 | % | 1.27 | % | 1.27 | % | 1.27 | % | 1.27 | % | |||||||||||||
Net Investment Income (Loss) | 0.75 | % | 0.45 | % | 0.99 | % | 1.50 | % | 1.20 | % | |||||||||||||
Gross Expenses (c) | 2.22 | % | 2.30 | % | 2.38 | % | 2.13 | % | 1.87 | % | |||||||||||||
Supplemental Data: | |||||||||||||||||||||||
Net Assets at end of period (000's) | $ | 1,090 | $ | 1,214 | $ | 1,129 | $ | 1,147 | $ | 1,554 | |||||||||||||
Portfolio Turnover (d) | 81 | % | 58 | % | 85 | % | 50 | % | 45 | % | |||||||||||||
(continues on next page)
See notes to financial statements.
66
Victory Portfolios | Financial Highlights — continued | ||||||
For a Share Outstanding Throughout Each Period
Victory INCORE Low Duration Bond Fund | |||||||||||||||||||||||
Class Y | |||||||||||||||||||||||
| Year Ended December 31, 2022 | Year Ended December 31, 2021 | Year Ended December 31, 2020 | Year Ended December 31, 2019 | Year Ended December 31, 2018 | |||||||||||||||||||
Net Asset Value, Beginning of Period | $ | 10.16 | $ | 10.20 | $ | 9.99 | $ | 9.86 | $ | 10.00 | |||||||||||||
Investment Activities: | |||||||||||||||||||||||
Net investment income (loss) (a) | 0.14 | 0.11 | 0.17 | 0.21 | 0.19 | ||||||||||||||||||
| Net realized and unrealized gains (losses) | (0.47 | ) | (0.01 | ) | 0.23 | 0.16 | (0.10 | ) | |||||||||||||||
Total from Investment Activities | (0.33 | ) | 0.10 | 0.40 | 0.37 | 0.09 | |||||||||||||||||
Distributions to Shareholders From: | |||||||||||||||||||||||
Net investment income | (0.18 | ) | (0.14 | ) | (0.15 | ) | (0.23 | ) | (0.23 | ) | |||||||||||||
Return of capital | — | — | (0.04 | ) | (0.01 | ) | — | ||||||||||||||||
Total Distributions | (0.18 | ) | (0.14 | ) | (0.19 | ) | (0.24 | ) | (0.23 | ) | |||||||||||||
Net Asset Value, End of Period | $ | 9.65 | $ | 10.16 | $ | 10.20 | $ | 9.99 | $ | 9.86 | |||||||||||||
Total Return (b) | (3.30 | )% | 0.94 | % | 4.08 | % | 3.76 | % | 0.96 | % | |||||||||||||
Ratios to Average Net Assets: | |||||||||||||||||||||||
Net Expenses (c) | 0.62 | % | 0.62 | % | 0.62 | % | 0.62 | % | 0.62 | % | |||||||||||||
Net Investment Income (Loss) | 1.40 | % | 1.10 | % | 1.64 | % | 2.12 | % | 1.87 | % | |||||||||||||
Gross Expenses (c) | 0.65 | % | 0.67 | % | 0.68 | % | 0.69 | % | 0.68 | % | |||||||||||||
Supplemental Data: | |||||||||||||||||||||||
Net Assets at end of period (000's) | $ | 105,653 | $ | 133,644 | $ | 165,330 | $ | 164,509 | $ | 180,034 | |||||||||||||
Portfolio Turnover (d) | 81 | % | 58 | % | 85 | % | 50 | % | 45 | % | |||||||||||||
(a) Per share net investment income (loss) has been calculated using the average daily shares method.
(b) Assumes reinvestment of all net investment income and realized capital gain distributions, if any, during the period. Includes adjustments in accordance with U.S. Generally Accepted Accounting Principles and could differ from the reported total return.
(c) Does not include acquired fund fees and expenses, if any.
(d) Portfolio turnover is calculated on the basis of the Fund as a whole without distinguishing between the classes of shares.
(e) Amount is less than $0.005 per share.
See notes to financial statements.
67
Victory Portfolios | Financial Highlights | ||||||
For a Share Outstanding Throughout Each Period
Victory High Yield Fund | |||||||||||||||||||||||
Class A | |||||||||||||||||||||||
| Year Ended December 31, 2022 | Year Ended December 31, 2021 | Year Ended December 31, 2020 | Year Ended December 31, 2019 | Year Ended December 31, 2018 | |||||||||||||||||||
Net Asset Value, Beginning of Period | $ | 6.79 | $ | 6.83 | $ | 6.73 | $ | 6.20 | $ | 6.57 | |||||||||||||
Investment Activities: | |||||||||||||||||||||||
Net investment income (loss) (a) | 0.40 | 0.36 | 0.37 | 0.37 | 0.39 | ||||||||||||||||||
| Net realized and unrealized gains (losses) | (1.52 | ) | (0.03 | ) | 0.10 | 0.54 | (0.37 | ) | |||||||||||||||
Total from Investment Activities | (1.12 | ) | 0.33 | 0.47 | 0.91 | 0.02 | |||||||||||||||||
Distributions to Shareholders From: | |||||||||||||||||||||||
Net investment income | (0.41 | ) | (0.37 | ) | (0.37 | ) | (0.38 | ) | (0.39 | ) | |||||||||||||
Total Distributions | (0.41 | ) | (0.37 | ) | (0.37 | ) | (0.38 | ) | (0.39 | ) | |||||||||||||
Net Asset Value, End of Period | $ | 5.26 | $ | 6.79 | $ | 6.83 | $ | 6.73 | $ | 6.20 | |||||||||||||
Total Return (excludes sales charge) (b) | (16.87 | )% | 4.86 | % | 7.61 | % | 14.90 | % | 0.28 | % | |||||||||||||
Ratios to Average Net Assets: | |||||||||||||||||||||||
Net Expenses (c) | 1.00 | % | 1.00 | % | 1.00 | % | 1.00 | % | 1.00 | % | |||||||||||||
Net Investment Income (Loss) | 6.68 | % | 5.22 | % | 5.85 | % | 5.70 | % | 6.01 | % | |||||||||||||
Gross Expenses (c) | 1.08 | % | 1.08 | % | 1.12 | % | 1.12 | % | 1.12 | % | |||||||||||||
Supplemental Data: | |||||||||||||||||||||||
Net Assets at end of period (000's) | $ | 28,508 | $ | 49,271 | $ | 38,735 | $ | 31,602 | $ | 23,797 | |||||||||||||
Portfolio Turnover (d) | 47 | % | 67 | % | 124 | % | 87 | % | 87 | % | |||||||||||||
(continues on next page)
See notes to financial statements.
68
Victory Portfolios | Financial Highlights — continued | ||||||
For a Share Outstanding Throughout Each Period
Victory High Yield Fund | |||||||||||||||||||||||
Class C | |||||||||||||||||||||||
| Year Ended December 31, 2022 | Year Ended December 31, 2021 | Year Ended December 31, 2020 | Year Ended December 31, 2019 | Year Ended December 31, 2018 | |||||||||||||||||||
Net Asset Value, Beginning of Period | $ | 6.81 | $ | 6.85 | $ | 6.75 | $ | 6.21 | $ | 6.58 | |||||||||||||
Investment Activities: | |||||||||||||||||||||||
Net investment income (loss) (a) | 0.36 | 0.31 | 0.33 | 0.33 | 0.34 | ||||||||||||||||||
| Net realized and unrealized gains (losses) | (1.52 | ) | (0.03 | ) | 0.10 | 0.54 | (0.36 | ) | |||||||||||||||
Total from Investment Activities | (1.16 | ) | 0.28 | 0.43 | 0.87 | (0.02 | ) | ||||||||||||||||
Distributions to Shareholders From: | |||||||||||||||||||||||
Net investment income | (0.37 | ) | (0.32 | ) | (0.33 | ) | (0.33 | ) | (0.35 | ) | |||||||||||||
Total Distributions | (0.37 | ) | (0.32 | ) | (0.33 | ) | (0.33 | ) | (0.35 | ) | |||||||||||||
Net Asset Value, End of Period | $ | 5.28 | $ | 6.81 | $ | 6.85 | $ | 6.75 | $ | 6.21 | |||||||||||||
| Total Return (excludes contingent deferred sales charge) (b) | (17.41 | )% | 4.11 | % | 6.84 | % | 14.24 | % | (0.43 | )% | |||||||||||||
Ratios to Average Net Assets: | |||||||||||||||||||||||
Net Expenses (c) | 1.70 | % | 1.70 | % | 1.70 | % | 1.70 | % | 1.70 | % | |||||||||||||
Net Investment Income (Loss) | 6.03 | % | 4.51 | % | 5.14 | % | 5.00 | % | 5.29 | % | |||||||||||||
Gross Expenses (c) | 1.80 | % | 1.78 | % | 1.81 | % | 1.82 | % | 1.84 | % | |||||||||||||
Supplemental Data: | |||||||||||||||||||||||
Net Assets at end of period (000's) | $ | 23,976 | $ | 32,889 | $ | 25,957 | $ | 21,163 | $ | 19,432 | |||||||||||||
Portfolio Turnover (d) | 47 | % | 67 | % | 124 | % | 87 | % | 87 | % | |||||||||||||
(continues on next page)
See notes to financial statements.
69
Victory Portfolios | Financial Highlights — continued | ||||||
For a Share Outstanding Throughout Each Period
Victory High Yield Fund | |||||||||||||||||||||||
Class R | |||||||||||||||||||||||
| Year Ended December 31, 2022 | Year Ended December 31, 2021 | Year Ended December 31, 2020 | Year Ended December 31, 2019 | Year Ended December 31, 2018 | |||||||||||||||||||
Net Asset Value, Beginning of Period | $ | 6.81 | $ | 6.85 | $ | 6.75 | $ | 6.22 | $ | 6.59 | |||||||||||||
Investment Activities: | |||||||||||||||||||||||
Net investment income (loss) (a) | 0.38 | 0.34 | 0.35 | 0.35 | 0.37 | ||||||||||||||||||
| Net realized and unrealized gains (losses) | (1.52 | ) | (0.03 | ) | 0.10 | 0.53 | (0.37 | ) | |||||||||||||||
Total from Investment Activities | (1.14 | ) | 0.31 | 0.45 | 0.88 | — | (e) | ||||||||||||||||
Distributions to Shareholders From: | |||||||||||||||||||||||
Net investment income | (0.39 | ) | (0.35 | ) | (0.35 | ) | (0.35 | ) | (0.37 | ) | |||||||||||||
Total Distributions | (0.39 | ) | (0.35 | ) | (0.35 | ) | (0.35 | ) | (0.37 | ) | |||||||||||||
Net Asset Value, End of Period | $ | 5.28 | $ | 6.81 | $ | 6.85 | $ | 6.75 | $ | 6.22 | |||||||||||||
Total Return (b) | (17.07 | )% | 4.55 | % | 7.24 | % | 14.48 | % | (0.07 | )% | |||||||||||||
Ratios to Average Net Assets: | |||||||||||||||||||||||
Net Expenses (c) | 1.29 | % | 1.28 | % | 1.33 | % | 1.33 | % | 1.35 | % | |||||||||||||
Net Investment Income (Loss) | 6.46 | % | 4.93 | % | 5.51 | % | 5.37 | % | 5.64 | % | |||||||||||||
Gross Expenses (c) | 1.29 | % | 1.28 | % | 1.33 | % | 1.33 | % | 1.35 | % | |||||||||||||
Supplemental Data: | |||||||||||||||||||||||
Net Assets at end of period (000's) | $ | 15,267 | $ | 19,243 | $ | 19,248 | $ | 18,818 | $ | 17,595 | |||||||||||||
Portfolio Turnover (d) | 47 | % | 67 | % | 124 | % | 87 | % | 87 | % | |||||||||||||
(continues on next page)
See notes to financial statements.
70
Victory Portfolios | Financial Highlights — continued | ||||||
For a Share Outstanding Throughout Each Period
Victory High Yield Fund | |||||||||||||||||||||||
Class Y | |||||||||||||||||||||||
| Year Ended December 31, 2022 | Year Ended December 31, 2021 | Year Ended December 31, 2020 | Year Ended December 31, 2019 | Year Ended December 31, 2018 | |||||||||||||||||||
Net Asset Value, Beginning of Period | $ | 6.76 | $ | 6.80 | $ | 6.70 | $ | 6.17 | $ | 6.54 | |||||||||||||
Investment Activities: | |||||||||||||||||||||||
Net investment income (loss) (a) | 0.41 | 0.38 | 0.39 | 0.39 | 0.41 | ||||||||||||||||||
| Net realized and unrealized gains (losses) | (1.51 | ) | (0.04 | ) | 0.10 | 0.53 | (0.37 | ) | |||||||||||||||
Total from Investment Activities | (1.10 | ) | 0.34 | 0.49 | 0.92 | 0.04 | |||||||||||||||||
Distributions to Shareholders From: | |||||||||||||||||||||||
Net investment income | (0.42 | ) | (0.38 | ) | (0.39 | ) | (0.39 | ) | (0.41 | ) | |||||||||||||
Total Distributions | (0.42 | ) | (0.38 | ) | (0.39 | ) | (0.39 | ) | (0.41 | ) | |||||||||||||
Net Asset Value, End of Period | $ | 5.24 | $ | 6.76 | $ | 6.80 | $ | 6.70 | $ | 6.17 | |||||||||||||
Total Return (b) | (16.58 | )% | 5.15 | % | 7.88 | % | 15.25 | % | 0.52 | % | |||||||||||||
Ratios to Average Net Assets: | |||||||||||||||||||||||
Net Expenses (c) | 0.76 | % | 0.76 | % | 0.76 | % | 0.76 | % | 0.76 | % | |||||||||||||
Net Investment Income (Loss) | 7.00 | % | 5.49 | % | 6.11 | % | 5.96 | % | 6.32 | % | |||||||||||||
Gross Expenses (c) | 0.86 | % | 0.84 | % | 0.90 | % | 0.92 | % | 0.97 | % | |||||||||||||
Supplemental Data: | |||||||||||||||||||||||
Net Assets at end of period (000's) | $ | 177,376 | $ | 237,385 | $ | 168,677 | $ | 108,171 | $ | 21,060 | |||||||||||||
Portfolio Turnover (d) | 47 | % | 67 | % | 124 | % | 87 | % | 87 | % | |||||||||||||
(a) Per share net investment income (loss) has been calculated using the average daily shares method.
(b) Assumes reinvestment of all net investment income and realized capital gain distributions, if any, during the period. Includes adjustments in accordance with U.S. Generally Accepted Accounting Principles and could differ from the reported total return.
(c) Does not include acquired fund fees and expenses, if any.
(d) Portfolio turnover is calculated on the basis of the Fund as a whole without distinguishing between the classes of shares.
(e) Amount is less than $0.005 per share.
See notes to financial statements.
71
Victory Portfolios | Financial Highlights | ||||||
For a Share Outstanding Throughout Each Period
Victory Tax-Exempt Fund | |||||||||||||||||||||||
Class A | |||||||||||||||||||||||
| Year Ended December 31, 2022 | Year Ended December 31, 2021 | Year Ended December 31, 2020 | Year Ended December 31, 2019 | Year Ended December 31, 2018 | |||||||||||||||||||
Net Asset Value, Beginning of Period | $ | 9.78 | $ | 9.94 | $ | 9.84 | $ | 9.47 | $ | 9.91 | |||||||||||||
Investment Activities: | |||||||||||||||||||||||
Net investment income (loss) (a) | 0.27 | 0.27 | 0.29 | 0.30 | 0.36 | ||||||||||||||||||
| Net realized and unrealized gains (losses) | (1.41 | ) | 0.12 | 0.23 | 0.53 | (0.30 | ) | ||||||||||||||||
Total from Investment Activities | (1.14 | ) | 0.39 | 0.52 | 0.83 | 0.06 | |||||||||||||||||
Distributions to Shareholders From: | |||||||||||||||||||||||
Net investment income | (0.31 | ) | (0.32 | ) | (0.32 | ) | (0.34 | ) | (0.36 | ) | |||||||||||||
Net realized gains from investments | (0.06 | ) | (0.23 | ) | (0.10 | ) | (0.12 | ) | (0.14 | ) | |||||||||||||
Total Distributions | (0.37 | ) | (0.55 | ) | (0.42 | ) | (0.46 | ) | (0.50 | ) | |||||||||||||
Net Asset Value, End of Period | $ | 8.27 | $ | 9.78 | $ | 9.94 | $ | 9.84 | $ | 9.47 | |||||||||||||
Total Return (excludes sales charge) (b) | (11.70 | )% | 3.94 | % | 5.39 | % | 8.82 | % | 0.69 | % | |||||||||||||
Ratios to Average Net Assets: | |||||||||||||||||||||||
Net Expenses (c) | 0.80 | % | 0.80 | % | 0.80 | % | 0.80 | % | 0.80 | % | |||||||||||||
Net Investment Income (Loss) | 3.08 | % | 2.74 | % | 3.00 | % | 3.04 | % | 3.68 | % | |||||||||||||
Gross Expenses (c) | 1.07 | % | 1.03 | % | 1.04 | % | 1.02 | % | 0.97 | % | |||||||||||||
Supplemental Data: | |||||||||||||||||||||||
Net Assets at end of period (000's) | $ | 24,745 | $ | 35,312 | $ | 32,001 | $ | 30,251 | $ | 29,993 | |||||||||||||
Portfolio Turnover (d) | 13 | % | 6 | % | 44 | % | 64 | % | 42 | % | |||||||||||||
(continues on next page)
See notes to financial statements.
72
Victory Portfolios | Financial Highlights — continued | ||||||
For a Share Outstanding Throughout Each Period
Victory Tax-Exempt Fund | |||||||||||||||||||||||
Class C | |||||||||||||||||||||||
| Year Ended December 31, 2022 | Year Ended December 31, 2021 | Year Ended December 31, 2020 | Year Ended December 31, 2019 | Year Ended December 31, 2018 | |||||||||||||||||||
Net Asset Value, Beginning of Period | $ | 9.78 | $ | 9.94 | $ | 9.84 | $ | 9.47 | $ | 9.90 | |||||||||||||
Investment Activities: | |||||||||||||||||||||||
Net investment income (loss) (a) | 0.20 | 0.20 | 0.22 | 0.23 | 0.28 | ||||||||||||||||||
| Net realized and unrealized gains (losses) | (1.41 | ) | 0.11 | 0.22 | 0.52 | (0.29 | ) | ||||||||||||||||
Total from Investment Activities | (1.21 | ) | 0.31 | 0.44 | 0.75 | (0.01 | ) | ||||||||||||||||
Distributions to Shareholders From: | |||||||||||||||||||||||
Net investment income | (0.24 | ) | (0.24 | ) | (0.24 | ) | (0.26 | ) | (0.28 | ) | |||||||||||||
Net realized gains from investments | (0.06 | ) | (0.23 | ) | (0.10 | ) | (0.12 | ) | (0.14 | ) | |||||||||||||
Total Distributions | (0.30 | ) | (0.47 | ) | (0.34 | ) | (0.38 | ) | (0.42 | ) | |||||||||||||
Net Asset Value, End of Period | $ | 8.27 | $ | 9.78 | $ | 9.94 | $ | 9.84 | $ | 9.47 | |||||||||||||
| Total Return (excludes contingent deferred sales charge) (b) | (12.40 | )% | 3.13 | % | 4.56 | % | 7.97 | % | (0.01 | )% | |||||||||||||
Ratios to Average Net Assets: | |||||||||||||||||||||||
Net Expenses (c) | 1.60 | % | 1.60 | % | 1.60 | % | 1.60 | % | 1.60 | % | |||||||||||||
Net Investment Income (Loss) | 2.23 | % | 2.01 | % | 2.28 | % | 2.34 | % | 2.88 | % | |||||||||||||
Gross Expenses (c) | 2.58 | % | 2.38 | % | 1.91 | % | 1.82 | % | 1.78 | % | |||||||||||||
Supplemental Data: | |||||||||||||||||||||||
Net Assets at end of period (000's) | $ | 927 | $ | 2,037 | $ | 6,497 | $ | 11,259 | $ | 17,986 | |||||||||||||
Portfolio Turnover (d) | 13 | % | 6 | % | 44 | % | 64 | % | 42 | % | |||||||||||||
(continues on next page)
See notes to financial statements.
73
Victory Portfolios | Financial Highlights — continued | ||||||
For a Share Outstanding Throughout Each Period
Victory Tax-Exempt Fund | |||||||||||||||||||||||
Class Y | |||||||||||||||||||||||
| Year Ended December 31, 2022 | Year Ended December 31, 2021 | Year Ended December 31, 2020 | Year Ended December 31, 2019 | Year Ended December 31, 2018 | |||||||||||||||||||
Net Asset Value, Beginning of Period | $ | 9.78 | $ | 9.94 | $ | 9.84 | $ | 9.46 | $ | 9.90 | |||||||||||||
Investment Activities: | |||||||||||||||||||||||
Net investment income (loss) (a) | 0.28 | 0.29 | 0.30 | 0.30 | 0.37 | ||||||||||||||||||
| Net realized and unrealized gains (losses) | (1.41 | ) | 0.11 | 0.23 | 0.55 | (0.30 | ) | ||||||||||||||||
Total from Investment Activities | (1.13 | ) | 0.40 | 0.53 | 0.85 | 0.07 | |||||||||||||||||
Distributions to Shareholders From: | |||||||||||||||||||||||
Net investment income | (0.32 | ) | (0.33 | ) | (0.33 | ) | (0.35 | ) | (0.37 | ) | |||||||||||||
Net realized gains from investments | (0.06 | ) | (0.23 | ) | (0.10 | ) | (0.12 | ) | (0.14 | ) | |||||||||||||
Total Distributions | (0.38 | ) | (0.56 | ) | (0.43 | ) | (0.47 | ) | (0.51 | ) | |||||||||||||
Net Asset Value, End of Period | $ | 8.27 | $ | 9.78 | $ | 9.94 | $ | 9.84 | $ | 9.46 | |||||||||||||
Total Return (b) | (11.60 | )% | 4.06 | % | 5.51 | % | 9.06 | % | 0.80 | % | |||||||||||||
Ratios to Average Net Assets: | |||||||||||||||||||||||
Net Expenses (c) | 0.69 | % | 0.69 | % | 0.69 | % | 0.69 | % | 0.69 | % | |||||||||||||
Net Investment Income (Loss) | 3.19 | % | 2.85 | % | 3.12 | % | 3.07 | % | 3.79 | % | |||||||||||||
Gross Expenses (c) | 0.87 | % | 0.89 | % | 0.85 | % | 0.83 | % | 0.77 | % | |||||||||||||
Supplemental Data: | |||||||||||||||||||||||
Net Assets at end of period (000's) | $ | 10,826 | $ | 13,969 | $ | 22,998 | $ | 24,459 | $ | 20,260 | |||||||||||||
Portfolio Turnover (d) | 13 | % | 6 | % | 44 | % | 64 | % | 42 | % | |||||||||||||
(a) Per share net investment income (loss) has been calculated using the average daily shares method.
(b) Assumes reinvestment of all net investment income and realized capital gain distributions, if any, during the period. Includes adjustments in accordance with U.S. Generally Accepted Accounting Principles and could differ from the reported total return.
(c) Does not include acquired fund fees and expenses, if any.
(d) Portfolio turnover is calculated on the basis of the Fund as a whole without distinguishing between the classes of shares.
See notes to financial statements.
74
Victory Portfolios | Financial Highlights | ||||||
For a Share Outstanding Throughout Each Period
Victory High Income Municipal Bond Fund | |||||||||||||||||||||||
Class A | |||||||||||||||||||||||
| Year Ended December 31, 2022 | Year Ended December 31, 2021 | Year Ended December 31, 2020 | Year Ended December 31, 2019 | Year Ended December 31, 2018 | |||||||||||||||||||
Net Asset Value, Beginning of Period | $ | 11.09 | $ | 10.84 | $ | 10.75 | $ | 10.39 | $ | 10.79 | |||||||||||||
Investment Activities: | |||||||||||||||||||||||
Net investment income (loss) (a) | 0.36 | 0.36 | 0.42 | 0.35 | 0.43 | ||||||||||||||||||
| Net realized and unrealized gains (losses) | (1.95 | ) | 0.27 | 0.15 | 0.47 | (0.40 | ) | ||||||||||||||||
Total from Investment Activities | (1.59 | ) | 0.63 | 0.57 | 0.82 | 0.03 | |||||||||||||||||
Distributions to Shareholders From: | |||||||||||||||||||||||
Net investment income | (0.40 | ) | (0.38 | ) | (0.39 | ) | (0.40 | ) | (0.43 | ) | |||||||||||||
Net realized gains from investments | (0.03 | ) | — | (0.09 | ) | (0.06 | ) | — | |||||||||||||||
Total Distributions | (0.43 | ) | (0.38 | ) | (0.48 | ) | (0.46 | ) | (0.43 | ) | |||||||||||||
Net Asset Value, End of Period | $ | 9.07 | $ | 11.09 | $ | 10.84 | $ | 10.75 | $ | 10.39 | |||||||||||||
Total Return (excludes sales charge) (b) | (14.48 | )% | 5.91 | % | 5.52 | % | 8.04 | % | 0.34 | % | |||||||||||||
Ratios to Average Net Assets: | |||||||||||||||||||||||
Net Expenses (c) | 0.80 | % | 0.80 | % | 0.80 | % | 0.80 | % | 0.80 | % | |||||||||||||
Net Investment Income (Loss) | 3.74 | % | 3.22 | % | 3.95 | % | 3.27 | % | 4.13 | % | |||||||||||||
Gross Expenses (c) | 1.04 | % | 1.04 | % | 1.10 | % | 1.09 | % | 1.02 | % | |||||||||||||
Supplemental Data: | |||||||||||||||||||||||
Net Assets at end of period (000's) | $ | 21,747 | $ | 34,352 | $ | 26,330 | $ | 19,153 | $ | 16,483 | |||||||||||||
Portfolio Turnover (d) | 23 | % | 19 | % | 74 | % | 49 | % | 48 | % | |||||||||||||
(continues on next page)
See notes to financial statements.
75
Victory Portfolios | Financial Highlights — continued | ||||||
For a Share Outstanding Throughout Each Period
Victory High Income Municipal Bond Fund | |||||||||||||||||||||||
Class C | |||||||||||||||||||||||
| Year Ended December 31, 2022 | Year Ended December 31, 2021 | Year Ended December 31, 2020 | Year Ended December 31, 2019 | Year Ended December 31, 2018 | |||||||||||||||||||
Net Asset Value, Beginning of Period | $ | 11.09 | $ | 10.84 | $ | 10.75 | $ | 10.39 | $ | 10.79 | |||||||||||||
Investment Activities: | |||||||||||||||||||||||
Net investment income (loss) (a) | 0.29 | 0.28 | 0.33 | 0.28 | 0.35 | ||||||||||||||||||
| Net realized and unrealized gains (losses) | (1.96 | ) | 0.27 | 0.16 | 0.46 | (0.40 | ) | ||||||||||||||||
Total from Investment Activities | (1.67 | ) | 0.55 | 0.49 | 0.74 | (0.05 | ) | ||||||||||||||||
Distributions to Shareholders From: | |||||||||||||||||||||||
Net investment income | (0.32 | ) | (0.30 | ) | (0.31 | ) | (0.32 | ) | (0.35 | ) | |||||||||||||
Net realized gains from investments | (0.03 | ) | — | (0.09 | ) | (0.06 | ) | — | |||||||||||||||
Total Distributions | (0.35 | ) | (0.30 | ) | (0.40 | ) | (0.38 | ) | (0.35 | ) | |||||||||||||
Net Asset Value, End of Period | $ | 9.07 | $ | 11.09 | $ | 10.84 | $ | 10.75 | $ | 10.39 | |||||||||||||
| Total Return (excludes contingent deferred sales charge) (b) | (15.14 | )% | 5.12 | % | 4.72 | % | 7.22 | % | (0.43 | )% | |||||||||||||
Ratios to Average Net Assets: | |||||||||||||||||||||||
Net Expenses (c) | 1.57 | % | 1.57 | % | 1.57 | % | 1.57 | % | 1.57 | % | |||||||||||||
Net Investment Income (Loss) | 2.94 | % | 2.50 | % | 3.11 | % | 2.61 | % | 3.35 | % | |||||||||||||
Gross Expenses (c) | 2.56 | % | 2.20 | % | 1.90 | % | 1.85 | % | 1.78 | % | |||||||||||||
Supplemental Data: | |||||||||||||||||||||||
Net Assets at end of period (000's) | $ | 1,259 | $ | 2,192 | $ | 9,378 | $ | 13,995 | $ | 19,282 | |||||||||||||
Portfolio Turnover (d) | 23 | % | 19 | % | 74 | % | 49 | % | 48 | % | |||||||||||||
(continues on next page)
See notes to financial statements.
76
Victory Portfolios | Financial Highlights — continued | ||||||
For a Share Outstanding Throughout Each Period
Victory High Income Municipal Bond Fund | |||||||||||||||||||||||
Class Y | |||||||||||||||||||||||
| Year Ended December 31, 2022 | Year Ended December 31, 2021 | Year Ended December 31, 2020 | Year Ended December 31, 2019 | Year Ended December 31, 2018 | |||||||||||||||||||
Net Asset Value, Beginning of Period | $ | 11.09 | $ | 10.84 | $ | 10.75 | $ | 10.39 | $ | 10.79 | |||||||||||||
Investment Activities: | |||||||||||||||||||||||
Net investment income (loss) (a) | 0.38 | 0.38 | 0.44 | 0.38 | 0.46 | ||||||||||||||||||
| Net realized and unrealized gains (losses) | (1.95 | ) | 0.28 | 0.16 | 0.47 | (0.40 | ) | ||||||||||||||||
Total from Investment Activities | (1.57 | ) | 0.66 | 0.60 | 0.85 | 0.06 | |||||||||||||||||
Distributions to Shareholders From: | |||||||||||||||||||||||
Net investment income | (0.42 | ) | (0.41 | ) | (0.42 | ) | (0.43 | ) | (0.46 | ) | |||||||||||||
Net realized gains from investments | (0.03 | ) | — | (0.09 | ) | (0.06 | ) | — | |||||||||||||||
Total Distributions | (0.45 | ) | (0.41 | ) | (0.51 | ) | (0.49 | ) | (0.46 | ) | |||||||||||||
Net Asset Value, End of Period | $ | 9.07 | $ | 11.09 | $ | 10.84 | $ | 10.75 | $ | 10.39 | |||||||||||||
Total Return (b) | (14.29 | )% | 6.16 | % | 5.76 | % | 8.29 | % | 0.57 | % | |||||||||||||
Ratios to Average Net Assets: | |||||||||||||||||||||||
Net Expenses (c) | 0.57 | % | 0.57 | % | 0.57 | % | 0.57 | % | 0.57 | % | |||||||||||||
Net Investment Income (Loss) | 3.94 | % | 3.40 | % | 4.14 | % | 3.56 | % | 4.36 | % | |||||||||||||
Gross Expenses (c) | 0.87 | % | 0.85 | % | 0.93 | % | 0.88 | % | 0.78 | % | |||||||||||||
Supplemental Data: | |||||||||||||||||||||||
Net Assets at end of period (000's) | $ | 12,548 | $ | 14,087 | $ | 9,682 | $ | 10,620 | $ | 11,683 | |||||||||||||
Portfolio Turnover (d) | 23 | % | 19 | % | 74 | % | 49 | % | 48 | % | |||||||||||||
(continues on next page)
See notes to financial statements.
77
Victory Portfolios | Financial Highlights — continued | ||||||
For a Share Outstanding Throughout Each Period
Victory High Income Municipal Bond Fund | |||||||||||||||
Member Class | |||||||||||||||
| Year Ended December 31, 2022 | Year Ended December 31, 2021 | November 3, 2020(e) through December 31, 2020 | |||||||||||||
Net Asset Value, Beginning of Period | $ | 11.09 | $ | 10.84 | $ | 10.56 | |||||||||
Investment Activities: | |||||||||||||||
Net investment income (loss) (a) | 0.38 | 0.34 | 0.12 | ||||||||||||
Net realized and unrealized gains (losses) | (1.96 | ) | 0.31 | 0.31 | |||||||||||
Total from Investment Activities | (1.58 | ) | 0.65 | 0.43 | |||||||||||
Distributions to Shareholders From: | |||||||||||||||
Net investment income | (0.41 | ) | (0.40 | ) | (0.06 | ) | |||||||||
Net realized gains from investments | (0.03 | ) | — | (0.09 | ) | ||||||||||
Total Distributions | (0.44 | ) | (0.40 | ) | (0.15 | ) | |||||||||
Net Asset Value, End of Period | $ | 9.07 | $ | 11.09 | $ | 10.84 | |||||||||
Total Return (b) (f) | (14.35 | )% | 6.07 | % | 4.12 | % | |||||||||
Ratios to Average Net Assets: | |||||||||||||||
Net Expenses (c) (g) | 0.65 | % | 0.65 | % | 0.65 | % | |||||||||
Net Investment Income (Loss) (g) | 3.93 | % | 3.04 | % | 6.78 | % | |||||||||
Gross Expenses (c) (g) | 1.33 | % | 2.61 | % | 42.32 | % | |||||||||
Supplemental Data: | |||||||||||||||
Net Assets at end of period (000's) | $ | 3,976 | $ | 2,853 | $ | 140 | |||||||||
Portfolio Turnover (d) (f) | 23 | % | 19 | % | 74 | % | |||||||||
(a) Per share net investment income (loss) has been calculated using the average daily shares method.
(b) Assumes reinvestment of all net investment income and realized capital gain distributions, if any, during the period. Includes adjustments in accordance with U.S. Generally Accepted Accounting Principles and could differ from the reported total return.
(c) Does not include acquired fund fees and expenses, if any.
(d) Portfolio turnover is calculated on the basis of the Fund as a whole without distinguishing between the classes of shares.
(e) Commencement of operations.
(f) Not annualized for periods less than one year.
(g) Annualized for periods less than one year.
See notes to financial statements.
78
Victory Portfolios | Financial Highlights | ||||||
For a Share Outstanding Throughout Each Period
Victory Floating Rate Fund | |||||||||||||||||||||||
Class A | |||||||||||||||||||||||
| Year Ended December 31, 2022 | Year Ended December 31, 2021 | Year Ended December 31, 2020 | Year Ended December 31, 2019 | Year Ended December 31, 2018 | |||||||||||||||||||
Net Asset Value, Beginning of Period | $ | 9.33 | $ | 9.34 | $ | 9.42 | $ | 9.13 | $ | 9.60 | |||||||||||||
Investment Activities: | |||||||||||||||||||||||
Net investment income (loss) (a) | 0.48 | 0.36 | 0.49 | 0.55 | 0.52 | ||||||||||||||||||
| Net realized and unrealized gains (losses) | (1.13 | ) | — | (b) | (0.08 | ) | 0.29 | (0.47 | ) | ||||||||||||||
Total from Investment Activities | (0.65 | ) | 0.36 | 0.41 | 0.84 | 0.05 | |||||||||||||||||
Distributions to Shareholders From: | |||||||||||||||||||||||
Net investment income | (0.49 | ) | (0.37 | ) | (0.49 | ) | (0.55 | ) | (0.52 | ) | |||||||||||||
Total Distributions | (0.49 | ) | (0.37 | ) | (0.49 | ) | (0.55 | ) | (0.52 | ) | |||||||||||||
Net Asset Value, End of Period | $ | 8.19 | $ | 9.33 | $ | 9.34 | $ | 9.42 | $ | 9.13 | |||||||||||||
Total Return (excludes sales charge) (c) | (7.01 | )% | 3.89 | % | 4.81 | % | 9.43 | % | 0.43 | % | |||||||||||||
Ratios to Average Net Assets: | |||||||||||||||||||||||
Net Expenses (d) | 1.01 | %(e) | 1.00 | % | 1.00 | % | 1.00 | % | 1.00 | % | |||||||||||||
Net Investment Income (Loss) | 5.52 | % | 3.88 | % | 5.54 | % | 5.89 | % | 5.41 | % | |||||||||||||
Gross Expenses (d) | 1.11 | % | 1.12 | % | 1.17 | % | 1.17 | % | 1.14 | % | |||||||||||||
Supplemental Data: | |||||||||||||||||||||||
Net Assets at end of period (000's) | $ | 252,904 | $ | 349,706 | $ | 164,864 | $ | 146,584 | $ | 118,672 | |||||||||||||
Portfolio Turnover (f) | 35 | % | 35 | % | 54 | % | 35 | % | 48 | % | |||||||||||||
(continues on next page)
See notes to financial statements.
79
Victory Portfolios | Financial Highlights — continued | ||||||
For a Share Outstanding Throughout Each Period
Victory Floating Rate Fund | |||||||||||||||||||||||
Class C | |||||||||||||||||||||||
| Year Ended December 31, 2022 | Year Ended December 31, 2021 | Year Ended December 31, 2020 | Year Ended December 31, 2019 | Year Ended December 31, 2018 | |||||||||||||||||||
Net Asset Value, Beginning of Period | $ | 9.33 | $ | 9.34 | $ | 9.42 | $ | 9.14 | $ | 9.61 | |||||||||||||
Investment Activities: | |||||||||||||||||||||||
Net investment income (loss) (a) | 0.41 | 0.29 | 0.43 | 0.48 | 0.44 | ||||||||||||||||||
| Net realized and unrealized gains (losses) | (1.12 | ) | (0.01 | ) | (0.09 | ) | 0.28 | (0.47 | ) | ||||||||||||||
Total from Investment Activities | (0.71 | ) | 0.28 | 0.34 | 0.76 | (0.03 | ) | ||||||||||||||||
Distributions to Shareholders From: | |||||||||||||||||||||||
Net investment income | (0.42 | ) | (0.29 | ) | (0.42 | ) | (0.48 | ) | (0.44 | ) | |||||||||||||
Total Distributions | (0.42 | ) | (0.29 | ) | (0.42 | ) | (0.48 | ) | (0.44 | ) | |||||||||||||
Net Asset Value, End of Period | $ | 8.20 | $ | 9.33 | $ | 9.34 | $ | 9.42 | $ | 9.14 | |||||||||||||
| Total Return (excludes contingent deferred sales charge) (c) | (7.66 | )% | 3.05 | % | 3.96 | % | 8.49 | % | (0.38 | )% | |||||||||||||
Ratios to Average Net Assets: | |||||||||||||||||||||||
Net Expenses (d) | 1.81 | %(e) | 1.80 | % | 1.80 | % | 1.80 | % | 1.80 | % | |||||||||||||
Net Investment Income (Loss) | 4.73 | % | 3.09 | % | 4.81 | % | 5.08 | % | 4.60 | % | |||||||||||||
Gross Expenses (d) | 1.87 | % | 1.89 | % | 1.94 | % | 1.92 | % | 1.90 | % | |||||||||||||
Supplemental Data: | |||||||||||||||||||||||
Net Assets at end of period (000's) | $ | 58,606 | $ | 81,109 | $ | 94,885 | $ | 149,054 | $ | 211,462 | |||||||||||||
Portfolio Turnover (f) | 35 | % | 35 | % | 54 | % | 35 | % | 48 | % | |||||||||||||
(continues on next page)
See notes to financial statements.
80
Victory Portfolios | Financial Highlights — continued | ||||||
For a Share Outstanding Throughout Each Period
Victory Floating Rate Fund | |||||||||||||||||||||||
Class R | |||||||||||||||||||||||
| Year Ended December 31, 2022 | Year Ended December 31, 2021 | Year Ended December 31, 2020 | Year Ended December 31, 2019 | Year Ended December 31, 2018 | |||||||||||||||||||
Net Asset Value, Beginning of Period | $ | 9.33 | $ | 9.33 | $ | 9.41 | $ | 9.13 | $ | 9.60 | |||||||||||||
Investment Activities: | |||||||||||||||||||||||
Net investment income (loss) (a) | 0.44 | 0.31 | 0.45 | 0.50 | 0.46 | ||||||||||||||||||
| Net realized and unrealized gains (losses) | (1.14 | ) | — | (b) | (0.09 | ) | 0.28 | (0.46 | ) | ||||||||||||||
Total from Investment Activities | (0.70 | ) | 0.31 | 0.36 | 0.78 | — | (b) | ||||||||||||||||
Distributions to Shareholders From: | |||||||||||||||||||||||
Net investment income | (0.44 | ) | (0.31 | ) | (0.44 | ) | (0.50 | ) | (0.47 | ) | |||||||||||||
Total Distributions | (0.44 | ) | (0.31 | ) | (0.44 | ) | (0.50 | ) | (0.47 | ) | |||||||||||||
Net Asset Value, End of Period | $ | 8.19 | $ | 9.33 | $ | 9.33 | $ | 9.41 | $ | 9.13 | |||||||||||||
Total Return (c) | (7.55 | )% | 3.40 | % | 4.23 | % | 8.75 | % | (0.13 | )% | |||||||||||||
Ratios to Average Net Assets: | |||||||||||||||||||||||
Net Expenses (d) | 1.57 | %(e) | 1.56 | % | 1.56 | % | 1.56 | % | 1.56 | % | |||||||||||||
Net Investment Income (Loss) | 5.05 | % | 3.31 | % | 5.01 | % | 5.34 | % | 4.84 | % | |||||||||||||
Gross Expenses (d) | 3.32 | % | 3.45 | % | 6.20 | % | 3.73 | % | 2.99 | % | |||||||||||||
Supplemental Data: | |||||||||||||||||||||||
Net Assets at end of period (000's) | $ | 537 | $ | 602 | $ | 300 | $ | 455 | $ | 716 | |||||||||||||
Portfolio Turnover (f) | 35 | % | 35 | % | 54 | % | 35 | % | 48 | % | |||||||||||||
(continues on next page)
See notes to financial statements.
81
Victory Portfolios | Financial Highlights — continued | ||||||
For a Share Outstanding Throughout Each Period
Victory Floating Rate Fund | |||||||||||||||||||||||
Class Y | |||||||||||||||||||||||
| Year Ended December 31, 2022 | Year Ended December 31, 2021 | Year Ended December 31, 2020 | Year Ended December 31, 2019 | Year Ended December 31, 2018 | |||||||||||||||||||
Net Asset Value, Beginning of Period | $ | 9.33 | $ | 9.35 | $ | 9.43 | $ | 9.14 | $ | 9.61 | |||||||||||||
Investment Activities: | |||||||||||||||||||||||
Net investment income (loss) (a) | 0.49 | 0.38 | 0.51 | 0.57 | 0.54 | ||||||||||||||||||
| Net realized and unrealized gains (losses) | (1.11 | ) | (0.01 | ) | (0.08 | ) | 0.29 | (0.47 | ) | ||||||||||||||
Total from Investment Activities | (0.62 | ) | 0.37 | 0.43 | 0.86 | 0.07 | |||||||||||||||||
Distributions to Shareholders From: | |||||||||||||||||||||||
Net investment income | (0.51 | ) | (0.39 | ) | (0.51 | ) | (0.57 | ) | (0.54 | ) | |||||||||||||
Total Distributions | (0.51 | ) | (0.39 | ) | (0.51 | ) | (0.57 | ) | (0.54 | ) | |||||||||||||
Net Asset Value, End of Period | $ | 8.20 | $ | 9.33 | $ | 9.35 | $ | 9.43 | $ | 9.14 | |||||||||||||
Total Return (c) | (6.69 | )% | 4.01 | % | 5.03 | % | 9.65 | % | 0.64 | % | |||||||||||||
Ratios to Average Net Assets: | |||||||||||||||||||||||
Net Expenses (d) | 0.79 | %(e) | 0.78 | % | 0.78 | % | 0.78 | % | 0.78 | % | |||||||||||||
Net Investment Income (Loss) | 5.58 | % | 4.08 | % | 5.73 | % | 6.10 | % | 5.64 | % | |||||||||||||
Gross Expenses (d) | 0.85 | % | 0.86 | % | 0.93 | % | 0.92 | % | 0.89 | % | |||||||||||||
Supplemental Data: | |||||||||||||||||||||||
Net Assets at end of period (000's) | $ | 939,244 | $ | 1,768,900 | $ | 403,852 | $ | 289,796 | $ | 281,545 | |||||||||||||
Portfolio Turnover (f) | 35 | % | 35 | % | 54 | % | 35 | % | 48 | % | |||||||||||||
(continues on next page)
See notes to financial statements.
82
Victory Portfolios | Financial Highlights — continued | ||||||
For a Share Outstanding Throughout Each Period
Victory Floating Rate Fund | |||||||||||||||
Member Class | |||||||||||||||
| Year Ended December 31, 2022 | Year Ended December 31, 2021 | November 3, 2020(g) through December 31, 2020 | |||||||||||||
Net Asset Value, Beginning of Period | $ | 9.33 | $ | 9.34 | $ | 9.02 | |||||||||
Investment Activities: | |||||||||||||||
Net investment income (loss) (a) | 0.52 | 0.38 | 0.08 | ||||||||||||
Net realized and unrealized gains (losses) | (1.15 | ) | (0.01 | ) | 0.32 | ||||||||||
Total from Investment Activities | (0.63 | ) | 0.37 | 0.40 | |||||||||||
Distributions to Shareholders From: | |||||||||||||||
Net investment income | (0.51 | ) | (0.38 | ) | (0.08 | ) | |||||||||
Total Distributions | (0.51 | ) | (0.38 | ) | (0.08 | ) | |||||||||
Net Asset Value, End of Period | $ | 8.19 | $ | 9.33 | $ | 9.34 | |||||||||
Total Return (c) (h) | (6.87 | )% | 4.04 | % | 4.41 | % | |||||||||
Ratios to Average Net Assets: | |||||||||||||||
Net Expenses (d) (i) | 0.86 | %(e) | 0.85 | % | 0.85 | % | |||||||||
Net Investment Income (Loss) (i) | 5.94 | % | 4.02 | % | 5.46 | % | |||||||||
Gross Expenses (d) (i) | 1.36 | % | 3.64 | % | 56.41 | % | |||||||||
Supplemental Data: | |||||||||||||||
Net Assets at end of period (000's) | $ | 4,350 | $ | 2,122 | $ | 62 | |||||||||
Portfolio Turnover (f) (h) | 35 | % | 35 | % | 54 | % | |||||||||
(a) Per share net investment income (loss) has been calculated using the average daily shares method.
(b) Amount is less than $0.005 per share.
(c) Assumes reinvestment of all net investment income and realized capital gain distributions, if any, during the period. Includes adjustments in accordance with U.S. Generally Accepted Accounting Principles and could differ from the reported total return.
(d) Does not include acquired fund fees and expenses, if any.
(e) Includes impact of Interfund lending fees. With these Interfund lending fees, the net expense ratio would have been at the contractual expense cap. (See Note 4 in the accompanying Notes to Financial Statements)
(f) Portfolio turnover is calculated on the basis of the Fund as a whole without distinguishing between the classes of shares.
(g) Commencement of operations.
(h) Not annualized for periods less than one year.
(i) Annualized for periods less than one year.
See notes to financial statements.
83
Victory Portfolios | Notes to Financial Statements December 31, 2022 | ||||||
1. Organization:
Victory Portfolios (the "Trust") is organized as a Delaware statutory trust and the Trust is registered under the Investment Company Act of 1940, as amended (the "1940 Act"), as an open-end investment company. The Trust is comprised of 37 funds and is authorized to issue an unlimited number of shares, which are units of beneficial interest with a par value of $0.001 per share.
The accompanying financial statements are those of the following five Funds (collectively, the "Funds" and individually, a "Fund"). Each Fund is classified as diversified under the 1940 Act.
Funds (Legal Name) | Funds (Short Name) | Investment Share Classes Offered | |||||||||
| Victory INCORE Low Duration Bond Fund | INCORE Low Duration Bond Fund | A, C, R, and Y | |||||||||
Victory High Yield Fund | High Yield Fund | A, C, R, and Y | |||||||||
Victory Tax-Exempt Fund | Tax-Exempt Fund | A, C, and Y | |||||||||
| Victory High Income Municipal Bond Fund | High Income Municipal Bond Fund | A, C, Y, and Member Class | |||||||||
| Victory Floating Rate Fund | Floating Rate Fund | A, C, R, Y, and Member Class | |||||||||
Each class of shares of a Fund has substantially identical rights and privileges except with respect to sales charges, fees paid under distribution plans, expenses allocable exclusively to each class of shares, voting rights on matters solely affecting a single class of shares, and the exchange privilege of each class of shares.
Victory Capital Management Inc. ("VCM" or the "Adviser") is an indirect wholly owned subsidiary of Victory Capital Holdings, Inc., a publicly traded Delaware corporation, and a wholly owned direct subsidiary of Victory Capital Operating, LLC.
Under the Trust's organizational documents, its officers and trustees are indemnified against certain liabilities arising out of the performance of their duties to the Funds. In addition, in the normal course of business, the Funds enter into contracts with their vendors and others that provide for general indemnifications. The Funds' maximum exposure under these arrangements is unknown, as this would involve future claims that may be made against the Funds. However, based on experience, the Funds expect that risk of loss to be remote.
2. Significant Accounting Policies:
The following is a summary of significant accounting policies followed by the Trust in the preparation of its financial statements. The policies are in conformity with U.S. Generally Accepted Accounting Principles ("GAAP"). The preparation of financial statements in accordance with GAAP requires management to make estimates and assumptions that affect the reported amounts of assets and liabilities and disclosure of contingent assets and liabilities at the date of the financial statements and the reported amounts of income and expenses for the period. Actual results could differ from those estimates. The Funds follow the specialized accounting and reporting requirements under GAAP that are applicable to investment companies under Accounting Standards Codification Topic 946.
Investment Valuation:
The Funds record investments at fair value. Fair value is defined as the price that would be received to sell an asset or paid to transfer a liability in an orderly transaction between market participants at the measurement date.
The valuation techniques described below maximize the use of observable inputs and minimize the use of unobservable inputs in determining fair value. The inputs used for valuing the Funds' investments are summarized in the three broad levels listed below:
• Level 1 — quoted prices (unadjusted) in active markets for identical securities
• Level 2 — other significant observable inputs (including quoted prices for similar securities, interest rates, or credit spreads, applicable to those securities, etc.)
84
Victory Portfolios | Notes to Financial Statements — continued December 31, 2022 | ||||||
• Level 3 — significant unobservable inputs (including the Adviser's assumptions in determining the fair value of investments)
Changes in valuation techniques may result in transfers in or out of an assigned level within the disclosure hierarchy. The inputs or methodologies used for valuation techniques are not necessarily an indication of the risk associated with entering into those investments.
The Adviser, appointed as the valuation designee by the Trust's Board of Trustees' (the "Board"), has established the Pricing and Liquidity Committee (the "Committee"), and subject to Board oversight, the Committee administers and oversees the Funds' valuation policies and procedures, which are approved by the Board.
Portfolio securities listed or traded on securities exchanges, including Exchange-Traded Funds ("ETFs"), are valued at the closing price on the exchange or system where the security is principally traded, if available, or at the Nasdaq Official Closing Price. If there have been no sales for that day on the exchange or system, then a security is valued at the last available bid quotation on the exchange or system where the security is principally traded. In each of these situations, valuations are typically categorized as Level 1 in the fair value hierarchy.
Investments in open-end investment companies, other than ETFs, are valued at their net asset value ("NAV"). These valuations are typically categorized as Level 1 in the fair value hierarchy.
Debt securities are valued each business day by a pricing service approved by the valuation designee and subject to the oversight of the Board. The pricing service uses the evaluated bid or the last sale price to value securities. Debt obligations maturing within 60 days may be valued at amortized cost, provided that the amortized cost represents the fair value of such securities. These valuations are typically categorized as Level 2 in the fair value hierarchy.
Futures contracts are valued at the settlement price established each day by the board of trade or an exchange on which they are traded. These valuations are typically categorized as Level 1 in the fair value hierarchy.
Swap agreements are valued at the mean between the current bid and ask prices. To the extent this model is utilized, these valuations are considered as Level 2 in the fair value hierarchy.
In the event that price quotations or valuations are not readily available, investments are valued at fair value in accordance with procedures established by and under the general supervision and responsibility of the Board. These valuations are typically categorized as Level 2 or Level 3 in the fair value hierarchy, based on the observability of inputs used to determine the fair value. The effect of fair value pricing is that securities may not be priced on the basis of quotations from the primary market in which they are traded and the actual price realized from the sale of a security may differ materially from the fair value price. Valuing these securities at fair value is intended to cause the Fund's NAV to be more reliable than it otherwise would be.
A summary of the valuations as of December 31, 2022, based upon the three levels defined above, is included in the table below while the breakdown, by category, of investments is disclosed on the Schedules of Portfolio Investments:
Level 1 | Level 2 | Level 3 | Total | ||||||||||||||||
INCORE Low Duration Bond Fund | |||||||||||||||||||
Asset-Backed Securities | $ | — | $ | 13,411,067 | $ | — | $ | 13,411,067 | |||||||||||
Collateralized Mortgage Obligations | — | 29,500,114 | — | 29,500,114 | |||||||||||||||
Convertible Corporate Bonds | — | 9,962,669 | — | 9,962,669 | |||||||||||||||
Convertible Preferred Stocks | 3,053,446 | — | — | 3,053,446 | |||||||||||||||
Corporate Bonds | — | 67,457,981 | — | 67,457,981 | |||||||||||||||
| Residential Mortgage-Backed Securities | — | 1,518,780 | — | 1,518,780 | |||||||||||||||
Yankee Dollars | — | 16,431,111 | — | 16,431,111 | |||||||||||||||
| U.S. Government Mortgage-Backed Agencies | — | 5,728,070 | — | 5,728,070 | |||||||||||||||
U.S. Treasury Obligations | — | 26,660,269 | — | 26,660,269 | |||||||||||||||
Collateral for Securities Loaned | 2,114,496 | — | — | 2,114,496 | |||||||||||||||
Total | $ | 5,167,942 | $ | 170,670,061 | $ | — | $ | 175,838,003 | |||||||||||
85
Victory Portfolios | Notes to Financial Statements — continued December 31, 2022 | ||||||
Level 1 | Level 2 | Level 3 | Total | ||||||||||||||||
Other Financial Investments*: | |||||||||||||||||||
Assets: | |||||||||||||||||||
Credit Default Swap | $ | — | $ | 397,087 | $ | — | $ | 397,087 | |||||||||||
Futures Contracts | 160,751 | — | — | 160,751 | |||||||||||||||
Liabilities: | |||||||||||||||||||
Futures Contracts | (62,801 | ) | — | — | (62,801 | ) | |||||||||||||
Total | $ | 97,950 | $ | 397,087 | $ | — | $ | 495,037 | |||||||||||
High Yield Fund | |||||||||||||||||||
Common Stocks | $ | 898,590 | $ | — | $ | 226,212 | $ | 1,124,802 | |||||||||||
Senior Secured Loans | — | 37,542,814 | — | 37,542,814 | |||||||||||||||
Corporate Bonds | — | 177,315,302 | — | 177,315,302 | |||||||||||||||
Yankee Dollars | — | 21,081,767 | — | 21,081,767 | |||||||||||||||
Exchange-Traded Funds | 990,324 | — | — | 990,324 | |||||||||||||||
Collateral for Securities Loaned | 24,074,536 | — | — | 24,074,536 | |||||||||||||||
Total | $ | 25,963,450 | $ | 235,939,883 | $ | 226,212 | $ | 262,129,545 | |||||||||||
Tax-Exempt Fund | |||||||||||||||||||
Municipal Bonds | $ | — | $ | 39,165,724 | $ | — | $ | 39,165,724 | |||||||||||
Total | $ | — | $ | 39,165,724 | $ | — | $ | 39,165,724 | |||||||||||
High Income Municipal Bond Fund | |||||||||||||||||||
Municipal Bonds | $ | — | $ | 37,792,446 | $ | — | $ | 37,792,446 | |||||||||||
Total | $ | — | $ | 37,792,446 | $ | — | $ | 37,792,446 | |||||||||||
Floating Rate Fund | |||||||||||||||||||
Common Stocks | $ | — | $ | — | $ | 367,660 | $ | 367,660 | |||||||||||
Warrants | — | — | ** | — | — | ** | |||||||||||||
Senior Secured Loans | — | 1,103,739,105 | — | 1,103,739,105 | |||||||||||||||
Corporate Bonds | — | 97,424,239 | — | 97,424,239 | |||||||||||||||
Yankee Dollars | — | 7,224,140 | — | 7,224,140 | |||||||||||||||
Total | $ | — | $ | 1,208,387,484 | $ | 367,660 | $ | 1,208,755,144 | |||||||||||
* Futures Contracts and Credit Default Swaps are valued at the unrealized appreciation (depreciation) on the investment.
** Zero market value security.
As of December 31, 2022, there were no transfers into/out of Level 3.
Real Estate Investment Trusts ("REITs"):
The Funds may invest in REITs, which report information on the source of their distributions annually. REITs are pooled investment vehicles that invest primarily in income-producing real estate or real-estate related loans or interests (such as mortgages). Certain distributions received from REITs during the year are recorded as realized gains or return of capital as estimated by the Funds or when such information becomes known.
Investment Companies:
Exchange-Traded Funds:
The Funds may invest in ETFs, the shares of which are bought and sold on a securities exchange. An ETF trades like common stock and represents a fixed portfolio of securities often designed to track the performance and dividend yield of a particular domestic of foreign market index. The Funds may purchase shares of ETFs for a variety of purposes, including in connection with pursuing their investment programs to temporarily gain exposure to a portion of the U.S. or a foreign market, and for cash management and other purposes. The risks of owning an ETF generally reflect the risks of owning
86
Victory Portfolios | Notes to Financial Statements — continued December 31, 2022 | ||||||
the underlying securities they are designed to track, although the lack of liquidity of an ETF could result in it being more volatile. Additionally, ETFs have fees and expenses that reduce their value.
Open-End Funds:
The Funds may invest in portfolios of open-end investment companies. These investment companies value securities in their portfolios for which market quotations are readily available at their market values (generally the last reported sale price) and all other securities and assets at their fair value by the methods established by the board of directors of the underlying funds.
Municipal Obligations:
The values of municipal obligations can fluctuate and may be affected by adverse tax, legislative, or political changes, and by financial developments affecting municipal issuers. Payment of municipal obligations may depend on a relatively limited source of revenue, resulting in greater credit risk. Future changes in federal tax laws or the activity of an issuer may adversely affect the tax-exempt status of municipal obligations.
Mortgage- and Asset-Backed Securities:
The values of some mortgage-related or asset-backed securities may be particularly sensitive to changes in prevailing interest rates. Early repayment of principal on some mortgage-related securities may expose the Funds to a lower rate of return upon reinvestment of principal. The values of mortgage- and asset-backed securities depend in part on the credit quality and adequacy of the underlying assets or collateral and may fluctuate in response to the market's perception of these factors as well as current and future repayment rates. Some mortgage-backed securities are backed by the full faith and credit of the U.S. government (e.g., mortgage-backed securities issued by the Government National Mortgage Association, commonly known as "Ginnie Mae"), while other mortgage-backed securities (e.g., mortgage-backed securities issued by the Federal National Mortgage Association and the Federal Home Loan Mortgage Corporation, commonly known as "Fannie Mae" and "Freddie Mac," respectively), are backed only by the credit of the government entity issuing them. In addition, some mortgage-backed securities are issued by private entities and, as such, are not guaranteed by the U.S. government or any agency or instrumentality of the U.S. government.
Loans:
Floating rate loans in which a Fund invests are primarily "senior" loans. Senior floating rate loans typically hold a senior position in the capital structures of the borrower, are typically secured by specific collateral, and have a claim on the assets and/or stock of the borrower that is senior to that held by subordinated debtholders and stockholders of the borrower. While these protections may reduce risk, these investments still present significant credit risk. A significant portion of a Fund's floating rate investments may be issued in connection with highly leveraged transactions such as leveraged buyouts, leveraged recapitalization loans, and other types of acquisition financing. Obligations in these types of transactions are subject to greater credit risk (including default and bankruptcy) than many other investments and may be, or become, illiquid. See the note below regarding below investment grade securities.
The Funds may purchase second-lien loans (secured loans with a claim on collateral subordinate to a senior lender's claim on such collateral), fixed rate loans, unsecured loans, and other debt obligations.
Transactions in loans often settle on a delayed basis, and a Fund may not receive the proceeds from the sale of a loan or pay for a loan purchase for a substantial period of time after entering into the transactions.
Below-Investment-Grade Securities:
Certain Funds may invest in below-investment-grade securities (i.e., lower-quality, "junk" debt), which are subject to various risks. Lower-quality debt is considered to be speculative because it is less certain that the issuer will be able to pay interest or repay the principal than in the case of investment-grade debt. These securities can involve a substantially greater risk of default than higher-rated securities,
87
Victory Portfolios | Notes to Financial Statements — continued December 31, 2022 | ||||||
and their values can decline significantly over short periods of time. Lower-quality debt securities tend to be more sensitive to adverse news about their issuers, the market and the economy in general, than higher-quality debt securities. The market for these securities can be less liquid, especially during periods of recession or general market decline.
Derivative Instruments:
Futures Contracts:
The Funds may enter into contracts for the future delivery of securities or foreign currencies and futures contracts based on a specific security, class of securities, foreign currency or an index, and purchase or sell options on any such futures contracts. A futures contract on a securities index is an agreement obligating either party to pay, and entitling the other party to receive, while the contract is outstanding, cash payments based on the level of a specified securities index. No physical delivery of the underlying asset is made. The Funds may enter into futures contracts in an effort to hedge against market risks. The acquisition of put and call options on futures contracts will give the Funds the right (but not the obligation), for a specified price, to sell or to purchase the underlying futures contract, upon exercise of the option, at any time during the option period. Futures transactions involve brokerage costs and require the Funds to segregate assets to cover contracts that would require it to purchase securities or currencies. A good faith margin deposit, known as initial margin, of cash or government securities with a broker or custodian is required to initiate and maintain open positions in futures contracts. Subsequent payments, known as variation margin, are made or received by the Funds based on the change in the market value of the position and are recorded as unrealized appreciation or depreciation until the contract is closed out, at which time the gain or loss is realized. The Funds may lose the expected benefit of futures transactions if interest rates, exchange rates or securities prices change in an unanticipated manner. Such unanticipated changes may also result in lower overall performance than if the Funds had not entered into any futures transactions. In addition, the value of the Funds' futures positions may not prove to be perfectly or even highly correlated with the value of its portfolio securities or foreign currencies, limiting the Funds' ability to hedge effectively against interest rate, exchange rate and/or market risk and giving rise to additional risks. There is no assurance of liquidity in the secondary market for purposes of closing out futures positions. The collateral held by the Funds is reflected on the Statements of Assets and Liabilities under Deposit with broker for futures contracts.
Management has determined that no offsetting requirements exist as a result of their conclusion that the Funds are not subject to master netting agreements for futures contracts.
During the year December 31, 2022, the Funds entered into futures contracts primarily for the strategy of hedging or other purposes, including but not limited to, providing liquidity and equitizing cash.
Credit Derivatives:
The Funds may enter into credit derivatives, including centrally cleared credit default swaps on individual obligations or credit indices. The Funds may use these investments (i) as alternatives to direct long or short investment in a particular security or securities, (ii) to adjust the Funds' asset allocations or risk exposures, or (iii) for hedging purposes. The use by the Funds of centrally cleared credit default swaps may have the effect of creating a short position in a security. Credit derivatives can create investment leverage and may create additional investment risks that may subject the Funds to greater volatility than investments in more traditional securities, as described in the Funds' Statements of Additional Information.
Centrally cleared credit default swap ("CDS") agreements on credit indices involve one party making a stream of payments (referred to as the buyer of protection) to another party (the seller of protection) in exchange for the right to receive a specified return in the event of a write-down, principal shortfall, interest shortfall or default of all or part of the referenced entities comprising the credit index. A credit index is a basket of credit instruments or exposures designed to be representative of a specific sector of the credit market as a whole. These indices are made up of reference credits that are judged by a poll of dealers to be the most liquid entities in the CDS.
88
Victory Portfolios | Notes to Financial Statements — continued December 31, 2022 | ||||||
The counterparty risk for cleared swap agreements is generally lower than uncleared over-the-counter swap agreements because generally a clearing organization becomes substituted for each counterparty to a centrally cleared swap agreement and, in effect, guarantees each party's performance under the contract as each party to a trade looks only to the clearing organization for performance of financial obligations. However, there can be no assurance that the clearing organization, or its members, will satisfy its obligations to the Fund.
The Funds may enter into CDS agreements either as a buyer or seller. The Funds may buy protection under a CDS to attempt to mitigate the risk of default or credit quality deterioration in one or more individual holdings or in a segment of the fixed income securities market. The Funds may sell protection under a CDS in an attempt to gain exposure to an underlying issuer's credit quality characteristics without investing directly in that issuer.
For swaps entered with an individual counterparty, the Funds bear the risk of loss of the uncollateralized amount expected to be received under a CDS agreement in the event of the default or bankruptcy of the counterparty. CDS agreements are generally valued at a price at which the counterparty to such agreement would terminate the agreement. The Funds may also enter into centrally cleared swaps.
Upon entering into a cleared CDS, the Funds may be required to deposit with the broker an amount of cash or cash equivalents in the range of approximately 3% to 6% of the notional amount for CDS on high yield debt issuers (this amount is subject to change by the clearing organization that clears the trade). This amount, known as "initial margin," is in the nature of a performance bond or good faith deposit on the CDS and is returned to a Fund upon termination of the CDS, assuming all contractual obligations have been satisfied. Subsequent payments, known as "variation margin," to and from the broker will be made daily as the price of the CDS fluctuates, making the long and short positions in the CDS contract more or less valuable, a process known as "marking-to-market". The premium (discount) payments are built into the daily price of the CDS and thus are amortized through the variation margin. The variation margin payment also includes the daily portion of the periodic payment stream.
The maximum potential amount of future payments (undiscounted) that the Funds as a seller of protection could be required to make under a CDS agreement equals the notional amount of the agreement. Notional amounts of each individual CDS agreement outstanding as of year end for which the Funds are the sellers of protection are disclosed on the Schedules of Portfolio Investments. These potential amounts would be partially offset by any recovery values of the respective referenced obligations, upfront payments received upon entering into the agreement, periodic interest payments, or net amounts received from the settlement of buy protection CDS agreements entered into by the Funds for the same referenced entity or entities. The collateral held by the Funds is reflected on the Statements of Assets and Liabilities under Deposit with broker for swap agreements.
Management has determined that no offsetting requirements exist as a result of their conclusion that the Funds are not subject to master netting agreements for swaps contracts. The INCORE Low Duration Bond Fund entered into centrally cleared CDS agreements primarily for the strategy of asset allocation and risk exposure management during the period.
Summary of Derivative Instruments:
The following table summarizes the fair values of derivative instruments on the Statements of Assets and Liabilities, categorized by risk exposure, as of December 31, 2022:
Assets | Liabilities | ||||||||||||||
| Variation Margin Receivable on Open Futures Contracts* | Variation Margin Receivable on Open Swap Agreements* | Variation Margin Payable on Open Futures Contracts* | |||||||||||||
Equity Risk Exposure: | |||||||||||||||
| INCORE Low Duration Bond Fund | $ | 109,916 | $ | — | $ | — | |||||||||
Currency Risk Exposure: | |||||||||||||||
| INCORE Low Duration Bond Fund | 23,479 | — | 62,801 | ||||||||||||
89
Victory Portfolios | Notes to Financial Statements — continued December 31, 2022 | ||||||
Assets | Liabilities | ||||||||||||||
| Variation Margin Receivable on Open Futures Contracts* | Variation Margin Receivable on Open Swap Agreements* | Variation Margin Payable on Open Futures Contracts* | |||||||||||||
Interest Rate Risk Exposure: | |||||||||||||||
| INCORE Low Duration Bond Fund | $ | 27,356 | $ | — | $ | — | |||||||||
Credit Risk Exposure: | |||||||||||||||
| INCORE Low Duration Bond Fund | — | 397,087 | — | ||||||||||||
* Includes cumulative appreciation (depreciation) of futures contracts and swap agreements as reported on the Schedules of Portfolio Investments. Only current day's variation margin for both futures contracts and swap agreements are reported within the Statements of Assets and Liabilities.
The following table presents the effect of derivative instruments on the Statements of Operations, categorized by risk exposure, for the year ended December 31, 2022.
| Net Realized Gains (Losses) on Derivatives Recognized as a Result from Operations | Net Change in Unrealized Appreciation/Depreciation on Derivatives Recognized as a Result of Operations | ||||||||||||||||||
| Net Realized Gains (Losses) from Futures Contracts | Net Realized Gains (Losses) from Swap Agreements | Net Change in Unrealized Appreciation/ Depreciation on Futures Contracts | Net Change in Unrealized Appreciation/ Depreciation on Swap Agreements | ||||||||||||||||
Equity Risk Exposure: | |||||||||||||||||||
INCORE Low Duration Bond Fund | $ | 356,915 | $ | — | $ | 109,916 | $ | — | |||||||||||
Currency Risk Exposure: | |||||||||||||||||||
INCORE Low Duration Bond Fund | 866,778 | — | (59,602 | ) | — | ||||||||||||||
Interest Rate Risk Exposure: | |||||||||||||||||||
INCORE Low Duration Bond Fund | 674,896 | — | 51,939 | — | |||||||||||||||
Credit Risk Exposure: | |||||||||||||||||||
INCORE Low Duration Bond Fund | — | (272,851 | ) | — | 355,576 | ||||||||||||||
All open derivative positions at period end are reflected on each respective Fund's Schedule of Portfolio Investments. The volume associated with derivative positions in the INCORE Low Duration Bond Fund was 4% and 4% for futures contracts and swap agreements, respectively, based on average monthly notional amounts in comparison to net assets during the year.
Investment Transactions and Related Income:
Changes in holdings of investments are accounted for no later than one business day following the trade date. For financial reporting purposes, however, investment transactions are accounted for on trade date or the last business day of the reporting period. Interest income is determined on the basis of coupon interest accrued using the effective interest method which adjusts, where applicable, the amortization of premiums or accretion of discounts. Dividend income is recorded on the ex-dividend date. Gains or losses realized on sales of securities are recorded on the identified cost basis. Paydown gains or losses on applicable securities, if any, are recorded as components of Interest income on the Statements of Operations.
The Funds may receive other income from investments in loan assignments and/or unfunded commitments, including amendment fees, consent fees, and commitment fees. These fees are recorded as income when received. These amounts, if received, are included in Interest income on the Statements of Operations.
90
Victory Portfolios | Notes to Financial Statements — continued December 31, 2022 | ||||||
Securities Lending:
The Funds, through a Securities Lending Agreement with Citibank, N.A. ("Citibank"), may lend their securities to qualified financial institutions, such as certain broker-dealers and banks, to earn additional income, net of income retained by Citibank. Borrowers are required to initially secure their loans for collateral in the amount of at least 102% of the value of U.S. securities loaned or at least 105% of the value of non-U.S. securities loaned, marked-to-market daily. Any collateral shortfalls associated with increases in the valuation of the securities loaned are generally cured the next business day. The collateral can be received in the form of cash collateral and/or non-cash collateral. Non-cash collateral can include U.S. Government Securities and other securities as permitted by Securities and Exchange Commission ("SEC") guidelines. The cash collateral is invested in short-term instruments or cash equivalents, primarily open-end investment companies, as noted on the Funds' Schedules of Portfolio Investments. The Funds effectively do not have control of the non-cash collateral and therefore it is not disclosed on the Funds' Schedules of Portfolio Investments. Collateral requirements are determined daily based on the value of the Funds' securities on loan as of the end of the prior business day. During the time portfolio securities are on loan, the borrower will pay the Funds any dividends or interest paid on such securities plus any fee negotiated between the parties to the lending agreement. The Funds also earn a return from the collateral. The Funds pay Citibank various fees in connection with the investment of cash collateral and fees based on the investment income received from securities lending activities. Securities lending income (net of these fees) is disclosed on the Statements of Operations. Loans are terminable upon demand and the borrower must return the loaned securities within the lesser of one standard settlement period or five business days. Although risk is mitigated by the collateral, a Fund could experience a delay in recovering its securities and possible loss of income or value if the borrower fails to return them. In addition, there is a risk that the value of the short-term investments will be less than the amount of cash collateral required to be returned to the borrower.
The Funds' agreement with Citibank does not include master netting provisions. Non-cash collateral received by the Funds may not be sold or repledged, except to satisfy borrower default.
The following table is a summary of the Funds' securities lending transactions as of December 31, 2022.
| Value of Securities on Loan | Non-Cash Collateral | Cash Collateral | |||||||||||||
INCORE Low Duration Bond Fund | $ | 2,073,844 | $ | — | $ | 2,114,496 | |||||||||
High Yield Fund | 23,078,966 | — | 24,074,536 | ||||||||||||
Federal Income Taxes:
Each Fund intends to continue to qualify as a regulated investment company by complying with the provisions available to certain investment companies, as defined in applicable sections of the Internal Revenue Code, and to make distributions of net investment income and net realized gains sufficient to relieve it from all, or substantially all, federal income taxes. Accordingly, no provision for federal income taxes is required in the financial statements. The Funds have a tax year end of December 31.
For the year ended December 31, 2022, the Funds did not incur any income tax, interest, or penalties, and have recorded no liability for net unrecognized tax benefits relating to uncertain tax positions.
Management of the Funds has reviewed tax positions taken in tax years that remain subject to examination by all major tax jurisdictions, including federal (i.e., the last four tax years, which includes the current fiscal tax year end). Management believes that there is no tax liability resulting from unrecognized tax benefits related to uncertain tax positions taken.
Allocations:
Expenses directly attributable to a Fund are charged to that Fund, while expenses that are attributable to more than one fund in the Trust, or jointly with an affiliated trust, are allocated among the respective funds in the Trust and/or an affiliated trust based upon net assets or another appropriate basis.
91
Victory Portfolios | Notes to Financial Statements — continued December 31, 2022 | ||||||
Income, expenses (other than class-specific expenses such as transfer agent fees, state registration fees, printing fees, and 12b-1 fees), and realized and unrealized gains or losses on investments are allocated to each class of shares based on its relative net assets on the date income is earned or expenses and realized and unrealized gains and losses are incurred.
Cross-Trade Transactions:
Pursuant to Rule 17a-7 under the 1940 Act, the Funds may engage in securities transactions with affiliated investment companies and advisory accounts managed by the Adviser and any applicable sub-adviser under specified conditions outlined in the valuation policies and procedures adopted by the Board. In addition, as defined under the valuation policies and procedures, each transaction must be effected at the independent current market price. For the year ended December 31, 2022, the Funds below engaged in the following securities transactions with affiliated funds, which resulted in the following net realized gains (losses):
Purchases | Sales | Net Realized Gains (Losses) | |||||||||||||
Tax-Exempt Fund | $ | 3,100,000 | $ | 6,250,000 | $ | — | |||||||||
High Income Municipal Bond Fund | 6,250,000 | 3,100,000 | — | ||||||||||||
3. Purchases and Sales:
Purchases and sales of securities (excluding securities maturing less than one year from acquisition) for the year ended December 31, 2022, were as follows:
| Excluding U.S. Government Securities | U.S. Government Securities | ||||||||||||||||||
Purchases | Sales | Purchases | Sales | ||||||||||||||||
INCORE Low Duration Bond Fund | $ | 52,484,028 | $ | 75,002,307 | $ | 102,588,394 | $ | 84,039,378 | |||||||||||
High Yield Fund | 135,555,600 | 154,482,046 | — | — | |||||||||||||||
Tax-Exempt Fund | 5,847,349 | 8,138,817 | — | — | |||||||||||||||
| High Income Municipal Bond Fund | 9,694,326 | 10,625,428 | — | — | |||||||||||||||
| Floating Rate Fund | 668,379,437 | 1,342,538,179 | — | — | |||||||||||||||
4. Fees and Transactions with Affiliates and Related Parties:
Investment Advisory Fees:
Investment advisory services are provided to the Funds by the Adviser, which is a New York corporation registered as an investment adviser with the SEC.
VCM has entered into a Sub-Advisory Agreement with Park Avenue Institutional Advisers LLC ("Park Avenue"). Park Avenue is responsible for providing day-to-day investment advisory services to the High Yield Fund and the Floating Rate Fund, subject to the oversight of the Board.
Under the terms of the Investment Advisory Agreement, the Adviser is entitled to receive fees based on a percentage of the average daily net assets of each Fund. The rates at which the Adviser is paid by each Fund are included in the table below.
Flat Rate | |||||||
INCORE Low Duration Bond Fund | 0.45 | % | |||||
High Yield Fund | 0.60 | % | |||||
Tax-Exempt Fund | 0.50 | % | |||||
High Income Municipal Bond Fund | 0.50 | % | |||||
Floating Rate Fund | 0.65 | % | |||||
92
Victory Portfolios | Notes to Financial Statements — continued December 31, 2022 | ||||||
Amounts incurred and paid to VCM for the year ended December 31, 2022, are reflected on the Statements of Operations as Investment advisory fees.
Administration and Servicing Fees:
VCM also serves as the Funds' administrator and fund accountant. Under the Administration and Fund Accounting Agreement, VCM is entitled to receive fees based on a percentage of the average daily net assets of the Trust, Victory Variable Insurance Funds and Victory Portfolios II. The tiered rates at which VCM is paid by the Funds are shown in the table below:
| Net Assets | |||||||||||
Up to $15 billion | $15 billion – $30 billion | Over $30 billion | |||||||||
0.08 | %, plus | 0.05 | %, plus | 0.04 | % | ||||||
Amounts incurred for the year ended December 31, 2022, are reflected on the Statements of Operations as Administration fees.
Citi Fund Services Ohio, Inc. ("Citi"), an affiliate of Citibank, acts as sub-administrator and sub-fund accountant to the Funds pursuant to the Sub-Administration and Sub-Fund Accounting Services Agreement between VCM and Citi. VCM pays Citi a fee for providing these services. The Funds reimburse VCM and Citi for out-of-pocket expenses incurred in providing these services and certain other expenses specifically allocated to the Funds. Amounts incurred for the year ended December 31, 2022, are reflected on the Statements of Operations as Sub-Administration fees.
The Funds (as part of the Trust) have entered into an agreement with the Adviser to provide compliance services, pursuant to which the Adviser furnishes its compliance personnel, including the services of the Chief Compliance Officer ("CCO"), and other resources reasonably necessary to provide the Trust with compliance oversight services related to the design, administration, and oversight of a compliance program for the Trust in accordance with Rule 38a-1 under the 1940 Act. The CCO is an employee of the Adviser, which pays the compensation of the CCO and support staff. The funds in the Trust, Victory Variable Insurance Funds, Victory Portfolios II and USAA Mutual Funds (collectively, the "Victory Funds Complex"), in aggregate, compensate the Adviser for these services. Amounts incurred for the year ended December 31, 2022, are reflected on the Statements of Operations as Compliance fees.
Transfer Agency Fees:
FIS Investor Services, LLC ("FIS") serves as the Funds' transfer agent. Under the Transfer Agent Agreement, the Trust pays FIS a fee for its services and reimburses FIS for all of their reasonable out-of-pocket expenses incurred in providing these services. Amounts incurred for the year ended December 31, 2022, are reflected on the Statements of Operations as Transfer agent fees.
Victory Capital Transfer Agency, Inc., an affiliate of the Adviser, serves as sub-transfer agent for the Member Class. Amounts incurred for the year ended December 31, 2022, are reflected on the Statements of Operations as Transfer agent fees.
Distributor/Underwriting Services:
Victory Capital Services, Inc. (the "Distributor"), an affiliate of the Adviser, serves as Distributor for the continuous offering of the shares of the Funds pursuant to a Distribution Agreement between the Distributor and the Trust.
Pursuant to the Distribution and Service Plans adopted in accordance with Rule 12b-1 under the 1940 Act, the Distributor may receive a monthly distribution and service fee up to the annual rate shown in the table below:
Class A | Class C | Class R | |||||||||||||
INCORE Low Duration Bond Fund | 0.25 | % | 1.00 | % | 0.50 | % | |||||||||
High Yield Fund | 0.25 | % | 1.00 | % | 0.50 | % | |||||||||
Tax-Exempt Fund | 0.25 | % | 1.00 | % | N/A | ||||||||||
High Income Municipal Bond Fund | 0.25 | % | 1.00 | % | N/A | ||||||||||
Floating Rate Fund | 0.25 | % | 1.00 | % | 0.50 | % | |||||||||
93
Victory Portfolios | Notes to Financial Statements — continued December 31, 2022 | ||||||
The distribution and service fees paid to the Distributor may be used by the Distributor to pay for activities primarily intended to result in the sale of Class A, Class C, and Class R. Amounts incurred for the year ended December 31, 2022, are reflected on the Statements of Operations as 12b-1 fees.
In addition, the Distributor is entitled to receive commissions in connection with sales of the Class A. For the year ended December 31, 2022, the Distributor received $12,028 from commissions earned in connection with sales of Class A.
Other Fees:
Citibank serves as the Funds' custodian. The Funds pay Citibank a fee for providing these services. Amounts incurred for the year ended December 31, 2022, are reflected on the Statements of Operations as Custodian fees.
Sidley Austin LLP provides legal services to the Trust.
The Adviser has entered into expense limitation agreements with the Funds. Under the terms of the agreements, the Adviser has agreed to waive fees or reimburse certain expenses to the extent that ordinary operating expenses incurred by certain classes of a Fund in any fiscal year exceed the expense limit for such classes of the Fund. Such excess amounts will be the liability of the Adviser. Acquired fund fees and expenses, interest, taxes, brokerage commissions, other expenditures which are capitalized in accordance with GAAP, and other extraordinary expenses not incurred in the ordinary course of the Fund's business are excluded from the expense limits. As of December 31, 2022, the expense limits (excluding voluntary waivers) are as follows:
In effect until April 30, 2023 | |||||||||||||||||||||||
Class A | Class C | Class R | Class Y | Member Class | |||||||||||||||||||
INCORE Low Duration Bond Fund | 0.85 | % | 1.62 | % | 1.27 | % | 0.62 | % | N/A | ||||||||||||||
High Yield Fund | 1.00 | % | 1.70 | % | 1.35 | % | 0.76 | % | N/A | ||||||||||||||
Tax-Exempt Fund | 0.80 | % | 1.60 | % | N/A | 0.69 | % | N/A | |||||||||||||||
High Income Municipal Bond Fund | 0.80 | % | 1.57 | % | N/A | 0.57 | % | 0.65 | % | ||||||||||||||
Floating Rate Fund | 1.00 | % | 1.80 | % | 1.56 | % | 0.78 | % | 0.85 | % | |||||||||||||
Under the terms of the expense limitation agreements, the Funds have agreed to repay fees and expenses that were waived or reimbursed by the Adviser for a period of up to three years (thirty-six (36) months) after the waiver or reimbursement took place, subject to the lesser of any operating expense limits in effect at the time of: (a) the original waiver or expense reimbursement; or (b) the recoupment, after giving effect to the recoupment amount.
As of December 31, 2022, the following amounts are available to be repaid to the Adviser. The Funds have not recorded any amounts available to be repaid as a liability due to an assessment that such repayments are not probable at December 31, 2022.
| Expires 2023 | Expires 2024 | Expires 2025 | Total | ||||||||||||||||
INCORE Low Duration Bond Fund | $ | 129,476 | $ | 97,075 | $ | 88,131 | $ | 314,682 | |||||||||||
High Yield Fund | 253,784 | 221,331 | 261,892 | 737,007 | |||||||||||||||
Tax-Exempt Fund | 135,204 | 131,110 | 125,945 | 392,259 | |||||||||||||||
High Income Municipal Bond Fund | 131,713 | 156,099 | 142,621 | 430,433 | |||||||||||||||
Floating Rate Fund | 812,408 | 1,454,748 | 1,383,846 | 3,651,002 | |||||||||||||||
The Adviser may voluntarily waive or reimburse additional fees to assist the Funds in maintaining competitive expense ratios. Voluntary waivers and reimbursements applicable to the Funds are not available to be recouped at a future time.
INCORE Low Duration Bond Fund | $ | 60,003 | |||||
Certain officers and/or interested trustees of the Funds are also officers and/or employees of the Adviser, administrator, fund accountant, sub-administrator, sub-fund accountant, custodian, legal counsel, and Distributor.
94
Victory Portfolios | Notes to Financial Statements — continued December 31, 2022 | ||||||
5. Risks:
The Funds may be subject to other risks in addition to these identified risks.
Debt Securities Risk — The value of a debt security or other income-producing security changes in response to various factors, including, for example, market-related factors (such as changes in interest rates or changes in the risk appetite of investors generally) and changes in the actual or perceived ability of the issuer (or of issuers generally) to meet its (or their) obligations. Other factors that may affect the value of debt securities, include, among others, public health crises and responses by governments and companies to such crises. These and other events may affect the creditworthiness of the issuer of a debt security and may impair an issuer's ability to timely meet its debt obligations as they come due.
Credit Risk — The Funds will be subject to credit risk with respect to the amount each expects to receive from counterparties for financial instruments entered into by the Funds. The Funds may be negatively impacted if a counterparty becomes bankrupt or otherwise fails to perform its obligations due to financial difficulties. The Funds may experience significant delays in obtaining any recovery in bankruptcy or other reorganization proceeding and the Funds may obtain only limited recovery or may obtain no recovery in such circumstances. The Funds typically enter into transactions with counterparties whose credit ratings are investment grade, as determined by a nationally recognized statistical rating organization or, if unrated, judged by the Adviser to be of comparable quality.
Derivatives Risk — The use of derivative instruments, such as futures contracts and credit default swaps, exposes the Funds to additional risks and transaction costs. Risks of derivative instruments include: (1) the risk that interest rates, securities prices, asset values, and currency markets will not move in the direction that a portfolio manager anticipates; (2) imperfect correlation between the price of derivative instruments and movements in the prices of the securities, assets, interest rates or currencies being hedged; (3) the fact that skills needed to use these strategies are different than those needed to select portfolio securities; (4) the possible absence of a liquid secondary market for any particular instrument and possible exchange imposed price fluctuation limits, either of which may make it difficult or impossible to close out a position when desired; (5) the risk that adverse price movements in an instrument can result in a loss substantially greater than the Funds' initial investment in that instrument (in some cases, the potential loss is unlimited); (6) particularly in the case of privately-negotiated instruments, the risk that the counterparty will not perform its obligations, which could leave the Funds worse off than if it had not entered into the position; and (7) the inability to close out certain hedged positions to avoid adverse tax consequences.
LIBOR Discontinuation Risk — The London Interbank Offered Rate ("LIBOR") discontinuation may adversely affect the financial markets generally and the Funds' operations, finances and investments specifically. LIBOR has been the principal floating-rate benchmark in the financial markets. However, LIBOR has been or will be discontinued as a floating rate benchmark. The date of discontinuation depends on the LIBOR currency and tenor. With limited exceptions, no new LIBOR obligations will be entered into after December 31, 2021. Existing LIBOR obligations have transitioned or will transition to another benchmark, depending on the LIBOR currency and tenor. For some existing LIBOR-based obligations, the contractual consequences of the discontinuation of LIBOR may not be clear.
Non-LIBOR floating-rate obligations, including Secured Overnight Financing Rate ("SOFR")-based obligations, may have returns and values that fluctuate more than those of floating-rate debt obligations that are based on LIBOR or other rates. Also, because SOFR and some alternative floating rates are relatively new market indexes, markets for certain non-LIBOR obligations may never develop or may not be liquid. Market terms for non-LIBOR floating rate obligations, such as the spread over the index reflected in interest-rate provisions, may evolve over time, and prices of non-LIBOR floating rate obligations may be different depending on when they are issued and changing views about correct spread levels.
Various SOFR-based rates, including SOFR-based term rates, and various non-SOFR-based rates are expected to develop in response to the discontinuation of U.S. dollar LIBOR, which may create various risks for the Funds and the financial markets more generally. There are non-LIBOR forward-looking floating rates that are not based on SOFR and that may be considered by participants in the financial
95
Victory Portfolios | Notes to Financial Statements — continued December 31, 2022 | ||||||
markets as LIBOR alternatives. Such rates include AMERIBOR (American Interbank Offered Rate), BSBY (Bloomberg Short-Term Bank Yield Index) and BYI (Bank Yield Index). Unlike forward-looking SOFR-based term rates, such rates are intended to reflect a bank credit spread component.
It is not clear how replacement rates for LIBOR — including SOFR-based rates and non-SOFR-based rates — will develop and to what extent they will be used. There is no assurance that these replacement rates will be suitable substitutes for LIBOR, and thus the substitution of such rates for LIBOR could have an adverse effect on the Funds and the financial markets more generally. Concerns about market depth and stability could affect the development of non-SOFR-based term rates, and such rates may create various risks, which may or may not be similar to the risks relating to SOFR.
Market Risk — Overall market risks may affect the value of the Funds. Domestic and international factors such as political events, war, terrorism, trade disputes, inflation rates, interest rate levels and other fiscal and monetary policy changes, cybersecurity incidents, pandemics and other public health crises, sanctions against a particular foreign country, its nationals, businesses or industries and related geopolitical events, as well as environmental disasters such as earthquakes, fires, and floods or other catastrophes, may add to instability in global economies and markets generally, and may lead to increased market volatility. Global economies and financial markets are highly interconnected, which increases the possibility that conditions in one country or region might adversely affect issuers in another country or region. The impact of these and other factors may be short-term or may last for extended periods.
6. Borrowing and Interfund Lending:
Line of Credit:
The Victory Funds Complex participates in a short-term demand note "Line of Credit" agreement with Citibank. The Line of Credit agreement with Citibank was renewed on June 27, 2022, with a termination date of June 26, 2023. Under the agreement with Citibank, the Victory Funds Complex may borrow up to $600 million, of which $300 million is committed and $300 million is uncommitted. $40 million of the Line of Credit is reserved for use by the Floating Rate Fund, another series of the Victory Funds Complex, with Floating Rate Fund paying the related commitment fees for that amount. The purpose of the Line of Credit is to meet temporary or emergency cash needs. For the year ended December 31, 2022, Citibank received an annual commitment fee of 0.15% on $300 million for providing the Line of Credit. Each fund in the Victory Funds Complex paid a pro-rata portion of the commitment fees plus any interest on amounts borrowed. For the period from January 1, 2022, through June 27, 2022, interest was based on the one-month LIBOR plus one percent. Effective with the renewal, for the period from June 28,2022, through December 31, 2022, interest was based on the one-month SOFR plus 1.10 percent. The Funds did not experience a material financial impact transitioning from LIBOR to SOFR. Interest charged to each Fund during the period, if applicable, is reflected on the Statements of Operations under Line of credit fees.
The Funds had no borrowings under the Line of Credit agreement during the year ended December 31, 2022.
Interfund Lending:
The Trust and the Adviser rely on an exemptive order granted by the SEC in March 2017 (the "Order"), permitting the establishment and operation of an Interfund Lending Facility (the "Facility"). The Facility allows each Fund to directly lend and borrow money to or from any other fund in the Victory Funds Complex that is permitted to participate in the Facility, relying upon the Order at rates beneficial to both the borrowing and lending funds. Advances under the Facility are allowed for temporary or emergency purposes, including the meeting of redemption requests that otherwise might require the untimely disposition of securities, and are subject to each Fund's borrowing restrictions. The interfund loan rate is determined, as specified in the Order, by averaging the current repurchase agreement rate and the current bank loan rate. As a Borrower, interest charged to each Fund, if any, during the period, is reflected on the Statements of Operations under Interfund lending fees. As a Lender, interest earned by each Fund, if any, during the period, is reflected on the Statements of Operations under Interfund lending.
96
Victory Portfolios | Notes to Financial Statements — continued December 31, 2022 | ||||||
The average borrowing or lending for the days outstanding and average interest rate for the Funds that utilized this Facility during the year ended December 31, 2022, were as follows:
| Borrower or Lender | Amount Outstanding at December 31, 2022 | Average Borrowing* | Days Borrowing Outstanding | Average Interest Rate* | Maximum Borrowing During the Period | ||||||||||||||||||||||
| INCORE Low Duration Bond Fund | Borrower | $ | — | $ | 716,000 | 3 | 4.32 | % | $ | 716,000 | |||||||||||||||||
High Yield Fund | Borrower | — | 1,096,000 | 1 | 4.59 | % | 1,096,000 | ||||||||||||||||||||
Tax-Exempt Fund | Borrower | 2,866,000 | 2,866,000 | 4 | 4.84 | % | 2,866,000 | ||||||||||||||||||||
| High Income Municipal Bond Fund | Borrower | — | 1,043,000 | 1 | 4.34 | % | 1,043,000 | ||||||||||||||||||||
Floating Rate Fund | Borrower | — | 19,477,681 | 94 | 3.27 | % | 65,250,000 | ||||||||||||||||||||
* For the year ended December 31, 2022, based on the number of days borrowings were outstanding.
7. Federal Income Tax Information:
Dividends from net investment income, if any, are declared and paid as noted in the table below. Distributable net realized gains, if any, are declared and distributed at least annually from each Fund.
Declared | Paid | ||||||||||
INCORE Low Duration Bond Fund | Monthly | Monthly | |||||||||
High Yield Fund | Monthly | Monthly | |||||||||
Tax-Exempt Fund | Monthly | Monthly | |||||||||
High Income Municipal Bond Fund | Monthly | Monthly | |||||||||
Floating Rate Fund | Monthly | Monthly | |||||||||
The amounts of dividends from net investment income and distributions from net realized gains (collectively, distributions to shareholders) are determined in accordance with federal income tax regulations, which may differ from GAAP. To the extent these "book/tax" differences are permanent in nature (e.g., net operating loss and distribution reclassification), such amounts are reclassified within the components of net assets based on their federal tax-basis treatment; temporary differences (e.g., wash sales) do not require reclassification. To the extent dividends and distributions exceed net investment income and net realized gains for tax purposes, they are reported as distributions of capital. Net investment losses incurred by the Funds may be reclassified as an offset to capital on the accompanying Statements of Assets and Liabilities.
As of December 31, 2022, on the Statements of Assets and Liabilities, as a result of permanent book-to-tax differences, reclassification adjustments were as follows:
| Total Accumulated Earnings/(Loss) | Capital | ||||||||||
INCORE Low Duration Bond Fund | $ | 1,869 | $ | (1,869 | ) | ||||||
The tax character of distributions paid during the tax years ended, as noted below, were as follows (total distributions paid may differ from the Statements of Changes in Net Assets because, for tax purposes, dividends are recognized when actually paid).
97
Victory Portfolios | Notes to Financial Statements — continued December 31, 2022 | ||||||
| Year Ended December 31, 2022 | ||||||||||||||||||||||
Distributions Paid From: | |||||||||||||||||||||||
Ordinary Income | Net Long-Term Capital Gains | Total Taxable Distributions | Tax-Exempt Distributions | Total Distributions Paid | |||||||||||||||||||
INCORE Low Duration Bond Fund | $ | 3,288,707 | $ | — | $ | 3,288,707 | $ | — | $ | 3,288,707 | |||||||||||||
High Yield Fund | 20,544,658 | — | 20,544,658 | — | 20,544,658 | ||||||||||||||||||
Tax-Exempt Fund | 1,379 | 306,762 | 308,141 | 1,694,609 | 2,002,750 | ||||||||||||||||||
High Income Municipal Bond Fund | 24,902 | 101,138 | 126,040 | 1,879,177 | 2,005,217 | ||||||||||||||||||
Floating Rate Fund | 109,598,335 | — | 109,598,335 | — | 109,598,335 | ||||||||||||||||||
Year Ended December 31, 2021 | |||||||||||||||||||||||
Distributions Paid From: | |||||||||||||||||||||||
Ordinary Income | Net Long-Term Capital Gains | Total Taxable Distributions | Tax-Exempt Distributions | Total Distributions Paid | |||||||||||||||||||
INCORE Low Duration Bond Fund | $ | 2,832,080 | $ | — | $ | 2,832,080 | $ | — | $ | 2,832,080 | |||||||||||||
High Yield Fund | 16,071,458 | — | 16,071,458 | — | 16,071,458 | ||||||||||||||||||
| Tax-Exempt Fund | 60,262 | 1,145,374 | 1,205,636 | 1,666,385 | 2,872,021 | ||||||||||||||||||
| High Income Municipal Bond Fund | 2,423 | — | 2,423 | 1,720,041 | 1,722,464 | ||||||||||||||||||
Floating Rate Fund | 65,678,189 | — | 65,678,189 | — | 65,678,189 | ||||||||||||||||||
As of December 31, 2022, the components of accumulated earnings/(loss) on a tax basis were as follows:
| Undistributed Ordinary Income | Undistributed Tax-Exempt Income | Distributions Payable | Other Earnings (Deficit) | Accumulated Earnings | Accumulated Capital and Other Losses | Unrealized Appreciation (Depreciation)* | Total Accumulated Earnings (Loss) | |||||||||||||||||||||||||||
| INCORE Low Duration Bond Fund | $ | 141,741 | $ | — | $ | — | $ | — | $ | 141,741 | $ | (31,123,371 | ) | $ | (6,085,885 | ) | $ | (37,067,515 | ) | ||||||||||||||||
| High Yield Fund | — | — | (2,494 | ) | — | (2,494 | ) | (14,915,250 | ) | (61,758,483 | ) | (76,676,227 | ) | ||||||||||||||||||||||
| Tax-Exempt Fund | — | 12,348 | — | — | 12,348 | (435,299 | ) | (3,598,063 | ) | (4,021,014 | ) | ||||||||||||||||||||||||
| High Income Municipal Bond Fund | — | 142,525 | — | (7,396 | ) | 135,129 | (616,537 | ) | (6,010,971 | ) | (6,492,379 | ) | |||||||||||||||||||||||
| Floating Rate Fund | 432,493 | — | — | (7,733 | ) | 424,760 | (287,273,378 | ) | (182,834,396 | ) | (469,683,014 | ) | |||||||||||||||||||||||
* The difference between the book-basis and tax-basis unrealized appreciation (depreciation) is attributable primarily to tax deferral of losses on wash sales, futures, and deemed dividends on Convertible Debt under Sec. 305(c).
As of December 31, 2022, the Funds had net capital loss carryforwards as shown in the table below. It is unlikely that the Board will authorize a distribution of capital gains realized in the future until the capital loss carryforwards have been used.
| Short-Term Amount | Long-Term Amount | Total | |||||||||||||
INCORE Low Duration Bond Fund | $ | 12,890,952 | $ | 18,232,419 | $ | 31,123,371 | |||||||||
High Yield Fund | 6,891,068 | 8,024,182 | 14,915,250 | ||||||||||||
Tax-Exempt Fund | 54,155 | 381,144 | 435,299 | ||||||||||||
High Income Municipal Bond Fund | 45,554 | 570,983 | 616,537 | ||||||||||||
Floating Rate Fund | 74,673,227 | 212,600,151 | 287,273,378 | ||||||||||||
98
Victory Portfolios | Notes to Financial Statements — continued December 31, 2022 | ||||||
As of December 31, 2022, the cost basis for federal income tax purposes, gross unrealized appreciation, gross unrealized depreciation, and net unrealized appreciation (depreciation) for investments were as follows:
| Cost of Investments for Federal Tax Purposes | Net Gross Unrealized Appreciation | Gross Unrealized Depreciation | Net Unrealized Appreciation (Depreciation) | |||||||||||||||
INCORE Low Duration Bond Fund | $ | 181,923,888 | $ | 1,320,332 | $ | (7,406,217 | ) | $ | (6,085,885 | ) | |||||||||
High Yield Fund | 323,888,028 | 358,805 | (62,117,288 | ) | (61,758,483 | ) | |||||||||||||
Tax-Exempt Fund | 42,763,787 | 82,643 | (3,680,706 | ) | (3,598,063 | ) | |||||||||||||
High Income Municipal Bond Fund | 43,803,417 | 212,560 | (6,223,531 | ) | (6,010,971 | ) | |||||||||||||
Floating Rate Fund | 1,391,589,540 | 1,143,009 | (183,977,405 | ) | (182,834,396 | ) | |||||||||||||
99
REPORT OF INDEPENDENT REGISTERED PUBLIC ACCOUNTING FIRM
To the Shareholders and Board of Trustees of Victory Portfolios
Opinion on the Financial Statements
We have audited the accompanying statements of assets and liabilities, including the schedules of portfolio investments, of Victory INCORE Low Duration Bond Fund, Victory High Yield Fund, Victory Tax-Exempt Fund, Victory High Income Municipal Bond, and Victory Floating Rate Fund (the "Funds"), each a series of Victory Portfolios, as of December 31, 2022, the related statements of operations for the year then ended, the statements of changes in net assets for each of the two years in the period then ended, the related notes, and the financial highlights for each of the four years in the period then ended (collectively referred to as the "financial statements"). In our opinion, the financial statements present fairly, in all material respects, the financial position of the Funds as of December 31, 2022, the results of their operations for the year then ended, the changes in net assets for each of the two years in the period then ended, and the financial highlights for each of the four years in the period then ended, in conformity with accounting principles generally accepted in the United States of America.
The Funds' financial highlights for the year ended December 31, 2018, were audited by other auditors whose report dated February 26, 2019, expressed an unqualified opinion on those financial highlights.
Basis for Opinion
These financial statements are the responsibility of the Funds' management. Our responsibility is to express an opinion on the Funds' financial statements based on our audits. We are a public accounting firm registered with the Public Company Accounting Oversight Board (United States) ("PCAOB") and are required to be independent with respect to the Funds in accordance with the U.S. federal securities laws and the applicable rules and regulations of the Securities and Exchange Commission and the PCAOB.
We conducted our audits in accordance with the standards of the PCAOB. Those standards require that we plan and perform the audit to obtain reasonable assurance about whether the financial statements are free of material misstatement whether due to error or fraud.
Our audits included performing procedures to assess the risks of material misstatement of the financial statements, whether due to error or fraud, and performing procedures that respond to those risks. Such procedures included examining, on a test basis, evidence regarding the amounts and disclosures in the financial statements. Our procedures included confirmation of securities owned as of December 31, 2022, by correspondence with the custodian and brokers; when replies were not received from brokers, we performed other auditing procedures. Our audits also included evaluating the accounting principles used and significant estimates made by management, as well as evaluating the overall presentation of the financial statements. We believe that our audits provide a reasonable basis for our opinion.
We have served as the auditor of one or more of the investment companies advised by Victory Capital Management, Inc. since 2015.

COHEN & COMPANY, LTD.
Cleveland, Ohio
February 23, 2023
100
Victory Portfolios | Supplemental Information December 31, 2022 | ||||||
(Unaudited)
Trustee and Officer Information
Board of Trustees:
Overall responsibility for management of the Trust rests with the Board. The Trust is managed by the Board in accordance with the laws of the State of Delaware. There are currently nine Trustees, eight of whom are not "interested persons" of the Trust within the meaning of that term under the 1940 Act ("Independent Trustees") and one of whom is an "interested person" of the Trust within the meaning of that term under the 1940 Act ("Interested Trustee"). The Trustees, in turn, elect the officers of the Trust to actively supervise its day-to-day operations.
The following tables list the Trustees, their date of birth, their position with the Trust, their commencement of service, their principal occupations during the past five years, and any directorships of other investment companies or companies whose securities are registered under the Securities Exchange Act of 1934, as amended, or who file reports under that Act. Each Trustee oversees 37 portfolios in the Trust, 6 portfolios in Victory Variable Insurance Funds, and 25 portfolios in Victory Portfolios II, each a registered investment company that, together with the Trust, comprise the Victory Fund Complex. David C. Brown is a Trustee of USAA Mutual Funds and oversees 45 portfolios of the USAA Mutual Funds Trust. Each Trustee's address is c/o Victory Portfolios, 4900 Tiedeman Road, 4th Floor, Brooklyn, Ohio 44144. Each Trustee has an indefinite term.
Name and Date of Birth | Position Held with the Trust | Date Commenced Service | Principal Occupation During Past 5 Years | Other Directorships Held During Past 5 Years | |||||||||||||||
Independent Trustees. | |||||||||||||||||||
| David Brooks Adcock, October 1951 | Trustee | May 2005 | Consultant (since 2006). | Chairman, Board of Trustees, Turner Funds (December 2016-December 2017). | |||||||||||||||
| Nigel D. T. Andrews, April 1947 | Trustee | August 2002 | Retired. | Director, Carlyle Secured Lending, Inc. (formerly TCG BDC I, Inc.) (since 2012); Director, Carlyle Credit Solutions, Inc. (formerly TCG BDC II, Inc.) (since 2017); Trustee, Carlyle Secured Lending III (since 2021). | |||||||||||||||
| E. Lee Beard,* August 1951 | Trustee | May 2005 | Retired. | None. | |||||||||||||||
| Dennis M. Bushe, January 1944 | Trustee | July 2016 | Retired. | None. | |||||||||||||||
101
Victory Portfolios | Supplemental Information — continued December 31, 2022 | ||||||
(Unaudited)
Name and Date of Birth | Position Held with the Trust | Date Commenced Service | Principal Occupation During Past 5 Years | Other Directorships Held During Past 5 Years | |||||||||||||||
| John L. Kelly, April 1953 | Chair and Trustee | February 2015 | Partner, McCarvill Capital Partners (September 2016- September 2017). | Director, Caledonia Mining Corporation (since May 2012). | |||||||||||||||
| David L. Meyer, April 1957 | Trustee | December 2008 | Retired. | None. | |||||||||||||||
| Gloria S. Nelund, May 1961 | Trustee | July 2016 | Chair, CEO and Co-Founder of TriLinc Global, LLC, an investment firm. | TriLinc Global Impact Fund, LLC (since 2012). | |||||||||||||||
| Timothy Pettee, April 1958 | Advisory Trustee | January 2023 | Chief Investment Officer, Hoya Capital Real Estate LLC (since February 2022); Chief Investment Officer, Sun America Asset Management Corp., (January 2003-July 2021). | None. | |||||||||||||||
| Leigh A. Wilson, December 1944 | Trustee | November 1994 | Private Investor. | Chair (since 2013), Caledonia Mining Corporation. | |||||||||||||||
Interested Trustee. | |||||||||||||||||||
| David C. Brown,** May 1972 | Trustee | May 2008 | Chief Executive Officer and Chairman (since 2013), the Adviser; Chief Executive Officer and Chairman (since 2013), Victory Capital Holdings, Inc.; Director (since 2013), Victory Capital Services, Inc.; Director (since 2019), Victory Capital Transfer Agency, Inc. | Trustee, USAA Mutual Funds Trust; Board Member, Victory Capital Services, Inc. | |||||||||||||||
* The Board has designated Ms. Beard as its Audit Committee Financial Expert.
** Mr. Brown is an "Interested Person" by reason of his relationship with the Adviser.
The Statement of Additional Information includes additional information about the Trustees of the Trust and is available, without charge, by calling 800-539-3863.
102
Victory Portfolios | Supplemental Information — continued December 31, 2022 | ||||||
(Unaudited)
Officers:
The officers of the Trust, their date of birth, their commencement of service, and their principal occupations during the past five years, are detailed in the following table. Each officer serves until the earlier of his or her resignation, removal, retirement, death, or the election of a successor. The mailing address of each officer of the Trust is 4900 Tiedeman Road, 4th Floor, Brooklyn, Ohio 44144. The officers of the Trust receive no compensation directly from the Trust for performing the duties of their offices.
Name and Date of Birth | Position with the Trust | Date Commenced Service | Principal Occupation During Past 5 Years | ||||||||||||
| Christopher K. Dyer, February 1962 | President | February 2006 | Director of Mutual Fund Administration, the Adviser (since 2004); Chief Operating Officer, Victory Capital Services, Inc. (since 2020); Vice President, Victory Capital Transfer Agency, Inc. (since 2019). | ||||||||||||
| Scott A. Stahorsky, July 1969 | Vice President | December 2014 | Manager, Fund Administration, the Adviser. (since 2015). | ||||||||||||
| Thomas Dusenberry, July 1977 | Secretary | May 2022 | Manager, Fund Administration, the Adviser (since 2022); Treasurer and Principal Financial Officer (2020-2022), Assistant Treasurer (2019), Salient MF Trust, Salient Midstream, MLP Fund and Forward Funds; Principal Financial Officer (2018-2021) and Treasurer (2020-2021), Salient Private Access Funds and Endowment PMF Funds; Senior Vice President of Fund Accounting and Operations, Salient Partners (2020-2022); Director of Fund Operations, Salient Partners (2016-2019). | ||||||||||||
| Allan Shaer, March 1965 | Treasurer | May 2017 | Senior Vice President, Financial Administration, Citi Fund Services Ohio, Inc. (since 2016). | ||||||||||||
| Christopher A. Ponte, March 1984 | Assistant Treasurer | December 2017 | Manager, Fund Administration, the Adviser (since 2017); Chief Financial Officer, Victory Capital Services, Inc. (since 2018). | ||||||||||||
| Sean Fox, September 1976 | Chief Compliance Officer | June 2022 | Sr. Compliance Officer, the Adviser (since 2019); Compliance Officer, the Adviser (2015-2019). | ||||||||||||
| Charles Booth, April 1960 | Anti-Money Laundering Compliance Officer and Identity Theft Officer | May 2015 | Director, Regulatory Administration and CCO Support Services, Citi Fund Services Ohio, Inc (since 2007). | ||||||||||||
| Jay G. Baris, January 1954 | Assistant Secretary | December 1997 | Partner, Sidley Austin LLP (since 2020); Partner, Shearman & Sterling LLP (2018-2020). | ||||||||||||
103
Victory Portfolios | Supplemental Information — continued December 31, 2022 | ||||||
(Unaudited)
Proxy Voting and Portfolio Holdings Information
Proxy Voting:
Information regarding the policies and procedures each Fund uses to determine how to vote proxies relating to portfolio securities is available without charge, upon request, by calling 800-539-3863. The information is also included in the Funds' Statement of Additional Information, which is available on the SEC's website at sec.gov.
Information relating to how the Funds voted proxies relating to portfolio securities held during the most recent 12 months ended June 30 is available on the SEC's website at sec.gov.
Availability of Schedules of Portfolio Investments:
The Trust files a complete list of Schedules of Portfolio Investments with the SEC for the first and third quarter of each fiscal year on Form N-PORT. Forms N-PORT are available on the SEC's website at sec.gov.
Expense Examples
As a shareholder of the Funds, you may incur two types of costs: (1) transaction costs, including sales charges (loads) on purchases; and (2) ongoing costs, including management fees and other Fund expenses. These examples are intended to help you understand your ongoing costs (in dollars) of investing in the Fund and to compare these costs with the ongoing costs of investing in other mutual funds.
These examples are based on an investment of $1,000 invested at the beginning of the period and held for the entire period from July 1, 2022, through December 31, 2022.
The Actual Expense figures in the table below provide information about actual account values and actual expenses. You may use the information below, together with the amount you invested, to estimate the expenses that you paid over the period. Simply divide your account value by $1,000 (for example, an $8,600 account value divided by $1,000 = 8.6), then multiply the result by the number in the table under the heading entitled "Actual Expenses Paid During Period" to estimate the expenses you paid on your account during this period.
The Hypothetical Expense figures in the table below provide information about hypothetical account values and hypothetical expenses based on the Fund's actual expense ratio and an assumed rate of return of 5% per year before expenses, which is not the Fund's actual return. The hypothetical account values and expenses may not be used to estimate the actual ending account balance or expenses you paid for the period. You may use this information to compare this 5% hypothetical example with the 5% hypothetical examples that appear in shareholder reports of other funds.
Please note the expenses shown in the table below are meant to highlight your ongoing costs only and do not reflect any transactional costs. Therefore, the hypothetical expenses in the table are useful in comparing ongoing costs only and will not help you determine the relative total costs of owning different funds. In addition, if these transactional costs were included, your costs would have been higher.
| Beginning Account Value 7/1/22 | Actual Ending Account Value 12/31/22 | Hypothetical Ending Account Value 12/31/22 | Actual Expenses Paid During Period 7/1/22- 12/31/22* | Hypothetical Expenses Paid During Period 7/1/22- 12/31/22* | Annualized Expense Ratio During Period 7/1/22- 12/31/22 | ||||||||||||||||||||||
INCORE Low Duration Bond Fund | |||||||||||||||||||||||||||
Class A | $ | 1,000.00 | $ | 1,002.80 | $ | 1,020.92 | $ | 4.29 | $ | 4.33 | 0.85 | % | |||||||||||||||
Class C | 1,000.00 | 998.90 | 1,017.04 | 8.16 | 8.24 | 1.62 | % | ||||||||||||||||||||
Class R | 1,000.00 | 1,000.60 | 1,018.80 | 6.40 | 6.46 | 1.27 | % | ||||||||||||||||||||
Class Y | 1,000.00 | 1,003.90 | 1,022.08 | 3.13 | 3.16 | 0.62 | % | ||||||||||||||||||||
High Yield Fund | |||||||||||||||||||||||||||
Class A | 1,000.00 | 988.70 | 1,020.16 | 5.01 | 5.09 | 1.00 | % | ||||||||||||||||||||
Class C | 1,000.00 | 985.20 | 1,016.64 | 8.51 | 8.64 | 1.70 | % | ||||||||||||||||||||
Class R | 1,000.00 | 987.20 | 1,018.65 | 6.51 | 6.61 | 1.30 | % | ||||||||||||||||||||
Class Y | 1,000.00 | 989.90 | 1,021.37 | 3.81 | 3.87 | 0.76 | % | ||||||||||||||||||||
104
Victory Portfolios | Supplemental Information — continued December 31, 2022 | ||||||
(Unaudited)
| Beginning Account Value 7/1/22 | Actual Ending Account Value 12/31/22 | Hypothetical Ending Account Value 12/31/22 | Actual Expenses Paid During Period 7/1/22- 12/31/22* | Hypothetical Expenses Paid During Period 7/1/22- 12/31/22* | Annualized Expense Ratio During Period 7/1/22- 12/31/22 | ||||||||||||||||||||||
Tax-Exempt Fund | |||||||||||||||||||||||||||
Class A | $ | 1,000.00 | $ | 993.40 | $ | 1,021.17 | $ | 4.02 | $ | 4.08 | 0.80 | % | |||||||||||||||
Class C | 1,000.00 | 989.40 | 1,017.14 | 8.02 | 8.13 | 1.60 | % | ||||||||||||||||||||
Class Y | 1,000.00 | 993.90 | 1,021.73 | 3.47 | 3.52 | 0.69 | % | ||||||||||||||||||||
High Income Municipal Bond Fund | |||||||||||||||||||||||||||
Class A | 1,000.00 | 987.40 | 1,021.17 | 4.01 | 4.08 | 0.80 | % | ||||||||||||||||||||
Class C | 1,000.00 | 983.50 | 1,017.29 | 7.85 | 7.98 | 1.57 | % | ||||||||||||||||||||
Class Y | 1,000.00 | 988.50 | 1,022.33 | 2.86 | 2.91 | 0.57 | % | ||||||||||||||||||||
Member Class | 1,000.00 | 988.10 | 1,021.93 | 3.26 | 3.31 | 0.65 | % | ||||||||||||||||||||
Floating Rate Fund | |||||||||||||||||||||||||||
Class A | 1,000.00 | 1,012.80 | 1,020.16 | 5.07 | 5.09 | 1.00 | % | ||||||||||||||||||||
Class C | 1,000.00 | 1,009.80 | 1,016.13 | 9.12 | 9.15 | 1.80 | % | ||||||||||||||||||||
Class R | 1,000.00 | 1,009.80 | 1,017.34 | 7.90 | 7.93 | 1.56 | % | ||||||||||||||||||||
Class Y | 1,000.00 | 1,015.10 | 1,021.27 | 3.96 | 3.97 | 0.78 | % | ||||||||||||||||||||
Member Class | 1,000.00 | 1,013.50 | 1,020.92 | 4.31 | 4.33 | 0.85 | % | ||||||||||||||||||||
* Expenses are equal to the average account value multiplied by the Fund's annualized expense ratio multiplied by 184/365 (the number of days in the most recent fiscal half-year divided by the number of days in the fiscal year).
105
Victory Portfolios | Supplemental Information — continued December 31, 2022 | ||||||
(Unaudited)
Additional Federal Income Tax Information
For the year ended December 31, 2022, the following Funds paid qualified dividend income for the purposes of reduced individual federal income tax rates of:
Percent | |||||||
INCORE Low Duration Bond Fund | 3 | % | |||||
High Yield Fund | — | %(a) | |||||
Dividends qualified for corporate dividends received deductions of:
Percent | |||||||
INCORE Low Duration Bond Fund | 3 | % | |||||
High Yield Fund | — | %(a) | |||||
For the year ended December 31, 2022, the following Funds designated tax-exempt capital gain distributions:
Amount | |||||||
Tax-Exempt Fund | $ | 1,694,609 | |||||
High Income Municipal Bond Fund | 1,879,177 | ||||||
For the year ended December 31, 2022, the following Funds designated short-term capital gain distributions:
Amount | |||||||
Tax-Exempt Fund | $ | 1,379 | |||||
High Income Municipal Bond Fund | 23,488 | ||||||
For the year ended December 31, 2022, the following Funds designated long-term capital gain distributions:
Amount | |||||||
Tax-Exempt Fund | $ | 306,762 | |||||
High Income Municipal Bond Fund | 101,138 | ||||||
(a) Rounds to less than 0.5%.
106
Victory Portfolios | Supplemental Information — continued December 31, 2022 | ||||||
(Unaudited)
Considerations of the Board in Continuing the Investment Advisory Agreements
The Board approved the advisory agreement with the Adviser, on behalf of each of the Funds (the "Advisory Agreement"), and the sub-advisory agreement between the Adviser and Park Avenue Institutional Advisers LLC (the "Sub-Adviser"), on behalf of each of the High Yield Fund and Floating Rate Fund (the "Sub-Advisory Agreement" and together with the Advisory Agreement, the "Agreements"), at a meeting, which was called for that purpose, on December 6, 2022. The Board also considered information relating to the Funds and the Agreements provided throughout the year and, more specifically, at the meetings on October 18, 2022 and December 6, 2022. In considering whether to approve the Agreement, the Board requested, and the Adviser and Sub-Adviser provided, information that the Board believed to be reasonably necessary to reach its conclusions.
The Board, including the Independent Trustees, evaluated this information along with other information obtained throughout the year and was advised by legal counsel to the Funds and independent legal counsel to the Independent Trustees. In addition, the Independent Trustees considered a past review of their overall process for conducting the annual review of the Funds' advisory arrangements by a consultant retained through their counsel.
The Board considered each Fund's advisory fee, expense ratio and investment performance as significant factors in determining whether the Agreements should be continued. The Board reviewed numerous factors with respect to each Fund, including the services to be provided by the Sub-Adviser. In considering whether the compensation paid to the Adviser was fair and reasonable, the Board also evaluated, among other things, the following factors:
• The requirements of the Funds for the services provided by the Adviser;
• The nature, quality and extent of the services provided and expected to be provided;
• The performance of the Funds as compared to comparable funds;
• The fees payable for the services and whether the fee arrangements provided for economies of scale that would benefit Fund shareholders as the Funds grow (acknowledging that economies of scale can be complex to assess and typically are not directly measurable);
• Whether the fee would be sufficient to enable the Adviser to attract and retain experienced personnel and continue to provide quality services to the Funds;
• The fees paid by other clients of the Adviser whose accounts are managed in a similar investment style and any differences in the services provided to the other clients compared to those provided to the Funds;
• The total expenses of each Fund;
• Management's commitment to operating the Funds at competitive expense levels;
• The profitability of the Adviser (as reflected by comparing fees earned against an estimate of the Adviser's costs) with respect to the Adviser's relationship with the Funds;
• Research and other service benefits received by the Adviser obtained through payment of client commissions for securities transactions;
• Other benefits received by the Adviser, and its affiliates, including revenues paid to the Adviser, or its affiliates, by the Funds for administration and fund accounting services, shareholder services and distribution;
• The capabilities and financial condition of the Adviser;
• Current economic and industry trends; and
• The historical relationship between each Fund and the Adviser.
In considering whether the compensation paid to the Sub-Adviser was fair and reasonable, the Board also evaluated, among other things, the following factors:
• The requirements of each Fund for the services provided by the Sub-Adviser;
• The nature, quality and extent of the services provided and expected to be provided;
• The fees payable for the services;
• Representations by the Adviser that the sub-advisory fee for each Fund is within the range of fees agreed to in the market for similar services;
107
Victory Portfolios | Supplemental Information — continued December 31, 2022 | ||||||
(Unaudited)
• Whether the fee would be sufficient to enable the Sub-Adviser to attract and retain experienced personnel and continue to provide quality services to the Funds;
• Management's commitment to operating the Fund at competitive expense levels;
• Research and other service benefits received by the Sub-Adviser obtained through payment of client commissions for securities transactions;
• Other benefits received by the Sub-Adviser as a result of its sub-advisory relationship with the Funds;
• The capabilities and financial condition of the Sub-Adviser;
• The nature, quality and extent of the oversight and compliance services provided by the Adviser;
• Current economic and industry trends; and
• The historical relationship between each sub-advised Fund and the Sub-Adviser.
The Board reviewed each Fund's current management fee, comprised of the advisory fee plus the administrative services fee paid to the Adviser, in the context of the Adviser's profitability with respect to each Fund individually. The Board retained an independent, third-party consultant to provide comparative information about fees, expenses and performance, and to design and maintain a database of relevant information designed to assist the Board in retrieving and analyzing comparative information. The Board met with the consultant to review its inputs and methodologies, among other things. The Board compared each Fund's gross management fee and total operating expense ratio on a net and gross basis with the median gross management fee and median expense ratio of a universe of comparable mutual funds compiled by the consultant, and a peer group of funds with similar investment strategies selected by that consultant from the universe of comparable funds. The Board reviewed the factors and methodology used by the consultant in the selection of each Fund's peer group, including the consultant's selection of a broad universe of funds, the more specific universe of comparable funds, and peer groups of funds with comparable investment strategies and asset levels, among other factors. The Board also reviewed any changes to the consultant's methodology as compared to the prior year, including those resulting from the Adviser's input, if any. With respect to certain Funds, the Board also reviewed fees and other information related to the Adviser's management of similarly managed institutional or private accounts, and the differences in the services provided to the other accounts. The Board noted that none of the advisory fee arrangements for the Funds included breakpoints, which would be a structure that results in reduced fees as a fund grows. The Board also considered the Adviser's commitment to limit expenses as discussed in more detail below.
For Funds with total net expense ratios that ranked within the fourth quartile (most expensive) in relation to their peers as evaluated by a consultant, the Board requested, and the Adviser provided, supplemental information about the level of fees and the nature of the services provided. The Adviser reviewed additional relevant circumstances, which included, among other things, specialized strategies, small or decreasing assets, or rapid or recent changes in peer expense ratios.
The Board also reviewed the compliance and administrative services provided to the Funds by the Adviser and its affiliates, including the Adviser's oversight of the Funds' day-to-day operations and oversight of Fund accounting, assistance in meeting legal and regulatory requirements, and other services necessary for the operation of the Funds and the Trust.
With respect to the High Yield Fund and Floating Rate Fund, the Board also considered information concerning the fee paid to the Sub-Adviser under the Sub-Advisory Agreement. The Board considered the relative roles and responsibilities of the Adviser and Sub-Adviser with respect to the applicable Funds and noted that, among other things: (1) the sub-advisory fees for these Funds are paid by the Adviser and, therefore, are not a direct expense of the Funds; and (2) the Adviser supervises the Sub-Adviser. The Board also considered the Adviser's representation that the fees to be paid to the Sub-Adviser are within the range of sub-advisory fees paid to other sub-advisers for similar services. The Board reviewed fees and other information related to the Sub-Adviser's management of similarly managed institutional or private accounts, and the differences in the services provided to the other accounts. The Board recognized that because the sub-advisory fees are paid by the Adviser, any arrangement by the Sub-Adviser to either increase or reduce its fee would have no direct impact on the Fund or its shareholders.
108
Victory Portfolios | Supplemental Information — continued December 31, 2022 | ||||||
(Unaudited)
The Board found that the gross annual management fee paid by each Fund was within the range of management fees paid by each Fund's respective peer group. The Board also found that each Fund's Class A net annual expense ratio was reasonable as compared with each Fund's respective peer group. The Board considered the Adviser's contractual agreement with each Fund to waive its fees and reimburse expenses of certain classes for a specified period of time, as described in the Fund's prospectus.
The Board reviewed each Fund's performance over one-, three-, five- and ten-year periods (as applicable) against the performance of the Fund's selected peer group and benchmark index. The Board recognized that the performance of the Fund and the peer group funds are net of expenses, while the performance of the benchmark index reflects gross returns.
The Board reviewed various other specific factors with respect to each Fund, as described below. In their deliberations, the Trustees did not rank the importance of any particular information or factor considered and each Trustee may have attributed different weights to various factors.
INCORE Low Duration Bond Fund:
The Board compared the Fund's Class A performance for the one-, three-, five- and ten-year periods ended June 30, 2022, to that of the median performance of the Fund's peer group and benchmark index for the same periods and considered the fact that the Fund underperformed the benchmark index for the one-year period, outperformed the benchmark index for the three-, five- and ten-year periods, outperformed the peer group median for the one- , three- and five-year periods, and matched the peer group median for the ten-year period.
Having considered, among other things: (1) the Fund's management fee compared to comparable mutual funds; (2) the Fund's total expense ratio compared to comparable mutual funds; (3) that the Adviser's willingness to limit the expenses of certain classes for a period of time would provide stability to the Fund's expenses for those share classes during that period; and (4) the Fund's performance during the periods reviewed, the Board concluded that the Agreement continued to be in the best interests of the Fund's shareholders.
High Yield Fund:
The Board compared the Fund's Class A performance for the one-, three-, five- and ten-year periods ended June 30, 2022, to that of the median performance of the Fund's peer group and benchmark index for the same periods and considered the fact that the Fund underperformed the benchmark index for the one-, three- and ten-year periods, outperformed the benchmark index for the five-year period, underperformed the peer group median for the one-year period, and outperformed the peer group median for the three- , five- and ten-year periods.
Having considered, among other things: (1) the Fund's management fee compared to comparable mutual funds; (2) the Fund's total expense ratio compared to comparable mutual funds; (3) that the Adviser's willingness to limit the expenses of certain classes for a period of time would provide stability to the Fund's expenses for those share classes during that period; and (4) the Fund's performance during the periods reviewed, the Board concluded that the Agreement continued to be in the best interests of the Fund's shareholders.
Tax-Exempt Fund:
The Board compared the Fund's Class A performance for the one-, three-, five- and ten-year periods ended June 30, 2022, to that of the median performance of the Fund's peer group and benchmark index for the same periods and considered the fact that the Fund underperformed the benchmark index for the one- and ten-year periods, outperformed the benchmark index for the three- and five-year periods, outperformed the peer group median for the three- and five-year periods, underperformed the peer group median for the one-year period, and matched the peer group median for the ten-year period. The Board considered the fact that as of April 1, 2020, the Adviser assumed day-to-day portfolio management responsibilities from the Fund's former sub-adviser.
Having considered, among other things: (1) the Fund's management fee compared to comparable mutual funds; (2) the Fund's total expense ratio compared to comparable mutual funds; (3) that the Adviser's willingness to limit the expenses of certain classes for a period of time would provide stability to the Fund's expenses for those share classes during that period; and (4) the Fund's performance during the recent periods reviewed, the Board concluded that the Agreement continued to be in the best interests of the Fund's shareholders.
109
Victory Portfolios | Supplemental Information — continued December 31, 2022 | ||||||
(Unaudited)
High Income Municipal Bond Fund:
The Board compared the Fund's Class A performance for the one-, three-, five- and ten-year periods ended June 30, 2022, to that of the median performance of the Fund's peer group and benchmark index for the same periods and considered the fact that the Fund underperformed the benchmark index for the one- and three-year periods, outperformed the benchmark index for the five- and ten-year periods, outperformed the peer group median for the one-, three- and five-year periods, and underperformed the peer group median for the ten-year period. The Board considered the fact that as of April 1, 2020, the Adviser assumed day-to-day portfolio management responsibilities from the Fund's former sub-adviser.
Having considered, among other things: (1) the Fund's management fee compared to comparable mutual funds; (2) the Fund's total expense ratio compared to comparable mutual funds; (3) that the Adviser's willingness to limit the expenses of certain classes for a period of time would provide stability to the Fund's expenses for those share classes during that period; and (4) the Fund's performance during the periods reviewed, the Board concluded that the Agreement continued to be in the best interests of the Fund's shareholders.
Floating Rate Fund:
The Board compared the Fund's Class A performance for the one-, three-, five- and ten-year periods ended June 30, 2022, to that of the median performance of the Fund's peer group and benchmark index for the same periods and considered the fact that the Fund underperformed the benchmark index for all of the periods reviewed, underperformed the peer group median for the one-year period, and outperformed the peer group median for the three- , five- and ten-year periods.
Having considered, among other things: (1) the Fund's management fee compared to comparable mutual funds; (2) the Fund's total expense ratio compared to comparable mutual funds; (3) that the Adviser's willingness to limit the expenses of certain classes for a period of time would provide stability to the Fund's expenses for those share classes during that period; and (4) the Fund's performance during the periods reviewed, the Board concluded that the Agreement continued to be in the best interests of the Fund's shareholders.
Conclusion:
Based on its review of the information requested and provided, and following extended discussions, the Board determined that the Agreement, on behalf of the Funds discussed above, was consistent with the best interests of each Fund and its shareholders, and the Board unanimously approved the Agreement, on behalf of each Fund, for an additional annual period on the basis of the foregoing review and discussions and the following considerations, among others:
• The fairness and reasonableness of the investment advisory fee payable to the Adviser under the Agreement in light of the investment advisory services provided, the costs of these services, the profitability of the Adviser's relationship with the Fund and the comparability of the fee paid to the fees paid by other investment companies;
• The nature, quality and extent of the investment advisory services provided by the Adviser;
• The Adviser's entrepreneurial commitment to the management of the Funds and the creation of a broad-based family of funds, which entails a substantial commitment of the Adviser's resources to the successful operation of the Funds;
• The Adviser's representations regarding its staffing and capabilities to manage the Funds, including the retention of personnel with relevant portfolio management experience;
• The Adviser's efforts to enhance investment results by, among other things, developing and supporting quality portfolio management teams;
• In the case of the sub-advised Funds, the Adviser's oversight of the Sub-Adviser; and
• The overall high quality of the personnel, operations, financial condition, investment management capabilities, methodologies and performance of the Adviser.
Based on its review of the information requested and provided, and following extended discussions, the Board concluded, among other things, that the Sub-Advisory Agreement, with respect to each of the High Yield Fund
110
Victory Portfolios | Supplemental Information — continued December 31, 2022 | ||||||
(Unaudited)
and Floating Rate Fund, was consistent with the best interests of each Fund and its shareholders and unanimously approved the Sub-Advisory Agreement (including the fees to be charged for services thereunder), on the basis of the foregoing review and discussions and the following considerations, among others:
• The fairness and reasonableness of the investment advisory fee payable to the Sub-Adviser under the Sub-Advisory Agreement in light of the investment advisory services provided, the costs of these services and the estimated profitability of the Sub-Adviser's relationship with each Fund;
• The relative roles and responsibilities of the Adviser and the Sub-Adviser the Sub-Advisory Agreement;
• The nature, quality and extent of the investment advisory services provided by the portfolio management team of the Sub-Adviser, which have resulted in each Fund achieving its stated investment objective;
• The Sub-Adviser's representations regarding its staffing and capabilities to manage the Funds; and
• The overall high quality of the personnel, operations, financial condition, investment management capabilities, methodologies and performance of the Sub-Adviser.
111
Privacy Policy
Protecting the Privacy of Information
The Trust respects your right to privacy. We also know that you expect us to conduct and process your business in an accurate and efficient manner. To do so, we must collect and maintain certain personal information about you. This is the information we collect from you on applications or other forms, and from the transactions you make with us or third parties. It may include your name, address, social security number, account transactions and balances, and information about investment goals and risk tolerance.
We do not disclose any information about you or about former customers to anyone except as permitted or required by law. Specifically, we may disclose the information we collect to companies that perform services on our behalf, such as the transfer agent that processes shareholder accounts and printers and mailers that assist us in the distribution of investor materials. We may also disclose this information to companies that perform marketing services on our behalf. This allows us to continue to offer you Victory investment products and services that meet your investing needs, and to effect transactions that you request or authorize. These companies will use this information only in connection with the services for which we hired them. They are not permitted to use or share this information for any other purpose.
To protect your personal information internally, we permit access only by authorized employees and maintain physical, electronic, and procedural safeguards to guard your personal information.*
* You may have received communications regarding information about privacy policies from other financial institutions which gave you the opportunity to "opt-out" of certain information sharing with companies which are not affiliated with that financial institution. The Trust does not share information with other companies for purposes of marketing solicitations for products other than the Trust. Therefore, the Trust does not provide opt-out options to their shareholders.
Victory Funds
P.O. Box 182593
Columbus, Ohio 43218-2593

Visit our website at: | Call Victory at: | ||||||
vcm.com | 800-539-FUND (800-539-3863) | ||||||
| 800-235-8396 for Member Class | |||||||
VPRSFIF-AR (12/22)
Item 2. Code of Ethics.
| (a) | The registrant has adopted a code of ethics that applies to the registrant’s principal executive officer, principal financial officer, principal accounting officer or controller, or persons performing similar functions. This code of ethics in included as an Exhibit. |
| (b) | During the period covered by the report, with respect to the registrant’s code of ethics that applies to its principal executive officer, principal financial officer, principal accounting officer or controller, or persons performing similar functions; there have been no amendments to, nor any waivers granted from, a provision that relates to any element of the code of ethics definition enumerated in paragraph (b) of this Item 2. |
Item 3. Audit Committee Financial Expert.
(a)(1) The registrant’s board of directors has determined that the registrant has at least one audit committee financial expert serving on its audit committee.
(a)(2) The audit committee financial expert is E. Lee Beard, who is “independent” for purposes of this Item 3 of Form N-CSR.
Item 4. Principal Accountant Fees and Services.
| 2022 | 2021 | |||||||
| (a) Audit Fees (1) | $ | 334,200 | $ | 367,250 | ||||
| (b) Audit-Related Fees (2) | 0 | 0 | ||||||
| (c) Tax Fees (3) | 0 | 0 | ||||||
| (d) All Other Fees (4) | 0 | 0 | ||||||
(1) Audit fees include amounts related to the audit of the Registrant’s annual financial statements and services normally provided by the accountant in connection with statutory and regulatory filings. Audit fees billed were for professional services provided by Cohen & Company, Ltd. for audit compliance, audit advice and audit planning.
(2) Represents the fee for assurance and related services by Cohen & Company, Ltd. reasonably related to the performance of the audit of the Registrant’s financial statements that was not reported under (a) of this item.
(3) Represents the aggregate tax fee billed for professional services rendered by Cohen & Company, Ltd. for tax compliance, tax advice, international tax fee transactions and tax planning. Such tax services included the review of income and excise tax returns for the Registrant.
(4) For the fiscal years ended December 31, 2022 and December 31, 2021, there were no fees billed for professional services rendered by Cohen & Company, Ltd. to the Registrant, other than the services reported in (a) through (c) of this item.
(e)(1) The Registrant’s Audit Committee must pre-approve non-audit services to be provided by the principal accountant and the fees charged with these services. The Committee may delegate authority to one or more Committee members to pre-approve these services, subject to subsequent review and approval by the Committee.
(e)(2) There were no services performed under Rule 2.01 (c)(7)(i)(C).
(f) Not applicable.
(g)
| 2022 | $ | 0 | |||
| 2021 | $ | 0 |
(h) The Registrant’s Audit Committee has evaluated the non-audit services that the principal accountant provided to the Registrant’s investment adviser (and the adviser’s relevant affiliated), which services the Committee did not pre-approve, and has concluded that the provision of those services was compatible with maintaining the accountant’s independence.
Item 5. Audit Committee of Listed Registrants.
Not applicable.
Item 6. Investments.
(a) Not applicable.
(b) Not applicable.
Item 7. Disclosure of Proxy Voting Policies and Procedures for Closed-End Management Investment Companies.
Not applicable.
Item 8. Portfolio Managers of Closed-End Management Investment Companies.
Not applicable.
Item 9. Purchases of Equity Securities by Closed-End Management Investment Company and Affiliated Purchasers.
Not applicable.
Item 10. Submission of Matters to a Vote of Security Holders.
Not applicable.
Item 11. Controls and Procedures.
(a)The registrant’s principal executive officer and principal financial officer have concluded, based on their evaluation of the registrant's disclosure controls and procedures as conducted within 90 days of the filing date of this report, that these disclosure controls and procedures are adequately designed and are operating effectively to ensure that information required to be disclosed by the registrant on Form N-CSR is recorded, processed, summarized and reported within the time periods specified in the Securities and Exchange Commission's rules and forms.
(b)There were no changes in the registrant’s internal control over financial reporting (as defined in Rule 30a-3(d) under the Investment Company Act of 1940 (17 CFR 270.30a-3(d)) that occurred during the period covered by this report that have materially affected or are reasonably likely to materially affect, the registrant’s internal control over financial reporting.
Item 12. Disclosure of Securities Lending Activities for Closed-End Management Investment Companies.
(a)(1) Not applicable.
(a)(2) Not applicable.
(a)(3) Not applicable.
(a)(4) Not applicable.
(b) Not applicable.
Item 13. Exhibits.
(a)(2) Certifications pursuant to Rule 30a-2(a) are attached hereto.
(a)(3) Not applicable.
(b) Certifications pursuant to Rule 30a-2(b) are furnished herewith.
SIGNATURES
Pursuant to the requirements of the Securities Exchange Act of 1934 and the Investment Company Act of 1940, the registrant has duly caused this report to be signed on its behalf by the undersigned, thereunto duly authorized.
| (Registrant) | Victory Portfolios |
| By (Signature and Title)* | /s/ Allan Shaer | |
| Allan Shaer, Principal Financial Officer |
| Date | February 24, 2023 |
Pursuant to the requirements of the Securities Exchange Act of 1934 and the Investment Company Act of 1940, this report has been signed below by the following persons on behalf of the registrant and in the capacities and on the dates indicated.
| By (Signature and Title)* | /s/ Christopher K. Dyer | |
| Christopher K. Dyer, Principal Executive Officer |
| Date | February 24, 2023 |
| By (Signature and Title)* | /s/ Allan Shaer | |
| Allan Shaer, Principal Financial Officer |
| Date | February 24, 2023 |