UNITED STATES
SECURITIES AND EXCHANGE COMMISSION
Washington, D.C. 20549
FORM N-CSR
CERTIFIED SHAREHOLDER REPORT OF REGISTERED
MANAGEMENT INVESTMENT COMPANIES
Investment Company Act file number 811-4861
Fidelity Garrison Street Trust
(Exact name of registrant as specified in charter)
82 Devonshire St., Boston, Massachusetts 02109
(Address of principal executive offices) (Zip code)
Eric D. Roiter, Secretary
82 Devonshire St.
Boston, Massachusetts 02109
(Name and address of agent for service)
Registrant's telephone number, including area code: 617-563-7000
Date of fiscal year end: | September 30 |
Date of reporting period: | March 31, 2006 |
Item 1. Reports to Stockholders
| Fidelity® Money Market Central Fund |
| Semiannual Report March 31, 2006 |
| To view a fund’s proxy voting guidelines and proxy voting record for the 12 month period ended June 30, visit www.fidelity.com/proxyvotingresults or visit the Securities and Exchange Commission’s (SEC) web site at www.sec.gov. You may also call 1 800 544 8544 to request a free copy of the proxy voting guidelines. Standard & Poor’s, S&P and S&P 500 are registered service marks of The McGraw Hill Companies, Inc. and have been licensed for use by Fidelity Distributors Corporation. Other third party marks appearing herein are the property of their respective owners. All other marks appearing herein are registered or unregistered trademarks or service marks of FMR Corp. or an affiliated company. A fund files its complete schedule of portfolio holdings with the SEC for the first and third quarters of each fiscal year on Form N Q. Forms N Q are available on the SEC’s web site at http://www.sec.gov. A fund’s Forms N Q may be reviewed and copied at the SEC’s Public Reference Room in Washington, DC. Information regarding the operation of the SEC’s Public Reference Room may be obtained by calling 1-800-SEC-0330. |
| CFM-SANN-0506 431365.1.0 1.756671.105 |
Shareholder Expense Example
As a shareholder of the Fund, you incur two types of costs: (1) transaction costs, and (2) ongoing costs, including management fees and other Fund expenses. This Example is intended to help you understand your ongoing costs (in dollars) of investing in the Fund and to compare these costs with the ongoing costs of investing in other mutual funds. The Example is based on an investment of $1,000 invested at the beginning of the period and held for the entire period (October 1, 2005 to March 31, 2006).
| Actual Expenses |
The first line of the table below provides information about actual account values and actual expenses. You may use the information in this line, together with the amount you invested, to estimate the expenses that you paid over the period. Simply divide your account value by $1,000.00 (for example, an $8,600 account value divided by $1,000.00 = 8.6), then multiply the result by the number in the first line under the heading entitled “Expenses Paid During Period” to estimate the expenses you paid on your account during this period.
Hypothetical Example for Comparison Purposes
The second line of the table below provides information about hypothetical account values and hypothetical expenses based on the Fund’s actual expense ratio and an assumed rate of return of 5% per year before expenses, which is not the Fund’s actual return. The hypothetical account values and expenses may not be used to estimate the actual ending account balance or expenses you paid for the period. You may use this information to compare the ongoing costs of investing in the Fund and other funds. To do so, compare this 5% hypothetical example with the 5% hypothetical examples that appear in the share holder reports of the other funds.
Please note that the expenses shown in the table are meant to highlight your ongoing costs only and do not reflect any transaction costs. Therefore, the second line of the table is useful in comparing ongoing costs only, and will not help you determine the relative total costs of owning different funds.
| Expenses Paid | ||||||||||||
| Beginning | Ending | During Period* | ||||||||||
| Account Value | Account Value | October 1, 2005 | ||||||||||
| October 1, 2005 | March 31, 2006 | to March 31, 2006 | ||||||||||
| Actual | $ 1,000.00 | $ 1,021.70 | $ .04 | |||||||||
| Hypothetical (5% return per year | ||||||||||||
| before expenses) | $ 1,000.00 | $ 1,024.89 | $ .04 | |||||||||
* Expenses are equal to the Fund’s annualized expense ratio of .0082%; multiplied by the average account value over the period, multiplied by 182/365 (to reflect the one half year period).
| Semiannual Report |
| 2 |
| Investment Changes | ||||||
| Maturity Diversification | ||||||
| Days | % of fund’s | % of fund’s | % of fund’s | |||
| investments | investments | investments | ||||
| 3/31/06 | 9/30/05 | 3/31/05 | ||||
| 0 – 30 | 66.2 | 53.8 | 49.0 | |||
| 31 – 90 | 22.0 | 34.9 | 30.4 | |||
| 91 – 180 | 5.4 | 6.9 | 17.1 | |||
| 181 – 397 | 6.4 | 4.4 | 3.5 | |||
| Weighted Average Maturity | ||||||
| 3/31/06 | 9/30/05 | 3/31/05 | ||||
| Fidelity Money Market Central Fund | 44 Days | 41 Days | 52 Days | |||
| All Taxable Money Market Funds | ||||||
| Average* | 38 Days | 38 Days | 38 Days | |||
*Source: iMoneyNet, Inc.
3 Semiannual Report
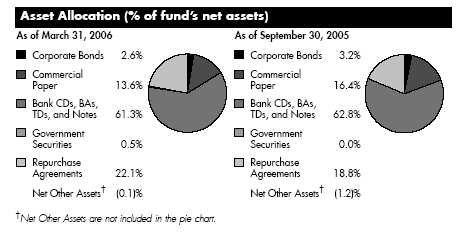
| Investments March 31, 2006 (Unaudited) | ||||||||||
| Showing Percentage of Net Assets | ||||||||||
| Corporate Bonds 2.5% | ||||||||||
| Due | Annualized Yield at | Principal Amount | Value (Note 1) | |||||||
| Date | Time of Purchase | |||||||||
| AOL Time Warner, Inc. | ||||||||||
| 4/15/06 | 4.20% | $ 525,000 | $ 525,376 | |||||||
| 4/15/06 | 4.30 | 250,000 | 250,170 | |||||||
| Conoco Funding Co. | ||||||||||
| 10/15/06 | 4.89 | 5,165,000 | 5,179,762 | |||||||
| Continental Cablevision, Inc. | ||||||||||
| 5/15/06 | 4.73 | 600,000 | 602,545 | |||||||
| Household Finance Corp. | ||||||||||
| 1/30/07 | 4.84 | 7,000,000 | 7,050,945 | |||||||
| PNC Funding Corp. | ||||||||||
| 8/1/06 | 4.79 | 5,000,000 | 5,015,569 | |||||||
| 8/1/06 | 4.82 | 500,000 | 501,508 | |||||||
| Sprint Capital Corp. | ||||||||||
| 8/17/06 | 4.84 | 1,155,000 | 1,154,739 | |||||||
| Verizon Wireless Capital LLC | ||||||||||
| 12/15/06 | 4.90 | 970,000 | 973,095 | |||||||
| TOTAL CORPORATE BONDS | 21,253,709 | |||||||||
| Certificates of Deposit 23.0% | ||||||||||
| Domestic Certificates Of Deposit – 0.3% | ||||||||||
| AmSouth Bank NA, Birmingham | ||||||||||
| 12/5/06 | 5.12 | 400,000 | 398,881 | |||||||
| Countrywide Bank, Alexandria Virginia | ||||||||||
| 5/15/06 | 4.76 (c) | 2,000,000 | 1,999,925 | |||||||
| 2,398,806 | ||||||||||
| London Branch, Eurodollar, Foreign Banks – 8.8% | ||||||||||
| Calyon | ||||||||||
| 2/12/07 | 5.00 | 5,000,000 | 5,000,000 | |||||||
| Credit Agricole SA | ||||||||||
| 5/15/06 | 4.70 | 5,000,000 | 4,998,454 | |||||||
| Credit Industriel et Commercial | ||||||||||
| 4/20/06 | 3.95 | 5,000,000 | 5,000,000 | |||||||
| 6/8/06 | 4.75 | 5,000,000 | 5,000,000 | |||||||
| 9/11/06 | 5.00 | 5,000,000 | 5,000,000 | |||||||
| 11/7/06 | 4.76 | 5,000,000 | 5,000,000 | |||||||
| 3/30/07 | 5.22 | 5,000,000 | 5,000,000 | |||||||
| Deutsche Bank AG | ||||||||||
| 1/30/07 | 4.86 | 5,000,000 | 5,000,000 | |||||||
| See accompanying notes which are an integral part of the financial statements. | ||||||||||
| Semiannual Report | 4 | |||||||||
| Certificates of Deposit continued | ||||||||||
| Due | Annualized Yield at | Principal Amount | Value (Note 1) | |||||||
| Date | Time of Purchase | |||||||||
| London Branch, Eurodollar, Foreign Banks – continued | ||||||||||
| Landesbank Hessen-Thuringen | ||||||||||
| 5/8/06 | 4.67% | $ 5,000,000 | $ 5,000,000 | |||||||
| Societe Generale | ||||||||||
| 4/28/06 | 4.00 | 10,000,000 | 10,000,000 | |||||||
| 5/10/06 | 4.80 | 10,000,000 | 10,000,000 | |||||||
| 11/7/06 | 4.91 | 5,000,000 | 5,000,000 | |||||||
| 12/6/06 | 4.80 | 5,000,000 | 5,000,000 | |||||||
| 74,998,454 | ||||||||||
| New York Branch, Yankee Dollar, Foreign Banks – 13.9% | ||||||||||
| Bank Tokyo-Mitsubishi UFJ Ltd. | ||||||||||
| 4/20/06 | 4.76 | 5,000,000 | 5,000,000 | |||||||
| 4/24/06 | 4.78 | 5,000,000 | 5,000,000 | |||||||
| Barclays Bank PLC | ||||||||||
| 5/10/06 | 4.80 | 25,000,000 | 25,000,000 | |||||||
| BNP Paribas SA | ||||||||||
| 10/30/06 | 4.81 | 5,000,000 | 5,000,000 | |||||||
| Canadian Imperial Bank of Commerce | ||||||||||
| 4/18/06 | 4.83 (c) | 9,000,000 | 9,000,000 | |||||||
| Credit Suisse First Boston New York Branch | ||||||||||
| 4/19/06 | 4.57 (c) | 5,000,000 | 5,000,000 | |||||||
| 4/19/06 | 4.76 (c) | 5,000,000 | 5,000,000 | |||||||
| 6/26/06 | 4.93 (c) | 5,000,000 | 5,000,000 | |||||||
| Deutsche Bank AG | ||||||||||
| 6/5/06 | 4.80 (c) | 5,000,000 | 5,000,000 | |||||||
| 2/5/07 | 4.90 | 5,000,000 | 5,000,000 | |||||||
| Eurohypo AG | ||||||||||
| 5/2/06 | 4.57 | 5,000,000 | 5,000,000 | |||||||
| 6/29/06 | 4.82 (a) | 4,000,000 | 4,000,000 | |||||||
| Mizuho Corporate Bank Ltd. | ||||||||||
| 5/8/06 | 4.82 | 5,000,000 | 5,000,000 | |||||||
| 5/10/06 | 4.83 | 5,000,000 | 5,000,000 | |||||||
| Skandinaviska Enskilda Banken AB | ||||||||||
| 4/6/06 | 4.50 (c) | 10,000,000 | 9,999,608 | |||||||
| Sumitomo Mitsui Banking Corp. | ||||||||||
| 4/17/06 | 4.75 | 1,000,000 | 1,000,000 | |||||||
| 4/20/06 | 4.77 | 1,000,000 | 1,000,000 | |||||||
| 4/21/06 | 4.80 | 1,000,000 | 1,000,000 | |||||||
| 4/24/06 | 4.80 | 1,000,000 | 1,000,000 | |||||||
| 4/28/06 | 4.82 | 1,000,000 | 1,000,000 | |||||||
| 5/4/06 | 4.81 | 1,000,000 | 1,000,000 | |||||||
See accompanying notes which are an integral part of the financial statements.
| 5 Semiannual Report |
| Investments (Unaudited) continued | ||||||||
| Certificates of Deposit continued | ||||||||
| Due | Annualized Yield at | Principal Amount | Value (Note 1) | |||||
| Date | Time of Purchase | |||||||
| New York Branch, Yankee Dollar, Foreign Banks – continued | ||||||||
| Toronto-Dominion Bank | ||||||||
| 4/7/06 | 3.86% | $ 5,000,000 | $ 5,000,000 | |||||
| Unicredito Italiano Spa | ||||||||
| 5/12/06 | 4.69 (c) | 5,000,000 | 4,999,916 | |||||
| 118,999,524 | ||||||||
| TOTAL CERTIFICATES OF DEPOSIT | 196,396,784 | |||||||
| Commercial Paper 13.6% | ||||||||
| Bavaria TRR Corp. | ||||||||
| 4/20/06 | 4.78 | 5,000,000 | 4,987,439 | |||||
| Citibank Credit Card Master Trust I (Dakota Certificate Program) | ||||||||
| 4/3/06 | 4.53 | 10,000,000 | 9,997,506 | |||||
| 4/4/06 | 4.53 | 2,000,000 | 1,999,252 | |||||
| Citigroup Funding, Inc. | ||||||||
| 4/26/06 | 4.82 | 5,000,000 | 4,983,333 | |||||
| Countrywide Financial Corp. | ||||||||
| 5/26/06 | 4.81 | 5,000,000 | 4,963,715 | |||||
| DaimlerChrysler NA Holding Corp. | ||||||||
| 4/13/06 | 4.83 | 1,000,000 | 998,397 | |||||
| 4/19/06 | 4.86 | 1,000,000 | 997,580 | |||||
| 4/20/06 | 4.87 | 1,000,000 | 997,440 | |||||
| 4/27/06 | 4.89 | 1,000,000 | 996,483 | |||||
| Emerald (MBNA Credit Card Master Note Trust) | ||||||||
| 4/5/06 | 4.53 | 5,000,000 | 4,997,506 | |||||
| 4/28/06 | 4.79 | 10,000,000 | 9,964,225 | |||||
| FCAR Owner Trust | ||||||||
| 4/4/06 | 4.50 | 5,000,000 | 4,998,146 | |||||
| 4/4/06 | 4.52 | 5,000,000 | 4,998,142 | |||||
| 7/18/06 | 4.76 | 5,000,000 | 4,930,250 | |||||
| 9/25/06 | 5.08 | 5,000,000 | 4,878,313 | |||||
| Fortune Brands, Inc. | ||||||||
| 4/10/06 | 4.72 | 500,000 | 499,414 | |||||
| 4/24/06 | 4.76 | 1,000,000 | 996,984 | |||||
| 4/26/06 | 4.79 | 1,000,000 | 996,701 | |||||
| France Telecom SA | ||||||||
| 4/19/06 | 4.84 (b) | 1,000,000 | 997,590 | |||||
| 4/20/06 | 4.65 (b) | 2,500,000 | 2,493,931 | |||||
| 5/3/06 | 4.74 (b) | 500,000 | 497,918 | |||||
See accompanying notes which are an integral part of the financial statements.
| Semiannual Report |
| 6 |
| Commercial Paper continued | ||||||||||
| Due | Annualized Yield at | Principal Amount | Value (Note 1) | |||||||
| Date | Time of Purchase | |||||||||
| John Deere Capital Corp. | ||||||||||
| 4/21/06 | 4.83% | $ 500,000 | $ 498,664 | |||||||
| 5/1/06 | 4.81 | 1,000,000 | 996,017 | |||||||
| 5/1/06 | 4.82 | 1,000,000 | 996,008 | |||||||
| 5/5/06 | 4.87 | 1,000,000 | 995,419 | |||||||
| Kellogg Co. | ||||||||||
| 4/7/06 | 4.71 | 1,000,000 | 999,218 | |||||||
| 4/18/06 | 4.72 | 1,000,000 | 997,785 | |||||||
| 4/25/06 | 4.73 | 1,000,000 | 996,873 | |||||||
| Nissan Motor Acceptance Corp. | ||||||||||
| 5/30/06 | 4.84 | 1,000,000 | 992,166 | |||||||
| Park Granada LLC | ||||||||||
| 5/9/06 | 4.80 | 5,000,000 | 4,974,825 | |||||||
| Skandinaviska Enskilda Banken AB | ||||||||||
| 4/28/06 | 4.79 (c) | 5,000,000 | 5,000,000 | |||||||
| Strand Capital LLC | ||||||||||
| 4/20/06 | 4.81 | 3,725,000 | 3,715,563 | |||||||
| 9/25/06 | 5.09 | 5,000,000 | 4,878,067 | |||||||
| Stratford Receivables Co. LLC | ||||||||||
| 4/11/06 | 4.74 | 5,000,000 | 4,993,444 | |||||||
| 4/27/06 | 4.80 | 5,000,000 | 4,982,721 | |||||||
| The Walt Disney Co. | ||||||||||
| 4/18/06 | 4.68 | 2,500,000 | 2,494,534 | |||||||
| 5/2/06 | 4.81 | 2,000,000 | 1,991,768 | |||||||
| Viacom, Inc. | ||||||||||
| 4/3/06 | 0.00 (b) | 1,000,000 | 999,722 | |||||||
| 4/4/06 | 5.00 (b) | 1,000,000 | 999,583 | |||||||
| 4/11/06 | 5.01 (b) | 1,000,000 | 998,611 | |||||||
| 4/21/06 | 5.02 (b) | 1,000,000 | 997,222 | |||||||
| TOTAL COMMERCIAL PAPER | 116,668,475 | |||||||||
| U.S. Treasury Obligations 0.5% | ||||||||||
| U.S. Treasury Bills – 0.5% | ||||||||||
| 8/3/06 | 4.50 | 4,045,000 | 3,983,696 | |||||||
See accompanying notes which are an integral part of the financial statements.
| 7 Semiannual Report |
| Investments (Unaudited) continued | ||||||
| Master Notes 2.7% | ||||||
| Due | Annualized Yield at | Principal Amount | Value (Note 1) | |||
| Date | Time of Purchase | |||||
| Goldman Sachs Group, Inc. | ||||||
| 4/10/06 | 4.74% (c)(e) | $ 5,000,000 | $ 5,000,000 | |||
| 4/10/06 | 4.76 (c)(e) | 5,000,000 | 5,000,000 | |||
| 4/11/06 | 4.78 (c)(e) | 6,000,000 | 6,000,000 | |||
| 5/30/06 | 4.85 (c)(e) | 7,000,000 | 7,000,000 | |||
| TOTAL MASTER NOTES | 23,000,000 | |||||
| Medium Term Notes 31.6% | ||||||
| AIG Matched Funding Corp. | ||||||
| 4/3/06 | 4.54 (c) | 5,000,000 | 5,000,000 | |||
| 4/11/06 | 4.57 (c) | 5,000,000 | 5,000,000 | |||
| 4/23/06 | 4.62 (c) | 5,000,000 | 5,000,000 | |||
| 6/15/06 | 4.93 (c) | 5,000,000 | 5,000,000 | |||
| Allstate Life Global Funding II | ||||||
| 4/27/06 | 4.81 (b)(c) | 1,000,000 | 1,000,000 | |||
| ASIF Global Financing XXX | ||||||
| 4/24/06 | 4.81 (b)(c) | 9,000,000 | 9,000,000 | |||
| Australia & New Zealand Banking Group Ltd. | ||||||
| 4/24/06 | 4.78 (b)(c) | 3,000,000 | 3,000,000 | |||
| Bank of New York Co., Inc. | ||||||
| 4/27/06 | 4.86 (b)(c) | 5,000,000 | 5,000,000 | |||
| Bayerische Landesbank Girozentrale | ||||||
| 4/18/06 | 4.58 (c) | 5,000,000 | 5,000,000 | |||
| 5/19/06 | 4.78 (c) | 5,000,000 | 5,000,000 | |||
| BellSouth Corp. | ||||||
| 4/26/06 | 4.26 (b)(c) | 500,000 | 500,011 | |||
| BMW U.S. Capital LLC | ||||||
| 4/18/06 | 4.72 (c) | 1,000,000 | 1,000,000 | |||
| Commonwealth Bank of Australia | ||||||
| 4/24/06 | 4.78 (c) | 2,000,000 | 2,000,000 | |||
| Countrywide Bank, Alexandria Virginia | ||||||
| 4/18/06 | 4.76 (c) | 2,000,000 | 1,999,909 | |||
| Cullinan Finance Corp. | ||||||
| 4/18/06 | 4.71 (b)(c) | 5,000,000 | 4,999,728 | |||
| GE Capital Assurance Co. | ||||||
| 4/3/06 | 4.71 (c)(e) | 5,000,000 | 5,000,000 | |||
| General Electric Capital Corp. | ||||||
| 4/7/06 | 4.69 (c) | 13,000,000 | 13,000,000 | |||
| 4/10/06 | 4.79 (c) | 10,500,000 | 10,505,332 | |||
See accompanying notes which are an integral part of the financial statements.
| Semiannual Report |
| 8 |
| Medium Term Notes continued | ||||||||
| Due | Annualized Yield at | Principal Amount | Value (Note 1) | |||||
| Date | Time of Purchase | |||||||
| General Electric Capital Corp. – continued | ||||||||
| 4/18/06 | 4.85% (c) | $ 9,000,000 | $ 9,002,165 | |||||
| HBOS Treasury Services PLC | ||||||||
| 6/26/06 | 5.00 (c) | 5,000,000 | 5,000,000 | |||||
| Household Finance Corp. | ||||||||
| 6/22/06 | 4.99 (c) | 10,000,000 | 10,001,852 | |||||
| HSBC Finance Corp. | ||||||||
| 4/6/06 | 4.65 (c) | 20,000,000 | 20,000,000 | |||||
| 4/24/06 | 4.84 (c) | 3,000,000 | 3,000,000 | |||||
| HSH Nordbank AG | ||||||||
| 4/24/06 | 4.80 (b)(c) | 3,000,000 | 3,000,000 | |||||
| ING USA Annuity & Life Insurance Co. | ||||||||
| 6/26/06 | 5.03 (c)(e) | 2,000,000 | 2,000,000 | |||||
| Links Finance LLC | ||||||||
| 6/23/06 | 4.87 (b)(c) | 10,000,000 | 9,999,097 | |||||
| MBIA Global Funding LLC | ||||||||
| 4/18/06 | 4.56 (b)(c) | 1,000,000 | 1,000,000 | |||||
| Merrill Lynch & Co., Inc. | ||||||||
| 4/18/06 | 4.73 (c) | 5,000,000 | 5,000,000 | |||||
| Metropolitan Life Insurance Co. | ||||||||
| 4/6/06 | 4.67 (b)(c) | 1,626,000 | 1,626,000 | |||||
| 4/6/06 | 4.67 (b)(c) | 1,000,000 | 1,000,000 | |||||
| Morgan Stanley | ||||||||
| 4/3/06 | 4.66 (c) | 5,000,000 | 5,000,000 | |||||
| 4/3/06 | 4.66 (c) | 10,000,000 | 10,000,000 | |||||
| 4/3/06 | 4.91 (c) | 1,000,000 | 1,000,000 | |||||
| 4/18/06 | 4.78 (c) | 3,000,000 | 3,000,000 | |||||
| 4/27/06 | 4.89 (c) | 5,000,000 | 5,000,000 | |||||
| RACERS | ||||||||
| 4/24/06 | 4.79 (b)(c) | 10,000,000 | 10,000,000 | |||||
| Royal Bank of Scotland PLC | ||||||||
| 4/21/06 | 4.75 (b)(c) | 5,000,000 | 5,000,000 | |||||
| SBC Communications, Inc. | ||||||||
| 6/5/06 | 4.02 (b) | 2,105,000 | 2,106,342 | |||||
| 6/5/06 | 4.19 (b) | 100,000 | 100,026 | |||||
| Security Life of Denver Insurance Co. | ||||||||
| 5/30/06 | 4.89 (c)(e) | 1,000,000 | 1,000,000 | |||||
| SLM Corp. | ||||||||
| 4/25/06 | 4.79 (c) | 10,000,000 | 10,001,172 | |||||
| Verizon Global Funding Corp. | ||||||||
| 6/15/06 | 5.02 (b)(c) | 18,000,000 | 17,999,953 | |||||
See accompanying notes which are an integral part of the financial statements.
| 9 Semiannual Report |
| Investments (Unaudited) continued | ||||||||
| Medium Term Notes continued | ||||||||
| Due | Annualized Yield at | Principal Amount | Value (Note 1) | |||||
| Date | Time of Purchase | |||||||
| Washington Mutual Bank FA | ||||||||
| 4/18/06 | 4.73% (c) | $ 1,000,000 | $ 1,000,000 | |||||
| Washington Mutual Bank, California | ||||||||
| 4/27/06 | 4.62 (c) | 5,000,000 | 5,000,000 | |||||
| 5/31/06 | 4.74 (c) | 5,000,000 | 5,000,000 | |||||
| 6/20/06 | 4.91 (c) | 3,000,000 | 3,000,000 | |||||
| 6/20/06 | 4.91 (c) | 1,000,000 | 1,000,000 | |||||
| 7/26/06 | 4.98 (c) | 10,000,000 | 9,999,854 | |||||
| Wells Fargo & Co. | ||||||||
| 4/18/06 | 4.74 (c) | 10,000,000 | 10,000,000 | |||||
| WestLB AG | ||||||||
| 4/10/06 | 4.74 (b)(c) | 3,000,000 | 3,000,000 | |||||
| 6/30/06 | 4.99 (b)(c) | 4,000,000 | 4,000,000 | |||||
| TOTAL MEDIUM TERM NOTES | 269,841,441 | |||||||
| Short Term Notes 0.6% | ||||||||
| New York Life Insurance Co. | ||||||||
| 4/3/06 | 4.66 (c)(e) | 5,000,000 | 5,000,000 | |||||
| Asset Backed Securities 0.1% | ||||||||
| Wind Trust | ||||||||
| 2/25/07 | 4.82 (b)(c) | 1,000,000 | 1,000,000 | |||||
| Municipal Securities 3.4% | ||||||||
| Athens-Clarke County Unified Govt. Dev. Auth. Rev. (Univ. | ||||||||
| of Georgia Athletic Assoc. Proj.) 4.75%, LOC Bank of | ||||||||
| America NA, VRDN (c) | 4,895,000 | 4,895,000 | ||||||
| California Statewide Cmntys. Dev. Auth. Rev. TRAN Series | ||||||||
| C4, 3.93% 6/30/06 | 2,000,000 | 2,000,000 | ||||||
| Connecticut Hsg. Fin. Auth. (Hsg. Mortgage Fin. Prog.) | ||||||||
| Series F2, 4.83% (AMBAC Insured), VRDN (c) | 7,720,000 | 7,720,000 | ||||||
| Hayes Green Beach Memorial Hosp. Corp. 4.93%, LOC | ||||||||
| Fifth Third Bank, Cincinnati, VRDN (c) | 3,350,000 | 3,350,000 | ||||||
See accompanying notes which are an integral part of the financial statements.
| Semiannual Report |
| 10 |
| Municipal Securities continued | ||||||
| Principal Amount | Value (Note 1) | |||||
| Savannah College Art & Design, Inc. Series 2004 BD, | ||||||
| 4.83%, LOC Bank of America NA, VRDN (c) | $ 11,179,987 | $ 11,179,987 | ||||
| TOTAL MUNICIPAL SECURITIES | 29,144,987 | |||||
| Repurchase Agreements 22.1% | ||||||
| Maturity | ||||||
| Amount | ||||||
| In a joint trading account (Collateralized by U.S. Government | ||||||
| Obligations) dated 3/31/06 due 4/3/06 at 4.88% | $ 441,179 | 441,000 | ||||
| With: | ||||||
| Banc of America Securities LLC at 5%, dated 3/31/06 due | ||||||
| 4/3/06 (Collateralized by Mortgage Loan Obligations | ||||||
| valued at $44,100,001, 5.09% 6.39%, 7/14/20 | ||||||
| 2/25/36) | 42,017,500 | 42,000,000 | ||||
| Citigroup Global Markets, Inc. at 4.93%, dated 3/31/06 | ||||||
| due 4/3/06 (Collateralized by Commercial Paper | ||||||
| Obligations valued at $31,620,000, 0%, 4/25/06) | 31,012,723 | 31,000,000 | ||||
| Goldman Sachs & Co. at 4.98%, dated: | ||||||
| 2/22/06 due 5/23/06 (Collateralized by Mortgage Loan | ||||||
| Obligations valued at $17,340,000, 5.57%, | ||||||
| 3/25/36) (c)(d) | 17,211,650 | 17,000,000 | ||||
| 3/31/06 due 4/3/06: | ||||||
| (Collateralized by Corporate Obligations valued at | ||||||
| $1,050,716, 1%, 12/15/33) | 1,000,415 | 1,000,000 | ||||
| (Collateralized by Corporate Obligations valued at | ||||||
| $1,020,000, 4.93%, 10/25/35) | 1,000,415 | 1,000,000 | ||||
| J.P. Morgan Securities, Inc. at 4.98%, dated 3/29/06 due | ||||||
| 5/11/06 (Collateralized by Corporate Obligations valued | ||||||
| at $8,414,976, 8.75% – 8.88%, 5/15/31 - | ||||||
| 3/15/32) (c)(d) | 8,047,587 | 8,000,000 | ||||
| Merrill Lynch, Pierce, Fenner & Smith at: | ||||||
| 4.92%, dated 3/31/06 due 4/3/06 (Collateralized by | ||||||
| Mortgage Loan Obligations valued at $14,702,393, | ||||||
| 5.75% – 5.95%, 8/5/18 – 11/25/35) | 14,005,734 | 14,000,000 | ||||
| 4.93%, dated 3/31/06 due 4/3/06 (Collateralized by | ||||||
| Commercial Paper Obligations valued at $13,260,976, | ||||||
| 0%, 4/3/06 – 4/27/06) | 13,005,335 | 13,000,000 | ||||
| 5.01%, dated 1/23/06 due 4/21/06 (Collateralized by | ||||||
| Corporate Obligations valued at $10,514,975, 6.88% - | ||||||
| 8.75%, 3/15/10 – 5/15/13) (c)(d) | 10,122,467 | 10,000,000 | ||||
See accompanying notes which are an integral part of the financial statements.
11 Semiannual Report
| Investments (Unaudited) continued | ||||||
| Repurchase Agreements continued | ||||||
| Maturity | Value (Note 1) | |||||
| Amount | ||||||
| With: – continued | ||||||
| Morgan Stanley & Co. at 4.88%, dated 3/29/06 due | ||||||
| 5/11/06 (Collateralized by Mortgage Loan Obligations | ||||||
| valued at $10,303,715, 0% – 7.5%, 11/25/08 - | ||||||
| 1/27/36) | $10,058,289 | $ 10,000,000 | ||||
| Wachovia Securities, Inc. at 4.94%, dated 3/31/06 due | ||||||
| 4/3/06 (Collateralized by Mortgage Loan Obligations | ||||||
| valued at $42,840,000, 4.74%, 5.61%, 6/10/44 | ||||||
| 3/15/45) | 42,017,290 | 42,000,000 | ||||
| TOTAL REPURCHASE AGREEMENTS | 189,441,000 | |||||
| TOTAL INVESTMENT PORTFOLIO 100.1% | ||||||
| (Cost $855,730,092) | 855,730,092 | |||||
| NET OTHER ASSETS – (0.1)% | (557,218) | |||||
| NET ASSETS 100% | $ 855,172,874 | |||||
| Security Type Abbreviations | ||||
| TRAN | — | TAX AND REVENUE | ||
| ANTICIPATION NOTE | ||||
| VRDN | — | VARIABLE RATE DEMAND | ||
| NOTE | ||||
| Legend (a) Debt obligation initially issued at one coupon which converts to a higher coupon at a specified date. The rate shown is the rate at period end. (b) Security exempt from registration under Rule 144A of the Securities Act of 1933. These securities may be resold in transactions exempt from registration, normally to qualified institutional buyers. At the period end, the value of these securities amounted to $91,315,734 or 10.7% of net assets. |
| (c) The coupon rate shown on floating or adjustable rate securities represents the rate at period end. The due dates on these types of securities reflect the next interest rate reset date or, when applicable, the final maturity date. (d) The maturity amount is based on the rate at period end. |
See accompanying notes which are an integral part of the financial statements.
Semiannual Report 12
| (e) Restricted securities – Investment in securities not registered under the Securities Act of 1933 (excluding 144A issues). At the end of the period, the value of restricted securities (excluding 144A issues) amounted to $36,000,000 or 4.2% of net assets. |
Additional information on each holding is as follows:
| Acquisition | ||||||
| Security | Date | Cost | ||||
| GE Capital | ||||||
| Assurance Co. | ||||||
| 4.71%, 4/3/06 | 7/28/05 | $ 5,000,000 | ||||
| Goldman Sachs | ||||||
| Group, Inc.: | ||||||
| 4.74%, 4/10/06 | 1/9/06 | $ 5,000,000 | ||||
| 4.76%, 4/10/06 | 11/10/05 | $ 5,000,000 | ||||
| 4.78%, 4/11/06 | 10/11/05 | $ 6,000,000 | ||||
| 4.85%, 5/30/06 | 8/26/04 | $ 7,000,000 | ||||
| ING USA Annuity | ||||||
| & Life Insurance | ||||||
| Co. 5.03%, | ||||||
| 6/26/06 | 6/23/05 | $ 2,000,000 | ||||
| New York Life | ||||||
| Insurance Co. | ||||||
| 4.66%, 4/3/06 | 2/28/02 | $ 5,000,000 | ||||
| Security Life of | ||||||
| Denver Insurance | ||||||
| Co. 4.89%, | ||||||
| 5/30/06 | 8/26/05 | $ 1,000,000 |
Income Tax Information
At September 30, 2005, the fund had a capital loss carryforward of approximately $34,915 of which $10,044, $7,239 and $17,632 will expire on September 30, 2011, 2012 and 2013, respectively.
See accompanying notes which are an integral part of the financial statements.
13 Semiannual Report
| Financial Statements | ||||||
| Statement of Assets and Liabilities | ||||||
| March 31, 2006 (Unaudited) | ||||||
| Assets | ||||||
| Investment in securities, at value (including repurchase | ||||||
| agreements of $189,441,000) See accompanying | ||||||
| schedule: | ||||||
| Unaffiliated issuers (cost $855,730,092) | $ 855,730,092 | |||||
| Cash | 45,288 | |||||
| Interest receivable | 3,165,664 | |||||
| Prepaid expenses | 2,823 | |||||
| Total assets | 858,943,867 | |||||
| Liabilities | ||||||
| Payable for investments purchased | $ 1,000,000 | |||||
| Distributions payable | 2,748,813 | |||||
| Other payables and accrued expenses | 22,180 | |||||
| Total liabilities | 3,770,993 | |||||
| Net Assets | $ 855,172,874 | |||||
| Net Assets consist of: | ||||||
| Paid in capital | $ 855,328,026 | |||||
| Undistributed net investment income | 21,315 | |||||
| Accumulated undistributed net realized gain (loss) on | ||||||
| investments | (176,467) | |||||
| Net Assets, for 855,322,783 shares outstanding | $ 855,172,874 | |||||
| Net Asset Value, offering price and redemption price per | ||||||
| share ($855,172,874 ÷ 855,322,783 shares) | $ 1.00 | |||||
See accompanying notes which are an integral part of the financial statements.
| Semiannual Report |
| 14 |
| Statement of Operations | ||||||
| Six months ended March 31, 2006 (Unaudited) | ||||||
| Investment Income | ||||||
| Interest (including $63,063 from affiliated interfund | ||||||
| lending) | $ 18,717,675 | |||||
| Expenses | ||||||
| Independent trustees’ compensation | $ 1,771 | |||||
| Custodian fees and expenses | 12,685 | |||||
| Audit | 17,646 | |||||
| Legal | 420 | |||||
| Insurance | 2,418 | |||||
| Miscellaneous | 601 | |||||
| Total expenses before reductions | 35,541 | |||||
| Expense reductions | (1,567) | 33,974 | ||||
| Net investment income | 18,683,701 | |||||
| Realized and Unrealized Gain (Loss) | ||||||
| Net realized gain (loss) on: | ||||||
| Investment securities: | ||||||
| Unaffiliated issuers | 728 | |||||
| Net increase in net assets resulting from operations | $ 18,684,429 | |||||
See accompanying notes which are an integral part of the financial statements.
15 Semiannual Report
| Financial Statements continued | ||||||||
| Statement of Changes in Net Assets | ||||||||
| Six months ended | Year ended | |||||||
| March 31, 2006 | September 30, | |||||||
| (Unaudited) | 2005 | |||||||
| Increase (Decrease) in Net Assets | ||||||||
| Operations | ||||||||
| Net investment income | $ 18,683,701 | $ 22,702,356 | ||||||
| Net realized gain (loss) | 728 | (137,557) | ||||||
| Net increase in net assets resulting | ||||||||
| from operations | 18,684,429 | 22,564,799 | ||||||
| Distributions to shareholders from net investment income . | (18,686,148) | (22,695,776) | ||||||
| Share transactions at net asset value of $1.00 per share | ||||||||
| Proceeds from sales of shares | 50,000,000 | — | ||||||
| Reinvestment of distributions | 3,790,202 | 3,520,914 | ||||||
| Cost of shares redeemed | (20,000,000) | — | ||||||
| Net increase (decrease) in net assets and shares | ||||||||
| resulting from share transactions | 33,790,202 | 3,520,914 | ||||||
| Total increase (decrease) in net assets | 33,788,483 | 3,389,937 | ||||||
| Net Assets | ||||||||
| Beginning of period | 821,384,391 | 817,994,454 | ||||||
| End of period (including undistributed net investment | ||||||||
| income of $21,315 and undistributed net investment | ||||||||
| income of $23,762, respectively) | $ 855,172,874 | $ 821,384,391 | ||||||
See accompanying notes which are an integral part of the financial statements.
| Semiannual Report |
| 16 |
| Financial Highlights | ||||||||||||||||||||||||
| Six months ended | ||||||||||||||||||||||||
| March 31, 2006 | Years ended September 30, | |||||||||||||||||||||||
| (Unaudited) | 2005 | 2004 | 2003 | 2002 | 2001 | |||||||||||||||||||
| Selected Per Share Data | ||||||||||||||||||||||||
| Net asset value, | ||||||||||||||||||||||||
| beginning of period | $ 1.00 | $ 1.00 | $ 1.00 | $ 1.00 | $ 1.00 | $ 1.00 | ||||||||||||||||||
| Income from | ||||||||||||||||||||||||
| Investment | ||||||||||||||||||||||||
| Operations | ||||||||||||||||||||||||
| Net investment | ||||||||||||||||||||||||
| income | 022 | .028 | .013 | .014 | .022 | .054 | ||||||||||||||||||
| Distributions from net | ||||||||||||||||||||||||
| investment income | (.022) | (.028) | (.013) | (.014) | (.022) | (.054) | ||||||||||||||||||
| Net asset value, | ||||||||||||||||||||||||
| end of period | $ 1.00 | $ 1.00 | $ 1.00 | $ 1.00 | $ 1.00 | $ 1.00 | ||||||||||||||||||
| Total ReturnB,C | 2.17% | 2.80% | 1.27% | 1.43% | 2.24% | 5.51% | ||||||||||||||||||
| Ratios to Average Net AssetsD | ||||||||||||||||||||||||
| Expenses before | ||||||||||||||||||||||||
| reductions | 0082%A | .0077% | .0070% | .0073% | .0076% | .0095% | ||||||||||||||||||
| Expenses net of fee | ||||||||||||||||||||||||
| waivers, if any | 0082%A | .0077% | .0070% | .0073% | .0076% | .0095% | ||||||||||||||||||
| Expenses net of all | ||||||||||||||||||||||||
| reductions | 0078%A | .0076% | .0070% | .0073% | .0076% | .0094% | ||||||||||||||||||
| Net investment | ||||||||||||||||||||||||
| income | 4.31%A | 2.77% | 1.27% | 1.42% | 2.24% | 5.40% | ||||||||||||||||||
| Supplemental Data | ||||||||||||||||||||||||
| Net assets, | ||||||||||||||||||||||||
| end of period | ||||||||||||||||||||||||
| (000 omitted) | $ 855,173 | $ 821,384 | $ 817,994 | $ 816,443 | $ 765,618 | $ 852,435 | ||||||||||||||||||
| A Annualized B Total returns for periods of less than one year are not annualized. C Total returns would have been lower had certain expenses not been reduced during the periods shown. D Expense ratios reflect operating expenses of the fund. Expenses before reductions do not reflect amounts reimbursed by the investment adviser or expense offset arrangements and do not represent the amount paid by the fund during periods when reimbursements or reductions occur. Ex penses net of fee waivers reflect expenses after reimbursement by the investment adviser but prior to reductions from expense offset arrange ments. Expenses net of all reductions represent the net expenses paid by the fund. |
See accompanying notes which are an integral part of the financial statements.
17 Semiannual Report
Notes to Financial Statements
For the period ended March 31, 2006 (Unaudited)
1. Significant Accounting Policies.
Fidelity Money Market Central Fund (the fund) is a fund of Fidelity Garrison Street Trust (the trust) and is authorized to issue an unlimited number of shares. The trust is registered under the Investment Company Act of 1940, as amended (the 1940 Act), as an open end management investment company organized as a Massachusetts business trust. Shares of the fund are only offered to other investment companies and accounts (the investing funds) managed by Fidelity Management & Research Company (FMR), or its affiliates. The financial statements have been prepared in conformity with accounting principles generally accepted in the United States of America, which require manage ment to make certain estimates and assumptions at the date of the financial statements. The following summarizes the significant accounting policies of the fund:
Security Valuation. As permitted by compliance with certain conditions under Rule 2a 7 of the 1940 Act, securities are valued at amortized cost, which approximates value.
Investment Transactions and Income. Security transactions are accounted for as of trade date. Gains and losses on securities sold are determined on the basis of identified cost. Interest income is accrued as earned. Interest income includes coupon interest and amortization of premium and accretion of discount on debt securities.
Expenses. Most expenses of the trust can be directly attributed to a fund. Expenses which cannot be directly attributed are apportioned among each fund in the trust.
Income Tax Information and Distributions to Shareholders. Each year, the fund intends to qualify as a regulated investment company by distributing all of its taxable income and realized gains under Subchapter M of the Internal Revenue Code. As a result, no provision for income taxes is required in the accompanying financial statements.
Dividends are declared daily and paid monthly from net investment income. Distribu tions from realized gains, if any, are recorded on the ex dividend date. Income and capital gain distributions are determined in accordance with income tax regulations, which may differ from generally accepted accounting principles.
Capital accounts within the financial statements are adjusted for permanent book tax differences. These adjustments have no impact on net assets or the results of operations. Temporary book tax differences will reverse in a subsequent period.
Book tax differences are primarily due to capital loss carryforwards and losses deferred due to wash sales and excise tax regulations.
| Semiannual Report |
| 18 |
| 1. Significant Accounting Policies continued | ||
| Income Tax Information and Distributions to Shareholders continued | ||
The federal tax cost of investments and unrealized appreciation (depreciation) as of period end were as follows:
| Unrealized appreciation | $ — | |||
| Unrealized depreciation | — | |||
| Net unrealized appreciation (depreciation) | $ — | |||
| Cost for federal income tax purposes | $ 855,730,092 | |||
| 2. Operating Policies. | ||||
Repurchase Agreements. FMR has received an Exemptive Order from the Securities and Exchange Commission (the SEC) which permits the fund and other affiliated entities of FMR to transfer uninvested cash balances into joint trading accounts which are then invested in repurchase agreements. The fund may also invest directly with institutions in repurchase agreements. Repurchase agreements are collateralized by government or non government securities. Upon settlement date, collateral is held in segregated accounts with custodian banks and may be obtained in the event of a default of the counterparty. The fund monitors, on a daily basis, the value of the collateral to ensure it is at least equal to the principal amount of the repurchase agreement (includ ing accrued interest). In the event of a default by the counterparty, realization of the collateral proceeds could be delayed, during which time the value of the collateral may decline.
Restricted Securities. The fund may invest in securities that are subject to legal or contractual restrictions on resale. These securities generally may be resold in transac tions exempt from registration or to the public if the securities are registered. Disposal of these securities may involve time consuming negotiations and expense, and prompt sale at an acceptable price may be difficult. Information regarding restricted securities is included at the end of the fund’s Schedule of Investments.
3. Fees and Other Transactions with Affiliates.
Management Fee. Fidelity Investments Money Management, Inc. (FIMM), an affiliate of FMR, provides the fund with investment management services. The fund does not pay any fees for these services.
19 Semiannual Report
| Notes to Financial Statements (Unaudited) continued |
3. Fees and Other Transactions with Affiliates continued |
Interfund Lending Program. Pursuant to an Exemptive Order issued by the SEC, the fund, along with other registered investment companies having management contracts with FMR, may participate in an interfund lending program. This program provides an alternative credit facility allowing the funds to borrow from, or lend money to, other participating affiliated funds. At period end, there were no interfund loans outstanding. The fund’s activity in this program during the period for which loans were outstanding was as follows:
| Average Daily Loan | Weighted Average | |||
| Borrower or Lender | Balance | Interest Rate | ||
| Lender | $ 20,891,769 | 4.18% | ||
| 4. Expense Reductions. | ||||
Through arrangements with the fund’s custodian, credits realized as a result of unin vested cash balances were used to reduce the fund’s expenses. During the period, these credits reduced the fund’s custody expense by $1,567.
| 5. Other. |
The fund’s organizational documents provide former and current trustees and officers with a limited indemnification against liabilities arising in connection with the performance of their duties to the fund. In the normal course of business, the fund may also enter into contracts that provide general indemnifications. The fund’s maximum exposure under these arrangements is unknown as this would be dependent on future claims that may be made against the fund. The risk of material loss from such claims is considered remote.
At the end of the period mutual funds managed by FMR or an FMR affiliate were the owners of record of all of the outstanding shares of the fund.
| Semiannual Report |
| 20 |
Proxy Voting Results
A special meeting of the fund’s shareholders was held on February 15, 2006. The results of votes taken among shareholders on the proposal before them are reported below. Each vote reported represents one dollar of net asset value held on the record date for the meeting.
| PROPOSAL 1 | ||||
| To elect a Board of Trustees.A | ||||
| # of | % of | |||
| Votes | Votes | |||
| Dennis J. Dirks | ||||
| Affirmative | 672,343,759.36 | 100.000 | ||
| Withheld | 00 | 00.000 | ||
| TOTAL | 672,343,759.36 | 100.000 | ||
| Albert R. Gamper, Jr. | ||||
| Affirmative | 672,343,759.36 | 100.000 | ||
| Withheld | 00 | 00.000 | ||
| TOTAL | 672,343,759.36 | 100.000 | ||
| Robert M. Gates | ||||
| Affirmative | 672,343,759.36 | 100.000 | ||
| Withheld | 00 | 00.000 | ||
| TOTAL | 672,343,759.36 | 100.000 | ||
| George H. Heilmeier | ||||
| Affirmative | 672,343,759.36 | 100.000 | ||
| Withheld | 00 | 00.000 | ||
| TOTAL | 672,343,759.36 | 100.000 | ||
| Edward C. Johnson 3d | ||||
| Affirmative | 672,343,759.36 | 100.000 | ||
| Withheld | 00 | 00.000 | ||
| TOTAL | 672,343,759.36 | 100.000 | ||
| Stephen P. Jonas | ||||
| Affirmative | 672,343,759.36 | 100.000 | ||
| Withheld | 00 | 00.000 | ||
| TOTAL | 672,343,759.36 | 100.000 | ||
| # of | % of | |||
| Votes | Votes | |||
| Marie L. Knowles | ||||
| Affirmative | 672,343,759.36 | 100.000 | ||
| Withheld | 00 | 00.000 | ||
| TOTAL | 672,343,759.36 | 100.000 | ||
| Ned C. Lautenbach | ||||
| Affirmative | 672,343,759.36 | 100.000 | ||
| Withheld | 00 | 00.000 | ||
| TOTAL | 672,343,759.36 | 100.000 | ||
| William O. McCoy | ||||
| Affirmative | 672,343,759.36 | 100.000 | ||
| Withheld | 00 | 00.000 | ||
| TOTAL | 672,343,759.36 | 100.000 | ||
| Robert L. Reynolds | ||||
| Affirmative | 672,343,759.36 | 100.000 | ||
| Withheld | 00 | 00.000 | ||
| TOTAL | 672,343,759.36 | 100.000 | ||
| Cornelia M. Small | ||||
| Affirmative | 672,343,759.36 | 100.000 | ||
| Withheld | 00 | 00.000 | ||
| TOTAL | 672,343,759.36 | 100.000 | ||
| William S. Stavropoulos | ||||
| Affirmative | 672,343,759.36 | 100.000 | ||
| Withheld | 00 | 00.000 | ||
| TOTAL | 672,343,759.36 | 100.000 | ||
| Kenneth L. Wolfe | ||||
| Affirmative | 672,343,759.36 | 100.000 | ||
| Withheld | 00 | 00.000 | ||
| TOTAL | 672,343,759.36 | 100.000 | ||
A Denotes trust-wide proposal and voting results.
21 Semiannual Report
Board Approval of Investment Advisory Contracts and Management Fees
Money Market Central Fund
On January 19, 2006, the Board of Trustees, including the Independent Trustees (together, the Board), voted to approve a general research services agreement (the Agreement) between FMR, FMR Co., Inc. (FMRC), Fidelity Investments Money Manage ment, Inc. (FIMM), and Fidelity Research & Analysis Company (FRAC) (together, the Investment Advisers) for the fund, effective January 20, 2006, pursuant to which FRAC may provide general research and investment advisory support services to FMRC and FIMM. The Board considered that it has approved previously various sub advisory agreements for the fund with affiliates of FIMM that allow FIMM to obtain research, non discretionary advice, or discretionary portfolio management at no additional expense to the fund. The Board, assisted by the advice of fund counsel and independent Trustees’ counsel, considered a broad range of information and determined that it would be beneficial for the fund to access the research and investment advisory support services supplied by FRAC at no additional expense to the fund.
The Board reached this determination in part because the new arrangement will involve no changes in (i) the contractual terms of and fees payable under the fund’s manage ment contract or sub advisory agreements; (ii) the investment process or strategies employed in the management of the fund’s assets; (iii) the nature or level of services provided under the fund’s management contract or sub advisory agreements; (iv) the day to day management of the fund or the persons primarily responsible for such man agement; or (v) the ultimate control or beneficial ownership of FMR, FMRC, or FIMM. The Board also considered that the establishment of the Agreement would not necessi tate prior shareholder approval of the Agreement or result in an assignment and termination of the fund’s management contract or sub advisory agreements under the Investment Company Act of 1940.
Because the Board was approving an arrangement with FRAC under which the fund will not bear any additional management fees or expenses and under which the fund’s portfolio manager would not change, it did not consider the fund’s investment perfor mance, competitiveness of management fee and total expenses, costs of services and profitability, or economies of scale to be significant factors in its decision.
In connection with its future renewal of the fund’s management contract and sub advisory agreements, the Board will consider: (i) the nature, extent, and quality of services provided to the fund, including shareholder and administrative services and investment performance; (ii) the competitiveness of the fund’s management fee and total expenses; (iii) the costs of the services and profitability, including the revenues earned and the expenses incurred by Fidelity in conducting the business of developing, marketing, distributing, managing, administering, and servicing the fund and its share holders; and (iv) whether there have been economies of scale in respect of the manage ment of the Fidelity funds, whether the Fidelity funds (including the fund) have
| Semiannual Report |
| 22 |
appropriately benefited from any such economies of scale, and whether there is potential for realization of any further economies.
Based on its evaluation of all of the conclusions noted above, and after considering all material factors, the Board ultimately concluded that the fund’s Agreement is fair and reasonable, and that the fund’s Agreement should be approved.
23 Semiannual Report
| Fidelity® Ultra Short Central Fund |
| Semiannual Report March 31, 2006 |
| To view a fund’s proxy voting guidelines and proxy voting record for the 12 month period ended June 30, visit www.fidelity.com/proxyvotingresults or visit the Securities and Exchange Commission’s (SEC) web site at www.sec.gov. You may also call 1 800 544 8544 to request a free copy of the proxy voting guidelines. Standard & Poor’s, S&P and S&P 500 are registered service marks of The McGraw Hill Companies, Inc. and have been licensed for use by Fidelity Distributors Corporation. Other third party marks appearing herein are the property of their respective owners. All other marks appearing herein are registered or unregistered trademarks or service marks of FMR Corp. or an affiliated company. A fund files its complete schedule of portfolio holdings with the SEC for the first and third quarters of each fiscal year on Form N Q. Forms N Q are available on the SEC’s web site at http://www.sec.gov. A fund’s Forms N Q may be reviewed and copied at the SEC’s Public Reference Room in Washington, DC. Information regarding the operation of the SEC’s Public Reference Room may be obtained by calling 1-800-SEC-0330. |
| USC SANN-0506 431656.1.0 1.771938.104 |
Shareholder Expense Example
As a shareholder of the Fund, you incur two types of costs: (1) transaction costs, and (2) ongoing costs, including management fees and other Fund expenses. This Example is intended to help you understand your ongoing costs (in dollars) of investing in the Fund and to compare these costs with the ongoing costs of investing in other mutual funds. The Example is based on an investment of $1,000 invested at the beginning of the period and held for the entire period (October 1, 2005 to March 31, 2006).
| Actual Expenses |
The first line of the table below provides information about actual account values and actual expenses. You may use the information in this line, together with the amount you invested, to estimate the expenses that you paid over the period. Simply divide your account value by $1,000.00 (for example, an $8,600 account value divided by $1,000.00 = 8.6), then multiply the result by the number in the first line under the heading entitled “Expenses Paid During Period” to estimate the expenses you paid on your account during this period.
Hypothetical Example for Comparison Purposes
The second line of the table below provides information about hypothetical account values and hypothetical expenses based on the Fund’s actual expense ratio and an assumed rate of return of 5% per year before expenses, which is not the Fund’s actual return. The hypothetical account values and expenses may not be used to estimate the actual ending account balance or expenses you paid for the period. You may use this information to compare the ongoing costs of investing in the Fund and other funds. To do so, compare this 5% hypothetical example with the 5% hypothetical examples that appear in the share holder reports of the other funds.
Please note that the expenses shown in the table are meant to highlight your ongoing costs only and do not reflect any transaction costs. Therefore, the second line of the table is useful in comparing ongoing costs only, and will not help you determine the relative total costs of owning different funds.
| Expenses Paid | ||||||||||||
| Beginning | Ending | During Period* | ||||||||||
| Account Value | Account Value | October 1, 2005 | ||||||||||
| October 1, 2005 | March 31, 2006 | to March 31, 2006 | ||||||||||
| Actual | $ 1,000.00 | $ 1,023.00 | $ .02 | |||||||||
| Hypothetical (5% return per year | ||||||||||||
| before expenses) | $ 1,000.00 | $ 1,024.91 | $ .02 | |||||||||
* Expenses are equal to the Fund’s annualized expense ratio of .0041%; multiplied by the average account value over the period, multiplied by 182/365 (to reflect the one half year period).
| Semiannual Report |
| 26 |
Investment Changes
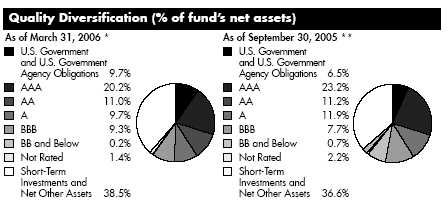
We have used ratings from Moody’s Investors Services, Inc. Where Moody’s ratings are not available, we have used S&P ratings. Securities rated BB or below were rated investment grade at the time of acquisition.
| Average Years to Maturity as of March 31, 2006 | ||||
| 6 months ago | ||||
| Years | 1.6 | 1.5 | ||
Average years to maturity is based on the average time remaining until principal payments are expected from each of the fund’s bonds, weighted by dollar amount.
| Duration as of March 31, 2006 | ||||||
| 6 months ago | ||||||
| Years | 0.2 | 0.1 | ||||
Duration shows how much a bond fund’s price fluctuates with changes in comparable interest rates. If rates rise 1%, for example, a fund with a five year duration is likely to lose about 5% of its value. Other factors also can influence a bond fund’s performance and share price. Accordingly, a bond fund’s actual performance may differ from this example.
27 Semiannual Report
| Investments March 31, 2006 | ||||||||
| Showing Percentage of Net Assets | ||||||||
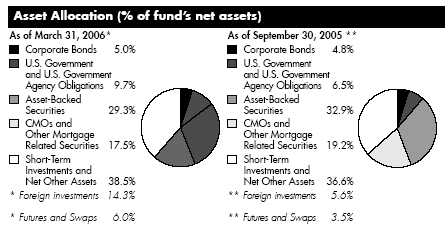
| Nonconvertible Bonds 5.0% | ||||||||
| Principal Amount | Value (Note 1) | |||||||
| CONSUMER DISCRETIONARY – 1.1% | ||||||||
| Auto Components 0.5% | ||||||||
| DaimlerChrysler NA Holding Corp.: | ||||||||
| 5.3% 3/13/09 (d) | $ 9,650,000 | $ 9,651,679 | ||||||
| 5.36% 9/10/07 (d) | 16,665,000 | 16,712,662 | ||||||
| Johnson Controls, Inc. 4.83% 1/17/08 (d) | 12,045,000 | 12,060,104 | ||||||
| 38,424,445 | ||||||||
| Media – 0.6% | ||||||||
| Continental Cablevision, Inc. 8.3% 5/15/06 | 8,000,000 | 8,024,616 | ||||||
| Cox Communications, Inc. (Reg. S) 5.45% 12/14/07 (d) | 12,140,000 | 12,217,562 | ||||||
| Liberty Media Corp. 6.41% 9/17/06 (d) | 16,694,000 | 16,762,278 | ||||||
| Univision Communications, Inc. 2.875% 10/15/06 | 8,505,000 | 8,395,490 | ||||||
| 45,399,946 | ||||||||
| TOTAL CONSUMER DISCRETIONARY | 83,824,391 | |||||||
| ENERGY 0.2% | ||||||||
| Oil, Gas & Consumable Fuels – 0.2% | ||||||||
| Enterprise Products Operating LP 4% 10/15/07 | 12,585,000 | 12,311,931 | ||||||
| FINANCIALS – 2.1% | ||||||||
| Commercial Banks – 0.4% | ||||||||
| Santander US Debt SA Unipersonal 4.6738% | ||||||||
| 10/21/08 (a)(d) | 15,000,000 | 14,998,530 | ||||||
| Wells Fargo & Co. 4.92% 3/10/08 (d) | 16,600,000 | 16,606,740 | ||||||
| 31,605,270 | ||||||||
| Consumer Finance – 0.4% | ||||||||
| MBNA Capital I 8.278% 12/1/26 | 6,295,000 | 6,644,108 | ||||||
| MBNA Europe Funding PLC 4.95% 9/7/07 (a)(d) | 19,925,000 | 19,933,687 | ||||||
| 26,577,795 | ||||||||
| Diversified Financial Services – 0.4% | ||||||||
| Aspetuck Trust 4.72% 10/16/06 (d)(g) | 17,585,000 | 17,743,793 | ||||||
| CC Funding Trust I 6.9% 2/16/07 | 13,305,000 | 13,449,931 | ||||||
| 31,193,724 | ||||||||
| Insurance – 0.1% | ||||||||
| Oil Insurance Ltd. 4.865% 10/6/06 (a)(d) | 6,710,000 | 6,706,222 | ||||||
| Real Estate 0.3% | ||||||||
| iStar Financial, Inc. 5.4669% 3/16/09 (d) | 20,710,000 | 20,810,588 | ||||||
| Thrifts & Mortgage Finance – 0.5% | ||||||||
| Countrywide Financial Corp. 4.72% 4/11/07 (d) | 11,025,000 | 11,034,559 | ||||||
See accompanying notes which are an integral part of the financial statements.
| Semiannual Report |
| 28 |
| Nonconvertible Bonds continued | ||||
| Principal Amount | Value (Note 1) | |||
| FINANCIALS – continued | ||||
| Thrifts & Mortgage Finance – continued | ||||
| Residential Capital Corp. 6.335% 6/29/07 (d) | $ 14,150,000 | $ 14,255,304 | ||
| Washington Mutual Bank 4.9% 8/25/08 (d) | 16,325,000 | 16,334,485 | ||
| 41,624,348 | ||||
| TOTAL FINANCIALS | 158,517,947 | |||
| TELECOMMUNICATION SERVICES – 0.8% | ||||
| Diversified Telecommunication Services – 0.7% | ||||
| Deutsche Telekom International Finance BV 5.12% | ||||
| 3/23/09 (d) | 11,500,000 | 11,502,783 | ||
| GTE Corp. 6.36% 4/15/06 | 9,000,000 | 9,002,259 | ||
| SBC Communications, Inc. 4.389% 6/5/06 (a) | 15,315,000 | 15,293,100 | ||
| Sprint Capital Corp. 4.78% 8/17/06 | 6,000,000 | 5,987,634 | ||
| Telefonos de Mexico SA de CV 4.5% 11/19/08 | 10,240,000 | 9,957,059 | ||
| TELUS Corp. yankee 7.5% 6/1/07 | 6,500,000 | 6,646,881 | ||
| 58,389,716 | ||||
| Wireless Telecommunication Services – 0.1% | ||||
| Verizon Wireless Capital LLC 5.375% 12/15/06 | 5,610,000 | 5,610,623 | ||
| TOTAL TELECOMMUNICATION SERVICES | 64,000,339 | |||
| UTILITIES – 0.8% | ||||
| Electric Utilities – 0.1% | ||||
| FirstEnergy Corp. 5.5% 11/15/06 | 7,752,000 | 7,753,985 | ||
| Independent Power Producers & Energy Traders – 0.1% | ||||
| Duke Capital LLC 4.331% 11/16/06 | 12,460,000 | 12,389,638 | ||
| Multi-Utilities – 0.6% | ||||
| Dominion Resources, Inc. 5.2648% 9/28/07 (d) | 17,150,000 | 17,164,698 | ||
| DTE Energy Co. 6.45% 6/1/06 | 13,190,000 | 13,212,133 | ||
| NiSource, Inc. 3.628% 11/1/06 | 8,410,000 | 8,322,006 | ||
| Sempra Energy 4.75% 5/15/09 | 5,500,000 | 5,385,501 | ||
| 44,084,338 | ||||
| TOTAL UTILITIES | 64,227,961 | |||
| TOTAL NONCONVERTIBLE BONDS | ||||
| (Cost $383,093,473) | 382,882,569 | |||
See accompanying notes which are an integral part of the financial statements.
29 Semiannual Report
| Investments continued | ||||
| U.S. Government Agency Obligations 0.8% | ||||
| Principal Amount | Value (Note 1) | |||
| Freddie Mac 0% 9/29/06 (c) | ||||
| (Cost $57,422,085) | $ 58,700,000 | $ 57,264,022 | ||
| Asset Backed Securities 29.3% | ||||
| Accredited Mortgage Loan Trust: | ||||
| Series 2004-2 Class A2, 5.1181% 7/25/34 (d) | 17,559,910 | 17,601,740 | ||
| Series 2004-3 Class 2A4, 5.1681% 10/25/34 (d) | 7,662,669 | 7,675,879 | ||
| Series 2004-4 Class A2D, 5.1681% 1/25/35 (d) | 2,359,873 | 2,365,996 | ||
| Series 2005-1 Class M1, 5.2881% 4/25/35 (d) | 11,280,000 | 11,325,214 | ||
| ACE Securities Corp.: | ||||
| Series 2002-HE1 Class M1, 5.4681% 6/25/32 (d) | 1,842,987 | 1,863,531 | ||
| Series 2002-HE2 Class M1, 5.6681% 8/25/32 (d) | 18,631,213 | 18,650,060 | ||
| Series 2003-HS1: | ||||
| Class M1, 5.5681% 6/25/33 (d) | 800,000 | 805,365 | ||
| Class M2, 6.5681% 6/25/33 (d) | 856,000 | 868,011 | ||
| Series 2003-NC1 Class M1, 5.5981% 7/25/33 (d) | 1,600,000 | 1,607,310 | ||
| Series 2004-HE1: | ||||
| Class M1, 5.3181% 2/25/34 (d) | 2,193,000 | 2,200,180 | ||
| Class M2, 5.9181% 2/25/34 (d) | 2,475,000 | 2,492,267 | ||
| Series 2004-OP1: | ||||
| Class M1, 5.3381% 4/25/34 (d) | 4,420,000 | 4,424,429 | ||
| Class M2, 5.8681% 4/25/34 (d) | 8,685,000 | 8,832,323 | ||
| Series 2005-HE2: | ||||
| Class M2, 5.2681% 4/25/35 (d) | 1,803,000 | 1,809,238 | ||
| Class M3, 5.2981% 4/25/35 (d) | 1,040,000 | 1,045,658 | ||
| Class M4, 5.4581% 4/25/35 (d) | 1,340,000 | 1,347,189 | ||
| Series 2005-HE3: | ||||
| Class A2A, 4.9181% 5/25/35 (d) | 3,675,448 | 3,675,924 | ||
| Class A2B, 5.0281% 5/25/35 (d) | 4,370,000 | 4,371,616 | ||
| Series 2005-HE7 Class A2B, 4.9981% 11/25/35 (d) | 25,000,000 | 24,999,780 | ||
| Series 2005-SD1 Class A1, 5.2181% 11/25/50 (d) | 1,810,519 | 1,812,710 | ||
| Aegis Asset Backed Securities Trust Series 2004-2N | ||||
| Class N1, 4.5% 4/25/34 (a) | 199,209 | 198,942 | ||
| Aesop Funding II LLC Series 2005-1A Class A2, | ||||
| 4.8363% 4/20/09 (a)(d) | 8,800,000 | 8,800,697 | ||
| American Express Credit Account Master Trust: | ||||
| Series 2002-6 Class B, 5.1988% 3/15/10 (d) | 5,000,000 | 5,023,079 | ||
| Series 2004-1 Class B, 4.9988% 9/15/11 (d) | 5,775,000 | 5,797,060 | ||
| Series 2004-C Class C, 5.2488% 2/15/12 (a)(d) | 12,639,679 | 12,669,171 | ||
| Series 2005-1 Class A, 4.7788% 10/15/12 (d) | 15,455,000 | 15,480,068 | ||
| Series 2005-6 Class C, 4.9988% 3/15/11 (a)(d) | 9,085,000 | 9,085,000 | ||
See accompanying notes which are an integral part of the financial statements.
| Semiannual Report |
| 30 |
| Asset Backed Securities continued | ||||||||
| Principal Amount | Value (Note 1) | |||||||
| AmeriCredit Automobile Receivables Trust: | ||||||||
| Series 2002-EM Class A4A, 3.67% 6/8/09 | $ 20,380,693 | $ 20,280,483 | ||||||
| Series 2003-AM Class A4B, 5.1306% 11/6/09 (d) | 8,628,757 | 8,644,688 | ||||||
| Series 2003-BX Class A4B, 5.0406% 1/6/10 (d) | 2,463,425 | 2,467,977 | ||||||
| Series 2003-CF Class A3, 2.75% 10/9/07 | 620,313 | 620,034 | ||||||
| Series 2005-1 Class C, 4.73% 7/6/10 | 15,500,000 | 15,236,545 | ||||||
| Ameriquest Finance NIMS Trust Series 2004-RN9A Class | ||||||||
| N1, 4.8% 11/25/34 (a) | 1,086,806 | 1,083,181 | ||||||
| Ameriquest Mortgage Securities, Inc.: | ||||||||
| Series 2002-3 Class M1, 5.5181% 8/25/32 (d) | 173,581 | 173,604 | ||||||
| Series 2003-1 Class M1, 5.7181% 2/25/33 (d) | 5,837,814 | 5,864,998 | ||||||
| Series 2003-11 Class M1, 5.5081% 1/25/34 (d) | 2,995,000 | 3,022,709 | ||||||
| Series 2003-3 Class M1, 5.6181% 3/25/33 (d) | 1,213,418 | 1,220,503 | ||||||
| Series 2003-6 Class M2, 6.6681% 5/25/33 (d) | 2,750,000 | 2,793,172 | ||||||
| Series 2003-AR1 Class M1, 5.9681% 1/25/33 (d) | 7,000,000 | 7,036,317 | ||||||
| Series 2004-R10: | ||||||||
| Class M1, 5.5181% 11/25/34 (d) | 4,665,000 | 4,691,422 | ||||||
| Class M5, 5.9681% 11/25/34 (d) | 3,095,000 | 3,137,927 | ||||||
| Series 2004-R11 Class M1, 5.4781% 11/25/34 (d) | . | 4,430,000 | 4,460,187 | |||||
| Series 2004-R2: | ||||||||
| Class M1, 5.2481% 4/25/34 (d) | 1,230,000 | 1,229,987 | ||||||
| Class M2, 5.2981% 4/25/34 (d) | 950,000 | 949,990 | ||||||
| Class M3, 5.3681% 4/25/34 (d) | 3,500,000 | 3,499,962 | ||||||
| Class M4, 5.8681% 4/25/34 (d) | 4,500,000 | 4,499,948 | ||||||
| Series 2004-R7 Class M7, 6.5181% 8/25/34 (d) | 5,000,000 | 5,068,209 | ||||||
| Series 2004-R9: | ||||||||
| Class A3, 5.1381% 10/25/34 (d) | 2,859,000 | 2,859,783 | ||||||
| Class M5, 6.2181% 10/25/34 (d) | 1,165,000 | 1,185,597 | ||||||
| Series 2005-R1: | ||||||||
| Class M1, 5.2681% 3/25/35 (d) | 5,710,000 | 5,729,743 | ||||||
| Class M2, 5.2981% 3/25/35 (d) | 1,925,000 | 1,931,185 | ||||||
| Series 2005-R2 Class M1, 5.2681% 4/25/35 (d) | 12,500,000 | 12,533,508 | ||||||
| Amortizing Residential Collateral Trust: | ||||||||
| Series 2002-BC1 Class M2, 5.9181% 1/25/32 (d) | 658,030 | 660,197 | ||||||
| Series 2002-BC3 Class A, 5.1481% 6/25/32 (d) | 1,828,033 | 1,833,676 | ||||||
| Series 2002-BC6 Class M1, 5.5681% 8/25/32 (d) | 24,900,000 | 25,037,869 | ||||||
| Series 2002-BC7 Class M1, 5.6181% 10/25/32 (d) | 10,000,000 | 10,019,269 | ||||||
| ARG Funding Corp.: | ||||||||
| Series 2005-1A Class A2, 4.8763% 4/20/09 (a)(d) | 11,000,000 | 10,998,902 | ||||||
| Series 2005-2A Class A2, 4.8863% 5/20/09 (a)(d) | 5,200,000 | 5,199,465 | ||||||
| Argent NIMS Trust Series 2004-WN9 Class A, 5.19% | ||||||||
| 10/25/34 (a) | 201,543 | 201,171 |
See accompanying notes which are an integral part of the financial statements.
31 Semiannual Report
| Investments continued | ||||||||
| Asset Backed Securities continued | ||||||||
| Principal Amount | Value (Note 1) | |||||||
| Argent Securities, Inc.: | ||||||||
| Series 2003-W3 Class M2, 6.6181% 9/25/33 (d) | $ 20,835,000 | $ 21,114,931 | ||||||
| Series 2003-W7 Class A2, 5.2081% 3/1/34 (d) | 1,622,924 | 1,625,329 | ||||||
| Series 2004-W11 Class M2, 5.5181% 11/25/34 (d) | 3,860,000 | 3,903,614 | ||||||
| Series 2004-W5 Class M1, 5.4181% 4/25/34 (d) | 3,960,000 | 3,964,670 | ||||||
| Series 2004-W7: | ||||||||
| Class M1, 5.3681% 5/25/34 (d) | 4,085,000 | 4,115,757 | ||||||
| Class M2, 5.4181% 5/25/34 (d) | 3,320,000 | 3,344,100 | ||||||
| Class M5, 6.1681% 5/25/34 (d) | 1,550,000 | 1,574,000 | ||||||
| Arran Funding Ltd. Series 2005-A Class C, 5.0688% | ||||||||
| 12/15/10 (d) | 26,765,000 | 26,756,971 | ||||||
| Asset Backed Securities Corp. Home Equity Loan Trust: | ||||||||
| Series 2003-HE2 Class M1, 5.6488% 4/15/33 (d) | 9,880,981 | 9,910,583 | ||||||
| Series 2003-HE3: | ||||||||
| Class M1, 5.5788% 6/15/33 (d) | 2,185,000 | 2,194,407 | ||||||
| Class M2, 6.7488% 6/15/33 (d) | 10,000,000 | 10,102,160 | ||||||
| Series 2003-HE6 Class M1, 5.4681% 11/25/33 (d) | 3,475,000 | 3,499,132 | ||||||
| Series 2004-HE2 Class M1, 5.3681% 4/25/34 (d) | 6,060,000 | 6,104,334 | ||||||
| Series 2004-HE3: | ||||||||
| Class M1, 5.3581% 6/25/34 (d) | 1,450,000 | 1,461,773 | ||||||
| Class M2, 5.9381% 6/25/34 (d) | 3,350,000 | 3,394,004 | ||||||
| Series 2004-HE6 Class A2, 5.1781% 6/25/34 (d) | 11,431,637 | 11,453,540 | ||||||
| Series 2005-HE1 Class M1, 5.3181% 3/25/35 (d) | 4,460,000 | 4,480,266 | ||||||
| Series 2005-HE2: | ||||||||
| Class M1, 5.2681% 3/25/35 (d) | 8,250,000 | 8,291,163 | ||||||
| Class M2, 5.3181% 3/25/35 (d) | 2,065,000 | 2,077,872 | ||||||
| Series 2005-HE3 Class A4, 5.0181% 4/25/35 (d) | 11,650,000 | 11,652,568 | ||||||
| Series 2005-HE6 Class A2B, 5.0681% 7/25/35 (d) | 10,000,000 | 10,024,007 | ||||||
| Series 2005-HE8 Class M2, 5.2681% 11/25/35 (d) | 2,105,000 | 2,114,530 | ||||||
| Bank One Issuance Trust: | ||||||||
| Series 2002-B1 Class B1, 5.1288% 12/15/09 (d) | 20,655,000 | 20,712,882 | ||||||
| Series 2002-C1 Class C1, 5.7088% 12/15/09 (d) | 7,980,000 | 8,040,094 | ||||||
| Series 2003-C4 Class C4, 5.7788% 2/15/11 (d) | 14,910,000 | 15,160,736 | ||||||
| Bayview Financial Acquisition Trust Series 2004-C Class | ||||||||
| A1, 5.2406% 5/28/44 (d) | 6,363,357 | 6,375,577 | ||||||
| Bayview Financial Asset Trust Series 2003-F Class A, | ||||||||
| 5.3206% 9/28/43 (d) | 7,311,046 | 7,316,385 | ||||||
| Bayview Financial Mortgage Loan Trust Series 2004-A | ||||||||
| Class A, 5.2706% 2/28/44 (d) | 4,272,723 | 4,283,696 | ||||||
| Bayview Financial Securities Co. LLC Series 2006-A | ||||||||
| Class 2A1, 4.725% 11/28/45 (d) | 22,434,389 | 22,434,241 | ||||||
| Bear Stearns Asset Backed Securities, Inc. Series 2005-3 | ||||||||
| Class A1, 5.2681% 9/25/35 (d) | 3,079,572 | 3,080,217 | ||||||
See accompanying notes which are an integral part of the financial statements.
| Semiannual Report |
| 32 |
| Asset Backed Securities continued | ||||||||
| Principal Amount | Value (Note 1) | |||||||
| Bear Stearns Asset Backed Securities I: | ||||||||
| Series 2005-HE2: | ||||||||
| Class M1, 5.3181% 2/25/35 (d) | $ 6,655,000 | $ 6,682,601 | ||||||
| Class M2, 5.5681% 2/25/35 (d) | 2,430,000 | 2,447,270 | ||||||
| Series 2005-HE5 Class 1A1, 4.9281% 6/25/35 (d) | 5,175,240 | 5,175,801 | ||||||
| Bear Stearns Asset Backed Securities NIMS Trust: | ||||||||
| Series 2004-FR1N Class A1, 5% 5/25/34 (a) | 38,852 | 38,739 | ||||||
| Series 2004-HE8N Class A1, 5% 9/25/34 (a) | 807,527 | 804,640 | ||||||
| Capital Auto Receivables Asset Trust: | ||||||||
| Series 2003-1 Class B, 5.2188% 6/15/10 (a)(d) | 3,109,931 | 3,115,140 | ||||||
| Series 2003-2 Class B, 5.0288% 1/15/09 (d) | 1,544,810 | 1,546,440 | ||||||
| Series 2005-1 Class B, 5.1238% 6/15/10 (d) | 5,725,000 | 5,755,308 | ||||||
| Capital One Auto Finance Trust: | ||||||||
| Series 2003-A Class A4B, 5.0288% 1/15/10 (d) | 9,013,026 | 9,026,041 | ||||||
| Series 2004-B Class A4, 4.8588% 8/15/11 (d) | 16,300,000 | 16,303,436 | ||||||
| Capital One Master Trust: | ||||||||
| Series 1999-3 Class B, 5.2288% 9/15/09 (d) | 5,000,000 | 4,999,596 | ||||||
| Series 2001-1 Class B, 5.2588% 12/15/10 (d) | 19,500,000 | 19,614,564 | ||||||
| Series 2001-8A Class B, 5.2988% 8/17/09 (d) | 9,585,000 | 9,601,626 | ||||||
| Series 2002-4A Class B, 5.2488% 3/15/10 (d) | 6,000,000 | 6,020,056 | ||||||
| Capital One Multi-Asset Execution Trust: | ||||||||
| Series 2003-B1 Class B1, 5.9188% 2/17/09 (d) | 15,470,000 | 15,475,688 | ||||||
| Series 2004-C1 Class C1, 3.4% 11/16/09 | 20,510,000 | 20,187,671 | ||||||
| Capital Trust Ltd. Series 2004-1: | ||||||||
| Class A2, 5.2263% 7/20/39 (a)(d) | 2,968,000 | 2,972,990 | ||||||
| Class B, 5.5263% 7/20/39 (a)(d) | 1,550,000 | 1,563,060 | ||||||
| Class C, 5.8763% 7/20/39 (a)(d) | 1,994,000 | 2,008,783 | ||||||
| Carrington Mortgage Loan Trust Series 2005-FRE1 Class | ||||||||
| A2, 4.9981% 12/25/35 (d) | 15,580,000 | 15,579,882 | ||||||
| CDC Mortgage Capital Trust: | ||||||||
| Series 2001-HE1 Class M1, 6.1256% 1/25/32 (d) | 2,061,143 | 2,062,260 | ||||||
| Series 2002-HE2 Class M1, 5.5181% 1/25/33 (d) | 9,278,431 | 9,285,261 | ||||||
| Series 2003-HE1 Class M1, 5.7181% 8/25/33 (d) | 1,907,142 | 1,912,331 | ||||||
| Series 2003-HE3 Class M1, 5.5181% 11/25/33 (d) . | 2,254,989 | 2,280,058 | ||||||
| Series 2004-HE2 Class M2, 6.0181% 7/26/34 (d) | 2,345,000 | 2,366,537 | ||||||
| Cendant Timeshare Receivables Funding LLC Series 2005 | ||||||||
| 1A Class 2A2, 4.9563% 5/20/17 (a)(d) | 7,269,599 | 7,258,397 | ||||||
| Chase Credit Card Owner Trust: | ||||||||
| Series 2001-6 Class B, 5.2288% 3/16/09 (d) | 1,305,000 | 1,307,674 | ||||||
| Series 2003-6 Class C, 5.5488% 2/15/11 (d) | 16,400,000 | 16,622,678 | ||||||
| Series 2004-1 Class B, 4.9488% 5/15/09 (d) | 4,105,000 | 4,104,700 | ||||||
| Citibank Credit Card Issuance Trust: | ||||||||
| Series 2001-B2 Class B2, 5.35% 12/10/08 (d) | 11,945,000 | 11,965,228 | ||||||
See accompanying notes which are an integral part of the financial statements.
33 Semiannual Report
| Investments continued | ||||||||
| Asset Backed Securities continued | ||||||||
| Principal Amount | Value (Note 1) | |||||||
| Citibank Credit Card Issuance Trust: – continued | ||||||||
| Series 2002-B1 Class B1, 4.8494% 6/25/09 (d) | $ 9,010,000 | $ 9,033,190 | ||||||
| Series 2002-C1 Class C1, 5.7% 2/9/09 (d) | 17,500,000 | 17,612,665 | ||||||
| Series 2003-C1 Class C1, 5.65% 4/7/10 (d) | 17,785,000 | 18,099,497 | ||||||
| Citigroup Mortgage Loan Trust Series 2003-HE4 Class A, | ||||||||
| 5.2281% 12/25/33 (a)(d) | 6,293,424 | 6,294,076 | ||||||
| CNH Wholesale Master Note Trust Series 2005-1: | ||||||||
| Class A, 4.8588% 6/15/11 (d) | 18,000,000 | 17,982,544 | ||||||
| Class B, 5.1488% 6/15/11 (d) | 2,280,000 | 2,281,167 | ||||||
| Countrywide Home Loans, Inc.: | ||||||||
| Series 2002-6 Class AV1, 5.2481% 5/25/33 (d) | 889,081 | 890,745 | ||||||
| Series 2003-BC1 Class M2, 6.8181% 9/25/32 (d) | 11,065,000 | 11,133,008 | ||||||
| Series 2003-SD3 Class A1, 5.2381% 12/25/32 (a)(d) | 426,390 | 427,521 | ||||||
| Series 2004-14 Class M1, 5.3281% 6/25/35 (d) | 13,520,000 | 13,604,078 | ||||||
| Series 2004-2 Class M1, 5.3181% 5/25/34 (d) | 7,650,000 | 7,675,204 | ||||||
| Series 2004-3: | ||||||||
| Class 3A4, 5.0681% 8/25/34 (d) | 271,040 | 271,249 | ||||||
| Class M1, 5.3181% 6/25/34 (d) | 1,475,000 | 1,480,405 | ||||||
| Class M4, 5.7881% 4/25/34 (d) | 4,000,000 | 4,015,773 | ||||||
| Series 2004-4: | ||||||||
| Class A, 5.1881% 8/25/34 (d) | 1,292,274 | 1,293,584 | ||||||
| Class M1, 5.2981% 7/25/34 (d) | 3,650,000 | 3,670,285 | ||||||
| Class M2, 5.3481% 6/25/34 (d) | 6,885,000 | 6,911,293 | ||||||
| Series 2005-1: | ||||||||
| Class 1AV2, 5.0181% 7/25/35 (d) | 8,780,000 | 8,782,811 | ||||||
| Class M1, 5.2381% 8/25/35 (d) | 3,525,000 | 3,531,259 | ||||||
| Class MV1, 5.2181% 7/25/35 (d) | 3,135,000 | 3,140,727 | ||||||
| Class MV2, 5.2581% 7/25/35 (d) | 3,765,000 | 3,776,019 | ||||||
| Series 2005-AB1 Class A2, 5.0281% 8/25/35 (d) | 17,520,000 | 17,529,216 | ||||||
| Series 2005-BC1 Class 2A2, 5.0181% 5/25/35 (d) | 7,915,773 | 7,918,192 | ||||||
| Series 2005-IM1 Class A1, 4.9481% 11/25/35 (d) | 10,101,326 | 10,101,984 | ||||||
| CS First Boston Mortgage Securities Corp.: | ||||||||
| Series 2003-6 Class M2, 6.4881% 2/25/34 (d) | 920,000 | 939,357 | ||||||
| Series 2003-8 Class A2, 5.2081% 4/25/34 (d) | 777,568 | 780,047 | ||||||
| Series 2004-FRE1: | ||||||||
| Class A2, 5.1681% 4/25/34 (d) | 96,697 | 96,697 | ||||||
| Class M3, 5.4681% 4/25/34 (d) | 5,885,000 | 5,884,938 | ||||||
| Discover Card Master Trust I: | ||||||||
| Series 2003-4 Class B1, 5.0788% 5/16/11 (d) | 8,155,000 | 8,197,806 | ||||||
| Series 2005-1 Class B, 4.8988% 9/16/10 (d) | 12,750,000 | 12,742,327 | ||||||
| Series 2005-3 Class B, 4.9388% 5/15/11 (d) | 18,000,000 | 17,996,078 | ||||||
| Series 2006-1 Class B1, 4.8988% 8/16/11 (d) | 14,629,000 | 14,633,572 | ||||||
See accompanying notes which are an integral part of the financial statements.
| Semiannual Report |
| 34 |
| Asset Backed Securities continued | ||||||||
| Principal Amount | Value (Note 1) | |||||||
| Fannie Mae guaranteed REMIC pass thru certificates | ||||||||
| Series 2004-T5 Class AB3, 5.4149% 5/28/35 (d) | $ 1,873,863 | $ 1,874,514 | ||||||
| Fieldstone Mortgage Investment Corp.: | ||||||||
| Series 2003-1: | ||||||||
| Class M1, 5.4981% 11/25/33 (d) | 300,483 | 300,729 | ||||||
| Class M2, 6.5681% 11/25/33 (d) | 700,000 | 707,129 | ||||||
| Series 2004-1 Class M2, 5.9181% 1/25/35 (d) | 3,700,000 | 3,702,488 | ||||||
| Series 2004-2 Class M2, 5.9681% 7/25/34 (d) | 9,890,000 | 9,889,915 | ||||||
| Series 2004-3 Class M5, 6.2681% 8/25/34 (d) | 2,000,000 | 2,032,920 | ||||||
| Series 2005-2 Class 2A1, 4.9381% 12/25/35 (d) | 13,165,007 | 13,166,383 | ||||||
| First Franklin Mortgage Loan Asset Backed Certificates | ||||||||
| Series 2005-FF2 Class A2A, 4.9081% 3/25/35 (d) | 2,940,180 | 2,940,611 | ||||||
| First Franklin Mortgage Loan Trust Series 2004-FF2: | ||||||||
| Class M3, 5.3681% 3/25/34 (d) | 400,000 | 401,095 | ||||||
| Class M4, 5.7181% 3/25/34 (d) | 300,000 | 302,263 | ||||||
| First Franklin NIMS Trust Series 2004-FF4A Class N, | ||||||||
| 5.75% 6/25/34 (a) | 421,928 | 421,218 | ||||||
| First USA Credit Card Master Trust Series 2001-4 Class | ||||||||
| B, 5.0981% 1/12/09 (d) | 15,000,000 | 15,002,526 | ||||||
| Ford Credit Auto Owner Trust Series 2003-B Class B2, | ||||||||
| 5.1788% 10/15/07 (d) | 19,600,000 | 19,633,020 | ||||||
| Ford Credit Floorplan Master Owner Trust Series 2005-1: | ||||||||
| Class A, 4.8988% 5/15/10 (d) | 9,590,000 | 9,588,863 | ||||||
| Class B, 5.1888% 5/15/10 (d) | 2,625,000 | 2,628,427 | ||||||
| Fremont Home Loan Trust: | ||||||||
| Series 2004-1: | ||||||||
| Class 1A1, 5.0381% 2/25/34 (d) | 416,916 | 416,995 | ||||||
| Class M1, 5.2681% 2/25/34 (d) | 750,000 | 751,035 | ||||||
| Class M2, 5.3181% 2/25/34 (d) | 800,000 | 801,543 | ||||||
| Series 2004-B Class M1, 5.3981% 5/25/34 (d) | 1,695,000 | 1,702,961 | ||||||
| Series 2004-C Class 2A2, 5.3681% 8/25/34 (d) | 10,000,000 | 10,058,398 | ||||||
| Series 2004-D Class 3A2, 5.0981% 11/25/34 (d) | 1,472,265 | 1,475,249 | ||||||
| Series 2005-2 Class 2A1, 4.9281% 6/25/35 (d) | 8,110,207 | 8,109,827 | ||||||
| Series 2005 A: | ||||||||
| Class 2A2, 5.0581% 2/25/35 (d) | 9,514,650 | 9,521,872 | ||||||
| Class M1, 5.2481% 1/25/35 (d) | 1,603,000 | 1,611,661 | ||||||
| Class M2, 5.2781% 1/25/35 (d) | 2,325,000 | 2,335,089 | ||||||
| Class M3, 5.3081% 1/25/35 (d) | 1,250,000 | 1,256,845 | ||||||
| Class M4, 5.4981% 1/25/35 (d) | 925,000 | 933,804 | ||||||
| Fremont NIMS Trust Series 2004-C Class A, 5.25% | ||||||||
| 8/25/34 (a) | 1,057,665 | 1,055,021 | ||||||
See accompanying notes which are an integral part of the financial statements.
35 Semiannual Report
| Investments continued | ||||||||
| Asset Backed Securities continued | ||||||||
| Principal Amount | Value (Note 1) | |||||||
| GE Business Loan Trust Series 2003-1 Class A, 5.1788% | ||||||||
| 4/15/31 (a)(d) | $ 4,561,347 | $ 4,584,109 | ||||||
| GE Capital Credit Card Master Note Trust Series 2005-2: | ||||||||
| Class A, 4.7588% 6/15/11 (d) | 30,000,000 | 29,996,343 | ||||||
| Class B, 4.9488% 6/15/11 (d) | 6,475,000 | 6,478,193 | ||||||
| Gracechurch Card Funding PLC: | ||||||||
| Series 11 Class C, 5.0288% 11/15/10 (d) | 20,510,000 | 20,509,795 | ||||||
| Series 5: | ||||||||
| Class B, 4.9788% 8/15/08 (d) | 1,520,000 | 1,519,832 | ||||||
| Class C, 5.6788% 8/15/08 (d) | 5,580,000 | 5,589,161 | ||||||
| Series 6 Class B, 4.9388% 2/17/09 (d) | 1,030,000 | 1,030,463 | ||||||
| Series 8 Class C, 5.0788% 6/15/10 (d) | 18,450,000 | 18,465,965 | ||||||
| Series 9: | ||||||||
| Class B, 4.8988% 9/15/10 (d) | 3,560,000 | 3,559,964 | ||||||
| Class C, 5.0588% 9/15/10 (d) | 13,000,000 | 12,999,870 | ||||||
| GSAMP Trust: | ||||||||
| Series 2002-HE Class M1, 6.0263% 11/20/32 (d) | 2,882,888 | 2,895,586 | ||||||
| Series 2002-NC1 Class A2, 5.1381% 7/25/32 (d) | 54,777 | 55,308 | ||||||
| Series 2003-FM1 Class M1, 5.5963% 3/20/33 (d) | 12,735,683 | 12,792,018 | ||||||
| Series 2004-FM1: | ||||||||
| Class M1, 5.4681% 11/25/33 (d) | 2,865,000 | 2,864,970 | ||||||
| Class M2, 6.2181% 11/25/33 (d) | 1,975,000 | 2,003,329 | ||||||
| Series 2004-FM2: | ||||||||
| Class M1, 5.3181% 1/25/34 (d) | 3,495,567 | 3,495,531 | ||||||
| Class M2, 5.9181% 1/25/34 (d) | 1,500,000 | 1,499,984 | ||||||
| Class M3, 6.1181% 1/25/34 (d) | 1,500,000 | 1,499,985 | ||||||
| Series 2004-HE1: | ||||||||
| Class M1, 5.3681% 5/25/34 (d) | 4,045,000 | 4,044,951 | ||||||
| Class M2, 5.9681% 5/25/34 (d) | 1,750,000 | 1,770,199 | ||||||
| Series 2004-HE1N Class N1, 5% 5/25/34 (a) | 1,029,932 | 1,027,357 | ||||||
| Series 2005-9 Class 2A1, 4.9381% 8/25/35 (d) | 11,637,079 | 11,623,458 | ||||||
| Series 2005-HE2 Class M, 5.2481% 3/25/35 (d) | 8,780,000 | 8,811,862 | ||||||
| Series 2005-MTR1 Class A1, 4.9581% 10/25/35 (d) | 15,945,292 | 15,945,292 | ||||||
| Series 2005-NC1 Class M1, 5.2681% 2/25/35 (d) | 9,010,000 | 9,047,892 | ||||||
| Guggenheim Structured Real Estate Funding Ltd. Series | ||||||||
| 2005-1 Class C, 5.8981% 5/25/30 (a)(d) | 14,000,000 | 13,960,660 | ||||||
| Home Equity Asset Trust: | ||||||||
| Series 2002-2 Class M1, 5.6181% 6/25/32 (d) | 10,000,000 | 10,002,200 | ||||||
| Series 2002-3 Class A5, 5.2581% 2/25/33 (d) | 2,763 | 2,766 | ||||||
| Series 2002-5 Class M1, 6.0181% 5/25/33 (d) | 11,435,329 | 11,488,182 | ||||||
| Series 2003-1 Class M1, 5.8181% 6/25/33 (d) | 6,529,228 | 6,542,341 | ||||||
| Series 2003-2 Class M1, 5.6981% 8/25/33 (d) | 1,861,177 | 1,877,627 | ||||||
See accompanying notes which are an integral part of the financial statements.
| Semiannual Report |
| 36 |
| Asset Backed Securities continued | ||||||||
| Principal Amount | Value (Note 1) | |||||||
| Home Equity Asset Trust: – continued | ||||||||
| Series 2003-3: | ||||||||
| Class A2, 5.1781% 8/25/33 (d) | $ 416,974 | $ 417,381 | ||||||
| Class M1, 5.6781% 8/25/33 (d) | 8,185,000 | 8,226,870 | ||||||
| Series 2003-4: | ||||||||
| Class M1, 5.6181% 10/25/33 (d) | 3,415,000 | 3,431,092 | ||||||
| Class M2, 6.7181% 10/25/33 (d) | 4,040,000 | 4,071,747 | ||||||
| Series 2003-5: | ||||||||
| Class A2, 5.1681% 12/25/33 (d) | 1,611,398 | 1,612,667 | ||||||
| Class M1, 5.5181% 12/25/33 (d) | 3,175,000 | 3,191,341 | ||||||
| Class M2, 6.5481% 12/25/33 (d) | 3,235,000 | 3,277,567 | ||||||
| Series 2003-7 Class A2, 5.1981% 3/25/34 (d) | 1,017,258 | 1,017,928 | ||||||
| Series 2003-8 Class M1, 5.5381% 4/25/34 (d) | 4,585,000 | 4,630,617 | ||||||
| Series 2004-1 Class M1, 5.4481% 6/25/34 (d) | 10,115,000 | 10,240,813 | ||||||
| Series 2004-2 Class A2, 5.1081% 7/25/34 (d) | 2,056,333 | 2,057,985 | ||||||
| Series 2004-3: | ||||||||
| Class M1, 5.3881% 8/25/34 (d) | 2,015,000 | 2,027,175 | ||||||
| Class M2, 6.0181% 8/25/34 (d) | 2,200,000 | 2,232,419 | ||||||
| Series 2004-4 Class A2, 5.1381% 10/25/34 (d) | 4,678,365 | 4,689,338 | ||||||
| Series 2004-6 Class A2, 5.1681% 12/25/34 (d) | 6,075,441 | 6,087,442 | ||||||
| Series 2004-7 Class A3, 5.2081% 1/25/35 (d) | 6,311,447 | 6,339,808 | ||||||
| Series 2005-1: | ||||||||
| Class M1, 5.2481% 5/25/35 (d) | 9,705,000 | 9,730,315 | ||||||
| Class M2, 5.2681% 5/25/35 (d) | 5,780,000 | 5,797,445 | ||||||
| Class M3, 5.3181% 5/25/35 (d) | 5,845,000 | 5,863,542 | ||||||
| Series 2005-2: | ||||||||
| Class 2A2, 5.0181% 7/25/35 (d) | 13,170,000 | 13,174,054 | ||||||
| Class M1, 5.2681% 7/25/35 (d) | 10,085,000 | 10,108,878 | ||||||
| Series 2005-3 Class M1, 5.2281% 8/25/35 (d) | 9,450,000 | 9,466,723 | ||||||
| Series 2005-5 Class 2A2, 5.0681% 11/25/35 (d) | 15,000,000 | 15,033,690 | ||||||
| Household Affinity Credit Card Master Note Trust I Series | ||||||||
| 2003-3 Class B, 5.0388% 8/15/08 (d) | 10,000,000 | 10,001,721 | ||||||
| Household Home Equity Loan Trust: | ||||||||
| Series 2003-2: | ||||||||
| Class A, 5.1063% 9/20/33 (d) | 1,852,517 | 1,854,620 | ||||||
| Class M, 5.3563% 9/20/33 (d) | 871,145 | 872,463 | ||||||
| Series 2004-1 Class M, 5.2963% 9/20/33 (d) | 1,775,909 | 1,782,087 | ||||||
| Household Mortgage Loan Trust Series 2004-HC1: | ||||||||
| Class A, 5.1263% 2/20/34 (d) | 2,454,470 | 2,457,524 | ||||||
| Class M, 5.2763% 2/20/34 (d) | 1,483,981 | 1,485,826 | ||||||
| Household Private Label Credit Card Master Note Trust I: | ||||||||
| Series 2002-1 Class B, 5.2988% 1/18/11 (d) | 8,850,000 | 8,865,194 | ||||||
See accompanying notes which are an integral part of the financial statements.
37 Semiannual Report
| Investments continued | ||||||||
| Asset Backed Securities continued | ||||||||
| Principal Amount | Value (Note 1) | |||||||
| Household Private Label Credit Card Master Note Trust I: | ||||||||
| – continued | ||||||||
| Series 2002-2: | ||||||||
| Class A, 4.9188% 1/18/11 (d) | $ 9,000,000 | $ 9,006,975 | ||||||
| Class B, 5.2988% 1/18/11 (d) | 14,275,000 | 14,329,202 | ||||||
| HSBC Home Equity Loan Trust: | ||||||||
| Series 2005-2: | ||||||||
| Class M1, 5.03% 1/20/35 (d) | 2,262,614 | 2,265,261 | ||||||
| Class M2, 5.06% 1/20/35 (d) | 1,694,329 | 1,698,454 | ||||||
| Series 2005-3: | ||||||||
| Class A1, 4.83% 1/20/35 (d) | 5,713,934 | 5,715,554 | ||||||
| Class M1, 4.99% 1/20/35 (d) | 3,342,651 | 3,345,547 | ||||||
| Ikon Receivables Funding LLC Series 2003-1 Class A3A, | ||||||||
| 4.9888% 12/17/07 (d) | 19,061 | 19,061 | ||||||
| IXIS Real Estate Capital Trust Series 2005-HE1: | ||||||||
| Class A1, 5.0681% 6/25/35 (d) | 6,442,018 | 6,443,150 | ||||||
| Class M1, 5.2881% 6/25/35 (d) | 4,100,000 | 4,108,525 | ||||||
| Keycorp Student Loan Trust Series 1999-A Class A2, | ||||||||
| 5.29% 12/27/09 (d) | 13,272,480 | 13,314,862 | ||||||
| Long Beach Mortgage Loan Trust: | ||||||||
| Series 2003-2 Class M1, 5.6381% 6/25/33 (d) | 18,041,302 | 18,106,326 | ||||||
| Series 2003-3 Class M1, 5.5681% 7/25/33 (d) | 7,711,118 | 7,751,615 | ||||||
| Series 2004-2: | ||||||||
| Class M1, 5.3481% 6/25/34 (d) | 4,275,000 | 4,283,461 | ||||||
| Class M2, 5.8981% 6/25/34 (d) | 1,400,000 | 1,412,806 | ||||||
| Series 2005-2 Class 2A2, 4.9981% 4/25/35 (d) | 12,000,000 | 12,004,306 | ||||||
| MASTR Asset Backed Securities Trust: | ||||||||
| Series 2003-NC1: | ||||||||
| Class M1, 5.5481% 4/25/33 (d) | 2,400,273 | 2,417,743 | ||||||
| Class M2, 6.6681% 4/25/33 (d) | 1,500,000 | 1,526,700 | ||||||
| Series 2004-FRE1 Class M1, 5.3681% 7/25/34 (d) | 5,223,000 | 5,249,074 | ||||||
| MBNA Credit Card Master Note Trust: | ||||||||
| Series 2001-B1 Class B1, 5.1238% 10/15/08 (d) | 30,000,000 | 30,005,223 | ||||||
| Series 2001-B2 Class B2, 5.1088% 1/15/09 (d) | 30,353,000 | 30,366,216 | ||||||
| Series 2002-B2 Class B2, 5.1288% 10/15/09 (d) | 20,000,000 | 20,060,260 | ||||||
| Series 2002-B4 Class B4, 5.2488% 3/15/10 (d) | 14,800,000 | 14,885,249 | ||||||
| Series 2003-B2 Class B2, 5.1388% 10/15/10 (d) | 1,530,000 | 1,539,501 | ||||||
| Series 2003-B3 Class B3, 5.1238% 1/18/11 (d) | 1,130,000 | 1,135,621 | ||||||
| Series 2003-B5 Class B5, 5.1188% 2/15/11 (d) | 705,000 | 709,537 | ||||||
| Series 2005-C3 Class C, 5.0188% 3/15/11 (d) | 22,170,000 | 22,220,605 | ||||||
| MBNA Master Credit Card Trust II: | ||||||||
| Series 1998-E Class B, 4.93% 9/15/10 (d) | 7,800,000 | 7,835,019 | ||||||
| Series 1998-G Class B, 5.1488% 2/17/09 (d) | 20,000,000 | 20,006,220 | ||||||
See accompanying notes which are an integral part of the financial statements.
| Semiannual Report |
| 38 |
| Asset Backed Securities continued | ||||||||
| Principal Amount | Value (Note 1) | |||||||
| Meritage Mortgage Loan Trust Series 2004-1: | ||||||||
| Class M1, 5.3181% 7/25/34 (d) | $ 2,125,000 | $ 2,124,978 | ||||||
| Class M2, 5.3681% 7/25/34 (d) | 375,000 | 374,996 | ||||||
| Class M3, 5.7681% 7/25/34 (d) | 775,000 | 774,992 | ||||||
| Class M4, 5.9181% 7/25/34 (d) | 525,000 | 525,929 | ||||||
| Merrill Lynch Mortgage Investors, Inc. Series 2003-HE1 | ||||||||
| Class M1, 5.5181% 7/25/34 (d) | 2,321,000 | 2,338,423 | ||||||
| Merrill Lynch Mortgage Ltd. Series 2004-OP1N Class | ||||||||
| N1, 4.75% 6/25/35 (a) | 597,333 | 593,401 | ||||||
| Morgan Stanley ABS Capital I, Inc.: | ||||||||
| Series 2003-NC5 Class M2, 6.8181% 4/25/33 (d) | 2,800,000 | 2,816,035 | ||||||
| Series 2003-NC6 Class M2, 6.7681% 6/27/33 (d) | 12,835,000 | 13,095,862 | ||||||
| Series 2003-NC7 Class M1, 5.5181% 6/25/33 (d) | 1,738,438 | 1,744,653 | ||||||
| Series 2003-NC8 Class M1, 5.5181% 9/25/33 (d) | 2,350,000 | 2,361,039 | ||||||
| Series 2004-HE6 Class A2, 5.1581% 8/25/34 (d) | 4,207,367 | 4,221,389 | ||||||
| Series 2004-NC2 Class M1, 5.3681% 12/25/33 (d) . | 2,595,000 | 2,612,136 | ||||||
| Series 2004-NC6 Class A2, 5.1581% 7/25/34 (d) | 1,885,434 | 1,891,234 | ||||||
| Series 2005-1 Class M2, 5.2881% 12/25/34 (d) | 4,425,000 | 4,444,928 | ||||||
| Series 2005-HE1: | ||||||||
| Class A3B, 5.0381% 12/25/34 (d) | 2,965,981 | 2,968,685 | ||||||
| Class M1, 5.2681% 12/25/34 (d) | 1,100,000 | 1,105,935 | ||||||
| Class M2, 5.2881% 12/25/34 (d) | 2,970,000 | 2,984,458 | ||||||
| Series 2005-HE2: | ||||||||
| Class M1, 5.2181% 1/25/35 (d) | 2,665,000 | 2,678,853 | ||||||
| Class M2, 5.2581% 1/25/35 (d) | 1,900,000 | 1,906,322 | ||||||
| Series 2005-NC1: | ||||||||
| Class M1, 5.2581% 1/25/35 (d) | 2,425,000 | 2,439,908 | ||||||
| Class M2, 5.2881% 1/25/35 (d) | 2,425,000 | 2,436,052 | ||||||
| Class M3, 5.3281% 1/25/35 (d) | 2,425,000 | 2,440,433 | ||||||
| Series 2005-NC2 Class B1, 5.9881% 3/25/35 (d) | 3,000,000 | 3,012,219 | ||||||
| Morgan Stanley Dean Witter Capital I Trust: | ||||||||
| Series 2001-AM1 Class M1, 6.0931% 2/25/32 (d) | 1,047,547 | 1,048,107 | ||||||
| Series 2001-NC4 Class M1, 5.8181% 1/25/32 (d) | 2,622,023 | 2,623,841 | ||||||
| Series 2002-AM3 Class A3, 5.3081% 2/25/33 (d) | 705,709 | 707,659 | ||||||
| Series 2002-HE1 Class M1, 5.4181% 7/25/32 (d) | 5,860,000 | 5,917,970 | ||||||
| Series 2002-HE2 Class M1, 5.5181% 8/25/32 (d) | 9,925,000 | 9,941,717 | ||||||
| Series 2002-NC3 Class A3, 5.1581% 8/25/32 (d) | 147,864 | 148,022 | ||||||
| Series 2002-OP1 Class M1, 5.5681% 9/25/32 (d) | 3,894,745 | 3,898,271 | ||||||
| Series 2003-NC1 Class M1, 5.8681% 11/25/32 (d) . | 2,391,382 | 2,401,622 | ||||||
| New Century Home Equity Loan Trust: | ||||||||
| Series 2003-1 Class M2, 6.8681% 2/25/33 (d) | 4,960,000 | 4,987,409 | ||||||
| Series 2003-6 Class M1, 5.5381% 1/25/34 (d) | 9,135,000 | 9,213,628 | ||||||
See accompanying notes which are an integral part of the financial statements.
39 Semiannual Report
| Investments continued | ||||||||
| Asset Backed Securities continued | ||||||||
| Principal Amount | Value (Note 1) | |||||||
| New Century Home Equity Loan Trust: – continued | ||||||||
| Series 2005-1: | ||||||||
| Class M1, 5.2681% 3/25/35 (d) | $ 4,395,000 | $ 4,406,925 | ||||||
| Class M2, 5.2981% 3/25/35 (d) | 4,395,000 | 4,413,149 | ||||||
| Class M3, 5.3381% 3/25/35 (d) | 2,120,000 | 2,132,986 | ||||||
| Series 2005-4 Class M2, 5.3281% 9/25/35 (d) | 9,815,000 | 9,858,020 | ||||||
| Nissan Auto Lease Trust: | ||||||||
| Series 2003-A Class A3A, 4.8888% 6/15/09 (d) | 5,715,560 | 5,717,667 | ||||||
| Series 2004-A Class A4A, 4.8188% 6/15/10 (d) | 10,570,000 | 10,577,701 | ||||||
| Series 2005-A Class A4, 4.7988% 8/15/11 (d) | 17,595,000 | 17,593,615 | ||||||
| NovaStar Home Equity Loan Series 2004-1: | ||||||||
| Class M1, 5.2681% 6/25/34 (d) | 1,450,000 | 1,451,210 | ||||||
| Class M4, 5.7931% 6/25/34 (d) | 2,435,000 | 2,451,303 | ||||||
| Ocala Funding LLC Series 2005-1A Class A, 6.2763% | ||||||||
| 3/20/10 (a)(d) | 3,675,000 | 3,675,000 | ||||||
| Option One Mortgage Loan Trust Series 2004-3 Class | ||||||||
| M3, 5.4681% 11/25/34 (d) | 2,365,000 | 2,370,287 | ||||||
| Ownit Mortgage Loan Asset-Backed Certificates: | ||||||||
| Series 2005-3 Class A2A, 4.9381% 6/25/36 (d) | 11,686,624 | 11,688,370 | ||||||
| Series 2005-4 Class A2A1, 4.9381% 8/25/36 (d) | 14,133,766 | 14,134,661 | ||||||
| Park Place Securities, Inc.: | ||||||||
| Series 2004-WCW1: | ||||||||
| Class M1, 5.4481% 9/25/34 (d) | 3,745,000 | 3,788,000 | ||||||
| Class M2, 5.4981% 9/25/34 (d) | 1,755,000 | 1,770,449 | ||||||
| Class M3, 6.0681% 9/25/34 (d) | 3,355,000 | 3,397,140 | ||||||
| Class M4, 6.2681% 9/25/34 (d) | 4,700,000 | 4,757,539 | ||||||
| Series 2004-WCW2: | ||||||||
| Class A2, 5.1981% 10/25/34 (d) | 3,872,574 | 3,879,741 | ||||||
| Class M3, 5.3681% 7/25/35 (d) | 2,755,000 | 2,768,828 | ||||||
| Series 2004-WWF1: | ||||||||
| Class M2, 5.4981% 2/25/35 (d) | 11,060,000 | 11,153,456 | ||||||
| Class M3, 5.5581% 2/25/35 (d) | 1,370,000 | 1,385,701 | ||||||
| Series 2005-WCH1: | ||||||||
| Class A3B, 5.0381% 1/25/35 (d) | 2,241,706 | 2,244,054 | ||||||
| Class M2, 5.3381% 1/25/35 (d) | 4,175,000 | 4,193,777 | ||||||
| Class M3, 5.3781% 1/25/35 (d) | 3,290,000 | 3,312,506 | ||||||
| Class M5, 5.6981% 1/25/35 (d) | 3,095,000 | 3,123,654 | ||||||
| Series 2005-WHQ2 Class M7, 6.0681% 5/25/35 (d) | 7,690,000 | 7,719,886 | ||||||
| People’s Choice Home Loan Securities Trust Series | ||||||||
| 2005-2 Class A1, 4.9281% 9/25/24 (d) | 812,794 | 812,836 | ||||||
| Providian Master Note Trust: | ||||||||
| Series 2005-2 Class C2, 5.2488% 11/15/12 (a)(d) | 17,800,000 | 17,799,822 | ||||||
See accompanying notes which are an integral part of the financial statements.
| Semiannual Report |
| 40 |
| Asset Backed Securities continued | ||||||
| Principal Amount | Value (Note 1) | |||||
| Providian Master Note Trust: – continued | ||||||
| Series 2006-C1A Class C1, 5.2481% 3/16/15 (a)(d) | $ 12,585,000 | $ 12,585,000 | ||||
| Residential Asset Mortgage Products, Inc.: | ||||||
| Series 2003-RS9 Class MII2, 6.6181% 10/25/33 (d) . | 1,622,000 | 1,652,413 | ||||
| Series 2004-RS10 Class MII2, 6.0681% 10/25/34 (d) | 5,500,000 | 5,598,803 | ||||
| Series 2005-SP2 Class 1A1, 4.9681% 5/25/44 (d) | 9,921,782 | 9,923,222 | ||||
| Residential Asset Securities Corp. Series 2005-KS7 Class | ||||||
| A1, 4.9181% 8/25/35 (d) | 6,944,744 | 6,945,095 | ||||
| Salomon Brothers Mortgage Securities VII, Inc. Series | ||||||
| 2003-HE1 Class A, 5.2181% 4/25/33 (d) | 183,206 | 183,674 | ||||
| Saxon Asset Securities Trust: | ||||||
| Series 2004-1 Class M1, 5.3481% 3/25/35 (d) | 4,415,000 | 4,423,514 | ||||
| Series 2004-2 Class MV1, 5.3981% 8/25/35 (d) | 4,495,000 | 4,513,925 | ||||
| Series 2005-1 Class A2B, 5.0381% 5/25/35 (d) | 16,056,000 | 16,065,955 | ||||
| Securitized Asset Backed Receivables LLC Trust Series | ||||||
| 2004-NC1 Class M1, 5.3381% 2/25/34 (d) | 2,910,000 | 2,918,414 | ||||
| Specialty Underwriting & Residential Finance: | ||||||
| Series 2003-BC3 Class M2, 6.4181% 8/25/34 (d) | 2,140,000 | 2,164,186 | ||||
| Series 2003-BC4 Class M1, 5.4181% 11/25/34 (d) . | 1,810,000 | 1,821,921 | ||||
| Structured Asset Investment Loan Trust: | ||||||
| Series 2003-BC9 Class M1, 5.5181% 8/25/33 (d) | 9,005,000 | 9,032,710 | ||||
| Series 2004-8 Class M5, 5.9681% 9/25/34 (d) | 2,395,000 | 2,426,365 | ||||
| Series 2005-1 Class M4, 5.5781% 2/25/35 (a)(d) | 3,990,000 | 4,060,224 | ||||
| Structured Asset Securities Corp.: | ||||||
| Series 2004-GEL1 Class A, 5.1781% 2/25/34 (d) | 624,298 | 624,292 | ||||
| Series 2005-5N Class 3A1A, 5.1181% 11/25/35 (d) | 15,454,759 | 15,466,860 | ||||
| Superior Wholesale Inventory Financing Trust VII Series | ||||||
| 2003-A8 Class CTFS, 5.1988% 3/15/11 (a)(d) | 10,835,000 | 10,884,093 | ||||
| Superior Wholesale Inventory Financing Trust XII Series | ||||||
| 2005-A12 Class C, 5.9488% 6/15/10 (d) | 6,840,000 | 6,853,640 | ||||
| Terwin Mortgage Trust: | ||||||
| Series 2003-4HE Class A1, 5.2481% 9/25/34 (d) | 886,234 | 889,900 | ||||
| Series 2003-6HE Class A1, 5.2881% 11/25/33 (d) | 855,249 | 856,949 | ||||
| Series 2005-14HE Class AF1, 4.9581% 8/25/36 (d) . | 6,166,377 | 6,166,332 | ||||
| Series 2005-8HE Class A1, 4.9381% 7/25/35 (a)(d) | 3,767,774 | 3,768,265 | ||||
| Washington Mutual Mortgage Securities Corp. Series | ||||||
| 2006-AR4 Class 1A1C, 5.0594% 5/25/46 (b)(d) | 4,315,000 | 4,315,000 |
See accompanying notes which are an integral part of the financial statements.
41 Semiannual Report
| Investments continued | ||||||||||
| Asset Backed Securities continued | ||||||||||
| Principal Amount | Value (Note 1) | |||||||||
| Wells Fargo Home Equity Trust Series 2004-7A Class A, | ||||||||||
| 4.75% 8/27/34 (a) | $ 312,562 | $ 311,999 | ||||||||
| Whinstone Capital Management Ltd. Series 1A Class B3, | ||||||||||
| 5.5229% 10/25/44 (a)(d) | 22,670,000 | 22,663,199 | ||||||||
| TOTAL ASSET BACKED SECURITIES | ||||||||||
| (Cost $2,228,676,940) | 2,233,267,232 | |||||||||
| Collateralized Mortgage Obligations 20.2% | ||||||||||
| Private Sponsor – 11.3% | ||||||||||
| Adjustable Rate Mortgage Trust floater: | ||||||||||
| Series 2004-2 Class 7A3, 5.2181% 2/25/35 (d) | 5,488,970 | 5,502,895 | ||||||||
| Series 2004-4 Class 5A2, 5.2181% 3/25/35 (d) | 2,123,516 | 2,127,253 | ||||||||
| Series 2005-1 Class 5A2, 5.1481% 5/25/35 (d) | 3,930,955 | 3,918,264 | ||||||||
| Series 2005-10: | ||||||||||
| Class 5A1, 5.0781% 1/25/36 (d) | 12,364,623 | 12,372,042 | ||||||||
| Class 5A2, 5.1381% 1/25/36 (d) | 568,773 | 569,114 | ||||||||
| Series 2005-2: | ||||||||||
| Class 6A2, 5.0981% 6/25/35 (d) | 1,623,515 | 1,625,119 | ||||||||
| Class 6M2, 5.2981% 6/25/35 (d) | 10,145,000 | 10,161,638 | ||||||||
| Series 2005-3 Class 8A2, 5.0581% 7/25/35 (d) | 12,069,516 | 12,092,425 | ||||||||
| Series 2005-4 Class 7A2, 5.0481% 8/25/35 (d) | 5,550,483 | 5,568,494 | ||||||||
| Series 2005-8 Class 7A2, 5.0981% 11/25/35 (d) | 5,903,249 | 5,920,324 | ||||||||
| American Home Mortgage Investment Trust floater Series | ||||||||||
| 2005-4 Class 1A1, 5.1081% 3/25/35 (d) | 10,448,408 | 10,465,551 | ||||||||
| Bear Stearns Adjustable Rate Mortgage Trust Series | ||||||||||
| 2005-6 Class 1A1, 5.125% 8/25/35 (d) | 15,820,692 | 15,674,046 | ||||||||
| Bear Stearns Alt-A Trust floater: | ||||||||||
| Series 2005-1 Class A1, 5.0981% 1/25/35 (d) | 14,848,685 | 14,872,234 | ||||||||
| Series 2005-2 Class 1A1, 5.0681% 3/25/35 (d) | 9,800,497 | 9,802,405 | ||||||||
| Series 2005-5 Class 1A1, 5.0381% 7/25/35 (d) | 13,437,638 | 13,436,430 | ||||||||
| Countrywide Alternative Loan Trust planned amortization | ||||||||||
| class Series 2003-5T2 Class A2, 5.2181% | ||||||||||
| 5/25/33 (d) | 3,850,373 | 3,853,628 | ||||||||
| CS First Boston Mortgage Securities Corp. floater: | ||||||||||
| Series 2004-AR2 Class 6A1, 5.2181% 3/25/34 (d) | 2,350,557 | 2,350,046 | ||||||||
| Series 2004-AR3 Class 6A2, 5.1881% 4/25/34 (d) | 1,147,602 | 1,148,543 | ||||||||
| Series 2004-AR4 Class 5A2, 5.1881% 5/25/34 (d) | 1,255,127 | 1,254,386 | ||||||||
| Series 2004-AR5 Class 11A2, 5.1881% 6/25/34 (d) | 1,815,523 | 1,812,170 | ||||||||
| Series 2004-AR6 Class 9A2, 5.1881% 10/25/34 (d) | 2,422,259 | 2,426,897 | ||||||||
| Series 2004-AR7 Class 6A2, 5.1981% 8/25/34 (d) | 3,532,542 | 3,539,850 | ||||||||
| Series 2004-AR8 Class 8A2, 5.1981% 9/25/34 (d) | 2,563,023 | 2,569,883 | ||||||||
See accompanying notes which are an integral part of the financial statements.
| Semiannual Report |
| 42 |
| Collateralized Mortgage Obligations continued | ||||||||
| Principal Amount | Value (Note 1) | |||||||
| Private Sponsor continued | ||||||||
| CWALT, Inc. floater Series 2005-56 Class 3A1, 5.1081% | ||||||||
| 11/25/35 (d) | $ 6,930,035 | $ 6,952,192 | ||||||
| First Horizon Mortgage pass thru Trust floater Series | ||||||||
| 2004-FL1 Class 2A1, 5.5638% 12/25/34 (d) | 1,901,205 | 1,900,235 | ||||||
| Gracechurch Mortgage Funding PLC floater Series 1A: | ||||||||
| Class A2B, 4.6045% 10/11/41 (a)(d) | 9,875,000 | 9,873,914 | ||||||
| Class CB, 4.8145% 10/11/41 (a)(d) | 2,100,000 | 2,099,769 | ||||||
| Class DB, 5.0045% 10/11/41 (a)(d) | 8,485,000 | 8,483,982 | ||||||
| Granite Master Issuer PLC floater: | ||||||||
| Series 2005-1: | ||||||||
| Class A3, 5.01% 12/21/24 (d) | 5,300,000 | 5,299,311 | ||||||
| Class B1, 5.06% 12/20/54 (d) | 7,050,000 | 7,048,590 | ||||||
| Class M1, 5.16% 12/20/54 (d) | 5,300,000 | 5,298,940 | ||||||
| Series 2005-2 Class C1, 5.27% 12/20/54 (d) | 7,975,000 | 7,980,583 | ||||||
| Series 2005-4: | ||||||||
| Class C1, 5.2% 12/20/54 (d) | 12,100,000 | 12,096,219 | ||||||
| Class M2, 5.05% 12/20/54 (d) | 6,500,000 | 6,497,969 | ||||||
| Series 2006-1A Class C2, 5.2569% 12/20/54 (a)(d) | 5,800,000 | 5,797,042 | ||||||
| Granite Mortgages PLC floater: | ||||||||
| Series 2003-1 Class 1C, 6.051% 1/20/43 (d) | 2,285,000 | 2,330,700 | ||||||
| Series 2003-3 Class 1C, 6.051% 1/20/44 (d) | 4,590,000 | 4,706,184 | ||||||
| Series 2004-1: | ||||||||
| Class 1B, 5.14% 3/20/44 (d) | 1,415,000 | 1,415,442 | ||||||
| Class 1C, 5.83% 3/20/44 (d) | 9,705,000 | 9,717,131 | ||||||
| Class 1M, 5.34% 3/20/44 (d) | 4,935,000 | 4,938,084 | ||||||
| Series 2004-2: | ||||||||
| Class 1A2, 5% 6/20/28 (d) | 1,913,176 | 1,913,208 | ||||||
| Class 1B, 5.1% 6/20/44 (d) | 361,743 | 361,769 | ||||||
| Class 1C, 5.63% 6/20/44 (d) | 1,316,938 | 1,318,100 | ||||||
| Class 1M, 5.21% 6/20/44 (d) | 967,501 | 967,501 | ||||||
| Series 2004-3: | ||||||||
| Class 1B, 5.09% 9/20/44 (d) | 1,425,430 | 1,425,772 | ||||||
| Class 1C, 5.52% 9/20/44 (d) | 5,396,272 | 5,403,826 | ||||||
| Class 1M, 5.2% 9/20/44 (d) | 814,532 | 814,857 | ||||||
| Harborview Mortgage Loan Trust floater Series 2005-2 | ||||||||
| Class 2A1A, 4.9963% 5/19/35 (d) | 9,912,288 | 9,923,284 | ||||||
| Holmes Financing No. 7 PLC floater Series 2 Class M, | ||||||||
| 5.4% 7/15/40 (d) | 2,560,000 | 2,573,046 | ||||||
| Holmes Financing No. 8 PLC floater Series 2: | ||||||||
| Class A, 4.68% 4/15/11 (d) | 25,000,000 | 25,006,270 | ||||||
| Class B, 4.77% 7/15/40 (d) | 2,695,000 | 2,693,922 | ||||||
| Class C, 5.32% 7/15/40 (d) | 10,280,000 | 10,303,644 | ||||||
See accompanying notes which are an integral part of the financial statements.
43 Semiannual Report
| Investments continued | ||||||||
| Collateralized Mortgage Obligations continued | ||||||||
| Principal Amount | Value (Note 1) | |||||||
| Private Sponsor continued | ||||||||
| Home Equity Asset Trust floater Series 2005-3 Class 2A1, | ||||||||
| 4.9081% 8/25/35 (d) | $ 3,283,345 | $ 3,283,856 | ||||||
| Homestar Mortgage Acceptance Corp. floater Series | ||||||||
| 2004-5 Class A1, 5.2681% 10/25/34 (d) | 3,171,951 | 3,185,405 | ||||||
| Impac CMB Trust floater: | ||||||||
| Series 2004-11 Class 2A2, 5.1881% 3/25/35 (d) | 5,875,822 | 5,882,096 | ||||||
| Series 2004-6 Class 1A2, 5.2081% 10/25/34 (d) | 2,437,853 | 2,444,358 | ||||||
| Series 2005-1: | ||||||||
| Class M1, 5.2781% 4/25/35 (d) | 2,387,430 | 2,391,866 | ||||||
| Class M2, 5.3181% 4/25/35 (d) | 4,179,684 | 4,186,828 | ||||||
| Class M3, 5.3481% 4/25/35 (d) | 1,025,586 | 1,026,600 | ||||||
| Class M4, 5.5681% 4/25/35 (d) | 605,264 | 606,103 | ||||||
| Class M5, 5.5881% 4/25/35 (d) | 605,264 | 605,700 | ||||||
| Class M6, 5.6381% 4/25/35 (d) | 968,421 | 968,477 | ||||||
| Series 2005-2 Class 1A2, 5.1281% 4/25/35 (d) | 10,076,435 | 10,078,010 | ||||||
| Series 2005-3 Class A1, 5.0581% 8/25/35 (d) | 11,718,003 | 11,712,381 | ||||||
| Series 2005-4 Class 1B1, 6.1181% 5/25/35 (d) | 4,044,899 | 4,028,467 | ||||||
| Series 2005-6 Class 1M3, 5.4281% 10/25/35 (d) | 2,985,504 | 2,985,504 | ||||||
| Series 2005-7: | ||||||||
| Class M1, 5.2981% 11/25/35 (d) | 1,656,466 | 1,657,781 | ||||||
| Class M2, 5.3381% 11/25/35 (d) | 1,243,523 | 1,245,622 | ||||||
| Class M3, 5.4381% 11/25/35 (d) | 6,208,227 | 6,228,826 | ||||||
| Class M4, 5.4781% 11/25/35 (d) | 2,974,130 | 2,970,683 | ||||||
| JPMorgan Mortgage Trust Series 2005-A8 Class 2A3, | ||||||||
| 4.9645% 11/25/35 (d) | 2,155,000 | 2,107,096 | ||||||
| Lehman Structured Securities Corp. floater Series 2005-1 | ||||||||
| Class A2, 4.9706% 9/26/45 (a)(d) | 11,814,192 | 11,827,114 | ||||||
| Lehman XS Trust Series 2006-06N Class A1, 0% | ||||||||
| 5/25/46 (b)(h) | 19,925,000 | 19,925,000 | ||||||
| MASTR Adjustable Rate Mortgages Trust: | ||||||||
| floater Series 2005-1 Class 1A1, 5.0881% | ||||||||
| 3/25/35 (d) | 5,243,656 | 5,255,467 | ||||||
| Series 2004-6 Class 4A2, 4.1464% 7/25/34 (d) | 2,107,186 | 2,097,956 | ||||||
| Merrill Lynch Mortgage Investors, Inc. floater: | ||||||||
| Series 2003-A Class 2A1, 5.2081% 3/25/28 (d) | 5,181,921 | 5,208,379 | ||||||
| Series 2003-B Class A1, 5.1581% 4/25/28 (d) | 5,309,573 | 5,340,435 | ||||||
| Series 2003-D Class A, 5.1281% 8/25/28 (d) | 4,905,240 | 4,913,274 | ||||||
| Series 2003-E Class A2, 5.2938% 10/25/28 (d) | 6,080,223 | 6,103,113 | ||||||
| Series 2003-F Class A2, 4.43% 10/25/28 (d) | 7,572,720 | 7,584,190 | ||||||
| Series 2004-A Class A2, 4.34% 4/25/29 (d) | 6,952,884 | 6,958,513 | ||||||
| Series 2004-B Class A2, 4.83% 6/25/29 (d) | 5,587,124 | 5,575,176 | ||||||
| Series 2004-C Class A2, 5.01% 7/25/29 (d) | 7,614,046 | 7,595,628 | ||||||
See accompanying notes which are an integral part of the financial statements.
| Semiannual Report |
| 44 |
| Collateralized Mortgage Obligations continued | ||||||||
| Principal Amount | Value (Note 1) | |||||||
| Private Sponsor continued | ||||||||
| Merrill Lynch Mortgage Investors, Inc. floater: - | ||||||||
| continued | ||||||||
| Series 2004-D Class A2, 5.3238% 9/25/29 (d) | $ 6,023,975 | $ 6,033,660 | ||||||
| Series 2004-E: | ||||||||
| Class A2B, 4.45% 11/25/29 (d) | 5,229,656 | 5,232,314 | ||||||
| Class A2D, 4.64% 11/25/29 (d) | 1,216,199 | 1,221,104 | ||||||
| Series 2004-G Class A2, 5.01% 11/25/29 (d) | 2,559,246 | 2,559,343 | ||||||
| Series 2005-A Class A2, 5.2138% 2/25/30 (d) | 7,142,025 | 7,146,412 | ||||||
| Mortgage Asset Backed Securities Trust floater Series | ||||||||
| 2002-NC1 Class M1, 5.6681% 10/25/32 (d) | 768,036 | 769,559 | ||||||
| MortgageIT Trust floater: | ||||||||
| Series 2004-2: | ||||||||
| Class A1, 5.1881% 12/25/34 (d) | 3,944,928 | 3,952,942 | ||||||
| Class A2, 5.2681% 12/25/34 (d) | 5,336,838 | 5,365,937 | ||||||
| Series 2005-2 Class 1A1, 5.0781% 5/25/35 (d) | 4,188,775 | 4,187,179 | ||||||
| Opteum Mortgage Acceptance Corp. floater: | ||||||||
| Series 2005-3 Class APT, 5.1081% 7/25/35 (d) | 16,429,231 | 16,444,633 | ||||||
| Series 2005-5 Class 1A1B, 5.0181% 11/25/35 (d) | 7,595,000 | 7,595,000 | ||||||
| Permanent Financing No. 3 PLC floater Series 2 Class C, | ||||||||
| 5.93% 6/10/42 (d) | 4,845,000 | 4,870,929 | ||||||
| Permanent Financing No. 4 PLC floater Series 2 Class C, | ||||||||
| 5.6% 6/10/42 (d) | 15,400,000 | 15,475,814 | ||||||
| Permanent Financing No. 5 PLC floater: | ||||||||
| Series 2 Class C, 5.53% 6/10/42 (d) | 4,215,000 | 4,232,282 | ||||||
| Series 3 Class C, 5.7% 6/10/42 (d) | 8,890,000 | 8,967,343 | ||||||
| Permanent Financing No. 6 PLC floater Series 6 Class | ||||||||
| 2C, 5.33% 6/10/42 (d) | 5,350,000 | 5,339,835 | ||||||
| Permanent Financing No. 7 PLC floater Series 7 Class | ||||||||
| 2C, 5.21% 6/10/42 (d) | 8,065,000 | 8,044,522 | ||||||
| Permanent Financing No. 8 PLC floater Series 8: | ||||||||
| Class 1C, 5.21% 6/10/42 (d) | 7,165,000 | 7,163,123 | ||||||
| Class 2C, 5.28% 6/10/42 (d) | 9,945,000 | 9,942,384 | ||||||
| Permanent Financing No. 9 PLC floater Series 9A: | ||||||||
| Class 1C, 5.2105% 6/10/42 (a)(d) | 3,105,000 | 3,104,416 | ||||||
| Class 2C, 5.2905% 6/10/42 (a)(d) | 5,665,000 | 5,663,935 | ||||||
| Class 3C, 5.4105% 6/10/42 (a)(d) | 4,880,000 | 4,879,078 | ||||||
| Residential Asset Mortgage Products, Inc.: | ||||||||
| sequential pay Series 2003-SL1 Class A31, 7.125% | ||||||||
| 4/25/31 | 3,529,472 | 3,537,506 | ||||||
| Series 2005-AR5 Class 1A1, 4.8502% 9/19/35 (d) . | 4,559,585 | 4,510,720 | ||||||
See accompanying notes which are an integral part of the financial statements.
45 Semiannual Report
| Investments continued | ||||||||
| Collateralized Mortgage Obligations continued | ||||||||
| Principal Amount | Value (Note 1) | |||||||
| Private Sponsor continued | ||||||||
| Residential Finance LP/Residential Finance Development | ||||||||
| Corp. floater Series 2003-A: | ||||||||
| Class B4, 6.4981% 3/10/35 (a)(d) | $ 5,421,889 | $ 5,451,075 | ||||||
| Class B5, 7.0481% 3/10/35 (a)(d) | 5,611,146 | 5,723,526 | ||||||
| Residential Funding Securities Corp.: | ||||||||
| Series 2003-RP1 Class A1, 5.3181% 11/25/34 (d) | 1,074,061 | 1,080,969 | ||||||
| Series 2003-RP2 Class A1, 5.2681% 6/25/33 (a)(d) . | 2,691,645 | 2,702,579 | ||||||
| Resmae Mortgage Loan Trust floater Series 2006-1 Class | ||||||||
| A2A, 4.8938% 2/25/36 (a)(b)(d) | 9,530,000 | 9,530,000 | ||||||
| Sequoia Mortgage Trust floater: | ||||||||
| Series 2003-5 Class A2, 5.27% 9/20/33 (d) | 7,134,609 | 7,136,084 | ||||||
| Series 2003-7 Class A2, 4.925% 1/20/34 (d) | 5,663,590 | 5,660,891 | ||||||
| Series 2004-1 Class A, 5.02% 2/20/34 (d) | 3,446,981 | 3,442,192 | ||||||
| Series 2004-10 Class A4, 4.7% 11/20/34 (d) | 6,246,674 | 6,245,306 | ||||||
| Series 2004-3 Class A, 4.61% 5/20/34 (d) | 6,362,605 | 6,365,232 | ||||||
| Series 2004-4 Class A, 4.62% 5/20/34 (d) | 8,008,810 | 8,002,187 | ||||||
| Series 2004-5 Class A3, 4.86% 6/20/34 (d) | 5,563,904 | 5,563,904 | ||||||
| Series 2004-6: | ||||||||
| Class A3A, 4.9644% 6/20/35 (d) | 4,851,538 | 4,847,743 | ||||||
| Class A3B, 5.1069% 7/20/34 (d) | 606,442 | 606,216 | ||||||
| Series 2004-7: | ||||||||
| Class A3A, 5.265% 8/20/34 (d) | 4,621,523 | 4,619,613 | ||||||
| Class A3B, 5.49% 7/20/34 (d) | 831,619 | 833,309 | ||||||
| Series 2004-8 Class A2, 5.31% 9/20/34 (d) | 8,236,587 | 8,245,257 | ||||||
| Series 2005-1 Class A2, 4.97% 2/20/35 (d) | 4,857,139 | 4,852,078 | ||||||
| Series 2005-2 Class A2, 5.19% 3/20/35 (d) | 7,648,952 | 7,646,506 | ||||||
| Series 2005-3 Class A1, 4.9763% 5/20/35 (d) | 6,212,639 | 6,207,915 | ||||||
| Structured Adjustable Rate Mortgage Loan Trust floater | ||||||||
| Series 2001-14 Class A1, 5.1281% 7/25/35 (d) | 9,253,561 | 9,287,597 | ||||||
| Structured Asset Securities Corp. floater Series | ||||||||
| 2004-NP1 Class A, 5.2181% 9/25/33 (a)(d) | 1,608,538 | 1,609,401 | ||||||
| Thornburg Mortgage Securities Trust floater: | ||||||||
| Series 2004-3 Class A, 5.1881% 9/25/34 (d) | 17,147,973 | 17,222,848 | ||||||
| Series 2005-3 Class A4, 5.0881% 10/25/35 (d) | 16,754,266 | 16,721,202 | ||||||
| Wachovia Mortgage Loan Trust LLC Series 2005-B Class | ||||||||
| 2A4, 5.1893% 10/20/35 (d) | 1,720,000 | 1,697,509 | ||||||
| WAMU Mortgage pass thru certificates floater: | ||||||||
| Series 2005-AR11 Class A1C1, 5.0181% | ||||||||
| 8/25/45 (d) | 11,838,968 | 11,828,690 | ||||||
| Series 2005-AR13 Class A1C1, 5.0081% | ||||||||
| 10/25/45 (d) | 20,624,765 | 20,604,573 | ||||||
See accompanying notes which are an integral part of the financial statements.
| Semiannual Report |
| 46 |
| Collateralized Mortgage Obligations continued | ||||||||||
| Principal Amount | Value (Note 1) | |||||||||
| Private Sponsor continued | ||||||||||
| WAMU Mortgage pass thru certificates floater: - | ||||||||||
| continued | ||||||||||
| Series 2005-AR17 Class A1C1, 5.0081% | ||||||||||
| 12/25/45 (d) | $ 9,812,918 | $ 9,807,496 | ||||||||
| Series 2005-AR19 Class A1C1, 5.0081% | ||||||||||
| 12/25/45 (d) | 15,835,897 | 15,835,772 | ||||||||
| Series 2005 AR6 Class 2A 1A, 5.0481% 4/25/45 (d) | 4,806,342 | 4,805,337 | ||||||||
| Wells Fargo Mortgage Backed Securities Trust: | ||||||||||
| Series 2004-M Class A3, 4.6806% 8/25/34 (d) | 15,072,130 | 14,964,091 | ||||||||
| Series 2005-AR12 Class 2A1, 4.3204% 7/25/35 (d) | 22,829,922 | 22,414,890 | ||||||||
| TOTAL PRIVATE SPONSOR | 861,986,985 | |||||||||
| U.S. Government Agency 8.9% | ||||||||||
| Fannie Mae: | ||||||||||
| floater: | ||||||||||
| Series 2000-38 Class F, 5.2763% 11/18/30 (d) | 761,856 | 768,477 | ||||||||
| Series 2000-40 Class FA, 5.3181% 7/25/30 (d) | 1,956,419 | 1,964,734 | ||||||||
| Series 2002-89 Class F, 5.1181% 1/25/33 (d) | 2,752,806 | 2,756,071 | ||||||||
| planned amortization class Series 2003-24 CLass PB, | ||||||||||
| 4.5% 12/25/12 | 18,813,618 | 18,650,767 | ||||||||
| target amortization class Series G94-2 Class D, 6.45% | ||||||||||
| 1/25/24 | 3,642,199 | 3,692,475 | ||||||||
| Fannie Mae Grantor Trust floater Series 2005-90 Class | ||||||||||
| FG, 5.0681% 10/25/35 (d) | 47,311,935 | 47,140,197 | ||||||||
| Fannie Mae guaranteed REMIC pass thru certificates: | ||||||||||
| floater: | ||||||||||
| Series 2001-34 Class FR, 5.1763% 8/18/31 (d) | 2,006,210 | 2,015,222 | ||||||||
| Series 2001-38 Class QF, 5.7981% 8/25/31 (d) | 7,947,030 | 8,133,264 | ||||||||
| Series 2001-44 Class FB, 5.1181% 9/25/31 (d) | 1,788,982 | 1,795,399 | ||||||||
| Series 2001-46 Class F, 5.1763% 9/18/31 (d) | 5,152,267 | 5,186,968 | ||||||||
| Series 2002-11 Class QF, 5.3181% 3/25/32 (d) | 3,586,281 | 3,619,678 | ||||||||
| Series 2002-36 Class FT, 5.3181% 6/25/32 (d) | 1,222,924 | 1,235,180 | ||||||||
| Series 2002-64 Class FE, 5.1263% 10/18/32 (d) | 1,765,789 | 1,776,013 | ||||||||
| Series 2002-65 Class FA, 5.1181% 10/25/17 (d) | 1,623,025 | 1,626,248 | ||||||||
| Series 2002-74 Class FV, 5.2681% 11/25/32 (d) | 6,829,703 | 6,889,322 | ||||||||
| Series 2002-77 Class FY, 5.2181% 12/25/17 (d) | 21,753,029 | 21,920,436 | ||||||||
| Series 2003-11: | ||||||||||
| Class DF, 5.2681% 2/25/33 (d) | 2,414,492 | 2,435,519 | ||||||||
| Class EF, 5.2681% 2/25/33 (d) | 1,461,909 | 1,468,091 | ||||||||
| Series 2003-119 Class FK, 5.3181% 5/25/18 (d) | 2,500,000 | 2,528,015 | ||||||||
See accompanying notes which are an integral part of the financial statements.
47 Semiannual Report
| Investments continued | ||||||||
| Collateralized Mortgage Obligations continued | ||||||||
| Principal Amount | Value (Note 1) | |||||||
| U.S. Government Agency continued | ||||||||
| Fannie Mae guaranteed REMIC pass thru certificates: - | ||||||||
| continued | ||||||||
| floater: | ||||||||
| Series 2003-131 Class FM, 5.2181% 12/25/29 (d) | $ 2,994,749 | $ 3,005,879 | ||||||
| Series 2003-15 Class WF, 5.1681% 8/25/17 (d) | 4,824,454 | 4,844,417 | ||||||
| Series 2003-63 Class F1, 5.1181% 11/25/27 (d) . | 4,640,760 | 4,645,032 | ||||||
| Series 2005-45 Class XA, 5.1581% 6/25/35 (d) | 68,767,169 | 68,609,775 | ||||||
| planned amortization class: | ||||||||
| Series 2001-62 Class PG, 6.5% 10/25/30 | 855,719 | 852,932 | ||||||
| Series 2002-16 Class QD, 5.5% 6/25/14 | 60,692 | 60,516 | ||||||
| Series 2002-28 Class PJ, 6.5% 3/25/31 | 1,365,855 | 1,361,675 | ||||||
| Series 2002-8 Class PD, 6.5% 7/25/30 | 221,156 | 220,392 | ||||||
| Series 2005-72 Class FG, 5.0681% 5/25/35 (d) | 49,893,260 | 49,712,936 | ||||||
| Freddie Mac: | ||||||||
| floater: | ||||||||
| Series 2344 Class FP, 5.6988% 8/15/31 (d) | 5,340,041 | 5,436,984 | ||||||
| Series 2510 Class FE, 5.1488% 10/15/32 (d) | 5,087,518 | 5,123,117 | ||||||
| Series 3028 Class FM, 4.9988% 9/15/35 (d) | 25,235,751 | 25,143,462 | ||||||
| Series 3033 Class TF, 0% 9/15/35 (d) | 854,545 | 802,071 | ||||||
| planned amortization class Series 2353 Class PC, | ||||||||
| 6.5% 9/15/15 | 240,194 | 239,708 | ||||||
| Freddie Mac Manufactured Housing participation | ||||||||
| certificates guaranteed floater Series 2338 Class FJ, | ||||||||
| 4.9488% 7/15/31 (d) | 4,459,131 | 4,421,929 | ||||||
| Freddie Mac Multi class participation certificates guaranteed: | ||||||||
| floater: | ||||||||
| Series 2395 Class FA, 5.3488% 6/15/29 (d) | 937,156 | 943,031 | ||||||
| Series 2406: | ||||||||
| Class FP, 5.7288% 1/15/32 (d) | 9,106,556 | 9,297,554 | ||||||
| Class PF, 5.7288% 12/15/31 (d) | 8,125,000 | 8,337,557 | ||||||
| Series 2410 Class PF, 5.7288% 2/15/32 (d) | 18,157,706 | 18,630,201 | ||||||
| Series 2412 Class GF, 5.6988% 2/15/32 (d) | 4,470,374 | 4,581,288 | ||||||
| Series 2453 Class NF, 5.1488% 2/15/17 (d) | 18,071,288 | 18,154,820 | ||||||
| Series 2474 Class FJ, 5.0988% 7/15/17 (d) | 3,726,582 | 3,733,434 | ||||||
| Series 2526 Class FC, 5.1488% 11/15/32 (d) | 2,400,966 | 2,411,156 | ||||||
| Series 2538 Class FB, 5.1488% 12/15/32 (d) | 5,487,274 | 5,515,543 | ||||||
| Series 2551 Class FH, 5.1988% 1/15/33 (d) | 2,312,928 | 2,322,535 | ||||||
| Series 2553 Class FB, 5.2488% 3/15/29 (d) | 21,880,000 | 22,002,493 | ||||||
| Series 2554 Class FJ, 5.1988% 3/15/28 (d) | 9,445,080 | 9,489,722 | ||||||
| Series 2577 Class FW, 5.2488% 1/15/30 (d) | 15,611,264 | 15,702,746 | ||||||
| Series 2861: | ||||||||
| Class GF, 5.0488% 1/15/21 (d) | 4,118,432 | 4,121,677 | ||||||
See accompanying notes which are an integral part of the financial statements.
| Semiannual Report |
| 48 |
| Collateralized Mortgage Obligations continued | ||||||||
| Principal Amount | Value (Note 1) | |||||||
| U.S. Government Agency continued | ||||||||
| Freddie Mac Multi-class participation certificates | ||||||||
| guaranteed: – continued | ||||||||
| floater: | ||||||||
| Series 2861: | ||||||||
| Class JF, 5.0488% 4/15/17 (d) | $ 6,203,380 | $ 6,212,743 | ||||||
| Series 2994 Class FB, 4.8988% 6/15/20 (d) | 5,699,603 | 5,684,028 | ||||||
| Series 3066 Class HF, 0% 1/15/34 (d) | 560,977 | 575,865 | ||||||
| Series 3071 Class TF, 5.0488% 4/15/35 (d) | 49,485,486 | 49,343,175 | ||||||
| Series 3094 Class UF, 0% 9/15/34 (d) | 1,529,140 | 1,499,204 | ||||||
| planned amortization class: | ||||||||
| Series 2136 Class PE, 6% 1/15/28 | 10,365,276 | 10,362,695 | ||||||
| Series 2395 Class PE, 6% 2/15/30 | 2,008,840 | 2,009,532 | ||||||
| Series 2398 Class DK, 6.5% 1/15/31 | 5,860 | 5,848 | ||||||
| Series 2461 Class PG, 6.5% 1/15/31 | 493,595 | 493,187 | ||||||
| Series 2650 Class FV, 5.1488% 12/15/32 (d) | 23,395,279 | 23,475,677 | ||||||
| Series 2776 Class UJ, 4.5% 5/15/20 (e) | 5,261,113 | 176,045 | ||||||
| Series 2828 Class JA, 4.5% 1/15/10 | 7,937,979 | 7,896,650 | ||||||
| Series 3013 Class AF, 4.9988% 5/15/35 (d) | 78,964,503 | 78,675,138 | ||||||
| sequential pay: | ||||||||
| Series 2608 Class FJ, 5.1488% 3/15/17 (d) | 14,051,546 | 14,120,548 | ||||||
| Series 2638 Class FA, 5.1488% 11/15/16 (d) | 12,969,612 | 13,022,589 | ||||||
| Series 2644 Class EF, 5.0988% 2/15/18 (d) | 14,557,097 | 14,602,593 | ||||||
| Ginnie Mae guaranteed REMIC pass thru securities | ||||||||
| floater: | ||||||||
| Series 2001-46 Class FB, 5.0988% 5/16/23 (d) | 2,399,041 | 2,412,406 | ||||||
| Series 2001-50 Class FV, 4.9488% 9/16/27 (d) | 7,564,093 | 7,562,743 | ||||||
| Series 2002-24 Class FX, 5.2988% 4/16/32 (d) | 2,042,694 | 2,062,662 | ||||||
| Series 2002-31 Class FW, 5.1488% 6/16/31 (d) | 2,783,186 | 2,801,673 | ||||||
| Series 2002-5 Class KF, 5.1488% 8/16/26 (d) | 185,796 | 185,682 | ||||||
| TOTAL U.S. GOVERNMENT AGENCY | 678,507,341 | |||||||
| TOTAL COLLATERALIZED MORTGAGE OBLIGATIONS | ||||||||
| (Cost $1,541,434,185) | 1,540,494,326 | |||||||
| Commercial Mortgage Securities 6.2% | ||||||||
| Banc of America Large Loan, Inc.: | ||||||||
| floater: | ||||||||
| Series 2003 BBA2 Class A3, 5.0688% 11/15/15 (a)(d) | 5,038,226 | 5,043,821 | ||||||
| Series 2005-BBA6: | ||||||||
| Class B, 4.9588% 1/15/19 (a)(d) | 2,800,000 | 2,799,756 | ||||||
| Class C, 4.9988% 1/15/19 (a)(d) | 2,857,948 | 2,857,507 | ||||||
See accompanying notes which are an integral part of the financial statements.
49 Semiannual Report
| Investments continued | ||||||||
| Commercial Mortgage Securities continued | ||||||||
| Principal Amount | Value (Note 1) | |||||||
| Banc of America Large Loan, Inc.: – continued | ||||||||
| floater: | ||||||||
| Series 2005-BBA6: | ||||||||
| Class D, 5.0488% 1/15/19 (a)(d) | $ 2,800,000 | $ 2,799,756 | ||||||
| Class E, 5.0888% 1/15/19 (a)(d) | 1,750,000 | 1,749,847 | ||||||
| Class F, 5.1388% 1/15/19 (a)(d) | 1,170,000 | 1,169,898 | ||||||
| Class G, 5.1688% 1/15/19 (a)(d) | 915,000 | 914,920 | ||||||
| Series 2005-BOCA: | ||||||||
| Class H, 5.6988% 12/15/16 (a)(d) | 2,065,000 | 2,068,939 | ||||||
| Class J, 5.8488% 12/15/16 (a)(d) | 1,020,000 | 1,022,016 | ||||||
| Class K, 6.0988% 12/15/16 (a)(d) | 6,659,000 | 6,672,146 | ||||||
| Series 2006-ESH: | ||||||||
| Class A, 5.6% 7/14/11 (a)(d) | 7,442,985 | 7,412,496 | ||||||
| Class B, 5.7% 7/14/11 (a)(d) | 3,700,812 | 3,685,670 | ||||||
| Class C, 5.85% 7/14/11 (a)(d) | 7,411,773 | 7,381,497 | ||||||
| Class D, 6.48% 7/14/11 (a)(d) | 4,320,039 | 4,305,402 | ||||||
| Series 2006 LAQ: | ||||||||
| Class H, 5.6025% 2/9/21 (b)(d) | 3,495,000 | 3,495,000 | ||||||
| Class J, 5.6925% 2/9/21 (b)(d) | 2,525,000 | 2,525,000 | ||||||
| Class K, 5.9225% 2/9/21 (b)(d) | 6,990,000 | 6,990,000 | ||||||
| Bank of America Large Loan, Inc.: | ||||||||
| floater: | ||||||||
| Series 2005 ESHA: | ||||||||
| Class F, 5.49% 7/14/08 (a)(d) | 6,395,000 | 6,419,291 | ||||||
| Class G, 5.62% 7/14/08 (a)(d) | 4,355,000 | 4,371,515 | ||||||
| Class H, 5.84% 7/14/08 (a)(d) | 5,365,000 | 5,385,289 | ||||||
| Series 2005-MIB1: | ||||||||
| Class B, 5.0088% 3/15/22 (a)(d) | 3,930,000 | 3,928,726 | ||||||
| Class C, 5.0588% 3/15/22 (a)(d) | 1,660,000 | 1,658,867 | ||||||
| Class D, 5.1088% 3/15/22 (a)(d) | 1,680,000 | 1,678,831 | ||||||
| Class E, 5.1488% 3/15/22 (a)(d) | 3,205,000 | 3,202,765 | ||||||
| Class F, 5.2188% 3/15/22 (a)(d) | 1,635,000 | 1,633,860 | ||||||
| Class G, 5.2788% 3/15/22 (a)(d) | 1,060,000 | 1,059,262 | ||||||
| Series 2005 ESHA Class X1, 0.9161% 7/14/20 (a)(d)(e) | 334,645,000 | 3,708,235 | ||||||
| Bayview Commercial Asset Trust floater: | ||||||||
| Series 2003-1 Class A, 5.3981% 8/25/33 (a)(d) | 5,281,428 | 5,344,171 | ||||||
| Series 2003-2: | ||||||||
| Class A, 5.3981% 12/25/33 (a)(d) | 11,330,843 | 11,373,334 | ||||||
| Class M1, 5.6681% 12/25/33 (a)(d) | 1,843,913 | 1,853,132 | ||||||
| Series 2004-1: | ||||||||
| Class A, 5.1781% 4/25/34 (a)(d) | 5,487,703 | 5,494,562 | ||||||
| Class B, 6.7181% 4/25/34 (a)(d) | 570,151 | 575,496 | ||||||
| Class M1, 5.3781% 4/25/34 (a)(d) | 498,882 | 500,129 | ||||||
| Class M2, 6.0181% 4/25/34 (a)(d) | 427,613 | 431,889 | ||||||
See accompanying notes which are an integral part of the financial statements.
| Semiannual Report |
| 50 |
| Commercial Mortgage Securities continued | ||||||||
| Principal Amount | Value (Note 1) | |||||||
| Bayview Commercial Asset Trust floater: – continued | ||||||||
| Series 2004-2: | ||||||||
| Class A, 5.2481% 8/25/34 (a)(d) | $ 5,667,951 | $ 5,685,663 | ||||||
| Class M1, 5.3981% 8/25/34 (a)(d) | 1,827,592 | 1,837,872 | ||||||
| Series 2004-3: | ||||||||
| Class A1, 5.1881% 1/25/35 (a)(d) | 5,972,712 | 5,987,644 | ||||||
| Class A2, 5.2381% 1/25/35 (a)(d) | 830,120 | 831,158 | ||||||
| Class M1, 5.3181% 1/25/35 (a)(d) | 995,452 | 997,319 | ||||||
| Class M2, 5.8181% 1/25/35 (a)(d) | 649,208 | 656,106 | ||||||
| Series 2005-2A: | ||||||||
| Class M1, 5.2481% 8/25/35 (a)(d) | 1,244,945 | 1,247,461 | ||||||
| Class M2, 5.2981% 8/25/35 (a)(d) | 2,049,372 | 2,055,577 | ||||||
| Class M3, 5.3181% 8/25/35 (a)(d) | 1,134,816 | 1,138,249 | ||||||
| Class M4, 5.4281% 8/25/35 (a)(d) | 1,043,839 | 1,046,982 | ||||||
| Series 2005-3A: | ||||||||
| Class A1, 5.1381% 11/25/35 (a)(d) | 6,248,216 | 6,270,674 | ||||||
| Class M1, 5.2581% 11/25/35 (a)(d) | 879,342 | 881,585 | ||||||
| Class M2, 5.3081% 11/25/35 (a)(d) | 1,235,965 | 1,240,373 | ||||||
| Class M3, 5.3281% 11/25/35 (a)(d) | 1,104,063 | 1,107,997 | ||||||
| Class M4, 5.4181% 11/25/35 (a)(d) | 1,377,636 | 1,381,124 | ||||||
| Series 2005-4A: | ||||||||
| Class A2, 5.2081% 1/25/36 (a)(d) | 9,107,193 | 9,112,885 | ||||||
| Class B1, 6.2181% 1/25/36 (a)(d) | 761,243 | 768,855 | ||||||
| Class M1, 5.2681% 1/25/36 (a)(d) | 2,969,737 | 2,977,161 | ||||||
| Class M2, 5.2881% 1/25/36 (a)(d) | 890,921 | 893,705 | ||||||
| Class M3, 5.3181% 1/25/36 (a)(d) | 1,254,219 | 1,258,138 | ||||||
| Class M4, 5.4281% 1/25/36 (a)(d) | 692,939 | 695,537 | ||||||
| Class M5, 5.4681% 1/25/36 (a)(d) | 692,939 | 695,537 | ||||||
| Class M6, 5.5181% 1/25/36 (a)(d) | 692,939 | 695,537 | ||||||
| Series 2006-1: | ||||||||
| Class A2, 5.1781% 3/25/36 (a)(d) | 3,228,583 | 3,228,583 | ||||||
| Class M1, 5.1981% 3/25/36 (a)(d) | 986,512 | 986,512 | ||||||
| Class M2, 5.2181% 3/25/36 (a)(d) | 1,042,314 | 1,042,314 | ||||||
| Class M3, 5.2381% 3/25/36 (a)(d) | 896,829 | 896,829 | ||||||
| Class M4, 5.3381% 3/25/36 (a)(d) | 508,203 | 508,203 | ||||||
| Class M5, 5.3781% 3/25/36 (a)(d) | 493,256 | 493,256 | ||||||
| Class M6, 5.4581% 3/25/36 (a)(d) | 1,086,159 | 1,086,159 | ||||||
| Bear Stearns Commercial Mortgage Securities, Inc. | ||||||||
| floater: | ||||||||
| Series 2003 BA1A: | ||||||||
| Class JFCM, 6.34% 4/14/15 (a)(d) | 1,344,296 | 1,354,212 | ||||||
| Class KFCM, 6.59% 4/14/15 (a)(d) | 1,436,661 | 1,447,811 | ||||||
| Class LFCM, 6.99% 4/14/15 (a)(d) | 1,601,905 | 1,602,628 | ||||||
See accompanying notes which are an integral part of the financial statements.
51 Semiannual Report
| Investments continued | ||||||||
| Commercial Mortgage Securities continued | ||||||||
| Principal Amount | Value (Note 1) | |||||||
| Bear Stearns Commercial Mortgage Securities, Inc. | ||||||||
| floater: – continued | ||||||||
| Series 2003 BA1A: | ||||||||
| Class MFCM, 7.29% 4/14/15 (a)(d) | $ 2,218,251 | $ 2,219,251 | ||||||
| Series 2004-BBA3 Class E, 5.4488% 6/15/17 (a)(d) . | 10,415,000 | 10,437,991 | ||||||
| COMM floater: | ||||||||
| Series 2001-FL5A Class E, 6.2488% 11/15/13 (a)(d) | 2,822,712 | 2,822,712 | ||||||
| Series 2002-FL6: | ||||||||
| Class F, 6.1988% 6/14/14 (a)(d) | 8,218,856 | 8,218,856 | ||||||
| Class G, 6.6488% 6/14/14 (a)(d) | 5,000,000 | 5,000,000 | ||||||
| Commercial Mortgage pass thru certificates floater: | ||||||||
| Series 2004-HTL1: | ||||||||
| Class B, 5.1988% 7/15/16 (a)(d) | 191,124 | 191,191 | ||||||
| Class D, 5.2988% 7/15/16 (a)(d) | 434,929 | 435,086 | ||||||
| Class E, 5.4988% 7/15/16 (a)(d) | 310,815 | 310,966 | ||||||
| Class F, 5.5488% 7/15/16 (a)(d) | 329,139 | 329,460 | ||||||
| Class H, 6.0488% 7/15/16 (a)(d) | 952,525 | 954,104 | ||||||
| Class J, 6.1988% 7/15/16 (a)(d) | 365,104 | 365,395 | ||||||
| Class K, 7.0988% 7/15/16 (a)(d) | 411,331 | 411,901 | ||||||
| Series 2005-F10A: | ||||||||
| Class B, 4.9788% 4/15/17 (a)(d) | 7,080,000 | 7,078,188 | ||||||
| Class C, 5.0188% 4/15/17 (a)(d) | 3,006,000 | 3,004,474 | ||||||
| Class D, 5.0588% 4/15/17 (a)(d) | 2,440,000 | 2,438,992 | ||||||
| Class E, 5.1188% 4/15/17 (a)(d) | 1,821,000 | 1,820,248 | ||||||
| Class F, 5.1588% 4/15/17 (a)(d) | 1,035,000 | 1,034,865 | ||||||
| Class G, 5.2988% 4/15/17 (a)(d) | 1,035,000 | 1,035,267 | ||||||
| Class H, 5.3688% 4/15/17 (a)(d) | 1,035,000 | 1,035,468 | ||||||
| Class I, 5.5988% 4/15/17 (a)(d) | 335,000 | 334,790 | ||||||
| Class MOA3, 5.0488% 3/15/20 (a)(d) | 4,590,000 | 4,589,836 | ||||||
| Series 2005-FL11: | ||||||||
| Class B, 4.9988% 11/15/17 (a)(d) | 2,999,446 | 2,998,958 | ||||||
| Class C, 5.0488% 11/15/17 (a)(d) | 6,188,856 | 6,186,516 | ||||||
| Class D, 5.0888% 11/15/17 (a)(d) | 1,064,803 | 1,065,012 | ||||||
| Class E, 5.1388% 11/15/17 (a)(d) | 1,634,698 | 1,634,080 | ||||||
| Class F, 5.1988% 11/15/17 (a)(d) | 1,484,726 | 1,484,590 | ||||||
| Class G, 5.2488% 11/15/17 (a)(d) | 2,379,560 | 2,378,661 | ||||||
| Series 2006-CN2A Class AJFL, 4.9206% | ||||||||
| 2/5/19 (a)(d) | 8,865,000 | 8,865,000 | ||||||
| CS First Boston Mortgage Securities Corp.: | ||||||||
| floater: | ||||||||
| Series 2004-FL1 Class B, 5.1988% 5/15/14 (a)(d) . | 7,876,194 | 7,880,585 | ||||||
| Series 2004-HC1: | ||||||||
| Class A2, 5.2488% 12/15/21 (a)(d) | 1,475,000 | 1,474,994 | ||||||
| Class B, 5.4988% 12/15/21 (a)(d) | 3,835,000 | 3,834,985 | ||||||
See accompanying notes which are an integral part of the financial statements.
| Semiannual Report |
| 52 |
| Commercial Mortgage Securities continued | ||||||||
| Principal Amount | Value (Note 1) | |||||||
| CS First Boston Mortgage Securities Corp.: – continued | ||||||||
| floater: | ||||||||
| Series 2004-TF2A Class E, 5.1688% | ||||||||
| 11/15/19 (a)(d) | $ 4,450,000 | $ 4,454,135 | ||||||
| Series 2004-TFL1: | ||||||||
| Class A2, 4.9388% 2/15/14 (a)(d) | 1,242,287 | 1,242,240 | ||||||
| Class E, 5.2988% 2/15/14 (a)(d) | 2,800,000 | 2,804,845 | ||||||
| Class F, 5.3488% 2/15/14 (a)(d) | 2,325,000 | 2,329,401 | ||||||
| Class G, 5.5988% 2/15/14 (a)(d) | 1,875,000 | 1,880,453 | ||||||
| Class H, 5.8488% 2/15/14 (a)(d) | 1,400,000 | 1,404,346 | ||||||
| Class J, 6.1488% 2/15/14 (a)(d) | 750,000 | 751,955 | ||||||
| Series 2005-CN2A Class A1J, 5.0788% | ||||||||
| 11/15/19 (a)(d) | 17,835,000 | 17,838,904 | ||||||
| Series 2005-TF2A Class F, 5.2488% | ||||||||
| 11/15/19 (a)(d) | 1,540,000 | 1,543,740 | ||||||
| Series 2005-TF3A Class A2, 5.0288% | ||||||||
| 11/15/20 (a)(d) | 22,225,000 | 22,224,911 | ||||||
| Series 2005-TFLA: | ||||||||
| Class C, 4.9888% 2/15/20 (a)(d) | 5,650,000 | 5,654,083 | ||||||
| Class E, 5.0788% 2/15/20 (a)(d) | 3,955,000 | 3,958,636 | ||||||
| Class F, 5.1288% 2/15/20 (a)(d) | 1,745,000 | 1,745,997 | ||||||
| Class G, 5.2688% 2/15/20 (a)(d) | 505,000 | 505,492 | ||||||
| Class H, 5.4988% 2/15/20 (a)(d) | 715,000 | 715,695 | ||||||
| sequential pay Series 1997-C2 Class A2, 6.52% | ||||||||
| 1/17/35 | 13,062 | 13,051 | ||||||
| Equitable Life Assurance Society of the United States: | ||||||||
| sequential pay Series 174 Class A1, 7.24% | ||||||||
| 5/15/06 (a) | 4,400,000 | 4,409,485 | ||||||
| Series 174: | ||||||||
| Class B1, 7.33% 5/15/06 (a) | 1,200,000 | 1,202,630 | ||||||
| Class C1, 7.52% 5/15/06 (a) | 2,500,000 | 2,505,722 | ||||||
| Class D1, 7.77% 5/15/06 (a) | 7,100,000 | 7,114,518 | ||||||
| Greenwich Capital Commercial Funding Corp. floater | ||||||||
| Series 2005-FL3A: | ||||||||
| Class H AON: | ||||||||
| 5.6606% 10/5/20 (a)(d) | 1,495,000 | 1,495,000 | ||||||
| 5.9106% 10/5/20 (a)(d) | 1,775,000 | 1,775,000 | ||||||
| Class M AON, 6.1606% 10/5/20 (a)(d) | 1,770,000 | 1,770,000 | ||||||
| Class N AON, 6.5106% 10/5/20 (a)(d) | 4,545,144 | 4,545,144 | ||||||
| GS Mortgage Securities Corp. II floater Series | ||||||||
| 2005-FL7A Class A1, 4.8206% 11/6/19 (a)(d) | 1,089,602 | 1,089,593 | ||||||
| Lehman Brothers Floating Rate Commercial Mortgage | ||||||||
| Trust floater: | ||||||||
| Series 2003 LLFA: | ||||||||
| Class A2, 5.1388% 12/16/14 (a)(d) | 8,045,299 | 8,045,968 | ||||||
See accompanying notes which are an integral part of the financial statements.
53 Semiannual Report
| Investments continued | ||||||||
| Commercial Mortgage Securities continued | ||||||||
| Principal Amount | Value (Note 1) | |||||||
| Lehman Brothers Floating Rate Commercial Mortgage | ||||||||
| Trust floater: – continued | ||||||||
| Series 2003 LLFA: | ||||||||
| Class B, 5.3488% 12/16/14 (a)(d) | $ 4,615,000 | $ 4,615,562 | ||||||
| Class C, 5.4488% 12/16/14 (a)(d) | 4,982,000 | 4,982,799 | ||||||
| Series 2005-LLFA Class FAIR, 6.3988% | ||||||||
| 7/15/18 (a)(d) | 4,360,000 | 4,372,174 | ||||||
| Morgan Stanley Capital I, Inc. floater Series 2005-XLF: | ||||||||
| Class B, 4.9588% 8/15/19 (a)(d) | 6,705,000 | 6,699,793 | ||||||
| Class C, 4.9888% 8/15/19 (a)(d) | 525,000 | 524,248 | ||||||
| Class D, 5.0088% 8/15/19 (a)(d) | 1,915,000 | 1,909,749 | ||||||
| Class E, 5.0288% 8/15/19 (a)(d) | 1,745,000 | 1,744,027 | ||||||
| Class F, 5.0688% 8/15/19 (a)(d) | 1,220,000 | 1,217,721 | ||||||
| Class G, 5.1188% 8/15/19 (a)(d) | 870,000 | 869,135 | ||||||
| Class H, 5.1388% 8/15/19 (a)(d) | 695,000 | 694,461 | ||||||
| Class J, 5.2088% 8/15/19 (a)(d) | 525,000 | 524,479 | ||||||
| Morgan Stanley Dean Witter Capital I Trust floater Series | ||||||||
| 2002-XLF Class F, 6.8106% 8/5/14 (a)(d) | 4,654,375 | 4,654,349 | ||||||
| SDG Macerich Properties LP floater Series 2000-1 Class | ||||||||
| A3, 5.0888% 5/15/09 (a)(d) | 18,000,000 | 18,000,000 | ||||||
| STRIPS III Ltd./STRIPS III Corp. floater Series 2004-1A | ||||||||
| Class A, 5.2894% 3/24/18 (a)(d) | 6,091,790 | 6,091,790 | ||||||
| Wachovia Bank Commercial Mortgage Trust: | ||||||||
| floater: | ||||||||
| Series 2005-WL5A: | ||||||||
| Class KHP1, 5.0988% 1/15/18 (a)(d) | 1,745,000 | 1,745,613 | ||||||
| Class KHP2, 5.2988% 1/15/18 (a)(d) | 1,745,000 | 1,746,215 | ||||||
| Class KHP3, 5.5988% 1/15/18 (a)(d) | 2,060,000 | 2,061,068 | ||||||
| Class KHP4, 5.6988% 1/15/18 (a)(d) | 1,600,000 | 1,600,828 | ||||||
| Class KHP5, 5.8988% 1/15/18 (a)(d) | 1,855,000 | 1,854,681 | ||||||
| Series 2005-WL6A: | ||||||||
| Class A2, 4.9988% 10/15/17 (a)(d) | 7,695,000 | 7,695,365 | ||||||
| Class AP, 6.0488% 10/15/17 (a)(d) | 10,000,000 | 10,007,900 | ||||||
| Class B, 5.0488% 10/15/17 (a)(d) | 1,540,000 | 1,540,073 | ||||||
| Class D, 5.1788% 10/15/17 (a)(d) | 3,090,000 | 3,089,711 | ||||||
| Series 2005-WL6A Class X1A, 0.754% | ||||||||
| 10/15/17 (a)(e) | 709,494,253 | 3,760,319 | ||||||
| TOTAL COMMERCIAL MORTGAGE SECURITIES | ||||||||
| (Cost $470,126,081) | 470,518,097 | |||||||
| Certificates of Deposit 8.3% | ||||||||
| BNP Paribas SA yankee 5.045% 2/21/07 | 96,000,000 | 95,828,419 | ||||||
| Credit Agricole SA euro 4.505% 10/16/06 | 30,000,000 | 29,886,480 | ||||||
See accompanying notes which are an integral part of the financial statements.
| Semiannual Report |
| 54 |
| Certificates of Deposit continued | ||||
| Principal Amount | Value (Note 1) | |||
| Credit Industriel et Commercial yankee 4.535% | ||||
| 10/17/06 | $ 30,000,000 | $ 29,890,590 | ||
| Deutsche Bank AG yankee 5.045% 2/21/07 | 96,000,000 | 95,828,419 | ||
| HBOS Treasury Services PLC yankee 5.04% 2/21/07 | 96,000,000 | 95,832,605 | ||
| Rabobank Nederland Coop. Central yankee 5.01% | ||||
| 2/14/07 | 94,400,000 | 94,205,385 | ||
| Royal Bank of Scotland PLC yankee 5.04% 2/21/07 | 96,000,000 | 95,824,320 | ||
| Societe Generale euro 5.05% 2/21/07 | 96,000,000 | 95,834,914 | ||
| TOTAL CERTIFICATES OF DEPOSIT | ||||
| (Cost $634,372,190) | 633,131,132 | |||
| Cash Equivalents 25.3% | ||||
| Maturity Amount | ||||
| Investments in repurchase agreements (Collateralized by | ||||
| U.S. Government Obligations), in a joint trading | ||||
| account at 4.86%, dated 3/31/06 due 4/3/06 (i) | $1,440,695,244 | 1,440,112,000 | ||
| With: | ||||
| Goldman Sachs & Co. at 4.98%, dated 2/22/06 due | ||||
| 5/23/06 (Collateralized by Equity Securities valued | ||||
| at $341,250,079) (d)(f) | 329,046,250 | 324,991,225 | ||
| Merrill Lynch, Pierce, Fenner & Smith at 4.92%, dated | ||||
| 3/31/06 due 4/3/06 (Collateralized by Mortgage | ||||
| Loan Obligations valued at $166,950,425, 4.41%– | ||||
| 6.92%, 3/25/18 – 3/25/36) | 159,065,124 | 159,000,000 | ||
| TOTAL CASH EQUIVALENTS | ||||
| (Cost $1,924,112,000) | 1,924,103,225 | |||
| TOTAL INVESTMENT PORTFOLIO 95.1% | ||||
| (Cost $7,239,236,955) | 7,241,660,603 | |||
| NET OTHER ASSETS – 4.9% | 372,757,749 | |||
| NET ASSETS 100% | $7,614,418,352 | |||
See accompanying notes which are an integral part of the financial statements.
55 Semiannual Report
| Investments continued | ||||||
| Futures Contracts | ||||||
| Expiration | Underlying Face | Unrealized | ||||
| Date | Amount at Value | Appreciation/ | ||||
| (Depreciation) | ||||||
| Purchased | ||||||
| Eurodollar Contracts | ||||||
| 196 Eurodollar 90 Day Index Contracts | June 2006 | $ 193,449,550 | $ (58,234) | |||
| 128 Eurodollar 90 Day Index Contracts | Sept. 2006 | 126,315,200 | (22,912) | |||
| TOTAL EURODOLLAR CONTRACTS | (81,146) | |||||
| Sold | ||||||
| Eurodollar Contracts | ||||||
| 43 Eurodollar 90 Day Index Contracts | Dec. 2006 | 42,435,087 | 90,365 | |||
| 41 Eurodollar 90 Day Index Contracts | March 2007 | 40,466,488 | 80,524 | |||
| 34 Eurodollar 90 Day Index Contracts | June 2007 | 33,560,975 | 57,814 | |||
| 24 Eurodollar 90 Day Index Contracts | Sept. 2007 | 23,691,600 | 41,604 | |||
| 20 Eurodollar 90 Day Index Contracts | Dec. 2007 | 19,743,000 | 34,620 | |||
| 20 Eurodollar 90 Day Index Contracts | March 2008 | 19,742,750 | 33,870 | |||
| 13 Eurodollar 90 Day Index Contracts | June 2008 | 12,832,300 | 26,548 | |||
| 12 Eurodollar 90 Day Index Contracts | Sept. 2008 | 11,844,600 | 24,402 | |||
| 5 Eurodollar 90 Day Index Contracts | Dec. 2008 | 4,934,813 | 8,043 | |||
| 3 Eurodollar 90 Day Index Contracts | March 2009 | 2,960,775 | 4,813 | |||
| TOTAL EURODOLLAR CONTRACTS | 402,603 | |||||
| $ 321,457 | ||||||
See accompanying notes which are an integral part of the financial statements.
| Semiannual Report |
| 56 |
| Swap Agreements | ||||||||
| Expiration | Notional Amount | Value | ||||||
| Date | ||||||||
| Credit Default Swaps | ||||||||
| Receive monthly notional amount multi- | ||||||||
| plied by 2.5% and pay Credit Suisse | ||||||||
| First Boston upon default event of | ||||||||
| Ameriquest Mortgage Securities, Inc., | ||||||||
| par value of the notional amount of | ||||||||
| Ameriquest Mortgage Securities, Inc. | ||||||||
| Series 2004-R11 Class M9, 8.03% | ||||||||
| 11/25/34. | Dec. 2034 | $ 3,000,000 | $ 10,212 | |||||
| Receive from Citibank, upon default event | ||||||||
| of DaimlerChrysler NA Holding Corp., | ||||||||
| par value of the notional amount of | ||||||||
| DaimlerChrysler NA Holding Corp. | ||||||||
| 6.5% 11/15/13, and pay quarterly | ||||||||
| notional amount multiplied by .8% | June 2007 | 14,000,000 | (107,940) | |||||
| Receive quarterly notional amount | ||||||||
| multiplied by .20% and pay Merrill | ||||||||
| Lynch, Inc. upon default event of | ||||||||
| American Transmission Co. LLC, par | ||||||||
| value of the notional amount of | ||||||||
| American Transmission Co. LLC 7.125% | ||||||||
| 3/15/11 | May 2007 | 10,555,000 | 13,194 | |||||
| Receive quarterly notional amount | ||||||||
| multiplied by .26% and pay Morgan | ||||||||
| Stanley, Inc. upon default event of | ||||||||
| Amareda Hess Corp., par value of the | ||||||||
| notional amount of Amareda Hess | ||||||||
| Corp. 6.65% 8/15/11 | March 2007 | 12,850,000 | 11,565 | |||||
| Receive quarterly notional amount | ||||||||
| multiplied by .28% and pay Morgan | ||||||||
| Stanley, Inc. upon defualt event of | ||||||||
| Amerada Hess Corp., par value of the | ||||||||
| notional amount of Amerada Hess | ||||||||
| 6.65% 8/15/11 | March 2007 | 16,000,000 | 17,440 | |||||
| Receive quarterly notional amount | ||||||||
| multiplied by .48% and pay Goldman | ||||||||
| Sachs upon default event of TXU | ||||||||
| Energy Co. LLC, par value of the | ||||||||
| notional amount of TXU Energy Co. LLC | ||||||||
| 7% 3/15/13 | Sept. 2008 | 13,540,000 | 3,385 | |||||
| Receive quarterly notional amount | ||||||||
| multiplied by .78% and pay Goldman | ||||||||
| Sachs upon default event of TXU | ||||||||
| Energy, par value of the notional | ||||||||
| amount of TXU Energy Co. LLC 7% | ||||||||
| 3/15/13 | Dec. 2008 | 10,650,000 | 102,666 | |||||
| TOTAL CREDIT DEFAULT SWAPS | 80,595,000 | 50,522 | ||||||
| See accompanying notes which are an integral part of the financial statements. | ||||||||
| 57 | Semiannual Report | |||||||
| Investments continued | ||||||||
| Swap Agreements continued | ||||||||
| Expiration | Notional Amount | Value | ||||||
| Date | ||||||||
| Total Return Swaps | ||||||||
| Receive monthly notional amount multi- | ||||||||
| plied by the nominal spread appreci- | ||||||||
| ation of the Lehman Brothers CMBS | ||||||||
| U.S. Aggregate Index adjusted by a | ||||||||
| modified duration factor plus 20 basis | ||||||||
| points and pay monthly notional | ||||||||
| amount multiplied by the nominal | ||||||||
| spread depreciation of the Lehman | ||||||||
| Brothers CMBS U.S. Aggregate Index | ||||||||
| adjusted by a modified duration factor | ||||||||
| with Citibank. | May 2006 | $ 35,100,000 | $ 50,180 | |||||
| Receive monthly notional amount multi- | ||||||||
| plied by the nominal spread appreci- | ||||||||
| ation of the Lehman Brothers CMBS | ||||||||
| U.S. Aggregate Index adjusted by a | ||||||||
| modified duration factor plus 30 basis | ||||||||
| points and pay monthly notional | ||||||||
| amount multiplied by the nominal | ||||||||
| spread depreciation of the Lehman | ||||||||
| Brothers CMBS U.S. Aggregate Index | ||||||||
| adjusted by a modified duration factor | ||||||||
| with Citibank. | April 2006 | 67,500,000 | 118,204 | |||||
| Receive monthly notional amount multi- | ||||||||
| plied by the nominal spread appreci- | ||||||||
| ation of the Lehman Brothers CMBS | ||||||||
| U.S. Aggregate Index adjusted by a | ||||||||
| modified duration factor plus 15 basis | ||||||||
| points and pay monthly notional | ||||||||
| amount multiplied by the nominal | ||||||||
| spread depreciation of the Lehman | ||||||||
| Brothers CMBS U.S. Aggregate Index | ||||||||
| adjusted by a modified duration factor | ||||||||
| with Citibank. | April 2006 | 48,200,000 | 78,549 | |||||
| Receive monthly notional amount multi- | ||||||||
| plied by the nominal spread appreci- | ||||||||
| ation of the Lehman Brothers CMBS | ||||||||
| U.S. Aggregate Index adjusted by a | ||||||||
| modified duration factor plus 15 basis | ||||||||
| points and pay monthly notional | ||||||||
| amount multiplied by the nominal | ||||||||
| spread depreciation of the Lehman | ||||||||
| Brothers CMBS U.S. Aggregate Index | ||||||||
| adjusted by a modified duration factor | ||||||||
| with Lehman Brothers, Inc. | July 2006 | 35,100,000 | 56,050 | |||||
| See accompanying notes which are an integral part of the financial statements. | ||||||||
| Semiannual Report | 58 | |||||||
| Swap Agreements continued | ||||||||
| Expiration | Notional Amount | Value | ||||||
| Date | ||||||||
| Receive monthly a return equal to Lehman | ||||||||
| Brothers U.S. ABS Floating Rate AA | ||||||||
| Home Equity Index and pay monthly a | ||||||||
| floating rate based on 1-month LIBOR | ||||||||
| with Lehman Brothers, Inc. | May 2006 | $ 34,600,000 | $ 36,278 | |||||
| Receive monthly a return equal to Lehman | ||||||||
| Brothers U.S. ABS Floating Rate AA | ||||||||
| Home Equity Index and pay monthly a | ||||||||
| floating rate based on 1-month LIBOR | ||||||||
| with Lehman Brothers, Inc. | June 2006 | 35,000,000 | 36,698 | |||||
| TOTAL TOTAL RETURN SWAPS | 255,500,000 | 375,959 | ||||||
| $ 336,095,000 | $ 426,481 | |||||||
| Legend (a) Security exempt from registration under Rule 144A of the Securities Act of 1933. These securities may be resold in transactions exempt from registration, normally to qualified institutional buyers. At the period end, the value of these securities amounted to $761,281,659 or 10.0% of net assets. (b) Security or a portion of the security purchased on a delayed delivery or when-issued basis. (c) Security or a portion of the security was pledged to cover margin requirements for futures contracts. At the period end, the value of securities pledged amounted to $975,537. (d) The coupon rate shown on floating or adjustable rate securities represents the rate at period end. (e) Security represents right to receive monthly interest payments on an underlying pool of mortgages. Principal shown is the par amount of the mortgage pool. |
| (f) The maturity amount is based on the rate at period end. (g) Restricted securities – Investment in securities not registered under the Securities Act of 1933 (excluding 144A issues). At the end of the period, the value of restricted securities (excluding 144A issues) amounted to $17,743,793 or 0.2% of net assets. |
Additional information on each holding is as follows:
| Acquisition | Acquisition | |||
| Security | Date | Cost | ||
| Aspetuck Trust | ||||
| 4.72% 10/16/06 | 12/14/05 | $17,585,000 |
| (h) Debt obligation initially issued in zero coupon form which converts to coupon form at a specified rate and date. The rate shown is the rate at period end. |
See accompanying notes which are an integral part of the financial statements.
59 Semiannual Report
Investments continued
| (i) Additional information on each counterparty to the repurchase agreement is as follows: |
| Repurchase Agreement/ | Value | |
| Counterparty | ||
| $1,440,112,000 due | ||
| 4/3/06 at 4.86% | ||
| Bank of America, | ||
| National Association | $ 136,950,791 | |
| Bank of America | ||
| Securities LLC | 263,630,273 | |
| Barclays Capital Inc. | 596,987,876 | |
| Bear Stearns & Co. Inc. . | 85,594,244 | |
| Goldman, Sachs & Co. | 219,998,025 | |
| UBS Securities LLC | 136,950,791 | |
| $ 1,440,112,000 |
Distribution of investments by country of issue, as a percentage of total net assets, is as follows:
| United States of America | 85.7% | |
| United Kingdom | 7.4% | |
| France | 3.3% | |
| Netherlands | 1.3% | |
| Germany | 1.3% | |
| Others (individually less than 1%) . | 1.0% | |
| 100.0% |
Income Tax Information
At September 30, 2005, the fund had a capital loss carryforward of approximately $4,905,519 all of which will expire on September 30, 2011.
See accompanying notes which are an integral part of the financial statements.
Semiannual Report 60
| Financial Statements | ||||||||
| Statement of Assets and Liabilities | ||||||||
| March 31, 2006 | ||||||||
| Assets | ||||||||
| Investment in securities, at value (including repurchase | ||||||||
| agreements of $1,924,103,225) See | ||||||||
| accompanying schedule: | ||||||||
| Unaffiliated issuers (cost $7,239,236,955) | $ 7,241,660,603 | |||||||
| Cash | 2,382,592 | |||||||
| Receivable for swap agreements | 5,625 | |||||||
| Receivable for fund shares sold | 434,956,249 | |||||||
| Interest receivable | 19,059,975 | |||||||
| Swap agreements, at value | 426,481 | |||||||
| Prepaid expenses | 22,396 | |||||||
| Other receivables | 37,285 | |||||||
| Total assets | 7,698,551,206 | |||||||
| Liabilities | ||||||||
| Payable for investments purchased | ||||||||
| Regular delivery | $ 6,806,412 | |||||||
| Delayed delivery | 46,778,130 | |||||||
| Distributions payable | 30,451,661 | |||||||
| Payable for daily variation on futures contracts | 25 | |||||||
| Other payables and accrued expenses | 96,626 | |||||||
| Total liabilities | 84,132,854 | |||||||
| Net Assets | $ 7,614,418,352 | |||||||
| Net Assets consist of: | ||||||||
| Paid in capital | $ 7,614,285,933 | |||||||
| Undistributed net investment income | 246,077 | |||||||
| Accumulated undistributed net realized gain (loss) on | ||||||||
| investments | (3,285,244) | |||||||
| Net unrealized appreciation (depreciation) on | ||||||||
| investments | 3,171,586 | |||||||
| Net Assets, for 76,548,816 shares outstanding | $ 7,614,418,352 | |||||||
| Net Asset Value, offering price and redemption price per | ||||||||
| share ($7,614,418,352 ÷ 76,548,816 shares) | $ 99.47 | |||||||
See accompanying notes which are an integral part of the financial statements.
61 Semiannual Report
| Financial Statements continued | ||||||
| Statement of Operations | ||||||
| Six months ended March 31, 2006 | ||||||
| Investment Income | ||||||
| Interest (including $174,355 from affiliated interfund | ||||||
| lending) | $ 162,373,672 | |||||
| Expenses | ||||||
| Independent trustees’ compensation | $ 14,314 | |||||
| Custodian fees and expenses | 44,636 | |||||
| Audit | 56,844 | |||||
| Legal | 7,144 | |||||
| Insurance | 18,723 | |||||
| Miscellaneous | 1,484 | |||||
| Total expenses before reductions | 143,145 | |||||
| Expense reductions | (37,809) | 105,336 | ||||
| Net investment income | 162,268,336 | |||||
| Realized and Unrealized Gain (Loss) | ||||||
| Net realized gain (loss) on: | ||||||
| Investment securities: | ||||||
| Unaffiliated issuers | 316,756 | |||||
| Futures contracts | 305,682 | |||||
| Swap agreements | 965,710 | |||||
| Total net realized gain (loss) | 1,588,148 | |||||
| Change in net unrealized appreciation (depreciation) on: | ||||||
| Investment securities | (3,139,087) | |||||
| Futures contracts | 65,524 | |||||
| Swap agreements | 693,370 | |||||
| Total change in net unrealized appreciation | ||||||
| (depreciation) | (2,380,193) | |||||
| Net gain (loss) | (792,045) | |||||
| Net increase (decrease) in net assets resulting from | ||||||
| operations | $ 161,476,291 | |||||
See accompanying notes which are an integral part of the financial statements.
| Semiannual Report |
| 62 |
| Statement of Changes in Net Assets | ||||
| Six months ended | Year ended | |||
| March 31, | September 30, | |||
| 2006 | 2005 | |||
| Increase (Decrease) in Net Assets | ||||
| Operations | ||||
| Net investment income | $ 162,268,336 | $ 190,517,987 | ||
| Net realized gain (loss) | 1,588,148 | 385,273 | ||
| Change in net unrealized appreciation (depreciation) . | (2,380,193) | (2,048,042) | ||
| Net increase (decrease) in net assets resulting | ||||
| from operations | 161,476,291 | 188,855,218 | ||
| Distributions to shareholders from net investment income . | (162,574,587) | (190,697,802) | ||
| Share transactions | ||||
| Proceeds from sales of shares | 1,573,948,343 | 2,273,689,006 | ||
| Cost of shares redeemed | (618,983,867) | (1,106,997,870) | ||
| Net increase (decrease) in net assets resulting from | ||||
| share transactions | 954,964,476 | 1,166,691,136 | ||
| Total increase (decrease) in net assets | 953,866,180 | 1,164,848,552 | ||
| Net Assets | ||||
| Beginning of period | 6,660,552,172 | 5,495,703,620 | ||
| End of period (including undistributed net investment | ||||
| income of $246,077 and undistributed net invest- | ||||
| ment income of $552,328, respectively) | $ 7,614,418,352 | $ 6,660,552,172 | ||
| Other Information | ||||
| Shares | ||||
| Sold | 15,823,714 | 22,848,333 | ||
| Redeemed | (6,223,387) | (11,123,468) | ||
| Net increase (decrease) | 9,600,327 | 11,724,865 | ||
See accompanying notes which are an integral part of the financial statements.
63 Semiannual Report
| Financial Highlights | ||||||||||||
| Six months ended | ||||||||||||
| March 31, | Years ended September 30, | |||||||||||
| 2006 | 2005 | 2004 | 2003 | 2002H | 2001E,H | |||||||
| Selected Per Share Data | ||||||||||||
| Net asset value, | ||||||||||||
| beginning of | ||||||||||||
| period | $ 99.49 | $ 99.52 | $ 99.49 | $ 99.15 | $100.00 | $100.00 | ||||||
| Income from | ||||||||||||
| Investment | ||||||||||||
| Operations | ||||||||||||
| Net investment | ||||||||||||
| incomeD | 2.278 | 3.167 | 1.764 | 1.917 | 3.022 | .900 | ||||||
| Net realized | ||||||||||||
| and unreal- | ||||||||||||
| ized gain | ||||||||||||
| (loss) | (.014) | (.059) | —G | .450 | (.743) | —G | ||||||
| Total from | ||||||||||||
| investment | ||||||||||||
| operations | 2.264 | 3.108 | 1.764 | 2.367 | 2.279 | .900 | ||||||
| Distributions from | ||||||||||||
| net investment | ||||||||||||
| income | (2.284) | (3.138) | (1.734) | (2.027) | (3.129) | (.900) | ||||||
| Net asset value, | ||||||||||||
| end of period . | $ 99.47 | $ 99.49 | $ 99.52 | $ 99.49 | $ 99.15 | $100.00 | ||||||
| Total ReturnB,C | 2.30% | 3.17% | 1.79% | 2.36% | 2.39% | .90% | ||||||
| Ratios to Average Net AssetsF | ||||||||||||
| Expenses before | ||||||||||||
| reductions | 0041%A | .0044% | .0034% | .0030% | .0033% | .0189%A | ||||||
| Expenses net of | ||||||||||||
| fee waivers, if | ||||||||||||
| any | 0041%A | .0044% | .0034% | .0030% | .0033% | .0189%A | ||||||
| Expenses net of | ||||||||||||
| all reductions | .0030%A | .0039% | .0032% | .0026% | .0021% | .0189%A | ||||||
| Net investment | ||||||||||||
| income | 4.60%A | 3.18% | 1.77% | 1.94% | 3.05% | 4.73%A | ||||||
| Supplemental Data | ||||||||||||
| Net assets, end | ||||||||||||
| of period | ||||||||||||
| (000 omitted) | $7,614,418 | $6,660,552 | $5,495,704 | $4,987,445 | $2,232,319 | $799,132 | ||||||
| Portfolio turn- | ||||||||||||
| over rate | 46%A | 49% | 50% | 58% | 167% | 282%A | ||||||
| A Annualized B Total returns for periods of less than one year are not annualized. C Total returns would have been lower had certain expenses not been reduced during the periods shown. D Calculated based on average shares outstanding during the period. E For the period July 16, 2001 (commencement of operations) to September 30, 2001. F Expense ratios reflect operating expenses of the fund. Expenses before reductions do not reflect amounts reimbursed by the investment adviser or expense offset arrangements and do not represent the amount paid by the fund during periods when reimbursements or reductions occur. Expense ratios before reductions for start up periods may not be representative of longer term operating periods. Expenses net of fee waivers reflect expenses after reimbursement by the investment adviser but prior to reductions from expense offset arrangements. Expenses net of all reductions represent the net expenses paid by the fund. G Amount represents less than $.001 per share. H Per share data has been adjusted for a 1 for 10 reverse stock split effective October 1, 2002. |
See accompanying notes which are an integral part of the financial statements.
| Semiannual Report |
| 64 |
Notes to Financial Statements
| For the period ended March 31, 2006 |
1. Significant Accounting Policies.
Fidelity Ultra Short Central Fund (the fund) is a fund of Fidelity Garrison Street Trust (the trust) and is authorized to issue an unlimited number of shares. The trust is regis tered under the Investment Company Act of 1940, as amended (the 1940 Act), as an open end management investment company organized as a Massachusetts business trust. The financial statements have been prepared in conformity with accounting principles generally accepted in the United States of America, which require manage ment to make certain estimates and assumptions at the date of the financial statements. The following summarizes the significant accounting policies of the fund:
Security Valuation. Investments are valued and net asset value per share is calculated (NAV calculation) as of the close of business of the New York Stock Exchange, normally 4:00 p.m. Eastern time. Wherever possible, the fund uses independent pricing services approved by the Board of Trustees to value its investments. Debt securities, including restricted securities, for which quotations are readily available, are valued by independent pricing services or by dealers who make markets in such securities. Pricing services consider yield or price of bonds of comparable quality, coupon, maturity and type as well as dealer supplied prices. When current market prices or quotations are not readily available or do not accurately reflect fair value, valuations may be determined in accordance with procedures adopted by the Board of Trustees. The frequency of when fair value pricing is used is unpredictable. The value of securities used for NAV calculation under fair value pricing may differ from published prices for the same securities. Investments in open end mutual funds are valued at their closing net asset value each business day. Short term securities with remaining maturities of sixty days or less for which quotations are not readily available are valued at amortized cost, which approximates value.
Investment Transactions and Income. Security transactions are accounted for as of trade date. Gains and losses on securities sold are determined on the basis of identified cost. Interest income is accrued as earned. Interest income includes coupon interest and amortization of premium and accretion of discount on debt securities.
Expenses. Most expenses of the trust can be directly attributed to a fund. Expenses which cannot be directly attributed are apportioned among each fund in the trust.
Income Tax Information and Distributions to Shareholders. Each year, the fund intends to qualify as a regulated investment company by distributing all of its taxable income and realized gains under Subchapter M of the Internal Revenue Code. As a result, no provision for income taxes is required in the accompanying financial statements.
Dividends are declared daily and paid monthly from net investment income. Distribu tions from realized gains, if any, are recorded on the ex dividend date. Income and capital gain distributions are determined in accordance with income tax regulations, which may differ from generally accepted accounting principles.
65 Semiannual Report
| Notes to Financial Statements continued | ||
1. Significant Accounting Policies continued | ||
Income Tax Information and Distributions to Shareholders continued | ||
Capital accounts within the financial statements are adjusted for permanent book tax differences. These adjustments have no impact on net assets or the results of operations. Temporary book tax differences will reverse in a subsequent period.
Book tax differences are primarily due to futures transactions, swap agreements, market discount, financing transactions, capital loss carryforwards, and losses deferred due to wash sales and futures transactions.
The federal tax cost of investments and unrealized appreciation (depreciation) as of period end were as follows:
| Unrealized appreciation | $ 8,845,941 | |||
| Unrealized depreciation | (5,990,220) | |||
| Net unrealized appreciation (depreciation) | $ 2,855,721 | |||
| Cost for federal income tax purposes | $ 7,238,804,882 | |||
| 2. Operating Policies. | ||||
Repurchase Agreements. Fidelity Management & Research Company (FMR) has received an Exemptive Order from the Securities and Exchange Commission (the SEC) which permits the fund and other affiliated entities of FMR to transfer uninvested cash balances into joint trading accounts which are then invested in repurchase agreements. The fund may also invest directly with institutions in repurchase agreements. Repur chase agreements are collateralized by government or non government securities. Upon settlement date, collateral is held in segregated accounts with custodian banks and may be obtained in the event of a default of the counterparty. The fund monitors, on a daily basis, the value of the collateral to ensure it is at least equal to the principal amount of the repurchase agreement (including accrued interest). In the event of a default by the counterparty, realization of the collateral proceeds could be delayed, during which time the value of the collateral may decline.
Delayed Delivery Transactions and When Issued Securities. The fund may purchase or sell securities on a delayed delivery or when issued basis. Payment and delivery may take place after the customary settlement period for that security. The price of the underlying securities and the date when the securities will be delivered and paid for are fixed at the time the transaction is negotiated. During the time a delayed delivery sell is outstanding, the contract is marked to market daily and equivalent deliverable securities are held for the transaction. The value of the securities purchased on a delayed delivery or when issued basis are identified as such in the fund’s Schedule of Investments. The fund may receive compensation for interest forgone in the purchase of
| Semiannual Report |
| 66 |
| 2. Operating Policies continued | ||
Delayed Delivery Transactions and When Issued Securities continued | ||
a delayed delivery or when issued security. With respect to purchase commitments, the fund identifies securities as segregated in its records with a value at least equal to the amount of the commitment. Losses may arise due to changes in the value of the underly ing securities or if the counterparty does not perform under the contract’s terms, or if the issuer does not issue the securities due to political, economic, or other factors.
Futures Contracts. The fund may use futures contracts to manage its exposure to the bond market and to fluctuations in interest rates. Buying futures tends to increase a fund’s exposure to the underlying instrument, while selling futures tends to decrease a fund’s exposure to the underlying instrument or hedge other fund investments. Upon entering into a futures contract, a fund is required to deposit with a clearing broker, no later than the following business day, an amount (“initial margin”) equal to a certain percentage of the face value of the contract. The initial margin may be in the form of cash or securities and is transferred to a segregated account on settlement date. Subsequent payments (“variation margin”) are made or received by a fund depending on the daily fluctuations in the value of the futures contract and are accounted for as unrealized gains or losses. Realized gains (losses) are recorded upon the expiration or closing of the futures contract. Securities deposited to meet margin requirements are identified in the Schedule of Investments. Futures contracts involve, to varying degrees, risk of loss in excess of any futures variation margin reflected in the Statement of Assets and Liabili ties. The underlying face amount at value of any open futures contracts at period end is shown in the Schedule of Investments under the caption “Futures Contracts.” This amount reflects each contract’s exposure to the underlying instrument at period end. Losses may arise from changes in the value of the underlying instruments or if the counterparties do not perform under the contract’s terms. Futures contracts are valued at the settlement price established each day by the board of trade or exchange on which they are traded.
Restricted Securities. The fund may invest in securities that are subject to legal or contractual restrictions on resale. These securities generally may be resold in transac tions exempt from registration or to the public if the securities are registered. Disposal of these securities may involve time consuming negotiations and expense, and prompt sale at an acceptable price may be difficult. Information regarding restricted securities is included at the end of the fund’s Schedule of Investments.
67 Semiannual Report
| Notes to Financial Statements continued |
2. Operating Policies continued |
Swap Agreements. The fund may invest in swaps for the purpose of managing its exposure to interest rate, credit or market risk.
Total return swaps are agreements to exchange the return generated by one instrument or index for the return generated by another instrument, for example, the agreement to pay interest in exchange for a market linked return based on a notional amount. To the extent the total return of the index exceeds the offsetting interest obligation, a fund will receive a payment from the counterparty. To the extent it is less, a fund will make a payment to the counterparty. Periodic payments received or made by the fund are recorded in the accompanying Statement of Operations as realized gains or losses, respectively.
Credit default swaps involve the exchange of a fixed rate premium for protection against the loss in value of an underlying debt instrument in the event of a defined credit event (such as payment default or bankruptcy). Under the terms of the swap, one party acts as a “guarantor” receiving a periodic payment that is a fixed percentage applied to a no tional principal amount. In return the party agrees to purchase the notional amount of the underlying instrument, at par, if a credit event occurs during the term of the swap. The fund may enter into credit default swaps in which either it or its counterparty act as guarantors. By acting as the guarantor of a swap, a fund assumes the market and credit risk of the underlying instrument including liquidity and loss of value. Periodic payments and premiums received or made by the fund are recorded in the accompanying State ment of Operations as realized gains or losses, respectively.
Swaps are marked to market daily based on dealer supplied valuations and changes in value are recorded as unrealized appreciation (depreciation). Gains or losses are realized upon early termination of the swap agreement. Collateral, in the form of cash or securities, may be required to be held in segregated accounts with a fund’s custodian in compliance with swap contracts. Risks may exceed amounts recognized on the State ment of Assets and Liabilities. These risks include changes in the returns of the underly ing instruments, failure of the counterparties to perform under the contracts’ terms and the possible lack of liquidity with respect to the swap agreements. Details of swap agreements open at period end are included in the fund’s Schedule of Investments under the caption “Swap Agreements.”
3. Purchases and Sales of Investments.
Purchases and sales of securities, other than short term securities and U.S. government securities, aggregated $1,635,156,791 and $996,310,330, respectively.
| Semiannual Report |
| 68 |
4. Fees and Other Transactions with Affiliates.
Management Fee. Fidelity Investments Money Management, Inc. (FIMM), an affiliate of FMR, provides the fund with investment management services. The fund does not pay any fees for these services.
Interfund Lending Program. Pursuant to an Exemptive Order issued by the SEC, the fund, along with other registered investment companies having management contracts with FMR, may participate in an interfund lending program. This program provides an alternative credit facility allowing the funds to borrow from, or lend money to, other participating affiliated funds. At period end, there were no interfund loans outstanding. The fund’s activity in this program during the period for which loans were outstanding was as follows:
| Average Daily | Weighted Average | |||||
| Borrower or Lender | Loan Balance | Interest Rate | ||||
| Lender | $ 186,880,000 | 4.33% | ||||
| 5. Expense Reductions. | ||||||
Through arrangements with the fund’s custodian and transfer agent, credits realized as a result of uninvested cash balances were used to reduce the fund’s expenses. During the period, these credits reduced the fund’s expenses by $37,809.
| 6. Other. |
The fund’s organizational documents provide former and current trustees and officers with a limited indemnification against liabilities arising in connection with the performance of their duties to the fund. In the normal course of business, the fund may also enter into contracts that provide general indemnifications. The fund’s maximum exposure under these arrangements is unknown as this would be dependent on future claims that may be made against the fund. The risk of material loss from such claims is considered remote.
At the end of the period mutual funds managed by FMR or an affiliate were the owners of record of all outstanding shares of the fund.
69 Semiannual Report
Report of Independent Registered Public Accounting Firm
To the Trustees of Fidelity Garrison Street Trust and Shareholders of Fidelity Ultra Short Central Fund:
We have audited the accompanying statement of assets and liabilities of Fidelity Ultra Short Central Fund (the Fund), a fund of Fidelity Garrison Street Trust, including the schedule of investments as of March 31, 2006, and the related statement of operations for the six months then ended, the statement of changes in net assets for the six months ended March 31, 2006 and the year ended September 30, 2005, and the financial highlights for the six months ended March 31, 2006 and for each of the five years ended Septem ber 30, 2005. These financial statements and financial highlights are the responsibility of the Fund’s management. Our responsibility is to express an opinion on these financial statements and financial highlights based on our audits.
We conducted our audits in accordance with standards of the Public Company Accounting Oversight Board (United States). Those standards require that we plan and perform the audit to obtain reasonable assurance about whether the financial statements and financial highlights are free of material misstatement. The Fund is not required to have, nor were we engaged to perform, an audit of its internal control over financial reporting. Our audits included consideration of internal control over financial reporting as a basis for designing audit procedures that are appropriate in the circumstances, but not for the purpose of expressing an opinion on the effectiveness of the Fund’s internal control over financial reporting. Accordingly, we express no such opinion. An audit also includes examining, on a test basis, evidence supporting the amounts and disclosures in the financial statements, assessing the accounting principles used and significant estimates made by management, as well as evaluating the overall financial statement presentation. Our procedures in cluded confirmation of securities owned as of March 31, 2006, by correspondence with the custodians and brokers; where replies were not received from brokers, we performed other auditing procedures. We believe that our audits provide a reasonable basis for our opinion.
In our opinion, the financial statements and financial highlights referred to above present fairly, in all material respects, the financial position of Fidelity Ultra Short Central Fund as of March 31, 2006, the results of its operations for the six months then ended, the changes in its net assets for the six months ended March 31, 2006, and the year ended Septem ber 30, 2005 and its financial highlights for the six months ended March 31, 2006, and for each of the five years ended September 30, 2005 in conformity with accounting principles generally accepted in the United States of America.
/s/ Deloitte & Touche LLP
DELOITTE & TOUCHE LLP
Boston, Massachusetts
May 12, 2006
| Semiannual Report |
| 70 |
Proxy Voting Results
A special meeting of the fund’s shareholders was held on February 15, 2006. The results of votes taken among shareholders on the proposal before them are reported below. Each vote reported represents one dollar of net asset value held on the record date for the meeting.
| PROPOSAL 1 | ||||
| To elect a Board of Trustees.A | ||||
| # of | % of | |||
| Votes | Votes | |||
| Dennis J. Dirks | ||||
| Affirmative | 672,343,759.36 | 100.000 | ||
| Withheld | 00 | 00.000 | ||
| TOTAL | 672,343,759.36 | 100.000 | ||
| Albert R. Gamper, Jr. | ||||
| Affirmative | 672,343,759.36 | 100.000 | ||
| Withheld | 00 | 00.000 | ||
| TOTAL | 672,343,759.36 | 100.000 | ||
| Robert M. Gates | ||||
| Affirmative | 672,343,759.36 | 100.000 | ||
| Withheld | 00 | 00.000 | ||
| TOTAL | 672,343,759.36 | 100.000 | ||
| George H. Heilmeier | ||||
| Affirmative | 672,343,759.36 | 100.000 | ||
| Withheld | 00 | 00.000 | ||
| TOTAL | 672,343,759.36 | 100.000 | ||
| Edward C. Johnson 3d | ||||
| Affirmative | 672,343,759.36 | 100.000 | ||
| Withheld | 00 | 00.000 | ||
| TOTAL | 672,343,759.36 | 100.000 | ||
| Stephen P. Jonas | ||||
| Affirmative | 672,343,759.36 | 100.000 | ||
| Withheld | 00 | 00.000 | ||
| TOTAL | 672,343,759.36 | 100.000 | ||
| # of | % of | |||
| Votes | Votes | |||
| Marie L. Knowles | ||||
| Affirmative | 672,343,759.36 | 100.000 | ||
| Withheld | 00 | 00.000 | ||
| TOTAL | 672,343,759.36 | 100.000 | ||
| Ned C. Lautenbach | ||||
| Affirmative | 672,343,759.36 | 100.000 | ||
| Withheld | 00 | 00.000 | ||
| TOTAL | 672,343,759.36 | 100.000 | ||
| William O. McCoy | ||||
| Affirmative | 672,343,759.36 | 100.000 | ||
| Withheld | 00 | 00.000 | ||
| TOTAL | 672,343,759.36 | 100.000 | ||
| Robert L. Reynolds | ||||
| Affirmative | 672,343,759.36 | 100.000 | ||
| Withheld | 00 | 00.000 | ||
| TOTAL | 672,343,759.36 | 100.000 | ||
| Cornelia M. Small | ||||
| Affirmative | 672,343,759.36 | 100.000 | ||
| Withheld | 00 | 00.000 | ||
| TOTAL | 672,343,759.36 | 100.000 | ||
| William S. Stavropoulos | ||||
| Affirmative | 672,343,759.36 | 100.000 | ||
| Withheld | 00 | 00.000 | ||
| TOTAL | 672,343,759.36 | 100.000 | ||
| Kenneth L. Wolfe | ||||
| Affirmative | 672,343,759.36 | 100.000 | ||
| Withheld | 00 | 00.000 | ||
| TOTAL | 672,343,759.36 | 100.000 | ||
A Denotes trust-wide proposal and voting results.
71 Semiannual Report
Board Approval of Investment Advisory Contracts and Management Fees
Ultra-Short Central Fund
On January 19, 2006, the Board of Trustees, including the Independent Trustees (together, the Board), voted to approve a general research services agreement (the Agreement) between FMR, FMR Co., Inc. (FMRC), Fidelity Investments Money Manage ment, Inc. (FIMM), and Fidelity Research & Analysis Company (FRAC) (together, the Investment Advisers) for the fund, effective January 20, 2006, pursuant to which FRAC may provide general research and investment advisory support services to FMRC and FIMM. The Board considered that it has approved previously various sub advisory agreements for the fund with affiliates of FIMM that allow FIMM to obtain research, non discretionary advice, or discretionary portfolio management at no additional expense to the fund. The Board, assisted by the advice of fund counsel and independent Trustees’ counsel, considered a broad range of information and determined that it would be beneficial for the fund to access the research and investment advisory support services supplied by FRAC at no additional expense to the fund.
The Board reached this determination in part because the new arrangement will involve no changes in (i) the contractual terms of and fees payable under the fund’s manage ment contract or sub advisory agreements; (ii) the investment process or strategies employed in the management of the fund’s assets; (iii) the nature or level of services provided under the fund’s management contract or sub advisory agreements; (iv) the day to day management of the fund or the persons primarily responsible for such man agement; or (v) the ultimate control or beneficial ownership of FMR, FMRC, or FIMM. The Board also considered that the establishment of the Agreement would not necessi tate prior shareholder approval of the Agreement or result in an assignment and termination of the fund’s management contract or sub advisory agreements under the Investment Company Act of 1940.
Because the Board was approving an arrangement with FRAC under which the fund will not bear any additional management fees or expenses and under which the fund’s portfolio manager would not change, it did not consider the fund’s investment perfor mance, competitiveness of management fee and total expenses, costs of services and profitability, or economies of scale to be significant factors in its decision.
In connection with its future renewal of the fund’s management contract and sub advisory agreements, the Board will consider: (i) the nature, extent, and quality of services provided to the fund, including shareholder and administrative services and investment performance; (ii) the competitiveness of the fund’s management fee and total expenses; (iii) the costs of the services and profitability, including the revenues earned and the expenses incurred by Fidelity in conducting the business of developing, marketing, distributing, managing, administering, and servicing the fund and its share holders; and (iv) whether there have been economies of scale in respect of the manage ment of the Fidelity funds, whether the Fidelity funds (including the fund) have
| Semiannual Report |
| 72 |
appropriately benefited from any such economies of scale, and whether there is potential for realization of any further economies.
Based on its evaluation of all of the conclusions noted above, and after considering all material factors, the Board ultimately concluded that the fund’s Agreement is fair and reasonable, and that the fund’s Agreement should be approved.
73 Semiannual Report
Item 2. Code of Ethics
Not applicable.
Item 3. Audit Committee Financial Expert
Not applicable.
Item 4. Principal Accountant Fees and Services
Not applicable.
Item 5. Audit Committee of Listed Registrants
Not applicable.
Item 6. Schedule of Investments
Not applicable.
Item 7. Disclosure of Proxy Voting Policies and Procedures for Closed-End Management Investment Companies
Not applicable.
Item 8. Portfolio Managers of Closed-End Management Investment Companies
Not applicable.
Item 9. Purchase of Equity Securities by Closed-End Management Investment Company and Affiliated Purchasers
Not applicable.
Item 10. Submission of Matters to a Vote of Security Holders
There were no material changes to the procedures by which shareholders may recommend nominees to the Fidelity Garrison Street Trust's Board of Trustees.
Item 11. Controls and Procedures
(a)(i) The President and Treasurer and the Chief Financial Officer have concluded that the Fidelity Garrison Street Trust's (the "Trust") disclosure controls and procedures (as defined in Rule 30a-3(c) under the Investment Company Act) provide reasonable assurances that material information relating to the Trust is made known to them by the appropriate persons, based on their evaluation of these controls and procedures as of a date within 90 days of the filing date of this report.
(a)(ii) There was no change in the Trust's internal control over financial reporting (as defined in Rule 30a-3(d) under the Investment Company Act) that occurred during the second fiscal quarter of the period covered by this report that has materially affected, or is reasonably likely to materially affect, the Trust's internal control over financial reporting.
Item 12. Exhibits
(a) | (1) | Not applicable. |
(a) | (2) | Certification pursuant to Rule 30a-2(a) under the Investment Company Act of 1940 (17 CFR 270.30a-2(a)) is filed and attached hereto as Exhibit 99.CERT. |
(a) | (3) | Not applicable. |
(b) | Certification pursuant to Rule 30a-2(b) under the Investment Company Act of 1940 (17 CFR 270.30a-2(b)) is furnished and attached hereto as Exhibit 99.906CERT. |
SIGNATURES
Pursuant to the requirements of the Securities Exchange Act of 1934 and the Investment Company Act of 1940, the registrant has duly caused this report to be signed on its behalf by the undersigned, thereunto duly authorized.
Fidelity Garrison Street Trust
By: | /s/Christine Reynolds |
Christine Reynolds | |
President and Treasurer | |
Date: | May 15, 2006 |
Pursuant to the requirements of the Securities Exchange Act of 1934 and the Investment Company Act of 1940, this report has been signed below by the following persons on behalf of the registrant and in the capacities and on the dates indicated.
By: | /s/Christine Reynolds |
Christine Reynolds | |
President and Treasurer | |
Date: | May 15, 2006 |
By: | /s/Paul M. Murphy |
Paul M. Murphy | |
Chief Financial Officer | |
Date: | May 15, 2006 |