UNITED STATES
SECURITIES AND EXCHANGE COMMISSION
Washington, D.C. 20549
FORM N-CSR
CERTIFIED SHAREHOLDER REPORT OF REGISTERED
MANAGEMENT INVESTMENT COMPANIES
Investment Company Act file number 811-04861
Fidelity Garrison Street Trust
(Exact name of registrant as specified in charter)
245 Summer St., Boston, Massachusetts 02210
(Address of principal executive offices) (Zip code)
Cynthia Lo Bessette, Secretary
245 Summer St.
Boston, Massachusetts 02210
(Name and address of agent for service)
Registrant's telephone number, including area code:
617-563-7000
Date of fiscal year end: | August 31 |
Date of reporting period: | August 31, 2022 |
Item 1.
Reports to Stockholders


Contents
| Average Annual Total Returns | |||
Periods ended August 31, 2022 | Past 1 year | Life of Fund A |
| Fidelity® Education Income Fund | -6.34% | -3.81% |
| $10,000 Over Life of Fund |
Let's say hypothetically that $10,000 was invested in Fidelity® Education Income Fund, on March 16, 2021, when the fund started. The chart shows how the value of your investment would have changed, and also shows how the Bloomberg U.S. 1-5 Year Government\Credit Bond Index performed over the same period. |
 |
Quality Diversification (% of Fund's net assets) |
 |
Percentages shown as 0.0% may reflect amounts less than 0.05%. |
| We have used ratings from Moody's Investors Service, Inc. Where Moody's® ratings are not available, we have used S&P® ratings. All ratings are as of the date indicated and do not reflect subsequent changes. |
Asset Allocation (% of Fund's net assets) |
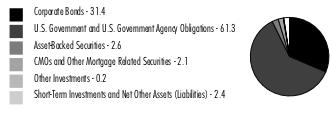 |
Foreign investments - 9.3% |
| Nonconvertible Bonds - 31.4% | |||
Principal Amount (a) | Value ($) | ||
| COMMUNICATION SERVICES - 1.4% | |||
| Diversified Telecommunication Services - 0.8% | |||
| AT&T, Inc.: | |||
| 1.65% 2/1/28 | 750,000 | 644,285 | |
| 4.25% 3/1/27 | 400,000 | 396,193 | |
| 4.3% 2/15/30 | 250,000 | 239,797 | |
| Verizon Communications, Inc.: | |||
| 2.1% 3/22/28 | 500,000 | 441,885 | |
| 3% 3/22/27 | 78,000 | 73,780 | |
| 1,795,940 | |||
| Entertainment - 0.1% | |||
| The Walt Disney Co. 1.75% 1/13/26 | 306,000 | 285,036 | |
| Media - 0.5% | |||
| Comcast Corp.: | |||
| 2.35% 1/15/27 | 500,000 | 465,554 | |
| 3.95% 10/15/25 | 725,000 | 723,801 | |
| Magallanes, Inc. 4.054% 3/15/29 (b) | 6,000 | 5,464 | |
| 1,194,819 | |||
| Wireless Telecommunication Services - 0.0% | |||
| Rogers Communications, Inc. 3.2% 3/15/27 (b) | 19,000 | 18,077 | |
TOTAL COMMUNICATION SERVICES | 3,293,872 | ||
| CONSUMER DISCRETIONARY - 1.3% | |||
| Automobiles - 1.3% | |||
| Daimler Finance North America LLC: | |||
| 0.75% 3/1/24 (b) | 500,000 | 475,323 | |
| 1.45% 3/2/26 (b) | 500,000 | 453,531 | |
| General Motors Financial Co., Inc.: | |||
| 1.05% 3/8/24 | 18,000 | 17,082 | |
| 1.25% 1/8/26 | 500,000 | 440,505 | |
| 2.35% 2/26/27 | 1,000,000 | 886,819 | |
| Toyota Motor Corp. 3.419% 7/20/23 | 355,000 | 354,484 | |
| Volkswagen Group of America Finance LLC: | |||
| 3.95% 6/6/25 (b) | 227,000 | 223,375 | |
| 4.35% 6/8/27 (b) | 200,000 | 194,692 | |
| 3,045,811 | |||
| Specialty Retail - 0.0% | |||
| The Home Depot, Inc. 2.875% 4/15/27 | 28,000 | 26,934 | |
TOTAL CONSUMER DISCRETIONARY | 3,072,745 | ||
| CONSUMER STAPLES - 0.9% | |||
| Tobacco - 0.9% | |||
| BAT Capital Corp. 4.7% 4/2/27 | 801,000 | 779,405 | |
| BAT International Finance PLC 1.668% 3/25/26 | 750,000 | 667,794 | |
| Philip Morris International, Inc. 1.5% 5/1/25 | 750,000 | 704,261 | |
| 2,151,460 | |||
| ENERGY - 0.8% | |||
| Energy Equipment & Services - 0.0% | |||
| Baker Hughes Co.: | |||
| 1.231% 12/15/23 | 16,000 | 15,501 | |
| 2.061% 12/15/26 | 15,000 | 13,649 | |
| 29,150 | |||
| Oil, Gas & Consumable Fuels - 0.8% | |||
| Canadian Natural Resources Ltd. 2.05% 7/15/25 | 315,000 | 293,268 | |
| ConocoPhillips Co. 2.4% 3/7/25 | 30,000 | 29,023 | |
| Enbridge, Inc.: | |||
| 2.15% 2/16/24 | 12,000 | 11,634 | |
| 2.5% 2/14/25 | 12,000 | 11,510 | |
| Energy Transfer LP 4.2% 9/15/23 | 73,000 | 72,847 | |
| Exxon Mobil Corp. 2.992% 3/19/25 | 210,000 | 205,442 | |
| MPLX LP: | |||
| 4% 3/15/28 | 760,000 | 727,054 | |
| 4.5% 7/15/23 | 350,000 | 351,277 | |
| Phillips 66 Co. 3.7% 4/6/23 | 118,000 | 117,982 | |
| 1,820,037 | |||
TOTAL ENERGY | 1,849,187 | ||
| FINANCIALS - 23.8% | |||
| Banks - 15.1% | |||
| Bank of America Corp.: | |||
| 1.197% 10/24/26 (c) | 500,000 | 447,032 | |
| 1.734% 7/22/27 (c) | 500,000 | 443,676 | |
| 2.456% 10/22/25 (c) | 500,000 | 477,107 | |
| 2.551% 2/4/28 (c) | 850,000 | 770,611 | |
| 2.651% 3/11/32 (c) | 250,000 | 207,271 | |
| 3.004% 12/20/23 (c) | 500,000 | 498,153 | |
| 3.458% 3/15/25 (c) | 393,000 | 386,546 | |
| 4.948% 7/22/28 (c) | 1,250,000 | 1,248,858 | |
| Banque Federative du Credit Mutuel SA 4.524% 7/13/25 (b) | 449,000 | 446,848 | |
| Barclays PLC: | |||
| 1.007% 12/10/24 (c) | 750,000 | 710,783 | |
| 2.279% 11/24/27 (c) | 1,300,000 | 1,141,719 | |
| 2.852% 5/7/26 (c) | 750,000 | 702,167 | |
| BNP Paribas SA U.S. Secured Overnight Fin. Rate (SOFR) Index + 1.000% 1.323% 1/13/27 (b)(c)(d) | 750,000 | 657,894 | |
| Canadian Imperial Bank of Commerce: | |||
| 3.45% 4/7/27 | 1,150,000 | 1,102,391 | |
| 3.945% 8/4/25 | 495,000 | 488,716 | |
| Citigroup, Inc.: | |||
| 1.122% 1/28/27 (c) | 500,000 | 441,334 | |
| 3.07% 2/24/28 (c) | 500,000 | 462,302 | |
| 3.106% 4/8/26 (c) | 1,100,000 | 1,056,579 | |
| 4.4% 6/10/25 | 250,000 | 248,908 | |
| DNB Bank ASA 1.605% 3/30/28 (b)(c) | 750,000 | 648,877 | |
| Fifth Third Bancorp 3.65% 1/25/24 | 168,000 | 166,923 | |
| HSBC Holdings PLC: | |||
| 1.589% 5/24/27 (c) | 550,000 | 479,073 | |
| 2.251% 11/22/27 (c) | 1,300,000 | 1,146,076 | |
| 3.803% 3/11/25 (c) | 750,000 | 735,660 | |
| 3.95% 5/18/24 (c) | 750,000 | 745,860 | |
| 5.21% 8/11/28 (c) | 327,000 | 319,169 | |
| Huntington Bancshares, Inc.: | |||
| 2.625% 8/6/24 | 450,000 | 436,688 | |
| 4.443% 8/4/28 (c) | 261,000 | 255,083 | |
| JPMorgan Chase & Co.: | |||
| 0.697% 3/16/24 (c) | 500,000 | 490,697 | |
| 0.824% 6/1/25 (c) | 63,000 | 58,939 | |
| 1.47% 9/22/27 (c) | 580,000 | 507,919 | |
| 2.083% 4/22/26 (c) | 500,000 | 467,585 | |
| 2.947% 2/24/28 (c) | 818,000 | 759,201 | |
| 3.54% 5/1/28 (c) | 350,000 | 329,686 | |
| 4.851% 7/25/28 (c) | 1,250,000 | 1,247,498 | |
| KeyBank NA 4.15% 8/8/25 | 250,000 | 248,052 | |
| KeyCorp 3.878% 5/23/25 (c) | 177,000 | 175,461 | |
| Mitsubishi UFJ Financial Group, Inc.: | |||
| 0.848% 9/15/24 (c) | 750,000 | 723,099 | |
| 0.953% 7/19/25 (c) | 750,000 | 700,005 | |
| 1.64% 10/13/27 (c) | 1,300,000 | 1,140,750 | |
| Mizuho Financial Group, Inc.: | |||
| 0.849% 9/8/24 (c) | 500,000 | 480,988 | |
| 1.234% 5/22/27 (c) | 1,050,000 | 913,869 | |
| 2.651% 5/22/26 (c) | 500,000 | 469,230 | |
| National Australia Bank Ltd. 2.875% 4/12/23 | 468,000 | 465,791 | |
| NatWest Group PLC: | |||
| 1.642% 6/14/27 (c) | 1,300,000 | 1,138,086 | |
| 4.269% 3/22/25 (c) | 200,000 | 197,705 | |
| PNC Financial Services Group, Inc. 3.5% 1/23/24 | 200,000 | 199,373 | |
| Rabobank Nederland 1.98% 12/15/27 (b)(c) | 550,000 | 486,100 | |
| Santander Holdings U.S.A., Inc. 2.49% 1/6/28 (c) | 773,000 | 672,195 | |
| Societe Generale 2.797% 1/19/28 (b)(c) | 950,000 | 837,043 | |
| Sumitomo Mitsui Financial Group, Inc.: | |||
| 1.402% 9/17/26 | 750,000 | 660,695 | |
| 2.696% 7/16/24 | 500,000 | 484,870 | |
| The Toronto-Dominion Bank 2.8% 3/10/27 | 64,000 | 59,977 | |
| Truist Financial Corp. 4.26% 7/28/26 (c) | 460,000 | 458,963 | |
| Wells Fargo & Co.: | |||
| 1.654% 6/2/24 (c) | 750,000 | 734,815 | |
| 2.164% 2/11/26 (c) | 750,000 | 705,659 | |
| 2.188% 4/30/26 (c) | 176,000 | 164,741 | |
| 3.526% 3/24/28 (c) | 788,000 | 744,404 | |
| 4.808% 7/25/28 (c) | 1,250,000 | 1,240,824 | |
| 34,836,524 | |||
| Capital Markets - 5.0% | |||
| Credit Suisse Group AG: | |||
| 1.305% 2/2/27 (b)(c) | 1,300,000 | 1,093,895 | |
| 3.091% 5/14/32 (b)(c) | 250,000 | 188,951 | |
| 6.373% 7/15/26 (b)(c) | 300,000 | 298,592 | |
| Deutsche Bank AG New York Branch: | |||
| 2.129% 11/24/26 (c) | 750,000 | 661,144 | |
| 2.311% 11/16/27 (c) | 1,300,000 | 1,104,389 | |
| Goldman Sachs Group, Inc.: | |||
| 0.627% 11/17/23 (c) | 500,000 | 495,928 | |
| 1.757% 1/24/25 (c) | 500,000 | 480,481 | |
| 2.64% 2/24/28 (c) | 563,000 | 510,550 | |
| 4.482% 8/23/28 (c) | 500,000 | 488,074 | |
| Intercontinental Exchange, Inc.: | |||
| 3.65% 5/23/25 | 314,000 | 310,768 | |
| 3.75% 9/21/28 | 125,000 | 120,876 | |
| 4% 9/15/27 | 981,000 | 965,438 | |
| Moody's Corp. 3.75% 3/24/25 | 750,000 | 742,779 | |
| Morgan Stanley: | |||
| 0.79% 5/30/25 (c) | 750,000 | 701,066 | |
| 2.188% 4/28/26 (c) | 750,000 | 704,481 | |
| 2.239% 7/21/32 (c) | 250,000 | 201,377 | |
| 3.591% 7/22/28 (c) | 1,050,000 | 991,217 | |
| 3.737% 4/24/24 (c) | 500,000 | 497,802 | |
| 4.679% 7/17/26 (c) | 342,000 | 342,368 | |
| S&P Global, Inc. 2.45% 3/1/27 (b) | 814,000 | 759,255 | |
| 11,659,431 | |||
| Consumer Finance - 1.5% | |||
| AerCap Ireland Capital Ltd./AerCap Global Aviation Trust 2.45% 10/29/26 | 700,000 | 617,227 | |
| American Express Co.: | |||
| 2.25% 3/4/25 | 35,000 | 33,410 | |
| 2.55% 3/4/27 | 54,000 | 50,145 | |
| Capital One Financial Corp.: | |||
| 1.343% 12/6/24 (c) | 850,000 | 815,196 | |
| 1.878% 11/2/27 (c) | 1,400,000 | 1,233,515 | |
| 4.985% 7/24/26 (c) | 201,000 | 200,718 | |
| Hyundai Capital America 1% 9/17/24 (b) | 74,000 | 68,560 | |
| John Deere Capital Corp. 3.4% 6/6/25 | 355,000 | 351,479 | |
| 3,370,250 | |||
| Diversified Financial Services - 0.5% | |||
| Athene Global Funding: | |||
| 1.716% 1/7/25 (b) | 600,000 | 555,376 | |
| 1.73% 10/2/26 (b) | 573,000 | 499,318 | |
| 1,054,694 | |||
| Insurance - 1.7% | |||
| American International Group, Inc. 2.5% 6/30/25 | 573,000 | 546,230 | |
| Equitable Financial Life Global Funding: | |||
| 1.1% 11/12/24 (b) | 500,000 | 466,130 | |
| 1.4% 8/27/27 (b) | 700,000 | 599,824 | |
| 1.7% 11/12/26 (b) | 799,000 | 711,073 | |
| MassMutual Global Funding II 4.15% 8/26/25 (b) | 463,000 | 461,764 | |
| RGA Global Funding 2% 11/30/26 (b) | 30,000 | 27,204 | |
| SunAmerica, Inc.: | |||
| 3.5% 4/4/25 (b) | 508,000 | 489,245 | |
| 3.65% 4/5/27 (b) | 762,000 | 716,439 | |
| 4,017,909 | |||
TOTAL FINANCIALS | 54,938,808 | ||
| HEALTH CARE - 0.2% | |||
| Health Care Providers & Services - 0.2% | |||
| CVS Health Corp. 4.3% 3/25/28 | 110,000 | 108,744 | |
| UnitedHealth Group, Inc. 3.7% 5/15/27 | 399,000 | 394,403 | |
| 503,147 | |||
| Pharmaceuticals - 0.0% | |||
| AstraZeneca Finance LLC 0.7% 5/28/24 | 60,000 | 56,797 | |
TOTAL HEALTH CARE | 559,944 | ||
| INDUSTRIALS - 1.4% | |||
| Aerospace & Defense - 0.4% | |||
| Raytheon Technologies Corp. 3.95% 8/16/25 | 116,000 | 115,996 | |
| The Boeing Co.: | |||
| 1.95% 2/1/24 | 307,000 | 297,041 | |
| 5.04% 5/1/27 | 500,000 | 498,496 | |
| 911,533 | |||
| Machinery - 0.5% | |||
| Daimler Trucks Finance North America LLC 2% 12/14/26 (b) | 500,000 | 444,928 | |
| Parker Hannifin Corp.: | |||
| 3.65% 6/15/24 | 440,000 | 436,011 | |
| 4.25% 9/15/27 | 217,000 | 214,749 | |
| 1,095,688 | |||
| Road & Rail - 0.2% | |||
| Canadian Pacific Railway Co. 1.75% 12/2/26 | 517,000 | 468,915 | |
| Trading Companies & Distributors - 0.3% | |||
| Air Lease Corp.: | |||
| 2.2% 1/15/27 | 530,000 | 465,449 | |
| 2.25% 1/15/23 | 175,000 | 173,709 | |
| 3.25% 3/1/25 | 97,000 | 92,589 | |
| 731,747 | |||
TOTAL INDUSTRIALS | 3,207,883 | ||
| INFORMATION TECHNOLOGY - 0.5% | |||
| Software - 0.5% | |||
| Roper Technologies, Inc.: | |||
| 1% 9/15/25 | 576,000 | 522,348 | |
| 1.75% 2/15/31 | 750,000 | 587,785 | |
| 1,110,133 | |||
| REAL ESTATE - 0.2% | |||
| Equity Real Estate Investment Trusts (REITs) - 0.2% | |||
| Crown Castle International Corp. 3.15% 7/15/23 | 399,000 | 396,201 | |
| UTILITIES - 0.9% | |||
| Electric Utilities - 0.8% | |||
| Alabama Power Co. 3.05% 3/15/32 | 526,000 | 478,574 | |
| Duke Energy Corp. 4.3% 3/15/28 | 341,000 | 333,839 | |
| Eversource Energy 0.8% 8/15/25 | 43,000 | 38,822 | |
| Exelon Corp. 2.75% 3/15/27 (b) | 6,000 | 5,605 | |
| Southern Co. 3.25% 7/1/26 | 500,000 | 477,599 | |
| Virginia Electric & Power Co. 2.4% 3/30/32 | 500,000 | 427,217 | |
| 1,761,656 | |||
| Independent Power and Renewable Electricity Producers - 0.1% | |||
| Exelon Generation Co. LLC 3.25% 6/1/25 | 178,000 | 172,744 | |
| Multi-Utilities - 0.0% | |||
| Sempra Energy 3.3% 4/1/25 | 28,000 | 27,252 | |
TOTAL UTILITIES | 1,961,652 | ||
| TOTAL NONCONVERTIBLE BONDS (Cost $74,315,640) | 72,541,885 | ||
| U.S. Treasury Obligations - 60.0% | |||
Principal Amount (a) | Value ($) | ||
| U.S. Treasury Bonds 3.125% 8/15/25 | 5,974,000 | 5,913,793 | |
| U.S. Treasury Notes: | |||
| 0.125% 8/15/23 | 3,243,400 | 3,141,664 | |
| 0.625% 7/31/26 | 223,300 | 200,359 | |
| 0.75% 3/31/26 | 4,532,900 | 4,118,742 | |
| 1.75% 3/15/25 | 9,400,000 | 9,004,172 | |
| 2.25% 4/30/24 | 49,000 | 48,037 | |
| 2.5% 4/30/24 | 30,817,100 | 30,328,360 | |
| 2.5% 3/31/27 | 678,700 | 653,514 | |
| 2.625% 4/15/25 | 57,349,000 | 56,103,448 | |
| 2.75% 4/30/27 | 16,773,900 | 16,326,378 | |
| 2.75% 7/31/27 | 500,000 | 486,602 | |
| 2.75% 8/15/32 | 1,967,000 | 1,897,540 | |
| 2.875% 4/30/29 | 6,797,700 | 6,610,232 | |
| 3.125% 8/31/27 | 3,673,000 | 3,640,287 | |
| TOTAL U.S. TREASURY OBLIGATIONS (Cost $140,566,883) | 138,473,128 | ||
| U.S. Government Agency - Mortgage Securities - 1.3% | |||
Principal Amount (a) | Value ($) | ||
| Fannie Mae - 1.0% | |||
| 2.5% 7/1/31 | 513,752 | 491,056 | |
| 3% 8/1/32 to 12/1/36 | 1,914,279 | 1,851,706 | |
TOTAL FANNIE MAE | 2,342,762 | ||
| Freddie Mac - 0.3% | |||
| 3% 7/1/32 to 3/1/33 | 653,805 | 634,968 | |
| TOTAL U.S. GOVERNMENT AGENCY - MORTGAGE SECURITIES (Cost $3,234,741) | 2,977,730 | ||
| Asset-Backed Securities - 2.6% | |||
Principal Amount (a) | Value ($) | ||
| American Express Credit Account Master Trust: | |||
| Series 2021-1 Class A, 0.9% 11/15/26 | 100,000 | 93,959 | |
| Series 2022-2 Class A, 3.39% 5/17/27 | 600,000 | 593,166 | |
| Series 2022-3 Class A, 3.75% 8/16/27 | 570,000 | 567,835 | |
| Bank of America Credit Card Master Trust: | |||
| Series 2021-A1 Class A1, 0.44% 9/15/26 | 80,000 | 75,815 | |
| Series 2022-A1 Class A1, 3.53% 11/15/27 | 624,000 | 619,136 | |
| Capital One Multi-Asset Execution Trust: | |||
| Series 2021-A3 Class A3, 1.04% 11/15/26 | 97,000 | 91,271 | |
| Series 2022-A1 Class A1, 2.8% 3/15/27 | 148,000 | 144,138 | |
| Series 2022-A2 Class A, 3.49% 5/15/27 | 671,000 | 665,055 | |
| Discover Card Execution Note Trust: | |||
| Series 2021-A1 Class A1, 0.58% 9/15/26 | 80,000 | 75,020 | |
| Series 2022-A1 Class A1, 1.96% 2/15/27 | 49,000 | 46,899 | |
| Series 2022-A2 Class A, 3.32% 5/15/27 | 540,000 | 532,608 | |
| Series 2022-A3 Class A3, 3.56% 7/15/27 | 540,000 | 535,664 | |
| Ford Credit Auto Owner Trust: | |||
| Series 2019-1 Class A, 3.52% 7/15/30 (b) | 320,000 | 317,300 | |
| Series 2021-A Class A3, 0.3% 8/15/25 | 491,667 | 478,461 | |
| Honda Auto Receivables Owner Trust Series 2021-1 Class A3, 0.27% 4/21/25 | 772,164 | 753,191 | |
| Verizon Master Trust: | |||
| Series 2021-1 Class A, 0.5% 5/20/27 | 59,000 | 55,665 | |
| Series 2021-2 Class A, 0.99% 4/20/28 | 90,000 | 84,754 | |
| Series 2022-5 Class A1A, 3.72% 7/20/27 | 277,000 | 277,092 | |
| TOTAL ASSET-BACKED SECURITIES (Cost $6,107,631) | 6,007,029 | ||
| Collateralized Mortgage Obligations - 0.3% | |||
Principal Amount (a) | Value ($) | ||
| Private Sponsor - 0.3% | |||
CSAIL Commercial Mortgage Trust Series 2015-C2 Class ASB, 3.2241% 6/15/57 (Cost $649,764) | 651,106 | 640,431 | |
| Commercial Mortgage Securities - 1.8% | |||
Principal Amount (a) | Value ($) | ||
| BX Commercial Mortgage Trust floater: | |||
| Series 2021-PAC Class A, 1 month U.S. LIBOR + 0.680% 3.0811% 10/15/36 (b)(c)(d) | 100,000 | 96,347 | |
| Series 2022-LP2 Class A, CME Term SOFR 1 Month Index + 1.010% 3.3099% 2/15/39 (b)(c)(d) | 93,383 | 90,278 | |
| BX Trust: | |||
| floater: | |||
Series 2021-ACNT Class A, 1 month U.S. LIBOR + 0.850% 3.242% 11/15/38 (b)(c)(d) | 100,000 | 96,750 | |
Series 2021-BXMF Class A, 1 month U.S. LIBOR + 0.630% 3.0269% 10/15/26 (b)(c)(d) | 100,000 | 95,750 | |
| floater, sequential payer Series 2019-XL Class A, 1 month U.S. LIBOR + 0.920% 3.311% 10/15/36 (b)(c)(d) | 75,543 | 74,644 | |
| CD Mortgage Trust sequential payer Series 2017-CD5 Class AAB, 3.22% 8/15/50 | 689,069 | 668,065 | |
| CSAIL Commercial Mortgage Trust Series 2017-CX9 Class A2, 3.0538% 9/15/50 | 29,657 | 29,607 | |
| ELP Commercial Mortgage Trust floater Series 2021-ELP Class A, 1 month U.S. LIBOR + 0.700% 3.093% 11/15/38 (b)(c)(d) | 100,000 | 96,447 | |
| GS Mortgage Securities Trust sequential payer: | |||
| Series 2015-GC28 Class AAB, 3.206% 2/10/48 | 109,450 | 107,461 | |
| Series 2015-GC32 Class AAB, 3.513% 7/10/48 | 349,677 | 342,887 | |
| Series 2016-GS2 Class AAB, 2.922% 5/10/49 | 761,858 | 741,047 | |
| Life Financial Services Trust floater Series 2022-BMR2 Class A1, CME Term SOFR 1 Month Index + 1.290% 3.6027% 5/15/39 (b)(c)(d) | 445,000 | 436,633 | |
| SREIT Trust floater Series 2021-MFP Class A, 1 month U.S. LIBOR + 0.730% 3.1218% 11/15/38 (b)(c)(d) | 200,000 | 192,733 | |
| Wells Fargo Commercial Mortgage Trust sequential payer Series 2015-C27 Class ASB, 3.278% 2/15/48 | 367,704 | 361,336 | |
| WF-RBS Commercial Mortgage Trust sequential payer Series 2014-C20 Class ASB, 3.638% 5/15/47 | 669,673 | 664,184 | |
| TOTAL COMMERCIAL MORTGAGE SECURITIES (Cost $4,206,265) | 4,094,169 | ||
| Bank Notes - 0.2% | |||
Principal Amount (a) | Value ($) | ||
Truist Bank 3% 2/2/23 (Cost $504,293) | 500,000 | 498,596 | |
| Money Market Funds - 1.8% | |||
| Shares | Value ($) | ||
Fidelity Cash Central Fund 2.33% (e) (Cost $4,178,473) | 4,177,637 | 4,178,473 | |
| TOTAL INVESTMENT IN SECURITIES - 99.4% (Cost $233,763,690) | 229,411,441 |
NET OTHER ASSETS (LIABILITIES) - 0.6% | 1,346,349 |
| NET ASSETS - 100.0% | 230,757,790 |
| (a) | Amount is stated in United States dollars unless otherwise noted. |
| (b) | Security exempt from registration under Rule 144A of the Securities Act of 1933. These securities may be resold in transactions exempt from registration, normally to qualified institutional buyers. At the end of the period, the value of these securities amounted to $13,330,265 or 5.8% of net assets. |
| (c) | Coupon rates for floating and adjustable rate securities reflect the rates in effect at period end. |
| (d) | Coupon is indexed to a floating interest rate which may be multiplied by a specified factor and/or subject to caps or floors. |
| (e) | Affiliated fund that is generally available only to investment companies and other accounts managed by Fidelity Investments. The rate quoted is the annualized seven-day yield of the fund at period end. A complete unaudited listing of the fund's holdings as of its most recent quarter end is available upon request. In addition, each Fidelity Central Fund's financial statements, which are not covered by the Fund's Report of Independent Registered Public Accounting Firm, are available on the SEC's website or upon request. |
| Affiliate | Value, beginning of period ($) | Purchases ($) | Sales Proceeds ($) | Dividend Income ($) | Realized Gain (loss) ($) | Change in Unrealized appreciation (depreciation) ($) | Value, end of period ($) | %ownership, end of period |
| Fidelity Cash Central Fund 2.33% | 950,803 | 96,113,539 | 92,885,869 | 22,193 | - | - | 4,178,473 | 0.0% |
| Fidelity Securities Lending Cash Central Fund 2.34% | - | 443,085 | 443,085 | - | - | - | - | 0.0% |
| Total | 950,803 | 96,556,624 | 93,328,954 | 22,193 | - | - | 4,178,473 | |
| Valuation Inputs at Reporting Date: | ||||
| Description | Total ($) | Level 1 ($) | Level 2 ($) | Level 3 ($) |
Investments in Securities: | ||||
| Corporate Bonds | 72,541,885 | - | 72,541,885 | - |
| U.S. Government and Government Agency Obligations | 138,473,128 | - | 138,473,128 | - |
| U.S. Government Agency - Mortgage Securities | 2,977,730 | - | 2,977,730 | - |
| Asset-Backed Securities | 6,007,029 | - | 6,007,029 | - |
| Collateralized Mortgage Obligations | 640,431 | - | 640,431 | - |
| Commercial Mortgage Securities | 4,094,169 | - | 4,094,169 | - |
| Bank Notes | 498,596 | - | 498,596 | - |
| Money Market Funds | 4,178,473 | 4,178,473 | - | - |
| Total Investments in Securities: | 229,411,441 | 4,178,473 | 225,232,968 | - |
| Statement of Assets and Liabilities | ||||
| August 31, 2022 | ||||
| Assets | ||||
| Investment in securities, at value - See accompanying schedule: | $225,232,968 | |||
Unaffiliated issuers (cost $229,585,217) | ||||
Fidelity Central Funds (cost $4,178,473) | 4,178,473 | |||
| Total Investment in Securities (cost $233,763,690) | $ | 229,411,441 | ||
| Receivable for investments sold | 9,212,149 | |||
| Receivable for fund shares sold | 581,219 | |||
| Interest receivable | 1,689,376 | |||
| Distributions receivable from Fidelity Central Funds | 6,897 | |||
Total assets | 240,901,082 | |||
| Liabilities | ||||
| Payable for investments purchased | $9,562,073 | |||
| Distributions payable | 581,219 | |||
| Total Liabilities | 10,143,292 | |||
| Net Assets | $ | 230,757,790 | ||
| Net Assets consist of: | ||||
| Paid in capital | $ | 235,911,029 | ||
| Total accumulated earnings (loss) | (5,153,239) | |||
| Net Assets | $ | 230,757,790 | ||
Net Asset Value , offering price and redemption price per share ($230,757,790 ÷ 24,947,371 shares) | $ | 9.25 | ||
| Statement of Operations | ||||
Year ended August 31, 2022 | ||||
| Investment Income | ||||
| Interest | $ | 2,261,485 | ||
| Income from Fidelity Central Funds | 22,193 | |||
| Total Income | 2,283,678 | |||
| Expenses | ||||
| Independent trustees' fees and expenses | 222 | |||
| Total expenses before reductions | 222 | |||
| Expense reductions | (183) | |||
| Total expenses after reductions | 39 | |||
| Net Investment income (loss) | 2,283,639 | |||
| Realized and Unrealized Gain (Loss) | ||||
| Net realized gain (loss) on: | ||||
| Investment Securities: | ||||
| Unaffiliated issuers | (775,412) | |||
| Total net realized gain (loss) | (775,412) | |||
| Change in net unrealized appreciation (depreciation) on investment securities | (4,473,970) | |||
| Net gain (loss) | (5,249,382) | |||
| Net increase (decrease) in net assets resulting from operations | $ | (2,965,743) | ||
| Statement of Changes in Net Assets | ||||
Year ended August 31, 2022 | For the period March 16, 2021 (commencement of operations) through August 31, 2021 | |||
| Increase (Decrease) in Net Assets | ||||
| Operations | ||||
| Net investment income (loss) | $ | 2,283,639 | $ | 111,953 |
| Net realized gain (loss) | (775,412) | 34,712 | ||
| Change in net unrealized appreciation (depreciation) | (4,473,970) | 121,721 | ||
| Net increase (decrease) in net assets resulting from operations | (2,965,743) | 268,386 | ||
| Distributions to shareholders | (2,334,309) | (121,571) | ||
| Share transactions | ||||
| Proceeds from sales of shares | 210,735,306 | 32,770,069 | ||
| Reinvestment of distributions | 2,334,309 | 121,571 | ||
| Cost of shares redeemed | (7,950,228) | (2,100,000) | ||
Net increase (decrease) in net assets resulting from share transactions | 205,119,387 | 30,791,640 | ||
| Total increase (decrease) in net assets | 199,819,335 | 30,938,455 | ||
| Net Assets | ||||
| Beginning of period | 30,938,455 | - | ||
| End of period | $ | 230,757,790 | $ | 30,938,455 |
| Other Information | ||||
| Shares | ||||
| Sold | 22,461,551 | 3,276,589 | ||
| Issued in reinvestment of distributions | 248,508 | 12,114 | ||
| Redeemed | (842,446) | (208,945) | ||
| Net increase (decrease) | 21,867,613 | 3,079,758 | ||
| Fidelity® Education Income Fund |
| Years ended August 31, | 2022 | 2021 A | ||
Selected Per-Share Data | ||||
| Net asset value, beginning of period | $ | 10.05 | $ | 10.00 |
| Income from Investment Operations | ||||
Net investment income (loss) B,C | .224 | .036 | ||
| Net realized and unrealized gain (loss) | (.858) | .052 | ||
| Total from investment operations | (.634) | .088 | ||
| Distributions from net investment income | (.153) | (.038) | ||
| Distributions from net realized gain | (.013) | - | ||
| Total distributions | (.166) | (.038) | ||
| Net asset value, end of period | $ | 9.25 | $ | 10.05 |
Total Return D,E | (6.34)% | .89% | ||
Ratios to Average Net Assets C,F,G | ||||
Expenses before reductions H | -% | -% I | ||
Expenses net of fee waivers, if any H | -% | -% I | ||
Expenses net of all reductions H | -% | -% I | ||
| Net investment income (loss) | 2.40% | .79% I | ||
| Supplemental Data | ||||
| Net assets, end of period (000 omitted) | $ | 230,758 | $ | 30,938 |
Portfolio turnover rate J | 80% | 87% K,L |
| Fidelity Central Fund | Investment Manager | Investment Objective | Investment Practices | Expense Ratio A |
| Fidelity Money Market Central Funds | Fidelity Management & Research Company LLC (FMR) | Each fund seeks to obtain a high level of current income consistent with the preservation of capital and liquidity. | Short-term Investments | Less than .005% |
| Gross unrealized appreciation | $ 2,231 |
| Gross unrealized depreciation | (4,456,934) |
| Net unrealized appreciation (depreciation) | $ (4,454,703) |
| Tax Cost | $ 233,866,144 |
| Capital loss carryforward | $ (672,958) |
| Net unrealized appreciation (depreciation) on securities and other investments | $ (4,454,703) |
Short-term | $(534,954) |
Long-term | (138,004) |
| Total capital loss carryforward | $ (672,958) |
| August 31, 2022 | August 31, 2021 A | |
| Ordinary Income | $ 2,334,309 | $ 121,571 |
| Purchases ($) | Sales ($) | |
| Fidelity Education Income Fund | 73,992,543 | 1,953,951 |
| Shares | Total Proceeds ($) | |
| Fidelity Education Income Fund | 3,057,370 | 30,573,697 |
| The Example is based on an investment of $1,000 invested at the beginning of the period and held for the entire period (March 1, 2022 to August 31, 2022). |
Annualized Expense Ratio- A | Beginning Account Value March 1, 2022 | Ending Account Value August 31, 2022 | Expenses Paid During Period- C March 1, 2022 to August 31, 2022 | |||||||
| Fidelity® Education Income Fund | -%- D | |||||||||
| Actual | $ 1,000 | $ 962.50 | $- E | |||||||
Hypothetical- B | $ 1,000 | $ 1,025.21 | $- E | |||||||
|
Item 2.
Code of Ethics
As of the end of the period, August 31, 2022, Fidelity Garrison Street Trust (the trust) has adopted a code of ethics, as defined in Item 2 of Form N-CSR, that applies to its President and Treasurer and its Chief Financial Officer. A copy of the code of ethics is filed as an exhibit to this Form N-CSR.
Item 3.
Audit Committee Financial Expert
The Board of Trustees of the trust has determined that Elizabeth S. Acton is an audit committee financial expert, as defined in Item 3 of Form N-CSR. Ms. Acton is independent for purposes of Item 3 of Form N-CSR.
Item 4.
Principal Accountant Fees and Services
Fees and Services
The following table presents fees billed by Deloitte & Touche LLP, the member firms of Deloitte Touche Tohmatsu, and their respective affiliates (collectively, “Deloitte Entities”) in each of the last two fiscal years for services rendered to Fidelity Education Income Fund (the “Fund”):
Services Billed by Deloitte Entities
August 31, 2022 FeesA
Audit Fees | Audit-Related Fees | Tax Fees | All Other Fees | |
Fidelity Education Income Fund | $77,100 | $- | $9,500 | $1,600 |
August 31, 2021 FeesA,B
Audit Fees | Audit-Related Fees | Tax Fees | All Other Fees | |
Fidelity Education Income Fund | $63,100 | $- | $8,900 | $600 |
A Amounts may reflect rounding.
B Fidelity Education Income Fund commenced operations on March 16, 2021.
The following table(s) present(s) fees billed by Deloitte Entities that were required to be approved by the Audit Committee for services that relate directly to the operations and
financial reporting of the Fund(s) and that are rendered on behalf of Fidelity Management & Research Company LLC ("FMR") and entities controlling, controlled by, or under common control with FMR (not including any sub-adviser whose role is primarily portfolio management and is subcontracted with or overseen by another investment adviser) that provide ongoing services to the Fund(s) (“Fund Service Providers”):
Services Billed by Deloitte Entities
August 31, 2022A | August 31, 2021 A,B | |
Audit-Related Fees | $- | $- |
Tax Fees | $- | $- |
All Other Fees | $- | $- |
A Amounts may reflect rounding.
B May include amounts billed prior to the Fidelity Education Income Fund’s
commencement of operations.
“Audit-Related Fees” represent fees billed for assurance and related services that are reasonably related to the performance of the fund audit or the review of the fund's financial statements and that are not reported under Audit Fees.
“Tax Fees” represent fees billed for tax compliance, tax advice or tax planning that relate directly to the operations and financial reporting of the fund.
“All Other Fees” represent fees billed for services provided to the fund or Fund Service Provider, a significant portion of which are assurance related, that relate directly to the operations and financial reporting of the fund, excluding those services that are reported under Audit Fees, Audit-Related Fees or Tax Fees.
Assurance services must be performed by an independent public accountant.
* * *
The aggregate non-audit fees billed by Deloitte Entities for services rendered to the Fund(s), FMR (not including any sub-adviser whose role is primarily portfolio management and is subcontracted with or overseen by another investment adviser), and any Fund Service Provider for each of the last two fiscal years of the Fund(s) are as follows:
Billed By | August 31, 2022A | August 31, 2021A,B |
Deloitte Entities | $468,700 | $531,100 |
A Amounts may reflect rounding.
B May include amounts billed prior to the Fidelity Education Income Fund’s
commencement of operations.
The trust's Audit Committee has considered non-audit services that were not pre-approved that were provided by Deloitte Entities to Fund Service Providers to be compatible with maintaining the independence of Deloitte Entities in its(their) audit of the Fund(s), taking into account representations from Deloitte Entities, in accordance with Public Company Accounting Oversight Board rules, regarding its independence from the Fund(s) and its(their) related entities and FMR’s review of the appropriateness and permissibility under applicable law of such non-audit services prior to their provision to the Fund(s) Service Providers.
Audit Committee Pre-Approval Policies and Procedures
The trust’s Audit Committee must pre-approve all audit and non-audit services provided by a fund’s independent registered public accounting firm relating to the operations or financial reporting of the fund. Prior to the commencement of any audit or non-audit services to a fund, the Audit Committee reviews the services to determine whether they are appropriate and permissible under applicable law.
The Audit Committee has adopted policies and procedures to, among other purposes, provide a framework for the Committee’s consideration of non-audit services by the audit firms that audit the Fidelity funds. The policies and procedures require that any non-audit service provided by a fund audit firm to a Fidelity fund and any non-audit service provided by a fund auditor to a Fund Service Provider that relates directly to the operations and financial reporting of a Fidelity fund (“Covered Service”) are subject to approval by the Audit Committee before such service is provided.
All Covered Services must be approved in advance of provision of the service either: (i) by formal resolution of the Audit Committee, or (ii) by oral or written approval of the service by the Chair of the Audit Committee (or if the Chair is unavailable, such other member of the Audit Committee as may be designated by the Chair to act in the Chair’s absence). The approval contemplated by (ii) above is permitted where the Treasurer determines that action on such an engagement is necessary before the next meeting of the Audit Committee.
Non-audit services provided by a fund audit firm to a Fund Service Provider that do not relate directly to the operations and financial reporting of a Fidelity fund are reported to the Audit Committee periodically.
Non-Audit Services Approved Pursuant to Rule 2-01(c)(7)(i)(C) and (ii) of Regulation S-X (“De Minimis Exception”)
There were no non-audit services approved or required to be approved by the Audit Committee pursuant to the De Minimis Exception during the Fund’s(s’) last two fiscal years relating to services provided to (i) the Fund(s) or (ii) any Fund Service Provider that relate directly to the operations and financial reporting of the Fund(s).
Item 5.
Audit Committee of Listed Registrants
Not applicable.
Item 6.
Investments
(a)
Not applicable.
(b)
Not applicable.
Item 7.
Disclosure of Proxy Voting Policies and Procedures for Closed-End Management Investment Companies
Not applicable.
Item 8.
Portfolio Managers of Closed-End Management Investment Companies
Not applicable.
Item 9.
Purchase of Equity Securities by Closed-End Management Investment Company and Affiliated Purchasers
Not applicable.
Item 10.
Submission of Matters to a Vote of Security Holders
There were no material changes to the procedures by which shareholders may recommend nominees to the trust’s Board of Trustees.
Item 11.
Controls and Procedures
(a)(i) The President and Treasurer and the Chief Financial Officer have concluded that the trust’s disclosure controls and procedures (as defined in Rule 30a-3(c) under the Investment Company Act) provide reasonable assurances that material information relating to the trust is made known to them by the appropriate persons, based on their evaluation of these controls and procedures as of a date within 90 days of the filing date of this report.
(a)(ii) There was no change in the trust’s internal control over financial reporting (as defined in Rule 30a-3(d) under the Investment Company Act) that occurred during the period covered by this report that has materially affected, or is reasonably likely to materially affect, the trust’s internal control over financial reporting.
Item 12.
Disclosure of Securities Lending Activities for Closed-End Management
Investment Companies
Not applicable.
Item 13.
Exhibits
(a) | (1) | Code of Ethics pursuant to Item 2 of Form N-CSR is filed and attached hereto as EX-99.CODE ETH. |
(a) | (2) | |
(a) | (3) | Not applicable. |
(b) |
SIGNATURES
Pursuant to the requirements of the Securities Exchange Act of 1934 and the Investment Company Act of 1940, the registrant has duly caused this report to be signed on its behalf by the undersigned, thereunto duly authorized.
Fidelity Garrison Street Trust
By: | /s/Laura M. Del Prato |
Laura M. Del Prato | |
President and Treasurer | |
Date: | October 20, 2022 |
Pursuant to the requirements of the Securities Exchange Act of 1934 and the Investment Company Act of 1940, this report has been signed below by the following persons on behalf of the registrant and in the capacities and on the dates indicated.
By: | /s/Laura M. Del Prato |
Laura M. Del Prato | |
President and Treasurer | |
Date: | October 20, 2022 |
By: | /s/John J. Burke III |
John J. Burke III | |
Chief Financial Officer | |
Date: | October 20, 2022 |