UNITED STATES
SECURITIES AND EXCHANGE COMMISSION
Washington, D.C. 20549
FORM N-CSR
CERTIFIED SHAREHOLDER REPORT OF REGISTERED
MANAGEMENT INVESTMENT COMPANIES
Investment Company Act file number 811-04861
Fidelity Garrison Street Trust
(Exact name of registrant as specified in charter)
245 Summer St., Boston, Massachusetts 02210
(Address of principal executive offices) (Zip code)
Margaret Carey, Secretary
245 Summer St.
Boston, Massachusetts 02210
(Name and address of agent for service)
Registrant's telephone number, including area code:
617-563-7000
| |
Date of fiscal year end: | August 31 |
|
|
Date of reporting period: | August 31, 2023 |
Item 1.
Reports to Stockholders
Fidelity® Education Income Fund
Annual Report
August 31, 2023
Contents
To view a fund's proxy voting guidelines and proxy voting record for the 12-month period ended June 30, visit http://www.fidelity.com/proxyvotingresults or visit the Securities and Exchange Commission's (SEC) web site at http://www.sec.gov.
You may also call 1-800-544-8544 to request a free copy of the proxy voting guidelines.
Standard & Poor's, S&P and S&P 500 are registered service marks of The McGraw-Hill Companies, Inc. and have been licensed for use by Fidelity Distributors Corporation.
Other third-party marks appearing herein are the property of their respective owners.
All other marks appearing herein are registered or unregistered trademarks or service marks of FMR LLC or an affiliated company. © 2023 FMR LLC. All rights reserved.
This report and the financial statements contained herein are submitted for the general information of the shareholders of the Fund. This report is not authorized for distribution to prospective investors in the Fund unless preceded or accompanied by an effective prospectus.
A fund files its complete schedule of portfolio holdings with the SEC for the first and third quarters of each fiscal year on Form N-PORT. Forms N-PORT are available on the SEC's web site at http://www.sec.gov. A fund's Forms N-PORT may be reviewed and copied at the SEC's Public Reference Room in Washington, DC. Information regarding the operation of the SEC's Public Reference Room may be obtained by calling 1-800-SEC-0330.
For a complete list of a fund's portfolio holdings, view the most recent holdings listing, semiannual report, or annual report on Fidelity's web site at http://www.fidelity.com, http://www.institutional.fidelity.com, or http://www.401k.com, as applicable.
NOT FDIC INSURED •MAY LOSE VALUE •NO BANK GUARANTEE
Neither the Fund nor Fidelity Distributors Corporation is a bank.
Average annual total return reflects the change in the value of an investment, assuming reinvestment of distributions from dividend income and capital gains (the profits earned upon the sale of securities that have grown in value, if any) and assuming a constant rate of performance each year. The hypothetical investment and the average annual total returns do not reflect the deduction of taxes that a shareholder would pay on fund distributions or the redemption of fund shares. During periods of reimbursement by Fidelity, a fund's total return will be greater than it would be had the reimbursement not occurred. How a fund did yesterday is no guarantee of how it will do tomorrow.
| Average Annual Total Returns |
| | | | |
Periods ended August 31, 2023 | Past 1 year | Life of Fund A |
| Fidelity® Education Income Fund | 1.34% | -1.75% |
A From March 16, 2021
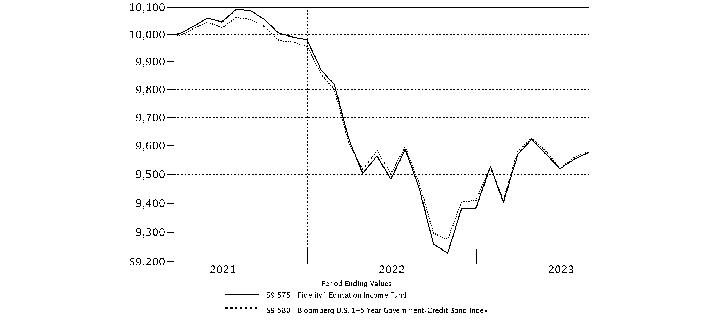
| $10,000 Over Life of Fund |
| |
Let's say hypothetically that $10,000 was invested in Fidelity® Education Income Fund, on March 16, 2021, when the fund started. The chart shows how the value of your investment would have changed, and also shows how the Bloomberg U.S. 1-5 Year Government/Credit Bond Index performed over the same period. |
|
|
Market Recap:
U.S. taxable investment-grade bonds returned -1.19% for the 12 months ending August 31, 2023, according to the Bloomberg U.S. Aggregate Bond Index. The first months of the period saw a continuation of the historic bond market downturn that began in early 2022, when the U.S. Federal Reserve began an aggressive series of interest rate hikes to combat persistent inflation. The actions helped push nominal and real U.S. bond yields to their highest levels in more than a decade. Bond prices, which move inversely to yields, fell sharply through October, and credit spreads widened, as investors demanded more yield for buying credit-sensitive assets. In November, the bond market staged a broad rally (+3.68%) when comments by Fed Chair Jerome Powell pointed to a slowdown in the size of future rate hikes. With the market anticipating the end of the hiking cycle by midyear, the index advanced 3.59% in the first four months of 2023, only to fall back in each of the four next months, as cooling but still-high inflation and a strong labor market suggested the Fed may need to keep raising rates for longer than anticipated. To date, the central bank has raised its benchmark rate 11 times, by a total of 5.25 percentage points. For the full 12 months, short-term bonds outperformed long-term issues, while lower-quality bonds bettered higher-quality debt, and risk assets like corporate bonds and asset-backed securities outpaced U.S. Treasuries. Meanwhile, U.S. mortgage-backed securities lagged in the rising-rate environment.
Comments from Co-Portfolio Managers Rob Galusza, Julian Potenza and David DeBiase:
For the fiscal year ending August 31, 2023, the fund gained 1.34%, outpacing, net of fees, the 0.83% advance of the Fidelity Education Income Composite Index, as well as the 1.19% gain of the benchmark Bloomberg 1-5 Year Government/Credit Index. During the 12 months, both sector allocation and security selection contributed to performance versus the Composite index. Specifically, bond selection and an overweight position in corporate debt helped, especially within the banking segment. Non-Composite exposure to securitized credit card debt and commercial mortgage-backed securities also added to relative performance. There were no meaningful detractors among the fund's primary investment strategies. At period end, corporates made up about 26% of fund assets, down from roughly 32% a year ago but higher than the Composite average of 17%. We increased the portfolio's allocation to asset-backed securities from 3% to 6% during the past 12 months, and slightly increased exposure to U.S. Treasuries, from about 61% to roughly 62% of assets, still notably lower than the average Composite weight of approximately 74%.
The views expressed above reflect those of the portfolio manager(s) only through the end of the period as stated on the cover of this report and do not necessarily represent the views of Fidelity or any other person in the Fidelity organization. Any such views are subject to change at any time based upon market or other conditions and Fidelity disclaims any responsibility to update such views. These views may not be relied on as investment advice and, because investment decisions for a Fidelity fund are based on numerous factors, may not be relied on as an indication of trading intent on behalf of any Fidelity fund.
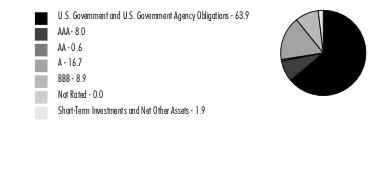
Quality Diversification (% of Fund's net assets) |
|
Percentages shown as 0.0% may reflect amounts less than 0.05%. |
| |
| We have used ratings from Moody's Investors Service, Inc. Where Moody's® ratings are not available, we have used S&P® ratings. All ratings are as of the date indicated and do not reflect subsequent changes. |
Asset Allocation (% of Fund's net assets) |
|
|
Showing Percentage of Net Assets
| Nonconvertible Bonds - 26.2% |
| | | Principal Amount (a) | Value ($) |
| COMMUNICATION SERVICES - 1.1% | | | |
| Diversified Telecommunication Services - 0.7% | | | |
| AT&T, Inc.: | | | |
| 1.65% 2/1/28 | | 2,750,000 | 2,351,287 |
| 4.25% 3/1/27 | | 400,000 | 385,518 |
| 4.3% 2/15/30 | | 250,000 | 233,091 |
| Verizon Communications, Inc.: | | | |
| 2.1% 3/22/28 | | 500,000 | 436,946 |
| 2.355% 3/15/32 | | 2,000,000 | 1,581,876 |
| 3% 3/22/27 | | 78,000 | 72,502 |
| | | | 5,061,220 |
| Entertainment - 0.1% | | | |
| The Walt Disney Co. 1.75% 1/13/26 | | 306,000 | 283,244 |
| Media - 0.3% | | | |
| Comcast Corp.: | | | |
| 2.35% 1/15/27 | | 500,000 | 458,719 |
| 3.95% 10/15/25 | | 725,000 | 706,152 |
| Magallanes, Inc.: | | | |
| 3.755% 3/15/27 | | 1,000,000 | 937,918 |
| 4.054% 3/15/29 | | 6,000 | 5,518 |
| | | | 2,108,307 |
| Wireless Telecommunication Services - 0.0% | | | |
| Rogers Communications, Inc. 3.2% 3/15/27 | | 19,000 | 17,564 |
TOTAL COMMUNICATION SERVICES | | | 7,470,335 |
| CONSUMER DISCRETIONARY - 1.6% | | | |
| Automobiles - 1.0% | | | |
| Daimler Finance North America LLC 1.45% 3/2/26 (b) | | 2,500,000 | 2,278,678 |
| General Motors Financial Co., Inc.: | | | |
| 1.05% 3/8/24 | | 18,000 | 17,546 |
| 1.25% 1/8/26 | | 500,000 | 449,794 |
| 2.35% 2/26/27 | | 3,000,000 | 2,667,028 |
| Volkswagen Group of America Finance LLC: | | | |
| 1.25% 11/24/25 (b) | | 1,000,000 | 911,593 |
| 3.95% 6/6/25 (b) | | 227,000 | 220,327 |
| 4.35% 6/8/27 (b) | | 200,000 | 192,611 |
| | | | 6,737,577 |
| Specialty Retail - 0.6% | | | |
| Lowe's Companies, Inc.: | | | |
| 4.4% 9/8/25 | | 2,275,000 | 2,233,725 |
| 4.8% 4/1/26 | | 261,000 | 257,976 |
| The Home Depot, Inc. 2.875% 4/15/27 | | 2,028,000 | 1,903,006 |
| | | | 4,394,707 |
TOTAL CONSUMER DISCRETIONARY | | | 11,132,284 |
| CONSUMER STAPLES - 1.2% | | | |
| Consumer Staples Distribution & Retail - 0.3% | | | |
| Dollar General Corp. 4.625% 11/1/27 | | 2,406,000 | 2,343,406 |
| Personal Care Products - 0.3% | | | |
| Kenvue, Inc.: | | | |
| 5.05% 3/22/28 (b) | | 1,262,000 | 1,265,349 |
| ��5.35% 3/22/26 (b) | | 598,000 | 601,102 |
| | | | 1,866,451 |
| Tobacco - 0.6% | | | |
| BAT Capital Corp. 4.7% 4/2/27 | | 801,000 | 776,848 |
| BAT International Finance PLC 1.668% 3/25/26 | | 2,750,000 | 2,490,363 |
| Philip Morris International, Inc. 1.5% 5/1/25 | | 750,000 | 703,844 |
| | | | 3,971,055 |
TOTAL CONSUMER STAPLES | | | 8,180,912 |
| ENERGY - 0.4% | | | |
| Energy Equipment & Services - 0.0% | | | |
| Baker Hughes Co.: | | | |
| 1.231% 12/15/23 | | 16,000 | 15,794 |
| 2.061% 12/15/26 | | 15,000 | 13,568 |
| | | | 29,362 |
| Oil, Gas & Consumable Fuels - 0.4% | | | |
| Canadian Natural Resources Ltd. 2.05% 7/15/25 | | 315,000 | 295,098 |
| ConocoPhillips Co. 2.4% 3/7/25 | | 4,000 | 3,834 |
| Enbridge, Inc.: | | | |
| 2.15% 2/16/24 | | 12,000 | 11,801 |
| 2.5% 2/14/25 | | 12,000 | 11,465 |
| Energy Transfer LP 4.2% 9/15/23 | | 73,000 | 72,964 |
| Exxon Mobil Corp. 2.992% 3/19/25 | | 210,000 | 203,315 |
| MPLX LP: | | | |
| 1.75% 3/1/26 | | 2,000,000 | 1,821,559 |
| 4% 3/15/28 | | 760,000 | 713,477 |
| | | | 3,133,513 |
TOTAL ENERGY | | | 3,162,875 |
| FINANCIALS - 18.9% | | | |
| Banks - 12.5% | | | |
| Bank of America Corp.: | | | |
| 1.197% 10/24/26 (c) | | 500,000 | 453,108 |
| 1.734% 7/22/27 (c) | | 500,000 | 447,395 |
| 2.456% 10/22/25 (c) | | 500,000 | 480,603 |
| 2.551% 2/4/28 (c) | | 850,000 | 768,747 |
| 2.651% 3/11/32 (c) | | 2,750,000 | 2,247,918 |
| 3.458% 3/15/25 (c) | | 393,000 | 387,402 |
| 4.827% 7/22/26 (c) | | 2,500,000 | 2,453,358 |
| 4.948% 7/22/28 (c) | | 3,750,000 | 3,671,633 |
| Banque Federative du Credit Mutuel SA 4.524% 7/13/25 (b) | | 449,000 | 438,608 |
| Barclays PLC: | | | |
| 1.007% 12/10/24 (c) | | 750,000 | 739,633 |
| 2.279% 11/24/27 (c) | | 1,300,000 | 1,154,449 |
| 2.852% 5/7/26 (c) | | 750,000 | 708,842 |
| 5.304% 8/9/26 (c) | | 2,500,000 | 2,463,093 |
| BNP Paribas SA U.S. Secured Overnight Fin. Rate (SOFR) Index + 1.000% 1.323% 1/13/27 (b)(c)(d) | | 750,000 | 674,410 |
| Canadian Imperial Bank of Commerce: | | | |
| 3.45% 4/7/27 | | 1,150,000 | 1,074,023 |
| 3.945% 8/4/25 | | 495,000 | 479,691 |
| Citigroup, Inc.: | | | |
| 1.122% 1/28/27 (c) | | 3,000,000 | 2,688,622 |
| 3.07% 2/24/28 (c) | | 3,000,000 | 2,753,881 |
| 3.106% 4/8/26 (c) | | 1,100,000 | 1,052,714 |
| 4.14% 5/24/25 (c) | | 2,500,000 | 2,466,424 |
| DNB Bank ASA: | | | |
| 0.856% 9/30/25 (b)(c) | | 2,500,000 | 2,368,206 |
| 1.605% 3/30/28 (b)(c) | | 2,250,000 | 1,952,687 |
| Fifth Third Bancorp 3.65% 1/25/24 | | 168,000 | 166,413 |
| HSBC Holdings PLC: | | | |
| 1.589% 5/24/27 (c) | | 550,000 | 488,678 |
| 2.251% 11/22/27 (c) | | 1,300,000 | 1,159,269 |
| 3.803% 3/11/25 (c) | | 2,250,000 | 2,221,841 |
| 5.21% 8/11/28 (c) | | 2,827,000 | 2,758,591 |
| Huntington Bancshares, Inc.: | | | |
| 2.625% 8/6/24 | | 450,000 | 434,650 |
| 4.443% 8/4/28 (c) | | 2,261,000 | 2,126,897 |
| Huntington National Bank 5.699% 11/18/25 (c) | | 1,490,000 | 1,461,412 |
| JPMorgan Chase & Co.: | | | |
| 0.824% 6/1/25 (c) | | 63,000 | 60,497 |
| 1.47% 9/22/27 (c) | | 3,080,000 | 2,720,586 |
| 2.083% 4/22/26 (c) | | 500,000 | 470,292 |
| 2.58% 4/22/32 (c) | | 3,000,000 | 2,455,830 |
| 2.947% 2/24/28 (c) | | 3,318,000 | 3,045,736 |
| 3.54% 5/1/28 (c) | | 350,000 | 326,628 |
| 4.851% 7/25/28 (c) | | 3,750,000 | 3,674,824 |
| KeyBank NA 4.15% 8/8/25 | | 250,000 | 236,547 |
| KeyCorp 3.878% 5/23/25 (c) | | 177,000 | 168,897 |
| Lloyds Banking Group PLC 5.985% 8/7/27 (c) | | 901,000 | 900,078 |
| Mitsubishi UFJ Financial Group, Inc.: | | | |
| 0.848% 9/15/24 (c) | | 750,000 | 748,896 |
| 0.953% 7/19/25 (c) | | 750,000 | 716,790 |
| 1.64% 10/13/27 (c) | | 1,300,000 | 1,152,674 |
| Mizuho Financial Group, Inc.: | | | |
| 0.849% 9/8/24 (c) | | 500,000 | 499,828 |
| 1.234% 5/22/27 (c) | | 2,050,000 | 1,814,360 |
| 2.651% 5/22/26 (c) | | 500,000 | 470,926 |
| Morgan Stanley Bank, West Valley City Utah 4.754% 4/21/26 | | 1,062,000 | 1,048,247 |
| NatWest Group PLC: | | | |
| 1.642% 6/14/27 (c) | | 3,300,000 | 2,929,631 |
| 4.269% 3/22/25 (c) | | 200,000 | 197,744 |
| PNC Financial Services Group, Inc.: | | | |
| 3.5% 1/23/24 | | 200,000 | 197,840 |
| 5.354% 12/2/28 (c) | | 1,020,000 | 1,004,973 |
| Rabobank Nederland 1.98% 12/15/27 (b)(c) | | 3,050,000 | 2,691,895 |
| Santander Holdings U.S.A., Inc. 2.49% 1/6/28 (c) | | 773,000 | 677,755 |
| Societe Generale: | | | |
| 2.226% 1/21/26 (b)(c) | | 2,500,000 | 2,351,895 |
| 2.797% 1/19/28 (b)(c) | | 950,000 | 850,983 |
| Sumitomo Mitsui Financial Group, Inc.: | | | |
| 1.402% 9/17/26 | | 750,000 | 663,645 |
| 1.474% 7/8/25 | | 2,500,000 | 2,314,527 |
| 2.696% 7/16/24 | | 500,000 | 486,617 |
| The Toronto-Dominion Bank 2.8% 3/10/27 | | 64,000 | 58,706 |
| Truist Financial Corp. 4.26% 7/28/26 (c) | | 2,960,000 | 2,859,423 |
| Wells Fargo & Co.: | | | |
| 2.164% 2/11/26 (c) | | 750,000 | 709,099 |
| 2.188% 4/30/26 (c) | | 2,676,000 | 2,516,555 |
| 3.526% 3/24/28 (c) | | 3,288,000 | 3,059,230 |
| 4.808% 7/25/28 (c) | | 1,250,000 | 1,212,470 |
| | | | 88,037,822 |
| Capital Markets - 4.2% | | | |
| Deutsche Bank AG New York Branch: | | | |
| 2.129% 11/24/26 (c) | | 750,000 | 680,451 |
| 2.311% 11/16/27 (c) | | 3,300,000 | 2,893,325 |
| Goldman Sachs Group, Inc.: | | | |
| 1.757% 1/24/25 (c) | | 500,000 | 490,725 |
| 2.64% 2/24/28 (c) | | 2,563,000 | 2,319,545 |
| 4.482% 8/23/28 (c) | | 2,500,000 | 2,405,446 |
| Intercontinental Exchange, Inc.: | | | |
| 3.65% 5/23/25 | | 314,000 | 304,395 |
| 3.75% 9/21/28 | | 125,000 | 117,963 |
| 4% 9/15/27 | | 1,981,000 | 1,896,483 |
| 4.35% 6/15/29 | | 2,500,000 | 2,392,896 |
| Moody's Corp. 3.75% 3/24/25 | | 750,000 | 729,884 |
| Morgan Stanley: | | | |
| 0.79% 5/30/25 (c) | | 750,000 | 719,086 |
| 2.188% 4/28/26 (c) | | 750,000 | 706,836 |
| 2.239% 7/21/32 (c) | | 2,750,000 | 2,163,234 |
| 3.591% 7/22/28 (c) | | 1,050,000 | 971,378 |
| 4.679% 7/17/26 (c) | | 1,842,000 | 1,803,490 |
| S&P Global, Inc. 2.45% 3/1/27 | | 2,814,000 | 2,594,606 |
| UBS Group AG: | | | |
| 1.305% 2/2/27 (b)(c) | | 1,300,000 | 1,155,783 |
| 2.593% 9/11/25 (b)(c) | | 2,500,000 | 2,410,534 |
| 3.091% 5/14/32 (b)(c) | | 250,000 | 206,021 |
| 4.703% 8/5/27 (b)(c) | | 2,500,000 | 2,423,571 |
| 6.373% 7/15/26 (b)(c) | | 300,000 | 301,248 |
| | | | 29,686,900 |
| Consumer Finance - 1.2% | | | |
| AerCap Ireland Capital Ltd./AerCap Global Aviation Trust 2.45% 10/29/26 | | 700,000 | 629,823 |
| American Express Co.: | | | |
| 2.25% 3/4/25 | | 35,000 | 33,279 |
| 2.55% 3/4/27 | | 54,000 | 49,102 |
| Capital One Financial Corp.: | | | |
| 1.343% 12/6/24 (c) | | 850,000 | 837,804 |
| 1.878% 11/2/27 (c) | | 3,400,000 | 2,980,593 |
| 4.985% 7/24/26 (c) | | 2,701,000 | 2,640,042 |
| Hyundai Capital America 1% 9/17/24 (b) | | 74,000 | 70,340 |
| John Deere Capital Corp.: | | | |
| 3.4% 6/6/25 | | 252,000 | 244,253 |
| 4.75% 6/8/26 | | 804,000 | 800,004 |
| | | | 8,285,240 |
| Financial Services - 0.6% | | | |
| Athene Global Funding: | | | |
| 1.716% 1/7/25 (b) | | 600,000 | 561,999 |
| 1.73% 10/2/26 (b) | | 573,000 | 498,740 |
| Corebridge Financial, Inc.: | | | |
| 3.5% 4/4/25 | | 508,000 | 488,169 |
| 3.65% 4/5/27 | | 2,762,000 | 2,598,188 |
| | | | 4,147,096 |
| Insurance - 0.4% | | | |
| American International Group, Inc. 2.5% 6/30/25 | | 383,000 | 362,539 |
| Equitable Financial Life Global Funding: | | | |
| 1.1% 11/12/24 (b) | | 500,000 | 471,893 |
| 1.4% 8/27/27 (b) | | 700,000 | 595,409 |
| 1.7% 11/12/26 (b) | | 799,000 | 700,406 |
| MassMutual Global Funding II 4.15% 8/26/25 (b) | | 463,000 | 451,614 |
| RGA Global Funding 2% 11/30/26 (b) | | 30,000 | 26,693 |
| | | | 2,608,554 |
TOTAL FINANCIALS | | | 132,765,612 |
| HEALTH CARE - 0.4% | | | |
| Biotechnology - 0.0% | | | |
| Amgen, Inc. 5.15% 3/2/28 | | 378,000 | 377,605 |
| Health Care Providers & Services - 0.4% | | | |
| CVS Health Corp. 4.3% 3/25/28 | | 110,000 | 105,651 |
| Humana, Inc. 3.7% 3/23/29 | | 2,500,000 | 2,314,614 |
| UnitedHealth Group, Inc. 3.7% 5/15/27 | | 399,000 | 383,562 |
| | | | 2,803,827 |
TOTAL HEALTH CARE | | | 3,181,432 |
| INDUSTRIALS - 0.8% | | | |
| Aerospace & Defense - 0.1% | | | |
| RTX Corp. 3.95% 8/16/25 | | 116,000 | 112,776 |
| The Boeing Co.: | | | |
| 1.95% 2/1/24 | | 307,000 | 301,844 |
| 5.04% 5/1/27 | | 500,000 | 494,496 |
| | | | 909,116 |
| Ground Transportation - 0.2% | | | |
| Canadian Pacific Railway Co. 1.75% 12/2/26 | | 1,517,000 | 1,363,253 |
| Machinery - 0.1% | | | |
| Daimler Trucks Finance North America LLC 2% 12/14/26 (b) | | 500,000 | 449,478 |
| Parker Hannifin Corp. 4.25% 9/15/27 | | 217,000 | 210,506 |
| | | | 659,984 |
| Trading Companies & Distributors - 0.4% | | | |
| Air Lease Corp.: | | | |
| 2.2% 1/15/27 | | 2,530,000 | 2,260,801 |
| 3.25% 3/1/25 | | 97,000 | 92,833 |
| | | | 2,353,634 |
TOTAL INDUSTRIALS | | | 5,285,987 |
| INFORMATION TECHNOLOGY - 0.4% | | | |
| Software - 0.4% | | | |
| Roper Technologies, Inc.: | | | |
| 1% 9/15/25 | | 2,076,000 | 1,901,460 |
| 1.75% 2/15/31 | | 750,000 | 588,700 |
| | | | 2,490,160 |
| REAL ESTATE - 0.3% | | | |
| Equity Real Estate Investment Trusts (REITs) - 0.3% | | | |
| Ventas Realty LP 2.65% 1/15/25 | | 2,000,000 | 1,905,294 |
| UTILITIES - 1.1% | | | |
| Electric Utilities - 0.9% | | | |
| Alabama Power Co. 3.05% 3/15/32 | | 2,526,000 | 2,167,551 |
| Duke Energy Corp. 4.3% 3/15/28 | | 1,341,000 | 1,291,089 |
| Eversource Energy 0.8% 8/15/25 | | 43,000 | 39,252 |
| Exelon Corp. 2.75% 3/15/27 | | 1,006,000 | 923,320 |
| Georgia Power Co. 4.65% 5/16/28 | | 948,000 | 924,466 |
| Southern Co. 3.25% 7/1/26 | | 500,000 | 473,027 |
| Virginia Electric & Power Co. 2.4% 3/30/32 | | 500,000 | 402,909 |
| | | | 6,221,614 |
| Independent Power and Renewable Electricity Producers - 0.0% | | | |
| Constellation Energy Generation, LLC 3.25% 6/1/25 | | 178,000 | 170,376 |
| Multi-Utilities - 0.2% | | | |
| NiSource, Inc. 0.95% 8/15/25 | | 1,500,000 | 1,374,976 |
| Sempra 3.3% 4/1/25 | | 28,000 | 26,975 |
| | | | 1,401,951 |
TOTAL UTILITIES | | | 7,793,941 |
| TOTAL NONCONVERTIBLE BONDS (Cost $187,350,966) | | | 183,368,832 |
| | | | |
| U.S. Treasury Obligations - 60.9% |
| | | Principal Amount (a) | Value ($) |
| U.S. Treasury Notes: | | | |
| 0.75% 12/31/23 | | 8,521,000 | 8,389,191 |
| 2.5% 4/30/24 | | 11,749,900 | 11,528,212 |
| 2.625% 4/15/25 | | 12,839,100 | 12,358,637 |
| 2.75% 2/15/24 | | 8,435,800 | 8,334,307 |
| 2.75% 4/30/27 | | 16,773,900 | 15,832,334 |
| 2.75% 8/15/32 | | 7,291,700 | 6,545,155 |
| 2.875% 4/30/29 | | 19,656,500 | 18,295,134 |
| 3.125% 8/15/25 | | 30,934,800 | 29,928,211 |
| 3.375% 5/15/33 | | 4,000,000 | 3,768,125 |
| 3.5% 9/15/25 | | 2,560,600 | 2,493,984 |
| 3.5% 4/30/28 | | 23,000,000 | 22,229,905 |
| 3.625% 5/31/28 | | 13,000,000 | 12,643,516 |
| 3.625% 3/31/30 | | 5,000,000 | 4,829,688 |
| 3.75% 4/15/26 | | 38,000,000 | 37,179,141 |
| 3.875% 4/30/25 | | 5,000,000 | 4,909,180 |
| 3.875% 1/15/26 | | 12,900,000 | 12,656,109 |
| 3.875% 11/30/27 | | 15,500,000 | 15,215,430 |
| 4% 12/15/25 | | 18,200,000 | 17,905,672 |
| 4% 2/15/26 | | 11,900,000 | 11,712,203 |
| 4% 2/29/28 | | 15,000,000 | 14,815,430 |
| 4% 6/30/28 | | 7,000,000 | 6,916,328 |
| 4% 7/31/30 | | 2,000,000 | 1,976,250 |
| 4.125% 6/15/26 | | 22,000,000 | 21,745,625 |
| 4.125% 9/30/27 | | 7,162,000 | 7,095,696 |
| 4.125% 10/31/27 | | 50,177,900 | 49,709,434 |
| 4.125% 7/31/28 | | 7,000,000 | 6,958,984 |
| 4.375% 8/31/28 | | 14,000,000 | 14,086,406 |
| 4.5% 11/15/25 | | 21,200,000 | 21,070,813 |
| 4.5% 7/15/26 | | 24,000,000 | 23,956,875 |
| 4.625% 3/15/26 | | 2,155,800 | 2,154,200 |
| TOTAL U.S. TREASURY OBLIGATIONS (Cost $434,734,605) | | | 427,240,175 |
| | | | |
| U.S. Government Agency - Mortgage Securities - 2.2% |
| | | Principal Amount (a) | Value ($) |
| Fannie Mae - 1.6% | | | |
| 2% 2/1/28 to 3/1/32 | | 1,556,202 | 1,426,725 |
| 2.5% 1/1/28 to 11/1/36 | | 2,033,683 | 1,884,049 |
| 3% 2/1/31 to 12/1/36 | | 5,641,390 | 5,240,893 |
| 3.5% 12/1/28 to 2/1/33 | | 863,886 | 834,600 |
| 1.5% 1/1/32 | | 2,315,093 | 2,079,137 |
TOTAL FANNIE MAE | | | 11,465,404 |
| Freddie Mac - 0.6% | | | |
| 2.5% 1/1/28 to 3/1/32 | | 2,329,915 | 2,163,273 |
| 3% 12/1/30 to 10/1/35 | | 2,057,093 | 1,936,147 |
TOTAL FREDDIE MAC | | | 4,099,420 |
| TOTAL U.S. GOVERNMENT AGENCY - MORTGAGE SECURITIES (Cost $15,891,630) | | | 15,564,824 |
| | | | |
| Asset-Backed Securities - 5.6% |
| | | Principal Amount (a) | Value ($) |
| American Express Credit Account Master Trust: | | | |
| Series 2021-1 Class A, 0.9% 11/15/26 | | 100,000 | 94,593 |
| Series 2022-2 Class A, 3.39% 5/15/27 | | 600,000 | 580,409 |
| Series 2022-3 Class A, 3.75% 8/15/27 | | 3,570,000 | 3,467,274 |
| Series 2022-4 Class A, 4.95% 10/15/27 | | 1,122,000 | 1,114,179 |
| Series 2023-1 Class A, 4.87% 5/15/28 | | 1,003,000 | 997,201 |
| Bank of America Credit Card Master Trust: | | | |
| Series 2021-A1 Class A1, 0.44% 9/15/26 | | 37,000 | 35,815 |
| Series 2022-A1 Class A1, 3.53% 11/15/27 | | 2,624,000 | 2,541,896 |
| Series 2022-A2, Class A2, 5% 4/15/28 | | 1,294,000 | 1,288,571 |
| Series 2023-A1 Class A1, 4.79% 5/15/28 | | 729,000 | 722,825 |
| Bmw Vechile Owner Trust 2023-A Series 2023-A Class A3, 5.47% 2/25/28 | | 272,000 | 272,874 |
| Capital One Multi-Asset Execution Trust: | | | |
| Series 2021-A3 Class A3, 1.04% 11/15/26 | | 97,000 | 91,951 |
| Series 2022-A1 Class A1, 2.8% 3/15/27 | | 148,000 | 142,195 |
| Series 2022-A2 Class A, 3.49% 5/15/27 | | 5,671,000 | 5,497,596 |
| Series 2022-A3 Class A, 4.95% 10/15/27 | | 1,603,000 | 1,591,403 |
| Carmax Auto Owner Trust Series 2023 2 Class A3, 5.05% 1/18/28 | | 1,732,000 | 1,719,570 |
| Carmx 2023-3 A3 Series 2023-3 Class A3, 5.28% 5/15/28 | | 1,274,000 | 1,273,408 |
| Chase Issuance Trust Series 2022-A1 Class A, 3.97% 9/15/27 | | 560,000 | 546,174 |
| Dell Equipment Finance Trust 2023-2 Series 2023-2 Class A3, 5.65% 1/22/29 (b) | | 578,000 | 579,665 |
| Discover Card Execution Note Trust: | | | |
| Series 2022-A1 Class A1, 1.96% 2/15/27 | | 49,000 | 46,623 |
| Series 2022-A2 Class A, 3.32% 5/15/27 | | 540,000 | 521,441 |
| Series 2022-A3 Class A3, 3.56% 7/15/27 | | 2,540,000 | 2,458,430 |
| Series 2022-A4, Class A, 5.03% 10/15/27 | | 1,613,000 | 1,605,949 |
| Dllaa 2023-1A Series 2023-1A Class A3, 5.64% 2/22/28 (b) | | 146,000 | 146,589 |
| Ford Credit Auto Owner Trust: | | | |
| Series 2019-1 Class A, 3.52% 7/15/30 (b) | | 320,000 | 317,058 |
| Series 2021-A Class A3, 0.3% 8/15/25 | | 196,703 | 192,491 |
| Ford Credit Auto Owner Trust 2 Series 2023-B Class A3, 5.23% 5/15/28 | | 1,127,000 | 1,126,389 |
| Ford Credit Floorplan Master Owner Trust Series 2023-1 Class A1, 4.92% 5/15/28 (b) | | 1,171,000 | 1,156,975 |
| GM Financial Automobile Leasing Series 2023-2 Class A3, 5.05% 7/20/26 | | 1,165,000 | 1,155,786 |
| GM Financial Consumer Automobile Re Series 2023 2 Class A3, 4.47% 2/16/28 | | 440,000 | 432,557 |
| Gm Financial Consumer Automobile Re Series 2023-3 Class A3, 5.45% 6/16/28 | | 312,000 | 313,668 |
| Gm Financial Leasing Trust 202 Series 2023-3 Class A3, 5.38% 11/20/26 | | 147,000 | 146,927 |
| GMF Floorplan Owner Revolving Trust Series 2023-1 Class A1, 5.34% 6/15/28 (b) | | 1,660,000 | 1,657,872 |
| Honda Auto Receivables Owner Trust Series 2021-1 Class A3, 0.27% 4/21/25 | | 263,492 | 258,555 |
| Hyundai Auto Receivables Trust: | | | |
| Series 2023 A Class A3, 4.58% 4/15/27 | | 533,000 | 526,233 |
| Series 2023-B Class A3, 5.48% 4/17/28 | | 314,000 | 315,587 |
| Verizon Master Trust: | | | |
| Series 2021-1 Class A, 0.5% 5/20/27 | | 59,000 | 56,774 |
| Series 2021-2 Class A, 0.99% 4/20/28 | | 90,000 | 85,305 |
| Series 2022-5 Class A1A, 3.72% 7/20/27 | | 277,000 | 274,689 |
| Series 2023 2 Class A, 4.89% 4/13/28 | | 1,342,000 | 1,329,009 |
| Series 2023-4 Class A1A, 5.16% 6/20/29 | | 1,806,000 | 1,804,659 |
| Volkswagen Auto Loan Enhanced Series 2023-1 Class A3, 5.02% 6/20/28 | | 823,000 | 819,357 |
| World Omni Auto Receivables Trust Series 2023-C Class A3, 5.15% 11/15/28 | | 181,000 | 180,705 |
| TOTAL ASSET-BACKED SECURITIES (Cost $39,947,297) | | | 39,487,227 |
| | | | |
| Collateralized Mortgage Obligations - 0.8% |
| | | Principal Amount (a) | Value ($) |
| Private Sponsor - 0.0% | | | |
| CSAIL Commercial Mortgage Trust Series 2015-C2 Class ASB, 3.2241% 6/15/57 | | 363,036 | 354,710 |
| U.S. Government Agency - 0.8% | | | |
| Fannie Mae Series 2022-28 Class A, 2.5% 2/25/52 | | 441,980 | 399,420 |
| Freddie Mac: | | | |
| Series 2020-5000 Class BA, 2% 4/25/45 | | 633,015 | 553,107 |
| Series 2022-5236: | | | |
Class HP, 4.5% 12/25/42 | | 2,706,038 | 2,641,556 |
Class P, 5% 4/25/48 | | 1,676,693 | 1,647,729 |
| Series 2022-5266 Class CD, 4.5% 10/25/44 | | 358,571 | 347,678 |
TOTAL U.S. GOVERNMENT AGENCY | | | 5,589,490 |
| TOTAL COLLATERALIZED MORTGAGE OBLIGATIONS (Cost $6,008,276) | | | 5,944,200 |
| | | | |
| Commercial Mortgage Securities - 2.4% |
| | | Principal Amount (a) | Value ($) |
| BANK sequential payer Series 2017-BNK9 Class ASB, 3.47% 11/15/54 | | 2,875,144 | 2,727,765 |
| BX Commercial Mortgage Trust floater: | | | |
| Series 2021-PAC Class A, CME Term SOFR 1 Month Index + 0.800% 6.1136% 10/15/36 (b)(c)(d) | | 100,000 | 97,678 |
| Series 2022-LP2 Class A, CME Term SOFR 1 Month Index + 1.010% 6.3234% 2/15/39 (b)(c)(d) | | 81,007 | 78,772 |
| BX Trust: | | | |
| floater: | | | |
Series 2021-ACNT Class A, CME Term SOFR 1 Month Index + 0.960% 6.2745% 11/15/38 (b)(c)(d) | | 100,000 | 98,150 |
Series 2021-BXMF Class A, CME Term SOFR 1 Month Index + 0.750% 6.0604% 10/15/26 (b)(c)(d) | | 100,000 | 97,710 |
Series 2022-GPA Class A, CME Term SOFR 1 Month Index + 2.160% 7.4755% 8/15/39 (b)(c)(d) | | 17,000 | 17,000 |
| floater sequential payer Series 2019-XL Class A, CME Term SOFR 1 Month Index + 1.030% 6.345% 10/15/36 (b)(c)(d) | | 1,303,871 | 1,300,572 |
| CD Mortgage Trust sequential payer Series 2017-CD5 Class AAB, 3.22% 8/15/50 | | 549,330 | 520,872 |
| Credit Suisse Mortgage Trust floater Series 2019-ICE4 Class A, CME Term SOFR 1 Month Index + 1.020% 6.338% 5/15/36 (b)(c)(d) | | 3,112,257 | 3,108,692 |
| CSAIL Commercial Mortgage Trust Series 2017-CX9 Class A2, 3.0538% 9/15/50 | | 5,239 | 5,224 |
| ELP Commercial Mortgage Trust floater Series 2021-ELP Class A, CME Term SOFR 1 Month Index + 0.810% 6.1265% 11/15/38 (b)(c)(d) | | 770,000 | 753,575 |
| GS Mortgage Securities Trust sequential payer: | | | |
| Series 2015-GC28 Class AAB, 3.206% 2/10/48 | | 60,502 | 59,401 |
| Series 2015-GC32 Class AAB, 3.513% 7/10/48 | | 219,334 | 213,817 |
| Series 2016-GS2 Class AAB, 2.922% 5/10/49 | | 529,835 | 508,412 |
| Series 2017-GS7 Class AAB, 3.203% 8/10/50 | | 2,116,374 | 1,997,664 |
| JPMorgan Chase Commercial Mortgage Securities Trust sequential payer Series 2019-COR4 Class ASB, 3.9381% 3/10/52 | | 1,000,000 | 954,577 |
| Life Financial Services Trust floater Series 2022-BMR2 Class A1, CME Term SOFR 1 Month Index + 1.290% 6.6057% 5/15/39 (b)(c)(d) | | 445,000 | 437,207 |
| MSCCG Trust floater Series 2018-SELF Class A, CME Term SOFR 1 Month Index + 0.940% 6.258% 10/15/37 (b)(c)(d) | | 1,919,130 | 1,910,029 |
| SREIT Trust floater Series 2021-MFP Class A, CME Term SOFR 1 Month Index + 0.840% 6.1558% 11/15/38 (b)(c)(d) | | 200,000 | 195,985 |
| Wells Fargo Commercial Mortgage Trust sequential payer: | | | |
| Series 2015-C27 Class ASB, 3.278% 2/15/48 | | 217,018 | 211,566 |
| Series 2019-C50 Class ASB, 3.635% 5/15/52 | | 1,000,000 | 945,769 |
| WF-RBS Commercial Mortgage Trust sequential payer Series 2014-C20 Class ASB, 3.638% 5/15/47 | | 261,984 | 259,523 |
| TOTAL COMMERCIAL MORTGAGE SECURITIES (Cost $16,592,775) | | | 16,499,960 |
| | | | |
| Money Market Funds - 1.2% |
| | | Shares | Value ($) |
Fidelity Cash Central Fund 5.43% (e) (Cost $8,051,408) | | 8,049,799 | 8,051,408 |
| | | | |
| TOTAL INVESTMENT IN SECURITIES - 99.3% (Cost $708,576,957) | 696,156,626 |
NET OTHER ASSETS (LIABILITIES) - 0.7% | 5,042,544 |
| NET ASSETS - 100.0% | 701,199,170 |
| | |
Legend
| (a) | Amount is stated in United States dollars unless otherwise noted. |
| (b) | Security exempt from registration under Rule 144A of the Securities Act of 1933. These securities may be resold in transactions exempt from registration, normally to qualified institutional buyers. At the end of the period, the value of these securities amounted to $39,075,602 or 5.6% of net assets. |
| (c) | Coupon rates for floating and adjustable rate securities reflect the rates in effect at period end. |
| (d) | Coupon is indexed to a floating interest rate which may be multiplied by a specified factor and/or subject to caps or floors. |
| (e) | Affiliated fund that is generally available only to investment companies and other accounts managed by Fidelity Investments. The rate quoted is the annualized seven-day yield of the fund at period end. A complete unaudited listing of the fund's holdings as of its most recent quarter end is available upon request. In addition, each Fidelity Central Fund's financial statements, which are not covered by the Fund's Report of Independent Registered Public Accounting Firm, are available on the SEC's website or upon request. |
Affiliated Central Funds
Fiscal year to date information regarding the Fund's investments in Fidelity Central Funds, including the ownership percentage, is presented below.
| Affiliate | Value, beginning of period ($) | Purchases ($) | Sales Proceeds ($) | Dividend Income ($) | Realized Gain (loss) ($) | Change in Unrealized appreciation (depreciation) ($) | Value, end of period ($) | % ownership, end of period |
| Fidelity Cash Central Fund 5.43% | 4,178,473 | 567,970,450 | 564,097,515 | 257,610 | - | - | 8,051,408 | 0.0% |
| Total | 4,178,473 | 567,970,450 | 564,097,515 | 257,610 | - | - | 8,051,408 | |
| | | | | | | | | |
Amounts in the dividend income column in the above table include any capital gain distributions from underlying funds, which are presented in the corresponding line item in the Statement of Operations, if applicable.
Amounts included in the purchases and sales proceeds columns may include in-kind transactions, if applicable.
Investment Valuation
The following is a summary of the inputs used, as of August 31, 2023, involving the Fund's assets and liabilities carried at fair value. The inputs or methodology used for valuing securities may not be an indication of the risk associated with investing in those securities. For more information on valuation inputs, and their aggregation into the levels used below, please refer to the Investment Valuation section in the accompanying Notes to Financial Statements.
| Valuation Inputs at Reporting Date: |
| Description | Total ($) | Level 1 ($) | Level 2 ($) | Level 3 ($) |
Investments in Securities: | | | | |
|
| Corporate Bonds | 183,368,832 | - | 183,368,832 | - |
|
| U.S. Government and Government Agency Obligations | 427,240,175 | - | 427,240,175 | - |
|
| U.S. Government Agency - Mortgage Securities | 15,564,824 | - | 15,564,824 | - |
|
| Asset-Backed Securities | 39,487,227 | - | 39,487,227 | - |
|
| Collateralized Mortgage Obligations | 5,944,200 | - | 5,944,200 | - |
|
| Commercial Mortgage Securities | 16,499,960 | - | 16,499,960 | - |
|
| Money Market Funds | 8,051,408 | 8,051,408 | - | - |
| Total Investments in Securities: | 696,156,626 | 8,051,408 | 688,105,218 | - |
| Statement of Assets and Liabilities |
| | | | August 31, 2023 |
| | | | | |
| Assets | | | | |
| Investment in securities, at value - See accompanying schedule: | | | | |
Unaffiliated issuers (cost $700,525,549) | $ | 688,105,218 | | |
Fidelity Central Funds (cost $8,051,408) | | 8,051,408 | | |
| | | | | |
| | | | | |
| Total Investment in Securities (cost $708,576,957) | | | $ | 696,156,626 |
| Receivable for investments sold | | | | 15,451,997 |
| Interest receivable | | | | 5,645,993 |
| Distributions receivable from Fidelity Central Funds | | | | 9,953 |
Total assets | | | | 717,264,569 |
| Liabilities | | | | |
| Payable for investments purchased | $ | 16,065,349 | | |
| Other payables and accrued expenses | | 50 | | |
| Total Liabilities | | | | 16,065,399 |
| Net Assets | | | $ | 701,199,170 |
| Net Assets consist of: | | | | |
| Paid in capital | | | $ | 722,608,558 |
| Total accumulated earnings (loss) | | | | (21,409,388) |
| Net Assets | | | $ | 701,199,170 |
Net Asset Value, offering price and redemption price per share ($701,199,170 ÷ 77,866,590 shares) | | | $ | 9.01 |
| Statement of Operations |
| | | | Year ended August 31, 2023 |
| Investment Income | | | | |
| Interest | | | $ | 27,257,801 |
| Income from Fidelity Central Funds | | | | 257,610 |
| Total Income | | | | 27,515,411 |
| Expenses | | | | |
| Independent trustees' fees and expenses | $ | 2,217 | | |
| Miscellaneous | | 4 | | |
| Total expenses before reductions | | 2,221 | | |
| Expense reductions | | (393) | | |
| Total expenses after reductions | | | | 1,828 |
| Net Investment income (loss) | | | | 27,513,583 |
| Realized and Unrealized Gain (Loss) | | | | |
| Net realized gain (loss) on: | | | | |
| Investment Securities: | | | | |
| Unaffiliated issuers | | (8,216,622) | | |
| Total net realized gain (loss) | | | | (8,216,622) |
| Change in net unrealized appreciation (depreciation) on investment securities | | | | (8,068,082) |
| Net gain (loss) | | | | (16,284,704) |
| Net increase (decrease) in net assets resulting from operations | | | $ | 11,228,879 |
| Statement of Changes in Net Assets |
| |
| | Year ended August 31, 2023 | | Year ended August 31, 2022 |
| Increase (Decrease) in Net Assets | | | | |
| Operations | | | | |
| Net investment income (loss) | $ | 27,513,583 | $ | 2,283,639 |
| Net realized gain (loss) | | (8,216,622) | | (775,412) |
| Change in net unrealized appreciation (depreciation) | | (8,068,082) | | (4,473,970) |
| Net increase (decrease) in net assets resulting from operations | | 11,228,879 | | (2,965,743) |
| Distributions to shareholders | | (27,485,070) | | (2,334,309) |
| | | | | |
| Share transactions | | | | |
| Proceeds from sales of shares | | 533,352,501 | | 210,735,306 |
| Reinvestment of distributions | | 27,485,070 | | 2,334,309 |
| Cost of shares redeemed | | (74,140,000) | | (7,950,228) |
| | | | | |
Net increase (decrease) in net assets resulting from share transactions | | 486,697,571 | | 205,119,387 |
| Total increase (decrease) in net assets | | 470,441,380 | | 199,819,335 |
| | | | | |
| Net Assets | | | | |
| Beginning of period | | 230,757,790 | | 30,938,455 |
| End of period | $ | 701,199,170 | $ | 230,757,790 |
| | | | | |
| Other Information | | | | |
| Shares | | | | |
| Sold | | 58,077,352 | | 22,461,551 |
| Issued in reinvestment of distributions | | 3,028,822 | | 248,508 |
| Redeemed | | (8,186,955) | | (842,446) |
| Net increase (decrease) | | 52,919,219 | | 21,867,613 |
| | | | | |
Financial Highlights
| Fidelity® Education Income Fund |
| |
| Years ended August 31, | | 2023 | | 2022 | | 2021 A |
Selected Per-Share Data | | | | | | |
| Net asset value, beginning of period | $ | 9.25 | $ | 10.05 | $ | 10.00 |
| Income from Investment Operations | | | | | | |
Net investment income (loss) B,C | | .360 | | .224 | | .036 |
| Net realized and unrealized gain (loss) | | (.240) | | (.858) | | .052 |
| Total from investment operations | | .120 | | (.634) | | .088 |
| Distributions from net investment income | | (.360) | | (.153) | | (.038) |
| Distributions from net realized gain | | - | | (.013) | | - |
| Total distributions | | (.360) | | (.166) | | (.038) |
| Net asset value, end of period | $ | 9.01 | $ | 9.25 | $ | 10.05 |
Total Return D,E | | 1.34% | | (6.34)% | | .89% |
Ratios to Average Net Assets C,F,G | | | | | | |
Expenses before reductions H | | -% | | -% | | -% I |
Expenses net of fee waivers, if any H | | -% | | -% | | -% I |
Expenses net of all reductions H | | -% | | -% | | -% I |
| Net investment income (loss) | | 3.95% | | 2.40% | | .79% I |
| Supplemental Data | | | | | | |
| Net assets, end of period (000 omitted) | $ | 701,199 | $ | 230,758 | $ | 30,938 |
Portfolio turnover rate J | | 73% | | 80% | | 87% K,L |
AFor the period March 16, 2021 (commencement of operations) through August 31, 2021.
BCalculated based on average shares outstanding during the period.
CNet investment income (loss) is affected by the timing of the declaration of dividends by any underlying mutual funds or exchange-traded funds (ETFs). Net investment income (loss) of any mutual funds or ETFs is not included in the Fund's net investment income (loss) ratio.
DTotal returns for periods of less than one year are not annualized.
ETotal returns would have been lower if certain expenses had not been reduced during the applicable periods shown.
FFees and expenses of any underlying mutual funds or exchange-traded funds (ETFs) are not included in the Fund's expense ratio. The Fund indirectly bears its proportionate share of these expenses. For additional expense information related to investments in Fidelity Central Funds, please refer to the "Investments in Fidelity Central Funds" note found in the Notes to Financial Statements section of the most recent Annual or Semi-Annual report.
GExpense ratios reflect operating expenses of the class. Expenses before reductions do not reflect amounts reimbursed, waived, or reduced through arrangements with the investment adviser, brokerage services, or other offset arrangements, if applicable, and do not represent the amount paid by the class during periods when reimbursements, waivers or reductions occur.
HAmount represents less than .005%.
IAnnualized.
JAmount does not include the portfolio activity of any underlying mutual funds or exchange-traded funds (ETFs).
KPortfolio turnover rate excludes securities received or delivered in-kind.
LAmount not annualized.
For the period ended August 31, 2023
1.Organization.
Fidelity Education Income Fund (the Fund) is a fund of Fidelity Garrison Street Trust (the Trust) and is authorized to issue an unlimited number of shares. The Trust is registered under the Investment Company Act of 1940, as amended (the 1940 Act), as an open-end management investment company organized as a Massachusetts business trust. Shares are offered only to Fidelity managed 529 plans.
2. Investments in Fidelity Central Funds.
Funds may invest in Fidelity Central Funds, which are open-end investment companies generally available only to other investment companies and accounts managed by the investment adviser and its affiliates. The Schedule of Investments lists any Fidelity Central Funds held as an investment as of period end, but does not include the underlying holdings of each Fidelity Central Fund. An investing fund indirectly bears its proportionate share of the expenses of the underlying Fidelity Central Funds.
Based on its investment objective, each Fidelity Central Fund may invest or participate in various investment vehicles or strategies that are similar to those of the investing fund. These strategies are consistent with the investment objectives of the investing fund and may involve certain economic risks which may cause a decline in value of each of the Fidelity Central Funds and thus a decline in the value of the investing fund.
| Fidelity Central Fund | Investment Manager | Investment Objective | Investment Practices | Expense RatioA |
| Fidelity Money Market Central Funds | Fidelity Management & Research Company LLC (FMR) | Each fund seeks to obtain a high level of current income consistent with the preservation of capital and liquidity. | Short-term Investments | Less than .005% |
A Expenses expressed as a percentage of average net assets and are as of each underlying Central Fund's most recent annual or semi-annual shareholder report.
A complete unaudited list of holdings for each Fidelity Central Fund is available upon request or at the Securities and Exchange Commission website at www.sec.gov. In addition, the financial statements of the Fidelity Central Funds which contain the significant accounting policies (including investment valuation policies) of those funds, and are not covered by the Report of Independent Registered Public Accounting Firm, are available on the Securities and Exchange Commission website or upon request.
3. Significant Accounting Policies.
The Fund is an investment company and applies the accounting and reporting guidance of the Financial Accounting Standards Board (FASB) Accounting Standards Codification Topic 946 Financial Services - Investment Companies. The financial statements have been prepared in conformity with accounting principles generally accepted in the United States of America (GAAP), which require management to make certain estimates and assumptions at the date of the financial statements. Actual results could differ from those estimates. Subsequent events, if any, through the date that the financial statements were issued have been evaluated in the preparation of the financial statements. The Fund's Schedule of Investments lists any underlying mutual funds or exchange-traded funds (ETFs) but does not include the underlying holdings of these funds. The following summarizes the significant accounting policies of the Fund:
Investment Valuation. Investments are valued as of 4:00 p.m. Eastern time on the last calendar day of the period. The Board of Trustees (the Board) has designated the Fund's investment adviser as the valuation designee responsible for the fair valuation function and performing fair value determinations as needed. The investment adviser has established a Fair Value Committee (the Committee) to carry out the day-to-day fair valuation responsibilities and has adopted policies and procedures to govern the fair valuation process and the activities of the Committee. In accordance with these fair valuation policies and procedures, which have been approved by the Board, the Fund attempts to obtain prices from one or more third party pricing services or brokers to value its investments. When current market prices, quotations or currency exchange rates are not readily available or reliable, investments will be fair valued in good faith by the Committee, in accordance with the policies and procedures. Factors used in determining fair value vary by investment type and may include market or investment specific events, transaction data, estimated cash flows, and market observations of comparable investments. The frequency that the fair valuation procedures are used cannot be predicted and they may be utilized to a significant extent. The Committee manages the Fund's fair valuation practices and maintains the fair valuation policies and procedures. The Fund's investment adviser reports to the Board information regarding the fair valuation process and related material matters.
The Fund categorizes the inputs to valuation techniques used to value its investments into a disclosure hierarchy consisting of three levels as shown below:
Level 1 - unadjusted quoted prices in active markets for identical investments
Level 2 - other significant observable inputs (including quoted prices for similar investments, interest rates, prepayment speeds, etc.)
Level 3 - unobservable inputs (including the Fund's own assumptions based on the best information available)
Valuation techniques used to value the Fund's investments by major category are as follows:
Debt securities, including restricted securities, are valued based on evaluated prices received from third party pricing services or from brokers who make markets in such securities. Corporate bonds, U.S. government and government agency obligations are valued by pricing services who utilize matrix pricing which considers yield or price of bonds of comparable quality, coupon, maturity and type or by broker-supplied prices. Asset backed securities, collateralized mortgage obligations, commercial mortgage securities and U.S. government agency mortgage securities are valued by pricing services who utilize matrix pricing which considers prepayment speed assumptions, attributes of the collateral, yield or price of bonds of comparable quality, coupon, maturity and type or by broker-supplied prices. When independent prices are unavailable or unreliable, debt securities may be valued utilizing pricing methodologies which consider similar factors that would be used by third party pricing services. Debt securities are generally categorized as Level 2 in the hierarchy but may be Level 3 depending on the circumstances.
Investments in open-end mutual funds, including the Fidelity Central Funds, are valued at their closing net asset value (NAV) each business day and are categorized as Level 1 in the hierarchy.
Changes in valuation techniques may result in transfers in or out of an assigned level within the disclosure hierarchy. The aggregate value of investments by input level as of August 31, 2023 is included at the end of the Fund's Schedule of Investments.
Investment Transactions and Income. For financial reporting purposes, the Fund's investment holdings and NAV include trades executed through the end of the last business day of the period. The NAV per share for processing shareholder transactions is calculated as of the close of business of the New York Stock Exchange (NYSE), normally 4:00 p.m. Eastern time and includes trades executed through the end of the prior business day. Gains and losses on securities sold are determined on the basis of identified cost. Income and capital gain distributions from Fidelity Central Funds, if any, are recorded on the ex-dividend date. Interest income is accrued as earned and includes coupon interest and amortization of premium and accretion of discount on debt securities as applicable.
Expenses. Expenses directly attributable to a fund are charged to that fund. Expenses attributable to more than one fund are allocated among the respective funds on the basis of relative net assets or other appropriate methods. Expenses included in the accompanying financial statements reflect the expenses of that fund and do not include any expenses associated with any underlying mutual funds or exchange-traded funds. Although not included in a fund's expenses, a fund indirectly bears its proportionate share of these expenses through the net asset value of each underlying mutual fund or exchange-traded fund. Expense estimates are accrued in the period to which they relate and adjustments are made when actual amounts are known.
Income Tax Information and Distributions to Shareholders. Each year, the Fund intends to qualify as a regulated investment company under Subchapter M of the Internal Revenue Code, including distributing substantially all of its taxable income and realized gains. As a result, no provision for U.S. Federal income taxes is required. As of August 31, 2023, the Fund did not have any unrecognized tax benefits in the financial statements; nor is the Fund aware of any tax positions for which it is reasonably possible that the total amounts of unrecognized tax benefits will significantly change in the next twelve months. The Fund files a U.S. federal tax return, in addition to state and local tax returns as required. The Fund's federal income tax returns are subject to examination by the Internal Revenue Service (IRS) for a period of three fiscal years after they are filed. State and local tax returns may be subject to examination for an additional fiscal year depending on the jurisdiction.
Distributions are declared and recorded daily and paid monthly from net investment income. Distributions from realized gains, if any, are declared and recorded on the ex-dividend date. Income and capital gain distributions are determined in accordance with income tax regulations, which may differ from GAAP.
Capital accounts within the financial statements are adjusted for permanent book-tax differences. These adjustments have no impact on net assets or the results of operations. Capital accounts are not adjusted for temporary book-tax differences which will reverse in a subsequent period.
Book-tax differences are primarily due to capital loss carryforwards and losses deferred due to wash sales.
As of period end, the cost and unrealized appreciation (depreciation) in securities, and derivatives if applicable, for federal income tax purposes were as follows:
| Gross unrealized appreciation | $184,368 |
| Gross unrealized depreciation | (12,649,843) |
| Net unrealized appreciation (depreciation) | $(12,465,475) |
| Tax Cost | $708,622,101 |
The tax-based components of distributable earnings as of period end were as follows:
| Undistributed ordinary income | $1,554 |
| Capital loss carryforward | $(8,945,467) |
| Net unrealized appreciation (depreciation) on securities and other investments | $(12,465,475) |
Capital loss carryforwards are only available to offset future capital gains of the Fund to the extent provided by regulations and may be limited. The capital loss carryforward information presented below, including any applicable limitation, is estimated as of fiscal period end and is subject to adjustment.
Short-term | $(7,895,194) |
Long-term | (1,050,273) |
| Total capital loss carryforward | $(8,945,467) |
The tax character of distributions paid was as follows:
| | August 31, 2023 | August 31, 2022 |
| | | |
| Ordinary Income | $27,485,070 | $ 2,334,309 |
Restricted Securities (including Private Placements). Funds may invest in securities that are subject to legal or contractual restrictions on resale. These securities generally may be resold in transactions exempt from registration or to the public if the securities are registered. Disposal of these securities may involve time-consuming negotiations and expense, and prompt sale at an acceptable price may be difficult. Information regarding restricted securities held at period end is included at the end of the Schedule of Investments, if applicable.
4. Purchases and Sales of Investments.
Purchases and sales of securities, other than short-term securities, U.S. government securities and in-kind transactions, as applicable, are noted in the table below.
| | Purchases ($) | Sales ($) |
| Fidelity Education Income Fund | 167,909,052 | 11,856,488 |
5. Fees and Other Transactions with Affiliates.
Management Fee. Fidelity Management & Research Company LLC (the investment adviser) and its affiliates provide the Fund with investment management related services and the Fund does not pay any fees for these services. Under the management contract, the investment adviser or an affiliate pays all other expenses of the Fund, excluding fees and expenses of the independent Trustees, and certain miscellaneous expenses such as proxy and shareholder meeting expenses.
Interfund Trades. Funds may purchase from or sell securities to other Fidelity Funds under procedures adopted by the Board. The procedures have been designed to ensure these interfund trades are executed in accordance with Rule 17a-7 of the 1940 Act. Any interfund trades are included within the respective purchases and sales amounts shown in the Purchases and Sales of Investments note. During the period, there were no interfund trades.
6. Committed Line of Credit.
Certain Funds participate with other funds managed by the investment adviser or an affiliate in a $4.25 billion credit facility (the "line of credit") to be utilized for temporary or emergency purposes to fund shareholder redemptions or for other short-term liquidity purposes. The commitment fees on the pro-rata portion of the line of credit are borne by the investment adviser. During the period, there were no borrowings on this line of credit.
7. Expense Reductions.
Through arrangements with the Fund's custodian, credits realized as a result of certain uninvested cash balances were used to reduce the Fund's expenses by $393.
8. Other.
A fund's organizational documents provide former and current trustees and officers with a limited indemnification against liabilities arising in connection with the performance of their duties to the fund. In the normal course of business, a fund may also enter into contracts that provide general indemnifications. A fund's maximum exposure under these arrangements is unknown as this would be dependent on future claims that may be made against a fund. The risk of material loss from such claims is considered remote.
At the end of the period, accounts managed by the investment adviser or its affiliates were the owners of record of all of the outstanding shares of the Fund.
9. Risk and Uncertainties.
Many factors affect a fund's performance. Developments that disrupt global economies and financial markets, such as pandemics, epidemics, outbreaks of infectious diseases, war, terrorism, and environmental disasters, may significantly affect a fund's investment performance. The effects of these developments to a fund will be impacted by the types of securities in which a fund invests, the financial condition, industry, economic sector, and geographic location of an issuer, and a fund's level of investment in the securities of that issuer. Significant concentrations in security types, issuers, industries, sectors, and geographic locations may magnify the factors that affect a fund's performance.
To the Board of Trustees of Fidelity Garrison Street Trust and the Shareholders of Fidelity Education Income Fund:
Opinion on the Financial Statements and Financial Highlights
We have audited the accompanying statement of assets and liabilities of Fidelity Education Income Fund (the "Fund"), a fund of Fidelity Garrison Street Trust, including the schedule of investments, as of August 31, 2023, the related statement of operations for the year then ended, the statement of changes in net assets for each of the two years in the period then ended, the financial highlights for each of the two years in the period then ended and for the period from March 16, 2021 (commencement of operations) through August 31, 2021, and the related notes. In our opinion, the financial statements and financial highlights present fairly, in all material respects, the financial position of the Fund as of August 31, 2023, and the results of its operations for the year then ended, the changes in its net assets for each of the two years in the period then ended, and the financial highlights for each of the two years in the period then ended and for the period from March 16, 2021 (commencement of operations) through August 31,2021, in conformity with accounting principles generally accepted in the United States of America.
Basis for Opinion
These financial statements and financial highlights are the responsibility of the Fund's management. Our responsibility is to express an opinion on the Fund's financial statements and financial highlights based on our audits. We are a public accounting firm registered with the Public Company Accounting Oversight Board (United States) (PCAOB) and are required to be independent with respect to the Fund in accordance with the U.S. federal securities laws and the applicable rules and regulations of the Securities and Exchange Commission and the PCAOB.
We conducted our audits in accordance with the standards of the PCAOB. Those standards require that we plan and perform the audit to obtain reasonable assurance about whether the financial statements and financial highlights are free of material misstatement, whether due to error or fraud. The Fund is not required to have, nor were we engaged to perform, an audit of its internal control over financial reporting. As part of our audits we are required to obtain an understanding of internal control over financial reporting but not for the purpose of expressing an opinion on the effectiveness of the Fund's internal control over financial reporting. Accordingly, we express no such opinion.
Our audits included performing procedures to assess the risks of material misstatement of the financial statements and financial highlights, whether due to error or fraud, and performing procedures that respond to those risks. Such procedures included examining, on a test basis, evidence regarding the amounts and disclosures in the financial statements and financial highlights. Our audits also included evaluating the accounting principles used and significant estimates made by management, as well as evaluating the overall presentation of the financial statements and financial highlights. Our procedures included confirmation of securities owned as of August 31, 2023, by correspondence with the custodian and brokers; when replies were not received from brokers, we performed other auditing procedures. We believe that our audits provide a reasonable basis for our opinion.
/s/ Deloitte & Touche LLP
Boston, Massachusetts
October 11, 2023
We have served as the auditor of one or more of the Fidelity investment companies since 1999.
The Trustees, Members of the Advisory Board (if any), and officers of the trust and fund, as applicable, are listed below. The Board of Trustees governs the fund and is responsible for protecting the interests of shareholders. The Trustees are experienced executives who meet periodically throughout the year to oversee the fund's activities, review contractual arrangements with companies that provide services to the fund, oversee management of the risks associated with such activities and contractual arrangements, and review the fund's performance. As of August 31, 2023, except for Laura M. Bishop, Robert W. Helm, Christine J. Thompson, and Carol J. Zierhoffer each of the Trustees oversees 313 funds. As of October 18, 2023, the date of their election as Trustee, Ms. Bishop, Mr. Helm, Ms. Thompson, and Ms. Zierhoffer each oversees 229 funds.
The Trustees hold office without limit in time except that (a) any Trustee may resign; (b) any Trustee may be removed by written instrument, signed by at least two-thirds of the number of Trustees prior to such removal; (c) any Trustee who requests to be retired or who has become incapacitated by illness or injury may be retired by written instrument signed by a majority of the other Trustees; and (d) any Trustee may be removed at any special meeting of shareholders by a two-thirds vote of the outstanding voting securities of the trust. Each Trustee who is not an interested person (as defined in the 1940 Act) of the trust and the fund is referred to herein as an Independent Trustee. Each Independent Trustee shall retire not later than the last day of the calendar year in which his or her 75th birthday occurs. The Independent Trustees may waive this mandatory retirement age policy with respect to individual Trustees. Officers and Advisory Board Members hold office without limit in time, except that any officer or Advisory Board Member may resign or may be removed by a vote of a majority of the Trustees at any regular meeting or any special meeting of the Trustees. Except as indicated, each individual has held the office shown or other offices in the same company for the past five years.
The fund's Statement of Additional Information (SAI) includes more information about the Trustees. To request a free copy, call Fidelity at 1-800-544-8544.
Experience, Skills, Attributes, and Qualifications of the Trustees. The Governance and Nominating Committee has adopted a statement of policy that describes the experience, qualifications, attributes, and skills that are necessary and desirable for potential Independent Trustee candidates (Statement of Policy). The Board believes that each Trustee satisfied at the time he or she was initially elected or appointed a Trustee, and continues to satisfy, the standards contemplated by the Statement of Policy. The Governance and Nominating Committee also engages professional search firms to help identify potential Independent Trustee candidates who have the experience, qualifications, attributes, and skills consistent with the Statement of Policy. From time to time, additional criteria based on the composition and skills of the current Independent Trustees, as well as experience or skills that may be appropriate in light of future changes to board composition, business conditions, and regulatory or other developments, have also been considered by the professional search firms and the Governance and Nominating Committee. In addition, the Board takes into account the Trustees' commitment and participation in Board and committee meetings, as well as their leadership of standing and ad hoc committees throughout their tenure.
In determining that a particular Trustee was and continues to be qualified to serve as a Trustee, the Board has considered a variety of criteria, none of which, in isolation, was controlling. The Board believes that, collectively, the Trustees have balanced and diverse experience, qualifications, attributes, and skills, which allow the Board to operate effectively in governing the fund and protecting the interests of shareholders. Information about the specific experience, skills, attributes, and qualifications of each Trustee, which in each case led to the Board's conclusion that the Trustee should serve (or continue to serve) as a trustee of the fund, is provided below.
Board Structure and Oversight Function. Abigail P. Johnson is an interested person and currently serves as Chairman. The Trustees have determined that an interested Chairman is appropriate and benefits shareholders because an interested Chairman has a personal and professional stake in the quality and continuity of services provided to the fund. Independent Trustees exercise their informed business judgment to appoint an individual of their choosing to serve as Chairman, regardless of whether the Trustee happens to be independent or a member of management. The Independent Trustees have determined that they can act independently and effectively without having an Independent Trustee serve as Chairman and that a key structural component for assuring that they are in a position to do so is for the Independent Trustees to constitute a substantial majority for the Board. The Independent Trustees also regularly meet in executive session. Michael E. Kenneally serves as Chairman of the Independent Trustees and as such (i) acts as a liaison between the Independent Trustees and management with respect to matters important to the Independent Trustees and (ii) with management prepares agendas for Board meetings.
Fidelity® funds are overseen by different Boards of Trustees. The fund's Board oversees Fidelity's investment-grade bond, money market, asset allocation and certain equity funds, and other Boards oversee Fidelity's alternative investment, high income and other equity funds. The asset allocation funds may invest in Fidelity® funds that are overseen by such other Boards. The use of separate Boards, each with its own committee structure, allows the Trustees of each group of Fidelity® funds to focus on the unique issues of the funds they oversee, including common research, investment, and operational issues. On occasion, the separate Boards establish joint committees to address issues of overlapping consequences for the Fidelity® funds overseen by each Board.
The Trustees operate using a system of committees to facilitate the timely and efficient consideration of all matters of importance to the Trustees, the fund, and fund shareholders and to facilitate compliance with legal and regulatory requirements and oversight of the fund's activities and associated risks. The Board, acting through its committees, has charged FMR and its affiliates with (i) identifying events or circumstances the occurrence of which could have demonstrably adverse effects on the fund's business and/or reputation; (ii) implementing processes and controls to lessen the possibility that such events or circumstances occur or to mitigate the effects of such events or circumstances if they do occur; and (iii) creating and maintaining a system designed to evaluate continuously business and market conditions in order to facilitate the identification and implementation processes described in (i) and (ii) above. Because the day-to-day operations and activities of the fund are carried out by or through FMR, its affiliates, and other service providers, the fund's exposure to risks is mitigated but not eliminated by the processes overseen by the Trustees. While each of the Board's committees has responsibility for overseeing different aspects of the fund's activities, oversight is exercised primarily through the Operations and Audit Committees. In addition, an ad hoc Board committee of Independent Trustees has worked with FMR to enhance the Board's oversight of investment and financial risks, legal and regulatory risks, technology risks, and operational risks, including the development of additional risk reporting to the Board. Appropriate personnel, including but not limited to the fund's Chief Compliance Officer (CCO), FMR's internal auditor, the independent accountants, the fund's Treasurer and portfolio management personnel, make periodic reports to the Board's committees, as appropriate, including an annual review of Fidelity's risk management program for the Fidelity® funds. The responsibilities of each standing committee, including their oversight responsibilities, are described further under "Standing Committees of the Trustees."
Interested Trustees*:
Correspondence intended for a Trustee who is an interested person may be sent to Fidelity Investments, 245 Summer Street, Boston, Massachusetts 02210.
Name, Year of Birth; Principal Occupations and Other Relevant Experience+
Abigail P. Johnson (1961)
Year of Election or Appointment: 2009
Trustee
Chairman of the Board of Trustees
Ms. Johnson also serves as Trustee of other Fidelity® funds. Ms. Johnson serves as Chairman (2016-present), Chief Executive Officer (2014-present), and Director (2007-present) of FMR LLC (diversified financial services company), President of Fidelity Financial Services (2012-present) and President of Personal, Workplace and Institutional Services (2005-present). Ms. Johnson is Chairman and Director of Fidelity Management & Research Company LLC (investment adviser firm, 2011-present). Previously, Ms. Johnson served as Chairman and Director of FMR Co., Inc. (investment adviser firm, 2011-2019), Vice Chairman (2007-2016) and President (2013-2016) of FMR LLC, President and a Director of Fidelity Management & Research Company (2001-2005), a Trustee of other investment companies advised by Fidelity Management & Research Company, Fidelity Investments Money Management, Inc. (investment adviser firm), and FMR Co., Inc. (2001-2005), Senior Vice President of the Fidelity® funds (2001-2005), and managed a number of Fidelity® funds. Ms. Abigail P. Johnson and Mr. Arthur E. Johnson are not related.
Jennifer Toolin McAuliffe (1959)
Year of Election or Appointment: 2016
Trustee
Ms. McAuliffe also serves as Trustee of other Fidelity® funds and as Trustee of Fidelity Charitable (2020-present). Previously, Ms. McAuliffe served as Co-Head of Fixed Income of Fidelity Investments Limited (now known as FIL Limited (FIL)) (diversified financial services company), Director of Research for FIL's credit and quantitative teams in London, Hong Kong and Tokyo and Director of Research for taxable and municipal bonds at Fidelity Investments Money Management, Inc. Ms. McAuliffe previously served as a member of the Advisory Board of certain Fidelity® funds (2016). Ms. McAuliffe was previously a lawyer at Ropes & Gray LLP and an international banker at Chemical Bank NA (now JPMorgan Chase & Co.). Ms. McAuliffe also currently serves as director or trustee of several not-for-profit entities.
Christine J. Thompson (1958)
Year of Election or Appointment: 2023
Trustee
Ms. Thompson also serves as a Trustee of other Fidelity® funds. Ms. Thompson serves as Leader of Advanced Technologies for Investment Management at Fidelity Investments (2018-present). Previously, Ms. Thompson served as Chief Investment Officer in the Bond group at Fidelity Management & Research Company (2010-2018) and held various other roles including Director of municipal bond portfolio managers and Portfolio Manager of certain Fidelity® funds.
* Determined to be an "Interested Trustee" by virtue of, among other things, his or her affiliation with the trust or various entities under common control with FMR.
+ The information includes the Trustee's principal occupation during the last five years and other information relating to the experience, attributes, and skills relevant to the Trustee's qualifications to serve as a Trustee, which led to the conclusion that the Trustee should serve as a Trustee for the fund.
Independent Trustees:
Correspondence intended for an Independent Trustee may be sent to Fidelity Investments, P.O. Box 55235, Boston, Massachusetts 02205-5235.
Name, Year of Birth; Principal Occupations and Other Relevant Experience+
Elizabeth S. Acton (1951)
Year of Election or Appointment: 2013
Trustee
Ms. Acton also serves as Trustee of other Fidelity® funds. Prior to her retirement, Ms. Acton served as Executive Vice President, Finance (2011-2012), Executive Vice President, Chief Financial Officer (2002-2011) and Treasurer (2004-2005) of Comerica Incorporated (financial services). Prior to joining Comerica, Ms. Acton held a variety of positions at Ford Motor Company (1983-2002), including Vice President and Treasurer (2000-2002) and Executive Vice President and Chief Financial Officer of Ford Motor Credit Company (1998-2000). Ms. Acton currently serves as a member of the Board and Audit and Finance Committees of Beazer Homes USA, Inc. (homebuilding, 2012-present). Ms. Acton previously served as a member of the Advisory Board of certain Fidelity® funds (2013-2016).
Laura M. Bishop (1961)
Year of Election or Appointment: 2023
Trustee
Ms. Bishop also serves as Trustee or Member of the Advisory Board of other Fidelity® funds. Prior to her retirement, Ms. Bishop held a variety of positions at United Services Automobile Association (2001-2020), including Executive Vice President and Chief Financial Officer (2014-2020) and Senior Vice President and Deputy Chief Financial Officer (2012-2014). Ms. Bishop currently serves as a member of the Audit Committee and Compensation and Personnel Committee (2021-present) of the Board of Directors of Korn Ferry (global organizational consulting). Previously, Ms. Bishop served as a Member of the Advisory Board of certain Fidelity® funds (2022-2023).
Ann E. Dunwoody (1953)
Year of Election or Appointment: 2018
Trustee
General Dunwoody also serves as Trustee of other Fidelity® funds. General Dunwoody (United States Army, Retired) was the first woman in U.S. military history to achieve the rank of four-star general and prior to her retirement in 2012 held a variety of positions within the U.S. Army, including Commanding General, U.S. Army Material Command (2008-2012). General Dunwoody currently serves as a member of the Board, Chair of Nomination Committee and a member of the Corporate Governance Committee of Kforce Inc. (professional staffing services, 2016-present) and a member of the Board of Automattic Inc. (software engineering, 2018-present). Previously, General Dunwoody served as President of First to Four LLC (leadership and mentoring services, 2012-2022), a member of the Advisory Board and Nominating and Corporate Governance Committee of L3 Technologies, Inc. (communication, electronic, sensor and aerospace systems, 2013-2019) and a member of the Board and Audit and Sustainability and Corporate Responsibility Committees of Republic Services, Inc. (waste collection, disposal and recycling, 2013-2016). General Dunwoody also serves on several boards for non-profit organizations, including as a member of the Board, Chair of the Nomination and Governance Committee and a member of the Audit Committee of the Noble Reach Foundation (formerly Logistics Management Institute) (consulting non-profit, 2012-present) and a member of the Board of ThanksUSA (military family education non-profit, 2014-present). Previously, General Dunwoody served as a member of the Board of Florida Institute of Technology (2015-2022) and a member of the Council of Trustees for the Association of the United States Army (advocacy non-profit, 2013-2021). General Dunwoody previously served as a member of the Advisory Board of certain Fidelity® funds (2018).
John Engler (1948)
Year of Election or Appointment: 2014
Trustee
Mr. Engler also serves as Trustee of other Fidelity® funds. Previously, Mr. Engler served as Governor of Michigan (1991-2003), President of the Business Roundtable (2011-2017) and interim President of Michigan State University (2018-2019). Previously, Mr. Engler served as a member of the Board of Stride, Inc. (formerly K12 Inc.) (technology-based education company, 2012-2022), a member of the Board of Universal Forest Products (manufacturer and distributor of wood and wood-alternative products, 2003-2019) and Trustee of The Munder Funds (2003-2014). Mr. Engler previously served as a member of the Advisory Board of certain Fidelity® funds (2014-2016).
Robert F. Gartland (1951)
Year of Election or Appointment: 2010
Trustee
Mr. Gartland also serves as Trustee of other Fidelity® funds. Prior to his retirement, Mr. Gartland held a variety of positions at Morgan Stanley (financial services, 1979-2007), including Managing Director (1987-2007) and Chase Manhattan Bank (1975-1978). Mr. Gartland previously served as Chairman and an investor in Gartland & Mellina Group Corp. (consulting, 2009-2019), as a member of the Board of National Securities Clearing Corporation (1993-1996) and as Chairman of TradeWeb (2003-2004).
Robert W. Helm (1957)
Year of Election or Appointment: 2023
Trustee
Mr. Helm also serves as Trustee or Member of the Advisory Board of other Fidelity® funds. Mr. Helm was formerly Deputy Chairman (2003-2020), partner (1991-2020) and an associate (1984-1991) of Dechert LLP (formerly Dechert Price & Rhoads). Mr. Helm currently serves on boards and committees of several not-for-profit organizations, including as a Trustee and member of the Executive Committee of the Baltimore Council on Foreign Affairs, a member of the Board of Directors of the St. Vincent de Paul Society of Baltimore and a member of the Life Guard Society of Mt. Vernon. Previously, Mr. Helm served as a Member of the Advisory Board of certain Fidelity® funds (2021-2023).
Arthur E. Johnson (1947)
Year of Election or Appointment: 2008
Trustee
Mr. Johnson also serves as Trustee of other Fidelity® funds. Prior to his retirement, Mr. Johnson served as Senior Vice President of Corporate Strategic Development of Lockheed Martin Corporation (defense contractor, 1999-2009). Mr. Johnson currently serves as a member of the Board of Booz Allen Hamilton (management consulting, 2011-present). Mr. Johnson previously served as a member of the Board of Eaton Corporation plc (diversified power management, 2009-2019) and a member of the Board of AGL Resources, Inc. (holding company, 2002-2016). Mr. Johnson previously served as Chairman (2018-2021) and Vice Chairman (2015-2018) of the Independent Trustees of certain Fidelity® funds. Mr. Arthur E. Johnson is not related to Ms. Abigail P. Johnson.
Michael E. Kenneally (1954)
Year of Election or Appointment: 2009
Trustee
Chairman of the Independent Trustees
Mr. Kenneally also serves as Trustee of other Fidelity® funds and was Vice Chairman (2018-2021) of the Independent Trustees of certain Fidelity® funds. Prior to retirement in 2005, he was Chairman and Global Chief Executive Officer of Credit Suisse Asset Management, the worldwide fund management and institutional investment business of Credit Suisse Group. Previously, Mr. Kenneally was an Executive Vice President and the Chief Investment Officer for Bank of America. In this role, he was responsible for the investment management, strategy and products delivered to the bank's institutional, high-net-worth and retail clients. Earlier, Mr. Kenneally directed the organization's equity and quantitative research groups. He began his career as a research analyst and then spent more than a dozen years as a portfolio manager for endowments, pension plans and mutual funds. He earned the Chartered Financial Analyst (CFA) designation in 1991.
Mark A. Murray (1954)
Year of Election or Appointment: 2016
Trustee
Mr. Murray also serves as Trustee of other Fidelity® funds. Previously, Mr. Murray served as Co-Chief Executive Officer (2013-2016), President (2006-2013) and Vice Chairman (2013-2020) of Meijer, Inc. Mr. Murray serves as a member of the Board (2009-present) and Public Policy and Responsibility Committee (2009-present) and Chair of the Nuclear Review Committee (2019-present) of DTE Energy Company (diversified energy company). Mr. Murray previously served as a member of the Board of Spectrum Health (not-for-profit health system, 2015-2019) and as a member of the Board and Audit Committee and Chairman of the Nominating and Corporate Governance Committee of Universal Forest Products, Inc. (manufacturer and distributor of wood and wood-alternative products, 2004-2016). Mr. Murray also serves as a member of the Board of many community and professional organizations. Mr. Murray previously served as a member of the Advisory Board of certain Fidelity® funds (2016).
Carol J. Zierhoffer (1960)
Year of Election or Appointment: 2023
Trustee
Ms. Zierhoffer also serves as Trustee or Member of the Advisory Board of other Fidelity® funds. Prior to her retirement, Ms. Zierhoffer held a variety of positions at Bechtel Corporation (engineering company, 2013-2019), including Principal Vice President and Chief Information Officer (2013-2016) and Senior Vice President and Chief Information Officer (2016-2019). Ms. Zierhoffer currently serves as a member of the Board of Directors, Audit Committee and Compensation Committee of Allscripts Healthcare Solutions, Inc. (healthcare technology, 2020-present) and as a member of the Board of Directors, Audit and Finance Committee and Nominating and Governance Committee of Atlas Air Worldwide Holdings, Inc. (aviation operating services, 2021-present). Previously, Ms. Zierhoffer served as a member of the Board of Directors and Audit Committee and as the founding Chair of the Information Technology Committee of MedAssets, Inc. (healthcare technology, 2013-2016), and as a Member of the Advisory Board of certain Fidelity® funds (2023).
+ The information includes the Trustee's principal occupation during the last five years and other information relating to the experience, attributes, and skills relevant to the Trustee's qualifications to serve as a Trustee, which led to the conclusion that the Trustee should serve as a Trustee for the fund.
Advisory Board Members and Officers:
Correspondence intended for a Member of the Advisory Board (if any) may be sent to Fidelity Investments, P.O. Box 55235, Boston, Massachusetts 02205-5235. Correspondence intended for an officer may be sent to Fidelity Investments, 245 Summer Street, Boston, Massachusetts 02210. Officers appear below in alphabetical order.
Name, Year of Birth; Principal Occupation
Heather Bonner (1977)
Year of Election or Appointment: 2023
Assistant Treasurer
Ms. Bonner also serves as an officer of other funds. Ms. Bonner serves as Senior Vice President (2022-present), and is an employee of Fidelity Investments. Ms. Bonner serves as Assistant Treasurer of Fidelity CRET Trustee LLC (2022-present). Prior to joining Fidelity, Ms. Bonner served as Managing Director at AQR Capital Management (2013-2022) and was the Treasurer and Principal Financial Officer of the AQR Funds (2013-2022).
Craig S. Brown (1977)
Year of Election or Appointment: 2019
Assistant Treasurer
Mr. Brown also serves as an officer of other funds. Mr. Brown serves as Assistant Treasurer of FIMM, LLC (2021-present) and is an employee of Fidelity Investments (2013-present). Previously, Mr. Brown served as Assistant Treasurer of certain Fidelity® funds (2019-2022).
John J. Burke III (1964)
Year of Election or Appointment: 2018
Chief Financial Officer
Mr. Burke also serves as Chief Financial Officer of other funds. Mr. Burke serves as Head of Investment Operations for Fidelity Fund and Investment Operations (2018-present) and is an employee of Fidelity Investments (1998-present). Previously Mr. Burke served as head of Asset Management Investment Operations (2012-2018).
Margaret Carey (1973)
Year of Election or Appointment: 2023
Secretary and Chief Legal Officer (CLO)
Ms. Carey also serves as an officer of other funds and as CLO of certain other Fidelity entities. She is a Senior Vice President and Deputy General Counsel of FMR LLC (diversified financial services company, 2019-present), and is an employee of Fidelity Investments.
David J. Carter (1973)
Year of Election or Appointment: 2020
Assistant Secretary
Mr. Carter also serves as Assistant Secretary of other funds. Mr. Carter serves as Senior Vice President, Deputy General Counsel (2022-present) and is an employee of Fidelity Investments (2005-present).
Jonathan Davis (1968)
Year of Election or Appointment: 2010
Assistant Treasurer
Mr. Davis also serves as an officer of other funds. Mr. Davis serves as Vice President Assistant Treasurer and is an employee of Fidelity Investments. Mr. Davis serves as Assistant Treasurer of certain Fidelity entities.
Laura M. Del Prato (1964)
Year of Election or Appointment: 2018
President and Treasurer
Ms. Del Prato also serves as an officer of other funds. Ms. Del Prato serves as Assistant Treasurer of FIMM, LLC (2021-present) and is an employee of Fidelity Investments (2017-present). Previously, Ms. Del Prato served as President and Treasurer of The North Carolina Capital Management Trust: Cash Portfolio and Term Portfolio (2018-2020). Prior to joining Fidelity Investments, Ms. Del Prato served as a Managing Director and Treasurer of the JPMorgan Mutual Funds (2014-2017). Prior to JPMorgan, Ms. Del Prato served as a partner at Cohen Fund Audit Services (accounting firm, 2012-2013) and KPMG LLP (accounting firm, 2004-2012).
Robin Foley (1964)
Year of Election or Appointment: 2023
Vice President
Ms. Foley also serves as Vice President of other funds. Ms. Foley serves as Head of Fidelity's Fixed Income division (2023-present) and is an employee of Fidelity Investments. Previously, Ms. Foley served as Chief Investment Officer of Bonds (2017-2023).
Christopher M. Gouveia (1973)
Year of Election or Appointment: 2023
Chief Compliance Officer
Mr. Gouveia also serves as Chief Compliance Officer of other funds. Mr. Gouveia serves as Senior Vice President of Asset Management Compliance for Fidelity Investments and is an employee of Fidelity Investments. Previously, Mr. Gouveia served as Chief Compliance Officer of the North Carolina Capital Management Trust (2016-2019).
Colm A. Hogan (1973)
Year of Election or Appointment: 2016
Assistant Treasurer
Mr. Hogan also serves as an officer of other funds. Mr. Hogan serves as Assistant Treasurer of FIMM, LLC (2021-present) and FMR Capital, Inc. (2017-present) and is an employee of Fidelity Investments (2005-present). Previously, Mr. Hogan served as Deputy Treasurer of certain Fidelity® funds (2016-2020) and Assistant Treasurer of certain Fidelity® funds (2016-2018).
Chris Maher (1972)
Year of Election or Appointment: 2013
Assistant Treasurer
Mr. Maher also serves as an officer of other funds. Mr. Maher serves as Assistant Treasurer of FIMM, LLC (2021-present) and FMR Capital, Inc. (2017-present), and is an employee of Fidelity Investments (2008-present). Previously, Mr. Maher served as Assistant Treasurer of certain funds (2013-2020); Vice President of Asset Management Compliance (2013), Vice President of the Program Management Group of FMR (investment adviser firm, 2010-2013), and Vice President of Valuation Oversight (2008-2010).
Brett Segaloff (1972)
Year of Election or Appointment: 2021
Anti-Money Laundering (AML) Officer
Mr. Segaloff also serves as an AML Officer of other funds and other related entities. He is Director, Anti-Money Laundering (2007-present) of FMR LLC (diversified financial services company) and is an employee of Fidelity Investments (1996-present).
Stacie M. Smith (1974)
Year of Election or Appointment: 2013
Assistant Treasurer
Ms. Smith also serves as an officer of other funds. Ms. Smith serves as Assistant Treasurer of certain Fidelity entities, is an employee of Fidelity Investments, and has served in other fund officer roles.
Jim Wegmann (1979)
Year of Election or Appointment: 2021
Deputy Treasurer
Mr. Wegmann also serves as an officer of other funds. Mr. Wegmann serves as Assistant Treasurer of FIMM, LLC (2021-present) and is an employee of Fidelity Investments (2011-present). Previously, Mr. Wegmann served as Assistant Treasurer of certain Fidelity® funds (2019-2021).
As a shareholder, you incur two types of costs: (1) transaction costs, which may include sales charges (loads) on purchase payments or redemption proceeds, as applicable and (2) ongoing costs, which generally include management fees, distribution and/or service (12b-1) fees and other Fund expenses. This Example is intended to help you understand your ongoing costs (in dollars) of investing in a fund and to compare these costs with the ongoing costs of investing in other mutual funds.
| The Example is based on an investment of $1,000 invested at the beginning of the period and held for the entire period (March 1, 2023 to August 31, 2023). |
Actual Expenses
The first line of the accompanying table provides information about actual account values and actual expenses. You may use the information in this line, together with the amount you invested, to estimate the expenses that you paid over the period. Simply divide your account value by $1,000.00 (for example, an $8,600 account value divided by $1,000.00 = 8.6), then multiply the result by the number in the first line for a class/Fund under the heading entitled "Expenses Paid During Period" to estimate the expenses you paid on your account during this period. If any fund is a shareholder of any underlying mutual funds or exchange-traded funds (ETFs) (the Underlying Funds), such fund indirectly bears its proportional share of the expenses of the Underlying Funds in addition to the direct expenses incurred presented in the table. These fees and expenses are not included in the annualized expense ratio used to calculate the expense estimate in the table below.
Hypothetical Example for Comparison Purposes
The second line of the accompanying table provides information about hypothetical account values and hypothetical expenses based on the actual expense ratio and an assumed rate of return of 5% per year before expenses, which is not the actual return. The hypothetical account values and expenses may not be used to estimate the actual ending account balance or expenses you paid for the period. You may use this information to compare the ongoing costs of investing in the Fund and other funds. To do so, compare this 5% hypothetical example with the 5% hypothetical examples that appear in the shareholder reports of the other funds. If any fund is a shareholder of any Underlying Funds, such fund indirectly bears its proportional share of the expenses of the Underlying Funds in addition to the direct expenses as presented in the table. These fees and expenses are not included in the annualized expense ratio used to calculate the expense estimate in the table below.
Please note that the expenses shown in the table are meant to highlight your ongoing costs only and do not reflect any transaction costs. Therefore, the second line of the table is useful in comparing ongoing costs only, and will not help you determine the relative total costs of owning different funds. In addition, if these transactional costs were included, your costs would have been higher.
| | | | | Annualized Expense Ratio- A | | Beginning Account Value March 1, 2023 | | Ending Account Value August 31, 2023 | | Expenses Paid During Period- C March 1, 2023 to August 31, 2023 |
| | | | | | | | | | |
| Fidelity® Education Income Fund | | | | -%-D | | | | | | |
| Actual | | | | | | $ 1,000 | | $ 1,018.50 | | $-E |
Hypothetical-B | | | | | | $ 1,000 | | $ 1,025.21 | | $-E |
| |
A Annualized expense ratio reflects expenses net of applicable fee waivers.
B 5% return per year before expenses
C Expenses are equal to the annualized expense ratio, multiplied by the average account value over the period, multiplied by 184/ 365 (to reflect the one-half year period). The fees and expenses of any Underlying Funds are not included in each annualized expense ratio.
D Amount represents less than .005%.
E Amount represents less than $.005.
The dividend and capital gains distributions for the fund(s) are available on Fidelity.com or Institutional.Fidelity.com.
A total of 62.12% of the dividends distributed during the fiscal year was derived from interest on U.S. Government securities which is generally exempt from state income tax.
The fund designates $27,011,429 of distributions paid during the fiscal year ended 2023 as qualifying to be taxed as section 163(j) interest dividends.
The fund will notify shareholders in January 2024 of amounts for use in preparing 2023 income tax returns.
1.9901557.102
EDI-ANN-1023
Item 2.
Code of Ethics
As of the end of the period, August 31, 2023, Fidelity Garrison Street Trust (the trust) has adopted a code of ethics, as defined in Item 2 of Form N-CSR, that applies to its President and Treasurer and its Chief Financial Officer. A copy of the code of ethics is filed as an exhibit to this Form N-CSR.
Item 3.
Audit Committee Financial Expert
The Board of Trustees of the trust has determined that Elizabeth S. Acton is an audit committee financial expert, as defined in Item 3 of Form N-CSR. Ms. Acton is independent for purposes of Item 3 of Form N-CSR.
Item 4.
Principal Accountant Fees and Services
Fees and Services
The following table presents fees billed by Deloitte & Touche LLP, the member firms of Deloitte Touche Tohmatsu, and their respective affiliates (collectively, “Deloitte Entities”) in each of the last two fiscal years for services rendered to Fidelity Education Income Fund (the “Fund”):
Services Billed by Deloitte Entities
August 31, 2023 FeesA
| | | | |
| Audit Fees | Audit-Related Fees | Tax Fees | All Other Fees |
Fidelity Education Income Fund | $75,000 | $- | $10,100 | $1,800 |
| | | | |
| Audit Fees | Audit-Related Fees | Tax Fees | All Other Fees |
Fidelity Education Income Fund | $77,100 | $- | $9,500 | $1,600 |
A Amounts may reflect rounding.
The following table(s) present(s) fees billed by Deloitte Entities that were required to be approved by the Audit Committee for services that relate directly to the operations and financial reporting of the Fund(s) and that are rendered on behalf of Fidelity Management & Research Company LLC ("FMR") and entities controlling, controlled by, or under common control with FMR (not including any sub-adviser whose role is primarily portfolio management and is subcontracted with or overseen by another investment adviser) that provide ongoing services to the Fund(s) (“Fund Service Providers”):
Services Billed by Deloitte Entities
| | |
| August 31, 2023A | August 31, 2022 A |
Audit-Related Fees | $- | $- |
Tax Fees | $- | $- |
All Other Fees | $- | $- |
A Amounts may reflect rounding.
“Audit-Related Fees” represent fees billed for assurance and related services that are reasonably related to the performance of the fund audit or the review of the fund's financial statements and that are not reported under Audit Fees.
“Tax Fees” represent fees billed for tax compliance, tax advice or tax planning that relate directly to the operations and financial reporting of the fund.
“All Other Fees” represent fees billed for services provided to the fund or Fund Service Provider, a significant portion of which are assurance related, that relate directly to the operations and financial reporting of the fund, excluding those services that are reported under Audit Fees, Audit-Related Fees or Tax Fees.
Assurance services must be performed by an independent public accountant.
* * *
The aggregate non-audit fees billed by Deloitte Entities for services rendered to the Fund(s), FMR (not including any sub-adviser whose role is primarily portfolio management and is subcontracted with or overseen by another investment adviser), and any Fund Service Provider for each of the last two fiscal years of the Fund(s) are as follows:
| | |
Billed By | August 31, 2023A | August 31, 2022A |
Deloitte Entities | $254,500 | $468,700 |
|
|
|
A Amounts may reflect rounding.
The trust's Audit Committee has considered non-audit services that were not pre-approved that were provided by Deloitte Entities to Fund Service Providers to be compatible with maintaining the independence of Deloitte Entities in its(their) audit of the Fund(s), taking into account representations from Deloitte Entities, in accordance with Public Company Accounting Oversight Board rules, regarding its independence from the Fund(s) and its(their) related entities and FMR’s review of the appropriateness and permissibility under applicable law of such non-audit services prior to their provision to the Fund(s) Service Providers.
Audit Committee Pre-Approval Policies and Procedures
The trust’s Audit Committee must pre-approve all audit and non-audit services provided by a fund’s independent registered public accounting firm relating to the operations or financial reporting of the fund. Prior to the commencement of any audit or non-audit services to a fund, the Audit Committee reviews the services to determine whether they are appropriate and permissible under applicable law.
The Audit Committee has adopted policies and procedures to, among other purposes, provide a framework for the Committee’s consideration of non-audit services by the audit firms that audit the Fidelity funds. The policies and procedures require that any non-audit service provided by a fund audit firm to a Fidelity fund and any non-audit service provided by a fund auditor to a Fund Service Provider that relates directly to the operations and financial reporting of a Fidelity fund (“Covered Service”) are subject to approval by the Audit Committee before such service is provided.
All Covered Services must be approved in advance of provision of the service either: (i) by formal resolution of the Audit Committee, or (ii) by oral or written approval of the service by the Chair of the Audit Committee (or if the Chair is unavailable, such other member of the Audit Committee as may be designated by the Chair to act in the Chair’s absence). The approval contemplated by (ii) above is permitted where the Treasurer determines that action on such an engagement is necessary before the next meeting of the Audit Committee.
Non-audit services provided by a fund audit firm to a Fund Service Provider that do not relate directly to the operations and financial reporting of a Fidelity fund are reported to the Audit Committee periodically.
Non-Audit Services Approved Pursuant to Rule 2-01(c)(7)(i)(C) and (ii) of Regulation S-X (“De Minimis Exception”)
There were no non-audit services approved or required to be approved by the Audit Committee pursuant to the De Minimis Exception during the Fund’s(s’) last two fiscal years relating to services provided to (i) the Fund(s) or (ii) any Fund Service Provider that relate directly to the operations and financial reporting of the Fund(s).
The Registrant has not retained, for the preparation of the audit report on the financial statements included in the Form N-CSR, a registered public accounting firm that has a branch or office that is located in a foreign jurisdiction and that the Public Company Accounting Oversight Board (the “PCAOB”) has determined that the PCAOB is unable to inspect or investigate completely because of a position taken by an authority in the foreign jurisdiction.
The Registrant is not a “foreign issuer,” as defined in 17 CFR 240.3b-4.
Item 5.
Audit Committee of Listed Registrants
Not applicable.
Item 6.
Investments
(a)
Not applicable.
(b)
Not applicable.
Item 7.
Disclosure of Proxy Voting Policies and Procedures for Closed-End Management Investment Companies
Not applicable.
Item 8.
Portfolio Managers of Closed-End Management Investment Companies
Not applicable.
Item 9.
Purchase of Equity Securities by Closed-End Management Investment Company and Affiliated Purchasers
Not applicable.
Item 10.
Submission of Matters to a Vote of Security Holders
There were no material changes to the procedures by which shareholders may recommend nominees to the trust’s Board of Trustees.
Item 11.
Controls and Procedures
(a)(i) The President and Treasurer and the Chief Financial Officer have concluded that the trust’s disclosure controls and procedures (as defined in Rule 30a-3(c) under the Investment Company Act) provide reasonable assurances that material information relating to the trust is made known to them by the appropriate persons, based on their evaluation of these controls and procedures as of a date within 90 days of the filing date of this report.
(a)(ii) There was no change in the trust’s internal control over financial reporting (as defined in Rule 30a-3(d) under the Investment Company Act) that occurred during the period covered by this report that has materially affected, or is reasonably likely to materially affect, the trust’s internal control over financial reporting.
Item 12.
Disclosure of Securities Lending Activities for Closed-End Management
Investment Companies
Not applicable.
Item 13.
Exhibits
SIGNATURES
Pursuant to the requirements of the Securities Exchange Act of 1934 and the Investment Company Act of 1940, the registrant has duly caused this report to be signed on its behalf by the undersigned, thereunto duly authorized.
Fidelity Garrison Street Trust
| |
By: | /s/Laura M. Del Prato |
| Laura M. Del Prato |
| President and Treasurer |
|
|
Date: | October 23, 2023 |
Pursuant to the requirements of the Securities Exchange Act of 1934 and the Investment Company Act of 1940, this report has been signed below by the following persons on behalf of the registrant and in the capacities and on the dates indicated.
| |
By: | /s/Laura M. Del Prato |
| Laura M. Del Prato |
| President and Treasurer |
|
|
Date: | October 23, 2023 |
| |
By: | /s/John J. Burke III |
| John J. Burke III |
| Chief Financial Officer |
|
|
Date: | October 23, 2023 |