Fidelity® Money Market Central Fund
Semi-Annual Report
March 31, 2020

See the inside front cover for important information about access to your fund’s shareholder reports.

Beginning on January 1, 2021, as permitted by regulations adopted by the Securities and Exchange Commission, paper copies of a fund’s shareholder reports will no longer be sent by mail, unless you specifically request paper copies of the reports from the fund or from your financial intermediary, such as a financial advisor, broker-dealer or bank. Instead, the reports will be made available on a website, and you will be notified by mail each time a report is posted and provided with a website link to access the report.
If you already elected to receive shareholder reports electronically, you will not be affected by this change and you need not take any action. You may elect to receive shareholder reports and other communications from a fund electronically, by contacting your financial intermediary. For Fidelity customers, visit Fidelity's web site or call Fidelity using the contact information listed below.
You may elect to receive all future reports in paper free of charge. If you wish to continue receiving paper copies of your shareholder reports, you may contact your financial intermediary or, if you are a Fidelity customer, visit Fidelity’s website, or call Fidelity at the applicable toll-free number listed below. Your election to receive reports in paper will apply to all funds held with the fund complex/your financial intermediary.
| Account Type | Website | Phone Number |
| Brokerage, Mutual Fund, or Annuity Contracts: | fidelity.com/mailpreferences | 1-800-343-3548 |
| Employer Provided Retirement Accounts: | netbenefits.fidelity.com/preferences (choose 'no' under Required Disclosures to continue to print) | 1-800-343-0860 |
| Advisor Sold Accounts Serviced Through Your Financial Intermediary: | Contact Your Financial Intermediary | Your Financial Intermediary's phone number |
| Advisor Sold Accounts Serviced by Fidelity: | institutional.fidelity.com | 1-877-208-0098 |
Contents
To view a fund's proxy voting guidelines and proxy voting record for the 12-month period ended June 30, visit http://www.fidelity.com/proxyvotingresults or visit the Securities and Exchange Commission's (SEC) web site at http://www.sec.gov.
You may also call 1-800-544-8544 to request a free copy of the proxy voting guidelines.
Standard & Poor's, S&P and S&P 500 are registered service marks of The McGraw-Hill Companies, Inc. and have been licensed for use by Fidelity Distributors Corporation.
Other third-party marks appearing herein are the property of their respective owners.
All other marks appearing herein are registered or unregistered trademarks or service marks of FMR LLC or an affiliated company. © 2020 FMR LLC. All rights reserved.
A fund files its complete schedule of portfolio holdings with the SEC for the first and third quarters of each fiscal year on Form N-PORT. Forms N-PORT are available on the SEC’s web site at http://www.sec.gov. A fund's Forms N-PORT may be reviewed and copied at the SEC’s Public Reference Room in Washington, DC. Information regarding the operation of the SEC's Public Reference Room may be obtained by calling 1-800-SEC-0330.
Note to Shareholders:
Early in 2020, the outbreak and spread of a new coronavirus emerged as a public health emergency that had a major influence on financial markets, primarily based on its impact on the global economy and corporate earnings. The virus causes a respiratory disease known as COVID-19. On March 11, the World Health Organization declared the COVID-19 outbreak a pandemic, citing sustained risk of further global spread.
In the weeks following, as the crisis worsened, we witnessed an escalating human tragedy with wide-scale social and economic consequences from coronavirus-containment measures. The outbreak of COVID-19 prompted a number of measures to limit the spread, including travel and border restrictions, quarantines, and restrictions on large gatherings. In turn, these resulted in lower consumer activity, diminished demand for a wide range of products and services, disruption in manufacturing and supply chains, and – given the wide variability in outcomes regarding the outbreak – significant market uncertainty and volatility. Amid the turmoil, the U.S. government took unprecedented action – in concert with the U.S. Federal Reserve and central banks around the world – to help support consumers, businesses, and the broader economy, and to limit disruption to the financial system.
The situation continues to unfold, and the extent and duration of its impact on financial markets and the economy remain highly uncertain. Extreme events such as the coronavirus crisis are “exogenous shocks” that can have significant adverse effects on mutual funds and their investments. Although multiple asset classes may be affected by market disruption, the duration and impact may not be the same for all types of assets.
Fidelity is committed to helping you stay informed amid news about COVID-19 and during increased market volatility, and we’re taking extra steps to be responsive to customer needs. We encourage you to visit our websites, where we offer ongoing updates, commentary, and analysis on the markets and our funds.
Investment Summary (Unaudited)
Effective Maturity Diversification as of March 31, 2020
| Days | % of fund's investments 3/31/20 |
| 1 - 7 | 51.0 |
| 8 - 30 | 14.2 |
| 31 - 60 | 20.9 |
| 61 - 90 | 6.1 |
| 91 - 180 | 7.8 |
Effective maturity is determined in accordance with the requirements of Rule 2a-7 under the Investment Company Act of 1940.
Asset Allocation (% of fund's net assets)
| As of March 31, 2020 |
| | Certificates of Deposit | 28.8% |
| | Commercial Paper | 33.1% |
| | Variable Rate Demand Notes (VRDNs) | 0.2% |
| | U.S. Treasury Debt | 1.7% |
| | Non-Negotiable Time Deposit | 13.3% |
| | Other Instruments | 0.3% |
| | Repurchase Agreements | 22.8% |
| | Net Other Assets (Liabilities)* | (0.2)% |
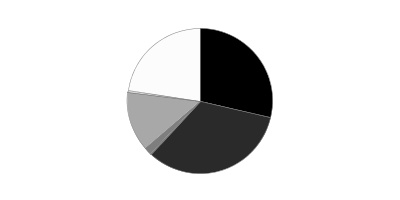
* Net Other Assets (Liabilities) are not included in the pie chart
Schedule of Investments March 31, 2020 (Unaudited)
Showing Percentage of Net Assets
| Certificate of Deposit - 28.8% | | | | |
| | | Yield(a) | Principal Amount | Value |
| Domestic Certificates Of Deposit - 0.6% | | | | |
| HSBC Bank U.S.A. NA | | | | |
| 4/23/20 to 4/24/20 | | 2.02% | $7,000,000 | $7,004,800 |
| Wells Fargo Bank NA | | | | |
| 7/27/20 | | 1.06 (b)(c) | 4,000,000 | 3,997,556 |
| | | | | 11,002,356 |
| London Branch, Eurodollar, Foreign Banks - 12.3% | | | | |
| Bank of Montreal London Branch | | | | |
| 7/20/20 | | 1.54 | 3,000,000 | 3,001,041 |
| Credit Agricole SA London Branch | | | | |
| 5/4/20 to 7/3/20 | | 1.48 to 1.79 | 15,000,000 | 15,005,187 |
| DZ Bank AG London Branch | | | | |
| 4/6/20 to 6/22/20 | | 1.66 to 1.91 | 65,000,000 | 64,925,236 |
| KBC Bank NV London | | | | |
| 4/21/20 to 6/29/20 | | 1.61 to 1.76 | 56,000,000 | 55,901,336 |
| Landesbank Hessen-Thueringen London Branch | | | | |
| 4/7/20 | | 0.70 | 26,000,000 | 26,000,512 |
| Mitsubishi UFJ Trust & Banking Corp. | | | | |
| 5/20/20 | | 1.69 | 2,000,000 | 1,996,073 |
| Mizuho Bank Ltd. London Branch | | | | |
| 5/5/20 to 6/2/20 | | 1.62 to 1.73 | 18,000,000 | 17,969,496 |
| Rabobank Nederland London Branch | | | | |
| 6/19/20 to 6/22/20 | | 1.66 | 10,000,000 | 9,967,962 |
| Sumitomo Mitsui Trust Bank Ltd. London Branch | | | | |
| 5/7/20 to 5/29/20 | | 1.74 to 1.82 | 11,000,000 | 10,975,365 |
| | | | | 205,742,208 |
| New York Branch, Yankee Dollar, Foreign Banks - 15.9% | | | | |
| Bank of Montreal | | | | |
| 4/1/20 to 11/17/20 | | 0.85 to 1.77 (b) | 63,000,000 | 62,895,703 |
| Bank of Nova Scotia | | | | |
| 8/20/20 | | 1.78 (b)(c) | 11,750,000 | 11,727,149 |
| Bank of Tokyo-Mitsubishi UFJ Ltd. | | | | |
| 6/30/20 to 7/16/20 | | 1.00 to 1.60 | 21,000,000 | 20,974,680 |
| Barclays Bank PLC | | | | |
| 5/4/20 | | 1.75 | 4,000,000 | 4,002,214 |
| Mitsubishi UFJ Trust & Banking Corp. | | | | |
| 5/13/20 to 7/2/20 | | 0.66 to 1.46 (b) | 18,000,000 | 17,998,781 |
| Mizuho Corporate Bank Ltd. | | | | |
| 5/13/20 to 7/1/20 | | 0.92 to 1.46 (b) | 39,000,000 | 39,022,145 |
| Natexis Banques Populaires New York Branch | | | | |
| 4/24/20 to 6/5/20 | | 1.06 to 1.81 | 30,000,000 | 30,008,034 |
| Royal Bank of Canada | | | | |
| 8/27/20 to 9/10/20 | | 0.98 to 1.72 (b)(c) | 17,000,000 | 16,960,236 |
| Sumitomo Mitsui Banking Corp. | | | | |
| 5/7/20 to 6/10/20 | | 0.74 to 1.47 (b)(c) | 30,000,000 | 30,002,346 |
| Sumitomo Mitsui Trust Bank Ltd. | | | | |
| 4/3/20 to 5/22/20 | | 0.85 to 1.98 (b) | 23,000,000 | 23,006,658 |
| Svenska Handelsbanken, Inc. | | | | |
| 8/11/20 | | 0.77 (b)(c) | 10,000,000 | 9,989,303 |
| | | | | 266,587,249 |
| TOTAL CERTIFICATE OF DEPOSIT | | | | |
| (Cost $483,410,993) | | | | 483,331,813 |
|
| Financial Company Commercial Paper - 26.4% | | | | |
| Bank of Nova Scotia | | | | |
| 7/24/20 to 11/13/20 | | 1.05 to 1.73 (b)(c) | 18,000,000 | 17,996,145 |
| Barclays Bank PLC/Barclays U.S. CCP Funding LLC | | | | |
| 5/1/20 | | 1.66 (d) | 2,000,000 | 1,996,132 |
| BNP Paribas Fortis | | | | |
| 4/3/20 | | 0.50 | 1,000,000 | 999,999 |
| BNP Paribas New York Branch | | | | |
| 4/1/20 to 4/3/20 | | 0.04 to 0.50 | 9,000,000 | 8,999,997 |
| BPCE SA | | | | |
| 6/24/20 | | 1.61 | 4,000,000 | 3,990,159 |
| Canadian Imperial Bank of Commerce | | | | |
| 4/3/20 to 9/14/20 | | 0.40 to 1.05 (b) | 60,000,000 | 59,858,182 |
| Citigroup Global Markets, Inc. | | | | |
| 8/3/20 to 8/5/20 | | 0.86 | 10,000,000 | 9,947,991 |
| Credit Suisse AG | | | | |
| 4/21/20 to 4/22/20 | | 2.03 | 9,000,000 | 8,995,898 |
| DZ BANK AG | | | | |
| 4/16/20 | | 1.73 | 10,000,000 | 9,994,964 |
| Federation des caisses Desjardin | | | | |
| 4/1/20 to 8/28/20 | | 0.07 to 1.61 | 18,000,000 | 17,954,348 |
| Landesbank Baden-Wurttemberg | | | | |
| 4/1/20 | | 0.05 | 26,000,000 | 26,000,000 |
| Mitsubishi UFJ Trust & Banking Corp. | | | | |
| 5/4/20 to 5/18/20 | | 1.69 to 1.71 | 24,000,000 | 23,970,489 |
| Natexis Banques Populaires New York Branch | | | | |
| 5/4/20 to 6/24/20 | | 1.61 to 1.72 | 20,000,000 | 19,970,238 |
| National Australia Bank Ltd. | | | | |
| 4/1/20 | | 2.05 | 4,000,000 | 3,999,888 |
| National Bank of Canada | | | | |
| 5/8/20 to 8/3/20 | | 1.60 to 1.90 (b) | 17,000,000 | 16,983,980 |
| Nationwide Building Society | | | | |
| 4/1/20 | | 1.63 | 2,000,000 | 1,999,997 |
| Ontario Teachers' Finance Trust | | | | |
| 4/2/20 | | 2.03 (d) | 3,000,000 | 2,999,920 |
| Rabobank Nederland New York Branch | | | | |
| 4/1/20 | | 0.05 | 6,000,000 | 6,000,000 |
| Royal Bank of Canada | | | | |
| 4/15/20 to 9/4/20 | | 0.88 to 1.76 (b) | 33,000,000 | 32,909,158 |
| Societe Generale | | | | |
| 4/3/20 to 4/7/20 | | 0.24 to 0.49 | 54,000,000 | 53,999,043 |
| Sumitomo Mitsui Trust Bank Ltd. | | | | |
| 4/24/20 to 6/19/20 | | 1.61 to 1.85 | 38,000,000 | 37,931,576 |
| Svenska Handelsbanken AB | | | | |
| 9/4/20 | | 0.92 | 11,000,000 | 10,938,260 |
| The Toronto-Dominion Bank | | | | |
| 7/23/20 to 11/10/20 | | 0.94 to 1.93 (b)(c) | 57,000,000 | 56,872,640 |
| Toyota Motor Credit Corp. | | | | |
| 7/2/20 | | 1.96 (b)(c) | 2,000,000 | 1,996,103 |
| UBS AG London Branch | | | | |
| 4/23/20 | | 2.02 | 5,000,000 | 4,996,400 |
| TOTAL FINANCIAL COMPANY COMMERCIAL PAPER | | | | |
| (Cost $442,520,178) | | | | 442,301,507 |
|
| Asset Backed Commercial Paper - 5.2% | | | | |
| Atlantic Asset Securitization Corp. (Liquidity Facility Credit Agricole CIB) | | | | |
| | | | | |
| 4/1/20 | | 0.07 | 1,000,000 | 1,000,000 |
| 5/19/20 | | 1.65 | 13,000,000 | 12,973,334 |
| 6/17/20 | | 1.61 | 7,000,000 | 6,977,250 |
| Autobahn Funding Co. LLC (Liquidity Facility DZ BANK AG) | | | | |
| | | | | |
| 4/1/20 | | 1.60 | 1,000,000 | 999,979 |
| 4/3/20 | | 0.60 | 12,000,000 | 11,999,125 |
| Gotham Funding Corp. (Liquidity Facility Bank of Tokyo-Mitsubishi UFJ Ltd.) | | | | |
| 4/3/20 | | 2.00 | 1,000,000 | 1,000,000 |
| Manhattan Asset Funding Co. LLC (Liquidity Facility Sumitomo Mitsui Banking Corp.) | | | | |
| | | | | |
| 4/1/20 | | 0.15 | 7,000,000 | 7,000,000 |
| 4/13/20 | | 1.00 | 2,000,000 | 1,999,333 |
| 4/16/20 | | 1.60 | 2,980,000 | 2,977,987 |
| 5/11/20 | | 1.70 | 8,000,000 | 7,986,242 |
| 5/4/20 | | 1.71 | 8,420,000 | 8,407,992 |
| 5/6/20 | | 1.70 | 17,000,000 | 16,974,330 |
| 5/7/20 | | 1.60 | 1,000,000 | 998,448 |
| 5/8/20 | | 1.70 | 3,000,000 | 2,995,218 |
| Sheffield Receivables Corp. (Liquidity Facility Barclays Bank PLC) | | | | |
| | | | | |
| 5/11/20 | | 1.69 | 1,000,000 | 997,927 |
| 5/12/20 | | 1.69 | 2,000,000 | 1,995,730 |
| TOTAL ASSET BACKED COMMERCIAL PAPER | | | | |
| (Cost $87,275,874) | | | | 87,282,895 |
|
| Non-Financial Company Commercial Paper - 1.5% | | | | |
| American Electric Power Co., Inc. | | | | |
| 4/1/20 to 4/9/20 | | 1.75 to 1.76 | 4,650,000 | 4,648,927 |
| Dominion Energy, Inc. | | | | |
| 4/2/20 to 4/27/20 | | 1.40 to 1.77 | 11,000,000 | 10,991,410 |
| Duke Energy Corp. | | | | |
| 4/8/20 to 4/9/20 | | 1.40 to 1.75 | 2,000,000 | 1,998,637 |
| Sempra Global | | | | |
| 4/2/20 | | 1.86 | 1,000,000 | 999,860 |
| 4/3/20 | | 1.86 | 1,000,000 | 999,785 |
| 4/7/20 | | 1.86 | 1,000,000 | 999,456 |
| 4/9/20 | | 1.78 | 1,000,000 | 999,272 |
| TransCanada PipeLines Ltd. | | | | |
| 4/2/20 to 4/13/20 | | 1.75 to 1.81 | 3,000,000 | 2,998,587 |
| TOTAL NON-FINANCIAL COMPANY COMMERCIAL PAPER | | | | |
| (Cost $24,643,423) | | | | 24,635,934 |
|
| U.S. Treasury Debt - 1.7% | | | | |
| U.S. Treasury Obligations - 1.7% | | | | |
| U.S. Treasury Bills | | | | |
| 5/7/20 | | 0.03 | 25,000,000 | 24,998,213 |
| U.S. Treasury Notes | | | | |
| 10/31/21 | | 0.39 (b)(c) | 3,000,000 | 3,008,413 |
| TOTAL U.S. TREASURY DEBT | | | | |
| (Cost $28,000,307) | | | | 28,006,626 |
|
| Other Instrument - 0.3% | | | | |
| Master Notes - 0.3% | | | | |
| Toyota Motor Credit Corp. | | | | |
| 4/7/20 | | | | |
| (Cost $5,000,000) | | 0.93 (b)(c)(e) | 5,000,000 | 5,000,000 |
|
| Variable Rate Demand Note - 0.2% | | | | |
| Michigan - 0.2% | | | | |
| Michigan Strategic Fund Ltd. Oblig. Rev. (Henry Ford Museum & Greenfield Village Proj.) Series 2002, 0.85% 4/1/20, LOC Comerica Bank, VRDN 4/1/20 | | | | |
| (Cost $3,870,000) | | 0.85 (b) | 3,870,000 | 3,870,000 |
|
| Non-Negotiable Time Deposit - 13.3% | | | | |
| Time Deposits - 13.3% | | | | |
| Abn Amro Bank NV(TD) | | | | |
| 4/1/20 | | 0.08 | 12,000,000 | 12,000,000 |
| Australia & New Zealand Banking Group Ltd. | | | | |
| 4/1/20 | | 0.05 | 13,000,000 | 13,000,000 |
| Bank of Nova Scotia | | | | |
| 4/1/20 | | 0.08 | 54,000,000 | 54,000,000 |
| Barclays Bank PLC | | | | |
| 4/1/20 | | 0.25 | 77,000,000 | 77,000,000 |
| Credit Agricole CIB | | | | |
| 4/1/20 | | 0.06 | 22,000,000 | 22,000,000 |
| Credit Suisse AG | | | | |
| 4/1/20 | | 0.10 | 26,000,000 | 26,000,000 |
| Landesbank Hessen-Thuringen London Branch | | | | |
| 4/3/20 | | 0.50 | 12,000,000 | 11,999,980 |
| Mizuho Bank Ltd. | | | | |
| 4/1/20 | | 0.03 | 7,000,000 | 7,000,000 |
| TOTAL NON-NEGOTIABLE TIME DEPOSIT | | | | |
| (Cost $223,000,000) | | | | 222,999,980 |
| U.S. Government Agency Repurchase Agreement -11.2% | | | |
| | | Maturity Amount | Value |
| In a joint trading account at 0.02% dated 3/31/20 due 4/1/20 (Collateralized by (U.S. Government Obligations) # | | $186,683,080 | $186,683,000 |
| With Deutsche Bank AG, New York at 0.02%, dated 3/31/20 due 4/1/20 (Collateralized by U.S. Treasury Obligations valued at $2,040,001, 0.05% - 3.00%, 3/31/25 - 10/1/49 | | 2,000,001 | 2,000,000 |
| TOTAL U.S. GOVERNMENT AGENCY REPURCHASE AGREEMENT | | | |
| (Cost $188,683,000) | | | 188,683,000 |
|
| U.S. Treasury Repurchase Agreement - 1.7% | | | |
| With: | | | |
| BNP Paribas, SA at 1.61%, dated 2/18/20 due 4/7/20 (Collateralized by U.S. Treasury Obligations valued at $6,131,798, 0.30% - 5.25%, 10/31/21 - 2/15/38) | | 6,024,150 | 6,000,000 |
| Credit Agricole CIB at 0.02%, dated 3/31/20 due 4/1/20 (Collateralized by U.S. Treasury Obligations valued at $5,134,069, 1.38% - 2.25%, 9/15/20 - 2/15/27) | | 5,000,003 | 5,000,000 |
| HSBC Securities, Inc. at 0.01%, dated 3/31/20 due 4/1/20 (Collateralized by U.S. Treasury Obligations valued at $3,087,982, 2.00%, 11/15/26) | | 3,000,001 | 3,000,000 |
| ING Financial Markets LLC at 0.01%, dated 3/31/20 due 4/1/20 (Collateralized by U.S. Treasury Obligations valued at $6,136,450, 1.38%, 6/30/23) | | 6,000,002 | 6,000,000 |
| MUFG Securities EMEA PLC at 0.01%, dated 3/31/20 due 4/1/20: | | | |
| (Collateralized by U.S. Treasury Obligations valued at $5,119,074, 1.50% - 2.25%, 9/30/21 - 8/15/46) | | 5,000,001 | 5,000,000 |
| (Collateralized by U.S. Treasury Obligations valued at $3,067,080, 2.00% - 2.25%, 5/31/24 - 8/15/46) | | 3,000,001 | 3,000,000 |
| TOTAL U.S. TREASURY REPURCHASE AGREEMENT | | | |
| (Cost $28,000,000) | | | 28,000,000 |
|
| Other Repurchase Agreement - 9.9% | | | |
| Other Repurchase Agreement - 9.9% | | | |
| With: | | | |
| BMO Capital Markets Corp. at 0.43%, dated 3/31/20 due 4/1/20 (Collateralized by Corporate Obligations valued at $17,998,285, 2.50% - 8.75%, 5/15/22 - 9/15/44) | | 17,000,203 | 17,000,000 |
| BNP Paribas at 0.33%, dated 3/31/20 due 4/1/20 (Collateralized by Corporate Obligations valued at $7,350,068, 2.40% - 6.30%, 2/1/23 - 1/1/50) | | 7,000,064 | 7,000,000 |
| BofA Securities, Inc. at 0.58%, dated 3/31/20 due 4/1/20 (Collateralized by U.S. Treasury Obligations valued at $3,450,056, 0.50% - 3.00%, 3/31/25 - 10/1/49) | | 3,000,048 | 3,000,000 |
| Citigroup Global Markets, Inc. at: | | | |
| 1.01%, dated 10/18/19 due 4/15/20 (Collateralized by Corporate Obligations valued at $3,241,288, 0.62% - 2.79%, 11/5/35 - 11/25/47)(b)(c)(f) | | 3,015,174 | 3,000,000 |
| 1.21%, dated 11/12/19 due 5/5/20 (Collateralized by Corporate Obligations valued at $4,322,909, 1.45% - 4.04%, 10/3/45 - 10/6/46)(b)(c)(f) | | 4,024,362 | 4,000,000 |
| 1.81%, dated 3/4/20 due 5/5/20 (Collateralized by Corporate Obligations valued at $2,102,273, 0.00% - 5.92%, 10/20/28 - 1/12/39)(b)(c)(f) | | 2,018,057 | 1,998,238 |
| 2.07%, dated 2/24/20 due 5/27/20 (Collateralized by Municipal Bond Obligations valued at $3,246,570, 0.00% - 1.63%, 10/31/26 - 7/1/42) | | 3,016,043 | 3,000,000 |
| Credit AG CIB Paris at 0.8%, dated: | | | |
| 3/27/20 due 4/3/20 (Collateralized by Corporate Obligations valued at $1,050,117, 2.75%, 1/11/23) | | 1,000,156 | 1,000,000 |
| 3/31/20 due 4/6/20 (Collateralized by Corporate Obligations valued at $3,150,070, 2.75% - 2.91%, 1/11/23 - 10/2/23) | | 3,000,400 | 3,000,000 |
| 4/1/20 due 4/7/20 (Collateralized by U.S. Treasury Obligations)(g) | | 3,000,400 | 3,000,000 |
| Credit Suisse Securities (U.S.A.) LLC at 1.66%, dated 3/2/20 due 6/4/20 (Collateralized by Mortgage Loan Obligations valued at $3,154,358, 4.23%, 2/16/46) | | 3,020,750 | 3,005,104 |
| Deutsche Bank AG at 0.58%, dated 3/31/20 due 4/1/20 (Collateralized by Corporate Obligations valued at $4,080,538, 0.00% - 2.50%, 2/10/22 - 11/1/29) | | 4,000,064 | 4,000,000 |
| HSBC Securities, Inc. at 0.43%, dated 3/31/20 due 4/1/20 (Collateralized by Corporate Obligations valued at $7,350,088, 3.30% - 4.25%, 11/28/22 - 10/15/50) | | 7,000,084 | 7,000,000 |
| ING Financial Markets LLC at: | | | |
| 0.25%, dated 3/31/20 due 4/1/20 (Collateralized by Corporate Obligations valued at $1,050,008, 2.35% - 4.45%, 1/15/22 - 9/15/24) | | 1,000,007 | 1,000,000 |
| 0.3%, dated 3/31/20 due 4/1/20 (Collateralized by Equity Securities valued at $1,080,025) | | 1,000,008 | 1,000,000 |
| 1.32%, dated 3/5/20 due 5/4/20 (Collateralized by Equity Securities valued at $3,243,237) | | 3,006,600 | 3,000,000 |
| J.P. Morgan Securities, LLC at 0.34%, dated 3/12/20 due 4/7/20 (Collateralized by Equity Securities valued at $12,964,483)(b)(c)(f) | | 12,002,833 | 12,000,000 |
| Mitsubishi UFJ Securities (U.S.A.), Inc. at 0.38%, dated 3/31/20 due 4/1/20 (Collateralized by Equity Securities valued at $4,320,054) | | 4,000,042 | 4,000,000 |
| Mizuho Securities U.S.A., Inc. at: | | | |
| 0.53%, dated 3/31/20 due 4/1/20 (Collateralized by U.S. Government Obligations valued at $2,040,031, 3.00%, 3/1/50) | | 2,000,029 | 2,000,000 |
| 0.58%, dated 3/31/20 due 4/1/20: | | | |
| (Collateralized by U.S. Government Obligations valued at $1,020,017, 3.00%, 3/1/50) | | 1,000,016 | 1,000,000 |
| (Collateralized by Equity Securities valued at $10,800,176) | | 10,000,161 | 10,000,000 |
| 1.08%, dated 3/31/20 due 4/1/20 (Collateralized by U.S. Government Obligations valued at $4,080,123, 3.00%, 3/1/50) | | 4,000,120 | 4,000,000 |
| 2.08%, dated 2/25/20 due 4/27/20 (Collateralized by Municipal Bond Obligations valued at $2,104,369, 4.00%, 3/1/36) | | 2,007,164 | 2,000,000 |
| Morgan Stanley & Co., Inc. at 2.08%, dated 2/5/20 due 5/5/20 (Collateralized by Mortgage Loan Obligations valued at $1,116,384, 1.09% - 9.00%, 8/20/20 - 5/15/67) | | 1,005,200 | 1,001,230 |
| RBS Securities, Inc. at 0.35%, dated 3/31/20 due 4/1/20 (Collateralized by U.S. Treasury Obligations valued at $4,080,064, 0.99% - 1.88%, 2/21/23 - 8/31/24) | | 4,000,039 | 4,000,000 |
| Societe Generale at: | | | |
| 0.45%, dated 3/31/20 due 4/1/20 (Collateralized by Corporate Obligations valued at $7,350,096, 0.68% - 6.38%, 11/16/20 - 1/21/44) | | 7,000,088 | 7,000,000 |
| 0.5%, dated 3/31/20 due 4/1/20 (Collateralized by Corporate Obligations valued at $9,579,814, 0.68% - 12.00%, 8/15/20 - 4/4/51) | | 9,000,125 | 9,000,000 |
| 0.55%, dated 3/31/20 due 4/1/20 (Collateralized by Corporate Obligations valued at $8,452,697, 1.13% - 8.50%, 5/27/21 - 7/17/47) | | 8,000,122 | 8,000,000 |
| 0.6%, dated 3/31/20 due 4/7/20 (Collateralized by Corporate Obligations valued at $4,266,914, 0.75% - 9.00%, 8/15/21 - 7/15/28) | | 4,000,467 | 4,000,000 |
| 0.65%, dated 3/31/20 due 4/7/20 (Collateralized by Mortgage Loan Obligations valued at $1,076,600, 0.68% - 8.15%, 11/4/20 - 3/24/51) | | 1,000,126 | 1,000,000 |
| Wells Fargo Securities, LLC at: | | | |
| 0.55%, dated 3/31/20 due 4/1/20 (Collateralized by Commercial Paper valued at $6,180,095, 6/15/20) | | 6,000,092 | 6,000,000 |
| 0.75%, dated 3/31/20 due 4/1/20: | | | |
| (Collateralized by Corporate Obligations valued at $14,040,293, 0.75% - 5.25%, 7/1/21 - 1/1/27) | | 13,000,271 | 13,000,000 |
| (Collateralized by Corporate Obligations valued at $4,320,090, 0.00% - 6.50%, 3/15/21 - 5/15/48) | | 4,000,083 | 4,000,000 |
| (Collateralized by Corporate Obligations valued at $4,320,090, 1.08% - 6.04%, 11/25/32 - 4/7/52) | | 4,000,083 | 4,000,000 |
| 0.8%, dated 3/30/20 due 4/6/20 (Collateralized by Corporate Obligations valued at $6,480,471, 1.00% - 3.00%, 7/1/20 - 1/15/25) | | 6,000,933 | 6,000,000 |
| | | | |
| TOTAL OTHER REPURCHASE AGREEMENTS | | | |
| (Cost $167,000,000) | | | 167,004,572 |
| TOTAL INVESTMENT IN SECURITIES - 100.2% | | | |
| (Cost $1,681,403,775) | | | 1,681,116,327 |
| NET OTHER ASSETS (LIABILITIES) - (0.2)% | | | (3,213,236) |
| NET ASSETS - 100% | | | $1,677,903,091 |
The date shown for securities represents the date when principal payments must be paid, taking into account any call options exercised by the issuer and any permissible maturity shortening features other than interest rate resets.
Legend
(a) Yield represents either the annualized yield at the date of purchase, or the stated coupon rate, or, for floating and adjustable rate securities, the rate at period end.
(b) Coupon rates for floating and adjustable rate securities reflect the rates in effect at period end.
(c) Coupon is indexed to a floating interest rate which may be multiplied by a specified factor and/or subject to caps or floors.
(d) Security exempt from registration under Rule 144A of the Securities Act of 1933. These securities may be resold in transactions exempt from registration, normally to qualified institutional buyers. At the end of the period, the value of these securities amounted to $4,996,052 or 0.3% of net assets.
(e) Restricted securities (including private placements) - Investment in securities not registered under the Securities Act of 1933 (excluding 144A issues). At the end of the period, the value of restricted securities (excluding 144A issues) amounted to $5,000,000 or 0.3% of net assets.
(f) The maturity amount is based on the rate at period end.
(g) Represents a forward settling transaction and therefore no collateral securities had been allocated as of period end. The agreement contemplated the delivery of U.S. Treasury Obligations as collateral on settlement date.
Additional information on each restricted holding is as follows:
| Security | Acquisition Date | Cost |
| Toyota Motor Credit Corp. 0.93%, 4/7/20 | 3/2/20 | $5,000,000.00 |
Investment Valuation
All investments are categorized as Level 2 under the Fair Value Hierarchy. The inputs or methodology used for valuing securities may not be an indication of the risk associated with investing in those securities. For more information on valuation inputs please refer to the Investment Valuation section in the accompanying Notes to Financial Statements.
Other Information
# Additional information on each counterparty to the repurchase agreement is as follows:
| Repurchase Agreement / Counterparty | Value |
| $186,683,000 due 4/01/20 at 0.02% | |
| BNP Paribas, S.A. | $16,572,000 |
| BNY Mellon Capital Markets LLC | 10,959,000 |
| Bank Of America, N.A. | 9,699,000 |
| Bank of Nova Scotia | 1,176,000 |
| Bofa Secs Inc | 5,110,000 |
| Citibank NA | 4,130,000 |
| Citigroup Global Markets, Inc. | 101,000 |
| HSBC Securities (USA), Inc. | 13,912,000 |
| ING Financial Markets LLC | 881,000 |
| Jp Morgan Secs Llc | 37,597,000 |
| Mitsubishi Ufj Secs Hldgs Ltd | 8,565,000 |
| Mitsubishi Ufj Securities (USA | 1,049,000 |
| Mizuho Securities USA, Inc. | 3,075,000 |
| Nomura Securities Internationa | 24,159,000 |
| Societe Generale (PARIS) | 5,447,000 |
| Sumitomo Mitsu Bk Corp Ny (DI) | 3,409,000 |
| Sumitomo Mitsui Bk Corp (REPO) | 29,841,000 |
| Wells Fargo Securities LLC | 11,001,000 |
| | $186,683,000 |
See accompanying notes which are an integral part of the financial statements.
Financial Statements
Statement of Assets and Liabilities
| | | March 31, 2020 (Unaudited) |
| Assets | | |
Investment in securities, at value (including repurchase agreements of $383,687,572) — See accompanying schedule:
Unaffiliated issuers (cost $1,681,403,775) | | $1,681,116,327 |
| Receivable for fund shares sold | | 102,406 |
| Interest receivable | | 684,061 |
| Total assets | | 1,681,902,794 |
| Liabilities | | |
| Payable to custodian bank | $15 | |
| Payable for investments purchased | 3,000,000 | |
| Payable for fund shares redeemed | 952,830 | |
| Other payables and accrued expenses | 46,858 | |
| Total liabilities | | 3,999,703 |
| Net Assets | | $1,677,903,091 |
| Net Assets consist of: | | |
| Paid in capital | | $1,678,121,616 |
| Total accumulated earnings (loss) | | (218,525) |
| Net Assets | | $1,677,903,091 |
| Net Asset Value, offering price and redemption price per share ($1,677,903,091 ÷ 1,678,194,407 shares) | | $.9998 |
See accompanying notes which are an integral part of the financial statements.
Statement of Operations
| | | Six months ended March 31, 2020 (Unaudited) |
| Investment Income | | |
| Interest (including $131,181 from affiliated interfund lending) | | $16,001,303 |
| Expenses | | |
| Custodian fees and expenses | $68,733 | |
| Independent trustees' fees and expenses | 3,204 | |
| Interest | 16,933 | |
| Total expenses before reductions | 88,870 | |
| Expense reductions | (337) | |
| Total expenses after reductions | | 88,533 |
| Net investment income (loss) | | 15,912,770 |
| Realized and Unrealized Gain (Loss) | | |
| Net realized gain (loss) on: | | |
| Investment securities: | | |
| Unaffiliated issuers | | 3,883 |
| Total net realized gain (loss) | | 3,883 |
| Change in net unrealized appreciation (depreciation) on investment securities | | (335,056) |
| Net increase in net assets resulting from operations | | $15,581,597 |
See accompanying notes which are an integral part of the financial statements.
Statement of Changes in Net Assets
| | Six months ended March 31, 2020 (Unaudited) | Year ended September 30, 2019 |
| Increase (Decrease) in Net Assets | | |
| Operations | | |
| Net investment income (loss) | $15,912,770 | $45,517,809 |
| Net realized gain (loss) | 3,883 | 5,116 |
| Change in net unrealized appreciation (depreciation) | (335,056) | (36,763) |
| Net increase in net assets resulting from operations | 15,581,597 | 45,486,162 |
| Distributions to shareholders | (15,912,672) | (45,517,833) |
| Affiliated share transactions | | |
| Proceeds from sales of shares | 127,934,789 | 219,693,319 |
| Reinvestment of distributions | 15,912,672 | 45,517,833 |
| Cost of shares redeemed | (286,445,101) | (136,395,201) |
| Net increase (decrease) in net assets and shares resulting from share transactions | (142,597,640) | 128,815,951 |
| Total increase (decrease) in net assets | (142,928,715) | 128,784,280 |
| Net Assets | | |
| Beginning of period | 1,820,831,806 | 1,692,047,526 |
| End of period | $1,677,903,091 | $1,820,831,806 |
| Other Information | | |
| Shares | | |
| Sold | 127,918,385 | 219,676,161 |
| Issued in reinvestment of distributions | 15,910,541 | 45,515,159 |
| Redeemed | (286,402,463) | (136,386,867) |
| Net increase (decrease) | (142,573,537) | 128,804,453 |
See accompanying notes which are an integral part of the financial statements.
Financial Highlights
Fidelity Money Market Central Fund
| | Six months ended (Unaudited) March 31, | Years endedSeptember 30, | | | | |
| | 2020 | 2019 | 2018 | 2017 | 2016 A | 2015 |
| Selected Per–Share Data | | | | | | |
| Net asset value, beginning of period | $1.0000 | $1.0000 | $1.0001 | $1.0002 | $1.0000 | $1.00 |
| Income from Investment Operations | | | | | | |
| Net investment income (loss) | .0092 | .0253 | .0190 | .0117 | .0062 | .003 |
| Net realized and unrealized gain (loss) | (.0002) | –B | (.0001) | (.0001) | .0003 | –B |
| Total from investment operations | .0090 | .0253 | .0189 | .0116 | .0065 | .003 |
| Distributions from net investment income | (.0092) | (.0253) | (.0190) | (.0117) | (.0062) | (.003) |
| Distributions from net realized gain | – | – | – | – | (.0001) | – |
| Total distributions | (.0092) | (.0253) | (.0190) | (.0117) | (.0063) | (.003) |
| Net asset value, end of period | $.9998 | $1.0000 | $1.0000 | $1.0001 | $1.0002 | $1.00 |
| Total ReturnC,D | .90% | 2.56% | 1.91% | 1.16% | .66% | .29% |
| Ratios to Average Net AssetsE | | | | | | |
| Expenses before reductions | .01%F | .01% | - %G | - %G | - %G | - %G |
| Expenses net of fee waivers, if any | .01%F | .01% | - %G | - %G | - %G | - %G |
| Expenses net of all reductions | .01%F | .01% | - %G | - %G | - %G | - %G |
| Net investment income (loss) | 1.84%F | 2.53% | 1.89% | 1.18% | .64% | .29% |
| Supplemental Data | | | | | | |
| Net assets, end of period (000 omitted) | $1,677,903 | $1,820,832 | $1,692,048 | $2,179,954 | $1,820,790 | $1,225,937 |
A Beginning September 12, 2016 the Fund began selling and redeeming class shares based upon the market-based value of the securities held rounded to the fourth decimal place; a "floating" net asset value.
B Amount represents less than $.00005 or $.0005 per share.
C Total returns for periods of less than one year are not annualized.
D Total returns would have been lower if certain expenses had not been reduced during the applicable periods shown.
E Expense ratios reflect operating expenses of the Fund. Expenses before reductions do not reflect amounts reimbursed or waived or reductions from expense offset arrangements and do not represent the amount paid by the Fund during periods when reimbursements, waivers or reductions occur. Expenses net of fee waivers reflect expenses after reimbursement and waivers but prior to reductions from expense offset arrangements. Expenses net of all reductions represent the net expenses paid by the Fund.
F Annualized
G Amount represents less than .005%.
See accompanying notes which are an integral part of the financial statements.
Notes to Financial Statements (Unaudited)
For the period ended March 31, 2020
1. Organization.
Fidelity Money Market Central Fund (the Fund) is a fund of Fidelity Garrison Street Trust (the Trust) and is authorized to issue an unlimited number of shares. The Trust is registered under the Investment Company Act of 1940, as amended (the 1940 Act), as an open-end management investment company organized as a Massachusetts business trust. Shares of the Fund are only offered to other investment companies and accounts (the Investing Funds) managed by Fidelity Management & Research Company LLC (FMR), or its affiliates. The Fund has been designated an institutional money market fund, and the value of the Fund's shares are calculated to four decimal places that fluctuates based upon changes in the value of the Fund's investments.
Effective January 1, 2020, investment advisers Fidelity Investments Money Management, Inc., FMR Co., Inc., and Fidelity SelectCo, LLC, merged with and into Fidelity Management & Research Company. In connection with the merger transactions, the resulting, merged investment adviser was then redomiciled from Massachusetts to Delaware, changed its corporate structure from a corporation to a limited liability company, and changed its name to "Fidelity Management & Research Company LLC".
2. Significant Accounting Policies.
The Fund is an investment company and applies the accounting and reporting guidance of the Financial Accounting Standards Board (FASB) Accounting Standards Codification Topic 946 Financial Services – Investments Companies. The financial statements have been prepared in conformity with accounting principles generally accepted in the United States of America (GAAP), which require management to make certain estimates and assumptions at the date of the financial statements. Actual results could differ from those estimates. Subsequent events, if any, through the date that the financial statements were issued have been evaluated in the preparation of the financial statements. The following summarizes the significant accounting policies of the Fund:
Investment Valuation. Investments are valued as of 4:00 p.m. Eastern time on the last calendar day of the period. The Board of Trustees (the Board) has delegated the day to day responsibility for the valuation of the Fund's investments to the Fair Value Committee (the Committee) established by the Fund's investment adviser. In accordance with valuation policies and procedures approved by the Board, the Fund attempts to obtain prices from one or more third party pricing vendors or brokers to value its investments. When current market prices, quotations or currency exchange rates are not readily available or reliable, investments will be fair valued in good faith by the Committee, in accordance with procedures adopted by the Board. Factors used in determining fair value vary by investment type and may include market or investment specific events, changes in interest rates and credit quality. The frequency with which these procedures are used cannot be predicted and they may be utilized to a significant extent. The Committee oversees the Fund's valuation policies and procedures and reports to the Board on the Committee's activities and fair value determinations. The Board monitors the appropriateness of the procedures used in valuing the Fund's investments and ratifies the fair value determinations of the Committee.
The Fund categorizes the inputs to valuation techniques used to value its investments into a disclosure hierarchy consisting of three levels as shown below:
Level 1 – quoted prices in active markets for identical investments
Level 2 – other significant observable inputs (including quoted prices for similar investments, interest rates, prepayment speeds, etc.)
Level 3 – unobservable inputs (including the Fund's own assumptions based on the best information available)
Valuation techniques used to value the Fund's investments by major category are as follows:
Debt securities, including restricted securities, are valued based on evaluated prices received from third party pricing vendors or from brokers who make markets in such securities. U.S. government and government agency obligations, commercial paper, certificates of deposit, master notes, municipal securities and other short-term securities are valued by pricing vendors who utilize matrix pricing which considers yield or price of bonds of comparable quality, coupon, maturity and type or by broker-supplied prices. When independent prices are unavailable or unreliable, debt securities may be valued utilizing pricing methodologies which consider similar factors that would be used by third party pricing vendors. Debt securities are generally categorized as Level 2 in the hierarchy but may be Level 3 depending on the circumstances.
Short-term securities with remaining maturities of sixty days or less may be valued at amortized cost, which approximates fair value, and are categorized as Level 2 in the hierarchy.
Securities held by a money market fund are generally high quality and liquid; however, they are reflected as Level 2 because the inputs used to determine fair value are not quoted prices in an active market.
Investment Transactions and Income. Security transactions are accounted for as of trade date. Gains and losses on securities sold are determined on the basis of identified cost. Interest income is accrued as earned and includes coupon interest and amortization of premium and accretion of discount on debt securities as applicable.
The principal amount on inflation-indexed securities is periodically adjusted to the rate of inflation and interest is accrued based on the principal amount. The adjustments to principal due to inflation are reflected as increases or decreases to Interest in the accompanying Statement of Operations.
Expenses. Expenses directly attributable to a fund are charged to that fund. Expenses attributable to more than one fund are allocated among the respective funds on the basis of relative net assets or other appropriate methods. Expense estimates are accrued in the period to which they relate and adjustments are made when actual amounts are known.
Income Tax Information and Distributions to Shareholders. Each year, the Fund intends to qualify as a regulated investment company under Subchapter M of the Internal Revenue Code, including distributing substantially all of its taxable income and realized gains. As a result, no provision for U.S. Federal income taxes is required. The Fund files a U.S. federal tax return, in addition to state and local tax returns as required. The Fund's federal income tax returns are subject to examination by the Internal Revenue Service (IRS) for a period of three fiscal years after they are filed. State and local tax returns may be subject to examination for an additional fiscal year depending on the jurisdiction.
Distributions are declared and recorded daily and paid monthly from net investment income. Distributions from realized gains, if any, are declared and recorded on the ex-dividend date. Income and capital gain distributions are determined in accordance with income tax regulations, which may differ from GAAP.
Capital accounts within the financial statements are adjusted for permanent book-tax differences. These adjustments have no impact on net assets or the results of operations. Capital accounts are not adjusted for temporary book-tax differences which will reverse in a subsequent period.
As of period end, the cost and unrealized appreciation (depreciation) in securities for federal income tax purposes were as follows:
| Gross unrealized appreciation | $235,691 |
| Gross unrealized depreciation | (523,139) |
| Net unrealized appreciation (depreciation) | $(287,448) |
| Tax cost | $1,681,403,775 |
Repurchase Agreements. Pursuant to an Exemptive Order issued by the Securities and Exchange Commission (the SEC), the Fund along with other registered investment companies having management contracts with FMR, or other affiliated entities of FMR, are permitted to transfer uninvested cash balances into joint trading accounts which are then invested in repurchase agreements. The Fund may also invest directly with institutions in repurchase agreements. Upon settlement date, collateral is held in segregated accounts with custodian banks and may be obtained in the event of a default of the counterparty. The Fund monitors, on a daily basis, the value of the collateral to ensure it is at least equal to the principal amount of the repurchase agreement (including accrued interest). In the event of a default by the counterparty, realization of the collateral proceeds could be delayed, during which time the value of the collateral may decline.
Reverse Repurchase Agreements. To enhance its yield, the Fund may enter into reverse repurchase transactions under master repurchase agreements whereby the Fund sells securities to a counterparty in return for cash and agrees to repurchase those securities at a future date and agreed upon price. During the period that reverse repurchase transactions are outstanding, the Fund identifies the securities as pledged in its records with an initial value at least equal to its principal obligation under the agreement. The cash proceeds received by the Fund may be invested in other securities. To the extent cash proceeds received from the counterparty exceed the value of the securities sold, the counterparty may request additional collateral from the Fund. If the counterparty defaults on its obligation, because of insolvency or other reasons, the Fund could experience delays and costs in recovering the securities sold. Information regarding securities sold under a reverse repurchase agreement, if any, is included at the end of the Fund's Schedule of Investments and the cash proceeds are recorded as a liability in the accompanying Statement of Assets and Liabilities. The Fund continues to receive interest and dividend payments on the securities sold during the term of the reverse repurchase agreement. During the period, the average principal balance of reverse repurchase transactions was $25,015,409 and the weighted average interest rate was 1.22% with payments included in the Statement of Operations as a component of interest expense. At period end, there were no reverse repurchase agreements outstanding.
Restricted Securities (including Private Placements). The Fund may invest in securities that are subject to legal or contractual restrictions on resale. These securities generally may be resold in transactions exempt from registration or to the public if the securities are registered. Disposal of these securities may involve time-consuming negotiations and expense, and prompt sale at an acceptable price may be difficult. Information regarding restricted securities is included at the end of the Fund's Schedule of Investments.
3. Fees and Other Transactions with Affiliates.
Management Fee and Expense Contract. Fidelity Management & Research Company LLC (the investment adviser) provides the Fund with investment management services. The Fund does not pay any fees for these services. Pursuant to the Fund's management contract, the investment adviser receives a monthly management fee that represents a portion of the management fees it receives from the Investing Funds. In addition, under an expense contract, the investment adviser also pays all other expenses of the Fund, excluding custody fees, the compensation of the independent Trustees, and certain miscellaneous expenses such as proxy and shareholder meeting expenses.
Interfund Lending Program. Pursuant to an Exemptive Order issued by the SEC, the fund, along with other registered investment companies having management contracts with FMR, or other affiliated entities of FMR, may participate in an interfund lending program. This program provides an alternative credit facility allowing the fund to borrow from, or lend money to, other participating affiliated funds. At period end, there were no interfund loans outstanding. Activity in this program during the period for which loans were outstanding was as follows:
| | | Average Loan Balance | Weighted Average Interest Rate |
| Fidelity Money Market Central Fund | Lender | 32,045,000 | 1.34% |
Interfund Trades. Funds may purchase from or sell securities to other Fidelity Funds under procedures adopted by the Board. The procedures have been designed to ensure these interfund trades are executed in accordance with Rule 17a-7 of the 1940 Act.
4. Expense Reductions.
Through arrangements with the Fund's custodian, credits realized as a result of certain uninvested cash balances were used to reduce the Fund's expenses by $337.
5. Other.
The Fund's organizational documents provide former and current trustees and officers with a limited indemnification against liabilities arising in connection with the performance of their duties to the Fund. In the normal course of business, the Fund may also enter into contracts that provide general indemnifications. The Fund's maximum exposure under these arrangements is unknown as this would be dependent on future claims that may be made against the Fund. The risk of material loss from such claims is considered remote.
At the end of the period, mutual funds managed by the investment adviser or its affiliates were the owners of record of all of the outstanding shares of the Fund.
6. Coronavirus (COVID-19) Pandemic.
An outbreak of COVID-19 first detected in China during December 2019 has since spread globally and was declared a pandemic by the World Health Organization during March 2020. Developments that disrupt global economies and financial markets, such as the COVID-19 pandemic, may magnify factors that affect the Fund's performance.
Shareholder Expense Example
As a shareholder of the Fund, you incur two types of costs: (1) transaction costs, and (2) ongoing costs, including other Fund expenses. This Example is intended to help you understand your ongoing costs (in dollars) of investing in the Fund and to compare these costs with the ongoing costs of investing in other mutual funds.
The Example is based on an investment of $1,000 invested at the beginning of the period and held for the entire period (October 1, 2019 to March 31, 2020).
Actual Expenses
The first line of the accompanying table provides information about actual account values and actual expenses. You may use the information in this line, together with the amount you invested, to estimate the expenses that you paid over the period. Simply divide your account value by $1,000.00 (for example, an $8,600 account value divided by $1,000.00 = 8.6), then multiply the result by the number in the first line under the heading entitled "Expenses Paid During Period" to estimate the expenses you paid on your account during this period.
Hypothetical Example for Comparison Purposes
The second line of the accompanying table provides information about hypothetical account values and hypothetical expenses based on the Fund's actual expense ratio and an assumed rate of return of 5% per year before expenses, which is not the Fund's actual return. The hypothetical account values and expenses may not be used to estimate the actual ending account balance or expenses you paid for the period. You may use this information to compare the ongoing costs of investing in the Fund and other funds. To do so, compare this 5% hypothetical example with the 5% hypothetical examples that appear in the shareholder reports of the other funds.
Please note that the expenses shown in the table are meant to highlight your ongoing costs only and do not reflect any transaction costs. Therefore, the second line of the table is useful in comparing ongoing costs only, and will not help you determine the relative total costs of owning different funds.
| | Annualized Expense Ratio-A | Beginning
Account Value
October 1, 2019 | Ending
Account Value
March 31, 2020 | Expenses Paid
During Period-B
October 1, 2019
to March 31, 2020 |
| Actual | .0103% | $1,000.00 | $1,009.00 | $.05 |
| Hypothetical-C | | $1,000.00 | $1,024.95 | $.05 |
A Annualized expense ratio reflects expenses net of applicable fee waivers.
B Expenses are equal to the Fund's annualized expense ratio, multiplied by the average account value over the period, multiplied by 183/366 (to reflect the one-half year period).
C 5% return per year before expenses

CFM-SANN-0520
1.756671.119