UNITED STATES
SECURITIES AND EXCHANGE COMMISSION
Washington, D.C. 20549
FORM N-CSR
CERTIFIED SHAREHOLDER REPORT OF REGISTERED
MANAGEMENT INVESTMENT COMPANIES
| Investment Company Act file number | 811-4854 |
The Oberweis Funds
(Exact name of registrant as specified in charter)
3333 Warrenville Road, Suite 500, Lisle, IL 60532
(Address of principal executive offices) (Zip code)
| James W. Oberweis The Oberweis Funds 3333 Warrenville Road, Suite 500 Lisle, IL 60532 | Copy to: James A. Arpaia Vedder Price P.C. 222 North LaSalle Street, Suite 2600 Chicago, IL 60601 |
(Name and address of agent for service)
Registrant’s telephone number, including area code: (800) 323-6166
Date of fiscal year end: December 31
Date of reporting period: June 30, 2022
Form N-CSR is to be used by management investment companies to file reports with the Commission not later than 10 days after the transmission to stockholders of any report that is required to be transmitted to stockholders under Rule 30e-1 under the Investment Company Act of 1940 (17 CFR 270.30e-1). The Commission may use the information provided on Form N-CSR in its regulatory, disclosure review, inspection, and policymaking roles.
A registrant is required to disclose the information specified by Form N-CSR, and the Commission will make this information public. A registrant is not required to respond to the collection of information contained in Form N-CSR unless the Form displays a currently valid Office of Management and Budget (“OMB”) control number. Please direct comments concerning the accuracy of the information collection burden estimate and any suggestions for reducing the burden to Secretary, Securities and Exchange Commission, 450 Fifth Street, NW, Washington, DC 20549-0609. The OMB has reviewed this collection of information under the clearance requirements of 44 U.S.C. § 3507.
ITEM 1. REPORTS TO STOCKHOLDERS.
Semi-Annual Reports for the period 01/01/22 through 06/30/22 is filed herewith

SEMI-ANNUAL REPORT | ||||||||
INVESTOR | INSTITUTIONAL | |||||||
Oberweis Micro-Cap Fund | OBMCX | OMCIX | ||||||
Oberweis Small-Cap Opportunities Fund | OBSOX | OBSIX | ||||||
Oberweis Global Opportunities Fund | OBEGX | OBGIX | ||||||
Oberweis China Opportunities Fund | OBCHX | OCHIX | ||||||
Oberweis International Opportunities Fund | OBIOX | — | ||||||
Oberweis Emerging Markets Fund | OBEMX | OIEMX | ||||||
June 30, 2022 | ||||||||
oberweisfunds.com | ||||||||
Beginning on January 1, 2021, as permitted by regulations adopted by the Securities and Exchange Commission, paper copies of the Fund’s shareholder reports will no longer be sent by mail, unless you specifically request paper copies of the reports from the Fund or from your financial intermediary, such as a broker-dealer or bank. Instead, the reports will be made available on www.oberweisfunds.com and you will be notified by mail each time a report is posted and provided with a website link to access the report.
If you already elected to receive shareholder reports electronically, you will not be affected by this change and you need not take any action. You may elect to receive shareholder reports and other communications from the Fund or your financial intermediary electronically by contacting us at 1-800-245-7311.
You may elect to receive all future reports in paper free of charge. You can inform the Fund or your financial intermediary that you wish to continue receiving paper copies of your shareholder reports by contacting us at 1-800-245-7311. Your election to receive reports in paper will apply to all funds held with the fund complex.
TABLE OF CONTENTS
1 | ||
Fund Overview | ||
5 | ||
5 | ||
6 | ||
6 | ||
7 | ||
7 | ||
Schedule of Investments | ||
8 | ||
12 | ||
16 | ||
19 | ||
22 | ||
25 | ||
Statements of Assets and Liabilities | ||
28 | ||
28 | ||
28 | ||
29 | ||
29 | ||
29 | ||
Statements of Operations | ||
30 | ||
30 | ||
31 | ||
31 | ||
31 | ||
31 | ||
Statements of Changes in Net Assets | ||
32 | ||
33 | ||
34 | ||
35 | ||
36 | ||
37 | ||
38 | ||
Financial Highlights | ||
47 | ||
49 | ||
51 | ||
53 | ||
55 | ||
56 | ||
58 |
PRESIDENT’S LETTER (unaudited)
Dear Fellow Oberweis Funds Shareholder,
YEAR-TO-DATE PERFORMANCE THROUGH June 30, 2022
Global equity markets closed out their worst first half in over fifty years, as surging inflation, interest rate hikes by the U.S. Federal Reserve, and Russia’s war in Ukraine stoked recessionary fears. Not surprisingly, each of the Oberweis Funds declined in the first half of 2022. The Micro-Cap Fund returned -21.91% versus -33.04% for the Russell Micro-Cap Growth Index. The Small-Cap Opportunities Fund returned -22.42% versus -29.45% for the Russell 2000 Growth Index. Among our international funds, the International Opportunities Fund returned -36.68% versus -29.55% for the MSCI World ex-US Small-Cap Growth Index. The China Opportunities Fund returned -21.72% versus -11.26% for the MSCI China Index, and the Emerging Markets Fund returned -23.11% versus -20.03% for the MSCI EM Small-Cap Index. The Global Opportunities Fund returned -34.88% versus -22.27% for the MSCI ACWI Small-Cap Index. Notably, despite significant headwinds for our growth-oriented investment style, the Micro-Cap and Small-Cap Funds still materially outperformed their benchmarks in the first half, primarily due to a focus on profitable companies and favorable stock selection in those funds.
MARKET ENVIRONMENT
Concerns over inflation, and more specifically whether central banks can bring the rate of inflation down without causing a recession, continued to impact equity returns in nearly every geographic region. Additionally, energy concerns remain front and center in Europe, with the EU scrambling to find enough natural gas for this winter to offset a reduction in supply from Russia. In China, lockdowns associated with China’s zero-COVID policy pressured economic growth and political leadership, particularly in Shanghai. In the US, inflation and interest rate hikes by the Fed have curbed economic growth, although the data remains mixed as to the degree.
While virtually all equity asset classes were down significantly in the first half, the pain was particularly acute for “growth” stocks, which were punished much more than their “value” counterparts. Unexpected increases in interest rates have often been the scourge of growth equities. Growth stocks — by definition — are valued based on the potential for significant earnings growth years into the future. When interest rates rise, the present value of future earnings declines, so, all else equal, they should be worth less (assuming the change was not already anticipated). “Value” stocks also suffer from a lower net present value, but with a smaller share of their cash flows far out into the future, the impact of rising rates tends to be less severe.
The real culprit for growth underperformance in the first half was P/E multiple compression.In uncertain times, investors tend to gravitate toward perceived safety and are marginally less interested in pursuing the potential for higher returns from innovation and earnings growth. Instead, they prefer safe, predictable cash flows, which are typically characteristics of “value” stocks. As a result, the valuation gap between “growth” stocks relative to “value” stocks has compressed. Another way of thinking about it is that the multiple of today’s earnings that one must pay to participate in a potentially much larger future earnings stream has markedly declined as risk-aversion has risen.
All of this makes sense, to a point. There are many “unknowns” and we expect that inflation and the potential for recession will continue to drive daily volatility in the near term. It is rational for risk-aversion to be somewhat higher in this environment. But to what degree? Many small growth stocks are already down 30-40% or more, with P/E valuations for some of our funds among the lowest we have ever observed. Our Global Opportunities Fund, for example, has an average P/E today of 13.0x versus 25.1x a year ago. One might argue that valuations today
1
PRESIDENT’S LETTER (unaudited) (continued)
appear very cheap because earnings estimates remain too high. That’s plausible, but it is unlikely that actual earnings will be so far short of estimates to justify the P/E multiple contraction already experienced.
Perhaps counterintuitively, we are very excited about the current opportunity set and the potential for strong prospective returns. Historically, we tend to thrive coming out of environments like this, when expectations and valuations are exceptionally low and risk-aversion is high. Macroeconomic and political turmoil have taken, and may continue to take, their toll on near-term stock prices. However, what matters to investors in the long run is the earnings power of businesses, which is a function of the firm’s sales growth, margins, cash flows and the incremental return on capital reinvested in the business. We look for businesses with strong and growing earnings power protected by robust competitive advantages. The ability of those types of firms to create shareholder value is not permanently impaired by economic cycles, though they often trade as if that is the case. Broadly speaking, we believe many of the headline risks with respect to our holdings have already been discounted, and likely over-discounted. As a result, we are finding what we believe to be tremendous values in small-cap stocks around the world. No one can predict the future, but we believe the odds for above-average prospective returns are in our favor when buying amid valuations this cheap.
VALUATION RECAP
P/E valuations for many of the funds are significantly lower than average. As of June 30, 2022, the weighted-average price/earnings (P/E) ratio was 13.0 times for the Global Opportunities Fund (versus 16.2 last quarter), 10.7 times for the Small-Cap Opportunities Fund (versus 13.5 last quarter), 10.0 times for the Micro-Cap Fund (versus 12.8 last quarter), 13.9 times for the International Opportunities Fund (versus 18.6 last quarter), 24.6 times for the China Opportunities Fund (versus 16.3 last quarter), and 14.3 times for the Emerging Markets Fund (versus 18.2 times last quarter). Each of these funds invests in companies with expected earnings growth rates that are higher than that of the broader market, and in companies expected to grow faster than current market expectations. As of June 30, 2022, the weighted-average market capitalization was $4.5 billion for the Global Opportunities Fund, $2.8 billion for the Small-Cap Opportunities Fund, $1.2 billion for the Micro-Cap Fund, $3.7 billion for the International Opportunities Fund, $3.3 billion for the Emerging Markets Fund, and $44.9 billion for the China Opportunities Fund.
Thank you for investing with us in The Oberweis Funds.
Sincerely,

James W. Oberweis, CFA
President & Portfolio Manager
2
PRESIDENT’S LETTER (unaudited) (continued)
For current performance information, please visit www.oberweisfunds.com.
OBERWEIS FUNDS AVERAGE ANNUAL TOTAL RETURNS (%) (as of June 30, 2022)
| Ticker | Qtr | 1 Yr | 3 Yr | 5 Yr | 10 Yr | Life of | Expense | ||||||||
Global | OBEGX OBGIX1 | -19.59 -19.55 | -34.51 -34.34 | 8.65 8.94 | 5.58 5.84 | 9.08 9.35 | 8.27 8.54 | 1.38 1.13 | ||||||||
Micro-Cap
| OBMCX OMCIX1 | -14.68 -14.62 | -13.91 -13.65 | 15.30 15.61 | 13.62 13.90 | 16.15 16.44 | 10.81 11.09 | 1.48 1.23 | ||||||||
Small-Cap | OBSOX OBSIX1 | -16.37 -16.31 | -11.32 -11.06 | 15.25 15.54 | 14.44 14.73 | 13.28 13.57 | 8.00 8.27 | 1.25 1.00 | ||||||||
China | OBCHX OCHIX1 | 5.88 5.90 | -29.89 -29.77 | 9.15 9.38 | 7.74 8.00 | 10.97 11.24 | 10.94 11.21 | 1.87 1.62 | ||||||||
International | OBIOX | -22.99 | -39.44 | 2.56 | 2.57 | 10.53 | 7.21 | 1.60 | ||||||||
Emerging Markets
| OBEMX OIEMX | -15.21 -15.08 | -24.99 -24.81 | 9.85 10.12 | n/a n/a | n/a n/a | 4.52 4.79 | 1.75 1.50 |
Performance data shown represents past performance and is no guarantee of future results. Investment return and principal value will fluctuate, so that you may have gain or loss when shares are sold. Current performance may be higher or lower than quoted. Unusually high returns may not be sustainable. Visit us online at oberweisfunds.com for most recent month-end performance.
The Oberweis Funds invest in rapidly growing smaller and medium sized companies which may offer greater return potential. However, these investments often involve greater risks and volatility. Foreign investments involve greater risks than U.S investments, including political and economic risks and the risk of currency fluctuations. There is no guarantee that the funds can achieve their objectives. Holdings in the Funds are subject to change.
Before investing, consider the fund’s investment objectives, risks, charges, and expenses. To obtain a copy of the prospectus or summary prospectus containing this and other information please visit our website at oberweisfunds.com or call 800-323-6166. Read it carefully before investing. The Oberweis Funds are distributed by Oberweis Securities, Inc. Member: FINRA & SIPC.
1 Institutional Class shares OBGIX, OMCIX, OBSIX and OCHIX performance information was calculated using the historical performance of Investor Class shares for periods prior to May 1, 2017.
2 Life of Fund returns are from commencement of operations on 01/07/87 for the Global Opportunities Fund, 01/01/96 for the Micro-Cap Fund, 09/15/96 for the Small-Cap Opportunities Fund, 10/01/05 for the China Opportunities Fund, 02/01/07 for the International Opportunities Fund, 05/01/17 for the Institutional Share Classes and 05/01/18 for the Emerging Markets Fund Share Classes.
3 December 31, 2021 data. Expense ratio is the total net annualized fund operating expense ratio. The expense ratio gross of expense offset arrangements and expense reimbursements was 1.38%, 1.13%, 1.48%, 1.23%, 1.59%, 1.34%, 1.87%, 1.62%,1.77%, 2.80% and 2.55% for OBEGX, OBGIX, OBMCX, OMCIX, OBSOX, OBSIX, OBCHX, OCHIX, OBIOX, OBEMX and OIEMX respectively. Oberweis Asset Management, Inc. (OAM), the Fund’s investment advisor is contractually obligated through April 30, 2023 to reduce its management fees or reimburse OBEGX and OBMCX to the extent that total ordinary operating expenses, as defined, exceed in any one year the following amounts expressed as a percentage of each Fund’s average daily net assets: 1.8% of the first $50 million; plus 1.6% of average daily net assets in excess of $50 million and for OBGIX and OMCIX 1.55% of the first $50 million; plus 1.35% of average daily net assets in excess of $50 million. OAM is also contractually obligated through April 30, 2022 to reduce its management fees or reimburse OBSOX, OBCHX, OBIOX and OBEMX to the extent that total ordinary operating expenses exceed in any one year 1.25%, 2.24%, 1.60% and 1.75% expressed as a percentage of each Fund’s average daily net assets, respectively, and for OBSIX, OCHIX and OIEMX 1.00%, 1.99% and 1.50%, respectively.
3
PRESIDENT’S LETTER (unaudited) (continued)
The MSCI World ex-US Small Cap Growth Index (Net) is a free float-adjusted market capitalization weighted index that is designed to measure the equity market performance of small cap growth developed markets excluding the US, with minimum dividends reinvested net of withholding tax. The MSCI ACWI Small Cap Index (Net) is a free float-adjusted market capitalization weighted index that is designed to measure the equity market performance of small cap developed and emerging markets with dividends reinvested net of withholding tax. The MSCI Emerging Markets Small Cap Index is a free float-adjusted, market capitalization-weighted index that measures the performance of small-cap stocks in 24 emerging markets. The MSCI China Net Index is a free float-adjusted market capitalization-weighted Index of Chinese equities that include China-affiliated corporations and H shares listed on the Hong Kong Exchange, and B shares listed on the Shanghai and Shenzhen exchanges and P chips and foreign listings with minimum dividends reinvested net of withholding tax.
The Russell 2000 Index measures the performance of approximately 2,000 companies with small-market capitalizations. The Russell 2000 Growth Index measures the performance of those Russell 2000 companies with higher price-to-book ratios and higher forecasted earnings growth rates. The Russell Microcap Growth Index measures the performance of those Russell Micro Cap companies with higher price-to-book ratios and higher forecasted growth values. The performance data includes reinvested dividends. The Russell Microcap Index is represented by the smallest 1,000 securities in the small cap Russell 2000 Index plus the next 1,000 securities. Each index is an unmanaged group of stocks, whose performance does not reflect the deduction of fees, expenses or taxes.
4
At June 30, 2022 (unaudited)
Asset Allocation (% of Net Assets) | ||
Equities | 97.5 | |
Other Assets less Liabilities | 2.5 | |
Top Ten Holdings (% of Net Assets) | ||
Lantheus Hldgs., Inc. | 5.0 | |
Axcelis Technologies, Inc. | 4.0 | |
Veritiv Corp. | 3.7 | |
Sierra Wireless, Inc. | 2.2 | |
Funko, Inc. | 2.1 | |
Resources Connection, Inc. | 2.1 | |
Clearfield, Inc. | 2.0 | |
Forrester Research, Inc. | 1.8 | |
Guess’, Inc. | 1.7 | |
Alpha and Omega Semiconductor Ltd. | 1.7 | |
Top Ten Industries (% of Net Assets) | ||
Back Office Support, Human Resources & Consulting | 12.8 | |
Production Technology Equipment | 10.7 | |
Communications Technology | 9.0 | |
Computer Services Software & Systems | 6.5 | |
Medical Equipment | 5.0 | |
Semiconductors & Components | 4.4 | |
Containers & Packaging | 3.7 | |
Specialty Retail | 3.2 | |
Medical & Dental Instruments & Supplies | 3.2 | |
Oil Well Equipment & Services | 2.9 | |
Oberweis Small-Cap Opportunities Fund
At June 30, 2022 (unaudited)
Asset Allocation (% of Net Assets) | ||
Equities | 95.7 | |
Other Assets less Liabilities | 4.3 | |
Top Ten Holdings (% of Net Assets) | ||
Lantheus Hldgs., Inc. | 3.9 | |
Axcelis Technologies, Inc. | 3.4 | |
Veritiv Corp. | 3.2 | |
Evolent Health, Inc. | 2.2 | |
Clearfield, Inc. | 2.2 | |
Synaptics, Inc. | 2.1 | |
Sierra Wireless, Inc. | 2.0 | |
Stride, Inc. | 2.0 | |
MaxLinear. Inc. | 1.9 | |
MGP Ingredients, Inc. | 1.8 | |
Top Ten Industries (% of Net Assets) | ||
Production Technology Equipment | 6.0 | |
Back Office Support, Human Resources, & Consulting | 5.8 | |
Semiconductors & Components | 5.3 | |
Healthcare Services | 5.1 | |
Medical Equipment | 4.5 | |
Containers & Packaging | 4.1 | |
Computer Services Software & Systems | 3.6 | |
Medical & Dental Instruments & Supplies | 3.3 | |
Chemicals – Diversified | 3.3 | |
Computer Technology | 3.0 | |
5
Oberweis Global Opportunities Fund
At June 30, 2022 (unaudited)
Asset Allocation (% of Net Assets) | ||
Equities | 97.4 | |
Other Assets less Liabilities | 2.6 | |
Top Ten Holdings (% of Net Assets) | ||
Halozyme Therapeutics, Inc. | 5.0 | |
Lantheus Hldgs., Inc. | 4.6 | |
Deckers Outdoor Corp. | 4.3 | |
Acadia Healthcare Co., Inc. | 4.3 | |
Dada Nexus Ltd. ADS | 4.1 | |
Synaptics, Inc. | 3.7 | |
Materion Corp. | 3.7 | |
Intermediate Capital Group PLC | 3.3 | |
Crocs, Inc. | 3.3 | |
Li Ning Co. Ltd. | 3.3 | |
Top Ten Industries (% of Net Assets) | ||
Semiconductor & Semiconductor Equipment | 18.5 | |
Textiles, Apparel & Luxury Goods | 10.9 | |
Healthcare Equipment & Supplies | 7.9 | |
Software | 5.2 | |
Biotechnology | 5.0 | |
Healthcare Provider & Services | 4.3 | |
Internet & Direct Marketing Retail | 4.1 | |
Information Technology Services | 3.9 | |
Trading Co. & Distribution | 3.7 | |
Metals & Mining | 3.7 | |
Oberweis China Opportunities Fund
At June 30, 2022 (unaudited)
Asset Allocation (% of Net Assets) | ||
Equities | 99.3 | |
Other Assets less Liabilities | 0.7 | |
Top Ten Holdings (% of Net Assets) | ||
Alibaba Group Hldg. Ltd. | 4.5 | |
Pinduoduo, Inc. ADS | 3.2 | |
Meituan | 2.9 | |
Wuxi Biologics (Cayman), Inc. | 2.7 | |
Ningbo Deye Technology Co. Ltd. | 2.5 | |
BYD Co. Ltd. | 2.4 | |
Ningbo Orient Wires & Cables Co. Ltd. | 2.3 | |
JD.com, Inc. | 2.3 | |
Ming Yang Smart Energy Group Ltd. | 2.3 | |
Zhejiang Shuanghuan Driveline Co. Ltd. | 2.3 | |
Top Ten Industries (% of Net Assets) | ||
Internet & Direct Marketing Retail | 16.7 | |
Real Estate Management & Development | 7.0 | |
Metals & Mining | 6.8 | |
Electrical Equipment | 6.6 | |
Automobiles | 6.1 | |
Hotels, Restaurants & Leisure | 6.0 | |
Auto Components | 6.0 | |
Machinery | 4.2 | |
Air Freight & Logisitics | 4.1 | |
Beverages | 3.4 | |
6
Oberweis International Opportunities Fund
At June 30, 2022 (unaudited)
Asset Allocation (% of Net Assets) | ||
Equities | 97.2 | |
Other Assets less Liabilities | 2.8 | |
Top Ten Holdings (% of Net Assets) | ||
Uniti Group Ltd. | 3.8 | |
BayCurrent Consulting, Inc. | 3.6 | |
Daiwa Securities Group, Inc. | 3.5 | |
Constellium SE | 3.2 | |
Nordic Semiconductor ASA | 3.1 | |
Rexel SA | 2.8 | |
AIXTRON SE | 2.7 | |
Rheinmetall AG | 2.6 | |
Man Group PLC | 2.5 | |
Alfen NV | 2.4 | |
Top Ten Industries (% of Net Assets) | ||
Capital Markets | 10.6 | |
Semiconductors & Semiconductor Equipment | 9.1 | |
Electrical Equipment | 6.2 | |
Trading Co. & Distribution | 5.9 | |
Machinery | 5.9 | |
Metals & Mining | 5.1 | |
Information Technology Services | 5.0 | |
Food & Staples Retailing | 4.1 | |
Diversified Telecommunication Services | 3.8 | |
Professional Services | 3.6 | |
Oberweis Emerging Markets Fund
At June 30, 2022 (unaudited)
Asset Allocation (% of Net Assets) | ||
Equities | 90.0 | |
Other Assets less Liabilities | 10.0 | |
Top Ten Holdings (% of Net Assets) | ||
Dada Nexus Ltd. ADS | 5.7 | |
Kingsoft Cloud Hldgs. Ltd. ADS | 4.1 | |
Yijiahe Technology Co. Ltd. | 3.2 | |
Hangzhou Robam Appliances Co. Ltd. | 2.5 | |
Gaztransport & Technigaz SA | 2.4 | |
PT Mitra Adiperkasa Tbk | 2.4 | |
TOTVS SA | 2.3 | |
ASPEED Technology, Inc. | 2.1 | |
PT Sumber Alfaria Trijaya Tbk | 2.0 | |
Kingdee International Software Group Co. Ltd. | 2.0 | |
Top Ten Industries (% of Net Assets) | ||
Software | 8.9 | |
Internet & Direct Marketing Retail | 6.9 | |
Semiconductors & Semiconductor Equipment | 6.5 | |
Information Technology Services | 5.6 | |
Oil, Gas & Consumable Fuels | 5.6 | |
Hotels, Restaurants & Leisure | 4.6 | |
Machinery | 4.5 | |
Food & Staples Retailing | 4.3 | |
Diversified Consumer Services | 4.2 | |
Multiline Retail | 3.9 | |
7
Schedule of Investments June 30, 2022 (unaudited)
Shares | Value | ||||
Equities – 97.5% |
| ||||
| |||||
Aerospace – 0.7% |
| ||||
VSE Corp. | 23,600 | $ | 886,888 | ||
| |||||
Back Office Support, Human Resources & Consulting – 12.8% |
| ||||
Cross Country Healthcare, Inc.* | 96,900 |
| 2,018,427 | ||
Forrester Research, Inc.* | 44,500 |
| 2,128,880 | ||
Franklin Covey Co.* | 36,800 |
| 1,699,424 | ||
ICF International, Inc. | 19,400 |
| 1,843,000 | ||
Information Services Group, Inc. | 242,100 |
| 1,636,596 | ||
Kforce, Inc. | 16,900 |
| 1,036,646 | ||
Resources Connection, Inc. | 121,400 |
| 2,472,918 | ||
The Hackett Group, Inc. | 79,300 |
| 1,504,321 | ||
TrueBlue, Inc.* | 51,900 |
| 929,010 | ||
| 15,269,222 | ||||
| |||||
Banks – Diversified – 1.0% |
| ||||
First Foundation, Inc. | 28,900 |
| 591,872 | ||
Mercantile Bank Corp. | 19,200 |
| 613,440 | ||
| 1,205,312 | ||||
| |||||
Biotechnology – 1.4% |
| ||||
Dynavax Technologies Corp.* | 137,200 |
| 1,727,348 | ||
| |||||
Casinos & Gambling – 1.2% |
| ||||
Full House Resorts, Inc.* | 225,743 |
| 1,372,517 | ||
| |||||
Communications Technology – 9.0% |
| ||||
ADTRAN, Inc. | 71,400 |
| 1,251,642 | ||
Aviat Networks, Inc.* | 72,007 |
| 1,803,055 | ||
Bel Fuse, Inc. | 81,500 |
| 1,268,140 | ||
DZS, Inc.* | 117,800 |
| 1,916,606 | ||
Extreme Networks, Inc.* | 133,800 |
| 1,193,496 | ||
Ooma, Inc.* | 57,300 |
| 678,432 | ||
Sierra Wireless, Inc.* | 110,100 |
| 2,576,340 | ||
| 10,687,711 | ||||
| |||||
Computer Services Software & Systems – 6.5% |
| ||||
A10 Networks, Inc. | 103,000 |
| 1,481,140 | ||
Arlo Technologies, Inc.* | 168,500 |
| 1,056,495 | ||
Avid Technology, Inc.* | 31,400 |
| 814,830 | ||
ChannelAdvisor Corp.* | 74,700 |
| 1,089,126 | ||
Model N, Inc.* | 68,700 |
| 1,757,346 | ||
Perficient, Inc.* | 16,900 |
| 1,549,561 | ||
| 7,748,498 | ||||
See accompanying notes to the financial statements.
8
OBERWEIS MICRO-CAP FUND (continued)
Schedule of Investments June 30, 2022 (unaudited)
Shares | Value | ||||
Computer Technology – 1.4% |
| ||||
ScanSource, Inc.* | 53,300 | $ | 1,659,762 | ||
| |||||
Consumer Lending – 1.0% |
| ||||
EZCORP, Inc.* | 158,200 |
| 1,188,082 | ||
| |||||
Consumer Services – Miscellaneous – 2.7% |
| ||||
Perion Network Ltd.* | 109,000 |
| 1,981,620 | ||
SP Plus Corp.* | 39,500 |
| 1,213,440 | ||
| 3,195,060 | ||||
| |||||
Containers & Packaging – 3.7% |
| ||||
Veritiv Corp.* | 40,100 |
| 4,352,855 | ||
| |||||
Construction – 1.5% |
| ||||
Sterling Construction Co. Inc.* | 79,000 |
| 1,731,680 | ||
| |||||
Diversified Retail – 0.9% |
| ||||
Global Industrial Co. | 32,500 |
| 1,097,525 | ||
| |||||
Education Services – 0.5% |
| ||||
Universal Technical Institute, Inc.* | 80,000 |
| 570,400 | ||
| |||||
Electronic Entertainment – 1.3% |
| ||||
Everi Hldgs. Inc.* | 97,500 |
| 1,590,225 | ||
| |||||
Energy Equipment – 1.3% |
| ||||
Ameresco, Inc.* | 33,808 |
| 1,540,292 | ||
| |||||
Financial Data & Systems – 1.5% |
| ||||
International Money Express, Inc.* | 85,700 |
| 1,754,279 | ||
| |||||
Healthcare Services – 0.8% |
| ||||
RadNet, Inc.* | 51,800 |
| 895,104 | ||
| |||||
Home Building – 0.9% |
| ||||
M/I Homes, Inc.* | 28,400 |
| 1,126,344 | ||
| |||||
Insurance – Property Casualty – 0.9% |
| ||||
Employers Hldgs., Inc. | 27,000 |
| 1,131,030 | ||
| |||||
Luxury Items – 1.3% |
| ||||
Movado Group, Inc. | 48,300 |
| 1,493,919 | ||
| |||||
Machinery – Agriculture – 2.2% |
| ||||
Titan International, Inc.* | 118,400 |
| 1,787,840 | ||
Titan Machinery, Inc.* | 38,900 |
| 871,749 | ||
| 2,659,589 | ||||
| |||||
Machinery – Industrial – 1.3% |
| ||||
EnPro Industries, Inc. | 18,600 |
| 1,523,898 | ||
See accompanying notes to the financial statements.
9
OBERWEIS MICRO-CAP FUND (continued)
Schedule of Investments June 30, 2022 (unaudited)
Shares | Value | ||||
Medical & Dental Instruments & Supplies – 3.2% |
| ||||
Alphatec Hldgs. Inc.* | 176,900 | $ | 1,156,926 | ||
AngioDynamics, Inc.* | 83,200 |
| 1,609,920 | ||
Cerus Corp.* | 196,300 |
| 1,038,427 | ||
| 3,805,273 | ||||
| |||||
Medical Equipment – 5.0% |
| ||||
Lantheus Hldgs., Inc.* | 90,200 |
| 5,955,906 | ||
| |||||
Oil Crude Producer – 1.0% |
| ||||
Earthstone Energy, Inc.* | 83,800 |
| 1,143,870 | ||
| |||||
Oil Well Equipment & Services – 2.9% |
| ||||
Patterson-UTI Energy, Inc. | 123,100 |
| 1,940,056 | ||
RPC, Inc.* | 216,300 |
| 1,494,633 | ||
| 3,434,689 | ||||
| |||||
Production Technology Equipment – 10.7% |
| ||||
Aehr Test Systems* | 175,300 |
| 1,314,750 | ||
Axcelis Technologies, Inc.* | 87,100 |
| 4,776,564 | ||
CyberOptics Corp.* | 42,800 |
| 1,495,432 | ||
Impinj, Inc.* | 19,900 |
| 1,167,533 | ||
Photronics, Inc.* | 104,300 |
| 2,031,764 | ||
Ultra Clean Hldgs., Inc.* | 66,500 |
| 1,979,705 | ||
| 12,765,748 | ||||
| |||||
Scientific Instruments – Electrical – 1.1% |
| ||||
Allied Motion Technologies, Inc. | 38,500 |
| 879,340 | ||
RF Industries Ltd.* | 63,900 |
| 396,180 | ||
| 1,275,520 | ||||
| |||||
Scientific Instruments – Gauges & Meters – 1.0% |
| ||||
Vishay Precision Group, Inc.* | 42,600 |
| 1,240,938 | ||
| |||||
Semiconductors & Components – 4.4% |
| ||||
Alpha and Omega Semiconductor Ltd.* | 62,000 |
| 2,067,080 | ||
Amtech Systems, Inc.* | 108,900 |
| 794,970 | ||
CEVA, Inc.* | 38,800 |
| 1,302,128 | ||
SMART Global Hldgs., Inc.* | 64,400 |
| 1,054,228 | ||
| 5,218,406 | ||||
| |||||
Specialty Retail – 3.2% |
| ||||
Boot Barn Hldgs., Inc.* | 25,900 |
| 1,784,769 | ||
Guess’, Inc. | 122,000 |
| 2,080,100 | ||
| 3,864,869 | ||||
| |||||
Technology – Miscellaneous – 2.4% |
| ||||
Camtek Ltd.* | 59,880 |
| 1,488,617 | ||
CTS Corp. | 39,500 |
| 1,344,975 | ||
| 2,833,592 | ||||
See accompanying notes to the financial statements.
10
OBERWEIS MICRO-CAP FUND (continued)
Schedule of Investments June 30, 2022 (unaudited)
Shares | Value | ||||
Telecommunications Equipment – 2.0% |
| ||||
Clearfield, Inc.* | 39,300 | $ | 2,434,635 | ||
| |||||
Textiles Apparel & Shoes – 2.7% |
| ||||
Delta Apparel, Inc.* | 21,600 |
| 612,792 | ||
Oxford Industries, Inc.* | 15,800 |
| 1,402,092 | ||
Rocky Brands, Inc. | 35,400 |
| 1,209,972 | ||
| 3,224,856 | ||||
| |||||
Toys – 2.1% |
| ||||
Funko, Inc.* | 112,500 |
| 2,511,001 | ||
| |||||
Total Equities |
| ||||
(Cost: $108,037,141) | $ | 116,116,843 | |||
| |||||
Total Investments – 97.5% |
| ||||
(Cost: $108,037,141) | $ | 116,116,843 | |||
Other Assets Less Liabilities – 2.5% |
| 3,022,166 | |||
Net Assets – 100% | $ | 119,139,009 | |||
* Non-income producing security during the period ended June 30, 2022
See accompanying notes to the financial statements.
11
OBERWEIS SMALL-CAP OPPORTUNITIES FUND
Schedule of Investments June 30, 2022 (unaudited)
Shares | Value | ||||
Equities – 95.7% |
| ||||
| |||||
Asset Management & Custodian – 0.7% |
| ||||
Focus Financial Partners, Inc.* | 7,600 | $ | 258,856 | ||
| |||||
Auto Parts – 1.0% |
| ||||
Visteon Corp.* | 3,800 |
| 393,604 | ||
| |||||
Back Office Support, Human Resources & Consulting – 5.8% |
| ||||
Forrester Research, Inc.* | 11,100 |
| 531,024 | ||
ICF International, Inc. | 5,300 |
| 503,500 | ||
Insperity, Inc. | 4,000 |
| 399,320 | ||
Korn Ferry | 8,500 |
| 493,170 | ||
NV5 Global, Inc.* | 2,700 |
| 315,198 | ||
| 2,242,212 | ||||
| |||||
Banks – Diversified – 0.9% |
| ||||
First Foundation, Inc. | 17,800 |
| 364,544 | ||
| |||||
Banks – Savings, Thrifts & Mortgage Lending – 1.7% |
| ||||
Banc of California, Inc. | 26,700 |
| 470,454 | ||
Flushing Financial Corp. | 8,900 |
| 189,214 | ||
| 659,668 | ||||
| |||||
Beverage – Brewers & Distillers – 1.8% |
| ||||
MGP Ingredients, Inc. | 7,100 |
| 710,639 | ||
| |||||
Biotechnology – 1.6% |
| ||||
Halozyme Therapeutics, Inc.* | 14,000 |
| 616,000 | ||
| |||||
Building Materials – 0.8% |
| ||||
Patrick Industries, Inc. | 6,000 |
| 311,040 | ||
| |||||
Casinos & Gambling – 0.9% |
| ||||
Monarch Casino and Resort, Inc.* | 6,200 |
| 363,754 | ||
| |||||
Chemicals – Diversified – 3.3% |
| ||||
Avient Corp. | 8,300 |
| 332,664 | ||
Cabot Corp. | 8,900 |
| 567,731 | ||
Univar Solutions, Inc.* | 15,000 |
| 373,050 | ||
| 1,273,445 | ||||
| |||||
Communications Technology – 2.0% |
| ||||
Sierra Wireless, Inc.* | 33,600 |
| 786,240 | ||
| |||||
Computer Services Software & Systems – 3.6% |
| ||||
Cargurus, Inc.* | 11,800 |
| 253,582 | ||
Rapid7, Inc.* | 4,400 |
| 293,920 | ||
TechTarget, Inc.* | 5,500 |
| 361,460 | ||
Teradata Corp.* | 13,000 |
| 481,130 | ||
| 1,390,092 | ||||
See accompanying notes to the financial statements.
12
OBERWEIS SMALL-CAP OPPORTUNITIES FUND (continued)
Schedule of Investments June 30, 2022 (unaudited)
Shares | Value | ||||
Computer Technology – 3.0% |
| ||||
Super Micro Computer, Inc.* | 9,300 | $ | 375,255 | ||
Synaptics, Inc.* | 6,800 |
| 802,740 | ||
| 1,177,995 | ||||
| |||||
Consumer Lending – 1.3% |
| ||||
FirstCash Hldgs., Inc. | 7,000 |
| 486,570 | ||
| |||||
Consumer Services – Miscellaneous – 1.7% |
| ||||
Perion Network Ltd.* | 35,300 |
| 641,754 | ||
| |||||
Containers & Packaging – 4.1% |
| ||||
O-I Glass, Inc.* | 26,000 |
| 364,000 | ||
Veritiv Corp.* | 11,342 |
| 1,231,174 | ||
| 1,595,174 | ||||
| |||||
Cosmetics – 1.3% |
| ||||
Inter Parfums, Inc. | 6,800 |
| 496,808 | ||
| |||||
Diversified Manufacturing Operations – 0.9% |
| ||||
Inmode Ltd.* | 15,000 |
| 336,150 | ||
| |||||
Diversified Metals & Minerals – 1.3% |
| ||||
Materion Corp. | 7,000 |
| 516,110 | ||
| |||||
Education Services – 2.0% |
| ||||
Stride, Inc.* | 18,600 |
| 758,694 | ||
| |||||
Electronic Entertainment – 1.3% |
| ||||
Everi Hldgs., Inc.* | 31,600 |
| 515,396 | ||
| |||||
Energy Equipment – 1.2% |
| ||||
Ameresco, Inc.* | 10,200 |
| 464,712 | ||
| |||||
Entertainment – 0.8% |
| ||||
ZipRecruiter, Inc.* | 20,200 |
| 299,364 | ||
| |||||
Environmental, Maintenance & Security Services – 1.2% |
| ||||
ABM Industries, Inc. | 10,600 |
| 460,252 | ||
| |||||
Forest Products – 0.8% |
| ||||
UFP Industries, Inc. | 4,800 |
| 327,072 | ||
| |||||
Healthcare Management Services – 1.3% |
| ||||
Option Care Health, Inc.* | 18,500 |
| 514,115 | ||
See accompanying notes to the financial statements.
13
OBERWEIS SMALL-CAP OPPORTUNITIES FUND (continued)
Schedule of Investments June 30, 2022 (unaudited)
Shares | Value | ||||
Healthcare Services – 5.1% |
| ||||
Acadia Healthcare Co., Inc.* | 9,700 | $ | 656,011 | ||
AMN Healthcare Services, Inc.* | 4,300 |
| 471,753 | ||
Evolent Health, Inc.* | 27,400 |
| 841,454 | ||
| 1,969,218 | ||||
| |||||
Home Building – 1.3% |
| ||||
M/I Homes, Inc.* | 7,600 |
| 301,416 | ||
Tri Pointe Homes, Inc.* | 11,400 |
| 192,318 | ||
| 493,734 | ||||
| |||||
Insurance – Property Casualty – 0.6% |
| ||||
Stewart Information Services Corp. | 5,000 |
| 248,750 | ||
| |||||
Leisure Time – 2.5% |
| ||||
Callaway Golf Co.* | 24,400 |
| 497,760 | ||
SeaWorld Entertainment, Inc.* | 10,300 |
| 455,054 | ||
| 952,814 | ||||
| |||||
Machinery – Agriculture – 1.1% |
| ||||
Titan International, Inc.* | 29,100 |
| 439,410 | ||
| |||||
Machinery – Industrial – 2.5% |
| ||||
Applied Industrial Technologies, Inc. | 5,100 |
| 490,467 | ||
Franklin Electric Co., Inc. | 6,800 |
| 498,168 | ||
| 988,635 | ||||
| |||||
Manufactured Housing – 1.1% |
| ||||
Skyline Champion Corp.* | 8,900 |
| 422,038 | ||
| |||||
Medical & Dental Instruments & Supplies – 3.3% |
| ||||
Alphatec Hldgs., Inc.* | 51,600 |
| 337,464 | ||
AngioDynamics, Inc.* | 25,700 |
| 497,295 | ||
Merit Medical Systems, Inc.* | 8,500 |
| 461,295 | ||
| 1,296,054 | ||||
| |||||
Medical Equipment – 4.5% |
| ||||
Lantheus Hldgs., Inc.* | 22,900 |
| 1,512,087 | ||
Shockwave Medical, Inc.* | 1,150 |
| 219,846 | ||
| 1,731,933 | ||||
| |||||
Oil Crude Producer – 1.6% |
| ||||
Magnolia Oil & Gas Corp. | 14,800 |
| 310,652 | ||
PDC Energy, Inc. | 4,900 |
| 301,889 | ||
| 612,541 | ||||
| |||||
Oil Well Equipment & Services – 0.9% |
| ||||
NOV, Inc. | 20,700 |
| 350,037 | ||
| |||||
Pharmaceuticals – 1.6% |
| ||||
Amphastar Pharmaceuticals, Inc.* | 17,900 |
| 622,741 | ||
See accompanying notes to the financial statements.
14
OBERWEIS SMALL-CAP OPPORTUNITIES FUND (continued)
Schedule of Investments June 30, 2022 (unaudited)
Shares | Value | ||||
Power Transmission Equipment – 1.8% |
| ||||
Belden, Inc. | 12,800 | $ | 681,856 | ||
| |||||
Production Technology Equipment – 6.0% |
| ||||
Axcelis Technologies, Inc.* | 24,400 |
| 1,338,096 | ||
Impinj, Inc.* | 9,100 |
| 533,897 | ||
Ultra Clean Hldgs., Inc.* | 15,800 |
| 470,366 | ||
| 2,342,359 | ||||
| |||||
Scientific Instruments – Pollution Control – 1.3% |
| ||||
Clean Harbors, Inc.* | 5,900 |
| 517,253 | ||
| |||||
Semiconductors & Components – 5.3% |
| ||||
Diodes, Inc.* | 6,900 |
| 445,533 | ||
MACOM Technology Solutions Hldgs. Inc.* | 7,500 |
| 345,750 | ||
MaxLinear. Inc.* | 22,100 |
| 750,958 | ||
Silicon Laboratories, Inc.* | 3,750 |
| 525,825 | ||
| 2,068,066 | ||||
| |||||
Specialty Retail – 2.4% |
| ||||
Boot Barn Hldgs., Inc.* | 8,200 |
| 565,062 | ||
Guess’, Inc. | 21,100 |
| 359,755 | ||
| 924,817 | ||||
| |||||
Telecommunications Equipment – 2.2% |
| ||||
Clearfield, Inc.* | 13,500 |
| 836,325 | ||
| |||||
Textiles, Apparel & Shoes – 2.7% |
| ||||
Crocs, Inc.* | 11,800 |
| 574,306 | ||
Deckers Outdoor Corp.* | 1,800 |
| 459,630 | ||
| 1,033,936 | ||||
| |||||
Toys – 1.6% |
| ||||
Funko, Inc.* | 30,400 |
| 678,528 | ||
| |||||
Total Equities |
| ||||
(Cost: $39,325,283) | $ | 37,171,305 | |||
| |||||
Total Investments – 95.7% |
| ||||
(Cost: $39,325,283) | $ | 37,171,305 | |||
Other Assets Less Liabilities – 4.3% |
| 1,679,590 | |||
Net Assets – 100% | $ | 38,850,895 | |||
* Non-income producing security during the period ended June 30, 2022
See accompanying notes to the financial statements.
15
OBERWEIS GLOBAL OPPORTUNITIES FUND
Schedule of Investments June 30, 2022 (unaudited)
Shares | Value | ||||
Equities – 97.4% |
| ||||
| |||||
Australia – 2.4% |
| ||||
Computershare Ltd.* | 38,800 | $ | 659,879 | ||
IDP Education Ltd. | 35,000 |
| 575,442 | ||
| 1,235,321 | ||||
| |||||
Canada – 2.6% |
| ||||
Aritzia, Inc.* | 26,100 |
| 706,638 | ||
BRP, Inc. | 9,600 |
| 590,827 | ||
| 1,297,465 | ||||
| |||||
China – 12.5% |
| ||||
Dada Nexus Ltd. ADS* | 259,415 |
| 2,103,856 | ||
Foryou Corp. | 132,800 |
| 898,849 | ||
Han’s Laser Technology Industry Group Co. Ltd. | 120,000 |
| 593,878 | ||
Li Ning Co. Ltd. | 180,000 |
| 1,667,686 | ||
Shanghai Weaver Network Co. Ltd.* | 75,000 |
| 408,594 | ||
YTO Express Group Co. Ltd. | 225,000 |
| 685,323 | ||
| 6,358,186 | ||||
| |||||
Denmark – 0.9% |
| ||||
ALK-Abello AS* | 25,700 |
| 446,100 | ||
| |||||
France – 1.7% |
| ||||
Rexel SA | 29,700 |
| 456,767 | ||
Soitec SA* | 3,000 |
| 426,011 | ||
| 882,778 | ||||
| |||||
Germany – 2.9% |
| ||||
AIXTRON SE | 30,000 |
| 760,218 | ||
Rheinmetall AG* | 3,000 |
| 692,622 | ||
| 1,452,840 | ||||
| |||||
India – 1.2% |
| ||||
Route Mobile Ltd.* | 40,000 |
| 629,510 | ||
| |||||
Israel – 0.9% |
| ||||
Inmode Ltd.* | 19,400 |
| 434,754 | ||
| |||||
Japan – 5.1% |
| ||||
BayCurrent Consulting, Inc.* | 2,600 |
| 691,775 | ||
Food & Life Co. Ltd.* | 31,500 |
| 672,347 | ||
Fuji Electric Co. Ltd. | 19,000 |
| 786,999 | ||
Future Corp. | 44,400 |
| 455,519 | ||
| 2,606,640 | ||||
See accompanying notes to the financial statements.
16
OBERWEIS GLOBAL OPPORTUNITIES FUND (continued)
Schedule of Investments June 30, 2022 (unaudited)
Shares | Value | ||||
Netherlands – 1.5% |
| ||||
BE Semiconductor Industries NV | 15,700 | $ | 754,725 | ||
| |||||
Norway – 2.0% |
| ||||
Nordic Semiconductor ASA* | 66,900 |
| 1,037,831 | ||
| |||||
South Korea – 1.0% |
| ||||
LEENO Industrial, Inc. | 5,000 |
| 500,616 | ||
| |||||
Switzerland – 1.2% |
| ||||
u-blox Hldg. AG* | 6,000 |
| 607,730 | ||
| |||||
Taiwan – 3.1% |
| ||||
M31 Technology Corp. | 201,000 |
| 1,585,232 | ||
| |||||
United Kingdom – 11.7% |
| ||||
Ashtead Technology Hldgs. PLC* | 372,733 |
| 1,007,264 | ||
Endava PLC ADS* | 9,600 |
| 847,392 | ||
Intermediate Capital Group PLC | 105,100 |
| 1,674,691 | ||
Oxford Instruments PLC | 19,200 |
| 461,828 | ||
RS GROUP PLC | 41,900 |
| 443,227 | ||
Taylor Wimpey PLC | 1,046,900 |
| 1,486,560 | ||
| 5,920,962 | ||||
| |||||
United States of America – 46.7% |
| ||||
Acadia Healthcare Co., Inc.* | 32,000 |
| 2,164,160 | ||
Alphatec Hldgs., Inc.* | 115,000 |
| 752,100 | ||
AngioDynamics, Inc.* | 25,200 |
| 487,620 | ||
Axcelis Technologies, Inc.* | 25,000 |
| 1,371,000 | ||
Belden, Inc. | 17,900 |
| 953,533 | ||
Boot Barn Hldgs., Inc.* | 15,400 |
| 1,061,214 | ||
Cabot Corp. | 8,400 |
| 535,836 | ||
Clean Harbors, Inc.* | 5,400 |
| 473,418 | ||
Crocs, Inc.* | 34,400 |
| 1,674,248 | ||
Deckers Outdoor Corp.* | 8,600 |
| 2,196,010 | ||
Evolent Health, Inc.* | 19,000 |
| 583,490 | ||
Halozyme Therapeutics, Inc.* | 57,800 |
| 2,543,200 | ||
Lantheus Hldgs., Inc.* | 35,600 |
| 2,350,668 | ||
Materion Corp. | 25,600 |
| 1,887,488 | ||
Model N, Inc.* | 21,200 |
| 542,296 | ||
Rapid7, Inc.* | 8,200 |
| 547,760 | ||
Skyline Champion Corp.* | 8,400 |
| 398,328 | ||
Super Micro Computer, Inc.* | 10,000 |
| 403,500 | ||
Synaptics, Inc.* | 16,100 |
| 1,900,605 | ||
See accompanying notes to the financial statements.
17
OBERWEIS GLOBAL OPPORTUNITIES FUND (continued)
Schedule of Investments June 30, 2022 (unaudited)
Shares | Value | ||||
Teradata Corp.* | 13,300 | $ | 492,233 | ||
Ultra Clean Hldgs., Inc.* | 15,200 |
| 452,504 | ||
| 23,771,211 | ||||
| |||||
Total Equities |
| ||||
(Cost: $56,508,403) | $ | 49,521,901 | |||
| |||||
Total Investments – 97.4% |
| ||||
(Cost: $56,508,403) | $ | 49,521,901 | |||
Other Assets Less Liabilities – 2.6% |
| 1,346,824 | |||
Net Assets – 100% | $ | 50,868,725 | |||
* Non-income producing security during the period ended June 30, 2022
ADS—American depositary share
SECTOR ALLOCATIONS (As a Percentage of Net Assets) | |||
Consumer Discretionary | 27.6 | % | |
Financials | 3.3 | % | |
Health Care | 19.2 | % | |
Industrials | 11.5 | % | |
Information Technology | 31.1 | % | |
Materials | 4.7 | % | |
See accompanying notes to the financial statements.
18
OBERWEIS CHINA OPPORTUNITIES FUND
Schedule of Investments June 30, 2022 (unaudited)
Shares | Value | ||||
Equities – 99.3% |
| ||||
| |||||
Air Freight & Logistics – 4.1% |
| ||||
Milkyway Chemical Supply Chain Service Co. Ltd. | 80,000 | $ | 1,633,629 | ||
YTO Express Group Co. Ltd. | 500,032 |
| 1,523,035 | ||
| 3,156,664 | ||||
Auto Components��– 6.0% |
| ||||
Foryou Corp. | 210,056 |
| 1,421,752 | ||
Shenzhen Kedali Industry Co. Ltd. | 60,000 |
| 1,425,093 | ||
Zhejiang Shuanghuan Driveline Co. Ltd. | 370,000 |
| 1,759,826 | ||
| 4,606,671 | ||||
| |||||
Automobiles – 6.1% |
| ||||
BYD Co. Ltd. | 45,000 |
| 1,800,734 | ||
Li Auto, Inc.* | 70,000 |
| 1,363,996 | ||
Xpeng, Inc.* | 95,000 |
| 1,530,305 | ||
| 4,695,035 | ||||
| |||||
Beverages – 3.4% |
| ||||
China Resources Beer Hldgs. Co. Ltd. | 180,000 |
| 1,341,948 | ||
Luzhou Laojiao Co. Ltd.* | 35,000 |
| 1,288,992 | ||
| 2,630,940 | ||||
| |||||
Capital Markets – 0.5% |
| ||||
East Money Information Co. Ltd. | 110,000 |
| 417,370 | ||
| |||||
Chemicals – 2.0% |
| ||||
Yunnan Energy New Material Co. Ltd. | 40,000 |
| 1,496,497 | ||
| |||||
Electrical Equipment – 6.6% |
| ||||
Hongfa Technology Co. Ltd. | 238,092 |
| 1,488,455 | ||
Ming Yang Smart Energy Group Ltd. | 350,052 |
| 1,767,438 | ||
Ningbo Orient Wires & Cables Co. Ltd. | 155,000 |
| 1,773,598 | ||
| 5,029,491 | ||||
| |||||
Electronic Equipment, Instruments & Components – 2.4% |
| ||||
E Ink Hldgs., Inc.* | 60,000 |
| 380,379 | ||
Wuhan DR Laser Technology Corp. Ltd. | 56,016 |
| 1,445,941 | ||
| 1,826,320 | ||||
| |||||
Entertainment – 1.7% |
| ||||
NetEase, Inc. | 70,000 |
| 1,285,492 | ||
| |||||
Food Products – 3.2% |
| ||||
Beijing Dabeinong Technology Group Co. Ltd.* | 200,000 |
| 233,333 | ||
COFCO Joycome Foods Ltd. | 2,100,000 |
| 1,016,975 | ||
Shanghai Milkground Food Tech Co. Ltd.* | 170,000 |
| 1,188,474 | ||
| 2,438,782 | ||||
See accompanying notes to the financial statements.
19
OBERWEIS CHINA OPPORTUNITIES FUND (continued)
Schedule of Investments June 30, 2022 (unaudited)
Shares | Value | ||||
Healthcare Providers & Services – 2.1% |
| ||||
Hygeia Healthcare Hldgs. Co. Ltd.* | 240,000 | $ | 1,595,045 | ||
| |||||
Hotels, Restaurants & Leisure – 6.0% |
| ||||
Huazhu Group Ltd. | 350,000 |
| 1,355,967 | ||
Jiumaojiu International Hldgs. Ltd. | 600,000 |
| 1,594,280 | ||
Trip.com Group Ltd.* | 15,000 |
| 423,612 | ||
Yum China Hldgs., Inc. | 25,500 |
| 1,236,750 | ||
| 4,610,609 | ||||
| |||||
Independent Power & Renewable Electricity Producers – 0.4% |
| ||||
China Longyuan Power Group Corp. Ltd. | 150,000 |
| 289,800 | ||
| |||||
Information Technology Services – 0.6% |
| ||||
GDS Hldgs. Ltd.* | 110,000 |
| 463,310 | ||
| |||||
Interactive Media & Services – 1.5% |
| ||||
Tencent Hldgs. Ltd. | 25,000 |
| 1,129,123 | ||
| |||||
Internet & Direct Marketing Retail – 16.7% |
| ||||
Alibaba Group Hldg. Ltd.* | 240,000 |
| 3,422,542 | ||
Dada Nexus Ltd. ADS* | 160,000 |
| 1,297,600 | ||
JD Health International, Inc.* | 200,000 |
| 1,568,792 | ||
JD.com, Inc. | 55,000 |
| 1,771,933 | ||
Meituan* | 90,000 |
| 2,227,405 | ||
Pinduoduo, Inc. ADS* | 40,000 |
| 2,472,000 | ||
| 12,760,272 | ||||
| |||||
Life Sciences Tools & Services – 2.7% |
| ||||
Wuxi Biologics (Cayman), Inc.* | 225,000 |
| 2,058,801 | ||
| |||||
Machinery – 4.2% |
| ||||
Han’s Laser Technology Industry Group Co. Ltd. | 110,000 |
| 544,389 | ||
LK Technology Hldgs. Ltd.* | 400,000 |
| 764,643 | ||
Ningbo Deye Technology Co. Ltd.* | 44,972 |
| 1,880,288 | ||
| 3,189,320 | ||||
| |||||
Metals & Mining – 6.8% |
| ||||
China Hongqiao Group Ltd. | 700,000 |
| 791,278 | ||
Ganfeng Lithium Co. Ltd. | 118,000 |
| 1,298,529 | ||
Yongxing Special Materials Technology Co. Ltd. | 70,082 |
| 1,593,472 | ||
Zhejiang Huayou Cobalt Co. Ltd. | 104,000 |
| 1,485,515 | ||
| 5,168,794 | ||||
| |||||
Oil, Gas & Consumable Fuels – 1.4% |
| ||||
Yankuang Energy Group Co. Ltd.* | 350,000 |
| 1,097,263 | ||
| |||||
Pharmaceuticals – 0.6% |
| ||||
Shenyang Xingqi Pharmaceutical Co. Ltd.* | 20,000 |
| 458,061 | ||
See accompanying notes to the financial statements.
20
OBERWEIS CHINA OPPORTUNITIES FUND (continued)
Schedule of Investments June 30, 2022 (unaudited)
Shares | Value | ||||
Professional Services – 0.2% |
| ||||
Centre Testing International Group Co. Ltd. | 50,050 | $ | 173,530 | ||
| |||||
Real Estate Management & Development – 7.0% |
| ||||
China Resources Mixc Lifestyle Services Ltd. | 251,538 |
| 1,246,983 | ||
Ever Sunshine Lifestyle Services Group Ltd. | 810,000 |
| 1,032,268 | ||
KE Hldgs., Inc. ADS* | 90,000 |
| 1,615,500 | ||
Longfor Group Hldgs. Ltd. | 310,000 |
| 1,463,718 | ||
| 5,358,469 | ||||
| |||||
Semiconductors & Semiconductor Equipment – 3.1% |
| ||||
BOE Varitronix Ltd.* | 350,000 |
| 702,962 | ||
JA Solar Technology Corp. Ltd. | 140,112 |
| 1,651,381 | ||
| 2,354,343 | ||||
| |||||
Specialty Retail – 1.6% |
| ||||
China Tourism Group Duty Free Corp. Ltd.* | 35,000 |
| 1,217,835 | ||
| |||||
Technology Hardware, Storage & Peripherals – 1.7% |
| ||||
Ninestar Corp.* | 170,000 |
| 1,285,482 | ||
| |||||
Tobacco – 1.6% |
| ||||
Smoore International Hldgs. Ltd.* | 400,000 |
| 1,233,624 | ||
| |||||
Textiles, Apparel & Luxury Goods – 2.0% |
| ||||
Li Ning Co. Ltd. | 165,000 |
| 1,528,712 | ||
| |||||
Transportation Infrastructure – 1.6% |
| ||||
Shanghai International Airport Co. Ltd.* | 140,000 |
| 1,185,784 | ||
| |||||
Utilities – Gas – 1.5% |
| ||||
China Resources Gas Group Ltd.* | 250,000 |
| 1,164,486 | ||
| |||||
Total Equities |
| ||||
(Cost: $67,391,599) | $ | 75,905,925 | |||
| |||||
Total Investments – 99.3% |
| ||||
(Cost: $67,391,599) | $ | 75,905,925 | |||
Other Assets Less Liabilities – 0.7% |
| 534,966 | |||
Net Assets – 100% | $ | 76,440,891 | |||
* Non-income producing security during the period ended June 30, 2022
ADS—American depositary share
COUNTRY ALLOCATION (As a Percentage of Net Assets) | |||
China ( Includes the People’s Republic of China, Taiwan and Hong Kong) | 99.3 | % | |
See accompanying notes to the financial statements.
21
OBERWEIS INTERNATIONAL OPPORTUNITIES FUND
Schedule of Investments June 30, 2022 (unaudited)
Shares | Value | ||||
Equities – 97.2% |
| ||||
| |||||
Australia – 10.9% |
| ||||
Charter Hall Group. | 83,000 | $ | 620,438 | ||
Computershare Ltd. | 174,700 |
| 2,971,154 | ||
Elders Ltd. | 216,300 |
| 1,879,636 | ||
Evolution Mining Ltd. | 559,100 |
| 918,455 | ||
GrainCorp Ltd.* | 281,200 |
| 1,845,812 | ||
IDP Education Ltd. | 214,200 |
| 3,521,703 | ||
JB Hi-Fi Ltd.* | 21,100 |
| 560,123 | ||
Uniti Group Ltd.* | 1,908,900 |
| 6,482,460 | ||
| 18,799,781 | ||||
| |||||
Austria – 2.2% |
| ||||
AT & S Austria Technologie & Systemtechnik AG* | 71,600 |
| 3,826,871 | ||
| |||||
Belgium – 1.2% |
| ||||
VGP NV | 6,200 |
| 987,634 | ||
Warehouses de Pauw NV | 36,100 |
| 1,134,982 | ||
| 2,122,616 | ||||
| |||||
Canada – 15.2% |
| ||||
Aritzia, Inc.* | 147,600 |
| 3,996,162 | ||
ATS Automation Tooling Systems, Inc.* | 145,300 |
| 3,990,332 | ||
BRP, Inc. | 45,000 |
| 2,769,500 | ||
Colliers International Group, Inc. | 11,900 |
| 1,303,804 | ||
Finning International, Inc. | 66,200 |
| 1,393,224 | ||
Gildan Activewear, Inc. | 88,000 |
| 2,532,940 | ||
Parex Resources, Inc. | 243,724 |
| 4,127,706 | ||
Sleep Country Canada Hldgs., Inc. | 81,500 |
| 1,520,844 | ||
TFI International, Inc. | 22,400 |
| 1,798,160 | ||
Toromont Industries Ltd. | 21,200 |
| 1,714,183 | ||
Trisura Group Ltd.* | 38,800 |
| 1,004,664 | ||
| 26,151,519 | ||||
| |||||
Denmark – 1.5% |
| ||||
ALK-Abello A/S* | 65,160 |
| 1,131,046 | ||
D/S Norden A/S | 41,400 |
| 1,434,908 | ||
| 2,565,954 | ||||
| |||||
Finland – 3.9% |
| ||||
Metso Outotec Oyj | 365,200 |
| 2,736,512 | ||
Outokumpu Oyj | 550,800 |
| 2,277,779 | ||
QT Group Oyj* | 23,800 |
| 1,755,942 | ||
| 6,770,233 | ||||
| |||||
France – 3.2% |
| ||||
Alten SA | 7,100 |
| 772,354 | ||
Rexel SA | 312,100 |
| 4,799,903 | ||
| 5,572,257 | ||||
See accompanying notes to the financial statements.
22
OBERWEIS INTERNATIONAL OPPORTUNITIES FUND (continued)
Schedule of Investments June 30, 2022 (unaudited)
Shares | Value | ||||
Germany – 8.6% |
| ||||
AIXTRON SE | 183,000 | $ | 4,637,330 | ||
Aurelius Equity Opportunities SE | 49,323 |
| 1,049,316 | ||
HelloFresh SE* | 73,700 |
| 2,382,776 | ||
Rheinmetall AG | 19,700 |
| 4,548,218 | ||
Sixt SE | 20,200 |
| 2,071,442 | ||
| 14,689,082 | ||||
| |||||
Israel – 2.2% |
| ||||
Nova Ltd.* | 43,100 |
| 3,815,643 | ||
| |||||
Italy – 0.5% |
| ||||
Banca IFIS SpA | 66,200 |
| 937,290 | ||
| |||||
Japan – 13.4% |
| ||||
BayCurrent Consulting, Inc. | 23,000 |
| 6,119,546 | ||
Daiwa Securities Group, Inc. | 1,337,800 |
| 5,975,139 | ||
Food & Life Co. Ltd.* | 160,200 |
| 3,419,363 | ||
Fuji Electric Co. Ltd. | 85,000 |
| 3,520,784 | ||
Future Corp. | 209,100 |
| 2,145,248 | ||
M&A Capital Partners Co. Ltd.* | 69,900 |
| 1,836,627 | ||
| 23,016,707 | ||||
| |||||
Netherlands – 8.1% |
| ||||
Aalberts NV | 60,100 |
| 2,342,401 | ||
Alfen NV* | 45,200 |
| 4,176,097 | ||
BE Semiconductor Industries NV | 38,466 |
| 1,849,125 | ||
Constellium SE* | 422,100 |
| 5,575,941 | ||
| 13,943,564 | ||||
| |||||
Norway – 4.2% |
| ||||
Aker Solutions ASA | 363,600 |
| 987,841 | ||
Nordic Semiconductor ASA* | 346,600 |
| 5,376,862 | ||
Wallenius Wilhelmsen ASA | 155,400 |
| 836,977 | ||
| 7,201,680 | ||||
| |||||
Spain – 1.6% |
| ||||
Laboratorios Farmaceuticos Rovi SA* | 41,400 |
| 2,533,808 | ||
| |||||
Sweden – 4.1% |
| ||||
Addtech AB* | 48,600 |
| 633,760 | ||
Arjo AB | 56,300 |
| 356,078 | ||
Cint Group AB* | 204,900 |
| 1,140,692 | ||
Hexatronic Group AB | 392,300 |
| 2,922,174 | ||
Nordnet AB | 127,100 |
| 1,661,154 | ||
Thule Group AB | 9,100 |
| 223,546 | ||
| 6,937,404 | ||||
See accompanying notes to the financial statements.
23
OBERWEIS INTERNATIONAL OPPORTUNITIES FUND (continued)
Schedule of Investments June 30, 2022 (unaudited)
Shares | Value | ||||
United Kingdom – 16.4% |
| ||||
Endava PLC ADS* | 30,800 | $ | 2,718,716 | ||
Future PLC | 157,700 |
| 3,307,573 | ||
Howden Joinery Group PLC | 112,300 |
| 823,761 | ||
IMI PLC | 75,900 |
| 1,083,758 | ||
Intermediate Capital Group PLC | 213,700 |
| 3,405,153 | ||
LondonMetric Property PLC | 451,000 |
| 1,253,906 | ||
Man Group PLC | 1,408,300 |
| 4,282,329 | ||
Marks & Spencer Group PLC* | 1,681,300 |
| 2,773,173 | ||
Morgan Sindall Group PLC | 40,600 |
| 900,465 | ||
OSB Group PLC | 221,800 |
| 1,296,511 | ||
Redrow PLC | 229,200 |
| 1,366,551 | ||
RS GROUP PLC | 78,600 |
| 831,447 | ||
Safestore Hldgs. PLC | 39,700 |
| 512,741 | ||
Taylor Wimpey PLC | 1,198,000 |
| 1,701,116 | ||
The Sage Group PLC | 216,400 |
| 1,672,194 | ||
| 27,929,394 | ||||
| |||||
Total Equities |
| ||||
(Cost: $192,198,329) | $ | 166,813,803 | |||
| |||||
Total Investments – 97.2% |
| ||||
(Cost: $192,198,329) | $ | 166,813,803 | |||
Other Assets Less Liabilities – 2.8% |
| 4,892,834 | |||
Net Assets – 100% | $ | 171,706,637 | |||
* Non-income producing security during the period ended June 30, 2022
ADS—American depositary share
SECTOR ALLOCATIONS (As a Percentage of Net Assets) | |||
Communication Services | 5.7 | % | |
Consumer Discretionary | 12.6 | % | |
Consumer Staples | 5.2 | % | |
Energy | 3.0 | % | |
Financials | 12.5 | % | |
Healthcare | 2.3 | % | |
Industrials | 28.3 | % | |
Information Technology | 19.0 | % | |
Materials | 5.1 | % | |
Real Estate | 3.5 | % | |
See accompanying notes to the financial statements.
24
OBERWEIS EMERGING MARKETS FUND
Schedule of Investments June 30, 2022 (unaudited)
Shares | Value | ||||
Equities – 90.0% |
| ||||
| |||||
Argentina – 0.7% |
| ||||
Despegar.com Corp.* | 11,600 | $ | 93,960 | ||
| |||||
Australia – 1.8% |
| ||||
IDP Education Ltd. | 14,800 |
| 243,330 | ||
| |||||
Brazil – 6.0% |
| ||||
Afya Ltd.* | 12,500 |
| 124,375 | ||
Arco Platform Ltd.* | 12,500 |
| 186,625 | ||
Locaweb Servicos de Internet SA* | 80,600 |
| 86,552 | ||
LOG Commercial Properties e Participacoes SA | 25,000 |
| 87,274 | ||
TOTVS SA | 69,900 |
| 310,667 | ||
| 795,493 | ||||
| |||||
Canada – 0.7% |
| ||||
Parex Resources, Inc. | 5,800 |
| 98,229 | ||
| |||||
Chile – 2.4% |
| ||||
Falabella SA | 87,800 |
| 205,710 | ||
GeoPark Ltd. | 8,300 |
| 107,236 | ||
| 312,946 | ||||
| |||||
China – 25.9% |
| ||||
Chongqing Brewery Co. Ltd. | 11,100 |
| 243,081 | ||
Dada Nexus Ltd. ADS* | 92,600 |
| 750,986 | ||
Hangzhou Robam Appliances Co. Ltd. | 61,000 |
| 328,314 | ||
Kingdee International Software Group Co. Ltd.* | 111,000 |
| 260,284 | ||
Kingsoft Cloud Hldgs. Ltd. ADS* | 121,400 |
| 540,230 | ||
Thunder Software Technology Co. Ltd.* | 7,000 |
| 136,438 | ||
Weimob, Inc.* | 310,000 |
| 211,755 | ||
Wolong Electric Group Co. Ltd.* | 64,500 |
| 138,938 | ||
Xiabuxiabu Catering Management China Hldgs. Co. Ltd.* | 250,000 |
| 136,680 | ||
Yantai Jereh Oilfield Services Group Co. Ltd. | 42,700 |
| 257,056 | ||
Yijiahe Technology Co. Ltd.* | 41,248 |
| 422,691 | ||
| 3,426,453 | ||||
| |||||
France – 2.4% |
| ||||
Gaztransport & Technigaz SA | 2,550 |
| 319,351 | ||
| |||||
Greece – 1.6% |
| ||||
Greek Organization of Football Prognostics SA* | 14,500 |
| 207,425 | ||
| |||||
Hungary – 1.1% |
| ||||
Richter Gedeon Nyrt | 8,000 |
| 144,423 | ||
See accompanying notes to the financial statements.
25
OBERWEIS EMERGING MARKETS FUND (continued)
Schedule of Investments June 30, 2022 (unaudited)
Shares | Value | ||||
India – 8.3% |
| ||||
Affle India Ltd.* | 8,500 | $ | 114,123 | ||
Amber Enterprises India Ltd.* | 2,800 |
| 79,656 | ||
Container Corp. of India Ltd. | 13,900 |
| 104,603 | ||
L&T Technology Services Ltd. | 2,100 |
| 80,594 | ||
Linde India Ltd. | 4,200 |
| 170,087 | ||
Route Mobile Ltd. | 11,500 |
| 180,984 | ||
Varun Beverages Ltd.* | 21,918 |
| 219,409 | ||
Vinati Organics Ltd.* | 6,000 |
| 150,652 | ||
| 1,100,108 | ||||
Indonesia – 9.4% |
| ||||
PT Indofood CBP Sukses Makmur Tbk* | 260,000 |
| 166,672 | ||
PT Industri Jamu dan Farmasi Sido Muncul Tbk | 2,390,711 |
| 160,477 | ||
PT Mitra Adiperkasa Tbk* | 4,737,900 |
| 311,673 | ||
PT Prodia Widyahusada Tbk | 292,000 |
| 127,404 | ||
PT Sumber Alfaria Trijaya Tbk | 1,910,500 |
| 261,616 | ||
PT United Tractors Tbk | 114,000 |
| 217,325 | ||
| 1,245,167 | ||||
| |||||
Malaysia – 0.9% |
| ||||
My E.G. Services Bhd* | 600,000 |
| 119,796 | ||
| |||||
Mexico – 2.4% |
| ||||
Alsea, S.A.B. de CV* | 88,300 |
| 167,208 | ||
Controladora Vuela Compania de Aviacion, S.A.B de CV ADS* | 14,000 |
| 143,780 | ||
| 310,988 | ||||
| |||||
Philippines – 1.0% |
| ||||
Wilcon Depot, Inc. | 291,500 |
| 126,174 | ||
| |||||
Poland – 0.9% |
| ||||
Dino Polska SA* | 1,600 |
| 113,893 | ||
| |||||
South Africa – 1.5% |
| ||||
Clicks Group Ltd. | 6,780 |
| 113,902 | ||
Karooooo Ltd.* | 3,700 |
| 80,845 | ||
| 194,747 | ||||
| |||||
South Korea – 6.3% |
| ||||
Classys, Inc. | 18,450 |
| 202,490 | ||
LEENO Industrial, Inc. | 1,909 |
| 191,135 | ||
LG Innotek Co. Ltd.* | 718 |
| 189,398 | ||
Nice Information Service Co. Ltd. | 9,392 |
| 104,163 | ||
SaraminHR Co. Ltd. | 5,500 |
| 149,318 | ||
| 836,504 | ||||
| |||||
Sweden – 0.3% |
| ||||
Medicover AB | 3,500 |
| 45,607 | ||
See accompanying notes to the financial statements.
26
OBERWEIS EMERGING MARKETS FUND (continued)
Schedule of Investments June 30, 2022 (unaudited)
Shares | Value | ||||
Switzerland – 0.7% |
| ||||
Wizz Air Hldgs. PLC* | 4,209 | $ | 89,867 | ||
| |||||
Taiwan – 12.4% |
| ||||
Airtac International Group* | 5,000 |
| 166,647 | ||
ASPEED Technology, Inc. | 4,400 |
| 281,164 | ||
Chailease Hldg. Co. Ltd. | 17,499 |
| 122,710 | ||
Chief Telecom, Inc. | 11,000 |
| 103,587 | ||
Innodisk Corp.* | 18,340 |
| 100,232 | ||
M31 Technology Corp. | 23,000 |
| 181,395 | ||
momo.com, Inc. | 7,440 |
| 159,642 | ||
Pan Jit International, Inc.* | 98,000 |
| 207,645 | ||
Sinbon Electronics Co. Ltd.* | 18,000 |
| 153,766 | ||
Taiwan FamilyMart Co. Ltd.* | 12,000 |
| 75,874 | ||
Yageo Corp.* | 9,000 |
| 93,228 | ||
| 1,645,890 | ||||
| |||||
Thailand – 1.1% |
| ||||
Mega Lifesciences PCL | 106,000 |
| 151,407 | ||
| |||||
Vietnam – 2.2% |
| ||||
Masan Group Corp.* | 28,800 |
| 138,646 | ||
Viettel Construction | 54,182 |
| 144,393 | ||
| 283,039 | ||||
| |||||
Total Equities |
| ||||
(Cost: $11,444,300) | $ | 11,904,797 | |||
| |||||
Total Investments – 90.0% |
| ||||
(Cost: $11,444,300) | $ | 11,904,797 | |||
Other Assets Less Liabilities – 10.0% |
| 1,320,803 | |||
Net Assets – 100% | $ | 13,225,600 | |||
* Non-income producing security during the period ended June 30, 2022
ADS—American depositary share
SECTOR ALLOCATIONS (As a Percentage of Net Assets) | |||
Communication Services | 2.7 | % | |
Consumer Discretionary | 23.6 | % | |
Consumer Staples | 11.3 | % | |
Energy | 7.6 | % | |
Financials | 0.9 | % | |
Healthcare | 5.1 | % | |
Industrials | 10.6 | % | |
Information Technology | 25.1 | % | |
Materials | 2.4 | % | |
Real Estate | 0.7 | % | |
See accompanying notes to the financial statements.
27
Statements of Assets and Liabilities June 30, 2022 (unaudited)
Micro-Cap | Small-Cap | Global | |||||||||||
ASSETS |
|
|
|
|
| ||||||||
Investment securities at valuea | $ | 116,116,843 | $ | 37,171,305 |
| $ | 49,521,901 |
| |||||
Cash |
| 2,839,155 |
| 1,697,209 |
|
| 1,264,071 |
| |||||
Receivable from securities sold |
| 560,252 |
| — |
|
| — |
| |||||
Dividends and interest receivable |
| 14,141 |
| 4,509 |
|
| 139,039 |
| |||||
Prepaid expenses |
| 27,969 |
| 18,598 |
|
| 21,823 |
| |||||
Total Assets |
| 119,558,360 |
| 38,891,621 |
|
| 50,946,834 |
| |||||
|
|
|
|
| |||||||||
LIABILITIES |
|
|
|
|
| ||||||||
Payable for securities purchased |
| 265,712 |
| — |
|
| — |
| |||||
Payable to advisor (see note 3) |
| 102,612 |
| 16,940 |
|
| 36,980 |
| |||||
Payable to distributor |
| 15,328 |
| 5,448 |
|
| 6,980 |
| |||||
Accrued expenses |
| 35,699 |
| 18,338 |
|
| 34,149 |
| |||||
Total Liabilities |
| 419,351 |
| 40,726 |
|
| 78,109 |
| |||||
NET ASSETS | $ | 119,139,009 | $ | 38,850,895 |
| $ | 50,868,725 |
| |||||
|
|
|
|
| |||||||||
NET ASSETS |
|
|
|
|
| ||||||||
Investor Class | $ | 71,732,359 | $ | 26,289,799 |
| $ | 32,440,697 |
| |||||
Institutional Class |
| 47,406,650 |
| 12,561,096 |
|
| 18,428,028 |
| |||||
Total | $ | 119,139,009 | $ | 38,850,895 |
| $ | 50,868,725 |
| |||||
|
|
|
|
| |||||||||
SHARES OUTSTANDING |
|
|
|
|
| ||||||||
(shares of beneficial interest issued and outstanding, respectively, unlimited number of shares authorized with no par value) |
|
|
|
|
| ||||||||
Investor Class |
| 2,559,933 |
| 1,573,261 |
|
| 1,411,481 |
| |||||
Institutional Class |
| 1,663,983 |
| 737,593 |
|
| 788,409 |
| |||||
Total |
| 4,223,916 |
| 2,310,854 |
|
| 2,199,890 |
| |||||
|
|
|
|
| |||||||||
NET ASSET VALUE |
|
|
|
|
| ||||||||
Investor Class, offering price and redemption price | $ | 28.02 | $ | 16.71 |
| $ | 22.98 |
| |||||
Institutional Class, offering price and redemption price | $ | 28.49 | $ | 17.03 |
| $ | 23.37 |
| |||||
|
|
|
|
| |||||||||
ANALYSIS OF NET ASSETS |
|
|
|
|
| ||||||||
Capital | $ | 110,942,172 | $ | 40,394,546 |
| $ | 57,370,927 |
| |||||
Accumulated earnings (losses) |
| 8,196,837 |
| (1,543,651 | ) |
| (6,502,202 | ) | |||||
Net assets | $ | 119,139,009 | $ | 38,850,895 |
| $ | 50,868,725 |
| |||||
|
|
|
|
| |||||||||
a Investment securities at cost | $ | 108,037,141 | $ | 39,325,283 |
| $ | 56,508,403 |
| |||||
See accompanying notes to the financial statements.
28
Statements of Assets and Liabilities June 30, 2022 (unaudited) (continued)
China | International | Emerging | ||||||||||||
ASSETS |
|
|
|
|
|
| ||||||||
Investment securities at valuea | $ | 75,905,925 |
| $ | 166,813,803 |
| $ | 11,904,797 |
| |||||
Cash |
| 285,358 |
|
| 3,363,803 |
|
| 1,335,183 |
| |||||
Foreign Currencyb |
| 271,282 |
|
| 7,255 |
|
| 143,495 |
| |||||
Receivable from securities sold |
| 1,058,013 |
|
| 771,038 |
|
| 176,750 |
| |||||
Dividends and interest receivable |
| 224,505 |
|
| 1,027,661 |
|
| 19,590 |
| |||||
Prepaid expenses |
| 18,568 |
|
| 29,017 |
|
| 21,706 |
| |||||
Total Assets |
| 77,763,651 |
|
| 172,012,577 |
|
| 13,601,521 |
| |||||
|
|
|
|
|
| |||||||||
LIABILITIES |
|
|
|
|
|
| ||||||||
Payable for securities purchased |
| 1,188,366 |
|
| — |
|
| 305,010 |
| |||||
Payable to advisor (see note 3) |
| 71,917 |
|
| 146,988 |
|
| 1,295 |
| |||||
Payable to distributor |
| 11,521 |
|
| 38,187 |
|
| 371 |
| |||||
Accrued expenses |
| 50,956 |
|
| 120,765 |
|
| 69,245 |
| |||||
Total Liabilities |
| 1,322,760 |
|
| 305,940 |
|
| 375,921 |
| |||||
NET ASSETS | $ | 76,440,891 |
| $ | 171,706,637 |
| $ | 13,225,600 |
| |||||
|
|
|
|
|
| |||||||||
NET ASSETS |
|
|
|
|
|
| ||||||||
Investor Class | $ | 59,828,511 |
| $ | 171,706,637 |
| $ | 1,787,528 |
| |||||
Institutional Class |
| 16,612,380 |
|
| — |
|
| 11,438,072 |
| |||||
Total | $ | 76,440,891 |
| $ | 171,706,637 |
| $ | 13,225,600 |
| |||||
|
|
|
|
|
| |||||||||
SHARES OUTSTANDING |
|
|
|
|
|
| ||||||||
(shares of beneficial interest issued and outstanding, respectively, unlimited number of shares authorized with no par value) |
|
|
|
|
|
| ||||||||
Investor Class |
| 6,639,313 |
|
| 10,231,919 |
|
| 170,527 |
| |||||
Institutional Class |
| 1,814,874 |
|
| — |
|
| 1,080,197 |
| |||||
Total |
| 8,454,187 |
|
| 10,231,919 |
|
| 1,250,724 |
| |||||
|
|
|
|
|
| |||||||||
NET ASSET VALUE |
|
|
|
|
|
| ||||||||
Investor Class, offering price and redemption price | $ | 9.01 |
| $ | 16.78 |
| $ | 10.48 |
| |||||
Institutional Class, offering price and redemption price | $ | 9.15 |
| $ | — |
| $ | 10.59 |
| |||||
|
|
|
|
|
| |||||||||
ANALYSIS OF NET ASSETS |
|
|
|
|
|
| ||||||||
Capital | $ | 81,420,711 |
| $ | 212,790,443 |
| $ | 13,541,730 |
| |||||
Accumulated losses |
| (4,979,820 | ) |
| (41,083,806 | ) |
| (316,130 | ) | |||||
Net assets | $ | 76,440,891 |
| $ | 171,706,637 |
| $ | 13,225,600 |
| |||||
|
|
|
|
|
| |||||||||
a Investment securities at cost | $ | 67,391,599 |
| $ | 192,198,329 |
| $ | 11,444,300 |
| |||||
b Foreign currency at cost | $ | 271,309 |
| $ | 7,228 |
| $ | 143,550 |
| |||||
See accompanying notes to the financial statements.
29
Statements of Operations Period Ended June 30, 2022 (unaudited)
Micro-Cap | Small-Cap | ||||||||
INVESTMENT INCOME |
|
|
|
| |||||
Dividends | $ | 326,638 |
| $ | 61,883 |
| |||
Total investment income |
| 326,638 |
|
| 61,883 |
| |||
|
|
|
| ||||||
| EXPENSES |
|
|
|
|
|
|
| |
Investment advisory fees (see note 3) |
| 391,574 |
|
| 65,928 |
| |||
Management fees (see note 3) |
| 261,049 |
|
| 65,928 |
| |||
Distribution fees and shareholder services |
| 94,361 |
|
| 25,644 |
| |||
Transfer agent fees and expenses |
| 60,946 |
|
| 21,730 |
| |||
Custodian fees and expenses |
| 10,718 |
|
| 5,357 |
| |||
Accounting services fees |
| 27,939 |
|
| 12,546 |
| |||
Federal and state registration fees |
| 19,324 |
|
| 16,280 |
| |||
Other |
| 44,416 |
|
| 19,246 |
| |||
Total expenses before reimbursed expenses |
| 910,327 |
|
| 232,659 |
| |||
Earnings credit (see note 6) |
| (2,029 | ) |
| (2,677 | ) | |||
Expense reimbursement (see note 3) |
| — |
|
| (39,518 | ) | |||
Total expenses |
| 908,298 |
|
| 190,464 |
| |||
NET INVESTMENT LOSS |
| (581,660 | ) |
| (128,581 | ) | |||
|
|
|
| ||||||
NET REALIZED AND UNREALIZED GAINS (LOSSES) FROM INVESTMENTS |
| ||||||||
Net realized gains on investment transactions |
| 745,237 |
|
| 506,124 |
| |||
Change in net unrealized appreciation/depreciation on investments |
| (33,065,710 | ) |
| (9,115,777 | ) | |||
Net realized/unrealized losses on investments |
| (32,320,473 | ) |
| (8,609,653 | ) | |||
NET DECREASE IN NET ASSETS RESULTING FROM OPERATIONS | $ | (32,902,133 | ) | $ | (8,738,234 | ) | |||
See accompanying notes to the financial statements.
30
Statements of Operations Period Ended June 30, 2022 (unaudited) (continued)
Global | China | International | Emerging | ||||||||||||
INVESTMENT INCOME |
|
|
|
|
|
|
|
| |||||||
Dividendsa | $ | 317,608 |
| $ | 494,084 |
| $ | 2,455,478 |
| $ | 81,416 |
| |||
Total investment income |
| 317,608 |
|
| 494,084 |
|
| 2,455,478 |
|
| 81,416 |
| |||
|
|
|
|
|
|
|
| ||||||||
EXPENSES |
|
|
|
|
|
|
|
| |||||||
Investment advisory fees (see note 3) |
| 130,328 |
|
| 456,610 |
|
| 1,415,364 |
|
| 83,310 |
| |||
Management fees (see note 3) |
| 117,931 |
|
| — |
|
| — |
|
| — |
| |||
Distribution fees and shareholder services (see note 3) |
| 49,576 |
|
| 74,880 |
|
| 283,073 |
|
| 2,164 |
| |||
Transfer agent fees and expenses |
| 31,349 |
|
| 58,330 |
|
| 204,434 |
|
| 15,990 |
| |||
Custodian fees and expenses |
| 20,969 |
|
| 56,434 |
|
| 63,672 |
|
| 23,770 |
| |||
Accounting services fees |
| 17,767 |
|
| 23,646 |
|
| 45,678 |
|
| 12,356 |
| |||
Federal and state registration fees |
| 15,854 |
|
| 18,748 |
|
| 17,958 |
|
| 16,827 |
| |||
Audit fees |
| 10,744 |
|
| 10,744 |
|
| 10,746 |
|
| 10,744 |
| |||
Other |
| 18,755 |
|
| 22,980 |
|
| 66,047 |
|
| 6,395 |
| |||
Total expenses before reimbursed expenses |
| 413,273 |
|
| 722,372 |
|
| 2,106,972 |
|
| 171,556 |
| |||
Earnings credit (see note 6) |
| (1,793 | ) |
| (2,291 | ) |
| (1,001 | ) |
| (1,580 | ) | |||
Expense reimbursement (see note 3) |
| — |
|
| — |
|
| (294,304 | ) |
| (67,843 | ) | |||
Total Expenses |
| 411,480 |
|
| 720,081 |
|
| 1,811,667 |
|
| 102,133 |
| |||
NET INVESTMENT INCOME (LOSS) |
| (93,872 | ) |
| (225,997 | ) |
| 643,811 |
|
| (20,717 | ) | |||
|
|
|
|
|
|
|
| ||||||||
NET REALIZED AND UNREALIZED GAINS (LOSSES) FROM INVESTMENTS |
| ||||||||||||||
Net realized losses on investment transactions |
| (363,577 | ) |
| (13,241,416 | ) |
| (8,972,644 | ) |
| (996,218 | ) | |||
Net realized foreign capital gains tax |
| — |
|
| — |
|
| — |
|
| (10,384 | ) | |||
Net realized losses on foreign currency transactions |
| (6,041 | ) |
| (17,714 | ) |
| (29,959 | ) |
| (5,646 | ) | |||
Net realized losses on investments and foreign currency transactions |
| (369,618 | ) |
| (13,259,130 | ) |
| (9,002,603 | ) |
| (1,012,248 | ) | |||
Change in net deferred foreign capital gains taxes on unrealized appreciation/ depreciation |
| — |
|
| — |
|
| — |
|
| 30,471 |
| |||
Change in net unrealized appreciation/depreciation on investments and translation of assets and liabilities denominated in foreign currencies |
| (26,158,745 | ) |
| (6,933,017 | ) |
| (98,952,966 | ) |
| (2,545,651 | ) | |||
Net realized/unrealized losses on investments and foreign currencies |
| (26,528,363 | ) |
| (20,192,147 | ) |
| (107,955,569 | ) |
| (3,527,428 | ) | |||
NET DECREASE IN NET ASSETS RESULTING FROM OPERATIONS | $ | (26,622,235 | ) | $ | (20,418,144 | ) | $ | (107,311,758 | ) | $ | (3,548,145 | ) | |||
a Dividends are net of foreign withholding tax of $23,474, $16,030, $279,173, and $16,024 for the Global Opportunities Fund, China Opportunities Fund, International Opportunities Fund, and Emerging Markets Fund respectively.
See accompanying notes to the financial statements.
31
Statements of Changes in Net Assets
Micro-Cap Fund | |||||||||
Six Months Ended | Year Ended | ||||||||
FROM OPERATIONS |
|
|
|
| |||||
Net investment loss | $ | (581,660 | ) | $ | (1,096,106 | ) | |||
Net realized gains on investment transactions |
| 745,237 |
|
| 31,544,351 |
| |||
Change in net unrealized appreciation/depreciation on investments |
| (33,065,710 | ) |
| 12,706,177 |
| |||
Net increase (decrease) in net assets resulting from operations |
| (32,902,133 | ) |
| 43,154,422 |
| |||
|
|
|
| ||||||
FROM DISTRIBUTIONS: |
|
|
|
| |||||
Distributions to shareholders |
|
|
|
| |||||
Investor Class |
| — |
|
| (17,266,714 | ) | |||
Institutional Class |
| — |
|
| (11,065,037 | ) | |||
Net decrease in net assets from distributions |
| — |
|
| (28,331,751 | ) | |||
|
|
|
| ||||||
FROM CAPITAL SHARE TRANSACTIONS |
|
|
|
| |||||
Investor Class |
|
|
|
| |||||
Proceeds from sale of shares |
| 25,492,356 |
|
| 36,156,710 |
| |||
Proceeds from reinvestment of distributions |
| — |
|
| 16,519,001 |
| |||
Redemption of shares (see note 5) |
| (21,581,449 | ) |
| (18,912,822 | ) | |||
Net increase from investor class share transactions |
| 3,910,907 |
|
| 33,762,889 |
| |||
Institutional Class |
|
|
|
| |||||
Proceeds from sale of shares |
| 23,481,492 |
|
| 13,443,503 |
| |||
Proceeds from reinvestment of distributions |
| — |
|
| 4,327,680 |
| |||
Redemption of shares (see note 5) |
| (13,028,970 | ) |
| (5,332,751 | ) | |||
Net increase from institutional class share transactions |
| 10,452,522 |
|
| 12,438,432 |
| |||
Redemption fees (see note 5) |
| 59,793 |
|
| 46,967 |
| |||
Net increase in net assets resulting from capital share transactions |
| 14,423,222 |
|
| 46,248,288 |
| |||
Total increase (decrease) in net assets |
| (18,478,911 | ) |
| 61,070,959 |
| |||
|
|
|
| ||||||
NET ASSETS |
|
|
|
| |||||
Beginning of period |
| 137,617,920 |
|
| 76,546,961 |
| |||
End of period | $ | 119,139,009 |
| $ | 137,617,920 |
| |||
|
|
|
| ||||||
TRANSACTIONS IN SHARES |
|
|
|
| |||||
Investor Class |
|
|
|
| |||||
Shares sold |
| 800,976 |
|
| 906,972 |
| |||
Shares issued in reinvestment of distributions |
| — |
|
| 461,296 |
| |||
Less shares redeemed |
| (682,863 | ) |
| (484,941 | ) | |||
Net increase from investor class share transactions |
| 118,113 |
|
| 883,327 |
| |||
Institutional Class |
|
|
|
| |||||
Shares sold |
| 717,758 |
|
| 320,473 |
| |||
Shares issued in reinvestment of distributions |
| — |
|
| 119,023 |
| |||
Less shares redeemed |
| (426,728 | ) |
| (129,108 | ) | |||
Net increase from institutional class share transactions |
| 291,030 |
|
| 310,388 |
| |||
Net increase from capital share transactions |
| 409,143 |
|
| 1,193,715 |
| |||
See accompanying notes to the financial statements.
32
THE OBERWEIS FUNDS
Statements of Changes in Net Assets (continued)
Small-Cap Opportunities Fund | |||||||||
Six Months Ended | Year Ended | ||||||||
FROM OPERATIONS |
|
|
|
| |||||
Net investment loss | $ | (128,581 | ) | $ | (238,629 | ) | |||
Net realized gains on investment transactions |
| 506,124 |
|
| 5,904,644 |
| |||
Change in net unrealized appreciation/depreciation on investments |
| (9,115,777 | ) |
| 1,849,942 |
| |||
Net increase (decrease) in net assets resulting from operations |
| (8,738,234 | ) |
| 7,515,957 |
| |||
|
|
|
| ||||||
FROM DISTRIBUTIONS |
|
|
|
| |||||
Distributions to shareholders |
|
|
|
| |||||
Investor Class |
| — |
|
| (3,123,678 | ) | |||
Institutional Class |
| — |
|
| (2,406,568 | ) | |||
Net decrease in net assets from distributions |
| — |
|
| (5,530,246 | ) | |||
|
|
|
| ||||||
FROM CAPITAL SHARE TRANSACTIONS |
|
|
|
| |||||
Investor Class |
|
|
|
| |||||
Proceeds from sale of shares |
| 19,320,735 |
|
| 7,952,725 |
| |||
Proceeds from reinvestment of distributions |
| — |
|
| 2,713,282 |
| |||
Redemption of shares (see note 5) |
| (3,854,525 | ) |
| (2,502,149 | ) | |||
Net increase from investor class share transactions |
| 15,466,210 |
|
| 8,163,858 |
| |||
Institutional Class |
|
|
|
| |||||
Proceeds from sale of shares |
| 4,758,683 |
|
| 1,774,000 |
| |||
Proceeds from reinvestment of distributions |
| — |
|
| 1,540,672 |
| |||
Redemption of shares (see note 5) |
| (1,703,510 | ) |
| (1,053,050 | ) | |||
Net increase from institutional class share transactions |
| 3,055,173 |
|
| 2,261,622 |
| |||
Redemption fees (see note 5) |
| 18,890 |
|
| 4,859 |
| |||
Net increase in net assets resulting from capital share transactions |
| 18,540,273 |
|
| 10,430,339 |
| |||
Total increase in net assets |
| 9,802,039 |
|
| 12,416,050 |
| |||
|
|
|
| ||||||
NET ASSETS |
|
|
|
| |||||
Beginning of period |
| 29,048,856 |
|
| 16,632,806 |
| |||
End of period | $ | 38,850,895 |
| $ | 29,048,856 |
| |||
|
|
|
| ||||||
TRANSACTIONS IN SHARES |
|
|
|
| |||||
Investor Class |
|
|
|
| |||||
Shares sold |
| 1,021,947 |
|
| 317,889 |
| |||
Shares issued in reinvestment of distributions |
| — |
|
| 126,140 |
| |||
Less shares redeemed |
| (206,364 | ) |
| (111,005 | ) | |||
Net increase from investor class share transactions |
| 815,583 |
|
| 333,024 |
| |||
Institutional Class |
|
|
|
| |||||
Shares sold |
| 243,812 |
|
| 76,279 |
| |||
Shares issued in reinvestment of distributions |
| — |
|
| 70,382 |
| |||
Less shares redeemed |
| (86,729 | ) |
| (45,184 | ) | |||
Net increase from institutional class share transactions |
| 157,083 |
|
| 101,477 |
| |||
Net increase from capital share transactions |
| 972,666 |
|
| 434,501 |
| |||
See accompanying notes to the financial statements.
33
Statements of Changes in Net Assets (continued)
Global Opportunities Fund | |||||||||
Six Months Ended | Year Ended | ||||||||
FROM OPERATIONS |
|
|
|
| |||||
Net investment loss | $ | (93,872 | ) | $ | (592,981 | ) | |||
Net realized gains (losses) on investment and foreign currency transactions |
| (369,618 | ) |
| 18,504,114 |
| |||
Change in net unrealized appreciation/depreciation on investments and foreign currencies |
| (26,158,745 | ) |
| (4,663,916 | ) | |||
Net increase (decrease) in net assets resulting from operations |
| (26,622,235 | ) |
| 13,247,217 |
| |||
|
|
|
| ||||||
FROM DISTRIBUTIONS |
|
|
|
| |||||
Distributions to shareholders |
|
|
|
| |||||
Investor Class |
| — |
|
| (10,952,215 | ) | |||
Institutional Class |
| — |
|
| (4,909,922 | ) | |||
Net decrease in net assets from distributions |
| — |
|
| (15,862,137 | ) | |||
|
|
|
| ||||||
FROM CAPITAL SHARE TRANSACTIONS |
|
|
|
| |||||
Investor Class |
|
|
|
| |||||
Proceeds from sale of shares |
| 1,697,480 |
|
| 7,705,053 |
| |||
Proceeds from reinvestment of distributions |
| — |
|
| 9,853,010 |
| |||
Redemption of shares (see note 5) |
| (4,403,530 | ) |
| (8,274,566 | ) | |||
Net increase (decrease) from investor class share transactions |
| (2,706,050 | ) |
| 9,283,497 |
| |||
Institutional Class |
|
|
|
| |||||
Proceeds from sale of shares |
| 6,268,839 |
|
| 6,574,138 |
| |||
Proceeds from reinvestment of distributions |
| — |
|
| 3,645,759 |
| |||
Redemption of shares (see note 5) |
| (2,933,590 | ) |
| (2,714,588 | ) | |||
Net increase from institutional class share transactions |
| 3,335,249 |
|
| 7,505,309 |
| |||
Redemption fees (see note 5) |
| 1,393 |
|
| 11,495 |
| |||
Net increase in net assets resulting from capital share transactions |
| 630,592 |
|
| 16,800,301 |
| |||
Total increase (decrease) in net assets |
| (25,991,643 | ) |
| 14,185,381 |
| |||
|
|
|
| ||||||
NET ASSETS |
|
|
|
| |||||
Beginning of period |
| 76,860,368 |
|
| 62,674,987 |
| |||
End of period | $ | 50,868,725 |
| $ | 76,860,368 |
| |||
|
|
|
| ||||||
TRANSACTIONS IN SHARES |
|
|
|
| |||||
Investor Class |
|
|
|
| |||||
Shares sold |
| 60,092 |
|
| 179,412 |
| |||
Shares issued in reinvestment of distributions |
| — |
|
| 279,360 |
| |||
Less shares redeemed |
| (160,182 | ) |
| (195,351 | ) | |||
Net increase (decrease) from investor class share transactions |
| (100,090 | ) |
| 263,421 |
| |||
Institutional Class |
|
|
|
| |||||
Shares sold |
| 234,546 |
|
| 153,008 |
| |||
Shares issued in reinvestment of distributions |
| — |
|
| 101,780 |
| |||
Less shares redeemed |
| (102,270 | ) |
| (62,733 | ) | |||
Net increase from institutional class share transactions |
| 132,276 |
|
| 192,055 |
| |||
Net increase from capital share transactions |
| 32,186 |
|
| 455,476 |
| |||
See accompanying notes to the financial statements.
34
Statements of Changes in Net Assets (continued)
China Opportunities Fund | |||||||||
Six Months Ended | Year Ended | ||||||||
FROM OPERATIONS |
|
|
|
| |||||
Net investment loss | $ | (225,997 | ) | $ | (672,492 | ) | |||
Net realized gains (losses) on investment and foreign currency transactions |
| (13,259,130 | ) |
| 28,850,352 |
| |||
Change in net unrealized appreciation/depreciation on investments and foreign currencies |
| (6,933,017 | ) |
| (34,074,056 | ) | |||
Net decrease in net assets resulting from operations |
| (20,418,144 | ) |
| (5,896,196 | ) | |||
|
|
|
| ||||||
FROM DISTRIBUTIONS |
|
|
|
| |||||
Distributions to shareholders |
|
|
|
| |||||
Investor Class |
| — |
|
| (24,499,105 | ) | |||
Institutional Class |
| — |
|
| (4,324,663 | ) | |||
Net decrease in net assets from distributions |
| — |
|
| (28,823,768 | ) | |||
|
|
|
| ||||||
FROM CAPITAL SHARE TRANSACTIONS |
|
|
|
| |||||
Investor Class |
|
|
|
| |||||
Proceeds from sale of shares |
| 3,325,134 |
|
| 10,556,082 |
| |||
Proceeds from reinvestment of distributions |
| — |
|
| 22,926,946 |
| |||
Redemption of shares (see note 5) |
| (6,990,122 | ) |
| (21,557,737 | ) | |||
Net increase (decrease) from investor class share transactions |
| (3,664,988 | ) |
| 11,925,291 |
| |||
Institutional Class |
|
|
|
| |||||
Proceeds from sale of shares |
| 6,761,248 |
|
| 2,825,562 |
| |||
Proceeds from reinvestment of distributions |
| — |
|
| 3,592,224 |
| |||
Redemption of shares (see note 5) |
| (2,512,068 | ) |
| (7,413,774 | ) | |||
Net increase (decrease) from institutional class share transactions |
| 4,249,180 |
|
| (995,988 | ) | |||
Redemption fees (see note 5) |
| 9,957 |
|
| 30,950 |
| |||
Net increase from capital share transactions |
| 594,149 |
|
| 10,960,253 |
| |||
Total decrease in net assets |
| (19,823,995 | ) |
| (23,759,711 | ) | |||
|
|
|
| ||||||
NET ASSETS |
|
|
|
| |||||
Beginning of period |
| 96,264,886 |
|
| 120,024,597 |
| |||
End of period | $ | 76,440,891 |
| $ | 96,264,886 |
| |||
|
|
|
| ||||||
TRANSACTIONS IN SHARES |
|
|
|
| |||||
Investor Class |
|
|
|
| |||||
Shares sold |
| 366,891 |
|
| 641,145 |
| |||
Shares issued in reinvestment of distributions |
| — |
|
| 2,012,901 |
| |||
Less shares redeemed |
| (769,394 | ) |
| (1,312,152 | ) | |||
Net increase (decrease) from investor class share transactions |
| (402,503 | ) |
| 1,341,894 |
| |||
Institutional Class |
|
|
|
| |||||
Shares sold |
| 803,732 |
|
| 191,107 |
| |||
Shares issued in reinvestment of distributions |
| — |
|
| 310,746 |
| |||
Less shares redeemed |
| (294,888 | ) |
| (429,627 | ) | |||
Net increase from institutional class share transactions |
| 508,844 |
|
| 72,226 |
| |||
Net increase from capital share transactions |
| 106,341 |
|
| 1,414,120 |
| |||
See accompanying notes to the financial statements.
35
Statements of Changes in Net Assets (continued)
International Opportunities Fund | |||||||||
Six Months Ended | Year Ended | ||||||||
FROM OPERATIONS |
|
|
|
| |||||
Net investment income (loss) | $ | 643,811 |
| $ | (2,693,822 | ) | |||
Net realized gains (losses) on investments and foreign currency transactions |
| (9,002,603 | ) |
| 68,274,853 |
| |||
Change in net unrealized appreciation/depreciation on investments and foreign currencies |
| (98,952,966 | ) |
| (60,205,704 | ) | |||
Net increase (decrease) in net assets resulting from operations |
| (107,311,758 | ) |
| 5,375,327 |
| |||
|
|
|
| ||||||
FROM DISTRIBUTIONS |
|
|
|
| |||||
Distributions to shareholders |
| — |
|
| (54,761,352 | ) | |||
Net decrease in net assets from distributions |
| — |
|
| (54,761,352 | ) | |||
|
|
|
| ||||||
FROM CAPITAL SHARE TRANSACTIONS |
|
|
|
| |||||
Proceeds from sale of shares |
| 16,696,488 |
|
| 55,352,019 |
| |||
Proceeds from reinvestment of distributions |
| — |
|
| 48,423,319 |
| |||
Redemption of shares (see note 5) |
| (48,067,005 | ) |
| (71,434,390 | ) | |||
Redemption fees (see note 5) |
| 32,647 |
|
| 46,955 |
| |||
Net increase (decrease) from capital share transactions |
| (31,337,870 | ) |
| 32,387,903 |
| |||
Total decrease in net assets |
| (138,649,628 | ) |
| (16,998,122 | ) | |||
|
|
|
| ||||||
NET ASSETS |
|
|
|
| |||||
Beginning of period |
| 310,356,265 |
|
| 327,354,387 |
| |||
End of period | $ | 171,706,637 |
| $ | 310,356,265 |
| |||
|
|
|
| ||||||
TRANSACTIONS IN SHARES |
|
|
|
| |||||
Shares sold |
| 778,851 |
|
| 1,709,411 |
| |||
Shares issued in reinvestment of distributions |
| — |
|
| 1,832,828 |
| |||
Less shares redeemed |
| (2,258,773 | ) |
| (2,214,866 | ) | |||
Net increase (decrease) from capital share transactions |
| (1,479,922 | ) |
| 1,327,373 |
| |||
See accompanying notes to the financial statements.
36
Statements of Changes in Net Assets (continued)
Emerging Markets Fund | |||||||||
Six Months Ended | Year Ended | ||||||||
FROM OPERATIONS |
|
|
|
| |||||
Net investment loss | $ | (20,717 | ) | $ | (81,243 | ) | |||
Net realized gains (losses) on investments and foreign currency transactions |
| (1,012,248 | ) |
| 1,728,935 |
| |||
Change in net unrealized appreciation/depreciation on investments and foreign currencies |
| (2,515,180 | ) |
| (205,546 | ) | |||
Net increase (decrease) in net assets resulting from operations |
| (3,548,145 | ) |
| 1,442,146 |
| |||
|
|
|
| ||||||
FROM DISTRIBUTIONS |
|
|
|
| |||||
Distributions to shareholders |
|
|
|
| |||||
Investor Class |
| — |
|
| (203,953 | ) | |||
Institutional Class |
| — |
|
| (1,523,671 | ) | |||
Net decrease in net assets from distributions |
| — |
|
| (1,727,624 | ) | |||
|
|
|
| ||||||
FROM CAPITAL SHARE TRANSACTIONS |
|
|
|
| |||||
Investor Class |
|
|
|
| |||||
Proceeds from sale of shares |
| 773,222 |
|
| 1,259,242 |
| |||
Proceeds from reinvestment of distributions |
| — |
|
| 186,395 |
| |||
Redemption of shares (see note 5) |
| (165,349 | ) |
| (481,241 | ) | |||
Net increase from investor class share transactions |
| 607,873 |
|
| 964,396 |
| |||
Institutional Class |
|
|
|
| |||||
Proceeds from sale of shares |
| 2,925,791 |
|
| 1,312,840 |
| |||
Proceeds from reinvestment of distributions |
| — |
|
| 1,143,509 |
| |||
Redemption of shares (see note 5) |
| (319,627 | ) |
| (309,129 | ) | |||
Net increase from institutional class share transactions |
| 2,606,164 |
|
| 2,147,220 |
| |||
Redemption fees (see note 5) |
| 3,086 |
|
| 2,746 |
| |||
Net increase in net assets resulting from capital share transactions |
| 3,217,123 |
|
| 3,114,362 |
| |||
Total increase (decrease) in net assets |
| (331,022 | ) |
| 2,828,884 |
| |||
|
|
|
| ||||||
NET ASSETS |
|
|
|
| |||||
Beginning of period |
| 13,556,622 |
|
| 10,727,738 |
| |||
End of period | $ | 13,225,600 |
| $ | 13,556,622 |
| |||
|
|
|
| ||||||
TRANSACTIONS IN SHARES |
|
|
|
| |||||
Investor Class |
|
|
|
| |||||
Shares sold |
| 64,079 |
|
| 81,184 |
| |||
Shares issued in reinvestment of distributions |
| — |
|
| 13,726 |
| |||
Less shares redeemed |
| (14,333 | ) |
| (31,287 | ) | |||
Net increase from investor class share transactions |
| 49,746 |
|
| 63,623 |
| |||
Institutional Class |
|
|
|
| |||||
Shares sold |
| 239,897 |
|
| 88,151 |
| |||
Shares issued in reinvestment of distributions |
| — |
|
| 83,407 |
| |||
Less shares redeemed |
| (25,768 | ) |
| (20,438 | ) | |||
Net increase from investor class share transactions |
| 214,129 |
|
| 151,120 |
| |||
Net increase from capital share transactions |
| 263,875 |
|
| 214,743 |
| |||
See accompanying notes to the financial statements.
37
Notes to Financial Statements June 30, 2022 (unaudited)
1. Description of Organization
Description of business. The Oberweis Funds (the ‘‘Trust’’) is registered under the Investment Company Act of 1940 as an open-end management investment company. The Trust is authorized to operate numerous Funds under various trading strategies. The Trust consists of eight Funds of which six are in this report: the Oberweis Micro-Cap Fund, the Oberweis Small-Cap Opportunities Fund, the Oberweis Global Opportunities Fund, the Oberweis China Opportunities Fund, the Oberweis International Opportunities Fund, and the Oberweis Emerging Markets Fund (collectively, ‘‘the Funds’’) are each a series of the Trust. Each Fund in this report except for Oberweis International Opportunities Fund currently offers two classes of shares: Investor Class and Institutional Class. Oberweis International Opportunities Fund offers only Investor Class shares. Each class of shares has identical voting, dividend, liquidation and other rights and the same terms and conditions, except each class may be subject to different class expenses as outlined in the relevant prospectus and each class has exclusive voting rights with respect to matters solely affecting such class.
2. Significant Accounting Policies
The following is a summary of significant accounting policies consistently followed by the Funds. These policies are in conformity with accounting principles generally accepted in the United States of America (“GAAP”). The Funds are each an investment company and follow accounting and reporting guidance under the Financial Accounting Standards Board (“FASB”) Accounting Standards Codification (“ASC”) Topic 946, “Financial Services—Investment Companies.”
Investment valuation. Investments in securities are stated at value as of the close of the regular trading session on the New York Stock Exchange (‘‘NYSE’’) (generally 3 p.m., Central Standard Time). Each listed and unlisted security for which last sale information is regularly reported is valued at the last reported sales price on that day. If there has been no sale on such day, then such security is valued at the current day’s bid price. Any unlisted security for which last sale information is not regularly reported and any listed debt security which has an inactive listed market for which over-the-counter market quotations are readily available is valued at the closing bid price determined on the basis of reasonable inquiry. Restricted securities and any other securities or other assets for which market quotations are not readily available are valued by appraisal at their fair value as determined in good faith under procedures established by and under the general supervision and responsibility of the Board of Trustees. Short-term debt obligations, commercial paper and repurchase agreements are valued on the basis of quoted yields for securities of comparable maturity, quality and type or on the basis of amortized cost.
The Oberweis Global Opportunities Fund, the Oberweis China Opportunities Fund, the Oberweis International Opportunities Fund and the Oberweis Emerging Markets Fund hold foreign equity securities. Foreign securities are fair valued as described in the following circumstances. Generally, trading in foreign securities markets is completed each day at various times prior to the close of the regular trading session of the NYSE. Due to the time differences between the closings of the relevant foreign securities exchanges and the close of the regular trading session of the NYSE for the Funds, the Funds will fair value their foreign investments when it is determined that the market quotations for the foreign investments either are not readily available or are unreliable and, therefore, do not represent fair value. When the fair value prices are utilized, these prices will attempt to reflect the impact of the U.S. financial
38
THE OBERWEIS FUNDS
Notes to Financial Statements June 30, 2022 (unaudited) (continued)
markets’ perceptions and trading activities on the Funds’ foreign investments since the last closing prices of the foreign investments were calculated on their primary foreign securities markets or exchanges. For these purposes, the Board of Trustees of the Trust has determined that movements in relevant indices, after the close of the foreign securities exchanges, may demonstrate that market quotations are unreliable, and may trigger fair value pricing for certain securities. Consequently, fair valuation of portfolio securities may occur on a daily basis. In determining fair value prices, the Trust utilizes data furnished by an independent pricing service (and that data draws upon, among other information, the market values of foreign investments). When a Fund uses fair value pricing, the values assigned to the Fund’s foreign investments may not be the quoted or published prices of the investments on their primary markets or exchanges.
Fair Value Measurements. In accordance with Financial Accounting Standards Board (‘‘FASB’’) guidance, the Funds utilize the ‘‘Fair Value Measurements and Disclosures’’ to define fair value, set out a framework for measuring fair value, and expand disclosures regarding fair value measurements.
Various inputs are used in determining the value of the Fund’s investments. These inputs are summarized in the three levels listed below:
• Level 1 – Quoted prices in active markets for identical securities.
• Level 2 – Other significant observable inputs (including quoted prices for similar securities, interest rates, prepayment speeds, credit risk, etc).
• Level 3 – Significant unobservable inputs (including the Fund’s own assumptions in determining the fair value of investments).
The inputs or methodology used for valuing securities are not necessarily an indication of the risk associated with investing in those securities. The following is a summary of the inputs used to value the Funds’ net assets as of June 30, 2022:
Micro-Cap | Small-Cap | |||||||
Level 1 – Equities | $ | 116,116,843 | $ | 37,171,305 | ||||
Total Level 1 |
| 116,116,843 |
| 37,171,305 | ||||
Level 2 |
| — |
| — | ||||
Level 3 |
| — |
| — | ||||
Total Investments | $ | 116,116,843 | $ | 37,171,305 | ||||
Global | China | International | |||||||||
Level 1 – Equities |
|
|
| ||||||||
Total Asia | $ | 12,114,938 | $ | 75,905,925 | $ | 26,832,350 | |||||
Total Australia |
| 1,235,321 |
| — |
| 18,799,781 | |||||
Total Europe |
| 11,102,966 |
| — |
| 95,030,153 | |||||
Total North America |
| 25,068,676 |
| — |
| 26,151,519 | |||||
Total South America |
| — |
| — |
| — | |||||
Total Level 1 |
| 49,521,901 |
| 75,905,925 |
| 166,813,803 | |||||
Level 2 |
| — |
| — |
| — | |||||
Level 3 |
| — |
| — |
| — | |||||
Total Investments | $ | 49,521,901 | $ | 75,905,925 | $ | 166,813,803 | |||||
39
THE OBERWEIS FUNDS
Notes to Financial Statements June 30, 2022 (unaudited) (continued)
Emerging Markets | |||||
Level 1 – Equities |
| ||||
Total Asia | $ | 8,934,538 | |||
Total Africa |
| 194,747 | |||
Total Australia |
| 243,330 | |||
Total Europe |
| 920,566 | |||
Total North America |
| 409,217 | |||
Total South America |
| 1,202,399 | |||
Total Level 1 |
| 11,904,797 | |||
Level 2 |
| — | |||
Level 3 |
| — | |||
Total Investments | $ | 11,904,797 | |||
The Funds’ assets include certain foreign securities for which a third-party statistical pricing service may be employed for purposes of fair market valuation. The pricing service provides fair market valuation on days when the movement in relevant indices exceeds a predetermined threshold.
Foreign Currency Transactions. The accounting records of the Funds are maintained in U.S. dollars. Foreign currency amounts are translated into U.S. dollars at the current rate of exchange to determine the value of investments, assets and liabilities. Purchases and sales of securities, and income and expenses are translated at the prevailing rate of exchange on the respective date of these transactions. The Funds do not isolate that portion of the results of operations resulting from changes in foreign exchange rates on investments from fluctuations arising from changes in market prices of securities held. These fluctuations are included with the net realized and unrealized gains or losses from investments and foreign currencies.
Risks Associated with Foreign Securities and Currencies. Investments in securities of foreign issuers carry certain risks not ordinarily associated with investments in securities of U.S. issuers. These risks include future political and economic developments, and the possible imposition of exchange controls or other foreign governmental laws and restrictions. In addition, with respect to certain countries, there is the possibility of expropriation of assets, confiscatory taxation, political or social instability or diplomatic developments, which could adversely affect investments in those countries.
Certain countries also may impose substantial restrictions on investments in their capital markets by foreign entities, including restrictions on investments in issuers of industries deemed sensitive to relevant national interests. These factors may limit the investment opportunities available and result in a lack of liquidity and a high price volatility with respect to securities of issuers from developing countries.
Fund Share Valuation. Fund shares are sold and redeemed on a continuous basis at net asset value. On each day the NYSE is open for trading, the net asset value per share is determined as of the later of the close of the NYSE or the CBOE by dividing the total value of each Fund’s investments and other assets, less liabilities, by the number of each Fund’s shares outstanding.
40
THE OBERWEIS FUNDS
Notes to Financial Statements June 30, 2022 (unaudited) (continued)
Investment Transactions and Investment Income. Investment transactions are accounted for on the trade date (date the order to buy or sell is executed). Dividend income is recorded on the ex-dividend date, except that certain dividends from foreign securities are recorded as soon as the information is available to the Fund, and interest income is recorded on the accrual basis and includes amortization of premium and discount. Realized gains and losses from investment transactions are reported on an identified cost basis. Income and realized and unrealized gains or losses on investments are allocated to each class of shares based on its relative net assets.
Fund Expense Allocations. The Funds account separately for the assets, liabilities and operations of each Fund. Direct expenses of each Fund or class are charged to that Fund or class while general expenses are allocated pro-rata among the Funds based on net assets or other appropriate methods.
Federal Income Taxes and Dividends to Shareholders. It is the policy of the Funds to continue to comply with all requirements of the Internal Revenue Code of 1986, as amended (‘‘the Code’’), applicable to regulated investment companies and to distribute substantially all of their taxable income to their shareholders. The Funds have met the requirements of the Code applicable to regulated investment companies for the period ended June 30, 2022. Therefore, no federal income tax provision is required. Income and capital gains of the Funds are determined in accordance with both tax regulations and accounting principles generally accepted in the U.S. (‘‘GAAP’’). Such treatment may result in temporary and permanent differences between tax basis earnings and earnings reported for financial statement purposes. These reclassifications, which have no impact on the net asset value of the Funds, are primarily attributable to certain differences in computation of distributable income and capital gains under federal tax rules versus GAAP.
Certain Funds may utilize earnings and profits on redemption of shares as part of the dividends paid deduction.
For the year ended December 31, 2021, permanent book and tax basis differences resulting primarily from differing treatments for net operating losses, foreign currency transactions, passive foreign investment company (‘‘PFIC’’) adjustments and the tax practice known as equalization, were identified and reclassified among the components of the Funds’ net assets.
GAAP requires that certain components of net assets be reclassified between financial and tax reporting. These reclassifications have no effect on net assets or net asset value per share. For the year ended December 31, 2021, permanent differences in book and tax accounting have been reclassified to paid in capital and accumulated earnings (loss) as follows:
Increases/(Decrease) | ||||||||||
Capital | Accumulated | |||||||||
Micro-Cap Fund | $ | 2,115,141 |
| $ | (2,115,141 | ) | ||||
Global Opportunities Fund |
| 1,552,718 |
|
| (1,552,718 | ) | ||||
Small-Cap Opportunities Fund |
| 498,909 |
|
| (498,909 | ) | ||||
China Opportunities Fund |
| 5,052,339 |
|
| (5,052,339 | ) | ||||
International Opportunities Fund |
| 1,632,358 |
|
| (1,632,358 | ) | ||||
Emerging Markets Fund |
| (83,369 | ) |
| 83,369 |
| ||||
41
THE OBERWEIS FUNDS
Notes to Financial Statements June 30, 2022 (unaudited) (continued)
The tax character of distributions paid during the fiscal year ended December 31, 2021 was as follows:
| Distributions | Distributions | Total | ||||
Micro-Cap Fund | $ 6,601,079 | $ 21,730,672 | $ 28,331,751 | ||||
Global Opportunities Fund | 2,861,842 | 13,000,295 | 15,862,137 | ||||
Small-Cap Opportunities Fund | 2,861,415 | 2,688,831 | 5,530,246 | ||||
China Opportunities Fund | 4,018,595 | 24,805,173 | 28,823,768 | ||||
International Opportunities Fund | — | 54,761,352 | 54,761,352 | ||||
Emerging Markets Fund | 15,223 | 1,712,401 | 1,727,624 |
The tax character of distributions paid during the fiscal year ended December 31, 2020 was as follows:
| Distributions | Distributions | Total | ||||
Micro-Cap Fund | $ — | $ — | $ — | ||||
Global Opportunities Fund | — | 3,445,739 | 3,445,739 | ||||
Small-Cap Opportunities Fund | — | 649,187 | 649,187 | ||||
China Opportunities Fund | 3,116,458 | 9,324,969 | 12,441,427 | ||||
International Opportunities Fund | 1,290,124 | — | 1,290,124 | ||||
Emerging Markets Fund | — | — | — |
The International Opportunities Fund utilized $8,525,215, respectively, of its capial loss carryforwards during the year ended December 31, 2021.
As of December 31, 2021 the components of accumulated earnings (deficit) on a tax basis were as follows:
| Undistributed | Undistributed | Accumulated | Unrealized | Unrealized | ||||||
Micro-Cap Fund | $ — | $ — | $ — | $ 41,098,971 | $ — | ||||||
Global Opportunities Fund | — | 1,327,220 | — | 18,746,003 | 406 | ||||||
Small-Cap Opportunities Fund | — | 263,165 | — | 6,931,416 | — | ||||||
China Opportunities Fund | — | 670,331 | — | 14,767,974 | 18 | ||||||
International Opportunities Fund | — | — | — | 66,225,392 | 3,561 | ||||||
Emerging Markets Fund | — | 336,985 | — | 2,965,453 | (70,422) |
42
THE OBERWEIS FUNDS
Notes to Financial Statements June 30, 2022 (unaudited) (continued)
Accumulated capital and other losses consists of timing differences related to wash sales and capital loss carryforwards.
As of December 31, 2021 the cost of investments for federal income tax purposes are as follows:
| Cost of | Gross | Gross | Unrealized | |||||
Micro-Cap Fund | $ 97,975,649 | $ 43,780,107 | $ (2,681,136) | $ 41,098,971 | |||||
Global Opportunities Fund | 55,843,137 | 20,352,799 | (1,606,796) | 18,746,003 | |||||
Small-Cap Opportunities Fund | 22,039,488 | 7,391,236 | (459,820) | 6,931,416 | |||||
China Opportunities Fund | 80,032,217 | 17,301,320 | (2,533,346) | 14,767,974 | |||||
International Opportunities Fund | 240,868,784 | 72,131,475 | (5,906,083) | 66,225,392 | |||||
Emerging Markets Fund | 9,776,967 | 3,815,023 | (849,570) | 2,965,453 |
The Funds have reviewed all open tax years and major jurisdictions and concluded that there are no significant uncertain tax positions that would require recognition in the financial statements. Open tax years are those that are open for exam by taxing authorities and, as of June 30, 2022, open Federal tax years include the tax years ended 2018 through 2022. The Funds have no examinations in progress and are also not aware of any tax positions for which it is reasonably possible that the total amounts of unrecognized tax benefits will significantly change in the next twelve months.
Use of estimates. The preparation of financial statements in conformity with generally accepted accounting principles requires management to make estimates and assumptions that affect the amounts reported in the financial statements and accompanying notes. Actual results may differ from those estimates.
Indemnifications. Under the Trust’s organizational documents, its present and former Officers and Trustees are indemnified against certain liabilities arising out of the performance of their duties to the Trust. In addition, in the normal course of business, the Trust enters into contracts that provide general indemnifications to other parties. The Trust’s maximum exposure under these arrangements is unknown as this would involve future claims that may be made against the Trust that have not yet occurred. However, the Trust has not had prior claims or losses pursuant to these contracts and expects the risk of loss to be remote.
3. Transactions with affiliates
The Funds have written agreements with Oberweis Asset Management, Inc. (‘‘OAM’’) as the Funds’ investment advisor and manager. Oberweis Securities, Inc. (‘‘OSI’’), the Funds’ principal distributor, is an affiliate of OAM.
Investment advisory agreement. Under the Advisory Agreement, OAM provides investment advisory services to the Micro-Cap, Global Opportunities, and Small-Cap Opportunities Funds and pursuant to a separate Management Agreement, OAM provides non-investment advisory management services such as administrative, compliance and accounting services to these Funds. For investment advisory services, the Micro-Cap Fund paid monthly investment advisory
43
THE OBERWEIS FUNDS
Notes to Financial Statements June 30, 2022 (unaudited) (continued)
fees at an annual rate equal to .60% of average daily net assets. The Small-Cap Opportunities Fund paid monthly investment advisory fees at an annual rate equal to .40% of average daily net assets. The Global Opportunities Fund paid monthly investment advisory fees at an annual rate equal to .45% of the first $50 million of average daily net assets and .40% of average daily net assets in excess of $50 million. For investment advisory and management services, the China Opportunities Fund, the International Opportunities Fund and the Emerging Markets Fund paid monthly investment advisory and management fees at an annual rate equal to 1.25%, 1.25% and 1.25% of average daily net assets, respectively. For the period ended June 30, 2022, the Micro-Cap Fund, Small-Cap Opportunities Fund and Global Opportunities Fund incurred investment advisory fees totaling $391,574, $65,928 and $130,328, respectively. For the period ended June 30, 2022, the China Opportunities Fund, International Opportunities Fund, and Emerging Market Fund incurred investment advisory fees totaling $456,610, $1,415,364 and $83,310, respectively.
Management agreement. For management services and facilities furnished, the Micro-Cap Fund, Small-Cap Opportunities Fund and Global Opportunities Fund each paid a monthly fee at an annual rate equal to .40% of average daily net assets. For the period ended June 30, 2022, the Micro-Cap Fund, Small-Cap Opportunities Fund and Global Opportunities Fund incurred management fees totaling $261,049, $65,928, and $117,931, respectively.
Expense reimbursement. OAM is contractually obligated to reduce its investment and management fees or reimburse the Micro-Cap Fund and Global Opportunities Fund Investor Class Shares to the extent that total ordinary operating expenses, as defined, exceed in any one year the following amounts expressed as a percentage of each Fund’s average daily net assets: 1.80% of the first $50 million; plus 1.60% of average daily net assets in excess of $50 million. OAM is contractually obligated to reduce its investment and management fees or reimburse Small-Cap Opportunities Fund, China Opportunities Fund, International Opportunities Fund and Emerging Markets Fund Investor Class Shares to the extent that total ordinary operating expenses, as defined, exceed in any one year 1.25%, 2.24%, 1.60% and 1.75% expressed as a percentage of the Fund’s average daily net assets, respectively. OAM is contractually obligated to reduce its investment and management fees or reimburse the Global Opportunities Fund and Micro-Cap Fund Institutional Class Shares to the extent that total ordinary operating expenses, as defined, exceed in any one year the following amounts expressed as a percentage of each Fund’s average daily net assets: 1.55% of the first $50 million; plus 1.35% of average daily net assets in excess of $50 million. OAM is contractually obligated to reduce its investment and management fees or reimburse the Small-Cap Opportunities Fund, China Opportunities Fund and Emerging Markets Fund Institutional Class Shares to the extent that total ordinary operating expenses, as defined, exceed in any one year 1.00%, 1.99% and 1.50% expressed as a percentage of the Funds’ average daily net assets, respectively. For the period ended June 30, 2022 OAM reimbursed the Small-Cap Opportunities Fund, the International Opportunities Fund and the Emerging Markets Fund in the amount of $39,518, $294,304, and $67,843, respectively.
Officers and trustees. Certain officers and trustees of the Trust are also officers and/or directors of OAM and OSI. During the period ended June 30, 2022, the Trust made no direct payments to its officers and paid $62,167 to its unaffiliated trustees.
Distribution and shareholder service agreement. The Funds have a distribution and shareholder services agreement with OSI. For services under the distribution and shareholder services agreement, the Funds pay OSI a fee at the annual rate of .25% of the average daily net assets of Investor Class Shares as compensation for services. For the period ended
44
THE OBERWEIS FUNDS
Notes to Financial Statements June 30, 2022 (unaudited) (continued)
June 30, 2022, the Micro-Cap Fund, Small-Cap Opportunities Fund, Global Opportunities Fund, China Opportunities Fund, International Opportunities Fund, and Emerging Markets Fund incurred distribution fees totaling $94,361, $25,644, $49,576, $74,880, $283,073, and $2,164, respectively.
Affiliated Commissions. For the period ended June 30, 2022, the Micro-Cap Fund, Global Opportunities Fund, Small-Cap Opportunities Fund, China Opportunities Fund, International Opportunities Fund and Emerging Markets Fund did not execute any security transactions through OSI and therefore did not pay commissions to OSI.
4. Investment transactions
The cost of securities purchased and proceeds from securities sold during the period ended June 30, 2022, other than money market investments, aggregated $49,774,650 and $40,369,961, respectively, for the Micro-Cap Fund, $24,860,348 and $8,050,295, respectively, for the Small-Cap Opportunities Fund, $22,836,411 and $21,345,937, respectively, for the Global Opportunities Fund, $95,201,201 and $93,920,066, respectively, for the China Opportunities Fund, $82,609,546 and $115,018,597, respectively, for the International Opportunities Fund, $6,342,773 and $3,636,649, respectively, for the Emerging Markets Fund. The Funds did not hold government securities during the period ended June 30, 2022.
The Funds may write covered call options. The premiums received provide a partial hedge (protection) against declining prices and enables each Fund to generate a higher return during periods when OAM does not expect the underlying security to make any major price moves in the near future but still deems the underlying security to be, over the long term, an attractive investment for each Fund. The Funds write covered call options for which premiums received are recorded as liabilities and are subsequently adjusted to the current value of the options written. Premiums received from writing options that expire are treated as realized gains. Premiums received from writing options, which are either exercised or closed, are offset against the proceeds received or amount paid on the transaction to determine realized gains or losses. Amounts recovered for securities litigation are included in the realized gains of the Fund and are recorded when received. The Funds did not write covered call options during the period ended June 30, 2022.
5. Redemption fee
The Oberweis Funds are designed for long-term investors. To discourage market timers, redemptions of shares of the Micro-Cap Fund, Global Opportunities Fund, and Small-Cap Opportunities Fund within 90 days of purchase are subject to a 1% redemption fee of the total redemption amount and 2% for the China Opportunities Fund, the Emerging Markets Fund and the International Opportunities Fund. The redemption fee is deducted from the redemption proceeds and is retained by the Fund.
The redemption fee is retained by the Funds for the expense they incur in connection with shareholder redemptions. Redemption fees received by the Micro-Cap Fund, Small-Cap Opportunities Fund, Global Opportunities Fund, China Opportunities Fund, International Opportunities Fund, and Emerging Markets Fund were $59,793, $18,890, $1,393, $9,957, $32,647 and $3,086, respectively, for the period ended June 30, 2022, and were recorded as a reduction of the redemption of shares in the Statements of Changes in Net Assets.
45
THE OBERWEIS FUNDS
Notes to Financial Statements June 30, 2022 (unaudited) (continued)
6. Earnings credits and interest charges
The Trust, as part of the agreement with the Custodian, receives credits against its custodian fees on its uninvested cash balances and is allowed to borrow for temporary purposes. Borrowings are not to exceed 5% of the value of each Fund’s total assets at the time of any such borrowing. Interest on amounts borrowed is calculated at the prime rate and is payable monthly. During the period ended June 30, 2022, the Micro-Cap Fund, Small-Cap Opportunities Fund, Global Opportunities Fund, China Opportunities Fund, International Opportunities Fund, and Emerging Markets Fund received credits of $2,029, $2,677, $1,793, $2,291, $1,001, and $1,580, respectively. During the period ended June 30, 2022, the Micro-Cap Fund, the Small Cap Opportunities Fund, the Global Opportunities Fund, the China Opportunities Fund, the International Opportunities Fund and the Emerging Markets Fund incurred interest charges of $6,705, $579, $68, $268, $2,762, and $0 respectively, which is included in custodian fees and expenses in the Statements of Operations.
7. Coronavirus (COVID-19) pandemic
In early 2020, an outbreak of a novel strain of coronavirus (COVID-19) emerged globally. This coronavirus has resulted in closing international borders, enhanced health screenings, healthcare service preparation and delivery, quarantines, cancellations, disruptions to supply chains and customer activity, as well as general public concern and uncertainty. The impact of this outbreak has negatively affected the worldwide economy, as well as the economies of individual countries, the financial health of individual companies and the market in general in significant and unforeseen ways. The future impact of COVID-19 is currently unknown, and it may exacerbate other risks that apply to the Funds, including political, social and economic risks. Any such impact could adversely affect the Funds’ performance, the performance of the securities in which the Funds invest and may lead to losses on your investment in each Fund. The ultimate impact of COVID-19 on the financial performance of the Funds’ investments is not reasonably estimable at this time.
8. Subsequent events
The Funds have evaluated subsequent events through the issuance of the financial statements and determined that no events have occurred that require disclosure.
46
Financial Highlights
Per share income and capital for a share outstanding throughout each period is as follows:
Investor Class | MICRO-CAP FUND | |||||||||||||||||||||||||
|
| Six Months |
| |||||||||||||||||||||||
| 2021 |
|
|
| 2020 |
|
|
| 2019 |
|
|
| 2018 |
|
|
| 2017 |
|
| |||||||
Net asset value at beginning of period | $ | 35.88 | $ | 29.10 | $ | 22.40 | $ | 18.37 | $ | 25.12 | $ | 22.02 | ||||||||||||||
| INCOME (LOSS) FROM INVESTMENT OPERATIONS: |
|
| |||||||||||||||||||||||
Net investment lossa | (.15 | ) | (.43 | ) | (.26 | ) | (.22 | ) | (.35 | ) | (.32 | ) | ||||||||||||||
Net realized and unrealized gains (losses) on investments |
| (7.72 | ) |
| 15.93 |
| 6.96 |
| 4.25 |
| (2.82 | ) |
| 6.37 | ||||||||||||
Total from investment operations | (7.87 | ) | 15.50 | 6.70 | 4.03 | (3.17 | ) | 6.05 | ||||||||||||||||||
Redemption feesa | .01 | .02 | — | — | .03 | — | ||||||||||||||||||||
Less distributions: | ||||||||||||||||||||||||||
Distribution from net realized gains on investments |
| — |
| (8.74 | ) |
| — |
| — |
| (3.61 | ) |
| (2.95 | ) | |||||||||||
Net asset value at end of period | $ | 28.02 | $ | 35.88 | $ | 29.10 | $ | 22.40 | $ | 18.37 | $ | 25.12 | ||||||||||||||
Total return (%) | (21.91 | )d | 53.38 | 29.91 | 21.94 | (12.30 | ) | 27.90 | ||||||||||||||||||
| RATIO/SUPPLEMENTAL DATA: |
|
| |||||||||||||||||||||||
Net Assets at end of period (in thousands) | $ | 71,732 | $ | 87,603 | $ | 45,345 | $ | 46,546 | $ | 53,094 | $ | 92,249 | ||||||||||||||
Ratio of gross expenses to average net assets (%) | 1.50 | c | 1.48 | 1.59 | 1.60 | 1.57 | 1.58 | |||||||||||||||||||
Ratio of net expenses to average net assets (%)b | 1.50 | c | 1.48 | 1.58 | 1.58 | 1.55 | 1.54 | |||||||||||||||||||
Ratio of net investment loss to average net assets (%) | (1.00 | )c | (1.08 | ) | (1.22 | ) | (1.03 | ) | (1.30 | ) | (1.32 | ) | ||||||||||||||
Portfolio turnover rate (%) | 31 | d | 81 | 92 | 112 | 119 | 91 | |||||||||||||||||||
Notes:
a The net investment loss per share data and the redemption fee data were determined using average shares outstanding during the period.
b The ratios in this row reflect the impact, if any, of expense offset arrangements with the custodian and expense reimbursement from the advisor.
c Annualized.
d Not annualized.
47
THE OBERWEIS FUNDS
Financial Highlights (continued)
Per share income and capital for a share outstanding throughout each period is as follows:
Institutional Class | MICRO-CAP FUND |
|
| ||||||||||||||||||||||||
|
| Six Months |
|
|
|
| |||||||||||||||||||||
| 2021 |
|
|
| 2020 |
|
|
| 2019 |
|
|
| 2018 |
|
| ||||||||||||
Net asset value at beginning of period | $ | 36.43 | $ | 29.36 | $ | 22.55 | $ | 18.47 | $ | 25.17 | $ | 23.52 | |||||||||||||||
| INCOME (LOSS) FROM INVESTMENT OPERATIONS: |
|
| ||||||||||||||||||||||||
Net investment lossb | (.12 | ) | (.33 | ) | (.21 | ) | (.13 | ) | (.28 | ) | (.18 | ) | |||||||||||||||
Net realized and unrealized gains (losses) on investments |
| (7.83 | ) |
| 16.12 |
| 7.02 |
| 4.21 |
| (2.84 | ) |
| 4.18 | |||||||||||||
Total from investment operations | (7.95 | ) | 15.79 | 6.81 | 4.08 | (3.12 | ) | 4.00 | |||||||||||||||||||
Redemption Feesb | .01 | .02 | — | — | .03 | — | |||||||||||||||||||||
Less distributions: | |||||||||||||||||||||||||||
Distribution from net realized gains on investments |
| — |
| (8.74 | ) |
| — |
| — |
| (3.61 | ) |
| (2.35 | ) | ||||||||||||
Net asset value at end of period | $ | 28.49 | $ | 36.43 | $ | 29.36 | $ | 22.55 | $ | 18.47 | $ | 25.17 | |||||||||||||||
Total Return (%) | (21.80 | )f | 53.90 | 30.20 | 22.09 | (12.07 | ) | 16.92 | d | ||||||||||||||||||
| RATIO/SUPPLEMENTAL DATA: |
|
| ||||||||||||||||||||||||
Net Assets at end of period | $ | 47,407 | $ | 50,015 | $ | 31,202 | $ | 30,994 | $ | 14,445 | $ | 9,346 | |||||||||||||||
Ratio of gross expenses to average net assets (%) | 1.25 | e | 1.23 | 1.34 | 1.34 | 1.33 | 1.32 | e | |||||||||||||||||||
Ratio of net expenses to average net assets (%)c | 1.25 | e | 1.23 | 1.33 | 1.32 | 1.32 | 1.28 | e | |||||||||||||||||||
Ratio of net investment loss to average net assets (%) | (0.74 | )e | (.85 | ) | (.97 | ) | (.61 | ) | (1.05 | ) | (1.04 | )e | |||||||||||||||
Portfolio turnover rate (%) | 31 | f | 81 | 92 | 112 | 119 | 91 | ||||||||||||||||||||
Notes:
a For the period from May 1, 2017 (commencement of operations) through December 31, 2017.
b The net investment loss per share data and the redemption fee data were determined using average shares outstanding during the period.
c The ratios in this row reflect the impact, if any, of expense offset arrangements with the custodian and expense reimbursement from the advisor.
d Calendar period performance for 2017 represents synthetic returns
e Annualized.
f Not annualized.
48
Financial Highlights (continued)
Per share income and capital for a share outstanding throughout each period is as follows:
Investor Class | SMALL-CAP OPPORTUNITIES FUND | |||||||||||||||||||||||||
|
| Six Months |
| |||||||||||||||||||||||
| 2021 |
|
|
| 2020 |
|
|
| 2019 |
|
|
| 2018 |
|
|
| 2017 |
|
| |||||||
Net asset value at beginning of period | $ | 21.54 | $ | 18.29 | $ | 14.36 | $ | 11.83 | $ | 16.40 | $ | 13.89 | ||||||||||||||
| INCOME (LOSS) FROM INVESTMENT OPERATIONS: |
|
| |||||||||||||||||||||||
Net investment lossa | (.08 | ) | (.28 | ) | (.17 | ) | (.13 | ) | (.18 | ) | (.22 | ) | ||||||||||||||
Net realized and unrealized gains (losses) on investments |
| (4.76 | ) |
| 8.23 |
| 4.84 |
| 3.10 |
| (1.05 | ) |
| 3.77 | ||||||||||||
Total from investment operations | (4.84 | ) | 7.95 | 4.67 | 2.97 | (1.23 | ) | 3.55 | ||||||||||||||||||
Redemption Feesa | .01 | .01 | — | — | — | — | ||||||||||||||||||||
Less distributions: | ||||||||||||||||||||||||||
Distribution from net realized gains on investments |
| — |
| (4.71 | ) |
| (.74 | ) |
| (.44 | ) |
| (3.34 | ) |
| (1.04 | ) | |||||||||
Net asset value at end of period | $ | 16.71 | $ | 21.54 | $ | 18.29 | $ | 14.36 | $ | 11.83 | $ | 16.40 | ||||||||||||||
Total return (%) | (22.42 | )d | 43.57 | 32.47 | 25.07 | (7.23 | ) | 25.54 | ||||||||||||||||||
| RATIO/SUPPLEMENTAL DATA: |
|
| |||||||||||||||||||||||
Net Assets at end of period (in thousands) | $ | 26,290 | $ | 16,322 | $ | 7,767 | $ | 6,110 | $ | 5,299 | $ | 7,533 | ||||||||||||||
Ratio of gross expenses to average net assets (%) | 1.51 | c | 1.59 | 2.03 | 2.21 | 2.13 | 2.29 | |||||||||||||||||||
Ratio of net expenses to average net assets (%)b | 1.25 | c | 1.55 | 1.55 | 1.55 | 1.55 | 1.72 | |||||||||||||||||||
Ratio of net investment loss to average net assets (%) | (.86 | )c | (1.22 | ) | (1.14 | ) | (.95 | ) | (1.06 | ) | (1.42 | ) | ||||||||||||||
Portfolio turnover rate (%) | 25 | d | 106 | 147 | 142 | 160 | 142 | |||||||||||||||||||
Notes:
a The net investment loss per share data and the redemption fee data were determined using average shares outstanding during the period.
b The ratios in this row reflect the impact, if any, of expense offset arrangements with the custodian and expense reimbursement from the advisor.
c Annualized.
d Not annualized.
49
THE OBERWEIS FUNDS
Financial Highlights (continued)
Per share income and capital for a share outstanding throughout each period is as follows:
Institutional Class | SMALL-CAP OPPORTUNITIES FUND | ||||||||||||||||||||||||||
|
| Six Months |
| Period Ended | |||||||||||||||||||||||
| 2021 |
|
|
| 2020 |
|
|
| 2019 |
|
|
| 2018 |
|
| ||||||||||||
Net asset value at beginning of period | $ | 21.92 | $ | 18.51 | $ | 14.49 | $ | 11.90 | $ | 16.44 | $ | 15.20 | |||||||||||||||
| INCOME (LOSS) FROM INVESTMENT OPERATIONS: |
|
| ||||||||||||||||||||||||
Net investment lossb | (.06 | ) | (.23 | ) | (.13 | ) | (.10 | ) | (.14 | ) | (.11 | ) | |||||||||||||||
Net realized and unrealized gains (losses) on investments |
| (4.84 | ) |
| 8.34 |
| 4.89 |
| 3.13 |
| (1.06 | ) |
| 2.39 | |||||||||||||
Total from investment operations | (4.90 | ) | 8.11 | 4.76 | 3.03 | (1.20 | ) | 2.28 | |||||||||||||||||||
Redemption feesb | .01 | .01 | — | — | — | — | |||||||||||||||||||||
Less distributions: | |||||||||||||||||||||||||||
Distribution from net realized gains on investments |
| — |
| (4.71 | ) |
| (.74 | ) |
| (.44 | ) |
| (3.34 | ) |
| (1.04 | ) | ||||||||||
Net asset value at end of period | $ | 17.03 | $ | 21.92 | $ | 18.51 | $ | 14.49 | $ | 11.90 | $ | 16.44 | |||||||||||||||
Total return (%) | (22.31 | )f | 43.92 | 32.80 | 25.43 | (7.05 | ) | 14.99 | d | ||||||||||||||||||
| RATIO/SUPPLEMENTAL DATA: |
|
| ||||||||||||||||||||||||
Net Assets at end of period (in thousands) | $ | 12,561 | $ | 12,727 | $ | 8,866 | $ | 5,622 | $ | 4,538 | $ | 3,564 | |||||||||||||||
Ratio of gross expenses to average net assets (%) | 1.26 | e | 1.34 | 1.78 | 1.96 | 1.88 | 1.86 | e | |||||||||||||||||||
Ratio of net expenses to average net assets (%)c | 1.00 | e | 1.30 | 1.30 | 1.30 | 1.30 | 1.30 | e | |||||||||||||||||||
Ratio of net investment loss to average net assets (%) | (.64 | )e | (.97 | ) | (.89 | ) | (.69 | ) | (.80 | ) | (.97 | )e | |||||||||||||||
Portfolio turnover rate (%) | 25 | f | 106 | 147 | 142 | 160 | 142 | ||||||||||||||||||||
Notes:
a For the period from May 1, 2017 (commencement of operations) through December 31, 2017.
b The net investment loss per share data and the redemption fee data were determined using average shares outstanding during the period.
c The ratios in this row reflect the impact, if any, of expense offset arrangements with the custodian and expense reimbursement from the advisor.
d Calendar period performance for 2017 represents synthetic returns
e Annualized.
f Not annualized.
50
Financial Highlights (continued)
Per share income and capital for a share outstanding throughout each period is as follows:
Investor Class | GLOBAL OPPORTUNITIES FUND | |||||||||||||||||||||||||
|
| Six Months |
| |||||||||||||||||||||||
| 2021 |
|
|
| 2020 |
|
|
| 2019 |
|
|
| 2018 |
|
| 2017 |
|
| ||||||||
Net asset value at beginning of period | $ | 35.29 | $ | 36.51 | $ | 24.82 | $ | 19.75 | $ | 28.36 | $ | 24.13 | ||||||||||||||
| INCOME (LOSS) FROM INVESTMENT OPERATIONS: |
|
| |||||||||||||||||||||||
Net investment lossa | (.06 | ) | (.37 | ) | (.32 | ) | (.24 | ) | (.20 | ) | (.19 | ) | ||||||||||||||
Net realized and unrealized gains (losses) on investments and translation of assets and liabilities denominated in foreign currency |
| (12.25 | ) |
| 7.99 |
| 14.13 |
| 5.31 |
| (7.09 | ) |
| 8.21 | ||||||||||||
Total from investment operations | (12.31 | ) | 7.62 | 13.81 | 5.07 | (7.29 | ) | 8.02 | ||||||||||||||||||
Redemption feesa | — | .01 | — | — | — | — | ||||||||||||||||||||
Less distributions: | ||||||||||||||||||||||||||
Distribution from net realized gains on investments |
| — |
| (8.85 | ) |
| (2.12 | ) |
| — |
| (1.32 | ) |
| (3.79 | ) | ||||||||||
Net asset value at end of period | $ | 22.98 | $ | 35.29 | $ | 36.51 | $ | 24.82 | $ | 19.75 | $ | 28.36 | ||||||||||||||
Total return (%) | (34.88 | )d | 20.92 | 55.55 | 25.67 | (25.66 | ) | 33.30 | ||||||||||||||||||
| RATIO/SUPPLEMENTAL DATA: |
|
| |||||||||||||||||||||||
Net Assets at end of period (in thousands) | $ | 32,441 | $ | 53,342 | $ | 45,566 | $ | 32,004 | $ | 28,847 | $ | 47,856 | ||||||||||||||
Ratio of gross expenses to average net assets (%) | 1.48 | c | 1.38 | 1.53 | 1.58 | 1.52 | 1.52 | |||||||||||||||||||
Ratio of net expenses to average net assets (%)b | 1.48 | c | 1.38 | 1.53 | 1.55 | 1.50 | 1.50 | |||||||||||||||||||
Ratio of net investment loss to average net assets (%) | (.44 | )c | (.86 | ) | (1.14 | ) | (1.07 | ) | (.72 | ) | (.67 | ) | ||||||||||||||
Portfolio turnover rate (%) | 36 | d | 111 | 129 | 120 | 155 | 137 | |||||||||||||||||||
Notes:
a The net investment loss per share data and the redemption fee data were determined using average shares outstanding during the period.
b The ratios in this row reflect the impact, if any, of expense offset arrangements with the custodian and expense reimbursement from the advisor.
c Annualized.
d Not annualized.
51
THE OBERWEIS FUNDS
Financial Highlights (continued)
Per share income and capital for a share outstanding throughout each period is as follows:
Institutional Class | GLOBAL OPPORTUNITIES FUND | ||||||||||||||||||||||||||
|
| Six Months |
|
|
| Period Ended | |||||||||||||||||||||
| 2021 |
|
|
| 2020 |
|
|
| 2019 |
|
|
| 2018 |
|
| ||||||||||||
Net asset value at beginning of period | $ | 35.84 | $ | 36.87 | $ | 24.99 | $ | 19.84 | $ | 28.41 | $ | 27.42 | |||||||||||||||
| INCOME (LOSS) FROM INVESTMENT OPERATIONS: |
|
| ||||||||||||||||||||||||
Net investment lossb | (.01 | ) | (.26 | ) | (.25 | ) | (.18 | ) | (.13 | ) | (.12 | ) | |||||||||||||||
Net realized and unrealized gains (losses) on investments and translation of assets and liabilities denominated in foreign currency |
| (12.46 | ) |
| 8.07 |
| 14.25 |
| 5.33 |
| (7.12 | ) |
| 4.90 | |||||||||||||
Total from investment operations | (12.47 | ) | 7.81 | 14.00 | 5.15 | (7.25 | ) | 4.78 | |||||||||||||||||||
Redemption Feesb | — | .01 | — | — | — | — | |||||||||||||||||||||
Less distributions: | |||||||||||||||||||||||||||
Distribution from net realized gains on investments |
| — |
| (8.85 | ) |
| (2.12 | ) |
| — |
| (1.32 | ) |
| (3.79 | ) | |||||||||||
Net asset value at end of period | $ | 23.37 | $ | 35.84 | $ | 36.87 | $ | 24.99 | $ | 19.84 | $ | 28.41 | |||||||||||||||
Total return (%) | (34.79 | )e | 21.23 | 55.94 | 25.96 | (25.48 | ) | 17.49 | f | ||||||||||||||||||
| RATIO/SUPPLEMENTAL DATA: |
|
| ||||||||||||||||||||||||
Net Assets at end of period (in thousands) | $ | 18,428 | $ | 23,518 | $ | 17,109 | $ | 10,644 | $ | 8,937 | $ | 7,919 | |||||||||||||||
Ratio of gross expenses to average net assets (%) | 1.24 | d | 1.14 | 1.28 | 1.33 | 1.28 | 1.20 | d | |||||||||||||||||||
Ratio of net expenses to average net assets (%)c | 1.23 | d | 1.13 | 1.27 | 1.30 | 1.25 | 1.18 | d | |||||||||||||||||||
Ratio of net investment loss to average net assets (%) | (.07 | )d | (.61 | ) | (.88 | ) | (.78 | ) | (.49 | ) | (.59 | )d | |||||||||||||||
Portfolio turnover rate (%) | 36 | e | 111 | 129 | 120 | 155 | 137 | ||||||||||||||||||||
Notes:
a For the period from May 1, 2017 (commencement of operations) through December 31, 2017.
b The net investment loss per share data and the redemption fee data were determined using average shares outstanding during the period.
c The ratios in this row reflect the impact, if any, of expense offset arrangements with the custodian and expense reimbursement from the advisor.
d Annualized.
e Not annualized.
f Calendar period performance for 2017 represents synthetic returns.
52
Financial Highlights (continued)
Per share income and capital for a share outstanding throughout each period is as follows:
Investor Class | China Opportunities Fund | |||||||||||||||||||||||||
|
| Six Months |
| |||||||||||||||||||||||
2021 | 2020 | 2019 | 2018 | 2017 | ||||||||||||||||||||||
Net asset value at beginning of period | $ | 11.51 | $ | 17.29 | $ | 12.33 | $ | 9.35 | $ | 15.95 | $ | 10.94 | ||||||||||||||
INCOME (LOSS) FROM INVESTMENT OPERATIONS: | ||||||||||||||||||||||||||
Net investment lossa | (.03 | ) | (.11 | ) | (.16 | ) | (.09 | ) | (.10 | ) | (.06 | ) | ||||||||||||||
Net realized and unrealized gains (losses) on investments and translation of assets and liabilities denominated in foreign currencies |
| (2.47 | ) |
| (.88 | ) |
| 7.11 |
| 3.47 |
| (4.06 | ) |
| 6.07 | |||||||||||
Total from investment operations | (2.50 | ) | (.99 | ) | 6.95 | 3.38 | (4.16 | ) | 6.01 | |||||||||||||||||
Redemption feesa | — | — | — | .02 | — | — | ||||||||||||||||||||
Less dividends and distributions: | ||||||||||||||||||||||||||
Distribution from net realized gains on investments | — | (4.79 | ) | (1.99 | ) | (.42 | ) | (2.44 | ) | (.98 | ) | |||||||||||||||
Dividends from net investment income |
| — |
| — | — |
| — |
| — |
| (.02 | ) | ||||||||||||||
Total dividends and distributions |
| — |
| (4.79 | ) |
| (1.99 | ) |
| (.42 | ) |
| (2.44 | ) |
| (1.00 | ) | |||||||||
Net asset value at end of period | $ | 9.01 | $ | 11.51 | $ | 17.29 | $ | 12.33 | $ | 9.35 | $ | 15.95 | ||||||||||||||
Total return (%) | (21.72 | )d | (5.41 | ) | 56.51 | 36.33 | (26.01 | ) | 55.05 | |||||||||||||||||
RATIO/SUPPLEMENTAL DATA: | ||||||||||||||||||||||||||
Net Assets at end of period (in thousands) | $ | 59,829 | $ | 81,018 | $ | 98,527 | $ | 75,487 | $ | 60,844 | $ | 107,190 | ||||||||||||||
Ratio of gross expenses to average net assets (%) | 2.02 | c | 1.87 | 1.95 | 1.95 | 1.91 | 1.92 | |||||||||||||||||||
Ratio of net expenses to average net assets (%)b | 2.01 | c | 1.87 | 1.95 | 1.84 | 1.86 | 1.91 | |||||||||||||||||||
Ratio of net investment income (loss) to average net assets (%) | (.74 | )c | (.63 | ) | (1.11 | ) | (.77 | ) | (.68 | ) | (.38 | ) | ||||||||||||||
Portfolio turnover rate (%) | 125 | d | 241 | 192 | 184 | 85 | 97 | |||||||||||||||||||
Notes:
a The net investment income (loss) per share data and the redemption fee data were determined using average shares outstanding during the period.
b The ratios in this row reflect the impact, if any, of expense offset arrangements with the custodian and expense reimbursement from the advisor.
c Annualized.
d Not annualized.
53
THE OBERWEIS FUNDS
Financial Highlights (continued)
Per share income and capital for a share outstanding throughout each period is as follows:
Institutional Class | China Opportunities Fund | |||||||||||||||||||||||||
|
| Six Months |
| Period Ended | ||||||||||||||||||||||
2021 | 2020 | 2019 | 2018 | |||||||||||||||||||||||
Net asset value at beginning of period | $ | 11.67 | $ | 17.42 | $ | 12.39 | $ | 9.36 | $ | 15.93 | $ | 12.78 | ||||||||||||||
INCOME (LOSS) FROM INVESTMENT OPERATIONS: | ||||||||||||||||||||||||||
Net investment lossb | — | (.07 | ) | (.13 | ) | (.07 | ) | (.06 | ) | (.01 | ) | |||||||||||||||
Net realized and unrealized gains (losses) on investments and translation of assets and liabilities denominated in foreign currencies |
| (2.52 | ) |
| (.89 | ) |
| 7.15 |
| 3.50 |
| (4.07 | ) |
| 4.19 | |||||||||||
Total from investment operations | (2.52 | ) | (.96 | ) | 7.02 | 3.43 | (4.13 | ) | 4.18 | |||||||||||||||||
Redemption feesb | — | — | — | .02 | — | — | ||||||||||||||||||||
Less dividends and | ||||||||||||||||||||||||||
Distribution from net realized gains on investments | — | (4.79 | ) | (1.99 | ) | (.42 | ) | (2.44 | ) | (.98 | ) | |||||||||||||||
Dividends from net investment income |
| — |
| — |
| — |
| — |
| — |
| (.05) | ||||||||||||||
Total dividends and distributions |
| — |
| (4.79 | ) |
| (1.99 | ) |
| (.42 | ) |
| (2.44 | ) |
| (1.03 | ) | |||||||||
Net asset value at end of period | $ | 9.15 | $ | 11.67 | $ | 17.42 | $ | 12.39 | $ | 9.36 | $ | 15.93 | ||||||||||||||
Total return (%) | (21.59 | )e | (5.23 | ) | 56.79 | 36.82 | (25.85 | ) | 32.87 | f | ||||||||||||||||
RATIO/SUPPLEMENTAL DATA: | ||||||||||||||||||||||||||
Net Assets at end of period (in thousands) | $ | 16,612 | $ | 15,247 | $ | 21,497 | $ | 14,301 | $ | 10,998 | $ | 14,087 | ||||||||||||||
Ratio of gross expenses to average net assets (%) | 1.77 | d | 1.62 | 1.69 | 1.70 | 1.65 | 1.60 | d | ||||||||||||||||||
Ratio of net expenses to average net assets (%)c | 1.77 | d | 1.62 | 1.69 | 1.59 | 1.61 | 1.59 | d | ||||||||||||||||||
Ratio of net investment income (loss) to average net assets (%) | (.05 | )d | (.38 | ) | (.85 | ) | (.55 | ) | (.42 | ) | (.12 | )d | ||||||||||||||
Portfolio turnover rate (%) | 125 | e | 241 | 192 | 184 | 85 | 97 | |||||||||||||||||||
Notes:
a For the period from May 1, 2017 (commencement of operations) through December 31, 2017.
b The net investment income (loss) per share data and the redemption fee data were determined using average shares outstanding during the period.
c The ratios in this row reflect the impact, if any, of expense offset arrangements with the custodian and expense reimbursement from the advisor.
d Annualized.
e Not annualized.
f Calendar period performance for 2017 represents synthetic returns.
54
Financial Highlights (continued)
Per share income and capital for a share outstanding throughout each period is as follows:
| Investor Class | International Opportunities Fund | ||||||||||||||||||||||||
|
| Six Months |
| |||||||||||||||||||||||
2021 | 2020 | 2019 | 2018 | 2017 | ||||||||||||||||||||||
Net asset value at beginning of period | $ | 26.50 | $ | 31.52 | $ | 19.43 | $ | 16.01 | $ | 25.49 | $ | 20.19 | ||||||||||||||
INCOME (LOSS) FROM INVESTMENT OPERATIONS: | ||||||||||||||||||||||||||
Net investment income (loss)a | 0.06 | (.26 | ) | (.16 | ) | (.03 | ) | (.04 | ) | (.04 | ) | |||||||||||||||
Net realized and unrealized gains (losses) on investments and translation of assets and liabilities denominated in foreign currencies |
| (9.78 | ) |
| .72 |
| 12.37 |
| 3.69 |
| (6.30 | ) |
| 8.26 | ||||||||||||
Total from investment operations | (9.72 | ) | .46 | 12.21 | 3.66 | (6.34 | ) | 8.22 | ||||||||||||||||||
Redemption feesa | — | — | — | — | — | — | ||||||||||||||||||||
Less dividends and distributions: | ||||||||||||||||||||||||||
Distribution from net realized gains on investments | — | (5.48 | ) | — | — | (3.10 | ) | (2.85 | ) | |||||||||||||||||
Dividends from net investment income |
| — |
| — |
| (.12) |
| (.24 | ) |
| (.04 | ) |
| (.07 | ) | |||||||||||
Total dividends and distributions |
| — |
| (5.48 | ) |
| (.12) |
| (.24 | ) |
| (3.14 | ) |
| (2.92 | ) | ||||||||||
Net asset value at end of period | $ | 16.78 | $ | 26.50 | $ | 31.52 | $ | 19.43 | $ | 16.01 | $ | 25.49 | ||||||||||||||
Total return (%) | (36.68 | )d | 1.52 | 62.86 | 22.85 | (24.73 | ) | 40.77 | ||||||||||||||||||
RATIO/SUPPLEMENTAL DATA: | ||||||||||||||||||||||||||
Net Assets at end of period (in thousands) | $ | 171,707 | $ | 310,356 | $ | 327,354 | $ | 324,254 | $ | 498,164 | $ | 905,392 | ||||||||||||||
Ratio of gross expenses to average net assets (%) | 1.86 | c | 1.77 | 1.87 | 1.82 | 1.77 | 1.79 | |||||||||||||||||||
Ratio of net expenses to average net assets (%)b | 1.60 | c | 1.60 | 1.60 | 1.60 | 1.60 | 1.60 | |||||||||||||||||||
Ratio of net investment income (loss) to average net assets (%) | .57 | c | (.79 | ) | (.75 | ) | (.19 | ) | (.16 | ) | (.18 | ) | ||||||||||||||
Portfolio turnover rate (%) | 36 | d | 93 | 130 | 142 | 145 | 153 | |||||||||||||||||||
Notes:
a The net investment income (loss) per share data and the redemption fee data were determined using average shares outstanding during the period.
b The ratios in this row reflect the impact, if any, of expense offset arrangements with the custodian and expense reimbursement from the advisor.
c Annualized.
d Not annualized.
55
Financial Highlights (continued)
Per share income and capital for a share outstanding throughout each period is as follows:
Investor Class | Emerging Markets Fund | ||||||||||||||||||||||
Six Months |
| Period Ended | |||||||||||||||||||||
2021 | 2020 | 2019 | |||||||||||||||||||||
Net asset value at beginning of period | $ | 13.63 | $ | 13.81 | $ | 9.67 | $ | 7.89 | $ | 10.00 | |||||||||||||
INCOME (LOSS) FROM INVESTMENT OPERATIONS: | |||||||||||||||||||||||
Net investment lossb | (.03 | ) | (.13 | ) | (.06 | ) | (.02 | ) | (.01 | ) | |||||||||||||
Net realized and unrealized gains (losses) on investments and translation of assets and liabilities denominated in foreign currencies |
| (3.12 | ) |
| 1.95 |
| 4.20 |
| 1.80 |
| (2.10 | ) | |||||||||||
Total from investment operations | (3.15 | ) | 1.82 | 4.14 | 1.78 | (2.11 | ) | ||||||||||||||||
Redemption Feesb | — | — | — | — | — | ||||||||||||||||||
Less dividends and distributions: | |||||||||||||||||||||||
Distribution from net realized gains on investments | — | (2.00 | ) | — | — | — | |||||||||||||||||
Dividends from net investment income |
| — |
| — |
| — |
| — |
| — | |||||||||||||
Total dividends and distributions |
| — |
| (2.00 | ) |
| — |
| — |
| — | ||||||||||||
Net asset value at end of period | $ | 10.48 | $ | 13.63 | $ | 13.81 | $ | 9.67 | $ | 7.89 | |||||||||||||
Total Return (%) | (23.11 | )e | 13.24 | 42.81 | 22.56 | (21.10 | )e | ||||||||||||||||
RATIO/SUPPLEMENTAL DATA: | |||||||||||||||||||||||
Net Assets at end of period (in thousands) | $ | 1,788 | $ | 1,646 | $ | 789 | $ | 587 | $ | 426 | |||||||||||||
Ratio of gross expenses to average net assets (%) | 2.79 | d | 2.80 | 3.79 | 3.86 | 3.99 | d | ||||||||||||||||
Ratio of net expenses to average net assets (%)c | 1.75 | d | 1.75 | 1.75 | 1.75 | 1.75 | d | ||||||||||||||||
Ratio of net investment loss to average net assets (%) | (.59 | )d | (.87 | ) | (.54 | ) | (.21 | ) | (.15 | )d | |||||||||||||
Portfolio turnover rate (%) | 29 | e | 67 | 131 | 153 | 111 | e | ||||||||||||||||
Notes:
a For the period from May 1, 2018 (commencement of operations) through December 31, 2018.
b The net investment income (loss) per share data and the redemption fee data were determined using average shares outstanding during the period.
c The ratios in this row reflect the impact, if any, of expense offset arrangements with the advisor, and expense reimbursement form the advisor.
d Annualized.
e Not Annualized.
56
THE OBERWEIS FUNDS
Financial Highlights (continued)
Per share income and capital for a share outstanding throughout each period is as follows:
Institutional Class | Emerging Markets Fund | |||||||||||||||||||||
Six Months |
|
| Period Ended |
|
| |||||||||||||||||
| 2021 |
|
|
| 2020 |
|
|
| 2019 | |||||||||||||
Net asset value at beginning of period | $ | 13.75 | $ | 13.90 | $ | 9.71 | $ | 7.90 | $ | 10.00 | ||||||||||||
| INCOME (LOSS) FROM INVESTMENT OPERATIONS: |
|
| |||||||||||||||||||
Net investment income (loss)b | (.02 | ) | (.10 | ) | (.03 | ) | — | .01 | ||||||||||||||
Net realized and unrealized gains (losses) on investments and translation of assets and liabilities denominated in foreign currencies |
| (3.14 | ) |
| 1.97 |
| 4.22 |
| 1.81 |
| (2.11 | ) | ||||||||||
Total from investment operations | (3.16 | ) | 1.87 | 4.19 | 1.81 | (2.10 | ) | |||||||||||||||
Redemption Feesb | — | — | — | — | — | |||||||||||||||||
Less dividends and distributions: | ||||||||||||||||||||||
Distribution from net realized gains on investments | — | (2.00 | ) | — | — | — | ||||||||||||||||
Dividends from net investment income |
| — |
| (.02 | ) |
| — |
| — |
| — | |||||||||||
Total dividends and distributions |
| — |
| (2.02 | ) |
| — |
| — |
| — | |||||||||||
Net asset value at end of period | $ | 10.59 | $ | 13.75 | $ | 13.90 | $ | 9.71 | $ | 7.90 | ||||||||||||
Total return (%) | (22.98 | )e | 13.50 | 43.15 | 22.91 | (21.00 | )e | |||||||||||||||
| RATIO/SUPPLEMENTAL DATA: |
|
| |||||||||||||||||||
Net Assets at end of period (in thousands) | $ | 11,438 | $ | 11,910 | $ | 9,938 | $ | 7,382 | $ | 6,012 | ||||||||||||
Ratio of gross expenses to average net assets (%) | 2.54 | d | 2.55 | 3.54 | 3.61 | 3.74 | d | |||||||||||||||
Ratio of net expenses to average net assets (%)c | 1.50 | d | 1.50 | 1.50 | 1.50 | 1.50 | d | |||||||||||||||
Ratio of net investment Income (loss) to average net assets (%) | (.27 | )d | (.62 | ) | (.26 | ) | — | .10 | d | |||||||||||||
Portfolio turnover rate (%) | 29 | e | 67 | 131 | 153 | 111 | e | |||||||||||||||
Notes:
a For the period from May 1, 2018 (commencement of operations) through December 31, 2018.
b The net investment income (loss) per share data and the redemption fee data were determined using average shares outstanding during the period.
c The ratios in this row reflect the impact, if any, of expense offset arrangements with the custodian, and expense reimbursement form the advisor.
d Annualized.
e Not Annualized.
57
Supplemental Information (unaudited)
Liquidity Risk Management Program:
Consistent with Rule 22e-4 under the Investment Company Act of 1940, as amended (the “Liquidity Rule”), The Oberweis Funds (each a “Fund” and collectively, the “Funds”) have adopted and implemented a liquidity risk management program (the “LRMP”). The LRMP seeks to assess and manage the Funds’ liquidity risk, which is defined as the risk that a Fund could not meet requests to redeem shares issued by the Fund without significant dilution of the remaining investors’ interests in the Fund. The Funds’ Board of Trustees (the “Board”) has approved an officer of the Funds (the “Administrator”) to serve as the administrator of the Funds’ LRMP.
The Fund’s LRMP includes a number of processes designed to support the assessment and management of its liquidity risk. In particular, the LRMP includes no less than annual assessments of factors that influence each Fund’s liquidity risk; no less than monthly classifications of a Fund’s investments into one of four liquidity classifications provided for in the Liquidity Rule; a 15% of net assets limit on the acquisition of “illiquid investments” (as defined under the Liquidity Rule); establishment of a minimum percentage of a Fund’s assets to be invested in investments classified as “highly liquid” (as defined under the Liquidity Rule) if the Fund does not invest primarily in highly liquid investments; and regular reporting to the Board.
At a meeting of the Board on May 18, 2022, the Administrator provided a written report (the “LRMP Report”) to the Board addressing the operation, adequacy, and effectiveness of implementation of the Fund’s LRMP, including if and as applicable, (1) the operation of the Highly Liquid Investment Minimum established for each applicable Fund; (2) an assessment of the quality of the data and analysis provided, and of the particular methodologies used and metrics analyzed, by any third-party vendor engaged; and (3) a summary of any material changes to the LRMP during the prior annual period. The LRMP Report covered the period from May 1, 2021 through April 30, 2022 (the “Reporting Period”). The LRMP Report concluded that the LRMP had operated adequately and effectively to manage the Funds’ liquidity risk during the Reporting Period. There were no material changes to the LRMP during the Reporting Period. The LRMP Report further concluded that the Funds’ investment strategies were appropriate for an open-end fund and did not involve relatively concentrated portfolios.
There can be no assurance that the LRMP will achieve its objectives under all circumstances in the future.
Proxy Voting:
The Oberweis Funds has delegated authority to vote proxies related to the Funds’ (Micro-Cap Fund, Small-Cap Opportunities Fund, Global Opportunities Fund, China Opportunities Fund, International Opportunities Fund and Emerging Markets Fund) Portfolio securities to the Funds’ investment adviser, Oberweis Asset Management, Inc. (“OAM”). A description of the policies and procedures that OAM uses in fulfilling this responsibility is available, without charge upon request, by calling 1-800-323-6166. It also appears on www.oberweisfunds.com and in the Funds’ Statement of Additional Information, which can be found on the Securities and Exchange Commission’s (“SEC”) website at http://www.sec.gov. Information on how the Funds voted proxies relating to portfolio securities during the most recent 12 month period ended June 30 is available (1) without charge, upon request, by calling 1-800-323-6166, and (2) on the SEC’s website at http://www.sec.gov.
58
THE OBERWEIS FUNDS
Supplemental Information (unaudited) (continued)
Availability of Schedules of Portfolio Investments:
The Funds file their complete schedule of portfolio investments with the SEC for the first and third quarter of each fiscal year (March 31 and September 30) on Form NPORT. The Funds’ Forms NPORT are available, without charge, on the SEC’s website at http://www.sec.gov and may be reviewed and copied at the SEC’s Public Reference Room in Washington, D.C. Information on the operation of the Public Reference Room may be obtained by calling 1-800-SEC-0330.
Expense Examples:
As a shareholder of The Oberweis Funds, you may incur two types of costs: (1) transaction costs, including redemption fees and (2) ongoing costs, including management fees; distribution (and/or service) 12b-1 fees; and other Fund expenses. This example is intended to help you understand your ongoing costs (in dollars) of investing in The Oberweis Funds and to compare these costs with the ongoing costs of investing in other mutual funds.
The Example is based on an investment of $1,000 investment at the beginning of the period and held for the entire period.
Actual Expenses:
The first line for each Fund in the table below provides information about actual account values and actual expenses. You may use the information below; together with the amount you invested, to estimate the expenses that you paid over the period. Simply divide your account value by $1,000 (for example, an $8,600 account value divided by $1,000=8.6), then multiply the result by the number in the table under the heading entitled “Expenses Paid During Period” to estimate the expenses you paid on your account during this period.
Hypothetical Example for Comparison Purposes:
The second line for each Fund in the table below provides information about hypothetical account values and hypothetical expenses based on each Fund’s actual expense ratio and an assumed rate of return of 5% per year before expenses, which is not the Fund’s actual return.
The hypothetical account values and expenses may not be used to estimate the actual ending account balance or expenses you paid for the period. You may use this information to compare this 5% hypothetical example with the 5% hypothetical examples that appear in the shareholder reports of other funds.
Please note that the expenses shown in the table are meant to highlight your ongoing costs only and do not reflect any transactional costs, such as redemption fees. Therefore, the second line for each Fund in the table is useful in comparing ongoing costs only, and will not help you determine the relative total costs of owning different funds. In addition, if these transactional costs were included, your costs would have been higher.
59
THE OBERWEIS FUNDS
Supplemental Information (unaudited) (continued)
Beginning | Ending | Expenses Paid | Expense Ratio | ||||||
MICRO-CAP FUND |
| ||||||||
Investor Class |
| ||||||||
Actual | $ 1,000.00 | $ 780.90 | $ 6.62 | 1.50 | % | ||||
Hypothetical | $ 1,000.00 | $ 1,017.36 | $ 7.50 | 1.50 | % | ||||
Institutional Class |
| ||||||||
Actual | $ 1,000.00 | $ 782.00 | $ 5.52 | 1.25 | % | ||||
Hypothetical | $ 1,000.00 | $ 1,018.60 | $ 6.26 | 1.25 | % | ||||
| |||||||||
SMALL-CAP OPPORTUNITIES FUND |
| ||||||||
Investor Class |
| ||||||||
Actual | $ 1,000.00 | $ 775.80 | $ 5.50 | 1.25 | % | ||||
Hypothetical | $ 1,000.00 | $ 1,018.60 | $ 6.26 | 1.25 | % | ||||
Institutional Class |
| ||||||||
Actual | $ 1,000.00 | $ 776.90 | $ 4.41 | 1.00 | % | ||||
Hypothetical | $ 1,000.00 | $ 1,019.84 | $ 5.01 | 1.00 | % | ||||
| |||||||||
GLOBAL OPPORTUNITIES FUND |
| ||||||||
Investor Class |
| ||||||||
Actual | $ 1,000.00 | $ 651.20 | $ 6.06 | 1.48 | % | ||||
Hypothetical | $ 1,000.00 | $ 1,017.46 | $ 7.40 | 1.48 | % | ||||
Institutional Class |
| ||||||||
Actual | $ 1,000.00 | $ 652.10 | $ 5.04 | 1.23 | % | ||||
Hypothetical | $ 1,000.00 | $ 1,018.70 | $ 6.16 | 1.23 | % | ||||
| |||||||||
CHINA OPPORTUNITIES FUND |
| ||||||||
Investor Class |
| ||||||||
Actual | $ 1,000.00 | $ 782.80 | $ 8.88 | 2.01 | % | ||||
Hypothetical | $ 1,000.00 | $ 1,014.83 | $10.04 | 2.01 | % | ||||
Institutional Class |
| ||||||||
Actual | $ 1,000.00 | $ 784.10 | $ 7.83 | 1.77 | % | ||||
Hypothetical | $ 1,000.00 | $ 1,016.02 | $ 8.85 | 1.77 | % | ||||
| |||||||||
INTERNATIONAL OPPORTUNITIES FUND |
| ||||||||
Investor Class |
| ||||||||
Actual | $ 1,000.00 | $ 633.20 | $ 6.48 | 1.60 | % | ||||
Hypothetical | $ 1,000.00 | $ 1,016.86 | $ 8.00 | 1.60 | % | ||||
| |||||||||
EMERGING MARKETS FUND |
| ||||||||
Investor Class |
| ||||||||
Actual | $ 1,000.00 | $ 768.90 | $ 7.68 | 1.75 | % | ||||
Hypothetical | $ 1,000.00 | $ 1,016.12 | $ 8.75 | 1.75 | % | ||||
Institutional Class |
| ||||||||
Actual | $ 1,000.00 | $ 770.20 | $ 6.58 | 1.50 | % | ||||
Hypothetical | $ 1,000.00 | $ 1,017.36 | $ 7.50 | 1.50 | % | ||||
* Expenses are equal to the average account value times the Fund’s annualized expense ratio multiplied by the number of days in the most recent fiscal half-year divided by the number of days in the fiscal year.
60
Trustees and Officers | ||
Michael J. Simon Gary D. McDaniel James W. Oberweis David I. Covas Kenneth S. Farsalas | Katherine Smith Dedrick Alix J. Charles Patrick B. Joyce Eric V. Hannemann Thomas P. Joyce |
Manager and Investment Advisor
Oberweis Asset Management, Inc.
3333 Warrenville Road, Suite 500, Lisle, IL 60532
800-323-6166
oberweisfunds.com
Distributor
Oberweis Securities, Inc.
3333 Warrenville Road, Suite 500, Lisle, IL 60532
630-577-2300
oberweisfunds.com
Custodian
UMB Bank, n.a.
928 Grand Blvd., Kansas City, MO 64106
Transfer Agent
UMB Fund Services, Inc.
P.O. Box 711, Milwaukee, WI 53201-0711
800-245-7311
Counsel
Vedder Price P.C.
222 North LaSalle Street, Chicago, IL 60601
Independent Registered Public Accounting Firm
BBD LLP
1835 Market Street, Philadelphia, PA 19103
The Oberweis Funds
Micro-Cap Fund
Small-Cap Opportunities Fund
Global Opportunities Fund
China Opportunities Fund
International Opportunities Fund
Emerging Markets Fund
800-245-7311
oberweisfunds.com
![]()
3333 Warrenville Road
Suite 500
Lisle, IL 60532
SEMI-ANNUAL REPORT | ||||
Oberweis International Opportunities Institutional Fund (OBIIX) | ||||
Oberweis Focused International Growth Fund (OFIGX) | ||||
June 30, 2022 | ||||
oberweisfunds.com | ||||
|
|
| ||
Beginning on January 1, 2021, as permitted by regulations adopted by the Securities and Exchange Commission, paper copies of the Fund’s shareholder reports will no longer be sent by mail, unless you specifically request paper copies of the reports from the Fund or from your financial intermediary, such as a broker-dealer or bank. Instead, the reports will be made available on www.oberweisfunds.com and you will be notified by mail each time a report is posted and provided with a website link to access the report.
If you already elected to receive shareholder reports electronically, you will not be affected by this change and you need not take any action. You may elect to receive shareholder reports and other communications from the Fund or your financial intermediary electronically by contacting us at 1-800-245-7311.
You may elect to receive all future reports in paper free of charge. You can inform the Fund or your financial intermediary that you wish to continue receiving paper copies of your shareholder reports by contacting us at 1-800-245-7311. Your election to receive reports in paper will apply to all funds held with the fund complex.
TABLE OF CONTENTS
1 | ||
Fund Overview | ||
5 | ||
5 | ||
Schedule of Investments | ||
6 | ||
10 | ||
Statement of Assets and Liabilities | ||
13 | ||
13 | ||
Statement of Operations | ||
14 | ||
14 | ||
Statements of Changes in Net Assets | ||
15 | ||
16 | ||
17 | ||
Financial Highlights | ||
24 | ||
25 | ||
26 |
PRESIDENT AND PORTFOLIO MANAGER’S LETTER (unaudited)
Dear Fellow Shareholder:
Year-to-date performance through june 30, 2022
For the first six months of 2022, the Oberweis International Opportunities Institutional fund returned -36.38% vs. -29.55% for the benchmark. The Oberweis Focused International Growth Fund, which launched on April 1st, 2022, returned -21.7% vs. -14.51% for the MSCI EAFE Index. While we are not pleased with these six-month returns, market corrections and benchmark dispersion over the short-term are to be expected, particularly in market environments similar to that experienced so far this year, when market movements seem to have been driven far more by macroeconomic worries and negative market sentiment rather than by idiosyncratic company specific fundamentals.
market environment
Concerns over inflation, and more specifically whether central banks can bring the rate of inflation down without incurring a significant economic slowdown, continued to impact global equities over the quarter. Core sticky-price CPI, a key measure of inflation for the FOMC, continued to increase over the quarter, rising to 7.5% on an annualized basis in May, following a 7.1% increase in April. It now stands at its highest level in 30 years. The issues which we have highlighted in recent quarterly letters remain central to the current investment environment with supply-side limitations placing upward pressure on prices. In particular, the labor market is still historically tight while supply chain cost pressures have yet to diminish in a meaningful manner. Of course, the war in Ukraine has also been a supply shock, with expectations for Russian oil production in 2023 downgraded by almost 2.5 million barrels per day. This potential missing supply approximates to current expectations for worldwide consumption growth. Perhaps the most important question in the equity markets today is whether the Fed is able to align demand with supply without bringing about a US and global recession.
Whether the US and developed markets end up in recession is difficult to predict. Given the unprecedented path to the current point, the economic unknowns today in our view are truly unknown, and therefore making bold and confident short-term predictions on the economic cycle in one direction or the other strikes us as premature. What is clear is that a lot of disinflation is now needed to reach the Fed’s target rate, and the US central bank faces a sizable challenge to bring it back in line. We await to see the economic consequences of monetary policy decisions as well as the inflation data.
Should, for example, sticky price CPI start to roll over without meaningful economic damage, then that could represent an inflection point higher for the stock-market. Although many pundits are ruling out this scenario with great certainty, we would not discount it: before this quarter’s drop of >15%, the S&P had experienced such a quarterly drop of >15% eight times since WWII, and 100% of the time the S&P was higher one year later, with an average return of +26.07%.
What could cause the sticky price CPI to roll over? A number of commodities have started to move lower, potentially exerting downward pressure on inflation expectations. The monetary tightening that has occurred so far will slow down housing activity over the coming quarters, if it has not already — starts and sales showed weakness in May and inventories are increasing. The run-up in prices should decelerate or to some degree even reverse. Weaker housing activity implies less construction of new homes, less spending on home improvements, fewer commissions paid to brokers, less liquidity from remortgaging. Such factors are likely to soften aggregate demand but do not by themselves necessitate a housing market crash or a recession.
1
PRESIDENT AND PORTFOLIO MANAGER’S LETTER (unaudited) (continued)
valuation recap
Valuations for developed market equities outside of the US remain below-average. For example, consider the chart below, which shows Free Cash Flow Yields for non-US developed market small-cap stocks. The charts that free cash flow yields for this asset class are near a historically high level. Absent either a severe deterioration in the economy or spike higher in bond yields, we consider this a provocative valuation that has already priced in a lot of bad news. According to a recent JP Morgan note: “Positioning and sentiment of investors is at multi-decade lows. So it is not that we think that the world and economies are in great shape, but just that an average investor expects an economic disaster, and if that does not materialize risky asset classes could recover most of their losses from the first half.” Historically, unusually high bearish sentiment and elevated levels of fear tend to be followed by above-average market returns. Most people are aware that investor sentiment is often an excellent contrarian indicator and that after investors have been the gloomiest, markets frequently have the strongest performance.
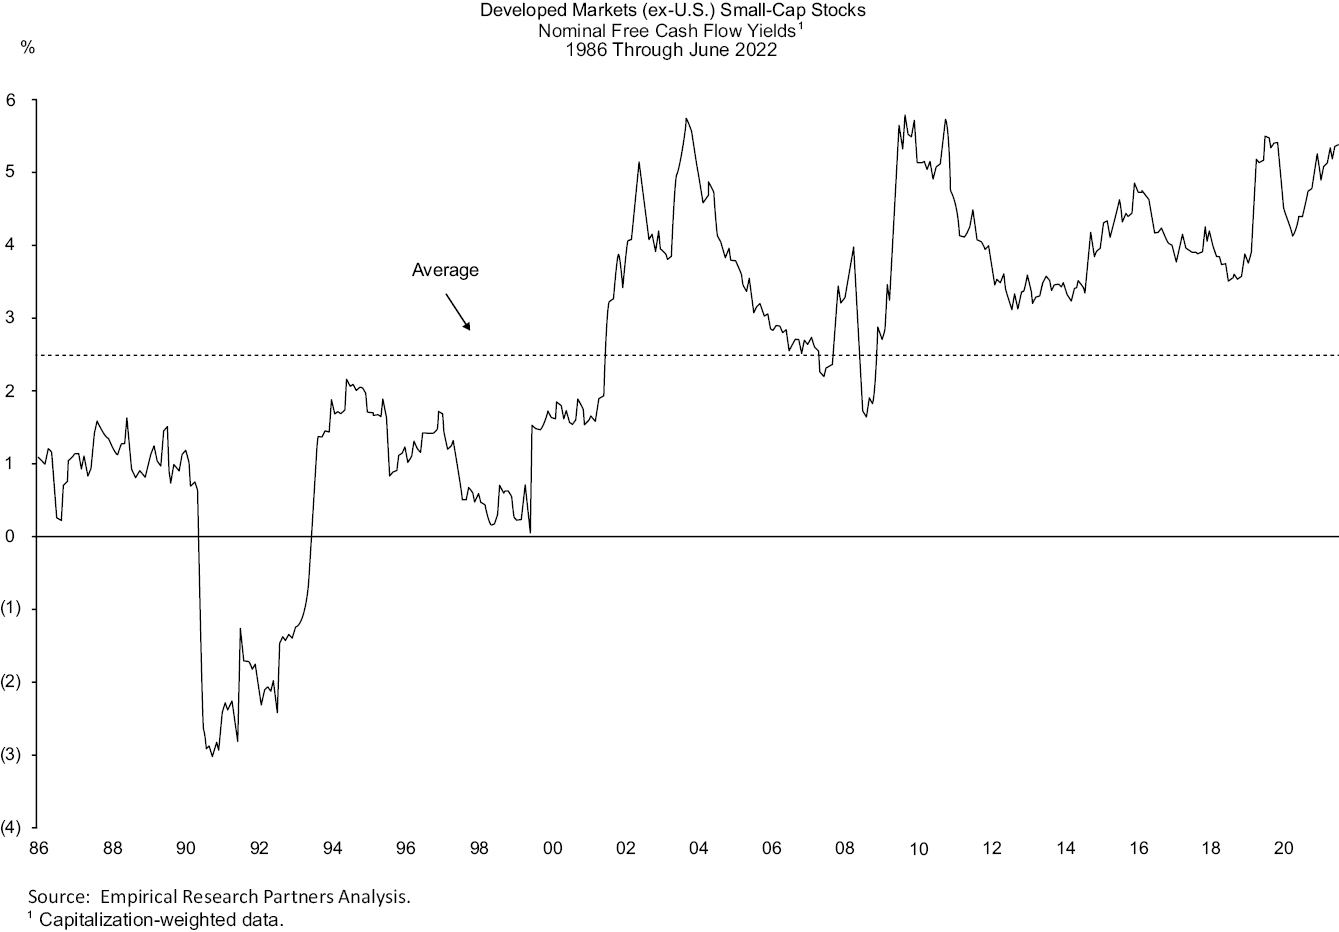
Valuation spreads, an indicator of intra-market disparities, sit at above-average historical levels but in our judgement not to a degree that compels big sector bets. This argues for a relatively balanced portfolio, which is how the strategy is positioned. Our primary focus continues to be to own strong companies with great underlying fundamentals, balance sheets and cash flows. In that regard, our portfolio companies had in aggregate an excellent set of earnings reports with strong underlying fundamentals. We are confident that whether the market goes up or down from here in the short-term, on a relative basis, the underlying fundamentals of our portfolio companies will continue to do well.
2
PRESIDENT AND PORTFOLIO MANAGER’S LETTER (unaudited) (continued)
On behalf of the entire team at Oberweis, thank you for investing in the Oberweis Funds. If you have any questions about your account, please contact shareholder services at (800) 245-7311.
Sincerely,
|
| |||
James W. Oberweis, CFA | Ralf Scherschmidt |

3
PRESIDENT AND PORTFOLIO MANAGER’S LETTER (unaudited) (continued)
AVERAGE ANNUAL TOTAL RETURNS (%) (as of June 30, 2022)
Ticker | Qtr | 1 Yr | 3 Yr | 5 Yr | 10 Yr | Life of | Expense | |||||||
OBIIX | -22.78 | -38.94 | 3.20 | 3.21 | N/A | 4.00 | 1.09 | |||||||
OFGIX | -21.70 | N/A | N/A | N/A | N/A | -21.70 | N/A |
Performance data shown represents past performance and is no guarantee of future results. Investment return and principal value will fluctuate, so that you may have gain or loss when shares are sold. Current performance may be higher or lower than quoted. Unusually high returns may not be sustainable. Visit us online at oberweisfunds.com for most recent month-end performance.
The Oberweis Funds invest in rapidly growing smaller and medium sized companies which may offer greater return potential. However, these investments often involve greater risks and volatility. Foreign investments involve greater risks than U.S investments, including political and economic risks and the risk of currency fluctuations. There is no guarantee that the funds can achieve their objectives. Holdings in the Funds are subject to change.
Before investing, consider the fund’s investment objectives, risks, charges, and expenses. To obtain a copy of the prospectus or summary prospectus containing this and other information please visit our website at oberweisfunds.com or call 800-323-6166. Read it carefully before investing. The Oberweis Funds are distributed by Oberweis Securities, Inc. Member: FINRA & SIPC.
* Life of Fund returns are from commencement of operations on 03/10/14 for OBIIX and 4/1/22 for OFIGX.
** December 31, 2021. Expense ratio is the total net annualized fund operating expense ratio. The expense ratio gross of expense offset arrangements and expense reimbursements was 1.09% for OBIIX. Oberweis Asset Management, Inc. (OAM), the Fund’s investment advisor is contractually obligated through April 30, 2023 to reduce its management fees or reimburse OBIIX and OFIGX to the extent that total ordinary operating expenses exceed in any one year 1.10% and 0.95% expressed as a percentage of each Fund’s average daily net assets, respectively.
The MSCI World ex-US Small Cap Growth Index (Net) is a free float-adjusted market capitalization weighted index that is designed to measure the equity market performance of small cap growth developed markets excluding the US, with minimum dividends reinvested net of withholding tax. The MSCI EAFE Index is an equity index that captures large and mid-cap representation across 21 developed markets countries around the world, excluding the U.S. and Canada. The index is comprehensive, covering approximately 85% of the free-float-adjusted market capitalization in each country.
4
Oberweis International Opportunities Institutional Fund
At June 30, 2022 (unaudited)
Asset Allocation (% of Net Assets) | ||
Equities | 96.9 | |
Other Assets less Liabilities | 3.1 | |
Top Ten Holdings (% of Net Assets) | ||
Uniti Group Ltd. | 3.8 | |
BayCurrent Consulting, Inc. | 3.6 | |
Daiwa Securities Group, Inc. | 3.5 | |
Constellium SE | 3.2 | |
Nordic Semiconductor ASA | 3.1 | |
Rexel SA | 2.8 | |
AIXTRON SE | 2.7 | |
Rheinmetall AG | 2.6 | |
Man Group PLC | 2.5 | |
Alfen NV | 2.4 | |
Top Ten Industries (% of Net Assets) | ||
Capital Markets | 10.6 | |
Semiconductors & Semiconductor Equipment | 9.1 | |
Electrical Equipment | 6.2 | |
Trading Co & Distribution | 5.9 | |
Machinery | 5.9 | |
Metals & Mining | 5.1 | |
Information Technology Services | 5.0 | |
Food & Staples Retailing | 4.1 | |
Diversified Telecommunication Services | 3.8 | |
Professional Services | 3.6 | |
Oberweis Focused International Growth Fund
At June 30, 2022 (unaudited)
Asset Allocation (% of Net Assets) | ||
Equities | 98.1 | |
Other Assets less Liabilities | 1.9 | |
Top Ten Holdings (% of Net Assets) | ||
HSBC Hldgs. PLC | 6.7 | |
Sony Group Corp. | 6.5 | |
STMicroelectronics NV | 6.4 | |
Adyen NV | 5.8 | |
Rexel SA | 4.9 | |
Datadog, Inc. | 4.4 | |
Future PLC | 4.1 | |
Roche Hldg. AG | 4.1 | |
Teleperformance SE | 3.8 | |
LVMH Moet Hennessy Louis Vuitton SE | 3.7 | |
Top Ten Industries (% of Net Assets) | ||
Semiconductor & Semiconductor Equipment | 9.3 | |
Software | 8.1 | |
Banks | 6.7 | |
Pharmaceuticals | 6.6 | |
Healthcare Equipment & Supplies | 6.5 | |
Household Durables | 6.5 | |
Oil, Gas & Consumable Fuels | 6.1 | |
Professional Services | 5.8 | |
Information Technology Services | 5.8 | |
Trading Co & Distribution | 4.9 | |
5
OBERWEIS INTERNATIONAL OPPORTUNITIES INSTITUTIONAL FUND
Schedule of Investments June 30, 2022 (unaudited)
Shares | Value | ||||
Equities – 96.9% |
| ||||
| |||||
Australia – 10.9% |
| ||||
Charter Hall Group. | 292,529 | $ | 2,186,698 | ||
Computershare Ltd. | 615,400 |
| 10,466,218 | ||
Elders Ltd. | 762,100 |
| 6,622,611 | ||
Evolution Mining Ltd. | 1,969,941 |
| 3,236,099 | ||
GrainCorp Ltd.* | 990,824 |
| 6,503,821 | ||
IDP Education Ltd. | 754,749 |
| 12,408,974 | ||
JB Hi-Fi Ltd.* | 74,339 |
| 1,973,411 | ||
Uniti Group Ltd.* | 6,725,855 |
| 22,840,424 | ||
| 66,238,256 | ||||
| |||||
Austria – 2.2% |
| ||||
AT & S Austria Technologie & Systemtechnik AG* | 253,100 |
| 13,527,667 | ||
| |||||
Belgium – 1.2% |
| ||||
VGP NV | 21,900 |
| 3,488,577 | ||
Warehouses de Pauw NV | 127,100 |
| 3,996,018 | ||
| 7,484,595 | ||||
| |||||
Canada – 15.2% |
| ||||
Aritzia, Inc.* | 520,100 |
| 14,081,328 | ||
ATS Automation Tooling Systems, Inc.* | 511,975 |
| 14,060,221 | ||
BRP, Inc. | 158,741 |
| 9,769,626 | ||
Colliers International Group, Inc. | 41,900 |
| 4,590,706 | ||
Finning International, Inc. | 233,300 |
| 4,909,957 | ||
Gildan Activewear, Inc. | 310,139 |
| 8,926,857 | ||
Parex Resources, Inc. | 858,691 |
| 14,542,778 | ||
Sleep Country Canada Hldgs., Inc. | 287,200 |
| 5,359,341 | ||
TFI International, Inc. | 79,200 |
| 6,357,781 | ||
Toromont Industries Ltd. | 74,600 |
| 6,031,983 | ||
Trisura Group Ltd.* | 136,800 |
| 3,542,219 | ||
| 92,172,797 | ||||
| |||||
Denmark – 1.5% |
| ||||
ALK-Abello A/S* | 229,560 |
| 3,984,698 | ||
D/S Norden A/S | 146,000 |
| 5,060,302 | ||
| 9,045,000 | ||||
| |||||
Finland – 3.9% |
| ||||
Metso Outotec Oyj | 1,286,631 |
| 9,640,968 | ||
Outokumpu Oyj | 1,940,776 |
| 8,025,888 | ||
QT Group Oyj* | 83,997 |
| 6,197,222 | ||
| 23,864,078 | ||||
See accompanying notes to the financial statements.
6
OBERWEIS INTERNATIONAL OPPORTUNITIES INSTITUTIONAL FUND
Schedule of Investments June 30, 2022 (unaudited) (continued)
Shares | Value | ||||
France – 3.2% |
| ||||
Alten SA | 24,800 | $ | 2,697,799 | ||
Rexel SA | 1,099,719 |
| 16,912,991 | ||
| 19,610,790 | ||||
| |||||
Germany – 8.5% |
| ||||
AIXTRON SE | 644,880 |
| 16,341,646 | ||
Aurelius Equity Opportunities SE | 173,865 |
| 3,698,868 | ||
HelloFresh SE* | 259,800 |
| 8,399,528 | ||
Rheinmetall AG | 69,500 |
| 16,045,745 | ||
Sixt SE | 71,317 |
| 7,313,318 | ||
| 51,799,105 | ||||
| |||||
Israel – 2.2% |
| ||||
Nova Ltd.* | 151,700 |
| 13,430,001 | ||
| |||||
Italy – 0.5% |
| ||||
Banca IFIS SpA | 233,100 |
| 3,300,336 | ||
| |||||
Japan – 13.4% |
| ||||
BayCurrent Consulting, Inc. | 81,200 |
| 21,604,658 | ||
Daiwa Securities Group, Inc. | 4,713,700 |
| 21,053,230 | ||
Food & Life Co. Ltd.* | 564,400 |
| 12,046,745 | ||
Fuji Electric Co. Ltd. | 299,400 |
| 12,401,445 | ||
Future Corp. | 736,600 |
| 7,557,099 | ||
M&A Capital Partners Co. Ltd.* | 246,300 |
| 6,471,547 | ||
| 81,134,724 | ||||
| |||||
Netherlands – 8.1% |
| ||||
Aalberts NV | 211,757 |
| 8,253,241 | ||
Alfen NV* | 159,300 |
| 14,717,971 | ||
BE Semiconductor Industries NV | 135,426 |
| 6,510,156 | ||
Constellium SE* | 1,487,239 |
| 19,646,427 | ||
| 49,127,795 | ||||
| |||||
Norway – 4.2% |
| ||||
Aker Solutions ASA | 1,281,100 |
| 3,480,536 | ||
Nordic Semiconductor ASA* | 1,225,144 |
| 19,005,858 | ||
Wallenius Wilhelmsen ASA | 547,435 |
| 2,948,458 | ||
| 25,434,852 | ||||
| |||||
Spain – 1.5% |
| ||||
Laboratorios Farmaceuticos Rovi SA* | 145,774 |
| 8,921,821 | ||
See accompanying notes to the financial statements.
7
OBERWEIS INTERNATIONAL OPPORTUNITIES INSTITUTIONAL FUND
Schedule of Investments June 30, 2022 (unaudited) (continued)
Shares | Value | ||||
Sweden – 4.1% |
| ||||
Addtech AB* | 171,336 | $ | 2,234,279 | ||
Arjo AB | 198,523 |
| 1,255,590 | ||
Cint Group AB* | 721,779 |
| 4,018,193 | ||
Hexatronic Group AB | 1,382,100 |
| 10,295,022 | ||
Nordnet AB | 447,800 |
| 5,852,593 | ||
Thule Group AB | 29,573 |
| 726,475 | ||
| 24,382,152 | ||||
| |||||
United Kingdom – 16.3% |
| ||||
Endava PLC ADS* | 108,548 |
| 9,581,532 | ||
Future PLC | 555,631 |
| 11,653,709 | ||
Howden Joinery Group PLC | 395,699 |
| 2,902,595 | ||
IMI PLC | 267,416 |
| 3,818,368 | ||
Intermediate Capital Group PLC | 752,835 |
| 11,995,874 | ||
LondonMetric Property PLC | 1,589,100 |
| 4,418,143 | ||
Man Group PLC | 4,962,000 |
| 15,088,346 | ||
Marks & Spencer Group PLC* | 5,923,900 |
| 9,771,010 | ||
Morgan Sindall Group PLC | 143,045 |
| 3,172,587 | ||
OSB Group PLC | 781,500 |
| 4,568,184 | ||
Redrow PLC | 807,538 |
| 4,814,755 | ||
RS GROUP PLC | 278,800 |
| 2,949,205 | ||
Safestore Hldgs. PLC | 139,700 |
| 1,804,281 | ||
Taylor Wimpey PLC | 4,220,802 |
| 5,993,385 | ||
The Sage Group PLC | 764,270 |
| 5,905,765 | ||
| 98,437,739 | ||||
| |||||
Total Equities |
| ||||
(Cost: $ 677,612,141) | $ | 587,911,708 | |||
| |||||
Total Investments – 96.9% |
| ||||
(Cost: $ 677,612,141) | $ | 587,911,708 | |||
| |||||
Other Assets Less Liabilities – 3.1% |
| 18,886,375 | |||
| |||||
Net Assets – 100% | $ | 606,798,083 | |||
* Non-income producing security during the period ended June 30, 2022
ADS — American depositary share
See accompanying notes to the financial statements.
8
OBERWEIS INTERNATIONAL OPPORTUNITIES INSTITUTIONAL FUND
Schedule of Investments June 30, 2022 (unaudited) (continued)
SECTOR ALLOCATIONS (As a Percentage of Net Assets) | |||
Communication Services | 5.7 | % | |
Consumer Discretionary | 12.5 | % | |
Consumer Staples | 5.2 | % | |
Energy | 3.0 | % | |
Financials | 12.5 | % | |
Healthcare | 2.3 | % | |
Industrials | 28.3 | % | |
Information Technology | 19.0 | % | |
Materials | 5.1 | % | |
Real Estate | 3.3 | % | |
See accompanying notes to the financial statements.
9
OBERWEIS FOCUSED INTERNATIONAL GROWTH FUND
Schedule of Investments June 30, 2022 (unaudited)
Shares | Value | ||||
Equities – 98.1% |
| ||||
| |||||
Australia – 3.0% |
| ||||
BHP Group Ltd. | 4,300 | $ | 122,429 | ||
Woodside Energy Group Ltd.* | 3,400 |
| 74,721 | ||
| 197,150 | ||||
| |||||
Denmark – 2.6% |
| ||||
Novo Nordisk AS* | 1,500 |
| 166,366 | ||
| |||||
France – 21.9% |
| ||||
LVMH Moet Hennessy Louis Vuitton SE | 400 |
| 243,848 | ||
Rexel SA | 20,600 |
| 316,815 | ||
Schneider Electric SE | 1,700 |
| 201,142 | ||
STMicroelectronics NV | 13,300 |
| 417,942 | ||
Teleperformance SE | 800 |
| 245,902 | ||
| 1,425,649 | ||||
| |||||
Germany – 2.1% |
| ||||
Sartorius AG* | 400 |
| 139,761 | ||
| |||||
Japan – 13.1% |
| ||||
BayCurrent Consulting, Inc.* | 500 |
| 133,034 | ||
Bridgestone Corp. | 3,100 |
| 113,097 | ||
Sony Group Corp.* | 5,200 |
| 425,221 | ||
Toyota Motor Corp.* | 11,900 |
| 184,183 | ||
| 855,535 | ||||
| |||||
Netherlands – 8.7% |
| ||||
Adyen NV* | 260 |
| 378,202 | ||
ASML Hldg. NV | 400 |
| 191,092 | ||
| 569,294 | ||||
| |||||
Sweden – 0.9% |
| ||||
EQT AB | 3,000 |
| 61,409 | ||
| |||||
Switzerland – 12.1% |
| ||||
Alcon, Inc. | 2,900 |
| 202,547 | ||
Nestle SA | 2,000 |
| 233,456 | ||
Roche Hldg. AG* | 800 |
| 266,932 | ||
Straumann Hldg. AG | 700 |
| 84,063 | ||
| 786,998 | ||||
See accompanying notes to the financial statements.
10
OBERWEIS FOCUSED INTERNATIONAL GROWTH FUND
Schedule of Investments June 30, 2022 (unaudited) (continued)
Shares | Value | ||||
United Kingdom – 25.6% |
| ||||
Anglo American PLC* | 3,100 | $ | 110,830 | ||
BP PLC | 31,700 |
| 149,837 | ||
Diageo PLC* | 3,900 |
| 167,607 | ||
Future PLC* | 12,900 |
| 270,562 | ||
HSBC Hldgs. PLC* | 67,500 |
| 440,085 | ||
Ocado Group PLC* | 19,500 |
| 185,434 | ||
Shell PLC | 6,700 |
| 174,045 | ||
St James’s Place PLC | 12,800 |
| 171,784 | ||
| 1,670,184 | ||||
| |||||
United States of America – 8.1% |
| ||||
Cadence Design Systems, Inc.* | 1,600 |
| 240,049 | ||
Datadog, Inc.* | 3,000 |
| 285,721 | ||
| 525,770 | ||||
| |||||
Total Equities |
| ||||
(Cost: $ 8,189,686) | $ | 6,398,116 | |||
| |||||
Total Investments – 98.1% |
| ||||
(Cost: $ 8,189,686) | $ | 6,398,116 | |||
| |||||
Other Assets Less Liabilities – 1.9% |
| 123,120 | |||
| |||||
Net Assets – 100% | $ | 6,521,236 | |||
* Non-income producing security during the period ended June 30, 2022
See accompanying notes to the financial statements.
11
OBERWEIS FOCUSED INTERNATIONAL GROWTH FUND
Schedule of Investments June 30, 2022 (unaudited) (continued)
SECTOR ALLOCATIONS (As a Percentage of Net Assets) | |||
Communication Services | 4.1 | % | |
Consumer Discretionary | 14.8 | % | |
Consumer Staples | 9.0 | % | |
Energy | 6.1 | % | |
Financials | 10.3 | % | |
Health Care | 13.2 | % | |
Industrials | 13.8 | % | |
Information Technology | 23.2 | % | |
Materials | 3.6 | % | |
See accompanying notes to the financial statements.
12
Statements of Assets and Liabilities June 30, 2022 (unaudited)
International | Focused | ||||||||
ASSETS | |||||||||
Investment securities at valuea | $ | 587,911,708 |
| $ | 6,398,116 |
| |||
Cash |
| 14,341,708 |
|
| 130,314 |
| |||
Foreign Currencyb |
| — |
|
| 1,632 |
| |||
Receivable from securities sold |
| 2,717,043 |
|
| — |
| |||
Dividends and interest receivable |
| 2,394,641 |
|
| 4,512 |
| |||
Receivable due from advisor (see note 3) |
| — |
|
| 520 |
| |||
Prepaid expenses |
| 59,847 |
|
| 1,379 |
| |||
Total Assets |
| 607,424,947 |
|
| 6,536,473 |
| |||
|
|
|
| ||||||
| LIABILITIES |
|
|
|
| ||||
| Payable to advisor (see note 3) |
| 504,081 |
|
| — |
| ||
Accrued expenses |
| 122,783 |
|
| 15,237 |
| |||
Total Liabilities |
| 626,864 |
|
| 15,237 |
| |||
NET ASSETS | $ | 606,798,083 |
| $ | 6,521,236 |
| |||
|
|
|
| ||||||
| SHARES OUTSTANDING |
|
|
|
| ||||
| (shares of beneficial interest issued and outstanding, respectively, unlimited number of shares authorized with no par value) |
| 72,787,566 |
|
| 832,434 |
| ||
Net asset value, offering price and redemption price | $ | 8.34 |
| $ | 7.83 |
| |||
|
|
|
| ||||||
| ANALYSIS OF NET ASSETS |
|
|
|
| ||||
| Capital | $ | 757,619,749 |
| $ | 8,263,807 |
| ||
Accumulated earnings |
| (150,821,666 | ) |
| (1,742,571 | ) | |||
Net Assets | $ | 606,798,083 |
| $ | 6,521,236 |
| |||
|
|
|
| ||||||
a Investment securities at cost | $ | 677,612,141 |
| $ | 8,189,686 |
| |||
b Foreign currency at cost | $ | — |
| $ | 1,644 |
| |||
See accompanying notes to the financial statements.
13
Statement of Operations Period Ended June 30, 2022 (unaudited)
| International | Focused | |||||||
| INVESTMENT INCOME |
|
|
|
| ||||
| Dividendsa | $ | 8,854,714 |
| $ | 61,324 |
| ||
Total Investment Income |
| 8,854,714 |
|
| 61,324 |
| |||
|
|
|
| ||||||
EXPENSES |
|
|
|
| |||||
| Investment advisory fees (see note 3) |
| 4,088,006 |
|
| 14,386 |
| ||
Transfer agent fees and expenses |
| 41,124 |
|
| 4,840 |
| |||
Custodian fees and expenses |
| 105,404 |
|
| 2,737 |
| |||
Accounting services fees |
| 137,022 |
|
| 3,614 |
| |||
Shareholder Fees |
| 15,188 |
|
| 1,936 |
| |||
Audit Fees |
| 10,744 |
|
| 5,544 |
| |||
Other |
| 173,575 |
|
| 588 |
| |||
Total expenses before reimbursed expenses |
| 4,571,063 |
|
| 33,645 |
| |||
Earnings credit (see note 6) |
| (7,501 | ) |
| (367 | ) | |||
Expense reimbursement (see note 3) |
| (66,756 | ) |
| (16,468 | ) | |||
Total Expenses |
| 4,496,806 |
|
| 16,810 |
| |||
NET INVESTMENT INCOME |
| 4,357,908 |
|
| 44,514 |
| |||
|
|
|
| ||||||
| NET REALIZED AND UNREALIZED GAINS (LOSSES) FROM INVESTMENTS |
|
| ||||||
| Net realized losses on investment transactions |
| (40,814,923 | ) |
| — |
|
| |
Net realized gains (losses) on foreign currency transactions |
| (43,779 | ) |
| 4,547 |
| |||
Net realized gains (losses) on investment and foreign currency transactions |
| (40,858,702 | ) |
| 4,547 |
| |||
Change in net unrealized appreciation/depreciation on investments and translation of assets and liabilities denominated in foreign currencies |
| (342,683,455 | ) |
| (1,791,632 | ) | |||
Net realized/unrealized losses on investments and foreign currencies |
| (383,542,157 | ) |
| (1,787,085 | ) | |||
NET DECREASE IN NET ASSETS RESULTING FROM OPERATIONS | $ | (379,184,249 | ) | $ | (1,742,571 | ) | |||
a Dividends are net of foreign withholding tax of $952,906 and $9,292 for the International Opportunities Institutional Fund and Focused International Growth Fund respectively.
b For the period from April 1, 2022 (commencement of operations) through June 30, 2022.
See accompanying notes to the financial statements.
14
Statement of Changes in Net Assets
| International Opportunities | ||||||||
Six Months | Year Ended | ||||||||
| FROM OPERATIONS |
|
|
|
|
| |||
| Net investment income (loss) | $ | 4,357,908 |
| $ | (3,838,610 | ) |
| |
Net realized gains (losses) on investments and foreign currency transactions |
| (40,858,702 | ) |
| 264,574,668 |
| |||
Change in net unrealized appreciation\depreciation on investments and foreign currencies |
| (342,683,455 | ) |
| (233,269,721 | ) | |||
Net increase (decrease) in net assets resulting from operations |
| (379,184,249 | ) |
| 27,466,337 |
| |||
|
|
|
| ||||||
| FROM DISTRIBUTIONS |
|
|
|
|
| |||
Distributions to shareholders |
| — |
|
| (266,497,571 | ) | |||
Net decrease in net assets from distributions |
| — |
|
| (266,497,571 | ) | |||
|
|
|
| ||||||
| FROM CAPITAL SHARE TRANSACTIONS |
|
|
|
|
| |||
| Proceeds from sale of shares |
| 30,372,924 |
|
| 102,744,641 |
|
| |
Proceeds from reinvestment of distributions |
| — |
|
| 246,793,697 |
| |||
Redemption of shares (see note 5) |
| (122,818,255 | ) |
| (229,735,433 | ) | |||
Net increase (decrease) from capital share transactions |
| (92,445,331 | ) |
| 119,802,905 |
| |||
Total decrease in net assets |
| (471,629,580 | ) |
| (119,228,329 | ) | |||
|
|
|
| ||||||
| NET ASSETS |
|
|
|
|
| |||
| Beginning of period |
| 1,078,427,663 |
|
| 1,197,655,992 |
|
| |
End of period | $ | 606,798,083 |
| $ | 1,078,427,663 |
| |||
|
|
|
| ||||||
|
|
|
| ||||||
| TRANSACTIONS IN SHARES |
|
|
|
| ||||
| Shares sold |
| 2,831,032 |
|
| 5,885,110 |
|
| |
Shares issued in reinvestment of distributions |
| — |
|
| 18,882,456 |
| |||
Less shares redeemed |
| (12,308,750 | ) |
| (13,179,772 | ) | |||
Net increase (decrease) from capital share transactions |
| (9,477,718 | ) |
| 11,587,794 |
| |||
See accompanying notes to the financial statements.
15
Statement of Changes in Net Assets (continued)
| Focused | |||||
Three Months | ||||||
| FROM OPERATIONS |
|
| |||
| Net investment income | $ | 44,514 |
| ||
| Net realized gains on investments and foreign currency transactions |
| 4,547 |
| ||
Change in net unrealized appreciation\depreciation on investments and foreign currencies |
| (1,791,632 | ) | |||
Net decrease in net assets resulting from operations |
| (1,742,571 | ) | |||
|
| |||||
| FROM CAPITAL SHARE TRANSACTIONS |
|
| |||
| Proceeds from sale of shares |
| 8,263,807 |
| ||
Redemption of shares (see note 5) |
| — |
| |||
Net increase from capital share transactions |
| 8,263,807 |
| |||
Total increase in net assets |
| 6,521,236 |
| |||
|
| |||||
| NET ASSETS |
|
| |||
Beginning of period |
| — |
| |||
End of period | $ | 6,521,236 |
| |||
|
| |||||
| TRANSACTIONS IN SHARES |
|
| |||
| Shares sold |
| 832,434 |
| ||
Less shares redeemed |
| — |
| |||
Net increase from capital share transactions |
| 832,434 |
| |||
See accompanying notes to the financial statements.
16
Notes to Financial Statements June 30, 2022 (unaudited)
1. Description of Organization
Description of business. The Oberweis Funds (the ‘‘Trust’’) is registered under the Investment Company Act of 1940 as an open-end management investment company. The Trust is authorized to operate numerous Funds under various trading strategies. The Oberweis International Opportunities Institutional Fund and the Oberweis Focused International Growth Fund (collectively, the “Funds”) are each funds in a series issued by the Trust.
2. Significant Accounting Policies
The following is a summary of significant accounting policies consistently followed by the Funds. These policies are in conformity with accounting principles generally accepted in the United States of America (“GAAP”). The Funds are each an investment company and follow accounting and reporting guidance under the Financial Accounting Standards Board (“FASB”) Accounting Standards Codification (“ASC”) Topic 946, “Financial Services—Investment Companies.”
Investment valuation. Investments in securities are stated at value as of the close of the regular trading session on the New York Stock Exchange (‘‘NYSE’’) (generally 3 p.m., Central Standard Time). Each listed and unlisted security for which last sale information is regularly reported is valued at the last reported sales price on that day. If there has been no sale on such day, then such security is valued at the current day’s bid price. Any unlisted security for which last sale information is not regularly reported and any listed debt security which has an inactive listed market for which over-the-counter market quotations are readily available are valued at the closing bid price determined on the basis of reasonable inquiry. Options are valued at the last reported bid price on the primary exchange as of the close of the regular trading session of the Chicago Board Options Exchange (‘‘CBOE’’). Restricted securities and any other securities or other assets for which market quotations are not readily available are valued by appraisal at their fair value as determined in good faith under procedures established by and under the general supervision and responsibility of the Board of Trustees. Short-term debt obligations, commercial paper and repurchase agreements are valued on the basis of quoted yields for securities of comparable maturity, quality and type or on the basis of amortized cost.
The Funds hold foreign equity securities. Foreign securities are fair valued as described in the following circumstances. Generally, trading in foreign securities markets is completed each day at various times prior to the close of the regular trading session of the NYSE. Due to the time differences between the closings of the relevant foreign securities exchanges and the close of the regular trading session of the NYSE for the Funds, the Funds will fair value their foreign investments when it is determined that the market quotations for the foreign investments either are not readily available or are unreliable and, therefore, do not represent fair value. When the fair value prices are utilized, these prices will attempt to reflect the impact of the U.S. financial markets’ perceptions and trading activities on the Funds’ foreign investments since the last closing prices of the foreign investments were calculated on their primary foreign securities markets or exchanges. For these purposes, the Board of Trustees of the Trust has determined that movements in relevant indices, after the close of the foreign securities exchanges, may demonstrate that market quotations are unreliable, and may trigger fair value pricing for certain securities. Consequently, fair valuation of portfolio securities may occur on a daily basis. In determining fair value prices, the Trust utilizes data furnished by an independent pricing service (and that data draws upon, among other information, the market values of foreign investments). When a Fund uses fair value pricing, the values assigned to the Fund’s foreign investments may not be the quoted or published prices of the investments on their primary markets or exchanges.
17
THE OBERWEIS FUNDS
Notes to Financial Statements June 30, 2022 (unaudited) (continued)
Fair value measurements. In accordance with Financial Accounting Standards Board (‘‘FASB’’) guidance, the Funds utilizes the ‘‘Fair Value Measurements and Disclosures’’ to define fair value, set out a framework for measuring fair value, and expand disclosures regarding fair value measurements. The Fair Value Measurement Standard applies to fair value measurements already required or permitted by existing standards.
Various inputs are used in determining the value of the Funds’ investments. These inputs are summarized in the three levels listed below:
• Level 1 — Quoted prices in active markets for identical securities.
• Level 2 — Other significant observable inputs (including quoted prices for similar securities, interest rates, prepayment speeds, credit risk, etc).
• Level 3 — Significant unobservable inputs (including the Funds’ own assumptions in determining the fair value of investments).
The inputs or methodology used for valuing securities are not necessarily an indication of the risk associated with investing in those securities. The following is a summary of the inputs used to value the Fund’s net assets as of June 30, 2022:
| International | Focused | ||||||
Level 1 – Equities |
|
| ||||||
Total Asia | $ | 94,564,725 | $ | 855,535 | ||||
Total Australia |
| 66,238,256 |
| 197,150 | ||||
Total Europe |
| 334,935,930 |
| 4,819,661 | ||||
Total North America |
| 92,172,797 |
| 525,770 | ||||
Total South America |
| — |
| — | ||||
Total Level 1 |
| 587,911,708 |
| 6,398,116 | ||||
Level 2 |
| — |
| — | ||||
Level 3 |
| — |
| — | ||||
Total Investments | $ | 587,911,708 | $ | 6,398,116 | ||||
The Funds’ assets may include certain foreign securities for which a third party statistical pricing service may be employed for purposes of fair market valuation. The pricing service provides fair market valuation on days when the movement in relevant indices exceeds a predetermined threshold.
Foreign currency transactions. The accounting records of the Funds are maintained in U.S. dollars. Foreign currency amounts are translated into U.S. dollars at the current rate of exchange to determine the value of investments, assets and liabilities. Purchases and sales of securities, and income and expenses are translated at the prevailing rate of exchange on the respective date of these transactions. The Funds do not isolate that portion of the results of operations resulting from changes in foreign exchange rates on investments from fluctuations arising from changes in market prices of securities held. These fluctuations are included with the net realized and unrealized gains or losses from investments and foreign currencies.
18
THE OBERWEIS FUNDS
Notes to Financial Statements June 30, 2022 (unaudited) (continued)
Risks associated with foreign securities and currencies. Investments in securities of foreign issuers carry certain risks not ordinarily associated with investments in securities of U.S. issuers. These risks include future political and economic developments, and the possible imposition of exchange controls or other foreign governmental laws and restrictions. In addition, with respect to certain countries, there is the possibility of expropriation of assets, confiscatory taxation, political or social instability or diplomatic developments, which could adversely affect investments in those countries.
Certain countries also may impose substantial restrictions on investments in their capital markets by foreign entities, including restrictions on investments in issuers of industries deemed sensitive to relevant national interests. These factors may limit the investment opportunities available and result in a lack of liquidity and a high price volatility with respect to securities of issuers from developing countries.
Fund share valuation. Fund shares are sold and redeemed on a continuous basis at net asset value. On each day the NYSE is open for trading, the net asset value per share is determined as of the later of the close of the NYSE or the CBOE by dividing the total value of investments and other assets, less liabilities, by the number of shares outstanding.
Investment transactions and investment income. Investment transactions are accounted for on the trade date (date the order to buy or sell is executed). Dividend income is recorded on the ex-dividend date, except that certain dividends from foreign securities are recorded as soon as the information is available to the Fund, and interest income is recorded on the accrual basis and includes amortization of premium and discount. Realized gains and losses from investment transactions are reported on an identified cost basis. Gains and losses on premiums from expired options are recognized on the date of expiration.
Federal income taxes and dividends to shareholders. It is the policy of the Funds to continue to comply with all requirements of the Internal Revenue Code of 1986, as amended (‘‘the Code’’), applicable to regulated investment companies and to distribute substantially all of their taxable income to their shareholders. The Funds have met the requirements of the Code applicable to regulated investment companies for the period ended June 30, 2022. Therefore, no federal income tax provision is required. Income and capital gains of the Funds are determined in accordance with both tax regulations and accounting principles generally accepted in the U.S. (‘‘GAAP’’). Such treatment may result in temporary and permanent differences between tax basis earnings and earnings reported for financial statement purposes. These reclassifications, which have no impact on the net asset value of the Funds, are primarily attributable to certain differences in computation of distributable income and capital gains under federal tax rules versus GAAP.
The Funds may utilize earnings and profits on redemption of shares as part of the dividends paid deduction.
For the year ended December 31, 2021, permanent book and tax differences resulting primarily from differing treatments for foreign currency transactions, and passive foreign investment company (“PFIC”) adjustments were identified and reclassified among the components of the Fund’s net assets.
19
THE OBERWEIS FUNDS
Notes to Financial Statements June 30, 2022 (unaudited) (continued)
GAAP requires that certain components of net assets be reclassified between financial and tax reporting. These reclassifications have no effect on net assets or net asset value per share. For the year ended December 31, 2021, permanent differences in book and tax accounting have been reclassified to paid in capital, accumulated net investment loss and accumulated net realized gain as follows:
Increases/(Decrease) | ||||||
Capital | Accumulated | |||||
International Opportunities Institutional Fund | $ 19,387,729 | $ (19,387,729) | ||||
The tax character of distributions paid during the fiscal year ended December 31, 2021 was as follows:
Distributions | Distributions | Total | ||||||
International Opportunities Institutional Fund | $ — | $ 266,497,571 | $ 266,497,571 | |||||
The tax character of distributions paid during the fiscal year ended December 31, 2020 was as follows:
Distributions | Distributions | Total | ||||||
International Opportunities Institutional Fund | $ 3,566,427 | $ 2,601,191 | $ 6,167,618 | |||||
As of December 31, 2021 the components of accumulated earnings on a tax basis were as follows:
Undistributed | Undistributed | Accumulated | Unrealized | Unrealized | ||||||||
International Opportunities Institutional Fund | $ — | $ — | $ — | $ 228,354,464 | $ 8,119 | |||||||
Accumulated capital and other losses consists of timing differences related to wash sales and mark to market on PFICs.
As of December 31, 2021 the cost of investments for federal income tax purposes are as follows:
Cost of | Gross | Gross | Unrealized | |||||||
International Opportunities Institutional Fund | $ 822,258,226 | $ 248,213,504 | $ (19,859,040) | $ 228,354,464 | ||||||
The Funds have reviewed all open tax years and major jurisdictions and concluded that there are no significant uncertain tax positions that would require recognition in the financial statements. Open tax years are those that are open for exam by taxing authorities and, as of June 30, 2022, open Federal tax years include the tax years ended 2018 through 2022. The Funds have no examinations in progress and is also not aware of any tax positions for which it is reasonably possible that the total amounts of unrecognized tax benefits will significantly change in the next twelve months.
20
THE OBERWEIS FUNDS
Notes to Financial Statements June 30, 2022 (unaudited) (continued)
Use of estimates. The preparation of financial statements in conformity with generally accepted accounting principles requires management to make estimates and assumptions that affect the amounts reported in the financial statements and accompanying notes. Actual results may differ from those estimates.
Indemnifications. Under the Trusts’ organizational documents, its present and former Officers and Trustees are indemnified against certain liabilities arising out of the performance of their duties to the Trust. In addition, in the normal course of business, the Trust enters into contracts that provide general indemnifications to other parties. The Trusts’ maximum exposure under these arrangements is unknown as this would involve future claims that may be made against the Trust that have not yet occurred. However, the Trust has not had prior claims or losses pursuant to these contracts and expects the risk of loss to be remote.
3. Transactions with affiliates
The Funds have written agreements with Oberweis Asset Management, Inc. (‘‘OAM’’) as the Fund’s investment adviser and manager. Oberweis Securities, Inc. (‘‘OSI’’), the Fund’s principal distributor, is an affiliate of OAM.
Investment advisory agreement. Under the Advisory Agreement, OAM provides investment advisory and management services to the Funds. The Oberweis International Opportunities Institutional Fund paid monthly investment advisory and management fees at an annual rate equal to 1.00% of average daily net assets and the Focused International Growth Fund paid investment advisory and management fees at an annual rate equal to 0.80% of average daily net assets. For the period ended June 30, 2022, the International Opportunities Institutional Fund incurred investment advisory and management fees totaling $4,088,006 and the Focused International Growth Fund incurred investment advisory and management fees totaling $14,386.
Expense reimbursement. OAM is contractually obligated to reduce its investment and management fees or reimburse the International Opportunities Institutional Fund and the Focused International Growth Fund to the extent that total ordinary operating expenses, as defined, exceed in any one year 1.10% and 0.95% expressed as a percentage of each Fund’s average daily net assets. For the period ended June 30, 2022 OAM reimbursed the International Opportunities Institutional Fund and the Focused International Growth Fund in the amount of $66,756 and $16,468, respectively.
Officers and trustees. Certain officers and trustees of the Trust are also officers and/or directors of OAM and OSI. During the period ended June 30, 2022, the Trust made no direct payments to its officers and paid $62,167 to its unaffiliated trustees.
Affiliated commissions. For the period ended June 30, 2022, the International Opportunities Institutional Fund and the Focused International Growth Fund did not execute any security transactions through OSI and therefore did not pay commissions to OSI.
4. Investment transactions
The cost of securities purchased and proceeds from securities sold during the period ended June 30, 2022, other than options written and money market investments, aggregated $304,963,984 and $384,262,019, respectively for the International Opportunities Institutional Fund, and $8,189,686 and $0 respectively for the Focused International Growth Fund. The Funds did not hold government securities during the period ended June 30, 2022.
21
THE OBERWEIS FUNDS
Notes to Financial Statements June 30, 2022 (unaudited) (continued)
The Funds may write covered call options. The premiums received provide a partial hedge (protection) against declining prices and enables the Fund to generate a higher return during periods when OAM does not expect the underlying security to make any major price moves in the near future but still deems the underlying security to be, over the long term, an attractive investment for the Fund. The Fund may write covered call options for which premiums received are recorded as liabilities and are subsequently adjusted to the current value of the options written. Premiums received from writing options that expire are treated as realized gains. Premiums received from writing options, which are either exercised or closed, are offset against the proceeds received or amount paid on the transaction to determine realized gains or losses. Amounts recovered for securities litigation are included in the realized gains of the Fund and are recorded when received. The Fund did not write covered call options during the period ended June 30, 2022.
5. Redemption fee
The Fund is designed for long-term investors. To discourage market timers, redemptions of shares within 90 days of purchase are subject to a 2% redemption fee of the total redemption amount. The redemption fee is deducted from the redemption proceeds and is retained by the Fund.
The redemption fee is retained by the Funds for the expense they incur in connection with shareholder redemptions. Redemption fees received by the International Opportunities International Fund and Focused International Growth Fund were $100,866 and $0 respectively for the period ended June 30, 2022 and were recorded as a reduction of the redemption of shares in the Statement of Changes in Net Assets.
6. Earnings credits and interest charges
The Trust, as part of the agreement with the Custodian, receives credits against its custodian fees on its uninvested cash balances and is allowed to borrow for temporary purposes. Borrowings are not to exceed 5% of the value of each Fund’s total assets at the time of any such borrowing. Interest on amounts borrowed is calculated at the prime rate and is payable monthly. During the period ended June 30, 2022, the International Opportunities Institutional Fund and the Focused International Growth Fund received credits of $7,501 and $367 respectively. The International Opportunities Institutional Fund and the Focused International Growth Fund incurred interest charges of $26,792 and $0 respectively, which is included in custodian fees and expenses in the Statement of Operations.
7. Coronavirus (COVID-19) pandemic
In early 2020, an outbreak of a novel strain of coronavirus (COVID-19) emerged globally. This coronavirus has resulted in closing international borders, enhanced health screenings, healthcare service preparation and delivery, quarantines, cancellations, disruptions to supply chains and customer activity, as well as general public concern and uncertainty. The impact of this outbreak has negatively affected the worldwide economy, as well as the economies of individual countries, the financial health of individual companies and the market in general in significant and unforeseen ways. The future impact of COVID-19 is currently unknown, and it may exacerbate other risks that apply to the Funds, including political, social and economic risks. Any such impact could adversely affect the Funds’ performance, the performance of the securities in which the Funds invest and may lead to losses on your investment in each Fund. The ultimate impact of COVID-19 on the financial performance of the Funds’ investments is not reasonably estimable at this time.
22
THE OBERWEIS FUNDS
Notes to Financial Statements June 30, 2022 (unaudited) (continued)
8. Subsequent events
The Funds have evaluated subsequent events through the issuance of the financial statements and determined that no events have occurred that require disclosure.
23
Financial Highlights
Per share income and capital for a share outstanding throughout each period is as follows:
|
| International Opportunities Institutional Fund |
|
| ||||||||||||||||||||||
|
| Six Months |
| |||||||||||||||||||||||
| 2021 |
|
|
| 2020 |
|
|
| 2019 |
|
|
| 2018 |
|
|
| 2017 |
|
| |||||||
Net asset value at beginning of period | $ | 13.11 | $ | 16.95 | $ | 10.41 | $ | 8.54 | $ | 12.77 | $ | 9.72 | ||||||||||||||
INCOME (LOSS) FROM INVESTMENT OPERATIONS: | ||||||||||||||||||||||||||
Net investment income (loss)a | .06 | (.06 | ) | (.03 | ) | .04 | .04 | .03 | ||||||||||||||||||
Net realized and unrealized gains (losses) on investments and foreign currency transactions |
| (4.83 | ) |
| .40 |
| 6.66 |
| 1.97 |
| (3.11 | ) |
| 3.95 | ||||||||||||
Total from investment operations | (4.77 | ) | .34 | 6.63 | 2.01 | (3.07 | ) | 3.98 | ||||||||||||||||||
Redemption feesa | — | e | — | e | — | e | — | e | — | e | — | e | ||||||||||||||
Less dividends and distributions: | ||||||||||||||||||||||||||
Dividends from net realized gains on investments and foreign currency transactions | — | (4.18 | ) | (.04 | ) | — | (1.15 | ) | (.85 | ) | ||||||||||||||||
Dividends from net investment income |
| — |
| — |
| (.05 | ) |
| (.14 | ) |
| (.01 | ) |
| (.08 | ) | ||||||||||
Total dividends and distributions |
| — |
| (4.18 | ) |
| (.09 | ) |
| (.14 | ) |
| (1.16 | ) |
| (.93 | ) | |||||||||
Net asset value at end of period | $ | 8.34 | $ | 13.11 | $ | 16.95 | $ | 10.41 | $ | 8.54 | $ | 12.77 | ||||||||||||||
Total return (%) | (36.38 | )d | 2.10 | 63.65 | 23.50 | (23.91 | ) | 40.99 | ||||||||||||||||||
RATIO/SUPPLEMENTAL DATA: | ||||||||||||||||||||||||||
Net Assets at end of period (in thousands) | $ | 606,798 | $ | 1,078,428 | $ | 1,197,656 | $ | 967,119 | $ | 753,138 | $ | 1,041,117 | ||||||||||||||
Ratio of gross expenses to average net assets (%) | 1.12 | c | 1.09 | 1.13 | 1.12 | 1.11 | 1.15 | |||||||||||||||||||
Ratio of net expenses to average net assets (%)b | 1.10 | c | 1.09 | 1.10 | 1.08 | 1.08 | 1.10 | |||||||||||||||||||
Ratio of net investment income (loss) to average net assets (%) | 1.07 | c | (.32 | ) | (.27 | ) | .37 | .35 | .29 | |||||||||||||||||
Portfolio turnover rate (%) | 37 | d | 91 | 134 | 153 | 145 | 168 | |||||||||||||||||||
Notes:
a The net investment income (loss) per share data and the redemption fee data were determined using average shares outstanding during the period.
b The ratios in this row reflect the impact, if any, of expense offset arrangements with the custodian and expense reimbursement from the advisor.
c Annualized.
d Not annualized.
e Less than $0.005 per share
24
Financial Highlights (continued)
Per share income and capital for a share outstanding throughout each period is as follows:
Focused International Growth Fund | ||||||||||||||||||||||||
Period | ||||||||||||||||||||||||
Net asset value at beginning of period | $ | 10.00 | ||||||||||||||||||||||
INCOME (LOSS) FROM INVESTMENT OPERATIONS: | ||||||||||||||||||||||||
Net investment incomeb | .05 | |||||||||||||||||||||||
Net realized and unrealized gains (losses) on investments |
| (2.22 | ) | |||||||||||||||||||||
Total from investment operations | (2.17 | ) | ||||||||||||||||||||||
Redemption Feesb |
| — | ||||||||||||||||||||||
Net asset value at end of period | $ | 7.83 | ||||||||||||||||||||||
Total Return (%) | (21.70 | )e | ||||||||||||||||||||||
RATIO/SUPPLEMENTAL DATA: | ||||||||||||||||||||||||
Net Assets at end of period (in thousands) | $ | 6,521 | ||||||||||||||||||||||
Ratio of gross expenses to average net assets (%) | 1.90 | d | ||||||||||||||||||||||
Ratio of net expenses to average net assets (%)c | .95 | |||||||||||||||||||||||
Ratio of net investment income to average net assets (%) | 2.52 | d | ||||||||||||||||||||||
Portfolio turnover rate (%) | 0 | e | ||||||||||||||||||||||
Notes:
a For the period from April 1, 2022 (commencement of operations) through June 30, 2022.
b The net investment income per share data and the redemption fee data were determined using average shares outstanding during the period.
c The ratios in this row reflect the impact, if any, of expense offset arrangements.
d Annualized.
e Not Annualized.
25
Supplemental Information (unaudited)
Liquidity Risk Management Program:
Consistent with Rule 22e-4 under the Investment Company Act of 1940, as amended (the “Liquidity Rule”), The Oberweis Funds (each a “Fund” and collectively, the “Funds”) have adopted and implemented a liquidity risk management program (the “LRMP”). The LRMP seeks to assess and manage the Funds’ liquidity risk, which is defined as the risk that a Fund could not meet requests to redeem shares issued by the Fund without significant dilution of the remaining investors’ interests in the Fund. The Funds’ Board of Trustees (the “Board”) has approved an officer of the Funds (the “Administrator”) to serve as the administrator of the Funds’ LRMP.
The Funds’ LRMP includes a number of processes designed to support the assessment and management of its liquidity risk. In particular, the LRMP includes no less than annual assessments of factors that influence each Funds’ liquidity risk; no less than monthly classifications of a Fund’s investments into one of four liquidity classifications provided for in the Liquidity Rule; a 15% of net assets limit on the acquisition of “illiquid investments” (as defined under the Liquidity Rule); establishment of a minimum percentage of a Fund’s assets to be invested in investments classified as “highly liquid” (as defined under the Liquidity Rule) if the Fund does not invest primarily in highly liquid investments; and regular reporting to the Board.
At a meeting of the Board on May 18, 2022, the Administrator provided a written report (the “LRMP Report”) to the Board addressing the operation, adequacy, and effectiveness of implementation of the Funds’ LRMP, including if and as applicable, (1) the operation of the Highly Liquid Investment Minimum established for each applicable Fund; (2) an assessment of the quality of the data and analysis provided, and of the particular methodologies used and metrics analyzed, by any third-party vendor engaged; and (3) a summary of any material changes to the LRMP during the prior annual period. The LRMP Report covered the period from May 1, 2021 through April 30, 2022 (the “Reporting Period”). The LRMP Report concluded that the LRMP had operated adequately and effectively to manage the Funds’ liquidity risk during the Reporting Period. There were no material changes to the LRMP during the Reporting Period. The LRMP Report further concluded that the Funds’ investment strategies were appropriate for an open-end fund and did not involve relatively concentrated portfolios.
There can be no assurance that the LRMP will achieve its objectives under all circumstances in the future.
Proxy Voting:
The Oberweis Funds has delegated authority to vote proxies related to the Funds’ portfolio securities to the Fund’s investment advisor, Oberweis Asset Management, Inc. (“OAM”). A description of the policies and procedures that OAM uses in fulfilling this responsibility is available, without charge upon request, by calling 1-800-323-6166. It also appears on www.oberweisfunds.com and in the Funds’ Statement of Additional Information, which can be found on the Securities and Exchange Commission’s (“SEC”) website at http://www.sec.gov. Information on how the Funds voted proxies relating to portfolio securities during the most recent 12-month period ended June 30 is available (1) without charge, upon request, by calling 1-800-323-6166, and (2) on the SEC’s website at http://www.sec.gov.
26
THE OBERWEIS FUNDS
Supplemental Information (unaudited) (continued)
Availability of Schedules of Portfolio Investments:
The Funds file their complete schedule of portfolio investments with the SEC for the first and third quarter of each fiscal year (March 31 and September 30) on Form NPORT. The Funds’ Form NPORT are available, without charge, on the SEC’s website at http://www.sec.gov and may be reviewed and copied at the SEC’s Public Reference Room in Washington, D.C. Information on the operation of the Public Reference Room may be obtained by calling 1-800-SEC-0330.
Approval of Investment Advisory Agreement:
The Investment Advisory and Management Agreement between The Oberweis Funds (the “Trust”) and Oberweis Asset Management (“OAM”) (the “Advisory Agreement”) with respect to the Focused International Growth Fund (the “Fund”) was approved by the Board of Trustees (the “Board”), including all of the trustees who are not parties to the Agreement or interested persons of any such party (the “independent trustees”), on February 16, 2022. The Board of Trustees, including a majority of the independent trustees, determined to approve the Agreement. The independent trustees were assisted by legal counsel in making their determination.
Nature, Quality and Extent of Services. With respect to the nature, quality and extent of the services to be provided by OAM pursuant to the Advisory Agreement, the Board considered the background and experience of OAM, the functions to be performed by OAM, the personnel that will provide such services and the management capabilities of OAM. The Board also considered OAM’s financial condition, the compliance reports provided to the Board and the culture of compliance created by OAM, including the competency of the Trust and OAM’s chief compliance officer. The Board also considered the experience, academic background, long tenure, structure, size and geographic locations of the portfolio management/strategy investment team and its role, the investment process with respect to the types of investments to be held by the Fund, the Fund’s portfolio management team and the portfolio manager who will be responsible for managing the Fund, as well as the honesty and integrity of OAM and that in the Board’s experience, OAM personnel are always open and forthright with the Board. In addition, the Board considered that OAM is a research-oriented firm that conducts extensive research. Based on the information provided, the Board concluded that the nature and extent of services to be provided to the Fund by OAM were appropriate and that the quality of such services was expected to be good.
Fees and Expenses. The Board compared the amounts to be paid to OAM for advisory and management services for the Fund as compared to a peer universe of funds provided by Broadridge Financial Solutions, Inc., an independent provider of investment company data. This information showed that the proposed advisory and management fees would be lower than nine of the other fourteen mutual funds.
In addition, the Board considered the proposed expense limitations for the Fund and noted that OAM would be responsible for the costs associated with the start-up of the Fund, including the organizational expenses and costs of preparing and filing the Registration Statement. Based on the information considered, the Board concluded that the Fund’s advisory and management fees were reasonable in amount given the quality of services expected to be provided and taking into consideration other relevant circumstances.
27
THE OBERWEIS FUNDS
Supplemental Information (unaudited) (continued)
Economies of Scale. The Board also considered the extent to which economies of scale would be realized as the Fund grows and whether fee levels reflect economies of scale for the benefit of Fund shareholders. The Board noted the asset capacity constraints for the Fund which limit economies of scale. The Board concluded that the Fund’s advisory and management fees reflect an appropriate recognition of any economies of scale.
Other Benefits to OAM or Its Affiliates. With respect to other incidental benefits to be received by OAM or its affiliates from their relationship with the Fund, the Board considered the fact that neither distribution fees nor 12b-1 fees would be paid to Oberweis Securities, Inc. (“OSI”) as the distributor of the Fund, as such, OSI would not receive payments for its distribution services for the Fund’s shares. The Board also considered potential benefits to OAM related to soft dollars.
After due consideration of all of the information and factors deemed relevant by the Board and based upon its own business judgment and the conclusions reached, the Board determined to approve the Advisory Agreement. The Board, including the Independent Trustees, did not identify any single factor or group of factors as all important or controlling and considered all factors together.
Expense Examples:
As a shareholder of The Fund, you may incur two types of costs: (1) transaction costs, including redemption fees and (2) ongoing costs, including management fees; distribution (and/or service) 12b-1 fees; and other Fund expenses. This example is intended to help you understand your ongoing costs (in dollars) of investing in The Fund and to compare these costs with the ongoing costs of investing in other mutual funds.
The Example is based on an investment of $1,000 investment at the beginning of the period and held for the entire period.
Actual Expenses:
The first line for each Fund in the table below provides information about actual account values and actual expenses. You may use the information below; together with the amount you invested, to estimate the expenses that you paid over the period. Simply divide your account value by $1,000 (for example, an $8,600 account value divided by $1,000=8.6), then multiply the result by the number in the table under the heading entitled “Expenses Paid During Period” to estimate the expenses you paid on your account during this period.
Hypothetical Example for Comparison Purposes:
The second line for each Fund in the table below provides information about hypothetical account values and hypothetical expenses based on the Fund’s actual expense ratio and an assumed rate of return of 5% per year before expenses, which is not the Fund’s actual return.
The hypothetical account values and expenses may not be used to estimate the actual ending account balance or expenses you paid for the period. You may use this information to compare this 5% hypothetical example with the 5% hypothetical examples that appear in the shareholder reports of other funds.
28
THE OBERWEIS FUNDS
Supplemental Information (unaudited) (continued)
Please note that the expenses shown in the table are meant to highlight your ongoing costs only and do not reflect any transactional costs, such as redemption fees. Therefore, the second line for each Fund in the table is useful in comparing ongoing costs only, and will not help you determine the relative total costs of owning different funds. In addition, if these transactional costs were included, your costs would have been higher.
| Beginning | Ending | Expenses Paid | Expense Ratio | ||||
INTERNATIONAL OPPORTUNITIES FUND | ||||||||
Actual | $ 1,000.00 | $ 636.20 | $ 4.46 | 1.10% | ||||
Hypothetical | $ 1,000.00 | $ 1,019.34 | $ 5.51 | 1.10% | ||||
FOCUSED INTERNATIONAL GROWTH FUND | ||||||||
Actual | $ 1,000.00 | $ 783.00 | $ 4.20 | 0.95% | ||||
Hypothetical | $ 1,000.00 | $ 1,020.08 | $ 4.76 | 0.95% | ||||
* Expenses are equal to the average account value times the Fund’s annualized expense ratio multiplied by the number of days in the most recent fiscal half-year divided by the number of days in the fiscal year.
29
Trustees and Officers | ||
Michael J. Simon Gary D. McDaniel James W. Oberweis David I. Covas Kenneth S. Farsalas | Katherine Smith Dedrick Alix J. Charles Patrick B. Joyce Eric V. Hannemann Thomas P. Joyce |
Manager and Investment Advisor
Oberweis Asset Management, Inc.
3333 Warrenville Road, Suite 500, Lisle, IL 60532
800-323-6166
oberweisfunds.com
Distributor
Oberweis Securities, Inc.
3333 Warrenville Road, Suite 500, Lisle, IL 60532
630-577-2300
oberweisfunds.com
Custodian
UMB Bank, n.a.
928 Grand Blvd., Kansas City, MO 64106
Transfer Agent
UMB Fund Services, Inc.
P.O. Box 711, Milwaukee, WI 53201-0711
800-245-7311
Counsel
Vedder Price P.C.
222 North LaSalle Street, Chicago, IL 60601
Independent Registered Public Accounting Firm
BBD, LLP
1835 Market Street, 3rd Floor, Philadelphia, PA 19103
International Opportunities Institutional Fund
Focused International Growth Fund
800-245-7311
oberweisfunds.com
![]()
3333 Warrenville Road
Suite 500
Lisle, IL 60532
ITEM 2. CODE OF ETHICS.
Not required for the Semi-Annual Report.
ITEM 3. AUDIT COMMITTEE FINANCIAL EXPERT
Not required for the Semi-Annual Report.
ITEM 4. PRINCIPAL ACCOUNTANT FEES AND SERVICES.
Not required for the Semi-Annual Report.
ITEM 5. AUDIT COMMITTEE OF LISTED REGISTRANTS.
Not Applicable to the registrant.
ITEM 6. SCHEDULE OF INVESTMENTS.
See Schedule of Investments in Item 1.
ITEM 7. DISCLOSURE OF PROXY VOTING POLICIES AND PROCEDURES FOR CLOSED-END MANAGEMENT INVESTMENT COMPANIES.
Not Applicable to the registrant.
ITEM 8. PORTFOLIO MANAGERS OF CLOSED-END MANAGEMENT INVESTMENT COMPANIES.
Not Applicable to the registrant.
ITEM 9. PURCHASES OF EQUITY SECURITIES BY CLOSED-END MANAGEMENT INVESTMENT COMPANY AND AFFILIATED PURCHASERS.
Not Applicable to the registrant.
ITEM 10. SUBMISSION OF MATTERS TO A VOTE OF SECURITY HOLDERS.
There have been no material changes to the procedures by which shareholders may recommend nominees to the registrant’s board of trustees since registrant last disclosed such procedures in its proxy statement dated April 16, 2004.
ITEM 11. CONTROLS AND PROCEDURES.
(a) The registrant’s principal executive and principal financial officers, or persons performing similar functions, have concluded that the registrant’s disclosure controls and procedures (as defined in Rule 30a-3(c) under the Investment Company Act of 1940, as amended (the “1940 Act”) (17CFR 270.30a-3(c))) are effective, as of a date within 90 days of the filing date of the report that includes the disclosure required by this paragraph, based on their evaluation of these controls and procedures required by Rule 30a-3(b) under the 1940 Act (17 CFR 270.30a-3(b)) and Rules 13a-15(b) or 15d-15(b) under the Exchange Act (17 CFR 240.13a-15(b) or 240.15d-15(b)).
(b) There has been no change to the registrant’s internal control over financial reporting (as defined in Rule 30a-3(d) under the 1940 Act (17 CFR 270.30a-3(d)) that occurred during the second fiscal quarter of the period covered by this report that has materially affected, or is reasonably likely to materially affect, the registrant’s internal control over financial reporting.
ITEM 12. EXHIBITS.
| (a) (1) | Not required for the Semi-Annual Report. |
| (a) (2) | Certifications pursuant to Rule 30a-2 under the Investment Company Act of 1940 (17CFR 270.30a-2) in the exact form set forth below: are attached hereto. |
| (a) (3) | Any written solicitation to purchase securities under Rule 23c-1 under the Investment Company Act of 1940 (17 CFR 270.23c-1) sent or given during the period covered by the report by or on behalf of the registrant to 10 or more persons. Not Applicable to the registrant. |
| (b) | The certifications required by Rule 30a-2(b) of the 1940 Act and Section 906 of the Sarbanes-Oxley Act of 2002 are attached hereto. |
SIGNATURES
Pursuant to the requirements of the Securities Exchange Act of 1934 and the Investment Company Act of 1940, the registrant has duly caused this report to be signed on its behalf by the undersigned, thereunto duly authorized.
| (Registrant) | The Oberweis Funds |
| By (Signature and Title*) | /s/ James W. Oberweis James W. Oberweis President, The Oberweis Funds |
Date 8/31/2022
Pursuant to the requirements of the Securities Exchange Act of 1934 and the Investment Company Act of 1940, this report has been signed below by the following persons on behalf of the registrant and in the capacities and on the dates indicated.
| By (Signature and Title*) | /s/ James W. Oberweis James W. Oberweis President, The Oberweis Funds |
Date 8/31/2022
| By (Signature and Title*) | /s/ Eric V. Hannemann Eric V. Hannemann Treasurer, The Oberweis Funds |
Date 8/31/2022
/*/ Print the name and title of each signing officer under his or her signature.