EXHIBIT 99.1
• Forward Looking Statements. This presentation contains forward - looking statements that are based on management’s beliefs, assumptions, current expectations, estimates and projections about the financial services industry, the economy, and ChoiceOne Financial Services, Inc. These statements are not guarantees of future performance and involve certain risks, uncertainties and assumptions (“risk factors”) that are difficult to predict with regard to timing, extent, likelihood, and degree of occurrence. Actual results and outcomes may materially differ from what may be expressed, implied or forecasted in such forward - looking statements. • Risk Factors include, but are not limited to, the risk factors described in Item 1A in ChoiceOne’s Annual Report on Form 10 - K for the year ended December 31, 2021. Disclaimer 2
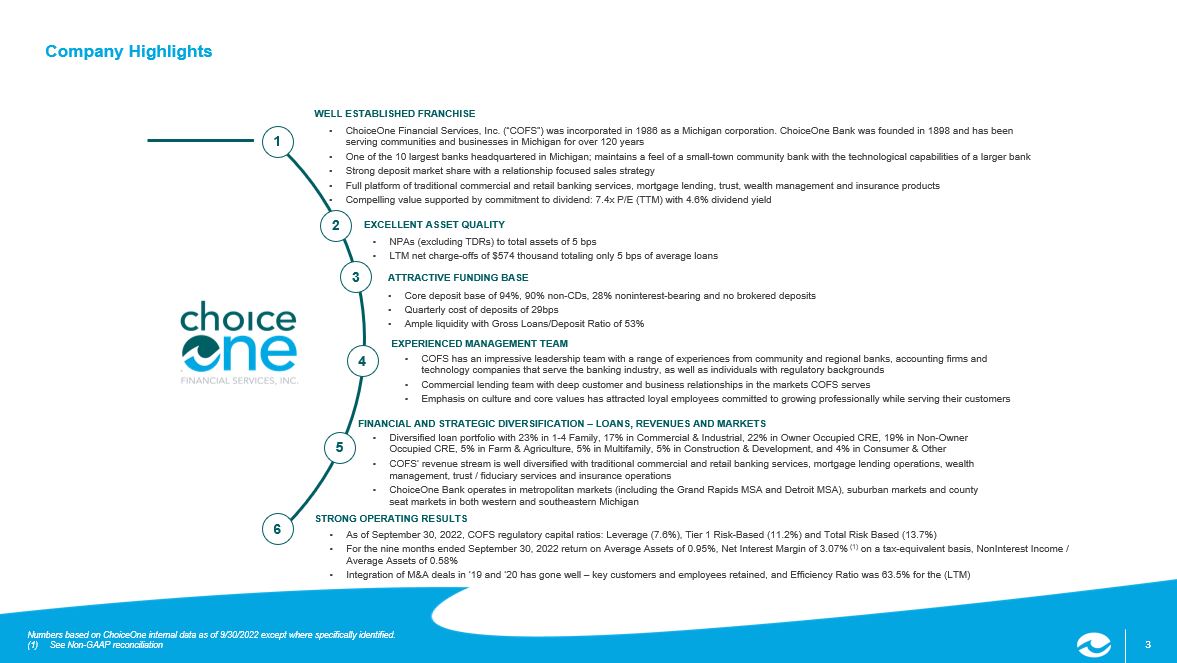
3 3 Company Highlights Numbers based on ChoiceOne internal data as of 9/30/2022 except where specifically identified. (1) See Non - GAAP reconciliation • As of September 30, 2022, COFS regulatory capital ratios: Leverage (7.6%), Tier 1 Risk - Based (11.2%) and Total Risk Based (13.7% ) • For the nine months ended September 30, 2022 return on Average Assets of 0.95%, Net Interest Margin of 3.07% (1) on a tax - equivalent basis, NonInterest Income / Average Assets of 0.58% • Integration of M&A deals in ‘19 and ‘20 has gone well – key customers and employees retained, and Efficiency Ratio was 63.5% for the (LTM) STRONG OPERATING RESULTS 6 • ChoiceOne Financial Services, Inc. (“COFS”) was incorporated in 1986 as a Michigan corporation. ChoiceOne Bank was founded in 18 98 and has been serving communities and businesses in Michigan for over 120 years • One of the 10 largest banks headquartered in Michigan; maintains a feel of a small - town community bank with the technological ca pabilities of a larger bank • Strong deposit market share with a relationship focused sales strategy • Full platform of traditional commercial and retail banking services, mortgage lending, trust, wealth management and insurance pr oducts • Compelling value supported by commitment to dividend: 7.4x P/E (TTM) with 4.6% dividend yield WELL ESTABLISHED FRANCHISE • NPAs (excluding TDRs) to total assets of 5 bps • LTM net charge - offs of $574 thousand totaling only 5 bps of average loans EXCELLENT ASSET QUALITY • Core deposit base of 94%, 90% non - CDs, 28% noninterest - bearing and no brokered deposits • Quarterly cost of deposits of 29bps • Ample liquidity with Gross Loans/Deposit Ratio of 53% ATTRACTIVE FUNDING BASE • Diversified loan portfolio with 23% in 1 - 4 Family, 17% in Commercial & Industrial, 22% in Owner Occupied CRE, 19% in Non - Owner Occupied CRE, 5% in Farm & Agriculture, 5% in Multifamily, 5% in Construction & Development, and 4% in Consumer & Other • COFS’ revenue stream is well diversified with traditional commercial and retail banking services, mortgage lending operations , w ealth management, trust / fiduciary services and insurance operations • ChoiceOne Bank operates in metropolitan markets (including the Grand Rapids MSA and Detroit MSA), suburban markets and county seat markets in both western and southeastern Michigan FINANCIAL AND STRATEGIC DIVERSIFICATION – LOANS, REVENUES AND MA RKETS 1 2 3 5 • COFS has an impressive leadership team with a range of experiences from community and regional banks, accounting firms and technology companies that serve the banking industry, as well as individuals with regulatory backgrounds • Commercial lending team with deep customer and business relationships in the markets COFS serves • Emphasis on culture and core values has attracted loyal employees committed to growing professionally while serving their cus tom ers EXPERIENCED MANAGEMENT TEAM 4
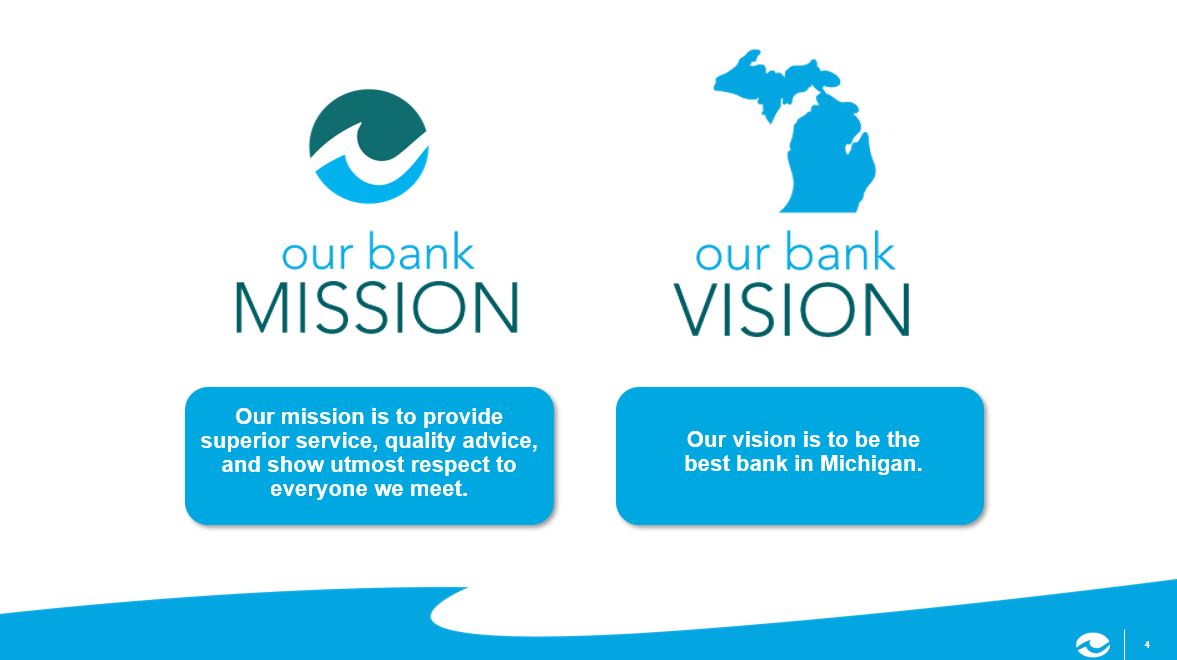
4 4 Our vision is to be the best bank in Michigan. Our mission is to provide superior service, quality advice, and show utmost respect to everyone we meet.
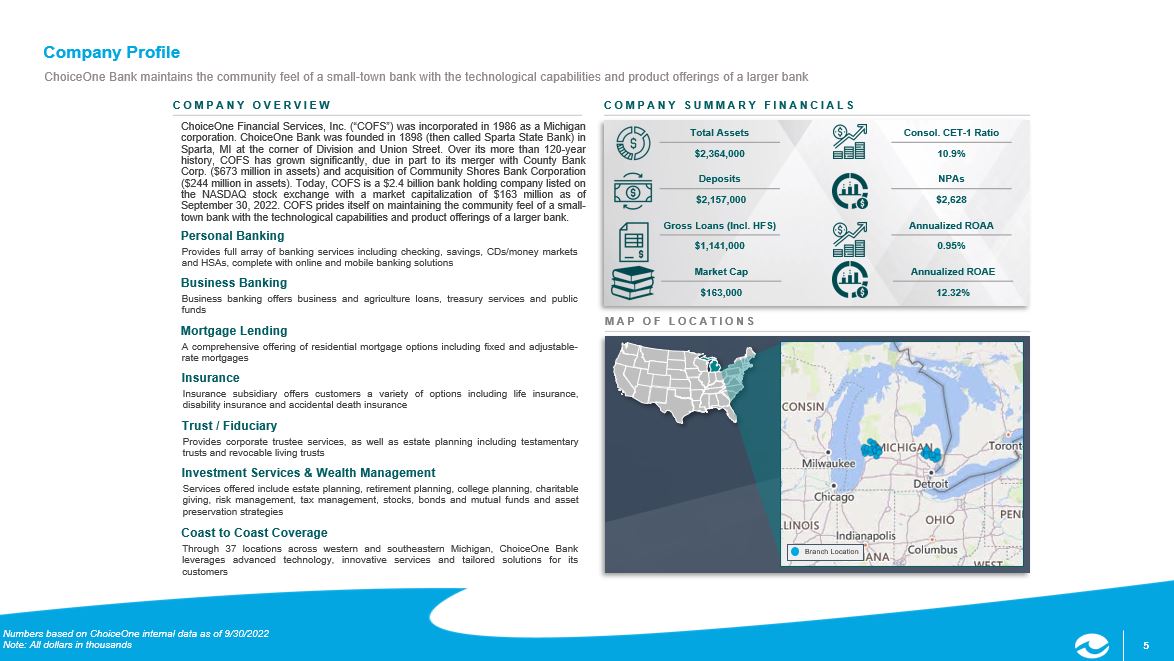
5 5 ChoiceOne Financial Services, Inc . (“COFS”) was incorporated in 1986 as a Michigan corporation . ChoiceOne Bank was founded in 1898 (then called Sparta State Bank) in Sparta, MI at the corner of Division and Union Street . Over its more than 120 - year history, COFS has grown significantly, due in part to its merger with County Bank Corp . ( $ 673 million in assets) and acquisition of Community Shores Bank Corporation ( $ 244 million in assets) . Today, COFS is a $ 2 . 4 billion bank holding company listed on the NASDAQ stock exchange with a market capitalization of $ 163 million as of September 30 , 2022 . COFS prides itself on maintaining the community feel of a small - town bank with the technological capabilities and product offerings of a larger bank . Company Profile ChoiceOne Bank maintains the community feel of a small - town bank with the technological capabilities and product offerings of a larger bank COMPANY OVERVIEW Personal Banking Provides full array of banking services including checking, savings, CDs/money markets and HSAs, complete with online and mobile banking solutions COMPANY SUMMARY FINANCIALS Total Assets $2,364,000 Deposits $2,157,000 Gross Loans (Incl. HFS) $1,141,000 Market Cap $163,000 Annualized ROAA 0.95% Annualized ROAE 12.32% Consol. CET - 1 Ratio 10.9% NPAs $2,628 MAP OF LOCATIONS Branch Location Numbers based on ChoiceOne internal data as of 9/30/2022 Note: All dollars in thousands Business Banking Business banking offers business and agriculture loans, treasury services and public funds Mortgage Lending A comprehensive offering of residential mortgage options including fixed and adjustable - rate mortgages Insurance Insurance subsidiary offers customers a variety of options including life insurance, disability insurance and accidental death insurance Trust / Fiduciary Provides corporate trustee services, as well as estate planning including testamentary trusts and revocable living trusts Investment Services & Wealth Management Services offered include estate planning, retirement planning, college planning, charitable giving, risk management, tax management, stocks, bonds and mutual funds and asset preservation strategies Coast to Coast Coverage Through 37 locations across western and southeastern Michigan, ChoiceOne Bank leverages advanced technology, innovative services and tailored solutions for its customers
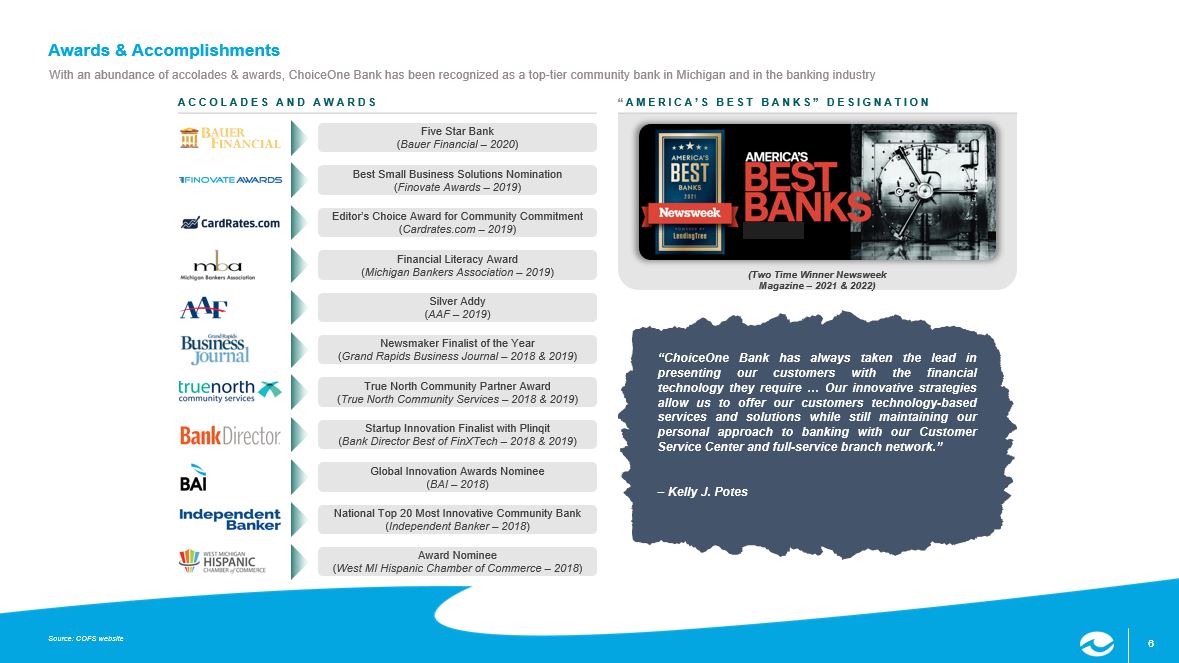
6 6 Five Star Bank ( Bauer Financial – 2020 ) Award Nominee ( West MI Hispanic Chamber of Commerce – 2018 ) Source: COFS website Awards & Accomplishments With an abundance of accolades & awards, ChoiceOne Bank has been recognized as a top - tier community bank in Michigan and in the banking industry ACCOLADES AND AWARDS “ AMERICA’S BEST BANKS” DESIGNATION (Two Time Winner Newsweek Magazine – 2021 & 2022) “ChoiceOne Bank has always taken the lead in presenting our customers with the financial technology they require … Our innovative strategies allow us to offer our customers technology - based services and solutions while still maintaining our personal approach to banking with our Customer Service Center and full - service branch network . ” – Kelly J . Potes National Top 20 Most Innovative Community Bank ( Independent Banker – 2018 ) Financial Literacy Award ( Michigan Bankers Association – 2019 ) Editor’s Choice Award for Community Commitment ( Cardrates.com – 2019 ) Best Small Business Solutions Nomination ( Finovate Awards – 2019 ) Global Innovation Awards Nominee ( BAI – 2018 ) Newsmaker Finalist of the Year ( Grand Rapids Business Journal – 2018 & 2019 ) True North Community Partner Award ( True North Community Services – 2018 & 2019 ) Silver Addy ( AAF – 2019 ) Startup Innovation Finalist with Plinqit ( Bank Director Best of FinXTech – 2018 & 2019 )
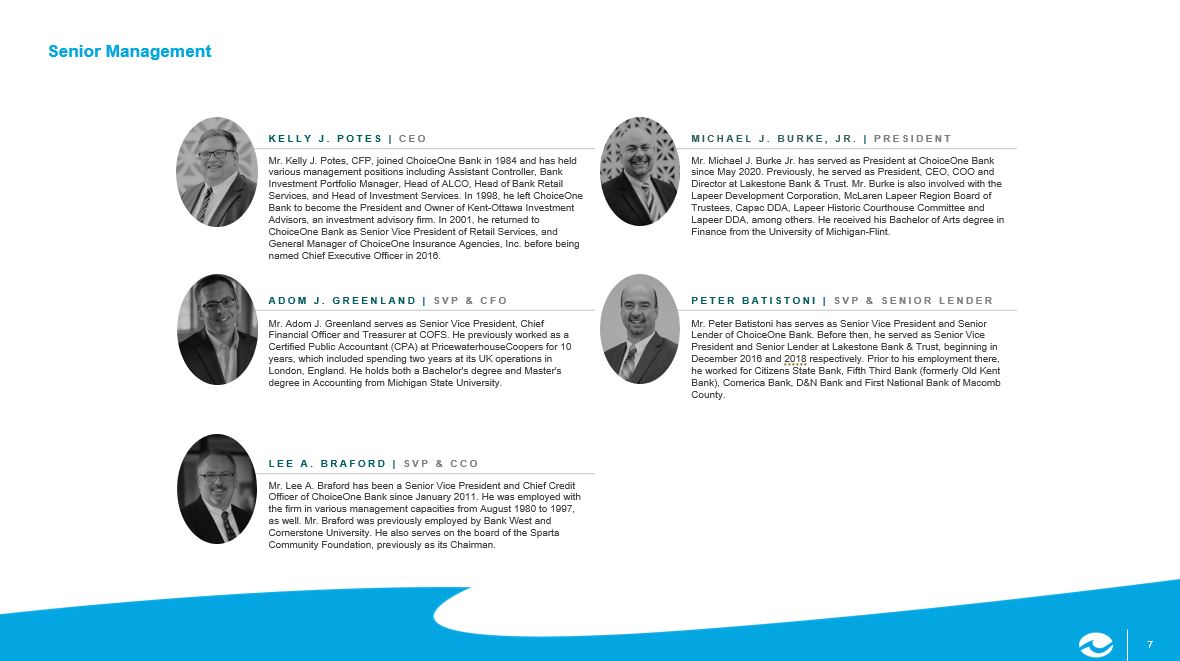
7 7 Mr. Peter Batistoni has serves as Senior Vice President and Senior Lender of ChoiceOne Bank. Before then, he served as Senior Vice President and Senior Lender at Lakestone Bank & Trust, beginning in December 2016 and 2018 respectively. Prior to his employment there, he worked for Citizens State Bank, Fifth Third Bank (formerly Old Kent Bank), Comerica Bank, D&N Bank and First National Bank of Macomb County. Mr. Michael J. Burke Jr. has served as President at ChoiceOne Bank since May 2020. Previously, he served as President, CEO, COO and Director at Lakestone Bank & Trust. Mr. Burke is also involved with the Lapeer Development Corporation, McLaren Lapeer Region Board of Trustees, Capac DDA, Lapeer Historic Courthouse Committee and Lapeer DDA, among others. He received his Bachelor of Arts degree in Finance from the University of Michigan - Flint. PETER BATISTONI | SVP & SENIOR LENDER MICHAEL J. BURKE, JR. | PRESIDENT Mr. Lee A. Braford has been a Senior Vice President and Chief Credit Officer of ChoiceOne Bank since January 2011. He was employed with the firm in various management capacities from August 1980 to 1997, as well. Mr. Braford was previously employed by Bank West and Cornerstone University. He also serves on the board of the Sparta Community Foundation, previously as its Chairman. Mr. Adom J. Greenland serves as Senior Vice President, Chief Financial Officer and Treasurer at COFS. He previously worked as a Certified Public Accountant (CPA) at PricewaterhouseCoopers for 10 years, which included spending two years at its UK operations in London, England. He holds both a Bachelor's degree and Master's degree in Accounting from Michigan State University. Mr. Kelly J. Potes, CFP, joined ChoiceOne Bank in 1984 and has held various management positions including Assistant Controller, Bank Investment Portfolio Manager, Head of ALCO, Head of Bank Retail Services, and Head of Investment Services. In 1998, he left ChoiceOne Bank to become the President and Owner of Kent - Ottawa Investment Advisors, an investment advisory firm. In 2001, he returned to ChoiceOne Bank as Senior Vice President of Retail Services, and General Manager of ChoiceOne Insurance Agencies, Inc. before being named Chief Executive Officer in 2016. ADOM J. GREENLAND | SVP & CFO LEE A. BRAFORD | SVP & CCO KELLY J. POTES | CEO Senior Management
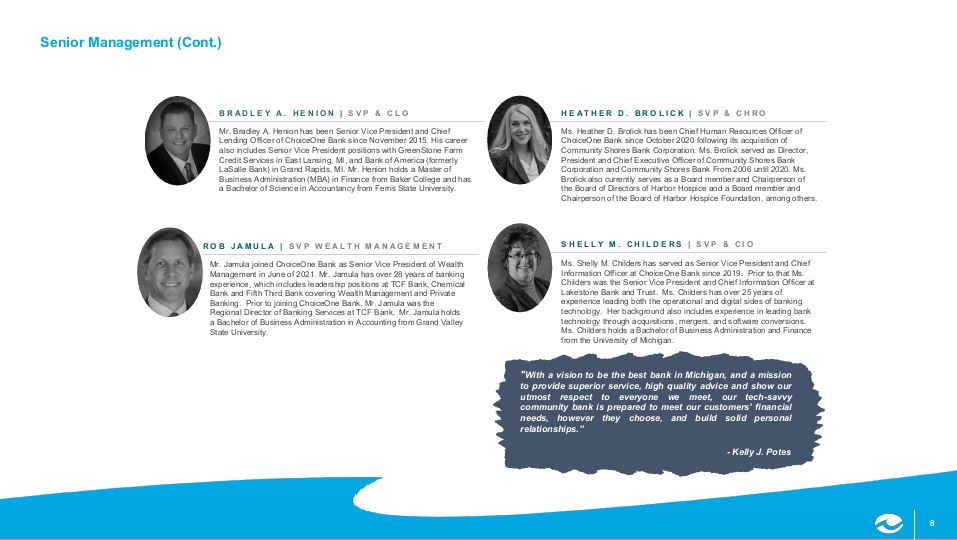
8 8 Ms. Shelly M. Childers has served as Senior Vice President and Chief Information Officer at ChoiceOne Bank since 2019. Prior to that Ms. Childers was the Senior Vice President and Chief Information Officer at Lakestone Bank and Trust. Ms. Childers has over 25 years of experience leading both the operational and digital sides of banking technology. Her background also includes experience in leading bank technology through acquisitions, mergers, and software conversions. Ms. Childers holds a Bachelor of Business Administration and Finance from the University of Michigan. " With a vision to be the best bank in Michigan, and a mission to provide superior service, high quality advice and show our utmost respect to everyone we meet, our tech - savvy community bank is prepared to meet our customers’ financial needs, however they choose, and build solid personal relationships . ” - Kelly J . Potes Mr. Jamula joined ChoiceOne Bank as Senior Vice President of Wealth Management in June of 2021. Mr. Jamula has over 28 years of banking experience, which includes leadership positions at TCF Bank, Chemical Bank and Fifth Third Bank covering Wealth Management and Private Banking. Prior to joining ChoiceOne Bank, Mr. Jamula was the Regional Director of Banking Services at TCF Bank. Mr. Jamula holds a Bachelor of Business Administration in Accounting from Grand Valley State University. Ms. Heather D. Brolick has been Chief Human Resources Officer of ChoiceOne Bank since October 2020 following its acquisition of Community Shores Bank Corporation. Ms. Brolick served as Director, President and Chief Executive Officer of Community Shores Bank Corporation and Community Shores Bank From 2006 until 2020. Ms. Brolick also currently serves as a Board member and Chairperson of the Board of Directors of Harbor Hospice and a Board member and Chairperson of the Board of Harbor Hospice Foundation, among others. Mr. Bradley A. Henion has been Senior Vice President and Chief Lending Officer of ChoiceOne Bank since November 2015. His career also includes Senior Vice President positions with GreenStone Farm Credit Services in East Lansing, MI, and Bank of America (formerly LaSalle Bank) in Grand Rapids, MI. Mr. Henion holds a Master of Business Administration (MBA) in Finance from Baker College and has a Bachelor of Science in Accountancy from Ferris State University. SHELLY M. CHILDERS | SVP & CIO HEATHER D. BROLICK | SVP & CHRO BRADLEY A. HENION | SVP & CLO Senior Management (Cont.) ROB JAMULA | SVP WEALTH MANAGEMENT
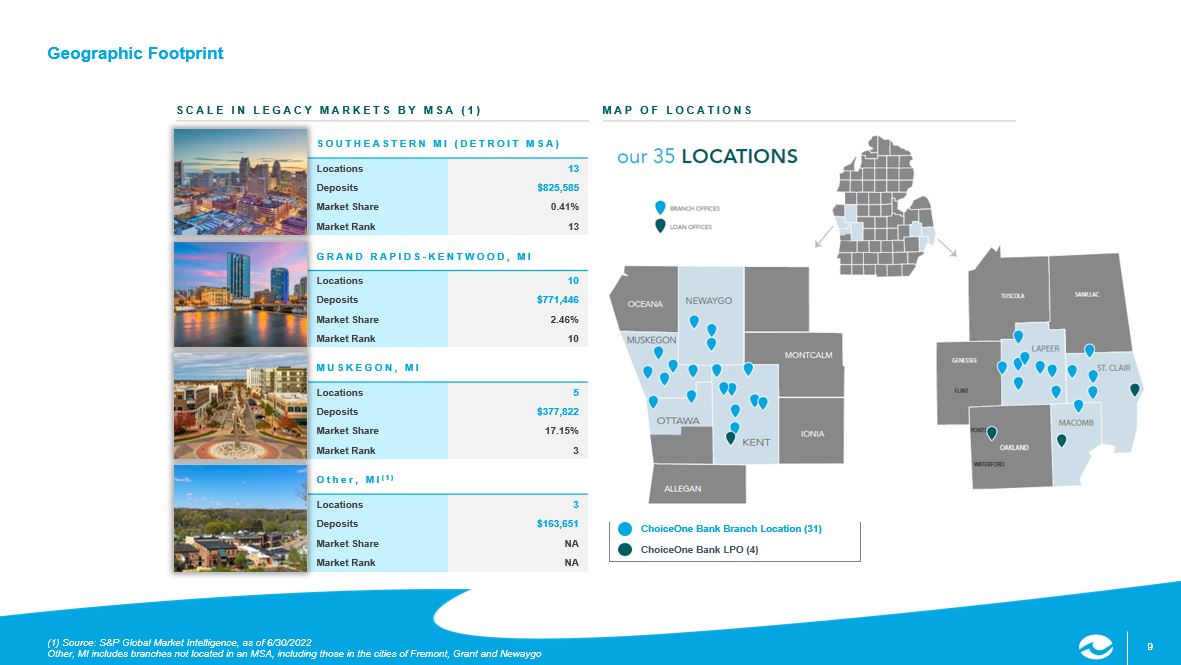
9 9 GRAND RAPIDS - KENTWOOD, MI Locations 10 Deposits $771,446 Market Share 2.46% Market Rank 10 SOUTHEASTERN MI (DETROIT MSA) Locations 13 Deposits $825,585 Market Share 0.41% Market Rank 13 MUSKEGON, MI Locations 5 Deposits $377,822 Market Share 17.15% Market Rank 3 Other, MI (1) Locations 3 Deposits $163,651 Market Share NA Market Rank NA Geographic Footprint MAP OF LOCATIONS SCALE IN LEGACY MARKETS BY MSA (1) ChoiceOne Bank Branch Location (31) (1) Source: S&P Global Market Intelligence, as of 6/30/2022 Other, MI includes branches not located in an MSA, including those in the cities of Fremont, Grant and Newaygo ChoiceOne Bank LPO (4)
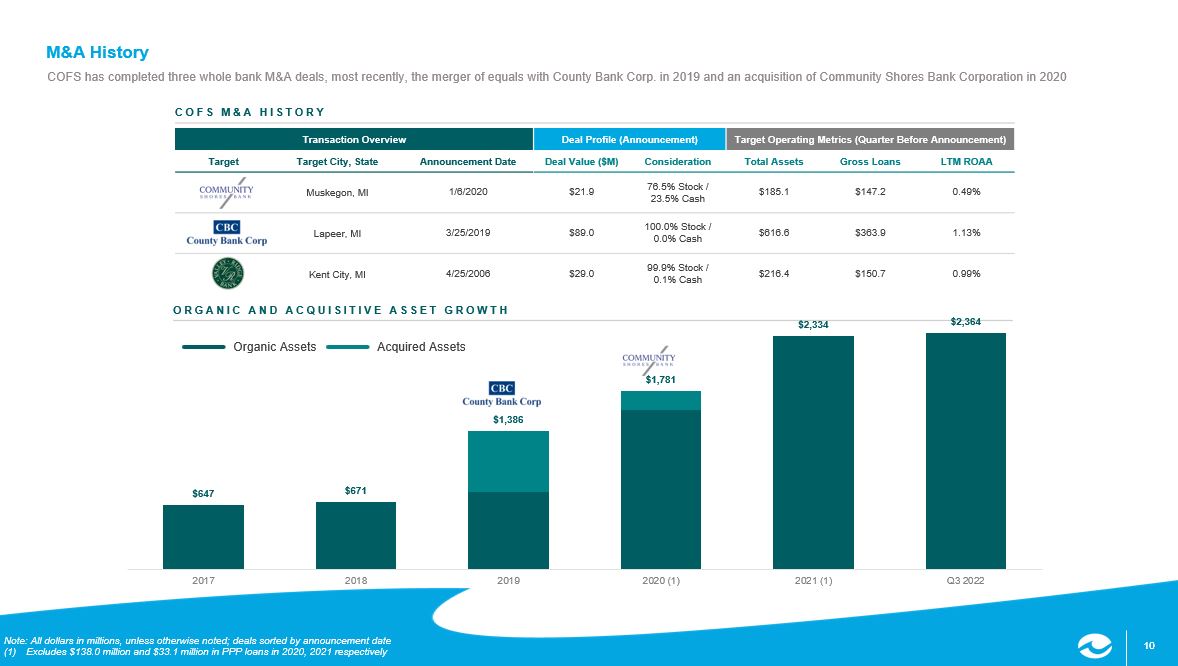
10 10 Transaction Overview Deal Profile (Announcement) Target Operating Metrics (Quarter Before Announcement) Target Target City, State Announcement Date Deal Value ($M) Consideration Total Assets Gross Loans LTM ROAA Muskegon, MI 1/6/2020 $21.9 76.5% Stock / 23.5% Cash $185.1 $147.2 0.49% Lapeer, MI 3/25/2019 $89.0 100.0% Stock / 0.0% Cash $616.6 $363.9 1.13% Kent City, MI 4/25/2006 $29.0 99.9% Stock / 0.1% Cash $216.4 $150.7 0.99% Note: All dollars in millions, unless otherwise noted; deals sorted by announcement date (1) Excludes $138.0 million and $33.1 million in PPP loans in 2020, 2021 respectively M&A History COFS has completed three whole bank M&A deals, most recently, the merger of equals with County Bank Corp. in 2019 and an acqu isi tion of Community Shores Bank Corporation in 2020 COFS M&A HISTORY ORGANIC AND ACQUISITIVE ASSET GROWTH Organic Assets Acquired Assets (1) $647 $671 $1,386 $1,781 $2,334 $2,364 2017 2018 2019 2020 (1) 2021 (1) Q3 2022
Financial Summary
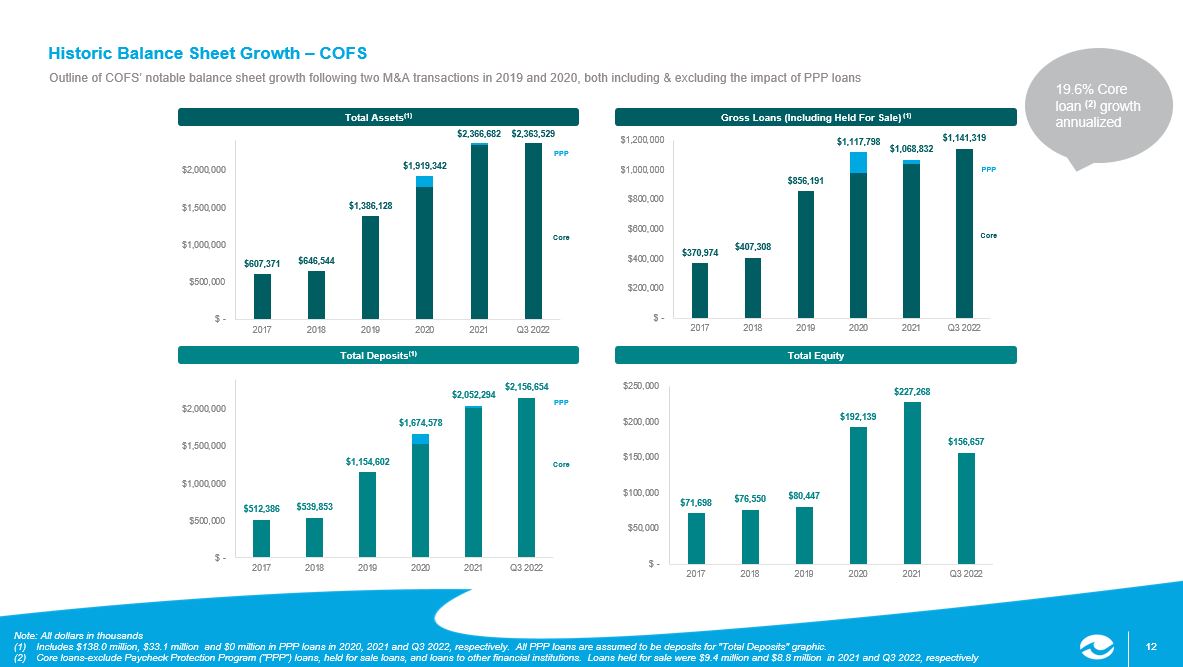
12 12 Note: All dollars in thousands (1) Includes $138.0 million, $33.1 million and $0 million in PPP loans in 2020, 2021 and Q3 2022, respectively. All PPP loans a re assumed to be deposits for "Total Deposits" graphic. (2) Core loans - exclude Paycheck Protection Program (“PPP”) loans, held for sale loans, and loans to other financial institutions. L oans held for sale were $9.4 million and $8.8 million in 2021 and Q3 2022, respectively Historic Balance Sheet Growth – COFS Outline of COFS’ notable balance sheet growth following two M&A transactions in 2019 and 2020, both including & excluding the im pact of PPP loans Total Equity Total Deposits (1) Gross Loans (Including Held For Sale) (1) Total Assets (1) PPP Core PPP Core PPP Core 19.6% Core loan (2) growth annualized $607,371 $646,544 $1,386,128 $1,919,342 $2,366,682 $2,363,529 $ - $500,000 $1,000,000 $1,500,000 $2,000,000 2017 2018 2019 2020 2021 Q3 2022 $370,974 $407,308 $856,191 $1,117,798 $1,068,832 $1,141,319 $ - $200,000 $400,000 $600,000 $800,000 $1,000,000 $1,200,000 2017 2018 2019 2020 2021 Q3 2022 $512,386 $539,853 $1,154,602 $1,674,578 $2,052,294 $2,156,654 $ - $500,000 $1,000,000 $1,500,000 $2,000,000 2017 2018 2019 2020 2021 Q3 2022 $71,698 $76,550 $80,447 $192,139 $227,268 $156,657 $ - $50,000 $100,000 $150,000 $200,000 $250,000 2017 2018 2019 2020 2021 Q3 2022
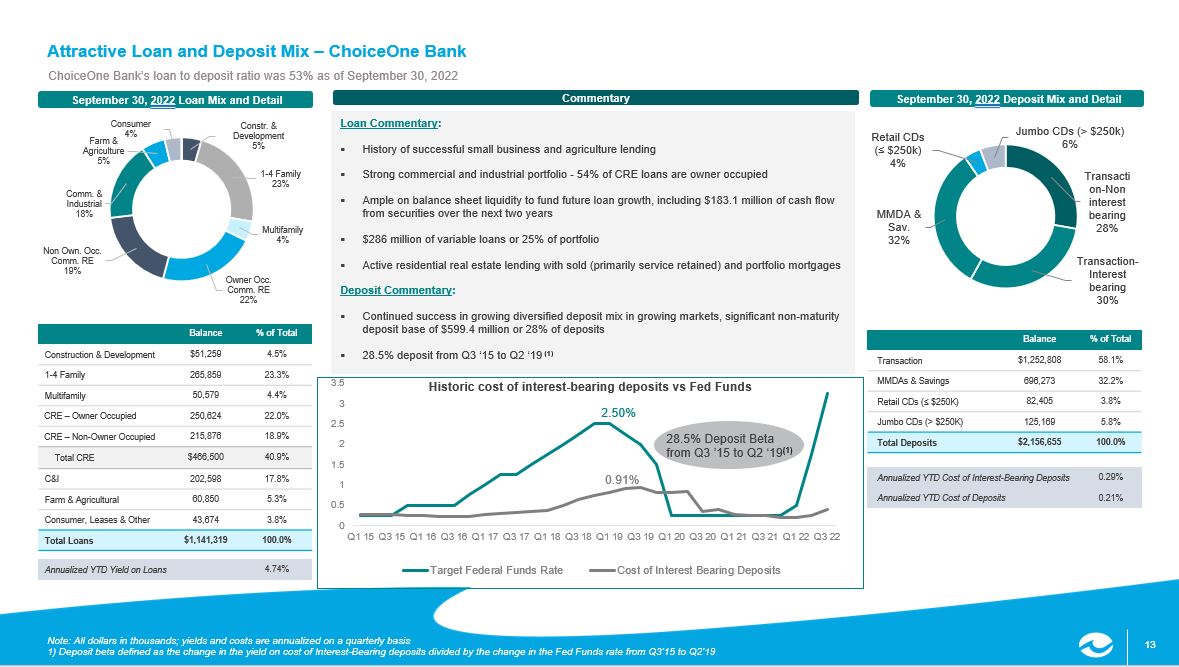
13 13 0 0.5 1 1.5 2 2.5 3 3.5 Q1 15 Q3 15 Q1 16 Q3 16 Q1 17 Q3 17 Q1 18 Q3 18 Q1 19 Q3 19 Q1 20 Q3 20 Q1 21 Q3 21 Q1 22 Q3 22 Target Federal Funds Rate Cost of Interest Bearing Deposits Loan Commentary : ▪ History of successful small business and agriculture lending ▪ Strong commercial and industrial portfolio - 54% of CRE loans are owner occupied ▪ Ample on balance sheet liquidity to fund future loan growth, including $183.1 million of cash flow from securities over the next two years ▪ $286 million of variable loans or 25% of portfolio ▪ Active residential real estate lending with sold (primarily service retained) and portfolio mortgages Deposit Commentary : ▪ Continued success in growing diversified deposit mix in growing markets, significant non - maturity deposit base of $599.4 million or 28% of deposits ▪ 28.5% deposit from Q3 ‘15 to Q2 ‘19 (1) Balance % of Total Construction & Development $51,259 4.5% 1 - 4 Family 265,859 23.3% Multifamily 50,579 4.4% CRE – Owner Occupied 250,624 22.0% CRE – Non - Owner Occupied 215,876 18.9% Total CRE $466,500 40.9% C&I 202,598 17.8% Farm & Agricultural 60,850 5.3% Consumer, Leases & Other 43,674 3.8% Total Loans $1,141,319 100.0% Annualized YTD Yield on Loans 4.74% September 30, 2022 Loan Mix and Detail September 30, 2022 Deposit Mix and Detail Note: All dollars in thousands; yields and costs are annualized on a quarterly basis 1) Deposit beta defined as the change in the yield on cost of Interest - Bearing deposits divided by the change in the Fed Funds r ate from Q3’15 to Q2’19 Attractive Loan and Deposit Mix – ChoiceOne Bank ChoiceOne Bank’s loan to deposit ratio was 53% as of September 30, 2022 Balance % of Total Transaction $1,252,808 58.1% MMDAs & Savings 696,273 32.2% Retail CDs (≤ $250K) 82,405 3.8% Jumbo CDs (> $250K) 125,169 5.8% Total Deposits $2,156,655 100.0% Annualized YTD Cost of Interest - Bearing Deposits 0.29% Annualized YTD Cost of Deposits 0.21% Commentary Constr. & Development 5% 1 - 4 Family 23% Multifamily 4% Owner Occ. Comm. RE 22% Non Own. Occ. Comm. RE 19% Comm. & Industrial 18% Farm & Agriculture 5% Consumer 4% 28.5% Deposit Beta from Q3 ’15 to Q2 ‘19 (1) 2.50% Transacti on - Non interest bearing 28% Transaction - Interest bearing 30% MMDA & Sav. 32% Retail CDs (≤ $250k) 4% Jumbo CDs (> $250k) 6% 0.91% Historic cost of interest - bearing deposits vs Fed Funds
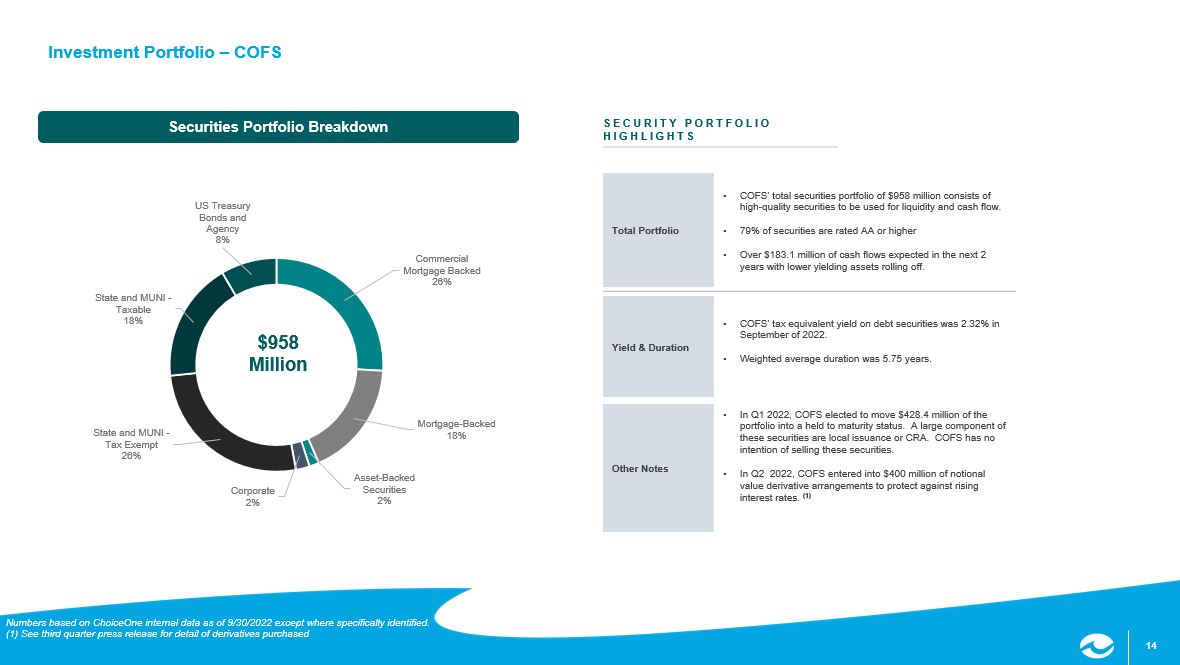
14 14 Commercial Mortgage Backed 26% Mortgage - Backed 18% Asset - Backed Securities 2% Corporate 2% State and MUNI - Tax Exempt 26% State and MUNI - Taxable 18% US Treasury Bonds and Agency 8% Numbers based on ChoiceOne internal data as of 9/30/2022 except where specifically identified. (1) See third quarter press release for detail of derivatives purchased Investment Portfolio – COFS Securities Portfolio Breakdown SECURITY PORTFOLIO HIGHLIGHTS $958 Million Total Portfolio • COFS’ total securities portfolio of $958 million consists of high - quality securities to be used for liquidity and cash flow. • 79% of securities are rated AA or higher • Over $183.1 million of cash flows expected in the next 2 years with lower yielding assets rolling off. Yield & Duration • COFS’ tax equivalent yield on debt securities was 2.32% in September of 2022. • Weighted average duration was 5.75 years. Other Notes • In Q1 2022, COFS elected to move $428.4 million of the portfolio into a held to maturity status. A large component of these securities are local issuance or CRA. COFS has no intention of selling these securities. • In Q2 2022, COFS entered into $400 million of notional value derivative arrangements to protect against rising interest rates . (1)AJG0
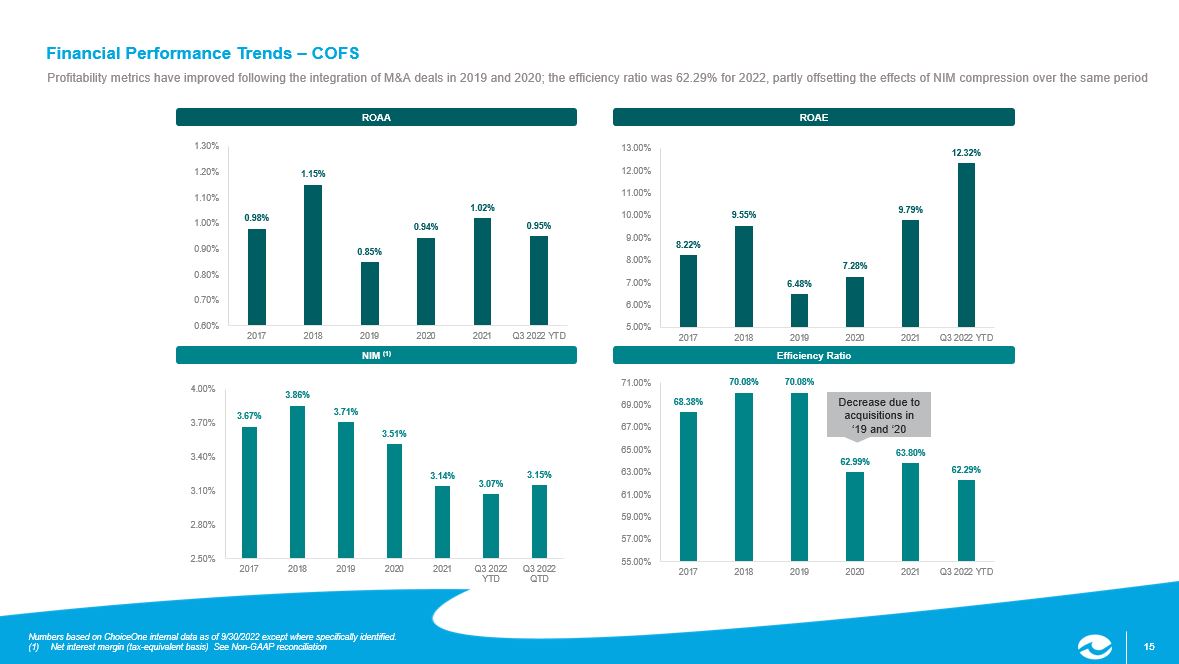
15 15 Financial Performance Trends – COFS Profitability metrics have improved following the integration of M&A deals in 2019 and 2020; the efficiency ratio was 62.29% for 2022, partly offsetting the effects of NIM compression over the same period Efficiency Ratio NIM (1) ROAE ROAA 0.98% 1.15% 0.85% 0.94% 1.02% 0.95% 0.60% 0.70% 0.80% 0.90% 1.00% 1.10% 1.20% 1.30% 2017 2018 2019 2020 2021 Q3 2022 YTD 68.38% 70.08% 70.08% 62.99% 63.80% 62.29% 55.00% 57.00% 59.00% 61.00% 63.00% 65.00% 67.00% 69.00% 71.00% 2017 2018 2019 2020 2021 Q3 2022 YTD Numbers based on ChoiceOne internal data as of 9/30/2022 except where specifically identified. (1) Net interest margin (tax - equivalent basis) See Non - GAAP reconciliation 3.67% 3.86% 3.71% 3.51% 3.14% 3.07% 3.15% 2.50% 2.80% 3.10% 3.40% 3.70% 4.00% 2017 2018 2019 2020 2021 Q3 2022 YTD Q3 2022 QTD Decrease due to acquisitions in ‘19 and ‘20 8.22% 9.55% 6.48% 7.28% 9.79% 12.32% 5.00% 6.00% 7.00% 8.00% 9.00% 10.00% 11.00% 12.00% 13.00% 2017 2018 2019 2020 2021 Q3 2022 YTD
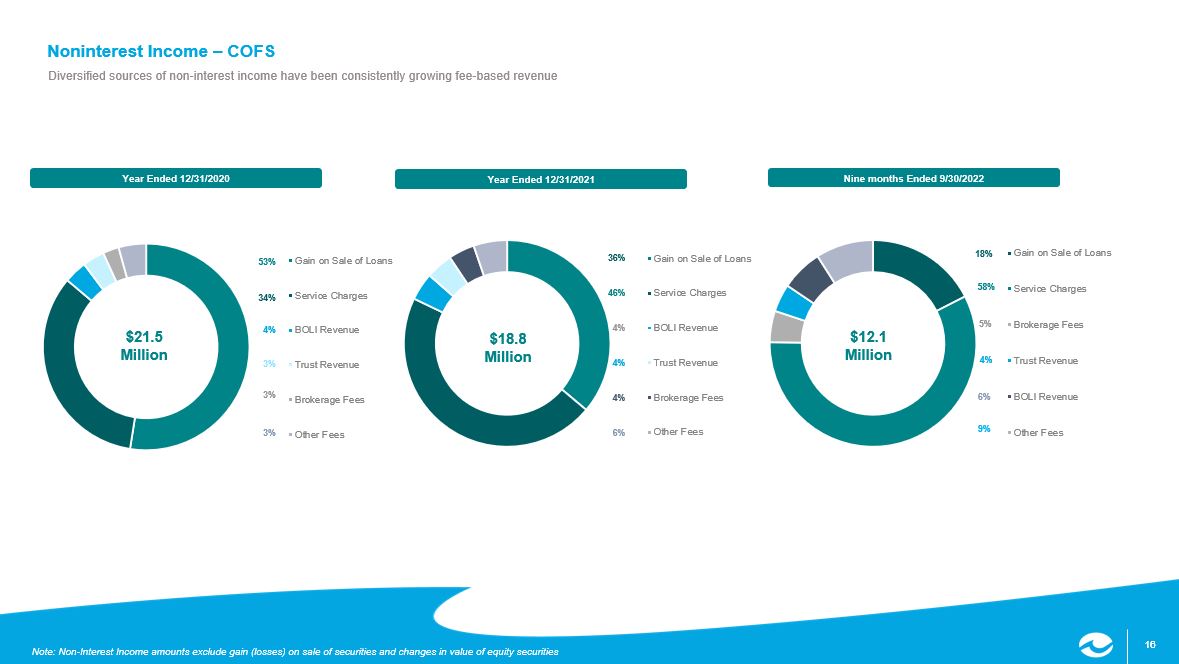
16 16 Gain on Sale of Loans Service Charges Brokerage Fees Trust Revenue BOLI Revenue Other Fees Gain on Sale of Loans Service Charges BOLI Revenue Trust Revenue Brokerage Fees Other Fees Gain on Sale of Loans Service Charges BOLI Revenue Trust Revenue Brokerage Fees Other Fees 36% 4% 4% 4% 6% 46% 53% 4% 3% 3% 3% 34% Note: Non - Interest Income amounts exclude gain (losses) on sale of securities and changes in value of equity securities Noninterest Income – COFS Diversified sources of non - interest income have been consistently growing fee - based revenue $21.5 Million Year Ended 12/31/2021 $18.8 Million Year Ended 12/31/2020 Nine months Ended 9/30/2022 $12.1 Million 18% 5% 4% 6% 9% 58%
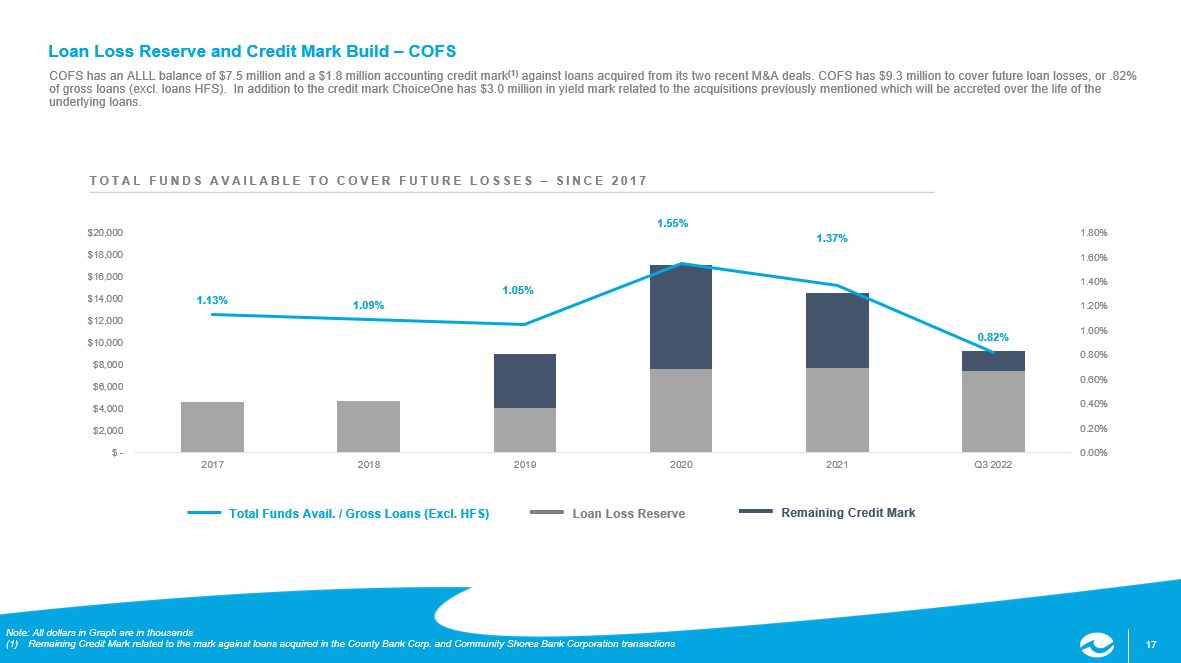
17 17 Note: All dollars in Graph are in thousands (1) Remaining Credit Mark related to the mark against loans acquired in the County Bank Corp. and Community Shores Bank Corporati on transactions Loan Loss Reserve and Credit Mark Build – COFS COFS has an ALLL balance of $7.5 million and a $1.8 million accounting credit mark (1) against loans acquired from its two recent M&A deals. COFS has $9.3 million to cover future loan losses, or .82% of gross loans (excl. loans HFS). In addition to the credit mark ChoiceOne has $3.0 million in yield mark related to the acq uis itions previously mentioned which will be accreted over the life of the underlying loans. TOTAL FUNDS AVAILABLE TO COVER FUTURE LOSSES – SINCE 2017 Total Funds Avail. / Gross Loans (Excl. HFS) Loan Loss Reserve Remaining Credit Mark 1.13% 1.09% 1.05% 1.55% 1.37% 0.82% 0.00% 0.20% 0.40% 0.60% 0.80% 1.00% 1.20% 1.40% 1.60% 1.80% $ - $2,000 $4,000 $6,000 $8,000 $10,000 $12,000 $14,000 $16,000 $18,000 $20,000 2017 2018 2019 2020 2021 Q3 2022
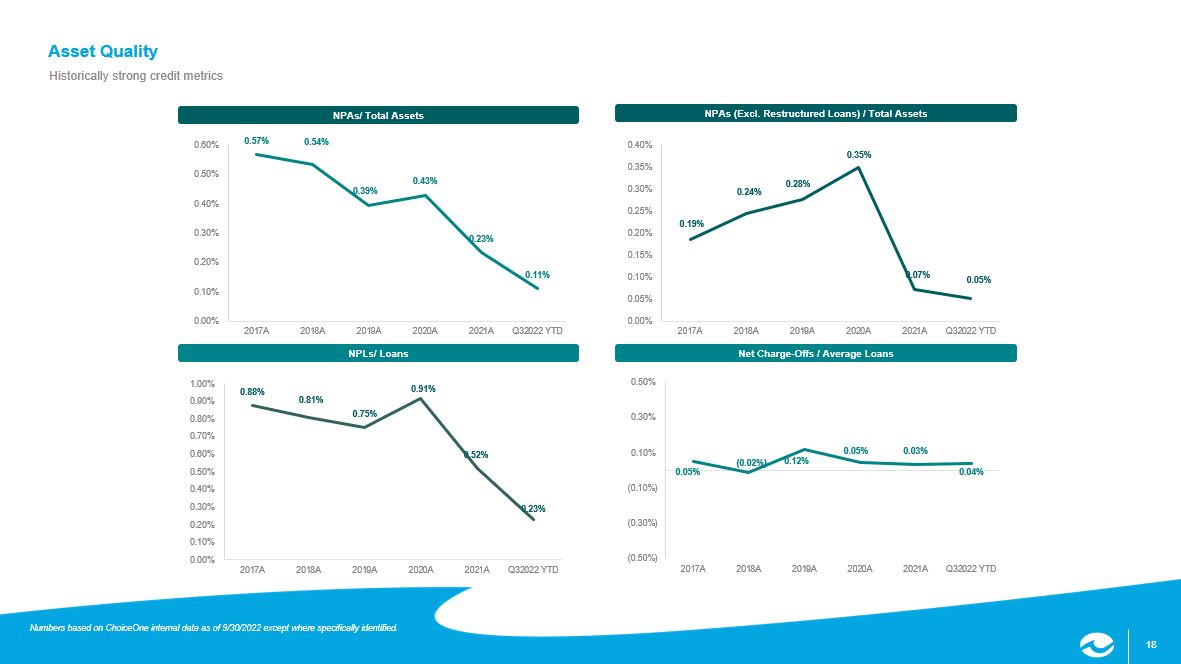
18 18 Asset Quality Historically strong credit metrics Net Charge - Offs / Average Loans NPLs/ Loans NPAs (Excl. Restructured Loans) / Total Assets NPAs/ Total Assets 0.19% 0.24% 0.28% 0.35% 0.07% 0.05% 0.00% 0.05% 0.10% 0.15% 0.20% 0.25% 0.30% 0.35% 0.40% 2017A 2018A 2019A 2020A 2021A Q32022 YTD 0.57% 0.54% 0.39% 0.43% 0.23% 0.11% 0.00% 0.10% 0.20% 0.30% 0.40% 0.50% 0.60% 2017A 2018A 2019A 2020A 2021A Q32022 YTD 0.88% 0.81% 0.75% 0.91% 0.52% 0.23% 0.00% 0.10% 0.20% 0.30% 0.40% 0.50% 0.60% 0.70% 0.80% 0.90% 1.00% 2017A 2018A 2019A 2020A 2021A Q32022 YTD Numbers based on ChoiceOne internal data as of 9/30/2022 except where specifically identified. 0.05% (0.02%) 0.12% 0.05% 0.03% 0.04% (0.50%) (0.30%) (0.10%) 0.10% 0.30% 0.50% 2017A 2018A 2019A 2020A 2021A Q32022 YTD
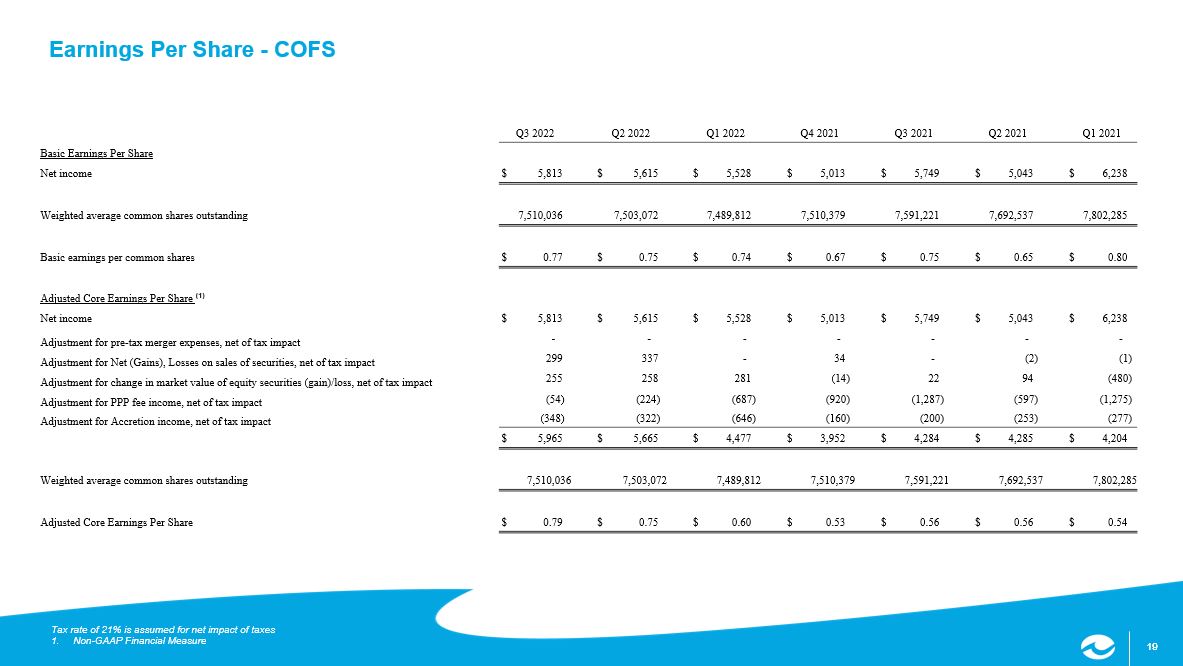
19 19 Earnings Per Share - COFS Tax rate of 21% is assumed for net impact of taxes 1. Non - GAAP Financial Measure Q3 2022 Q2 2022 Q1 2022 Q4 2021 Q3 2021 Q2 2021 Q1 2021 Basic Earnings Per Share Net income $ 5,813 $ 5,615 $ 5,528 $ 5,013 $ 5,749 $ 5,043 $ 6,238 Weighted average common shares outstanding 7,510,036 7,503,072 7,489,812 7,510,379 7,591,221 7,692,537 7,802,285 Basic earnings per common shares $ 0.77 $ 0.75 $ 0.74 $ 0.67 $ 0.75 $ 0.65 $ 0.80 Adjusted Core Earnings Per Share (1) Net income $ 5,813 $ 5,615 $ 5,528 $ 5,013 $ 5,749 $ 5,043 $ 6,238 Adjustment for pre - tax merger expenses, net of tax impact - - - - - - - Adjustment for Net (Gains), Losses on sales of securities, net of tax impact 299 337 - 34 - (2) (1) Adjustment for change in market value of equity securities (gain)/loss, net of tax impact 255 258 281 (14) 22 94 (480) Adjustment for PPP fee income, net of tax impact (54) (224) (687) (920) (1,287) (597) (1,275) Adjustment for Accretion income, net of tax impact (348) (322) (646) (160) (200) (253) (277) $ 5,965 $ 5,665 $ 4,477 $ 3,952 $ 4,284 $ 4,285 $ 4,204 Weighted average common shares outstanding 7,510,036 7,503,072 7,489,812 7,510,379 7,591,221 7,692,537 7,802,285 Adjusted Core Earnings Per Share $ 0.79 $ 0.75 $ 0.60 $ 0.53 $ 0.56 $ 0.56 $ 0.54
C OF S T R ADES ON TH E NAS D A Q ® Market Makers in ChoiceOne Stock D. A. Davidson & Co. Nick Bi cking 800.394.9230 Raymond James & Associates Anthony LanFranca 312.655.2961 Stifel, Nicolaus & Company, Inc. Paul Drueke 616.224.1553 Stock Registrar & Transfer Agent Continental Stock Transfer & Trust Company 1 State Street Plaza, 30th Floor New York, NY 10004 - 1561 212.509.4000 ChoiceOne trades on the NASDAQ S t ock E x change under its s ymbol, “COFS.”
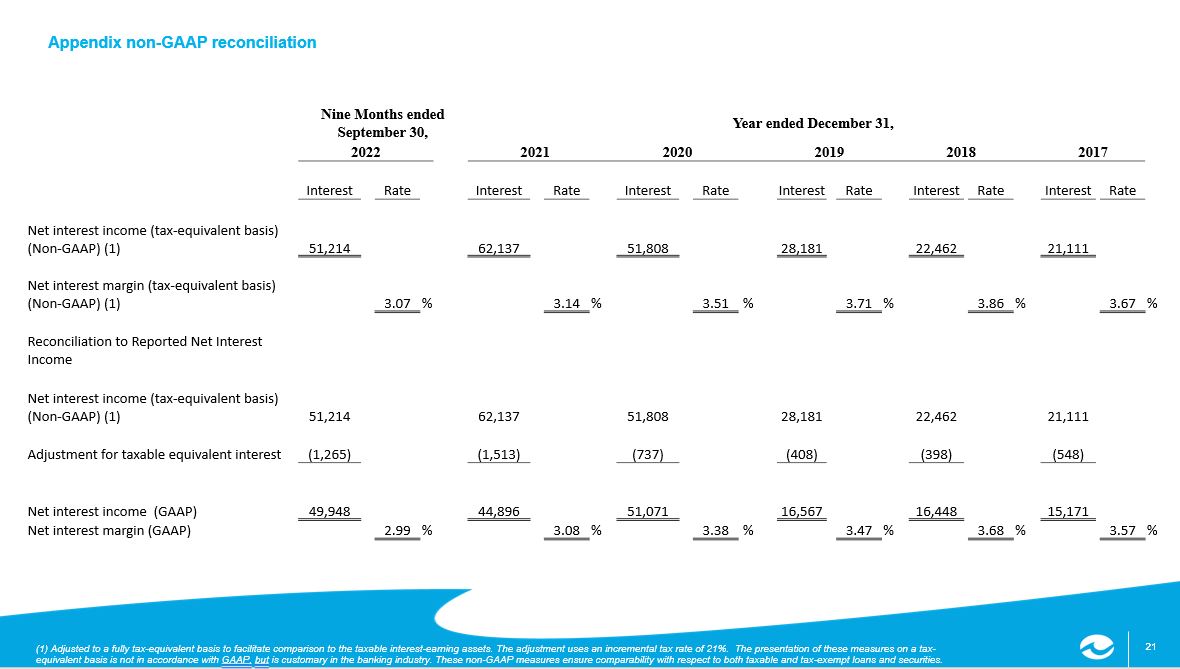
21 21 (1) Adjusted to a fully tax - equivalent basis to facilitate comparison to the taxable interest - earning assets. The adjustment use s an incremental tax rate of 21%. The presentation of these measures on a tax - equivalent basis is not in accordance with GAAP, but is customary in the banking industry. These non - GAAP measures ensure compar ability with respect to both taxable and tax - exempt loans and securities. Appendix non - GAAP reconciliation Nine Months ended September 30, Year ended December 31, 2022 2021 2020 2019 2018 2017 Interest Rate Interest Rate Interest Rate Interest Rate Interest Rate Interest Rate Net interest income (tax - equivalent basis) (Non - GAAP) (1) 51,214 62,137 51,808 28,181 22,462 21,111 Net interest margin (tax - equivalent basis) (Non - GAAP) (1) 3.07 % 3.14 % 3.51 % 3.71 % 3.86 % 3.67 % Reconciliation to Reported Net Interest Income Net interest income (tax - equivalent basis) (Non - GAAP) (1) 51,214 62,137 51,808 28,181 22,462 21,111 Adjustment for taxable equivalent interest (1,265) (1,513) (737) (408) (398) (548) Net interest income (GAAP) 49,948 44,896 51,071 16,567 16,448 15,171 Net interest margin (GAAP) 2.99 % 3.08 % 3.38 % 3.47 % 3.68 % 3.57 %
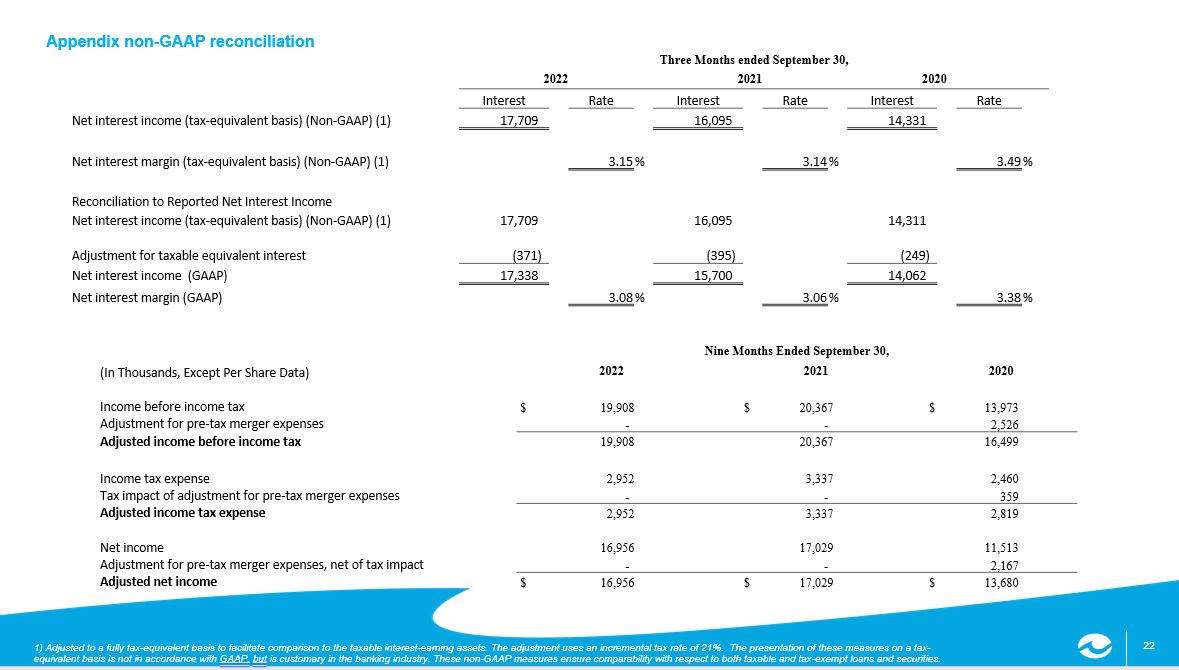
22 22 1) Adjusted to a fully tax - equivalent basis to facilitate comparison to the taxable interest - earning assets. The adjustment uses an incremental tax rate of 21%. The presentation of these measures on a tax - equivalent basis is not in accordance with GAAP, but is customary in the banking industry. These non - GAAP measures ensure compar ability with respect to both taxable and tax - exempt loans and securities. Appendix non - GAAP reconciliation Three Months ended September 30, 2022 2021 2020 Interest Rate Interest Rate Interest Rate Net interest income (tax - equivalent basis) (Non - GAAP) (1) 17,709 16,095 14,331 Net interest margin (tax - equivalent basis) (Non - GAAP) (1) 3.15 % 3.14 % 3.49 % Reconciliation to Reported Net Interest Income Net interest income (tax - equivalent basis) (Non - GAAP) (1) 17,709 16,095 14,311 Adjustment for taxable equivalent interest (371) (395) (249) Net interest income (GAAP) 17,338 15,700 14,062 Net interest margin (GAAP) 3.08 % 3.06 % 3.38 % Nine Months Ended September 30, (In Thousands, Except Per Share Data) 2022 2021 2020 Income before income tax $ 19,908 $ 20,367 $ 13,973 Adjustment for pre - tax merger expenses - - 2,526 Adjusted income before income tax 19,908 20,367 16,499 Income tax expense 2,952 3,337 2,460 Tax impact of adjustment for pre - tax merger expenses - - 359 Adjusted income tax expense 2,952 3,337 2,819 Net income 16,956 17,029 11,513 Adjustment for pre - tax merger expenses, net of tax impact - - 2,167 Adjusted net income $ 16,956 $ 17,029 $ 13,680