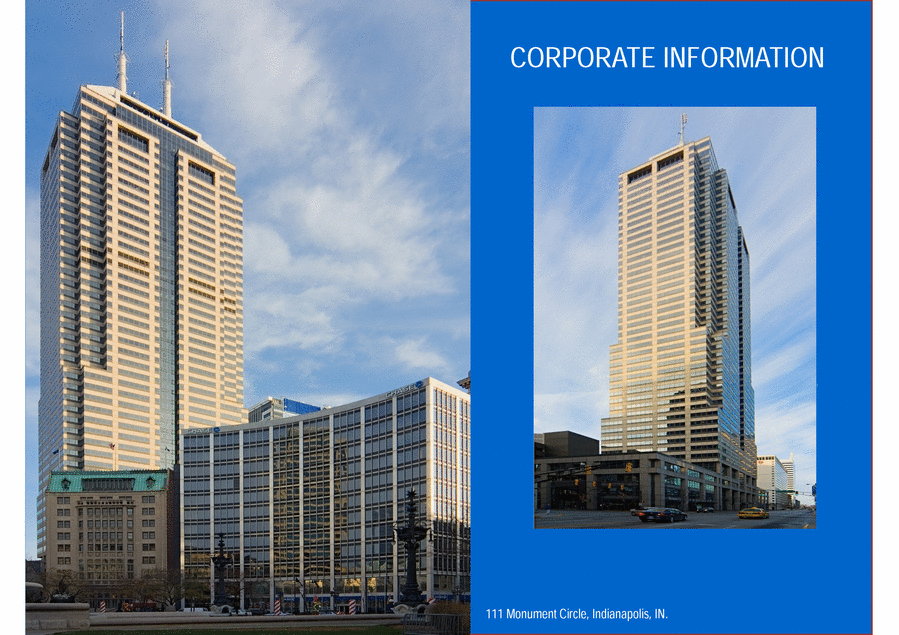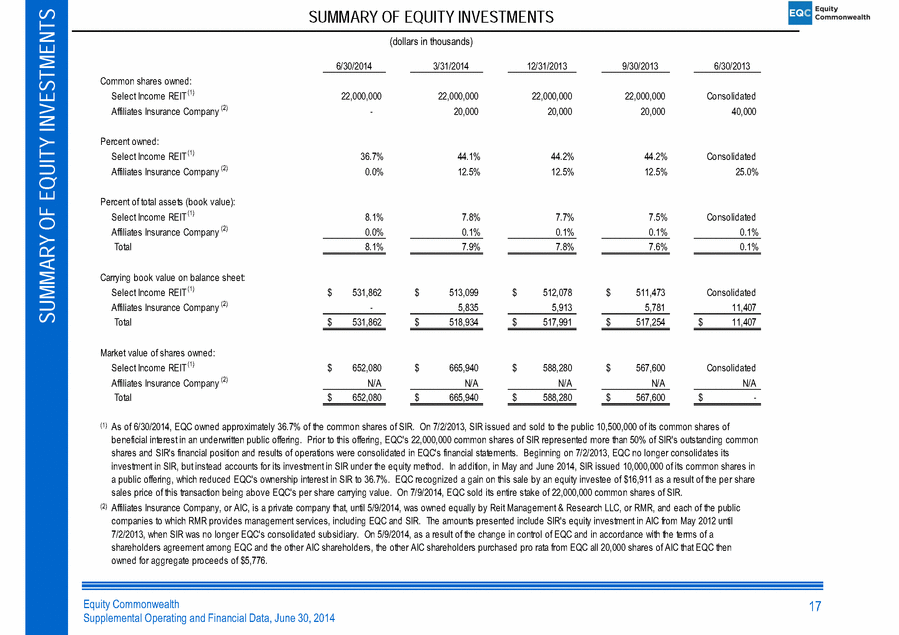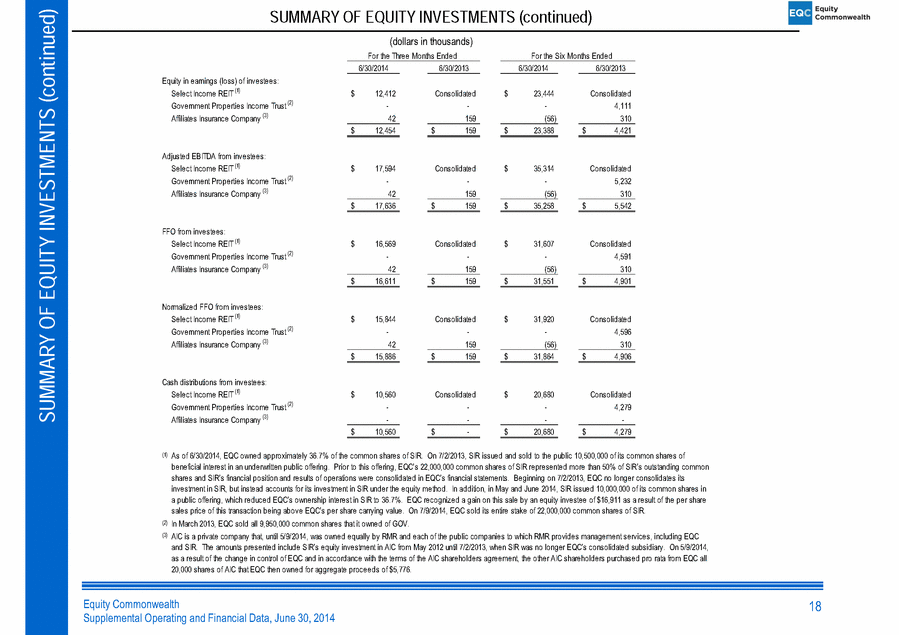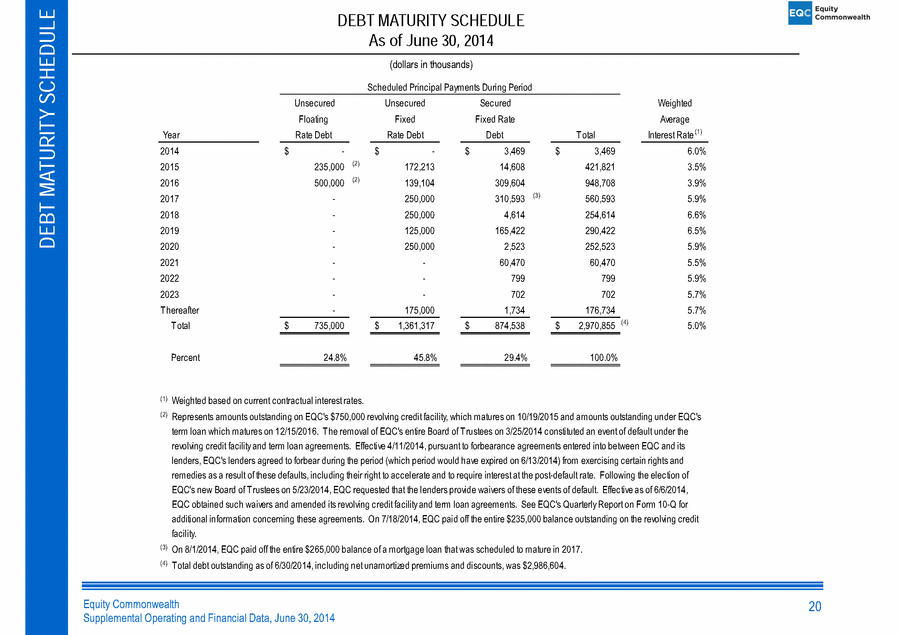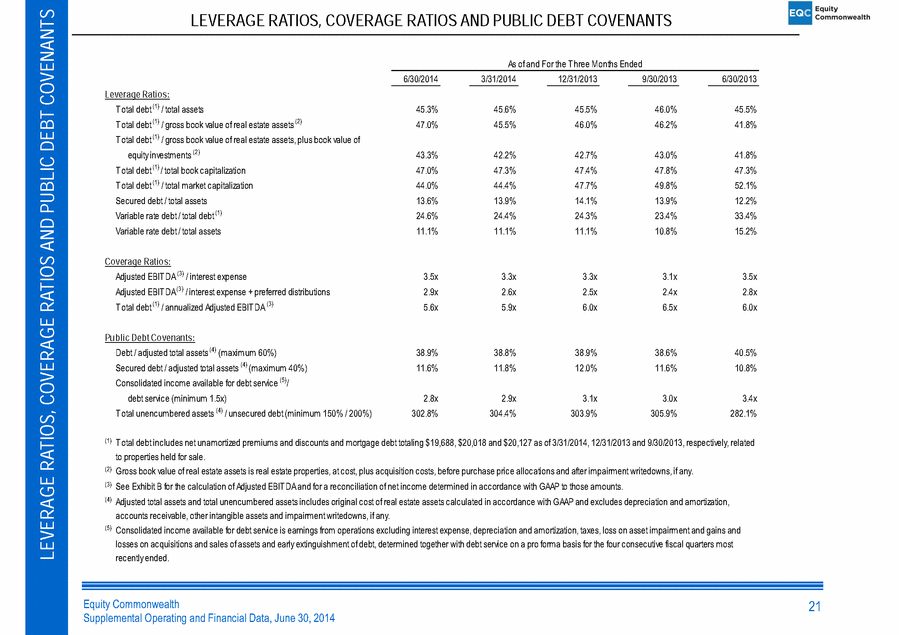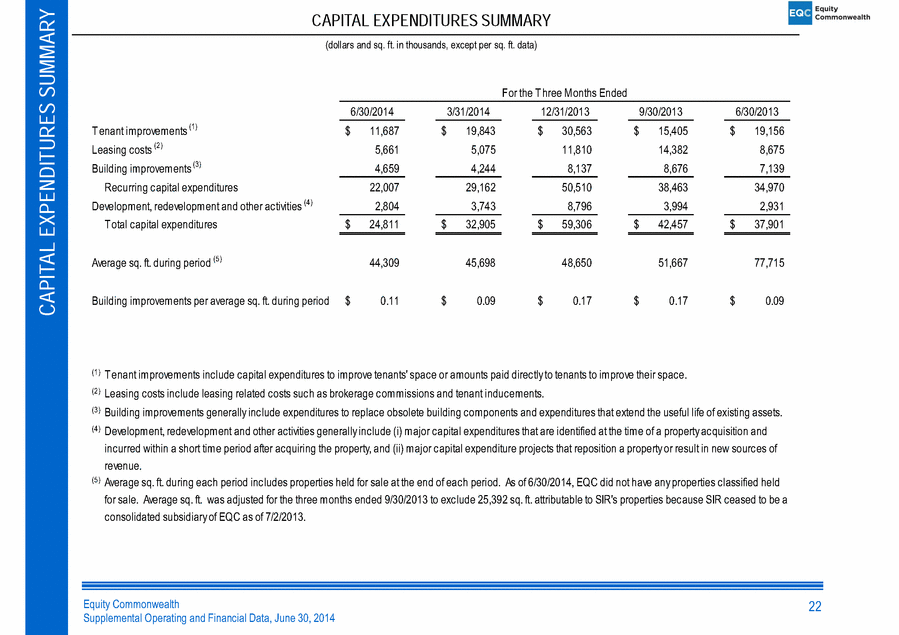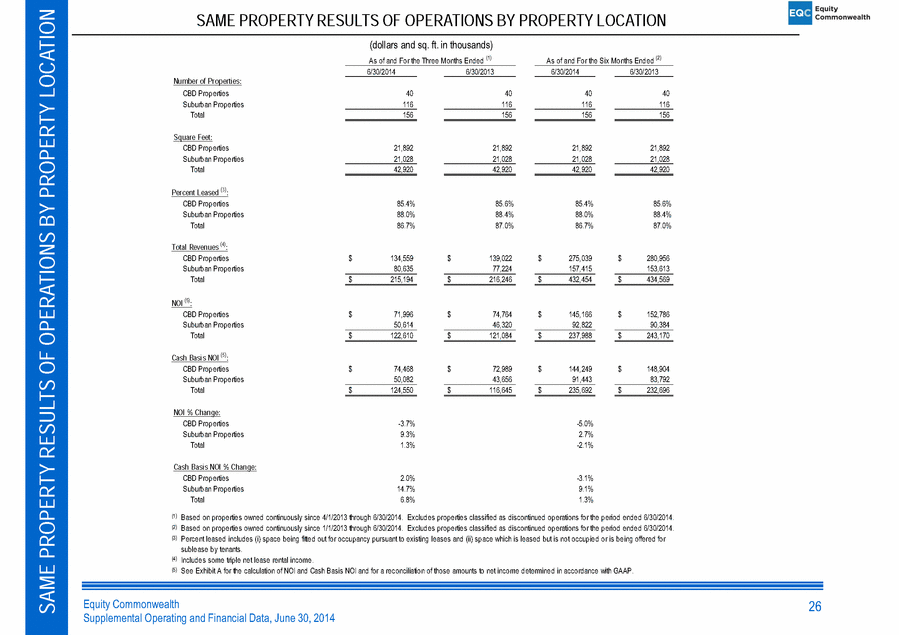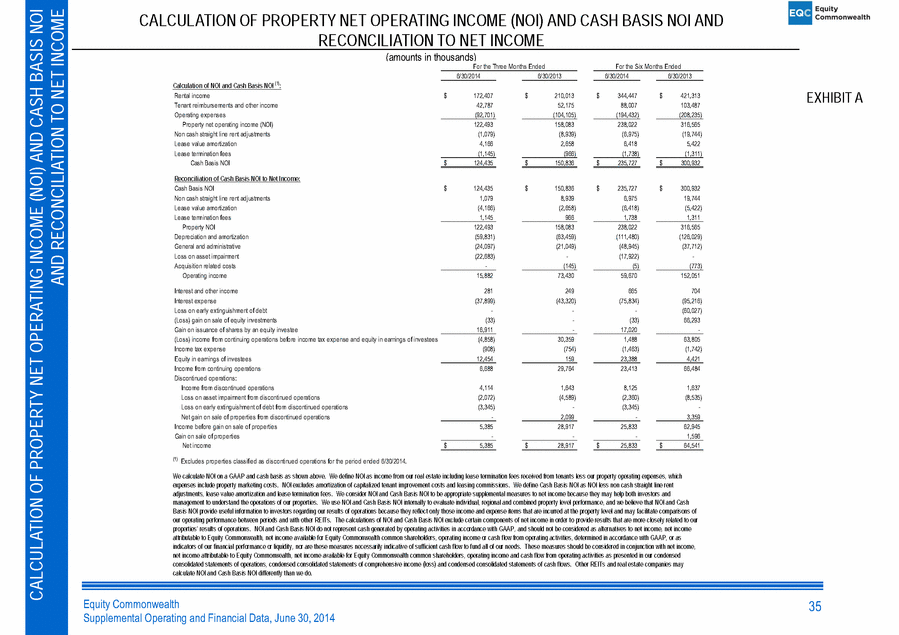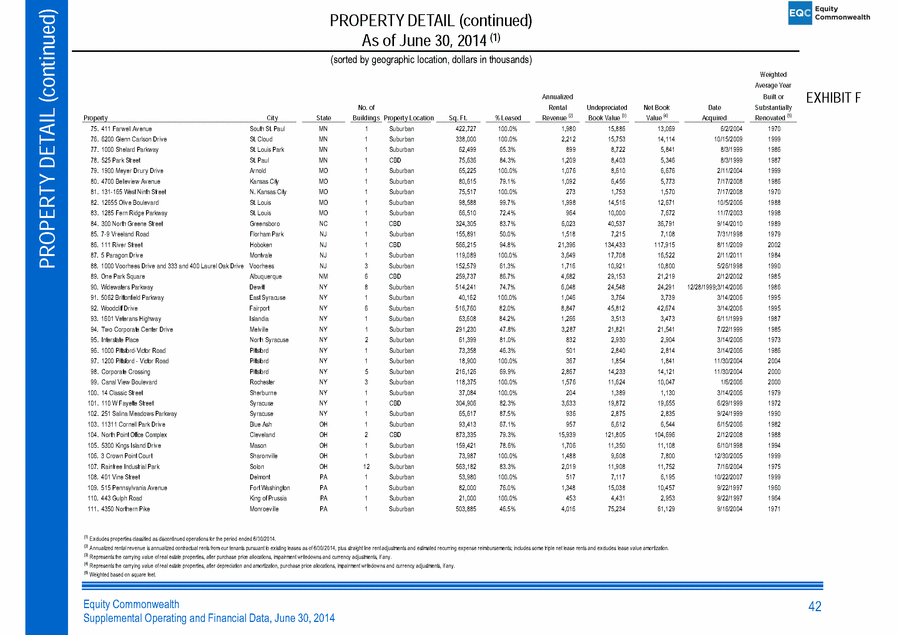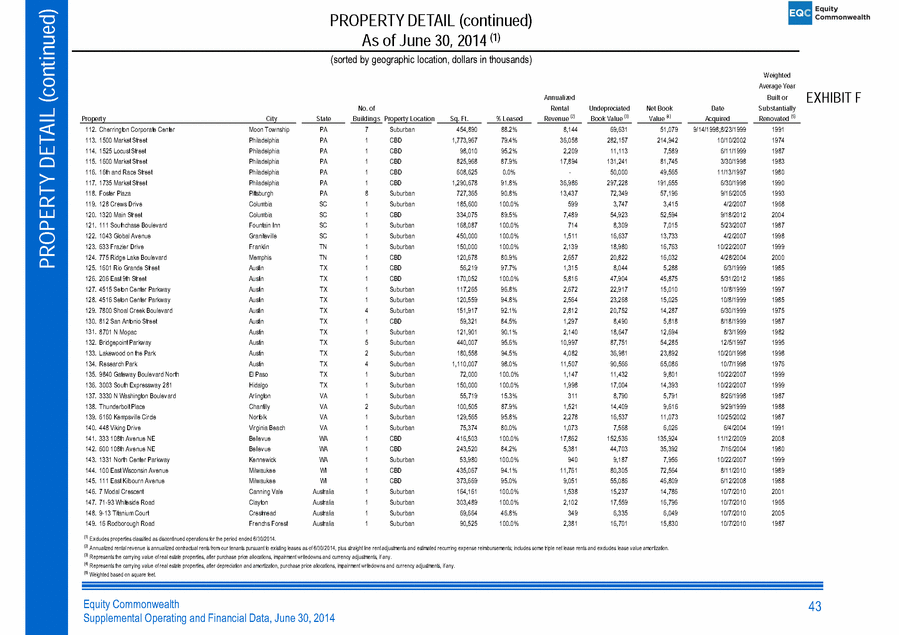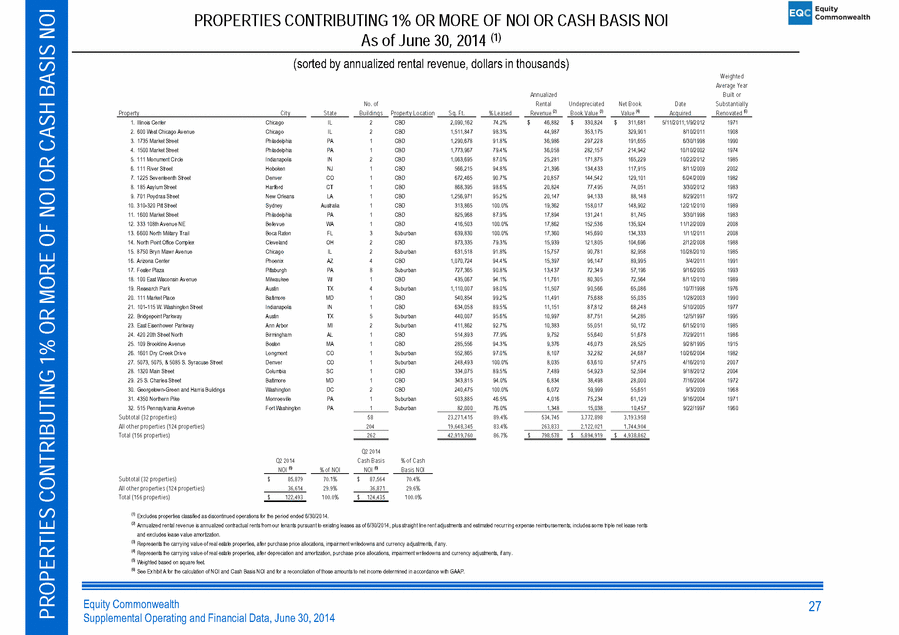
| Equity Commonwealth Supplemental Operating and Financial Data, June 30, 2014 PROPERTIES CONTRIBUTING 1% OR MORE OF NOI OR CASH BASIS NOI 27 PROPERTIES CONTRIBUTING 1% OR MORE OF NOI OR CASH BASIS NOI As of June 30, 2014 (1) (sorted by annualized rental revenue, dollars in thousands) Weighted Average Year Annualized Built or No. of Rental Undepreciated Net Book Date Substantially Property City State Buildings Property Location Sq. Ft. % Leased Revenue (2) Book Value (3) Value (4) Acquired Renovated (5) 1. Illinois Center Chicago IL 2 CBD 2,090,162 74.2% 46,882 $ 330,824 $ 311,681 $ 5/11/2011;1/9/2012 1971 2. 600 West Chicago Avenue Chicago IL 2 CBD 1,511,847 98.3% 44,987 353,175 329,901 8/10/2011 1908 3. 1735 Market Street Philadelphia PA 1 CBD 1,290,678 91.8% 36,986 297,228 191,655 6/30/1998 1990 4. 1500 Market Street Philadelphia PA 1 CBD 1,773,967 79.4% 36,058 282,157 214,942 10/10/2002 1974 5. 111 Monument Circle Indianapolis IN 2 CBD 1,063,695 87.0% 25,281 171,875 165,229 10/22/2012 1985 6. 111 River Street Hoboken NJ 1 CBD 566,215 94.8% 21,396 134,433 117,915 8/11/2009 2002 7. 1225 Seventeenth Street Denver CO 1 CBD 672,465 90.7% 20,857 144,542 129,101 6/24/2009 1982 8. 185 Asylum Street Hartford CT 1 CBD 868,395 98.6% 20,824 77,495 74,051 3/30/2012 1983 9. 701 Poydras Street New Orleans LA 1 CBD 1,256,971 95.2% 20,147 94,133 88,148 8/29/2011 1972 10. 310-320 Pitt Street Sydney Australia 1 CBD 313,865 100.0% 19,362 158,017 148,902 12/21/2010 1989 11. 1600 Market Street Philadelphia PA 1 CBD 825,968 87.9% 17,894 131,241 81,745 3/30/1998 1983 12. 333 108th Avenue NE Bellevue WA 1 CBD 416,503 100.0% 17,862 152,536 135,924 11/12/2009 2008 13. 6600 North Military Trail Boca Raton FL 3 Suburban 639,830 100.0% 17,360 145,690 134,333 1/11/2011 2008 14. North Point Office Complex Cleveland OH 2 CBD 873,335 79.3% 15,939 121,805 104,696 2/12/2008 1988 15. 8750 Bryn Mawr Avenue Chicago IL 2 Suburban 631,518 91.8% 15,757 90,781 82,958 10/28/2010 1985 16. Arizona Center Phoenix AZ 4 CBD 1,070,724 94.4% 15,397 96,147 89,995 3/4/2011 1991 17. Foster Plaza Pittsburgh PA 8 Suburban 727,365 90.8% 13,437 72,349 57,196 9/16/2005 1993 18. 100 East Wisconsin Avenue Milwaukee WI 1 CBD 435,067 94.1% 11,761 80,305 72,564 8/11/2010 1989 19. Research Park Austin TX 4 Suburban 1,110,007 98.0% 11,507 90,566 65,086 10/7/1998 1976 20. 111 Market Place Baltimore MD 1 CBD 540,854 99.2% 11,491 75,688 55,035 1/28/2003 1990 21. 101-115 W. Washington Street Indianapolis IN 1 CBD 634,058 89.5% 11,151 87,812 68,248 5/10/2005 1977 22. Bridgepoint Parkway Austin TX 5 Suburban 440,007 95.6% 10,997 87,751 54,285 12/5/1997 1995 23. East Eisenhower Parkway Ann Arbor MI 2 Suburban 411,862 92.7% 10,383 55,051 50,172 6/15/2010 1985 24. 420 20th Street North Birmingham AL 1 CBD 514,893 77.9% 9,752 55,640 51,678 7/29/2011 1986 25. 109 Brookline Avenue Boston MA 1 CBD 285,556 94.3% 9,376 46,073 28,525 9/28/1995 1915 26. 1601 Dry Creek Drive Longmont CO 1 Suburban 552,865 97.0% 8,107 32,282 24,687 10/26/2004 1982 27. 5073, 5075, & 5085 S. Syracuse Street Denver CO 1 Suburban 248,493 100.0% 8,035 63,610 57,475 4/16/2010 2007 28. 1320 Main Street Columbia SC 1 CBD 334,075 89.5% 7,489 54,923 52,594 9/18/2012 2004 29. 25 S. Charles Street Baltimore MD 1 CBD 343,815 94.0% 6,834 38,498 28,000 7/16/2004 1972 30. Georgetown-Green and Harris Buildings Washington DC 2 CBD 240,475 100.0% 6,072 59,999 55,651 9/3/2009 1968 31. 4350 Northern Pike Monroeville PA 1 Suburban 503,885 46.5% 4,016 75,234 61,129 9/16/2004 1971 32. 515 Pennsylvania Avenue Fort Washington PA 1 Suburban 82,000 76.0% 1,348 15,038 10,457 9/22/1997 1960 Subtotal (32 properties) 58 23,271,415 89.4% 534,745 3,772,898 3,193,958 All other properties (124 properties) 204 19,648,345 83.4% 263,833 2,122,021 1,744,904 Total (156 properties) 262 42,919,760 86.7% 798,578 $ 5,894,919 $ 4,938,862 $ Q2 2014 Q2 2014 Cash Basis % of Cash NOI (6) % of NOI NOI (6) Basis NOI Subtotal (32 properties) 85,879 $ 70.1% 87,564 $ 70.4% All other properties (124 properties) 36,614 29.9% 36,871 29.6% Total (156 properties) 122,493 $ 100.0% 124,435 $ 100.0% (1) Excludes properties classified as discontinued operations for the period ended 6/30/2014. (2) Annualized rental revenue is annualized contractual rents from our tenants pursuant to existing leases as of 6/30/2014, plus straight line rent adjustments and estimated recurring expense reimbursements; includes some triple net lease rents and excludes lease value amortization. (3) Represents the carrying value of real estate properties, after purchase price allocations, impairment writedowns and currency adjustments, if any. (4) Represents the carrying value of real estate properties, after depreciation and amortization, purchase price allocations, impairment writedowns and currency adjustments, if any. (5) Weighted based on square feet. (6) See Exhibit A for the calculation of NOI and Cash Basis NOI and for a reconciliation of those amounts to net income determined in accordance with GAAP. |