UNITED STATES
SECURITIES AND EXCHANGE COMMISSION
Washington, D.C. 20549
FORM N-CSR
CERTIFIED SHAREHOLDER REPORT
OF
REGISTERED MANAGEMENT INVESTMENT COMPANIES
Investment Company Act file number: 811-04875
Name of Registrant: Royce Value Trust, Inc.
Address of Registrant: 1414 Avenue of the Americas
New York, NY 10019
| Name and address of agent for service: | John E. Denneen, Esquire |
| | 1414 Avenue of the Americas |
| | New York, NY 10019 |
Registrant’s telephone number, including area code: (212) 486-1445
Date of fiscal year end: December 31
Date of reporting period: January 1, 2006 - December 31, 2006
Item 1: Reports to Shareholders
| |
|
| A N N U A L R E V I E W |
|
| |
Royce Value Trust
Royce Micro-Cap Trust
Royce Focus Trust
www.roycefunds.com
| | AND
R E P O R T T O S T O C K H O L D E R S
2006 |
| |
| | TheRoyceFunds |
| |
| |
VALUE INVESTING IN SMALL COMPANIES FOR MORE THAN 30 YEARS
|
A FEW WORDS ON CLOSED-END FUNDS
| | Royce & Associates, LLC manages three closed-end funds: Royce Value Trust, the first small-cap value closed-end fund offering; Royce Micro-Cap Trust, the only micro-cap closed-end fund; and Royce Focus Trust, a closed-end fund that invests in a limited number of primarily small-cap companies.
A closed-end fund is an investment company whose shares are listed on a stock exchange or are traded in the over-the-counter market. Like all investment companies, including open-end mutual funds, the assets of a closed-end fund are professionally managed in accordance with the investment objectives and policies approved by the fund’s Board of Directors. A closed-end fund raises cash for investment by issuing a fixed number of shares through initial and other public offerings that may include shelf offerings and periodic rights offerings. Proceeds from the offerings are invested in an actively managed portfolio of securities. Investors wanting to buy or sell shares of a publicly traded closed-end fund after the offerings must do so on a stock exchange or the Nasdaq market, as with any publicly traded stock. This is in contrast to open-end mutual funds, in which the fund sells and redeems its shares on a continuous basis.
| |
A CLOSED-END FUND OFFERS SEVERAL DISTINCT ADVANTAGES
NOT AVAILABLE FROM AN OPEN-END FUND STRUCTURE |
| |
• | |
Since a closed-end fund does not issue redeemable securities or offer its securities on a continuous basis, it does not need to liquidate securities or hold uninvested assets to meet investor demands for cash redemptions, as an open-end fund must.
| |
| | • | | In a closed-end fund, not having to meet investor redemption requests or invest at inopportune times is ideal for value managers who attempt to buy stocks when prices are depressed and sell securities when prices are high.
| |
| | • | | A closed-end fund may invest more freely in less liquid portfolio securities because it is not subject to potential stockholder redemption demands. This is particularly beneficial for Royce-managed closed-end funds, which invest in small- and micro-cap securities.
| |
| | • | | The fixed capital structure allows permanent leverage to be employed as a means to enhance capital appreciation potential.
| |
| | • | | Unlike Royce’s open-end funds, our closed-end funds are able to distribute capital gains on a quarterly basis. Each of the Funds has adopted a quarterly distribution policy for its common stock.
| |
| | We believe that the closed-end fund structure is very suitable for the long-term investor who understands the benefits of a stable pool of capital.
| |
WHY DIVIDEND REINVESTMENT IS IMPORTANT |
| |
A very important component of an investor’s total return comes from the reinvestment of distributions. By reinvesting distributions, our investors can maintain an undiluted investment in a Fund. To get a fair idea of the impact of reinvested distributions, please see the charts on pages 13, 15 and 17. For additional information on the Funds’ Distribution Reinvestment and Cash Purchase Options and the benefits for stockholders, please see page 19 or visit our website at www.roycefunds.com.
| |
| |
| THIS PAGE IS NOT PART OF THE 2006 ANNUAL REPORT TO STOCKHOLDERS | | |

| Annual Review | | |
|
| Performance Table | | 2 |
|
| Letter to Our Stockholders | | 3 |
|
| | |
|
| Annual Report to Stockholders | | 10 |
|
For more than 30 years, we have used a value approach to invest in smaller-cap securities. We focus primarily on the quality of a company’s balance sheet, its ability to generate free cash flow and other measures of profitability or sound financial condition. At times, we may also look at other factors, such as a company’s unrecognized asset values, its future growth prospects or its turnaround potential following an earnings disappointment or other business difficulties. We then use these factors to assess the company’s current worth, basing the assessment on either what we believe a knowledgeable buyer might pay to acquire the entire company, or what we think the value of the company should be in the stock market.
| |
| THIS PAGE IS NOT PART OF THE 2006 ANNUAL REPORT TO STOCKHOLDERS | 1 |

Charles M. Royce, President
During our security selection process,
we have historically focused on five
categories of risk: valuation,
business strategy, market, portfolio
and financial. Of these, financial
risk is probably the most important.
Small companies, by virtue of their
size, are generally more fragile than
large companies, which makes the
need for strong financial condition
paramount. But how do we evaluate
a company’s financial strength?
One of the most important steps
involves a careful scrutiny of the
balance sheet. This evaluation is as
much art as science, which is one way
of saying that the process entails a
number of subjective measures in
addition to more objective,
quantifiable ones. It is not simply the
numbers that tell the story, but one’s
interpretation of their significance.
Rather than concentrate primarily
on long-term debt, we search for
companies whose balance sheets
Continued on Page 4...
| | | |
| | | |
| | | | PERFORMANCE TABLE |
| | | |
|
| | | | | | | | | | | | | | | | | | | | | | | |
| | | | AVERAGE ANNUAL NAV TOTAL RETURNS Through December 31, 2006 |
| | | | | | | | Royce | | Royce | | | | Royce | | Russell |
| | | | | | | | Value Trust | | Micro-Cap Trust | | | | Focus Trust | | 2000 |
| | | | | | | | | | | | | | | | | | | | | | | |
| | | | Fourth Quarter 2006* | | | | 8.23 | % | | 10.07 | % | | | | | 11.17 | % | | 8.90 | % | | |
| | | | | | | | | | | | | | | | | | | | | | | |
| | | | July-December 2006* | | | | 8.99 | | | 9.74 | | | | | | 7.18 | | | 9.38 | | | |
| | | | | | | | | | | | | | | | | | | | | | | |
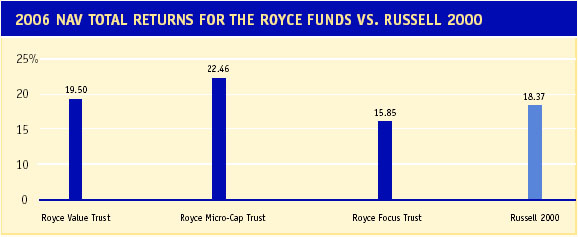
| | | | One-Year | | | | 19.50 | | | 22.46 | | | | | | 15.85 | | | 18.37 | | | |
| | | | | | | | | | | | | | | | | | | | | | | |
| | | | Three-Year | | | | 16.30 | | | 15.77 | | | | | | 19.42 | | | 13.56 | | | |
| | | | | | | | | | | | | | | | | | | | | | | |
| | | | Five-Year | | | | 13.32 | | | 15.78 | | | | | | 18.12 | | | 11.39 | | | |
| | | | | | | | | | | | | | | | | | | | | | | |
| | | | 10-Year | | | | 13.96 | | | 14.62 | | | | | | 14.09 | | | 9.44 | | | |
| | | | | | | | | | | | | | | | | | | | | | | |
| | | | 15-Year | | | | 14.14 | | | n/a | | | | | | n/a | | | 11.47 | | | |
| | | | | | | | | | | | | | | | | | | | | | | |
| | | | 20-Year | | | | 13.05 | | | n/a | | | | | | n/a | | | 10.92 | | | |
| | | | | | | | | | | | | | | | | | | | | | | |
| | | | Since Inception | | | | 12.99 | | | 14.58 | | | | | | 14.35 | | | — | | | |
| | | | | | | | | | | | | | | | | | | | | | | |
| | | | Inception Date | | | | 11/26/86 | | 12/14/93 | | | | 11/1/96** | — | | | |
| | | | * Not annualized. |
| | | | ** Date Royce & Associates, LLC assumed investment management responsibility for the Fund. |
| | | | | | | | | | | | | | | | | | | | | | | |
| | | | | | | | | | | | | | | | | | | | | | | |
| | | | | | | | | | | | | | | | | | | | | | | |
| | | | IMPORTANT PERFORMANCE AND RISK INFORMATION |
| | | | | | | | | | | | | | | | | | | | | | | |
| | | | All performance information in this Review and Report reflects past performance, is presented on a total return basis and reflects the reinvestment of distributions. Past performance is no guarantee of future results. Performance information does not reflect the deduction of taxes that a stockholder would pay on distributions or on the sale of Fund shares. Investment return and principal value of an investment will fluctuate, so that shares may be worth more or less than their original cost when sold. Current performance may be higher or lower than performance quoted. Current month-end performance may be obtained at www.roycefunds.com. The Royce Funds invest primarily in securities of small-cap and/or micro-cap companies, which may involve considerably more risk than investments in securities of larger-cap companies.
The thoughts expressed in this Review and Report to Stockholders concerning recent market movements and future prospects for small company stocks are solely the opinion of Royce at December 31, 2006, and, of course, historical market trends are not necessarily indicative of future market movements. Statements regarding the future prospects for particular securities held in the Funds’ portfolios and Royce’s investment intentions with respect to those securities reflect Royce’s opinions as of December 31, 2006 and are subject to change at any time without notice. There can be no assurance that securities mentioned in this Review and Report to Stockholders will be included in any Royce-managed portfolio in the future. |
| | | | |
2 | THIS PAGE IS NOT PART OF THE 2006 ANNUAL
REPORT TO STOCKHOLDERS | | | |
| | | | |
LETTER TO OUR STOCKHOLDERS
|
 |
All Things Must Pass . . .
As one year fades into permanent night and a new one greets its first day, talk naturally turns to transitions. The movement from 2006 to 2007 offered far more than a change in calendars to mark the passage of one period to another: The political landscape shifted as Republicans gave way to Democrats; the Federal Reserve Board moved from raising interest rates to a neutral stance; a growing economy slowed; and the real estate bubble either burst or began to leak, depending on where you live. None of these events was surprising in and of itself. One lesson that the asset management business repeatedly teaches is that change is the only constant. And the stock market was hardly immune from its own significant movements in 2006—though it changed in ways that we did not anticipate. While we had been calling for lower returns throughout the market, the Russell 2000 and Dow Jones Industrial Average both reached new highs in December. This was the year’s biggest surprise for us, since some of the conditions for a slump or slowdown in stock prices—most critically a slower-growth economy—had been present throughout much of 2006. Although returns were high across all asset classes, we saw what appeared to be a shift in market leadership after the long-term period of dynamic outperformance for small-cap stocks relative to their larger peers.
A possible shift in market leadership has admittedly been a bit of a preoccupation for us in our communications over the last couple of years. Yet 2006 ended without a clear sense of whether small- or large-cap stocks were leading the market into 2007. While small-cap (as measured by the Russell 2000) did better for the calendar-year period and led during the
|
|
We want to make it clear that we do not see disaster or long-term difficulties ahead for our chosen asset class. However, the recent period of outperformance for small-cap, particularly small-cap value, is subject to the same realities of cyclicality that ensure a limited stay at the top for any investment class or style.
|
|
THIS PAGE IS NOT PART OF THE 2006 ANNUAL REPORT TO STOCKHOLDERS | 3 |
| |
| |
show low leverage. We measure
leverage more broadly by looking at
the ratio of assets to stockholders’
equity. Using this method allows us
to note net changes in long- and
short-term debt, as well as in
accounts receivable. Items that can
have an adverse effect on a
company, such as higher-than-usual
levels of receivables or increasingly
bulging inventories, are not always
financed as long-term debt. This
type of examination paints what we
believe is a more complete picture.
Our general rule-of-thumb is to look
for a two-to-one ratio of assets to
stockholders’ equity for non-financial
companies. This represents
what we refer to as the company’s
“margin of safety.”
If a company is carrying too much
debt, it impedes its own ability to
meet the challenge of out-of-left-field
occurrences such as lawsuits
and overseas currency crises. A
conservatively capitalized company
can better weather these storms
because it has the necessary financial
reserves to do so, while a company
with too much debt on the balance
sheet runs a greater risk that stormy
weather will turn into a hurricane.
Continued on Page 6...
| | |
LETTER TO OUR STOCKHOLDERS
dynamic rallies that opened and closed the year, large-cap (as measured by the S&P 500) led during the second half of the year and from the previous high in May 2006 through the end of the year. We had guessed that large-cap would have a firmer grip on market leadership before December bade farewell, though we were more on target regarding the shift in market leadership than we were in expecting lower returns. In any case, the strong absolute returns of 2006 were welcome, though surprising, news, especially as they benefited smaller companies (to say nothing of Royce-managed portfolios). We’ll gladly exchange that for another forecast being partially incorrect.
The critical question for any investor is how best to deal with a new market-cycle phase that seems likely—to us, anyway—to be different from the last several years of strong returns and relative performance dominance for smaller stocks. We want to make it clear that we do not see disaster or long-term difficulties ahead for our chosen asset class. However, the recent period of outperformance for small-cap, particularly small-cap value, is subject to the same realities of cyclicality that ensure a limited stay at the top for any investment class or style. The last seven years were the reverse of the late ’90s, when large-cap stocks were enjoying a long period of relative outperformance and, within the small-cap universe, growth mostly outpaced value. Having noted that any market cycle contains a hidden expiration date, we remain optimistic about the prospects for small-cap stocks. Our security selection process does not divide the small-cap world into value and growth segments. More importantly, we currently see many companies that we regard as high-quality businesses that have not fully participated in the small-cap bull run. Our task remains what it has always been: to search throughout the small-cap world for what we think are great businesses trading at attractive stock prices.
It’s All Too Much After finishing 2005 with nearly identical returns, the small-cap Russell 2000 took back sole possession of the relative outperformance crown in 2006. The small-cap index gained 18.4% versus 15.8% for the S&P 500 and 9.5% for the Nasdaq Composite. Putting aside its calendar-year relative underperformance, it was a terrific year for large-cap stocks. The lion’s share of small-cap’s performance edge in 2006 occurred during the first quarter, a period during which the Russell 2000 gained an impressive 13.9%, compared to a relatively paltry gain of 4.2% for the S&P 500. However, during the less dynamic second (-5.0% versus -1.4%) and third quarters (+0.4% versus +5.7%), the Russell 2000 decisively trailed the large-cap index. Third-quarter strength was also key to large-cap’s advantage over its small-cap counterparts during the second half of the year: from 6/30/06 through 12/31/06, the Russell 2000 was up 9.4% versus a gain of 12.7% for the large-cap index. Small-cap managed to outpace the S&P 500 during the dynamic fourth quarter (+8.9% versus +6.7%), though the fourth quarter saw the large-cap index finally show a positive performance on a |
4 | THIS PAGE IS NOT PART OF THE 2006 ANNUAL
REPORT TO STOCKHOLDERS
| | |
|
total return basis from its peak established in March 2000. The S&P 500 also enjoyed its strongest calendar-year performance since 2003.
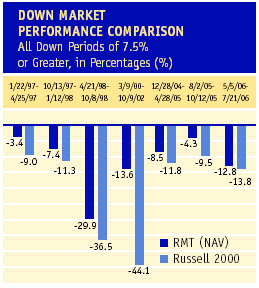
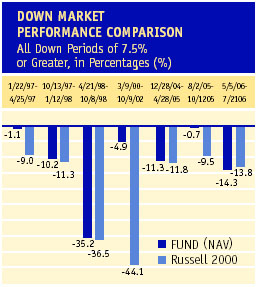
Equally important from our perspective—because of the emphasis we put on down-market performance—was the fact that large-cap also finished ahead of small-cap from the earlier peak on 5/5/06 through 12/31/06, up 8.4% versus 1.6% for the Russell 2000. In our estimation, these stronger performances in the down and relatively flat periods of 2006 provide the most accurate barometer of the market’s subsequent near-term direction. We continue to believe that where investors go when stock prices fall is a telling indicator of nascent market leadership. Last January, we surmised that small-cap was apt to lead in any bullish period, while large-cap would lead in any bearish market environment. By the end of the second quarter, we felt differently. Issues with the economy and contracting worldwide liquidity had us convinced that large-cap was likely to capture leadership in an uptick as well as a downturn, and this reasoning proved sound until the rally that sparked the fourth quarter. What was most surprising about the upswing near the end of 2006 was the strength of more speculative issues within small-cap during a period in which we thought that investors would be looking for more safety and less risk. Micro-cap companies, as measured by the Russell Microcap index, posted significant gains in both the first (+14.1%) and fourth quarters (+10.3%) of 2006, something paralleled by some of our own portfolios with significant micro-cap exposure. Whether this late surge indicated ongoing small-cap strength remains to be seen.
|
Long, Long, Long
It certainly seems that small-cap value has been leading its growth counterpart, as measured by the Russell 2000 Value and Russell 2000 Growth indices, for a long, long, long time. Two thousand six actually marked the third consecutive year of value’s outperformance and sixth out of the last seven. Unlike 2005, which saw a narrowing performance spread between small-cap value and growth, 2006 was a year in which value substantially outperformed growth within small-cap. The Russell 2000 Value index was up an impressive 23.5% for the calendar year, while the Russell 2000 Growth index posted a return of 13.4%, a respectable result on an absolute basis, but more than one thousand basis points behind its value sibling. This considerable advantage for small-cap value only widened its advantage over long-term time periods. The Russell 2000 Value index outgained the Russell 2000 Growth index for the one-, three-, five-, 10-, 15-, 20- and 25-year periods ended 12/31/06.
One interesting sidebar to the recent performance dominance of small-cap value has been its strength during upswings. It’s generally expected that value will prove its mettle during flat or down market periods, and this was certainly the case during the short-lived downdrafts of 2006, as small-cap value bested growth in the second (-2.7% versus -7.3%) and third quarters (+2.6%
|
|
What was most surprising about the upswing near the end of 2006 was the strength of more speculative issues within small-cap during a period in which we thought that investors would be looking for more safety and less risk.
|
|
THIS PAGE IS NOT PART OF THE 2006 ANNUAL REPORT TO STOCKHOLDERS | 5 |
| |
| |
| | |
LETTER TO OUR STOCKHOLDERS
|
| |
We also view financially strong
companies as well-positioned to
grow. The assets of these companies
are derived more from retained
earnings than paid-in capital; i.e.,
they have the ability to foster
growth out of their own success as
a business.
The balance sheet and its
accompanying footnotes and
schedules also reveal companies
whose businesses are conservatively
managed: debts are written off early,
LIFO inventories are used that may
understate profits, and asset
ownership and depreciation are the
norm as opposed to leasing. Such
practices give us critical insight into
the way a company operates. The
presence or absence of such items
tells us something about
management and their goals for
the company.
Other factors are also important to
risk-focused investment managers
like us. We ask certain questions as
we study annual reports and
financial statements: What is the
schedule for bad debt provision? Is
the company massaging earnings in
the short-term via advertising or
Continued on Page 8...
| | |
versus -1.8%). Yet small-cap value was also competitive in the first-quarter rally (+13.5% versus +14.4%), and actually held a slight advantage over small-cap growth in the similarly dynamic fourth quarter (+9.0% versus +8.8%). So while down- and flat-market returns were key to outperformance in the calendar year, strong absolute results in short-term upticks also helped the Russell 2000 Value index hang on to its significant performance edge in 2006.
You’re Asking Me, “Will My Fund Grow?” We were very pleased with the strong absolute returns for our three closed-end portfolios in 2006. On a relative basis, both Royce Value Trust and Royce Micro-Cap Trust outgained the Russell 2000 on a net asset value (NAV) basis, while Royce Focus Trust came up short versus the small-cap index. All three Funds outperformed the Russell 2000 on a market price basis in 2006, and each Fund finished the year with a flourish in the form of a strong fourth quarter. This was the case for the small-cap universe as a whole, with micro-cap stocks finishing a bit stronger than their small-cap peers. Although Royce Value Trust and Royce Micro-Cap Trust each hold an ample number of micro-cap names, Royce Focus Trust has much less exposure. However, its relative underperformance came not in the fourth quarter (in which it outperformed the Russell 2000 on both an NAV and market price basis), but in the bearish second quarter. Its fourth-quarter strength was all the more notable considering the lack of micro-cap names.
Although there are important differences among all three of our closed-end portfolios, each had similar sector strength in 2006. Industrial Products and Technology holdings as a group did well in all three Funds on a dollar basis, posting the largest net gains in each portfolio. The worldwide construction boom continued to benefit many Industrial Products holdings in the metal fabrication and machinery industries. In Technology, successes could be found in several industries, including internet software and services, IT services, and (in RVT and FUND) components and systems. Within the Natural Resources sector, precious metals and mining companies saw a resurgence late in the year and were among the top beneficiaries of the overall market rally during the fourth quarter.
|
6 | THIS PAGE IS NOT PART OF THE 2006 ANNUAL
REPORT TO STOCKHOLDERS
| |
Dark Horse
As it relates to stock-market investing, quality is conventionally defined as a company’s ability to generate consistent growth in earnings and dividends over long-term time periods. It’s a definition that we agree with in large part. Some stock market observers, however, also hold that quality is the near-exclusive province of large-cap companies, mostly because their size and multiple lines of business are thought to make them less risky. By contrast, small-cap companies have traditionally been regarded as more volatile and speculative, and thus lacking the greater level of safety of their larger-cap cohorts. Here, of course, we part company with the conventional wisdom. We have always found quality companies in the small-cap world, and over the years have cultivated a pronounced preference for high-quality small-cap businesses.
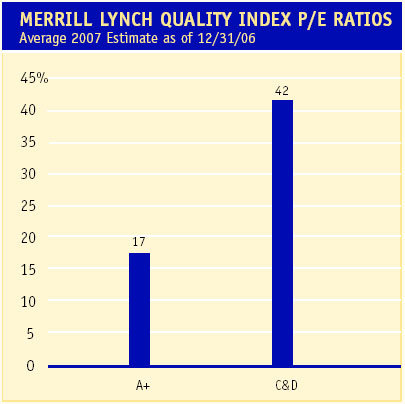
Why is this significant now? We think that in the current economic and stock-market cycles, high-quality companies offer investors several advantages, especially when compared to lower-quality stocks. Economic growth has slowed, corporate profit growth has likely peaked, and global liquidity has shown signs of contracting. Traditionally, more modest economic growth, coupled with an erosion of excess global liquidity, has favored higher quality stocks, as money flows to safer investments. Although it may seem surprising in light of small-cap value’s recent results, many high-quality small-cap stocks look attractively undervalued to us in the current market climate. Moving the capitalization parameters beyond small-cap, quality still appears undervalued. According to the Merrill Lynch Quantitative Strategy Quality Indices, the highest quality stocks (those with “A+” ratings) had an average forward price to earnings ratio of 17 times 2007 earnings, while the lowest quality stocks (those with “C” or “D” ratings) traded at an average 42 times 2007 earnings at the end of December 2006 (See the chart below).
We have always believed that smaller companies with sound fundamentals should deliver strong absolute returns over the long term, especially when purchased at attractively low prices (a critical element in our security selection process). Our quest for quality typically begins with an examination of a company’s historical returns. We examine a business’s returns over full market cycles, with close emphasis paid to seeing precisely how those returns |
| |
 Source: Merrill Lynch |
| |
|
We think that in the current economic and stock-market cycles, high-quality companies offer investors several advantages, especially when compared to lower-quality stocks.
|
|
THIS PAGE IS NOT PART OF THE 2006 ANNUAL REPORT TO STOCKHOLDERS | 7 |
| |
repair expenditures? Are there any
notices or indications of pending
litigation? We take an in-depth
look at the ratio of retained earnings
to total equity and capitalized
items such as development costs.
All of these factors may have a
bearing on a company’s—and by
extension our own— exposure to
risk. We take time to look back and
compare balance sheets (as well as
the rest of the financial statements)
from previous years because we are
interested in the history of a
company. We look for changes from
period to period that can tell us
about a company’s direction. If the
balance sheet takes a shape we
like, we want to understand how it
evolved to its current status.
The process of balance sheet
analysis is often time-consuming,
seldom exciting and certainly never
glamorous. It is critical, however, in
our search to find the kind of healthy
small-cap companies that have
been our mainstay for 30 years.
| | | |
| | | |
| | | |
LETTER TO OUR STOCKHOLDERS |
| | | |
|
| | | |
were achieved. Another metric we examine with particular scrutiny is return on assets (ROA), defined as net income divided by assets. This ratio helps to reveal to us the first markings of a quality company. Of course, for most of our managers, a company’s balance sheet, record of success as a business and potential for a profitable future are also critically important. Our disciplined, bottom-up approach focuses on identifying companies that are generating strong (or improving) free cash flow and returns on capital. Our goal is to find quality companies that are trading at a discount to our estimate of their worth as a business.
We believe that the long-term records of The Royce Funds show that we have successfully identified growing businesses that are capable of both producing free cash and surviving potential difficulties in the stock market or the economy. For example, our three closed-end Funds’ portfolios have significant equity investments in U.S.-traded, non-financial common stocks that have a weighted average return on assets (ROA) greater than such companies contained in the Russell 2000. (See the table below). While these Funds may suffer underperformance periods from time to time, our belief is that a turn to quality in the market would benefit companies with such metrics, especially over long-term, full-market cycles. They are the small-cap universe’s ‘dark horses,’ companies that have strong fundamentals, but so far may not have enjoyed the full benefits of small-cap’s extended run.
|
| | | | | | | | | | | | | | | | | | | | | | | |
| | | | | | | | | | | | | | | | | | Percent of Portfolio/Index |
| | | | | | | | Return on Assets | | | | Included in ROA Calculation |
| | | |
|
| | | | Royce Value Trust | | | | | | | 7.1 | | | | | | | | | 71 | % | | |
| | | |
|
| | | | Royce Micro-Cap Trust | | | | | | | 6.1 | | | | | | | | | 71 | | | |
| | | |
|
| | | | Royce Focus Trust | | | | | | | 12.1 | | | | | | | | | 67 | | | |
| | | |
|
| | | | Russell 2000 | | | | | | | 5.9 | | | | | | | | | 71 | | | |
| | | |
|
| | | | Results are the asset-weighted average trailing 12-month ROA for the U.S.-traded non-financial common stocks in each Fund’s portfolio as of 12/31/06. |
| | | | | | | | | | | | | | | | | | | | | | | |
| | | | | | | | | | | | | | | | | | | | | | | |
| | | | Here Comes The Sun
The beginning and end points of market cycles are always unpredictable, and the timing of any leadership change often looks arbitrary until well after it has been established. It’s also important to remember that the market’s moves do not always make sense, at least until other, related factors come to light with the passage of time. Small-cap has enjoyed an extraordinary run over the last seven years. However, as this long-term small-cap rally matures, the asset class may become increasingly vulnerable to a correction. We do not see the possibility of either a period of large-cap leadership or a potential small-cap correction as bad news for investors with a long-term outlook. While a downturn would cause pain in the short run for small-cap investors, it would also present ample purchase opportunities. We also think that many of the high-quality small-caps we already own would potentially thrive beyond the difficulties of a hopefully short-term correction. Although a widespread shift to |
| | | | | | | | | | | | | | | | | | | | | | | |
| | | | | | | | | | | | | | | | | | | | | | | |
| | | | | | | | | | | | | | | | | | | | | | | |
| | | | | | | | | | | | | | | | | | | | | | | |
| | | | | | | | | | | | | | | | | | | | | | | |
| | | | | | | | | | | | | | | | | | | | | | | |
| | | | | | | | | | | | | | | | | | | | | | | |
| | | | | | | | | | | | | | | | | | | | | | | |
| | | | | | | | | | | | | | | | | | | | | | | |
| | | | | | | | | | | | | | | | | | | | | | | |
| | | | | | | | | | | | | | | | | | | | | | | |
| | | | | | | | | | | | | | | | | | | | | | | |
| | | | | | | | | | | | | | | | | | | | | | | |
| | | | | | | | | | | | | | | | | | | | | | | |
| | | | | | | | | | | | | | | | | | | | | | | |
| | | | | | | | | | | | | | | | | | | | | | | |
| | | | |
| | | | |
| | | | | | | | | | | | | | | | | | | | | | | |
| | | | | | | | | | | | | | | | | | | | | | | |
| | | | | | | | | | | | | | | | | | | | | | | |
| | | | | | | | | | | | | | | | | | | | | | | |
| | | | |
8 | THIS PAGE IS NOT PART OF THE 2006 ANNUAL
REPORT TO STOCKHOLDERS | | | |
| | | | |
|
quality would certainly benefit large-cap stocks—and would be consistent with our recent contention that large-cap is overdue for a stint of market leadership—we believe that it would also benefit stocks with high-quality characteristics throughout the market, including small- and micro-cap stocks. As the song says, “It’s all right.”
|
| | | | | | |
| Sincerely, | | | | | |
| | | | | | |
 | |  | |  | |
| Charles M. Royce | | W. Whitney George | | Jack E. Fockler, Jr. | |
| President | | Vice President | | Vice President | |
| | | | | | |
| | | | | | |
| January 31, 2007 | | | | | |
| | | | | | |
| | | | | | |
|
Although a widespread shift to quality would certainly benefit large-cap stocks—and would be consistent with our recent contention that large-cap is overdue for a stint of market leadership—we believe that it would also benefit stocks with high-quality characteristics throughout the market, including small- and micro-cap stocks.
|
|
THIS PAGE IS NOT PART OF THE 2006 ANNUAL REPORT TO STOCKHOLDERS | 9 |
| |
| | | |
| TABLE OF CONTENTS | | |
|
| | | |
| Annual Report to Stockholders | | |
|
| Directors and Officers | | 11 |
|
| Managers’ Discussions of Fund Performance | | |
| | | |
Royce Value Trust | | 12 |
|
Royce Micro-Cap Trust | | 14 |
|
Royce Focus Trust | | 16 |
|
| History Since Inception | | 18 |
|
| Distribution Reinvestment and Cash Purchase Options | | 19 |
|
| Schedules of Investments and Other Financial Statements | | |
| | | |
Royce Value Trust | | 20 |
|
Royce Micro-Cap Trust | | 35 |
|
Royce Focus Trust | | 50 |
|
| Notes to Performance and Other Important Information | | 60 |
|
| Stockholder Meeting Results | | 61 |
|
10 | 2006 ANNUAL REPORT TO STOCKHOLDERS |
| |
| All Directors and Officers may be reached c/o The Royce Funds, 1414 Avenue of the Americas, New York, NY 10019 |
|
| | | |
| NAME AND POSITION: | Charles M. Royce, Director*, President | |
| Age: 67 | Number of Funds Overseen: 25 | |
| Tenure: Since 1982 | Non-Royce Directorships: Director of Technology Investment Capital Corp. | |
Principal Occupation(s) During Past Five Years: President, Chief Investment Officer and Member of Board of Managers of Royce & Associates, LLC (“Royce”) (since October 2001), the Trust’s investment adviser. | |
| | | |
| NAME AND POSITION: | Mark R. Fetting, Director* | |
| Age: 52 | Number of Funds Overseen: 46 | |
| Tenure: Since 2001 | Non-Royce Directorships: Director/Trustee of registered investment companies constituting the 21 Legg Mason Funds. | |
Principal Occupation(s) During Past Five Years: Senior Executive Vice President of Legg Mason, Inc.; Member of Board of Managers of Royce (since October 2001); Division President and Senior Officer, Prudential Financial Group, Inc. and related companies, including Fund Boards and consulting services to subsidiary companies (from 1991 to 2000). Mr. Fetting’s prior business experience includes having served as Partner, Greenwich Associates and Vice President, T. Rowe Price Group, Inc. | |
| |
| | | |
| NAME AND POSITION: | Donald R. Dwight, Director | |
| Age: 75 | Number of Funds Overseen: 25 | |
| Tenure: Since 1998 | Non-Royce Directorships: None | |
Principal Occupation(s) During Past Five Years: President of Dwight Partners, Inc., corporate communications consultant; Chairman (from 1982 to March 1998) and Chairman Emeritus (since March 1998) of Newspapers of New England, Inc. Mr. Dwight’s prior experience includes having served as Lieutenant Governor of the Commonwealth of Massachusetts, as President and Publisher of Minneapolis Star and Tribune Company and as a Trustee of the registered investment companies constituting the Eaton Vance Funds. | |
| | | |
| NAME AND POSITION: | Richard M. Galkin, Director | |
| Age: 68 | Number of Funds Overseen: 25 | |
| Tenure: Since 1982 | Non-Royce Directorships: None | |
Principal Occupation(s) During Past Five Years: Private investor. Mr. Galkin’s prior business experience includes having served as President of Richard M. Galkin Associates, Inc., telecommunications consultants, President of Manhattan Cable Television (a subsidiary of Time, Inc.), President of Haverhills Inc. (another Time, Inc. subsidiary), President of Rhode Island Cable Television and Senior Vice President of Satellite Television Corp. (a subsidiary of Comsat). | |
| | | |
| NAME AND POSITION: | Stephen L. Isaacs, Director | |
| Age: 67 | Number of Funds Overseen: 25 | |
| Tenure: Since 1989 | Non-Royce Directorships: None | |
Principal Occupation(s) During Past Five Years: President of The Center for Health and Social Policy (since September 1996); Attorney and President of Health Policy Associates, Inc., consultants. Mr. Isaacs’s prior business experience includes having served as Director of Columbia University Development Law and Policy Program and Professor at Columbia University (until August 1996). | |
| | | |
| NAME AND POSITION: | William L. Koke, Director | |
| Age: 72 | Number of Funds Overseen: 25 | |
| Tenure: Since 1996 | Non-Royce Directorships: None | |
Principal Occupation(s) During Past Five Years: Private investor. Mr. Koke’s prior business experience includes having served as President of Shoreline Financial Consultants, Director of Financial Relations of SONAT, Inc., Treasurer of Ward Foods, Inc. and President of CFC, Inc. | |
| | | |
| NAME AND POSITION: | Arthur S. Mehlman, Director | |
| Age: 64 | Number of Funds Overseen: 46 | |
| Tenure: Since 2004 | Non-Royce Directorships: Director/Trustee of registered investment companies constituting the 21 Legg Mason Funds and Director of Municipal Mortgage & Equity, LLC. | |
Principal Occupation(s) During Past Five Years: Director of The League for People with Disabilities, Inc.; Director of University of Maryland Foundation (non-profits). Formerly: Director of University of Maryland College Park Foundation (non-profit) (from 1998 to 2005); Partner, KPMG LLP (international accounting firm) (from 1972 to 2002); Director of Maryland Business Roundtable for Education (from July 1984 to June 2002). | |
| | | |
| | | |
| | |
| NAME AND POSITION: | David L. Meister, Director |
| Age: 67 | Number of Funds Overseen: 25 |
| Tenure: Since 1982 | Non-Royce Directorships: None |
Principal Occupation(s) During Past Five Years: Consultant. Chairman and Chief Executive Officer of The Tennis Channel (from June 2000 to March 2005). Chief Executive officer of Seniorlife.com (from December 1999 to May 2000). Mr. Meister’s prior business experience includes having served as a consultant to the communications industry, President of Financial News Network, Senior Vice President of HBO, President of Time-Life Films and Head of Broadcasting for Major League Baseball. |
| | |
| NAME AND POSITION: | G. Peter O’Brien, Director |
| Age: 61 | Number of Funds Overseen: 46 |
| Tenure: Since 2001 | Non-Royce Directorships: Director/Trustee of registered investment companies constituting the 21 Legg Mason Funds; Director of Technology Investment Capital Corp. |
Principal Occupation(s) During Past Five Years: Trustee Emeritus of Colgate University (since 2005); Board Member of Hill House, Inc. (since 1999); Formerly: Trustee of Colgate University (from 1996 to 2005), President of Hill House, Inc. (from 2001 to 2005) and Managing Director/Equity Capital Markets Group of Merrill Lynch & Co. (from 1971 to 1999). |
|
| | |
| NAME AND POSITION: | John D. Diederich, Vice President and Treasurer |
| Age: 55 | |
| Tenure: Since 2001 | |
Principal Occupation(s) During Past Five Years: Chief Operating Officer, Managing Director and member of the Board of Managers of Royce; Chief Financial Officer of Royce (since March 2002); Director of Administration of the Trust; and President of RFS, having been employed by Royce since April 1993. |
| | |
| NAME AND POSITION: | Jack E. Fockler, Jr., Vice President |
| Age: 48 | |
| Tenure: Since 1995 | |
Principal Occupation(s) During Past Five Years: Managing Director and Vice President of Royce, and Vice President of RFS, having been employed by Royce since October 1989. |
| | |
| NAME AND POSITION: | W. Whitney George, Vice President |
| Age: 48 | |
| Tenure: Since 1995 | |
Principal Occupation(s) During Past Five Years: Managing Director and Vice President of Royce, having been employed by Royce since October 1991. |
| | |
| NAME AND POSITION: | Daniel A. O’Byrne, Vice President and Assistant Secretary |
| Age: 44 | |
| Tenure: Since 1994 | |
Principal Occupation(s) During Past Five Years: Principal and Vice President of Royce, having been employed by Royce since October 1986. |
| | |
| NAME AND POSITION: | John E. Denneen, Secretary and Chief Legal Officer |
| Age: 39 | |
| Tenure: 1996-2001 and Since April 2002 | |
Principal Occupation(s) During Past Five Years: General Counsel (Deputy General Counsel prior to 2003), Principal, Chief Legal and Compliance Officer and Secretary of Royce (since March 2002); Secretary of The Royce Funds (from 1996 to 2001 and since April 2002); and Principal of Credit Suisse First Boston Private Equity (from 2001 to 2002). |
| | |
| NAME AND POSITION: | Lisa Curcio, Chief Compliance Officer |
| Age: 47 | |
| Tenure: Since 2004 | |
Principal Occupation(s) During Past Five Years: Chief Compliance Officer of The Royce Funds (since October 2004); Compliance Officer of Royce (since June 2004); Vice President, The Bank of New York (from February 2001 to June 2004). |
| | |
|
| * | Interested Director. |
| |
2006 ANNUAL REPORT TO STOCKHOLDERS | 11 |
| |
ROYCE VALUE TRUST
AVERAGE ANNUAL NAV TOTAL RETURNS
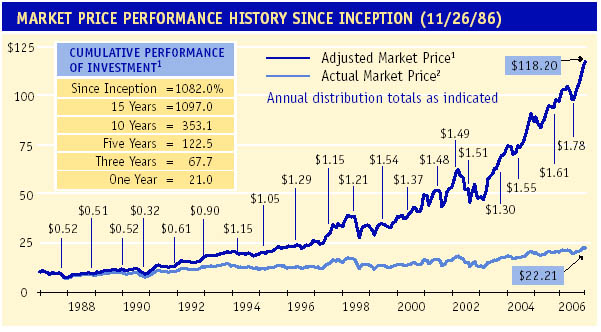
Through 12/31/06 | |  Manager’s Discussion Manager’s DiscussionRoyce Value Trust’s (RVT) diversified portfolio of small- and micro-cap stocks more than participated in the mostly good times for small-cap stocks in 2006. The Fund gained 19.5% on a net asset value (NAV) basis and 21.0% on a market price basis, compared to calendar-year returns of 18.4% for the Russell 2000 and 15.1% for the S&P 600. In the third quarter, RVT was up 0.7% on an NAV basis and 8.0% on a market price basis, versus a gain of 0.4% for the Russell 2000 and a loss of 0.9% for the S&P 600. The fourth quarter arrived with a strong rally that closed out the year. The Fund was up 8.2% on an NAV basis and 11.3% on a market price basis, compared to gains of 8.9% for the Russell 2000 and 7.9% for the S&P 600.
RVT’s solid NAV return in 2006 contributed to its strong absolute and relative results over market-cycle and other long-term periods. From the previous small-cap market peak on 3/9/00 through 12/31/06, RVT gained 131.4% versus 41.7% for the Russell 2000 and 90.0% for the S&P 600. During the more bullish phase from the small-cap market trough on 10/9/02 through 12/31/06, the Fund was up 163.5% compared to a gain of 153.5% for the Russell 2000 and 143.7% for the S&P 600. On both an NAV and market price basis, RVT outperformed both of its small-cap benchmarks for the one-, three-, five-, 10-, 15-, 20-year and since inception (11/26/86) periods ended 12/31/06. (The Fund celebrated its twentieth anniversary in November 2006.) RVT’s average annual NAV total return since inception was 13.0%.
While each of the Fund’s equity sectors had positive net gains, holdings in Industrial Products led the way in dollar-based net gains for the full year (as well as in the fourth quarter). Companies in the machinery industry posted the sector’s highest net gains on a dollar basis, though they were not as dominant in the second half as in the first. The metals and distributions and other industrial products industries also showed strong dollar-based gains. Kimball International is a company that we have owned since 1989. The firm, whose low debt and consistent dividend helped to draw and maintain our attraction, makes wood furniture and cabinets, as well as electronic assembly products. Better-than-expected fiscal third- and fourth-quarter earnings, as well as new opportunities for its electronics division, seemed to attract more investors. Unlike many stocks in 2006, Kimball’s price climbed relatively later and more consistently, taking off in May and climbing steadily from then on. We trimmed our position in November.
The same month saw us make a small trim to our position in asset management company, AllianceBernstein Holding. We have long admired the firm for its success in a business that we know well. The Fund’s largest holding at the end of the year, it was also the largest net gainer on a dollar basis in 2006, as the firm benefited from rising profits and earnings. Although our current position dates back to 2000, we have owned the stock periodically since 1993. Fine art, antique and collectibles auction house Sotheby’s was first selected for RVT’s portfolio in 1990, All performance information in this Report reflects past performance, is presented on a total return basis and reflects the reinvestment of distributions. Past performance is no guarantee of future results. Investment return and principal value of an investment will fluctuate, so that shares may be worth more or less than their original cost when sold. Current performance may be higher or lower than performance quoted. Current month-end performance may be obtained at www.roycefunds.com. The Funds’ P/E ratio calculations exclude companies with zero or negative earnings. |
|
Fourth Quarter 2006* | | 8.23 | % |
|
July-December 2006* | | 8.99 | |
|
One-Year | | | | | | | | 19.50 | |
|
Three-Year | | | | | | | | 16.30 | |
|
Five-Year | | | | | | | | 13.32 | |
|
10-Year | | | | | | | | 13.96 | |
|
15-Year | | | | | | | | 14.14 | |
|
20-Year | | | | | | | | 13.05 | |
|
Since Inception (11/26/86) | | 12.99 | |
|
CALENDAR YEAR NAV TOTAL RETURNS |
|
Year | | RVT | | | Year | | | RVT | |
|
2006 | | 19.5 | % | | 1996 | | | 15.5 | % |
|
2005 | | 8.4 | | | 1995 | | | 21.1 | |
|
2004 | | 21.4 | | | 1994 | | | 0.1 | |
|
2003 | | 40.8 | | | 1993 | | | 17.3 | |
|
2002 | | -15.6 | | | 1992 | | | 19.3 | |
|
2001 | | 15.2 | | | 1991 | | | 38.4 | |
|
2000 | | 16.6 | | | 1990 | | | -13.8 | |
|
1999 | | 11.7 | | | 1989 | | | 18.3 | |
|
1998 | | 3.3 | | | 1988 | | | 22.7 | |
|
1997 | | 27.5 | | | 1987 | | | -7.7 | |
| | | | | | | | | | |
TOP 10 POSITIONS
% of Net Assets Applicable
to Common Stockholders |
|
AllianceBernstein Holding L.P. | | 2.3 | % |
|
Ritchie Bros. Auctioneers | | 1.4 | |
|
Sotheby’s | | 1.3 | |
|
SEACOR Holdings | | 1.3 | |
|
Lincoln Electric Holdings | | 1.2 | |
|
Newport Corporation | | 1.1 | |
|
Universal Compression Holdings | | 1.0 | |
|
Adaptec | | 1.0 | |
|
Brady Corporation Cl. A | | 0.9 | |
|
Ash Grove Cement Cl. B | | 0.9 | |
| | | | | | | | | | |
PORTFOLIO SECTOR BREAKDOWN
% of Net Assets Applicable
to Common Stockholders |
|
Technology | | 24.2 | % |
|
Industrial Products | | 17.7 | |
|
Industrial Services | | 13.0 | |
|
Financial Intermediaries | | 11.0 | |
|
Natural Resources | | 10.3 | |
|
Financial Services | | 8.2 | |
|
Health | | 7.0 | |
|
Consumer Services | | 6.5 | |
|
Consumer Products | | 4.7 | |
|
Utilities | | 0.2 | |
|
Diversified Investment Companies | | 0.1 | |
|
Miscellaneous | | 5.0 | |
|
Bonds & Preferred Stocks | | 0.2 | |
|
Cash and Cash Equivalents | | 10.5 | |
12 | 2006 ANNUAL REPORT TO STOCKHOLDERS
Performance and Portfolio Review
| | | |
though we took our current position in 1998. Its leadership in its field has long been a source of our attraction. Its share price was volatile, but moved mostly upward in 2006. First purchased in 1998, SEACOR Holdings is a relative newcomer to RVT’s portfolio. The company engages in the ownership, operation, marketing and remarketing of mostly marine transportation and oil and gas equipment. Better-than-expected earnings fueled the rise in its stock price, and we sold a small number of shares in December.
Net losses at the individual company level were relatively modest. The share prices of many energy-related stocks began to cool down during April and May. The problem for ceramic proppant maker Carbo Ceramics (which we’ve owned since 1996) was that its stock price remained in a downdraft for much of the rest of the year. (Proppants are used in the hydraulic fracturing of natural gas and oil wells.) Its balance sheet remained strong and earnings were positive, so we increased our stake in October. Forward Air provides various transportation and logistics services. Its calendar third-quarter earnings were positive, but lower than what analysts were anticipating, which helped to speed the decline of its share price. | | PORTFOLIO DIAGNOSTICS |
GOOD IDEAS THAT WORKED
2006 Net Realized and Unrealized Gain
| | |
|
| | | Average Market Capitalization | $1,188 million |
| | |
|
| AllianceBernstein Holding L.P. | $8,396,172 | | | Weighted Average P/E Ratio | 20.2x |
| | |
|
| Sotheby’s | 6,142,632 | | | Weighted Average P/B Ratio | 2.3x |
| | |
|
| Kimball International Cl. B | 6,012,659 | | | Weighted Average Yield | 0.8% |
| | |
|
| SEACOR Holdings | 4,755,130 | | | Fund Net Assets | $1,180 million |
| | |
|
| Newport Corporation | 4,626,089 | | | Turnover Rate | 21% |
| | | | |
|
| | | | | Net Leverage* | 8% |
GOOD IDEAS AT THE TIME
2006 Net Realized and Unrealized Loss
| | |
|
| | | Symbol | |
| Carbo Ceramics | $2,796,270 | | | Market Price | RVT |
| | | NAV | XRVTX |
| Forward Air | 1,812,269 | | | *Net leverage is the percentage, in excess of 100%, of the total value of equity type investments, divided by net assets applicable to Common Stockholders. |
| | |
| First Albany Companies | 1,620,963 | | |
| | | | | | |
| PXRE Group | 1,390,701 | | | CAPITAL STRUCTURE
Publicly Traded Securities Outstanding at
12/31/06 at NAV or Liquidation Value |
| | |
| Cimarex Energy | 1,285,273 | | |
| | | |
|
| | | | 57.3 million shares
of Common Stock | $1,180 million |
| | | |
|
1 Reflects the cumulative total return of an investment made by a stockholder who purchased one share at inception ($10.00 IPO), reinvested all annual distributions as indicated and fully participated in primary subscriptions of the Fund’s rights offerings.
2 Reflects the actual market price of one share as it traded on the NYSE. | | 5.90% Cumulative
Preferred Stock | $220 million |
| | | | | |
| | RISK/RETURN COMPARISON
Five-Year Period Ended 12/31/06 |
| |
|
| | | Average Annual
Total Return | Standard Deviation | Return
Efficiency* |
| |
|
| | RVT (NAV) | 13.32% | 16.95 | 0.79 |
| |
|
| | S&P 600 | 12.49 | 15.52 | 0.80 |
| |
|
| | Russell 2000 | 11.39 | 17.16 | 0.66 |
| | *Return Efficiency is the average annual total return divided by the annualized standard deviation over a designated time period. |
| | | | | |
| |  |
2006 ANNUAL REPORT TO STOCKHOLDERS | 13
ROYCE MICRO-CAP TRUST
AVERAGE ANNUAL NAV TOTAL RETURNS
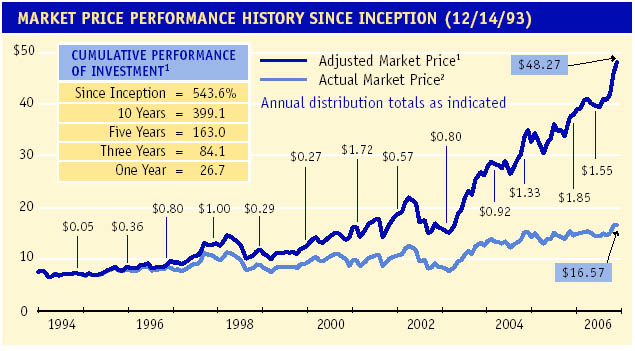
Through 12/31/06 | | Manager’s DiscussionHelped by a strong surge from micro-caps at the end of the year, the diversified portfolio of Royce Micro-Cap Trust (RMT) posted solid results on both an absolute and relative basis in 2006. RMT gained 22.5% on a net asset value (NAV) basis and 26.7% on a market price basis versus a return of 18.4% for the Russell 2000, the Fund’s small-cap benchmark. In a year that began and ended with vigorous rallies, RMT initially participated only on an NAV basis, with respective NAV and market price gains of 15.2% and 7.00% versus the Russell 2000’s return of 13.9% in the the first quarter. When stock prices fell in the second quarter, RMT displayed impressive down-market strength, losing 3.2% on an NAV basis and 2.3% on a market price basis, both results ahead of the Russell 2000’s 5.0% decline. The flatter-return period of the third quarter saw the Fund giving back some NAV gain, while it continued to be solid on a market price basis. RMT was down 0.3% an NAV basis between July and September, compared to gains of 2.8% in its market price and 0.4% for its small-cap benchmark.
In the rally that enlivened the fourth quarter, the Fund shone on both an NAV and market price basis. RMT gained 10.1% on an NAV basis and an impressive 17.9% on a market price basis versus an 8.9% return for the Russell 2000. From the interim small-cap peak on 5/5/06 through 12/31/06, the Fund was up 3.0% on an NAV basis and 14.7% on a market price basis, both results again better than the small-cap index’s return of 1.6%. Although this latter period represented a short time period, we were pleased with the Fund’s sturdy NAV showing considering the historical volatility and vulnerability of micro-cap stocks.
We were also pleased with the Fund’s NAV results over full market cycle and other long-term periods on both an absolute and relative basis. These are the most critical time spans when it comes to evaluating performance. From the small-cap market peak on 3/9/00 through 12/31/06, RMT gained 147.2% on an NAV basis (+232.6% on a market price basis) versus 47.1% for the Russell 2000. Perhaps more notable was its gain during the mostly bullish phase that ran from the small-cap market trough on 10/9/02 through 12/31/06, a period in which RMT gained 186.2% on an NAV basis (+253.5% on a market price basis) compared to the Russell 2000’s gain of 153.5%.The Fund also outperformed its benchmark for the one-, three-, five, 10-year and since inception (12/14/93) periods on both an NAV and market price basis. RMT’s average annual NAV total return since inception was 14.6%.
Each of the Fund’s sectors posted net gains in 2006, with Technology and Industrial Products in the lead on a dollar basis. At the individual company level, the Fund’s top net gainers came from several different sectors and industry groups, with no single area truly dominating. Securities broker International Assets Holding is involved in asset management. The announcement in June of record revenues and earnings for its fiscal third quarter appeared to attract more investors to the firm’s stock. We took some gains between June and December. La All performance information in this Report reflects past performance, is presented on a total return basis and reflects the reinvestment of distributions. Past performance is no guarantee of future results. Investment return and principal value of an investment will fluctuate, so that shares may be worth more or less than their original cost when sold. Current performance may be higher or lower than performance quoted. Current month-end performance may be obtained at www.roycefunds.com. The Funds’ P/E ratio calculations exclude companies with zero or negative earnings. |
|
Fourth Quarter 2006* | | 10.07 | % |
|
July-December 2006* | | 9.74 | |
|
One-Year | | | | | | | | 22.46 | |
|
Three-Year | | | | | | | | 15.77 | |
|
Five-Year | | | | | | | | 15.78 | |
|
10-Year | | | | | | | | 14.62 | |
|
Since Inception (11/26/86) | | 14.58 | |
|
CALENDAR YEAR NAV TOTAL RETURNS |
|
Year | | RMT | | | Year | | | RMT | |
|
2006 | | 22.5 | % | | 1999 | | | 12.7 | % |
|
2005 | | 6.8 | | | 1998 | | | -4.1 | |
|
2004 | | 18.7 | | | 1997 | | | 27.1 | |
|
2003 | | 55.6 | | | 1996 | | | 16.6 | |
|
2002 | | -13.8 | | | 1995 | | | 22.9 | |
|
2001 | | 23.4 | | | 1994 | | | 5.0 | |
|
2000 | | 10.9 | | | | | | | |
| | | | | | | | | | |
TOP 10 POSITIONS
% of Net Assets Applicable
to Common Stockholders |
|
ASA Bermuda | | 1.4 | % |
|
Seneca Foods | | 1.3 | |
|
Highbury Financial | | 1.2 | |
|
Covansys Corporation | | 1.2 | |
|
First Consulting Group | | 1.1 | |
|
PAREXEL International | | 1.0 | |
|
TriZetto Group (The) | | 1.0 | |
|
Aceto Corporation | | 1.0 | |
|
Universal Truckload Services | | 0.9 | |
|
Transaction Systems
Architects Cl. A | | 0.9 | |
| | | | | | | | | | |
PORTFOLIO SECTOR BREAKDOWN
% of Net Assets Applicable
to Common Stockholders |
|
Technology | | 24.3 | % |
|
Health | | 16.9 | |
|
Industrial Products | | 14.9 | |
|
Industrial Services | | 12.8 | |
|
Financial Intermediaries | | 10.1 | |
|
Natural Resources | | 9.4 | |
|
Consumer Services | | 5.7 | |
|
Consumer Products | | 5.6 | |
|
Financial Services | | 3.6 | |
|
Diversified Investment Companies | | 1.9 | |
|
Miscellaneous | | 4.9 | |
|
Preferred Stock | | 0.5 | |
|
Cash and Cash Equivalents | | 6.9 | |
14 | 2006 ANNUAL REPORT TO STOCKHOLDERS
Performance and Portfolio Review
| | | |
Senza Corporation is a women’s apparel retailer based in Canada whose stock we first purchased in 1995. Its share price climbed when its acquisition by a larger competitor was announced in November, which prompted us to sell our position at a substantial net gain. A happy exception to the woes that afflicted many healthcare stocks in 2006 was the terrific performance of First Consulting Group, which provides management and other services to healthcare, pharmaceutical and life sciences businesses. We liked its niche business and balance sheet. The earnings strength of this top-ten position seemed to take Wall Street by surprise in 2006, which in turn drew more investors to its stock.
Net losses for individual companies in the portfolio were generally small. Multi-business holding company BB Holdings spun off a subsidiary that trades in the U.S., but its own domestic de-listing drove investors away from the stock, which continues to trade on the London Exchange. American Bank Note Holographics, a firm that produces holograms for currency, credit card identification and document security saw its stock price fall 60% in March on news that a major credit card company would no longer be using the firm’s security stripe. Its stock was only able to mount a slight rebound. We held on to our position owing to our regard for its niche business, balance sheet and positive earnings. | | PORTFOLIO DIAGNOSTICS |
GOOD IDEAS THAT WORKED
2006 Net Realized and Unrealized Gain
| | |
|
| | | Average Market Capitalization | $280 million |
| | |
|
| International Assets Holding | $2,795,352 | | | Weighted Average P/E Ratio | 18.6x* |
| | |
|
| La Senza Corporation | 2,537,402 | | | Weighted Average P/B Ratio | 1.9x |
| | |
|
| First Consulting Group | 2,167,383 | | | Weighted Average Yield | 0.6% |
| | |
|
| Volt Information Sciences | 1,884,059 | | | Fund Net Assets | $344 million |
| | |
|
| Covansys Corporation | 1,729,279 | | | Turnover Rate | 34% |
| | | | |
|
| | | | | Net Leverage† | 11% |
GOOD IDEAS AT THE TIME
2006 Net Realized and Unrealized Loss
| | |
|
| | | Symbol | |
| BB Holdings | $1,513,960 | | | Market Price | RMT |
| | | NAV | XOTCX |
| American Bank Note Holographics | 838,012 | | | *Excludes 18% of portfolio holdings with zero or negative earnings as of 12/31/06. †Net leverage is the percentage, in excess of 100%, of the total value of equity type investments, divided by net assets, applicable to Common Stockholders. |
| | |
| Stein Mart | 728,121 | | |
| | |
| America’s Car-Mart | 719,317 | | | | | | |
| | | CAPITAL STRUCTURE
Publicly Traded Securities Outstanding at
12/31/06 at NAV or Liquidation Value |
| Hi-Tech Pharmacal | 637,230 | | |
| | | |
|
| | | | 23.3 million shares
of Common Stock | $344 million |
| | | |
|
1 Reflects the cumulative total return of an investment made by a stockholder who purchased one share at inception ($7.50 IPO), reinvested distributions as indicated and fully participated in the primary subscription of the 1994 rights offering.
2 Reflects the actual market price of one share as it traded on Nasdaq and, beginning on 12/1/03, on the NYSE. | | 6.00% Cumulative
Preferred Stock | $60 million |
| | | | | |
| | RISK/RETURN COMPARISON
Five-Year Period Ended 12/31/06 |
| |
|
| | | Average Annual
Total Return | Standard Deviation | Return
Efficiency* |
| |
|
| | RMT (NAV) | 15.78% | 17.83 | 0.89 |
| |
|
| | Russell 2000 | 11.39 | 17.16 | 0.66 |
| | *Return Efficiency is the average annual total return divided by the annualized standard deviation over a designated time period. |
| | | | | |
| |  |
2006 ANNUAL REPORT TO STOCKHOLDERS | 15
ROYCE FOCUS TRUST
AVERAGE ANNUAL NAV TOTAL RETURNS
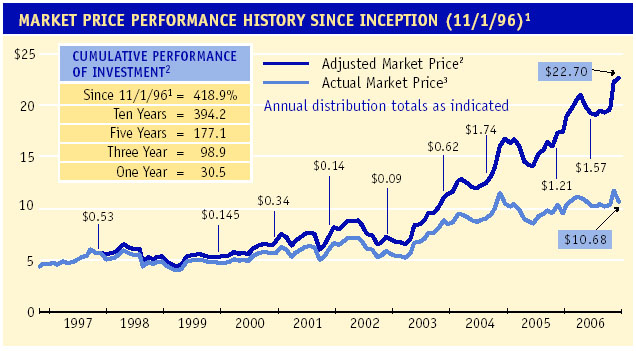
Through 12/31/06 | |  Manager’s Discussion Manager’s DiscussionAlthough its calendar-year net asset value (NAV) performance suffered a bit in comparison to its small-cap benchmark, the Russell 2000, we were pleased with the results for Royce Focus Trust (FUND) on an absolute basis. FUND gained 15.9% on an NAV basis, and an impressive 30.5% on a market price basis, compared to a gain of 18.4% for the Russell 2000. In all but one quarter in 2006, the Fund’s NAV results went much the way that we would expect, with solid up-market turns in the dynamic first and fourth quarters and slightly better relative downmarket performance in the bearish second quarter. During the bullish first quarter, the Fund was up 13.6% on an NAV basis and 18.4% on a market price basis, compared to a 13.9% gain for the Russell 2000. The second quarter saw the Fund lose 4.8% on an NAV basis and 6.5% on a market price basis, while the Russell 2000 declined 5.0%.
However, in the underwhelming environment of the third quarter, FUND declined 3.6% on an NAV basis, compared to a gain of 0.4% for both its market price and the Russell 2000. The Fund rebounded nicely in the fourth quarter, when stock prices in general were on the rise. On an NAV basis, FUND was up 11.2% (+17.5% on a market price basis) versus a return of 8.9% for the small-cap index. So while the portfolio did well to make up for its difficult third quarter, it was not enough to push its calendar-year return past that of the Russell 2000.
The Fund once again posted strong absolute and superior relative results over market-cycle and other long-term performance periods. From the previous small-cap market peak on 3/9/00 through 12/31/06, the Fund gained 200.5% on an NAV basis (+293.4% on a market price basis) versus 41.7% for the Russell 2000. In the more bullish period from the small-cap market trough on 10/9/02 through 12/31/06, FUND’s NAV return was 215.9% (+266.8% on a market price basis) versus a gain of 153.5% for its small-cap benchmark. On both an NAV and market price basis, FUND outperformed the Russell 2000 for the three-, five-, 10-year and since inception of Royce’s management (11/1/96) periods ended 12/31/06. The Fund’s average annual NAV total return since the inception of our management was 14.4%.
The Industrial Products, Natural Resources and Technology sectors led the way for the year as a whole in dollar-based net gains. Net losses at the individual company level were relatively modest, however disappointing. Multi-business holding company BB Holdings spun off a subsidiary that trades in the U.S., but the prospect of its own domestic de-listing sent investors fleeing. Its stock continues to trade in London, and we added to our stake during May and June. Canadian energy services company Trican Well Service manufactures piping and drilling equipment and provides oil well completion, maintenance and repair services. Its share price hit an all-time high early in 2006 and was mostly on a downward slide through the rest of the year, even as it continued to post solid earnings. After trimming our position between early 2005 and February 2006, we began to purchase shares at what we judged to be attractive prices during All performance information in this Report reflects past performance, is presented on a total return basis and reflects the reinvestment of distributions. Past performance is no guarantee of future results. Investment return and principal value of an investment will fluctuate, so that shares may be worth more or less than their original cost when sold. Current performance may be higher or lower than performance quoted. Current month-end performance may be obtained at www.roycefunds.com. The Funds’ P/E ratio calculations exclude companies with zero or negative earnings. |
|
Fourth Quarter 2006* | | 11.17 | % |
|
July-December 2006* | | 7.18 | |
|
One-Year | | | | | | | | 15.85 | |
|
Three-Year | | | | | | | | 19.42 | |
|
Five-Year | | | | | | | | 18.12 | |
|
10-Year | | | | | | | | 14.09 | |
|
Since Inception (11/1/96)† | | 14.35 | |
† Royce & Associates assumed investment management responsibility for the Fund on 11/1/96. |
CALENDAR YEAR NAV TOTAL RETURNS |
|
Year | | FUND | | | Year | | | FUND | |
|
2006 | | 15.9 | % | | 2001 | | | 10.0 | % |
|
2005 | | 13.3 | | | 2000 | | | 20.9 | |
|
2004 | | 29.2 | | | 1999 | | | 8.7 | |
|
2003 | | 54.3 | | | 1998 | | | -6.8 | |
|
2002 | | -12.5 | | | 1997 | | | 20.5 | |
| | | | | | | | | | |
TOP 10 POSITIONS
% of Net Assets Applicable
to Common Stockholders |
|
New Zealand Government 6.00% Bond | | 4.4 | % |
|
Athena Neurosciences Finance 7.25% Bond | | 3.9 | |
|
IPSCO | | 3.6 | |
|
Harris Steel Group | | 3.5 | |
|
Canadian Government 3.00% Bond | | 3.3 | |
|
Simpson Manufacturing | | 3.0 | |
|
Metal Management | | 3.0 | |
|
Silver Standard Resources | | 2.9 | |
|
Ivanhoe Mines | | 2.8 | |
|
Florida Rock Industries | | 2.7 | |
| | | | | | | | | | |
PORTFOLIO SECTOR BREAKDOWN
% of Net Assets Applicable
to Common Stockholders |
|
Industrial Products | | 25.9 | % |
|
Natural Resources | | 21.8 | |
|
Technology | | 7.5 | |
|
Health | | 6.4 | |
|
Consumer Services | | 6.0 | |
|
Consumer Products | | 5.5 | |
|
Financial Intermediaries | | 4.0 | |
|
Industrial Services | | 3.0 | |
|
Financial Services | | 2.6 | |
|
Bonds | | 11.6 | |
|
Cash and Cash Equivalents | | 21.5 | |
16 | 2006 ANNUAL REPORT TO STOCKHOLDERS
Performance and Portfolio Review
| | | |
July and October. Orchid Cellmark has a dominant position in DNA testing, a promising niche business that we liked a great deal. However, it struggled with losses and meeting new regulations and the resulting accounting difficulties left us with enough uncertainty about the firm’s future prospects to sell our position in August.
Within Industrial Products, several holdings posted impressive net gains. Top-ten holding Harris Steel Group processes, fabricates and installs steel products. Its price began to rise in November with news of a second consecutive quarter of better-than-expected earnings followed by the announcement of Harris being acquired by a competitor in December. After correcting between May and early September, the share price of scrap metal recycling services company Metal Management showed new life, helped in part by strong earnings. In the Natural Resources sector, several precious metals and mining companies overcame their own stock price corrections to end the year on a high note. Six of the Fund’s 20 top-gaining stocks on a dollar basis came from the precious metals and mining group in 2006, including Silver Standard Resources and Glamis Gold. At year-end, our take on the long-term prospects for both energy and precious metals stocks remained positive. We have chosen to act opportunistically, occasionally buying on dips and at times trimming on upticks, our eyes focused firmly on the long view. | | PORTFOLIO DIAGNOSTICS |
GOOD IDEAS THAT WORKED
2006 Net Realized and Unrealized Gain
| | |
|
| | | Average Market Capitalization | $1,672 million |
| | |
|
| Silver Standard Resources | $2,721,635 | | | Weighted Average P/E Ratio | 11.8x |
| | |
|
| Harris Steel Group | 2,226,162 | | | Weighted Average P/B Ratio | 2.0x |
| | |
|
| Metal Management | 2,119,554 | | | Weighted Average Yield | 1.4% |
| | |
|
| Glamis Gold | 1,699,548 | | | Fund Net Assets | $159 million |
| | |
|
| Lincoln Electric Holdings | 1,564,234 | | | Turnover Rate | 30% |
| | | | |
|
| | | | | Net Leverage* | 0% |
GOOD IDEAS AT THE TIME
2006 Net Realized and Unrealized Loss
| | |
|
| | | Symbol | |
| BB Holdings | $1,121,661 | | | Market Price | FUND |
| | | NAV | XFUNX |
| Trican Well Service | 878,364 | | | *Net leverage is the percentage, in excess of 100%, of the total value of equity type investments, divided by net assets applicable to Common Stockholders. |
| | |
| Orchid Cellmark | 800,561 | | |
| | | | | | |
| International Coal Group | 777,511 | | | CAPITAL STRUCTURE
Publicly Traded Securities Outstanding at
12/31/06 at NAV or Liquidation Value |
| | |
| Ensign Energy Services | 767,313 | | |
| | | |
|
| | | | 16.3 million shares
of Common Stock | $159 million |
| | | |
|
1 Royce & Associates assumed investment management responsibility for the Fund on 11/1/96. 1 Reflects the cumulative total return of a continuous common stockholder who reinvested all distributions as indicated and fully participated in the primary subscription of the 2005 rights offering. 3 Reflects the actual market price of one share as it traded on Nasdaq. | | 6.00% Cumulative
Preferred Stock | $25 million |
| | | | | |
| | RISK/RETURN COMPARISON
Five-Year Period Ended 12/31/06 |
| |
|
| | | Average Annual
Total Return | Standard Deviation | Return
Efficiency* |
| |
|
| | FUND (NAV) | 18.12% | 17.31 | 1.05 |
| |
|
| | Russell 2000 | 11.39 | 17.16 | 0.66 |
| | *Return Efficiency is the average annual total return divided by the annualized standard deviation over a designated time period. |
| | | | | |
| |  |
2006 ANNUAL REPORT TO STOCKHOLDERS | 17
HISTORY SINCE INCEPTION
The following table details the share accumulations by an initial investor in the Funds who reinvested all distributions (including fractional shares) and participated fully in primary subscriptions for each of the rights offerings. Full participation in distribution reinvestments and rights offerings can maximize the returns available to a long-term investor. This table should be read in conjunction with the Performance and Portfolio Reviews of the Funds.
|
| | | | | Amount | | Purchase | | | | | NAV | | Market |
| | History | | Invested | | Price* | | Shares | | | Value** | | Value** |
|
| Royce Value Trust | | | | | | | | | | | | | | | | | | |
| 11/26/86 | | Initial Purchase | | $ | 10,000 | | | $ | 10.000 | | | 1,000 | | | $ | 9,280 | | | $ | 10,000 |
| 10/15/87 | | Distribution $0.30 | | | | | | | 7.000 | | | 42 | | | | | | | | |
| 12/31/87 | | Distribution $0.22 | | | | | | | 7.125 | | | 32 | | | | 8,578 | | | | 7,250 |
| 12/27/88 | | Distribution $0.51 | | | | | | | 8.625 | | | 63 | | | | 10,529 | | | | 9,238 |
| 9/22/89 | | Rights Offering | | | 405 | | | | 9.000 | | | 45 | | | | | | | | |
| 12/29/89 | | Distribution $0.52 | | | | | | | 9.125 | | | 67 | | | | 12,942 | | | | 11,866 |
| 9/24/90 | | Rights Offering | | | 457 | | | | 7.375 | | | 62 | | | | | | | | |
| 12/31/90 | | Distribution $0.32 | | | | | | | 8.000 | | | 52 | | | | 11,713 | | | | 11,074 |
| 9/23/91 | | Rights Offering | | | 638 | | | | 9.375 | | | 68 | | | | | | | | |
| 12/31/91 | | Distribution $0.61 | | | | | | | 10.625 | | | 82 | | | | 17,919 | | | | 15,697 |
| 9/25/92 | | Rights Offering | | | 825 | | | | 11.000 | | | 75 | | | | | | | | |
| 12/31/92 | | Distribution $0.90 | | | | | | | 12.500 | | | 114 | | | | 21,999 | | | | 20,874 |
| 9/27/93 | | Rights Offering | | | 1,469 | | | | 13.000 | | | 113 | | | | | | | | |
| 12/31/93 | | Distribution $1.15 | | | | | | | 13.000 | | | 160 | | | | 26,603 | | | | 25,428 |
| 10/28/94 | | Rights Offering | | | 1,103 | | | | 11.250 | | | 98 | | | | | | | | |
| 12/19/94 | | Distribution $1.05 | | | | | | | 11.375 | | | 191 | | | | 27,939 | | | | 24,905 |
| 11/3/95 | | Rights Offering | | | 1,425 | | | | 12.500 | | | 114 | | | | | | | | |
| 12/7/95 | | Distribution $1.29 | | | | | | | 12.125 | | | 253 | | | | 35,676 | | | | 31,243 |
| 12/6/96 | | Distribution $1.15 | | | | | | | 12.250 | | | 247 | | | | 41,213 | | | | 36,335 |
| 1997 | | Annual distribution total $1.21 | | | | | | | 15.374 | | | 230 | | | | 52,556 | | | | 46,814 |
| 1998 | | Annual distribution total $1.54 | | | | | | | 14.311 | | | 347 | | | | 54,313 | | | | 47,506 |
| 1999 | | Annual distribution total $1.37 | | | | | | | 12.616 | | | 391 | | | | 60,653 | | | | 50,239 |
| 2000 | | Annual distribution total $1.48 | | | | | | | 13.972 | | | 424 | | | | 70,711 | | | | 61,648 |
| 2001 | | Annual distribution total $1.49 | | | | | | | 15.072 | | | 437 | | | | 81,478 | | | | 73,994 |
| 2002 | | Annual distribution total $1.51 | | | | | | | 14.903 | | | 494 | | | | 68,770 | | | | 68,927 |
| 1/28/03 | | Rights Offering | | | 5,600 | | | | 10.770 | | | 520 | | | | | | | | |
| 2003 | | Annual distribution total $1.30 | | | | | | | 14.582 | | | 516 | | | | 106,216 | | | | 107,339 |
| 2004 | | Annual distribution total $1.55 | | | | | | | 17.604 | | | 568 | | | | 128,955 | | | | 139,094 |
| 2005 | | Annual distribution total $1.61 | | | | | | | 18.739 | | | 604 | | | | 139,808 | | | | 148,773 |
| 2006 | | Annual distribution total $1.78 | | | | | | | 19.696 | | | 693 | | | | | | | | |
|
| 12/31/06 | | | | $ | 21,922 | | | | | | | 8,102 | | | $ | 167,063 | | | $ | 179,945 |
|
| Royce Micro-Cap Trust | | | | | | | | | | | | | | | | | | |
| 12/14/93 | | Initial Purchase | | $ | 7,500 | | | $ | 7.500 | | | 1,000 | | | $ | 7,250 | | | $ | 7,500 |
| 10/28/94 | | Rights Offering | | | 1,400 | | | | 7.000 | | | 200 | | | | | | | | |
| 12/19/94 | | Distribution $0.05 | | | | | | | 6.750 | | | 9 | | | | 9,163 | | | | 8,462 |
| 12/7/95 | | Distribution $0.36 | | | | | | | 7.500 | | | 58 | | | | 11,264 | | | | 10,136 |
| 12/6/96 | | Distribution $0.80 | | | | | | | 7.625 | | | 133 | | | | 13,132 | | | | 11,550 |
| 12/5/97 | | Distribution $1.00 | | | | | | | 10.000 | | | 140 | | | | 16,694 | | | | 15,593 |
| 12/7/98 | | Distribution $0.29 | | | | | | | 8.625 | | | 52 | | | | 16,016 | | | | 14,129 |
| 12/6/99 | | Distribution $0.27 | | | | | | | 8.781 | | | 49 | | | | 18,051 | | | | 14,769 |
| 12/6/00 | | Distribution $1.72 | | | | | | | 8.469 | | | 333 | | | | 20,016 | | | | 17,026 |
| 12/6/01 | | Distribution $0.57 | | | | | | | 9.880 | | | 114 | | | | 24,701 | | | | 21,924 |
| 2002 | | Annual distribution total $0.80 | | | | | | | 9.518 | | | 180 | | | | 21,297 | | | | 19,142 |
| 2003 | | Annual distribution total $0.92 | | | | | | | 10.004 | | | 217 | | | | 33,125 | | | | 31,311 |
| 2004 | | Annual distribution total $1.33 | | | | | | | 13.350 | | | 257 | | | | 39,320 | | | | 41,788 |
| 2005 | | Annual distribution total $1.85 | | | | | | | 13.848 | | | 383 | | | | 41,969 | | | | 45,500 |
| 2006 | | Annual distribution total $1.55 | | | | | | | 14.246 | | | 354 | | | | | | | | |
|
| 12/31/06 | | | | $ | 8,900 | | | | | | | 3,479 | | | $ | 51,385 | | | $ | 57,647 |
|
| Royce Focus Trust | | | | | | | | | | | | | | | | | | |
| 10/31/96 | | Initial Purchase | | $ | 4,375 | | | $ | 4.375 | | | 1,000 | | | $ | 5,280 | | | $ | 4,375 |
| 12/31/96 | | | | | | | | | | | | | | | | 5,520 | | | | 4,594 |
| 12/5/97 | | Distribution $0.53 | | | | | | | 5.250 | | | 101 | | | | 6,650 | | | | 5,574 |
| 12/31/98 | | | | | | | | | | | | | | | | 6,199 | | | | 5,367 |
| 12/6/99 | | Distribution $0.145 | | | | | | | 4.750 | | | 34 | | | | 6,742 | | | | 5,356 |
| 12/6/00 | | Distribution $0.34 | | | | | | | 5.563 | | | 69 | | | | 8,151 | | | | 6,848 |
| 12/6/01 | | Distribution $0.14 | | | | | | | 6.010 | | | 28 | | | | 8,969 | | | | 8,193 |
| 12/6/02 | | Distribution $0.09 | | | | | | | 5.640 | | | 19 | | | | 7,844 | | | | 6,956 |
| 12/8/03 | | Distribution $0.62 | | | | | | | 8.250 | | | 94 | | | | 12,105 | | | | 11,406 |
| 2004 | | Annual distribution total $1.74 | | | | | | | 9.325 | | | 259 | | | | 15,639 | | | | 16,794 |
| 5/6/05 | | Rights offering | | | 2,669 | | | | 8.340 | | | 320 | | | | | | | | |
| 2005 | | Annual distribution total $1.21 | | | | | | | 9.470 | | | 249 | | | | 21,208 | | | | 20,709 |
| 2006 | | Annual distribution total $1.57 | | | | | | | 9.860 | | | 357 | | | | | | | | |
|
| 12/31/06 | | | | $ | 7,044 | | | | | | | 2,530 | | | $ | 24,668 | | | $ | 27,020 |
|
| * | | Beginning with the 1997 (RVT), 2002 (RMT) and 2004 (FUND) distributions, the purchase price of distributions is a weighted average of the distribution reinvestment prices for the year. |
| | | |
| ** | | Other than for initial purchase, values are stated as of December 31 of the year indicated, after reinvestment of distributions. |
18 | 2006 ANNUAL REPORT TO STOCKHOLDERS
DISTRIBUTION REINVESTMENT AND CASH PURCHASE OPTIONS
Why should I reinvest my distributions?
By reinvesting distributions, a stockholder can maintain an undiluted investment in the Fund. The regular reinvestment of distributions has a significant impact on stockholder returns. In contrast, the stockholder who takes distributions in cash is penalized when shares are issued below net asset value to other stockholders.
How does the reinvestment of distributions from the Royce closed-end funds work?
The Funds automatically issue shares in payment of distributions unless you indicate otherwise. The shares are generally issued at the lower of the market price or net asset value on the valuation date.
How does this apply to registered stockholders?
If your shares are registered directly with a Fund, your distributions are automatically reinvested unless you have otherwise instructed the Funds’ transfer agent, Computershare, in writing. A registered stockholder also has the option to receive the distribution in the form of a stock certificate or in cash if Computershare is properly notified.
What if my shares are held by a brokerage firm or a bank?
If your shares are held by a brokerage firm, bank, or other intermediary as the stockholder of record, you should contact your brokerage firm or bank to be certain that it is automatically reinvesting distributions on your behalf. If they are unable to reinvest distributions on your behalf, you should have your shares registered in your name in order to participate.
What other features are available for registered stockholders?
The Distribution Reinvestment and Cash Purchase Plans also allow registered stockholders to make optional cash purchases of shares of a Fund’s common stock directly through Computershare on a monthly basis, and to deposit certificates representing your Fund shares with Computershare for safekeeping. The Funds’ investment adviser is absorbing all commissions on optional cash purchases under the Plans through December 31, 2006.
How do the Plans work for registered stockholders?
Computershare maintains the accounts for registered stockholders in the Plans and sends written confirmation of all transactions in the account. Shares in the account of each participant will be held by Computershare in non-certificated form in the name of the participant, and each participant will be able to vote those shares at a stockholder meeting or by proxy. A participant may also send other stock certificates held by them to Computershare to be held in non-certificated form. There is no service fee charged to participants for reinvesting distributions. If a participant elects to sell shares from a Plan account, Computershare will deduct a $2.50 fee plus brokerage commissions from the sale transaction. If a nominee is the registered owner of your shares, the nominee will maintain the accounts on your behalf.
How can I get more information on the Plans?
You can call an Investor Services Representative at (800) 221-4268 or you can request a copy of the Plan for your Fund from Computershare. All correspondence (including notifications) should be directed to: [Name of Fund] Distribution Reinvestment and Cash Purchase Plan, c/o Computershare, PO Box 43010, Providence, RI 02940-3010, telephone (800) 426-5523.
2006 ANNUAL REPORT TO STOCKHOLDERS | 19
ROYCE VALUE TRUST
| | | SHARES | | | VALUE | | | | SHARES | | | VALUE |
COMMON STOCKS – 107.9% | | | | | | | Restaurants and Lodgings - 1.4% | | | | | |
| | | | | | | | Applebee’s International | | 63,000 | | $ | 1,554,210 |
Consumer Products – 4.7% | | | | | | | Benihana Cl. A a,c | | 6,600 | | | 202,620 |
Apparel and Shoes - 1.6% | | | | | | | CEC Entertainment a,c | | 121,400 | | | 4,886,350 |
Kenneth Cole Productions Cl. A | | 35,000 | | $ | 839,650 | | IHOP Corporation | | 93,400 | | | 4,922,180 |
Columbia Sportswear c | | 34,600 | | | 1,927,220 | | †Morgans Hotel Group a,c | | 90,000 | | | 1,523,700 |
K-Swiss Cl. A | | 105,000 | | | 3,227,700 | | Steak n Shake a | | 183,000 | | | 3,220,800 |
Oakley | | 94,900 | | | 1,903,694 | | | | | |
|
Polo Ralph Lauren Cl. A | | 38,200 | | | 2,966,612 | | | | | | | 16,309,860 |
Tandy Brands Accessories | | 16,900 | | | 198,068 | | | | | |
|
Weyco Group | | 307,992 | | | 7,653,601 | | Retail Stores - 2.4% | | | | | |
| | | | |
| | †America’s Car-Mart a,c | | 70,400 | | | 834,944 |
| | | | | | 18,716,545 | | Big Lots a | | 155,300 | | | 3,559,476 |
| | | | |
| | CarMax a | | 56,000 | | | 3,003,280 |
Collectibles - 0.3% | | | | | | | Children’s Place Retail Stores a | | 13,670 | | | 868,318 |
Russ Berrie & Company a | | 230,000 | | | 3,553,500 | | Claire’s Stores | | 209,800 | | | 6,952,772 |
| | | | |
| | Cost Plus a,c | | 80,500 | | | 829,150 |
Food/Beverage/Tobacco - 0.2% | | | | | | | Fred’s Cl. A | | 50,000 | | | 602,000 |
Hain Celestial Group a,c | | 37,800 | | | 1,179,738 | | Gander Mountain a,c | | 53,300 | | | 480,233 |
Hershey Creamery | | 709 | | | 1,488,900 | | Hot Topic a,c | | 29,000 | | | 386,860 |
| | | | |
| | Krispy Kreme Doughnuts a | | 85,000 | | | 943,500 |
| | | | | | 2,668,638 | | 99 Cents Only Stores a,c | | 95,000 | | | 1,156,150 |
| | | | |
| | Stein Mart | | 142,800 | | | 1,893,528 |
Home Furnishing and Appliances - 0.3% | | | | | | | Tiffany & Co. | | 75,000 | | | 2,943,000 |
Aaron Rents | | 4,500 | | | 129,510 | | Urban Outfitters a,c | | 27,000 | | | 621,810 |
Ethan Allen Interiors | | 35,800 | | | 1,292,738 | | West Marine a | | 131,100 | | | 2,264,097 |
†Jacuzzi Brands a,c | | 145,000 | | | 1,802,350 | | Wet Seal (The) Cl. A a | | 162,000 | | | 1,080,540 |
La-Z-Boy c | | 68,200 | | | 809,534 | | | | | |
|
| | | | |
| | | | | | | 28,419,658 |
| | | | | | 4,034,132 | | | | | |
|
| | | | |
| | Other Consumer Services - 2.4% | | | | | |
Publishing - 0.4% | | | | | | | Corinthian Colleges a,c | | 106,500 | | | 1,451,595 |
Scholastic Corporation a | | 130,000 | | | 4,659,200 | | ITT Educational Services a | | 80,000 | | | 5,309,600 |
| | | | |
| | Laureate Education a,c | | 75,000 | | | 3,647,250 |
Sports and Recreation - 0.6% | | | | | | | MoneyGram International | | 74,900 | | | 2,348,864 |
Coachmen Industries | | 47,700 | | | 524,700 | | Renaissance Learning | | 15,000 | | | 265,950 |
Monaco Coach | | 166,650 | | | 2,359,764 | | Sotheby’s | | 485,200 | | | 15,050,904 |
Nautilus | | 2,000 | | | 28,000 | | | | | |
|
Sturm, Ruger & Company a | | 272,900 | | | 2,619,840 | | | | | | | 28,074,163 |
Thor Industries | | 26,100 | | | 1,148,139 | | | | | |
|
| | | | |
| | Total (Cost $48,875,384) | | | | | 76,357,108 |
| | | | | | 6,680,443 | | | | | |
|
| | | | |
| | Diversified Investment Companies – 0.1% | | | | | |
Other Consumer Products - 1.3% | | | | | | | Closed-End Funds - 0.1% | | | | | |
Blyth | | 14,700 | | | 305,025 | | Central Fund of Canada Cl. A | | 111,500 | | | 1,041,410 |
Burnham Holdings Cl. B | | 36,000 | | | 594,000 | | | | | |
|
Fossil a,c | | 82,800 | | | 1,869,624 | | Total (Cost $589,526) | | | | | 1,041,410 |
Lazare Kaplan International a | | 103,600 | | | 1,030,820 | | | | | |
|
Leapfrog Enterprises a,c | | 175,000 | | | 1,659,000 | | Financial Intermediaries – 11.0% | | | | | |
Matthews International Cl. A | | 100,000 | | | 3,935,000 | | Banking - 3.5% | | | | | |
RC2 Corporation a | | 132,600 | | | 5,834,400 | | BOK Financial | | 129,327 | | | 7,110,398 |
| | | | |
| | Bank of N.T. Butterfield & Son | | 118,750 | | | 6,679,687 |
| | | | | | 15,227,869 | | CFS Bancorp | | 260,000 | | | 3,809,000 |
| | | | |
| | Cadence Financial | | 30,300 | | | 656,601 |
Total (Cost $32,903,921) | | | | | 55,540,327 | | Commercial National Financial | | 45,300 | | | 878,820 |
| | | | |
| | Exchange National Bancshares | | 50,400 | | | 1,587,600 |
Consumer Services – 6.5% | | | | | | | Farmers & Merchants Bank of Long Beach | | 1,266 | | | 8,545,500 |
Direct Marketing - 0.1% | | | | | | | Heritage Financial | | 12,915 | | | 316,805 |
FTD Group a,c | | 55,000 | | | 983,950 | | HopFed Bancorp | | 25,000 | | | 397,500 |
| | | | |
| | Jefferson Bancshares | | 25,000 | | | 325,500 |
Leisure and Entertainment - 0.1% | | | | | | | Mechanics Bank | | 200 | | | 3,921,000 |
Shuffle Master a,c | | 15,000 | | | 393,000 | | NetBank | | 70,000 | | | 324,800 |
Steiner Leisure a | | 2,100 | | | 95,550 | | Old Point Financial | | 20,000 | | | 568,000 |
| | | | |
| | Partners Trust Financial Group | | 100,000 | | | 1,164,000 |
| | | | | | 488,550 | | Sun Bancorp a,c | | 44,100 | | | 929,187 |
| | | | |
| | | | | | | |
Media and Broadcasting - 0.1% | | | | | | | | | | | | |
Cox Radio Cl. A a,c | | 23,000 | | | 374,900 | | | | | | | |
†Discovery Holding Company Cl. A a,c | | 50,000 | | | 804,500 | | | | | | | |
†Discovery Holding Company Cl. B a,c | | 56,100 | | | 901,527 | | | | | | | |
| | | | |
| | | | | | | |
| | | | | | 2,080,927 | | | | | | | |
| | | | |
| | | | | | | |
20 | 2006 ANNUAL REPORT TO STOCKHOLDERS | THE ACCOMPANYING NOTES ARE AN INTEGRAL PART OF THESE FINANCIAL STATEMENTS. |
DECEMBER 31, 2006
| | | SHARES | | | VALUE | | | | SHARES | | | VALUE |
Financial Intermediaries (continued) | | | | | | | PRG-Schultz International a,c | | 14,420 | | $ | 115,360 |
Banking (continued) | | | | | | | SEI Investments | | 141,200 | | | 8,409,872 |
Tompkins Trustco | | 17,545 | | $ | 797,420 | | | | | |
|
Whitney Holding | | 40,500 | | | 1,321,110 | | | | | | | 20,410,985 |
Wilber Corporation | | 31,700 | | | 317,634 | | | | | |
|
Wilmington Trust | | 31,000 | | | 1,307,270 | | Insurance Brokers - 1.2% | | | | | |
Yadkin Valley Financial | | 3,800 | | | 71,668 | | Crawford & Company Cl. A | | 289,200 | | | 1,732,308 |
| | | | |
| | Crawford & Company Cl. B | | 162,300 | | | 1,184,790 |
| | | | | | 41,029,500 | | Gallagher (Arthur J.) & Co. | | 111,200 | | | 3,285,960 |
| | | | |
| | Hilb Rogal & Hobbs | | 155,050 | | | 6,530,706 |
Insurance - 4.1% | | | | | | | National Financial Partners | | 22,000 | | | 967,340 |
Alleghany Corporation a | | 11,097 | | | 4,034,869 | | U.S.I. Holdings a,c | | 40,000 | | | 614,400 |
Aspen Insurance Holdings | | 64,000 | | | 1,687,040 | | | | | |
|
Commerce Group | | 89,000 | | | 2,647,750 | | | | | | | 14,315,504 |
Erie Indemnity Cl. A | | 139,900 | | | 8,111,402 | | | | | |
|
IPC Holdings | | 27,000 | | | 849,150 | | Investment Management - 4.5% | | | | | |
Leucadia National | | 84,940 | | | 2,395,308 | | ADDENDA Capital | | 150,900 | | | 3,029,258 |
Markel Corporation a | | 7,200 | | | 3,456,720 | | AllianceBernstein Holding L.P. | | 333,100 | | | 26,781,240 |
Montpelier Re Holdings | | 66,000 | | | 1,228,260 | | BKF Capital Group a | | 65,700 | | | 220,095 |
NYMAGIC | | 85,200 | | | 3,118,320 | | Eaton Vance | | 140,400 | | | 4,634,604 |
Ohio Casualty | | 107,000 | | | 3,189,670 | | Federated Investors Cl. B | | 161,900 | | | 5,468,982 |
PXRE Group a | | 166,551 | | | 767,800 | | GAMCO Investors Cl. A | | 158,600 | | | 6,099,756 |
ProAssurance Corporation a,c | | 38,070 | | | 1,900,454 | | Nuveen Investments Cl. A | | 138,600 | | | 7,190,568 |
RLI | | 99,724 | | | 5,626,428 | | | | | |
|
†Security Capital Assurance | | 30,000 | | | 834,900 | | | | | | | 53,424,503 |
21st Century Insurance Group | | 62,000 | | | 1,094,300 | | | | | |
|
Wesco Financial | | 4,750 | | | 2,185,000 | | Other Financial Services - 0.8% | | | | | |
White Mountains Insurance Group | | 10,000 | | | 5,794,300 | | †AmeriCredit Corporation a,c | | 18,870 | | | 474,958 |
| | | | |
| | CharterMac | | 59,600 | | | 1,279,612 |
| | | | | | 48,921,671 | | Credit Acceptance a,c | | 46,601 | | | 1,553,211 |
| | | | |
| | †KKR Private Equity Investors LLP | | 105,000 | | | 2,399,250 |
Real Estate Investment Trusts - 1.1% | | | | | | | Municipal Mortgage & Equity | | 40,300 | | | 1,297,660 |
Gladstone Commercial | | 34,700 | | | 698,858 | | Ocwen Financial a,c | | 50,000 | | | 793,000 |
Government Properties Trust | | 50,000 | | | 530,000 | | Van der Moolen Holding ADR | | 21,362 | | | 125,395 |
†KKR Financial | | 161,200 | | | 4,318,548 | | World Acceptance a,c | | 21,700 | | | 1,018,815 |
Opteum Cl. A | | 897,500 | | | 6,821,000 | | | | | |
|
| | | | |
| | | | | | | 8,941,901 |
| | | | | | 12,368,406 | | | | | |
|
| | | | |
| | Total (Cost $59,143,116) | | | | | 97,092,893 |
Securities Brokers - 0.8% | | | | | | | | | | |
|
Dundee Wealth Management | | 100,000 | | | 1,179,951 | | Health – 7.0% | | | | | |
†Evercore Partners Cl. A a,c | | 19,400 | | | 714,890 | | Commercial Services - 1.4% | | | | | |
First Albany Companies a | | 350,100 | | | 812,232 | | First Consulting Group a | | 560,900 | | | 7,717,984 |
Investment Technology Group a | | 30,400 | | | 1,303,552 | | PAREXEL International a,c | | 313,700 | | | 9,087,889 |
Knight Capital Group Cl. A a,c | | 229,700 | | | 4,403,349 | | | | | |
|
optionsXpress Holdings | | 53,000 | | | 1,202,570 | | | | | | | 16,805,873 |
| | | | |
| | | | | |
|
| | | | | | 9,616,544 | | Drugs and Biotech - 1.5% | | | | | |
| | | | |
| | Affymetrix a,c | | 10,000 | | | 230,600 |
Other Financial Intermediaries - 1.5% | | | | | | | Antigenics a,c | | 99,300 | | | 181,719 |
†AP Alternative Assets L.P. a | | 133,000 | | | 2,394,000 | | Cerus Corporation a,c | | 21,700 | | | 127,162 |
International Securities Exchange Cl. A | | 75,000 | | | 3,509,250 | | DUSA Pharmaceuticals a | | 79,700 | | | 342,710 |
MCG Capital | | 138,000 | | | 2,804,160 | | Endo Pharmaceuticals Holdings a | | 172,300 | | | 4,752,034 |
MVC Capital | | 353,900 | | | 4,728,104 | | Gene Logic a | | 365,000 | | | 562,100 |
MarketAxess Holdings a | | 67,000 | | | 909,190 | | Hi-Tech Pharmacal a | | 1,650 | | | 20,081 |
RHJ International a | | 177,500 | | | 3,795,804 | | Hollis-Eden Pharmaceuticals a,c | | 44,000 | | | 231,440 |
| | | | |
| | Human Genome Sciences a,c | | 90,000 | | | 1,119,600 |
| | | | | | 18,140,508 | | K-V Pharmaceutical Cl. A a,c | | 51,500 | | | 1,224,670 |
| | | | |
| | Medicines Company (The) a,c | | 20,000 | | | 634,400 |
Total (Cost $90,347,936) | | | | | 130,076,629 | | Millennium Pharmaceuticals a,c | | 100,000 | | | 1,090,000 |
| | | | |
| | Myriad Genetics a,c | | 50,000 | | | 1,565,000 |
Financial Services – 8.2% | | | | | | | Perrigo Company | | 186,750 | | | 3,230,775 |
Information and Processing - 1.7% | | | | | | | Pharmanet Development Group a,c | | 10,000 | | | 220,700 |
eFunds Corporation a,c | | 126,875 | | | 3,489,063 | | QLT a,c | | 114,070 | | | 965,032 |
FactSet Research Systems | | 35,350 | | | 1,996,568 | | Telik a | | 100,000 | | | 443,000 |
Global Payments | | 68,500 | | | 3,171,550 | | VIVUS a,c | | 163,300 | | | 591,146 |
Interactive Data | | 134,300 | | | 3,228,572 | | | | | |
|
| | | | | | | | | | | | | 17,532,169 |
| | | | | | | | | | | |
|
| THE ACCOMPANYING NOTES ARE AN INTEGRAL PART OF THESE FINANCIAL STATEMENTS. |
2006 ANNUAL REPORT TO STOCKHOLDERS | 21 |
ROYCE VALUE TRUST
| | | SHARES | | | VALUE | | | | SHARES | | | VALUE |
Health (continued) | | | | | | | CLARCOR | | 83,500 | | $ | 2,823,135 |
Health Services - 1.6% | | | | | | | Donaldson Company | | 92,800 | | | 3,221,088 |
Albany Molecular Research a | | 85,000 | | $ | 897,600 | | GrafTech International a,c | | 64,790 | | | 448,347 |
Cross Country Healthcare a | | 30,000 | | | 654,600 | | PerkinElmer | | 135,000 | | | 3,001,050 |
Eclipsys Corporation a,c | | 20,000 | | | 411,200 | | Powell Industries a,c | | 92,400 | | | 2,917,068 |
Gentiva Health Services a | | 30,150 | | | 574,659 | | II-VI a | | 13,500 | | | 377,190 |
HMS Holdings a,c | | 50,000 | | | 757,500 | | | | | |
|
†HealthSouth Corporation a,c | | 200,000 | | | 4,530,000 | | | | | | | 14,573,836 |
Lincare Holdings a,c | | 52,562 | | | 2,094,070 | | | | | |
|
MedQuist a | | 73,893 | | | 993,861 | | Machinery - 5.7% | | | | | |
National Home Health Care | | 20,000 | | | 229,400 | | Baldor Electric | | 62,900 | | | 2,102,118 |
On Assignment a | | 375,400 | | | 4,410,950 | | Coherent a,c | | 243,500 | | | 7,687,295 |
Paramount Acquisition (Units) a | | 280,000 | | | 1,904,000 | | Exco Technologies | | 91,000 | | | 294,190 |
Quovadx a | | 3,000 | | | 8,460 | | Federal Signal | | 58,600 | | | 939,944 |
†Res-Care a,c | | 65,460 | | | 1,188,099 | | Franklin Electric | | 84,200 | | | 4,327,038 |
| | | | |
| | Graco | | 96,825 | | | 3,836,206 |
| | | | | | 18,654,399 | | Hardinge | | 192,893 | | | 2,904,969 |
| | | | |
| | IDEX Corporation | | 36,000 | | | 1,706,760 |
Medical Products and Devices - 2.3% | | | | | | | Intermec a,c | | 3,000 | | | 72,810 |
Allied Healthcare Products a | | 210,200 | | | 1,086,734 | | Lincoln Electric Holdings | | 228,680 | | | 13,816,846 |
Arrow International | | 195,728 | | | 6,924,857 | | Nordson Corporation | | 172,200 | | | 8,580,726 |
ArthroCare Corporation a,c | | 10,000 | | | 399,200 | | PAXAR Corporation a,c | | 267,500 | | | 6,168,550 |
Bruker BioSciences a | | 370,200 | | | 2,780,202 | | Rofin-Sinar Technologies a | | 128,000 | | | 7,738,880 |
CONMED Corporation a,c | | 81,500 | | | 1,884,280 | | †Williams Controls a | | 37,499 | | | 543,735 |
IDEXX Laboratories a | | 79,000 | | | 6,264,700 | | Woodward Governor | | 154,800 | | | 6,147,108 |
Invacare Corporation | | 103,100 | | | 2,531,105 | | | | | |
|
Novoste Corporation a | | 16,625 | | | 44,888 | | | | | | | 66,867,175 |
STERIS Corporation | | 98,600 | | | 2,481,762 | | | | | |
|
Young Innovations | | 62,550 | | | 2,082,915 | | Metal Fabrication and Distribution - 2.0% | | | | | |
Zoll Medical a | | 20,200 | | | 1,176,448 | | Commercial Metals | | 36,600 | | | 944,280 |
| | | | |
| | CompX International Cl. A | | 292,300 | | | 5,892,768 |
| | | | | | 27,657,091 | | Gerdau Ameristeel | | 61,100 | | | 545,012 |
| | | | |
| | Harris Steel Group | | 100,000 | | | 3,729,366 |
Personal Care - 0.2% | | | | | | | IPSCO | | 14,500 | | | 1,361,115 |
Nutraceutical International a | | 22,800 | | | 349,068 | | Kaydon Corporation | | 208,700 | | | 8,293,738 |
USANA Health Sciences a,c | | 38,900 | | | 2,009,574 | | NN | | 127,100 | | | 1,579,853 |
| | | | |
| | Novamerican Steel a | | 10,800 | | | 394,200 |
| | | | | | 2,358,642 | | Reliance Steel & Aluminum | | 25,920 | | | 1,020,730 |
| | | | |
| | | | | |
|
Total (Cost $56,168,057) | | | | | 83,008,174 | | | | | | | 23,761,062 |
| | | | |
| | | | | |
|
Industrial Products – 17.7% | | | | | | | Paper and Packaging - 0.1% | | | | | |
Automotive - 0.5% | | | | | | | Peak International a | | 408,400 | | | 1,192,528 |
Fuel Systems Solutions a,c | | 22,500 | | | 496,800 | | | | | |
|
LKQ Corporation a,c | | 200,000 | | | 4,598,000 | | Specialty Chemicals and Materials - 2.1% | | | | | |
Quantam Fuel Systems Technologies Worldwide a,c | | 15,500 | | | 24,800 | | Aceto Corporation | | 78,410 | | | 677,462 |
Superior Industries International | | 52,000 | | | 1,002,040 | | Balchem Corporation | | 11,250 | | | 288,900 |
| | | | |
| | Cabot Corporation | | 183,500 | | | 7,995,095 |
| | | | | | 6,121,640 | | Hawkins | | 206,878 | | | 2,958,355 |
| | | | |
| | Lydall a,c | | 35,500 | | | 383,755 |
Building Systems and Components - 1.0% | | | | | | | MacDermid | | 264,131 | | | 9,006,867 |
Decker Manufacturing | | 6,022 | | | 222,814 | | Schulman (A.) | | 143,100 | | | 3,183,975 |
Preformed Line Products | | 91,600 | | | 3,228,900 | | Sensient Technologies | | 22,000 | | | 541,200 |
Simpson Manufacturing | | 250,800 | | | 7,937,820 | | | | | |
|
| | | | |
| | | | | | | 25,035,609 |
| | | | | | 11,389,534 | | | | | |
|
| | | | |
| | Textiles - 0.1% | | | | | |
Construction Materials - 2.1% | | | | | | | Unifi a,c | | 145,100 | | | 355,495 |
Ash Grove Cement Cl. B | | 50,518 | | | 10,709,816 | | | | | |
|
Florida Rock Industries | | 100,175 | | | 4,312,534 | | Other Industrial Products - 2.9% | | | | | |
Heywood Williams Group a | | 958,837 | | | 2,041,676 | | Brady Corporation Cl. A | | 293,400 | | | 10,937,952 |
Synalloy Corporation a,b | | 345,000 | | | 6,361,800 | | Diebold | | 86,700 | | | 4,040,220 |
†USG Corporation a,c | | 25,000 | | | 1,370,000 | | Distributed Energy Systems a | | 32,000 | | | 115,200 |
| | | | |
| | Kimball International Cl. B | | 387,380 | | | 9,413,334 |
| | | | | | 24,795,826 | | Maxwell Technologies a | | 21,500 | | | 299,925 |
| | | | |
| | †Mettler-Toledo International a,c | | 28,700 | | | 2,262,995 |
Industrial Components - 1.2% | | | | | | | Myers Industries | | 30,499 | | | 477,614 |
Barnes Group | | 4,000 | | | 87,000 | | Peerless Manufacturing a | | 148,600 | | | 3,667,448 |
Bel Fuse Cl. A | | 2,000 | | | 60,340 | | Solar Integrated Technologies a | | 75,000 | | | 54,335 |
C & D Technologies c | | 345,700 | | | 1,638,618 | | | | | | | |
22 | 2006 ANNUAL REPORT TO STOCKHOLDERS | THE ACCOMPANYING NOTES ARE AN INTEGRAL PART OF THESE FINANCIAL STATEMENTS. |
DECEMBER 31, 2006
| | | SHARES | | | VALUE | | | | SHARES | | | VALUE |
Industrial Products (continued) | | | | | | | Printing - 0.1% | | | | | |
Other Industrial Products (continued) | | | | | | | Bowne & Co. | | 68,100 | | $ | 1,085,514 |
†Waters Corporation a | | 75,990 | | $ | 3,721,230 | | | | | |
|
| | | | |
| | Transportation and Logistics - 3.4% | | | | | |
| | | | | | 34,990,253 | | Alexander & Baldwin | | 60,000 | | | 2,660,400 |
| | | | |
| | Arkansas Best | | 1,200 | | | 43,200 |
Total (Cost $110,610,487) | | | | | 209,082,958 | | Atlas Air Worldwide Holdings a,c | | 17,000 | | | 756,500 |
| | | | |
| | C. H. Robinson Worldwide | | 80,000 | | | 3,271,200 |
Industrial Services – 13.0% | | | | | | | EGL a,c | | 123,125 | | | 3,666,662 |
Advertising and Publishing - 0.8% | | | | | | | Forward Air | | 234,750 | | | 6,791,318 |
Interpublic Group of Companies a,c | | 510,000 | | | 6,242,400 | | Frozen Food Express Industries | | 286,635 | | | 2,465,061 |
Lamar Advertising Cl. A a,c | | 26,000 | | | 1,700,140 | | Hub Group Cl. A a,c | | 174,400 | | | 4,804,720 |
MDC Partners Cl. A a | | 60,000 | | | 444,000 | | Landstar System | | 11,200 | | | 427,616 |
ValueClick a | | 45,000 | | | 1,063,350 | | Patriot Transportation Holding a | | 96,300 | | | 8,990,568 |
| | | | |
| | UTI Worldwide | | 105,000 | | | 3,139,500 |
| | | | | | 9,449,890 | | Universal Truckload Services a | | 115,100 | | | 2,733,625 |
| | | | |
| | | | | |
|
Commercial Services - 4.7% | | | | | | | | | | | | 39,750,370 |
ABM Industries | | 134,800 | | | 3,061,308 | | | | | |
|
†Acquicor Technology (Units) a | | 600,000 | | | 4,350,000 | | Other Industrial Services - 0.5% | | | | | |
Allied Waste Industries a | | 188,800 | | | 2,320,352 | | Landauer | | 117,900 | | | 6,186,213 |
Anacomp Cl. A a | | 26,000 | | | 218,400 | | | | | |
|
BB Holdings a | | 194,900 | | | 562,881 | | Total (Cost $83,177,831) | | | | | 153,000,207 |
Bennett Environmental a,c | | 20,900 | | | 16,720 | | | | | |
|
Central Parking | | 18,300 | | | 329,400 | | Natural Resources – 10.3% | | | | | |
Convergys Corporation a | | 121,000 | | | 2,877,380 | | Energy Services - 4.0% | | | | | |
Copart a | | 158,100 | | | 4,743,000 | | Atwood Oceanics a,c | | 29,400 | | | 1,439,718 |
eResearch Technology a,c | | 181,000 | | | 1,218,130 | | Carbo Ceramics | | 158,400 | | | 5,919,408 |
First Advantage Cl. A a,c | | 5,000 | | | 114,800 | | Core Laboratories a | | 10,000 | | | 810,000 |
Global Imaging Systems a | | 100,000 | | | 2,195,000 | | Environmental Power a | | 326,000 | | | 2,885,100 |
Grupo Aeroportuario del Sureste ADR | | 36,900 | | | 1,567,143 | | Global Industries a | | 54,500 | | | 710,680 |
Hewitt Associates Cl. A a,c | | 164,620 | | | 4,238,965 | | Hanover Compressor a,c | | 360,000 | | | 6,800,400 |
Iron Mountain a,c | | 156,175 | | | 6,456,275 | | Helmerich & Payne | | 80,600 | | | 1,972,282 |
Learning Tree International a,c | | 53,400 | | | 474,726 | | Hydril a,c | | 25,000 | | | 1,879,750 |
MPS Group a | | 564,600 | | | 8,006,028 | | Input/Output a | | 494,100 | | | 6,734,583 |
Manpower | | 105,800 | | | 7,927,594 | | TETRA Technologies a,c | | 68,000 | | | 1,739,440 |
New Horizons Worldwide a | | 228,600 | | | 240,030 | | Universal Compression Holdings a | | 195,100 | | | 12,117,661 |
Rollins | | 130,500 | | | 2,885,355 | | Willbros Group a,c | | 207,600 | | | 3,923,640 |
Spherion Corporation a,c | | 53,000 | | | 393,790 | | | | | |
|
TRC Companies a | | 3,600 | | | 31,068 | | | | | | | 46,932,662 |
Viad Corporation | | 9,025 | | | 366,415 | | | | | |
|
Wright Express a,c | | 30,000 | | | 935,100 | | Oil and Gas - 2.5% | | | | | |
| | | | |
| | Bill Barrett a,c | | 50,000 | | | 1,360,500 |
| | | | | | 55,529,860 | | †Carrizo Oil & Gas a,c | | 41,700 | | | 1,210,134 |
| | | | |
| | Cimarex Energy | | 193,990 | | | 7,080,635 |
Engineering and Construction - 1.1% | | | | | | | †FX Energy a,c | | 20,000 | | | 123,400 |
Dycom Industries a,c | | 35,500 | | | 749,760 | | Falcon Oil & Gas a | | 360,000 | | | 1,179,265 |
Fleetwood Enterprises a | | 234,300 | | | 1,853,313 | | †Helix Energy Solutions Group a,c | | 34,226 | | | 1,073,670 |
Insituform Technologies Cl. A a,c | | 174,300 | | | 4,507,398 | | Particle Drilling Technologies a | | 61,500 | | | 263,220 |
Washington Group International a | | 100,000 | | | 5,979,000 | | Penn Virginia | | 16,440 | | | 1,151,458 |
| | | | |
| | PetroCorp a,d | | 61,400 | | | 0 |
| | | | | | 13,089,471 | | Pioneer Drilling a,c | | 1,800 | | | 23,904 |
| | | | |
| | SEACOR Holdings a,c | | 151,500 | | | 15,019,710 |
Food and Tobacco Processors - 0.5% | | | | | | | †Storm Cat Energy a,c | | 330,800 | | | 393,652 |
American Italian Pasta Cl. A a | | 10,000 | | | 89,500 | | W&T Offshore | | 25,000 | | | 768,000 |
MGP Ingredients | | 127,400 | | | 2,880,514 | | | | | |
|
Performance Food Group a | | 10,000 | | | 276,400 | | | | | | | 29,647,548 |
Seneca Foods Cl. A a | | 71,500 | | | 1,737,450 | | | | | |
|
Seneca Foods Cl. B a | | 13,251 | | | 321,999 | | Precious Metals and Mining - 2.2% | | | | | |
| | | | |
| | Agnico-Eagle Mines | | 34,000 | | | 1,402,160 |
| | | | | | 5,305,863 | | Bema Gold a,c | | 248,000 | | | 1,302,000 |
| | | | |
| | Constellation Copper a | | 186,900 | | | 230,790 |
Industrial Distribution - 1.9% | | | | | | | Entree Gold a | | 90,000 | | | 139,500 |
Central Steel & Wire | | 6,662 | | | 4,030,510 | | Etruscan Resources a | | 675,900 | | | 2,214,070 |
MSC Industrial Direct Cl. A | | 20,000 | | | 783,000 | | Gammon Lake Resources a,c | | 188,300 | | | 3,067,407 |
Ritchie Bros. Auctioneers | | 310,400 | | | 16,618,816 | | Golden Star Resources a,c | | 175,000 | | | 516,250 |
Strategic Distribution a | | 115,000 | | | 1,170,700 | | Hecla Mining a,c | | 598,000 | | | 4,580,680 |
| | | | |
| | | | | | | |
| | | | | | 22,603,026 | | | | | | | |
| | | | |
| | | | | | | |
| THE ACCOMPANYING NOTES ARE AN INTEGRAL PART OF THESE FINANCIAL STATEMENTS. |
2006 ANNUAL REPORT TO STOCKHOLDERS | 23 |
ROYCE VALUE TRUST
| | | SHARES | | | VALUE | | | | SHARES | | | VALUE |
Natural Resources (continued) | | | | | | | UQM Technologies a,c | | 50,000 | | $ | 137,000 |
Precious Metals and Mining (continued) | | | | | | | Vishay Intertechnology a,c | | 186,000 | | | 2,518,440 |
IAMGOLD Corporation | | 300,620 | | $ | 2,648,462 | | Zebra Technologies Cl. A a,c | | 76,525 | | | 2,662,305 |
†International Coal Group a,c | | 189,000 | | | 1,030,050 | | | | | |
|
Ivanhoe Mines a,c | | 140,000 | | | 1,376,200 | | | | | | | 70,198,554 |
Meridian Gold a,c | | 111,000 | | | 3,084,690 | | | | | |
|
Miramar Mining a | | 245,000 | | | 1,107,400 | | Distribution - 1.5% | | | | | |
Pan American Silver a,c | | 41,000 | | | 1,031,970 | | Agilysys | | 165,125 | | | 2,764,192 |
QGX a | | 30,000 | | | 47,078 | | Anixter International a | | 61,795 | | | 3,355,468 |
Randgold Resources ADR a,c | | 53,000 | | | 1,243,380 | | Benchmark Electronics a,c | | 208,200 | | | 5,071,752 |
Stillwater Mining a,c | | 10,780 | | | 134,642 | | Solectron Corporation a,c | | 1,070,100 | | | 3,445,722 |
Yamana Gold | | 80,000 | | | 1,054,400 | | Tech Data a,c | | 86,500 | | | 3,275,755 |
| | | | |
| | | | | |
|
| | | | | | 26,211,129 | | | | | | | 17,912,889 |
| | | | |
| | | | | |
|
Real Estate - 1.4% | | | | | | | Internet Software and Services - 1.9% | | | | | |
Alico | | 27,000 | | | 1,367,010 | | Arbinet-thexchange a | | 87,200 | | | 478,728 |
Consolidated-Tomoka Land | | 13,564 | | | 982,034 | | CMGI a,c | | 1,535,000 | | | 2,056,900 |
†Realogy Corporation a,c | | 300,000 | | | 9,096,000 | | CNET Networks a,c | | 155,400 | | | 1,412,586 |
The St. Joe Company | | 98,900 | | | 5,298,073 | | CryptoLogic | | 137,000 | | | 3,178,400 |
| | | | |
| | CyberSource Corporation a,c | | 10,000 | | | 110,200 |
| | | | | | 16,743,117 | | EarthLink a,c | | 55,200 | | | 391,920 |
| | | | |
| | Internap Network Services a,c | | 144,890 | | | 2,878,964 |
Other Natural Resources - 0.2% | | | | | | | †j2 Global Communications a,c | | 43,420 | | | 1,183,195 |
PICO Holdings a | | 55,200 | | | 1,919,304 | | Jupitermedia Corporation a,c | | 500,000 | | | 3,960,000 |
| | | | |
| | Lionbridge Technologies a | | 37,500 | | | 241,500 |
Total (Cost $71,041,325) | | | | | 121,453,760 | | †NetEase.com ADR a,c | | 100,000 | | | 1,869,000 |
| | | | |
| | RealNetworks a,c | | 245,400 | | | 2,684,676 |
Technology – 24.2% | | | | | | | S1 Corporation a | | 5,054 | | | 27,848 |
Aerospace and Defense - 0.6% | | | | | | | SupportSoft a | | 220,000 | | | 1,205,600 |
Allied Defense Group (The) a | | 45,700 | | | 971,125 | | | | | |
|
Armor Holdings a,c | | 11,410 | | | 625,839 | | | | | | | 21,679,517 |
Astronics Corporation a | | 52,400 | | | 896,564 | | | | | |
|
Axsys Technologies a | | 10,000 | | | 175,700 | | IT Services - 4.1% | | | | | |
Ducommun a | | 117,200 | | | 2,681,536 | | answerthink a | | 655,000 | | | 2,017,400 |
Hexcel Corporation a,c | | 47,500 | | | 826,975 | | BearingPoint a,c | | 788,800 | | | 6,207,856 |
Integral Systems | | 49,800 | | | 1,153,866 | | Black Box | | 47,000 | | | 1,973,530 |
| | | | |
| | CACI International Cl. A a,c | | 10,000 | | | 565,000 |
| | | | | | 7,331,605 | | CIBER a,c | | 10,000 | | | 67,800 |
| | | | |
| | Cogent Communications Group a,c | | 226,900 | | | 3,680,318 |
Components and Systems - 6.0% | | | | | | | Computer Task Group a | | 101,100 | | | 480,225 |
Analogic Corporation | | 40,135 | | | 2,253,179 | | Covansys Corporation a | | 188,900 | | | 4,335,255 |
Belden CDT | | 57,800 | | | 2,259,402 | | Diamond Management & | | | | | |
Checkpoint Systems a | | 56,060 | | | 1,132,412 | | Technology Consultants | | 80,400 | | | 1,000,176 |
Dionex Corporation a | | 81,000 | | | 4,593,510 | | Forrester Research a | | 40,300 | | | 1,092,533 |
Electronics for Imaging a,c | | 25,000 | | | 664,500 | | Gartner a | | 126,000 | | | 2,493,540 |
Energy Conversion Devices a,c | | 105,500 | | | 3,584,890 | | Keane a | | 468,000 | | | 5,573,880 |
Excel Technology a | | 168,500 | | | 4,311,915 | | MAXIMUS | | 127,900 | | | 3,936,762 |
Hutchinson Technology a,c | | 47,500 | | | 1,119,575 | | Perot Systems Cl. A a,c | | 165,100 | | | 2,705,989 |
Imation Corporation | | 15,700 | | | 728,951 | | Sapient Corporation a,c | | 806,602 | | | 4,428,245 |
InFocus Corporation a | | 228,100 | | | 609,027 | | Syntel | | 152,679 | | | 4,091,797 |
KEMET Corporation a | | 95,600 | | | 697,880 | | TriZetto Group (The) a,c | | 215,200 | | | 3,953,224 |
Kronos a | | 38,775 | | | 1,424,594 | | | | | |
|
Methode Electronics | | 50,000 | | | 541,500 | | | | | | | 48,603,530 |
Newport Corporation a,c | | 592,200 | | | 12,406,590 | | | | | |
|
On Track Innovations a,c | | 40,000 | | | 276,200 | | Semiconductors and Equipment - 3.6% | | | | | |
Perceptron a | | 397,400 | | | 3,365,978 | | Axcelis Technologies a | | 135,000 | | | 787,050 |
Plexus Corporation a,c | | 325,700 | | | 7,777,716 | | BE Semiconductor Industries a | | 58,000 | | | 341,620 |
Power-One a,c | | 10,000 | | | 72,800 | | Brooks Automation a,c | | 28,500 | | | 410,400 |
REMEC | | 143,387 | | | 189,271 | | Cabot Microelectronics a | | 131,200 | | | 4,452,928 |
Radiant Systems a,c | | 32,500 | | | 339,300 | | Catalyst Semiconductor a | | 200 | | | 688 |
Richardson Electronics | | 116,700 | | | 1,063,137 | | CEVA a | | 31,666 | | | 204,879 |
SafeNet a,c | | 36,240 | | | 867,586 | | Cognex Corporation | | 197,700 | | | 4,709,214 |
TTM Technologies a | | 221,400 | | | 2,508,462 | | Conexant Systems a | | 11,980 | | | 24,439 |
Technitrol | | 311,200 | | | 7,434,568 | | Credence Systems a,c | | 53,600 | | | 278,720 |
Tektronix | | 159,680 | | | 4,657,866 | | DSP Group a | | 115,000 | | | 2,495,500 |
| | | | | | | | DTS a | | 64,100 | | | 1,550,579 |
24 | 2006 ANNUAL REPORT TO STOCKHOLDERS | THE ACCOMPANYING NOTES ARE AN INTEGRAL PART OF THESE FINANCIAL STATEMENTS. |
DECEMBER 31, 2006
| | | SHARES | | | VALUE | | | | SHARES | | | VALUE |
Technology (continued) | | | | | | | Sycamore Networks a | | 171,000 | | $ | 642,960 |
Semiconductors and Equipment (continued) | | | | | | | Time Warner Telecom Cl. A a,c | | 179,000 | | | 3,567,470 |
†Diodes a,c | | 167,900 | | $ | 5,957,092 | | Tollgrade Communications a | | 20,000 | | | 211,400 |
Dolby Laboratories Cl. A a | | 83,900 | | | 2,602,578 | | USA Mobility | | 97,500 | | | 2,181,075 |
Exar Corporation a,c | | 231,976 | | | 3,015,688 | | †Vonage Holdings a | | 100,000 | | | 694,000 |
Fairchild Semiconductor International a,c | | 51,200 | | | 860,672 | | | | | |
|
International Rectifier a,c | | 120,000 | | | 4,623,600 | | | | | | | 34,250,998 |
Intevac a | | 57,450 | | | 1,490,827 | | | | | |
|
†IXYS Corporation a | | 10,000 | | | 89,000 | | Total (Cost $209,667,396) | | | | | 285,682,412 |
Kulicke & Soffa Industries a,c | | 105,800 | | | 888,720 | | | | | |
|
Novellus Systems a,c | | 12,000 | | | 413,040 | | Utilities – 0.2% | | | | | |
Pericom Semiconductor a | | 58,000 | | | 665,260 | | CH Energy Group | | 44,500 | | | 2,349,600 |
Power Integrations a | | 49,000 | | | 1,141,700 | | Southern Union | | 11,576 | | | 323,549 |
Sanmina-SCI Corporation a | | 200,000 | | | 690,000 | | | | | |
|
Semitool a,c | | 50,000 | | | 665,500 | | Total (Cost $2,127,413) | | | | | 2,673,149 |
Staktek Holdings a | | 184,700 | | | 951,205 | | | | | |
|
Veeco Instruments a,c | | 65,000 | | | 1,217,450 | | Miscellaneous e – 5.0% | | | | | |
†Xilinx | | 100,000 | | | 2,381,000 | | Total (Cost $55,508,821) | | | | | 58,451,714 |
| | | | |
| | | | | |
|
| | | | | | 42,909,349 | | TOTAL COMMON STOCKS | | | | | |
| | | | |
| | (Cost $820,161,213) | | | | | 1,273,460,741 |
Software - 3.6% | | | | | | | | | | |
|
Advent Software a,c | | 116,800 | | | 4,121,872 | | PREFERRED STOCKS – 0.1% | | | | | |
ANSYS a | | 50,000 | | | 2,174,500 | | Aristotle Corporation 11.00% Conv. | | 4,800 | | | 40,080 |
Aspen Technology a | | 27,100 | | | 298,642 | | Seneca Foods Conv. a | | 300 | | | 7,020 |
†Avid Technology a,c | | 30,000 | | | 1,117,800 | | Seneca Foods Conv. a,d | | 85,000 | | | 1,858,950 |
†BEA Systems a | | 65,610 | | | 825,374 | | | | | |
|
†Borland Software a,c | | 270,000 | | | 1,468,800 | | TOTAL PREFERRED STOCKS | | | | | |
†Epicor Software a,c | | 79,900 | | | 1,079,449 | | (Cost $1,316,015) | | | | | 1,906,050 |
iPass a,c | | 268,400 | | | 1,578,192 | | | | | |
|
JDA Software Group a,c | | 99,900 | | | 1,375,623 | | | | PRINCIPAL | | | |
MSC.Software a | | 70,000 | | | 1,066,100 | | | | AMOUNT | | | |
ManTech International Cl. A a | | 119,400 | | | 4,397,502 | | CORPORATE BONDS – 0.1% | | | | | |
NAVTEQ Corporation a,c | | 70,000 | | | 2,447,900 | | Dixie Group 7.00% | | | | | |
†Net 1 UEPS Technologies a | | 105,000 | | | 3,103,800 | | Conv. Sub. Deb. due 5/15/12 | | $397,000 | | | 379,135 |
PLATO Learning a,c | | 149,642 | | | 809,563 | | | | | |
|
Progress Software a,c | | 30,500 | | | 851,865 | | TOTAL CORPORATE BONDS | | | | | |
SPSS a | | 179,600 | | | 5,400,572 | | (Cost $326,101) | | | | | 379,135 |
Sybase a,c | | 82,600 | | | 2,040,220 | | | | | |
|
†THQ a | | 20,000 | | | 650,400 | | REPURCHASE AGREEMENTS – 10.7% | | | | | |
Transaction Systems Architects Cl. A a,c | | 203,150 | | | 6,616,596 | | State Street Bank & Trust Company, | | | | | |
Verint Systems a,c | | 40,000 | | | 1,371,200 | | 5.10% dated 12/29/06, due 1/2/07, | | | | | |
| | | | |
| | maturity value $46,292,217 (collateralized | | | | | |
| | | | | | 42,795,970 | | by obligations of various U.S. Government | | | | | |
| | | | |
| | Agencies, valued at $47,426,931) | | | | | |
Telecommunications - 2.9% | | | | | | | (Cost $46,266,000) | | | | | 46,266,000 |
Adaptec a,c | | 2,584,100 | | | 12,041,906 | | | | | |
|
ADTRAN | | 65,000 | | | 1,475,500 | | Lehman Brothers (Tri-Party), | | | | | |
Broadwing Corporation a | | 1,000 | | | 15,620 | | 5.15% dated 12/29/06, due 1/3/07, | | | | | |
Catapult Communications a,c | | 87,100 | | | 782,158 | | maturity value $80,057,222 (collateralized | | | | | |
Covad Communications Group a,c | | 35,000 | | | 48,300 | | by obligations of various U.S. Government | | | | | |
Foundry Networks a,c | | 373,400 | | | 5,593,532 | | Agencies, valued at $81,650,071) | | | | | |
†Globalstar a,c | | 50,000 | | | 695,500 | | (Cost $80,000,000) | | | | | 80,000,000 |
Globecomm Systems a | | 233,700 | | | 2,058,897 | | | | | |
|
IDT Corporation a | | 78,400 | | | 1,060,752 | | TOTAL REPURCHASE AGREEMENTS | | | | | |
IDT Corporation Cl. B a,c | | 65,000 | | | 850,200 | | (Cost $126,266,000) | | | | | 126,266,000 |
Level 3 Communications a | | 400,000 | | | 2,240,000 | | | | | |
|
PECO II a | | 93,600 | | | 91,728 | | | | | | | |
| THE ACCOMPANYING NOTES ARE AN INTEGRAL PART OF THESE FINANCIAL STATEMENTS. |
2006 ANNUAL REPORT TO STOCKHOLDERS | 25 |
| ROYCE VALUE TRUST | DECEMBER 31, 2006 |
|
| | | PRINCIPAL | | | | |
| | | AMOUNT | | | VALUE | |
COLLATERAL RECEIVED FOR SECURITIES
LOANED – 9.1% | | | | | | | |
| U.S. Treasury Bonds | | | | | | | |
5.25%-8.125% due 8/15/19-2/15/29 | | | $155,067 | | $ | 158,240 | |
| Money Market Funds | | | | | | | |
State Street Navigator Securities Lending | | | | | | | |
Prime Portfolio (7 day yield-5.25%) | | | | | | 108,178,797 | |
| | | | | |
| |
TOTAL COLLATERAL RECEIVED FOR
SECURITIES LOANED | | | | | | | |
(Cost $108,337,037) | | | | | | 108,337,037 | |
| | | | | |
| |
TOTAL INVESTMENTS – 127.9% | | | | | | | |
(Cost $1,056,406,366) | | | | | | 1,510,348,963 | |
| | | | | | | | |
LIABILITIES LESS CASH
AND OTHER ASSETS – (9.3)% | | | | | | (109,921,400 | ) |
| | | | | | | | |
PREFERRED STOCK – (18.6)% | | | | | | (220,000,000 | ) |
| | | | | |
| |
NET ASSETS APPLICABLE TO
COMMON STOCKHOLDERS – 100.0% | | | | | $ | 1,180,427,563 | |
| | | | | |
| |
|
| a | | Non-income producing. |
| | | |
| b | | At December 31, 2006, the Fund owned 5% or more of the Company’s outstanding voting securities thereby making the Company an Affiliated Company as that term is defined in the Investment Company Act of 1940. |
| | | |
| c | | All or a portion of these securities were on loan at December 31, 2006. Total market value of loaned securities at December 31, 2006 was $104,771,383. |
| | | |
| d | | Securities for which market quotations are no longer readily available represent 0.2% of net assets. These securities have been valued at their fair value under procedures established by the Fund’s Board of Directors. |
| | | |
| e | | Includes securities first acquired in 2006 and less than 1% of net assets applicable to Common Stockholders. |
| | | |
| † | | New additions in 2006. |
| | | |
| | | Bold indicates the Fund’s largest 20 equity holdings in terms of December 31, 2006 market value. |
| | | |
| INCOME TAX INFORMATION: The cost of total investments for Federal income tax purposes was $1,059,579,730. At December 31, 2006, net unrealized appreciation for all securities was $450,769,233, consisting of aggregate gross unrealized appreciation of $486,963,015 and aggregate gross unrealized depreciation of $36,193,782. The primary difference in book and tax basis cost is the timing of the recognition of losses on securities sold. |
|
26 | 2006 ANNUAL REPORT TO STOCKHOLDERS | THE ACCOMPANYING NOTES ARE AN INTEGRAL PART OF THESE FINANCIAL STATEMENTS. |
| ROYCE VALUE TRUST | DECEMBER 31, 2006 |
|
|
Statement of Assets and Liabilities |
|
| ASSETS: | | | | |
| Investments at value (including collateral on loaned securities)* | | | | |
Non-Affiliates (cost $928,342,916) | | $ | 1,377,721,163 | |
Affiliated Companies (cost $1,797,450) | | | 6,361,800 | |
|
| Total investments at value | | | 1,384,082,963 | |
| Repurchase agreements (at cost and value) | | | 126,266,000 | |
| Cash | | | 4,218,269 | |
| Receivable for investments sold | | | 163,233 | |
| Receivable for dividends and interest | | | 960,473 | |
| Prepaid expenses and other assets | | | 185,168 | |
|
Total Assets | | | 1,515,876,106 | |
|
| LIABILITIES: | | | | |
| Payable for collateral on loaned securities | | | 108,337,037 | |
| Payable for investments purchased | | | 5,359,899 | |
| Payable for investment advisory fee | | | 1,205,995 | |
| Preferred dividends accrued but not yet declared | | | 288,453 | |
| Accrued expenses | | | 257,159 | |
|
Total Liabilities | | | 115,448,543 | |
|
| PREFERRED STOCK: | | | | |
| 5.90% Cumulative Preferred Stock - $0.001 par value, $25 liquidation value per share; 8,800,000 shares outstanding | | | 220,000,000 | |
|
Total Preferred Stock | | | 220,000,000 | |
|
| NET ASSETS APPLICABLE TO COMMON STOCKHOLDERS | | $ | 1,180,427,563 | |
|
| ANALYSIS OF NET ASSETS APPLICABLE TO COMMON STOCKHOLDERS: | | | | |
| Common Stock paid-in capital - $0.001 par value per share; 57,258,821 shares outstanding (150,000,000 shares authorized) | | $ | 715,035,482 | |
| Undistributed net investment income (loss) | | | (1,605,284 | ) |
| Accumulated net realized gain (loss) on investments and foreign currency | | | 13,346,011 | |
| Net unrealized appreciation (depreciation) on investments and foreign currency | | | 453,939,803 | |
| Preferred dividends accrued but not yet declared | | | (288,449 | ) |
|
Net Assets applicable to Common Stockholders (net asset value per share - $20.62) | | $ | 1,180,427,563 | |
|
| *Investments at identified cost (including $108,337,037 of collateral on loaned securities) | | $ | 930,140,366 | |
|
| Market value of loaned securities | | $ | 104,771,383 | |
|
| THE ACCOMPANYING NOTES ARE AN INTEGRAL PART OF THESE FINANCIAL STATEMENTS. |
2006 ANNUAL REPORT TO STOCKHOLDERS | 27 |
| ROYCE VALUE TRUST | YEAR ENDED DECEMBER 31, 2006 |
|
| INVESTMENT INCOME: | | | | |
| Income: | | | | |
Dividends* | | | | |
Non-Affiliates | | $ | 10,707,136 | |
Interest | | | 10,258,813 | |
Securities lending | | | 477,117 | |
|
| Total income | | | 21,443,066 | |
|
| Expenses: | | | | |
Investment advisory fees | | | 13,401,430 | |
Stockholder reports | | | 434,669 | |
Custody and transfer agent fees | | | 222,874 | |
Directors’ fees | | | 118,181 | |
Administrative and office facilities expenses | | | 104,740 | |
Professional fees | | | 58,230 | |
Other expenses | | | 114,509 | |
|
| Total expenses | | | 14,454,633 | |
| Compensating balance credits | | | (8,259 | ) |
|
| Net expenses | | | 14,446,374 | |
|
| Net investment income (loss) | | | 6,996,692 | |
|
| REALIZED AND UNREALIZED GAIN (LOSS) ON INVESTMENTS AND FOREIGN CURRENCY: | | | | |
| Net realized gain (loss) on investments and foreign currency | | | | |
Non-Affiliates | | | 109,962,913 | |
Affiliated Companies | | | 206,529 | |
| Net change in unrealized appreciation (depreciation) on investments and foreign currency | | | 93,033,099 | |
|
| Net realized and unrealized gain (loss) on investments and foreign currency | | | 203,202,541 | |
|
| NET INCREASE (DECREASE) IN NET ASSETS RESULTING FROM INVESTMENT OPERATIONS | | | 210,199,233 | |
|
| DISTRIBUTIONS TO PREFERRED STOCKHOLDERS | | | (12,980,000 | ) |
|
| NET INCREASE (DECREASE) IN NET ASSETS APPLICABLE TO COMMON STOCKHOLDERS | | | | |
RESULTING FROM INVESTMENT OPERATIONS | | $ | 197,219,233 | |
|
| *Net of foreign withholding tax of $86,148. | | | | |
28 | 2006 ANNUAL REPORT TO STOCKHOLDERS | THE ACCOMPANYING NOTES ARE AN INTEGRAL PART OF THESE FINANCIAL STATEMENTS. |
|
Statement of Changes in Net Assets |
|
|
| | | | Year ended | | | | | Year ended | |
| | | | 12/31/06 | | | | | 12/31/05 | |
|
| INVESTMENT OPERATIONS: | | | | | | | | | |
| Net investment income (loss) | | $ | 6,996,692 | | | | $ | 321,412 | |
| Net realized gain (loss) on investments and foreign currency | | | 110,169,442 | | | | | 99,178,811 | |
| Net change in unrealized appreciation (depreciation) on investments and foreign currency | | | 93,033,099 | | | | | (4,983,024 | ) |
|
| Net increase (decrease) in net assets resulting from investment operations | | | 210,199,233 | | | | | 94,517,199 | |
|
| DISTRIBUTIONS TO PREFERRED STOCKHOLDERS: | | | | | | | | | |
| Net investment income | | | (1,020,228 | ) | | | | – | |
| Net realized gain on investments and foreign currency | | | (11,959,772 | ) | | | | (12,980,000 | ) |
|
| Total distributions to Preferred Stockholders | | | (12,980,000 | ) | | | | (12,980,000 | ) |
|
| NET INCREASE (DECREASE) IN NET ASSETS APPLICABLE TO COMMON STOCKHOLDERS | | | | | | | | | |
RESULTING FROM INVESTMENT OPERATIONS | | | 197,219,233 | | | | | 81,537,199 | |
|
| DISTRIBUTIONS TO COMMON STOCKHOLDERS: | | | | | | | | | |
| Net investment income | | | (7,788,658 | ) | | | | – | |
| Net realized gain on investments and foreign currency | | | (91,303,684 | ) | | | | (85,780,292 | ) |
|
| Total distributions to Common Stockholders | | | (99,092,342 | ) | | | | (85,780,292 | ) |
|
| CAPITAL STOCK TRANSACTIONS: | | | | | | | | | |
| Reinvestment of distributions to Common Stockholders | | | 50,180,586 | | | | | 43,058,750 | |
|
| Total capital stock transactions | | | 50,180,586 | | | | | 43,058,750 | |
|
| NET INCREASE (DECREASE) IN NET ASSETS APPLICABLE TO COMMON STOCKHOLDERS | | | 148,307,477 | | | | | 38,815,657 | |
|
| NET ASSETS APPLICABLE TO COMMON STOCKHOLDERS: | | | | | | | | | |
Beginning of year | | | 1,032,120,086 | | | | | 993,304,429 | |
|
End of year (including undistributed net investment income (loss) of $(1,605,284) at 12/31/06 | | | | | | | | | |
and $321,412 at 12/31/05) | | $ | 1,180,427,563 | | | | $ | 1,032,120,086 | |
|
| THE ACCOMPANYING NOTES ARE AN INTEGRAL PART OF THESE FINANCIAL STATEMENTS. |
2006 ANNUAL REPORT TO STOCKHOLDERS | 29 |
ROYCE VALUE TRUST
This table is presented to show selected data for a share of Common Stock outstanding throughout each period, and to assist stockholders in evaluating the Fund’s performance for the periods presented.
| | | Years ended December 31, |
| | |
|
| | | | 2006 | | | | 2005 | | | | 2004 | | | | 2003 | | | | 2002 | |
|
| NET ASSET VALUE, BEGINNING OF PERIOD | | | $18.87 | | | | $18.95 | | | | $17.03 | | | | $13.22 | | | | $17.31 | |
|
| INVESTMENT OPERATIONS: | | | | | | | | | | | | | | | | | | | | |
Net investment income (loss) | | | 0.13 | | | | 0.01 | | | | (0.08 | ) | | | (0.05 | ) | | | (0.02 | ) |
Net realized and unrealized gain (loss) on investments and foreign currency | | | 3.63 | | | | 1.75 | | | | 3.81 | | | | 5.64 | | | | (2.25 | ) |
|
Total investment operations | | | 3.76 | | | | 1.76 | | | | 3.73 | | | | 5.59 | | | | (2.27 | ) |
|
| DISTRIBUTIONS TO PREFERRED STOCKHOLDERS: | | | | | | | | | | | | | | | | | | | | |
Net investment income | | | (0.02 | ) | | | – | | | | – | | | | – | | | | (0.01 | ) |
Net realized gain on investments and foreign currency | | | (0.21 | ) | | | (0.24 | ) | | | (0.26 | ) | | | (0.26 | ) | | | (0.28 | ) |
|
Total distributions to Preferred Stockholders | | | (0.23 | ) | | | (0.24 | ) | | | (0.26 | ) | | | (0.26 | ) | | | (0.29 | ) |
|
| NET INCREASE (DECREASE) IN NET ASSETS APPLICABLE TO COMMON | | | | | | | | | | | | | | | | | | | | |
STOCKHOLDERS RESULTING FROM INVESTMENT OPERATIONS | | | 3.53 | | | | 1.52 | | | | 3.47 | | | | 5.33 | | | | (2.56 | ) |
|
| DISTRIBUTIONS TO COMMON STOCKHOLDERS: | | | | | | | | | | | | | | | | | | | | |
Net investment income | | | (0.14 | ) | | | – | | | | – | | | | – | | | | (0.07 | ) |
Net realized gain on investments and foreign currency | | | (1.64 | ) | | | (1.61 | ) | | | (1.55 | ) | | | (1.30 | ) | | | (1.44 | ) |
|
Total distributions to Common Stockholders | | | (1.78 | ) | | | (1.61 | ) | | | (1.55 | ) | | | (1.30 | ) | | | (1.51 | ) |
|
| CAPITAL STOCK TRANSACTIONS: | | | | | | | | | | | | | | | | | | | | |
Effect of reinvestment of distributions by Common Stockholders | | | (0.00 | ) | | | 0.01 | | | | 0.00 | | | | (0.00 | ) | | | (0.02 | ) |
Effect of rights offering and Preferred Stock offering | | | – | | | | – | | | | – | | | | (0.22 | ) | | | – | |
|
Total capital stock transactions | | | (0.00 | ) | | | 0.01 | | | | 0.00 | | | | (0.22 | ) | | | (0.02 | ) |
|
| NET ASSET VALUE, END OF PERIOD | | | $20.62 | | | | $18.87 | | | | $18.95 | | | | $17.03 | | | | $13.22 | |
|
| MARKET VALUE, END OF PERIOD | | | $22.21 | | | | $20.08 | | | | $20.44 | | | | $17.21 | | | | $13.25 | |
|
| TOTAL RETURN (a): | | | | | | | | | | | | | | | | | | | | |
| Market Value | | | 20.96 | % | | | 6.95 | % | | | 29.60 | % | | | 41.96 | % | | | (6.87 | )% |
| Net Asset Value | | | 19.50 | % | | | 8.41 | % | | | 21.42 | % | | | 40.80 | % | | | (15.61 | )% |
| RATIOS BASED ON AVERAGE NET ASSETS APPLICABLE TO | | | | | | | | | | | | | | | | | | | | |
COMMON STOCKHOLDERS: | | | | | | | | | | | | | | | | | | | | |
| Total expenses (b,c) | | | 1.29 | % | | | 1.49 | % | | | 1.51 | % | | | 1.49 | % | | | 1.72 | % |
Management fee expense (d) | | | 1.20 | % | | | 1.37 | % | | | 1.39 | % | | | 1.34 | % | | | 1.56 | % |
Other operating expenses | | | 0.09 | % | | | 0.12 | % | | | 0.12 | % | | | 0.15 | % | | | 0.16 | % |
| Net investment income (loss) | | | 0.62 | % | | | 0.03 | % | | | (0.50 | )% | | | (0.36 | )% | | | (0.09 | )% |
| SUPPLEMENTAL DATA: | | | | | | | | | | | | | | | | | | | | |
| Net Assets Applicable to Common Stockholders, | | | | | | | | | | | | | | | | | | | | |
End of Period (in thousands) | | $ | 1,180,428 | | | $ | 1,032,120 | | | $ | 993,304 | | | $ | 850,773 | | | $ | 560,776 | |
| Liquidation Value of Preferred Stock, | | | | | | | | | | | | | | | | | | | | |
End of Period (in thousands) | | $ | 220,000 | | | $ | 220,000 | | | $ | 220,000 | | | $ | 220,000 | | | $ | 160,000 | |
| Portfolio Turnover Rate | | | 21 | % | | | 31 | % | | | 30 | % | | | 23 | % | | | 35 | % |
| PREFERRED STOCK: | | | | | | | | | | | | | | | | | | | | |
| Total shares outstanding | | | 8,800,000 | | | | 8,800,000 | | | | 8,800,000 | | | | 8,800,000 | | | | 6,400,000 | |
| Asset coverage per share | | | $159.14 | | | | $142.29 | | | | $137.88 | | | | $121.68 | | | | $112.62 | |
| Liquidation preference per share | | | $25.00 | | | | $25.00 | | | | $25.00 | | | | $25.00 | | | | $25.00 | |
| Average market value per share (e): | | | | | | | | | | | | | | | | | | | | |
5.90% Cumulative | | | $23.95 | | | | $24.75 | | | | $24.50 | | | | $25.04 | | | | – | |
7.80% Cumulative | | | – | | | | – | | | | – | | | | $25.87 | | | | $26.37 | |
7.30% Tax-Advantaged Cumulative | | | – | | | | – | | | | – | | | | $25.53 | | | | $25.82 | |
|
| (a) | | The Market Value Total Return is calculated assuming a purchase of Common Stock on the opening of the first business day and a sale on the closing of the last business day of each period reported. Dividends and distributions, if any, are assumed for the purposes of this calculation to be reinvested at prices obtained under the Fund’s Distribution Reinvestment and Cash Purchase Plan. Net Asset Value Total Return is calculated on the same basis, except that the Fund’s net asset value is used on the purchase and sale dates instead of market value. |
| (b) | | Expense ratios based on total average net assets including liquidation value of Preferred Stock were 1.08%, 1.22%, 1.21%, 1.19% and 1.38% for the periods ended December 31, 2006, 2005, 2004, 2003 and 2002, respectively. |
| (c) | | Expense ratios based on average net assets applicable to Common Stockholders before waiver of fees by the investment adviser would have been 1.62% and 1.82% for the periods ended December 31, 2003 and 2002, respectively. |
| (d) | | The management fee is calculated based on average net assets over a rolling 60-month basis, while the above ratios of Management Fee expenses are based on the average net assets applicable to Common Stockholders over a 12-month basis. |
| (e) | | The average of month-end market values during the period that the Preferred Stock was outstanding. |
| 30 | | | | | 2006 ANNUAL REPORT TO STOCKHOLDERS | | THE ACCOMPANYING NOTES ARE AN INTEGRAL PART OF THESE FINANCIAL STATEMENTS. |
| ROYCE VALUE TRUST | DECEMBER 31, 2006 |
|
|
| Notes to Financial Statements |
|
Summary of Significant Accounting Policies:
Royce Value Trust, Inc. (“the Fund”) was incorporated under the laws of the State of Maryland on July 1, 1986 as a diversified closed-end investment company. The Fund commenced operations on November 26, 1986.
The preparation of financial statements in conformity with accounting principles generally accepted in the United States of America requires management to make estimates and assumptions that affect the reported amounts of assets and liabilities and the disclosure of contingent assets and liabilities at the date of the financial statements, and the reported amounts of income and expenses during the reporting period. Actual results could differ from those estimates.
Valuation of Investments:
Securities are valued as of the close of trading on the New York Stock Exchange (generally 4:00 p.m. Eastern time) on the valuation date. Securities that trade on an exchange, and securities traded on Nasdaq’s Electronic Bulletin Board, are valued at their last r eported sales price or Nasdaq official closing price taken from the primary market in which each security trades or, if no sale is reported for such day, at their bid price. Other over-the-counter securities for which market quotations are readily available are valued at their highest bid price. Securities for which market quotations are not readily available are valued at their fair value under procedures established by the Fund’s Board of Directors. Bonds and other fixed income securities may be valued by reference to other securities with comparable ratings, interest rates and maturities, using established independent pricing services. Investments in money market funds are valued at net asset value per share.
Foreign Currency:
The Fund does not isolate that portion of the results of operations which result from changes in foreign exchange rates on invest ments from the portion arising from changes in market prices of securities held. Such fluctuations are included with net realized and unrealized gains and losses on investments.
Net realized foreign exchange gains or losses arise from sales and maturities of short-term securities, sales of foreign currencies, expiration of currency forward contracts, currency gains or losses realized between the trade and settlement dates on securities transactions, the difference between the amounts of dividends, interest, and foreign withholding taxes recorded on the Fund’s books, and the U.S. dollar equivalent of the amounts actually received or paid. Net unrealized foreign exchange gains and losses arise from changes in the value of assets and liabilities, including investments in securities at fiscal year end, as a result of changes in the exchange rates.
Investment Transactions and Related Investment Income:
Investment transactions are accounted for on the trade date. Dividend income is recorded on the ex-dividend date and any non-cash dividend income is recorded on the ex-dividend date at the fair market value of the securities received. Interest income is recorded on an accrual basis. Premium and discounts on debt securities are amortized using the effective yield to maturity method. Realized gains and losses from investment transactions are determined on the basis of identified cost for book and tax purposes. | | Expenses:
The Fund incurs direct and indirect expenses. Expenses directly attributable to the Fund are charged to the Fund’s operations, while expenses applicable to more than one of the Royce Funds are allocated in an equitable manner. Allocated personnel and occupancy costs related to The Royce Funds are included in administrative and office facilities expenses. The Fund has adopted a deferred fee agreement that allows the Fund’s Directors to defer the receipt of all or a portion of Directors’ Fees otherwise payable. The deferred fees are invested in certain Royce Funds until distributed in accordance with the agreement.
Compensating Balance Credits:
The Fund has an arrangement with its custodian bank, whereby a portion of the custodian’s fee is paid indirectly by credits earned on the Fund’s cash on deposit with the bank. This deposit arrangement is an alternative to purchasing overnight investments.
Taxes:
As a qualified regulated investment company under Subchapter M of the Internal Revenue Code, the Fund is not subject to income taxes to the extent that it distributes substantially all of its taxable income for its fiscal year. The Schedule of Investments includes information regarding income taxes under the caption “Income Tax Information”.
Distributions:
The Fund currently has a policy of paying quarterly distributions on the Fund’ s Common Stock. Distributions are currently being made at the annual rate of 9% of the rolling average of the prior four calendar quarter-end NAVs of the Fund’s Common Stock, with the fourth quarter distribution being the greater of 2.25% of the rolling average or the distribution required by IRS regulations. Distributions to Preferred Stockholders are accrued daily and paid quarterly and distributions to Common Stockholders are recorded on ex-dividend date. The Fund is required to allocate long-term capital gain distributions and other types of income proportionately to distributions made to holders of shares of Common Stock and Preferred Stock. To the extent that distributions are not paid from long-term capital gains, net investment income or net short-term capital gains, they will represent a return of capital. Distributions are determined in accordance with income tax regulations that may differ from accounting principles generally accepted in the United States of America. Permanent book and tax ba sis differences relating to stockholder distributions will result in reclassifications within the capital accounts. Undistributed net investment income may include temporary book and tax basis differences, which will reverse in a subsequent period. Any taxable income or gain remaining undistributed at fiscal year end is distributed in the following year.
Repurchase Agreements:
The Fund may enter into repurchase agreements with institutions that the Fund’s investment adviser has determined are creditworthy. The Fund |
2006 ANNUAL REPORT TO STOCKHOLDERS | 31 |
|
| Notes to Financial Statements (continued) |
|
restricts repurchase agreements to maturities of no more than seven days. Securities pledged as collateral for repurchase agreements, which are held until maturity of the repurchase agreements, are marked-to-market daily and maintained at a value at least equal to the principal amount of the repurchase agreement (including accrued interest). Repurchase agreements could involve certain risks in the event of default or insolvency of the counter-party, including possible delays or restrictions upon the ability of the Fund to dispose of the underlying securities.
Securities Lending:
The Fund loans securities to qualified institutional investors for the purpose of realizing additional income. Collateral on all securities loaned for the Fund is accepted in cash and cash equivalents and invested temporarily by the custodian. The collateral is equal to at least 100% of the current market value of the loaned securities. The market value of the loaned securities is determined at the close of business of the Fund and any additional required collateral is delivered to the Fund on the next business day.
New Accounting Pronouncements:
On July 13, 2006, the Financial Accounting Standards Board (“FASB”) released FASB Interpretation No. 48, “Accounting for Uncertainty in Income Taxes” (“FIN 48”). FIN 48 provides guidance for how uncertain tax positions should be recognized, measured, presented and disclosed in the financial statements. FIN 48 requires the evaluation of tax positions taken or expected to be taken in the course of preparing the Fund’s tax returns to determine whether the tax positions are “more-likely-than-not” of being sustained by the applicable tax authority. Tax positions not deemed to meet the more-likely-than-not threshold would be recorded as a tax benefit or expense in the current year. Adoption of FIN 48 is required to be implemented no later than the Fund’s June 29, 2007 NAV calculation and is to be applied to all open tax years as of the effective date. At this time, management is evaluating the implications of FIN 48 and its impact in the financial statements has not yet been determined.
On September 15, 2006, the FASB released Statement of Financial Accounting Standards No. 157, “Fair Value Measurement” (“FAS 157”) which provides enhanced guidance for using fair value to measure assets and liabilities. The standard requires companies to provide expanded information about the assets and liabilities measured at fair value and the potential effect of these fair valuations on an entity’s financial performance. The standard does not expand the use of fair value in any new circumstances, but provides clarification on acceptable fair valuation methods and applications. Adoption of FAS 157 is required for fiscal years beginning after November 15, 2007. The standard is not expected to materially impact the Fund’s financial statements.
Capital Stock:
The Fund issued 2,548,023 and 2,294,908 shares of Common Stock as reinvestment of distributions by Common Stockholders for the years ended December 31, 2006 and 2005, respectively.
At December 31, 2006, 8,800,000 shares of 5.90% Cumulative Preferred Stock were outstanding. Commencing October 9, 2008 and thereafter, the | | Fund, at its option, may redeem the Cumulative Preferred Stock, in whole or in part, at the redemption price. The Cumulative Preferred Stock is classified outside of permanent equity (net assets applicable to Common Stockholders) in the accompanying financial statements in accordance with Emerging Issues Task Force (EITF) Topic D-98, Classification and Measurement of Redeemable Securities, that requires preferred securities that are redeemable for cash or other assets to be classified outside of permanent equity to the extent that the redemption is at a fixed or determinable price and at the option of the holder or upon the occurrence of an event that is not solely within the control of the issuer.
The Fund is required to meet certain asset coverage tests with respect to the Cumulative Preferred Stock as required by the 1940 Act. In addition, pursuant to the Rating Agency Guidelines estab lished by Moody’s, the Fund is required to maintain a certain discounted asset coverage. If the Fund fails to meet these requirements and does not correct such failure, the Fund may be required to redeem, in part or in full, the Cumulative Preferred Stock at a redemption price of $25.00 per share, plus an amount equal to the accumulated and unpaid dividends, whether or not declared on such shares, in order to meet these requirements. Additionally, failure to meet the foregoing asset coverage requirements could restrict the Fund’s ability to pay dividends to Common Stockholders and could lead to sales of portfolio securities at inopportune times. The Fund has met these requirements since issuing the Cumulative Preferred Stock.
Investment Advisory Agreement:
As compensation for its services under the Investment Advisory Agreement, Royce & Associates, LL C (“Royce”) receives a fee comprised of a Basic Fee (“Basic Fee”) and an adjustment to the Basic Fee based on the investment performance of the Fund in relation to the investment record of the S&P SmallCap 600 Index (“S&P 600”).
The Basic Fee is a monthly fee equal to 1/12 of 1% (1% on an annualized basis) of the average of the Fund’s month-end net assets applicable to Common Stockholders, plus the liquidation value of Preferred Stock, for the rolling 60-month period ending with such month (the “performance period”). The Basic Fee for each month is increased or decreased at the rate of 1/12 of .05% for each percentage point that the investment performance of the Fund exceeds, or is exceeded by, the percentage change in the investment record of the S&P 600 for the performance period by more than two percentage points. The performance period for each such month is a rolling 60-month period ending with such month. The maximum in crease or decrease in the Basic Fee for any month may not exceed 1/12 of .5%. Accordingly, for each month, the maximum monthly fee rate as adjusted for performance is 1/12 of 1.5% and is payable if the investment performance of the Fund exceeds the percentage change in the investment record of the S&P 600 by 12 or more percentage points for the performance period, and the minimum monthly fee rate as adjusted for performance is 1/12 of .5% and is payable if the percentage change in the investment record of the S&P 600 exceeds the investment performance of the Fund by 12 or more percentage points for the performance period. |
32 | 2006 ANNUAL REPORT TO STOCKHOLDERS
Notwithstanding the foregoing, Royce is not entitled to receive any fee for any month when the investment performance of the Fund for the rolling 36-month period ending with such month is negative. In the event that the Fund’s investment performance for such a performance period is less than zero, Royce will not be required to refund to the Fund any fee earned in respect of any prior performance period.
Royce has voluntarily committed to waive the portion of its investment advisory fee attributable to an issue of the Fund’s Preferred Stock for any month in which the Fund’s average annual NAV total return since issuance | | of the Preferred Stock fails to exceed the applicable Preferred Stock’s dividend rate.
For the twelve rolling 60-month periods ending December 2006, the investment performance of the Fund exceeded the investment performance of the S&P 600 by 4% to 12%. Accordingly, the investment advisory fee consisted of a Basic Fee of $10,218,393 and an upward adjustment of $3,183,037 for performance of the Fund above that of the S&P 600. For the year ended December 31, 2006, the Fund accrued and paid Royce advisory fees totaling $13,401,430. |
Distributions to Stockholders:
The tax character of distributions paid to stockholders during 2006 and 2005 was as follows:
|
| Distributions paid from: | | | 2006 | | | | 2005 | |
| Ordinary income | | $ | 24,577,545 | | | $ | 11,811,731 | |
| Long-term capital gain | | | 87,494,797 | | | | 86,948,561 | |
| | |
|
| | | $ | 112,072,342 | | | $ | 98,760,292 | |
|
As of December 31, 2006, the tax basis components of distributable earnings included in stockholders’ equity were as follows:
|
| Undistributed long-term capital gain | | $ | 14,955,604 | |
| Unrealized appreciation | | | 450,766,439 | |
| Post October currency loss* | | | (41,513 | ) |
| Accrued preferred distributions | | | (288,449 | ) |
| | |
|
| | | $ | 465,392,081 | |
|
| *Under current tax law, capital and currency losses realized after October 31, and prior to the Fund’s fiscal year end, may be deferred as occurring on the first day of the following year. |
| | |
| | The difference between book basis and tax basis unrealized appreciation is attributable primarily to the tax deferral on wash sales and the unrealized gains on investments in Passive Foreign Investment Companies. |
| |
For financial reporting purposes, capital accounts and distributions to stockholders are adjusted to reflect the tax character of permanent book / tax differences. These differences are primarily due to differing treatments of income and gains on various investment securities and foreign currency transactions held by the Fund, timing differences and different characterization of distributions made by the Fund. For the year ended December 31, 2006, the Fund recorded the following permanent reclassifications, which relate primarily to the current net operating losses. Results of operations and net assets were not affected by these reclassifications.
|
|
| Undistributed | | | | Accumulated | | | | |
| Net Investment | | | | Net Realized | | | | Paid-in |
| Income | | | | Gain (Loss) | | | | Capital |
| | | |
| | | |
|
| $(114,502) | | | | $(417,617) | | | | $532,119 |
|
Purchases and Sales of Investment Securities:
For the year ended December 31, 2006, the cost of purchases and proceeds from sales of investment securities, other than short-term securities and collateral received for securities loaned, amounted to $246,066,275 and $259,146,868, respectively.
Transactions in Shares of Affiliated Companies:
An “Affiliated Company”, as defined in the Investment Company Act of 1940, is a company in which a Fund owns 5% or more of the company’s outstanding voting securities at any time during the period. The Fund effected the following transactions in shares of such companies during the year ended December 31, 2006:
| | | Shares | | Market Value | | Cost of | | Cost of | | Realized | | Dividend | | Shares | | Market Value |
| Affiliated Company | | 12/31/05 | | 12/31/05 | | Purchases | | Sales | | Gain (Loss) | | Income | | 12/31/06 | | 12/31/06 |
|
| Peerless Manufacturing** | | | 158,600 | | | $ | 2,775,500 | | | | – | | | $ | 38,275 | | | $ | 206,529 | | | | – | | | | | | | | | |
| Synalloy Corporation | | | 345,000 | | | | 3,610,080 | | | | – | | | | – | | | | – | | | | – | | | | 345,000 | | | $ | 6,361,800 | |
|
| | | | | | | $ | 6,385,580 | | | | | | | | | | | $ | 206,529 | | | | – | | | | | | | $ | 6,361,800 | |
|
| **Not an Affiliated Company at December 31, 2006. |
2006 ANNUAL REPORT TO STOCKHOLDERS | 33
ROYCE VALUE TRUST
|
| Report of Independent Registered Public Accounting Firm |
|
To the Board of Directors and Stockholders of
Royce Value Trust, Inc.
New York, New York
We have audited the accompanying statement of assets and liabilities of Royce Value Trust, Inc. (“ Fund”) including the schedule of investments, as of December 31, 2006, and the related statement of operations for the year then ended, the statement of changes in net assets for each of the two years in the period then ended and the financial highlights for each of the five years in the period then ended. These financial statements and financial highlights are the responsibility of the Fund’s management. Our responsibility is to express an opinion on these financial statements and financial highlights based on our audits.
We conducted our audits in accordance with standards of the Public Company Accounting Oversight Board (United States). Those standards require that we plan and perform the audit to obtain reasonable assurance about whether the financial statements and financial highlights are free of material misstatement. The Fund is not required to have, nor were we engaged to perform, an audit of its internal control over financial reporting. Our audits included consideration of internal control over financial reporting as a basis for designing audit procedures that are appropriate in the circumstances, but not for the purpose of expressing an opinion on the effectiveness of the Fund’s internal control over financial reporting. Accordingly, we express no such opinion. An audit includes examining, on a test basis, evidence supporting the amounts and disclosures in the financial statements. Our procedures included confirmation of securities owned as of December 31, 2006 by correspondence with the custodian and brokers or by other appropriate auditing procedures where replies from brokers were not received. An audit also includes assessing the accounting principles used and significant estimates made by management, as well as evaluating the overall financial statement presentation. We believe that our audits provide a reasonable basis for our opinion.
In our opinion, the financial statements and financial highlights referred to above present fairly, in all material respects, the financial position of Royce Value Trust, Inc. as of December 31, 2006, the results of its operations for the year then ended, the changes in its net assets for each of the two years in the period then ended and the financial highlights for each of the five years in the period then ended, in conformity with accounting principles generally accepted in the United States of America.
| | | TAIT, WELLER & BAKER LLP |
| | | |
| Philadelphia, Pennsylvania | | |
| February 12, 2007 | | |
34 | 2006 ANNUAL REPORT TO STOCKHOLDERS
| ROYCE MICRO-CAP TRUST | DECEMBER 31, 2006 |
|
| |
| | | | SHARES | | | VALUE | | | | | SHARES | | | VALUE |
COMMON STOCKS – 110.1% | | | | | | | | | California Pizza Kitchen a,c | | | 2,100 | | | $ | 69,951 |
Consumer Products – 5.6% | | | | | | | | | Champps Entertainment a | | | 10,000 | | | | 69,500 |
Apparel and Shoes - 2.5% | | | | | | | | | †Famous Dave’s of America a | | | 44,470 | | | | 732,421 |
†Bluefly a,c | | | 400,000 | | | $ | 512,000 | | | | | | | |
|
Delta Apparel | | | 129,300 | | | | 2,209,737 | | | | | | | | | 896,432 |
Hartmarx Corporation a | | | 70,000 | | | | 494,200 | | | | | | | |
|
†Jos. A. Bank Clothiers a,c | | | 3,100 | | | | 90,985 | | Retail Stores - 4.3% | | | | | | | |
Kleinert’s a,d | | | 14,200 | | | | 0 | | A.C. Moore Arts & Crafts a | | | 45,600 | | | | 988,152 |
Steven Madden | | | 21,750 | | | | 763,208 | | America’s Car-Mart a,c | | | 182,000 | | | | 2,158,520 |
Shoe Pavilion a | | | 123,300 | | | | 906,255 | | Buckle (The) | | | 25,500 | | | | 1,296,675 |
Stride Rite | | | 10,000 | | | | 150,800 | | Cache a | | | 3,200 | | | | 80,768 |
True Religion Apparel a,c | | | 26,800 | | | | 410,308 | | Casual Male Retail Group a | | | 2,000 | | | | 26,100 |
Weyco Group | | | 120,000 | | | | 2,982,000 | | Cato Corporation Cl. A | | | 71,850 | | | | 1,646,084 |
| | | | | | |
| | Cost Plus a,c | | | 45,077 | | | | 464,293 |
| | | | | | | | 8,519,493 | | Deb Shops | | | 19,900 | | | | 525,360 |
| | | | | | |
| | Fred’s Cl. A | | | 7,500 | | | | 90,300 |
Collectibles - 0.4% | | | | | | | | | †Gottschalks a,c | | | 50,000 | | | | 574,000 |
Topps Company (The) | | | 148,500 | | | | 1,321,650 | | †PriceSmart a,c | | | 51,916 | | | | 929,816 |
| | | | | | |
| | Shoe Carnival a,c | | | 11,000 | | | | 347,600 |
Food/Beverage/Tobacco - 0.3% | | | | | | | | | Stein Mart | | | 148,900 | | | | 1,974,414 |
Green Mountain Coffee Roasters a,c | | | 25,600 | | | | 1,260,288 | | †Trans World Entertainment a,c | | | 65,000 | | | | 427,700 |
Nutrition 21 a,c | | | 20,000 | | | | 34,000 | | United Retail Group a | | | 60,600 | | | | 849,612 |
| | | | | | |
| | West Marine a,c | | | 142,000 | | | | 2,452,340 |
| | | | | | | | 1,294,288 | | Wild Oats Markets a | | | 3,000 | | | | 43,140 |
| | | | | | |
| | | | | | | |
|
Home Furnishing and Appliances - 0.2% | | | | | | | | | | | | | | | | 14,874,874 |
Lifetime Brands | | | 42,054 | | | | 690,947 | | | | | | | |
|
| | | | | | |
| | Other Consumer Services - 0.4% | | | | | | | |
Publishing - 0.1% | | | | | | | | | Ambassadors Group | | | 15,000 | | | | 455,250 |
Educational Development | | | 10,600 | | | | 75,790 | | Ambassadors International | | | 6,100 | | | | 278,282 |
| | | | | | |
| | Autobytel a,c | | | 20,000 | | | | 70,000 |
Sports and Recreation - 0.9% | | | | | | | | | Cash America International | | | 1,500 | | | | 70,350 |
Monaco Coach | | | 142,400 | | | | 2,016,384 | | Collectors Universe | | | 11,700 | | | | 156,780 |
National R.V. Holdings a | | | 31,800 | | | | 117,342 | | †Premier Exhibitions a,c | | | 60,000 | | | | 375,000 |
Orange 21 a,c | | | 10,300 | | | | 50,779 | | Renaissance Learning | | | 2,365 | | | | 41,931 |
Sturm, Ruger & Company a,c | | | 95,000 | | | | 912,000 | | | | | | | |
|
| | | | | | |
| | | | | | | | | 1,447,593 |
| | | | | | | | 3,096,505 | | | | | | | |
|
| | | | | | |
| | Total (Cost $13,764,081) | | | | | | | 19,676,024 |
Other Consumer Products - 1.2% | | | | | | | | | | | | | | |
|
Burnham Holdings Cl. A | | | 79,500 | | | | 1,311,750 | | Diversified Investment Companies – 1.9% | | | | | | | |
Cobra Electronics | | | 10,000 | | | | 95,600 | | Closed-End Funds - 1.9% | | | | | | | |
A.T. Cross Company Cl. A a | | | 100,000 | | | | 760,000 | | ASA Bermuda | | | 73,300 | | | | 4,732,248 |
JAKKS Pacific a | | | 25,000 | | | | 546,000 | | Central Fund of Canada Cl. A | | | 207,000 | | | | 1,933,380 |
Lazare Kaplan International a | | | 151,700 | | | | 1,509,415 | | | | | | | |
|
Sonic Solutions a,c | | | 4,000 | | | | 65,200 | | Total (Cost $3,571,777) | | | | | | | 6,665,628 |
| | | | | | |
| | | | | | | |
|
| | | | | | | | 4,287,965 | | Financial Intermediaries – 10.1% | | | | | | | |
| | | | | | |
| | Banking - 3.3% | | | | | | | |
Total (Cost $12,408,469) | | | | | | | 19,286,638 | | Abigail Adams National Bancorp | | | 160,500 | | | | 2,166,750 |
| | | | | | |
| | Arrow Financial | | | 14,751 | | | | 365,382 |
Consumer Services – 5.7% | | | | | | | | | Bancorp (The) a,c | | | 51,380 | | | | 1,520,848 |
Direct Marketing - 0.3% | | | | | | | | | †Endeavour Mining Capital | | | 150,000 | | | | 913,262 |
†Dover Saddlery a | | | 9,500 | | | | 81,415 | | First National Lincoln | | | 40,200 | | | | 673,350 |
FTD Group a | | | 55,000 | | | | 983,950 | | Lakeland Financial | | | 45,000 | | | | 1,148,850 |
ValueVision Media Cl. A a | | | 5,000 | | | | 65,700 | | Meta Financial Group | | | 44,800 | | | | 1,335,040 |
| | | | | | |
| | †Nexity Financial a | | | 96,400 | | | | 1,156,800 |
| | | | | | | | 1,131,065 | | Peapack-Gladstone Financial | | | 27,600 | | | | 775,560 |
| | | | | | |
| | Queen City Investments | | | 948 | | | | 857,940 |
Leisure and Entertainment - 0.1% | | | | | | | | | Quest Capital | | | 30,000 | | | | 77,434 |
†FortuNet a,c | | | 9,600 | | | | 97,152 | | Sterling Bancorp | | | 22,869 | | | | 450,519 |
IMAX Corporation a,c | | | 25,000 | | | | 94,000 | | | | | | | |
|
Multimedia Games a | | | 5,000 | | | | 48,000 | | | | | | | | | 11,441,735 |
Progressive Gaming International a | | | 9,500 | | | | 86,165 | | | | | | | |
|
Singing Machine (The) a | | | 5,000 | | | | 3,450 | | Insurance - 2.1% | | | | | | | |
TiVo a,c | | | 20,000 | | | | 102,400 | | American Safety Insurance Holdings a | | | 20,000 | | | | 371,000 |
| | | | | | |
| | |
| | | | | | | | 431,167 | |
| | | | | | |
| |
Media and Broadcasting - 0.3% | | | | | | | | |
Outdoor Channel Holdings a,c | | | 69,750 | | | | 894,893 | |
| | | | | | |
| |
Restaurants and Lodgings - 0.3% | | | | | | | | |
Benihana Cl. A a | | | 800 | | | | 24,560 | |
| THE ACCOMPANYING NOTES ARE AN INTEGRAL PART OF THESE FINANCIAL STATEMENTS. |
2006 ANNUAL REPORT TO STOCKHOLDERS | 35 |
| | | | SHARES | | | | VALUE | | | | | SHARES | | | | VALUE |
Financial Intermediaries (continued) | | | | | | | | | Barrier Therapeutics a,c | | | 11,300 | | | $ | 85,202 |
Insurance (continued) | | | | | | | | | Cambrex Corporation | | | 16,000 | | | | 363,520 |
First Acceptance a | | | 258,405 | | | $ | 2,770,102 | | Caraco Pharmaceutical Laboratories a,c | | | 148,150 | | | | 2,074,100 |
Independence Holding | | | 33,534 | | | | 732,047 | | Cardiome Pharma a,c | | | 23,400 | | | | 260,910 |
NYMAGIC | | | 65,400 | | | | 2,393,640 | | Cell Genesys a | | | 58,000 | | | | 196,620 |
Navigators Group a | | | 17,200 | | | | 828,696 | | Cerus Corporation a | | | 162,200 | | | | 950,492 |
| | | | | | |
| | CollaGenex Pharmaceuticals a,c | | | 25,000 | | | | 349,250 |
| | | | | | | | 7,095,485 | | †Cytokinetics a,c | | | 5,000 | | | | 37,400 |
| | | | | | |
| | Dendreon Corporation a,c | | | 11,400 | | | | 47,538 |
Real Estate Investment Trusts - 0.7% | | | | | | | | | Draxis Health a | | | 15,000 | | | | 72,450 |
†Capstead Mortgage | | | 154,900 | | | | 1,285,670 | | Durect Corporation a | | | 44,100 | | | | 195,804 |
Opteum Cl. A | | | 149,000 | | | | 1,132,400 | | DUSA Pharmaceuticals a,c | | | 36,700 | | | | 157,810 |
| | | | | | |
| | Dyax Corporation a,c | | | 15,000 | | | | 45,450 |
| | | | | | | | 2,418,070 | | Emisphere Technologies a,c | | | 163,200 | | | | 863,328 |
| | | | | | |
| | †Favrille a,c | | | 231,000 | | | | 577,500 |
Securities Brokers - 1.8% | | | | | | | | | Gene Logic a | | | 234,479 | | | | 361,098 |
†Cowen Group a | | | 63,800 | | | | 1,349,370 | | Genitope Corporation a,c | | | 291,700 | | | | 1,026,784 |
First Albany Companies a | | | 95,000 | | | | 220,400 | | †Halozyme Therapeutics a | | | 20,000 | | | | 161,000 |
International Assets Holding a,c | | | 106,200 | | | | 3,049,002 | | Hi-Tech Pharmacal a | | | 96,630 | | | | 1,175,987 |
Sanders Morris Harris Group | | | 21,000 | | | | 268,170 | | †Idenix Pharmaceuticals a,c | | | 5,000 | | | | 43,450 |
Stifel Financial a,c | | | 21,233 | | | | 832,971 | | ImmunoGen a | | | 44,000 | | | | 223,080 |
†Thomas Weisel Partners Group a | | | 6,500 | | | | 137,150 | | Infinity Pharmaceuticals a | | | 8,750 | | | | 108,938 |
Tradestation Group a,c | | | 30,000 | | | | 412,500 | | †Lannett Company a | | | 56,100 | | | | 350,625 |
| | | | | | |
| | †Lifecore Biomedical a,c | | | 22,900 | | | | 408,307 |
| | | | | | | | 6,269,563 | | Mannkind Corporation a,c | | | 42,000 | | | | 692,580 |
| | | | | | |
| | Maxygen a | | | 5,000 | | | | 53,850 |
Other Financial Intermediaries - 2.2% | | | | | | | | | Micromet a,c | | | 14,333 | | | | 42,999 |
Electronic Clearing House a,c | | | 20,000 | | | | 368,000 | | Momenta Pharmaceuticals a | | | 65,000 | | | | 1,022,450 |
†Kohlberg Capital a | | | 84,900 | | | | 1,468,770 | | Myriad Genetics a,c | | | 25,000 | | | | 782,500 |
MVC Capital | | | 211,200 | | | | 2,821,632 | | Nabi Biopharmaceuticals a | | | 5,000 | | | | 33,900 |
MarketAxess Holdings a | | | 123,700 | | | | 1,678,609 | | Nastech Pharmaceutical a,c | | | 2,700 | | | | 40,851 |
NGP Capital Resources | | | 58,600 | | | | 981,550 | | Neurogen Corporation a | | | 40,000 | | | | 238,000 |
| | | | | | |
| | Nuvelo a | | | 131,500 | | | | 526,000 |
| | | | | | | | 7,318,561 | | Oncolytics Biotech a,c | | | 41,000 | | | | 85,280 |
| | | | | | |
| | Orchid Cellmark a,c | | | 78,000 | | | | 241,800 |
Total (Cost $23,258,455) | | | | | | | 34,543,414 | | †Origin Agritech a | | | 70,300 | | | | 769,082 |
| | | | | | |
| | Pharmacyclics a | | | 98,000 | | | | 496,860 |
Financial Services – 3.6% | | | | | | | | | Pharmanet Development Group a,c | | | 25,000 | | | | 551,750 |
Insurance Brokers - 0.1% | | | | | | | | | †Poniard Pharmaceuticals a,c | | | 17,300 | | | | 86,500 |
Crawford & Company Cl. A | | | 50,000 | | | | 299,500 | | Sangamo BioSciences a,c | | | 21,000 | | | | 138,600 |
| | | | | | |
| | †Seattle Genetics a,c | | | 170,000 | | | | 906,100 |
Investment Management - 3.0% | | | | | | | | | Senesco Technologies a,c | | | 25,000 | | | | 27,500 |
ADDENDA Capital | | | 88,000 | | | | 1,766,565 | | Senomyx a,c | | | 47,000 | | | | 610,530 |
BKF Capital Group a | | | 406,500 | | | | 1,361,775 | | †Tapestry Pharmaceuticals a,c | | | 483,000 | | | | 966,000 |
Epoch Holding Corporation a | | | 218,300 | | | | 2,169,902 | | Tercica a | | | 7,900 | | | | 39,500 |
Hennessy Advisors | | | 16,500 | | | | 379,500 | | Theragenics Corporation a | | | 145,800 | | | | 451,980 |
†Highbury Financial a,b,c | | | 580,400 | | | | 3,383,732 | | TorreyPines Therapeutics a | | | 6,250 | | | | 46,125 |
†Highbury Financial (Warrants) a | | | 533,900 | | | | 880,935 | | Trimeris a,c | | | 85,000 | | | | 1,080,350 |
Rockwater Capital a | | | 50,000 | | | | 221,670 | | | | | | | |
|
| | | | | | |
| | | | | | | | | 21,915,454 |
| | | | | | | | 10,164,079 | | | | | | | |
|
| | | | | | |
| | Health Services - 2.2% | | | | | | | |
Other Financial Services - 0.5% | | | | | | | | | ATC Healthcare Cl. A a | | | 35,000 | | | | 11,900 |
†Chardan North China Acquisition a,c | | | 106,600 | | | | 923,156 | | Albany Molecular Research a | | | 40,000 | | | | 422,400 |
†Chardan North China Acquisition | | | | | | | | | Bio-Imaging Technologies a | | | 35,277 | | | | 284,333 |
(Warrants) a | | | 148,000 | | | | 532,800 | | Encorium Group a,c | | | 25,000 | | | | 132,750 |
MicroFinancial | | | 10,000 | | | | 38,900 | | Gentiva Health Services a | | | 23,000 | | | | 438,380 |
†Stone Arcade Acquisition a,c | | | 62,000 | | | | 394,320 | | HMS Holdings a | | | 11,900 | | | | 180,285 |
| | | | | | |
| | †Health Grades a | | | 107,100 | | | | 480,879 |
| | | | | | | | 1,889,176 | | Healthcare Services Group | | | 2,800 | | | | 81,088 |
| | | | | | |
| | | | | | | | | |
Total (Cost $10,446,520) | | | | | | | 12,352,755 | | | | | | | | | |
| | | | | | |
| | | | | | | | | |
Health – 16.9% | | | | | | | | | | | | | | | | |
Commercial Services - 2.1% | | | | | | | | | | | | | | | | |
First Consulting Group a | | | 274,700 | | | | 3,779,872 | | | | | | | | | |
PAREXEL International a,c | | | 121,400 | | | | 3,516,958 | | | | | | | | | |
| | | | | | |
| | | | | | | | | |
| | | | | | | | 7,296,830 | | | | | | | | | |
| | | | | | |
| | | | | | | | | |
Drugs and Biotech - 6.4% | | | | | | | | | | | | | | | | |
Adolor Corporation a,c | | | 125,000 | | | | 940,000 | | | | | | | | | |
Allos Therapeutics a,c | | | 153,600 | | | | 897,024 | | | | | | | | | |
Alnylam Pharmaceuticals a,c | | | 500 | | | | 10,700 | | | | | | | | | |
36 | 2006 ANNUAL REPORT TO STOCKHOLDERS | THE ACCOMPANYING NOTES ARE AN INTEGRAL PART OF THESE FINANCIAL STATEMENTS. |
| | | | SHARES | | | | VALUE | | | | | SHARES | | | | VALUE |
Health (continued) | | | | | | | | | Nutraceutical International a | | | 15,000 | | | $ | 229,650 |
Health Services (continued) | | | | | | | | | | | | | | |
|
Hooper Holmes a | | | 88,600 | | | $ | 293,266 | | | | | | | | | 905,497 |
Horizon Health a | | | 50,000 | | | | 978,500 | | | | | | | |
|
MedCath Corporation a | | | 18,000 | | | | 492,480 | | Total (Cost $43,945,491) | | | | | | | 57,996,174 |
Mediware Information Systems a | | | 63,800 | | | | 533,368 | | | | | | | |
|
†National Medical Health Card Systems a,c | | | 84,900 | | | | 1,002,669 | | Industrial Products – 14.9% | | | | | | | |
On Assignment a | | | 41,100 | | | | 482,925 | | Automotive - 1.0% | | | | | | | |
Quovadx a | | | 5,000 | | | | 14,100 | | International Textile Group a,c | | | 75,000 | | | | 926,250 |
RehabCare Group a | | | 22,000 | | | | 326,700 | | LKQ Corporation a,c | | | 11,400 | | | | 262,086 |
Res-Care a | | | 41,000 | | | | 744,150 | | Noble International | | | 41,600 | | | | 834,080 |
Sun Healthcare Group a,c | | | 51,000 | | | | 644,130 | | Spartan Motors | | | 4,200 | | | | 63,756 |
U.S. Physical Therapy a | | | 10,000 | | | | 122,500 | | Strattec Security a | | | 28,300 | | | | 1,318,780 |
| | | | | | |
| | Wescast Industries Cl. A | | | 12,900 | | | | 125,554 |
| | | | | | | | 7,666,803 | | | | | | | |
|
| | | | | | |
| | | | | | | | | 3,530,506 |
Medical Products and Devices - 5.9% | | | | | | | | | | | | | | |
|
Adeza Biomedical a,c | | | 23,200 | | | | 345,912 | | Building Systems and Components - 1.0% | | | | | | | |
Allied Healthcare Products a | | | 273,500 | | | | 1,413,995 | | AAON | | | 63,700 | | | | 1,674,036 |
AngioDynamics a | | | 14,000 | | | | 300,860 | | Craftmade International | | | 26,200 | | | | 470,552 |
Anika Therapeutics a | | | 24,000 | | | | 318,480 | | Flanders Corporation a,c | | | 1,500 | | | | 14,850 |
Bruker BioSciences a | | | 135,200 | | | | 1,015,352 | | LSI Industries | | | 63,812 | | | | 1,266,668 |
Caliper Life Sciences a | | | 52,400 | | | | 299,728 | | Modtech Holdings a | | | 3,800 | | | | 18,810 |
Cardiac Science a | | | 29,947 | | | | 241,672 | | | | | | | |
|
CONMED Corporation a | | | 3,900 | | | | 90,168 | | | | | | | | | 3,444,916 |
†Cutera a | | | 27,300 | | | | 737,100 | | | | | | | |
|
Del Global Technologies a | | | 168,279 | | | | 260,832 | | Construction Materials - 1.8% | | | | | | | |
EPIX Pharmaceuticals a,c | | | 32,666 | | | | 225,395 | | Ash Grove Cement | | | 8,000 | | | | 1,696,000 |
Endologix a,c | | | 10,500 | | | | 36,750 | | Monarch Cement | | | 50,410 | | | | 1,638,325 |
Exactech a,c | | | 114,100 | | | | 1,623,643 | | Synalloy Corporation a | | | 161,000 | | | | 2,968,840 |
IRIDEX Corporation a | | | 49,700 | | | | 440,839 | | | | | | | |
|
Kensey Nash a,c | | | 24,250 | | | | 771,150 | | | | | | | | | 6,303,165 |
Langer a | | | 7,100 | | | | 32,589 | | | | | | | |
|
Medical Action Industries a | | | 83,500 | | | | 2,692,040 | | Industrial Components - 2.1% | | | | | | | |
Merit Medical Systems a,c | | | 5,700 | | | | 90,288 | | American Superconducter a,c | | | 52,000 | | | | 510,120 |
†Microtek Medical Holdings a | | | 89,120 | | | | 409,952 | | Bel Fuse Cl. A | | | 55,200 | | | | 1,665,384 |
†Minrad International a | | | 6,800 | | | | 37,128 | | C & D Technologies c | | | 53,000 | | | | 251,220 |
Molecular Devices a,c | | | 25,500 | | | | 537,285 | | †Deswell Industries | | | 105,300 | | | | 1,200,420 |
NMT Medical a | | | 12,000 | | | | 162,360 | | †Gerber Scientific a,c | | | 50,500 | | | | 634,280 |
Neurometrix a,c | | | 21,500 | | | | 320,565 | | Ladish Company a | | | 10,000 | | | | 370,800 |
Orthofix International a | | | 28,000 | | | | 1,400,000 | | Plug Power a,c | | | 1,370 | | | | 5,329 |
OrthoLogic Corporation a | | | 84,000 | | | | 120,120 | | Powell Industries a | | | 49,800 | | | | 1,572,186 |
PLC Systems a | | | 105,200 | | | | 64,172 | | Tech/Ops Sevcon | | | 76,200 | | | | 598,170 |
Possis Medical a,c | | | 28,900 | | | | 389,572 | | II-VI a | | | 20,000 | | | | 558,800 |
†Restore Medical a,c | | | 13,600 | | | | 57,256 | | | | | | | |
|
Shamir Optical Industry a | | | 7,500 | | | | 63,750 | | | | | | | | | 7,366,709 |
Sirona Dental Systems | | | 25,000 | | | | 962,750 | | | | | | | |
|
STAAR Surgical a | | | 5,000 | | | | 35,050 | | Machinery - 2.9% | | | | | | | |
†Synergetics USA a,c | | | 5,000 | | | | 21,850 | | Alamo Group | | | 38,600 | | | | 905,556 |
†Syneron Medical a,c | | | 2,000 | | | | 54,260 | | Astec Industries a,c | | | 40,200 | | | | 1,411,020 |
Synovis Life Technologies a,c | | | 23,000 | | | | 228,850 | | Gorman-Rupp Company | | | 4,218 | | | | 155,939 |
Urologix a,c | | | 415,500 | | | | 968,115 | | Hardinge | | | 87,000 | | | | 1,310,220 |
Utah Medical Products | | | 42,300 | | | | 1,395,477 | | Hurco Companies a | | | 33,900 | | | | 1,077,342 |
Young Innovations | | | 61,450 | | | | 2,046,285 | | Keithley Instruments | | | 14,000 | | | | 184,100 |
| | | | | | |
| | †K-Tron International a | | | 11,000 | | | | 821,370 |
| | | | | | | | 20,211,590 | | LeCroy Corporation a | | | 2,000 | | | | 23,020 |
| | | | | | |
| | MTS Systems | | | 10,000 | | | | 386,200 |
Personal Care - 0.3% | | | | | | | | | Mueller (Paul) Company | | | 9,650 | | | | 371,525 |
CCA Industries | | | 9,040 | | | | 104,322 | | Sun Hydraulics | | | 38,950 | | | | 798,864 |
Helen of Troy a,c | | | 20,000 | | | | 485,200 | | T-3 Energy Services a | | | 4,912 | | | | 108,310 |
Nature’s Sunshine Products | | | 7,500 | | | | 86,325 | | Tennant Company | | | 88,200 | | | | 2,557,800 |
| | | | | | | | | | | | | | | |
|
| | | | | | | | | | | | | | | | | 10,111,266 |
| | | | | | | | | | | | | | | |
|
| | | | | | | | | | Metal Fabrication and Distribution - 1.9% | | | | | | | |
| | | | | | | | | | Encore Wire a,c | | | 15,000 | | | | 330,150 |
| | | | | | | | | | Harris Steel Group | | | 50,000 | | | | 1,864,683 |
| | | | | | | | | | Haynes International a | | | 26,770 | | | | 1,418,810 |
| | | | | | | | | | Insteel Industries | | | 30,900 | | | | 549,711 |
| THE ACCOMPANYING NOTES ARE AN INTEGRAL PART OF THESE FINANCIAL STATEMENTS. |
2006 ANNUAL REPORT TO STOCKHOLDERS | 37 |
| | | | SHARES | | | | VALUE | | | | | SHARES | | | | VALUE |
Industrial Products (continued) | | | | | | | | | Devcon International a | | | 21,700 | | | $ | 121,303 |
Metal Fabrication and Distribution (continued) | | | | | | | | | Exponent a | | | 136,600 | | | | 2,548,956 |
NN | | | 114,300 | | | $ | 1,420,749 | | Insituform Technologies Cl. A a,c | | | 75,300 | | | | 1,947,258 |
Novamerican Steel a | | | 3,500 | | | | 127,750 | | Nobility Homes | | | 2,000 | | | | 52,880 |
Universal Stainless & Alloy Products a | | | 22,730 | | | | 761,000 | | Skyline Corporation | | | 32,100 | | | | 1,291,062 |
| | | | | | |
| | | | | | | |
|
| | | | | | | | 6,472,853 | | | | | | | | | 6,361,779 |
| | | | | | |
| | | | | | | |
|
Paper and Packaging - 0.1% | | | | | | | | | Food and Tobacco Processors - 1.4% | | | | | | | |
Mod-Pac Corporation a | | | 23,200 | | | | 255,200 | | Cal-Maine Foods | | | 50,000 | | | | 429,000 |
| | | | | | |
| | Farmer Bros. | | | 23,700 | | | | 505,995 |
Pumps, Valves and Bearings - 0.3% | | | | | | | | | Galaxy Nutritional Foods a | | | 334,800 | | | | 174,096 |
CIRCOR International | | | 28,000 | | | | 1,030,120 | | ML Macadamia Orchards L.P. | | | 120,200 | | | | 734,422 |
| | | | | | |
| | Omega Protein a | | | 9,600 | | | | 74,208 |
Specialty Chemicals and Materials - 1.9% | | | | | | | | | Seneca Foods Cl. A a | | | 62,500 | | | | 1,518,750 |
Aceto Corporation | | | 384,619 | | | | 3,323,108 | | Seneca Foods Cl. B a | | | 42,500 | | | | 1,032,750 |
American Vanguard | | | 3,333 | | | | 52,995 | | Sunopta a,c | | | 40,580 | | | | 357,104 |
Balchem Corporation | | | 22,500 | | | | 577,800 | | | | | | | |
|
Hawkins | | | 122,667 | | | | 1,754,138 | | | | | | | | | 4,826,325 |
NuCo2 a,c | | | 20,000 | | | | 491,800 | | | | | | | |
|
Park Electrochemical | | | 10,000 | | | | 256,500 | | Industrial Distribution - 0.6% | | | | | | | |
| | | | | | |
| | Central Steel & Wire | | | 1,088 | | | | 658,240 |
| | | | | | | | 6,456,341 | | Elamex a | | | 60,200 | | | | 39,130 |
| | | | | | |
| | Lawson Products | | | 19,500 | | | | 894,855 |
Textiles - 0.1% | | | | | | | | | Strategic Distribution a | | | 59,690 | | | | 607,644 |
Unifi a | | | 100,000 | | | | 245,000 | | | | | | | |
|
| | | | | | |
| | | | | | | | | 2,199,869 |
Other Industrial Products - 1.8% | | | | | | | | | | | | | | |
|
†Basin Water a,c | | | 7,800 | | | | 52,806 | | Printing - 1.1% | | | | | | | |
Color Kinetics a | | | 50,000 | | | | 1,067,500 | | American Bank Note Holographics a | | | 242,200 | | | | 663,628 |
Distributed Energy Systems a | | | 59,000 | | | | 212,400 | | Bowne & Co. | | | 66,500 | | | | 1,060,010 |
Eastern Company (The) | | | 39,750 | | | | 770,753 | | Champion Industries | | | 23,500 | | | | 201,865 |
Maxwell Technologies a | | | 15,300 | | | | 213,435 | | Courier Corporation | | | 22,950 | | | | 894,362 |
Peerless Manufacturing a | | | 42,200 | | | | 1,041,496 | | Ennis | | | 9,700 | | | | 237,262 |
Quixote Corporation | | | 35,500 | | | | 698,285 | | Schawk | | | 38,900 | | | | 760,106 |
Raven Industries | | | 73,000 | | | | 1,956,400 | | | | | | | |
|
| | | | | | |
| | | | | | | | | 3,817,233 |
| | | | | | | | 6,013,075 | | | | | | | |
|
| | | | | | |
| | Transportation and Logistics - 2.3% | | | | | | | |
Total (Cost $30,813,011) | | | | | | | 51,229,151 | | †ABX Air a | | | 191,300 | | | | 1,325,709 |
| | | | | | |
| | †Dynamex a,c | | | 26,050 | | | | 608,528 |
Industrial Services – 12.8% | | | | | | | | | Forward Air | | | 50,700 | | | | 1,466,751 |
Advertising and Publishing - 0.5% | | | | | | | | | Frozen Food Express Industries | | | 92,000 | | | | 791,200 |
Greenfield Online a,c | | | 20,000 | | | | 286,000 | | MAIR Holdings a,c | | | 8,600 | | | | 61,662 |
MDC Partners Cl. A a | | | 87,300 | | | | 646,020 | | Marten Transport a,c | | | 4,050 | | | | 74,236 |
NetRatings a,c | | | 50,000 | | | | 875,500 | | Pacific CMA a | | | 200,000 | | | | 58,000 |
| | | | | | |
| | Patriot Transportation Holding a | | | 3,000 | | | | 280,080 |
| | | | | | | | 1,807,520 | | Universal Truckload Services a | | | 134,200 | | | | 3,187,250 |
| | | | | | |
| | Vitran Corporation Cl. A a | | | 8,000 | | | | 138,960 |
Commercial Services - 4.6% | | | | | | | | | | | | | | |
|
†Acquicor Technology (Units) a | | | 205,000 | | | | 1,486,250 | | | | | | | | | 7,992,376 |
BB Holdings a | | | 390,000 | | | | 1,126,340 | | | | | | | |
|
CBIZ a,c | | | 87,000 | | | | 606,390 | | Other Industrial Services - 0.4% | | | | | | | |
Carlisle Group a | | | 151,000 | | | | 301,571 | | Landauer | | | 21,300 | | | | 1,117,611 |
CorVel Corporation a | | | 40,125 | | | | 1,908,746 | | Team a | | | 2,200 | | | | 76,626 |
†eResearch Technology a,c | | | 185,000 | | | | 1,245,050 | | | | | | | |
|
Geo Group (The) a | | | 76,800 | | | | 2,881,536 | | | | | | | | | 1,194,237 |
†Global Sources a | | | 47,800 | | | | 849,884 | | | | | | | |
|
Kforce a,c | | | 55,000 | | | | 669,350 | | Total (Cost $24,631,448) | | | | | | | 43,877,079 |
PDI a | | | 10,200 | | | | 103,530 | | | | | | | |
|
RCM Technologies a | | | 1,000 | | | | 5,990 | | Natural Resources – 9.4% | | | | | | | |
SM&A a | | | 31,300 | | | | 181,540 | | Energy Services - 4.3% | | | | | | | |
TRC Companies a,c | | | 64,200 | | | | 554,046 | | Calfrac Well Services | | | 1,000 | | | | 18,951 |
Volt Information Sciences a | | | 35,200 | | | | 1,767,392 | | Carbo Ceramics | | | 18,750 | | | | 700,688 |
Westaff a | | | 362,500 | | | | 1,990,125 | | Conrad Industries a | | | 115,000 | | | | 701,500 |
| | | | | | |
| | Dawson Geophysical a | | | 1,900 | | | | 69,217 |
| | | | | | | | 15,677,740 | | Dril-Quip a | | | 55,000 | | | | 2,153,800 |
| | | | | | |
| | Enerflex Systems | | | 1,900 | | | | 18,004 |
Engineering and Construction - 1.9% | | | | | | | | | †Environmental Power a | | | 90,000 | | | | 796,500 |
†Cavco Industries a,c | | | 3,200 | | | | 112,128 | | | | | | | | | |
Comfort Systems USA | | | 22,800 | | | | 288,192 | | | | | | | | | |
38 | 2006 ANNUAL REPORT TO STOCKHOLDERS | THE ACCOMPANYING NOTES ARE AN INTEGRAL PART OF THESE FINANCIAL STATEMENTS. |
| | | | SHARES | | | | VALUE | | | | | SHARES | | | | VALUE |
Natural Resources (continued) | | | | | | | | | Axsys Technologies a | | | 6,400 | | | $ | 112,448 |
Energy Services (continued) | | | | | | | | | Ducommun a | | | 72,100 | | | | 1,649,648 |
Gulf Island Fabrication | | | 41,400 | | | $ | 1,527,660 | | HEICO Corporation | | | 41,600 | | | | 1,615,328 |
GulfMark Offshore a,c | | | 65,200 | | | | 2,439,132 | | HEICO Corporation Cl. A | | | 24,160 | | | | 787,133 |
Input/Output a | | | 43,500 | | | | 592,905 | | Integral Systems | | | 47,100 | | | | 1,091,307 |
†Newpark Resources a,c | | | 48,100 | | | | 346,801 | | SIFCO Industries a | | | 45,800 | | | | 237,244 |
Pason Systems | | | 222,400 | | | | 2,528,855 | | TVI Corporation a,c | | | 237,490 | | | | 558,102 |
StealthGas | | | 4,900 | | | | 57,232 | | | | | | | |
|
TGC Industries a | | | 11,280 | | | | 94,752 | | | | | | | | | 7,900,314 |
Valley National Gases a | | | 30,100 | | | | 796,145 | | | | | | | |
|
Willbros Group a,c | | | 67,600 | | | | 1,277,640 | | Components and Systems - 3.3% | | | | | | | |
†World Energy Solutions a | | | 778,300 | | | | 767,521 | | Acacia Research-Acacia Technologies a | | | 90,550 | | | | 1,211,559 |
| | | | | | |
| | Advanced Photonix Cl. A a | | | 117,900 | | | | 271,170 |
| | | | | | | | 14,887,303 | | CSP a | | | 122,581 | | | | 1,002,713 |
| | | | | | |
| | †DDi Corporation a | | | 70,947 | | | | 510,818 |
Oil and Gas - 1.3% | | | | | | | | | Dalsa Corporation a | | | 5,000 | | | | 54,881 |
Bonavista Energy Trust | | | 69,700 | | | | 1,682,507 | | Dot Hill Systems a,c | | | 2,000 | | | | 7,860 |
CE Franklin a,c | | | 69,210 | | | | 696,253 | | Excel Technology a | | | 91,900 | | | | 2,351,721 |
Contango Oil & Gas a,c | | | 10,000 | | | | 238,400 | | †Flextronics International a,c | | | 9,610 | | | | 110,323 |
Edge Petroleum a,c | | | 2,000 | | | | 36,480 | | Giga-tronics a | | | 3,200 | | | | 6,528 |
Exploration Company of Delaware a,c | | | 5,500 | | | | 73,370 | | Mobility Electronics a,c | | | 1,000 | | | | 3,350 |
†Houston American Energy a,c | | | 37,500 | | | | 277,125 | | MOCON | | | 15,600 | | | | 198,276 |
Nuvista Energy a | | | 121,000 | | | | 1,348,883 | | Neoware a,c | | | 103,200 | | | | 1,363,272 |
Particle Drilling Technologies a | | | 8,000 | | | | 34,240 | | †On Track Innovations a,c | | | 29,615 | | | | 204,492 |
PetroCorp a,d | | | 104,200 | | | | 0 | | Performance Technologies a | | | 128,350 | | | | 768,817 |
Pioneer Drilling a | | | 7,500 | | | | 99,600 | | Richardson Electronics | | | 80,100 | | | | 729,711 |
Savanna Energy Services a | | | 2,500 | | | | 40,604 | | Rimage Corporation a | | | 20,000 | | | | 520,000 |
†Storm Cat Energy a,c | | | 43,370 | | | | 51,610 | | TTM Technologies a | | | 120,700 | | | | 1,367,531 |
| | | | | | |
| | TransAct Technologies a | | | 78,600 | | | | 650,022 |
| | | | | | | | 4,579,072 | | | | | | | |
|
| | | | | | |
| | | | | | | | | 11,333,044 |
Precious Metals and Mining - 2.5% | | | | | | | | | | | | | | |
|
Aurizon Mines a | | | 257,000 | | | | 804,410 | | Distribution - 0.7% | | | | | | | |
Brush Engineered Materials a,c | | | 15,500 | | | | 523,435 | | Agilysys | | | 90,000 | | | | 1,506,600 |
†Chesapeake Gold a,c | | | 20,000 | | | | 87,467 | | Bell Industries a | | | 85,700 | | | | 325,660 |
Cumberland Resources a | | | 220,000 | | | | 1,240,800 | | Jaco Electronics a | | | 29,000 | | | | 95,700 |
Gammon Lake Resources a | | | 85,236 | | | | 1,388,494 | | Nu Horizons Electronics a,c | | | 40,000 | | | | 411,600 |
Gold Reserve a | | | 14,000 | | | | 66,080 | | PC Mall a | | | 6,000 | | | | 63,240 |
Golden Star Resources a,c | | | 168,100 | | | | 495,895 | | Pomeroy IT Solutions a | | | 6,900 | | | | 52,371 |
Metallica Resources a | | | 341,300 | | | | 1,351,548 | | | | | | | |
|
Minefinders Corporation a,c | | | 116,000 | | | | 1,032,400 | | | | | | | | | 2,455,171 |
Nevsun Resources a | | | 5,000 | | | | 10,850 | | | | | | | |
|
Northern Orion Resources a | | | 51,400 | | | | 188,124 | | Internet Software and Services - 2.9% | | | | | | | |
Northgate Minerals a | | | 270,000 | | | | 939,600 | | Answers Corporation a,c | | | 4,100 | | | | 54,899 |
Spur Ventures a | | | 44,100 | | | | 22,312 | | †CMGI a | | | 1,595,000 | | | | 2,137,300 |
†Vista Gold a,c | | | 50,000 | | | | 431,500 | | Convera Corporation Cl. A a,c | | | 190,000 | | | | 872,100 |
| | | | | | |
| | CryptoLogic | | | 3,900 | | | | 90,480 |
| | | | | | | | 8,582,915 | | Digitas a | | | 88,840 | | | | 1,191,344 |
| | | | | | |
| | EDGAR Online a,c | | | 33,700 | | | | 117,950 |
Real Estate - 0.4% | | | | | | | | | iGATE Corporation a | | | 273,400 | | | | 1,880,992 |
HomeFed Corporation | | | 11,352 | | | | 749,232 | | Inforte Corporation a | | | 12,400 | | | | 46,376 |
Kennedy-Wilson a | | | 21,500 | | | | 481,600 | | Jupitermedia Corporation a,c | | | 355,800 | | | | 2,817,936 |
†ZipRealty a,c | | | 11,000 | | | | 82,390 | | LookSmart a | | | 4,000 | | | | 17,840 |
| | | | | | |
| | MIVA a,c | | | 32,000 | | | | 108,480 |
| | | | | | | | 1,313,222 | | NIC a | | | 26,800 | | | | 133,196 |
| | | | | | |
| | Packeteer a | | | 6,700 | | | | 91,120 |
Other Natural Resources - 0.9% | | | | | | | | | †PFSweb a | | | 7,242 | | | | 7,966 |
PICO Holdings a | | | 55,700 | | | | 1,936,689 | | Stamps.com a | | | 21,200 | | | | 333,900 |
Pope Resources L.P. | | | 33,000 | | | | 1,132,560 | | Web.com a | | | 31,200 | | | | 130,728 |
| | | | | | |
| | | | | | | |
|
| | | | | | | | 3,069,249 | | | | | | | | | 10,032,607 |
| | | | | | |
| | | | | | | |
|
Total (Cost $13,574,348) | | | | | | | 32,431,761 | | IT Services - 5.8% | | | | | | | |
| | | | | | |
| | CIBER a | | | 182,662 | | | | 1,238,448 |
Technology – 24.3% | | | | | | | | | †Cogent Communications Group a,c | | | 30,000 | | | | 486,600 |
Aerospace and Defense - 2.3% | | | | | | | | | | | | | | | | |
Allied Defense Group (The) a,c | | | 65,760 | | | | 1,397,400 | | | | | | | | | |
Astronics Corporation a | | | 26,400 | | | | 451,704 | | | | | | | | | |
| THE ACCOMPANYING NOTES ARE AN INTEGRAL PART OF THESE FINANCIAL STATEMENTS. |
2006 ANNUAL REPORT TO STOCKHOLDERS | 39 |
| | | | SHARES | | | | VALUE | | | | | SHARES | | | | VALUE |
Technology (continued) | | | | | | | | | SPSS a,c | | | 41,800 | | | $ | 1,256,926 |
IT Services (continued) | | | | | | | | | SeaChange International a,c | | | 5,000 | | | | 51,100 |
Computer Task Group a | | | 431,100 | | | $ | 2,047,725 | | TeleCommunication Systems Cl. A a,c | | | 10,000 | | | | 31,000 |
Covansys Corporation a | | | 172,500 | | | | 3,958,875 | | Transaction Systems Architects Cl. A a | | | 97,600 | | | | 3,178,832 |
Diamond Management & Technology | | | | | | | | | Unica Corporation a | | | 3,200 | | | | 41,440 |
Consultants | | | 138,100 | | | | 1,717,964 | | | | | | | |
|
Forrester Research a | | | 101,500 | | | | 2,751,665 | | | | | | | | | 13,880,603 |
Rainmaker Systems a,c | | | 2,000 | | | | 14,940 | | | | | | | |
|
Sapient Corporation a,c | | | 500,000 | | | | 2,745,000 | | Telecommunications - 3.2% | | | | | | | |
Syntel | | | 54,300 | | | | 1,455,240 | | Anaren a | | | 24,200 | | | | 429,792 |
TriZetto Group (The) a | | | 182,300 | | | | 3,348,851 | | C-COR.net a | | | 5,000 | | | | 55,700 |
| | | | | | |
| | Captaris a | | | 43,300 | | | | 336,441 |
| | | | | | | | 19,765,308 | | Catapult Communications a | | | 5,000 | | | | 44,900 |
| | | | | | |
| | Centillium Communications a | | | 11,000 | | | | 23,540 |
Semiconductors and Equipment - 2.1% | | | | | | | | | Channell Commercial a | | | 5,000 | | | | 14,850 |
California Micro Devices a | | | 16,700 | | | | 73,146 | | Communications Systems | | | 79,500 | | | | 794,205 |
Cascade Microtech a | | | 48,000 | | | | 628,800 | | †ECtel a | | | 146,400 | | | | 715,896 |
Catalyst Semiconductor a | | | 9,200 | | | | 31,648 | | †EFJ a | | | 10,000 | | | | 67,400 |
ESS Technology a | | | 25,000 | | | | 25,750 | | †GigaBeam a,c | | | 10,000 | | | | 42,700 |
Electroglas a,c | | | 281,700 | | | | 701,433 | | †Hurray! Holding Company ADR a | | | 10,100 | | | | 62,620 |
Exar Corporation a,c | | | 121,208 | | | | 1,575,704 | | Intervoice a | | | 2,900 | | | | 22,214 |
†Genesis Microchip a,c | | | 8,000 | | | | 81,120 | | †NMS Communications a,c | | | 600,000 | | | | 1,230,000 |
Integrated Silicon Solution a | | | 15,000 | | | | 86,250 | | North Pittsburgh Systems | | | 15,700 | | | | 378,998 |
Intevac a | | | 40,550 | | | | 1,052,272 | | Novatel Wireless a,c | | | 49,200 | | | | 475,764 |
Jinpan International | | | 18,050 | | | | 435,727 | | PC-Tel a | | | 49,600 | | | | 463,760 |
†Kopin Corporation a | | | 11,400 | | | | 40,698 | | Radyne a | | | 78,520 | | | | 843,305 |
MIPS Technologies a | | | 4,300 | | | | 35,690 | | SpectraLink Corporation a | | | 57,000 | | | | 490,200 |
†Nextest Systems a,c | | | 4,900 | | | | 55,223 | | Symmetricom a,c | | | 24,782 | | | | 221,055 |
PDF Solutions a,c | | | 29,000 | | | | 419,050 | | UCN a | | | 189,500 | | | | 540,075 |
Photronics a,c | | | 29,750 | | | | 486,115 | | ViaSat a | | | 91,812 | | | | 2,736,916 |
QuickLogic Corporation a | | | 20,000 | | | | 59,400 | | WJ Communications a | | | 209,300 | | | | 328,601 |
Semitool a,c | | | 25,500 | | | | 339,405 | | Zhone Technologies a,c | | | 481,600 | | | | 630,896 |
†Vimicro International ADR a | | | 100,000 | | | | 1,020,000 | | | | | | | |
|
| | | | | | |
| | | | | | | | | 10,949,828 |
| | | | | | | | 7,147,431 | | | | | | | |
|
| | | | | | |
| | Total (Cost $51,436,043) | | | | | | | 83,464,306 |
Software - 4.0% | | | | | | | | | | | | | | |
|
Aladdin Knowledge Systems a | | | 27,300 | | | | 532,077 | | Miscellanous e – 4.9% | | | | | | | |
Altiris a | | | 3,500 | | | | 88,830 | | Total (Cost $16,275,646) | | | | | | | 16,717,503 |
Applix a | | | 20,000 | | | | 227,000 | | | | | | | |
|
AsiaInfo Holdings a | | | 50,000 | | | | 384,000 | | TOTAL COMMON STOCKS | | | | | | | |
Descartes Systems Group (The) a | | | 56,500 | | | | 208,485 | | (Cost $244,125,289) | | | | | | | 378,240,433 |
Evans & Sutherland Computer a | | | 83,500 | | | | 353,205 | | | | | | | |
|
Fundtech a | | | 55,000 | | | | 599,500 | | PREFERRED STOCK – 0.5% | | | | | | | |
ILOG ADR a | | | 35,000 | | | | 464,450 | | Seneca Foods Conv. a | | | 75,409 | | | | 1,764,571 |
Indus International a | | | 19,200 | | | | 72,768 | | | | | | | |
|
iPass a,c | | | 190,000 | | | | 1,117,200 | | TOTAL PREFERRED STOCK | | | | | | | |
JDA Software Group a,c | | | 59,500 | | | | 819,315 | | (Cost $943,607) | | | | | | | 1,764,571 |
Majesco Entertainment a | | | 2,500 | | | | 3,325 | | | | | | | |
|
MapInfo a | | | 5,000 | | | | 65,250 | | REPURCHASE AGREEMENT – 7.5% | | | | | | | |
McDATA Corporation Cl. A a,c | | | 18,199 | | | | 101,004 | | State Street Bank & Trust Company, | | | | | | | |
MIND C.T.I. | | | 20,000 | | | | 53,800 | | 5.10% dated 12/29/06, due 1/2/07, | | | | | | | |
Moldflow Corporation a | | | 7,500 | | | | 104,175 | | maturity value $25,628,515 (collateralized | | | | | | | |
Peerless Systems a,c | | | 88,670 | | | | 241,182 | | by obligations of various U.S. Government | | | | | | | |
Pegasystems c | | | 320,200 | | | | 3,160,374 | | Agencies, valued at $26,257,513) | | | | | | | |
†Pervasive Software a | | | 22,500 | | | | 81,225 | | (Cost $25,614,000) | | | | | | | 25,614,000 |
Phase Forward a | | | 43,000 | | | | 644,140 | | | | | | | |
|
40 | 2006 ANNUAL REPORT TO STOCKHOLDERS | THE ACCOMPANYING NOTES ARE AN INTEGRAL PART OF THESE FINANCIAL STATEMENTS. |
| | | | PRINCIPAL | | | | | |
| | | | AMOUNT | | | | VALUE | |
| | | | | | | | | |
COLLATERAL RECEIVED FOR SECURITIES
LOANED – 7.5% | | | | | | | | |
| U.S. Treasury Bonds | | | | | | | | |
6.25% due 8/15/23 | | $ | 161,125 | | | $ | 164,383 | |
Money Market Funds | | | | | | | | |
State Street Navigator Securities Lending | | | | | | | | |
Prime Portfolio (7 day yield-5.25%) | | | | | | | 25,761,168 | |
| | | | | | |
| |
TOTAL COLLATERAL RECEIVED FOR
SECURITIES LOANED | | | | | | | | |
(Cost $25,925,551) | | | | | | | 25,925,551 | |
| | | | | | |
| |
TOTAL INVESTMENTS – 125.6% | | | | | | | | |
(Cost $296,608,447) | | | | | | | 431,544,555 | |
| | | | | | | | | |
LIABILITIES LESS CASH
AND OTHER ASSETS – (8.1)% | | | | | | | (27,862,285 | ) |
| | | | | | | | | |
PREFERRED STOCK – (17.5)% | | | | | | | (60,000,000 | ) |
| | | | | | |
| |
NET ASSETS APPLICABLE TO
COMMON STOCKHOLDERS – 100.0% | | | | | | $ | 343,682,270 | |
| | | | | | |
| |
| a | | Non-income producing. |
| b | | At December 31, 2006, the Fund owned 5% or more of the Company’s outstanding voting securities thereby making the Company an Affiliated Company as that term is defined in the Investment Company Act of 1940. |
| c | | All or a portion of these securities were on loan at December 31, 2006. Total market value of loaned securities at December 31, 2006 was $24,965,008. |
| d | | Securities for which market quotations are no longer readily available represent 0.0% of net assets. These securities have been valued at their fair value under procedures established by the Fund’s Board of Directors. |
| e | | Includes securities first acquired in 2006 and less than 1% of net assets applicable to Common Stockholders. |
| † | | New additions in 2006. |
| | |
Bold indicates the Fund’s largest 20 equity holdings in terms of December 31, 2006 market value. |
| | | |
| INCOME TAX INFORMATION: The cost of total investments for Federal income tax purposes was $300,839,343. At December 31, 2006, net unrealized appreciation for all securities was $130,705,212, consisting of aggregate gross unrealized appreciation of $144,862,458 and aggregate gross unrealized depreciation of $14,157,246. The primary difference in book and tax basis cost is the timing of the recognition of losses on securities sold. |
| THE ACCOMPANYING NOTES ARE AN INTEGRAL PART OF THESE FINANCIAL STATEMENTS. |
2006 ANNUAL REPORT TO STOCKHOLDERS | 41 |
| ROYCE MICRO-CAP TRUST | DECEMBER 31, 2006 |
|
|
| Statement of Assets and Liabitities |
|
| ASSETS: | | | | |
| Investments at value (including collateral on loaned securities)* | | | | |
Non-Affiliates (cost $267,575,267) | | $ | 402,546,823 | |
Affiliated Companies (cost $3,419,180) | | | 3,383,732 | |
|
| Total investments at value | | | 405,930,555 | |
| Repurchase agreement (at cost and value) | | | 25,614,000 | |
| Cash | | | 29,945 | |
| Receivable for investments sold | | | 470,072 | |
| Receivable for dividends and interest | | | 377,136 | |
| Prepaid expenses | | | 7,499 | |
|
Total Assets | | | 432,429,207 | |
|
| LIABILITIES: | | | | |
| Payable for collateral on loaned securities | | | 25,925,551 | |
| Payable for investments purchased | | | 2,221,436 | |
| Payable for investment advisory fee | | | 384,478 | |
| Preferred dividends accrued but not yet declared | | | 80,000 | |
| Accrued expenses | | | 135,472 | |
|
Total Liabilities | | | 28,746,937 | |
|
| PREFERRED STOCK: | | | | |
| 6.00% Cumulative Preferred Stock - $0.001 par value, $25 liquidation value per share; 2,400,000 shares outstanding | | | 60,000,000 | |
|
Total Preferred Stock | | | 60,000,000 | |
|
| NET ASSETS APPLICABLE TO COMMON STOCKHOLDERS | | $ | 343,682,270 | |
|
| ANALYSIS OF NET ASSETS APPLICABLE TO COMMON STOCKHOLDERS: | | | | |
| Common Stock paid-in capital - $0.001 par value per share; 23,270,418 shares outstanding (150,000,000 shares authorized) | | $ | 204,286,122 | |
| Undistributed net investment income (loss) | | | (2,725,894 | ) |
| Accumulated net realized gain (loss) on investments and foreign currency | | | 7,266,208 | |
| Net unrealized appreciation (depreciation) on investments and foreign currency | | | 134,935,834 | |
| Preferred dividends accrued but not yet declared | | | (80,000 | ) |
|
Net Assets applicable to Common Stockholders (net asset value per share - $14.77) | | $ | 343,682,270 | |
|
| *Investments at identified cost (including $25,925,551 of collateral on loaned securities) | | $ | 270,994,447 | |
|
| Market value of loaned securities | | $ | 24,965,008 | |
|
| 42 | | | | | 2006 ANNUAL REPORT TO STOCKHOLDERS | | THE ACCOMPANYING NOTES ARE AN INTEGRAL PART OF THESE FINANCIAL STATEMENTS. |
| ROYCE MICRO-CAP TRUST | YEAR ENDED DECEMBER 31, 2006 |
|
| INVESTMENT INCOME: | | | |
| Income: | | | |
Dividends | | | |
Non-Affiliates* | $ | 2,832,838 | |
Affiliated Companies | | 92,475 | |
Interest | | 2,270,875 | |
Securities lending | | 276,627 | |
|
| Total income | | 5,472,815 | |
|
| Expenses: | | | |
Investment advisory fees | | 4,833,976 | |
Stockholder reports | | 141,775 | |
Custody and transfer agent fees | | 140,921 | |
Directors’ fees | | 55,772 | |
Professional fees | | 39,358 | |
Administrative and office facilities expenses | | 30,038 | |
Other expenses | | 72,555 | |
|
| Total expenses | | 5,314,395 | |
| Compensating balance credits | | (8,853 | ) |
|
| Net expenses | | 5,305,542 | |
|
| Net investment income (loss) | | 167,273 | |
|
| REALIZED AND UNREALIZED GAIN (LOSS) ON INVESTMENTS AND FOREIGN CURRENCY: | | | |
| Net realized gain (loss) on investments and foreign currency | | | |
Non-Affiliates | | 40,575,092 | |
Affiliated Companies | | (234,819 | ) |
| Net change in unrealized appreciation (depreciation) on investments and foreign currency | | 27,839,554 | |
|
| Net realized and unrealized gain (loss) on investments and foreign currency | | 68,179,827 | |
|
| NET INCREASE (DECREASE) IN NET ASSETS RESULTING FROM INVESTMENT OPERATIONS | | 68,347,100 | |
|
| DISTRIBUTIONS TO PREFERRED STOCKHOLDERS | | (3,600,000 | ) |
|
| NET INCREASE (DECREASE) IN NET ASSETS APPLICABLE TO COMMON STOCKHOLDERS | | | |
RESULTING FROM INVESTMENT OPERATIONS | $ | 64,747,100 | |
|
| * Net of foreign withholding tax of $63,945. | | | |
| THE ACCOMPANYING NOTES ARE AN INTEGRAL PART OF THESE FINANCIAL STATEMENTS. | | 2006 ANNUAL REPORT TO STOCKHOLDERS | | | 43 |
|
| Statement of Changes in Net Assets |
|
|
| | | Year ended | | Year ended |
| | | 12/31/06 | | 12/31/05 |
|
| INVESTMENT OPERATIONS: | | | | | | | | |
| Net investment income (loss) | | $ | 167,273 | | | $ | (763,209 | ) |
| Net realized gain (loss) on investments and foreign currency | | | 40,340,273 | | | | 37,754,245 | |
| Net change in unrealized appreciation (depreciation) on investments and foreign currency | | | 27,839,554 | | | | (14,066,144 | ) |
|
| Net increase (decrease) in net assets resulting from investment operations | | | 68,347,100 | | | | 22,924,892 | |
|
| DISTRIBUTIONS TO PREFERRED STOCKHOLDERS: | | | | | | | | |
| Net investment income | | | (475,560 | ) | | | – | |
| Net realized gain on investments and foreign currency | | | (3,124,440 | ) | | | (3,600,000 | ) |
|
| Total distributions to Preferred Stockholders | | | (3,600,000 | ) | | | (3,600,000 | ) |
|
| NET INCREASE (DECREASE) IN NET ASSETS APPLICABLE TO COMMON STOCKHOLDERS | | | | | | | | |
RESULTING FROM INVESTMENT OPERATIONS | | | 64,747,100 | | | | 19,324,892 | |
|
| DISTRIBUTIONS TO COMMON STOCKHOLDERS: | | | | | | | | |
| Net investment income | | | (4,585,208 | ) | | | – | |
| Net realized gain on investments and foreign currency | | | (30,124,923 | ) | | | (38,452,900 | ) |
|
| Total distributions to Common Stockholders | | | (34,710,131 | ) | | | (38,452,900 | ) |
|
| CAPITAL STOCK TRANSACTIONS: | | | | | | | | |
| Reinvestment of distributions to Common Stockholders | | | 19,926,104 | | | | 22,483,567 | |
|
| Total capital stock transactions | | | 19,926,104 | | | | 22,483,567 | |
|
| NET INCREASE (DECREASE) IN NET ASSETS APPLICABLE TO COMMON STOCKHOLDERS | | | 49,963,073 | | | | 3,355,559 | |
|
| NET ASSETS APPLICABLE TO COMMON STOCKHOLDERS: | | | | | | | | |
Beginning of year | | | 293,719,197 | | | | 290,363,638 | |
|
End of year (including undistributed net investment income (loss) of $(2,725,894) at 12/31/06 and $(1,104) at 12/31/05) | | $ | 343,682,270 | | | $ | 293,719,197 | |
|
| 44 | | | | | 2006 ANNUAL REPORT TO STOCKHOLDERS | | THE ACCOMPANYING NOTES ARE AN INTEGRAL PART OF THESE FINANCIAL STATEMENTS. |
| This table is presented to show selected data for a share of Common Stock outstanding throughout each period, and to assist stockholders in evaluating the Fund’s performance for the periods presented. |
| | | | Years ended December 31, |
| | | |
|
| | | | | 2006 | | | | 2005 | | | | 2004 | | | | 2003 | | | | 2002 | |
|
| NET ASSET VALUE, BEGINNING OF PERIOD | | | | $13.43 | | | | $14.34 | | | | $13.33 | | | | $9.39 | | | | $11.83 | |
|
| INVESTMENT OPERATIONS: | | | | | | | | | | | | | | | | | | | | | |
Net investment income (loss) | | | | 0.01 | | | | (0.03 | ) | | | (0.08 | ) | | | (0.09 | ) | | | (0.13 | ) |
Net realized and unrealized gain (loss) on investments and foreign currency | | | | 3.04 | | | | 1.14 | | | | 2.62 | | | | 5.28 | | | | (1.29 | ) |
|
Total investment operations | | | | 3.05 | | | | 1.11 | | | | 2.54 | | | | 5.19 | | | | (1.42 | ) |
|
| DISTRIBUTIONS TO PREFERRED STOCKHOLDERS: | | | | | | | | | | | | | | | | | | | | | |
Net investment income | | | | (0.02 | ) | | | – | | | | – | | | | – | | | | – | |
Net realized gain on investments and foreign currency | | | | (0.14 | ) | | | (0.17 | ) | | | (0.19 | ) | | | (0.18 | ) | | | (0.18 | ) |
|
Total distributions to Preferred Stockholders | | | | (0.16 | ) | | | (0.17 | ) | | | (0.19 | ) | | | (0.18 | ) | | | (0.18 | ) |
|
NET INCREASE (DECREASE) IN NET ASSETS APPLICABLE TO COMMON STOCKHOLDERS RESULTING FROM INVESTMENT OPERATIONS | | | | 2.89 | | | | 0.94 | | | | 2.35 | | | | 5.01 | | | | (1.60 | ) |
|
| DISTRIBUTIONS TO COMMON STOCKHOLDERS: | | | | | | | | | | | | | | | | | | | | | |
Net investment income | | | | (0.20 | ) | | | – | | | | – | | | | – | | | | – | |
Net realized gain on investments and foreign currency | | | | (1.35 | ) | | | (1.85 | ) | | | (1.33 | ) | | | (0.92 | ) | | | (0.80 | ) |
|
Total distributions to Common Stockholders | | | | (1.55 | ) | | | (1.85 | ) | | | (1.33 | ) | | | (0.92 | ) | | | (0.80 | ) |
|
| CAPITAL STOCK TRANSACTIONS: | | | | | | | | | | | | | | | | | | | | | |
Effect of reinvestment of distributions by Common Stockholders | | | | (0.00 | ) | | | 0.00 | | | | (0.01 | ) | | | (0.04 | ) | | | (0.04 | ) |
Effect of Preferred Stock offering | | | | – | | | | – | | | | – | | | | (0.11 | ) | | | – | |
|
Total capital stock transactions | | | | (0.00 | ) | | | 0.00 | | | | (0.01 | ) | | | (0.15 | ) | | | (0.04 | ) |
|
| NET ASSET VALUE, END OF PERIOD | | | | $14.77 | | | | $13.43 | | | | $14.34 | | | | $13.33 | | | | $9.39 | |
|
| MARKET VALUE, END OF PERIOD | | | | $16.57 | | | | $14.56 | | | | $15.24 | | | | $12.60 | | | | $8.44 | |
|
| TOTAL RETURN (a): | | | | | | | | | | | | | | | | | | | | | |
| Market Value | | | | 26.72 | % | | | 8.90 | % | | | 33.44 | % | | | 63.58 | % | | | (12.70 | )% |
| Net Asset Value | | | | 22.46 | % | | | 6.75 | % | | | 18.69 | % | | | 55.55 | % | | | (13.80 | )% |
RATIOS BASED ON AVERAGE NET ASSETS APPLICABLE TO COMMON STOCKHOLDERS: | | | | | | | | | | | | | | | | | | | | | |
| Total expenses (b,c) | | | | 1.64 | % | | | 1.63 | % | | | 1.62 | % | | | 1.82 | % | | | 1.96 | % |
Management fee expense (d) | | | | 1.49 | % | | | 1.43 | % | | | 1.43 | % | | | 1.59 | % | | | 1.59 | % |
Other operating expenses | | | | 0.15 | % | | | 0.20 | % | | | 0.19 | % | | | 0.23 | % | | | 0.37 | % |
| Net investment income (loss) | | | | 0.05 | % | | | (0.27 | )% | | | (0.56 | )% | | | (0.82 | )% | | | (1.23 | )% |
| SUPPLEMENTAL DATA: | | | | | | | | | | | | | | | | | | | | | |
| Net Assets Applicable to Common Stockholders, | | | | | | | | | | | | | | | | | | | | | |
End of Period (in thousands) | | | | $343,682 | | | | $293,719 | | | | $290,364 | | | | $253,425 | | | | $167,571 | |
| Liquidation Value of Preferred Stock, | | | | | | | | | | | | | | | | | | | | | |
End of Period (in thousands) | | | | $60,000 | | | | $60,000 | | | | $60,000 | | | | $60,000 | | | | $40,000 | |
| Portfolio Turnover Rate | | | | 34 | % | | | 46 | % | | | 32 | % | | | 26 | % | | | 39 | % |
| PREFERRED STOCK: | | | | | | | | | | | | | | | | | | | | | |
| Total shares outstanding | | | | 2,400,000 | | | | 2,400,000 | | | | 2,400,000 | | | | 2,400,000 | | | | 1,600,000 | |
| Asset coverage per share | | | | $168.20 | | | | $147.38 | | | | $145.98 | | | | $130.59 | | | | $129.73 | |
| Liquidation preference per share | | | | $25.00 | | | | $25.00 | | | | $25.00 | | | | $25.00 | | | | $25.00 | |
| Average market value per share (e): | | | | | | | | | | | | | | | | | | | | | |
6.00% Cumulative | | | | $24.15 | | | | $24.97 | | | | $24.66 | | | | $25.37 | | | | – | |
7.75% Cumulative | | | | – | | | | – | | | | – | | | | $25.70 | | | | $25.91 | |
|
| (a) | | The Market Value Total Return is calculated assuming a purchase of Common Stock on the opening of the first business day and a sale on the closing of the last business day of each period reported. Dividends and distributions, if any, are assumed for the purposes of this calculation to be reinvested at prices obtained under the Fund’s Distribution Reinvestment and Cash Purchase Plan. Net Asset Value Total Return is calculated on the same basis, except that the Fund’s net asset value is used on the purchase and sale dates instead of market value. | |
| (b) | | Expense ratios based on total average net assets including liquidation value of Preferred Stock were 1.38%, 1.35%, 1.32%, 1.49% and 1.62% for the periods ended December 31, 2006, 2005, 2004, 2003 and 2002, respectively. | |
| (c) | | Expense ratios based on average net assets applicable to Common Stockholders before waiver of fees by the investment adviser would have been 1.92% and 2.04% for the periods ended December 31, 2003 and 2002, respectively. | |
| (d) | | The management fee is calculated based on average net assets over a rolling 36-month basis, while the above ratios of Management fee expenses are based on average net assets applicable to Common Stockholders over a 12-month basis. | |
| (e) | | The average of month-end market values during the period that the Preferred Stock was outstanding. | |
| THE ACCOMPANYING NOTES ARE AN INTEGRAL PART OF THESE FINANCIAL STATEMENTS. |
2006 ANNUAL REPORT TO STOCKHOLDERS | 45 |
ROYCE MICRO-CAP TRUST
|
Notes to Financial Statements |
|
Summary of Significant Accounting Policies:
Royce Micro-Cap Trust, Inc. (“the Fund”) was incorporated under the laws of the State of Maryland on September 9, 1993 as a diversified closed-end investment company. The Fund commenced operations on December 14, 1993.
The preparation of financial statements in conformity with accounting principles generally accepted in the United States of America requires management to make estimates and assumptions that affect the reported amounts of assets and liabilities and the disclosure of contingent assets and liabilities at the date of the financial statements, and the reported amounts of income and expenses during the reporting period. Actual results could differ from those estimates.
Valuation of Investments:
Securities are valued as of the close of trading on the New York Stock Exchange (generally 4:00 p.m. Eastern time) on the valuation date. Securities that trade on an exchange, and securities traded on Nasdaq’s Electronic Bulletin Board, are valued at their last reported sales price or Nasdaq official closing price taken from the primary market in which each security trades or, if no sale is reported for such day, at their bid price. Other over-the-counter securities for which market quotations are readily available are valued at their highest bid price. Securities for which market quotations are not readily available are valued at their fair value under procedures established by the Fund’s Board of Directors. Bonds and other fixed income securities may be valued by reference to other securities with comparable ratings, interest rates and maturities, using established independent pricing services. Investments in money market funds are valued at net asset value per share.
Foreign Currency:
The Fund does not isolate that portion of the results of operations which result from changes in foreign exchange rates on investments from the portion arising from changes in market prices of securities held. Such fluctuations are included with net realized and unrealized gains and losses on investments.
Net realized foreign exchange gains or losses arise from sales and maturities of short-term securities, sales of foreign currencies, expiration of currency forward contracts, currency gains or losses realized between the trade and settlement dates on securities transactions, the difference between the amounts of dividends, interest, and foreign withholding taxes recorded on the Fund’s books, and the U.S. dollar equivalent of the amounts actually received or paid. Net unrealized foreign exchange gains and losses arise from changes in the value of assets and liabilities, including investments in securities at fiscal year end, as a result of changes in the exchange rates.
Investment Transactions and Related Investment Income:
Investment transactions are accounted for on the trade date. Dividend income is recorded on the ex-dividend date and any non-cash dividend income is recorded on the ex-dividend date at the fair market value of the securities received. Interest income is recorded on an accrual basis. Premium and discounts on debt securities are amortized using the effective yield to maturity method. Realized gains and losses from | | investment transactions are determined on the basis of identified cost for book and tax purposes.
Expenses:
The Fund incurs direct and indirect expenses. Expenses directly attributable to the Fund are charged to the Fund’s operations, while expenses applicable to more than one of the Royce Funds are allocated in an equitable manner. Allocated personnel and occupancy costs related to The Royce Funds are included in administrative and office facilities expenses. The Fund has adopted a deferred fee agreement that allows the Fund’s Directors to defer the receipt of all or a portion of Directors’ Fees otherwise payable. The deferred fees are invested in certain Royce Funds until distributed in accordance with the agreement.
Compensating Balance Credits:
The Fund has an arrangement with its custodian bank, whereby a portion of the custodian’s fee is paid indirectly by credits earned on the Fund’s cash on deposit with the bank. This deposit arrangement is an alternative to purchasing overnight investments.
Taxes:
As a qualified regulated investment company under Subchapter M of the Internal Revenue Code, the Fund is not subject to income taxes to the extent that it distributes substantially all of its taxable income for its fiscal year. The Schedule of Investments includes information regarding income taxes under the caption “Income Tax Information”.
Distributions:
The Fund currently has a policy of paying quarterly distributions on the Fund’s Common Stock. Distributions are currently being made at the annual rate of 9% of the rolling average of the prior four calendar quarter-end NAVs of the Fund’s Common Stock, with the fourth quarter distribution being the greater of 2.25% of the rolling average or the distribution required by IRS regulations. Distributions to Preferred Stockholders are accrued daily and paid quarterly and distributions to Common Stockholders are recorded on ex-dividend date. The Fund is required to allocate long-term capital gain distributions and other types of income proportionately to distributions made to holders of shares of Common Stock and Preferred Stock. To the extent that distributions are not paid from long-term capital gains, net investment income or net short-term capital gains, they will represent a return of capital. Distributions are determined in accordance with income tax regulations that may differ from accounting principles generally accepted in the United States of America. Permanent book and tax basis differences relating to stockholder distributions will result in reclassifications within the capital accounts. Undistributed net investment income may include temporary book and tax basis differences, which will reverse in a subsequent period. Any taxable income or gain remaining undistributed at fiscal year end is distributed in the following year.
Repurchase Agreements:
The Fund may enter into repurchase agreements with institutions that the Fund’s investment adviser has determined are creditworthy. The Fund restricts repurchase agreements to maturities of no more than |
46 | 2006 ANNUAL REPORT TO STOCKHOLDERS |
DECEMBER 31, 2006
seven days. Securities pledged as collateral for repurchase agreements, which are held until maturity of the repurchase agreements, are marked-to-market daily and maintained at a value at least equal to the principal amount of the repurchase agreement (including accrued interest). Repurchase agreements could involve certain risks in the event of default or insolvency of the counter-party, including possible delays or restrictions upon the ability of the Fund to dispose of the underlying securities.
Securities Lending:
The Fund loans securities to qualified institutional investors for the purpose of realizing additional income. Collateral on all securities loaned for the Fund is accepted in cash and cash equivalents and invested temporarily by the custodian. The collateral is equal to at least 100% of the current market value of the loaned securities. The market value of the loaned securities is determined at the close of business of the Fund and any additional required collateral is delivered to the Fund on the next business day.
New Accounting Pronouncements:
On July 13, 2006, the Financial Accounting Standards Board (“FASB”) released FASB Interpretation No. 48, “Accounting for Uncertainty in Income Taxes” (“FIN 48”). FIN 48 provides guidance for how uncertain tax positions should be recognized, measured, presented and disclosed in the financial statements. FIN 48 requires the evaluation of tax positions taken or expected to be taken in the course of preparing the Fund’s tax returns to determine whether the tax positions are “more-likely-than-not” of being sustained by the applicable tax authority. Tax positions not deemed to meet the more-likely-than-not threshold would be recorded as a tax benefit or expense in the current year. Adoption of FIN 48 is required to be implemented no later than the Fund’s June 29, 2007 NAV calculation and is to be applied to all open tax years as of the effective date. At this time, management is evaluating the implications of FIN 48 and its impact in the financial statements has not yet been determined.
On September 15, 2006, the FASB released Statement of Financial Accounting Standards No. 157, “Fair Value Measurement” (“FAS 157”) which provides enhanced guidance for using fair value to measure assets and liabilities. The standard requires companies to provide expanded information about the assets and liabilities measured at fair value and the potential effect of these fair valuations on an entity’s financial performance. The standard does not expand the use of fair value in any new circumstances, but provides clarification on acceptable fair valuation methods and applications. Adoption of FAS 157 is required for fiscal years beginning after November 15, 2007. The standard is not expected to materially impact the Fund’s financial statements.
Capital Stock:
The Fund issued 1,401,367 and 1,625,665 shares of Common Stock as reinvestment of distributions by Common Stockholders for the years ended December 31, 2006 and 2005, respectively.
At December 31, 2006, 2,400,000 shares of 6.00% Cumulative Preferred Stock were outstanding. Commencing October 16, 2008 and thereafter, the Fund, at its option, may redeem the Cumulative Preferred Stock, in | | whole or in part, at the redemption price. The Cumulative Preferred Stock is classified outside of permanent equity (net assets applicable to Common Stockholders) in the accompanying financial statements in accordance with Emerging Issues Task Force (EITF) Topic D-98, Classification and Measurement of Redeemable Securities, that requires preferred securities that are redeemable for cash or other assets to be classified outside of permanent equity to the extent that the redemption is at a fixed or determinable price and at the option of the holder or upon the occurrence of an event that is not solely within the control of the issuer.
The Fund is required to meet certain asset coverage tests with respect to the Cumulative Preferred Stock as required by the 1940 Act. In addition, pursuant to the Rating Agency Guidelines established by Moody’s, the Fund is required to maintain a certain discounted asset coverage. If the Fund fails to meet these requirements and does not correct such failure, the Fund may be required to redeem, in part or in full, the Cumulative Preferred Stock at a redemption price of $25.00 per share, plus an amount equal to the accumulated and unpaid dividends, whether or not declared on such shares, in order to meet these requirements. Additionally, failure to meet the foregoing asset coverage requirements could restrict the Fund’s ability to pay dividends to Common Stockholders and could lead to sales of portfolio securities at inopportune times. The Fund has met these requirements since issuing the Cumulative Preferred Stock.
Investment Advisory Agreement:
As compensation for its services under the Investment Advisory Agreement, Royce & Associates, LLC (“Royce”) receives a fee comprised of a Basic Fee (“Basic Fee”) and an adjustment to the Basic Fee based on the investment performance of the Fund in relation to the investment record of the Russell 2000.
The Basic Fee is a monthly fee equal to 1/12 of 1% (1% on an annualized basis) of the average of the Fund’s month-end net assets applicable to Common Stockholders, plus the liquidation value of Preferred Stock, for the rolling 36-month period ending with such month (the “performance period”). The Basic Fee for each month is increased or decreased at the rate of 1/12 of 05% for each percentage point that the investment performance of the Fund exceeds, or is exceeded by, the percentage change in the investment record of the Russell 2000 for the performance period by more than two percentage points. The performance period for each such month is a rolling 36-month period ending with such month. The maximum increase or decrease in the Basic Fee for any month may not exceed 1/12 of 5%. Accordingly, for each month, the maximum monthly fee rate as adjusted for performance is 1/12 of 1.5% and is payable if the investment performance of the Fund exceeds the percentage change in the investment record of the Russell 2000 by 12 or more percentage points for the performance period, and the minimum monthly fee rate as adjusted for performance is 1/12 of 5% and is payable if the percentage change in the investment record of the Russell 2000 exceeds the investment performance of the Fund by 12 or more percentage points for the performance period.
Royce has voluntarily committed to waive the portion of its investment advisory fee attributable to an issue of the Fund’s Preferred Stock for any |
|
2006 ANNUAL REPORT TO STOCKHOLDERS | 47 |
| ROYCE MICRO-CAP TRUST | | DECEMBER 31, 2006 |
|
| Notes to Financial Statements (continued) |
|
month in which the Fund’s average annual NAV total return since issuance of the Preferred Stock fails to exceed the applicable Preferred Stock’s dividend rate.
For the twelve rolling 36-month periods ending December 2006, the investment performance of the Fund exceeded the investment performance | | of the Russell 2000 by 7% to 29%. Accordingly, the investment advisory fee consisted of a Basic Fee of $3,369,094 and an upward adjustment of $1,464,882 for performance of the Fund above that of the Russell 2000. For the year ended December 31, 2006, the Fund accrued and paid Royce advisory fees totaling $4,833,976. |
Distributions to Stockholders:
The tax character of distributions paid to stockholders during 2006 and 2005 was as follows:
|
| | Distributions paid from: | | 2006 | | 2005 |
| | Ordinary income | | | $ | 12,220,932 | | | | $ | 4,022,315 | |
| | Long-term capital gain | | | | 26,089,199 | | | | | 38,030,585 | |
| | | | |
|
| | | | | $ | 38,310,131 | | | | $ | 42,052,900 | |
|
As of December 31, 2006, the tax basis components of distributable earnings included in stockholders’ equity were as follows:
|
| | Undistributed net investment income | | | | $ | 2,577,694 | |
| | Undistributed long-term capital gain | | | | | 6,194,696 | |
| | Unrealized appreciation | | | | | 130,704,938 | |
| | Post October currency loss* | | | | | (1,180 | ) |
| | Accrued preferred distributions | | | | | (80,000 | ) |
| | | | | |
|
| | | | | | $ | 139,396,148 | |
|
| * | Under current tax law, capital and currency losses realized after October 31, and prior to the Fund’s fiscal year end, may be deferred as occurring on the first day of the following fiscal year. |
The difference between book basis and tax basis unrealized appreciation is attributable primarily to the tax deferral on wash sales and the unrealized gains on investments in Passive Foreign Investment Companies.
For financial reporting purposes, capital accounts and distributions to stockholders are adjusted to reflect the tax character of permanent book / tax differences. These differences are primarily due to differing treatments of income and gains on various investment securities and foreign currency transactions held by the Fund, timing differences and different characterization of distributions made by the Fund. For the year ended December 31, 2006, the Fund recorded the following permanent reclassifications, which relate primarily to the current net operating losses. Results of operations and net assets were not affected by these reclassifications.
|
| | Undistributed | | | Accumulated | | | | | |
| | Net Investment | | | Net Realized | | | | Paid-in | |
| | Income | | | Gain (Loss) | | | | Capital | |
| |
| | |
| | | |
| |
| | $2,168,705 | | | $(2,082,796) | | | $ | (85,909) | |
|
Purchases and Sales of Investment Securities:
For the year ended December 31, 2006, the cost of purchases and proceeds from sales of investment securities, other than short-term securities and collateral received for securities loaned, amounted to $117,114,561 and $122,279,205, respectively.Transactions in Shares of Affiliated Companies:
An “Affiliated Company”, as defined in the Investment Company Act of 1940, is a company in which a Fund owns 5% or more of the company’s outstanding voting securities at any time during the period. The Fund effected the following transactions in shares of such companies during the year ended December 31, 2006:
| | | | Shares | | Market Value | | Cost of | | Cost of | | Realized | | Dividend | | Shares | | Market Value |
| Affiliated Company | | | 12/31/05 | | 12/31/05 | | Purchases | | Sales | | Gain (Loss) | | Income | | 12/31/06 | | 12/31/06 |
|
| Abigail Adams National Bancorp** | | | | 244,400 | | | | $ | 3,421,624 | | | | | – | | | | $ | 1,342,400 | | | | $ | (235,259 | ) | | | $ | 92,475 | | | | | | | | | | | |
| BKF Capital Group** | | | | – | | | | | – | | | | $ | 1,601,001 | | | | | 94,735 | | | | | 440 | | | | | – | | | | | | | | | | | |
| Highbury Financial | | | | – | | | | | – | | | | | 3,419,180 | | | | | – | | | | | – | | | | | – | | | | | 580,400 | | | | $ | 3,383,732 | |
|
| | | | | | | | | $ | 3,421,624 | | | | | | | | | | | | | | $ | (234,819 | ) | | | $ | 92,475 | | | | | | | | | $ | 3,383,732 | |
|
| ** | | Not an Affilated Company at December 31, 2006. |
48 | 2006 ANNUAL REPORT TO STOCKHOLDERS |
| ROYCE MICRO-CAP TRUST | | DECEMBER 31, 2006 |
|
|
Report of Independent Registered Public Accounting Firm |
|
To the Board of Directors and Stockholders of
Royce Micro – Cap Trust, Inc.
New York, New York
We have audited the accompanying statement of assets and liabilities of Royce Micro - Cap Trust, Inc. (“Fund”) including the schedule of investments, as of December 31, 2006, and the related statement of operations for the year then ended, the statement of changes in net assets for each of the two years in the period then ended and the financial highlights for each of the five years in the period then ended. These financial statements and financial highlights are the responsibility of the Fund’s management. Our responsibility is to express an opinion on these financial statements and financial highlights based on our audits.
We conducted our audits in accordance with standards of the Public Company Accounting Oversight Board (United States). Those standards require that we plan and perform the audit to obtain reasonable assurance about whether the financial statements and financial highlights are free of material misstatement. The Fund is not required to have, nor were we engaged to perform, an audit of its internal control over financial reporting. Our audits included consideration of internal control over financial reporting as a basis for designing audit procedures that are appropriate in the circumstances, but not for the purpose of expressing an opinion on the effectiveness of the Fund’s internal control over financial reporting. Accordingly, we express no such opinion. An audit includes examining, on a test basis, evidence supporting the amounts and disclosures in the financial statements. Our procedures included confirmation of securities owned as of December 31, 2006 by correspondence with the custodian and brokers or by other appropriate auditing procedures where replies from brokers were not received. An audit also includes assessing the accounting principles used and significant estimates made by management, as well as evaluating the overall financial statement presentation. We believe that our audits provide a reasonable basis for our opinion.
In our opinion, the financial statements and financial highlights referred to above present fairly, in all material respects, the financial position of Royce Micro - Cap Trust, Inc. as of December 31, 2006, the results of its operations for the year then ended, the changes in its net assets for each of the two years in the period then ended and the financial highlights for each of the five years in the period then ended, in conformity with accounting principles generally accepted in the United States of America.
Philadelphia, Pennsylvania
February 12, 2007
| |
2006 ANNUAL REPORT TO STOCKHOLDERS | 49 |
ROYCE FOCUS TRUST
| | | SHARES | | | VALUE | | | | SHARES | | | VALUE | |
COMMON STOCKS – 82.7% | | | | | | | Metal Fabrication and Distribution - 15.0% | | | | | | |
| | | | | | | | Harris Steel Group | | 150,000 | | $ | 5,594,049 | |
Consumer Products – 5.5% | | | | | | | IPSCO | | 60,000 | | | 5,632,200 | |
Apparel and Shoes - 1.5% | | | | | | | Metal Management | | 125,000 | | | 4,731,250 | |
Timberland Company Cl. A a | | 75,000 | | $ | 2,368,500 | | Reliance Steel & Aluminum | | 100,000 | | | 3,938,000 | |
| | | | |
| | Schnitzer Steel Industries Cl. A | | 100,000 | | | 3,970,000 | |
Sports and Recreation - 4.0% | | | | | | | | | | |
| |
Thor Industries | | 90,000 | | | 3,959,100 | | | | | | | 23,865,499 | |
Winnebago Industries | | 75,000 | | | 2,468,250 | | | | | |
| |
| | | | |
| | Total (Cost $19,617,454) | | | | | 41,118,399 | |
| | | | | | 6,427,350 | | | | | |
| |
| | | | |
| | Industrial Services – 3.0% | | | | | | |
Total (Cost $6,260,311) | | | | | 8,795,850 | | Commercial Services - 0.7% | | | | | | |
| | | | |
| | BB Holdings a | | 400,000 | | | 1,155,220 | |
Consumer Services – 6.0% | | | | | | | | | | |
| |
Direct Marketing - 2.3% | | | | | | | Transportation and Logistics - 2.3% | | | | | | |
Nu Skin Enterprises Cl. A | | 200,000 | | | 3,646,000 | | Arkansas Best | | 100,000 | | | 3,600,000 | |
| | | | |
| | | | | |
| |
Retail Stores - 1.3% | | | | | | | Total (Cost $5,116,019) | | | | | 4,755,220 | |
†Buckle (The) | | 40,000 | | | 2,034,000 | | | | | |
| |
| | | | |
| | Natural Resources – 21.8% | | | | | | |
Other Consumer Services - 2.4% | | | | | | | Energy Services - 8.4% | | | | | | |
Corinthian Colleges a | | 120,000 | | | 1,635,600 | | Ensign Energy Services | | 170,000 | | | 2,680,873 | |
†Universal Technical Institute a | | 100,100 | | | 2,223,221 | | Input/Output a | | 100,000 | | | 1,363,000 | |
| | | | |
| | Pason Systems | | 200,000 | | | 2,274,150 | |
| | | | | | 3,858,821 | | Tesco Corporation a | | 200,000 | | | 3,534,000 | |
| | | | |
| | Trican Well Service | | 200,000 | | | 3,484,972 | |
Total (Cost $7,464,964) | | | | | 9,538,821 | | | | | |
| |
| | | | |
| | | | | | | 13,336,995 | |
Financial Intermediaries – 4.0% | | | | | | | | | | |
| |
Banking - 1.6% | | | | | | | Oil and Gas - 1.5% | | | | | | |
†Endeavour Mining Capital | | 400,000 | | | 2,435,364 | | †Unit Corporation a | | 50,000 | | | 2,422,500 | |
| | | | |
| | | | | |
| |
Securities Brokers - 2.4% | | | | | | | Precious Metals and Mining - 11.9% | | | | | | |
†Knight Capital Group Cl. A a | | 200,000 | | | 3,834,000 | | Gammon Lake Resources a | | 180,000 | | | 2,932,200 | |
| | | | |
| | Ivanhoe Mines a | | 450,000 | | | 4,423,500 | |
Total (Cost $5,799,301) | | | | | 6,269,364 | | Meridian Gold a | | 100,000 | | | 2,779,000 | |
| | | | |
| | Pan American Silver a | | 160,000 | | | 4,027,200 | |
Financial Services – 2.6% | | | | | | | Silver Standard Resources a,b | | 150,000 | | | 4,611,000 | |
| | | | | | | | | |
| |
Information and Processing - 2.6% | | | | | | | | | | | | 18,772,900 | |
eFunds Corporation a | | 150,000 | | | 4,125,000 | | | | | |
| |
| | | | |
| | Total (Cost $19,556,773) | | | | | 34,532,395 | |
Total (Cost $1,997,748) | | | | | 4,125,000 | | | | | |
| |
| | | | |
| | Technology – 7.5% | | | | | | |
Health – 6.4% | | | | | | | Internet Software and Services - 0.5% | | | | | | |
Drugs and Biotech - 4.8% | | | | | | | RealNetworks a | | 70,000 | | | 765,800 | |
Endo Pharmaceuticals Holdings a | | 120,000 | | | 3,309,600 | | | | | |
| |
Lexicon Genetics a,b | | 599,400 | | | 2,163,834 | | Semiconductors and Equipment - 1.0% | | | | | | |
†ViroPharma a | | 150,000 | | | 2,196,000 | | †Cirrus Logic a | | 224,900 | | | 1,547,312 | |
| | | | |
| | | | | |
| |
| | | | | | 7,669,434 | | Software - 2.3% | | | | | | |
| | | | |
| | ManTech International Cl. A a | | 75,000 | | | 2,762,250 | |
Medical Products and Devices - 1.6% | | | | | | | PLATO Learning a | | 160,000 | | | 865,600 | |
Caliper Life Sciences a | | 200,000 | | | 1,144,000 | | | | | |
| |
Possis Medical a,b | | 100,000 | | | 1,348,000 | | | | | | | 3,627,850 | |
| | | | |
| | | | | |
| |
| | | | | | 2,492,000 | | Telecommunications - 3.7% | | | | | | |
| | | | |
| | †ADTRAN | | 75,000 | | | 1,702,500 | |
Total (Cost $9,002,776) | | | | | 10,161,434 | | Foundry Networks a | | 280,100 | | | 4,195,898 | |
| | | | |
| | | | | |
| |
Industrial Products – 25.9% | | | | | | | | | | | | 5,898,398 | |
Building Systems and Components - 3.0% | | | | | | | | | | |
| |
Simpson Manufacturing | | 150,000 | | | 4,747,500 | | Total (Cost $8,633,826) | | | | | 11,839,360 | |
| | | | |
| | | | | |
| |
Construction Materials - 2.7% | | | | | | | TOTAL COMMON STOCKS | | | | | | |
Florida Rock Industries | | 100,000 | | | 4,305,000 | | (Cost $83,449,172) | | | | | 131,135,843 | |
| | | | |
| | | | | |
| |
Machinery - 5.2% | | | | | | | | | | | | | |
Lincoln Electric Holdings | | 70,000 | | | 4,229,400 | | | | | | | | |
Woodward Governor | | 100,000 | | | 3,971,000 | | | | | | | | |
| | | | |
| | | | | | | | |
| | | | | | 8,200,400 | | | | | | | | |
| | | | |
| | | | | | | | |
50 | 2006 ANNUAL REPORT TO STOCKHOLDERS | THE ACCOMPANYING NOTES ARE AN INTEGRAL PART OF THESE FINANCIAL STATEMENTS. |
DECEMBER 31, 2006
| | | PRINCIPAL | | | | | | | | | |
| | | AMOUNT | | | VALUE | | | | | VALUE | |
CORPORATE BONDS – 3.9% | | | | | | | | | Lehman Brothers (Tri-Party), | | | | |
Athena Neurosciences Finance 7.25% | | | | | | | | | 5.15% dated 12/29/06, due 1/3/07, | | | | |
Senior Note due 2/21/08 | | | $6,000,000 | | | $ | 6,120,000 | | maturity value $20,014,306 (collateralized | | | | |
| | | | | | |
| | by obligations of various U.S. Government | | | | |
TOTAL CORPORATE BONDS | | | | | | | | | Agencies, valued at $20,414,326) | | | | |
(Cost $5,735,520) | | | | | | | 6,120,000 | | (Cost $20,000,000) | | $ | 20,000,000 | |
| | | | | | |
| | | |
| |
GOVERNMENT BONDS – 7.7% | | | | | | | | | TOTAL REPURCHASE AGREEMENTS | | | | |
(Principal Amount shown | | | | | | | | | (Cost $33,738,000) | | | 33,738,000 | |
in local currency) | | | | | | | | | | |
| |
Canadian Government Bond | | | | | | | | | COLLATERAL RECEIVED FOR SECURITIES | | | | |
3.00% due 6/1/07 | | | 6,150,000 | | | | 5,249,136 | | LOANED – 0.5% | | | | |
New Zealand Government Bond | | | | | | | | | Money Market Funds | | | | |
6.00% due 7/15/08 | | | 10,000,000 | | | | 6,978,453 | | State Street Navigator Securities Lending | | | | |
| | | | | | |
| | Prime Portfolio (7 day yield-5.25%) | | | | |
TOTAL GOVERNMENT BONDS | | | | | | | 12,227,589 | | (Cost $786,590) | | | 786,590 | |
(Cost $11,360,867) | | | | | |
| | | |
| |
REPURCHASE AGREEMENTS – 21.3% | | | | | | | | | TOTAL INVESTMENTS – 116.1% | | | | |
State Street Bank & Trust Company, | | | | | | | | | (Cost $135,070,149) | | | 184,008,022 | |
5.10% dated 12/29/06, due 1/2/07, maturity value $13,745,785 (collateralized by obligations of various U.S. Government Agencies, valued at $14,085,075) (Cost $13,738,000) | | | | | | | | | LIABILITIES LESS CASH | | | | |
| | | | | | | 13,738,000 | | AND OTHER ASSETS – (0.3)% | | | (440,771 | ) |
| | | | | |
| | PREFERRED STOCK – (15.8)% | | | (25,000,000 | ) |
| | | | | | | | | | | |
| |
| | | | | | | | | | NET ASSETS APPLICABLE TO | | | | |
| | | | | | | | | COMMON STOCKHOLDERS – 100.0% | | $ | 158,567,251 | |
| | | | | | | | | | | |
| |
|
| a | | Non-income producing. |
| b | | All or a portion of these securities were on loan at December 31, 2006. Total market value of loaned securities at December 31, 2006 was $761,337. |
| † | | New additions in 2006. |
| | |
Bold indicates the Fund’s largest 20 equity holdings in terms of December 31, 2006 market value. |
| INCOME TAX INFORMATION: The cost of total investments for Federal income tax purposes was $138,218,355. At December 31, 2006, net unrealized appreciation for all securities was $45,789,667 consisting of aggregate gross unrealized appreciation of $47,504,537 and aggregate gross unrealized depreciation of $1,714,870. The primary differences in book and tax basis cost are the timing of the recognition of losses on securities sold and amortization of discount for book and tax purposes. |
|
| THE ACCOMPANYING NOTES ARE AN INTEGRAL PART OF THESE FINANCIAL STATEMENTS. |
2006 ANNUAL REPORT TO STOCKHOLDERS | 51 |
| ROYCE FOCUS TRUST | | DECEMBER 31, 2006 |
|
|
Statement of Assets and Liabilities |
|
| ASSETS: | | | | |
| Investments at value (including collateral on loaned securities)* | | $ | 150,270,022 | |
| Repurchase agreements (at cost and value) | | | 33,738,000 | |
| Cash | | | 37,201 | |
| Receivable for dividends and interest | | | 578,308 | |
| Prepaid expenses | | | 3,508 | |
|
Total Assets | | | 184,627,039 | |
|
| LIABILITIES: | | | | |
| Payable for collateral on loaned securities | | | 786,590 | |
| Payable for investment advisory fee | | | 158,038 | |
| Preferred dividends accrued but not yet declared | | | 33,326 | |
| Accrued expenses | | | 81,834 | |
|
Total Liabilities | | | 1,059,788 | |
|
| PREFERRED STOCK: | | | | |
| 6.00% Cumulative Preferred Stock - $0.001 par value, $25 liquidation value per share; 1,000,000 shares outstanding | | | 25,000,000 | |
|
Total Preferred Stock | | | 25,000,000 | |
|
| NET ASSETS APPLICABLE TO COMMON STOCKHOLDERS | | $ | 158,567,251 | |
|
| ANALYSIS OF NET ASSETS APPLICABLE TO COMMON STOCKHOLDERS: | | | | |
| Common Stock paid-in capital - $0.001 par value per share; 16,262,552 shares outstanding (100,000,000 shares authorized) | | $ | 108,025,365 | |
| Undistributed net investment income (loss) | | | (517,355 | ) |
| Accumulated net realized gain (loss) on investments and foreign currency | | | 2,142,267 | |
| Net unrealized appreciation (depreciation) on investments and foreign currency | | | 48,950,307 | |
| Preferred dividends accrued but not yet declared | | | (33,333 | ) |
|
Net Assets applicable to Common Stockholders (net asset value per share - $9.75) | | $ | 158,567,251 | |
|
| *Investments at identified cost (including $786,590 of collateral on loaned securities) | | $ | 101,332,149 | |
|
| Market value of loaned securities | | $ | 761,337 | |
|
| 52 | 2006 ANNUAL REPORT TO STOCKHOLDERS | THE ACCOMPANYING NOTES ARE AN INTEGRAL PART OF THESE FINANCIAL STATEMENTS. |
| ROYCE FOCUS TRUST | | YEAR ENDED DECEMBER 31, 2006 |
|
| INVESTMENT INCOME: | | | | |
| Income: | | | | |
Interest | | $ | 3,489,600 | |
Dividends* | | | 946,172 | |
Securities lending | | | 16,536 | |
|
| Total income | | | 4,452,308 | |
|
| Expenses: | | | | |
Investment advisory fees | | | 1,786,912 | |
Stockholder reports | | | 80,611 | |
Custody and transfer agent fees | | | 74,751 | |
Professional fees | | | 32,120 | |
Directors’ fees | | | 20,596 | |
Administrative and office facilities expenses | | | 13,856 | |
Other expenses | | | 76,280 | |
|
| Total expenses | | | 2,085,126 | |
| Compensating balance credits | | | (1,385 | ) |
|
| Net expenses | | | 2,083,741 | |
|
| Net investment income (loss) | | | 2,368,567 | |
|
| REALIZED AND UNREALIZED GAIN (LOSS) ON INVESTMENTS AND FOREIGN CURRENCY: | | | | |
| Net realized gain (loss) on investments and foreign currency | | | 20,546,074 | |
| Net change in unrealized appreciation (depreciation) on investments and foreign currency | | | 1,820,291 | |
|
| Net realized and unrealized gain (loss) on investments and foreign currency | | | 22,366,365 | |
|
| NET INCREASE (DECREASE) IN NET ASSETS RESULTING FROM INVESTMENT OPERATIONS | | | 24,734,932 | |
|
| DISTRIBUTIONS TO PREFERRED STOCKHOLDERS | | | (1,500,000 | ) |
|
| NET INCREASE (DECREASE) IN NET ASSETS APPLICABLE TO COMMON STOCKHOLDERS | | | | |
RESULTING FROM INVESTMENT OPERATIONS | | $ | 23,234,932 | |
|
| *Net of foreign withholding tax of $27,116. | | | | |
| THE ACCOMPANYING NOTES ARE AN INTEGRAL PART OF THESE FINANCIAL STATEMENTS. | 2006 ANNUAL REPORT TO STOCKHOLDERS | 53 |
|
Statement of Changes in Net Assets |
|
|
| | | | | Year ended | | | | Year ended | |
| | | | | 12/31/06 | | | | 12/31/05 | |
|
| INVESTMENT OPERATIONS: | | | | | | | | | |
| Net investment income (loss) | | | $ | 2,368,567 | | | $ | 743,582 | |
| Net realized gain (loss) on investments | | | | 20,546,074 | | | | 19,164,839 | |
| Net change in unrealized appreciation (depreciation) on investments and foreign currency | | | | 1,820,291 | | | | 1,922,287 | |
|
| Net increase (decrease) in net assets resulting from investment operations | | | | 24,734,932 | | | | 21,830,708 | |
|
| DISTRIBUTIONS TO PREFERRED STOCKHOLDERS: | | | | | | | | | |
| Net investment income | | | | (187,800 | ) | | | (80,100 | ) |
| Net realized gain on investments and foreign currency | | | | (1,312,200 | ) | | | (1,419,900 | ) |
|
| Total distributions to Preferred Stockholders | | | | (1,500,000 | ) | | | (1,500,000 | ) |
|
NET INCREASE (DECREASE) IN NET ASSETS APPLICABLE TO COMMON STOCKHOLDERS RESULTING FROM INVESTMENT OPERATIONS | | | | 23,234,932 | | | | 20,330,708 | |
|
| DISTRIBUTIONS TO COMMON STOCKHOLDERS: | | | | | | | | | |
| Net investment income | | | | (2,950,803 | ) | | | (853,787 | ) |
| Net realized gain on investments and foreign currency | | | | (20,617,913 | ) | | | (15,134,720 | ) |
|
| Total distributions to Common Stockholders | | | | (23,568,716 | ) | | | (15,988,507 | ) |
|
| CAPITAL STOCK TRANSACTIONS: | | | | | | | | | |
| Reinvestment of distributions to Common Stockholders | | | | 15,657,293 | | | | 11,288,577 | |
| Net proceeds from rights offering | | | | – | | | | 21,760,372 | |
|
| Total capital stock transactions | | | | 15,657,293 | | | | 33,048,949 | |
|
| NET INCREASE (DECREASE) IN NET ASSETS APPLICABLE TO COMMON STOCKHOLDERS | | | | 15,323,509 | | | | 37,391,150 | |
|
| NET ASSETS APPLICABLE TO COMMON STOCKHOLDERS: | | | | | | | | | |
Beginning of year | | | | 143,243,742 | | | | 105,852,592 | |
|
End of year (including undistributed net investment income (loss) of $(517,355) at 12/31/06 and $(55,839) at 12/31/05) | | | $ | 158,567,251 | | | $ | 143,243,742 | |
|
| 54 | 2006 ANNUAL REPORT TO STOCKHOLDERS | THE ACCOMPANYING NOTES ARE AN INTEGRAL PART OF THESE FINANCIAL STATEMENTS. |
This table is presented to show selected data for a share of Common Stock outstanding throughout each period, and to assist stockholders in evaluating the Fund’s performance for the periods presented.
| | | | Years ended December 31, |
| | | |
|
| | | | | 2006 | | | | 2005 | | | | 2004 | | | | 2003 | | | | 2002 | |
|
| NET ASSET VALUE, BEGINNING OF PERIOD | | | | $9.76 | | | | $9.75 | | | | $9.00 | | | | $6.27 | | | | $7.28 | |
|
| INVESTMENT OPERATIONS: | | | | | | | | | | | | | | | | | | | | | |
Net investment income (loss) | | | | 0.16 | | | | 0.06 | | | | 0.02 | | | | 0.08 | | | | (0.01 | ) |
Net realized and unrealized gain (loss) on investments and foreign currency | | | | 1.50 | | | | 1.44 | | | | 2.63 | | | | 3.57 | | | | (0.74 | ) |
|
Total investment operations | | | | 1.66 | | | | 1.50 | | | | 2.65 | | | | 3.65 | | | | (0.75 | ) |
|
| DISTRIBUTIONS TO PREFERRED STOCKHOLDERS: | | | | | | | | | | | | | | | | | | | | | |
Net investment income | | | | (0.01 | ) | | | (0.01 | ) | | | (0.00 | ) | | | (0.02 | ) | | | (0.03 | ) |
Net realized gain on investments and foreign currency | | | | (0.09 | ) | | | (0.11 | ) | | | (0.15 | ) | | | (0.14 | ) | | | (0.13 | ) |
|
Total distributions to Preferred Stockholders | | | | (0.10 | ) | | | (0.12 | ) | | | (0.15 | ) | | | (0.16 | ) | | | (0.16 | ) |
|
| NET INCREASE (DECREASE) IN NET ASSETS APPLICABLE TO COMMON | | | | | | | | | | | | | | | | | | | | | |
STOCKHOLDERS RESULTING FROM INVESTMENT OPERATIONS | | | | 1.56 | | | | 1.38 | | | | 2.50 | | | | 3.49 | | | | (0.91 | ) |
|
| DISTRIBUTIONS TO COMMON STOCKHOLDERS: | | | | | | | | | | | | | | | | | | | | | |
Net investment income | | | | (0.20 | ) | | | (0.06 | ) | | | (0.02 | ) | | | (0.06 | ) | | | (0.02 | ) |
Net realized gain on investments and foreign currency | | | | (1.37 | ) | | | (1.15 | ) | | | (1.72 | ) | | | (0.56 | ) | | | (0.07 | ) |
|
Total distributions to Common Stockholders | | | | (1.57 | ) | | | (1.21 | ) | | | (1.74 | ) | | | (0.62 | ) | | | (0.09 | ) |
|
| CAPITAL STOCK TRANSACTIONS: | | | | | | | | | | | | | | | | | | | | | |
Effect of reinvestment of distributions by Common Stockholders | | | | (0.00 | ) | | | (0.03 | ) | | | (0.01 | ) | | | (0.03 | ) | | | (0.01 | ) |
Effect of rights offering and Preferred Stock offering | | | | – | | | | (0.13 | ) | | | – | | | | (0.11 | ) | | | – | |
|
Total capital stock transactions | | | | (0.00 | ) | | | (0.16 | ) | | | (0.01 | ) | | | (0.14 | ) | | | (0.01 | ) |
|
| NET ASSET VALUE, END OF PERIOD | | | | $9.75 | | | | $9.76 | | | | $9.75 | | | | $9.00 | | | | $6.27 | |
|
| MARKET VALUE, END OF PERIOD | | | | $10.68 | | | | $9.53 | | | | $10.47 | | | | $8.48 | | | | $5.56 | |
|
| TOTAL RETURN (a): | | | | | | | | | | | | | | | | | | | | | |
| Market Value | | | | 30.50 | % | | | 3.03 | % | | | 47.26 | % | | | 63.98 | % | | | (15.06 | )% |
| Net Asset Value | | | | 16.33 | % | | | 13.31 | % | | | 29.21 | % | | | 54.33 | % | | | (12.50 | )% |
| RATIOS BASED ON AVERAGE NET ASSETS APPLICABLE TO | | | | | | | | | | | | | | | | | | | | | |
COMMON STOCKHOLDERS: | | | | | | | | | | | | | | | | | | | | | |
| Total expenses (b,c) | | | | 1.36 | % | | | 1.48 | % | | | 1.53 | % | | | 1.57 | % | | | 1.88 | % |
Management fee expense | | | | 1.16 | % | | | 1.21 | % | | | 1.27 | % | | | 1.14 | % | | | 1.13 | % |
Other operating expenses | | | | 0.20 | % | | | 0.27 | % | | | 0.26 | % | | | 0.43 | % | | | 0.75 | % |
| Net investment income (loss) | | | | 1.54 | % | | | 0.63 | % | | | 0.24 | % | | | 1.07 | % | | | (0.16 | )% |
| SUPPLEMENTAL DATA: | | | | | | | | | | | | | | | | | | | | | |
| Net Assets Applicable to Common Stockholders, | | | | | | | | | | | | | | | | | | | | | |
End of Period (in thousands) | | | $ | 158,567 | | | $ | 143,244 | | | $ | 105,853 | | | $ | 87,012 | | | $ | 57,956 | |
| Liquidation Value of Preferred Stock, | | | | | | | | | | | | | | | | | | | | | |
End of Period (in thousands) | | | $ | 25,000 | | | $ | 25,000 | | | $ | 25,000 | | | $ | 25,000 | | | $ | 20,000 | |
| Portfolio Turnover Rate | | | | 30 | % | | | 42 | % | | | 52 | % | | | 49 | % | | | 61 | % |
| PREFERRED STOCK: | | | | | | | | | | | | | | | | | | | | | |
| Total shares outstanding | | | | 1,000,000 | | | | 1,000,000 | | | | 1,000,000 | | | | 1,000,000 | | | | 800,000 | |
| Asset coverage per share | | | | $183.57 | | | | $168.24 | | | | $130.85 | | | | $112.01 | | | | $97.44 | |
| Liquidation preference per share | | | | $25.00 | | | | $25.00 | | | | $25.00 | | | | $25.00 | | | | $25.00 | |
| Average market value per share (d): | | | | | | | | | | | | | | | | | | | | | |
6.00% Cumulative | | | | $24.98 | | | | $25.38 | | | | $24.83 | | | | $25.45 | | | | – | |
7.45% Cumulative | | | | – | | | | – | | | | – | | | | $25.53 | | | | $25.64 | |
|
| (a) | | The Market Value Total Return is calculated assuming a purchase of Common Stock on the opening of the first business day and a sale on the closing of the last business day of each period reported. Dividends and distributions, if any, are assumed for the purposes of this calculation to be reinvested at prices obtained under the Fund’s Distribution Reinvestment and Cash Purchase Plan. Net Asset Value Total Return is calculated on the same basis, except that the Fund’s net asset value is used on the purchase and sale dates instead of market value. |
| (b) | | Expense ratios based on total average net assets including liquidation value of Preferred Stock were 1.17%, 1.22%, 1.21%, 1.20% and 1.43% for the periods ended December 31, 2006, 2005, 2004, 2003 and 2002, respectively. | |
| (c) | | Expense ratios based on average net assets applicable to Common Stockholders before waiver of fees by the investment adviser would have been 1.73% and 2.06% for the periods ended December 31, 2003 and 2002, respectively. |
| (d) | | The average of month-end market values during the period that the Preferred Stock was outstanding. |
| THE ACCOMPANYING NOTES ARE AN INTEGRAL PART OF THESE FINANCIAL STATEMENTS. | 2006 ANNUAL REPORT TO STOCKHOLDERS | 55 |
ROYCE FOCUS TRUST
|
Notes to Financial Statements |
|
Summary of Significant Accounting Policies:
Royce Focus Trust, Inc. (“the Fund”) is a diversified closed-end investment company. The Fund commenced operations on March 2, 1988 and Royce & Associates, LLC (“Royce”) assumed investment management responsibility for the Fund on November 1, 1996. The preparation of financial statements in conformity with accounting principles generally accepted in the United States of America requires management to make estimates and assumptions that affect the reported amounts of assets and liabilities and the disclosure of contingent assets and liabilities at the date of the financial statements, and the reported amounts of income and expenses during the reporting period. Actual results could differ from those estimates.
Valuation of Investments:
Securities are valued as of the close of trading on the New York Stock Exchange (generally 4:00 p.m. Eastern time) on the valuation date. Securities that trade on an exchange, and securities traded on Nasdaq’s Electronic Bulletin Board, are valued at their last reported sales price or Nasdaq official closing price taken from the primary market in which each security trades or, if no sale is reported for such day, at their bid price. Other over-the-counter securities for which market quotations are readily available are valued at their highest bid price. Securities for which market quotations are not readily available are valued at their fair value under procedures established by the Fund’s Board of Directors. Bonds and other fixed income securities may be valued by reference to other securities with comparable ratings, interest rates and maturities, using established independent pricing services. Investments in money market funds are valued at net asset value per share.
Foreign Currency:
The Fund does not isolate that portion of the results of operations which result from changes in foreign exchange rates on investments from the portion arising from changes in market prices of securities held. Such fluctuations are included with net realized and unrealized gains and losses on investments. Net realized foreign exchange gains or losses arise from sales and maturities of short-term securities, sales of foreign currencies, expiration of currency forward contracts, currency gains or losses realized between the trade and settlement dates on securities transactions, the difference between the amounts of dividends, interest, and foreign withholding taxes recorded on the Fund’s books, and the U.S. dollar equivalent of the amounts actually received or paid. Net unrealized foreign exchange gains and losses arise from changes in the value of assets and liabilities, including investments in securities at fiscal year end, as a result of changes in the exchange rates.
Investment Transactions and Related Investment Income:
Investment transactions are accounted for on the trade date. Dividend income is recorded on the ex-dividend date and any non-cash dividend income is recorded on the ex-dividend date at the fair market value of the securities received. Interest income is recorded on an accrual basis.
| | Premium and discounts on debt securities are amortized using the effective yield to maturity method. Realized gains and losses from investment transactions are determined on the basis of identified cost for book and tax purposes.
Expenses:
The Fund incurs direct and indirect expenses. Expenses directly attributable to the Fund are charged to the Fund��s operations, while expenses applicable to more than one of the Royce Funds are allocated in an equitable manner. Allocated personnel and occupancy costs related to The Royce Funds are included in administrative and office facilities expenses. The Fund has adopted a deferred fee agreement that allows the Fund’s Directors to defer the receipt of all or a portion of Directors’ Fees otherwise payable. The deferred fees are invested in certain Royce Funds until distributed in accordance with the agreement.
Compensating Balance Credits:
The Fund has an arrangement with its custodian bank, whereby a portion of the custodian’s fee is paid indirectly by credits earned on the Fund’s cash on deposit with the bank. This deposit arrangement is an alternative to purchasing overnight investments.
Taxes:
As a qualified regulated investment company under Subchapter M of the Internal Revenue Code, the Fund is not subject to income taxes to the extent that it distributes substantially all of its taxable income for its fiscal year. The Schedule of Investments includes information regarding income taxes under the caption “Income Tax Information”.
Distributions:The Fund currently has a policy of paying quarterly distributions on the Fund’s Common Stock. Distributions are currently being made at the annual rate of 5% of the rolling average of the prior four calendar quarter-end NAVs of the Fund’s Common Stock, with the fourth quarter distribution being the greater of 1.25% of the rolling average or the distribution required by IRS regulations. Distributions to Preferred Stockholders are accrued daily and paid quarterly and distributions to Common Stockholders are recorded on ex-dividend date. The Fund is required to allocate long-term capital gain distributions and other types of income proportionately to distributions made to holders of shares of Common Stock and Preferred Stock. To the extent that distributions are not paid from long-term capital gains, net investment income or net short-term capital gains, they will represent a return of capital. Distributions are determined in accordance with income tax regulations that may differ from accounting principles generally accepted in the United States of America. Permanent book and tax basis differences relating to stockholder distributions will result in reclassifications within the capital accounts. Undistributed net investment income may include temporary book and tax basis differences, which will reverse in a subsequent period. Any taxable income or gain remaining undistributed at fiscal year end is distributed in the following year. |
| 56 | 2006 ANNUAL REPORT TO STOCKHOLDERS |
DECEMBER 31, 2006
Repurchase Agreements:
The Fund may enter into repurchase agreements with institutions that the Fund’s investment adviser has determined are creditworthy. The Fund restricts repurchase agreements to maturities of no more than seven days. Securities pledged as collateral for repurchase agreements, which are held until maturity of the repurchase agreements, are marked-to-market daily and maintained at a value at least equal to the principal amount of the repurchase agreement (including accrued interest). Repurchase agreements could involve certain risks in the event of default or insolvency of the counter-party, including possible delays or restrictions upon the ability of the Fund to dispose of the underlying securities.
Securities Lending:
The Fund loans securities to qualified institutional investors for the purpose of realizing additional income. Collateral on all securities loaned for the Fund is accepted in cash and cash equivalents and invested temporarily by the custodian. The collateral is equal to at least 100% of the current market value of the loaned securities. The market value of the loaned securities is determined at the close of business of the Fund and any additional required collateral is delivered to the Fund on the next business day.
New Accounting Pronouncements:
On July 13, 2006, the Financial Accounting Standards Board (“FASB”) released FASB Interpretation No. 48, “Accounting for Uncertainty in Income Taxes” (“FIN 48”). FIN 48 provides guidance for how uncertain tax positions should be recognized, measured, presented and disclosed in the financial statements. FIN 48 requires the evaluation of tax positions taken or expected to be taken in the course of preparing the Fund’s tax returns to determine whether the tax positions are “more-likely-than-not” of being sustained by the applicable tax authority. Tax positions not deemed to meet the more-likely-than-not threshold would be recorded as a tax benefit or expense in the current year. Adoption of FIN 48 is required to be implemented no later than the Fund’s June 29, 2007 NAV calculation and is to be applied to all open tax years as of the effective date. At this time, management is evaluating the implications of FIN 48 and its impact in the financial statements has not yet been determined.
On September 15, 2006, the FASB released Statement of Financial Accounting Standards No. 157, “Fair Value Measurement” (“FAS 157”) which provides enhanced guidance for using fair value to measure assets and liabilities. The standard requires companies to provide expanded information about the assets and liabilities measured at fair value and the potential effect of these fair valuations on an entity’s financial performance. The standard does not expand the use of fair value in any
| | new circumstances, but provides clarification on acceptable fair valuation methods and applications. Adoption of FAS 157 is required for fiscal years beginning after November 15, 2007. The standard is not expected to materially impact the Fund’s financial statements.
Capital Stock:
The Fund issued 1,587,885 and 1,191,399 shares of Common Stock as reinvestment of distributions by Common Stockholders for the years ended December 31, 2006 and 2005, respectively. On June 10, 2005, the Fund completed a rights offering of Common Stock to its stockholders at the rate of one common share for each 5 rights held by stockholders of record on May 6, 2005. The rights offering was fully subscribed, resulting in the issuance of 2,627,397 common shares at a price of $8.34, and proceeds of $21,912,491 to the Fund prior to the deduction of expenses of $152,119. The net asset value per share of the Fund’s Common Stock was reduced by approximately $0.13 per share as a result of the issuance. At December 31, 2006, 1,000,000 shares of 6.00% Cumulative Preferred Stock were outstanding. Commencing October 17, 2008 and thereafter, the Fund, at its option, may redeem the Cumulative Preferred Stock, in whole or in part, at the redemption price. The Cumulative Preferred Stock is classified outside of permanent equity (net assets applicable to Common Stockholders) in the accompanying financial statements in accordance with Emerging Issues Task Force (EITF) Topic D-98, Classification and Measurement of Redeemable Securities, that requires preferred securities that are redeemable for cash or other assets to be classified outside of permanent equity to the extent that the redemption is at a fixed or determinable price and at the option of the holder or upon the occurrence of an event that is not solely within the control of the issuer. The Fund is required to meet certain asset coverage tests with respect to the Cumulative Preferred Stock as required by the 1940 Act. In addition, pursuant to the Rating Agency Guidelines established by Moody’s, the Fund is required to maintain a certain discounted asset coverage. If the Fund fails to meet these requirements and does not correct such failure, the Fund may be required to redeem, in part or in full, the Cumulative Preferred Stock at a redemption price of $25.00 per share, plus an amount equal to the accumulated and unpaid dividends, whether or not declared on such shares, in order to meet these requirements. Additionally, failure to meet the foregoing asset coverage requirements could restrict the Fund’s ability to pay dividends to Common Stockholders and could lead to sales of portfolio securities at inopportune times. The Fund has met these requirements since issuing the Cumulative Preferred Stock. |
| 2006 ANNUAL REPORT TO STOCKHOLDERS | 57 |
| ROYCE FOCUS TRUST | DECEMBER 31, 2006 |
|
|
Notes to Financial Statements (continued) |
|
Investment Advisory Agreement:
The Investment Advisory Agreement between Royce and the Fund provides for fees to be paid at an annual rate of 1.0% of the Fund’s average daily net assets applicable to Common Stockholders plus the liquidation value of Preferred Stock. Royce has voluntarily committed to waive the portion of its investment advisory fee attributable to an issue of the Fund’s Preferred Stock for any month in which the Fund’s average annual NAV total return since issuance of the Preferred Stock fails to exceed the applicable Preferred Stock’s dividend rate. For the year ended December 31, 2006, the Fund accrued and paid Royce advisory fees totaling $1,786,912.
Distributions to Stockholders: The tax character of distributions paid to stockholders during 2006 and 2005 was as follows:
|
| Distributions paid from: | | | 2006 | | | 2005 | |
| Ordinary income | | $ | 4,915,975 | | $ | 1,682,395 | |
| Long-term capital gain | | | 20,152,741 | | | 15,806,112 | |
| | |
| |
| | | $ | 25,068,716 | | $ | 17,488,507 | |
|
As of December 31, 2006, the tax basis components of distributable earnings included in stockholders’ equity were as follows:
|
| Undistributed net investment income | | | | | $ | 2,400,890 | |
| Undistributed long-term capital gain | | | | | | 2,432,323 | |
| Unrealized appreciation | | | | | | 45,802,101 | |
| Post October currency loss* | | | | | | (60,095 | ) |
| Accrued preferred distributions | | | | | | (33,333 | ) |
| | | | | |
| |
| | | | | | $ | 50,541,886 | |
|
*Under current tax law, capital and currency losses realized after October 31, and prior to the Fund’s fiscal year end, may be deferred as occurring on the first day of the following year.
The difference between book basis and tax basis unrealized appreciation is attributable primarily to the tax deferral on wash sales and the unrealized gains on investments in Passive Foreign Investment Companies.
For financial reporting purposes, capital accounts and distributions to stockholders are adjusted to reflect the tax character of permanent book / tax differences. These differences are primarily due to differing treatments of income and gains on various investment securities and foreign currency transactions held by the Fund, timing differences and different characterization of distributions made by the Fund. For the year ended December 31, 2006, the Fund recorded the following permanent reclassifications, which relate primarily to the current net operating losses. Results of operations and net assets were not affected by these reclassifications.
|
| Undistributed | | | Accumulated | | | | | |
| Net Investment | | | Net Realized | | | Paid-in | | |
| Income | | | Gain (Loss) | | | Capital | | |
| | |
| | |
| | |
| $308,520 | | | $(308,520) | | | $– | | |
|
Purchases and Sales of Investment Securities:For the year ended December 31, 2006, the cost of purchases and proceeds from sales of investment securities, other than short-term securities and collateral received for securities loaned, amounted to $44,695,025 and $69,675,911, respectively.
| 58 | 2006 ANNUAL REPORT TO STOCKHOLDERS |
ROYCE FOCUS TRUST
|
Report of Independent Registered Public Accounting Firm |
|
To the Board of Directors and Stockholders of
Royce Focus Trust, Inc.
New York, New YorkWe have audited the accompanying statement of assets and liabilities of Royce Focus Trust, Inc. (“Fund”) including the schedule of investments, as of December 31, 2006, and the related statement of operations for the year then ended, the statement of changes in net assets for each of the two years in the period then ended and the financial highlights for each of the five years in the period then ended. These financial statements and financial highlights are the responsibility of the Fund’s management. Our responsibility is to express an opinion on these financial statements and financial highlights based on our audits.
We conducted our audits in accordance with standards of the Public Company Accounting Oversight Board (United States). Those standards require that we plan and perform the audit to obtain reasonable assurance about whether the financial statements and financial highlights are free of material misstatement. The Fund is not required to have, nor were we engaged to perform, an audit of its internal control over financial reporting. Our audits included consideration of internal control over financial reporting as a basis for designing audit procedures that are appropriate in the circumstances, but not for the purpose of expressing an opinion on the effectiveness of the Fund’s internal control over financial reporting. Accordingly, we express no such opinion. An audit includes examining, on a test basis, evidence supporting the amounts and disclosures in the financial statements. Our procedures included confirmation of securities owned as of December 31, 2006 by correspondence with the custodian. An audit also includes assessing the accounting principles used and significant estimates made by management, as well as evaluating the overall financial statement presentation. We believe that our audits provide a reasonable basis for our opinion.
In our opinion, the financial statements and financial highlights referred to above present fairly, in all material respects, the financial position of Royce Focus Trust, Inc. as of December 31, 2006, the results of its operations for the year then ended, the changes in its net assets for each of the two years in the period then ended and the financial highlights for each of the five years in the period then ended, in conformity with accounting principles generally accepted in the United States of America.
TAIT, WELLER & BAKER LLP
Philadelphia, Pennsylvania
February 12, 2007
| 2006 ANNUAL REPORT TO STOCKHOLDERS | 59 |
NOTES TO PERFORMANCE AND OTHER IMPORTANT INFORMATION |
|
|
The thoughts expressed in this Review and Report concerning recent market movements and future prospects for small company stocks are solely the opinion of Royce at December 31, 2006, and, of course, historical market trends are not necessarily indicative of future market movements. Statements regarding the future prospects for particular securities held in the Funds’ portfolios and Royce’s investment intentions with respect to those securities reflect Royce’s opinions as of December 31, 2006 and are subject to change at any time without notice. There can be no assurance that securities mentioned in this Review and Report will be included in any Royce-managed portfolio in the future. The Funds invest primarily in securities of mid-, small- and micro-cap companies, that may involve considerably more risk than investments of larger-cap companies. All publicly released material information is always disclosed by the Funds on the website at www.roycefunds.com.
|
| Standard deviation is a statistical measure within which a fund’s total returns have varied over time. The greater the standard deviation, the greater a fund’s volatility. |
The Russell 2000, Russell 2000 Value, Russell 2000 Growth, Nasdaq Composite, S&P 500 and S&P 600 are unmanaged indices of domestic common stocks. Returns for the market indices used in this Review and Report were based on information supplied to Royce by Frank Russell and Morningstar. Royce has not independently verified the above described information. The Royce Funds is a service mark of The Royce Funds. |
Forward-Looking Statements |
| This material contains forward-looking statements within the meaning of the Securities Exchange Act of 1934, as amended (the “Exchange Act”), that involve risks and uncertainties, including, among others, statements as to: |
| • | | the Funds’ future operating results |
| • | | the prospects of the Funds’ portfolio companies |
| • | | the impact of investments that the Funds have made or may make |
| • | | the dependence of the Funds’ future success on the general economy and its impact on the companies and industries in which the Funds invest, and |
| • | | the ability of the Funds’ portfolio companies to achieve their objectives. |
This Review and Report uses words such as “anticipates,” “believes,” “expects,” “future,” “intends,” and similar expressions to identify forward-looking statements. Actual results may differ materially from those projected in the forward-looking statements for any reason.
|
The Royce Funds have based the forward-looking statements included in this Review and Report on information available to us on the date of the report, and we assume no obligation to update any such forward-looking statements. Although The Royce Funds undertake no obligation to revise or update any forward-looking statements, whether as a result of new information, future events or otherwise, you are advised to consult any additional disclosures that we may make through future stockholder communications or reports. |
Authorized Share Transactions |
| Royce Value Trust, Royce Micro-Cap Trust and Royce Focus Trust may each repurchase up to 300,000 shares of its respective common stock and up to 10% of the issued and outstanding shares of its respective preferred stock during the year ending December 31, 2007. Any such repurchases would take place at then prevailing prices in the open market or in other transactions. Common stock repurchases would be effected at a price per share that is less than the share’s then current net asset value, and preferred stock repurchases would be effected at a price per share that is less than the share’s liquidation value. |
Royce Value Trust, Royce Micro-Cap Trust and Royce Focus Trust are also authorized to offer their common stockholders an opportunity to subscribe for additional shares of their common stock through rights offerings at a price per share that may be less than the share’s then current net asset value. The timing and terms of any such offerings are within each Board’s discretion. |
| A copy of the policies and procedures that The Royce Funds use to determine how to vote proxies relating to portfolio securities and information regarding how each of The Royce Funds voted proxies relating to portfolio securities during the most recent 12-month period ended June 30 is available, without charge, on the Royce Funds’ website at www.roycefunds.com, by calling 1-800-221-4268 (toll-free) and on the website of the Securities and Exchange Commission (“SEC”), at www.sec.gov. |
| 60 | 2006 ANNUAL REPORT TO STOCKHOLDER |
Form N-Q Filing The Funds file their complete schedules of investments with the SEC for the first and third quarters of each fiscal year on Form N-Q. The Funds’ Forms N-Q are available on The Royce Funds’ website at www.roycefunds.com and on the SEC’s website at www.sec.gov. The Funds’ Forms N-Q may also be reviewed and copied at the SEC’s Public Reference Room in Washington, D.C. To find out more about this public service, call the SEC at 1-800-732-0330. The Funds’ complete schedules of investments are updated quarterly, and are available at www.roycefunds.com. |
Royce Value Trust, Inc. At the 2006 Annual Meeting of Stockholders held on September 28, 2006, the Fund’s stockholders elected four Directors, consisting of: |
|
| | | | Votes For | | Votes Abstained |
|
| ** | William L. Koke | | | 7,308,761 | | | | 87,551 | |
| ** | David L. Meister | | | 7,313,591 | | | | 82,721 | |
| * | G. Peter O’Brien | | | 57,435,488 | | | | 486,956 | |
| * | Charles M. Royce | | | 57,490,317 | | | | 432,127 | |
|
| * | Common Stock and Preferred Stock voting together as a single class |
| ** | Preferred Stock voting as a separate class |
Royce Micro-Cap Trust, Inc.At the 2006 Annual Meeting of Stockholders held on September 28, 2006, the Fund’s stockholders elected four Directors, consisting of:
|
| | | | Votes For | | Votes Abstained |
|
| ** | William L. Koke | | | 1,909,294 | | | | 19,308 | |
| ** | David L. Meister | | | 1,908,294 | | | | 20,308 | |
| * | G. Peter O’Brien | | | 22,879,163 | | | | 136,191 | |
| * | Charles M. Royce | | | 22,891,392 | | | | 123,962 | |
|
| * | Common Stock and Preferred Stock voting together as a single class |
| ** | Preferred Stock voting as a separate class |
| Royce Focus Trust, Inc. |
| At the 2006 Annual Meeting of Stockholders held on September 28, 2006, the Fund’s stockholders elected four Directors, consisting of: |
|
| | | | Votes For | | Votes Abstained |
|
| ** | Stephen L. Isaacs | | | 911,276 | | | | 1,680 | |
| ** | David L. Meister | | | 911,276 | | | | 1,680 | |
| * | G. Peter O’Brien | | | 14,485,743 | | | | 155,571 | |
| * | Charles M. Royce | | | 14,508,798 | | | | 132,516 | |
|
| * | Common Stock and Preferred Stock voting together as a single class |
| ** | Preferred Stock voting as a separate class |
| 2006 ANNUAL REPORT TO STOCKHOLDERS | 61 |
| |
| | | The RoyceFunds
Wealth Of Experience With approximately $28.2 billion in open- and closed-end fund assets under management, Royce & Associates is committed to the same small-company investing principles that have served us well for more than 30 years. Charles M. Royce, our Chief Investment Officer, enjoys one of the longest tenures of any active mutual fund manager. Royce’s investment staff includes six other Portfolio Managers, as well as eight assistant portfolio managers and analysts, and six traders.
Multiple Funds, Common Focus Our goal is to offer both individual and institutional investors the best available small-cap value portfolios. Unlike a lot of mutual fund groups with broad product offerings, we have chosen to concentrate on small-company value investing by providing investors with a range of funds that take full advantage of this large and diverse sector.
Consistent Discipline Our approach emphasizes paying close attention to risk and maintaining the same discipline, regardless of market movements and trends. The price we pay for a security must be significantly below our appraisal of its current worth. This requires a thorough analysis of the financial and business dynamics of an enterprise, as though we were purchasing the entire company.
Co-Ownership Of Funds It is important that our employees and shareholders share a common financial goal; our officers, employees and their families currently have approximately $113 million invested in The Royce Funds. | | |
|
| | | General Information
Additional Report Copies
and Fund Inquiries
(800) 221-4268
Computershare
Transfer Agent and Registrar
(800) 426-5523
| Broker/Dealer Services
For Fund Materials and Performance Updates,
(800) 59-ROYCE (597-6923)
Advisor Services
For Fund Materials, Performance Updates
or Account Inquiries
(800) 33-ROYCE (337-6923) | | |
|
| | | www.roycefunds.com | | |
| |
CE-REP-1206
| | |
Item 2: Code(s) of Ethics – As of the end of the period covered by this report, the Registrant had adopted a code of ethics, as defined in Item 2 of Form N-CSR, applicable to its principal executive officer, principal financial officer, principal accounting officer or controller, or persons performing similar functions. A copy of this code of ethics is filed as an exhibit to this Form N-CSR. No substantive amendments were approved or waivers were granted to this code of ethics during the period covered by this report.
Item 3: Audit Committee Financial Expert –
| (a)(1) | | The Board of Directors of the Registrant has determined that it has an audit committee financial expert. |
| | | |
| (a)(2) | | Arthur S. Mehlman was designated by the Board of Directors as the Registrant’s Audit Committee Financial Expert, effective April 15, 2004. Mr. Mehlman is “independent” as defined under Item 3 of Form N-CSR. |
Item 4: Principal Accountant Fees and Services.
| (a) | | Audit Fees: |
| | | Year ended December 31, 2006 – $34,000 |
| | | Year ended December 31, 2005 – $33,000 |
| | | |
| (b) | | Audit-Related Fees: |
| | | Year ended December 31, 2006 – $1,500 – Preparation of reports to rating agency for Preferred Stock |
| | | |
| | | Year ended December 31, 2005 – $1,500 – Preparation of reports to rating agency for Preferred Stock |
| | | |
| (c) | | Tax Fees: |
| | | Year ended December 31, 2006 – $5,000 – Preparation of tax returns |
| | | Year ended December 31, 2005 – $2,500 – Preparation of tax returns |
| | | |
| (d) | | All Other Fees: |
| | | Year ended December 31, 2006 – $0 |
| | | Year ended December 31, 2005 – $2,500 – Agreed upon procedures report relating to investment advisory fee calculation |
| | | |
(e)(1) Annual Pre-Approval: On an annual basis, the Registrant’s independent auditor submits to the Audit Committee a schedule of proposed audit, audit-related, tax and other non-audit services to be rendered to the Registrant and/or investment adviser(s) for the following year that require pre-approval by the Audit Committee. This schedule provides a description of each type of service that is expected to require pre-approval and the maximum fees that can be paid for each such service without further Audit Committee approval. The Audit Committee then reviews and determines whether to approve the types of scheduled services and the projected fees for them. Any subsequent revision to already pre-approved services or fees (including fee increases) are presented for consideration at the next regularly scheduled Audit Committee meeting, as needed.
If subsequent to the annual pre-approval of services and fees by the Audit Committee, the Registrant or one of its affiliates determines that it would like to engage the Registrant’s independent auditor to perform a service not already pre-approved, the request is to be submitted to the Registrant’s Chief Financial Officer, and if he or she determines that the service fits within the independence guidelines (e.g., it is not a prohibited service), he or she will then arrange for a discussion of the proposed service and fee to be included on the agenda for the next regularly scheduled Audit Committee meeting so that pre-approval can be considered.
Interim Pre-Approval: If, in the judgment of the Registrant’s Chief Financial Officer, a proposed engagement needs to commence before the next regularly scheduled Audit Committee meeting, he or she shall submit a written summary of the proposed engagement to all members of the Audit Committee, outlining the services, the estimated maximum cost, the category of the services (e.g., audit, audit-related, tax or other) and the rationale for engaging the Registrant’s independent auditor to perform the services. To the extent the proposed engagement involves audit, audit-related or tax services, any individual member of the Audit Committee who is an independent Board member is authorized to pre-approve the engagement. To the extent the proposed engagement involves non-audit services other than audit-related or tax, the Chairman of the Audit Committee is authorized to pre-approve the engagement. The Registrant’s Chief Financial Officer will arrange for this interim review and coordinate with the appropriate member(s) of the Committee. The independent auditor may not commence the engagement under consideration until the Registrant’s Chief Financial Officer has informed the auditor in writing that pre-approval has been obtained from the Audit Committee or an individual member who is an independent Board member. The member of the Audit Committee who pre-approves any engagements in between regularly scheduled Audit Committee meetings is to report, for informational purposes only, any pre-approval decisions to the Audit Committee at its next regularly scheduled meeting.
| (e)(2) | | Not Applicable |
| | | |
| (f) | | Not Applicable |
| | | |
| (g) | | Year ended December 31, 2006 – $0 |
| | | Year ended December 31, 2005 – $11,500 |
| | | |
| (h) | | No such services were rendered during 2006 or 2005. |
Item 5: The Registrant has a separately designated standing audit committee established in accordance with Section 3(a)(58)(A) of the Securities Exchange Act of 1934. Donald R. Dwight, Richard M. Galkin, Stephen L. Isaacs, William L. Koke, Arthur S. Mehlman, David L. Meister and G. Peter O’Brien are members of the Registrant’s audit committee.
Item 6: Not Applicable.
Item 7:
| | | |
| | | June 5, 2003 |
| | | As amended on April 14, 2005 and |
| | | February 28, 2006 |
| | | |
Royce & Associates Proxy Voting Guidelines and Procedures
These procedures apply to Royce & Associates, LLC (“Royce”) and all funds and other client accounts for which it is responsible for voting proxies, including all open and closed-end registered investment companies (“The Royce Funds”), limited partnerships, limited liability companies, separate accounts, other accounts for which it acts as investment adviser and any accounts for which it acts as sub-adviser that have directly or indirectly delegated proxy voting authority to Royce. The Boards of Trustees/Directors of The Royce Funds (the “Boards” have delegated all proxy voting decisions to Royce, and in the case of Royce Technology Value Fund, to JHC Capital Management subject to these policies and procedures.
Receipt of Proxy Material. Under the continuous oversight of the Head of Administration or his designee is responsible for monitoring receipt of all proxies and ensuring that proxies are received for all securities for which Royce has proxy voting responsibility. All proxy materials are logged in upon receipt by Royce’s Librarian
Voting of Proxies. Once proxy material has been logged in by Royce’s Librarian, it is then promptly reviewed by the designated Administrative Assistant to evaluate the issues presented. Regularly recurring matters are usually voted as recommended by the issuer’s board of directors or “management.” The Head of Administration or his designee, in consultation with the Chief Investment Officer, develops and updates a list of matters Royce treats as “regularly recurring” and is responsible for ensuring that the designated Administrative Assistant has an up-to-date list of these matters at all times, including instructions from Royce’s Chief Investment Officer on how to vote on those matters on behalf of Royce clients. Examples of “regularly recurring” matters include non-contested elections of directors and non-contested approval of independent auditors. Non-“regularly recurring” matters are brought to the attention of the portfolio manager(s) for the account(s) involved by the designated Administrative Assistant, and, after giving some consideration to advisories from “Proxy Master” (a service provided by Institutional Shareholder Services), the portfolio manager directs that such matters be voted in a way that he or she believes should better protect or enhance the value of the investment. If the portfolio manager determines that information concerning any proxy requires analysis, is missing or incomplete, he or she then gives the proxy to an analyst or another portfolio manager for review and analysis.
| | a. | From time to time, it is possible that one Royce portfolio manager will decide (i) to vote shares held in client accounts he or she manages differently from the vote of another Royce portfolio manager whose client accounts hold the same security or (ii) to abstain from voting on behalf of client accounts he or she manages when another Royce portfolio manager is casting votes on behalf of other Royce client accounts. |
| | | |
| | | The designated Administrative Assistant reviews all proxy votes collected from Royce’s portfolio managers prior to such votes being cast. If any difference exists among the voting instructions given by Royce’s portfolio managers, as described above, the designated Administrative Assistant then presents these proposed votes to the Head of Administration or his designee and the Chief Investment Officer. The Chief Investment Officer, after consulting with the relevant portfolio managers, either reconciles the votes or authorizes the casting of differing votes by different portfolio managers. The Head of Administration or his designee maintains a log of all votes for which different portfolio managers have cast differing votes, that describes the rationale for allowing such differing votes and contains the initials of both the Chief Investment Officer and Head of Administration or his designee allowing such differing votes. The Head of Administration or his designee performs a weekly review of all votes cast by Royce to confirm that any conflicting votes were properly handled in accordance with the above-described procedures. |
| | | |
| | b. | There are many circumstances that might cause Royce to vote against an issuer’s board of directors or “management” proposal. These would include, among others, excessive compensation, unusual management stock options, preferential voting and poison pills. The portfolio managers decide these issues on a case-by-case basis as described above. |
| | | |
| | c. | A portfolio manager may, on occasion, determine to abstain from voting a proxy or a specific proxy item when he or she concludes that the potential benefit of voting is outweighed by the cost, when it is not in the client account’s best interest to vote. |
| | | |
| | d. | When a client has authorized Royce to vote proxies on its behalf, Royce will generally not accept instructions from the clients regarding how to vote proxies. |
| | | |
| | e. | If a security is on loan under The Royce Funds’ Securities Lending Program with State Street Bank and Trust Company (“Loaned Securities”), the Head of Administration or his designee will recall the Loaned Securities and request that they be delivered within the customary settlement period after the notice, to permit the exercise of their voting rights if the number of shares of the security on loan would have a material effect on The Royce Funds’ voting power at the up-coming stockholder meeting. A material effect is defined as any case where the Loaned Securities are 1% or more of a class of a company’s outstanding equity securities. Monthly, the Head of Administration or his designee will review the summary of this activity by State Street. A quarterly report detailing any exceptions that occur in recalling Loaned Securities will be given to the Boards. |
Custodian banks are authorized to release all shares held for Royce client account portfolios to Automated Data Processing Corporation (“ADP”) for voting, utilizing ADP’s “Proxy Edge” software system. Substantially all portfolio companies utilize ADP to collect their proxy votes. However, for the limited number of portfolio companies that do not utilize ADP, Royce attempts to register at least a portion of its clients holdings as a physical shareholder in order to ensure its receipt of a physical proxy.
Under the continuous oversight of the Head of Administration or his designee, the designated Administrative Assistant is responsible for voting all proxies in a timely manner. Votes are returned to ADP using Proxy Edge as ballots are received, generally two weeks before the scheduled meeting date. The issuer can thus see that the shares were voted, but the actual vote cast is not released to the company until 4pm on the day before the meeting. If proxies must be mailed, they go out at least ten business days before the meeting date.
Conflicts of Interest. The designated Administrative Assistant reviews reports generated by Royce’s portfolio management system (“Quest PMS”) that set forth by record date, any security held in a Royce client account which is issued by a (i) public company that is, or a known affiliate of which is, a separate account client of Royce (including sub-advisory relationships), (ii) public company, or a known affiliate of a public company, that has invested in a privately-offered pooled vehicle managed by Royce or (iii) public company, or a known affiliate of a public company, by which the spouse of a Royce employee or an immediate family member of a Royce employee living in the household of such employee is employed, for the purpose of identifying any potential proxy votes that could present a conflict of interest for Royce. The Head of Administration or his designee develops and updates the list of such public companies or their known affiliates which is used by Quest PMS to generate these daily reports. This list also contains information regarding the source of any potential conflict relating to such companies. Potential conflicts identified on the “conflicts reports” are brought to the attention of the Head of Administration or his designee by the designated Administrative Assistant, who then reviews them to determine if business or personal relationships exist between Royce, its officers, managers or employees and the company that could present a material conflict of interest. Any such identified material conflicts are voted by Royce in accordance with the recommendation given by an independent third party research firm (Institutional Shareholder Services). The Head of Administration or his designee maintains a log of all such conflicts identified, the analysis of the conflict and the vote ultimately cast. Each entry in this log is signed by the Chief Investment Officer before the relevant votes are cast.
Recordkeeping. A record of the issues and how they are voted is stored in the Proxy Edge system. Copies of all physically executed proxy cards, all proxy statements and any other documents created or reviewed that are material to making a decision on how to vote proxies are retained in the Company File maintained by Royce’s Librarian.
Item 8: (a)(1) Portfolio Managers of Closed-End Management Investment Companies (information as of March 5, 2007)
| Name | Title | Length of Service | Principal Occupation(s) During Past 5 Years |
| Charles M. Royce | President, Chief Investment Officer and member of the Board of Managers of Royce & Associates, LLC and its predecessor, Royce & Associates, Inc. (collectively, “Royce”) | Since 1972 | President, Chief Investment Officer and member of the Board of Managers of Royce, the Registrant’s investment adviser; Director and President of the Registrant, Royce Micro-Cap Trust, Inc. (“RMT”) and Royce Focus Trust, Inc. (“RFT”), closed-end diversified management investment companies of which Royce is the investment adviser; Trustee and President of The Royce Fund (“TRF”) and Royce Capital Fund (“RCF”), open-end diversified management investment companies of which Royce is the investment adviser (the Registrant, RMT, RFT, TRF, and RCF collectively, “The Royce Funds”); Secretary and sole director of Royce Fund Services, Inc., a wholly-owned subsidiary of Royce and the distributor of TRF’s and RFC’s shares; and managing general partner of Royce Management Company, the general partner of various private investment limited partnerships until October 2001. |
| (a)(2) | Other Accounts Managed by Portfolio Manager and Potential Conflicts of Interest (information as of December 31, 2006) | |
| |
| Other Accounts |
| Type of Account | | Number of
Accounts Managed | | Total
Assets Managed | | Number of Accounts Managed for which Advisory Fee is
Performance-Based | | Value of Managed Accounts for which Advisory Fee is Performance Based |
| Registered investment companies | | 11 | | $17,209,849,932 | | 4 | | $1,829,129,329 |
| Private pooled investment vehicles | | 5 | | $175,251,754 | | 3 | | $64,256,984 |
| Other accounts* | | 13 | | $72,476,035 | | - | | - |
*Other accounts include all other accounts managed by the Portfolio Manager in either a professional or personal capacity except for personal accounts subject to pre-approval and reporting requirements under the Registrant’s Rule 17j-1 Code of Ethics.
Conflicts of Interest
The fact that the Portfolio Manager has day-to-day management responsibility for more than one client account may create actual, potential or only apparent conflicts of interest. For example, the Portfolio Manager may have an opportunity to purchase securities of limited availability. In this circumstance, the Portfolio Manager is expected to review each account’s investment guidelines, restrictions, tax considerations, cash balances, liquidity needs and other factors to determine the suitability of the investment for each account and to ensure that his managed accounts are treated equitably. The Portfolio Manager may also decide to purchase or sell the same security for multiple managed accounts at approximately the same time. To address any conflicts that this situation may create, the Portfolio Manager will generally combine managed account orders (i.e., enter a “bunched” order) in an effort to obtain best execution or a more favorable commission rate. In addition, if orders to buy or sell a security for multiple accounts managed by the same Portfolio Manager on the same day are executed at different prices or commission rates, the transactions will generally be allocated by Royce to each of such managed accounts at the weighted average execution price and commission. In circumstances where a bunched order is not completely filled, each account will normally receive a pro-rated portion of the securities based upon the account’s level of participation in the order. Royce may under certain circumstances allocate securities in a manner other than pro-rata if it determines that the allocation is fair and equitable under the circumstances and does not discriminate against any account.
As described below, there is a revenue-based component of the Portfolio Manager’s Performance Bonus and the Portfolio Manager also receives a Firm Bonus based on revenues (adjusted for certain imputed expenses) generated by Royce. In addition, the Portfolio Manager receives a bonus based on Royce’s retained pre-tax profits from operations. As a result, the Portfolio Manager may receive a greater relative benefit from activities that increase the value to Royce of The Royce Funds and/or other Royce client accounts, including, but not limited to, increases in sales of the Registrant’s shares and assets under management.
Also, as described above, the Portfolio Manager generally manages more than one client account, including, among others, registered investment company accounts, separate accounts and private pooled accounts managed on behalf of institutions (e.g., pension funds, endowments and foundations) and for high-net-worth individuals. The appearance of a conflict of interest may arise where Royce has an incentive, such as a performance-based management fee (or any other variation in the level of fees payable by The Royce Funds or other Royce client accounts to Royce), which relates to the management of one or more of The Royce Funds or accounts with respect to which the Portfolio Manager has day-to-day management responsibilities. The Performance Bonus paid to the Portfolio Manager for two registered investment company accounts (the Registrant and RMT) is based, in part, on performance-based fee revenues. The Registrant and RMT pay Royce a fulcrum fee that is adjusted up or down depending on the performance of that Fund relative to its benchmark index. In addition, two other registered investment company accounts managed by the Portfolio Manager, Royce Select Fund I and Royce Select Fund II, each pay Royce a performance-based fee.
Finally, conflicts of interest may arise when the Portfolio Manager personally buys, holds or sells securities held or to be purchased or sold for the Registrant or other Royce client account or personally buys, holds or sells the shares of one or more of The Royce Funds. To address this, Royce has adopted a written Code of Ethics designed to prevent and detect personal trading activities that may interfere or conflict with client interests (including Registrant shareholders’ interests). Royce generally does not permit its Portfolio Managers to purchase small- or micro-cap securities in their personal investment portfolios.
Royce and The Royce Funds have adopted certain compliance procedures which are designed to address the above-described types of conflicts. However, there is no guarantee that such procedures will detect each and every situation in which a conflict arises.
| (a)(3) | Description of Portfolio Manager Compensation Structure (information as of December 31, 2006) | |
Royce seeks to maintain a compensation program that is competitively positioned to attract and retain high-caliber investment professionals. The Portfolio Manager receives from Royce a base salary, a Performance Bonus and a benefits package. The Portfolio Manager’s compensation is reviewed and may be modified from time to time as appropriate to reflect changes in the market, as well as to adjust the factors used to determine bonuses. The Portfolio Manager’s compensation consists of the following elements:
| - | BASE SALARY. The Portfolio Manager is paid a base salary. In setting the base salary, Royce seeks to be competitive in light of the Portfolio Manager’s experience and responsibilities. |
| | |
| - | PERFORMANCE BONUS. The Portfolio Manager receives a quarterly Performance Bonus that is either asset-based. or revenue based and therefore in part based on the value of the accounts’ net assets, determined with reference to each of the registered investment company and other client accounts managed by him. The revenue used to determine the quarterly performance bonus received by the Portfolio Manager that relates to each of the Registrant and RMT are performance-based fee revenues. Except as described below, the Performance Bonus applicable to the registered investment company accounts managed by the Portfolio Manager is subject to upward or downward adjustment or elimination based on a combination of 3-year and 5-year risk-adjusted pre-tax returns of such accounts relative to all small-cap objective funds with three years of history tracked by Morningstar (as of December 31, 2006 there were 373 such Funds tracked by Morningstar) and the 5-year absolute returns of such accounts relative to 5-year U.S. Treasury Notes. The Performance Bonus applicable to non-registered investment company accounts managed by the Portfolio Manager, and to Royce Select Fund I and Royce Select Fund II, is not subject to a performance-related adjustment. |
Payment of the Performance Bonus may be deferred as described below, and any amounts deferred are forfeitable, if the Portfolio Manager is terminated by Royce with or without cause or resigns. The amount of the deferred Performance Bonus will appreciate or depreciate during the deferral period, based on the total return performance of one or more Royce-managed registered investment company accounts selected by the Portfolio Manager at the beginning of the deferral period. The amount deferred will depend on the Portfolio Manager’s total direct, indirect beneficial and deferred unvested bonus investments in the Royce registered investment company account for which he or she is receiving portfolio management compensation.
| - | FIRM BONUS. The Portfolio Manager receives a quarterly bonus based on Royce’s net revenues. |
| | |
| - | BENEFIT PACKAGE. The Portfolio Manager also receives benefits standard for all Royce employees, including health care and other insurance benefits, and participation in Royce’s 401(k) Plan and Money Purchase Pension Plan. From time to time, on a purely discretionary basis, the Portfolio Manager may also receive options to acquire stock in Royce’s parent company, Legg Mason, Inc. Those options typically represent a relatively small portion of a Portfolio Manager’s overall compensation. |
The Portfolio Manager, in addition to the above-described compensation, also receives a bonus based on Royce’s retained pre-tax operating profit. This bonus, along with the Performance Bonus and Firm Bonus, generally represents the most significant element of the Portfolio Manager’s compensation. A portion of the above-described compensation payable to the Portfolio Manager relates to his responsibilities as Royce’s Chief Executive Officer, Chief Investment Officer and President of The Royce Funds.
| (a)(4) | Dollar Range of Equity Securities in Registrant Beneficially Owned by Portfolio Manager (information as of December 31, 2006) |
The following table shows the dollar range of the Registrant’s shares owned beneficially and of record by the Portfolio Manager, including investments by his immediately family members sharing the same household and amounts invested through retirement and deferred compensation plans.
Dollar Range of Registrant’s Shares Beneficially Owned
Over $1,000,000
Item 9: Not Applicable.
Item 10: Not Applicable.
Item 11: Controls and Procedures.
| (a) | | Disclosure Controls and Procedures. The Principal Executive and Financial Officers concluded that the Registrant’s Disclosure Controls and Procedures are effective based on their evaluation of the Disclosure Controls and Procedures as of a date within 90 days of the filing date of this report. |
| | | |
| (b) | | Internal Control over Financial Reporting. There were no significant changes in Registrant’s internal control over financial reporting or in other factors that could significantly affect this control subsequent to the date of the evaluation, including any corrective actions with regard to significant deficiencies and material weaknesses during the second fiscal quarter of the period covered by this report. |
Item 12: Exhibits attached hereto.
| (a)(1) | | | The Registrant’s code of ethics pursuant to Item 2 of Form N-CSR. |
| | | | |
| (a)(2) | | | Separate certifications by the Registrant’s Principal Executive Officer and Principal Financial Officer as required by Rule 30a-2(a) under the Investment Company Act of 1940. |
| | | | |
| (a)(3) | | | Not Applicable |
| | | | |
| (b) | | | Separate certifications by the Registrant’s Principal Executive Officer and Principal Financial Officer, pursuant to Section 906 of the Sarbanes-Oxley Act of 2002 and required by Rule 30a-2(b) under the Investment Company Act of 1940. |
Pursuant to the requirements of the Securities Exchange Act of 1934 and the Investment Company Act of 1940, the registrant has duly caused this report to be signed on its behalf by the undersigned, thereunto duly authorized.
ROYCE VALUE TRUST, INC.
BY: /s/Charles M. Royce
Charles M. Royce
President
Date: March 5, 2007
Pursuant to the requirements of the Securities Exchange Act of 1934 and the Investment Company Act of 1940, this report has been signed below by the following persons on behalf of the registrant and in the capacities and on the dates indicated.
ROYCE VALUE TRUST, INC.
BY: /s/Charles M. Royce
Charles M. Royce
President
Date: March 5, 2007
ROYCE VALUE TRUST, INC.
BY: /s/John D. Diederich
John D. Diederich
Chief Financial Officer
Date: March 5, 2007