UNITED STATES
SECURITIES AND EXCHANGE COMMISSION
Washington, D.C. 20549
FORM N-CSR
CERTIFIED SHAREHOLDER REPORT
OF
REGISTERED MANAGEMENT INVESTMENT COMPANIES
Investment Company Act File Number: 811-04875
Name of Registrant: Royce Small-Cap Trust, Inc.
Address of Registrant: One Madison Avenue
New York, NY 10010
Name and address of agent for service: John E. Denneen, Esq.
One Madison Avenue
New York, NY 10010
Registrant's telephone number, including area code: (212) 508-4500
Date of fiscal year end: December 31
Date of reporting period: January 1, 2024 – December 31, 2024
Item 1. Reports to Shareholders.
| | | | |
| | | | |
| | | | |
| | royceinvest.com | |
| | | | |
| | | | |
| | | | |
| | | | |
| | | | |
| | | | |
| | Royce Closed-End Funds 2024 Annual | | |
| | | | |
| | Review and Report to Stockholders
December 31, 2024 | | |
| | | | |
| | | | |
| | | | |
| | | | |
| | | | |
| | | | |
| | Royce Global Trust | | |
| | | | |
| | Royce Micro-Cap Trust | | |
| | | | |
| | Royce Small-Cap Trust | | |
| | | | |
| | | | |
| | | | |
| | | | |
| | | | |
| | | | |
| | | | |
| | | | |
| | | | |
| | | | |
| | | | |
| | | | |
| | | | |
| | | | |
| | | | |
| | | | |
| | | | |
| | | | |
| | | | |
| | | | |
| | | | |
| | | | |
| | | | |
| | | | |
| | | | |
| | | | |
| | | | |
| | | | |
| | | | | |
| |  |  | |
| | | | | |
| | | | |
| | | | |
| | | | |
| | | | |
A Few Words on Closed-End Funds
Royce Investment Partners (“Royce”) manages three closed-end funds: Royce Global Trust, which primarily invests in both U.S. and non-U.S. companies with market capitalization below $10 billion; Royce Micro-Cap Trust, which primarily invests in micro-cap securities; and Royce Small-Cap Trust, which primarily invests in small-cap securities. A closed-end fund is an investment company whose shares are listed and traded on a stock exchange. Like all investment companies, including open-end mutual funds, the assets of a closed-end fund are professionally managed in accordance with the investment objectives and policies approved by the fund’s Board of Directors. A closed-end fund raises cash for investment by issuing a fixed number of shares through initial and other public offerings that may include shelf offerings and periodic rights offerings. Proceeds from the offerings are invested in an actively managed portfolio of securities. Investors wanting to buy or sell shares of a publicly traded closed-end fund after the initial and any subsequent offerings must do so on a stock exchange, as with any publicly traded stock. Shares of closed-end funds frequently trade at a discount to their net asset value. This is in contrast to open-end mutual funds, which sell and redeem their shares at net asset value on a continuous basis.
A Closed-End Fund Can Offer Several Distinct Advantages
| • | A closed-end fund does not issue redeemable securities or offer its securities on a continuous basis, so it does not need to liquidate securities or hold uninvested assets to meet investor demands for cash redemptions. |
| • | In a closed-end fund, not having to meet investor redemption requests or invest at inopportune times can be effective for value managers who attempt to buy stocks when prices are depressed and sell securities when prices are high. |
| • | A closed-end fund may invest in less liquid portfolio securities because it is not subject to potential stockholder redemption demands. This is potentially beneficial for Royce-managed closed-end funds, with significant investments in small- and micro-cap securities. |
| • | The fixed capital structure allows permanent leverage to be employed as a means to enhance capital appreciation potential. |
| • | Royce Micro-Cap Trust and Royce Small-Cap Trust distribute capital gains, if any, on a quarterly basis. Each of these Funds has adopted a quarterly distribution policy for its common stock. |
We believe that the closed-end fund structure can be an appropriate investment for a long-term investor who understands the benefits of a more stable pool of capital.
Why Dividend Reinvestment Is Important
A very important component of an investor’s total return comes from the reinvestment of distributions. By reinvesting distributions, our investors can maintain an undiluted investment in a Fund. To get a fair idea of the impact of reinvested distributions, please see the charts on pages 61 and 62. For additional information on the Funds’ Distribution Reinvestment and Cash Purchase Options and the benefits for stockholders, please see page 63 or visit our website at www.royceinvest.com.
Managed Distribution Policy
The Board of Directors of each of Royce Micro-Cap Trust and Royce Small-Cap Trust has authorized a managed distribution policy (MDP). Under the MDP, Royce Micro-Cap Trust and Royce Small-Cap Trust pay quarterly distributions at an annual rate of 7% of the average of the prior four quarter-end net asset values, with the fourth quarter being the greater of these annualized rates or the distribution required by IRS regulations. With each distribution, the Fund will issue a notice to its stockholders and an accompanying press release that provides detailed information regarding the amount and composition of the distribution (including whether any portion of the distribution represents a return of capital) and other information required by a Fund’s MDP. You should not draw any conclusions about a Fund’s investment performance from the amount of distributions or from the terms of a Fund’s MDP. A Fund’s Board of Directors may amend or terminate the MDP at any time without prior notice to stockholders; however, at this time there are no reasonably foreseeable circumstances that might cause the termination of any of the MDPs.
This page is not part of the 2024 Annual Report to Stockholders
Table of Contents

This page is not part of the 2024 Annual Report to Stockholders | 1
Letter to Our Stockholders

A QUICK LOOK BACK
The last several years have not been especially kind to small-cap stocks, at least in relation to their bigger counterparts. The asset class’s long-running historical performance advantage over large-caps—an advantage that often went hand in hand with higher volatility—has steadily eroded. In what, for the purposes of this letter, we’ll call the “Old Normal,” small-cap companies generally had higher long-term returns but also experienced higher volatility, while larger companies trailed but tended to be steadier in their performance patterns. Since the introduction of the Russell Indexes on 12/31/78, a similar pattern often held true for value and growth investing: the former typically enjoyed a better long-term performance record while the latter had higher volatility but also often had attractively high short-term performance.
There were exceptions to these patterns, of course, and the persistence of leadership could span several years. For example, small-cap, and small-cap value in particular, dominated performance from the peak of the Internet bubble in March of 2000 up until the market peaks in the summer of 2007 that presaged the Great Financial Crisis of 2008-09. In retrospect, any path out of that seismic series of events and back to what history might see as normal, or at least typical, was bound to be winding and uncertain. There were also additional and unprecedented
obstacles, the biggest by far being the covid pandemic, which saw policymakers once again slashing rates and keeping the flow of cash into the economy steady and strong. The current period of large-cap leadership, dominated by mega-cap stocks within the big stock cohort, stretches back to 2011, when a steep and sudden bear market lasted from April through October on fears that the economy was falling into a recession. This 14-year span has also been better for small-cap growth than value. The two charts below show the spreads for the 3-year monthly rolling average returns, first for the Russell 2000 and Russell 1000 Indexes and second for the Russell 2000 Value and Growth Indexes from their shared inception dates through 12/31/24.
Leadership Shifts Between Small-Cap and Large-Cap
The Spread of 3-Year Monthly Rolling Average Annual Total Returns for the Russell 2000 and Russell 1000, 12/31/81-12/31/24
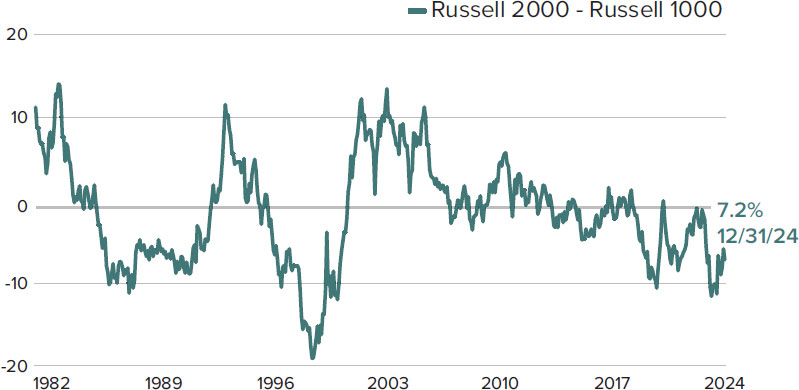
Past performance is no guarantee of future results.
2 | This page is not part of the 2024 Annual Report to Stockholders
LETTER TO OUR STOCKHOLDERS
Leadership Shifts Between Small-Cap Value and Growth
The Spread of 3-Year Monthly Rolling Average Annual Total Returns for the Russell 2000 Value and Russell 2000 Growth, 12/31/81-12/31/24
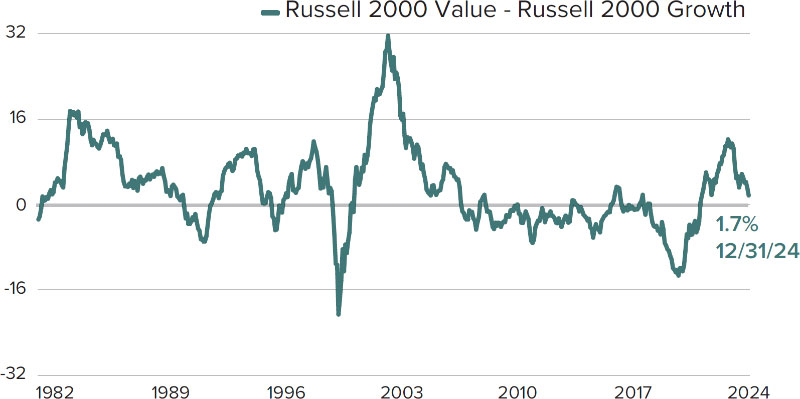
Past performance is no guarantee of future results.
2024 thus marked the eighth straight year of small-cap underperformance relative to large-cap. In fact, the Russell 2000 has beaten the Russell 1000 in only four of the last 20 calendar years, during which large-cap’s average outperformance spread was 6.1%. Small-cap last beat large-cap in 2016, making the period ended 12/31/24 the longest underperformance stretch measured by calendar years since each index’s inception. And while we are all too keenly aware of how long we have been calling for a sustained period of small-cap leadership, we do see several promising signs on the horizon for a sustained leadership phase for small-cap stocks.
DO VALUATIONS FAVOR THE ODDS OF SMALL-CAP LEADERSHIP?
Much ink has been spilled and even more bandwidth has been spent discussing, worrying about, or otherwise focusing on the sky-high state of valuations in the U.S. equity market over the last 12-18 months. We would offer what follows as a corrective to what looks to us like a narrow viewpoint on share prices. Most of these observations have used the S&P 500 as the proxy for the entire market, occasionally adding the Nasdaq Composite or Nasdaq 100. We have no disagreement with the idea that large-cap valuations are unsustainably high. However, small-cap valuations remain attractive versus large-cap valuations, having finished 2024 still near their lowest relative valuation versus large-caps in more than 25 years, based on the index valuation metric we use most: the last 12 months’ enterprise value over earnings before interest & taxes, aka LTM EV/EBIT. The chart below shows this picture in compelling detail—while also revealing that this wide valuation spread has persisted for more than five years.
With small-cap’s underperformance versus large cap having reached an extreme point, it should come as no surprise that small-cap’s weighting in the Russell 3000 Index was also near a historical low at the end of 2024.
Relative Valuations for Small-Caps vs. Large-Caps Are Near Their Lowest in 25 Years
Russell 2000 vs. Russell 1000 Median LTM EV/EBIT1 (ex. Negative EBIT Companies), 12/31/99-12/31/24

1 Enterprise Value/Earnings Before Interest and Taxes
Source: FactSet
This page is not part of the 2024 Annual Report to Stockholders | 3
LETTER TO OUR STOCKHOLDERS
Wide Breadth of Undervaluation Across the Small-Cap Asset Class
Russell 2000 and Russell 1000 Median EV/EBIT1 (ex. Negative EBIT) by Sector as of 12/31/24
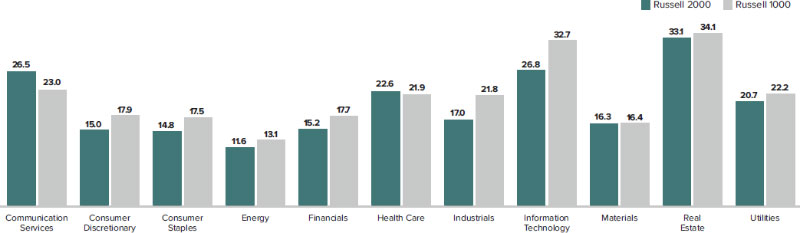
1 Enterprise Value/Earnings Before Interest and Taxes
Source: FactSet
Equally, if not more important is the fact that small-cap’s more attractive valuation could be seen across all 11 sectors. These disparities in sector valuations between small- and large-cap are notable, especially in the broad and diverse areas such as Information Technology, Industrials, Financials, and Consumer Discretionary. They add further credence to the idea that, while mega-cap behemoths such as Nvidia or Apple may be priced beyond perfection (or at least reason), attractive bargains can be found in several corners of the small-cap universe. (In fact, Apple’s market cap at the end of 2024 was 122% of the entire Russell 2000.)
However, the most important factor about valuations from our perspective as small-cap specialists is that many companies in the asset class continue to trade at attractively cheap prices on an absolute basis in diverse areas such as machinery; semiconductors & semiconductor equipment; capital markets; electronic equipment, instruments & components; banks; construction & engineering; healthcare; and energy.
EARNING THEIR WAY TO MARKET LEADERSHIP
While attractive absolute and relative valuations for small-caps are noteworthy, valuation is seldom enough to catalyze stock price performance. We are fond of saying that psychology runs the market in the short run, but earnings run it in the long run. Across the U.S. equity markets, earnings are expected to be pretty healthy in 2025, with the current consensus indicating 15% earnings per share (EPS) growth for the Russell 1000, along with solid to strong results anticipated for 4Q24, which are in the midst of being reported and will pick up steam
within small-caps as we move further into February. Consensus EPS estimates for the Russell 2000, however, are considerably higher than they are for large-caps in 2025, coming in at an impressive 89.3% versus 30.9% for the Russell 1000.
There is some important context to accompany this encouraging data: the Russell 2000 finished 2024 having endured a two-year earnings recession, so a substantive rebound makes a certain amount of sense. It’s also important to keep in mind that more than 40% of the companies in the Russell 2000 currently have no earnings. We think it’s equally relevant to remind our readers that our own portfolios typically hold companies that have established histories of earnings or those where our respective investment teams have identified a catalyst for earnings to resume or begin.
Average Expected Earnings Growth for 2025-2026
Index Aggregate Estimated Two-Year EPS Growth
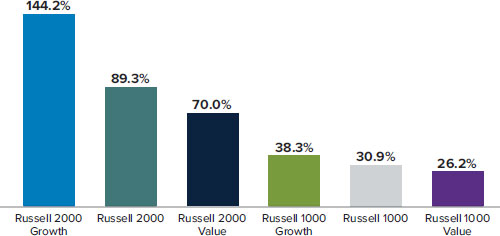
Earnings per share (EPS) is calculated as a company’s profit divided by the outstanding shares of its common stock. The EPS Growth Estimates are the pre-calculated mean two-year EPS growth rate estimates by brokerage analysts. Estimates are the average of those provided by analysts working for brokerage firms who provide research coverage on each individual security as reported by FactSet. All non-equity securities, investment companies, and companies without brokerage analyst coverage are excluded. Source: FactSet.
4 | This page is not part of the 2024 Annual Report to Stockholders
LETTER TO OUR STOCKHOLDERS
One critical advantage of having been small-cap investors for more than five decades is how it’s bred
a deep appreciation for the cyclical nature of markets and the long-term benefit of contrarian thinking.
Bull markets, bear markets, and long periods of outperformance for one style or asset class—
all are subject to cyclical dynamics, and none lasts forever.
WHAT FOLLOWS LOW-RETURN SMALL-CAP MARKETS?
At 12/31/24, the Russell 2000’s 3-year average annual total return was 1.2%, well below the small-cap index’s monthly rolling average 3-year return of 10.5% since inception. This highly underwhelming number perhaps distills the frustrations of small-cap investors better than any other. Yet it may also be a sign that improved results may be close. Subsequent 3-year average annualized performance for small-caps following previous low-return periods have been stellar, as seen in the chart below.
99% of the Time, Positive 3-Year Returns Have Followed Low Return Markets
Subsequent Average Annualized 3-Year Performance for the Russell 2000 Following 3-Year Annualized Return Ranges of Less Than 3%, 12/31/81-12/31/24
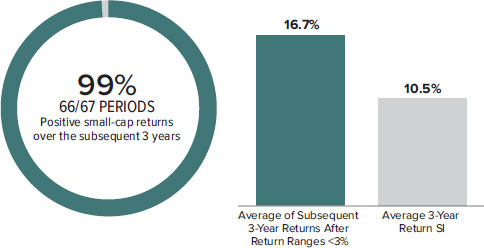
Past performance is no guarantee of future results. As of 12/31/24, the average of subsequent 3-year return ranges <3% has 481 periods, the average 3-year return since inception has 517 periods.
Of course, this dynamic has a kind of logic to it. The cyclical nature of share prices would support the notion that low-return periods are typically succeeded by higher-return periods. What makes the data above particularly compelling from our standpoint is not just the fact that small-caps generally recovered from low, flat, or negative return periods with better results but also that these subsequent performances averaged a 60% higher return than the historical 3-year monthly rolling average.
LOOKING FORWARD TO HEIGHTENED VOLATILITY?
Just a few weeks into the new administration, and the stock market has already seen some highly volatile days. February
began with the markets swooning from President Trump’s announcement of tariffs on goods coming into the U.S. from China, Canada, and Mexico. Markets quickly fell into disarray before some measure of calm returned following reports that there would be a pause on tariffs for goods, first those from Mexico and later that same day with those from Canada, in each case following constructive negotiations. The initial indications were that tariffs involving Canada and Mexico would be implemented as part of an effort at solving non-economic issues such as the cross-border drug trade and immigration—so the hope is that they will remain on pause, assuming that the ostensible goals are met. As of this writing we expect the greatest areas of potential impact, if these tariffs are sustained, would be on the housing, auto, and farm sectors of the U.S. economy.
We suspect that most if not all of the tariffs being proposed are being used tactically and, while disruptive, will impact market sentiment, volatility, and risk taking more than longer-term business fundamentals. Regardless of their ultimate duration and scale, however, tariffs are expected to hasten the now established trends of deglobalization, business reshoring to the U.S., and better supply chain management in U.S. manufacturing. All of which support our well-documented case for U.S. small-cap stocks regaining leadership in the market, driven by a meaningful upswing in small-cap earnings and supported by valuations far more attractive than found in other market capitalization or style segments.
We also think it’s important to be mindful of volatility as we believe we are entering a period of heightened uncertainty driven by the disruptive nature of both the rhetoric and policy proposals of the new Trump administration. We have often talked about how we welcome short-term volatility as a foundational element for building long-term, market-beating returns. One critical advantage of having been small-cap investors for more than five decades is how it’s bred a deep appreciation for the cyclical nature of markets and the long-term benefit of contrarian thinking.
This page is not part of the 2024 Annual Report to Stockholders | 5
LETTER TO OUR STOCKHOLDERS
Bull markets, bear markets, and/or long periods of outperformance for one style or asset class—all are subject to cyclical dynamics, and none lasts forever. We find that understanding what drives inflection points along with a willingness to think critically beyond the market’s conventional wisdom are the underpinnings that can generate long-term outperformance.
While still in the early days, many signals seem to be pointing to the likelihood that equities will experience heightened levels of volatility as we move further into 2025 and, if history is our guide, this could be an additional positive sign for small cap’s absolute and relative returns. Looking at subsequent average annualized returns for the Russell 2000 and the large-cap Russell 1000 following periods when the CBOE S&P 500 Volatility Index—aka the VIX or the ‘fear gauge,’—was elevated showed a positive edge for small-cap stocks. Our research revealed that the percentage of periods when the Russell 2000 had better average annualized 3-year returns than the Russell 1000 were at their highest following periods of heightened volatility.
Russell 2000 vs Russell 1000 Monthly Rolling VIX Regimes
Subsequent Average 1-Year Return Periods After VIX 1-Month Average was ≥28% from 12/31/89-12/31/24
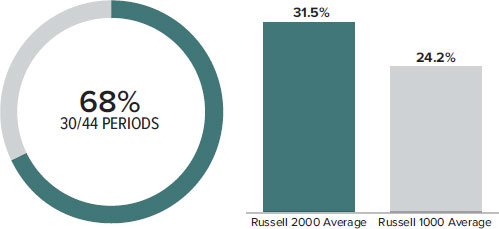
VIX was ≥28% in 44/408 periods. Source: Bloomberg. Past performance is no guarantee of future results. The chart above measures the average returns and spread of the monthly trailing three-year return periods in month where the monthly average three-year VIX level falls within the specified range.
Interestingly, recent uncertainty—and the now familiar idea that the new administration’s policies seem likely to create ample doses of (ideally short-lived) market gyrations—has not yet translated to a higher-than-average VIX, which was lower than average between election day through February 7th. What has been on the rise, according to an article in the February 10th issue of Barron’s, is the VVIX—which measures the volatility of the VIX and can be seen as a “fear of fear” index. The VVIX has risen past its historical average of 92.86 to 99.04 over the same post-election day period. This is hardly the worst development for highly active small-cap investors with a long-term investment horizon like us. We welcome a market environment that, at least in the short run, distracts investors from longer-term business fundamentals and economic value, which is often the case when markets experience elevated volatility. These distractions often appear to blur the distinctions between companies that possess higher quality attributes versus those that do not. As we move further into 2025, we remain highly constructive on the backdrop for small-cap stocks and for our differentiated and highly active approach to constructing our portfolios.
Sincerely,
 |  |
| Christopher D. Clark | Francis D. Gannon |
Chief Executive Officer, and
Co-Chief Investment Officer | Co-Chief Investment Officer |
February 13, 2025
6 | This page is not part of the 2024 Annual Report to Stockholders
Performance
NAV Average Annual Total Returns
As of December 31, 2024 (%)
| | 1-YR | 3-YR | 5-YR | 10-YR | 15-YR | 20-YR | 25-YR | 30-YR | SINCE
INCEPTION | INCEPTION
DATE |
| Royce Global Trust | 11.80 | -1.78 | 5.69 | 7.40 | N/A | N/A | N/A | N/A | 6.23 | 10/17/13 |
| Royce Micro-Cap Trust | 13.47 | 3.23 | 11.86 | 9.16 | 11.33 | 8.65 | 10.24 | 10.94 | 10.74 | 12/14/93 |
| Royce Small-Cap Trust | 12.64 | 2.57 | 9.54 | 9.37 | 10.51 | 8.15 | 9.32 | 10.35 | 10.38 | 11/26/86 |
| INDEX | | | | | | | | | | |
| MSCI ACWI Small Cap Index | 7.66 | 0.76 | 6.68 | 7.26 | 8.69 | 7.72 | 7.50 | 7.79 | N/A | N/A |
| Russell Microcap Index | 13.70 | -1.00 | 6.97 | 6.77 | 9.81 | 6.36 | N/A | N/A | N/A | N/A |
| Russell 2000 Index | 11.54 | 1.24 | 7.40 | 7.82 | 10.33 | 7.79 | 7.55 | 9.02 | N/A | N/A |
Important Performance and Risk Information
All performance information in this Review and Report reflects past performance, is presented on a total return basis, net of the Fund’s investment advisory fee, reflects the reinvestment of distributions and does not reflect the deduction of taxes that a shareholder would pay on fund distributions or the sale of fund shares. Past performance is no guarantee of future results. Investment return and principal value of an investment will fluctuate, so that shares may be worth more or less than their original cost when sold. Current month-end performance may be higher or lower than performance quoted and may be obtained at www.royceinvest.com. The Funds are closed-end registered investment companies whose respective shares of common stock may trade at a discount to the net asset value. Shares of each Fund’s common stock are also subject to the market risk of investing in the underlying portfolio securities held by each Fund. Each Fund is subject to market risk-the possibility that common stock prices will decline, sometimes sharply and unpredictably, over short or extended periods of time. Such declines may be caused by various factors, including market, financial, and economic conditions, governmental or central bank actions, and other factors, such as pandemics, acts of terrorism, or the armed conflicts in Europe and the Middle East, that may not be directly related to the issuer of a security held by a Fund. These conflicts, along with any banking industry instability, could adversely affect global market, financial, and economic conditions, as well as individual companies, in ways that cannot necessarily be foreseen. Investments in securities of micro-cap or small-cap companies may involve considerably more risk than investments in securities of larger-cap companies. Investments in securities of foreign issuers may be subject to different risks than investments in securities of U.S. companies, including adverse political, social, economic, or other developments that are unique to a particular country or region. Therefore, the prices of securities of foreign companies in particular countries or regions may, at times, move in a different direction than those of securities of U.S. companies. Because such investments are usually denominated in foreign currencies and the Funds do not intend to hedge their foreign currency exposures, the U.S. dollar value of such investments may be harmed by declines in the value of foreign currencies in relation to the U.S. dollar. Royce Global Trust invests a significant portion of its assets in foreign companies. A broadly diversified portfolio does not ensure a profit or guarantee against loss. All indexes referenced are unmanaged and capitalization-weighted. Each index’s returns include net reinvested dividends and/or interest income. Source: MSCI. MSCI makes no express or implied warranties or representations and shall have no liability whatsoever with respect to any MSCI data contained herein. The MSCI data may not be further redistributed or used as a basis for other indexes or any securities or financial products. This report is not approved, endorsed, reviewed or produced by MSCI. None of the MSCI data is intended to constitute investment advice or a recommendation to make (or refrain from making) any kind of investment decision and may not be relied on as such. Russell Investment Group is the source and owner of the trademarks, service marks and copyrights related to the Russell Indexes. Russell® is a trademark of Russell Investment Group. The Russell 2000 Index is an index of domestic small-cap stocks that measures the performance of the 2,000 smallest publicly traded U.S. companies in the Russell 3000 Index. The Russell Microcap Index includes 1,000 of the smallest securities in the small-cap Russell 2000 Index, along with the next smallest eligible securities as determined by Russell. The MSCI ACWI Small Cap Index is an unmanaged, capitalization-weighted index of global small-cap stocks. The performance of an index does not represent exactly any particular investment, as you cannot invest directly in an index. Index returns include net reinvested dividends and/or interest income. Royce Global, Micro-Cap, and Small-Cap Trust shares of common stock trade on the NYSE. Royce Fund Services, LLC (“RFS”) is a member of the Finanancial Industry Regulatory Authority (“FINRA”) and files certain material with FINRA on behalf of each Fund. RFS is not an underwriter or distributor of any of the Funds.
This page is not part of the 2024 Annual Report to Stockholders | 7
MANAGER’S DISCUSSION (UNAUDITED)
Royce Global Trust (RGT)

Steven McBoyle
FUND PERFORMANCE
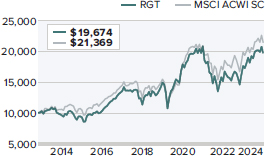
Royce Global Trust (RGT) advanced 11.8% on a NAV (net asset value) basis and an impressive 14.8% based on its market price, well ahead of the 7.7% gain for its benchmark, the MSCI ACWI Small Cap Index, for the same period. The Fund also beat its benchmark on an NAV basis for the 10-year period ended 12/31/24 while lagging for the 3- and 5-year period.
WHAT WORKED… AND WHAT DIDN’T
Eight of the Fund’s 10 equity sectors made positive contributions to performance in 2024, led by Financials, Industrials, and Information Technology. Health Care and Consumer Discretionary detracted while Communication Services made the smallest positive contribution. At the industry level, capital markets (Financials), software (Information Technology), and trading companies & distributors (Industrials) were the top contributors while the biggest detractors were media (Communication Services), health care equipment & supplies (Health Care), and building products (Industrials).
At the position level, the top contributor was FTAI Aviation, which provides maintenance, repair, and exchange of CFM56 and V2500 aircraft engines, the workhorses of the global aircraft fleet, to smaller airlines globally. Contributing to its notable performance in 2024 were the market’s recognition of the tight supply of aircraft engines, FTAI’s growth runway as it closed deals with Latam Airlines and Pratt & Whitney—a burgeoning cost advantage after FTAI purchased its management fee agreement and a key maintenance facility in Montreal—and FAA approval for critical aftermarket engine parts. Tel Aviv Stock Exchange operates Israel’s only stock exchange and provides trading services for stocks, mutual funds, corporate and government bonds, short-term T-bills, and index and currency options. A key element of its business model is that trading commissions only account for 38% of revenue, with the remainder coming from listing fees and annual levies, clearing/custodial fees, and data distribution fees. Despite Israel’s war against Hamas and Lebanon and a weak environment for IPOs/secondary equity offerings, the stock delivered strong returns in 2024 due to robust demand for Treasury Bills, corporate bonds, and government bond issuance, as well as from the exchange’s derivatives business, which benefited from increased volatility, and the securing of regulatory approval for bringing pricing in line with global peers.
| | | | | | |
| | Top Contributors to Performance | | Top Detractors from Performance | |
| | For 2024 (%)1 | | | For 2024 (%)2 | | |
| | FTAI Aviation | 2.68 | | EVI Industries | -0.69 | |
| | Tel Aviv Stock Exchange | 1.72 | | Dish TV India | -0.42 | |
| | Cellebrite DI | 1.34 | | Carel Industries | -0.39 | |
| | PAR Technology | 0.79 | | Teqnion | -0.37 | |
| | Protector Forsikring | 0.75 | | AutoCanada | -0.35 | |
| | 1 Includes dividends | | | 2 Net of dividends | | |
| | | | | | | |
EVI Industries, which distributes commercial laundry and dry cleaning equipment, industrial boilers, and related parts for its U.S. customer base, was the top-detracting position in 2024. While continuing to operate effectively, both its business and stock have also continued to face challenges, including declining profits, increased operating costs and interest expenses, competitive pressures, and environmental regulations. We began to reduce our stake in its shares in December 2024. Dish TV India is a subscription based satellite television provider whose offerings include multilingual services, entertainment, lifestyle, devotional and astrology, kids and games, and learning programs. The company faced challenges in the highly competitive direct-to-home and cable television industries, including difficulties expanding its market share and remaining profitable in the face of increased competition. We held a small position at year-end.
RGT’s advantage over the MSCI ACWI Small Cap was attributable to both stock selection and sector allocation decisions in 2024. At the sector level, stock selection and our substantially higher weighting in Financials, stock selection in Information Technology, and stock selection and, to a lesser extent, a higher weighting in Materials helped most with relative results. Conversely, stock selection in Health Care and Consumer Discretionary, as well as a combination of stock selection and a higher weight in Communication Services hindered relative performance the most in 2024.
CURRENT POSITIONING AND OUTLOOK
Having endured a multi-year earnings recession in small-cap, we are expecting a (long-awaited) period of sustained small-cap leadership, driven by stronger relative earnings growth and more attractive valuations. Prior small-cap leadership cycles have distinct dynamics at different points in the cycle, and low-quality factors often drive performance as the cycle gets under way. Given RGT’s disciplined focus on owning quality companies—those with high returns on invested capital, consistent free cash flow, and strong balance sheets—we are often challenged to keep pace with the initial run for lower-quality names. In time, however, this dynamic has reversed, as more high-quality factors assumed long-term leadership and outperformed. A key differentiator of our approach is the long-term investment horizon inherent in taking a business buyer’s approach. This enables the Fund to arbitrage time by adding to existing names or buying new high-quality holdings when their valuations contract due to short-term sentiment that often overshadows attractive and sustainable long-term value creation drivers. Though positioning changed little throughout the year, with relatively few new names being added, we were active in reducing multi-year outperformers while adding to lower market cap holdings that were down due to cyclical or macro concerns and where our conviction in the business model and long-term earnings power remains strong.
8 | 2024 Annual Report to Stockholders
| PERFORMANCE AND PORTFOLIO REVIEW (UNAUDITED) | SYMBOLS MARKET PRICE RGT NAV XRGTX |
Performance
Average Annual Total Return (%) Through 12/31/24
| | JUL-DEC 20241 | 1-YR | 3-YR | 5-YR | 10-YR | SINCE INCEPTION (10/17/13) |
| RGT (NAV) | 4.40 | 11.80 | -1.78 | 5.69 | 7.40 | 6.23 |
1 Not Annualized
Market Price Performance History Since Inception (10/17/13)
Cumulative Performance of Investment through 12/31/241
| | 1-YR | 5-YR | 10-YR | 15-YR | 20-YR | SINCE INCEPTION (10/17/13) |
| RGT | 14.8% | 31.1% | 100.7% | N/A | N/A | 83.2% |

| 1 | Reflects the cumulative performance experience of a continuous common stockholder who purchased one share at inception ($8.975 IPO) and reinvested all distributions. |
| 2 | Reflects the actual month-end market price movement of one share as it has traded on NYSE. |
Morningstar Style Map™ As of 12/31/24

The Morningstar Style Map is the Morningstar Style Box™ with the center 75% of fund holdings plotted as the Morningstar Ownership Zone™. The Morningstar Style Box is designed to reveal a fund’s investment strategy. The Morningstar Ownership Zone provides detail about a portfolio’s investment style by showing the range of stock sizes and styles. The Ownership Zone is derived by plotting each stock in the portfolio within the proprietary Morningstar Style Box. Over time, the shape and location of a fund's ownership zone may vary. See page 65 for additional information.
Value of $10,000
Invested on 10/17/13 as of 12/31/24 ($)
Top 10 Positions
% of Net Assets
| FTAI Aviation | 3.8 |
| Tel Aviv Stock Exchange | 3.2 |
| SEI Investments | 2.8 |
| Sprott | 2.4 |
| Protector Forsikring | 2.1 |
| Alamos Gold Cl. A | 2.1 |
| APi Group | 2.0 |
| Morningstar | 2.0 |
| ESAB Corporation | 2.0 |
| TMX Group | 1.8 |
Portfolio Sector Breakdown
% of Net Assets
| Industrials | 34.1 |
| Financials | 26.5 |
| Information Technology | 14.2 |
| Materials | 8.5 |
| Health Care | 5.6 |
| Communication Services | 3.9 |
| Consumer Discretionary | 3.5 |
| Energy | 2.4 |
| Real Estate | 1.1 |
| Consumer Staples | 0.9 |
| Outstanding Line of Credit, Net of Cash and Cash Equivalents | -0.7 |
| Calendar Year Total Returns (%) | |
| YEAR | RGT |
| 2024 | 11.8 |
| 2023 | 16.1 |
| 2022 | -27.0 |
| 2021 | 16.3 |
| 2020 | 19.7 |
| 2019 | 31.2 |
| 2018 | -16.1 |
| 2017 | 31.1 |
| 2016 | 11.1 |
| 2015 | -3.4 |
| 2014 | -6.2 |
| | |
| | |
| Portfolio Country Breakdown 1,2 | |
| % of Net Assets | |
| United States | 42.8 |
| Canada | 17.8 |
| Israel | 7.2 |
| United Kingdom | 6.9 |
| Sweden | 5.1 |
| 1 | Represents countries that are 3% or more of net assets. |
| 2 | Securities are categorized by the country of their headquarters. |
Portfolio Diagnostics
| Fund Net Assets | $82 million |
| Number of Holdings | 116 |
| Turnover Rate | 16% |
| Net Asset Value | $12.55 |
| Market Price | $10.72 |
| Net Leverage1 | 0.7% |
| Average Market Capitalization2 | $2,539 million |
| Weighted Average P/E Ratio3,4 | 22.8x |
| Weighted Average P/B Ratio3 | 2.9x |
| Active Share5 | 98% |
| 1 | Net leverage is the percentage, in excess of 100%, of the total value of equity type investments, divided by net assets. |
| 2 | Geometric Average. This weighted calculation uses each portfolio holding’s market cap in a way designed to not skew the effect of very large or small holdings; instead, it aims to better identify the portfolio’s center, which Royce believes offers a more accurate measure of average market cap than a simple mean or median. |
| 3 | Harmonic Average. This weighted calculation evaluates a portfolio as if it were a single stock and measures it overall. It compares the total market value of the portfolio to the portfolio’s share in the earnings or book value, as the case may be, of its underlying stocks. |
| 4 | The Fund’s P/E Ratio calculation excludes companies with zero or negative earnings (16% of portfolio holdings as of 12/31/24). |
| 5 | Active Share is the sum of the absolute values of the different weightings of each holding in the Fund versus each holding in the benchmark, divided by two. |
Important Performance and Risk Information
All performance information reflects past performance, is presented on a total return basis, net of the Fund’s investment advisory fee, reflects the reinvestment of distributions and does not reflect the deduction of taxes that a shareholder would pay on fund distributions or the sale of fund shares. Past performance is no guarantee of future results. Current month-end performance may be higher or lower than performance quoted and may be obtained at www.royceinvest.com. The market price of the Fund’s shares will fluctuate, so that shares may be worth more or less than their original cost when sold. The Fund invests primarily in securities of small- and mid-cap companies, which may involve considerably more risk than investments in securities of larger-cap companies. The Fund’s broadly diversified portfolio does not ensure a profit or guarantee against loss. The Fund generally invests a significant portion of its net assets in foreign securities, which may involve political, economic, currency and other risks not encountered in U.S. investments. Regarding the “Top Contributors” and “Top Detractors” tables shown above, the sum of all contributors to, and all detractors from, performance for all securities in the portfolio would approximate the Fund’s year-to-date performance for 2024.
2024 Annual Report to Stockholders | 9
Royce Global Trust
Schedule of Investments
Common Stocks – 100.7%
| | | SHARES | | | VALUE |
| | | | | | |
| AUSTRALIA – 2.7% | | | | | |
| Cochlear 1 | | | 4,000 | | | $ | 716,527 |
| IPH 1 | | | 233,881 | | | | 726,709 |
| Technology One 1 | | | 40,400 | | | | 780,366 |
| Total (Cost $1,267,991) | | | | | | | 2,223,602 |
| | | | | | | | |
| BERMUDA – 0.9% | | | | | | | |
| Bank of N.T. Butterfield & Son | | | 21,000 | | | | 767,550 |
| Total (Cost $745,408) | | | | | | | 767,550 |
| | | | | | | | |
| BRAZIL – 0.9% | | | | | | | |
| Odontoprev 1 | | | 171,600 | | | | 301,694 |
| TOTVS 1 | | | 97,885 | | | | 421,534 |
| Total (Cost $750,794) | | | | | | | 723,228 |
| | | | | | | | |
| CANADA – 17.8% | | | | | | | |
| Alamos Gold Cl. A | | | 94,100 | | | | 1,736,083 |
| Altus Group | | | 22,470 | | | | 875,384 |
| AutoCanada 2 | | | 45,840 | | | | 552,650 |
| Canaccord Genuity Group | | | 97,143 | | | | 683,235 |
| Computer Modelling Group | | | 109,901 | | | | 814,251 |
| Descartes Systems Group (The) 2,3 | | | 8,424 | | | | 956,966 |
| IMAX Corporation 2 | | | 51,171 | | | | 1,309,978 |
| Major Drilling Group International 2 | | | 194,300 | | | | 1,109,745 |
| Onex Corporation | | | 17,813 | | | | 1,391,383 |
| Pan American Silver 3 | | | 12,700 | | | | 256,794 |
| Pason Systems | | | 71,300 | | | | 675,079 |
| Sprott | | | 45,635 | | | | 1,922,927 |
| Stella-Jones | | | 12,000 | | | | 594,302 |
| TELUS Corporation | | | 16,311 | | | | 221,157 |
| TMX Group | | | 47,600 | | | | 1,466,297 |
| Total (Cost $9,919,801) | | | | | | | 14,566,231 |
| | | | | | | | |
| FRANCE – 0.9% | | | | | | | |
| Ayvens 1 | | | 39,000 | | | | 263,307 |
| Esker 1 | | | 1,800 | | | | 486,336 |
| Total (Cost $516,235) | | | | | | | 749,643 |
| | | | | | | | |
| GERMANY – 0.3% | | | | | | | |
| Carl Zeiss Meditec 1 | | | 3,400 | | | | 160,162 |
| STRATEC 1 | | | 3,300 | | | | 101,907 |
| Total (Cost $540,371) | | | | | | | 262,069 |
| | | | | | | | |
| GREECE – 0.9% | | | | | | | |
| Sarantis 1 | | | 64,500 | | | | 726,921 |
| Total (Cost $554,222) | | | | | | | 726,921 |
| | | | | | | | |
| ICELAND – 0.3% | | | | | | | |
| Embla Medical 1,2 | | | 51,000 | | | | 252,197 |
| Total (Cost $321,244) | | | | | | | 252,197 |
| | | | | | | | |
| INDIA – 2.4% | | | | | | | |
| AIA Engineering 1 | | | 28,440 | | | | 1,125,808 |
| †BSE 1 | | | 7,232 | | | | 450,078 |
| Dish TV India 1,2 | | | 3,017,686 | | | | 365,828 |
| Total (Cost $1,407,224) | | | | | | | 1,941,714 |
| | | | | | | | |
| INDONESIA – 0.2% | | | | | | | |
| Aspirasi Hidup Indonesia 1 | | | 4,000,000 | | | | 194,576 |
| Total (Cost $169,716) | | | | | | | 194,576 |
| | | | | | | | |
| IRELAND – 0.5% | | | | | | | |
| †Avadel Pharmaceuticals 2 | | | 35,460 | | | | 372,685 |
| Total (Cost $590,636) | | | | | | | 372,685 |
| | | | | | | | |
| ISRAEL – 7.2% | | | | | | | |
| Cellebrite DI 2 | | | 54,893 | | | | 1,209,293 |
| Global-e Online 2 | | | 5,200 | | | | 283,556 |
| Nova 2,3,4 | | | 5,700 | | | | 1,122,615 |
| Phoenix Financial 1 | | | 48,500 | | | | 708,239 |
| Tel Aviv Stock Exchange 1 | | | 222,300 | | | | 2,578,284 |
| Total (Cost $2,106,727) | | | | | | | 5,901,987 |
| | | | | | | | |
| ITALY – 0.7% | | | | | | | |
| Carel Industries 1 | | | 28,300 | | | | 542,326 |
| Total (Cost $342,471) | | | | | | | 542,326 |
| | | | | | | | |
| JAPAN – 1.7% | | | | | | | |
| As One 1 | | | 11,200 | | | | 187,167 |
| Fukui Computer Holdings 1 | | | 10,800 | | | | 208,927 |
| NSD 1 | | | 12,200 | | | | 260,602 |
| TechnoPro Holdings 1 | | | 7,200 | | | | 134,489 |
| TKC Corporation 1 | | | 25,500 | | | | 613,097 |
| Total (Cost $1,109,922) | | | | | | | 1,404,282 |
| | | | | | | | |
| NETHERLANDS – 1.0% | | | | | | | |
| IMCD 1 | | | 5,500 | | | | 814,542 |
| Total (Cost $387,492) | | | | | | | 814,542 |
| | | | | | | | |
| NEW ZEALAND – 0.5% | | | | | | | |
| Fisher & Paykel Healthcare 1 | | | 17,000 | | | | 364,716 |
| Total (Cost $101,973) | | | | | | | 364,716 |
| | | | | | | | |
| NORWAY – 2.1% | | | | | | | |
| Protector Forsikring 1 | | | 70,000 | | | | 1,753,525 |
| Total (Cost $521,854) | | | | | | | 1,753,525 |
| | | | | | | | |
| PANAMA – 0.6% | | | | | | | |
| †Banco Latinoamericano de Comercio | | | | | | | |
| Exterior Cl. E | | | 13,716 | | | | 487,878 |
| Total (Cost $379,574) | | | | | | | 487,878 |
| | | | | | | | |
| SINGAPORE – 0.0% | | | | | | | |
| Midas Holdings 2,5 | | | 400,000 | | | | 0 |
| Total (Cost $50,439) | | | | | | | 0 |
| | | | | | | | |
| SOUTH AFRICA – 2.7% | | | | | | | |
| CA Sales Holdings 1 | | | 147,597 | | | | 126,698 |
| Curro Holdings 1 | | | 258,594 | | | | 179,074 |
| PSG Financial Services 1 | | | 550,976 | | | | 572,910 |
| Stadio Holdings 1 | | | 3,686,928 | | | | 1,347,828 |
| Total (Cost $1,125,199) | | | | | | | 2,226,510 |
| | | | | | | | |
| SWEDEN – 5.1% | | | | | | | |
| Biotage 1 | | | 37,900 | | | | 551,811 |
| Bravida Holding 1 | | | 68,900 | | | | 499,274 |
| CDON 1,2 | | | 25,000 | | | | 198,807 |
| Karnov Group 1,2 | | | 145,381 | | | | 1,082,146 |
| OEM International Cl. B 1 | | | 107,000 | | | | 1,081,112 |
| †Teqnion 1,2 | | | 47,800 | | | | 714,081 |
| Total (Cost $3,671,717) | | | | | | | 4,127,231 |
| | | | | | | | |
| SWITZERLAND – 1.6% | | | | | | | |
| Kardex Holding 1 | | | 2,400 | | | | 715,300 |
| 10 | 2024 Annual Report to Stockholders | THE ACCOMPANYING NOTES ARE AN INTEGRAL PART OF THESE FINANCIAL STATEMENTS |
December 31, 2024
Schedule of Investments (continued)
| | | SHARES | | | VALUE |
| | | | | | | | |
| SWITZERLAND (continued) | | | | | | | |
| LEM Holding 1 | | | 150 | | | $ | 122,474 |
| VZ Holding 1 | | | 2,900 | | | | 460,281 |
| Total (Cost $482,877) | | | | | | | 1,298,055 |
| | | | | | | | |
| UNITED KINGDOM – 6.9% | | | | | | | |
| Diploma 1 | | | 8,200 | | | | 436,143 |
| DiscoverIE Group 1 | | | 70,800 | | | | 633,973 |
| FDM Group Holdings 1 | | | 46,800 | | | | 184,855 |
| Genuit Group 1 | | | 54,600 | | | | 266,249 |
| Halma 1 | | | 21,500 | | | | 719,666 |
| Judges Scientific 1 | | | 7,600 | | | | 802,483 |
| Keystone Law Group 1 | | | 95,940 | | | | 690,750 |
| Marlowe 1 | | | 112,600 | | | | 456,395 |
| Mortgage Advice Bureau Holdings 1 | | | 36,100 | | | | 275,662 |
| †Optima Health 1,2 | | | 112,600 | | | | 203,025 |
| Restore 1 | | | 83,000 | | | | 250,754 |
| SThree 1 | | | 146,600 | | | | 541,723 |
| Team Internet Group 1 | | | 80,000 | | | | 94,231 |
| YouGov 1 | | | 18,600 | | | | 96,730 |
| Total (Cost $5,271,467) | | | | | | | 5,652,639 |
| | | | | | | | |
| UNITED STATES – 42.8% | | | | | | | |
| ACV Auctions Cl. A 2 | | | 33,400 | | | | 721,440 |
| Air Lease Cl. A 3 | | | 22,023 | | | | 1,061,729 |
| APi Group 2,3,4 | | | 46,008 | | | | 1,654,908 |
| Arcosa | | | 12,660 | | | | 1,224,728 |
| Artisan Partners Asset Management Cl. A | | | 33,200 | | | | 1,429,260 |
| †Atmus Filtration Technologies | | | 20,870 | | | | 817,687 |
| Blue Owl Capital Cl. A | | | 24,876 | | | | 578,616 |
| †CBIZ 2 | | | 7,053 | | | | 577,147 |
| Diodes 2,3 | | | 1,420 | | | | 87,571 |
| Element Solutions 3 | | | 36,400 | | | | 925,652 |
| Enovis Corporation 2 | | | 14,998 | | | | 658,112 |
| †Enpro | | | 1,770 | | | | 305,236 |
| ESAB Corporation | | | 13,420 | | | | 1,609,595 |
| EVI Industries 3 | | | 68,563 | | | | 1,121,005 |
| FormFactor 2,3,4 | | | 13,500 | | | | 594,000 |
| FTAI Aviation | | | 21,360 | | | | 3,076,694 |
| GCM Grosvenor Cl. A | | | 101,682 | | | | 1,247,638 |
| Griffon Corporation 3 | | | 11,250 | | | | 801,787 |
| Hagerty Cl. A 2 | | | 39,300 | | | | 379,245 |
| Innospec 3 | | | 6,228 | | | | 685,454 |
| Kadant 3 | | | 1,928 | | | | 665,141 |
| KBR 3 | | | 16,416 | | | | 950,979 |
| Lindsay Corporation 3 | | | 3,547 | | | | 419,646 |
| Mesa Laboratories | | | 3,829 | | | | 504,930 |
| MKS Instruments | | | 2,907 | | | | 303,462 |
| Morningstar 3 | | | 4,835 | | | | 1,628,235 |
| NewtekOne | | | 22,650 | | | | 289,240 |
| nLIGHT 2 | | | 32,100 | | | | 336,729 |
| PAR Technology 2,3,4 | | | 11,000 | | | | 799,370 |
| Quaker Houghton | | | 5,560 | | | | 782,626 |
| RB Global | | | 2,000 | | | | 180,420 |
| †Repligen Corporation 2 | | | 1,286 | | | | 185,107 |
| Richardson Electronics | | | 11,356 | | | | 159,325 |
| Rogers Corporation 2 | | | 3,428 | | | | 348,319 |
| Royal Gold | | | 6,320 | | | | 833,292 |
| SEI Investments 3 | | | 27,650 | | | | 2,280,572 |
| †Teledyne Technologies 2 | | | 1,340 | | | | 621,934 |
| Transcat 2,3 | | | 13,705 | | | | 1,449,167 |
| †Victory Capital Holdings | | | 5,283 | | | | 345,825 |
| †Viper Energy Cl. A | | | 25,649 | | | | 1,258,596 |
| Vontier Corporation 3,4 | | | 29,889 | | | | 1,090,052 |
| Total (Cost $21,746,084) | | | | | | | 34,990,471 |
| | | | | | | | |
| TOTAL COMMON STOCKS | | | | | | | |
| (Cost $54,081,438) | | | | | | | 82,344,578 |
| | | | | | | | |
| INVESTMENTS AT VALUE | | | | | | | |
| (Cost $54,081,438) | | | | | | | 82,344,578 |
| | | | | | | | |
| REPURCHASE AGREEMENT– 0.8% | | | | | | | |
Fixed Income Clearing Corporation, 3.75% dated 12/31/24, due 1/2/25, maturity value $675,533 (collateralized by obligations of U.S. Government Agencies, 3.625% due 3/31/30, valued at $688,905) |
| (Cost $675,392) | | | | | | | 675,392 |
| | | | | | | | |
| TOTAL INVESTMENTS – 101.5% | | | | | | | |
| (Cost $54,756,830) | | | | | | | 83,019,970 |
| | | | | | | | |
| LIABILITIES LESS CASH AND OTHER ASSETS – (1.5)% | | | | | | | (1,220,074) |
| | | | | | | | |
| NET ASSETS – 100.0% | | | | | | $ | 81,799,896 |
| 1 | These securities are defined as Level 2 securities due to fair value being based on quoted prices for similar securities and/or due to the application of fair value factors. See Notes to Financial Statements. |
| 3 | All or a portion of these securities were pledged as collateral in connection with the Fund's revolving credit agreement as of December 31, 2024. Total market value of pledged securities as of December 31, 2024, was $7,322,408. |
| 4 | As of December 31, 2024, a portion of these securities, in the aggregate amount of $2,066,402, were rehypothecated by BNP Paribas Prime Brokerage International, Limited in connection with the Fund's revolving credit agreement. See Notes to Financial Statements. |
| 5 | A security for which market quotations are not readily available represents 0.0% of net assets. This security has been valued at its fair value under procedures approved by the Fund's Board of Directors. This security is defined as a Level 3 security due to the use of significant unobservable inputs in the determination of fair value. See Notes to Financial Statements. |
Securities are categorized by the country of their headquarters.
Bold indicates the Fund’s 20 largest equity holdings in terms of December 31, 2024, market value.
TAX INFORMATION: The cost of total investments for Federal income tax purposes was $58,354,899. As of December 31, 2024, net unrealized appreciation for all securities was $24,665,071 consisting of aggregate gross unrealized appreciation of $28,496,640 and aggregate gross unrealized depreciation of $3,831,569. The primary causes of the difference between book and tax basis cost are the timing of the recognition of losses on securities sold, underlying investments and mark-to-market of Passive Foreign Investment Companies.
| THE ACCOMPANYING NOTES ARE AN INTEGRAL PART OF THESE FINANCIAL STATEMENTS | 2024 Annual Report to Stockholders | 11 |
| Royce Global Trust | December 31, 2024 |
Statement of Assets and Liabilities
| ASSETS: | | | |
| Investments at value | | $ | 82,344,578 | |
| Repurchase agreements (at cost and value) | | | 675,392 | |
| Foreign currency (cost $5,489) | | | 5,481 | |
| Receivable for investments sold | | | 962,454 | |
| Receivable for dividends and interest | | | 125,682 | |
| Receivable for insurance reimbursement | | | 24,299 | |
| Prepaid expenses and other assets | | | 17,759 | |
| Total Assets | | | 84,155,645 | |
| LIABILITIES: | | | | |
| Revolving credit agreement | | | 2,000,000 | |
| Payable for investments purchased | | | 106,096 | |
| Payable for investment advisory fee | | | 71,693 | |
| Payable for directors' fees | | | 7,226 | |
| Payable for interest expense | | | 16,936 | |
| Accrued legal expense | | | 24,299 | |
| Accrued other expenses | | | 64,719 | |
| Deferred capital gains tax | | | 64,780 | |
| Total Liabilities | | | 2,355,749 | |
| Commitments and Contingent Liabilities1 | | | | |
| Net Assets | | $ | 81,799,896 | |
| ANALYSIS OF NET ASSETS: | | | | |
| Paid-in capital - $0.001 par value per share; 6,519,010 shares outstanding (150,000,000 shares authorized) | | $ | 57,834,408 | |
| Total distributable earnings (loss) | | | 23,965,488 | |
| Net Assets (net asset value per share - $12.55) | | $ | 81,799,896 | |
| Investments at identified cost | | $ | 54,081,438 | |
1 See Notes to Financial Statements.
| 12 | 2024 Annual Report to Stockholders | THE ACCOMPANYING NOTES ARE AN INTEGRAL PART OF THESE FINANCIAL STATEMENTS |
| Royce Global Trust | Year Ended December 31, 2024 |
Statement of Operations
| INVESTMENT INCOME: | | | |
| INCOME: | | | |
| Dividends | | $ | 1,532,223 | |
| Foreign withholding tax | | | (94,650 | ) |
| Interest | | | 67,014 | |
| Rehypothecation income | | | 20 | |
| Total income | | | 1,504,607 | |
| EXPENSES: | | | | |
| Investment advisory fees | | | 806,996 | |
| Legal expense1 | | | 855,838 | |
| Insurance reimbursement of legal expense1 | | | (855,838 | ) |
| Interest expense | | | 255,173 | |
| Custody and transfer agent fees | | | 79,724 | |
| Professional fees | | | 67,554 | |
| Stockholder reports | | | 65,696 | |
| Administrative and office facilities | | | 48,594 | |
| Directors' fees | | | 24,984 | |
| Other expenses | | | 34,653 | |
| Total expenses | | | 1,383,374 | |
| Net investment income (loss) | | | 121,233 | |
| REALIZED AND UNREALIZED GAIN (LOSS) ON INVESTMENTS AND FOREIGN CURRENCY: | | | | |
| NET REALIZED GAIN (LOSS): | | | | |
| Investments | | | 375,541 | |
| Foreign currency transactions | | | (7,420 | ) |
| NET CHANGE IN UNREALIZED APPRECIATION (DEPRECIATION): | | | | |
| Investments | | | 8,064,824 | |
| Other assets and liabilities denominated in foreign currency | | | (26,245 | ) |
| Net realized and unrealized gain (loss) on investments and foreign currency | | | 8,406,700 | |
| NET INCREASE (DECREASE) IN NET ASSETS FROM INVESTMENT OPERATIONS | | $ | 8,527,933 | |
| 1 | The Fund incurred $855,838 in legal fees and expenses in 2024 in connection with an action filed on June 29, 2023 against the Fund and numerous unrelated funds in Saba Capital Master Funds., Ltd., et al. v. Clearbridge Energy Midstream Opportunity Fund, Inc., et al., No. 1:23-cv-05568 (S.D.N.Y.) See Notes to Financial Statements. |
| THE ACCOMPANYING NOTES ARE AN INTEGRAL PART OF THESE FINANCIAL STATEMENTS | 2024 Annual Report to Stockholders | 13 |
Statement of Changes in Net Assets
| | | YEAR ENDED 12/31/24 | | | YEAR ENDED 12/31/23 | |
| INVESTMENT OPERATIONS: | | | | | | | | |
| Net investment income (loss) | | $ | 121,233 | | | $ | (307,034 | ) |
| Net realized gain (loss) on investments and foreign currency | | | 368,121 | | | | 170,469 | |
| Net change in unrealized appreciation (depreciation) on investments and foreign currency | | | 8,038,579 | | | | 10,485,406 | |
| Net increase (decrease) in net assets from investment operations | | | 8,527,933 | | | | 10,348,841 | |
| DISTRIBUTIONS: | | | | | | | | |
| Total distributable earnings | | | (2,989,773 | ) | | | (946,548 | ) |
| Total distributions | | | (2,989,773 | ) | | | (946,548 | ) |
| CAPITAL STOCK TRANSACTIONS: | | | | | | | | |
| Reinvestment of distributions | | | 1,683,617 | | | | 483,560 | |
| Total capital stock transactions | | | 1,683,617 | | | | 483,560 | |
| Net Increase (Decrease) In Net Assets | | | 7,221,777 | | | | 9,885,853 | |
| NET ASSETS: | | | | | | | | |
| Beginning of year | | | 74,578,119 | | | | 64,692,266 | |
| End of year | | $ | 81,799,896 | | | $ | 74,578,119 | |
| 14 | 2024 Annual Report to Stockholders | THE ACCOMPANYING NOTES ARE AN INTEGRAL PART OF THESE FINANCIAL STATEMENTS |
| Royce Global Trust | Year Ended December 31, 2024 |
Statement of Cash Flows
| CASH FLOWS FROM OPERATING ACTIVITIES: | | | |
| Net increase (decrease) in net assets from investment operations | | $ | 8,527,933 | |
| Adjustments to reconcile net increase (decrease) in net assets from investment operations to net cash provided by operating activities: | | | | |
| Purchases of long-term investments | | | (12,982,487 | ) |
| Proceeds from sales and maturities of long-term investments | | | 14,795,632 | |
| Net purchases, sales and maturities of short-term investments | | | 1,197,332 | |
| Net (increase) decrease in dividends and interest receivable and other assets | | | 371,845 | |
| Net increase (decrease) in interest expense payable, accrued expenses and other liabilities | | | (299,898 | ) |
| Net change in unrealized appreciation (depreciation) on investments | | | (8,064,824 | ) |
| Net realized gain (loss) on investments | | | (375,541 | ) |
| Net cash provided by operating activities | | | 3,169,992 | |
| CASH FLOWS FROM FINANCING ACTIVITIES: | | | | |
| Repayment of borrowings | | | (2,000,000 | ) |
| Distributions net of reinvestment (reinvestment $1,683,617) | | | (1,306,156 | ) |
| Net cash used for financing activities | | | (3,306,156 | ) |
| INCREASE (DECREASE) IN CASH: | | | (136,164 | ) |
| Cash and foreign currency at beginning of year | | | 141,645 | |
| Cash and foreign currency at end of year | | $ | 5,481 | |
Supplemental disclosure of cash flow information:
For the year ended December 31, 2024, the Fund paid $260,695 in interest expense.
| THE ACCOMPANYING NOTES ARE AN INTEGRAL PART OF THESE FINANCIAL STATEMENTS | 2024 Annual Report to Stockholders | 15 |
Royce Global Trust
Financial Highlights
This table is presented to show selected data for a share of Common Stock outstanding throughout each period, and to assist stockholders in evaluating the Fund’s performance for the periods presented.
| | | YEARS ENDED | |
| | | 12/31/24 | | | 12/31/23 | | | 12/31/22 | | | 12/31/21 | | | 12/31/20 | |
| Net Asset Value, Beginning of Period | | $ | 11.72 | | | $ | 10.25 | | | $ | 14.26 | | | $ | 14.95 | | | $ | 13.60 | |
| INVESTMENT OPERATIONS: | | | | | | | | | | | | | | | | | | | | |
| Net investment income (loss) | | | 0.03 | | | | (0.05 | )1,2 | | | 0.09 | | | | (0.01 | ) | | | (0.05) | |
| Net realized and unrealized gain (loss) on investments and foreign currency | | | 1.32 | | | | 1.69 | | | | (3.96 | ) | | | 2.19 | | | | 2.63 | |
| Net increase (decrease) in net assets from investment operations | | | 1.35 | | | | 1.64 | | | | (3.87 | ) | | | 2.18 | | | | 2.58 | |
| DISTRIBUTIONS: | | | | | | | | | | | | | | | | | | | | |
| Net investment income | | | (0.43 | ) | | | – | | | | (0.10 | ) | | | (0.09 | ) | | | – | |
| Net realized gain on investments and foreign currency | | | (0.04 | ) | | | (0.15 | ) | | | (0.03 | ) | | | (2.66 | ) | | | (1.19) | |
| Return of capital | | | – | | | | – | | | | (0.00 | ) | | | – | | | | – | |
| Total distributions | | | (0.47 | ) | | | (0.15 | ) | | | (0.13 | ) | | | (2.75 | ) | | | (1.19 | ) |
| CAPITAL STOCK TRANSACTIONS: | | | | | | | | | | | | | | | | | | | | |
| Effect of reinvestment of distributions by Common Stockholders | | | (0.05 | ) | | | (0.02 | ) | | | (0.01 | ) | | | (0.12 | ) | | | (0.04) | |
| Total capital stock transactions | | | (0.05 | ) | | | (0.02 | ) | | | (0.01 | ) | | | (0.12 | ) | | | (0.04 | ) |
| Net Asset Value, End of Period | | $ | 12.55 | | | $ | 11.72 | | | $ | 10.25 | | | $ | 14.26 | | | $ | 14.95 | |
| Market Value, End of Period | | $ | 10.72 | | | $ | 9.75 | | | $ | 8.65 | | | $ | 13.12 | | | $ | 13.36 | |
| TOTAL RETURN:3 | | | | | | | | | | | | | | | | | | | | |
| Net Asset Value | | | 11.80 | % | | | 16.15 | % | | | (27.04 | )% | | | 16.34 | % | | | 19.67 | % |
| Market Value | | | 14.81 | % | | | 14.50 | % | | | (33.08 | )% | | | 19.77 | % | | | 24.42 | % |
| RATIOS BASED ON AVERAGE NET ASSETS: | | | | | | | | | | | | | | | | | | | | |
| Investment advisory fee expense | | | 1.00 | % | | | 1.00 | % | | | 1.00 | % | | | 1.00 | % | | | 1.00 | % |
| Other operating expenses | | | 0.71 | % | | | 1.52 | %1 | | | 0.54 | % | | | 0.39 | % | | | 0.34 | % |
| Total expenses (net) | | | 1.71 | % | | | 2.52 | %1 | | | 1.54 | % | | | 1.39 | % | | | 1.34 | % |
| Expenses excluding interest expense | | | 1.40 | % | | | 2.15 | %1 | | | 1.38 | % | | | 1.33 | % | | | 1.24 | % |
| Expenses prior to balance credits | | | 1.71 | % | | | 2.52 | %1 | | | 1.54 | % | | | 1.39 | % | | | 1.34 | % |
| Net investment income (loss) | | | 0.15 | % | | | (0.45 | )%1,2 | | | 0.79 | % | | | (0.13 | )% | | | (0.15 | )% |
| SUPPLEMENTAL DATA: | | | | | | | | | | | | | | | | | | | | |
| Net Assets, End of Period (in thousands) | | $ | 81,800 | | | $ | 74,578 | | | $ | 64,692 | | | $ | 89,394 | | | $ | 83,752 | |
| Portfolio Turnover Rate | | | 16 | % | | | 14 | % | | | 24 | % | | | 52 | % | | | 54 | % |
| REVOLVING CREDIT AGREEMENT: | | | | | | | | | | | | | | | | | | | | |
| Asset coverage | | | 4190 | % | | | 1964 | % | | | 1717 | % | | | 2335 | % | | | 1147 | % |
| Asset coverage per $1,000 | | $ | 41,900 | | | $ | 19,645 | | | $ | 17,173 | | | $ | 23,349 | | | $ | 11,469 | |
| | | | | | | | | | | | | | | | | | | | | |
| 1 | Due to an action filed against the Fund and numerous unrelated funds in Saba Capital Master Funds., Ltd., et al. v. Clearbridge Energy Midstream Opportunity Fund, Inc., et al., No.1:23-cv-05568 (S.D.N.Y.), the Fund accrued net $500,000 in legal fees and expenses which resulted in a decrease in net investment income (loss) per share of $0.08, a decrease in the ratio of net investment income (loss) to average net assets of 0.73% and an increase in the noted expense ratios to average net assets of 0.73%. |
| 2 | A special distribution from Tel Aviv Stock Exchange resulted in an increase in net investment income (loss) per share of $0.02 and an increase in the ratio of net investment income (loss) to average net assets of 0.17%. |
| 3 | The Market Value Total Return is calculated assuming a purchase of Common Stock on the opening of the first business day and a sale on the closing of the last business day of each period. Dividends and distributions are assumed for the purposes of this calculation to be reinvested at prices obtained under the Fund’s Distribution Reinvestment and Cash Purchase Plan. Net Asset Value Total Return is calculated on the same basis, except that the Fund’s net asset value is used on the purchase, sale and dividend reinvestment dates instead of market value. |
| 16 | 2024 Annual Report to Stockholders | THE ACCOMPANYING NOTES ARE AN INTEGRAL PART OF THESE FINANCIAL STATEMENTS |
Royce Global Trust
Notes to Financial Statements
Summary of Significant Accounting Policies
Royce Global Trust, Inc. (formerly Royce Global Value Trust, Inc.) (the “Fund”), is a diversified closed-end investment company that was incorporated under the laws of the State of Maryland on February 14, 2011. The Fund commenced operations on October 18, 2013.
The preparation of financial statements in conformity with accounting principles generally accepted in the United States of America requires management to make estimates and assumptions that affect the reported amounts of assets and liabilities and the disclosure of contingent assets and liabilities at the date of the financial statements and the reported amounts of income and expenses during the reporting period. Actual results could differ from those estimates.
The Fund is an investment company registered under the Investment Company Act of 1940 (the “1940 Act”) and accordingly follows the investment company accounting and reporting guidance of the Financial Accounting Standards Board (FASB) Accounting Standard Codification Topic 946 “Financial Services-Investment Companies.”
Royce & Associates, LP, the Fund’s investment adviser, is a majority-owned subsidiary of Franklin Resources, Inc. and primarily conducts business using the name Royce Investment Partners (“Royce”). As of December 31, 2024, officers and employees of Royce, Fund directors, the Royce retirement plans and other affiliates owned more than 19% of the Fund.
VALUATION OF INVESTMENTS:
Portfolio securities held by the Fund are valued as of the close of trading on the New York Stock Exchange (“NYSE”) (generally 4:00 p.m. Eastern time) on the valuation date. Investments in money market funds are valued at net asset value per share. Values for non-U.S. dollar denominated equity securities are converted to U.S. dollars daily based upon prevailing foreign currency exchange rates as quoted by a major bank.
Portfolio securities that are listed on an exchange or Nasdaq, or traded on OTC Market Group Inc.’s OTC Link ATS or other alternative trading system, are valued: (i) on the basis of their last reported sales prices or official closing prices, as applicable, on a valuation date; or (ii) at their highest reported bid prices in the event such equity securities did not trade on a valuation date. Such inputs are generally referred to as “Level 1” inputs because they represent reliable quoted prices in active markets for identical securities.
If the value of a portfolio security held by the Fund cannot be determined solely by reference to Level 1 inputs, such portfolio security will be “fair valued.” The Fund’s Board of Directors has designated Royce as valuation designee to perform fair value determinations for such portfolio securities in accordance with Rule 2a-5 under the 1940 Act (“Rule 2a-5”). Pursuant to Rule 2a-5, fair values are determined in accordance with policies and procedures approved by the Fund’s Board of Directors and policies and procedures adopted by Royce in its capacity as valuation designee for the Fund. Fair valued securities are reported as either “Level 2” or “Level 3” securities.
As a general principle, the fair value of a security is the amount which the Fund might reasonably expect to receive for the security upon its current sale. However, in light of the judgment involved in fair valuations, no assurance can be given that a fair value assigned to a particular portfolio security will be the amount which the Fund might be able to receive upon its current sale. When a fair value pricing methodology is used, the fair value prices used by the Fund for such securities will likely differ from the quoted or published prices for the same securities.
Level 2 inputs are other significant observable inputs (e.g., dealer bid side quotes and quoted prices for securities with comparable characteristics). Examples of situations in which Level 2 inputs are used to fair value portfolio securities held by the Fund on a particular valuation date include:
| • | Over-the-counter equity securities other than those traded on OTC Market Group Inc.’s OTC Link ATS or other alternative trading system (collectively referred to herein as “Other OTC Equity Securities”) are fair valued at their highest bid price when Royce receives at least two bid side quotes from dealers who make markets in such securities; |
| • | Certain bonds and other fixed income securities may be fair valued by reference to other securities with comparable ratings, interest rates, and maturities in accordance with valuation methodologies maintained by certain independent pricing services; and |
| • | The Fund uses an independent pricing service to fair value certain non-U.S. equity securities when U.S. market volatility exceeds a certain threshold set by Royce as valuation designee. This pricing service uses proprietary correlations it has developed between the movement of prices of non-U.S. equity securities and indices of U.S.-traded securities, futures contracts, and other indications to estimate the fair value of such non-U.S. securities. |
Level 3 inputs are significant unobservable inputs. Examples of Level 3 inputs include (without limitation) the last trade price for a security before trading was suspended or terminated; discounts to last trade price for lack of marketability or otherwise; market price information regarding other securities; information received from the issuer and/or published documents, including SEC filings and financial statements; and other publicly available information. Pursuant to the above-referenced policies and procedures, Royce may use various techniques in making fair value determinations based upon Level 3 inputs, which techniques may include (without limitation): (i) workout valuation methods (e.g., earnings multiples, discounted cash flows, liquidation values, derivations of book value, firm or probable
2024 Annual Report to Stockholders | 17
Royce Global Trust
Notes to Financial Statements (continued)
VALUATION OF INVESTMENTS (continued):
offers from qualified buyers for the issuer’s ongoing business, etc.); (ii) discount or premium from market, or compilation of other observable market information, for other similar freely traded securities; (iii) conversion from the readily available market price of a security into which an affected security is convertible or exchangeable; and (iv) pricing models or other formulas.
A security that is valued by reference to Level 1 or Level 2 inputs may drop to Level 3 on a particular valuation date for several reasons, including if:
| • | an equity security that is listed on an exchange or Nasdaq, or traded on OTC Market Group Inc.’s OTC Link ATS or other alternative trading system, has not traded and there are no bids; |
| • | Royce does not receive at least two bid side quotes for an Other OTC Equity Security; |
| • | the independent pricing services are unable to supply fair value prices; or |
| • | the Level 1 or Level 2 inputs become otherwise unreliable for any reason (e.g., a significant event occurs after the close of trading for a security but prior to the time the Fund prices its shares). |
The table below shows the aggregate value of the various Level 1, Level 2, and Level 3 securities held by the Fund as of December 31, 2024. Any Level 2 or Level 3 securities held by the Fund are noted in its Schedule of Investments. The inputs or methodology used for valuing securities are not necessarily an indication of the risk associated with owning those securities.
| | LEVEL 1 | LEVEL 2 | LEVEL 3 | TOTAL |
| Common Stocks | $53,800,279 | $28,544,299 | $0 | $82,344,578 |
| Repurchase Agreement | – | 675,392 | – | 675,392 |
REPURCHASE AGREEMENTS:
The Fund may enter into repurchase agreements with institutions that the Fund’s investment adviser has determined are creditworthy. The Fund restricts repurchase agreements to maturities of no more than seven days. Securities pledged as collateral for repurchase agreements, which are held until maturity of the repurchase agreements, are marked-to-market daily and maintained at a value at least equal to the principal amount of the repurchase agreement (including accrued interest). Repurchase agreements could involve certain risks in the event of default or insolvency of the counter-party, including possible delays or restrictions upon the ability of the Fund to dispose of its underlying securities. The remaining contractual maturity of the repurchase agreement held by the Fund as of December 31, 2024, is next business day and continuous.
FOREIGN CURRENCY:
Net realized foreign exchange gains or losses arise from sales and maturities of short-term securities, sales of foreign currencies, expiration of currency forward contracts, currency gains or losses realized between the trade and settlement dates on securities transactions, and the difference between the amounts of dividends, interest, and foreign withholding taxes recorded on the Fund’s books and the U.S. dollar equivalent of the amounts actually received or paid. Net unrealized foreign exchange gains and losses arise from changes in the value of assets and liabilities, other than investments in securities at the end of the reporting period, as a result of changes in foreign currency exchange rates.
The Fund does not isolate that portion of the results of operations resulting from fluctuations in foreign exchange rates on investments from the fluctuations arising from changes in market prices of securities held. Such fluctuations are included with the net realized and unrealized gain or loss on investments.
The Fund invests a significant portion of its assets in foreign companies that may be subject to different risks than investments in securities of U.S. companies, including adverse political, social, economic, or other developments that are unique to a particular country or region. Therefore, the prices of securities of foreign companies in particular countries or regions may, at times, move in a different direction than those of securities of U.S. companies. Because such investments in securities of foreign companies are usually denominated in foreign currencies and the Fund does not intend to hedge its foreign currency exposure, the U.S. dollar value of such investments may be harmed by declines in the value of foreign currencies in relation to the U.S. dollar.
For the purposes of the Statement of Cash Flows, the Fund defines Cash as cash, including foreign currency.
DISTRIBUTIONS AND TAXES:
As a qualified regulated investment company under Subchapter M of the Internal Revenue Code, the Fund is not subject to income taxes to the extent that it distributes substantially all of its taxable income for its fiscal year. The Schedule of Investments includes information regarding income taxes under the caption “Tax Information.”
The Fund pays any dividends and capital gain distributions annually in December. Because federal income tax regulations differ from generally accepted accounting principles, income and capital gain distributions determined in accordance with tax regulations may differ from net investment income and realized gains recognized for financial reporting purposes. Accordingly, the character of distributions and composition of net assets for tax purposes differ from those reflected in the accompanying financial statements.
18 | 2024 Annual Report to Stockholders
Royce Global Trust
Notes to Financial Statements (continued)
CAPITAL GAINS TAXES:
The Fund may be subject to a tax imposed on capital gains on securities of issuers domiciled in certain countries. This amount, if any, is reported as deferred capital gains tax in the accompanying Statement of Assets and Liabilities, assuming those positions were disposed of at the end of the period, and accounted for as a reduction in the market value of the security.
INVESTMENT TRANSACTIONS AND RELATED INVESTMENT INCOME:
Investment transactions are accounted for on the trade date. Dividend income is recorded on the ex-dividend date except for certain dividends from securities where the dividend rate is not available. In such cases, the dividend is recorded as soon as the information is received by the Fund. Non-cash dividend income is recorded at the fair market value of the securities received. Interest income is recorded on an accrual basis. Premiums and discounts on debt securities are amortized using the effective yield-to-maturity method. Realized gains and losses from investment transactions are determined on the basis of identified cost for book and tax purposes.
CASH INCLUDING FOREIGN CURRENCIES:
Cash, including foreign currencies, consists of deposits maintained at State Street Bank and Trust Company, the Fund’s Custodian (in such capacity, the "Custodian"), and through the Custodian’s global sub-custodian network. Accordingly, the Fund’s risk for the possible insolvency loss of a cash deposit lies with the Custodian or the relevant sub-custodian bank. Fund cash deposits maintained at the Custodian or through a particular sub-custodian bank may be significant, and may, at times, exceed U.S. or other applicable insurance limits.
EXPENSES:
The Fund incurs direct and indirect expenses. Expenses directly attributable to the Fund are charged to the Fund, while expenses applicable to more than one of the Royce Funds are allocated equitably. Certain personnel, occupancy costs and other administrative expenses related to all of the Royce Funds are allocated by Royce under an administration agreement and are included in administrative and office facilities and professional fees.
INDEMNIFICATION PROVISIONS:
Reference is made to Maryland law, the Fund’s Articles of Incorporation, as amended and supplemented, and the Fund’s Amended and Restated By-laws, each of which provides for the indemnification by the Fund of the Fund’s officers and directors under the circumstances and to the extent set forth therein. Reference is also made to the investment advisory agreement between the Fund and Royce which provides for the indemnification by the Fund of Royce under the circumstances and to the extent set forth therein. Additionally, in the normal course of business, the Fund enters into contracts with service providers that contain general indemnification provisions in favor of such service providers and other covered persons. The amount of any potential Fund liability under these indemnification arrangements, if any, currently cannot be determined with any degree of specificity. The Fund is not currently in possession of any information that would cause it to believe that the Fund is reasonably likely to be subject to any material adverse impact from the operation of these indemnification arrangements. No assurance can be given, however, that the Fund will not incur any liability from the operation of these indemnification arrangements. Any future liability to the Fund that may arise from the operation of such arrangements will be disclosed to the extent required by relevant accounting guidance and applicable laws, rules, and regulations.
Capital Stock:
The Fund issued 157,790 and 50,902 shares of Common Stock as reinvestment of distributions for the years ended December 31, 2024, and December 31, 2023, respectively.
Borrowings:
The Fund is party to a revolving credit agreement (the “credit agreement”) with BNP Paribas Prime Brokerage International, Limited (BNPPI). The Fund pays a commitment fee of 0.50% per annum on the unused portion of the then-current maximum amount that may be borrowed by the Fund under the credit agreement. The credit agreement has a 179-day rolling term that resets daily. The Fund pledges eligible portfolio securities as collateral and has granted a security interest in such pledged securities to, and in favor of, BNPPI as security for the loan balance outstanding. The amount of eligible portfolio securities required to be pledged as collateral is determined by BNPPI in accordance with the credit agreement. In determining collateral requirements, the value of eligible securities pledged as collateral is subject to discount by BNPPI based upon a variety of factors set forth in the credit agreement. As of December 31, 2024, the market value of eligible securities pledged as collateral exceeded three times the loan balance outstanding.
2024 Annual Report to Stockholders | 19
Royce Global Trust
Notes to Financial Statements (continued)
Borrowings (continued):
If the Fund fails to meet certain requirements, or comply with other financial covenants set forth in the credit agreement, the Fund may be required to repay immediately, in part or in full, the loan balance outstanding under the credit agreement, which may necessitate the sale of portfolio securities at potentially inopportune times. BNPPI may terminate the credit agreement upon certain ratings downgrades of its corporate parent, which would result in the Fund’s entire loan balance becoming immediately due and payable. The occurrence of such ratings downgrades may necessitate the sale of portfolio securities at potentially inopportune times. BNPPI may also terminate the credit agreement upon sixty (60) calendar days’ prior written notice to the Fund in the event the Fund’s net asset value per share as of the close of business on the last business day of any calendar month declines by thirty-five percent (35%) or more from the Fund’s net asset value per share as of the close of business on the last business day of the immediately preceding calendar month.
The credit agreement also permits, subject to certain conditions, BNPPI to rehypothecate portfolio securities pledged by the Fund up to the amount of the loan balance outstanding. The Fund continues to receive payments in lieu of dividends and interest on rehypothecated securities. The Fund also has the right under the credit agreement to recall the rehypothecated securities from BNPPI on demand. If BNPPI fails to deliver the recalled security in a timely manner, the Fund is compensated by BNPPI for any fees or losses related to the failed delivery or, in the event a recalled security is not returned by BNPPI, the Fund, upon notice to BNPPI, may reduce the loan balance outstanding by the value of the recalled security failed to be returned. The Fund receives a portion of the fees earned by BNPPI in connection with the rehypothecation of portfolio securities.
As of December 31, 2024, the Fund had outstanding borrowings of $2,000,000. The Fund has the right to reduce the maximum amount it can borrow under the credit agreement upon one (1) business day’s prior written notice to BNPPI. The maximum amount the Fund may borrow under the credit agreement was reduced to $0 as of January 22, 2025. The Fund and BNPPI may agree to increase the maximum amount the Fund can borrow under the credit agreement, which amount may not exceed $15,000,000.
During the year ended December 31, 2024, the Fund had an average daily loan balance of $3,953,552 at a weighted average borrowing cost of 6.34%. The maximum loan balance outstanding during the year ended December 31, 2024, was $4,000,000. As of December 31, 2024, the aggregate value of rehypothecated securities was $2,066,402. During the year ended December 31, 2024, the Fund earned $20 in fees from rehypothecated securities.
Investment Advisory Agreement:
The investment advisory agreement between Royce and the Fund provides for fees to be paid at an annual rate of 1.00% of the Fund’s average daily net assets, computed daily and payable monthly. For the year ended December 31, 2024, the Fund expensed Royce investment advisory fees totaling $806,996.
Purchases and Sales of Investment Securities:
For the year ended December 31, 2024, the costs of purchases and proceeds from sales of investment securities, other than short-term securities, amounted to $13,405,676, and $15,750,666, respectively.
Cross trades were executed by the Fund pursuant to Rule 17a-7 under the 1940 Act. Cross trading is the buying or selling of portfolio securities between funds to which Royce or an affiliate of Franklin Resources, Inc. serves as investment adviser. The Fund’s Chief Compliance Officer reviews such transactions each quarter for compliance with the requirements and restrictions set forth by Rule 17a-7, and reports the results of that review to the Board of Directors. Cross trades for the year ended December 31, 2024, were as follows:
| COSTS OF PURCHASES | PROCEEDS FROM SALES | REALIZED GAIN (LOSS) |
| $322,753 | $ – | $ – |
Tax Information:
Distributions during the years ended December 31, 2024 and 2023, were characterized as follows for tax purposes:
| ORDINARY INCOME | LONG-TERM CAPITAL GAINS |
| 2024 | 2023 | 2024 | 2023 |
| $2,989,773 | $456,300 | $ – | $490,248 |
The tax basis components of distributable earnings as of December 31, 2024, were as follows:
UNDISTRIBUTED
ORDINARY INCOME | UNDISTRIBUTED LONG-TERM
CAPITAL GAINS OR
(CAPITAL LOSS CARRYFORWARD) | NET UNREALIZED
APPRECIATION
(DEPRECIATION)1 | QUALIFIED LATE YEAR
ORDINARY AND
POST-OCTOBER LOSS
DEFERRALS2 | TOTAL
DISTRIBUTABLE
EARNINGS |
| $270,786 | $(902,805) | $24,597,507 | $ – | $23,965,488 |
| 1 | Includes timing differences on foreign currency, recognition of losses on securities sold, underlying investments and mark-to-market of Passive Foreign Investment Companies. |
| 2 | Under the current tax law, capital losses and qualified late year ordinary losses incurred after October 31 may be deferred and treated as occurring on the first day of the following fiscal year. |
20 | 2024 Annual Report to Stockholders
Royce Global Trust
Notes to Financial Statements (continued)
Tax Information: (continued):
For financial reporting purposes, capital accounts and distributions to stockholders are adjusted to reflect the tax character of permanent book/tax differences. For the year ended December 31, 2024, the Fund recorded the following permanent reclassifications, which relates to excise taxes paid. Results of operations and net assets were not affected by these reclassifications.
| TOTAL DISTRIBUTABLE EARNINGS (LOSS) | PAID-IN CAPITAL |
| $4,038 | $(4,038) |
Management has analyzed the Fund’s tax positions taken on federal income tax returns for all open tax years (2021-2024) and has concluded that as of December 31, 2024, no provision for income tax is required in the Fund’s financial statements.
Commitments/Contingencies:
On June 29, 2023, an action was filed against the Fund and numerous unrelated funds in Saba Capital Master Funds., Ltd., et al. v. Clearbridge Energy Midstream Opportunity Fund, Inc., et al., No. 1:23-cv-05568 (S.D.N.Y.) that sought rescission of the defendants’ election to opt into the provisions of the Maryland Control Share Acquisition Act (the “MCSAA”). On January 4, 2024, the U.S. District Court for the Southern District of New York issued an opinion and order that, among other things, declared that the resolutions opting into the MCSAA violate a provision of the Investment Company Act of 1940 and ordered that those resolutions “be rescinded forthwith.”
Following an appeal by the Fund and the other remaining defendants, the district court’s judgment was affirmed in full by the United States Court of Appeals for the Second Circuit on June 26, 2024. On or about September 24, 2024, the Fund and certain defendants filed a petition with the U.S. Supreme Court for a writ of certiorari to review the judgment of the Second Circuit. The ultimate outcome of such petition is unknown.
The Fund incurred $855,838 in legal fees and expenses in 2024 in connection with this action. The Fund was reimbursed $831,539 and expects to be reimbursed the remaining $24,299 in 2025 under its insurance policy. The deductible amount for this action under the Fund’s insurance policy is $500,000 and was met by the Fund in 2023. Any additional amounts incurred for legal fees and expenses for this action are also expected to be reimbursed to the Fund by the insurer.
Segment Reporting:
The Fund has adopted the Financial Accounting Standards Board (FASB) Accounting Standards Update (ASU) 2023-07, Segment Reporting (Topic 280) - Improvements to Segment Reporting Disclosures (the “Update”). The Update is limited to disclosure requirements and does not impact the Fund’s financial position or results of operations.
The Fund operates as a single operating segment, which is a segregated investment portfolio. Royce, in its capacity as investment manager, functions as the Chief Operating Decision Maker (CODM) for the Fund for purposes of the Update, evaluating its results and performance based upon its specific investment strategy and other relevant facts and circumstances. The CODM uses these measures to assess Fund performance and allocate resources effectively, subject to compliance with applicable legal and regulatory requirements and oversight from its Board of Directors. Internal reporting provided to the CODM aligns with the accounting policies and measurement principles used in the financial statements.
For information regarding segment assets, segment profit or loss, and significant expenses, refer to the Statement of Assets and Liabilities and the Statement of Operations, along with the related notes to the financial statements. The Schedule of Investments provides details of the Fund’s investments that generate returns such as interest, dividends, and realized and unrealized gains or losses. Performance metrics, including portfolio turnover and expense ratios, are disclosed in the Financial Highlights.
Subsequent Events:
Subsequent events have been evaluated through the date the financial statements were issued and it has been determined that no events have occurred that require disclosure, other than as disclosed within.
2024 Annual Report to Stockholders | 21
Report of Independent Registered Public Accounting Firm
To the Board of Directors and Stockholders of Royce Global Trust, Inc.:
Opinion on the Financial Statements
We have audited the accompanying statement of assets and liabilities, including the schedule of investments, of Royce Global Trust, Inc. (the "Fund") as of December 31, 2024, the related statements of operations and cash flows for the year ended December 31, 2024, the statement of changes in net assets for each of the two years in the period ended December 31, 2024, including the related notes, and the financial highlights for each of the five years in the period ended December 31, 2024 (collectively referred to as the “financial statements”). In our opinion, the financial statements present fairly, in all material respects, the financial position of the Fund as of December 31, 2024, the results of its operations and its cash flows for the year then ended, the changes in its net assets for each of the two years in the period ended December 31, 2024 and the financial highlights for each of the five years in the period ended December 31, 2024 in conformity with accounting principles generally accepted in the United States of America.
Basis for Opinion
These financial statements are the responsibility of the Fund’s management. Our responsibility is to express an opinion on the Fund’s financial statements based on our audits. We are a public accounting firm registered with the Public Company Accounting Oversight Board (United States) (PCAOB) and are required to be independent with respect to the Fund in accordance with the U.S. federal securities laws and the applicable rules and regulations of the Securities and Exchange Commission and the PCAOB.
We conducted our audits of these financial statements in accordance with the standards of the PCAOB. Those standards require that we plan and perform the audit to obtain reasonable assurance about whether the financial statements are free of material misstatement, whether due to error or fraud.
Our audits included performing procedures to assess the risks of material misstatement of the financial statements, whether due to error or fraud, and performing procedures that respond to those risks. Such procedures included examining, on a test basis, evidence regarding the amounts and disclosures in the financial statements. Our audits also included evaluating the accounting principles used and significant estimates made by management, as well as evaluating the overall presentation of the financial statements. Our procedures included confirmation of securities owned as of December 31, 2024 by correspondence with the custodian and brokers; when replies were not received from brokers, we performed other auditing procedures. We believe that our audits provide a reasonable basis for our opinion.
/s/PricewaterhouseCoopers LLP
New York, New York
February 21, 2025
We have served as the auditor of one or more investment companies in the Franklin Templeton Group of Funds since 1948.
22 | 2024 Annual Report to Stockholders
This page is intentionally left blank.
2024 Annual Report to Stockholders | 23
MANAGERS’ DISCUSSION (UNAUDITED)
Royce Micro-Cap Trust (RMT)

Jim Stoeffel, Andrew Palen
FUND PERFORMANCE
Royce Micro-Cap Trust (RMT) advanced 13.5% on an NAV (net asset value) basis and 14.2% based on its market price in 2024 versus a gain of 11.5% for its benchmark, the small-cap Russell 2000 Index, and an increase of 13.7% for its benchmark, the Russell Microcap Index, for the same period. RMT also beat the Russell 2000 on both an NAV and market price basis for the 3-, 5-, 10-, 15-, 25-, 30-year, and since inception (12/14/93) periods ended 12/31/24.
WHAT WORKED… AND WHAT DIDN’T
Nine of the portfolio’s 11 equity sectors contributed to calendar-year performance, led by Industrials, Information Technology, and Financials. The only negative impacts came from Utilities and Real Estate, while Materials made the smallest positive impact. At the industry level, construction & engineering (Industrials), capital markets (Financials), and electronic equipment, instruments & components (Information Technology) contributed most in 2024, while specialty retail (Consumer Discretionary), trading companies & distributors and professional services (both in Industrials), detracted the most.
The Fund’s top contributing position was IES Holdings, which provides critical infrastructure and electrical services to several end markets. IES’s thoughtful consolidation strategy focused on accretive acquisitions that management can leverage across its existing infrastructure efforts has led to an almost fourfold increase in EBITDA over the past couple of years. Cellebrite DI offers digital intelligence solutions for law enforcement, governments, and the enterprise market. The company reported strong 3Q24 results in November when it also announced a new partnership with Amazon Web Services and a patent for Remote Mobile Collection, which equips corporate investigators with immediate, targeted remote data collection. PAR Technology is a leader in enterprise restaurant technology, offering a best-in-class product suite that generates revenue streams diversified across several platforms including Subscription Services, Guest Engagement, Operator Solutions, Back-Office Solutions, Hardware, and Professional Services. The enterprise end-market among restaurant customers is increasingly moving away from complex point solutions and/or costly internally developed technology, a move that benefits PAR’s broad and integrated cloud platforms. In 2024, the company showcased remarkable sales momentum with both new brand and location wins, as well as expansion with existing customers, most notably, Burger King and Wendy’s.
| | | | | | | |
| | Top Contributors to Performance | | Top Detractors from Performance | |
| | For 2024 (%)1 | | | For 2024 (%)2 | | |
| | IES Holdings | 1.74 | | Quanterix Corporation | -0.66 | |
| | Cellebrite DI | 1.44 | | Luna Innovations | -0.61 | |
| | PAR Technology | 1.28 | | Forrester Research | -0.45 | |
| | Applied Optoelectronics | 1.05 | | AutoCanada | -0.42 | |
| | Universal Technical Institute | 0.89 | | Arcturus Therapeutics Holdings | -0.40 | |
| | 1 Includes dividends | | | 2 Net of dividends | | |
| | | | | | | |
RMT’s biggest detractor at the position level was Quanterix Corporation, which offers a digital immunoassay platform for research and in-vitro diagnostics. Its shares fell sharply in March due to the FDA’s concerns about another company’s similar technology. Second-quarter results released in August showed net losses and revised guidance. Both of these developments influenced our decision to exit the position. Luna Innovations provides advanced optical technology for test and measurement applications. The company ran into accounting issues that kept it from filing financial statements, resulting in being delisted from Nasdaq (and now trading on the OTC Market). While disappointed, we maintained a small position as we believe its products have immense technological value. Forrester Research is a subscription-based information technology research company geared toward helping businesses maximize the use of emerging technologies. Declines in IT spending during 2023, as well as Forrester’s ongoing change to its go-to-market strategy, which includes culling smaller clients and retraining its existing sales force, weighed on contract value and sales growth in 2024. Although the pace of progress is testing investor patience, we acted in a contrarian fashion by adding shares in 2024.
The Fund’s advantage over the Russell 2000 in 2024 came from both sector allocation decisions and stock selection. At the sector level, stock selection and, to a lesser extent, our higher weighting in Industrials, stock selection in Communication Services, and both stock selection and our lower exposure to Health Care did most to boost relative performance. Conversely, stock selection and a lower exposure to Financials, a higher weighting and stock selection in Materials, and our lower exposure to Consumer Staples (where our stock selection was additive) hurt relative results the most.
CURRENT POSITIONING AND OUTLOOK
With the election over, we have more clarity on the outlook for fiscal and regulatory policies, which we view as generally positive for equities. We continue to see a significant opportunity set associated with broad macroeconomic trends. We believe the reindustrialization of the U.S. economy and the rapid adoption of AI are providing investment opportunities across the micro-cap universe and inform our overweight positions in Industrials and Information Technology. These opportunities often arise in tangential areas such as the significant increase in power demand associated with AI data centers. These trends fit well with our U.S.-centric microcap universe. Of course, there remain numerous areas of potential volatility outside our control. First among these is the pace of future interest rate cuts, but the outside geopolitical world also remains highly volatile. As always, we will seek to use these periods of volatility to our advantage.
24 | 2024 Annual Report to Stockholders
| PERFORMANCE AND PORTFOLIO REVIEW (UNAUDITED) | SYMBOLS MARKET PRICE RMT NAV XOTCX |
Performance
Average Annual Total Return (%) Through 12/31/24
| | | | | | | | | | SINCE INCEPTION |
| | JUL-DEC 20241 | 1-YR | 3-YR | 5-YR | 10-YR | 15-YR | 20-YR | 25-YR 30-YR | (12/14/93) |
| RMT (NAV) | 8.28 | 13.47 | 3.23 | 11.86 | 9.16 | 11.33 | 8.65 | 10.24 10.94 | 10.74 |
| 1 Not Annualized | | | | | | | | | |
Market Price Performance History Since Inception (12/14/93)
Cumulative Performance of Investment through 12/31/241
| | 1-YR | 5-YR | 10-YR | 15-YR | 20-YR | SINCE INCEPTION (12/14/93) |
| RMT | 14.2% | 75.4% | 139.9% | 436.4% | 339.3% | 1948.8% |
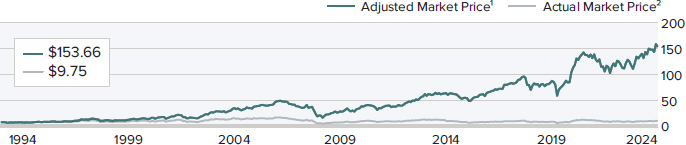
| 1 | Reflects the cumulative performance experience of a continuous common stockholder who purchased one share at inception ($7.50 IPO), reinvested all distributions and fully participated in the primary subscription of the Fund’s 1994 rights offering. |
| 2 | Reflects the actual month-end market price movement of one share as it has traded on NYSE and, prior to 12/1/03, on the Nasdaq. |
Morningstar Style Map™ As of 12/31/24
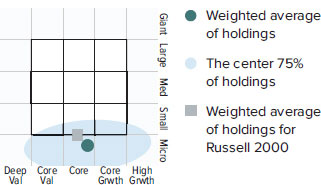
The Morningstar Style Map is the Morningstar Style Box™ with the center 75% of fund holdings plotted as the Morningstar Ownership Zone™. The Morningstar Style Box is designed to reveal a fund’s investment strategy. The Morningstar Ownership Zone provides detail about a portfolio’s investment style by showing the range of stock sizes and styles. The Ownership Zone is derived by plotting each stock in the portfolio within the proprietary Morningstar Style Box. Over time, the shape and location of a fund’s ownership zone may vary. See page 65 for additional information.
Value of $10,000
Invested on 6/30/2000 (Russell Microcap Inception) as of 12/31/24 ($)

Top 10 Positions
% of Net Assets
| Transcat | 1.7 |
| Richardson Electronics | 1.7 |
| Universal Technical Institute | 1.6 |
| Sprott | 1.5 |
| Mesa Laboratories | 1.4 |
| PAR Technology | 1.4 |
| BioLife Solutions | 1.3 |
| nLIGHT | 1.2 |
| Graham Corporation | 1.2 |
| Major Drilling Group International | 1.2 |
Portfolio Sector Breakdown
% of Net Assets
| Information Technology | 23.9 |
| Industrials | 22.4 |
| Financials | 16.3 |
| Health Care | 12.5 |
| Consumer Discretionary | 6.5 |
| Materials | 5.6 |
| Energy | 4.6 |
| Communication Services | 3.6 |
| Real Estate | 1.3 |
| Consumer Staples | 1.1 |
| Utilities | 0.2 |
| Cash and Cash Equivalents, Net of | |
| Outstanding Line of Credit | 2.0 |
| Calendar Year Total Returns (%) | |
| YEAR | RMT |
| 2024 | 13.5 |
| 2023 | 16.6 |
| 2022 | -16.9 |
| 2021 | 19.2 |
| 2020 | 33.6 |
| 2019 | 22.4 |
| 2018 | -11.6 |
| 2017 | 17.7 |
| 2016 | 22.0 |
| 2015 | -11.7 |
| 2014 | 3.5 |
| 2013 | 44.5 |
| 2012 | 17.3 |
| 2011 | -7.7 |
| 2010 | 28.5 |
| | |
| | |
| Portfolio Diagnostics | |
| Fund Net Assets | $567 million |
| Number of Holdings | 192 |
| Turnover Rate | 53% |
| Net Asset Value | $10.98 |
| Market Price | $9.75 |
| Average Market Capitalization 1 | $769 million |
| Weighted Average P/B Ratio 2 | 2.1x |
| Active Share 3 | 96% |
| U.S. Investments (% of Net Assets) | 79.6% |
| Non-U.S. Investments (% of Net Assets) | 18.4% |
| 1 | Geometric Average. This weighted calculation uses each portfolio holding’s market cap in a way designed to not skew the effect of very large or small holdings; instead, it aims to better identify the portfolio’s center, which Royce believes offers a more accurate measure of average market cap than a simple mean or median. |
| 2 | Harmonic Average. This weighted calculation evaluates a portfolio as if it were a single stock and measures it overall. It compares the total market value of the portfolio to the portfolio’s share in the earnings or book value, as the case may be, of its underlying stocks. |
| 3 | Active Share is the sum of the absolute values of the different weightings of each holding in the Fund versus each holding in the benchmark, divided by two. |
Important Performance and Risk Information
All performance information reflects past performance, is presented on a total return basis, net of the Fund’s investment advisory fee, reflects the reinvestment of distributions and does not reflect the deduction of taxes that a shareholder would pay on fund distributions or the sale of fund shares. Past performance is no guarantee of future results. Current month-end performance may be higher or lower than performance quoted and may be obtained at www.royceinvest.com. The market price of the Fund’s shares will fluctuate, so that shares may be worth more or less than their original cost when sold. The Fund normally invests in micro-cap companies, which may involve considerably more risk than investments in securities of larger-cap companies. The Fund’s broadly diversified portfolio does not ensure a profit or guarantee against loss. From time to time, the Fund may invest a significant portion of its net assets in foreign securities, which may involve political, economic, currency and other risks not encountered in U.S. investments. Regarding the “Top Contributors” and “Top Detractors” tables shown above, the sum of all contributors to, and all detractors from, performance for all securities in the portfolio would approximate the Fund’s year-to-date performance for 2024.
2024 Annual Report to Stockholders | 25
Royce Micro-Cap Trust
Schedule of Investments
Common Stocks — 97.4%
| | | SHARES | | | VALUE |
| | | | | | |
| COMMUNICATION SERVICES – 3.6% | | | | | | | |
| ENTERTAINMENT - 1.1% | | | | | | | |
| IMAX Corporation 1 | | | 234,902 | | | $ | 6,013,491 |
| INTERACTIVE MEDIA & SERVICES - 1.7% | | | | | | | |
| QuinStreet 1 | | | 216,363 | | | | 4,991,494 |
| † Vimeo 1 | | | 362,945 | | | | 2,322,848 |
| ZipRecruiter Cl. A 1 | | | 357,057 | | | | 2,585,093 |
| | | | | | | | 9,899,435 |
| MEDIA - 0.8% | | | | | | | |
| Magnite 1 | | | 298,173 | | | | 4,746,914 |
| Total (Cost $11,713,679) | | | | | | | 20,659,840 |
| | | | | | | | |
| CONSUMER DISCRETIONARY – 6.5% | | | | | | | |
| AUTOMOBILE COMPONENTS - 0.1% | | | | | | | |
| Stoneridge 1,2 | | | 111,200 | | | | 697,224 |
| DIVERSIFIED CONSUMER SERVICES - 2.1% | | | | | | | |
| † Legacy Education 1 | | | 334,657 | | | | 2,784,346 |
| Universal Technical Institute 1 | | | 355,500 | | | | 9,139,905 |
| | | | | | | | 11,924,251 |
| HOTELS, RESTAURANTS & LEISURE - 1.7% | | | | | | | |
| Century Casinos 1 | | | 322,500 | | | | 1,044,900 |
| † Denny’s Corporation 1 | | | 214,887 | | | | 1,300,066 |
| Lindblad Expeditions Holdings 1,2 | | | 493,431 | | | | 5,852,092 |
| Nathan’s Famous | | | 15,028 | | | | 1,181,351 |
| | | | | | | | 9,378,409 |
| HOUSEHOLD DURABLES - 1.1% | | | | | | | |
| Cavco Industries 1,2,3 | | | 6,210 | | | | 2,771,089 |
| Legacy Housing 1 | | | 151,597 | | | | 3,741,414 |
| | | | | | | | 6,512,503 |
| LEISURE PRODUCTS - 0.4% | | | | | | | |
| † American Outdoor Brands 1 | | | 161,751 | | | | 2,465,085 |
| SPECIALTY RETAIL - 0.9% | | | | | | | |
| Beyond 1 | | | 240,000 | | | | 1,183,200 |
| OneWater Marine Cl. A 1 | | | 35,000 | | | | 608,300 |
| † RealReal 1 | | | 105,183 | | | | 1,149,650 |
| Shoe Carnival 2 | | | 57,963 | | | | 1,917,416 |
| | | | | | | | 4,858,566 |
| TEXTILES, APPAREL & LUXURY GOODS - 0.2% | | | | | | | |
| † Lakeland Industries | | | 24,856 | | | | 635,071 |
| † Vera Bradley 1 | | | 130,000 | | | | 510,900 |
| | | | | | | | 1,145,971 |
| Total (Cost $24,110,343) | | | | | | | 36,982,009 |
| | | | | | | | |
| CONSUMER STAPLES – 1.1% | | | | | | | |
| FOOD PRODUCTS - 1.1% | | | | | | | |
| CubicFarm Systems 1,4 | | | 40,000 | | | | 6,400 |
| J G Boswell Company 5 | | | 1,539 | | | | 840,294 |
| Seneca Foods Cl. A 1 | | | 64,703 | | | | 5,128,360 |
| Total (Cost $5,236,441) | | | | | | | 5,975,054 |
| | | | | | | | |
| ENERGY – 4.6% | | | | | | | |
| ENERGY EQUIPMENT & SERVICES - 2.9% | | | | | | | |
| Bristow Group 1,2,3 | | | 145,901 | | | | 5,004,405 |
| NPK International 1 | | | 627,090 | | | | 4,809,780 |
| Pason Systems | | | 436,588 | | | | 4,133,683 |
| † Select Water Solutions Cl. A | | | 188,683 | | | | 2,498,163 |
| | | | | | | | 16,446,031 |
| OIL, GAS & CONSUMABLE FUELS - 1.7% | | | | | | | |
| Dorchester Minerals L.P. | | | 76,981 | | | | 2,565,777 |
| Navigator Holdings | | | 157,581 | | | | 2,418,868 |
| † Riley Exploration Permian | | | 83,633 | | | | 2,669,565 |
| † SandRidge Energy | | | 171,169 | | | | 2,004,389 |
| | | | | | | | 9,658,599 |
| Total (Cost $22,729,385) | | | | | | | 26,104,630 |
| | | | | | | | |
| FINANCIALS – 15.7% | | | | | | | |
| BANKS - 4.0% | | | | | | | |
| † Chain Bridge Bancorp Cl. A 1 | | | 67,500 | | | | 1,692,225 |
| Chemung Financial 2 | | | 31,000 | | | | 1,513,110 |
| Citizens Bancshares 5 | | | 22,699 | | | | 1,161,054 |
| † Coastal Financial 1 | | | 31,511 | | | | 2,675,599 |
| † First Foundation | | | 189,666 | | | | 1,177,826 |
| First National Bank Alaska 5 | | | 5,712 | | | | 1,330,896 |
| HBT Financial | | | 101,554 | | | | 2,224,032 |
| † Hingham Institution for Savings | | | 7,867 | | | | 1,999,319 |
| † Katahdin Bankshares 5 | | | 22,425 | | | | 555,019 |
| Midway Investments 1,4 | | | 735,647 | | | | 0 |
| † Northeast Bank | | | 26,085 | | | | 2,392,777 |
| OP Bancorp | | | 94,500 | | | | 1,494,045 |
| United Bancorporation of Alabama 5 | | | 21,055 | | | | 1,185,396 |
| † Unity Bancorp | | | 34,188 | | | | 1,490,939 |
| Virginia National Bankshares 2 | | | 51,718 | | | | 1,975,628 |
| | | | | | | | 22,867,865 |
| CAPITAL MARKETS - 7.6% | | | | | | | |
| Bolsa Mexicana de Valores | | | 918,000 | | | | 1,474,453 |
| Canaccord Genuity Group | | | 621,067 | | | | 4,368,143 |
| Donnelley Financial Solutions 1,2 | | | 11,923 | | | | 747,930 |
| Open Lending 1 | | | 527,035 | | | | 3,146,399 |
| † Oppenheimer Holdings Cl. A | | | 21,039 | | | | 1,348,390 |
| OTC Markets Group 5 | | | 63,527 | | | | 3,249,406 |
| Perella Weinberg Partners Cl. A | | | 140,676 | | | | 3,353,716 |
| Silvercrest Asset Management Group Cl. A 2 | | | 305,264 | | | | 5,613,805 |
| Sprott | | | 206,485 | | | | 8,700,683 |
| StoneX Group 1,2 | | | 45,997 | | | | 4,506,326 |
| Tel Aviv Stock Exchange 5 | | | 333,000 | | | | 3,862,206 |
| Value Line | | | 18,570 | | | | 980,496 |
| Westaim Corporation (The) 1 | | | 500,000 | | | | 1,798,323 |
| | | | | | | | 43,150,276 |
| CONSUMER FINANCE - 1.1% | | | | | | | |
| EZCORP Cl. A 1,2,3 | | | 516,176 | | | | 6,307,671 |
| FINANCIAL SERVICES - 2.6% | | | | | | | |
| Acacia Research 1,2,3 | | | 399,140 | | | | 1,732,268 |
| Cass Information Systems | | | 45,858 | | | | 1,876,051 |
| ECN Capital | | | 741,225 | | | | 1,629,463 |
| International Money Express 1 | | | 121,598 | | | | 2,532,886 |
| NewtekOne | | | 109,917 | | | | 1,403,640 |
| Repay Holdings Cl. A 1 | | | 749,404 | | | | 5,717,952 |
| | | | | | | | 14,892,260 |
| INSURANCE - 0.4% | | | | | | | |
| † International General Insurance Holdings | | | 82,206 | | | | 1,953,214 |
| Total (Cost $74,413,894) | | | | | | | 89,171,286 |
| | | | | | | | |
| HEALTH CARE – 12.5% | | | | | | | |
| BIOTECHNOLOGY - 1.4% | | | | | | | |
| Absci Corporation 1 | | | 882,096 | | | | 2,311,092 |
| † ARS Pharmaceuticals 1 | | | 235,018 | | | | 2,479,440 |
| CareDx 1 | | | 100,000 | | | | 2,141,000 |
| 26 | 2024 Annual Report to Stockholders | THE ACCOMPANYING NOTES ARE AN INTEGRAL PART OF THESE FINANCIAL STATEMENTS |
December 31, 2024
Schedule of Investments (continued)
| | | SHARES | | | VALUE |
| | | | | | |
| HEALTH CARE (continued) | | | | | | | |
| BIOTECHNOLOGY (continued) | | | | | | | |
| MeiraGTx Holdings 1 | | | 137,025 | | | $ | 834,482 |
| | | | | | | | 7,766,014 |
| HEALTH CARE EQUIPMENT & SUPPLIES - 3.4% | | | | | | | |
| † Alphatec Holdings 1 | | | 408,149 | | | | 3,746,808 |
| Artivion 1 | | | 60,200 | | | | 1,721,118 |
| Establishment Labs Holdings 1 | | | 62,159 | | | | 2,863,665 |
| Inogen 1 | | | 311,199 | | | | 2,853,695 |
| Profound Medical 1 | | | 427,971 | | | | 3,215,476 |
| UFP Technologies 1,2 | | | 8,949 | | | | 2,188,120 |
| Utah Medical Products | | | 40,946 | | | | 2,516,951 |
| | | | | | | | 19,105,833 |
| HEALTH CARE PROVIDERS & SERVICES - 1.5% | | | | | | | |
| † AMN Healthcare Services 1 | | | 101,304 | | | | 2,423,192 |
| Cross Country Healthcare 1,2 | | | 194,552 | | | | 3,533,064 |
| † GeneDx Holdings Cl. A 1 | | | 31,567 | | | | 2,426,239 |
| | | | | | | | 8,382,495 |
| HEALTH CARE TECHNOLOGY - 0.9% | | | | | | | |
| Simulations Plus 2 | | | 182,065 | | | | 5,077,793 |
| LIFE SCIENCES TOOLS & SERVICES - 5.3% | | | | | | | |
| BioLife Solutions 1 | | | 281,861 | | | | 7,317,112 |
| Cytek Biosciences 1 | | | 460,279 | | | | 2,987,211 |
| Harvard Bioscience 1 | | | 872,055 | | | | 1,840,036 |
| † Maravai LifeSciences Holdings Cl. A 1 | | | 330,000 | | | | 1,798,500 |
| MaxCyte 1 | | | 799,873 | | | | 3,327,472 |
| Mesa Laboratories 2 | | | 60,183 | | | | 7,936,332 |
| OmniAb 1 | | | 707,080 | | | | 2,503,063 |
| † Standard BioTools 1 | | | 1,455,503 | | | | 2,547,130 |
| | | | | | | | 30,256,856 |
| Total (Cost $63,268,230) | | | | | | | 70,588,991 |
| | | | | | | | |
| INDUSTRIALS – 22.4% | | | | | | | |
| AEROSPACE & DEFENSE - 1.6% | | | | | | | |
| Astronics Corporation 1 | | | 183,019 | | | | 2,920,983 |
| CPI Aerostructures 1 | | | 189,700 | | | | 768,285 |
| Park Aerospace | | | 352,276 | | | | 5,160,844 |
| | | | | | | | 8,850,112 |
| AIR FREIGHT & LOGISTICS - 0.6% | | | | | | | |
| † Radiant Logistics 1 | | | 479,652 | | | | 3,213,668 |
| BUILDING PRODUCTS - 0.2% | | | | | | | |
| Quanex Building Products | | | 52,176 | | | | 1,264,746 |
| COMMERCIAL SERVICES & SUPPLIES - 3.2% | | | | | | | |
| Acme United | | | 60,952 | | | | 2,275,338 |
| CECO Environmental 1 | | | 153,185 | | | | 4,630,783 |
| Civeo Corporation | | | 75,000 | | | | 1,704,000 |
| Liquidity Services 1 | | | 109,500 | | | | 3,535,755 |
| Montrose Environmental Group 1 | | | 141,809 | | | | 2,630,557 |
| VSE Corporation | | | 33,140 | | | | 3,151,614 |
| | | | | | | | 17,928,047 |
| CONSTRUCTION & ENGINEERING - 3.2% | | | | | | | |
| † Argan | | | 27,507 | | | | 3,769,559 |
| † Bowman Consulting Group 1 | | | 65,961 | | | | 1,645,727 |
| IES Holdings 1,2 | | | 22,700 | | | | 4,561,792 |
| Limbach Holdings 1 | | | 46,871 | | | | 4,009,345 |
| Matrix Service 1,2 | | | 56,915 | | | | 681,273 |
| Northwest Pipe 1,2 | | | 68,789 | | | | 3,319,757 |
| | | | | | | | 17,987,453 |
| ELECTRICAL EQUIPMENT - 2.9% | | | | | | | |
| American Superconductor 1 | | | 184,553 | | | | 4,545,540 |
| Hammond Power Solutions Cl. A | | | 35,719 | | | | 3,181,897 |
| LSI Industries | | | 199,970 | | | | 3,883,418 |
| Powell Industries | | | 11,396 | | | | 2,525,923 |
| Preformed Line Products | | | 20,087 | | | | 2,566,918 |
| | | | | | | | 16,703,696 |
| GROUND TRANSPORTATION - 1.4% | | | | | | | |
| Covenant Logistics Group Cl. A | | | 59,985 | | | | 3,269,782 |
| FTAI Infrastructure | | | 177,089 | | | | 1,285,666 |
| Universal Logistics Holdings 2 | | | 70,240 | | | | 3,226,826 |
| | | | | | | | 7,782,274 |
| MACHINERY - 3.6% | | | | | | | |
| Graham Corporation 1 | | | 149,850 | | | | 6,663,829 |
| Hurco Companies 2 | | | 51,954 | | | | 1,002,193 |
| L B Foster Company 1,2 | | | 95,300 | | | | 2,563,570 |
| Lindsay Corporation 2 | | | 48,879 | | | | 5,782,874 |
| Luxfer Holdings 2 | | | 204,200 | | | | 2,672,978 |
| Shyft Group (The) | | | 170,121 | | | | 1,997,221 |
| | | | | | | | 20,682,665 |
| MARINE TRANSPORTATION - 0.4% | | | | | | | |
| Clarkson 5 | | | 52,700 | | | | 2,604,142 |
| PROFESSIONAL SERVICES - 1.6% | | | | | | | |
| † Asure Software 1 | | | 96,673 | | | | 909,693 |
| Forrester Research 1,2 | | | 225,449 | | | | 3,532,786 |
| Heidrick & Struggles International | | | 37,232 | | | | 1,649,750 |
| Resources Connection | | | 253,095 | | | | 2,158,900 |
| TrueBlue 1 | | | 95,000 | | | | 798,000 |
| † TTEC Holdings 1 | | | 14,020 | | | | 69,960 |
| | | | | | | | 9,119,089 |
| TRADING COMPANIES & DISTRIBUTORS - 3.7% | | | | | | | |
| † Alta Equipment Group | | | 150,270 | | | | 982,766 |
| Distribution Solutions Group 1 | | | 151,857 | | | | 5,223,881 |
| EVI Industries 2 | | | 233,157 | | | | 3,812,117 |
| † Teqnion 1,5 | | | 58,178 | | | | 869,117 |
| Titan Machinery 1 | | | 42,286 | | | | 597,501 |
| Transcat 1,2 | | | 90,670 | | | | 9,587,446 |
| | | | | | | | 21,072,828 |
| Total (Cost $97,661,164) | | | | | | | 127,208,720 |
| | | | | | | | |
| INFORMATION TECHNOLOGY – 23.9% | | | | | | | |
| COMMUNICATIONS EQUIPMENT - 2.5% | | | | | | | |
| ADTRAN Holdings 1 | | | 79,916 | | | | 665,700 |
| Applied Optoelectronics 1 | | | 164,180 | | | | 6,051,675 |
| Clearfield 1,2 | | | 143,278 | | | | 4,441,618 |
| Digi International 1,2 | | | 70,000 | | | | 2,116,100 |
| Harmonic 1 | | | 68,206 | | | | 902,365 |
| | | | | | | | 14,177,458 |
| ELECTRONIC EQUIPMENT, INSTRUMENTS & COMPONENTS - 8.3% | | | | | | | |
| Bel Fuse Cl. A | | | 18,805 | | | | 1,693,954 |
| † Bel Fuse Cl. B | | | 43,953 | | | | 3,624,804 |
| † Climb Global Solutions | | | 25,675 | | | | 3,254,306 |
| FARO Technologies 1,2,3 | | | 170,546 | | | | 4,325,047 |
| Luna Innovations 1 | | | 752,876 | | | | 1,626,212 |
| nLIGHT 1,2 | | | 657,176 | | | | 6,893,776 |
| PAR Technology 1,2 | | | 106,593 | | | | 7,746,113 |
| Powerfleet 1 | | | 966,159 | | | | 6,434,619 |
| Richardson Electronics | | | 667,688 | | | | 9,367,663 |
| Vishay Precision Group 1,2 | | | 86,931 | | | | 2,040,271 |
| | | | | | | | 47,006,765 |
| THE ACCOMPANYING NOTES ARE AN INTEGRAL PART OF THESE FINANCIAL STATEMENTS | 2024 Annual Report to Stockholders | 27 |
Royce Micro-Cap Trust
Schedule of Investments (continued)
| | | SHARES | | | VALUE |
| | | | | | |
| INFORMATION TECHNOLOGY (continued) | | | | | | | |
| IT SERVICES - 0.5% | | | | | | | |
| Hackett Group (The) 2 | | | 85,788 | | | $ | 2,635,407 |
| SEMICONDUCTORS & SEMICONDUCTOR EQUIPMENT - 7.5% | | | | | | | |
| Alpha & Omega Semiconductor 1,2 | | | 27,940 | | | | 1,034,618 |
| Amtech Systems 1,2 | | | 92,184 | | | | 502,403 |
| Camtek | | | 66,775 | | | | 5,393,417 |
| Cohu 1,2 | | | 178,322 | | | | 4,761,197 |
| Ichor Holdings 1 | | | 182,240 | | | | 5,871,773 |
| inTEST Corporation 1 | | | 236,739 | | | | 2,033,588 |
| Kopin Corporation 1 | | | 610,000 | | | | 829,600 |
| Nova 1,2 | | | 31,500 | | | | 6,203,925 |
| NVE Corporation 2 | | | 40,500 | | | | 3,297,915 |
| Onto Innovation 1,2,3 | | | 27,766 | | | | 4,627,759 |
| † Penguin Solutions 1 | | | 100,214 | | | | 1,923,107 |
| Photronics 1 | | | 140,815 | | | | 3,317,601 |
| Ultra Clean Holdings 1,2 | | | 81,000 | | | | 2,911,950 |
| | | | | | | | 42,708,853 |
| SOFTWARE - 4.3% | | | | | | | |
| Alkami Technology 1 | | | 100,156 | | | | 3,673,722 |
| Cellebrite DI 1 | | | 257,291 | | | | 5,668,121 |
| Computer Modelling Group | | | 801,796 | | | | 5,940,469 |
| † Coveo Solutions 1 | | | 348,460 | | | | 1,546,610 |
| Enfusion Cl. A 1 | | | 184,078 | | | | 1,896,004 |
| Logility Supply Chain Solutions 2 | | | 126,152 | | | | 1,397,764 |
| PROS Holdings 1 | | | 81,500 | | | | 1,789,740 |
| † ReposiTrak | | | 109,707 | | | | 2,427,816 |
| | | | | | | | 24,340,246 |
| TECHNOLOGY HARDWARE, STORAGE & PERIPHERALS - 0.8% | | | | | | | |
| AstroNova 1 | | | 115,860 | | | | 1,391,479 |
| † CompoSecure Cl. A | | | 112,866 | | | | 1,730,236 |
| Intevac 1 | | | 483,318 | | | | 1,643,281 |
| | | | | | | | 4,764,996 |
| Total (Cost $96,320,303) | | | | | | | 135,633,725 |
| | | | | | | | |
| MATERIALS – 5.6% | | | | | | | |
| CHEMICALS - 1.1% | | | | | | | |
| Aspen Aerogels 1 | | | 122,022 | | | | 1,449,621 |
| † 5N Plus 1 | | | 555,000 | | | | 2,849,421 |
| LSB Industries 1 | | | 225,601 | | | | 1,712,311 |
| † Mativ Holdings | | | 33,794 | | | | 368,355 |
| | | | | | | | 6,379,708 |
| METALS & MINING - 4.5% | | | | | | | |
| Alamos Gold Cl. A | | | 256,044 | | | | 4,723,842 |
| † Alphamin Resources | | | 1,267,682 | | | | 943,629 |
| Altius Minerals | | | 171,100 | | | | 3,168,585 |
| † Compass Minerals International | | | 112,609 | | | | 1,266,851 |
| † Ferroglobe | | | 518,310 | | | | 1,969,578 |
| MAG Silver 1 | | | 154,050 | | | | 2,095,080 |
| Major Drilling Group International 1 | | | 1,157,723 | | | | 6,612,339 |
| Sandstorm Gold 2 | | | 785,000 | | | | 4,380,300 |
| | | | | | | | 25,160,204 |
| Total (Cost $25,504,599) | | | | | | | 31,539,912 |
| | | | | | | | |
| REAL ESTATE – 1.3% | | | | | | | |
| OFFICE REITS - 0.3% | | | | | | | |
| Postal Realty Trust Cl. A | | | 114,000 | | | | 1,487,700 |
| REAL ESTATE MANAGEMENT & DEVELOPMENT - 1.0% | | | | | | | |
| Altus Group | | | 73,400 | | | | 2,859,508 |
| Marcus & Millichap | | | 30,090 | | | | 1,151,244 |
| RMR Group (The) Cl. A 2 | | | 86,200 | | | | 1,779,168 |
| | | | | | | | 5,789,920 |
| Total (Cost $7,688,924) | | | | | | | 7,277,620 |
| | | | | | | | |
| UTILITIES – 0.2% | | | | | | | |
| WATER UTILITIES - 0.2% | | | | | | | |
| Global Water Resources | | | 106,000 | | | | 1,219,000 |
| Total (Cost $678,400) | | | | | | | 1,219,000 |
| | | | | | | | |
| TOTAL COMMON STOCKS | | | | | | | |
| (Cost $429,325,362) | | | | | | | 552,360,787 |
| | | | | | | | |
| INVESTMENT COMPANIES – 0.6% | | | | | | | |
| | | | | | | | |
| FINANCIALS – 0.6% | | | | | | | |
| CAPITAL MARKETS - 0.6% | | | | | | | |
| ASA Gold and Precious Metals | | | 171,150 | | | | 3,460,653 |
| Total (Cost $2,914,814) | | | | | | | 3,460,653 |
| | | | | | | | |
| INVESTMENTS AT VALUE | | | | | | | |
| (Cost $432,240,176) | | | | | | | 555,821,440 |
| | | | | | | | |
| REPURCHASE AGREEMENT – 2.4% | | | | | | | |
Fixed Income Clearing Corporation, 3.75% dated 12/31/24, due 1/2/25, maturity value $13,426,190 (collateralized by obligations of U.S. Government Agencies, 4.25% due 12/31/26, valued at $13,691,999) | | | | | | | |
| (Cost $13,423,393) | | | | | | | 13,423,393 |
| | | | | | | | |
| TOTAL INVESTMENTS – 100.4% | | | | | | | |
| (Cost $445,663,569) | | | | | | | 569,244,833 |
| | | | | | | | |
| LIABILITIES LESS CASH AND OTHER ASSETS – (0.4)% | | | | | | | (2,468,235) |
| | | | | | | | |
| NET ASSETS – 100.0% | | | | | | $ | 566,776,598 |
| 28 | 2024 Annual Report to Stockholders | THE ACCOMPANYING NOTES ARE AN INTEGRAL PART OF THESE FINANCIAL STATEMENTS |
December 31, 2024
| 2 | All or a portion of these securities were pledged as collateral in connection with the Fund’s revolving credit agreement as of December 31, 2024. Total market value of pledged securities as of December 31, 2024, was $5,231,824. |
| 3 | As of December 31, 2024, a portion of these securities, in the aggregate amount of $1,094,466, were rehypothecated by BNP Paribas Prime Brokerage International, Limited in connection with the Fund’s revolving credit agreement. See Notes to Financial Statements. |
| 4 | Securities for which market quotations are not readily available represent 0.0% of net assets. These securities have been valued at their fair value under procedures approved by the Fund’s Board of Directors. These securities are defined as Level 3 securities due to the use of significant unobservable inputs in the determination of fair value. See Notes to Financial Statements. |
| 5 | These securities are defined as Level 2 securities due to fair value being based on quoted prices for similar securities and/or due to the application of fair value factors. See Notes to Financial Statements. |
Bold indicates the Fund’s 20 largest equity holdings in terms of December 31, 2024, market value.
TAX INFORMATION: The cost of total investments for Federal income tax purposes was $448,764,876. As of December 31, 2024, net unrealized appreciation for all securities was $120,479,957 consisting of aggregate gross unrealized appreciation of $157,444,112 and aggregate gross unrealized depreciation of $36,964,155. The primary causes of the difference between book and tax basis cost are the timing of the recognition of losses on securities sold, investments in publicly traded partnerships and Trusts, investments in Real Estate Investment Trusts and mark-to-market of Passive Foreign Investment Companies.
| THE ACCOMPANYING NOTES ARE AN INTEGRAL PART OF THESE FINANCIAL STATEMENTS | 2024 Annual Report to Stockholders | 29 |
| Royce Micro-Cap Trust | December 31, 2024 |
Statement of Assets and Liabilities
| ASSETS: | | | |
| Investments at value | | $ | 555,821,440 | |
| Repurchase agreements (at cost and value) | | | 13,423,393 | |
| Foreign currency (cost $38,003) | | | 37,945 | |
| Receivable for investments sold | | | 121,776 | |
| Receivable for dividends and interest | | | 91,929 | |
| Prepaid expenses and other assets | | | 40,586 | |
| Total Assets | | | 569,537,069 | |
| LIABILITIES: | | | | |
| Revolving credit agreement | | | 2,000,000 | |
| Payable for investments purchased | | | 139,554 | |
| Payable for investment advisory fee | | | 461,965 | |
| Payable for directors’ fees | | | 23,291 | |
| Payable for interest expense | | | 9,788 | |
| Accrued expenses | | | 125,873 | |
| Total Liabilities | | | 2,760,471 | |
| Net Assets | | $ | 566,776,598 | |
| ANALYSIS OF NET ASSETS: | | | | |
| Paid-in capital - $0.001 par value per share; 51,622,624 shares outstanding (150,000,000 shares authorized) | | $ | 436,146,720 | |
| Total distributable earnings (loss) | | | 130,629,878 | |
| Net Assets (net asset value per share - $10.98) | | $ | 566,776,598 | |
| Investments at identified cost | | $ | 432,240,176 | |
| 30 | 2024 Annual Report to Stockholders | THE ACCOMPANYING NOTES ARE AN INTEGRAL PART OF THESE FINANCIAL STATEMENTS |
| Royce Micro-Cap Trust | Year Ended December 31, 2024 |
Statement of Operations
| INVESTMENT INCOME: | | | |
| INCOME: | | | |
| Dividends | | $ | 5,800,726 | |
| Foreign withholding tax | | | (221,472 | ) |
| Interest | | | 829,556 | |
| Rehypothecation income | | | 40 | |
| Total income | | | 6,408,850 | |
| EXPENSES: | | | | |
| Investment advisory fees | | | 5,688,005 | |
| Administrative and office facilities | | | 255,133 | |
| Interest expense | | | 128,906 | |
| Stockholder reports | | | 118,738 | |
| Professional fees | | | 111,031 | |
| Custody and transfer agent fees | | | 109,315 | |
| Directors’ fees | | | 88,688 | |
| Other expenses | | | 107,310 | |
| Total expenses | | | 6,607,126 | |
| Net investment income (loss) | | | (198,276 | ) |
| REALIZED AND UNREALIZED GAIN (LOSS) ON INVESTMENTS AND FOREIGN CURRENCY: | | | | |
| NET REALIZED GAIN (LOSS): | | | | |
| Investments | | | 41,934,012 | |
| Foreign currency transactions | | | (10,190 | ) |
| NET CHANGE IN UNREALIZED APPRECIATION (DEPRECIATION): | | | | |
| Investments | | | 24,219,510 | |
| Other assets and liabilities denominated in foreign currency | | | (246 | ) |
| Net realized and unrealized gain (loss) on investments and foreign currency | | | 66,143,086 | |
| NET INCREASE (DECREASE) IN NET ASSETS FROM INVESTMENT OPERATIONS | | $ | 65,944,810 | |
| THE ACCOMPANYING NOTES ARE AN INTEGRAL PART OF THESE FINANCIAL STATEMENTS | 2024 Annual Report to Stockholders | 31 |
Royce Micro-Cap Trust
Statement of Changes in Net Assets
| | | YEAR ENDED 12/31/24 | | | YEAR ENDED 12/31/23 | |
| | | | | | | |
| INVESTMENT OPERATIONS: | | | | | | | | |
| Net investment income (loss) | | $ | (198,276 | ) | | $ | (587,854 | ) |
| Net realized gain (loss) on investments and foreign currency | | | 41,923,822 | | | | 67,119,219 | |
| Net change in unrealized appreciation (depreciation) on investments and foreign currency | | | 24,219,264 | | | | 6,362,921 | |
| Net increase (decrease) in net assets from investment operations | | | 65,944,810 | | | | 72,894,286 | |
| DISTRIBUTIONS: | | | | | | | | |
| Total distributable earnings | | | (37,346,698 | ) | | | (35,849,605 | ) |
| Total distributions | | | (37,346,698 | ) | | | (35,849,605 | ) |
| CAPITAL STOCK TRANSACTIONS: | | | | | | | | |
| Reinvestment of distributions | | | 17,685,144 | | | | 17,559,078 | |
| Total capital stock transactions | | | 17,685,144 | | | | 17,559,078 | |
| Net Increase (Decrease) In Net Assets | | | 46,283,256 | | | | 54,603,759 | |
| NET ASSETS: | | | | | | | | |
| Beginning of year | | | 520,493,342 | | | | 465,889,583 | |
| End of year | | $ | 566,776,598 | | | $ | 520,493,342 | |
| 32 | 2024 Annual Report to Stockholders | THE ACCOMPANYING NOTES ARE AN INTEGRAL PART OF THESE FINANCIAL STATEMENTS |
| Royce Micro-Cap Trust | Year Ended December 31, 2024 |
Statement of Cash Flows
| CASH FLOWS FROM OPERATING ACTIVITIES: | | | |
| Net increase (decrease) in net assets from investment operations | | $ | 65,944,810 | |
| Adjustments to reconcile net increase (decrease) in net assets from investment operations to net cash provided by operating activities: | | | | |
| Purchases of long-term investments | | | (279,369,743 | ) |
| Proceeds from sales and maturities of long-term investments | | | 299,939,773 | |
| Net purchases, sales and maturities of short-term investments | | | (973,389 | ) |
| Net (increase) decrease in dividends and interest receivable and other assets | | | 300,234 | |
| Net increase (decrease) in interest expense payable, accrued expenses and other liabilities | | | (84,060 | ) |
| Net change in unrealized appreciation (depreciation) on investments | | | (24,219,510 | ) |
| Net realized gain (loss) on investments | | | (41,934,012 | ) |
| Net cash provided by operating activities | | | 19,604,103 | |
| CASH FLOWS FROM FINANCING ACTIVITIES: | | | | |
| Distributions net of reinvestment (reinvestment $17,685,144) | | | (19,661,554 | ) |
| Net cash used for financing activities | | | (19,661,554 | ) |
| INCREASE (DECREASE) IN CASH: | | | (57,451 | ) |
| Cash and foreign currency at beginning of year | | | 95,396 | |
| Cash and foreign currency at end of year | | $ | 37,945 | |
Supplemental disclosure of cash flow information:
For the year ended December 31, 2024, the Fund paid $130,347 in interest expense.
| THE ACCOMPANYING NOTES ARE AN INTEGRAL PART OF THESE FINANCIAL STATEMENTS | 2024 Annual Report to Stockholders | 33 |
Royce Micro-Cap Trust
Financial Highlights
This table is presented to show selected data for a share of Common Stock outstanding throughout each period, and to assist stockholders in evaluating the Fund’s performance for the periods presented.
| | | YEARS ENDED | |
| | | | 12/31/24 | | | | 12/31/23 | | | | 12/31/22 | | | | 12/31/21 | | | | 12/31/20 | |
| Net Asset Value, Beginning of Period | | $ | 10.47 | | | $ | 9.77 | | | $ | 13.06 | | | $ | 11.79 | | | $ | 9.63 | |
| INVESTMENT OPERATIONS: | | | | | | | | | | | | | | | | | | | | |
| Net investment income (loss) | | | 0.00 | | | | (0.01 | ) | | | (0.02 | ) | | | 0.04 | 1 | | | (0.03 | ) |
| Net realized and unrealized gain (loss) on investments and foreign currency | | | 1.30 | | | | 1.50 | | | | (2.26 | ) | | | 2.12 | | | | 2.86 | |
| Net increase (decrease) in net assets from investment operations | | | 1.30 | | | | 1.49 | | | | (2.28 | ) | | | 2.16 | | | | 2.83 | |
| DISTRIBUTIONS: | | | | | | | | | | | | | | | | | | | | |
| Net investment income | | | (0.03 | ) | | | – | | | | (0.05 | ) | | | – | | | | (0.08 | ) |
| Net realized gain on investments and foreign currency | | | (0.71 | ) | | | (0.74 | ) | | | (0.89 | ) | | | (0.84 | ) | | | (0.53 | ) |
| Return of capital | | | – | | | | – | | | | (0.01 | ) | | | – | | | | – | |
| Total distributions | | | (0.74 | ) | | | (0.74 | ) | | | (0.95 | ) | | | (0.84 | ) | | | (0.61 | ) |
| CAPITAL STOCK TRANSACTIONS: | | | | | | | | | | | | | | | | | | | | |
| Effect of reinvestment of distributions by Common Stockholders | | | (0.05 | ) | | | (0.05 | ) | | | (0.06 | ) | | | (0.05 | ) | | | (0.06 | ) |
| Total capital stock transactions | | | (0.05 | ) | | | (0.05 | ) | | | (0.06 | ) | | | (0.05 | ) | | | (0.06 | ) |
| Net Asset Value, End of Period | | $ | 10.98 | | | $ | 10.47 | | | $ | 9.77 | | | $ | 13.06 | | | $ | 11.79 | |
| Market Value, End of Period | | $ | 9.75 | | | $ | 9.24 | | | $ | 8.68 | | | $ | 11.55 | | | $ | 10.12 | |
| TOTAL RETURN:2 | | | | | | | | | | | | | | | | | | | | |
| Net Asset Value | | | 13.47 | % | | | 16.64 | % | | | (16.89 | )% | | | 19.17 | % | | | 33.60 | % |
| Market Value | | | 14.17 | % | | | 15.86 | % | | | (16.51 | )% | | | 22.78 | % | | | 29.32 | % |
| RATIOS BASED ON AVERAGE NET ASSETS: | | | | | | | | | | | | | | | | | | | | |
| Investment advisory fee expense3 | | | 1.05 | % | | | 1.46 | % | | | 1.47 | % | | | 1.04 | % | | | 1.19 | % |
| Other operating expenses | | | 0.17 | % | | | 0.39 | % | | | 0.29 | % | | | 0.16 | % | | | 0.24 | % |
| Total expenses (net) | | | 1.22 | % | | | 1.85 | % | | | 1.76 | % | | | 1.20 | % | | | 1.43 | % |
| Expenses excluding interest expense | | | 1.19 | % | | | 1.62 | % | | | 1.63 | % | | | 1.16 | % | | | 1.34 | % |
| Expenses prior to balance credits | | | 1.22 | % | | | 1.85 | % | | | 1.76 | % | | | 1.20 | % | | | 1.43 | % |
| Net investment income (loss) | | | (0.04 | )% | | | (0.12 | )% | | | (0.21 | )% | | | 0.30 | %1 | | | (0.34 | )% |
| SUPPLEMENTAL DATA: | | | | | | | | | | | | | | | | | | | | |
| Net Assets, End of Period (in thousands) | | $ | 566,777 | | | $ | 520,493 | | | $ | 465,890 | | | $ | 590,313 | | | $ | 515,916 | |
| Portfolio Turnover Rate | | | 53 | % | | | 30 | % | | | 26 | % | | | 15 | % | | | 17 | % |
| REVOLVING CREDIT AGREEMENT: | | | | | | | | | | | | | | | | | | | | |
| Asset coverage | | | 28439 | % | | | 26125 | % | | | 4335 | % | | | 2783 | % | | | 2445 | % |
| Asset coverage per $1,000 | | $ | 284,388 | | | $ | 261,247 | | | $ | 43,354 | | | $ | 27,832 | | | $ | 24,451 | |
| 1 | A special distribution from ECN Capital resulted in an increase in net investment income (loss) per share of $0.07 and an increase in the ratio of net investment income (loss) to average net assets of 0.51%. |
| 2 | The Market Value Total Return is calculated assuming a purchase of Common Stock on the opening of the first business day and a sale on the closing of the last business day of each period. Dividends and distributions are assumed for the purposes of this calculation to be reinvested at prices obtained under the Fund’s Distribution Reinvestment and Cash Purchase Plan. Net Asset Value Total Return is calculated on the same basis, except that the Fund’s net asset value is used on the purchase, sale and dividend reinvestment dates instead of market value. |
| 3 | The investment advisory fee is calculated based on average net assets over a rolling 36-month basis, while the above ratios of investment advisory fee expenses are based on the average net assets over a 12-month basis. |
| 34 | 2024 Annual Report to Stockholders | THE ACCOMPANYING NOTES ARE AN INTEGRAL PART OF THESE FINANCIAL STATEMENTS |
Royce Micro-Cap Trust
Notes to Financial Statements
Summary of Significant Accounting Policies
Royce Micro-Cap Trust, Inc. (the “Fund”), is a diversified closed-end investment company that was incorporated under the laws of the State of Maryland on September 9, 1993. The Fund commenced operations on December 14, 1993.
The preparation of financial statements in conformity with accounting principles generally accepted in the United States of America requires management to make estimates and assumptions that affect the reported amounts of assets and liabilities and the disclosure of contingent assets and liabilities at the date of the financial statements and the reported amounts of income and expenses during the reporting period. Actual results could differ from those estimates.
The Fund is an investment company registered under the Investment Company Act of 1940 (the “1940 Act”) and accordingly follows the investment company accounting and reporting guidance of the Financial Accounting Standards Board (FASB) Accounting Standard Codification Topic 946 “Financial Services-Investment Companies.”
Royce & Associates, LP, the Fund’s investment adviser, is a majority-owned subsidiary of Franklin Resources, Inc. and primarily conducts business using the name Royce Investment Partners (“Royce”).
VALUATION OF INVESTMENTS:
Portfolio securities held by the Fund are valued as of the close of trading on the New York Stock Exchange (“NYSE”) (generally 4:00 p.m. Eastern time) on the valuation date. Investments in money market funds are valued at net asset value per share. Values for non-U.S. dollar denominated equity securities are converted to U.S. dollars daily based upon prevailing foreign currency exchange rates as quoted by a major bank.
Portfolio securities that are listed on an exchange or Nasdaq, or traded on OTC Market Group Inc.’s OTC Link ATS or other alternative trading system, are valued: (i) on the basis of their last reported sales prices or official closing prices, as applicable, on a valuation date; or (ii) at their highest reported bid prices in the event such equity securities did not trade on a valuation date. Such inputs are generally referred to as “Level 1” inputs because they represent reliable quoted prices in active markets for identical securities.
If the value of a portfolio security held by the Fund cannot be determined solely by reference to Level 1 inputs, such portfolio security will be “fair valued.” The Fund’s Board of Directors has designated Royce as valuation designee to perform fair value determinations for such portfolio securities in accordance with Rule 2a-5 under the 1940 Act (“Rule 2a-5”). Pursuant to Rule 2a-5, fair values are determined in accordance with policies and procedures approved by the Fund’s Board of Directors and policies and procedures adopted by Royce in its capacity as valuation designee for the Fund. Fair valued securities are reported as either “Level 2” or “Level 3” securities.
As a general principle, the fair value of a security is the amount which the Fund might reasonably expect to receive for the security upon its current sale. However, in light of the judgment involved in fair valuations, no assurance can be given that a fair value assigned to a particular portfolio security will be the amount which the Fund might be able to receive upon its current sale. When a fair value pricing methodology is used, the fair value prices used by the Fund for such securities will likely differ from the quoted or published prices for the same securities.
Level 2 inputs are other significant observable inputs (e.g., dealer bid side quotes and quoted prices for securities with comparable characteristics). Examples of situations in which Level 2 inputs are used to fair value portfolio securities held by the Fund on a particular valuation date include:
| ● | Over-the-counter equity securities other than those traded on OTC Market Group Inc.’s OTC Link ATS or other alternative trading system (collectively referred to herein as “Other OTC Equity Securities”) are fair valued at their highest bid price when Royce receives at least two bid side quotes from dealers who make markets in such securities; |
| ● | Certain bonds and other fixed income securities may be fair valued by reference to other securities with comparable ratings, interest rates, and maturities in accordance with valuation methodologies maintained by certain independent pricing services; and |
| ● | The Fund uses an independent pricing service to fair value certain non-U.S. equity securities when U.S. market volatility exceeds a certain threshold set by Royce as valuation designee. This pricing service uses proprietary correlations it has developed between the movement of prices of non-U.S. equity securities and indices of U.S.-traded securities, futures contracts, and other indications to estimate the fair value of such non-U.S. securities. |
Level 3 inputs are significant unobservable inputs. Examples of Level 3 inputs include (without limitation) the last trade price for a security before trading was suspended or terminated; discounts to last trade price for lack of marketability or otherwise; market price information regarding other securities; information received from the issuer and/or published documents, including SEC filings and financial statements; and other publicly available information. Pursuant to the above-referenced policies and procedures, Royce may use
2024 Annual Report to Stockholders | 35
Royce Micro-Cap Trust
Notes to Financial Statements (continued)
VALUATION OF INVESTMENTS (continued):
various techniques in making fair value determinations based upon Level 3 inputs, which techniques may include (without limitation): (i) workout valuation methods (e.g., earnings multiples, discounted cash flows, liquidation values, derivations of book value, firm or probable offers from qualified buyers for the issuer’s ongoing business, etc.); (ii) discount or premium from market, or compilation of other observable market information, for other similar freely traded securities; (iii) conversion from the readily available market price of a security into which an affected security is convertible or exchangeable; and (iv) pricing models or other formulas.
A security that is valued by reference to Level 1 or Level 2 inputs may drop to Level 3 on a particular valuation date for several reasons, including if:
| ● | an equity security that is listed on an exchange or Nasdaq, or traded on OTC Market Group Inc.’s OTC Link ATS or other alternative trading system, has not traded and there are no bids; |
| ● | Royce does not receive at least two bid side quotes for an Other OTC Equity Security; |
| ● | the independent pricing services are unable to supply fair value prices; or |
| ● | the Level 1 or Level 2 inputs become otherwise unreliable for any reason (e.g., a significant event occurs after the close of trading for a security but prior to the time the Fund prices its shares). |
The table below shows the aggregate value of the various Level 1, Level 2, and Level 3 securities held by the Fund as of December 31, 2024. Any Level 2 or Level 3 securities held by the Fund are noted in its Schedule of Investments. The inputs or methodology used for valuing securities are not necessarily an indication of the risk associated with owning those securities.
| | LEVEL 1 | LEVEL 2 | LEVEL 3 | TOTAL |
| Common Stocks | $536,696,857 | | $15,657,530 | | $6,400 | | $552,360,787 | |
| Investment Companies | 3,460,653 | | – | | – | | 3,460,653 | |
| Repurchase Agreement | – | | 13,423,393 | | – | | 13,423,393 | |
Level 3 Reconciliation:
| | | | | | NET CHANGE IN
UNREALIZED GAIN (LOSS)1 | |
| | BALANCE AS OF
12/31/23 | PURCHASES | SALES | REALIZED GAIN (LOSS)1 | CURRENTLY HELD
SECURITIES | SECURITIES NO
LONGER HELD | BALANCE AS OF
12/31/24 |
| Common Stocks | $225,680 | $501,245 | $343,700 | $(27,893) | $(494,845) | $145,913 | $6,400 |
| 1 | The net change in unrealized appreciation (depreciation) is included in the accompanying Statement of Operations. Change in unrealized appreciation (depreciation) includes net unrealized appreciation (depreciation) resulting from changes in investment values during the reporting period and the reversal of previously recorded unrealized appreciation (depreciation) when gains or losses are realized. Net realized gain (loss) from investments and foreign currency transactions is included in the accompanying Statement of Operations. |
REPURCHASE AGREEMENTS:
The Fund may enter into repurchase agreements with institutions that the Fund’s investment adviser has determined are creditworthy. The Fund restricts repurchase agreements to maturities of no more than seven days. Securities pledged as collateral for repurchase agreements, which are held until maturity of the repurchase agreements, are marked-to-market daily and maintained at a value at least equal to the principal amount of the repurchase agreement (including accrued interest). Repurchase agreements could involve certain risks in the event of default or insolvency of the counter-party, including possible delays or restrictions upon the ability of the Fund to dispose of its underlying securities. The remaining contractual maturity of the repurchase agreement held by the Fund as of December 31, 2024, is next business day and continuous.
FOREIGN CURRENCY:
Net realized foreign exchange gains or losses arise from sales and maturities of short-term securities, sales of foreign currencies, expiration of currency forward contracts, currency gains or losses realized between the trade and settlement dates on securities transactions, and the difference between the amounts of dividends, interest, and foreign withholding taxes recorded on the Fund’s books and the U.S. dollar equivalent of the amounts actually received or paid. Net unrealized foreign exchange gains and losses arise from changes in the value of assets and liabilities, other than investments in securities at the end of the reporting period, as a result of changes in foreign currency exchange rates.
The Fund does not isolate that portion of the results of operations resulting from fluctuations in foreign exchange rates on investments from the fluctuations arising from changes in market prices of securities held. Such fluctuations are included with the net realized and unrealized gain or loss on investments.
For the purposes of the Statement of Cash Flows, the Fund defines Cash as cash, including foreign currency.
36 | 2024 Annual Report to Stockholders
Royce Micro-Cap Trust
Notes to Financial Statements (continued)
TAXES:
As a qualified regulated investment company under Subchapter M of the Internal Revenue Code, the Fund is not subject to income taxes to the extent that it distributes substantially all of its taxable income for its fiscal year. The Schedule of Investments includes information regarding income taxes under the caption “Tax Information.”
DISTRIBUTIONS:
The Fund pays quarterly distributions on the Fund’s Common Stock at the annual rate of 7% of the rolling average of the prior four calendar quarter-end NAVs of the Fund’s Common Stock, with the fourth quarter distribution being the greater of 1.75% of the rolling average or the distribution required by IRS regulations. Distributions to Common Stockholders are recorded on ex-dividend date. To the extent that distributions in any year are not paid from long-term capital gains, net investment income or net short-term capital gains, they will represent a return of capital. Distributions are determined in accordance with income tax regulations that may differ from accounting principles generally accepted in the United States of America. Permanent book and tax differences relating to stockholder distributions will result in reclassifications within the capital accounts. Undistributed net investment income may include temporary book and tax basis differences, which will reverse in a subsequent period. Any taxable income or gain remaining undistributed at fiscal year end is distributed in the following year.
INVESTMENT TRANSACTIONS AND RELATED INVESTMENT INCOME:
Investment transactions are accounted for on the trade date. Dividend income is recorded on the ex-dividend date except for certain dividends from securities where the dividend rate is not available. In such cases, the dividend is recorded as soon as the information is received by the Fund. Non-cash dividend income is recorded at the fair market value of the securities received. Interest income is recorded on an accrual basis. Premiums and discounts on debt securities are amortized using the effective yield-to-maturity method. Realized gains and losses from investment transactions are determined on the basis of identified cost for book and tax purposes.
CASH INCLUDING FOREIGN CURRENCIES:
Cash, including foreign currencies, consists of deposits maintained at State Street Bank and Trust Company, the Fund’s Custodian (in such capacity, the “Custodian”), and through the Custodian's global sub-custodian network. Accordingly, the Fund’s risk for the possible insolvency loss of a cash deposit lies with the Custodian or the relevant sub-custodian bank. Fund cash deposits maintained at the Custodian or through a particular sub-custodian bank may be significant, and may, at times, exceed U.S. or other applicable insurance limits.
EXPENSES:
The Fund incurs direct and indirect expenses. Expenses directly attributable to the Fund are charged to the Fund, while expenses applicable to more than one of the Royce Funds are allocated equitably. Certain personnel, occupancy costs and other administrative expenses related to all of the Royce Funds are allocated by Royce under an administration agreement and are included in administrative and office facilities and professional fees.
INDEMNIFICATION PROVISIONS:
Reference is made to Maryland law, the Fund’s Articles of Incorporation, as amended and supplemented, and the Fund’s Amended and Restated By-laws, each of which provides for the indemnification by the Fund of the Fund’s officers and directors under the circumstances and to the extent set forth therein. Reference is also made to the investment advisory agreement between the Fund and Royce which provides for the indemnification by the Fund of Royce under the circumstances and to the extent set forth therein. Additionally, in the normal course of business, the Fund enters into contracts with service providers that contain general indemnification provisions in favor of such service providers and other covered persons. The amount of any potential Fund liability under these indemnification arrangements, if any, currently cannot be determined with any degree of specificity. The Fund is not currently in possession of any information that would cause it to believe that the Fund is reasonably likely to be subject to any material adverse impact from the operation of these indemnification arrangements. No assurance can be given, however, that the Fund will not incur any liability from the operation of these indemnification arrangements. Any future liability to the Fund that may arise from the operation of such arrangements will be disclosed to the extent required by relevant accounting guidance and applicable laws, rules, and regulations.
Capital Stock:
The Fund issued 1,903,830 and 2,030,423 shares of Common Stock as reinvestment of distributions for the years ended December 31, 2024, and December 31, 2023, respectively.
2024 Annual Report to Stockholders | 37
Royce Micro-Cap Trust
Notes to Financial Statements (continued)
Borrowings:
The Fund is party to a revolving credit agreement (the “credit agreement”) with BNP Paribas Prime Brokerage International, Limited (BNPPI). The Fund pays a commitment fee of 0.50% per annum on the unused portion of the then-current maximum amount that may be borrowed by the Fund under the credit agreement. The credit agreement has a 179-day rolling term that resets daily. The Fund pledges eligible portfolio securities as collateral and has granted a security interest in such pledged securities to, and in favor of, BNPPI as security for the loan balance outstanding. The amount of eligible portfolio securities required to be pledged as collateral is determined by BNPPI in accordance with the credit agreement. In determining collateral requirements, the value of eligible securities pledged as collateral is subject to discount by BNPPI based upon a variety of factors set forth in the credit agreement. As of December 31, 2024, the market value of eligible securities pledged as collateral exceeded two times the loan balance outstanding.
If the Fund fails to meet certain requirements, or comply with other financial covenants set forth in the credit agreement, the Fund may be required to repay immediately, in part or in full, the loan balance outstanding under the credit agreement, which may necessitate the sale of portfolio securities at potentially inopportune times. BNPPI may terminate the credit agreement upon certain ratings downgrades of its corporate parent, which would result in the Fund’s entire loan balance becoming immediately due and payable. The occurrence of such ratings downgrades may necessitate the sale of portfolio securities at potentially inopportune times. BNPPI may also terminate the credit agreement upon sixty (60) calendar days’ prior written notice to the Fund in the event the Fund’s net asset value per share as of the close of business on the last business day of any calendar month declines by thirty-five percent (35%) or more from the Fund’s net asset value per share as of the close of business on the last business day of the immediately preceding calendar month.
The credit agreement also permits, subject to certain conditions, BNPPI to rehypothecate portfolio securities pledged by the Fund up to the amount of the loan balance outstanding. The Fund continues to receive payments in lieu of dividends and interest on rehypothecated securities. The Fund also has the right under the credit agreement to recall the rehypothecated securities from BNPPI on demand. If BNPPI fails to deliver the recalled security in a timely manner, the Fund is compensated by BNPPI for any fees or losses related to the failed delivery or, in the event a recalled security is not returned by BNPPI, the Fund, upon notice to BNPPI, may reduce the loan balance outstanding by the value of the recalled security failed to be returned. The Fund receives a portion of the fees earned by BNPPI in connection with the rehypothecation of portfolio securities.
As of December 31, 2024, the Fund had outstanding borrowings of $2,000,000. The Fund has the right to reduce the maximum amount it can borrow under the credit agreement upon one (1) business day’s prior written notice to BNPPI. The maximum amount the Fund may borrow under the credit agreement was reduced to $0 as of February 6, 2025. In addition, the Fund and BNPPI may agree to increase the maximum amount the Fund can borrow under the credit agreement, which amount may not exceed $60,000,000.
During the year ended December 31, 2024, the Fund had an average daily loan balance of $2,000,000 at a weighted average borrowing cost of 6.34%. The maximum loan balance outstanding during the year ended December 31, 2024, was $2,000,000. As of December 31, 2024, the aggregate value of rehypothecated securities was $1,094,466. During the year ended December 31, 2024, the Fund earned $40 in fees from rehypothecated securities.
Investment Advisory Agreement:
As compensation for its services under the investment advisory agreement, Royce receives a fee comprised of a Basic Fee (“Basic Fee”) and an adjustment to the Basic Fee based on the investment performance of the Fund in relation to the investment record of the Russell 2000. The fee is payable monthly.
The Basic Fee is a monthly fee equal to 1/12 of 1% (1% on an annualized basis) of the average of the Fund’s month-end net assets for the rolling 36-month period ending with such month (the “performance period”). The Basic Fee for each month is increased or decreased at the rate of 1/12 of .05% for each percentage point that the investment performance of the Fund exceeds, or is exceeded by, the percentage change in the investment record of the Russell 2000 for the performance period by more than two percentage points. The performance period for each such month is a rolling 36-month period ending with such month. The maximum increase or decrease in the Basic Fee for any month may not exceed 1/12 of .5%. Accordingly, for each month, the maximum monthly fee rate as adjusted for performance is 1/12 of 1.5% and is payable if the investment performance of the Fund exceeds the percentage change in the investment record of the Russell 2000 by 12 or more percentage points for the performance period, and the minimum monthly fee rate as adjusted for performance is 1/12 of .5% and is payable if the percentage change in the investment record of the Russell 2000 exceeds the investment performance of the Fund by 12 or more percentage points for the performance period.
For the twelve rolling 36-month periods in 2024, the Fund’s investment performance ranged from 1% above to 9% above the investment performance of the Russell 2000. Accordingly, the net investment advisory fee consisted of a Basic Fee of $5,091,079 and a net upward adjustment of $596,926 for the performance of the Fund relative to that of the Russell 2000. For the year ended December 31, 2024, the Fund expensed Royce investment advisory fees totaling $5,688,005.
38 | 2024 Annual Report to Stockholders
Royce Micro-Cap Trust
Notes to Financial Statements (continued)
Purchases and Sales of Investment Securities:
For the year ended December 31, 2024, the costs of purchases and proceeds from sales of investment securities, other than short-term securities, amounted to $278,850,586 and $297,666,764, respectively.
Cross trades were executed by the Fund pursuant to Rule 17a-7 under the 1940 Act. Cross trading is the buying or selling of portfolio securities between funds to which Royce or an affiliate of Franklin Resources, Inc. serves as investment adviser. The Fund’s Chief Compliance Officer reviews such transactions each quarter for compliance with the requirements and restrictions set forth by Rule 17a-7, and reports the results of that review to the Board of Directors. Cross trades for the year ended December 31, 2024, were as follows:
| COSTS OF PURCHASES | PROCEEDS FROM SALES | REALIZED GAIN (LOSS) |
| $– | $715,235 | $236,837 |
Tax Information:
Distributions during the years ended December 31, 2024 and 2023, were characterized as follows for tax purposes:
| ORDINARY INCOME | LONG-TERM CAPITAL GAINS |
| 2024 | 2023 | 2024 | 2023 |
| $6,562,690 | $7,402,359 | $30,784,008 | $28,447,246 |
The tax basis components of distributable earnings as of December 31, 2024, were as follows:
UNDISTRIBUTED
ORDINARY INCOME | UNDISTRIBUTED LONG-TERM
CAPITAL GAINS | NET UNREALIZED
APPRECIATION
(DEPRECIATION)1 | QUALIFIED LATE YEAR
ORDINARY AND
POST-OCTOBER LOSS
DEFERRALS2 | TOTAL
DISTRIBUTABLE
EARNINGS |
| $3,042,946 | $7,264,638 | $120,479,156 | $(156,862) | $130,629,878 |
| 1 | Includes timing differences on foreign currency, recognition of losses on securities sold, investments in Real Estate Investment Trusts, investments in publicly traded partnerships and Trusts and mark-to-market of Passive Foreign Investment Companies. |
| 2 | Under the current tax law, capital losses and qualified late year ordinary losses incurred after October 31 may be deferred and treated as occurring on the first day of the following fiscal year. This column also includes passive activity losses. |
For financial reporting purposes, capital accounts and distributions to stockholders are adjusted to reflect the tax character of permanent book/tax differences. For the year ended December 31, 2024, the Fund recorded the following permanent reclassifications, which relates to excise taxes paid. Results of operations and net assets were not affected by these reclassifications.
| TOTAL DISTRIBUTABLE EARNINGS (LOSS) | PAID-IN CAPITAL |
| $32,369 | $(32,369) |
Management has analyzed the Fund’s tax positions taken on federal income tax returns for all open tax years (2021-2024) and has concluded that as of December 31, 2024, no provision for income tax is required in the Fund’s financial statements.
Segment Reporting:
The Fund has adopted the Financial Accounting Standards Board (FASB) Accounting Standards Update (ASU) 2023-07, Segment Reporting (Topic 280) - Improvements to Segment Reporting Disclosures (the “Update”). The Update is limited to disclosure requirements and does not impact the Fund’s financial position or results of operations.
The Fund operates as a single operating segment, which is a segregated investment portfolio. Royce, in its capacity as investment manager, functions as the Chief Operating Decision Maker (CODM) for the Fund for purposes of the Update, evaluating its results and performance based upon its specific investment strategy and other relevant facts and circumstances. The CODM uses these measures to assess Fund performance and allocate resources effectively, subject to compliance with applicable legal and regulatory requirements and oversight from its Board of Directors. Internal reporting provided to the CODM aligns with the accounting policies and measurement principles used in the financial statements.
For information regarding segment assets, segment profit or loss, and significant expenses, refer to the Statement of Assets and Liabilities and the Statement of Operations, along with the related notes to the financial statements. The Schedule of Investments provides details of the Fund's investments that generate returns such as interest, dividends, and realized and unrealized gains or losses. Performance metrics, including portfolio turnover and expense ratios, are disclosed in the Financial Highlights.
Subsequent Events:
Subsequent events have been evaluated through the date the financial statements were issued and it has been determined that no events have occurred that require disclosure.
2024 Annual Report to Stockholders | 39
Report of Independent Registered Public Accounting Firm
To the Board of Directors and Stockholders of Royce Micro-Cap Trust, Inc.:
Opinion on the Financial Statements
We have audited the accompanying statement of assets and liabilities, including the schedule of investments, of Royce Micro-Cap Trust, Inc. (the “Fund”) as of December 31, 2024, the related statements of operations and cash flows for the year ended December 31, 2024, the statement of changes in net assets for each of the two years in the period ended December 31, 2024, including the related notes, and the financial highlights for each of the five years in the period ended December 31, 2024 (collectively referred to as the “financial statements”). In our opinion, the financial statements present fairly, in all material respects, the financial position of the Fund as of December 31, 2024, the results of its operations and its cash flows for the year then ended, the changes in its net assets for each of the two years in the period ended December 31, 2024 and the financial highlights for each of the five years in the period ended December 31, 2024 in conformity with accounting principles generally accepted in the United States of America.
Basis for Opinion
These financial statements are the responsibility of the Fund’s management. Our responsibility is to express an opinion on the Fund’s financial statements based on our audits. We are a public accounting firm registered with the Public Company Accounting Oversight Board (United States) (PCAOB) and are required to be independent with respect to the Fund in accordance with the U.S. federal securities laws and the applicable rules and regulations of the Securities and Exchange Commission and the PCAOB.
We conducted our audits of these financial statements in accordance with the standards of the PCAOB. Those standards require that we plan and perform the audit to obtain reasonable assurance about whether the financial statements are free of material misstatement, whether due to error or fraud.
Our audits included performing procedures to assess the risks of material misstatement of the financial statements, whether due to error or fraud, and performing procedures that respond to those risks. Such procedures included examining, on a test basis, evidence regarding the amounts and disclosures in the financial statements. Our audits also included evaluating the accounting principles used and significant estimates made by management, as well as evaluating the overall presentation of the financial statements. Our procedures included confirmation of securities owned as of December 31, 2024 by correspondence with the custodian and brokers. We believe that our audits provide a reasonable basis for our opinion.
/s/PricewaterhouseCoopers LLP
New York, New York
February 21, 2025
We have served as the auditor of one or more investment companies in the Franklin Templeton Group of Funds since 1948.
40 | 2024 Annual Report to Stockholders
This page is intentionally left blank.
2024 Annual Report to Stockholders | 41
MANAGERS’ DISCUSSION (UNAUDITED)
Royce Small-Cap Trust (RVT)

Francis Gannon, Steven McBoyle,
Lauren Romeo, George Necakov,
Andrew Palen
FUND PERFORMANCE
Royce Small-Cap Trust (RVT) advanced 12.6% on an NAV (net asset value) basis in 2024 and 18.1% on a market price basis versus respective gains of 11.5% and 8.7% for its small-cap benchmark, the Russell 2000 Index, and the S&P SmallCap 600 Index, for the same period. The Fund also maintained its longer-term relative advantages over the Russell 2000, beating it on both an NAV and market price basis for the 3-, 5-, 10-, 15-, 25-, 30-, 35-year, and since inception (11/26/86) periods ended 12/31/24.
WHAT WORKED… AND WHAT DIDN’T
Seven of RVT’s 11 equity sectors finished 2024 in the black. Industrials and Financials made by far the biggest positive impact, followed by Information Technology, while the biggest detractors were Health Care, Communication Services, and Real Estate. At the industry level, construction & engineering (Industrials) made the biggest positive contribution, followed by two groups in Financials: capital markets and insurance. The biggest detractors came from three different sectors: specialty retail (Consumer Discretionary), health care equipment & supplies (Health Care), and diversified telecommunication services (Communication Services).
The Fund’s top contributor at the position level was IES Holdings, which designs and installs electrical and technology systems into numerous infrastructure segments. Through a thoughtful growth strategy focused on both internal and external opportunities, IES has been building scale in each of its four business segments, which has resulted in rapidly improving operating profitability. The company reported full fiscal year results in November that featured growing revenue while expanding operating margins in all of IES’s four operating segments. FTAI Aviation provides maintenance, repair, and exchange of CFM56 and V2500 aircraft engines, the workhorses of the global aircraft fleet, to smaller airlines globally. FTAI also leases used aircraft and spare engines to airlines. Key aspects of FTAI’s business model have been its ability to deliver a better mousetrap (lease/sale/exchange; faster repairs; no negative surprises), have lower costs than its competitors, and operate in an asset-light manner through partnerships with Lockheed Martin, Chrome Alloy, AAR, Pratt & Whitney, et al. Contributing to its notable performance in 2024 were the market’s recognition of the tight supply of aircraft engines, FTAI’s growth runway as it closed deals with Latam Airlines and Pratt & Whitney, a burgeoning cost advantage after FTAI purchased its management fee agreement and a key maintenance facility in Montreal, and FAA approval for critical aftermarket engine parts.
| | | | | | |
| | Top Contributors to Performance | | | Top Detractors from Performance | |
| | For 2024 (%)1 | | | For 2024 (%)2 | | |
| | IES Holdings | 1.66 | | Quaker Houghton | -0.35 | |
| | FTAI Aviation | 0.83 | | Enovis Corporation | -0.33 | |
| | Impinj | 0.67 | | Azenta | -0.25 | |
| | Alamos Gold Cl. A | 0.64 | | Globalstar | -0.24 | |
| | PAR Technology | 0.56 | | Ziff Davis | -0.22 | |
| | 1 Includes dividends | | | 2 Net of dividends | |
| | | | | | |
The Fund’s top detractor was Quaker Houghton, which produces, develops, and markets industrial chemical products, including heat treatment, metal forming, forging, and tin plating fluids, as well as cleaners, casting lubricants, greases, ground control agents, and metal rolling oils. We see Quaker Houghton as an attractive asset light business, with recurring revenues and strong customer loyalty. After a strong performance in 2023, the stock fell as the company faced more difficult sales growth comparisons as it lapped strategic price increases and volumes varied by geographic region, reflecting slower global industrial growth. Quaker Houghton recently promoted to CEO a respected, internal “rising star” who has overseen global growth initiatives and the merger integration of Houghton. We believe much of his focus is on reemphasizing the company’s “customer intimacy” sales process to accelerate new product growth and geographic expansion (e.g., to India), as well as more effectively capitalizing on cross-selling opportunities across the company’s customer base. Enovis Corporation is an orthopedic-focused, medical technology company with leading a global market share in Prevention & Recovery (braces and other rehabilitation products) and a growing Reconstruction segment (e.g., surgical implants for extremities). The stock has been under pressure, however, since Enovis closed its acquisition of Lima in 2024, the company’s largest-ever deal. The strategic fit and valuation of the deal made sense to us, but the stock was hurt by near-term concerns about integration and sales dis-synergies, especially with the elevation of new leadership in the Reconstruction segment. Yet management actually delivered results consistent with what it had outlined and entered 2025 with most of these headwinds behind it.
CURRENT POSITIONING AND OUTLOOK
We remain constructive about the prospects for the Fund. The highly promising earnings prospects for small-cap as a whole—the consensus for earnings per share growth in 2025 is 44% as of this writing—are a major factor in our thinking. Our conviction becomes even stronger when combined with small-cap’s far more attractive valuations compared to large-cap. Using our preferred index valuation metric of enterprise value over earnings before interest and taxes—or EV/ EBIT—we see that the Russell 2000 finished 2024 still near its lowest levels relative to the Russell 1000 in 25 years. To us, this combination signals an ongoing opportunity for active small-cap managers to capture robust earnings growth at attractive—highly attractive in many cases—prices. We remain confident in the long-term case for small-cap leadership or risk-averse and earnings-focused active management in our asset class.
42 | 2024 Annual Report to Stockholders
| PERFORMANCE AND PORTFOLIO REVIEW (UNAUDITED) | SYMBOLS MARKET PRICE RVT NAV XRVTX |
Performance
Average Annual Total Return (%) Through 12/31/24
| | | | | | | | | | | | SINCE INCEPTION |
| | JUL-DEC 20241 | 1-YR | 3-YR | 5-YR | 10-YR | 15-YR | 20-YR | 25-YR | 30-YR | 35-YR | (11/26/86) |
| RVT (NAV) | 7.61 | 12.64 | 2.57 | 9.54 | 9.37 | 10.51 | 8.15 | 9.32 | 10.35 | 10.41 | 10.38 |
1 Not Annualized
Market Price Performance History Since Inception (11/26/86)
Cumulative Performance of Investment through 12/31/241
| | 1-YR | 5-YR | 10-YR | 15-YR | 20-YR | SINCE INCEPTION (11/26/86) |
| RVT | 18.1% | 64.7% | 158.5% | 397.3% | 313.6% | 3678.9% |
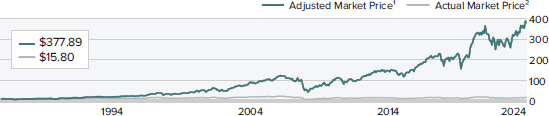
| 1 | Reflects the cumulative performance of an investment made by a stockholder who purchased one share at inception ($10.00 IPO), reinvested all distributions and fully participated in primary subscriptions of the Fund's rights offerings. |
| 2 | Reflects the actual month-end market price movement of one share as it has traded on the NYSE. |
Morningstar Style Map™ As of 12/31/24
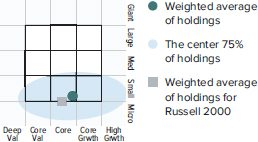
The Morningstar Style Map is the Morningstar Style Box™ with the center 75% of fund holdings plotted as the Morningstar Ownership Zone™. The Morningstar Style Box is designed to reveal a fund’s investment strategy. The Morningstar Ownership Zone provides detail about a portfolio’s investment style by showing the range of stock sizes and styles. The Ownership Zone is derived by plotting each stock in the portfolio within the proprietary Morningstar Style Box. Over time, the shape and location of a fund's ownership zone may vary. See page 65 for additional information.
Value of $10,000
Invested on 11/26/86 as of 12/31/24 ($)
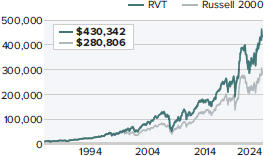
Top 10 Positions
% of Net Assets
| Assured Guaranty | 1.5 |
| PAR Technology | 1.4 |
| IES Holdings | 1.4 |
| SEI Investments | 1.3 |
| Enovis Corporation | 1.1 |
| Air Lease Cl. A | 1.1 |
| Impinj | 1.0 |
| Brady Corporation Cl. A | 1.0 |
| E-L Financial | 1.0 |
| Haemonetics Corporation | 1.0 |
Portfolio Sector Breakdown
% of Net Assets
| Industrials | 23.7 |
| Financials | 21.8 |
| Information Technology | 16.8 |
| Health Care | 9.4 |
| Consumer Discretionary | 9.3 |
| Materials | 7.1 |
| Real Estate | 3.2 |
| Communication Services | 2.9 |
| Consumer Staples | 2.3 |
| Energy | 2.1 |
| Utilities | 0.2 |
| Cash and Cash Equivalents, Net of | |
| Outstanding Line of Credit | 1.2 |
| Calendar Year Total Returns (%) |
| YEAR | RVT |
| 2024 | 12.6 |
| 2023 | 21.6 |
| 2022 | -21.2 |
| 2021 | 20.0 |
| 2020 | 21.9 |
| 2019 | 30.5 |
| 2018 | -14.4 |
| 2017 | 19.4 |
| 2016 | 26.8 |
| 2015 | -8.1 |
| 2014 | 0.8 |
| 2013 | 34.1 |
| 2012 | 15.4 |
| 2011 | -10.1 |
| 2010 | 30.3 |
| | |
| Portfolio Diagnostics | |
| Fund Net Assets | $1,998 million |
| Number of Holdings | 483 |
| Turnover Rate | 40% |
| Net Asset Value | $16.99 |
| Market Price | $15.80 |
| Average Market Capitalization 1 | $3,053 million |
| Weighted Average P/E Ratio 2,3 | 17.1x |
| Weighted Average P/B Ratio 2 | 2.1x |
| Active Share 4 | 79% |
| U.S. Investments (% of Net Assets) | 83.9% |
| Non-U.S. Investments (% of Net Assets) | 14.9% |
| 1 | Geometric Average. This weighted calculation uses each portfolio holding’s market cap in a way designed to not skew the effect of very large or small holdings; instead, it aims to better identify the portfolio’s center, which Royce believes offers a more accurate measure of average market cap than a simple mean or median. |
| 2 | Harmonic Average. This weighted calculation evaluates a portfolio as if it were a single stock and measures it overall. It compares the total market value of the portfolio to the portfolio’s share in the earnings or book value, as the case may be, of its underlying stocks. |
| 3 | The Fund’s P/E Ratio calculation excludes companies with zero or negative earnings (17% of portfolio holdings as of 12/31/24). |
| 4 | Active Share is the sum of the absolute values of the different weightings of each holding in the Fund versus each holding in the benchmark, divided by two. |
Important Performance and Risk Information
All performance information reflects past performance, is presented on a total return basis, net of the Fund’s investment advisory fee, reflects the reinvestment of distributions and does not reflect the deduction of taxes that a shareholder would pay on fund distributions or the sale of fund shares. Past performance is no guarantee of future results. Current month-end performance may be higher or lower than performance quoted and may be obtained at www.royceinvest.com. Certain immaterial adjustments were made to the net assets of Royce Small-Cap Trust at 12/31/22 for financial reporting purposes, and as a result the net asset value originally calculated on that date and the total return based on that net asset value differs from the adjusted net asset value and total return reported in the Financial Highlights. The market price of the Fund’s shares will fluctuate, so that shares may be worth more or less than their original cost when sold. The Fund invests primarily in securities of small- and micro-cap companies, which may involve considerably more risk than investing in larger-cap companies. The Fund’s broadly diversified portfolio does not ensure a profit or guarantee against loss. From time to time, the Fund may invest a significant portion of its net assets in foreign securities, which may involve political, economic, currency and other risks not encountered in U.S. investments. Regarding the “Top Contributors” and “Top Detractors” tables shown above, the sum of all contributors to, and all detractors from, performance for all securities in the portfolio would approximate the Fund’s year-to-date performance for 2024.
2024 Annual Report to Stockholders | 43
Royce Small-Cap Trust
Schedule of Investments
Common Stocks — 98.2%
| | | SHARES | | | VALUE |
| | | | | | |
| COMMUNICATION SERVICES – 2.9% | | | | | | | |
| DIVERSIFIED TELECOMMUNICATION SERVICES – 0.3% | | | | | | | |
| Cogent Communications Holdings 1 | | | 18,176 | | | $ | 1,400,824 |
| IDT Corporation Cl. B | | | 62,622 | | | | 2,975,797 |
| Liberty Latin America Cl. C 1,2,3 | | | 83,228 | | | | 527,666 |
| | | | | | | | 4,904,287 |
| ENTERTAINMENT – 0.3% | | | | | | | |
| IMAX Corporation 3 | | | 262,660 | | | | 6,724,096 |
| INTERACTIVE MEDIA & SERVICES – 1.9% | | | | | | | |
| Cars.com 3 | | | 197,759 | | | | 3,427,164 |
| QuinStreet 1,3 | | | 203,754 | | | | 4,700,605 |
| † Reddit Cl. A 3 | | | 33,000 | | | | 5,393,520 |
| Shutterstock | | | 130,086 | | | | 3,948,110 |
| TripAdvisor 3 | | | 75,630 | | | | 1,117,055 |
| Yelp 3 | | | 50,349 | | | | 1,948,506 |
| Ziff Davis 1,3 | | | 326,203 | | | | 17,725,871 |
| | | | | | | | 38,260,831 |
| MEDIA – 0.3% | | | | | | | |
| AMC Networks Cl. A 3 | | | 135,962 | | | | 1,346,024 |
| John Wiley & Sons Cl. A | | | 23,592 | | | | 1,031,206 |
| Scholastic Corporation | | | 43,724 | | | | 932,633 |
| TechTarget 3 | | | 30,000 | | | | 594,600 |
| †TEGNA | | | 31,586 | | | | 577,708 |
| Thryv Holdings 3 | | | 124,969 | | | | 1,849,541 |
| | | | | | | | 6,331,712 |
| WIRELESS TELECOMMUNICATION SERVICES – 0.1% | | | | | | | |
| Gogo 3 | | | 150,855 | | | | 1,220,417 |
| Total (Cost $60,914,451) | | | | | | | 57,441,343 |
| | | | | | | | |
| CONSUMER DISCRETIONARY – 9.3% | | | | | | | |
| AUTOMOBILE COMPONENTS - 2.0% | | | | | | | |
| Dorman Products 1,2,3 | | | 128,552 | | | | 16,653,912 |
| Garrett Motion 3 | | | 224,085 | | | | 2,023,488 |
| Gentex Corporation 1 | | | 56,334 | | | | 1,618,476 |
| LCI Industries 1 | | | 105,814 | | | | 10,940,109 |
| †Modine Manufacturing 3 | | | 28,365 | | | | 3,288,354 |
| Patrick Industries 1 | | | 46 | | | | 3,822 |
| †PHINIA | | | 25,140 | | | | 1,210,994 |
| Standard Motor Products | | | 41,802 | | | | 1,295,026 |
| Visteon Corporation 3 | | | 40,003 | | | | 3,549,066 |
| | | | | | | | 40,583,247 |
| | | | | | | | |
| BROADLINE RETAIL – 0.1% | | | | | | | |
| Etsy 3 | | | 45,852 | | | | 2,425,112 |
| DIVERSIFIED CONSUMER SERVICES – 1.1% | | | | | | | |
| Adtalem Global Education 3 | | | 2,187 | | | | 198,689 |
| †Bright Horizons Family Solutions 3 | | | 4,000 | | | | 443,400 |
| †OneSpaWorld Holdings | | | 25,000 | | | | 497,500 |
| Perdoceo Education | | | 83,728 | | | | 2,216,280 |
| Stride 3 | | | 26,644 | | | | 2,769,111 |
| Universal Technical Institute 3 | | | 639,032 | | | | 16,429,513 |
| | | | | | | | 22,554,493 |
| HOTELS, RESTAURANTS & LEISURE – 0.4% | | | | | | | |
| †DraftKings Cl. A 3 | | | 8,000 | | | | 297,600 |
| †Kura Sushi USA Cl. A 3 | | | 2,500 | | | | 226,450 |
| †Life Time Group Holdings 3 | | | 26,000 | | | | 575,120 |
| Lindblad Expeditions Holdings 3 | | | 373,700 | | | | 4,432,082 |
| Monarch Casino & Resort | | | 17,950 | | | | 1,416,255 |
| | | | | | | | 6,947,507 |
| HOUSEHOLD DURABLES – 1.1% | | | | | | | |
| Cavco Industries 1,2,3 | | | 15,121 | | | | 6,747,444 |
| Champion Homes 3 | | | 34,468 | | | | 3,036,631 |
| Ethan Allen Interiors 1 | | | 16,648 | | | | 467,975 |
| Helen of Troy 3 | | | 5,940 | | | | 355,390 |
| Installed Building Products | | | 16,123 | | | | 2,825,556 |
| M/I Homes 3 | | | 43,876 | | | | 5,833,314 |
| Meritage Homes | | | 5,526 | | | | 850,009 |
| †Sonos 3 | | | 23,766 | | | | 357,441 |
| Tri Pointe Homes 3 | | | 24,107 | | | | 874,120 |
| Worthington Enterprises | | | 37,175 | | | | 1,491,089 |
| | | | | | | | 22,838,969 |
| LEISURE PRODUCTS – 0.4% | | | | | | | |
| Brunswick Corporation 1 | | | 49,208 | | | | 3,182,774 |
| †Revelyst 3 | | | 11,128 | | | | 213,991 |
| YETI Holdings 3 | | | 121,371 | | | | 4,673,997 |
| | | | | | | | 8,070,762 |
| SPECIALTY RETAIL – 3.6% | | | | | | | |
| Abercrombie & Fitch Cl. A 3 | | | 7,457 | | | | 1,114,598 |
| Academy Sports & Outdoors | | | 222,000 | | | | 12,771,660 |
| Advance Auto Parts | | | 243,080 | | | | 11,495,253 |
| American Eagle Outfitters | | | 9,306 | | | | 155,131 |
| America's Car-Mart 1,2,3 | | | 87,700 | | | | 4,494,625 |
| Asbury Automotive Group 3 | | | 15,500 | | | | 3,766,965 |
| AutoCanada 3 | | | 625,600 | | | | 7,542,278 |
| Buckle (The) | | | 11,929 | | | | 606,112 |
| Guess? | | | 77,366 | | | | 1,087,766 |
| Monro | | | 34,770 | | | | 862,296 |
| Murphy USA | | | 15,803 | | | | 7,929,155 |
| ODP Corporation (The) 3 | | | 25,339 | | | | 576,209 |
| OneWater Marine Cl. A 3 | | | 209,873 | | | | 3,647,593 |
| Signet Jewelers | | | 98,617 | | | | 7,959,378 |
| Valvoline 3 | | | 204,548 | | | | 7,400,547 |
| | | | | | | | 71,409,566 |
| | | | | | | | |
| TEXTILES, APPAREL & LUXURY GOODS – 0.6% | | | | | | | |
| G-III Apparel Group 3 | | | 24,943 | | | | 813,641 |
| Kontoor Brands | | | 23,140 | | | | 1,976,388 |
| Movado Group | | | 82,305 | | | | 1,619,762 |
| Ralph Lauren Cl. A | | | 14,350 | | | | 3,314,563 |
| Steven Madden | | | 92,252 | | | | 3,922,555 |
| | | | | | | | 11,646,909 |
| Total (Cost $150,964,418) | | | | | | | 186,476,565 |
| | | | | | | | |
| CONSUMER STAPLES – 2.3% | | | | | | | |
| BEVERAGES – 0.2% | | | | | | | |
| Celsius Holdings 3 | | | 1,000 | | | | 26,340 |
| †Primo Brands Cl. A | | | 126,278 | | | | 3,885,574 |
| | | | | | | | 3,911,914 |
| CONSUMER STAPLES DISTRIBUTION & RETAIL – 0.2% | | | | | | | |
| †Guardian Pharmacy Services Cl. A 3 | | | 38,000 | | | | 769,880 |
| PriceSmart | | | 20,922 | | | | 1,928,381 |
| | | | | | | | 2,698,261 |
| FOOD PRODUCTS – 1.4% | | | | | | | |
| Cal-Maine Foods | | | 7,633 | | | | 785,588 |
| Freshpet 1,3 | | | 3,500 | | | | 518,385 |
| John B. Sanfilippo & Son | | | 19,651 | | | | 1,711,799 |
| Nomad Foods 1 | | | 486,865 | | | | 8,169,595 |
| Seneca Foods Cl. A 3 | | | 183,460 | | | | 14,541,039 |
| †WK Kellogg | | | 105,134 | | | | 1,891,361 |
| | | | | | | | 27,617,767 |
| 44 | 2024 Annual Report to Stockholders | THE ACCOMPANYING NOTES ARE AN INTEGRAL PART OF THESE FINANCIAL STATEMENTS |
December 31, 2024
Schedule of Investments (continued)
| | | SHARES | | | VALUE |
| | | | | | |
| CONSUMER STAPLES (continued) | | | | | | | |
| HOUSEHOLD PRODUCTS – 0.1% | | | | | | | |
| Central Garden & Pet 3 | | | 35,150 | | | $ | 1,363,820 |
| †Central Garden & Pet Cl. A 3 | | | 2,242 | | | | 74,098 |
| WD-40 Company | | | 1,799 | | | | 436,581 |
| | | | | | | | 1,874,499 |
| PERSONAL CARE PRODUCTS – 0.4% | | | | | | | |
| Interparfums 1 | | | 53,861 | | | | 7,083,260 |
| USANA Health Sciences 3 | | | 36,823 | | | | 1,321,578 |
| | | | | | | | 8,404,838 |
| TOBACCO - 0.0% | | | | | | | |
| Universal Corporation | | | 11,105 | | | | 608,998 |
| Total (Cost $28,379,217) | | | | | | | 45,116,277 |
| | | | | | | | |
| ENERGY – 2.1% | | | | | | | |
| ENERGY EQUIPMENT & SERVICES – 1.3% | | | | | | | |
| Bristow Group 1,3 | | | 219,464 | | | | 7,527,615 |
| †Cactus Cl. A | | | 18,208 | | | | 1,062,619 |
| Core Laboratories 1,2 | | | 130,893 | | | | 2,265,758 |
| Helmerich & Payne | | | 31,688 | | | | 1,014,650 |
| †Liberty Energy Cl. A | | | 47,855 | | | | 951,836 |
| Pason Systems | | | 999,060 | | | | 9,459,255 |
| ProPetro Holding Corp. 3 | | | 40,050 | | | | 373,666 |
| RPC | | | 296,047 | | | | 1,758,519 |
| †Weatherford International | | | 24,287 | | | | 1,739,678 |
| | | | | | | | 26,153,596 |
| OIL, GAS & CONSUMABLE FUELS – 0.8% | | | | | | | |
| California Resources | | | 21,286 | | | | 1,104,530 |
| CONSOL Energy 1 | | | 12,686 | | | | 1,353,342 |
| †Crescent Energy Cl. A | | | 6,954 | | | | 101,598 |
| CVR Energy 1 | | | 94,508 | | | | 1,771,080 |
| Dorchester Minerals L.P. 1 | | | 279,148 | | | | 9,304,003 |
| †Matador Resources | | | 1,816 | | | | 102,168 |
| Northern Oil & Gas | | | 2,749 | | | | 102,153 |
| Par Pacific Holdings 3 | | | 4,835 | | | | 79,246 |
| REX American Resources 3 | | | 33,352 | | | | 1,390,445 |
| World Kinect | | | 25,164 | | | | 692,262 |
| | | | | | | | 16,000,827 |
| Total (Cost $36,143,225) | | | | | | | 42,154,423 |
| | | | | | | | |
| FINANCIALS – 21.8% | | | | | | | |
| BANKS - 4.3% | | | | | | | |
| Atlantic Union Bankshares | | | 36,000 | | | | 1,363,680 |
| Axos Financial 3 | | | 24,608 | | | | 1,718,869 |
| Banc of California | | | 230,698 | | | | 3,566,591 |
| Bank of N.T. Butterfield & Son 1 | | | 226,503 | | | | 8,278,685 |
| BankUnited 1 | | | 262,336 | | | | 10,013,365 |
| Cathay General Bancorp | | | 50,203 | | | | 2,390,165 |
| Central Pacific Financial | | | 23,541 | | | | 683,866 |
| †Coastal Financial 3 | | | 15,001 | | | | 1,273,735 |
| Customers Bancorp 3 | | | 26,781 | | | | 1,303,699 |
| Dime Community Bancshares | | | 5,936 | | | | 182,443 |
| Eagle Bancorp | | | 47,322 | | | | 1,231,792 |
| First Bancorp | | | 14,000 | | | | 615,580 |
| First Citizens BancShares Cl. A | | | 3,282 | | | | 6,934,932 |
| First Commonwealth Financial | | | 65,862 | | | | 1,114,385 |
| First Financial Bancorp | | | 101,922 | | | | 2,739,663 |
| †First Financial Bankshares | | | 32,025 | | | | 1,154,501 |
| Fulton Financial | | | 12,348 | | | | 238,069 |
| German American Bancorp | | | 26,791 | | | | 1,077,534 |
| Glacier Bancorp | | | 5,000 | | | | 251,100 |
| Hanmi Financial | | | 189,347 | | | | 4,472,376 |
| HBT Financial | | | 20,000 | | | | 438,000 |
| Hingham Institution for Savings | | | 14,999 | | | | 3,811,846 |
| Home BancShares | | | 152,117 | | | | 4,304,911 |
| Hope Bancorp | | | 15,529 | | | | 190,851 |
| †Northeast Bank | | | 13,357 | | | | 1,225,238 |
| OceanFirst Financial | | | 40,266 | | | | 728,814 |
| Origin Bancorp | | | 270,640 | | | | 9,009,606 |
| Pathward Financial | | | 16,614 | | | | 1,222,458 |
| Preferred Bank | | | 23,210 | | | | 2,004,880 |
| Provident Financial Services | | | 44,601 | | | | 841,621 |
| S&T Bancorp | | | 34,172 | | | | 1,306,054 |
| †Seacoast Banking Corporation of Florida | | | 15,500 | | | | 426,715 |
| TowneBank | | | 20,000 | | | | 681,200 |
| TrustCo Bank Corp NY | | | 15,835 | | | | 527,464 |
| Veritex Holdings | | | 20,857 | | | | 566,476 |
| WaFd | | | 21,058 | | | | 678,910 |
| †Westamerica Bancorporation 1 | | | 27,456 | | | | 1,440,342 |
| Western Alliance Bancorp 1,2 | | | 55,415 | | | | 4,629,369 |
| WSFS Financial | | | 8,732 | | | | 463,931 |
| | | | | | | | 85,103,716 |
| CAPITAL MARKETS – 7.5% | | | | | | | |
| Acadian Asset Management | | | 49,071 | | | | 1,292,530 |
| Ares Management Cl. A 1 | | | 34,800 | | | | 6,160,644 |
| Artisan Partners Asset Management Cl. A 1 | | | 241,858 | | | | 10,411,987 |
| Bolsa Mexicana de Valores | | | 1,723,106 | | | | 2,767,580 |
| †Brookfield Asset Management Cl. A | | | 7,378 | | | | 399,814 |
| †Cohen & Steers | | | 8,997 | | | | 830,783 |
| Donnelley Financial Solutions 1,2,3 | | | 35,500 | | | | 2,226,915 |
| Evercore Cl. A | | | 23,411 | | | | 6,489,295 |
| GCM Grosvenor Cl. A | | | 801,494 | | | | 9,834,331 |
| Houlihan Lokey Cl. A 1 | | | 28,581 | | | | 4,963,377 |
| Lazard 1 | | | 102,457 | | | | 5,274,486 |
| †Marex Group | | | 296,667 | | | | 9,247,110 |
| MarketWise Cl. A | | | 500,000 | | | | 283,750 |
| Morningstar 1 | | | 14,516 | | | | 4,888,408 |
| Onex Corporation | | | 171,437 | | | | 13,391,037 |
| †Perella Weinberg Partners Cl. A | | | 187,296 | | | | 4,465,137 |
| SEI Investments 1 | | | 324,994 | | | | 26,805,505 |
| Silvercrest Asset Management Group Cl. A | | | 23,192 | | | | 426,501 |
| Sprott | | | 264,413 | | | | 11,141,602 |
| Tel Aviv Stock Exchange 4 | | | 221,179 | | | | 2,565,282 |
| TMX Group | | | 478,421 | | | | 14,737,544 |
| Tradeweb Markets Cl. A | | | 51,167 | | | | 6,698,784 |
| Victory Capital Holdings | | | 30,918 | | | | 2,023,892 |
| Virtu Financial Cl. A | | | 65,000 | | | | 2,319,200 |
| | | | | | | | 149,645,494 |
| CONSUMER FINANCE – 1.2% | | | | | | | |
| Bread Financial Holdings 1 | | | 123,697 | | | | 7,552,939 |
| Encore Capital Group 1,2,3 | | | 25,000 | | | | 1,194,250 |
| Enova International 3 | | | 55,322 | | | | 5,304,273 |
| †FirstCash Holdings | | | 61,403 | | | | 6,361,351 |
| PRA Group 3 | | | 98,876 | | | | 2,065,520 |
| PROG Holdings | | | 30,865 | | | | 1,304,355 |
| World Acceptance 3 | | | 7,896 | | | | 887,826 |
| | | | | | | | 24,670,514 |
| THE ACCOMPANYING NOTES ARE AN INTEGRAL PART OF THESE FINANCIAL STATEMENTS | 2024 Annual Report to Stockholders | 45 |
Royce Small-Cap Trust
Schedule of Investments (continued)
| | | SHARES | | | VALUE |
| | | | | | |
| FINANCIALS (continued) | | | | | | | |
| FINANCIAL SERVICES – 1.9% | | | | | | | |
| Banco Latinoamericano de Comercio | | | | | | | |
| Exterior Cl. E | | | 103,446 | | | $ | 3,679,574 |
| Burford Capital | | | 175,000 | | | | 2,231,250 |
| †Cantaloupe 3 | | | 72,000 | | | | 684,720 |
| Compass Diversified Holdings 1,2 | | | 99,872 | | | | 2,305,046 |
| ECN Capital | | | 888,800 | | | | 1,953,882 |
| EVERTEC | | | 3,284 | | | | 113,397 |
| †Jackson Financial | | | 9,318 | | | | 811,411 |
| †Merchants Bancorp | | | 92,746 | | | | 3,382,447 |
| †NCR Atleos 3 | | | 37,137 | | | | 1,259,687 |
| NewtekOne | | | 314,894 | | | | 4,021,196 |
| NMI Holdings 3 | | | 135,771 | | | | 4,990,942 |
| †Payoneer Global 3 | | | 250,578 | | | | 2,515,803 |
| Radian Group | | | 88,108 | | | | 2,794,786 |
| Repay Holdings Cl. A 3 | | | 145,000 | | | | 1,106,350 |
| Shift4 Payments Cl. A 3 | | | 50,000 | | | | 5,189,000 |
| WEX 3 | | | 5,470 | | | | 959,000 |
| | | | | | | | 37,998,491 |
| INSURANCE – 6.9% | | | | | | | |
| †Abacus Life 3 | | | 315,431 | | | | 2,469,825 |
| Ambac Financial Group 3 | | | 72,934 | | | | 922,615 |
| AMERISAFE | | | 36,243 | | | | 1,867,964 |
| Assured Guaranty | | | 329,587 | | | | 29,666,126 |
| Axis Capital Holdings | | | 75,304 | | | | 6,673,441 |
| Berkley (W.R.) | | | 110,054 | | | | 6,440,360 |
| E-L Financial | | | 21,650 | | | | 19,956,346 |
| Employers Holdings | | | 38,535 | | | | 1,974,148 |
| Erie Indemnity Cl. A | | | 22,600 | | | | 9,316,398 |
| Genworth Financial 3 | | | 166,127 | | | | 1,161,228 |
| Hagerty Cl. A 3 | | | 485,700 | | | | 4,687,005 |
| †HCI Group | | | 8,722 | | | | 1,016,375 |
| International General Insurance Holdings | | | 614,732 | | | | 14,606,032 |
| †Lincoln National | | | 40,287 | | | | 1,277,501 |
| Mercury General | | | 7,563 | | | | 502,788 |
| ProAssurance Corporation 1,2,3 | | | 298,600 | | | | 4,750,726 |
| RenaissanceRe Holdings | | | 27,941 | | | | 6,952,000 |
| RLI Corp. 1 | | | 36,363 | | | | 5,993,713 |
| SiriusPoint 3 | | | 169,251 | | | | 2,774,024 |
| Skyward Specialty Insurance Group 3 | | | 27,473 | | | | 1,388,486 |
| White Mountains Insurance Group | | | 6,706 | | | | 13,043,572 |
| | | | | | | | 137,440,673 |
| Total (Cost $311,598,743) | | | | | | | 434,858,888 |
| | | | | | | | |
| HEALTH CARE – 9.4% | | | | | | | |
| BIOTECHNOLOGY – 1.8% | | | | | | | |
| †ADMA Biologics 3 | | | 225,193 | | | | 3,862,060 |
| †Alkermes 3 | | | 54,431 | | | | 1,565,435 |
| †Alvotech 3 | | | 27,000 | | | | 357,210 |
| †ARS Pharmaceuticals 3 | | | 121,627 | | | | 1,283,165 |
| †BridgeBio Pharma 3 | | | 77,429 | | | | 2,124,652 |
| CareDx 3 | | | 22,000 | | | | 471,020 |
| Catalyst Pharmaceuticals 3 | | | 502,126 | | | | 10,479,370 |
| Dynavax Technologies 3 | | | 88,800 | | | | 1,133,976 |
| Halozyme Therapeutics 3 | | | 66,320 | | | | 3,170,759 |
| †Insmed 3 | | | 48,062 | | | | 3,318,200 |
| Ironwood Pharmaceuticals Cl. A 3 | | | 709,188 | | | | 3,141,703 |
| †Protagonist Therapeutics 3 | | | 5,157 | | | | 199,060 |
| PureTech Health 3,4 | | | 120,000 | | | | 224,916 |
| United Therapeutics 3 | | | 10,000 | | | | 3,528,400 |
| †Viking Therapeutics 3 | | | 40,266 | | | | 1,620,304 |
| | | | | | | | 36,480,230 |
| HEALTH CARE EQUIPMENT & SUPPLIES – 3.3% | | | | | | | |
| Alphatec Holdings 3 | | | 239,739 | | | | 2,200,804 |
| Embecta Corp. | | | 47,716 | | | | 985,335 |
| Enovis Corporation 3 | | | 510,611 | | | | 22,405,611 |
| †Envista Holdings 3 | | | 121,983 | | | | 2,353,052 |
| Haemonetics Corporation 1,3 | | | 247,590 | | | | 19,331,827 |
| Integer Holdings 1,2,3 | | | 45,700 | | | | 6,056,164 |
| Lantheus Holdings 3 | | | 19,932 | | | | 1,783,117 |
| †Omnicell 3 | | | 16,037 | | | | 713,967 |
| OraSure Technologies 3 | | | 53,410 | | | | 192,810 |
| TransMedics Group 3 | | | 150,000 | | | | 9,352,500 |
| Varex Imaging 3 | | | 37,500 | | | | 547,125 |
| | | | | | | | 65,922,312 |
| HEALTH CARE PROVIDERS & SERVICES – 0.6% | | | | | | | |
| Addus HomeCare 1,3 | | | 7,567 | | | | 948,523 |
| AMN Healthcare Services 1,2,3 | | | 17,412 | | | | 416,495 |
| †Astrana Health 3 | | | 11,940 | | | | 376,468 |
| †Concentra Group Holdings Parent | | | 77,388 | | | | 1,530,735 |
| CorVel Corporation 3 | | | 2,880 | | | | 320,429 |
| Hims & Hers Health Cl. A 3 | | | 32,000 | | | | 773,760 |
| Owens & Minor 3 | | | 77,993 | | | | 1,019,369 |
| †PACS Group 3 | | | 128,954 | | | | 1,690,587 |
| Pediatrix Medical Group 3 | | | 193,506 | | | | 2,538,799 |
| Premier Cl. A | | | 8,846 | | | | 187,535 |
| †Progyny 3 | | | 19,639 | | | | 338,773 |
| Select Medical Holdings | | | 95,900 | | | | 1,807,715 |
| †Surgery Partners 3 | | | 13,037 | | | | 275,993 |
| †Talkspace 3 | | | 92,260 | | | | 285,083 |
| | | | | | | | 12,510,264 |
| HEALTH CARE TECHNOLOGY – 0.2% | | | | | | | |
| Simulations Plus 1 | | | 87,548 | | | | 2,441,714 |
| Veradigm 3,4 | | | 217,435 | | | | 2,065,632 |
| | | | | | | | 4,507,346 |
| LIFE SCIENCES TOOLS & SERVICES – 2.2% | | | | | | | |
| Azenta 1,3 | | | 219,100 | | | | 10,955,000 |
| BioLife Solutions 3 | | | 124,138 | | | | 3,222,623 |
| Bio-Techne 1 | | | 130,411 | | | | 9,393,504 |
| Maravai LifeSciences Holdings Cl. A 3 | | | 328,252 | | | | 1,788,973 |
| Mesa Laboratories 1,2 | | | 93,595 | | | | 12,342,373 |
| Stevanato Group | | | 234,767 | | | | 5,115,573 |
| | | | | | | | 42,818,046 |
| PHARMACEUTICALS – 1.3% | | | | | | | |
| Amphastar Pharmaceuticals 3 | | | 6,630 | | | | 246,172 |
| †Axsome Therapeutics 3 | | | 8,500 | | | | 719,185 |
| Collegium Pharmaceutical 3 | | | 42,878 | | | | 1,228,455 |
| Corcept Therapeutics 3 | | | 276,300 | | | | 13,922,757 |
| Harmony Biosciences Holdings 1,2,3 | | | 78,385 | | | | 2,697,228 |
| †Harrow 3 | | | 7,500 | | | | 251,625 |
| Innoviva 3 | | | 51,935 | | | | 901,072 |
| Intra-Cellular Therapies 3 | | | 10,000 | | | | 835,200 |
| Ligand Pharmaceuticals 3 | | | 1,568 | | | | 168,011 |
| †Organon & Co | | | 36,287 | | | | 541,402 |
| Prestige Consumer Healthcare 3 | | | 56,300 | | | | 4,396,467 |
| 46 | 2024 Annual Report to Stockholders | THE ACCOMPANYING NOTES ARE AN INTEGRAL PART OF THESE FINANCIAL STATEMENTS |
December 31, 2024
Schedule of Investments (continued)
| | | SHARES | | | VALUE |
| HEALTH CARE (continued) | | | | | | | |
| PHARMACEUTICALS (continued) | | | | | | | |
| Supernus Pharmaceuticals 3 | | | 9,624 | | | $ | 348,004 |
| | | | | | | | 26,255,578 |
| Total (Cost $176,281,988) | | | | | | | 188,493,776 |
| | | | | | | | |
| INDUSTRIALS – 23.7% | | | | | | | |
| AEROSPACE & DEFENSE – 0.9% | | | | | | | |
| AeroVironment 3 | | | 2,000 | | | | 307,780 |
| †Kratos Defense & Security Solutions 3 | | | 143,481 | | | | 3,785,029 |
| Leonardo DRS 3 | | | 204,774 | | | | 6,616,248 |
| Magellan Aerospace | | | 943,092 | | | | 6,606,794 |
| National Presto Industries | | | 4,379 | | | | 430,981 |
| | | | | | | | 17,746,832 |
| AIR FREIGHT & LOGISTICS – 0.3% | | | | | | | |
| Forward Air 1,3 | | | 78,333 | | | | 2,526,239 |
| Hub Group Cl. A | | | 54,165 | | | | 2,413,593 |
| | | | | | | | 4,939,832 |
| BUILDING PRODUCTS – 1.7% | | | | | | | |
| American Woodmark 3 | | | 10,031 | | | | 797,766 |
| Apogee Enterprises | | | 27,316 | | | | 1,950,636 |
| AZZ 1 | | | 20,000 | | | | 1,638,400 |
| Carlisle Companies | | | 6,830 | | | | 2,519,177 |
| CSW Industrials | | | 41,355 | | | | 14,590,044 |
| Gibraltar Industries 3 | | | 25,320 | | | | 1,491,348 |
| Insteel Industries | | | 13,432 | | | | 362,798 |
| Janus International Group 3 | | | 350,678 | | | | 2,577,483 |
| †MasterBrand 3 | | | 126,914 | | | | 1,854,214 |
| Quanex Building Products | | | 29,587 | | | | 717,189 |
| Resideo Technologies 3 | | | 20,988 | | | | 483,773 |
| Simpson Manufacturing 1 | | | 14,900 | | | | 2,470,867 |
| UFP Industries | | | 29,374 | | | | 3,308,981 |
| | | | | | | | 34,762,676 |
| COMMERCIAL SERVICES & SUPPLIES – 2.1% | | | | | | | |
| ACV Auctions Cl. A 3 | | | 97,800 | | | | 2,112,480 |
| Brady Corporation Cl. A 1 | | | 271,792 | | | | 20,071,839 |
| CompX International Cl. A 1 | | | 183,197 | | | | 4,790,602 |
| Healthcare Services Group 3 | | | 389,372 | | | | 4,522,556 |
| HNI Corporation | | | 7,774 | | | | 391,576 |
| Liquidity Services 3 | | | 27,837 | | | | 898,857 |
| Montrose Environmental Group 3 | | | 36,355 | | | | 674,385 |
| RB Global 1 | | | 40,437 | | | | 3,647,822 |
| UniFirst Corporation | | | 10,100 | | | | 1,728,009 |
| †Vestis Corporation | | | 129,942 | | | | 1,980,316 |
| VSE Corporation | | | 3,250 | | | | 309,075 |
| | | | | | | | 41,127,517 |
| CONSTRUCTION & ENGINEERING – 4.5% | | | | | | | |
| APi Group 1,2,3 | | | 492,120 | | | | 17,701,556 |
| Arcosa 1 | | | 197,407 | | | | 19,097,153 |
| Comfort Systems USA 1 | | | 845 | | | | 358,331 |
| EMCOR Group | | | 1,300 | | | | 590,070 |
| IES Holdings 1,3 | | | 135,872 | | | | 27,304,837 |
| †Limbach Holdings 3 | | | 32,017 | | | | 2,738,734 |
| MasTec 3 | | | 78,980 | | | | 10,752,337 |
| Sterling Infrastructure 3 | | | 15,670 | | | | 2,639,612 |
| Valmont Industries 1 | | | 30,432 | | | | 9,332,582 |
| | | | | | | | 90,515,212 |
| ELECTRICAL EQUIPMENT – 2.0% | | | | | | | |
| Atkore | | | 59,974 | | | | 5,004,830 |
| LSI Industries | | | 496,657 | | | | 9,645,079 |
| †Nextracker Cl. A 3 | | | 89,327 | | | | 3,263,115 |
| Powell Industries | | | 60,343 | | | | 13,375,026 |
| Preformed Line Products | | | 32,816 | | | | 4,193,557 |
| Vertiv Holdings Cl. A | | | 45,379 | | | | 5,155,508 |
| | | | | | | | 40,637,115 |
| GROUND TRANSPORTATION – 0.5% | | | | | | | |
| Hertz Global Holdings 3 | | | 239,496 | | | | 876,555 |
| Landstar System 1 | | | 52,586 | | | | 9,037,430 |
| | | | | | | | 9,913,985 |
| MACHINERY – 5.4% | | | | | | | |
| Atmus Filtration Technologies | | | 212,284 | | | | 8,317,287 |
| ATS Corporation 3 | | | 14,000 | | | | 426,978 |
| Enpro | | | 40,557 | | | | 6,994,055 |
| ESAB Corporation 1 | | | 137,267 | | | | 16,463,804 |
| ESCO Technologies 1 | | | 59,877 | | | | 7,976,215 |
| Franklin Electric | | | 3,973 | | | | 387,169 |
| Helios Technologies 1 | | | 44,900 | | | | 2,004,336 |
| JBT Marel 1 | | | 119,357 | | | | 15,170,275 |
| Kadant 1 | | | 29,601 | | | | 10,212,049 |
| Lincoln Electric Holdings 1 | | | 3,984 | | | | 746,881 |
| Lindsay Corporation 1 | | | 63,313 | | | | 7,490,561 |
| Miller Industries | | | 52,164 | | | | 3,409,439 |
| Mueller Industries 1 | | | 24,879 | | | | 1,974,397 |
| RBC Bearings 3 | | | 5,200 | | | | 1,555,528 |
| Standex International | | | 7,560 | | | | 1,413,644 |
| Tennant Company 1 | | | 80,500 | | | | 6,563,165 |
| Timken Company (The) | | | 68,051 | | | | 4,856,800 |
| Titan International 3 | | | 72,015 | | | | 488,982 |
| Wabash National | | | 64,256 | | | | 1,100,705 |
| Watts Water Technologies Cl. A 1 | | | 46,400 | | | | 9,433,120 |
| | | | | | | | 106,985,390 |
| MARINE TRANSPORTATION – 0.2% | | | | | | | |
| Kirby Corporation 3 | | | 33,694 | | | | 3,564,825 |
| Matson | | | 1,910 | | | | 257,544 |
| | | | | | | | 3,822,369 |
| PASSENGER AIRLINES – 0.1% | | | | | | | |
| †SkyWest 3 | | | 18,664 | | | | 1,868,826 |
| Sun Country Airlines Holdings 3 | | | 22,044 | | | | 321,402 |
| | | | | | | | 2,190,228 |
| PROFESSIONAL SERVICES – 2.3% | | | | | | | |
| †Amentum Holdings 3 | | | 22,500 | | | | 473,175 |
| CBIZ 1,3 | | | 108,915 | | | | 8,912,515 |
| CSG Systems International | | | 7,045 | | | | 360,070 |
| Dun & Bradstreet Holdings | | | 311,126 | | | | 3,876,630 |
| Exponent | | | 23,900 | | | | 2,129,490 |
| Forrester Research 1,2,3 | | | 416,105 | | | | 6,520,365 |
| Heidrick & Struggles International | | | 19,748 | | | | 875,034 |
| Jacobs Solutions 1 | | | 22,500 | | | | 3,006,450 |
| KBR 1 | | | 139,154 | | | | 8,061,191 |
| Korn Ferry 1 | | | 124,145 | | | | 8,373,580 |
| Paylocity Holding 3 | | | 3,000 | | | | 598,410 |
| Resources Connection | | | 66,283 | | | | 565,394 |
| Robert Half | | | 11,685 | | | | 823,325 |
| †Verra Mobility Cl. A 3 | | | 49,620 | | | | 1,199,812 |
| | | | | | | | 45,775,441 |
| TRADING COMPANIES & DISTRIBUTORS – 3.7% | | | | | | | |
| Air Lease Cl. A 1 | | | 436,795 | | | | 21,057,887 |
| Applied Industrial Technologies | | | 23,836 | | | | 5,708,007 |
| THE ACCOMPANYING NOTES ARE AN INTEGRAL PART OF THESE FINANCIAL STATEMENTS | 2024 Annual Report to Stockholders | 47 |
Royce Small-Cap Trust
Schedule of Investments (continued)
| | | SHARES | | | VALUE |
| | | | | | |
| INDUSTRIALS (continued) | | | | | | | |
| TRADING COMPANIES & DISTRIBUTORS (continued) | | | | | | | |
| Boise Cascade 1 | | | 8,331 | | | $ | 990,223 |
| Distribution Solutions Group 3 | | | 96,456 | | | | 3,318,086 |
| DNOW 3 | | | 75,996 | | | | 988,708 |
| FTAI Aviation | | | 100,618 | | | | 14,493,017 |
| GMS 3 | | | 6,826 | | | | 579,049 |
| MSC Industrial Direct Cl. A | | | 61,317 | | | | 4,579,767 |
| †Teqnion 3,4 | | | 191,300 | | | | 2,857,818 |
| Transcat 3 | | | 160,728 | | | | 16,995,379 |
| †WESCO International | | | 14,990 | | | | 2,712,590 |
| | | | | | | | 74,280,531 |
| Total (Cost $285,746,430) | | | | | | | 472,697,128 |
| | | | | | | | |
| INFORMATION TECHNOLOGY–16.8% | | | | | | | |
| COMMUNICATIONS EQUIPMENT – 0.7% | | | | | | | |
| †Ciena Corporation 3 | | | 63,205 | | | | 5,360,416 |
| Digi International 3 | | | 64,057 | | | | 1,936,443 |
| Extreme Networks 3 | | | 98,165 | | | | 1,643,282 |
| Harmonic 3 | | | 260,843 | | | | 3,450,953 |
| NetScout Systems 3 | | | 56,948 | | | | 1,233,494 |
| | | | | | | | 13,624,588 |
| ELECTRONIC EQUIPMENT, INSTRUMENTS & COMPONENTS – 7.5% | | | | | | | |
| Badger Meter | | | 4,481 | | | | 950,510 |
| Bel Fuse Cl. B | | | 34,676 | | | | 2,859,730 |
| Benchmark Electronics | | | 33,923 | | | | 1,540,104 |
| Cognex Corporation 1 | | | 342,696 | | | | 12,289,079 |
| Coherent Corp. 1,2,3 | | | 78,861 | | | | 7,470,502 |
| Crane NXT | | | 162,257 | | | | 9,446,603 |
| CTS Corporation 1,2 | | | 29,048 | | | | 1,531,701 |
| ePlus 3 | | | 20,776 | | | | 1,534,931 |
| Fabrinet 1,3 | | | 23,849 | | | | 5,243,918 |
| FARO Technologies 1,2,3 | | | 228,848 | | | | 5,803,585 |
| Insight Enterprises 3 | | | 12,021 | | | | 1,828,394 |
| IPG Photonics 3 | | | 51,100 | | | | 3,715,992 |
| †Knowles Corporation 3 | | | 67,141 | | | | 1,338,120 |
| Littelfuse 1 | | | 34,070 | | | | 8,028,595 |
| Luna Innovations 3 | | | 657,869 | | | | 1,420,997 |
| Mirion Technologies Cl. A 3 | | | 253,000 | | | | 4,414,850 |
| NAPCO Security Technologies | | | 168,430 | | | | 5,989,371 |
| PAR Technology 1,2,3 | | | 389,239 | | | | 28,285,998 |
| PC Connection | | | 28,878 | | | | 2,000,379 |
| Plexus 3 | | | 2,652 | | | | 414,985 |
| Richardson Electronics | | | 433,407 | | | | 6,080,700 |
| Rogers Corporation 1,3 | | | 100,924 | | | | 10,254,888 |
| Sanmina Corporation 3 | | | 70,124 | | | | 5,306,283 |
| ScanSource 3 | | | 21,545 | | | | 1,022,310 |
| Teledyne Technologies 3 | | | 9,660 | | | | 4,483,496 |
| TTM Technologies 1,2,3 | | | 341,192 | | | | 8,444,502 |
| Vishay Intertechnology | | | 25,900 | | | | 438,746 |
| Vontier Corporation | | | 223,144 | | | | 8,138,062 |
| | | | | | | | 150,277,331 |
| IT SERVICES – 1.2% | | | | | | | |
| †DXC Technology 3 | | | 114,931 | | | | 2,296,321 |
| Hackett Group (The) 1 | | | 392,058 | | | | 12,044,022 |
| Kyndryl Holdings 3 | | | 289,529 | | | | 10,017,704 |
| | | | | | | | 24,358,047 |
| SEMICONDUCTORS & SEMICONDUCTOR EQUIPMENT – 5.4% | | | | | | | |
| Axcelis Technologies 3 | | | 58,678 | | | | 4,099,832 |
| Camtek | | | 60,199 | | | | 4,862,273 |
| Cirrus Logic 1,3 | | | 84,328 | | | | 8,397,382 |
| Cohu 1,2,3 | | | 155,038 | | | | 4,139,515 |
| Diodes 1,2,3 | | | 79,173 | | | | 4,882,599 |
| FormFactor 3 | | | 267,791 | | | | 11,782,804 |
| Impinj 1,2,3 | | | 144,114 | | | | 20,934,000 |
| Kulicke & Soffa Industries 1 | | | 107,092 | | | | 4,996,913 |
| MaxLinear 3 | | | 41,310 | | | | 817,112 |
| MKS Instruments | | | 75,791 | | | | 7,911,823 |
| Nova 3 | | | 23,713 | | | | 4,670,275 |
| Onto Innovation 1,2,3 | | | 57,596 | | | | 9,599,525 |
| PDF Solutions 3 | | | 12,000 | | | | 324,960 |
| Penguin Solutions 3 | | | 30,126 | | | | 578,118 |
| Photronics 3 | | | 248,033 | | | | 5,843,657 |
| Rambus 3 | | | 64,651 | | | | 3,417,452 |
| Semtech Corporation 3 | | | 7,500 | | | | 463,875 |
| Silicon Laboratories 3 | | | 4,000 | | | | 496,880 |
| Silicon Motion Technology ADR | | | 1,596 | | | | 86,264 |
| SiTime Corporation 3 | | | 11,023 | | | | 2,364,764 |
| Synaptics 3 | | | 14,316 | | | | 1,092,597 |
| Ultra Clean Holdings 3 | | | 168,361 | | | | 6,052,578 |
| | | | | | | | 107,815,198 |
| SOFTWARE – 2.0% | | | | | | | |
| Adeia 1 | | | 172,775 | | | | 2,415,395 |
| Agilysys 1,2,3 | | | 68,187 | | | | 8,980,910 |
| Alkami Technology 1,3 | | | 61,449 | | | | 2,253,949 |
| †Blend Labs Cl. A 3 | | | 120,000 | | | | 505,200 |
| †Clearwater Analytics Holdings Cl. A 3 | | | 13,000 | | | | 357,760 |
| Computer Modelling Group | | | 614,611 | | | | 4,553,624 |
| Consensus Cloud Solutions 1,2,3 | | | 45,599 | | | | 1,087,992 |
| †Coveo Solutions 3 | | | 151,000 | | | | 670,201 |
| †CyberArk Software 3 | | | 1,900 | | | | 632,985 |
| Descartes Systems Group (The) 3 | | | 8,500 | | | | 965,600 |
| InterDigital 1 | | | 11,173 | | | | 2,164,434 |
| JFrog 3 | | | 217,500 | | | | 6,396,675 |
| NCR Voyix 3 | | | 34,618 | | | | 479,113 |
| †NextNav 3 | | | 28,000 | | | | 435,680 |
| Progress Software | | | 52,529 | | | | 3,422,264 |
| PROS Holdings 3 | | | 46,664 | | | | 1,024,741 |
| Sapiens International | | | 151,351 | | | | 4,066,801 |
| | | | | | | | 40,413,324 |
| TECHNOLOGY HARDWARE, STORAGE & PERIPHERALS – 0.0% | | | | | | | |
| †Xerox Holdings | | | 36,854 | | | | 310,679 |
| Total (Cost $260,850,534) | | | | | | | 336,799,167 |
| | | | | | | | |
| MATERIALS – 6.5% | | | | | | | |
| CHEMICALS – 3.5% | | | | | | | |
| AdvanSix 1 | | | 4,685 | | | | 133,476 |
| Aspen Aerogels 3 | | | 118,727 | | | | 1,410,477 |
| Element Solutions 1 | | | 554,565 | | | | 14,102,588 |
| Hawkins 1 | | | 105,691 | | | | 12,965,115 |
| Ingevity Corporation 3 | | | 236,012 | | | | 9,617,489 |
| Innospec 1 | | | 117,315 | | | | 12,911,689 |
| NewMarket Corporation | | | 8,000 | | | | 4,226,800 |
| Quaker Houghton | | | 108,089 | | | | 15,214,607 |
| | | | | | | | 70,582,241 |
| CONSTRUCTION MATERIALS - 0.1% | | | | | | | |
| †Knife River 3 | | | 6,300 | | | | 640,332 |
| | | | | | | | |
| 48 | 2024 Annual Report to Stockholders | THE ACCOMPANYING NOTES ARE AN INTEGRAL PART OF THESE FINANCIAL STATEMENTS |
December 31, 2024
Schedule of Investments (continued)
| | | SHARES | | | VALUE |
| | | | | | | | |
| MATERIALS (continued) | | | | | | | |
| CONTAINERS & PACKAGING – 0.2% | | | | | | | |
| Sealed Air | | | 14,598 | | | $ | 493,850 |
| Silgan Holdings | | | 52,391 | | | | 2,726,952 |
| | | | | | | | 3,220,802 |
| METALS & MINING – 2.1% | | | | | | | |
| Alamos Gold Cl. A | | | 945,406 | | | | 17,442,114 |
| †Alpha Metallurgical Resources 3 | | | 2,287 | | | | 457,674 |
| †Arch Resources | | | 14,875 | | | | 2,100,648 |
| Gold Fields ADR | | | 536,500 | | | | 7,081,800 |
| IAMGOLD Corporation 3 | | | 500,000 | | | | 2,580,000 |
| Major Drilling Group International 3 | | | 1,496,691 | | | | 8,548,355 |
| Materion Corporation | | | 25,000 | | | | 2,472,000 |
| Metallus 3 | | | 56,120 | | | | 792,976 |
| Olympic Steel | | | 29,494 | | | | 967,698 |
| Warrior Met Coal | | | 2,949 | | | | 159,954 |
| | | | | | | | 42,603,219 |
| PAPER & FOREST PRODUCTS – 0.6% | | | | | | | |
| Clearwater Paper 3 | | | 36,477 | | | | 1,085,920 |
| Louisiana-Pacific | | | 32,272 | | | | 3,341,766 |
| Stella-Jones | | | 100,486 | | | | 4,976,589 |
| Sylvamo Corporation 1 | | | 35,191 | | | | 2,780,793 |
| | | | | | | | 12,185,068 |
| Total (Cost $80,792,590) | | | | | | | 129,231,662 |
| | | | | | | | |
| REAL ESTATE – 3.2% | | | | | | | |
| DIVERSIFIED REITS – 0.0% | | | | | | | |
| New York REIT 3,5 | | | 15,000 | | | | 163,200 |
| REAL ESTATE MANAGEMENT & DEVELOPMENT – 3.2% | | | | | | | |
| Colliers International Group | | | 59,511 | | | | 8,091,711 |
| FirstService Corporation | | | 90,772 | | | | 16,431,547 |
| FRP Holdings 1,3 | | | 108,661 | | | | 3,328,286 |
| Kennedy-Wilson Holdings 1 | | | 1,437,381 | | | | 14,359,436 |
| Marcus & Millichap 1 | | | 363,583 | | | | 13,910,686 |
| St. Joe Company (The) 1 | | | 78,800 | | | | 3,540,484 |
| Tejon Ranch 1,2,3 | | | 313,818 | | | | 4,989,706 |
| | | | | | | | 64,651,856 |
| Total (Cost $49,755,699) | | | | | | | 64,815,056 |
| | | | | | | | |
| UTILITIES – 0.2% | | | | | | | |
| ELECTRIC UTILITIES – 0.2% | | | | | | | |
| †MGE Energy | | | 16,281 | | | | 1,529,763 |
| Otter Tail | | | 28,555 | | | | 2,108,501 |
| | | | | | | | 3,638,264 |
| GAS UTILITIES – 0.0% | | | | | | | |
| Chesapeake Utilities | | | 4,708 | | | | 571,316 |
| Total (Cost $4,134,702) | | | | | | | 4,209,580 |
| | | | | | | | |
| TOTAL COMMON STOCKS | | | | | | | |
| (Cost $1,445,561,997) | | | | | | | 1,962,293,865 |
| | | | | | | | |
| INVESTMENT COMPANIES – 0.6% | | | | | | | |
| | | | | | | | |
| MATERIALS – 0.6% | | | | | | | |
| METALS & MINING – 0.6% | | | | | | | |
| VanEck Junior Gold Miners ETF | | | 293,758 | | | | 12,558,154 |
| Total (Cost $10,332,361) | | | | | | | 12,558,154 |
| | | | | | | | |
| INVESTMENTS AT VALUE | | | | | | | |
| (Cost $1,455,894,358) | | | | | | | 1,974,852,019 |
| | | | | | | | |
| REPURCHASE AGREEMENT– 3.0% | | | | | | | |
Fixed Income Clearing Corporation, 3.75% dated 12/31/24, due 1/2/25, maturity value $59,304,143 (collateralized by obligations of U.S. Government Agencies, 3.625% due 3/31/30, valued at $60,477,722) |
| (Cost $59,291,791) | | | | | | | 59,291,791 |
| | | | | | | | |
| TOTAL INVESTMENTS – 101.8% | | | | | | | |
| (Cost $1,515,186,149) | | | | | | | 2,034,143,810 |
| | | | | | | | |
| LIABILITIES LESS CASH AND OTHER ASSETS – (1.8)% | | | | | | | (35,686,789) |
| | | | | | | | |
| NET ASSETS – 100.0% | | | | | | $ | 1,998,457,021 |
For the purposes of this report, “ADR” shall mean American Depository Receipt and “ETF” shall mean Exchange-Traded Fund.
| 1 | All or a portion of these securities were pledged as collateral in connection with the Fund's revolving credit agreement as of December 31, 2024. Total market value of pledged securities as of December 31, 2024, was $70,156,761. |
| 2 | As of December 31, 2024, a portion of these securities, in the aggregate amount of $33,376,278, were rehypothecated by BNP Paribas Prime Brokerage International, Limited in connection with the Fund's revolving credit agreement. See Notes to Financial Statements. |
| 4 | These securities are defined as Level 2 securities due to fair value being based on quoted prices for similar securities and/or due to the application of fair value factors. See Notes to Financial Statements. |
| 5 | A security for which market quotations are not readily available represents 0.0% of net assets. This security has been valued at its fair value under procedures approved by the Fund's Board of Directors. This security is defined as a Level 3 security due to the use of significant unobservable inputs in the determination of fair value. See Notes to Financial Statements. |
Bold indicates the Fund’s 20 largest equity holdings in terms of December 31, 2024, market value.
TAX INFORMATION: The cost of total investments for Federal income tax purposes was $1,533,891,158. As of December 31, 2024, net unrealized appreciation for all securities was $500,252,652 consisting of aggregate gross unrealized appreciation of $618,304,599 and aggregate gross unrealized depreciation of $118,051,947. The primary causes of the difference between book and tax basis cost are the timing of the recognition of losses on securities sold, investments in publicly traded partnerships, investments in Real Estate Investment Trusts and mark-to-market of Passive Foreign Investment Companies.
| THE ACCOMPANYING NOTES ARE AN INTEGRAL PART OF THESE FINANCIAL STATEMENTS | 2024 Annual Report to Stockholders | 49 |
| Royce Small-Cap Trust | December 31, 2024 |
Statement of Assets and Liabilities
| ASSETS: | | | |
| Investments at value | | $ | 1,974,852,019 | |
| Repurchase agreements (at cost and value) | | | 59,291,791 | |
| Cash | | | 2,383 | |
| Foreign currency (cost $96,145) | | | 95,997 | |
| Receivable for investments sold | | | 615,966 | |
| Receivable for dividends and interest | | | 945,793 | |
| Prepaid expenses and other assets | | | 489,714 | |
| Total Assets | | | 2,036,293,663 | |
| LIABILITIES: | | | | |
| Revolving credit agreement | | | 35,000,000 | |
| Payable for investments purchased | | | 651,026 | |
| Payable for investment advisory fee | | | 1,658,282 | |
| Payable for directors’ fees | | | 45,758 | |
| Payable for interest expense | | | 171,286 | |
| Accrued expenses | | | 310,290 | |
| Total Liabilities | | | 37,836,642 | |
| Net Assets | | $ | 1,998,457,021 | |
| ANALYSIS OF NET ASSETS: | | | | |
| Paid-in capital - $0.001 par value per share; 117,623,696 shares outstanding (150,000,000 shares authorized) | | $ | 1,470,983,226 | |
| Total distributable earnings (loss) | | | 527,473,795 | |
| Net Assets (net asset value per share - $16.99) | | $ | 1,998,457,021 | |
| Investments at identified cost | | $ | 1,455,894,358 | |
| 50 | 2024 Annual Report to Stockholders | THE ACCOMPANYING NOTES ARE AN INTEGRAL PART OF THESE FINANCIAL STATEMENTS |
| Royce Small-Cap Trust | Year Ended December 31, 2024 |
Statement of Operations
| INVESTMENT INCOME: | | | |
| INCOME: | | | |
| Dividends | | $ | 21,765,219 | |
| Foreign withholding tax | | | (508,969 | ) |
| Interest | | | 2,342,845 | |
| Rehypothecation income | | | 283 | |
| Total income | | | 23,599,378 | |
| EXPENSES: | | | | |
| Investment advisory fees | | | 20,365,455 | |
| Interest expense | | | 2,255,867 | |
| Administrative and office facilities | | | 881,634 | |
| Stockholder reports | | | 384,253 | |
| Professional fees | | | 272,754 | |
| Custody and transfer agent fees | | | 230,562 | |
| Directors’ fees | | | 188,159 | |
| Other expenses | | | 198,714 | |
| Total expenses | | | 24,777,398 | |
| Net investment income (loss) | | | (1,178,020 | ) |
| REALIZED AND UNREALIZED GAIN (LOSS) ON INVESTMENTS AND FOREIGN CURRENCY: | | | | |
| NET REALIZED GAIN (LOSS): | | | | |
| Investments | | | 165,738,411 | |
| Foreign currency transactions | | | (17,671 | ) |
| NET CHANGE IN UNREALIZED APPRECIATION (DEPRECIATION): | | | | |
| Investments | | | 55,138,411 | |
| Other assets and liabilities denominated in foreign currency | | | 323 | |
| Net realized and unrealized gain (loss) on investments and foreign currency | | | 220,859,474 | |
| NET INCREASE (DECREASE) IN NET ASSETS FROM INVESTMENT OPERATIONS | | $ | 219,681,454 | |
| THE ACCOMPANYING NOTES ARE AN INTEGRAL PART OF THESE FINANCIAL STATEMENTS | 2024 Annual Report to Stockholders | 51 |
Royce Small-Cap Trust
Statement of Changes in Net Assets
| | | YEAR ENDED 12/31/24 | | | YEAR ENDED 12/31/23 | |
| | | | | | | |
| INVESTMENT OPERATIONS: | | | | | | | | |
| Net investment income (loss) | | $ | (1,178,020 | ) | | $ | (1,838,039 | ) |
| Net realized gain (loss) on investments and foreign currency | | | 165,720,740 | | | | 115,048,691 | |
| Net change in unrealized appreciation (depreciation) on investments and foreign currency | | | 55,138,734 | | | | 216,427,271 | |
| Net increase (decrease) in net assets from investment operations | | | 219,681,454 | | | | 329,637,923 | |
| DISTRIBUTIONS: | | | | | | | | |
| Total distributable earnings | | | (146,122,985 | ) | | | (119,069,508 | ) |
| Total distributions | | | (146,122,985 | ) | | | (119,069,508 | ) |
| CAPITAL STOCK TRANSACTIONS: | | | | | | | | |
| Reinvestment of distributions | | | 60,920,152 | | | | 48,230,613 | |
| Total capital stock transactions | | | 60,920,152 | | | | 48,230,613 | |
| Net Increase (Decrease) In Net Assets | | | 134,478,621 | | | | 258,799,028 | |
| NET ASSETS: | | | | | | | | |
| Beginning of year | | | 1,863,978,400 | | | | 1,605,179,372 | |
| End of year | | $ | 1,998,457,021 | | | $ | 1,863,978,400 | |
| 52 | 2024 Annual Report to Stockholders | THE ACCOMPANYING NOTES ARE AN INTEGRAL PART OF THESE FINANCIAL STATEMENTS |
| Royce Small-Cap Trust | Year Ended December 31, 2024 |
Statement of Cash Flows
| CASH FLOWS FROM OPERATING ACTIVITIES: | | | |
| Net increase (decrease) in net assets from investment operations | | $ | 219,681,454 | |
| Adjustments to reconcile net increase (decrease) in net assets from investment operations to net cash provided by operating activities: | | | | |
| Purchases of long-term investments | | | (775,390,923 | ) |
| Proceeds from sales and maturities of long-term investments | | | 862,469,441 | |
| Net purchases, sales and maturities of short-term investments | | | (467,114 | ) |
| Net (increase) decrease in dividends and interest receivable and other assets | | | 175,111 | |
| Net increase (decrease) in interest expense payable, accrued expenses and other liabilities | | | (373,025 | ) |
| Net change in unrealized appreciation (depreciation) on investments | | | (55,138,411 | ) |
| Net realized gain (loss) on investments | | | (165,738,411 | ) |
| Net cash provided by operating activities | | | 85,218,122 | |
| CASH FLOWS FROM FINANCING ACTIVITIES: | | | | |
| Distributions net of reinvestment (reinvestment $60,920,152) | | | (85,202,833 | ) |
| Decrease in payable to custodian for cash overdrawn and foreign currency | | | (841 | ) |
| Net cash used for financing activities | | | (85,203,674 | ) |
| INCREASE (DECREASE) IN CASH: | | | 14,448 | |
| Cash and foreign currency at beginning of year | | | 83,932 | |
| Cash and foreign currency at end of year | | $ | 98,380 | |
Supplemental disclosure of cash flow information:
For the year ended December 31, 2024, the Fund paid $2,281,087 in interest expense.
| THE ACCOMPANYING NOTES ARE AN INTEGRAL PART OF THESE FINANCIAL STATEMENTS | 2024 Annual Report to Stockholders | 53 |
Royce Small-Cap Trust
Financial Highlights
This table is presented to show selected data for a share of Common Stock outstanding throughout each period, and to assist stockholders in evaluating the Fund's performance for the periods presented.
| | | YEARS ENDED |
| | | 12/31/24 | | 12/31/23 | | 12/31/22 | | 12/31/21 | | 12/31/20 |
| Net Asset Value, Beginning of Period | | $ | 16.42 | | | $ | 14.60 | | | $ | 20.29 | | | $ | 18.52 | | | $ | 16.58 | |
| INVESTMENT OPERATIONS: | | | | | | | | | | | | | | | | | | | | |
| Net investment income (loss) | | | 0.00 | | | | (0.01 | ) | | | 0.06 | | | | 0.04 | 1 | | | 0.03 | |
| Net realized and unrealized gain (loss) on investments and foreign currency | | | 1.91 | | | | 2.96 | | | | (4.40 | ) | | | 3.46 | | | | 3.02 | |
| Net increase (decrease) in net assets from investment operations | | | 1.91 | | | | 2.95 | | | | (4.34 | ) | | | 3.50 | | | | 3.05 | |
| DISTRIBUTIONS: | | | | | | | | | | | | | | | | | | | | |
| Net investment income | | | (0.14 | ) | | | – | | | | (0.12 | ) | | | (0.02 | ) | | | (0.09 | ) |
| Net realized gain on investments and foreign currency | | | (1.13 | ) | | | (1.07 | ) | | | (1.01 | ) | | | (1.65 | ) | | | (0.95 | ) |
| Return of capital | | | – | | | | – | | | | (0.19 | ) | | | – | | | | – | |
| Total distributions | | | (1.27 | ) | | | (1.07 | ) | | | (1.32 | ) | | | (1.67 | ) | | | (1.04 | ) |
| CAPITAL STOCK TRANSACTIONS: | | | | | | | | | | | | | | | | | | | | |
| Effect of reinvestment of distributions by Common Stockholders | | | (0.07 | ) | | | (0.06 | ) | | | (0.03 | ) | | | (0.06 | ) | | | (0.07 | ) |
| Total capital stock transactions | | | (0.07 | ) | | | (0.06 | ) | | | (0.03 | ) | | | (0.06 | ) | | | (0.07 | ) |
| Net Asset Value, End of Period | | $ | 16.99 | | | $ | 16.42 | | | $ | 14.60 | | | $ | 20.29 | | | $ | 18.52 | |
| Market Value, End of Period | | $ | 15.80 | | | $ | 14.56 | | | $ | 13.26 | | | $ | 19.59 | | | $ | 16.14 | |
| TOTAL RETURN:2 | | | | | | | | | | | | | | | | | | | | |
| Net Asset Value | | | 12.64 | % | | | 21.71 | % | | | (21.29 | )% | | | 19.97 | % | | | 21.85 | % |
| Market Value | | | 18.13 | % | | | 18.83 | % | | | (25.96 | )% | | | 32.91 | % | | | 19.20 | % |
| RATIOS BASED ON AVERAGE NET ASSETS: | | | | | | | | | | | | | | | | | | | | |
| Investment advisory fee expense3 | | | 1.04 | % | | | 1.17 | % | | | 0.74 | % | | | 1.02 | % | | | 1.15 | % |
| Other operating expenses | | | 0.23 | % | | | 0.24 | % | | | 0.23 | % | | | 0.13 | % | | | 0.19 | % |
| Total expenses (net) | | | 1.27 | % | | | 1.41 | % | | | 0.97 | % | | | 1.15 | % | | | 1.34 | % |
| Expenses excluding interest expense | | | 1.15 | % | | | 1.29 | % | | | 0.86 | % | | | 1.11 | % | | | 1.26 | % |
| Expenses prior to balance credits | | | 1.27 | % | | | 1.41 | % | | | 0.97 | % | | | 1.15 | % | | | 1.34 | % |
| Net investment income (loss) | | | (0.06 | )% | | | (0.11 | )% | | | 0.39 | % | | | 0.21 | %1 | | | 0.16 | % |
| SUPPLEMENTAL DATA: | | | | | | | | | | | | | | | | | | | | |
| Net Assets, End of Period (in thousands) | | $ | 1,998,457 | | | $ | 1,863,978 | | | $ | 1,605,179 | | | $ | 2,149,870 | | | $ | 1,888,606 | |
| Portfolio Turnover Rate | | | 40 | % | | | 67 | % | | | 60 | % | | | 44 | % | | | 36 | % |
| REVOLVING CREDIT AGREEMENT: | | | | | | | | | | | | | | | | | | | | |
| Asset coverage | | | 5810 | % | | | 5426 | % | | | 4686 | % | | | 3171 | % | | | 2798 | % |
| Asset coverage per $1,000 | | $ | 58,099 | | | $ | 54,257 | | | $ | 46,862 | | | $ | 31,712 | | | $ | 27,980 | |
| 1 | A special distribution from ECN Capital resulted in an increase in net investment income (loss) per share of $0.05 and an increase in the ratio of net investment income (loss) to average net assets of 0.26%. |
| 2 | The Market Value Total Return is calculated assuming a purchase of Common Stock on the opening of the first business day and a sale on the closing of the last business day of each period. Dividends and distributions are assumed for the purposes of this calculation to be reinvested at prices obtained under the Fund's Distribution Reinvestment and Cash Purchase Plan. Net Asset Value Total Return is calculated on the same basis, except that the Fund's net asset value is used on the purchase, sale and dividend reinvestment dates instead of market value. |
| 3 | The investment advisory fee is calculated based on average net assets over a rolling 60-month basis, while the above ratios of investment advisory fee expenses are based on the average net assets over a 12-month basis. |
| 54 | 2024 Annual Report to Stockholders | THE ACCOMPANYING NOTES ARE AN INTEGRAL PART OF THESE FINANCIAL STATEMENTS |
Royce Small-Cap Trust
Notes to Financial Statements
Summary of Significant Accounting Policies:
Royce Small-Cap Trust, Inc. (formerly Royce Value Trust, Inc.) (the “Fund”), is a diversified closed-end investment company that was incorporated under the laws of the State of Maryland on July 1, 1986. The Fund commenced operations on November 26, 1986.
The preparation of financial statements in conformity with accounting principles generally accepted in the United States of America requires management to make estimates and assumptions that affect the reported amounts of assets and liabilities and the disclosure of contingent assets and liabilities at the date of the financial statements and the reported amounts of income and expenses during the reporting period. Actual results could differ from those estimates.
The Fund is an investment company registered under the Investment Company Act of 1940 (the “1940 Act”) and accordingly follows the investment company accounting and reporting guidance of the Financial Accounting Standards Board (FASB) Accounting Standard Codification Topic 946 “Financial Services-Investment Companies.”
Royce & Associates, LP, the Fund’s investment adviser, is a majority-owned subsidiary of Franklin Resources, Inc. and primarily conducts business using the name Royce Investment Partners (“Royce”).
VALUATION OF INVESTMENTS:
Portfolio securities held by the Fund are valued as of the close of trading on the New York Stock Exchange (“NYSE”) (generally 4:00 p.m. Eastern time) on the valuation date. Investments in money market funds are valued at net asset value per share. Values for non-U.S. dollar denominated equity securities are converted to U.S. dollars daily based upon prevailing foreign currency exchange rates as quoted by a major bank.
Portfolio securities that are listed on an exchange or Nasdaq, or traded on OTC Market Group Inc.’s OTC Link ATS or other alternative trading system, are valued: (i) on the basis of their last reported sales prices or official closing prices, as applicable, on a valuation date; or (ii) at their highest reported bid prices in the event such equity securities did not trade on a valuation date. Such inputs are generally referred to as “Level 1” inputs because they represent reliable quoted prices in active markets for identical securities.
If the value of a portfolio security held by the Fund cannot be determined solely by reference to Level 1 inputs, such portfolio security will be “fair valued.” The Fund’s Board of Directors has designated Royce as valuation designee to perform fair value determinations for such portfolio securities in accordance with Rule 2a-5 under the 1940 Act (“Rule 2a-5”). Pursuant to Rule 2a-5, fair values are determined in accordance with policies and procedures approved by the Fund’s Board of Directors and policies and procedures adopted by Royce in its capacity as valuation designee for the Fund. Fair valued securities are reported as either “Level 2” or “Level 3” securities.
As a general principle, the fair value of a security is the amount which the Fund might reasonably expect to receive for the security upon its current sale. However, in light of the judgment involved in fair valuations, no assurance can be given that a fair value assigned to a particular portfolio security will be the amount which the Fund might be able to receive upon its current sale. When a fair value pricing methodology is used, the fair value prices used by the Fund for such securities will likely differ from the quoted or published prices for the same securities.
Level 2 inputs are other significant observable inputs (e.g., dealer bid side quotes and quoted prices for securities with comparable characteristics). Examples of situations in which Level 2 inputs are used to fair value portfolio securities held by the Fund on a particular valuation date include:
| ● | Over-the-counter equity securities other than those traded on OTC Market Group Inc.’s OTC Link ATS or other alternative trading system (collectively referred to herein as “Other OTC Equity Securities”) are fair valued at their highest bid price when Royce receives at least two bid side quotes from dealers who make markets in such securities; |
| ● | Certain bonds and other fixed income securities may be fair valued by reference to other securities with comparable ratings, interest rates, and maturities in accordance with valuation methodologies maintained by certain independent pricing services; and |
| ● | The Fund uses an independent pricing service to fair value certain non-U.S. equity securities when U.S. market volatility exceeds a certain threshold set by Royce as valuation designee. This pricing service uses proprietary correlations it has developed between the movement of prices of non-U.S. equity securities and indices of U.S.-traded securities, futures contracts, and other indications to estimate the fair value of such non-U.S. securities. |
Level 3 inputs are significant unobservable inputs. Examples of Level 3 inputs include (without limitation) the last trade price for a security before trading was suspended or terminated; discounts to last trade price for lack of marketability or otherwise; market price information regarding other securities; information received from the issuer and/or published documents, including SEC filings and financial statements; and other publicly available information. Pursuant to the above-referenced policies and procedures, Royce may use
2024 Annual Report to Stockholders | 55
Royce Small-Cap Trust
Notes to Financial Statements (continued)
VALUATION OF INVESTMENTS (continued):
various techniques in making fair value determinations based upon Level 3 inputs, which techniques may include (without limitation): (i) workout valuation methods (e.g., earnings multiples, discounted cash flows, liquidation values, derivations of book value, firm or probable offers from qualified buyers for the issuer’s ongoing business, etc.); (ii) discount or premium from market, or compilation of other observable market information, for other similar freely traded securities; (iii) conversion from the readily available market price of a security into which an affected security is convertible or exchangeable; and (iv) pricing models or other formulas.
A security that is valued by reference to Level 1 or Level 2 inputs may drop to Level 3 on a particular valuation date for several reasons, including if:
| ● | an equity security that is listed on an exchange or Nasdaq, or traded on OTC Market Group Inc.’s OTC Link ATS or other alternative trading system, has not traded and there are no bids; |
| ● | Royce does not receive at least two bid side quotes for an Other OTC Equity Security; |
| ● | the independent pricing services are unable to supply fair value prices; or |
| ● | the Level 1 or Level 2 inputs become otherwise unreliable for any reason (e.g., a significant event occurs after the close of trading for a security but prior to the time the Fund prices its shares). |
The table below shows the aggregate value of the various Level 1, Level 2, and Level 3 securities held by the Fund as of December 31, 2024. Any Level 2 or Level 3 securities held by the Fund are noted in its Schedule of Investments. The inputs or methodology used for valuing securities are not necessarily an indication of the risk associated with owning those securities.
| | | LEVEL 1 | | | LEVEL 2 | | | LEVEL 3 | | | TOTAL | |
| Common Stocks | | $1,954,417,017 | | | $ 7,713,648 | | | $163,200 | | | $1,962,293,865 | |
| Investment Companies | | 12,558,154 | | | – | | | – | | | 12,558,154 | |
| Repurchase Agreement | | – | | | 59,291,791 | | | – | | | 59,291,791 | |
Level 3 Reconciliation:
| | | | | | NET CHANGE IN | | |
| | | | | | UNREALIZED GAIN (LOSS) 1 | | |
| | BALANCE AS OF | | | REALIZED GAIN (LOSS) 1 | CURRENTLY HELD | SECURITIES NO | BALANCE AS OF | |
| | 12/31/23 | PURCHASES | SALES | SECURITIES | LONGER HELD | 12/31/24 | |
| Common Stocks | $995,360 | $ – | $1,040,200 | $(308,284) | $0 | $516,324 | $163,200 | |
| 1 | The net change in unrealized appreciation (depreciation) is included in the accompanying Statement of Operations. Change in unrealized appreciation (depreciation) includes net unrealized appreciation (depreciation) resulting from changes in investment values during the reporting period and the reversal of previously recorded unrealized appreciation (depreciation) when gains or losses are realized. Net realized gain (loss) from investments and foreign currency transactions is included in the accompanying Statement of Operations. |
REPURCHASE AGREEMENTS:
The Fund may enter into repurchase agreements with institutions that the Fund’s investment adviser has determined are creditworthy. The Fund restricts repurchase agreements to maturities of no more than seven days. Securities pledged as collateral for repurchase agreements, which are held until maturity of the repurchase agreements, are marked-to-market daily and maintained at a value at least equal to the principal amount of the repurchase agreement (including accrued interest). Repurchase agreements could involve certain risks in the event of default or insolvency of the counter-party, including possible delays or restrictions upon the ability of the Fund to dispose of its underlying securities. The remaining contractual maturity of the repurchase agreement held by the Fund as of December 31, 2024, is next business day and continuous.
FOREIGN CURRENCY:
Net realized foreign exchange gains or losses arise from sales and maturities of short-term securities, sales of foreign currencies, expiration of currency forward contracts, currency gains or losses realized between the trade and settlement dates on securities transactions, and the difference between the amounts of dividends, interest, and foreign withholding taxes recorded on the Fund’s books and the U.S. dollar equivalent of the amounts actually received or paid. Net unrealized foreign exchange gains and losses arise from changes in the value of assets and liabilities, other than investments in securities at the end of the reporting period, as a result of changes in foreign currency exchange rates.
The Fund does not isolate that portion of the results of operations resulting from fluctuations in foreign exchange rates on investments from the fluctuations arising from changes in market prices of securities held. Such fluctuations are included with the net realized and unrealized gain or loss on investments.
For the purposes of the Statement of Cash Flows, the Fund defines Cash as cash, including foreign currency.
56 | 2024 Annual Report to Stockholders
Royce Small-Cap Trust
Notes to Financial Statements (continued)
TAXES:
As a qualified regulated investment company under Subchapter M of the Internal Revenue Code, the Fund is not subject to income taxes to the extent that it distributes substantially all of its taxable income for its fiscal year. The Schedule of Investments includes information regarding income taxes under the caption “Tax Information.”
DISTRIBUTIONS:
The Fund pays quarterly distributions on the Fund’s Common Stock at the annual rate of 7% of the rolling average of the prior four calendar quarter-end NAVs of the Fund’s Common Stock, with the fourth quarter distribution being the greater of 1.75% of the rolling average or the distribution required by IRS regulations. Distributions to Common Stockholders are recorded on ex-dividend date. To the extent that distributions in any year are not paid from long-term capital gains, net investment income or net short-term capital gains, they will represent a return of capital. Distributions are determined in accordance with income tax regulations that may differ from accounting principles generally accepted in the United States of America. Permanent book and tax differences relating to stockholder distributions will result in reclassifications within the capital accounts. Undistributed net investment income may include temporary book and tax basis differences, which will reverse in a subsequent period. Any taxable income or gain remaining undistributed at fiscal year end is distributed in the following year.
INVESTMENT TRANSACTIONS AND RELATED INVESTMENT INCOME:
Investment transactions are accounted for on the trade date. Dividend income is recorded on the ex-dividend date except for certain dividends from securities where the dividend rate is not available. In such cases, the dividend is recorded as soon as the information is received by the Fund. Non-cash dividend income is recorded at the fair market value of the securities received. Interest income is recorded on an accrual basis. Premiums and discounts on debt securities are amortized using the effective yield-to-maturity method. Realized gains and losses from investment transactions are determined on the basis of identified cost for book and tax purposes.
CASH INCLUDING FOREIGN CURRENCIES:
Cash, including foreign currencies, consists of deposits maintained at State Street Bank and Trust Company, the Fund’s Custodian (in such capacity, the “Custodian”), and through the Custodian’s global sub-custodian network. Accordingly, the Fund’s risk for the possible insolvency loss of a cash deposit lies with the Custodian or the relevant sub-custodian bank. Fund cash deposits maintained at the Custodian or through a particular sub-custodian bank may be significant, and may, at times, exceed U.S. or other applicable insurance limits.
EXPENSES:
The Fund incurs direct and indirect expenses. Expenses directly attributable to the Fund are charged to the Fund, while expenses applicable to more than one of the Royce Funds are allocated equitably. Certain personnel, occupancy costs and other administrative expenses related to all of the Royce Funds are allocated by Royce under an administration agreement and are included in administrative and office facilities and professional fees.
INDEMNIFICATION PROVISIONS:
Reference is made to Maryland law, the Fund’s Articles of Incorporation, as amended and supplemented, and the Fund’s Amended and Restated By-laws, each of which provides for the indemnification by the Fund of the Fund’s officers and directors under the circumstances and to the extent set forth therein. Reference is also made to the investment advisory agreement between the Fund and Royce which provides for the indemnification by the Fund of Royce under the circumstances and to the extent set forth therein. Additionally, in the normal course of business, the Fund enters into contracts with service providers that contain general indemnification provisions in favor of such service providers and other covered persons. The amount of any potential Fund liability under these indemnification arrangements, if any, currently cannot be determined with any degree of specificity. The Fund is not currently in possession of any information that would cause it to believe that the Fund is reasonably likely to be subject to any material adverse impact from the operation of these indemnification arrangements. No assurance can be given, however, that the Fund will not incur any liability from the operation of these indemnification arrangements. Any future liability to the Fund that may arise from the operation of such arrangements will be disclosed to the extent required by relevant accounting guidance and applicable laws, rules, and regulations.
Capital Stock:
The Fund issued 4,114,483 and 3,593,871 shares of Common Stock as reinvestment of distributions for the years ended December 31, 2024, and December 31, 2023, respectively.
2024 Annual Report to Stockholders | 57
Royce Small-Cap Trust
Notes to Financial Statements (continued)
Borrowings:
The Fund is party to a revolving credit agreement (the “credit agreement”) with BNP Paribas Prime Brokerage International, Limited (BNPPI). The Fund pays a commitment fee of 0.50% per annum on the unused portion of the then-current maximum amount that may be borrowed by the Fund under the credit agreement. The credit agreement has a 179-day rolling term that resets daily. The Fund pledges eligible portfolio securities as collateral and has granted a security interest in such pledged securities to, and in favor of, BNPPI as security for the loan balance outstanding. The amount of eligible portfolio securities required to be pledged as collateral is determined by BNPPI in accordance with the credit agreement. In determining collateral requirements, the value of eligible securities pledged as collateral is subject to discount by BNPPI based upon a variety of factors set forth in the credit agreement. As of December 31, 2024, the market value of eligible securities pledged as collateral exceeded two times the loan balance outstanding.
If the Fund fails to meet certain requirements, or comply with other financial covenants set forth in the credit agreement, the Fund may be required to repay immediately, in part or in full, the loan balance outstanding under the credit agreement, which may necessitate the sale of portfolio securities at potentially inopportune times. BNPPI may terminate the credit agreement upon certain ratings downgrades of its corporate parent, which would result in the Fund’s entire loan balance becoming immediately due and payable. The occurrence of such ratings downgrades may necessitate the sale of portfolio securities at potentially inopportune times. BNPPI may also terminate the credit agreement upon sixty (60) calendar days’ prior written notice to the Fund in the event the Fund’s net asset value per share as of the close of business on the last business day of any calendar month declines by thirty-five percent (35%) or more from the Fund’s net asset value per share as of the close of business on the last business day of the immediately preceding calendar month.
The credit agreement also permits, subject to certain conditions, BNPPI to rehypothecate portfolio securities pledged by the Fund up to the amount of the loan balance outstanding. The Fund continues to receive payments in lieu of dividends and interest on rehypothecated securities. The Fund also has the right under the credit agreement to recall the rehypothecated securities from BNPPI on demand. If BNPPI fails to deliver the recalled security in a timely manner, the Fund is compensated by BNPPI for any fees or losses related to the failed delivery or, in the event a recalled security is not returned by BNPPI, the Fund, upon notice to BNPPI, may reduce the loan balance outstanding by the value of the recalled security failed to be returned. The Fund receives a portion of the fees earned by BNPPI in connection with the rehypothecation of portfolio securities.
As of December 31, 2024, the Fund had outstanding borrowings of $35,000,000. The Fund has the right to reduce the maximum amount it can borrow under the credit agreement upon one (1) business day’s prior written notice to BNPPI. The maximum amount the Fund may borrow under the credit agreement was reduced to $0 as of January 31, 2025. In addition, the Fund and BNPPI may agree to increase the maximum amount the Fund can borrow under the credit agreement, which amount may not exceed $150,000,000.
During the year ended December 31, 2024, the Fund had an average daily loan balance of $35,000,000 at a weighted average borrowing cost of 6.34%. The maximum loan balance outstanding during the year ended December 31, 2024, was $35,000,000. As of December 31, 2024, the aggregate value of rehypothecated securities was $33,376,278. During the year ended December 31, 2024, the Fund earned $283 in fees from rehypothecated securities.
Investment Advisory Agreement:
As compensation for its services under the investment advisory agreement, Royce receives a fee comprised of a Basic Fee (“Basic Fee”) and an adjustment to the Basic Fee based on the investment performance of the Fund in relation to the investment record of the S&P SmallCap 600 Index (“S&P 600”). The fee is payable monthly.
The Basic Fee is a monthly fee equal to 1/12 of 1% (1% on an annualized basis) of the average of the Fund’s month-end net assets for the rolling 60-month period ending with such month (the “performance period”). The Basic Fee for each month is increased or decreased at the rate of 1/12 of .05% for each percentage point that the investment performance of the Fund exceeds, or is exceeded by, the percentage change in the investment record of the S&P 600 for the performance period by more than two percentage points. The performance period for each such month is a rolling 60-month period ending with such month. The maximum increase or decrease in the Basic Fee for any month may not exceed 1/12 of .5%. Accordingly, for each month, the maximum monthly fee rate as adjusted for performance is 1/12 of 1.5% and is payable if the investment performance of the Fund exceeds the percentage change in the investment record of the S&P 600 by 12 or more percentage points for the performance period, and the minimum monthly fee rate as adjusted for performance is 1/12 of .5% and is payable if the percentage change in the investment record of the S&P 600 exceeds the investment performance of the Fund by 12 or more percentage points for the performance period.
Notwithstanding the foregoing, Royce is not entitled to receive any fee for any month when the investment performance of the Fund for the rolling 36-month period ending with such month is negative. In the event that the Fund’s investment performance for such a performance period is less than zero, Royce will not be required to refund to the Fund any fee earned in respect of any prior performance period.
58 | 2024 Annual Report to Stockholders
Royce Small-Cap Trust
Notes to Financial Statements (continued)
Investment Advisory Agreement (continued):
For the twelve rolling 60-month periods in 2024, the Fund’s investment performance ranged from 4% above to 11% above the investment performance of the S&P 600. Accordingly, the net investment advisory fee consisted of a Basic Fee of $16,198,339 and a net upward adjustment of $4,167,116 for the performance of the Fund relative to that of the S&P 600. For the year ended December 31, 2024, the Fund expensed Royce investment advisory fees totaling $20,365,455.
Purchases and Sales of Investment Securities:
For the year ended December 31, 2024, the costs of purchases and proceeds from sales of investment securities, other than short-term securities, amounted to $771,403,962 and $841,049,707, respectively.
Cross trades were executed by the Fund pursuant to Rule 17a-7 under the 1940 Act. Cross trading is the buying or selling of portfolio securities between funds to which Royce or an affiliate of Franklin Resources, Inc. serves as investment adviser. The Fund’s Chief Compliance Officer reviews such transactions each quarter for compliance with the requirements and restrictions set forth by Rule 17a-7, and reports the results of that review to the Board of Directors. Cross trades for the year ended December 31, 2024, were as follows:
| COSTS OF PURCHASES | PROCEEDS FROM SALES | REALIZED GAIN (LOSS) |
| $2,165,163 | $372,299 | $(667,890) |
Tax Information:
Distributions during the years ended December 31, 2024 and 2023, were characterized as follows for tax purposes:
| ORDINARY INCOME | LONG-TERM CAPITAL GAINS |
| 2024 | 2023 | 2024 | 2023 |
| $29,913,265 | $15,316,939 | $116,209,720 | $103,752,569 |
The tax basis components of distributable earnings as of December 31, 2024, were as follows:
| | | | QUALIFIED LATE YEAR | |
| | | NET UNREALIZED | ORDINARY AND | TOTAL |
| UNDISTRIBUTED | UNDISTRIBUTED LONG-TERM | APPRECIATION | POST-OCTOBER LOSS | DISTRIBUTABLE |
| ORDINARY INCOME | CAPITAL GAINS | (DEPRECIATION)1 | DEFERRALS2 | EARNINGS |
| $4,200,299 | $23,032,909 | $500,252,377 | $(11,790) | $527,473,795 |
| 1 | Includes timing differences on foreign currency, recognition of losses on securities sold, investments in Real Estate Investment Trusts, investments in publicly traded partnerships and mark-to-market of Passive Foreign Investment Companies. |
| 2 | Under the current tax law, capital losses and qualified late year ordinary losses incurred after October 31 may be deferred and treated as occurring on the first day of the following fiscal year. |
For financial reporting purposes, capital accounts and distributions to stockholders are adjusted to reflect the tax character of permanent book/tax differences. For the year ended December 31, 2024, the Fund had no reclassifications.
Management has analyzed the Fund’s tax positions taken on federal income tax returns for all open tax years (2021-2024) and has concluded that as of December 31, 2024, no provision for income tax is required in the Fund’s financial statements.
Segment Reporting:
The Fund has adopted the Financial Accounting Standards Board (FASB) Accounting Standards Update (ASU) 2023-07, Segment Reporting (Topic 280) - Improvements to Segment Reporting Disclosures (the “Update”). The Update is limited to disclosure requirements and does not impact the Fund’s financial position or results of operations.
The Fund operates as a single operating segment, which is a segregated investment portfolio. Royce, in its capacity as investment manager, functions as the Chief Operating Decision Maker (CODM) for the Fund for purposes of the Update, evaluating its results and performance based upon its specific investment strategy and other relevant facts and circumstances. The CODM uses these measures to assess Fund performance and allocate resources effectively, subject to compliance with applicable legal and regulatory requirements and oversight from its Board of Directors. Internal reporting provided to the CODM aligns with the accounting policies and measurement principles used in the financial statements.
For information regarding segment assets, segment profit or loss, and significant expenses, refer to the Statement of Assets and Liabilities and the Statement of Operations, along with the related notes to the financial statements. The Schedule of Investments provides details of the Fund’s investments that generate returns such as interest, dividends, and realized and unrealized gains or losses. Performance metrics, including portfolio turnover and expense ratios, are disclosed in the Financial Highlights.
Subsequent Events:
Subsequent events have been evaluated through the date the financial statements were issued and it has been determined that no events have occurred that require disclosure.
2024 Annual Report to Stockholders | 59
Report of Independent Registered Public Accounting Firm
To the Board of Directors and Stockholders of Royce Small-Cap Trust, Inc.:
Opinion on the Financial Statements
We have audited the accompanying statement of assets and liabilities, including the schedule of investments, of Royce Small-Cap Trust, Inc. (the “Fund”) as of December 31, 2024, the related statements of operations and cash flows for the year ended December 31, 2024, the statement of changes in net assets for each of the two years in the period ended December 31, 2024, including the related notes, and the financial highlights for each of the five years in the period ended December 31, 2024 (collectively referred to as the “financial statements”). In our opinion, the financial statements present fairly, in all material respects, the financial position of the Fund as of December 31, 2024, the results of its operations and its cash flows for the year then ended, the changes in its net assets for each of the two years in the period ended December 31, 2024 and the financial highlights for each of the five years in the period ended December 31, 2024 in conformity with accounting principles generally accepted in the United States of America.
Basis for Opinion
These financial statements are the responsibility of the Fund’s management. Our responsibility is to express an opinion on the Fund’s financial statements based on our audits. We are a public accounting firm registered with the Public Company Accounting Oversight Board (United States) (PCAOB) and are required to be independent with respect to the Fund in accordance with the U.S. federal securities laws and the applicable rules and regulations of the Securities and Exchange Commission and the PCAOB.
We conducted our audits of these financial statements in accordance with the standards of the PCAOB. Those standards require that we plan and perform the audit to obtain reasonable assurance about whether the financial statements are free of material misstatement, whether due to error or fraud.
Our audits included performing procedures to assess the risks of material misstatement of the financial statements, whether due to error or fraud, and performing procedures that respond to those risks. Such procedures included examining, on a test basis, evidence regarding the amounts and disclosures in the financial statements. Our audits also included evaluating the accounting principles used and significant estimates made by management, as well as evaluating the overall presentation of the financial statements. Our procedures included confirmation of securities owned as of December 31, 2024 by correspondence with the custodian and brokers; when replies were not received from brokers, we performed other auditing procedures. We believe that our audits provide a reasonable basis for our opinion.
/s/PricewaterhouseCoopers LLP
New York, New York
February 21, 2025
We have served as the auditor of one or more investment companies in the Franklin Templeton Group of Funds since 1948.
60 | 2024 Annual Report to Stockholders
History Since Inception (unaudited)
The following table details the share accumulations by an initial investor in the Funds who reinvested all distributions and participated fully in primary subscriptions for each of the rights offerings. Full participation in distribution reinvestments and rights offerings can maximize the returns available to a long-term investor. This table should be read in conjunction with the Performance and Portfolio Reviews of the Funds.
| HISTORY | | | | AMOUNT INVESTED | | | PURCHASE PRICE 1 | | | SHARES | | | NAV VALUE 2 | | | MARKET VALUE 2 | |
| Royce Global Trust | | | | | | | | | | | | | | | | | | | |
| 10/17/13 | | Initial Purchase | | $ | 8,975 | | | $ | 8.975 | | | 1,000 | | | $ | 9,780 | | | $ | 8,975 | |
| 12/11/14 | | Distribution $0.15 | | | | | | | 7.970 | | | 19 | | | | 9,426 | | | | 8,193 | |
| 12/10/15 | | Distribution $0.10 | | | | | | | 7.230 | | | 14 | | | | 9,101 | | | | 7,696 | |
| 12/9/16 | | Distribution $0.14 | | | | | | | 7.940 | | | 18 | | | | 10,111 | | | | 8,446 | |
| 12/12/17 | | Distribution $0.11 | | | | | | | 10.610 | | | 11 | | | | 13,254 | | | | 11,484 | |
| 12/12/18 | | Distribution $0.04 | | | | | | | 8.500 | | | 5 | | | | 11,118 | | | | 9,475 | |
| 12/11/19 | | Distribution $0.06 | | | | | | | 10.670 | | | 6 | | | | 14,593 | | | | 12,543 | |
| 12/17/20 | | Distribution $1.19 | | | | | | | 13.441 | | | 95 | | | | 17,462 | | | | 15,604 | |
| 12/10/21 | | Distribution $2.75 | | | | | | | 12.498 | | | 257 | | | | 20,321 | | | | 18,696 | |
| 12/9/22 | | Distribution $0.133 | | | | | | | 8.821 | | | 21 | | | | 14,822 | | | | 12,508 | |
| 12/8/23 | | Distribution $0.15 | | | | | | | 9.430 | | | 23 | | | | 17,217 | | | | 14,323 | |
| 12/12/24 | | Distribution $0.47 | | | | | | | 10.671 | | | 65 | | | | | | | | | |
| 12/31/24 | | | | $ | 8,975 | | | | | | | 1,534 | | | $ | 19,252 | | | $ | 16,447 | |
| | | | | | | | | | | | | | | | | | | | | | |
| Royce Micro-Cap Trust | | | | | | | | | | | | | | | | | | | |
| 12/14/93 | | Initial Purchase | | $ | 7,500 | | | $ | 7.500 | | | 1,000 | | | $ | 7,250 | | | $ | 7,500 | |
| 10/28/94 | | Rights Offering | | | 1,400 | | | | 7.000 | | | 200 | | | | | | | | | |
| 12/19/94 | | Distribution $0.05 | | | | | | | 6.750 | | | 9 | | | | 9,163 | | | | 8,462 | |
| 12/7/95 | | Distribution $0.36 | | | | | | | 7.500 | | | 58 | | | | 11,264 | | | | 10,136 | |
| 12/6/96 | | Distribution $0.80 | | | | | | | 7.625 | | | 133 | | | | 13,132 | | | | 11,550 | |
| 12/5/97 | | Distribution $1.00 | | | | | | | 10.000 | | | 140 | | | | 16,694 | | | | 15,593 | |
| 12/7/98 | | Distribution $0.29 | | | | | | | 8.625 | | | 52 | | | | 16,016 | | | | 14,129 | |
| 12/6/99 | | Distribution $0.27 | | | | | | | 8.781 | | | 49 | | | | 18,051 | | | | 14,769 | |
| 12/6/00 | | Distribution $1.72 | | | | | | | 8.469 | | | 333 | | | | 20,016 | | | | 17,026 | |
| 12/6/01 | | Distribution $0.57 | | | | | | | 9.880 | | | 114 | | | | 24,701 | | | | 21,924 | |
| 2002 | | Annual distribution total $0.80 | | | | | | | 9.518 | | | 180 | | | | 21,297 | | | | 19,142 | |
| 2003 | | Annual distribution total $0.92 | | | | | | | 10.004 | | | 217 | | | | 33,125 | | | | 31,311 | |
| 2004 | | Annual distribution total $1.33 | | | | | | | 13.350 | | | 257 | | | | 39,320 | | | | 41,788 | |
| 2005 | | Annual distribution total $1.85 | | | | | | | 13.848 | | | 383 | | | | 41,969 | | | | 45,500 | |
| 2006 | | Annual distribution total $1.55 | | | | | | | 14.246 | | | 354 | | | | 51,385 | | | | 57,647 | |
| 2007 | | Annual distribution total $1.35 | | | | | | | 13.584 | | | 357 | | | | 51,709 | | | | 45,802 | |
| 2008 | | Annual distribution total $1.193 | | | | | | | 8.237 | | | 578 | | | | 28,205 | | | | 24,807 | |
| 3/11/09 | | Distribution $0.223 | | | | | | | 4.260 | | | 228 | | | | 41,314 | | | | 34,212 | |
| 12/2/10 | | Distribution $0.08 | | | | | | | 9.400 | | | 40 | | | | 53,094 | | | | 45,884 | |
| 2011 | | Annual distribution total $0.533 | | | | | | | 8.773 | | | 289 | | | | 49,014 | | | | 43,596 | |
| 2012 | | Annual distribution total $0.51 | | | | | | | 9.084 | | | 285 | | | | 57,501 | | | | 49,669 | |
| 2013 | | Annual distribution total $1.38 | | | | | | | 11.864 | | | 630 | | | | 83,110 | | | | 74,222 | |
| 2014 | | Annual distribution total $2.90 | | | | | | | 10.513 | | | 1,704 | | | | 86,071 | | | | 76,507 | |
| 2015 | | Annual distribution total $1.26 | | | | | | | 7.974 | | | 1,256 | | | | 75,987 | | | | 64,222 | |
| 2016 | | Annual distribution total $0.64 | | | | | | | 7.513 | | | 779 | | | | 92,689 | | | | 78,540 | |
| 2017 | | Annual distribution total $0.69 | | | | | | | 8.746 | | | 783 | | | | 109,076 | | | | 98,254 | |
| 2018 | | Annual distribution total $0.75 | | | | | | | 8.993 | | | 893 | | | | 96,398 | | | | 83,853 | |
| 2019 | | Annual distribution total $0.68 | | | | | | | 8.297 | | | 955 | | | | 118,025 | | | | 104,666 | |
| 2020 | | Annual distribution total $0.61 | | | | | | | 6.944 | | | 1,120 | | | | 128,811 | | | | 135,365 | |
| 2021 | | Annual distribution total $0.84 | | | | | | | 11.377 | | | 1,014 | | | | 187,933 | | | | 166,205 | |
| 2022 | | Annual distribution total $0.953 | | | | | | | 8.887 | | | 1,598 | | | | 156,203 | | | | 138,776 | |
| 2023 | | Annual distribution total $0.74 | | | | | | | 8.648 | | | 1,413 | | | | 182,188 | | | | 160,785 | |
| 2024 | | Annual distribution total $0.74 | | | | | | | 9.307 | | | 1,426 | | | | | | | | | |
| 12/31/24 | | | | $ | 8,900 | | | | | | | 18,827 | | | $ | 206,720 | | | $ | 183,563 | |
1 The purchase price used for annual distribution totals is a weighted average of the distribution reinvestment prices for the year.
2 Values are stated as of December 31 of the year indicated, after reinvestment of distributions, other than for initial purchase.
3 Includes a return of capital.
This page is not part of the 2024 Annual Report to Stockholders | 61
History Since Inception (unaudited) (continued)
| HISTORY | | | | AMOUNT INVESTED | | | PURCHASE PRICE 1 | | | SHARES | | | NAV VALUE2 | | | MARKET VALUE2 | |
| Royce Small-Cap Trust | | | | | | | | | | | | | | | | | | | |
| 11/26/86 | | Initial Purchase | | $ | 10,000 | | | $ | 10.000 | | | 1,000 | | | $ | 9,280 | | | $ | 10,000 | |
| 10/15/87 | | Distribution $0.30 | | | | | | | 7.000 | | | 42 | | | | | | | | | |
| 12/31/87 | | Distribution $0.22 | | | | | | | 7.125 | | | 32 | | | | 8,578 | | | | 7,250 | |
| 12/27/88 | | Distribution $0.51 | | | | | | | 8.625 | | | 63 | | | | 10,529 | | | | 9,238 | |
| 9/22/89 | | Rights Offering | | | 405 | | | | 9.000 | | | 45 | | | | | | | | | |
| 12/29/89 | | Distribution $0.52 | | | | | | | 9.125 | | | 67 | | | | 12,942 | | | | 11,866 | |
| 9/24/90 | | Rights Offering | | | 457 | | | | 7.375 | | | 62 | | | | | | | | | |
| 12/31/90 | | Distribution $0.32 | | | | | | | 8.000 | | | 52 | | | | 11,713 | | | | 11,074 | |
| 9/23/91 | | Rights Offering | | | 638 | | | | 9.375 | | | 68 | | | | | | | | | |
| 12/31/91 | | Distribution $0.61 | | | | | | | 10.625 | | | 82 | | | | 17,919 | | | | 15,697 | |
| 9/25/92 | | Rights Offering | | | 825 | | | | 11.000 | | | 75 | | | | | | | | | |
| 12/31/92 | | Distribution $0.90 | | | | | | | 12.500 | | | 114 | | | | 21,999 | | | | 20,874 | |
| 9/27/93 | | Rights Offering | | | 1,469 | | | | 13.000 | | | 113 | | | | | | | | | |
| 12/31/93 | | Distribution $1.15 | | | | | | | 13.000 | | | 160 | | | | 26,603 | | | | 25,428 | |
| 10/28/94 | | Rights Offering | | | 1,103 | | | | 11.250 | | | 98 | | | | | | | | | |
| 12/19/94 | | Distribution $1.05 | | | | | | | 11.375 | | | 191 | | | | 27,939 | | | | 24,905 | |
| 11/3/95 | | Rights Offering | | | 1,425 | | | | 12.500 | | | 114 | | | | | | | | | |
| 12/7/95 | | Distribution $1.29 | | | | | | | 12.125 | | | 253 | | | | 35,676 | | | | 31,243 | |
| 12/6/96 | | Distribution $1.15 | | | | | | | 12.250 | | | 247 | | | | 41,213 | | | | 36,335 | |
| 1997 | | Annual distribution total $1.21 | | | | | | | 15.374 | | | 230 | | | | 52,556 | | | | 46,814 | |
| 1998 | | Annual distribution total $1.54 | | | | | | | 14.311 | | | 347 | | | | 54,313 | | | | 47,506 | |
| 1999 | | Annual distribution total $1.37 | | | | | | | 12.616 | | | 391 | | | | 60,653 | | | | 50,239 | |
| 2000 | | Annual distribution total $1.48 | | | | | | | 13.972 | | | 424 | | | | 70,711 | | | | 61,648 | |
| 2001 | | Annual distribution total $1.49 | | | | | | | 15.072 | | | 437 | | | | 81,478 | | | | 73,994 | |
| 2002 | | Annual distribution total $1.51 | | | | | | | 14.903 | | | 494 | | | | 68,770 | | | | 68,927 | |
| 1/28/03 | | Rights Offering | | | 5,600 | | | | 10.770 | | | 520 | | | | | | | | | |
| 2003 | | Annual distribution total $1.30 | | | | | | | 14.582 | | | 516 | | | | 106,216 | | | | 107,339 | |
| 2004 | | Annual distribution total $1.55 | | | | | | | 17.604 | | | 568 | | | | 128,955 | | | | 139,094 | |
| 2005 | | Annual distribution total $1.61 | | | | | | | 18.739 | | | 604 | | | | 139,808 | | | | 148,773 | |
| 2006 | | Annual distribution total $1.78 | | | | | | | 19.696 | | | 693 | | | | 167,063 | | | | 179,945 | |
| 2007 | | Annual distribution total $1.85 | | | | | | | 19.687 | | | 787 | | | | 175,469 | | | | 165,158 | |
| 2008 | | Annual distribution total $1.723 | | | | | | | 12.307 | | | 1,294 | | | | 95,415 | | | | 85,435 | |
| 3/11/09 | | Distribution $0.323 | | | | | | | 6.071 | | | 537 | | | | 137,966 | | | | 115,669 | |
| 12/2/10 | | Distribution $0.03 | | | | | | | 13.850 | | | 23 | | | | 179,730 | | | | 156,203 | |
| 2011 | | Annual distribution total $0.783 | | | | | | | 13.043 | | | 656 | | | | 161,638 | | | | 139,866 | |
| 2012 | | Annual distribution total $0.80 | | | | | | | 13.063 | | | 714 | | | | 186,540 | | | | 162,556 | |
| 2013 | | Annual distribution total $2.194 | | | | | | | 16.647 | | | 1,658 | | | | 250,219 | | | | 220,474 | |
| 2014 | | Annual distribution total $1.82 | | | | | | | 14.840 | | | 1,757 | | | | 252,175 | | | | 222,516 | |
| 2015 | | Annual distribution total $1.24 | | | | | | | 12.725 | | | 1,565 | | | | 231,781 | | | | 201,185 | |
| 2016 | | Annual distribution total $1.02 | | | | | | | 12.334 | | | 1,460 | | | | 293,880 | | | | 248,425 | |
| 2017 | | Annual distribution total $1.16 | | | | | | | 14.841 | | | 1,495 | | | | 350,840 | | | | 324,176 | |
| 2018 | | Distribution through 6/30/18 $0.59 | | | | | | | 15.962 | | | 748 | | | | | | | | | |
| 2018 | | Rights Offering | | | 31,289 | | | | 15.330 | | | 2,041 | | | | | | | | | |
| 2018 | | Distribution after 6/30/18 $0.67 | | | | | | | 12.706 | | | 1,168 | | | | 329,589 | | | | 283,259 | |
| 2019 | | Annual distribution total $1.10 | | | | | | | 14.100 | | | 1,929 | | | | 429,986 | | | | 383,045 | |
| 2020 | | Annual distribution total $1.04 | | | | | | | 11.888 | | | 2,357 | | | | 523,949 | | | | 456,617 | |
| 2021 | | Annual distribution total $1.67 | | | | | | | 18.124 | | | 2,690 | | | | 628,604 | | | | 609,918 | |
| 2022 | | Annual distribution total $1.323 | | | | | | | 14.525 | | | 2,907 | | | | 495,104 | | | | 449,355 | |
| 2023 | | Annual distribution total $1.07 | | | | | | | 13.427 | | | 2,784 | | | | 602,154 | | | | 533,944 | |
| 2024 | | Annual distribution total $1.27 | | | | | | | 14.815 | | | 3,247 | | | | | | | | | |
| 12/31/24 | | | | $ | 53,211 | | | | | | | 39,919 | | | $ | 678,224 | | | $ | 630,720 | |
1 The purchase price used for annual distribution totals is a weighted average of the distribution reinvestment prices for the year.
2 Values are stated as of December 31 of the year indicated, after reinvestment of distributions, other than for initial purchase.
3 Includes a return of capital.
4 Includes Royce Global Trust spin-off of $1.40 per share.
62 | This page is not part of the 2024 Annual Report to Stockholders
Distribution Reinvestment and Cash Purchase Options
Why should I reinvest my distributions?
By reinvesting distributions, a stockholder can maintain an undiluted investment in the Fund. The regular reinvestment of distributions has a significant impact on stockholder returns. In contrast, the stockholder who takes distributions in cash is penalized when shares are issued below net asset value to other stockholders.
How does the reinvestment of distributions from the Royce closed-end funds work?
The Funds automatically issue shares in payment of distributions unless you indicate otherwise. The shares are generally issued at the lower of the market price or net asset value on the valuation date.
How does this apply to registered stockholders?
If your shares are registered directly with a Fund, your distributions are automatically reinvested unless you have otherwise instructed the Funds’ transfer agent, Computershare, in writing, in which case you will receive your distribution in cash. A registered stockholder also may have the option to receive the distribution in the form of a stock certificate.
What if my shares are held by a brokerage firm or a bank?
If your shares are held by a brokerage firm, bank, or other intermediary as the stockholder of record, you should contact your brokerage firm or bank to be certain that it is automatically reinvesting distributions on your behalf. If they are unable to reinvest distributions on your behalf, you should have your shares registered in your name in order to participate.
What other features are available for registered stockholders?
The Distribution Reinvestment and Cash Purchase Plans also allow registered stockholders to make optional cash purchases of shares of a Fund’s common stock directly through Computershare on a monthly basis, and to deposit certificates representing your RVT and RMT shares with Computershare for safekeeping. (RGT does not issue shares in certificated form). Plan participants are subject to a $0.75 service fee for each voluntary cash purchase under the Plans. The Funds’ investment adviser absorbed all commissions on optional cash purchases under the Plans through December 31, 2024.
How do the Plans work for registered stockholders?
Computershare maintains the accounts for registered stockholders in the Plans and sends written confirmation of all transactions in the account. Shares in the account of each participant will be held by Computershare in non-certificated form in the name of the participant, and each participant will be able to vote those shares at a stockholder meeting or by proxy. A participant may also send stock certificates for RVT and RMT held by them to Computershare to be held in non-certificated form. RGT does not issue shares in certificated form. There is no service fee charged to participants for reinvesting distributions If a participant elects to sell shares from a Plan account, Computershare will deduct a $2.50 service fee from the sale transaction. The Funds’ investment adviser absorbed all commissions on optional sales under the Plans through December 31, 2024. If a nominee is the registered owner of your shares, the nominee will maintain the accounts on your behalf.
How can I get more information on the Plans?
You can call an Investor Services Representative at (800) 221-4268 or you can request a copy of the Plan for your Fund from Computershare. All correspondence (including notifications) should be directed to: [Name of Fund] Distribution Reinvestment and Cash Purchase Plan, c/o Computershare, PO Box 43078, Providence, RI 02940-3078, telephone (800) 426-5523 (from 9:00 A.M. to 5:00 P.M.).
This page is not part of the 2024 Annual Report to Stockholders | 63
Directors and Officers
All Directors and Officers may be reached c/o The Royce Funds, One Madison Avenue, New York, NY 10010
Christopher D. Clark, Director 1, President
Age: 59 | Number of Funds Overseen: 15 | Tenure: Since 2014
Principal Occupation(s) During Past Five Years: Chief Executive Officer (since July 2016), President (since July 2014), Co-Chief Investment Officer (since January 2014), Managing Director of Royce, a Member of the Board of Managers of Royce, having been employed by Royce since May 2007.
Patricia W. Chadwick, Director
Age: 76 | Number of Funds Overseen: 15 | Tenure: Since 2009
Non-Royce Directorships: Director of Voya Mutual Funds
Principal Occupation(s) During Past 5 Years: Consultant and President, Ravengate Partners LLC (since 2000). Formerly Director, Wisconsin Energy Corp. (until 2022).
Christopher C. Grisanti, Director
Age: 63 | Number of Funds Overseen: 15 | Tenure: Since 2017
Non-Royce Directorships: None
Principal Occupation(s) During Past Five Years: Chief Equity Strategist and Senior Portfolio Manager, MAI Capital Management LLC (investment advisory firm) (since May 2020). Formerly Co-Founder and Chief Executive Officer, Grisanti Capital Management LLC (investment advisory firm) (from 1999 to 2020); Director of Research and Portfolio Manager, Spears Benzak, Salomon & Farrell (from 1994 to 1999); and Senior Associate, Simpson, Thacher & Bartlett (law firm) (from 1988 to 1994).
Cecile B. Harper, Director
Age: 61 | Number of Funds Overseen: 15 | Tenure: Since 2020
Non-Royce Directorships: Director of Alarm.com Holdings, Inc. (since May 2024)
Principal Occupation(s) During Past Five Years: Chief Financial Officer and Chief Operating Officer, College Foundation at the University of Virginia (since October 2019). Formerly Board Member, Pyramid Peak Foundation (January 2012 to 2022); Board Member, Regional One Health Foundation (from June 2013 to September 2019); and Principal, Southeastern Asset Management (from December 1993 to September 2019).
G. Peter O’Brien, Director
Age: 79 | Number of Funds Overseen: 64 | Tenure: Since 2001
Non-Royce Directorships: Director/Trustee of registered investment companies constituting the 49 Legg Mason Funds.
Principal Occupation(s) During Past Five Years: Trustee Emeritus, Colgate University (since 2005); and Emeritus Board Member, Hill House, Inc. (since 2019). Formerly Director, TICC Capital Corp. (from 2003-2017); Trustee, Colgate University (from 1996 to 2005); President, Hill House, Inc. (from 2001 to 2005); Board Member, Hill House, Inc. (from 1999 to 2019); Director, Bridges School (from 2006 to 2018); and Managing Director/ Equity Capital Markets Group, Merrill Lynch & Co. (from 1971 to 1999).
Julia W. Poston, Director
Age: 64 | Number of Funds Overseen: 15 | Tenure: Since 2023
Non-Royce Directorships: AuguStar Variable Insurance Products Fund, Inc. and The James Advantage Funds
Principal Occupation(s) During Past Five Years: Director, Member of Nominating/Governance Committee, and Chair of Audit Committee, Al. Neyer Corporation (since 2020); Director, Member of Governance Committee, and Chair of Audit Committee, Master Fluid Solutions (since 2021); Trustee and Chair of Finance/Audit Committee, Cincinnati Museum Center (non-profit) (since 2015); and Director and Founder, Cincinnati Women’s Executive Forum (non-profit) (since 2010). Formerly Senior Client Partner (2002-2020) and Assurance Practice Group Leader for Ohio Valley Region (2014-2019), Ernst & Young, LLP (international accounting and services firm); and Audit Partner, Arthur Andersen LLP (international accounting and services firm) (1982-2002).
Michael K. Shields, Director
Age: 66 | Number of Funds Overseen: 15 | Tenure: Since 2015
Non-Royce Directorships: None
Principal Occupation(s) During Past Five Years: Chairman, UNC Charlotte Investment Fund Board (since February 2016); and Chairman, Halftime Carolinas Board (since February 2011). Formerly President and Chief Executive Officer, Piedmont Trust Company (privately owned North Carolina trust company) (from February 2012 to December 2023); Owner, Shields Advisors (investment consulting firm) (from April 2010 to June 2012); President and Chief Executive Officer, Eastover Capital Management (2005-2007); President and Chief Executive Officer, Campbell, Cowperthwait & Co. (investment subsidiary of U.S. Trust Corporation) (1997-2002); and equity portfolio manager and co- manager of Quality Growth Team, Scudder, Stevens & Clark (1992-1997).
Francis D. Gannon, Vice President
Age: 57 | Tenure: Since 2014
Principal Occupation(s) During Past Five Years: Co-Chief Investment Officer (since January 2014) and Managing Director of Royce, having been employed by Royce since September 2006.
Daniel A. O’Byrne, Vice President
Age: 62 | Tenure: Since 1994
Principal Occupation(s) During Past Five Years: Principal and Vice President of Royce, having been employed by Royce since October 1986.
Peter K. Hoglund, Treasurer
Age: 58 | Tenure: Since 2015
Principal Occupation(s) During Past Five Years: Chief Financial Officer, Chief Administrative Officer, and Managing Director of Royce, having been employed by Royce since December 2014. Prior to joining Royce, Mr. Hoglund spent more than 20 years with Munder Capital Management in Birmingham, MI, serving as Managing Director and Chief Financial Officer and overseeing all financial aspects of the firm. He began his career at Munder as a portfolio manager.
John E. Denneen, Secretary and Chief Legal Officer
Age: 57 | Tenure: 1996-2001 and Since 2002
Principal Occupation(s) During Past Five Years: General Counsel, Managing Director, and, since June 2015, a Member of the Board of Managers of Royce. Chief Legal and Compliance Officer and Secretary of Royce.
John P. Schwartz, Chief Compliance Officer
Age: 53 | Tenure: Since 2022
Principal Occupation(s) During Past Five Years: Chief Compliance Officer of The Royce Funds (since May 2022) and Associate General Counsel and Compliance Officer of Royce (since March 2013).
1 Interested Director.
Directors will hold office until their successors have been duly elected and qualified or until their earlier resignation or removal. The Statement of Additional Information, which contains additional information about the Trust’s directors and officers, is available and can be obtained without charge at www.royceinvest.com or by calling (800) 221-4268.
64 | This page is not part of the 2024 Annual Report to Stockholders
Notes to Performance and Other Important Information
The thoughts expressed in this Review and Report concerning recent market movements and future prospects for small company stocks are solely the opinion of Royce at December 31, 2024, and, of course, historical market trends are not necessarily indicative of future market movements. Statements regarding the future prospects for particular securities held in the Funds’ portfolios and Royce’s investment intentions with respect to those securities reflect Royce’s opinions as of December 31, 2024 and are subject to change at any time without notice. There can be no assurance that securities mentioned in this Review and Report will be included in any Royce-managed portfolio in the future. Investments in securities of micro-cap, small-cap and/or mid-cap companies may involve considerably more risk than investments in securities of larger-cap companies. All publicly released material information is always disclosed by the Funds on the website at www.royceinvest.com.
Sector weightings are determined using the Global Industry Classification Standard (“GICS”). GICS was developed by, and is the exclusive property of, Standard & Poor’s Financial Services LLC (“S&P”) and MSCI Inc. (“MSCI”). GICS is the trademark of S&P and MSCI. “Global Industry Classification Standard (GICS)” and “GICS Direct” are service marks of S&P and MSCI.
All indexes referred to are unmanaged and capitalization-weighted. Each index’s returns include net reinvested dividends and/or interest income. Frank Russell Company (“Russell”) is the source and owner of the trademarks, service marks and copyrights related to the Russell Indexes. Russell® is a trademark of Frank Russell Company. Neither Russell nor its licensors accept any liability for any errors or omissions in the Russell Indexes and/or Russell ratings or underlying data and no party may rely on any Russell Indexes and/or Russell ratings and/ or underlying data contained in this communication. No further distribution of Russell Data is permitted without Russell’s express written consent. Russell does not promote, sponsor or endorse the content of this communication. The Russell 2000 Index is an index of domestic small-cap stocks. It measures the performance of the 2,000 smallest publicly traded U.S. companies in the Russell 3000 Index. The Russell 2000 Value and Growth Indexes consist of the respective value and growth stocks within the Russell 2000 as determined by Russell Investments. The Russell Microcap Index includes 1,000 of the smallest securities in the small-cap Russell 2000 Index along with the next smallest eligible securities as determined by Russell. The Russell 1000 Index is an index of domestic large-cap stocks. It measures the performance of the 1,000 largest publicly traded U.S. companies in the Russell 3000 Index. Source: MSCI. MSCI makes no express or implied warranties or representations and shall have no liability whatsoever with respect to any MSCI data contained herein. The MSCI data may not be further redistributed or used as a basis for other indexes or any securities or financial products. This report is not approved, endorsed, reviewed or produced by MSCI. None of the MSCI data is intended to constitute investment advice or a recommendation to make (or refrain from making) any kind of investment decision and may not be relied on as such. The MSCI ACWI Small Cap Index is an unmanaged, capitalization-weighted index of global small-cap stocks. Index returns include net reinvested dividends and/or interest income. The S&P SmallCap 600 Index is an index of U.S. small-cap stocks selected by Standard & Poor’s based on market size, liquidity, and industry grouping, among other factors. The S&P 500 Index tracks the stock performance of 500 of the largest companies listed on stock exchanges in the U.S. The Nasdaq Composite Index is a market capitalization weighted index of more than 3,700 stocks listed on the Nasdaq stock exchange. The performance of an index does not represent exactly any particular investment, as you cannot invest directly in an index. Index returns used in this Report were based on information supplied to Royce by Russell for the Russell market indexes and by MSCI for the MSCI market indexes. Royce has not independently verified the above described information.
The Price-Earnings, or P/E, Ratio is calculated by dividing a company’s share price by its trailing 12-month earnings-per-share (EPS). The Price-to-Book, or P/B, Ratio is calculated by dividing a company’s share price by its book value per share. Beta is a measure of the volatility or risk of an investment compared to the market as a whole. The Morningstar Style Map uses proprietary scores of a stock’s value and growth characteristics to determine its placement in one of the five categories listed on the horizontal axis. These characteristics are then compared to those of other stocks within the same market capitalization band. Each is scored from zero to 100 for both value and growth attributes. The value score is subtracted from the growth score to determine the overall style score. For the vertical, market cap axis, Morningstar subdivides into size groups. Giant-cap stocks are defined as those that account for the top 40% of the capitalization of each style zone; large-cap stocks represent the next 30%; mid-cap stocks the next 20%; small-cap stocks the next 7%; micro-cap stocks the smallest 3%. For the Morningstar Small Blend Category: © 2024 Morningstar. All Rights Reserved. The information regarding the category in this piece is: (1) is proprietary to Morningstar and/or its content providers; (2) may not be copied or distributed; and (3) is not warranted to be accurate, complete or timely. Neither Morningstar nor its content providers are responsible for any damages or losses arising from any use of this information. Cyclical and Defensive are defined as follows: Cyclical: Communication Services, Consumer Discretionary, Energy, Financials, Industrials, Information Technology, and Materials. Defensive: Consumer Staples, Health Care, Real Estate, and Utilities. Return on Invested Capital is calculated by dividing a company’s past 12 months of operating income (earnings before interest and taxes) by its average invested capital (total equity, less cash and cash equivalents, plus total debt, minority interest, and preferred stock). The Royce Funds is a service mark of The Royce Funds.
Investment Objectives
The investment objective of each Fund is long-term growth of capital.
Investment Policies
Royce Global Trust, Inc. (“RGT”). Under normal circumstances, RGT will invest at least 80% of its net assets in equity securities, such as common stock and preferred stock. RGT generally invests a significant portion of its assets U.S. and non-U.S. small/mid-cap stocks (generally market caps up to $10 billion). Under normal circumstances, at least 40% of RGT’s net assets will be invested in the equity securities of companies headquartered in at least three countries outside the United States. From time to time, a substantial portion of RGT’s assets may be invested in companies located in a single country. Although there are no geographic limits on RGT’s investments, no more than 35% of RGT’s net assets may be invested in the securities of companies headquartered in “developing countries,” also known as emerging markets. Generally, developing countries include every country in the world other than the United States, Canada, Japan, Australia, New Zealand, Hong Kong, Singapore, South Korea, Taiwan, Bermuda, and Western European countries (which include, Austria, Belgium, Denmark, France, Finland, Germany, Greece, Ireland, Italy, Luxembourg, the Netherlands, Norway, Portugal, Spain, Sweden, Switzerland and the United Kingdom).
Royce Micro-Cap Trust, Inc. (“RMT”). RMT normally invests at least 80% of its net assets in the equity securities of micro-cap companies. Micro-cap companies are those that have a market capitalization not greater than that of the largest company in the Russell Microcap® Index at the time of its most recent reconstitution. Royce employs a core approach that combines multiple investment themes and focuses on companies with strong fundamentals and/or prospects selling at prices that Royce believes do not fully reflect
This page is not part of the 2024 Annual Report to Stockholders | 65
Notes to Performance and Other Important Information (continued)
these attributes. RMT may invest up to 25% of its assets in securities of issuers headquartered outside the United States.
Royce Small-Cap Trust, Inc. (“RVT”). RVT normally invests at least 80% of its assets in the equity securities of small-cap companies. Such companies are those that have a market capitalization not greater than that of the largest company in the Russell 2000® Index at the time of its most recent reconstitution. Royce employs a core approach that combines multiple investment themes and focuses on companies with high returns on invested capital or those with strong fundamentals and/or prospects trading at what Royce believes are attractive valuations. A portion of the Fund’s assets is managed using a systematic multi-factor selection process that is derived from the investment philosophies used by the Fund’s Portfolio Managers in managing the remainder of the Fund. While this multi-factor process provides guidance, a Portfolio Manager has discretion for which buys and sells are executed. RVT may invest up to 25% of its assets in securities of issuers headquartered outside the United States.
Primary Risks
As with any closed-end fund that invests in common stocks, each Fund is subject to market risk—the possibility that common stock prices will decline over short and/or extended periods of time due to overall market, financial, and economic conditions, trends or events, governmental or central bank actions and/or interventions, changes in investor sentiment, armed conflicts, economic sanctions and countermeasures in response to sanctions, market disruptions caused by trade disputes or other factors, political developments, major cybersecurity events and acts of terrorism, the global and domestic effects of a pandemic or epidemic, contagion effects on the finance sector and the overall economy from banking industry instability, and other factors that may or may not be directly related to the issuer of a security held by a Fund. Economies and financial markets throughout the world are increasingly interconnected, and economic, financial, or political events in one country or region could have profound impacts on global economies or markets. Armed conflicts in Europe and the Middle East, as well as any banking industry instability, may adversely affect global economies, markets, industries, and individual companies in ways that cannot necessarily be foreseen. As a result, the value of your investment in a Fund will fluctuate, sometimes sharply and unpredictably, and you could lose money over short and/or long periods of time.
Investors wanting to buy or sell shares of a Fund must do so on a stock exchange, as with any publicly traded stock. Shares of closed-end funds frequently trade at a discount to their net asset value. This is in contrast to open-end mutual funds, which sell and redeem their shares at net asset value on a continuous basis.
The prices of equity securities of the smaller companies in which the Funds invest are generally more volatile than those of larger-cap securities. In addition, because these securities tend to have significantly lower trading volumes than larger-cap securities, the Funds may have difficulty selling holdings or may only be able to sell holdings at prices substantially lower than what Royce believes they are worth. Therefore, each Fund may involve considerably more risk of loss and its returns may differ significantly from funds investing in larger-cap companies or other asset classes. No assurance can be given that there will be net investment income to distribute and/or that the Funds will achieve their investment goals.
Investment in foreign securities involves risks that may not be encountered in U.S. investments, including adverse political, social, economic, or other developments that are unique to a particular region or country. Prices of foreign securities in particular countries or regions may, at times, move in a different direction and/or be more volatile than those of U.S. securities. Each Fund’s investments are usually denominated in or tied to the currencies of the countries in which they are primarily traded. Because the Funds do not intend to hedge their foreign currency exposure, the U.S. dollar value of the Funds’ investments may be harmed by declines in the value of foreign currencies in relation to the U.S. dollar. This may occur even if the value of the investment in the currency’s home country has not declined. These risk factors may affect the prices of foreign securities issued by companies headquartered in developing countries more than those headquartered in developed countries. For example, many developing countries have in the past experienced high rates of inflation or sharply devalued their currencies against the U.S. dollar, thereby causing the value of investments in companies located in those countries to decline. Transaction costs are often higher in developing countries, and there may be delays in settlement procedures. To the extent that a Fund’s investments in the securities of international companies consists of non-U.S. headquartered companies that trade on a U.S. exchange, some or all of the above stated risks of investing in international companies may not apply.
Each Fund may, from time to time, invest a significant portion of its assets in companies from a single sector or a limited number of sectors. Such an investment approach may involve considerably more risk to investors than one that is more broadly diversified across economic sectors because it may be more susceptible to corporate, economic, political, regulatory, or market events that adversely affect the relevant sector(s). As of December 31, 2024, RGT invested a significant portion of its assets in companies from the Industrials and Financials sectors, RMT invested a significant portion of its assets in companies from the Information Technology and Industrials sectors, and RVT invested a significant portion of its assets in companies from the Industrials and Financials sectors. Industrials sector companies can be significantly affected by general economic trends, commodity prices, legislation, government regulation and spending, import and export controls, worldwide competition, changes in consumer sentiment and spending, and liability for environmental damage, depletion of resources, and mandated expenditures for safety and pollution control. Companies from the Financials sector are subject to extensive government regulation, can be significantly affected by changes in interest rates, the availability and cost of capital, the rate of corporate and consumer debt defaults, and price competition, and can be subject to relatively rapid change due to government interventions in capital, credit, and currency markets. Information Technology sector companies can be significantly affected by the obsolescence of existing technology, short product cycles, falling prices and profits, competition from new market entrants, and general economic conditions.
Royce’s estimate of a company’s current worth may prove to be inaccurate, or this estimate may not be recognized by other investors, which could lead to portfolio losses or underperformance relative to similar funds and/or a Fund’s benchmark index(es). Securities in the Funds’ portfolios may not increase as much as the market as a whole and some securities may continue to be undervalued for long periods of time or may never reach what Royce believes are their full market values. Investments in a Fund are not bank deposits and are not insured or guaranteed by the Federal Deposit Insurance Corporation or any other government agency.
Environmental, Social, and Governance (“ESG”) Investment Considerations and Risks
ESG factors may have a material impact on the business risk and financial performance of portfolio companies held by a Fund. Royce seeks to ensure, to the extent applicable, that material ESG factors are incorporated as inputs to the investment analysis of such portfolio companies. Royce defines material ESG factors as those that it believes may impact a portfolio company’s cash flows, balance sheet, reputation, and/ or enterprise value. Each investment strategy used in connection with the Funds has its own customized
66 | This page is not part of the 2024 Annual Report to Stockholders
Notes to Performance and Other Important Information (continued)
ESG due diligence framework that focuses on the ESG factors Royce investment staff members believe to be most material to their respective investment processes. Materiality is the core principle of Royce’s approach to ESG integration, as particular factors may or may not be meaningful to different business models, industries, and regions. No assurance can be given that ESG factors will, in fact, contribute to the long-term investment performance of any particular portfolio company or that Royce’s assessment of material ESG factors in respect of any particular portfolio company will be correct.
Evaluation of what Royce believes to be material ESG risks is only one component of Royce’s assessment of a potential investment by a Fund and, as with its consideration of other factors and risks, may not be a determinative factor in any instruction or recommendation to purchase, sell, or hold a security. In addition, where such material ESG factors are considered, the importance given to such ESG factors may vary across Royce investment staff members and accounts to which they are assigned and across different types of investments, sectors, industries, regions, and issuers. ESG factors considered, and the importance placed upon those factors, may change over time. Royce may not assess every investment by a Fund for ESG factors. and when it does, not every ESG factor may be identified or evaluated. The assessment of ESG-related risk(s) for a portfolio company by Royce investment staff members also may vary across the various accounts to which they are assigned, even if such accounts employ identical or substantially similar ESG integration approaches. Royce investment staff members are under no obligation to exclude investments with relatively poor third-party ESG ratings or metrics from a Fund. There is also no minimum ESG risk rating for an investment to be held by a Fund. There are no prescribed methods or standards within Royce or among Royce investment staff members for evaluating or assessing third-party or internally generated ESG-related information, data, metrics, and ratings.
The assessment of material ESG factors for a portfolio company by Royce investment staff members is subjective and may differ from those of other institutional investors, third-party service providers (e.g., ratings providers), and/or other funds, and may be dependent on the availability of timely, complete, and accurate ESG data and research from issuers and/ or third-party providers, the timeliness, completeness, and accuracy of which is outside of the control of Royce and its investment staff members. ESG factors are often not uniformly measured or defined, which could impact the ability of Royce investment staff members to evaluate a portfolio company.
Investments in cash and cash equivalents and securities lending activities in connection with the Funds are not assessed by Royce for ESG factors.
Portfolio Management Changes for the Funds
Effective after the close of business on September 30, 2024, Charles M. Royce no longer served as a portfolio manager of RGT, RMT, and RVT. Set forth below are the portfolio management arrangements for RGT, RMT, and RVT as of such time:
| • | RGT’s portfolio manager is Steven McBoyle; |
| • | James Stoeffel is RMT’s portfolio manager and Andrew Palen is RMT’s assistant portfolio manager; and |
| • | RVT’s portfolio managers are Lauren Romeo, Steven McBoyle, Andrew Palen, George Neckakov, and Francis Gannon. |
Forward-Looking Statements
This material contains forward-looking statements within the meaning of the Securities Exchange Act of 1934, as amended (the “Exchange Act”), that involve risks and uncertainties, including, among others, statements as to:
| • | the Funds’ future operating results |
| • | the prospects of the Funds’ portfolio companies |
| • | the impact of investments that the Funds have made or may make |
| • | the dependence of the Funds’ future success on the general economy and its impact on the companies and industries in which the Funds invest, and |
| • | the ability of the Funds’ portfolio companies to achieve their objectives. |
This Review and Report uses words such as “anticipates,” “believes,” “expects,” “future,” “intends,” and similar expressions to identify forward-looking statements. Actual results may differ materially from those projected in the forward-looking statements for any reason.
The Funds have based the forward-looking statements included in this Review and Report on information available to us on the date of the report, and we assume no obligation to update any such forward-looking statements. Although the Funds undertake no obligation to revise or update any forward-looking statements, whether as a result of new information, future events or otherwise, you are advised to consult any additional disclosures that we may make through future stockholder communications or reports.
Authorized Share Transactions
Royce Global Trust, Royce Micro-Cap Trust, and Royce Small-Cap Trust may each repurchase up to 5% of the issued and outstanding shares of its respective common stock during the year ending December 31, 2025. Any such repurchases would take place at then prevailing prices in the open market or in other transactions. Common stock repurchases would be effected at a price per share that is less than the share’s then current net asset value.
Royce Global Trust, Royce Micro-Cap Trust, and Royce Small-Cap Trust are also authorized to offer their common stockholders an opportunity to subscribe for additional shares of their common stock through rights offerings at a price per share that may be less than the share’s then current net asset value. The timing and terms of any such offerings are within each Board’s discretion.
Annual Certifications
As required, the Funds have submitted to the New York Stock Exchange (“NYSE”) for the annual certification of the Funds’ Chief Executive Officer that he is not aware of any violation of the NYSE’s listing standards. The Funds also have included the certification of the Funds’ Chief Executive Officer and Chief Financial Officer required by section 302 of the Sarbanes-Oxley Act of 2002 as exhibits to the Funds’ form N-CSR for the period ended December 31, 2024, filed with the Securities and Exchange Commission.
Proxy Voting
A copy of the policies and procedures that the Funds use to determine how to vote proxies relating to portfolio securities and information regarding how each of the Funds voted proxies relating to portfolio securities during the most recent 12-month period ended June 30 is available, without charge, on the Funds’ website at www.royceinvest.com, by calling (800) 221-4268 (toll-free) and on the website of the Securities and Exchange Commission (“SEC”), at www.sec.gov.
Disclosure of Portfolio Holdings
The Funds’ complete portfolio holdings are also available on Exhibit F to Form N-PORT, which filings are made with the SEC within 60 days of the end of the first and third fiscal quarters. The Funds’ Form N-PORT filings are available on the SEC’s website at http://www.sec.gov.
This page is not part of the 2024 Annual Report to Stockholders | 67
Results of Stockholders Meetings
Royce Global Trust, Inc.
At the 2024 Annual Meeting of Stockholders held on September 30, 2024, the Fund’s stockholders elected three Directors, consisting of:
| | VOTES FOR | VOTES WITHHELD |
| Cecile B. Harper | 4,097,952 | 1,392,194 |
| G. Peter O’Brien | 4,080,907 | 1,409,239 |
| Julia W. Poston | 4,087,523 | 1,402,623 |
Royce Micro-Cap Trust, Inc.
At the 2024 Annual Meeting of Stockholders held on September 30, 2024, the Fund’s stockholders elected three Directors, consisting of:
| | VOTES FOR | VOTES WITHHELD |
| Cecile B. Harper | 37,807,597 | 1,516,751 |
| G. Peter O’Brien | 37,153,624 | 2,170,724 |
| Julia W. Poston | 37,599,158 | 1,725,190 |
Royce Small-Cap Trust, Inc.
At the 2024 Annual Meeting of Stockholders held on September 30, 2024, the Fund’s stockholders elected three Directors, consisting of:
| | VOTES FOR | VOTES WITHHELD |
| Cecile B. Harper | 94,463,962 | 2,243,540 |
| G. Peter O’Brien | 91,844,645 | 4,862,856 |
| Julia W. Poston | 94,399,032 | 2,308,470 |
68 | This page is not part of the 2024 Annual Report to Stockholders

| | | | |
| | | | |
| | | | |
| | | |
| | | |
| |  | |
| | | | |
| | | | |
| | | | |
| | | | |
| | | | |
| | About Royce Investment Partners Unparalleled Knowledge + Experience Pioneers in small-cap investing, with 50+ years
of experience, depth of knowledge, and focus. Independent Thinking The confidence to go against consensus, the insight
to uncover opportunities others might miss, and the
tenacity to stay the course through market cycles. Specialized Approaches U.S., international, and global investment strategies
that pursue approaches with different risk profiles. Unwavering Commitment Our team of 18 portfolio managers has significant
personal investments in the strategies they manage. | Contact Us GENERAL INFORMATION General Royce Funds information including an
overview of our firm and Funds (800) 221-4268 COMPUTERSHARE Transfer Agent and Registrar Speak with a representative about: • Your account, transactions, and forms (800) 426-5523 FINANCIAL ADVISORS AND BROKER-DEALERS Speak with your regional Royce contact regarding: • Information about our firm, strategies, and Funds • Fund Materials (800) 337-6923 | |
| | | | |
| | | | |
| | | | |
| | | | |
| | | | |
| |  |  | |
| | | | |
| | | CE-REP-1224 | |
| | | | |
Item 2. Code(s) of Ethics.
As of the end of the period covered by this report, the Registrant had adopted a code of ethics, as defined in Item 2 of Form N-CSR, applicable to its principal executive officer, principal financial officer, principal accounting officer or controller, or persons performing similar functions. A copy of this code of ethics is filed as an exhibit to this Form N-CSR. During the period covered by this report, the Registrant did not: (i) amend any provision of its code of ethics that applies to its principal executive officer, principal financial officer, principal accounting officer or controller, or persons performing similar functions or (ii) grant any waiver, including an implicit waiver, from a provision of such code of ethics to its principal executive officer, principal financial officer, principal accounting officer or controller, or persons performing similar functions.
Item 3. Audit Committee Financial Expert.
| (a)(1) | The Board of Trustees of the Registrant has determined that it has an audit committee financial expert serving on its Audit Committee. |
| (a)(2) | Patricia W. Chadwick and Julia W. Poston were designated by the Board of Trustees as the Registrant’s Audit Committee Financial Experts, effective April 8, 2010, and July 13, 2023, respectively. Ms. Chadwick and Ms. Poston are “independent” as defined in Section 2(a)(19) of the Investment Company Act of 1940 (the “1940 Act”). |
Item 4. Principal Accountant Fees and Services.
Year ended December 31, 2023 - $54,020
Year ended December 31, 2023 - $52,447
Year ended December 31, 2024 - $0
Year ended December 31, 2023 - $0
Year ended December 31, 2024 - $11,509 – Preparation of tax returns
Year ended December 31, 2023 - $11,173 – Preparation of tax returns
Year ended December 31, 2024 - $0
Year ended December 31, 2023 - $0
| (e)(1) | Annual Pre-Approval: On an annual basis, the Registrant’s independent auditor submits to the Audit Committee a schedule of proposed audit, audit-related, tax and other non-audit services to be rendered to the Registrant and/or its investment adviser and its affiliates for the following year that require pre-approval by the Audit Committee. This schedule provides a description of each type of service that is expected to require pre-approval and the maximum fees that can be paid for each such service without further Audit Committee approval. The Audit Committee then reviews and determines whether to approve the types of scheduled services and the projected fees associated with them. Any subsequent revision to already pre-approved services or fees are presented for consideration at the next regularly scheduled Audit Committee meeting, as needed. |
If subsequent to the annual pre-approval of services and fees by the Audit Committee, the Registrant and/or its investment adviser and its affiliates determines that it would like to engage the Registrant’s independent auditor to perform a service not already pre-approved, the request is to be submitted to the Registrant’s Chief Financial Officer, and if he or she determines that the service fits within the independence guidelines (i.e., it is not a prohibited service), he or she will then arrange for a discussion of the proposed service and fee to be included on the agenda for the next regularly scheduled Audit Committee meeting so that pre-approval can be considered.
Interim Pre-Approval: If, in the judgment of the Registrant's Chief Financial Officer, a proposed engagement needs to commence before the next regularly scheduled Audit Committee meeting, he or she shall submit a written summary of the proposed engagement to all members of the Audit Committee, outlining the services, the estimated maximum cost, the category of the services (e.g., audit, audit-related, tax or other) and the rationale for engaging the Registrant’s independent auditor to perform the services. To the extent the proposed engagement involves audit, audit-related or tax services, any individual member of the Audit Committee who is an independent Board member is authorized to pre-approve the engagement. To the extent the proposed engagement involves non-audit services other than audit-related or tax, only the Chairman of the Audit Committee is authorized to pre-approve the engagement. The Registrant’s Chief Financial Officer will arrange for this interim review and coordinate with the appropriate member(s) of the Audit Committee. The Registrant’s independent auditor may not commence the engagement under consideration until the Registrant’s Chief Financial Officer has informed the auditor in writing that the required pre-approval has been obtained from an individual member of the Audit Committee who is an independent Board member or the Chairman of the Audit Committee, as applicable. Each member of the Audit Committee who pre-approves any engagements in between regularly scheduled Audit Committee meetings is to report, for informational purposes only, any pre-approval decisions to the Audit Committee at its next regularly scheduled meeting.
| (g) | Year ended December 31, 2024 - $11,509 |
Year ended December 31, 2023 - $11,173
| (h) | No such services were rendered during 2024 or 2023. |
Item 5. Audit Committee of Listed Registrants.
The Registrant has a separately designated standing audit committee established in accordance with Section 3(a)(58)(A) of the Securities Exchange Act of 1934 (the “Exchange Act”). Julia W. Poston, Patricia W. Chadwick, Christopher C. Grisanti, Cecile B. Harper, G. Peter O’Brien, and Michael K. Shields are members of the Registrant’s audit committee.
Item 6. Investments.
| (a) | The Schedule of Investments is included as part of the Report to Stockholders included under Item 1 of this Form N-CSR. |
Item 7. Financial Statements and Financial Highlights for Open-End Management Investment Companies. Not Applicable.
Item 8. Changes in and Disagreements with Accountants for Open-End Management Investment Companies. Not Applicable.
Item 9. Proxy Disclosures for Open-End Management Investment Companies. Not Applicable.
Item 10. Remuneration Paid to Directors, Officers, and Others of Open-End Management Investment Companies. Not Applicable.
Item 11. Statement Regarding Basis for Approval of Investment Advisory Contract. Not Applicable.
Item 12. Disclosure of Proxy Voting Policies and Procedures for Closed-End Management Investment Companies. This information is disclosed as part of the Report to Stockholders included under Item 1 of this Form N-CSR.
Item 13. Portfolio Managers of Closed-End Management Investment Companies.
| (a)(1) | Portfolio Managers of Closed-End Management Investment Companies (information as of December 31, 2024). |
| Name | Title | Length of Service | Principal Occupation(s) During Past 5 Years |
| Steven McBoyle | Portfolio Manager | Since September 2024 | Portfolio manager for Royce & Associates, LP |
| Lauren Romeo | Portfolio Manager | Since September 2024 | Portfolio manager for Royce & Associates, LP |
| Andrew Palen | Portfolio Manager | Since September 2024 | Portfolio manager for Royce & Associates, LP |
| George Necakov | Portfolio Manager | Since September 2024 | Portfolio manager for Royce & Associates, LP |
| Francis Gannon | Portfolio Manager | Since September 2024 | Co-Chief Investment Officer for Royce & Associates, LP |
| (a)(2) | Other Accounts Managed by Portfolio Manager and Potential Conflicts of Interest (information as of December 31, 2024). |
Other Accounts
Name of Portfolio
Manager | Type of
Account | Number of
Accounts
Managed | Total Assets
Managed | Number of
Accounts Managed for
which Advisory Fee is Performance-
Based | Value of
Managed Accounts for
which Advisory Fee is Performance
Based |
| Steven McBoyle | | | | | |
| | Registered investment companies | 5 | $5,849,420,516 | 2 | $2,080,256,917 |
| | Private pooled investment vehicles | 3 | $163,450,599 | — | — |
| | Other accounts* | 6 | $401,682,885 | — | — |
| Lauren Romeo | | | | | |
| | Registered investment companies | 3 | $5,152,463,902 | 1 | - $1,998,457,021 |
| | Private pooled investment vehicles | 3 | $163,450,599 | — | — |
| | Other accounts* | 6 | $674,515,693 | — | — |
| Andrew Palen | | | | | |
| | Registered investment companies | 6 | $6,162,245,733 | 2 | $2,565,233,619 |
| | Private pooled investment vehicles | 3 | $163,450,599 | — | — |
| | Other accounts* | — | — | — | — |
| George Necakov | | | | | |
| | Registered investment companies | 1 | $1,998,457,021 | 1 | $1,998,457,021 |
| | Private pooled investment vehicles | 1 | $208,372 | — | — |
| | Other accounts* | 1 | $27,714,552 | — | — |
| Francis Gannon | | | | | |
| | Registered investment companies | 2 | $3,868,242,045 | 1 | 1,998,457,021 |
| | Private pooled investment vehicles | — | — | — | — |
| | Other accounts* | — | — | — | — |
*Other accounts include all other accounts managed by the Portfolio Manager in either a professional or personal capacity except for personal accounts subject to pre-approval and reporting requirements under the Registrant’s Rule 17j-1 Code of Ethics.
Conflicts of Interest
The fact that a Portfolio Manager has day-to-day management responsibility for more than one client account may create actual, potential or only apparent conflicts of interest. For example, the Portfolio Manager may have an opportunity to purchase securities of limited availability. In this circumstance, the Portfolio Manager is expected to review each account's investment guidelines, restrictions, tax considerations, cash balances, liquidity needs and other factors to determine the suitability of the investment for each account and to ensure that his or her managed accounts are treated equitably.
The Portfolio Manager may also decide to purchase or sell the same security for multiple managed accounts at approximately the same time. To address any conflicts that this situation may create, the Portfolio Manager will generally combine managed account orders (i.e., enter a “bunched” order) in an effort to obtain best execution or a more favorable commission rate. In addition, if orders to buy or sell a security for multiple accounts managed by common Portfolio Managers on the same day are executed at different prices or commission rates, the transactions will generally be allocated by Royce to each of such managed accounts at the weighted average execution price and commission. In circumstances where a pre-allocated bunched order is not completely filled, each account will normally receive a pro-rated portion of the securities based upon the account's level of participation in the order, subject to Royce’s minimum ticket size requirements. Royce may, under certain circumstances, allocate securities in a manner other than pro-rata if it determines that the allocation is fair and equitable under the circumstances and does not discriminate against any account. In addition, on a limited, infrequent basis, and in accordance with written procedures, Royce may change initial allocations from one Royce client account to another Royce client account prior to the booking of the trade on the day after trade date when: (i) it is determined that a security is unsuitable or inappropriate for a particular Royce client account in the original allocation; (ii) there is insufficient cash in a Royce client account to which a security is initially allocated; (iii) there is a client-imposed restriction on the purchase of the security being allocated; or (iv) the Portfolio Manager has decided to change the initial allocation for some other reason.
As described below, there is a revenue-based component of each Portfolio Manager's Performance-Related Variable Compensation, and the Portfolio Managers also receive Firm-Related Variable Compensation based on revenues (adjusted for certain imputed expenses) generated by Royce. As a result, the Portfolio Manager may receive a greater relative benefit from activities that increase the value to Royce of The Royce Funds and/or other Royce client accounts, including, but not limited to, increases in sales of Registrant’s shares and assets under management.
Also, as described above, the Portfolio Managers generally manage more than one client account, including, among others, registered investment company accounts, separate accounts and private pooled accounts managed on behalf of institutions (e.g., pension funds, endowments and foundations) and for high-net-worth individuals. The appearance of a conflict of interest may arise where Royce has an incentive, such as a performance-based management fee (or any other variation in the level of fees payable by the Registrant or other Royce client accounts to Royce), which relates to the management of one or more of The Royce Funds or accounts with respect to which the same Portfolio Manager has day-to-day management responsibilities. Except as described below, no Royce Portfolio Manager's compensation is tied to performance fees earned by Royce for the management of any one client account. Although variable and other compensation derived from Royce revenues or profits is impacted to some extent, the impact is relatively minor given the small percentage of Royce’s assets under management for which it receives performance-measured revenue. RVT and RMT pay Royce a fulcrum fee that is adjusted up or down depending on the performance of the Fund relative to its benchmark index.
Finally, conflicts of interest may arise when a Portfolio Manager personally buys, holds or sells securities held or to be purchased or sold for the Registrant or other Royce client account or personally buys, holds or sells the shares of one or more of The Royce Funds. To address this, Royce has adopted a written Code of Ethics designed to prevent and detect personal trading activities that may interfere or conflict with client interests (including Registrant’s stockholders’ interests). Royce generally does not permit its Portfolio Managers to purchase small- or micro-cap securities for their personal investment portfolios.
Royce and The Royce Funds have adopted certain compliance procedures which are designed to address the above-described types of conflicts. However, there is no guarantee that such procedures will detect each and every situation in which a conflict arises.
| (a)(3) | Description of Portfolio Manager Compensation Structure (information as of December 31, 2024) |
Royce seeks to maintain a compensation program that is competitively positioned to attract and retain high-caliber investment professionals. All Portfolio Managers receive from Royce a base salary, Portfolio-Related Variable Compensation (generally the largest element of each Portfolio Manager’s compensation), Firm-Related Variable Compensation based primarily on registered investment company and other client account revenues generated by Royce, and a benefits package. Portfolio Manager compensation is reviewed and may be modified from time to time as appropriate to reflect changes in the market, as well as to adjust the factors used to determine variable compensation. Except as described below, each Portfolio Manager’s compensation consists of the following elements:
| - | BASE SALARY. Each Portfolio Manager is paid a base salary. In setting the base salary, Royce seeks to be competitive in light of the particular Portfolio Manager’s experience and responsibilities. |
| - | PORTFOLIO-RELATED VARIABLE COMPENSATION. Each Portfolio Manager receives quarterly Portfolio-Related Variable Compensation that is either asset-based, or revenue-based and therefore in part based on the value of the net assets of the account for which he or she is being compensated, determined with reference to each of the registered investment company and other client accounts they are managing. |
Payment of the Portfolio-Related Variable Compensation may be deferred, and any amounts deferred are forfeitable, if the Portfolio Manager is terminated by Royce with or without cause or resigns. The amount of the deferred Portfolio-Related Variable Compensation will appreciate or depreciate during the deferral period, based on the total return performance of one or more Royce-managed registered investment company accounts selected by the Portfolio Manager at the beginning of the deferral period. The amount deferred will depend on the Portfolio Manager’s total direct, indirect beneficial and deferred unvested investments in the Royce registered investment company accounts for which he or she is receiving portfolio management compensation.
| - | FIRM-RELATED VARIABLE COMPENSATION. Portfolio Managers receive quarterly variable compensation based on Royce’s net revenues. |
| - | BENEFIT PACKAGE. Portfolio Managers also receive the standard benefits package available to all Royce employees, including health care and other insurance benefits, and participation in Royce’s 401(k) Plan and Money Purchase Pension Plan. Each Royce employee, including each Portfolio Manager, is also eligible to purchase shares of Franklin Resources, Inc. at a 15% discount to its closing price on certain dates in accordance with the terms and conditions of the Franklin Templeton Employee Stock Investment Plan. |
| (a)(4) | Dollar Range of Equity Securities in Registrant Beneficially Owned by Portfolio Manager (information as of December 31, 2024). |
The following table shows the dollar range of the Registrant’s shares owned beneficially and of record by the Portfolio Managers, including investments by his immediate family members sharing the same household and amounts invested through retirement and deferred compensation plans.
| Portfolio Manager | Dollar Range of Registrant’s Shares Beneficially Owned |
| Steven McBoyle (Portfolio Manager) | None |
| Lauren Romeo (Portfolio Manager) | $100,001 - $500,000 |
| Andrew Palen (Portfolio Manager) | $10,001 - $50,000 |
| George Necakov (Portfolio Manager) | None |
| Francis Gannon (Portfolio Manager) | $50,001 - $100,000 |
Item 14. Purchases of Equity Securities by Closed-End Management Investment Company and Affiliated Purchasers.
There were no purchases of equity securities of the Registrant by the Registrant or any Affiliated Purchasers during the period of January 1, 2024 – December 31, 2024. The Registrant did not effectuate any repurchase plans or programs during the period.
Item 15. Submission of Matters to a Vote of Security Holders. Not Applicable.
Item 16. Controls and Procedures.
| (a) | Disclosure Controls and Procedures. The Principal Executive and Financial Officers concluded that the Registrant's Disclosure Controls and Procedures are effective based on their evaluation of the Disclosure Controls and Procedures as of a date within 90 days of the filing date of this report. |
| (b) | Internal Control over Financial Reporting. There were no changes in Registrant's internal control over financial reporting (as defined in Rule 30a-3(d) under the Investment Company Act of 1940) that occurred during the period covered by this report that has materially affected, or is reasonably likely to materially affect, the Registrant’s internal control over financial reporting. |
17. Disclosure of Securities Lending Activities for Closed-End Management Investment Companies.
| (a)(1) | Gross income from securities lending activities for the six-month period ended December 31, 2024, was $317.79. |
| (a)(2) | Compensation paid related to the securities lending program for the six-month period ended December 31, 2024, was $41.45. All compensation was paid pursuant to a revenue split. |
| (a)(3) | Aggregate compensation paid related to the securities lending program for the six-month period ended December 31, 2024, was $41.45. |
| (a)(4) | Net income from securities lending activities for the six-month period ended December 31, 2024, was $276.34. |
| (b) | Please see the section entitled “Borrowing” in the Notes to the Financial Statements contained in the Report to Stockholders included under Item 1 of this Form N-CSR. |
Item 18. Recovery of Erroneously Awarded Compensation. Not Applicable.
Item 19. Exhibits. Attached hereto.
Pursuant to the requirements of the Securities Exchange Act of 1934 and the Investment Company Act of 1940, the registrant has duly caused this report to be signed on its behalf by the undersigned, thereunto duly authorized.
ROYCE SMALL-CAP TRUST, INC.
| BY: | /s/Christopher D. Clark | |
Christopher D. Clark
President
Date: February 28, 2025
Pursuant to the requirements of the Securities Exchange Act of 1934 and the Investment Company Act of 1940, this report has been signed below by the following persons on behalf of the registrant and in the capacities and on the dates indicated.
| ROYCE SMALL-CAP TRUST, INC. | | ROYCE SMALL-CAP TRUST, INC. |
| | | |
| BY: | /s/Christopher D. Clark | | | BY: | /s/ Peter K. Hoglund | |
| Christopher D. Clark | | Peter K. Hoglund |
| President | | Chief Financial Officer |
| | | |
| Date: February 28, 2025 | | Date: February 28, 2025 |