
Investment objective
The Fund’s investment objective is to seek long-term capital appreciation primarily through investments in equity securities listed in Taiwan.
| Fund facts | (as at 05/31/17) |
| Net asset value per share | $21.54 |
| Market price | $19.29 |
| Premium/discount | -10.45% |
| Total net assets | $176.79 m |
| Market cap | $158.34 m |
| Fund statistics | |
| Investment adviser (date of appointment) | JF International Management, Inc. (07/22/14) |
| Fund manager | Shumin Huang |
| Listed | NYSE |
| Launch date | 12/23/86 |
| Shares outstanding | 8,208,223 |
| Last dividend (Ex-dividend date) | $2.6332 (December 26, 2014) |
| Benchmark | TAIEX Total Return Index |
| Fund codes | |
| Bloomberg | TWN |
| Sedol | 286987895 |
| CUSIP | 874036106 |
| ISIN | US8740361063 |
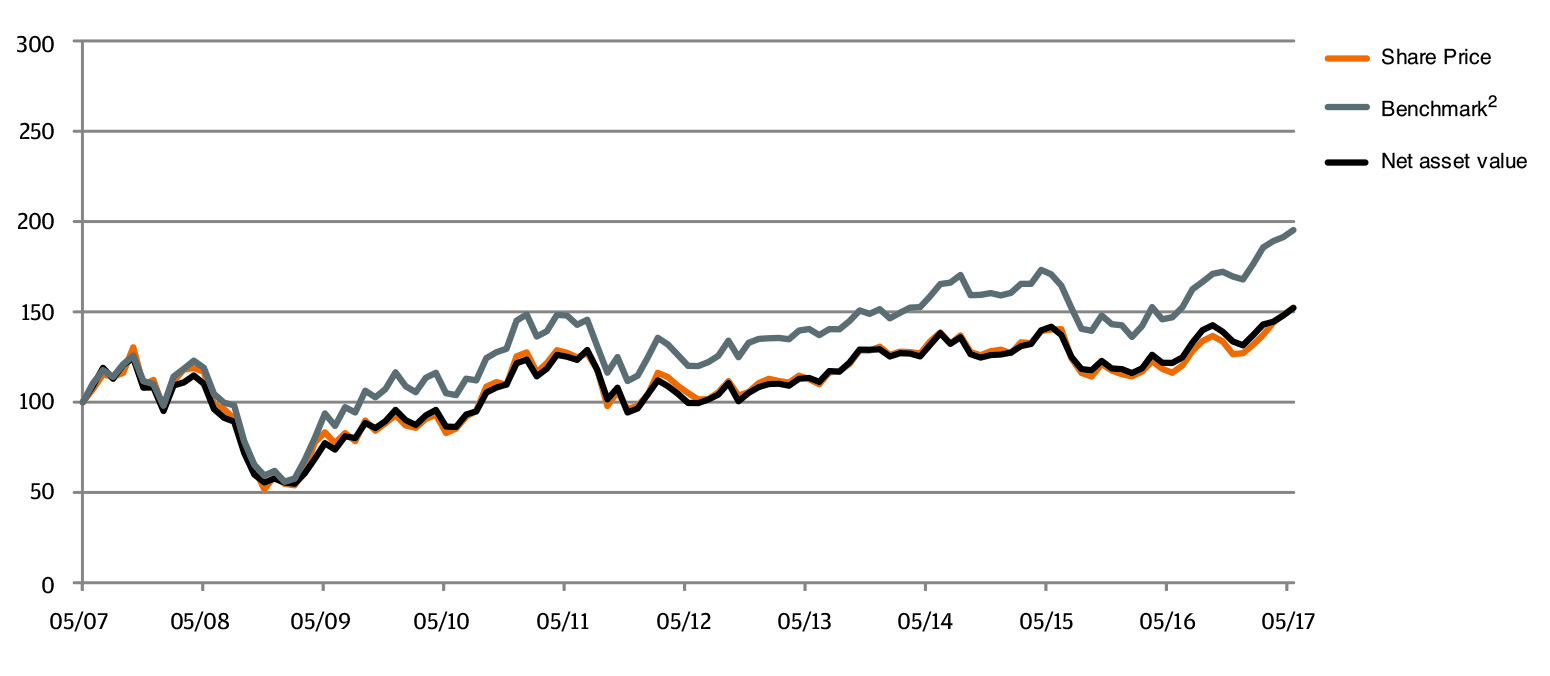
| 10 year performance data | (as at 05/31/17) |
Cumulative Performance1 | (as at 05/31/17) | ||||||
| % | 1m | 3m | YTD2 | 1Y | 3Y | 5Y | 10Y |
| The Taiwan Fund, Inc. | 2.8 | 6.4 | 15.7 | 25.0 | 15.5 | 52.8 | 52.3 |
| Market Price | 2.7 | 11.0 | 19.8 | 31.0 | 13.9 | 44.9 | 52.3 |
| TSE Index | 2.0 | 5.2 | 16.3 | 27.5 | 10.3 | 36.5 | 35.4 |
TAIEX Total Return Index3 | 2.0 | 5.2 | 16.3 | 32.8 | 23.1 | 62.6 | 95.3 |
| MSCI Taiwan Index | 2.4 | 6.4 | 16.8 | 33.4 | 25.8 | 63.3 | 70.0 |
Rolling 12 month performance1 | (as at 05/31/17) | ||||
| % | 2017/2016 | 2016/2015 | 2015/2014 | 2014/2013 | 2013/2012 |
| The Taiwan Fund, Inc. | 25.0 | -14.1 | 7.5 | 16.2 | 13.9 |
| Market Price | 31.0 | -17.1 | 4.9 | 18.6 | 7.3 |
| TSE Index | 27.5 | -17.2 | 4.4 | 9.7 | 12.8 |
TAIEX Total Return Index3 | 32.8 | -13.9 | 7.6 | 12.9 | 17.0 |
| MSCI Taiwan Index | 33.4 | -15.5 | 11.5 | 11.8 | 16.2 |
| Top 10 holdings | (as at 05/31/17) |
| Holding | Fund % |
Taiwan Semiconductor Manufacturing Co., Ltd. | 9.7% |
Hon Hai Precision Industry Co., Ltd. | 8.4% |
Largan Precision Co., Ltd. | 4.1% |
Cathay Financial Holding Co., Ltd. | 3.6% |
Nan Ya Plastics Corp. | 2.3% |
Yuanta Financial Holding Co., Ltd. | 2.2% |
CTBC Financial Holding Co., Ltd. | 2.2% |
President Chain Store Corp. | 2.1% |
| Airtac International Group | 2.1% |
Silergy Corp. | 2.1% |
1 | In US Dollar terms |
2 | Calendar year to date |
3 | TAIEX Total Return Index (prior to January 1, 2003, TAIEX Index) |

| Sector breakdown | (as at 05/31/17) | ||
| Sector Allocation | Fund % | Benchmark | Deviation |
| Automobile | 0.0% | 1.5% | -1.5% |
| Biotechnology & Medical Care | 0.0% | 0.7% | -0.7% |
| Building Material & Construction | 0.0% | 1.5% | -1.5% |
| Cement | 1.3% | 0.9% | 0.4% |
| Chemical | 0.2% | 1.0% | -0.8% |
| Communications & Internet | 1.3% | 6.2% | -4.9% |
| Computer & Peripheral Equipment | 6.2% | 5.9% | 0.3% |
| Electric & Machinery | 6.6% | 1.9% | 4.7% |
| Electrical & Cable | 0.0% | 0.3% | -0.3% |
| Electronic Parts & Components | 6.7% | 4.5% | 2.2% |
| Electronic Products Distribution | 0.0% | 0.8% | -0.8% |
| Financial & Insurance | 10.3% | 12.6% | -2.3% |
| Foods | 1.4% | 2.0% | -0.6% |
| Glass & Ceramic | 0.0% | 0.2% | -0.2% |
| Information Service | 0.0% | 0.2% | -0.2% |
| Iron & Steel | 0.4% | 2.0% | -1.6% |
| Oil, Gas & Electricity | 1.1% | 3.6% | -2.5% |
| Optoelectronic | 6.6% | 4.7% | 1.9% |
| Other | 7.6% | 3.5% | 4.1% |
| Other Electronic | 12.8% | 8.2% | 4.6% |
| Paper & Pulp | 0.0% | 0.3% | -0.3% |
| Plastics | 3.2% | 6.3% | -3.1% |
| Rubber | 0.0% | 1.2% | -1.2% |
| Semiconductor | 24.6% | 24.9% | -0.3% |
| Shipping & Transportation | 1.5% | 1.4% | 0.1% |
| Textiles | 1.9% | 1.6% | 0.3% |
| Tourism | 0.9% | 0.5% | 0.4% |
| Trading & Consumers’ Goods | 3.2% | 1.6% | 1.6% |
| Cash | 2.2% | 0.0% | 2.2% |
| OVERALL TOTAL | 100.0% | 100.0% | 0.0% |
Market review
The TAIEX Total Return Index (TAIEX) closed higher for the sixth consecutive month, rising 2.0% in May and reaching a 17 year high. Trading volume across the market increased with activity from both overseas and local institutional investors. The technology sector outperformed as the new Apple Inc. iPhone 8 product cycle generated greater demand. The non-technology sectors, which had previously lagged the market, were the biggest contributors to performance, most notably automobile, food and tourism, as the strong New Taiwan Dollar (NTD) attracted investors to domestically focused companies. In contrast, the financial sector underperformed as insurance companies suffered foreign exchange losses on their overseas investments.
Fund update
The Fund outperformed the TAIEX Index by 0.8% in May. The Fund’s positions in mid-cap technology names positively contributed to the Fund’s performance. ASPEED Technology, Inc. rose as its newly launched software solution for Cybercafe was expected to contribute to both revenue and margin improvements. Bizlink Holding, Inc. and Hota Industrial Manufacturing Co., Ltd. benefitted from demand from Tesla. Mitac Holdings Corp. reported improvements in its core business supported by high dividend yields. General Interface Solution Holding Ltd. rallied following the report of better than expected margins. In contrast, the main detractor from the Fund’s performance was Largan Precision Co., Ltd. which experienced a decline following its previous gains. The Fund’s underweight position in Taiwan Semiconductor Manufacturing Co., Ltd also detracted as its share price continued to rise despite a weak second quarter 2017 (2Q17) outlook. Eclat Textile Co., Ltd. also struggled with weak April sales, but the company maintained its targets for 2Q17 and the rest of the year.
There was no change to the Fund’s core investment approach, with a focus on quality companies with strong growth profiles. The Fund continues to prefer consumer growth names with sustainable franchises, including those in the sportswear and auto parts sectors within Other Electronic. The Fund is also positive about its exposure to automation products in industrials. Additionally, the Fund is overweight in technology companies in the Apple Inc. supply chain, cloud, internet-of- things, gaming and semi-conductor sectors. The Fund remained underweight in telecommunications and basic materials.
Outlook
The impact of currency on the market is expected to be less pronounced as the NTD seems unlikely to experience similar levels of gains registered in the first quarter of 2017 and may establish itself around current levels in the second half of 2017. A successful launch of the new iPhone 8 in the third quarter of 2017 may generate further gains in the TAIEX, although the market may react negatively to any significant delays. Strong foreign inflows, continuing attractive valuations and the forthcoming dividend payment season may provide some positive support to the market.
| Full portfolio holdings | (as at 05/31/17) | |
| Holding | Market Value USD | Fund % |
| Semiconductor | 43,440,245 | 24.6 |
Taiwan Semiconductor Manufacturing Co., Ltd. | 17,216,430 | 9.7 |
Silergy Corp. | 3,732,371 | 2.1 |
| ASPEED Technology, Inc. | 3,351,346 | 1.9 |
| Powertech Technology, Inc. | 3,311,520 | 1.9 |
Nanya Technology Corp. | 2,628,003 | 1.5 |
| Advanced Semiconductor Engineering, Inc. | 2,558,413 | 1.4 |
| MediaTek, Inc. | 2,286,313 | 1.3 |
Novatek Microelectronics Corp. | 1,899,033 | 1.1 |
Realtek Semiconductor Corp. | 1,861,049 | 1.1 |
| Parade Technologies Ltd. | 1,320,506 | 0.7 |
Chunghwa Precision Test Tech Co., Ltd. | 1,028,458 | 0.6 |
Win Semiconductors Corp. | 706,539 | 0.4 |
King Yuan Electronics Co., Ltd. | 529,765 | 0.3 |
Vanguard International Semiconductor Corp. | 516,500 | 0.3 |
| Tong Hsing Electronic Industries, Ltd. | 493,999 | 0.3 |
| Other Electronic | 22,690,725 | 12.8 |
Hon Hai Precision Industry Co., Ltd. | 14,862,418 | 8.4 |
Catcher Technology Co., Ltd. | 3,467,669 | 1.9 |
| Bizlink Holding, Inc. | 2,649,623 | 1.5 |
Voltronic Power Technology Corp. | 1,711,015 | 1.0 |
| Financial & Insurance | 18,204,696 | 10.3 |
Cathay Financial Holding Co., Ltd. | 6,281,670 | 3.6 |
Yuanta Financial Holding Co., Ltd. | 3,896,908 | 2.2 |
CTBC Financial Holding Co., Ltd. | 3,860,687 | 2.2 |
Fubon Financial Holding Co., Ltd. | 3,124,855 | 1.7 |
China Life Insurance Co., Ltd. | 1,040,576 | 0.6 |
| Other | 13,370,015 | 7.6 |
| Taiwan Paiho Ltd. | 3,377,955 | 1.9 |
Chailease Holding Co., Ltd. | 3,096,393 | 1.8 |
Nien Made Enterprise Co., Ltd. | 2,129,808 | 1.2 |
Giant Manufacturing Co., Ltd. | 2,047,891 | 1.2 |
Merida Industry Co., Ltd. | 1,853,037 | 1.0 |
| KMC Kuei Meng International, Inc. | 864,931 | 0.5 |
| Electronic Parts & Components | 11,879,171 | 6.7 |
| Delta Electronics, Inc. | 3,218,316 | 1.8 |
Tripod Technology Corp. | 2,469,663 | 1.4 |
Elite Material Co., Ltd. | 2,219,156 | 1.3 |
King Slide Works Co., Ltd. | 1,838,625 | 1.0 |
Sinbon Electronics Co., Ltd. | 1,658,960 | 0.9 |
| Flexium Interconnect, Inc. | 474,451 | 0.3 |
| Electric & Machinery | 11,744,050 | 6.6 |
| Airtac International Group | 3,741,747 | 2.1 |
Hota Industrial Manufacturing Co., Ltd. | 3,481,507 | 2.0 |
Hiwin Technologies Corp. | 2,088,567 | 1.2 |
Global PMX Co., Ltd. | 1,963,463 | 1.1 |
Macauto Industrial Co., Ltd. | 468,766 | 0.2 |
| Optoelectronic | 11,580,455 | 6.6 |
Largan Precision Co., Ltd. | 7,264,204 | 4.1 |
Epistar Corp. | 2,402,765 | 1.4 |
| General Interface Solution Holding Ltd. | 1,172,446 | 0.7 |
Au Optronics Corp. | 741,040 | 0.4 |
| Full portfolio holdings (cont'd) | ||
| Holding | Market Value USD | Fund % |
| Computer & Peripheral Equipment | 10,917,543 | 6.2 |
Ennoconn Corp. | 2,734,226 | 1.6 |
Mitac Holdings Corp. | 2,485,435 | 1.4 |
| Primax Electronics Ltd. | 2,238,555 | 1.3 |
Advantech Co., Ltd. | 1,614,282 | 0.9 |
Inventec Corp. | 1,312,215 | 0.7 |
Quanta Computer, Inc. | 532,830 | 0.3 |
| Trading & Consumers' Goods | 5,735,736 | 3.2 |
President Chain Store Corp. | 3,756,109 | 2.1 |
Poya International Co., Ltd. | 1,979,627 | 1.1 |
| Plastics | 5,682,699 | 3.2 |
Nan Ya Plastics Corp. | 4,039,536 | 2.3 |
Formosa Plastics Corp. | 1,643,163 | 0.9 |
| Textiles | 3,437,601 | 1.9 |
Eclat Textile Co., Ltd. | 3,437,601 | 1.9 |
| Shipping & Transportation | 2,579,836 | 1.5 |
Evergreen Marine Corp. (Taiwan) Ltd. | 2,579,836 | 1.5 |
| Foods | 2,515,562 | 1.4 |
Uni-President Enterprises Corp. | 2,515,562 | 1.4 |
| Communications & Internet | 2,320,160 | 1.3 |
Wistron NeWeb Corp. | 1,262,944 | 0.7 |
Advanced Ceramic X Corp. | 1,057,216 | 0.6 |
| Cement | 2,294,172 | 1.3 |
Taiwan Cement Corp. | 2,294,172 | 1.3 |
| Oil, Gas & Electricity | 1,992,753 | 1.1 |
Formosa Petrochemical Corp. | 1,992,753 | 1.1 |
| Tourism | 1,503,042 | 0.9 |
Gourmet Master Co., Ltd. | 1,503,042 | 0.9 |
| Iron & Steel | 705,991 | 0.4 |
China Steel Corp. | 705,991 | 0.4 |
| Chemical | 344,759 | 0.2 |
China Steel Chemical Corp. | 344,759 | 0.2 |
| Cash | 3,850,947 | 2.2 |
| Cash | 3,850,947 | 2.2 |
| Grand Total | 176,790,158 | 100.0 |
Source: MSCI. Neither MSCI nor any other party involved in or related to compiling, computing or creating the MSCI data makes any express of implied warranties or representations with respect to such data (or the results to be obtained by the use thereof), and all such parties hereby expressly disclaim all warranties of originality, accuracy, completeness, merchantability or fitness for a particular purpose with respect to any of such data. Without limiting any of the foregoing, in no event shall MSCI, any of its affiliates or any third party involved in or related to compiling computing or creating the data have any liability for any direct, indirect, special, punitive, consequential or any other damages (including lost profits) even if notified of the possibility of such damages.
No further distribution or dissemination of the MSCI data is permitted without MSCI’s express written consent.
Important Information
This document is issued and approved by JF International Management, Inc. (“JFIMI”), as investment advisor of The Taiwan Fund, Inc. (the ‘’Fund’’). JFIMI is an investment advisor registered with the US Securities and Exchange Commission. Certain information herein is believed to be reliable but has not been verified by JFIMI. JFIMI makes no representation or warranty and does not accept any responsibility in relation to such information or for opinion or conclusion which the reader may draw from this newsletter.
The Fund is classified as a diversified investment company under the US Investment Company Act of 1940 as amended. It meets the criteria of a closed end US fund and its shares are listed on the New York Stock Exchange. JFIMI has been appointed investment advisor to the Fund.
This newsletter does not constitute an offer of shares. Closed-end funds, unlike open-end funds, are not continuously offered. After the initial public offering, shares are bought and sold on the open market through a stock exchange. JFIMI, its ultimate and intermediate holding companies, subsidiaries, affiliates, clients, directors or staff may, at any time, have a position in the market referred to herein, and may buy or sell securities, currencies, or any other financial instruments in such markets. The information or opinion expressed in this newsletter should not be construed to be a recommendation to buy or sell any security, including the securities, commodities, currencies or financial instruments referred to herein.
Portfolio holdings are subject to change daily.
It should not be assumed that any of the securities transactions or holdings discussed here were or will prove to be profitable, or that the investment recommendations or decisions we make in the future will be profitable or will equal the investment performance of the securities discussed herein.
Investing in the Fund involves certain considerations in addition to the risks normally associated with making investments in securities. The value of the shares issued by the Fund, and the income from them, may go down as well as up and there can be no assurance that upon sale, or otherwise, investors will receive back the amount originally invested. There can be no assurance that you will receive comparable performance returns. Movements in foreign exchange rates may have a separate effect, unfavorable as well as favorable, on the gain or loss otherwise experienced on an investment. Past performance is not a guide to future returns. Accordingly, the Fund is only suitable for investment by investors who are able and willing to withstand the total loss of their investment. In particular, prospective investors should consider the following risks:
Discretionary investment is not risk-free. The past operating performance does not guarantee a minimum return for the discretionary investment fund. Apart from exercising the duty of care of a prudent adviser, JFIMI will not be responsible for the profit or loss of the discretionary investment fund, nor guarantee a minimum return.
| • | It should be noted that investment in the Fund is only suitable for sophisticated investors who are aware of the risk of investing in Taiwan and should be regarded as long term. Funds which invest in one country carry a higher degree of risk than those with portfolios diversified across a number of markets. |
| • | Investment in the securities of smaller and unquoted companies can involve greater risk than is customarily associated with investment in larger, more established, companies. In particular, smaller companies often have limited product lines, markets or financial resources and their management may be dependent on a smaller number of key individuals. In addition, the market for stock in smaller companies is often less liquid than that for stock in larger companies, bringing with it potential difficulties in acquiring, valuing and disposing of such stock. Proper information for determining their value, or the risks to which they are exposed, may not be available. |
| • | Investments within emerging markets such as Taiwan can be of higher risk. Many emerging markets, and the companies quoted on their stock exchanges, are exposed to the risks of political, social and religious instability, expropriation of assets or nationalization, rapid rates of inflation, high interest rates, currency depreciation and fluctuations and changes in taxation which may affect the Fund’s income and the value of its investments. |
| • | The marketability of quoted shares may be limited due to foreign investment restrictions, wide dealing spreads, exchange controls, foreign ownership restrictions, the restricted opening of stock exchanges and a narrow range of investors. Trading volume may be lower than on more developed stock markets, and equities are less liquid. Volatility of prices can also be greater than in more developed stock markets. The infrastructure for clearing, settlement and registration on the primary and secondary markets may be undeveloped. Under certain circumstances, there may be delays in settling transactions in some of the markets. |