Investment objective
The Fund’s investment objective is to seek long-term capital appreciation primarily through investments in equity securities listed in Taiwan.
| Fund facts | (as at 04/30/18) |
| Net asset value per share | $23.28 |
| Market price | $19.91 |
| Premium/discount | -14.48% |
| Total net assets | $189.52 m |
| Market cap | $162.14 m |
| Fund statistics | |
Investment adviser (date of appointment) | JF International Management, Inc. (07/22/14) |
| Fund manager | Shumin Huang |
| Listed | NYSE |
| Launch date | 12/23/86 |
| Shares outstanding | 8,143,558 |
Last dividend (Ex-dividend date) | $0.66 |
| Benchmark | TAIEX Total Return Index |
| Fund codes | |
| Bloomberg | TWN |
| Sedol | 286987895 |
| CUSIP | 874036106 |
| ISIN | US8740361063 |
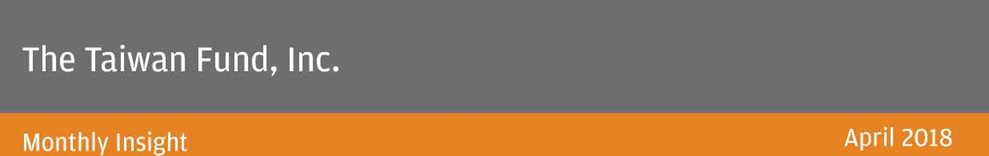
| 10 year performance data | (as at 04/30/18) |
| Cumulative Performance1 | (as at 04/30/18) | ||||||
| % | 1m | 3m | YTD | 1Y | 3Y | 5Y | 10Y |
| The Taiwan Fund, Inc. | -4.2 | -5.0 | 0.4 | 14.5 | 21.3 | 50.0 | 47.8 |
| Market Price | -5.9 | -9.2 | -4.6 | 9.2 | 16.2 | 41.2 | 36.3 |
| TSE Index | -3.7 | -5.4 | 0.7 | 10.1 | 12.3 | 31.4 | 23.0 |
| TAIEX Total Return Index | -3.7 | -5.4 | 0.7 | 14.4 | 26.4 | 56.8 | 78.1 |
| MSCI Taiwan Index | -4.6 | -6.3 | 0.9 | 12.8 | 23.9 | 54.6 | 57.9 |
| 1 Rolling 12 month performance1 | (as at 04/30/18) | ||||
| % | 2018/2017 | 2017/2016 | 2016/2015 | 2015/2014 | 2014/2013 |
| The Taiwan Fund, Inc. | 14.5 | 21.5 | -12.8 | 11.5 | 10.9 |
| Market Price | 9.2 | 25.2 | -15.0 | 9.8 | 10.7 |
| TSE Index | 10.1 | 26.0 | -19.0 | 10.1 | 6.2 |
| TAIEX Total Return Index3 | 14.4 | 31.2 | -15.8 | 13.5 | 9.3 |
| MSCI Taiwan Index | 12.8 | 32.6 | -17.1 | 16.1 | 7.5 |
| Top 10 holdings | (as at 04/30/18) |
| Holding | Fund % |
| Taiwan Semiconductor Manufacturing Co., Ltd. | 19.2% |
| MediaTek, Inc. | 4.8% |
| Hiwin Technologies Corp. | 4.2% |
| CTBC Financial Holding Co., Ltd. | 4.0% |
| Cathay Financial Holding Co., Ltd. | 4.0% |
| Yageo Corp. | 3.9% |
| Catcher Technology Co., Ltd. | 3.8% |
| Formosa Plastics Corp. | 3.5% |
| Chroma ATE, Inc. | 3.3% |
| Acer, Inc. | 2.9% |
| 1 | In US Dollar terms |
| 2 | Calendar year to date |
| 3 | TAIEX Total Return Index (prior to January 1, 2003, TAIEX Index) |

| Sector breakdown | (as at 04/30/18) |
| Sector Allocation | Fund % | Benchmark | Deviation |
| Automobile | 0.0 | 1.1 | -1.1 |
| Biotechnology & Medical Care | 2.1 | 0.8 | 1.3 |
| Building Material & Construction | 0.0 | 1.4 | -1.4 |
| Cement | 2.5 | 1.0 | 1.5 |
| Chemical | 0.0 | 1.0 | -1.0 |
| Communications & Internet | 2.1 | 5.8 | -3.7 |
| Computer & Peripheral Equipment | 9.4 | 5.1 | 4.3 |
| Electric & Machinery | 8.5 | 2.2 | 6.3 |
| Electrical & Cable | 0.0 | 0.4 | -0.4 |
| Electronic Parts & Components | 3.9 | 4.7 | -0.8 |
| Electronic Products Distribution | 0.0 | 0.8 | -0.8 |
| Financial & Insurance | 12.0 | 13.5 | -1.5 |
| Foods | 2.3 | 2.1 | 0.1 |
| Glass & Ceramic | 0.0 | 0.2 | -0.2 |
| Information Service | 0.0 | 0.2 | -0.2 |
| Iron & Steel | 0.0 | 2.0 | -2.0 |
| Oil, Gas & Electricity | 0.0 | 3.8 | -3.8 |
| Optoelectronic | 1.7 | 3.8 | -2.2 |
| Other | 2.9 | 3.3 | -0.5 |
| Other Electronic | 9.1 | 6.6 | 2.5 |
| Paper & Pulp | 0.0 | 0.4 | -0.4 |
| Plastics | 5.8 | 6.9 | -1.1 |
| Rubber | 0.0 | 1.0 | -1.0 |
| Semiconductor | 35.4 | 26.4 | 9.0 |
| Shipping & Transportation | 0.0 | 1.5 | -1.5 |
| Textiles | 0.0 | 1.6 | -1.6 |
| Tourism | 0.0 | 0.5 | -0.5 |
| Trading & Consumers’ Goods | 0.7 | 1.7 | -0.9 |
| Cash | 1.7 | 0.0 | 1.7 |
| OVERALL TOTAL | 100.0% | 100.0% | 0.0 |
Market review
The TAIEX Total Return Index (TAIEX) declined 3.7% in April, affected by the escalating trade tensions between China and the United States (U.S.), lower than expected demand for the iPhone X and disappointing earnings results. The technology sector led the market correction as Taiwan Semiconductor Manufacturing Co., Ltd. (TSMC) delivered unexpected weak guidance. In addition, the telecommunications supply chain suffered from the U.S. Commerce Department's ban on U.S. technology companies selling their products to Zhongxing Telecommunications Equipment (ZTE), one of the two main smartphone manufacturers in China, due to ZTE violating U.S. sanctions. The U.S. Department of Justice also opened an investigation into Huawei, the other major smartphone manufacturer in China.
Fund update
The Fund underperformed the TAIEX by 0.5% in April. Chroma ATE, Inc. and Visual Photonics Epitaxy Co., Ltd. suffered from the ZTE ban referenced above. Win Semiconductors Corp. underperformed due to weak iPhone X demand, but the Fund remains positive about growth in its 3D sensing and power amplifier content growth when migrating to 5G. In contrast, other technology and industrials names such as Yageo Corp. and Hiwin Technologies Corp. positively contributed to performance due to increase in the prices of each company's products. The Fund's underweight position in TSMC also added to performance against the TAIEX.
There is no change to the Fund's core investment approach with a preference for quality companies with strong growth profiles supported by earnings momentum. The resumption of inventory restocking and the product cycle is expected to gradually improve sentiment in some technology stocks. The Fund's overweight position in technology and growth stocks reflects its confidence in the structural trends in numerous subsectors. It also remains overweight in non-technology industrial, financial and consumer businesses and underweight in telecommunications and basic materials.
Outlook
The Fund remains positive about the outlook for the Taiwan equity market with the expectation that trade tension between the U.S. and China will ease and demand for artificial intelligence, electrical vehicles, cloud and industrial internet of things will continue to increase.

Full portfolio holdings | (as at 04/30/18) |
| Holding | Market Value USD | Fund % |
| Semiconductor | 67,103,158 | 35.4 |
| Taiwan Semiconductor Manufacturing Co., Ltd. | 36,359,590 | 19.2 |
| MediaTek, Inc. | 9,147,415 | 4.8 |
| Nanya Technology Corp. | 4,425,802 | 2.3 |
| Parade Technologies Ltd. | 4,000,085 | 2.1 |
| Globalwafers Co., Ltd. | 3,150,728 | 1.7 |
| Global Unichip Corp. | 2,859,412 | 1.5 |
| Win Semiconductors Corp. | 2,617,832 | 1.4 |
| ASPEED Technology, Inc. | 1,699,741 | 0.9 |
| Silergy Corp. | 1,471,617 | 0.8 |
| Chipbond Technology Corp. | 1,370,936 | 0.7 |
| Financial & Insurance | 22,710,716 | 12.0 |
| CTBC Financial Holding Co., Ltd. | 7,660,673 | 4.0 |
| Cathay Financial Holding Co., Ltd. | 7,581,299 | 4.0 |
| Fubon Financial Holding Co., Ltd. | 4,076,690 | 2.2 |
| E.Sun Financial Holding Co., Ltd. | 3,392,054 | 1.8 |
| Computer & Peripheral Equipment | 17,749,662 | 9.4 |
| Acer, Inc. | 5,412,076 | 2.9 |
| Ennoconn Corp. | 4,422,902 | 2.3 |
| Micro-Star International Co., Ltd. | 4,141,781 | 2.2 |
| Wistron Corp. | 3,772,903 | 2.0 |
| Other Electronic | 17,309,209 | 9.1 |
| Catcher Technology Co., Ltd. | 7,137,647 | 3.8 |
| Chroma ATE, Inc. | 6,322,140 | 3.3 |
| Voltronic Power Technology Corp. | 2,495,189 | 1.3 |
| Kingpak Technology, Inc. | 1,354,233 | 0.7 |
| Electric & Machinery | 16,172,380 | 8.5 |
| Hiwin Technologies Corp. | 7,907,187 | 4.2 |
| Airtac International Group | 4,935,194 | 2.6 |
| Global PMX Co., Ltd. | 2,352,932 | 1.2 |
| Hota Industrial Manufacturing Co., Ltd. | 977,067 | 0.5 |
| Plastics | 10,965,153 | 5.8 |
| Formosa Plastics Corp. | 6,671,979 | 3.5 |
| Formosa Chemicals & Fibre Corp. | 4,293,174 | 2.3 |
| Electronic Parts & Components | 7,332,466 | 3.9 |
| Yageo Corp. | 7,332,466 | 3.9 |
| Other | 5,403,748 | 2.8 |
| Chailease Holding Co., Ltd. | 4,723,032 | 2.5 |
| Nien Made Enterprise Co., Ltd. | 680,716 | 0.3 |
| Full portfolio holdings (cont’d) | (as at 04/30/18)
| |
| Holding | Market Value USD | Fund % |
| Cement | 4,773,070 | 2.5 |
| Taiwan Cement Corp. | 4,773,070 | 2.5 |
| Foods | 4,322,148 | 2.3 |
| Uni-President Enterprises Corp. | 4,322,148 | 2.3 |
| Communications & Internet | 4,000,869 | 2.1 |
| Visual Photonics Epitaxy Co., Ltd. | 2,733,967 | 1.4 |
| Accton Technology Corp. | 1,266,902 | 0.7 |
| Biotechnology & Medical Care | 3,902,422 | 2.1 |
| St. Shine Optical Co., Ltd. | 3,136,566 | 1.7 |
| Grape King Bio Ltd. | 765,856 | 0.4 |
| Optoelectronic | 3,175,773 | 1.7 |
| Largan Precision Co., Ltd. | 3,175,773 | 1.7 |
| Trading & Consumers’ Goods | 1,397,053 | 0.7 |
| Poya International Co., Ltd. | 1,397,053 | 0.7 |
| Cash | 3,205,869 | 1.7 |
| Cash | 3,205,869 | 1.7 |
| Grand Total | 189,523,696 | 100.0 |
Source: MSCI. Neither MSCI nor any other party involved in or related to compiling, computing or creating the MSCI data makes any express of implied warranties or representations with respect to such data (or the results to be obtained by the use thereof), and all such parties hereby expressly disclaim all warranties of originality, accuracy, completeness, merchantability or fitness for a particular purpose with respect to any of such data. Without limiting any of the foregoing, in no event shall MSCI, any of its affiliates or any third party involved in or related to compiling computing or creating the data have any liability for any direct, indirect, special, punitive, consequential or any other damages (including lost profits) even if notified of the possibility of such damages.
No further distribution or dissemination of the MSCI data is permitted without MSCI's express written consent.
Important Information
This document is issued and approved by JF International Management, Inc. (“JFIMI”), as investment advisor of The Taiwan Fund, Inc. (the ‘'Fund''). JFIMI is an investment advisor registered with the US Securities and Exchange Commission. Certain information herein is believed to be reliable but has not been verified by JFIMI. JFIMI makes no representation or warranty and does not accept any responsibility in relation to such information or for opinion or conclusion which the reader may draw from this newsletter.
The Fund is classified as a diversified investment company under the US Investment Company Act of 1940 as amended. It meets the criteria of a closed end US fund and its shares are listed on the New York Stock Exchange. JFIMI has been appointed investment advisor to the Fund.
This newsletter does not constitute an offer of shares. Closed-end funds, unlike open-end funds, are not continuously offered. After the initial public offering, shares are bought and sold on the open market through a stock exchange. JFIMI, its ultimate and intermediate holding companies, subsidiaries, affiliates, clients, directors or staff may, at any time, have a position in the market referred to herein, and may buy or sell securities, currencies, or any other financial instruments in such markets. The information or opinion expressed in this newsletter should not be construed to be a recommendation to buy or sell any security, including the securities, commodities, currencies or financial instruments referred to herein.
Portfolio holdings are subject to change daily.
It should not be assumed that any of the securities transactions or holdings discussed here were or will prove to be profitable, or that the investment recommendations or decisions we make in the future will be profitable or will equal the investment performance of the securities discussed herein.
Investing in the Fund involves certain considerations in addition to the risks normally associated with making investments in securities. The value of the shares issued by the Fund, and the income from them, may go down as well as up and there can be no assurance that upon sale, or otherwise, investors will receive back the amount originally invested. There can be no assurance that you will receive comparable performance returns. Movements in foreign exchange rates may have a separate effect, unfavorable as well as favorable, on the gain or loss otherwise experienced on an investment. Past performance is not a guide to future returns. Accordingly, the Fund is only suitable for investment by investors who are able and willing to withstand the total loss of their investment. In particular, prospective investors should consider the following risks:
Discretionary investment is not risk-free. The past operating performance does not guarantee a minimum return for the discretionary investment fund. Apart from exercising the duty of care of a prudent adviser, JFIMI will not be responsible for the profit or loss of the discretionary investment fund, nor guarantee a minimum return.
| • | It should be noted that investment in the Fund is only suitable for sophisticated investors who are aware of the risk of investing in Taiwan and should be regarded as long term. Funds which invest in one country carry a higher degree of risk than those with portfolios diversified across a number of markets. |
| • | Investment in the securities of smaller and unquoted companies can involve greater risk than is customarily associated with investment in larger, more established, companies. In particular, smaller companies often have limited product lines, markets or financial resources and their management may be dependent on a smaller number of key individuals. In addition, the market for stock in smaller companies is often less liquid than that for stock in larger companies, bringing with it potential difficulties in acquiring, valuing and disposing of such stock. Proper information for determining their value, or the risks to which they are exposed, may not be available. |
| • | Investments within emerging markets such as Taiwan can be of higher risk. Many emerging markets, and the companies quoted on their stock exchanges, are exposed to the risks of political, social and religious instability, expropriation of assets or nationalization, rapid rates of inflation, high interest rates, currency depreciation and fluctuations and changes in taxation which may affect the Fund's income and the value of its investments. |
| • | The marketability of quoted shares may be limited due to foreign investment restrictions, wide dealing spreads, exchange controls, foreign ownership restrictions, the restricted opening of stock exchanges and a narrow range of investors. Trading volume may be lower than on more developed stock markets, and equities are less liquid. Volatility of prices can also be greater than in more developed stock markets. The infrastructure for clearing, settlement and registration on the primary and secondary markets may be undeveloped. Under certain circumstances, there may be delays in settling transactions in some of the markets. |
If you have any questions or comments about the Fund, please contact the Fund at the address or telephone number below or via the websitewww.thetaiwanfund.com
The Taiwan Fund, Inc.
c/o State Street Bank and Trust Company
P.O. Box 5049 One Lincoln Street
Boston MA 02206-5049
Tel: 877-217-9502