UNITED STATES
SECURITIES AND EXCHANGE COMMISSION
Washington, D.C. 20549
FORM N-CSR
CERTIFIED SHAREHOLDER REPORT OF REGISTERED
MANAGEMENT INVESTMENT COMPANIES
Investment Company Act file number: 811-04893
THE TAIWAN FUND, INC.
(Exact name of registrant as specified in charter)
C/O STATE STREET BANK AND TRUST COMPANY,
ONE LINCOLN STREET, P.O. BOX 5049,
BOSTON, MA 02111
(Address of principal executive offices)(Zip code)
| (Name and Address of Agent for Service) | Copy to: |
| | |
| State Street Bank and Trust Company | Leonard B. Mackey, Jr., Esq. |
| Attention: Brian F. Link | Clifford Chance US LLP |
| Secretary | 31 West 52nd Street |
| 100 Summer Street, Mailstop: SUM0703 | New York, New York 10019-6131 |
| Boston, Massachusetts 02111 | |
Registrant’s telephone number, including area code: 1-877-217-9502
Date of fiscal year end: August 31
Date of reporting period: February 28, 2019
Item 1. Report to Stockholders.
Beginning on April 1, 2021, as permitted by regulations adopted by the U.S. Securities and Exchange Commission, paper copies of the Fund’s annual and semi-annual shareholder reports will no longer be sent by mail, unless you specifically request paper copies of the reports. Instead, the reports will be made available on the Fund’s website (www.thetaiwanfund.com), and you will be notified by mail each time a report is posted and provided with a website link to access the report.
If you already elected to receive shareholder reports electronically, you will not be affected by this change and you need not take any action. You may elect to receive shareholder reports and other communications from the Fund electronically anytime by contacting your financial intermediary or, if you are a direct investor, by calling 1-800-426-5523.
You may elect to receive all future reports in paper free of charge. If you invest through a financial intermediary, you can contact your financial intermediary to request that you continue to receive paper copies of your shareholder reports. Your election to receive shareholder reports in paper will apply to all funds that you hold through the financial intermediary. If you invest directly with the Fund, you can call 1-800-426-5523 to let the Fund know you wish to continue receiving paper copies of your shareholder reports.
Dear Stockholders,
During the six months ended February 28, 2019 (“the period”), the Taiwan equity market experienced a significant decline in 2018 before posting steady gains in the first two months of 2019. Increased tensions in the continuing trade dispute between China and the United States and a slowing of economic growth in China were among the negative factors contributing to losses in 2018. Some of the positive sentiment in 2019 arose from expectations of a new Sino-American trade agreement; the Beijing government’s economic stimulus program; and the reduced likelihood of interest rate rises by the United States Federal Reserve.
Against this backdrop, The Taiwan Fund, Inc.’s (the “Fund”) underperformance against its benchmark, the TAIEX Total Return Index (“TAIEX”) experienced in the financial year ended August 31, 2018 continued, with underperformances totalling -4.7% in September and October 2018. The paragraphs below detail actions taken by the Board to address that underperformance. Since November 2018, the Fund’s performance against the TAIEX has made up ground and ended the period with an outperformance against the TAIEX of 0.8% on a net asset value basis. The Fund’s net asset value declined 5.4%1 during the period and the benchmark declined by -6.2% over the same period. Based on share price, the Fund declined -5.5%1 during the same period. Details of the investment strategy of JF International Management Inc., the Fund’s Investment Manager, are provided in the Report of the Investment Manager on pages 4 to 6.
On October 30, 2018, the Fund announced that it had negotiated a reduction in the advisory fees paid to JF International Management Inc. from 0.90% (tiered) to a flat fee of 0.75% effective from September 1, 2018.
Note
1 | Total investment return at net asset value (“NAV”) is based on changes in the NAV of Fund shares and assumes reinvestment of dividends and distributions. Total investment return at market value is based on changes in the market price at which the Fund’s shares traded on the stock exchange during the period and assumes reinvestment of dividends and distributions at actual prices pursuant to the Fund’s dividend reinvestment program. |
2
On December 4, 2018 the Fund announced that the Fund’s Board had commenced a search for an Investment Manager to manage the Fund’s assets, and on March 8, 2019, the Fund announced that the Board had selected Allianz Global Investors U.S. LLC to serve as the Fund’s investment adviser, subject to stockholder approval. Stockholders approved the selection at the Fund’s Annual Meeting on April 24, 2019.
The Fund paid a dividend of $1.7078 per share on January 4, 2019 to stockholders of record on December 21, 2018 with an ex-dividend date of December 20, 2018.
During the period, the Fund continued the repurchase of shares under its Discount Management Program (the “Program”) and made purchases totalling 184,148 shares. During the period, the average discount at which the Fund’s shares traded below net asset value was 13.2%, with a high of 15.4% and a low of 10.3 %. On December 4, 2018 the Fund announced a further adjustment to the Discount Management Program in which, in addition to continuing to repurchase shares to the maximum extent permitted by law, the Fund also intends once a week to seek to repurchase a block of its shares.
On behalf of the Board, I thank you for your continuing support of the Fund.
Sincerely,

William C. Kirby,
Chairman
3
Report of the Investment Manager |
Market Review
For the six month period ended February 28, 2019, the TAIEX Total Return Index (“TAIEX”) declined -6.2% in U.S. dollar terms, reflecting the global equity market correction towards the end of 2018. The main reasons for the decline included concerns over the China and U.S. trade dispute, the slow down of economic growth in China and the continuation of weak data for the Taiwan export market. In contrast, stock markets rebounded in the first two months of 2019, driven by more positive macro and policy developments including an easing of China and U.S. trade tensions with the announcement of delays to the launch of higher import tariffs on Chinese goods. Positive sentiment was also supported by the expectation that the U.S. Federal Reserve would reduce the pace of increases in interest rates, the launch of a domestic consumer stimulus plan by the government in China and expectations of improved results for technology companies in the second half of the 2019.
Portfolio activity
The Fund’s performance stabilized as the period progressed and ended outperforming the TAIEX index by 0.8% driven by strong stock selection albeit negative attribution from sector allocation.
The Fund diversified away from smartphone components due to the continued lackluster demand for the Apple iPhones and smartphones manufactured in China, particularly Catcher Technology Co., Ltd. and Win Semiconductors Corp., which were among the key detractors for the Fund. Within the smartphone supply chain, the Fund was highly selective and remained positive towards Largan Precision Co., Ltd. for the increasing adoption of triple-camera technology by both the Apple and Chinese smartphone manufacturers in 2019, as well as Merry Electronics Co., Ltd. for their True Wireless Stereo technology. Within the semiconductor sector, the Fund switched from Vanguard International Semiconductor Corp. to Taiwan Semiconductor Manufacturing Co., Ltd., given the increasing concern about declining utilization for power semiconductors amid the continued weakness within the automobile industries.
4
The Fund also reduced its exposure to stocks in the Financial & Insurance sector, including CTBC Financial Holding Co., Ltd., Fubon Financial Holding Co., Ltd. and Mega Financial Holding Co., Ltd, as the expected changes in the U.S. Federal Reserve’s interest rate policy seemed likely to reduce earnings for the financial sector. However, the Fund added to its holding in Chailease Holding Co., Ltd. as its leasing business in China is well positioned to benefit from China’s policy stimuli for small/medium enterprises.
In the Biotechnology & Medical Care sector, the Fund reduced its holdings in Grape King Bio Ltd. due to the Chinese government’s tightening policy on micro-merchants for health food products, and St. Shine Optical Co., Ltd. because of rising competition in the color contact lens market in Japan. In contrast, the Fund increased its holding in Ginko International Co., Ltd., a leading contact lens brand in China with a steady market share in a growing market.
Within the automobile component industries included in the Other Electronic and Electric & Machinery sectors, the Fund reduced its holding in Bizlink Holding Inc. and Hota Industrial Manufacturing Co., Ltd given Tesla’s unexpected price cuts which could eventually lead to pricing pressure for the supply chain.
The Fund invested in automation industries on the basis of improved market sentiment and as capital expenditure-related automation in Taiwan began to see demand stabilization. Additions were made to companies that seemed well positioned to benefit from these improvements, including Delta Electronics, Inc., Airtac International Group and Hiwin Technologies Corp.
In technology, the Fund added to Novatek Microelectronics Corp., which benefits from the strong demand for Touch Display Driver technology. The Fund also added to MediaTek, Inc., Wistron NeWeb Corp. and Inventec Corp. in anticipation of the upcoming 5G deployment and associated data centre upgrades.
In consumer industries included in Other and Trading & Consumers’ Goods sectors, the Fund initiated new positions in Giant Manufacturing Co., Ltd. as its e-bike sales have grown to profitable levels. The Fund also added to Nien Made Enterprises Co., Ltd. and Poya International Co., Ltd., both for improving outlooks in their respective businesses.
5
The Fund remains overweight in semi-conductor stocks and underweight in financials, telecommunications, materials and consumer stocks. The portfolio positioning reflects its confidence around several key themes including 5G preparation and data center upgrade; China’s policy stimulus; renewed capital expenditure cycle; triple camera displays and true wireless stereo in smartphone components.
Market Outlook
The current market rally is mainly driven by improving market sentiment although any negative developments in trade or macro issues could possibly reverse market expectations and confidence in the near term. The outlook guidance for companies is improving, despite weak earnings results, especially from stocks in the industry automation and technology areas. We believe that the secular trends referred to above will lead to another wave of technology upcycle and relevant capital expenditures for upgrades in manufacturing proces. Production migration due to the ongoing trade dispute issues referred to earlier also seems likely to benefit industry automation businesses. In the non- technology sectors, commodity and consumption stocks seem likely to benefit from an economic recovery in China and improved supply / demand outlook. Despite potential volatility after a strong rally in early 2019, investors are likely to continue repositioning into secular growth sectors ahead of an expected second half recovery.
6
About the Portfolio Manager(unaudited) |
Shumin Huang
Portfolio Manager, JPMAM Emerging Market & Asia Pacific Equities Team
Shumin Huang, Managing Director, is the Portfolio Manager for the Fund. She is an Investment Manager and the Head of Research for Greater China equities within the Emerging Markets and Asia Pacific (“EMAP”) Equities team. Based in Hong Kong, she joined the firm in 2006 after eight years at Goldman Sachs, where she was managing director and head of the Asia-Pacific Energy and Chemicals team. She began her career with UBS Taiwan in 1992 as a research analyst in steel and financials, after which she transferred to Hong Kong as director and head of Asia-Pacific chemicals research. Shumin obtained a B.S. in Business Administration from the National University of Taiwan and an M.B.A. from London Business School.
James Yeh
Chief Investment Officer, JP Morgan Asset Management (Taiwan) Limited
James Yeh is the Chief Investment Officer of JP Morgan Asset Management (Taiwan) Limited and a country specialist for Taiwan equities within the EMAP team. James joined the firm in 2002 from Prudential Asset Management as a fund manager. In 1998, he joined Transcend Investment Trust Limited as an analyst in the research department and subsequently became the manager. He began his career in 1996 with Shinkong Life Limited as an analyst in the securities investment department. James obtained a B.A. in Finance from the National Taiwan University.
Investment Adviser
The Fund’s investment adviser is JF International Management Inc. (“JFIMI”).
JFIMI was incorporated in the British Virgin Islands in 1992 and has had a branch in Hong Kong since July 1992. It is registered as an investment adviser under the U.S. Investment Advisers Act of 1940, as amended and is licensed by the Securities and Futures Commission in Hong Kong to conduct Type 4 (advising on securities) and Type 9 (asset management) regulated activities. JFIMI’s registered address is Palm Grove House, P.O. Box 438, Road Town, Tortola, British Virgin Islands and its principal address in Hong Kong is 19th Floor and 21st Floor, Chater House, 8 Connaught Road Central, Hong Kong. JFIMI belongs to a group
7
of companies operating under the name of J.P. Morgan Asset Management (“JPMAM”), the brand name of the global group of asset management companies belonging to JPMorgan Chase & Co. JPMorgan Chase & Co. is the ultimate parent company of JFIMI. JPMAM has assets under management totalling U.S. $1.987 trillion (as of December 31, 2018).
Participating Affiliate Arrangement
JFIMI engages certain of its foreign affiliated advisers that are not registered as investment advisers with the U.S. Securities and Exchange Commission (“SEC”) to provide advice or research to JFIMI for use with its U.S. clients. Such a participating affiliate arrangements are structured in accordance with a series of SEC no-action letters requiring that participating affiliates remain subject to the regulatory supervision of both JFIMI and the SEC in certain respects. JFIMI has participating affiliate arrangements with JPMorgan Asset Management (Taiwan) Limited.
8
Top Ten Equity Holdings | | Top Ten Equity Holdings |
Holdings as of February 28, 2019 | % | | Holdings as of August 31, 2018 | % |
Taiwan Semiconductor Manufacturing Co., Ltd. | 21.8 | | Taiwan Semiconductor Manufacturing Co., Ltd. | 19.0 |
Largan Precision Co., Ltd. | 4.4 | | Largan Precision Co., Ltd. | 5.4 |
MediaTek, Inc. | 4.4 | | Catcher Technology Co., Ltd. | 4.9 |
Formosa Plastics Corp. | 4.1 | | Pegatron Corp. | 4.6 |
Silergy Corp. | 3.9 | | Chroma ATE, Inc. | 4.3 |
CTBC Financial Holding Co., Ltd. | 3.5 | | Vanguard International Semiconductor Corp. | 3.9 |
Fubon Financial Holding Co., Ltd. | 3.3 | | Formosa Plastics Corp. | 3.7 |
Delta Electronics, Inc. | 3.0 | | Parade Technologies Ltd. | 3.1 |
Nien Made Enterprise Co., Ltd. | 2.9 | | Global Unichip Corp. | 3.0 |
Hiwin Technologies Corp. | 2.8 | | CTBC Financial Holding Co., Ltd. | 3.0 |
Top Ten Industry Weightings | | Top Ten Industry Weightings |
Weightings as of February 28, 2019 | % | | Weightings as of August 31, 2018 | % |
Semiconductor | 38.8 | | Semiconductor | 40.8 |
Financial & Insurance | 10.7 | | Other Electronic | 11.3 |
Electric & Machinery | 7.6 | | Financial & Insurance | 8.8 |
Other | 7.0 | | Plastics | 6.2 |
Plastics | 6.9 | | Computer & Peripheral Equipment | 5.6 |
Other Electronic | 6.8 | | Optoelectronics | 5.4 |
Optoelectronics | 4.4 | | Electric & Machinery | 4.9 |
Electronic Parts & Components | 3.0 | | Biotechnology & Medical Care | 4.2 |
Communications & Internet | 2.2 | | Communications & Internet | 3.4 |
Oil Gas & Electricity Industry General | 2.0 | | Other | 2.5 |
* | Percentages based on net assets. |
9
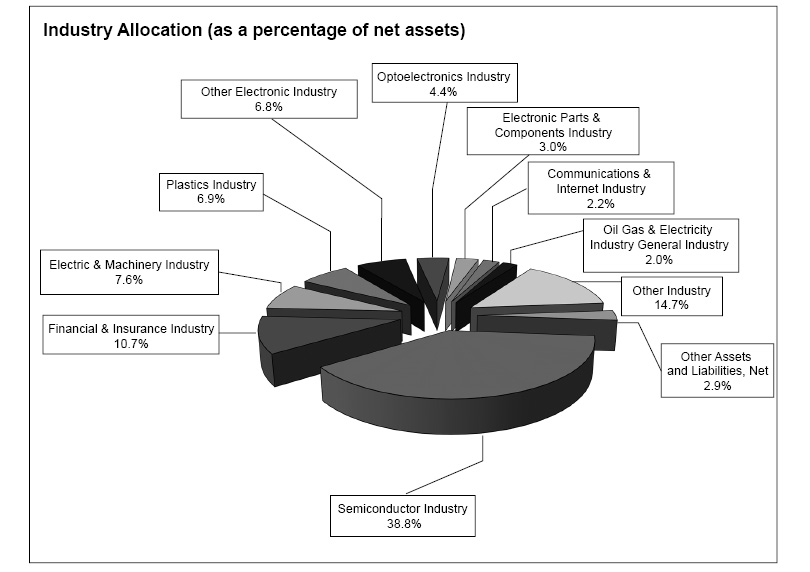
Fund holdings are subject to change and percentages shown above are based on net assets as of February 28, 2019. The pie chart illustrates the allocation of the investments by industry. A complete list of holdings as of February 28, 2019 is contained in the Schedule of Investments included in this report. The most current available data regarding portfolio holdings and industry allocation can be found on our website,www.thetaiwanfund.com. You may also obtain updated holdings by calling 1-877-217-9502.
10
Schedule of Investments/February 28, 2019
(Showing Percentage of Net Assets)(unaudited) |
| | | Shares | | | US $
Value
(Note 2) | |
COMMON STOCKS – 97.1% |
CONSUMER DISCRETIONARY — 8.9% |
Electric & Machinery Industry — 1.8% |
Global PMX Co., Ltd. | | | 349,000 | | | $ | 1,366,448 | |
Hota Industrial Manufacturing Co., Ltd. | | | 352,000 | | | | 1,372,476 | |
| | | | | | | | 2,738,924 | |
Other Industry — 4.3% |
Giant Manufacturing Co., Ltd. | | | 418,000 | | | | 2,302,113 | |
Nien Made Enterprise Co., Ltd. | | | 512,000 | | | | 4,450,149 | |
| | | | | | | | 6,752,262 | |
Textiles Industry — 0.5% |
Makalot Industrial Co., Ltd. | | | 121,000 | | | | 737,170 | |
| | | | | | | | | |
Tourism Industry — 1.6% |
Gourmet Master Co., Ltd. | | | 330,000 | | | | 2,482,251 | |
| | | | | | | | | |
Trading & Consumers' Goods Industry — 0.7% |
Poya International Co., Ltd. | | | 102,000 | | | | 1,043,979 | |
TOTAL CONSUMER DISCRETIONARY | | | | | | | 13,754,586 | |
| | | | | | | | | |
CONSUMER STAPLES — 1.6% |
Biotechnology & Medical Care Industry — 0.7% |
Grape King Bio Ltd. | | | 160,000 | | | | 1,057,950 | |
| | | | | | | | | |
Food Industry — 0.9% |
Uni-President Enterprises Corp. | | | 608,995 | | | | 1,484,075 | |
TOTAL CONSUMER STAPLES | | | | | | | 2,542,025 | |
| | | | | | | | | |
ENERGY — 2.0% |
Oil Gas & Electricity Industry General Industry — 2.0% |
Formosa Petrochemical Corp. | | | 804,000 | | | | 3,043,426 | |
TOTAL ENERGY | | | | | | | 3,043,426 | |
| | | | | | | | | |
FINANCIALS — 13.3% |
Financial & Insurance Industry — 10.7% |
Cathay Financial Holding Co., Ltd. | | | 1,012,600 | | | | 1,490,448 | |
CTBC Financial Holding Co., Ltd. | | | 7,954,000 | | | | 5,388,556 | |
E.Sun Financial Holding Co., Ltd. | | | 4,282,559 | | | | 3,075,221 | |
Fubon Financial Holding Co., Ltd. | | | 3,425,000 | | | | 5,063,523 | |
Mega Financial Holding Co., Ltd. | | | 1,736,000 | | | | 1,537,082 | |
| | | | | | | | 16,554,830 | |
Other Industry — 2.6% |
Chailease Holding Co., Ltd. | | | 1,034,900 | | | | 4,068,783 | |
TOTAL FINANCIALS | | | | | | | 20,623,613 | |
| | | | | | | | | |
HEALTHCARE — 1.1% |
Biotechnology & Medical Care Industry — 1.1% |
Ginko International Co., Ltd. | | | 137,000 | | | $ | 1,014,930 | |
St. Shine Optical Co., Ltd. | | | 40,000 | | | | 751,223 | |
TOTAL HEALTHCARE | | | | | | | 1,766,153 | |
| | | | | | | | | |
INDUSTRIALS — 7.8% |
Electric & Machinery Industry — 4.8% |
Airtac International Group | | | 250,000 | | | | 3,111,140 | |
Hiwin Technologies Corp. | | | 488,476 | | | | 4,396,466 | |
| | | | | | | | 7,507,606 | |
Other Electronic Industry — 3.0% |
Bizlink Holding, Inc. | | | 314,000 | | | | 2,030,316 | |
Voltronic Power Technology Corp. | | | 135,818 | | | | 2,528,673 | |
| | | | | | | | 4,558,989 | |
TOTAL INDUSTRIALS | | | | | | | 12,066,595 | |
| | | | | | | | | |
INFORMATION TECHNOLOGY — 53.5% |
Communications & Internet Industry — 2.2% |
Merry Electronics Co., Ltd. | | | 297,896 | | | | 1,592,251 | |
Wistron NeWeb Corp. | | | 740,440 | | | | 1,891,007 | |
| | | | | | | | 3,483,258 | |
Computer & Peripheral Equipment Industry — 1.3% |
Inventec Corp. | | | 2,540,000 | | | | 1,964,226 | |
| | | | | | | | | |
Electronic Parts & Components Industry — 3.0% |
Delta Electronics, Inc. | | | 934,000 | | | | 4,658,392 | |
| | | | | | | | | |
Optoelectronics Industry — 4.4% |
Largan Precision Co., Ltd. | | | 48,000 | | | | 6,799,993 | |
| | | | | | | | | |
Other Electronic Industry — 3.8% |
Catcher Technology Co., Ltd. | | | 103,000 | | | | 783,130 | |
Chroma ATE, Inc. | | | 597,000 | | | | 2,482,934 | |
Kingpak Technology, Inc. | | | 455,000 | | | | 2,735,041 | |
| | | | | | | | 6,001,105 | |
Semiconductor Industry — 38.8% |
ASPEED Technology, Inc. | | | 40,164 | | | | 914,820 | |
Chipbond Technology Corp. | | | 1,035,000 | | | | 2,269,995 | |
Global Unichip Corp. | | | 110,000 | | | | 755,934 | |
Globalwafers Co., Ltd. | | | 78,000 | | | | 849,024 | |
MediaTek, Inc. | | | 743,000 | | | | 6,759,703 | |
Novatek Microelectronics Corp. | | | 390,000 | | | | 2,166,913 | |
Parade Technologies Ltd. | | | 229,000 | | | | 4,055,205 | |
Silergy Corp. | | | 336,000 | | | | 6,048,251 | |
The accompanying notes are an integral part of the financial statements.
11
Schedule of Investments/February 28, 2019
(Showing Percentage of Net Assets)(unaudited) (concluded) |
| | | Shares | | | US $
Value
(Note 2) | |
INFORMATION TECHNOLOGY —(continued) |
Semiconductor Industry —(continued) |
Taiwan Semiconductor Manufacturing Co., Ltd. | | | 4,368,000 | | | $ | 33,920,426 | |
Vanguard International Semiconductor Corp. | | | 146,000 | | | | 328,751 | |
Win Semiconductors Corp. | | | 378,000 | | | | 2,149,367 | |
| | | | | | | | 60,218,389 | |
TOTAL INFORMATION TECHNOLOGY | | | | | | | 83,125,363 | |
| | | | | | | | | |
MATERIALS — 8.9% |
Cement Industry — 1.0% |
Taiwan Cement Corp. | | | 1,301,100 | | | | 1,623,389 | |
| | | | | | | | | |
Electric & Machinery Industry — 1.0% |
Yeong Guan Energy Technology Group Co., Ltd. | | | 709,000 | | | | 1,529,661 | |
| | | | | | | | | |
Plastics Industry — 6.9% | | | | | | | | |
Formosa Chemicals & Fibre Corp. | | | 1,248,000 | | | | 4,278,069 | |
Formosa Plastics Corp. | | | 1,928,000 | | | | 6,421,133 | |
| | | | | | | | 10,699,202 | |
TOTAL MATERIALS | | | | | | | 13,852,252 | |
| | | | | | | | | |
TOTAL COMMON STOCKS (Cost — $125,612,391) | | | | | | | 150,774,013 | |
| | | | | | | | | |
TOTAL INVESTMENTS — 97.1% (Cost — $125,612,391) | | | | | | | 150,774,013 | |
| | | | | | | | | |
OTHER ASSETS AND LIABILITIES, NET—2.9% | | | | | | | 4,492,913 | |
| | | | | | | | | |
NET ASSETS—100.0% | | | | | | $ | 155,266,926 | |
Legend:
US $– United States dollar
The accompanying notes are an integral part of the financial statements.
12
STATEMENT OF ASSETS AND LIABILITIES
February 28, 2019(unaudited) |
Assets: | | | | | | | | |
Investments in securities, at value (cost $125,612,391) (Notes 2 and 3) | | | | | | $ | 150,774,013 | |
Cash | | | | | | | 811,196 | |
Foreign Cash (cost $3,873,784) | | | | | | | 3,879,240 | |
Prepaid expenses and other assets | | | | | | | 47,831 | |
Total assets | | | | | | | 155,512,280 | |
| | | | | | | | | |
Liabilities: | | | | | | | | |
Payable for Fund shares repurchased | | $ | 44,059 | | | | | |
Accrued management fee (Note 4) | | | 85,993 | | | | | |
Other payables and accrued expenses | | | 115,302 | | | | | |
Total liabilities | | | | | | | 245,354 | |
| | | | | | | | | |
Net Assets | | | | | | $ | 155,266,926 | |
| | | | | | | | | |
Net Assets Consist of: | | | | | | | | |
Paid in capital | | | | | | $ | 165,457,903 | |
Total distributable earnings (loss) | | | | | | $ | (10,190,977 | ) |
| | | | | | | | | |
Net Assets | | | | | | $ | 155,266,926 | |
| | | | | | | | | |
Net Asset Value, per share($155,266,926/7,929,798 shares outstanding) | | | | | | $ | 19.58 | |
STATEMENT OF OPERATIONS
For the Six Months Ended February 28, 2019(unaudited) |
Investment Income: | | | | | | | | |
Dividends | | | | | | $ | 289,130 | |
Less: Taiwan stock dividend tax (Note 2) | | | | | | | (1,065 | ) |
Taiwan withholding tax (Note 2) | | | | | | | (60,451 | ) |
Total investment income | | | | | | | 227,614 | |
| | | | | | | | | |
Expenses: | | | | | | | | |
Management fees (Note 4) | | $ | 585,185 | | | | | |
Directors' and officers' fees and expenses | | | 195,888 | | | | | |
Custodian fees | | | 113,117 | | | | | |
Legal fees | | | 104,996 | | | | | |
Administration and accounting fees | | | 88,424 | | | | | |
Stockholder communications | | | 41,188 | | | | | |
Audit fees | | | 38,920 | | | | | |
Delaware franchise tax | | | 34,157 | | | | | |
Insurance fees | | | 32,775 | | | | | |
Compliance services fees | | | 31,395 | | | | | |
Principal financial officer fees | | | 29,753 | | | | | |
Transfer agent fees | | | 10,611 | | | | | |
Miscellaneous | | | 28,202 | | | | | |
Total expenses | | | | | | | 1,334,611 | |
| | | | | | | | | |
Net Investment Income (loss) | | | | | | | (1,106,997 | ) |
| | | | | | | | | |
Realized and Unrealized Gain (Loss) on: | | | | | | | | |
Net realized loss on: | | | | | | | | |
Investments | | | (15,860,126 | ) | | | | |
Foreign currency transactions | | | (95,000 | ) | | | | |
| | | | | | | | (15,955,126 | ) |
Net change in unrealized appreciation on: | | | | | | | | |
Investments | | | 2,095,181 | | | | | |
Foreign currency translations | | | 259 | | | | | |
| | | | | | | | 2,095,440 | |
Net realized and unrealized loss | | | | | | | (13,859,686 | ) |
Net Decrease in Net AssetsResulting From Operations | | | | | | $ | (14,966,683 | ) |
13
The accompanying notes are an integral part of the financial statements.
Financial Statements(continued)
|
STATEMENTS OF CHANGES IN NET ASSETS
| | | Six Months Ended
February 28, 2019 | | | Year Ended
August 31, 2018 | |
| | | (Unaudited) | | | | | |
Increase/(Decrease) in Net Assets | | | | | | | | |
Operations: | | | | | | | | |
Net investment income (loss) | | $ | (1,106,997 | ) | | $ | 1,818,323 | |
Net realized gain (loss) on investments and foreign currency transactions | | | (15,955,126 | ) | | | 26,089,781 | |
Net change in unrealized appreciation (depreciation) on investments and foreign currency translations | | | 2,095,440 | | | | (31,367,309 | ) |
Net decrease in net assets resulting from operations | | | (14,966,683 | ) | | | (3,459,205 | ) |
Distributions to stockholders from: | | | | | | | | |
Distributable Income | | | (13,717,272 | ) | | | (5,394,421 | ) |
Total distributions to stockholders | | | (13,717,272 | ) | | | (5,394,421 | ) |
Capital stock transactions (Note 6): | | | | | | | | |
Reinvestment of distributions from net investment income and net realized gains | | | 26,740 | | | | 9,776 | |
Cost of shares repurchased (Note 5) | | | (3,023,768 | ) | | | (1,778,819 | ) |
Total capital stock transactions | | | (2,997,028 | ) | | | (1,769,043 | ) |
Decrease in net assets | | | (31,680,983 | ) | | | (10,622,669 | ) |
| | | | | | | | | |
Net Assets | | | | | | | | |
Beginning of period | | | 186,947,909 | | | | 197,570,578 | |
End of period | | $ | 155,266,926 | | | $ | 186,947,909 | |
Distributions from net investment income and net realized capital gains are combined for the period ended February 28, 2019. Funds are no longer required to disclose the undistributed net investment income (loss) included in net assets at year end. See Note 8 in the Notes to Financial Statements for more information. The dividends and distributions to stockholders for the year ended August 31, 2018 have been reclassified to conform to the current year presentation.
The accompanying notes are an integral part of the financial statements.
14
Financial Statements(continued)
|
FINANCIAL HIGHLIGHTS
Selected data for a share of common stock outstanding for the periods indicated
| | | Six Months
Ended | | | Year Ended August 31, | |
| | | February 28,
2019 | | | 2018 | | | 2017 | | | 2016 | | | 2015 | | | 2014† | |
| | | (Unaudited) | | | | | | | | | | | | | | | | | | | | | |
Selected Per Share Data | | | | | | | | | | | | | | | | | | | | | | | | |
Net asset value, beginning of period | | $ | 23.05 | | | $ | 24.11 | | | $ | 19.80 | | | $ | 16.74 | | | $ | 22.45 | | | $ | 19.30 | |
Income from Investment Operations: | | | | | | | | | | | | | | | | | | | | | | | | |
Net investment income (loss)(a) | | | (0.14 | ) | | | 0.22 | | | | 0.20 | | | | 0.12 | (e) | | | 0.07 | | | | 0.08 | |
Net realized and unrealized gain (loss) on investments and foreign currency transactions | | | (1.67 | ) | | | (0.65 | ) | | | 4.10 | | | | 2.94 | | | | (3.15 | ) | | | 3.07 | |
Total from investment operations | | | (1.81 | ) | | | (0.43 | ) | | | 4.30 | | | | 3.06 | | | | (3.08 | ) | | | 3.15 | |
Less Distributions to Stockholders from: | | | | | | | | | | | | | | | | | | | | | | | | |
Net investment income | | | — | | | | (0.66 | ) | | | — | | | | — | | | | — | | | | — | |
Net realized gains | | | (1.71 | ) | | | — | | | | — | | | | — | | | | (2.63 | ) | | | — | |
Total distributions to stockholders | | | (1.71 | ) | | | (0.66 | ) | | | — | | | | — | | | | (2.63 | ) | | | — | |
Capital Share Transactions: | | | | | | | | | | | | | | | | | | | | | | | | |
Accretion (dilution) to net asset value, resulting from share repurchase program, tender offer or issuance of shares in stock dividend | | | 0.05 | | | | 0.03 | | | | 0.01 | | | | — | | | | 0.00 | (d) | | | — | |
| | | | | | | | | | | | | | | | | | | | | | | | | |
Net asset value, end of period | | $ | 19.58 | | | $ | 23.05 | | | $ | 24.11 | | | $ | 19.80 | | | $ | 16.74 | | | $ | 22.45 | |
| | | | | | | | | | | | | | | | | | | | | | | | | |
Market value, end of period | | $ | 16.84 | | | $ | 19.85 | | | $ | 21.37 | | | $ | 16.96 | | | $ | 14.72 | | | $ | 20.24 | |
| | | | | | | | | | | | | | | | | | | | | | | | | |
Total Return | | | | | | | | | | | | | | | | | | | | | | | | |
Per share net asset value(b) | | | (5.41 | )% | | | (1.46 | )% | | | 21.77 | % | | | 18.34 | % | | | (13.02 | )% | | | 16.32 | % |
Per share market value(b) | | | (5.53 | )% | | | (4.26 | )% | | | 26.00 | % | | | 15.22 | % | | | (15.16 | )% | | | 16.79 | % |
Ratio and Supplemental Data: | | | | | | | | | | | | | | | | | | | | | | | | |
Net Assets, end of period (000s) | | $ | 155,267 | | | $ | 186,948 | | | $ | 197,571 | | | $ | 162,881 | | | $ | 137,642 | | | $ | 184,534 | |
Ratio of expenses | | | 1.71 | %(c) | | | 1.71 | %(f) | | | 1.78 | %(f) | | | 2.05 | %(f) | | | 1.86 | %(f) | | | 1.80 | %(f) |
Ratio of net investment income (loss) | | | (1.42 | )%(c) | | | 0.94 | % | | | 0.99 | % | | | 0.72 | %(e) | | | 0.37 | % | | | 0.40 | % |
Portfolio turnover rate | | | 35 | % | | | 112 | % | | | 89 | % | | | 105 | % | | | 92 | % | | | 181 | % |
(a) | Based on average shares outstanding during the period. |
(b) | Total investment return at net asset value (“NAV”) is based on changes in the NAV of Fund shares and assumes reinvestment of dividends and distributions, if any. Total investment return at market value is based on changes in the market price at which the Fund’s shares traded on the stock exchange during the period and assumes reinvestment of dividends and distributions, if any, at actual prices pursuant to the Fund’s dividend reinvestment program. Because the Fund’s shares trade in the stock market based on investor demand, the Fund may trade at a price higher or lower than its NAV. Therefore, returns are calculated based on share price and NAV. |
(d) | Amount represents less than $0.005 per share. |
(e) | Amount includes a non-recurring reimbursement for over-billing of prior years’ custody out of pocket expense which amounted to $0.012 per share and 0.07% of average net assets. |
(f) | Expense ratio includes 21% tax paid on stock dividends received by the Fund (20% for the period prior to January 1, 2018). For the years ended August 31, 2018, 2017, 2016, 2015 and 2014, the Fund’s ratio of expenses excluding taxes paid on stock dividends was 1.70%, 1.77%, 1.99%, 1.80% and 1.76%, respectively. |
† | As of February 22, 2014, Allianz Global Investors U.S. LLC (“AllianzGI”) succeeded Martin Currie Inc. as the Fund’s investment adviser. As of July 22, 2014, JFIMI succeeded Allianz Global Investors U.S. LLC as the Fund’s investment adviser. |
15
The accompanying notes are an integral part of the financial statements.
Notes To Financial Statements(unaudited)
February 28, 2019 |
1. Organization
The Taiwan Fund, Inc. (the “Fund”), a Delaware corporation, is registered under the Investment Company Act of 1940, as amended (the “1940 Act”), as a diversified closed-end management investment fund.
The Fund is an investment company and accordingly follows the investment company accounting and reporting guidance of the Financial Accounting Standards Board Accounting Standard Codification Topic 946 “Financial Services - Investment Companies.”
The Fund concentrates its investments in the securities listed on the Taiwan Stock Exchange. Because of this concentration, the Fund may be subject to certain additional risks not typically associated with investing in securities of U.S. companies or the U.S. government, including (1) volatility of the Taiwan securities market, (2) restrictions on repatriation of capital invested in Taiwan, (3) fluctuations in the rate of exchange between the New Taiwan Dollar and the U.S. Dollar, and (4) political and economic risks. In addition, Republic of China accounting, auditing, financial and other reporting standards are not equivalent to U.S. standards and, therefore, certain material disclosures may not be made, and less information may be available to investors investing in Taiwan than in the United States. There is also generally less regulation by governmental agencies and self-regulatory organizations with respect to the securities industry in Taiwan than there is in the United States.
2. Significant Accounting Policies
The financial statements are prepared in accordance with U.S. generally accepted accounting principles (“GAAP”), which require management to make estimates and assumptions that affect the reported amounts of assets and liabilities. Actual results could differ from those estimates. Management has evaluated the impact of all events or transactions occurring after period end through the date these financial statements were issued, and has determined that there were no subsequent events requiring recognition or disclosure. The following summarizes the significant accounting policies of the Fund:
Security Valuation. All securities, including those traded over-the-counter, for which market quotations are readily available are valued at the last sales price prior to the time of determination of the Fund’s net asset value per share or, if there were no sales on such date, at the closing price quoted for such securities (but if bid and asked quotations are available, at the mean between the last current bid and asked prices, rather than such quoted closing price). These securities are generally categorized as Level 1 securities in the fair value hierarchy. In certain instances where the price determined above may not represent fair market value, the value is determined in such manner as the Board of Directors (the “Board”) may prescribe. Foreign securities may be valued at fair value according to procedures approved by the Board if the closing price is not reflective of current market values due to trading or events occurring in the valuation time of the Fund. In addition, substantial changes in values in the U.S. markets subsequent to the close of a foreign market may also affect the values of securities traded in the foreign market. These securities may be categorized as Level 2 or Level 3 securities in the fair value hierarchy, depending on the valuation inputs. Short-term investments, having a maturity of 60 days or less are valued at amortized cost, which approximates market value, with accrued interest or discount earned included in interest receivable.
16
Notes To Financial Statements (unaudited) (continued)
February 28, 2019 |
2. Significant Accounting Policies – continued
The Fund has adopted fair valuation accounting standards which establish a definition of fair value and set out a hierarchy for measuring fair value. These standards require additional disclosures about the various inputs and valuation techniques used to develop the measurements of fair value and a discussion in changes in valuation techniques and related inputs during the period. These inputs are summarized in the three broad levels listed below:
● | Level 1 – quoted unadjusted prices for identical instruments in active markets to which the Fund has access at the date of measurement. |
● | Level 2 – quoted prices for similar instruments in active markets; quoted prices for identical or similar instruments in markets that are not active; and model derived valuations in which all significant inputs and significant value drivers are observable in active markets. Level 2 inputs are those in markets for which there are few transactions, the prices are not current, little public information exists or instances where prices vary substantially over time or among brokered market makers. |
● | Level 3 – model derived valuations in which one or more significant inputs or significant value drivers are unobservable. Unobservable inputs are those inputs that reflect the Fund’s own assumptions that market participants would use to price the asset or liability based on the best available information. |
Investments
in Securities | | Level 1 | | | Level 2 | | | Level 3 | | | Total | |
Common Stocks^ | | $ | 150,774,013 | | | $ | — | | | $ | — | | | $ | 150,774,013 | |
Total | | $ | 150,774,013 | | | $ | — | | | $ | — | | | $ | 150,774,013 | |
^ | See schedule of investments for industry breakout. |
The inputs or methodology used for valuing securities are not necessarily an indication of the risk associated with investing in those securities.
Repurchase Agreements. In connection with transactions in repurchase agreements, it is the Fund’s policy that its custodian take possession of the underlying collateral securities, the fair value of which exceeds the principal amount of the repurchase transaction, including accrued interest, at all times. If the seller defaults, and the fair value of the collateral declines, realization of the collateral by the Fund may be delayed or limited. As of February 28, 2019, the Fund was not participating in any repurchase agreements.
Foreign Currency Translation. The financial accounting records of the Fund are maintained in U.S. Dollars. Investment securities, other assets and liabilities denominated in a foreign currency are translated into U.S. Dollars at the current exchange rate. Purchases and sales of securities, income receipts and expense payments are translated into U.S. Dollars at the exchange rate on the dates of the transactions.
Reported net realized gains and losses on foreign currency transactions represent net gains and losses from disposition of foreign currencies, currency gains and losses realized between the trade dates and settlement dates of security transactions, and the difference between the amount of net investment income accrued and the U.S. Dollar amount actually received. The effects of changes in foreign currency exchange rates on investments in securities are not segregated in the Statement of Operations from the effects of changes in market prices of those securities, but are included in realized and unrealized gain or loss on investments.
17
Notes To Financial Statements (unaudited) (continued)
February 28, 2019 |
2. Significant Accounting Policies – continued
Forward Foreign Currency Transactions. A forward foreign currency contract (“Forward”) is an agreement between two parties to buy or sell currency at a set price on a future date. The Fund may enter into Forwards in order to hedge foreign currency risk or for other risk management purposes. Realized gains or losses on Forwards include net gains or losses on contracts that have matured or which the Fund has terminated by entering into an offsetting closing transaction. Unrealized appreciation or depreciation on Forwards, if any, is included in the Statement of Assets and Liabilities. The portfolio could be exposed to risk of loss if the counterparty is unable to meet the terms of the contract or if the value of the currency changes unfavorably. As of February 28, 2019 the Fund had no open Forwards.
Indemnification Obligations. Under the Fund’s organizational documents, its officers and directors are indemnified against certain liabilities arising out of the performance of their duties to the Fund. In addition, in the normal course of business the Fund enters into contracts that provide general indemnifications to other parties. The Fund’s maximum exposure under these arrangements is unknown as this would involve future claims that may be made against the Fund that have not yet occurred.
Taxes. As a qualified Regulated Investment Company under Subchapter M of the Internal Revenue Code, the Fund is not subject to income taxes to the extent that it distributes all of its investment company taxable income and net realized capital gains for its fiscal year. In addition to federal income tax for which the Fund is liable on undistributed amounts, the Fund is subject to federal excise tax on undistributed investment company taxable income and net realized capital gains. The Fund is organized in Delaware and as such is required to pay Delaware an annual franchise tax. Also, the Fund is currently subject to a Taiwan security transaction tax of 0.3% on sales of equities and 0.1% on sales of mutual fund shares based on the transaction amount. Security transaction tax is embedded in the cost basis of each security and contributes to the realized gain or loss for the Fund. Security transaction taxes are not accrued until the tax becomes payable.
The Fund’s functional currency for tax reporting purposes is the New Taiwan Dollar.
The Fund recognizes the tax benefits of uncertain tax positions only where the position is “more likely than not” to be sustained assuming examination by tax authorities. Management has analyzed the Fund’s tax positions, and has concluded that no liability for unrecognized tax benefits should be recorded related to uncertain tax positions taken on returns filed for prior three fiscal years. The Fund identifies its major tax jurisdictions as U.S. Federal, Delaware and Taiwan where the Fund is not aware of any tax positions for which it is reasonably possible that the total amounts of unrecognized tax benefits will change materially in the next twelve months.
Investment Income. Dividend income is recorded on the ex-dividend date; except, where the ex-dividend date may have passed, certain dividends from foreign securities are recorded as soon as the Fund is informed of the ex-dividend date.
Taiwanese companies typically declare dividends in the Fund’s third fiscal quarter of each year. As a result, the Fund receives substantially less dividend income in the first half of its year. Interest income, which includes accretion of original discount, is accrued as earned.
Dividend and interest income generated in Taiwan is subject to a 21% withholding tax. Stock dividends received (except those which have resulted from capitalization of capital surplus) are taxable at 21% of the par value of the stock dividends received.
18
Notes To Financial Statements (unaudited) (continued)
February 28, 2019 |
2. Significant Accounting Policies – continued
Distributions to Stockholders. The Fund distributes to stockholders at least annually, substantially all of its taxable ordinary income and expects to distribute its taxable net realized gains. Certain foreign currency gains (losses) are taxable as ordinary income and, therefore, increase (decrease) taxable ordinary income available for distribution. Pursuant to the Dividend Reinvestment and Cash Purchase Plan (the “Plan”), stockholders may elect to have all cash distributions automatically reinvested in Fund shares. (See the summary of the Plan described later.) Unless the Board elects to make a distribution in shares of the Fund’s common stock, stockholders who do not participate in the Plan will receive all distributions in cash paid by check in U.S. dollars. Income and capital gain distributions are determined in accordance with income tax regulations, which may differ from GAAP. No capital gain distributions are permitted to be made until any capital loss carryforwards have been fully utilized or expired.
Tax components of distributable earnings are determined in accordance with income tax regulations which may differ from the composition of net assets reported under GAAP. Book and tax basis differences, if any, are primarily due to differing treatments for foreign currency transactions, net operating loss and post October capital and late year ordinary loss deferrals.
Permanent book and tax basis differences relating to stockholder distributions will result in reclassifications between components of net assets. Accordingly, for the year ended August 31, 2018, the effects of certain differences were reclassified. The Fund decreased undistributed net investment income by $18,058,119, decreased accumulated net realized gain by $8,136,266, and increased paid in capital by $26,194,385.
Security Transactions. Security transactions are accounted as of the trade date. Gains and losses on securities sold are determined on the basis of identified cost.
3. Purchases and Sales of Securities
For the six months ended February 28, 2019, purchases and sales of securities, other than short-term securities, aggregated $54,185,416 and $71,469,676, respectively.
4. Management Fees and Other Service Providers
Management Fee. The Fund entered into an Investment Management Agreement (the “Agreement”) with JFIMI. Under the terms of the Agreement, JFIMI receives a fee for its services, computed daily and payable monthly in U.S. dollars, at the annual rate of 0.75% per annum of the value of the Fund’s average daily net assets for all assets. Prior to September 1, 2018, JFIMI received a fee for its services at the annual rate of 0.90% per annum of the value of the Fund’s average daily net assets up to and including $150 million of net assets; 0.80% per annum of the value of the Fund’s average daily net assets on the next $150 million of net assets; and 0.70% per annum of the value of the Fund’s average daily net assets in excess thereof.
For the period September 1, 2018 through February 28, 2019, the management fee was equivalent to an annual rate of 0.75% of weighted average net assets.
Administration Fees. State Street Bank and Trust Company (“State Street”) provides, or arranges for the provision of certain administrative and accounting services for the Fund, including maintaining the books and records of the Fund, and preparing certain reports and other documents required by federal and/or state laws and regulations. The Fund pays State Street a fee at the annual rate of 0.11% of the Fund’s average daily net assets up to $150 million, 0.08% of the next $150 million, and 0.05% of those assets in excess of $300 million, subject to certain minimum requirements. The Fund also pays State Street $130,000 per year for certain legal administrative services, including corporate secretarial services and preparing regulatory filings. State Street also serves as custodian (the “Custodian”) to the Fund. For this service, the Fund pays State Street asset-based fees that vary according to the number of positions and transactions plus out of pocket fees.
19
Notes To Financial Statements (unaudited) (continued)
February 28, 2019 |
4. Management Fees and Other Service Providers– continued
Director’s and Officers Fees and Expenses.The Fund pays each of its directors who is not an “interested person” of the Fund, as the term is defined in the 1940 Act, an annual fee of $20,000 ($30,000 for the Chairman) plus a fee of $2,500 for each Board meeting or Committee meeting attended in person or by telephone. Effective March 1, 2019, the fee paid to Directors for attendance at Board and Committee meetings was reduced to $2,000. In addition, the Fund will reimburse each of the directors for travel and out-of-pocket expenses incurred in connection with Board meetings.
Other Service Providers. Pursuant to a Compliance Services Agreement, Foreside Fund Officer Services, LLC (‘‘FFOS’’) provides the Fund with a Chief Compliance Officer. FFOS is paid customary fees for its services. Foreside Management Services, LLC (“FMS”) provides the Fund with a Treasurer. Neither FFOS, FMS, nor their employees that serve as officers of the Fund, have a role in determining the investment policies or which securities are purchased or sold by the Fund.
General.Certain officers of the Fund may also be employees of the aforementioned companies that provide services to the Fund, and during their terms of office, receive no compensation from the Fund.
5. Discount Management Policy
The Board has approved a Program which authorizes management to make open market purchases in an aggregate amount up to 10% of the Fund’s outstanding shares. Under the Program, shares may be repurchased at differing trigger levels that will not be announced. Any repurchases will be disclosed in the Fund’s stockholder reports for the relevant fiscal periods and updated in the Fund’s monthly reports when repurchases are made. Any repurchases made under the Program will be announced on Monday of each week for repurchases made during the prior week.
For the period ended February 28, 2019, the Fund repurchased 184,148 of its shares at an average price of $16.46 per share (including brokerage commissions) at an average discount of 13.10%. These repurchases had a total cost of $3,023,768.
The Board will continue to review the Program and its effectiveness, and, as appropriate, may make further enhancements as it believes are necessary.
6. Fund Shares
At February 28, 2019, there were 100,000,000 shares of $0.01 par value capital stock authorized, of which 7,929,798 were issued and outstanding.
For the period ended February 28, 2019, the Fund repurchased 184,148 shares of its common stock, valued at $3,023,768, including commission and trading fees of $12,890, from stockholders under the Program.
| | | For the
Period Ended
February 28, 2019 | | | For the
Year Ended
August 31, 2018 | |
Shares outstanding at beginning of year | | | 8,112,169 | | | | 8,194,938 | |
Shares issued from reinvestment of distributions | | | 1,777 | | | | 454 | |
Shares repurchased | | | (184,148 | ) | | | (83,223 | ) |
Shares outstanding at end of year | | | 7,929,798 | | | | 8,112,169 | |
20
Notes To Financial Statements (unaudited) (concluded)
February 28, 2019 |
7. Federal Tax Information
The tax character of distributions paid by the Fund during the period ended August 31, 2018 is as follows:
| | | Year Ended
August 31, 2018 | |
Capital Gains | | $ | — | |
Ordinary Income | | $ | 5,394,421 | |
Total | | $ | 5,394,421 | |
There were no distributions paid during the fiscal year ended August 31, 2017.
As of August 31, 2018, the tax components of accumulated net earnings (losses) were $13,716,845 of Undistributed Capital Gains, $21,742,731 of Unrealized Appreciation and $(16,966,598) of post October capital and late-year ordinary losses. For the year ended August 31, 2018, the amount of capital loss carryover utilized was $3,906,963.
The difference between book basis and tax basis unrealized appreciation and depreciation is attributable primarily to the tax deferral of losses on wash sales and passive foreign investment company adjustments. At February 28, 2019, the aggregate cost basis of the Fund’s investment securities for income tax purposes was $125,612,391. Net unrealized appreciation of the Fund’s investment securities was $25,161,622 of which $27,112,069 was related to appreciated investment securities and $1,950,447 was related to depreciated investment securities.
8. Recent Accounting Pronouncements
As of November 5, 2018, pursuant to the Securities and Exchange Commission (“SEC”) Release #33-10532 “Disclosure Update and Simplification,” funds are no longer required to disclose whether distributions from earnings are either from net investment income or net realized capital gains. Funds are also not required to disclose the undistributed net income (loss) included in net assets at year end. The presentation for the year ended August 31, 2018 has been adjusted for this change in the Statement of Changes in Net Assets. At August 31, 2018, the distributions to stockholders from net investment income were $5,394,421 and the undistributed net investment loss included in net assets - end of period was $17,622,560.
9. Subsequent Event
On April 24, 2019 the Fund’s stockholders approved Allianz Global Investors U.S. LLC (“Allianz”) as the Fund’s new investment adviser. It is expected that Allianz will commence managing the Fund’s portfolio on or about June 1, 2019. Allianz is a U.S.-based firm registered as an investment adviser with the Securities and Exchange Commission. Allianz is part of the Allianz Global Investors group of entities, which are wholly-owned subsidiaries of Allianz SE, one of the world’s largest financial services providers and a publicly-traded company. Allianz SE’s principal offices are located at Königinstrasse 28, 80802 Munich, Germany. As of December 31, 2018, the total assets under management of the Allianz Global Investors group of entities amounted to $577.4 billion, including $5.516 billion invested in Taiwan mandates. Allianz’s principal offices are located at 1633 Broadway, New York, NY 10019.
21
Other Information(unaudited)
|
Federal Tax Information. The Fund has made an election under Internal Revenue Code Section 853 to pass through foreign taxes paid by the Fund to its stockholders. For the year ended August 31, 2018, the total amount of foreign taxes paid that was passed through to its stockholders for information reporting purposes was $ 1,286,825 (representing taxes withheld plus taxes on stock dividends).
Privacy Policy
Privacy Notice The Taiwan Fund, Inc. collects non-public personal information about its stockholders from the following sources: ☐ Information it receives from stockholders on applications or other forms; ☐ Information about stockholder transactions with the Fund, its affiliates, or others; and ☐ Information it receives from a consumer reporting agency. The Fund’s policy is to not disclose nonpublic personal information about its stockholders to nonaffiliated third parties (other than disclosures permitted by law). The Fund restricts access to nonpublic personal information about its stockholders to those agents of the Fund who need to know that information to provide products or services to stockholders. The Fund maintains physical, electronic, and procedural safeguards that comply with federal standards to guard it stockholders’ nonpublic personal information. |
Proxy Voting Policies and Procedures
A description of the policies and procedures that are used by the Fund’s investment adviser to vote proxies relating to the Fund’s portfolio securities is available (1) without charge, upon request, by calling 1-877-217-9502; and (2) as an exhibit to the Fund’s annual report on Form N-CSR which is available on the website of the Securities and Exchange Commission (the “Commission”) athttp://www.sec.gov. Information regarding how the investment adviser voted these proxies during the most recent 12-month period ended June 30 is available without charge, upon request, by calling the same number or by accessing the Commission’s website.
Quarterly Portfolio of Investments
The Fund files with the Commission its complete schedule of portfolio holdings on Form N-Q for the first and third quarters of each fiscal year. The Fund’s Form N-Q’s are available on the Commission’s website athttp://www.sec.gov. Additionally, the Portfolio of Investments may be reviewed and copied at the Commission’s Public Reference Room in Washington, D.C. Information on the operation of the Public Reference Room may be obtained by calling 1-800-SEC-0330. The most recent Form N-Q is available without charge, upon request, by calling 1-877-217-9502.
22
Other Information(unaudited) (continued)
|
Certifications
The Fund’s chief executive officer has certified to the New York Stock Exchange that, as of May 2, 2018, he was not aware of any violation by the Fund of applicable New York Stock Exchange corporate governance listing standards. Also, in accordance with Section 303A.12 of the New York Stock Exchange Listed Company Manual, the Fund submitted an Interim Written Affirmation on April 29, 2018. The Fund also has included the certifications of the Fund’s chief executive officer and chief financial officer required by Section 302 and Section 906 of the Sarbanes-Oxley Act of 2002 in the Fund’s Form N-CSR filed with the Commission, for the period of this report.
23
Summary of Dividend Reinvestment and
Cash Purchase Plan |
What is the Dividend Reinvestment and Cash Purchase Plan?
The Dividend Reinvestment and Cash Purchase Plan (the “Plan”) offers stockholders of the Fund, a prompt and simple way to reinvest their dividends and capital gains distributions in shares of the Fund. The Fund will distribute to stockholders, at least annually, substantially all of its net income and expects to distribute annually its net realized capital gains. Computershare Trust Company, N.A. (the “Plan Administrator”), acts as Plan Administrator for stockholders in administering the Plan. The Plan also allows you to make optional cash investments in Fund shares through the Plan Administrator.
Who Can Participate in the Plan?
If you own shares in your own name, you can elect to participate directly in the Plan. If you own shares that are held in the name of a brokerage firm, bank, or other nominee, you should contact your nominee to arrange for them to participate on your behalf.
What Does the Plan Offer?
The Plan has two components; reinvestment of dividends and capital gains distributions, and a voluntary cash purchase feature.
Reinvestment of dividends and capital gains distributions
If you choose to participate in the Plan, your dividends and capital gains distributions will be promptly invested for you, automatically increasing your holdings in the Fund. If the Fund declares a dividend or capital gains distribution payable in cash, you will automatically receive shares purchased by the Plan Administrator on the open market. You will be charged a per share fee (currently $0.05) incurred with respect to the Plan Administrator’s open market purchases.
If a distribution is declared which is payable in shares or cash at the option of the stockholder and if on the valuation date (generally the payable date) the market price of shares is equal to or exceeds their net asset value, the Fund will issue new shares to you at the greater of the following: (a) net asset value per share or (b) 95% of the market price per share. If the market price per share on the valuation date is less than the net asset value per share, the Fund will issue new shares to you at the market price per share on the valuation date.
All reinvestments are in full and fractional shares, carried to three decimal places. In the case of foreign (non-U.S.) stockholders, reinvestment will be made net of applicable withholding tax.
The Plan will not operate if a distribution is declared in shares only, subject to an election by the stockholders to receive cash.
24
Summary of Dividend Reinvestment and
Cash Purchase Plan(continued) |
Voluntary cash purchase option
Plan participants have the option of making investments in Fund shares through the Plan Administrator. You may invest any amount from $100 to $3,000 semi-annually. The Plan Administrator will purchase shares for you on the New York Stock Exchange or otherwise on the open market on or about February 15 and August 15. If you hold shares in your own name, you should deal directly with the Plan Administrator. Checks in U.S. dollars and drawn in U.S. banks should be made payable to “Computershare”. The Plan Administrator will not accept cash, traveler’s checks, money orders, or third party checks. We suggest you send your check, along with a completed transaction form which is attached to each statement you receive, to the following address to be received at least two business days before the investment date:
Computershare, c/o The Taiwan Fund, Inc. at P.O. Box 43078, Providence, RI 02940-3078. The Plan Administrator will return any cash payments received more than thirty days prior to February 15 or August 15, and you will not receive interest on uninvested cash payments. If you own shares that are held in the name of a brokerage firm, bank, or other nominee, you should contact your nominee to arrange for them to participate in the cash purchase option on your behalf.
If your check is returned unpaid for any reason, the Plan Administrator will consider the request for investment of such funds null and void, and shall immediately remove these shares from your account. The Plan Administrator shall be entitled to sell shares to satisfy any uncollected amount plus any applicable fees. If the net proceeds of the sale are insufficient to satisfy the balance of any uncollected amounts, the Plan Administrator shall be entitled to sell such additional shares from your account as may be necessary to satisfy the uncollected balance.
Is There a Cost to Participate?
For purchases from the reinvestment of dividends and capital gains distributions, you will pay a pro rata portion of brokerage commissions payable with respect to purchases of shares by the Plan Administrator on the open market. You will also be charged a per share fee (currently $0.05) incurred with respect to the Plan Administrator’s open market purchases in connection with the reinvestment of dividends and capital gains distributions. Brokerage charges for purchasing shares through the Plan are expected to be less than the usual brokerage charges for individual transactions, because the Plan Administrator will purchase stock for all participants in blocks, resulting in lower commissions for each individual participant. The Plan Administrator’s transaction fees for handling capital gains distributions or income dividends will be paid by the Fund.
For purchases from voluntary cash payments, participants are charged a service fee (currently $0.75 per investment) and a per fee (currently $0.05) for each voluntary cash investment. Per share fees include any brokerage commissions the Plan Administrator is required to pay.
Brokerage commissions and service fees, if any, will be deducted from amounts to be invested.
25
Summary of Dividend Reinvestment and
Cash Purchase Plan(continued) |
What Are the Tax Implications for Participants?
You may withdraw from the Plan without penalty at any time by calling the Plan Administrator at 1-800-426-5523, by accessing your Plan account at the Plan Administrator’s web site,www.computershare.com/investor or by written notice to the Plan Administrator.
You will receive tax information annually for your personal records and to help you prepare your federal income tax return. The automatic reinvestment of dividends and capital gains distributions does not relieve you of any income tax which may be payable on dividends or distributions. For further information as to the tax consequences of participating in the Plan, you should consult with your tax advisors.
If the Fund issues shares upon reinvestment of a dividend or capital gains distribution, for U.S. federal income tax purposes, the amount reportable in respect of the reinvested amount of the dividend or distribution will be the fair market value of the shares received as of the payment date, which will be reportable as ordinary dividend income and/or long term capital gains. The shares will have a tax basis equal to such fair market value, and the holding period for the shares will begin on the day after the payment date. State, local and foreign taxes may also be applicable.
Once Enrolled in the Plan, May I Withdraw From It?
If you withdraw, you will receive, without charge, stock certificates issued in your name for all full shares, and a check for any fractional share (valued at the market value of the shares at the time of withdrawal or termination) less any applicable fees. You may also request that the Plan Administrator sell your shares and send you the proceeds, less a transaction fee of $2.50 and a per share fee of $0.15 for any request for withdrawal or termination. The per share fee includes any brokerage commissions the Plan Administrator is required to pay. Alternatively, you may also request that the Plan Administrator move your whole shares to the Direct Management System, which would allow you to maintain ownership of those whole shares in book entry form on the records of the Fund.
All sale requests having an anticipated market value of $100,000.00 or more are expected to be submitted in written form. In addition, all sale requests within thirty (30) days of an address change are expected to be submitted in written form.
26
Summary of Dividend Reinvestment and
Cash Purchase Plan(concluded) |
Whom Should I Contact for Additional Information?
If you hold shares in your own name, please address all notices, correspondence, questions, or other communications regarding the Plan to: Computershare, c/o The Taiwan Fund, Inc. at P.O. Box 43078, Providence, RI 02940-3078, by telephone at 1-800-426-5523 or through the Internet atwww.computershare.com/investor. If your shares are not held in your name, you should contact your brokerage firm, bank, or other nominee for more information and to arrange for them to participate in the Plan on your behalf.
Either the Fund or the Plan Administrator may amend or terminate the Plan. Except in the case of amendments necessary or appropriate to comply with applicable law, rules or policies or a regulatory authority, participants will be mailed written notice at least 30 days before the effective date of any amendment. In the case of termination, participants will be mailed written notice at least 30 days before the record date of any dividend or capital gains distribution by the Fund.
27
UNITED STATES ADDRESS
The Taiwan Fund, Inc.
c/o State Street Bank and Trust Company
One Lincoln Street
P.O. Box 5049
Boston, MA
1-877-217-9502
www.thetaiwanfund.com
INVESTMENT ADVISER
JF International Management Inc.
21st Floor, Chater House
8 Connaught Road Central
Hong Kong
DIRECTORS AND OFFICERS
William C. Kirby, Chairman of the Board and Share Repurchase Program Committee, Member, Audit Committee, Nominating Committee, Valuation Committee and Independent Director
Anthony S. Clark, Chairman, Valuation Committee, Member, Audit Committee, Nominating Committee, Share Repurchase Program Committee, and Independent Director
Thomas G. Kamp, Chairman, Audit Committee, Member, Share Repurchase Program Committee, Nominating Committee, Valuation Committee and Independent Director
Shelley E. Rigger, Chair, Nominating Committee, Member, Audit Committee, Share Repurchase Program Committee, Valuation Committee and Independent Director
Warren J. Olsen, Member, Audit Committee, Nominating Committee, Share Repurchase Program Committee, Valuation Committee and Independent Director
Simon J. Crinage, President
Patrick J. Keniston, Chief Compliance Officer
Brian F. Link, Secretary
Monique Labbe, Treasurer
ADMINISTRATOR AND ACCOUNTING AGENT
State Street Bank and Trust Company
Boston, MA
CUSTODIAN
State Street Bank and Trust Company
Boston, MA
TRANSFER AGENT, DIVIDEND PAYING AGENT AND REGISTRAR
Computershare Trust Company, N.A.
Canton, MA
LEGAL COUNSEL
Clifford Chance US LLP
New York, NY
Lee and Li
Taipei, Taiwan
INDEPENDENT REGISTERED PUBLIC ACCOUNTING FIRM
Tait, Weller & Baker LLP
Philadelphia, PA
STOCKHOLDER AGENT
AST Fund Solutions, LLC
New York, NY
Notice is hereby given in accordance with Section 23(c) of the Investment Company Act of 1940 that from time to time the Fund may purchase shares of its common stock in the open market at prevailing market prices.
Item 2. Code of Ethics.
Not required for this filing.
Item 3. Audit Committee Financial Expert.
Not required for this filing.
Item 4. Principal Accountant Fees and Services.
Not required for this filing.
Item 5. Audit Committee of Listed Registrants.
Not required for this filing.
Item 6. Investments.
| (a) | Schedule of Investments is included as part of Item 1. |
Item 7. Disclosure of Proxy Voting Policies and Procedures for Closed-End Investment Companies.
Not required for this filing.
Item 8. Portfolio Managers of Closed-End Management Investment Company.
| (a)(1) | Not required for this filing. |
| (a)(2) | Not required for this filing. |
| (a)(3) | Not required for this filing. |
| (a)(4) | Not required for this filing. |
(b) There have been no changes to any of the registrant’s portfolio managers since last reported in the registrant’s Annual Report dated August 31, 2018 and as filed in Form N-CSR on November 2, 2018 SEC Accession No. 0001398344-18-015830.
Item 9. Purchases of Equity Securities by Closed-End Management Investment Company and Affiliated Purchasers.
During the six month period ended February 28, 2019, the following purchases were made by or on behalf of the Fund as that term is defined in Rule 10b-18 under the Exchange Act.
| Period | (a) Total Number
of Shares (or Units)
Purchased | (b) Average Price
Paid per Share (or Unit) | (c) Total Number
of Shares (or Units)
Purchased as Part of
Publicly Announced
Plans or Programs | (d) Maximum Number
(or Approximate Dollar
Value) of Shares
(or Units) that May Yet
Be Purchased Under
the Plans or Programs |
| September 1, 2018 through September 30, 2018 | 9,612 | $19.24 | 9,612 | 801,604 |
| October 1, 2018 through October 31, 2018 | 18,175 | $16.66 | 18,175 | 783,429 |
| November 1, 2018 through November 30, 2018 | 46,725 | $16.90 | 46,725 | 736,704 |
| December 1, 2018 through December 31, 2018 | 16,206 | $16.09 | 16,206 | 720,498 |
| January 1, 2019 through January 31, 2019 | 76,525 | $15.66 | 76,525 | 643,973 |
| February 1, 2019 through February 28, 2019 | 16,905 | $16.46 | 16,905 | 627,068 |
| Total | 184,148 | $16.35 | 184,148 | 627,068 |
Under the Fund’s Discount Management Policy (the “Policy”), which was adopted in September 2014 and last modified on March 8, 2019, the Fund is authorized to make open market purchases in an aggregate amount up to 10% of the Fund’s outstanding shareson any day that the Fund’s shares are trading at a discount that exceeds 9.5%. All of the purchases listed above were under the Policy.
Item 10. Submission of Matters to a Vote of Security Holders.
There have been no material changes to the procedures by which stockholders may recommend nominees to the registrant’s Board of Directors during the period covered by this Form N-CSR filing.
Item 11. Controls and Procedures.
| (a) | The registrant’s principal executive and principal financial officers have concluded that the registrant’s disclosure controls and procedures (as defined in Rule 30a-3(c) under the Investment Company Act of 1940, as amended (the “1940 Act”) (17 CFR 270.30a-3(c))) are effective, as of a date within 90 days of the filing date of this Form N-CSR based on their evaluation of these controls and procedures required by Rule 30a-3(b) under the 1940 Act (17 CFR 270.30a-3(b)) and Rules 13a-15(b) or 15d-15(b) under the 1934 Act (17 CFR 240.13a-15(b) or 240.15d-15(b)). |
| (b) | There were no changes in the registrant’s internal control over financial reporting (as defined in Rule 30a-3(d) under the 1940 Act (17 CFR 270.30a-3(d))) that occurred during the registrant’s most recent fiscal quarter that has materially affected, or is reasonably likely to materially affect, the registrant’s internal control over financial reporting. |
Item 12. Disclosure of Securities Lending Activities for Closed-End Management Investment Companies.
The registrant does not participate in securities lending activities.
Item 13. Exhibits.
| (a)(1) | Not required for this filing. |
| (a)(2) | The certifications required by Rule 30a-2 of the 1940 Act (17 CFR 270.30a-2(a)) are attached hereto. |
| (a)(3) | Not required for this filing. |
| (b) | The certifications required by Rule 30a-2(b) of the 1940 Act (17 CFR 270.30a-2(b)) and Section 906 of the Sarbanes-Oxley Act of 2002 are attached hereto. |
SIGNATURES
Pursuant to the requirements of the Securities Exchange Act of 1934 and the Investment Company Act of 1940, the registrant has duly caused this report to be signed on its behalf by the undersigned, thereunto duly authorized.
THE TAIWAN FUND, INC.
| By: | /s/ Simon J. Crinage | |
| | Simon J. Crinage | |
| | President of The Taiwan Fund, Inc. | |
| | | |
| Date: | May 8, 2019 | |
| | | |
| Pursuant to the requirements of the Securities Exchange Act of 1934 and the Investment Company Act of 1940, this report has been signed below by the following persons on behalf of the registrant and in the capacities and on the dates indicated. |
| | | |
| By: | /s/ Simon J. Crinage | |
| | Simon J. Crinage | |
| | President of The Taiwan Fund, Inc. | |
| | | |
| Date: | May 8, 2019 | |
| | | |
| By: | /s/ Monique Labbe | |
| | Monique Labbe | |
| | Treasurer of The Taiwan Fund, Inc. | |
| | | |
| Date: | May 8, 2019 | |