American Land Lease Announces Second Quarter 2004 Financial Results
8.7% Increase in Funds From Operations per share over 2003
CLEARWATER, Fla., August 5, 2004 /PRNewswire/ — American Land Lease, Inc. (NYSE:ANI. -news) today released results for second quarter 2004.
Please refer to the Supplemental Information which the Company also released today for definitions of measures of performance not determined in accordance with generally accepted accounting principles (“non-GAAP”) and reconciliation of non-GAAP measures to measures determined in accordance with generally accepted accounting principles (“GAAP”).
Summary Financial Results
Second Quarter
| • | Diluted Earnings Per Share (“Diluted EPS”) were $0.29 for the three-month period ended June 30, 2004 as compared to $0.26 from the same period one year ago, an increase of 9.2% on a per share basis. |
| • | Funds from Operations (“FFO”; a non-GAAP financial measure defined in the Supplemental Information) were S3.1 million, or $0.38 per diluted common share, for the quarter compared to $2.8 million, or $0.35 per diluted common share from the same period one year ago, an increase of 8.7% on a per share basis. |
| • | Unit volume in home sales was 103 new home closings, including 94 new homes sold on expansion home sites. This compares with 88 new home closings in second quarter 2003, including 87 new homes sold on expansion sites. |
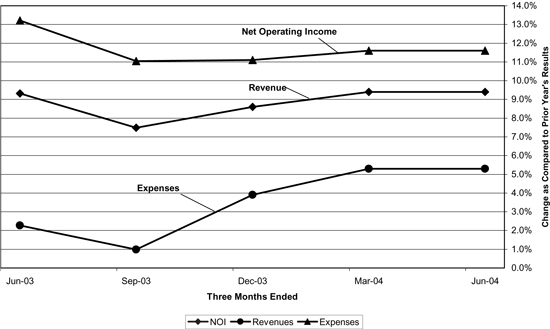
| • | “Same Store” results provided a revenue increase of 9.0%, an expense increase of 3.4% and an increase of 11.8% in Net Operating Income (“NOI”). |
| • | “Same Site” results provided a revenue increase of 3.1%, an expense increase of 2.1% and an increase of 3.7% in NOI. |
Supplemental Information
The full text of this press release and Supplemental Information are available upon request or through the Company’s web site at www.americanlandlease.com.
Management Comments
Bob Blatz, President of American Land Lease, commented, “We are pleased to report results for the second quarter 2004. The impact of newly leased sites continues to drive the outperformance of our same store growth rate while our focus on senior communities continues to provide stable growth in our core business.”
“Our home sales unit volume increased as compared to second quarter 2003 and revenue growth in home sales was 25% primarily driven by an increase from $85,000 to $92,000 in average selling price. Our backlog is up 15% over the prior year to 189 homes, so we
continue to see growth in the volume and quality of our home sales as a driver for improved results. Our partnership with home manufacturers continues to yield product improvements, including longer lead times, and a better quality home product that commands a higher sales price. The better quality homes are a welcome addition to our communities as they increase the overall community value.”
Dividend Declaration
On July 28, 2004, the Board of Directors declared a regular second quarter dividend of $0.25 per share, payable on August 26, 2004, to stockholders of record on August 9, 2004. The Company continues to suspend its dividend reinvestment plan until further notice.
The Board of Directors reviews the dividend policy quarterly. The Company’s dividend is set quarterly and is subject to change or elimination at any time. The Company’s primary financial objective is to maximize long term, risk adjusted returns on investment for stockholders. While the dividend policy is considered within the context of this objective, maintenance of past dividend levels is not a primary investment objective of the Company and the dividend policy is subject to numerous factors including, the Company’s profitability, capital expenditure plans, obligations related to principal payments and capitalized interest, and the availability of debt and equity capital at terms deemed attractive by the Company to finance these expenditures. The Company’s net operating loss carryforward may be used to offset all or a portion of its real estate investment trust (“REIT”) taxable income, which may allow the Company to reduce or eliminate its dividends and still maintain its REIT status.
Operational Results
Second Quarter Property Operations
Second quarter revenue from property operations was $7,247,000 as compared to $6,540,000 in the same period one year ago, a 10.8% increase. Second quarter property operating expenses totaled $2,764,000 as compared to $2,616,000 in the same period one year ago, a 5.7% increase. The Company realized significant increases in rental income driven by annual rental rate increases, the absorption of new home sites as a result of its home sales efforts and the acquisition of one community during fourth quarter 2003. Property operating expenses increased in the second quarter 2004 as compared to the same period in the prior year driven primarily by increases in labor and benefit costs, the acquisition of one community during the fourth quarter 2003, and utility costs, offset by decreases in offsite management and tenant related legal costs. The combination of increased revenue and expenses resulted in an overall improvement in property operating margins before depreciation expense from 60.0% in the prior year’s second quarter to 61.9% in the second quarter 2004.
Second Quarter “Same Store” Results
Second quarter “same store” results reflect the results of operations for properties and golf courses owned for both the second quarter of 2004 and the same period in the prior year. The same store properties account for 98% of the property operating revenues for the second quarter of 2004. We believe that same store information provides insight as to the changes in profitability for properties owned during both reporting periods that could not be obtained from a review of the consolidated income statement in periods where properties are acquired. A reconciliation of “same store” operating results reported below to total property revenues and property expenses, as determined under GAAP, can be found in the Supplemental Information, page 27.
The same store increases are as follows:
| 2Q04 | |||
Revenue | 9.0 | % | |
Expense | 3.4 | % | |
Net Operating Income | 11.8 | % |
We derive our increase in property revenue (i) from increases in rental rates and other charges at our properties and (ii) through the origination of leases on expansion home sites (“absorption”). “Same site” results reflect the results of operations excluding those sites leased subsequent to the beginning of the prior year period. We believe that “same site” information provides the ability to understand the changes in profitability without the growth related to the newly leased sites. Our presentation of same site results is a non-GAAP measure and should not be considered in isolation from, and is not intended to represent an alternative measure to, operating income or cash flow or any other measure of performance as determined in accordance with GAAP.
We calculate absorption revenues as the rental revenue recognized on sites leased subsequent to the beginning of the prior year period. We estimate that 50% of the increase in expenses over the prior year period is attributable to newly leased sites in our calculation of same site results. We believe that the allocation of expenses between same site and absorption is an appropriate allocation between fixed and variable costs of operating our properties.
Our same site, absorption, same site golf operations and total same store results for second quarter 2004 are as follows:
| Same Site Rental | Absorption | Same Site Golf | Same Store | |||||||||
Revenue | 3.1 | % | 5.8 | % | 0.1 | % | 9.0 | % | ||||
Expense | 2.1 | % | 2.0 | % | (0.7 | %) | 3.4 | % | ||||
NOI | 3.7 | % | 7.7 | % | 0.4 | % | 11.8 | % |
A reconciliation of same site and same store operating results used in the above calculations to total property revenues and property expenses, as determined under GAAP, for the three months ended June 30, 2004 and 2003 can be found in the Supplemental Information, page 27.
Second Quarter Home Sales Operations
Second quarter 2004 new home sales unit volume was 103 closings, a 17% increase from the 88 closings in the same period in the prior year. Average selling price per home was $92,000 as compared to $85,000 in the same period in the prior year, an 8.2% increase. The increase in closings compared to the same period in the prior year was balanced across the Company’s expansion communities, with increases in nine communities and decreases in seven communities. Brokerage profits were up 85% as compared with the same period in the prior year driven by an 89% increase in the number of transactions. Selling gross margins, excluding brokerage activities, improved to 33% in the quarter as compared to 29% in the same period in the prior year. This increase was driven by increased selling prices, increased manufacturer rebates associated with higher purchasing volumes, and sales of upgrades to base home models. The increases in revenue and cost savings were offset by increases in the cost of homes purchased. Selling costs as a percentage of sales revenue increased from 20.6% in the prior year’s period to 25.3% in the second quarter of 2004, reflecting additional investments in personnel and advertising/marketing in support of a higher operating level for the business. The backlog of contracts for closing stood at 189 home sales, an increase of 24 contracts from the same period in the prior year.
The Company remains committed to its program of generating revenue growth through new lease originations in its existing portfolio. The home sales business continues to provide the Company with additional earning home sites that have a greater return on investment than is currently available through the purchase of occupied communities.
Summary of home sales activity:
| Quarter ended June 30, 2004 | Quarter ended June 30, 2003 | |||
New home closings | 103 | 88 | ||
New home contracts | 144 | 105 | ||
Home resales | 5 | 11 | ||
Brokered home sales | 83 | 44 | ||
New home contract backlog | 189 | 165 |
Outlook for 2004
The table below summarizes the Company’s projected financial outlook for 2004 as of the date of this release and is based on the estimates and assumptions disclosed in this and previous press releases:
Full Year 2004 Projected | ||
FFO | $1.40 to $1.60 | |
AFFO | $1.28 to $1.44 | |
Diluted EPS | $1.03 to $1.24 | |
Same Store Sales | ||
Revenue Growth | 5.0% to 9.0% | |
Expense Growth | 4.5% to 7.5% | |
NOI Growth | 6.0% to 9.5% | |
Home Sales Operating Income | $2,000,000 to $3,250,000 | |
General and Administrative Expenses | $3,200,000 to $3,700,000 | |
Other Income | $210,000 to $280,000 | |
Capital Replacements (per site) | $115 to $135 | |
Depreciation | $2,900,000 to $3,200,000 |
A portion of the Company’s earnings is from the sale of new homes on expansion home sites in its developing communities. The earnings from the new home sales are subject to greater volatility than the earnings from rental property activities. The Company’s earnings estimates would be impacted positively by increases in the unit volume of new
home sales or increases in the gross margins from new home sales. Conversely, decreases in the unit volume of new home sales or decreases in the gross margins from new home sales would negatively impact the Company’s earnings estimates. Home sales volume is dependent upon a number of factors, including consumer confidence and consumer access to financing sources for home purchases and the sale of their current home.
The Company’s projected results for 2004 include increased corporate governance costs based upon current estimates of the cost of compliance. Non-employee director compensation continues to be paid in stock and all stock based compensation is expensed within the 2004 projections. The Company’s earnings estimates would be adversely impacted by the increased cost of compliance with regulations and laws applicable to public companies and financial reporting.
The financial and operating projections provided in this release are the result of management’s consideration of past operating performance, current and anticipated market conditions and other factors that management considers relevant from its past experience.
Development Activity
The Company continued its development activity at Savanna Club and will be selling into its “Eagles Retreat” subdivision throughout the third quarter. This subdivision represents Phase VII of VIII.
At Riverside Club, “The Bluffs” is in its closeout phase - with less than 10 homesites not under contract. While the next Phase - “The Fairways”- is not scheduled for completion until the end of third quarter, the Company has begun pre-selling into that phase as of August 1st. In its current pre-sale phase, only 48 of the 148 home sites are available to be placed under contract for a home and future lease. As that phase sells out the company will open another section of the subdivision, which is expected in Q105first quarter 2005.
Construction neared completion for the subdivisions at the Royal Palm and Brentwood communities that will provide an additional 162 home sites for immediate occupancy in third quarter 2004. Planning and permitting a subdivision at an additional community continued during the quarter.
Financing Activity
During the quarter, the Company negotiated a 1% reduction in floor interest rate on three variable rate loans with an outstanding balance of $10.6 million as of June 30, 2004. This reduction in floor rate became effective July 1, 2004. With respect to these three loans, the Company achieved occupancy targets at three properties that provided additional advances under committed non-recourse credit facilities totaling $2.13 million.
During the quarter, the Company increased the size of its floor plan credit facility used to finance its inventory of homes to $20 million.
American Land Lease, Inc. is a REIT that holds interests in 29 manufactured home communities with 6,754 operational home sites, 976 developed expansion sites, 1,268 undeveloped expansion sites and 129 recreational vehicle sites.
Some of the statements in this press release, as well as oral statements made by the Company’s officials to analysts and stockholders in the course of presentations about the Company and conference calls following quarterly earnings releases, constitute “forward looking statements” within the meaning of the Private Securities Litigation Reform Act of 1995. Such statements may include projections of the Company’s cash flow, dividends and anticipated returns on real estate investments. Such forward-looking statements involve known and unknown risks, uncertainties and other factors that may cause actual results, performance or achievements of the Company to be materially different from any future results, performance or achievements expressed or implied by the forward-looking statements. Such factors include: general economic and business conditions; interest rate changes, financing and refinancing risks; risks inherent in owning real estate; future development rate of home sites; competition; the availability of real estate assets at prices which meet the Company’s investment criteria; the Company’s ability to reduce expense levels, implement rent increases, use leverage and other risks set forth in the Company’s Securities and Exchange Commission filings.
Management will hold a teleconference call, Thursday, August 5, 2004 at 4:00 p.m. Eastern Daylight Time to discuss second quarter 2004 results. You can participate in the conference call by dialing, toll-free, (800) 374-5458 approximately five minutes before the conference call is scheduled to begin and indicating that you wish to join the American Land Lease first quarter 2004 results conference call. If you are unable to participate at the scheduled time, this information will be available for recorded playback from 5:30 p.m. EDT, August 5, 2004 until midnight on August 12, 2004. To access the replay, dial toll free, (800) 642-1687 and request information from conference ID 9106803.
Contact: | Robert G. Blatz, President (727) 726-8868 | |
Shannon E. Smith, Chief Financial Officer (727) 726-8868 |
SOURCE: American Land Lease, Inc.
GLOSSARY
GLOSSARY OF NON-GAAP FINANCIAL AND OPERATING MEASUREMENTS Financial and operational measurements found in the Earnings Release and Supplemental Information include certain non-GAAP financial measurements standardly used by American Land Lease management. Measurements include Funds from Operations (“FFO”), which is an industry-accepted measurement as based on the definition of the National Association of Real Estate Investment Trusts (NAREIT). These terms are defined below and, where appropriate, reconciled to the most comparable Generally Accepted Accounting Principles (GAAP) measurements on the accompanying supplement schedules.
FUNDS FROM OPERATIONS (“FFO”): is a commonly used term defined by NAREIT as net income (loss), computed in accordance with GAAP, excluding gains and losses from extraordinary items, dispositions of depreciable real estate property, disposals of discontinued operations, net of related income taxes, plus real estate related depreciation and amortization (excluding amortization of financing costs), including depreciation for unconsolidated real estate partnerships, joint ventures and discontinued operations. American Land Lease calculates FFO based on the NAREIT definition, as further adjusted for the minority interest in the American Land Leases’s operating partnership (Asset Investors Operating Partnership). This supplemental measure captures real estate performance by recognizing that real estate generally appreciates over time or maintains residual value to a much greater extent than do other depreciable assets such as machinery, computers or other personal property. There can be no assurance that American Land Lease’s method for computing FFO is comparable with that of other real estate investments trusts.
ADJUSTED FUNDS FROM OPERATIONS (“AFFO”): is FFO less both Capital Replacement expenditures and Capital Enhancement expenditures. Similar to FFO, AFFO captures real estate performance by recognizing that real estate generally appreciates over time or maintains residual value to a much greater extent than do other depreciating assets such as machinery, computers or other personal property, and AFFO also reflects that Capital Replacements are necessary to maintain the associated real estate assets.
SAME STORE RESULTS:represent an operating measure that is used commonly to describe properties that have been in the portfolio for a period of time and therefore serve as a good basis upon which to review comparative performance data. American Land Lease’s definition of Same Store communities are communities that are owned during both the current and comparable prior year period.
SAME SITE RESULTS: represent an operating measure that is used to describe homesites that have been in the portfolio for a period of time and therefore serve as a good basis upon which to review comparative performance data. American Land Lease’s definition of Same Site is individual homesites that were operational during both the current and comparable prior year period. Absorbed incremental homesites are not included in this calculation.
OPERATIONAL HOME SITE:represents those sites within our portfolio that are/or have been leased to a tenant. Operational Home Sites and their relative occupancy provide a measure of stabilized portfolio status.
DEVELOPED HOME SITE:represents those sites within our portfolio that have not been occupied, but for which a majority of the infrastructure has been completed.
UNDEVELOPED HOME SITE:represent those sites within our portfolio that have not been fully developed and require construction of substantial lateral improvements such as roads.
CAPITAL REPLACEMENT:represents capitalized spending which maintains a property. American Land Lease generally capitalizes spending for items that cost more than $250 and have a useful life of more than one year. A common example is street repaving. This spending is better considered a recurring cost of preserving an asset rather than as an additional investment. It is a cash proxy for depreciation.
CAPITAL ENHANCEMENT:represents capitalized spending which adds a material feature increases overall community value or revenue source. An example is the addition of a marina facility to an existing community.
USED HOME SALE:represents the sale of a home previously owned by a third party and where American Land Lease has acquired title through an eviction proceeding or through purchase from a third party.
GROSS DISTRIBUTION PAYOUT RATIO: This is calculated as the dividend per share divided by FFO and AFFO per share, respectively.
DISTRIBUTION PAYOUT RATIO NET OF DRIP:this is calculated as dividend per share less amounts reinvested pursuant to the dividend reinvestment plan divided by FFO and AFFO per share, respectively.
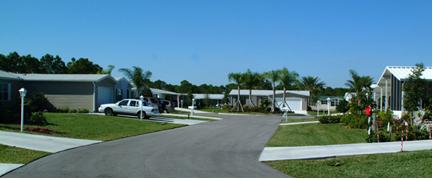
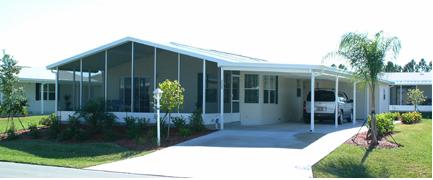
American Land Lease – Selected Properties
Riverside Club – Ruskin, Florida
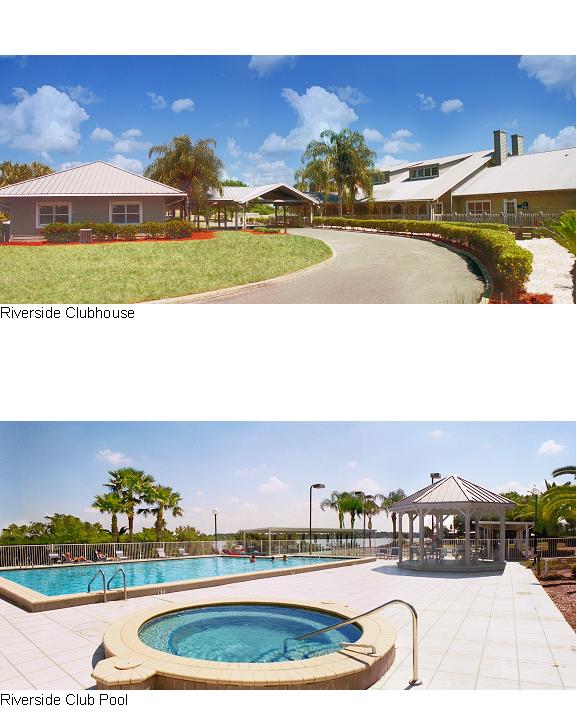
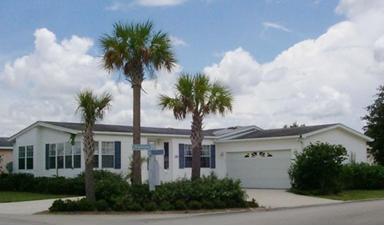
Riverside Home
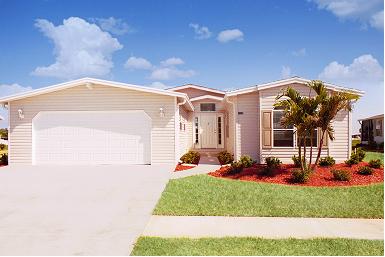
Riverside Home
Savanna Club – Port St. Lucie, Florida
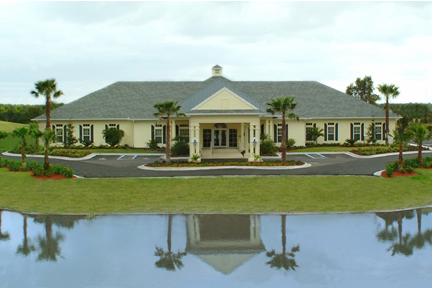
Savanna Clubhouse
Savanna Streetcape
Savanna Club Home

Savanna Club Home
Savanna Club Home
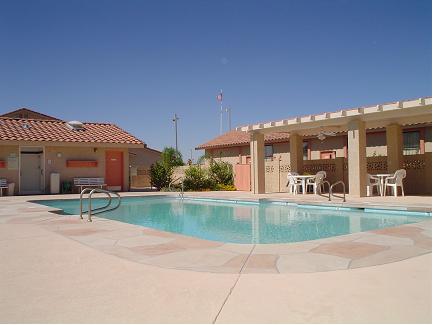
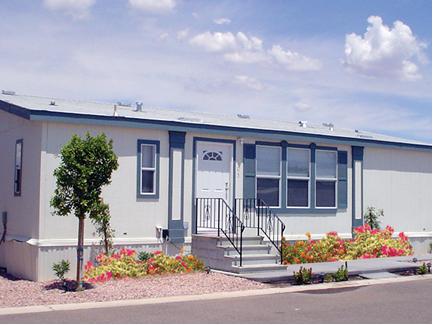
Desert Harbor - Apache Junction, Arizona
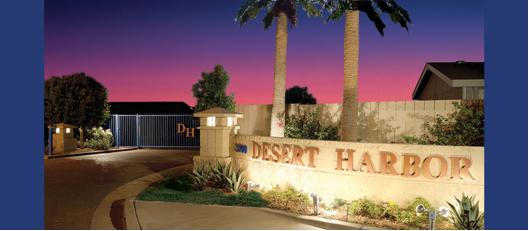
Desert Harbor - Entrance
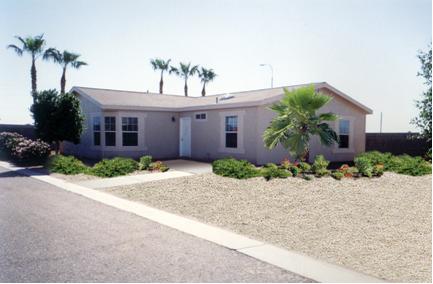
Desert Harbor - Home
Desert Harbor - Home
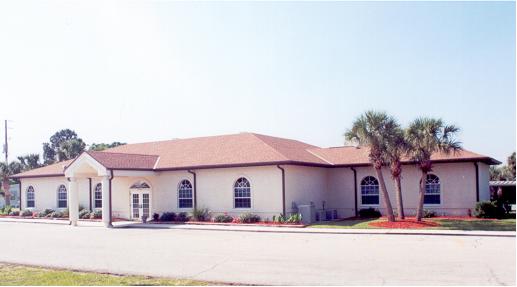
Forest View Estates – Homosassa, Florida
Forest View Clubhouse
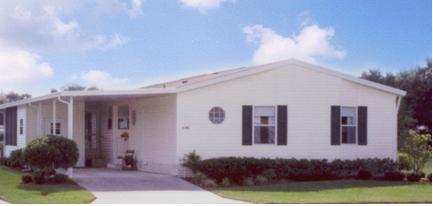
Forest View Home
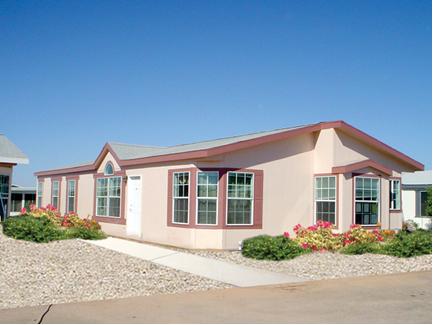
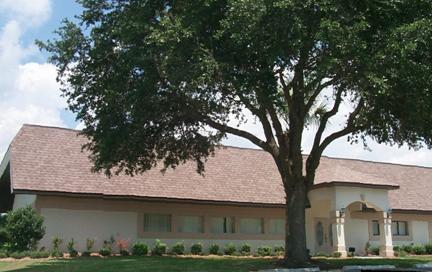
Royal Palm – Haines City, Florida
Royal Palm Clubhouse

Royal Palm Home
Lost Dutchman – Apache Junction, Arizona
Lost Dutchman Recreation Area
Lost Dutchman Home
AMERICAN LAND LEASE INC. AND SUBSIDIARIES
CONSOLIDATED BALANCE SHEETS
(in thousands)
| As of | ||||||||||||||||||||
June 30, 2004 | March 31, 2004 | December 31, 2003 | September 30, 2003 | June 30, 2003 | ||||||||||||||||
| (unaudited) | (unaudited) | (unaudited) | (unaudited) | |||||||||||||||||
ASSETS | ||||||||||||||||||||
Real Estate | $ | 215,155 | $ | 209,849 | $ | 204,777 | $ | 198,806 | $ | 192,099 | ||||||||||
Less accumulated depreciation | (21,474 | ) | (20,779 | ) | (20,112 | ) | (19,453 | ) | (18,825 | ) | ||||||||||
Real estate under development | 44,636 | 42,223 | 41,413 | 36,669 | 38,429 | |||||||||||||||
Total Real Estate | 238,317 | 231,293 | 226,078 | 216,022 | 211,703 | |||||||||||||||
Cash and cash equivalents | 1,207 | 776 | 2,064 | 3,077 | 978 | |||||||||||||||
Inventory | 13,073 | 11,330 | 10,403 | 10,335 | 12,192 | |||||||||||||||
Investments in unconsolidated real estate partnerships | — | — | — | — | 1,692 | |||||||||||||||
Other Assets | 9,729 | 8,566 | 8,162 | 8,774 | 8,242 | |||||||||||||||
Assets held for sale | 313 | 361 | 389 | 418 | 599 | |||||||||||||||
Total Assets | $ | 262,639 | $ | 252,326 | $ | 247,096 | $ | 238,626 | $ | 235,406 | ||||||||||
LIABILITIES AND EQUITY | ||||||||||||||||||||
Liabilities | ||||||||||||||||||||
Secured long-term notes payable | $ | 119,876 | $ | 118,478 | $ | 119,194 | $ | 111,236 | $ | 110,906 | ||||||||||
Secured short-term financing | 20,142 | 13,495 | 10,659 | 8,921 | 10,188 | |||||||||||||||
Accounts payable and accrued liabilities | 10,982 | 9,883 | 8,423 | 10,310 | 8,254 | |||||||||||||||
Liabilities related to assets held for sale | 6 | 4 | 5 | 7 | 10 | |||||||||||||||
Total Liabilities | 151,006 | 141,860 | 138,281 | 130,474 | 129,358 | |||||||||||||||
Minority Interest in Operating Partnership | 14,497 | 14,319 | 14,014 | 13,849 | 13,815 | |||||||||||||||
STOCKHOLDERS’ EQUITY | ||||||||||||||||||||
Preferred Stock; par value $.01 per share; 1,000 shares authorized, no shares issues or outstanding | — | — | — | — | — | |||||||||||||||
Common Stock, par value $.01 per share; 12,000 shares authorized | 90 | 90 | 88 | 88 | 88 | |||||||||||||||
Additional paid-in-capital | 285,517 | 285,207 | 282,818 | 282,719 | 282,246 | |||||||||||||||
Notes receivable from officers re common stock purchases | (775 | ) | (785 | ) | (799 | ) | (814 | ) | (833 | ) | ||||||||||
Deferred compensation re restricted stock | (2,719 | ) | (3,049 | ) | (1,354 | ) | (1,487 | ) | (1,642 | ) | ||||||||||
Dividends in excess of accumulated earnings | (158,365 | ) | (158,704 | ) | (159,340 | ) | (159,591 | ) | (161,014 | ) | ||||||||||
Treasury stock at cost | (26,612 | ) | (26,612 | ) | (26,612 | ) | (26,612 | ) | (26,612 | ) | ||||||||||
Total Stockholders’ Equity | 97,136 | 96,147 | 94,801 | 94,303 | 92,233 | |||||||||||||||
Total Liabilities and Stockholders’ Equity | $ | 262,639 | $ | 252,326 | $ | 247,096 | $ | 238,626 | $ | 235,406 | ||||||||||
AMERICAN LAND LEASE INC. AND SUBSIDIARIES
CONSOLIDATED STATEMENTS OF INCOME
(in thousands, except per share data)
(unaudited)
| Three Months Ended | ||||||||||||||||||||
| June 30, 2004 | March 31, 2004 | December 31, 2003 | September 30, 2003 | June 30, 2003 | ||||||||||||||||
RENTAL PROPERTY OPERATIONS | ||||||||||||||||||||
Rental and other property revenues | $ | 7,071 | $ | 7,033 | $ | 6,698 | $ | 6,428 | $ | 6,366 | ||||||||||
Golf course operating revenues | 176 | 403 | 196 | 120 | 173 | |||||||||||||||
Total property operating revenues | 7,247 | 7,436 | 6,894 | 6,548 | 6,539 | |||||||||||||||
Property operating expenses | (2,459 | ) | (2,549 | ) | (2,414 | ) | (2,315 | ) | (2,297 | ) | ||||||||||
Golf course operating expenses | (305 | ) | (308 | ) | (307 | ) | (293 | ) | (319 | ) | ||||||||||
Total property operating expenses | (2,764 | ) | (2,857 | ) | (2,721 | ) | (2,608 | ) | (2,616 | ) | ||||||||||
Depreciation | (741 | ) | (709 | ) | (699 | ) | (662 | ) | (660 | ) | ||||||||||
Income from rental property operations | 3,742 | 3,870 | 3,474 | 3,278 | 3,263 | |||||||||||||||
SALES OPERATIONS | ||||||||||||||||||||
Home sales revenue | 9,714 | 9,280 | 9,914 | 12,354 | 7,771 | |||||||||||||||
Cost of home sales | (6,474 | ) | (6,204 | ) | (6,968 | ) | (8,920 | ) | (5,531 | ) | ||||||||||
Gross profit on home sales | 3,240 | 3,076 | 2,946 | 3,434 | 2,240 | |||||||||||||||
Commissions earned on brokered sales | 227 | 185 | 142 | �� | 151 | 117 | ||||||||||||||
Commissions paid on brokered sales | (122 | ) | (100 | ) | (73 | ) | (74 | ) | (60 | ) | ||||||||||
Gross profit on brokered sales | 105 | 85 | 69 | 77 | 57 | |||||||||||||||
Selling and marketing expenses | (2,455 | ) | (2,343 | ) | (2,163 | ) | (2,071 | ) | (1,604 | ) | ||||||||||
Income (loss) from sales operations | 890 | 818 | 852 | 1,440 | 693 | |||||||||||||||
General and administrative expenses | (904 | ) | (911 | ) | (754 | ) | (687 | ) | (661 | ) | ||||||||||
Interest and other income | 28 | 272 | 31 | 47 | 150 | |||||||||||||||
Gain (loss) on sale of real estate | — | — | — | 971 | — | |||||||||||||||
Interest expense | (1,392 | ) | (1,360 | ) | (1,382 | ) | (1,344 | ) | (1,371 | ) | ||||||||||
Equity in income of unconsolidated real estate partnerships | — | — | — | — | 17 | |||||||||||||||
Income before minority interest in Operating Partnership | 2,364 | 2,689 | 2,221 | 3,705 | 2,091 | |||||||||||||||
Minority interest in Operating Partnership | (285 | ) | (323 | ) | (265 | ) | (443 | ) | (247 | ) | ||||||||||
Income from continuing operations | 2,079 | 2,366 | 1,956 | 3,262 | 1,844 | |||||||||||||||
DISCONTINUED OPERATIONS: | ||||||||||||||||||||
(Loss) Income from discontinued operations | 8 | 8 | 21 | (123 | ) | 17 | ||||||||||||||
NET INCOME | $ | 2,087 | $ | 2,374 | $ | 1,977 | $ | 3,139 | $ | 1,861 | ||||||||||
Basic earnings from continuing operations | $ | 0.30 | $ | 0.34 | $ | 0.28 | $ | 0.47 | $ | 0.27 | ||||||||||
Basic (loss) earnings from discontinued operations | — | — | — | (0.01 | ) | — | ||||||||||||||
Basic earnings per share | $ | 0.30 | $ | 0.34 | $ | 0.28 | $ | 0.46 | $ | 0.27 | ||||||||||
Diluted earnings from continuing operations | $ | 0.29 | $ | 0.32 | $ | 0.27 | $ | 0.46 | $ | 0.26 | ||||||||||
Diluted (loss) earnings from discontinued operations | — | — | — | (0.02 | ) | — | ||||||||||||||
Diluted earnings per share | $ | 0.29 | $ | 0.32 | $ | 0.27 | $ | 0.44 | $ | 0.26 | ||||||||||
Weighted average common shares outstanding | 6,971 | 6,938 | 6,914 | 6,890 | 6,866 | |||||||||||||||
Weighted average common shares and common share equivalents outstanding | 7,236 | 7,301 | 7,202 | 7,131 | 7,056 | |||||||||||||||
Dividends paid per share | $ | 0.25 | $ | 0.25 | $ | 0.25 | $ | 0.25 | $ | 0.25 | ||||||||||
AMERICAN LAND LEASE INC. AND SUBSIDIARIES
DEBT ANALYSIS
(in thousands)
(unaudited)
| As of | ||||||||||||||||||||
June 30, 2004 | March 31, 2004 | December 31, 2003 | September 30, 2003 | June 30, 2003 | ||||||||||||||||
DEBT OUTSTANDING | ||||||||||||||||||||
Mortgage Loans Payable - Fixed | $ | 93,377 | $ | 94,107 | $ | 94,819 | $ | 87,139 | $ | 87,805 | ||||||||||
Mortgage Loans Payable - Floating | 26,499 | 24,371 | 24,375 | 24,097 | 23,101 | |||||||||||||||
Floor Plan Facility | 10,762 | 9,077 | 8,269 | 8,921 | 9,988 | |||||||||||||||
Line of Credit | 9,380 | 4,418 | 2,390 | — | 200 | |||||||||||||||
Total Debt | $ | 140,018 | $ | 131,973 | $ | 129,853 | $ | 120,157 | $ | 121,094 | ||||||||||
% FIXED/FLOATING | ||||||||||||||||||||
Fixed | 66.7 | % | 71.3 | % | 73.0 | % | 72.5 | % | 72 5 | % | ||||||||||
Floating | 33.3 | % | 28.7 | % | 27.0 | % | 27.5 | % | 27.5 | % | ||||||||||
Total | 100.00 | % | 100.00 | % | 100.00 | % | 100.00 | % | 100.00 | % | ||||||||||
AVERAGE INTEREST RATES | ||||||||||||||||||||
Mortgage Loans Payable - Fixed | 7.1 | % | 7.1 | % | 7.1 | % | 7.2 | % | 7.2 | % | ||||||||||
Mortgage Loans Payable - Floating | 4.9 | % | 4.8 | % | 4.8 | % | 4.7 | % | 4.8 | % | ||||||||||
Floor Plan Facility | 6.5 | % | 6.1 | % | 7.1 | % | 7.5 | % | 7.8 | % | ||||||||||
Line of Credit | 3.2 | % | 3.1 | % | 3.1 | % | 3.1 | % | 4.3 | % | ||||||||||
Total Weighted Average | 6.4 | % | 6.5 | % | 6.6 | % | 6.7 | % | 6.8 | % | ||||||||||
DEBT RATIOS | ||||||||||||||||||||
Debt/Total Market Cap(1) | 47.5 | % | 44.1 | % | 48.4 | % | 44.8 | % | 47.4 | % | ||||||||||
Debt/Gross Assets | 53.3 | % | 52.3 | % | 52.6 | % | 50.4 | % | 51.4 | % | ||||||||||
| December 31, 2004 | December 31, 2005 | December 31, 2006 | December 31, 2007 | December 31, 2008 | ||||||||||||||||
MATURITIES | ||||||||||||||||||||
Mortgage Loans Maturities - Scheduled | 1,512 | 3,186 | 3,414 | 3,664 | 3,886 | |||||||||||||||
Mortgage Loans Maturities - Balloon | — | 854 | — | 13,278 | — | |||||||||||||||
Floor Plan Facility(2) | — | — | — | — | — | |||||||||||||||
Total | $ | 1,512 | $ | 4,040 | $ | 3,414 | $ | 18,949 | $ | 3,886 | ||||||||||
| (1) | Computed based upon closing price as reported on NYSE as of the period ended. |
| (2) | Discretionary, non-committed facility whose individual advances mature at different dates between 360 and 540 days from advance date. |
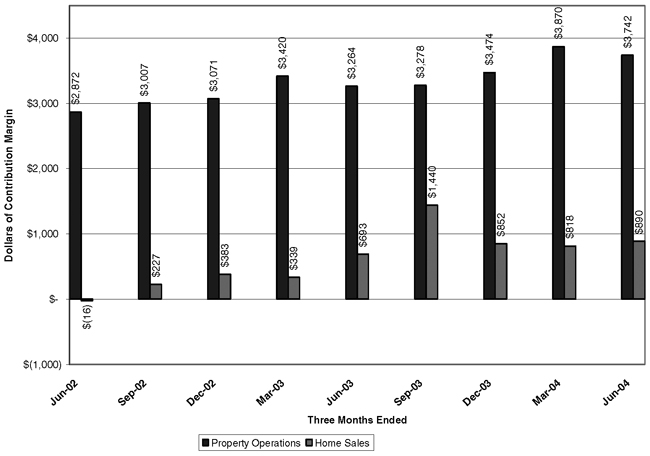
Contribution Margin to Net Income from Rental Property Operations and Home Sales
(in thousands)
(unaudited)
AMERICAN LAND LEASE INC. AND SUBSIDIARIES
CONSOLIDATED STATEMENTS OF INCOME
PER DILUTIVE SHARE
(unaudited)
| Three Months Ended | ||||||||||||||||||||
| June 30, 2004 | March 31, 2004 | December 31, 2003 | September 30, 2003 | June 30, 2003 | ||||||||||||||||
RENTAL PROPERTY OPERATIONS | ||||||||||||||||||||
Rental and other property revenues | $ | 0.97 | $ | 0.96 | $ | 0.93 | $ | 0.90 | $ | 0.90 | ||||||||||
Golf course operating revenues | 0.02 | 0.05 | 0.03 | 0.02 | 0.03 | |||||||||||||||
Total property operating revenues | 0.99 | 1.01 | 0.96 | 0.92 | 0.93 | |||||||||||||||
Property operating expenses | (0.34 | ) | (0.35 | ) | (0.34 | ) | (0.33 | ) | (0.33 | ) | ||||||||||
Golf course operating expenses | (0.04 | ) | (0.04 | ) | (0.04 | ) | (0.04 | ) | (0.04 | ) | ||||||||||
Total property operating expenses | (0.38 | ) | (0.39 | ) | (0.38 | ) | (0.37 | ) | (0.37 | ) | ||||||||||
Depreciation | (0.10 | ) | (0.10 | ) | (0.10 | ) | (0.09 | ) | (0.10 | ) | ||||||||||
Income from rental property operations | 0.51 | 0.52 | 0.48 | 0.46 | 0.46 | |||||||||||||||
SALES OPERATIONS | ||||||||||||||||||||
Home sales revenue | 1.33 | 1.27 | 1.38 | 1.73 | 1.10 | |||||||||||||||
Cost of home sales | (0.89 | ) | (0.85 | ) | (0.97 | ) | (1.25 | ) | (0.78 | ) | ||||||||||
Gross profit on home sales | 0.44 | 0.42 | 0.41 | 0.48 | 0.32 | |||||||||||||||
Commissions earned on brokered sales | 0.03 | 0.02 | 0.02 | 0.02 | 0.02 | |||||||||||||||
Commissions paid on brokered sales | (0.02 | ) | (0.01 | ) | (0.01 | ) | (0.01 | ) | (0.01 | ) | ||||||||||
Gross profit on brokered sales | 0.01 | 0.01 | 0.01 | 0.01 | 0.01 | |||||||||||||||
Selling and marketing expenses | (0.33 | ) | (0.32 | ) | (0.30 | ) | (0.29 | ) | (0.23 | ) | ||||||||||
Income (loss) from sales operations | 0.12 | 0.11 | 0.12 | 0.20 | 0.10 | |||||||||||||||
General and administrative expenses | (0.12 | ) | (0.12 | ) | (0.10 | ) | (0.10 | ) | (0.09 | ) | ||||||||||
Interest and other income | — | 0.04 | — | 0.01 | 0.02 | |||||||||||||||
Gain (loss) on sale of real estate | — | — | — | 0.14 | — | |||||||||||||||
Interest expense | (0.19 | ) | (0.19 | ) | (0.19 | ) | (0.19 | ) | (0.19 | ) | ||||||||||
Equity in income of unconsolidated real estate partnerships | — | — | — | — | — | |||||||||||||||
Income before minority interest in Operating Partnership | 0.32 | 0.36 | 0.31 | 0.52 | 0.30 | |||||||||||||||
Minority interest in Operating Partnership | (0.04 | ) | (0.04 | ) | (0.04 | ) | (0.06 | ) | (0.04 | ) | ||||||||||
Income from continuing operations | 0.28 | 0.32 | 0.27 | 0.46 | 0.26 | |||||||||||||||
DISCONTINUED OPERATIONS: | ||||||||||||||||||||
(Loss) Income from discontinued operations | — | — | — | (0.02 | ) | — | ||||||||||||||
NET INCOME | $ | 0.28 | $ | 0.32 | $ | 0.27 | $ | 0.44 | $ | 0.26 | ||||||||||
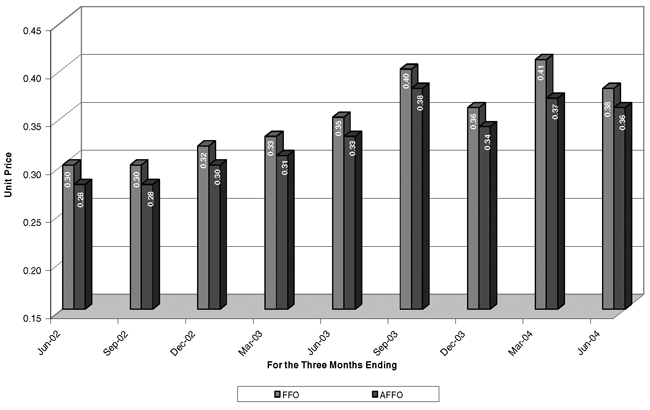
FFO/AFFO Per Common Share/OP Unit
(unaudited)
AMERICAN LAND LEASE INC. AND SUBSIDIARIES
RECONCILIATION OF NET INCOME TO FFO AND AFFO
(Amounts in thousands, except per share/OP unit amounts) (Unaudited)
Three Months Ended June 30 | ||||||||
| 2004 | 2003 | |||||||
Net Income | $ | 2,087 | $ | 1,862 | ||||
Adjustments: | ||||||||
Minority interest in operating partnership | 285 | 247 | ||||||
Real estate depreciation | 741 | 660 | ||||||
Discontinued Operations | ||||||||
Real estate depreciation | 1 | |||||||
Minority interest in operating partnership attributed to discontinued operations | 1 | 2 | ||||||
Loss on sale of real estate | 0 | |||||||
Depreciation from unconsolidated real estate partnerships | 20 | |||||||
Funds From Operations (FFO) | 3,114 | 2,792 | ||||||
Capital Replacements | (203 | ) | (180 | ) | ||||
Adjusted Funds from Operations (AFFO) | $ | 2,911 | $ | 2,612 | ||||
Weighted Average Common Shares/OP Units Outstanding: | 8,190 | 7,986 | ||||||
Per Common Share and OP Unit: | ||||||||
FFO: | $ | 0.38 | $ | 0.35 | ||||
AFFO: | $ | 0.36 | $ | 0.33 | ||||
Payout Ratio Per Common Share and OP Unit: | ||||||||
Gross Distribution Payout | ||||||||
FFO: | 65.8 | % | 71.4 | % | ||||
AFFO: | 69.4 | % | 75.8 | % | ||||
AMERICAN LAND LEASE INC. AND SUBSIDIARIES
RECONCILIATION OF SAME SITE AND SAME STORE OPERATING RESULTS
FOR THE QUARTER ENDED JUNE 30, 2004
(in thousands)
Three Months Ended June 30, 2004 | Three Months Ended June 30, 2003 | Change | % Change | Contribution to Same Store % Change(1) | ||||||||||||||
Same site rental revenues | $ | 6,407 | $ | 6,205 | $ | 202 | 3.3 | % | 3.1 | % | ||||||||
Absorption rental revenues | 458 | 83 | 375 | 451.8 | % | 5.8 | % | |||||||||||
Same site golf revenues | 175 | 173 | 2 | 1.2 | % | 0.1 | % | |||||||||||
Same store revenues | A | 7,040 | 6,461 | 579 | 9.0 | % | 9.0 | % | ||||||||||
Mini-storage revenue | 72 | 75 | (3 | ) | -4.0 | % | ||||||||||||
Acquisition property rental revenues | 130 | — | 130 | 100.0 | % | |||||||||||||
Other Income | 5 | 3 | 2 | 66.7 | % | |||||||||||||
Total property revenues | C | $ | 7,247 | $ | 6,539 | 708 | 10.8 | % | ||||||||||
Same site rental expenses | $ | 1,901 | $ | 1,856 | 45 | 2.4 | % | 2.1 | % | |||||||||
Absorption rental expenses | 44 | — | 44 | 100.0 | % | 2.0 | % | |||||||||||
Same site golf expenses | 305 | 319 | (14 | ) | -4.4 | % | -0.7 | % | ||||||||||
Same store expenses | B | 2,250 | 2,175 | 75 | 3.4 | % | 3.4 | % | ||||||||||
Mini-storage expenses | 38 | 40 | (2 | ) | -5.0 | % | ||||||||||||
Acquisition property expenses | 88 | — | 88 | 100.0 | % | |||||||||||||
Expenses related to off site management2 | 388 | 401 | (13 | ) | -3.2 | % | ||||||||||||
Total property’ operating expenses | D | $ | 2,764 | $ | 2,616 | $ | 148 | 5.7 | % | |||||||||
Same Store net operating income | A-B | $ | 4,790 | $ | 4,286 | $ | 504 | 11.8 | % | |||||||||
Total net operating income | C-D | $ | 4,483 | $ | 3,923 | $ | 560 | 14.3 | % | |||||||||
| (1) | Contribution to Same Store % change is computed as the change in the individual component of same store revenue or expense divided by the total applicable same store base (revenue or expense) for the 2003 period. For example, same site rental revenue of $202 as compared to the total same store revenues in 2003 of $6,461 is a 3.3% increase ($202/$6,461=3.1%). |
| (2) | Expenses related to offsite management reflect portfolio property management costs not attributable to a specific property. |
SAME STORE ANALYSIS
TRAILING FIVE QUARTERS
AMERICAN LAND LEASE, INC.
(unaudited)
AMERICAN LAND LEASE, INC. AND SUBSIDIARIES
NUMBER OF HOMESITES AND AVERAGE RENT BY COMMUNITY
AS OF JUNE 30, 2004
Community | Location | Operational Home Sites | Occupancy | Average Monthly Rent | RV Sites | Undeveloped Home Sites | Developed Home Sites | Year(s) First Developed | ||||||||||
Owned | ||||||||||||||||||
Blue Heron Pines | Punta Gorda, FL | 282 | 100 | % | $ | 364 | — | 65 | 42 | 1983/1999 | ||||||||
Brentwood | Hudson, FL | 112 | 97 | % | 275 | — | 48 | 32 | 1984 | |||||||||
Serendipity | Ft. Myers, FL | 338 | 96 | % | 318 | — | — | — | 1971/1974 | |||||||||
Stonebrook | Homosassa, FL | 156 | 100 | % | 276 | — | — | 55 | 1987/1997 | |||||||||
Sun Lake | Grand Island, FL | 318 | 100 | % | 326 | — | — | 76 | 1980 | |||||||||
Sun Valley | Tarpon Springs, FL | 261 | 99 | % | 356 | — | — | — | 1972 | |||||||||
Caribbean Cove | Orlando, FL | 272 | 87 | % | 359 | — | — | 13 | 1984 | |||||||||
Forest View | Homosassa, FL | 247 | 100 | % | 286 | — | — | 57 | 1987/1997 | |||||||||
Gulfstream Harbor | Orlando, FL | 382 | 99 | % | 383 | — | 50 | — | 1980 | |||||||||
Gulfstream Harbor II | Orlando, FL | 306 | 100 | % | 378 | — | 37 | 1 | 1988 | |||||||||
Lakeshore Villas | Tampa, FL | 281 | 100 | % | 390 | — | — | — | 1972 | |||||||||
Park Royale | Pinellas Park, FL | 283 | 96 | % | 406 | — | — | 26 | 1971 | |||||||||
Pleasant Living | Riverview, FL | 245 | 97 | % | 323 | — | — | — | 1979 | |||||||||
Riverside GCC | Ruskin, FL | 344 | 100 | % | 488 | — | 568 | 25 | 1981 | |||||||||
Royal Palm | Haines City, FL | 258 | 98 | % | 301 | — | 114 | 13 | 1971 | |||||||||
C_press Greens | Lakeland, FL | 147 | 100 | % | 234 | — | — | 114 | 1986 | |||||||||
Savanna Club | Port St. Lucie, FL | 665 | 100 | % | 257 | — | 192 | 196 | 1999 | |||||||||
Woodlands | Groveland, FL | 131 | 100 | % | 241 | — | — | 161 | ||||||||||
Sub-total Florida | 5,028 | 1,074 | 811 | |||||||||||||||
Blue Star | Apache Junction, AZ | 22 | 73 | % | 281 | 129 | — | — | 1955 | |||||||||
Brentwood West | Mesa, AZ | 350 | 94 | % | 413 | — | — | — | 1972/1987 | |||||||||
Casa Encanta | Mesa, AZ | — | 0 | % | — | — | 193 | — | 1970 | |||||||||
Desert Harbor | Apache Junction, AZ | 131 | 98 | % | 357 | — | — | 75 | 1997 | |||||||||
Fiesta Village | Mesa, AZ | 172 | 76 | % | 352 | — | — | — | 1962 | |||||||||
La Casa Blanca | Apache Junction, AZ | 198 | 88 | % | 362 | — | — | — | 1993 | |||||||||
Lost Dutchman | Apache Junction, AZ | 169 | 92 | % | 302 | — | — | 90 | 1971/1979/1999 | |||||||||
New Era | Tucson & Marana, AZ | 14 | 79 | % | 339 | — | — | — | 1998 | |||||||||
Rancho Mirage | Apache Junction, AZ | 312 | 92 | % | 380 | — | — | — | 1994 | |||||||||
Sun Valley | Apache Junction, AZ | 268 | 95 | % | 313 | — | — | — | 1984 | |||||||||
Sub-total Arizona | 1,636 | 193 | 165 | |||||||||||||||
Mullica Woods | Egg Harbor City, NJ | 90 | 100 | 462 | — | — | — | 1985 | ||||||||||
Total Communities | 29 | 6,754 | 97 | % | $ | 340 | 129 | 1,267 | 976 | |||||||||
| (1) | We define operational home sites as those sites within our portfolio that have been leased to a tenant during our ownership of the community. Since our portfolio contains a large inventory of developed home sites that have not been occupied during our ownership, we have expressed occupancy as the number of occupied sites as a percentage of operational home sites. We believe this measure most accurately describes the performance of an individual property relative to prior periods and other properties within our portfolio. The occupancy of all developed sites was 82.9% across the entire portfolio. Including sites not yet developed, occupancy was 72.4% June 30, 2004. |
Portfolio Summary
Operational Home sites | Developed Home sites | Undeveloped Home sites | RV Sites | Total | ||||||||||
As of December 31, 2003 | 6,578 | 979 | 1,437 | 129 | 9,123 | |||||||||
Properties developed | — | 216 | (216 | ) | — | — | ||||||||
New lots purchased | — | 7 | — | — | 7 | |||||||||
Lots sold | (3 | ) | — | — | — | (3 | ) | |||||||
New leases originated | 180 | (180 | ) | — | — | — | ||||||||
Adjust for site plan changes | (1 | ) | (46 | ) | 47 | — | 0 | |||||||
As of June 30, 2004 | 6,754 | (1) | 976 | 1,268 | 129 | 9,127 | ||||||||
| (1) | As of June 30, 2004, 6,517 of these operational home sites were occupied. |
Occupancy Roll Forward
| Occupied Home sites | Operational Home sites | Occupancy | |||||||
As of December 31, 2003 | 6,349 | 6,578 | 96.5 | % | |||||
New home sales | 194 | 179 | |||||||
Used home sales | 15 | — | |||||||
Used homes acquired | (18 | ) | — | ||||||
Lots Sold | — | (3 | ) | ||||||
Homes constructed by others | 2 | — | |||||||
Site plan changes | — | — | |||||||
Homes removed from previously leased sites | (25 | ) | — | ||||||
As of June 30, 2004 | 6,517 | 6,754 | 96.5 | % |
AMERICAN LAND LEASE, INC. AND SUBSIDIARIES
RETURN ON INVESTMENT FROM HOME SALES
(unaudited)
| Three Months Ended June 30, 2004 | Three Months Ended June 30, 2003 | |||||||||
Expansion sites leased during the year | 94 | 87 | ||||||||
Estimated first year annualized profit on leases originated during the year | A | $ | 337 | $ | 294 | |||||
Costs, including development costs of sites leased | $ | 4,153 | $ | 3,407 | ||||||
Home sales income (loss) attributable to sites leased | 785 | 636 | ||||||||
Total costs incurred to originate ground leases | B | $ | 3,368 | $ | 2,770 | |||||
Estimated first year annualized return on investment for leases originated during the year | A/B | 10.0 | % | 10.6 | % | |||||
For the three months ended June 30, 2004 and 2003, we estimate our profit or loss attributable to the sale of homes situated on expansion home sites as follows (in thousands):
| Three Months Ended June 30, 2004 | Three Months Ended June 30, 2003 | |||||||
Reported income (loss) from sales operations | $ | 890 | $ | 693 | ||||
Used home sales and brokerage business income | (105 | ) | (57 | ) | ||||
Adjusted income (loss) for pro forma analysis | $ | 785 | $ | 636 | ||||
The reconciliation of our estimated first year return on investment in expansion home sites, a non-GAAP financial measure, to our return on investment in operational home sites in accordance with GAAP is shown below (in thousands):
| Total Portfolio for Year Ended December 31, 2003 | ||||||
Property income before depreciation1 | A | $ | 16,105 | |||
Total investment in operating home sites1 | B | $ | 201,660 | |||
Return on investment from earning home sites1 | A/B | 8.0 | % | |||
AMERICAN LAND LEASE INC. AND SUBSIDIARIES
KEY HOME SALES STATISTICS
| March 31, 2003 | June 30, 2003 | September 30, 2003 | December 31, 2003 | March 31, 2004 | June 30, 2004 | Qtr over Qtr Increase/ Decrease | Qtr over Qtr % Change | ||||||||||||||||||||||||
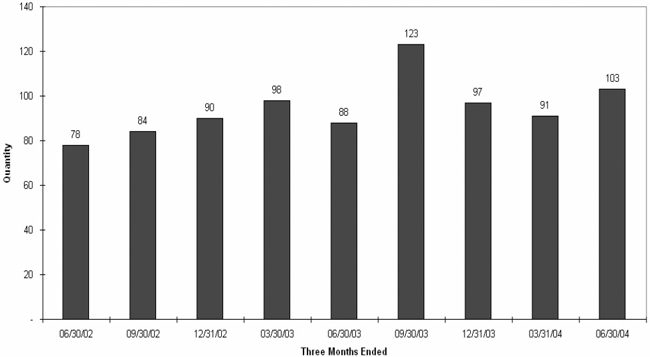
New home closings | 98 | 88 | 125 | 103 | 91 | 103 | 12 | 11.7 | % | ||||||||||||||||||||||
New home contracts | 171 | 105 | 86 | 76 | 168 | 144 | (24 | ) | -31.6 | % | |||||||||||||||||||||
Home resales | 14 | 11 | 9 | 7 | 12 | 5 | (7 | ) | -100.0 | % | |||||||||||||||||||||
Brokered home sales | 45 | 44 | 53 | 51 | 79 | 83 | 4 | 7.8 | % | ||||||||||||||||||||||
New home contract backlog | 145 | 165 | 102 | 89 | 164 | 189 | 25 | 28.1 | % | ||||||||||||||||||||||
Average Selling Price | $ | 79,000 | $ | 85,000 | $ | 96,000 | $ | 95,000 | $ | 100,000 | $ | 92,000 | $ | (8,000 | ) | -8.4 | % | ||||||||||||||
Average Gross Margin Percentage | 26.7 | % | 28.8 | % | 27.8 | % | 29.7 | % | 33.2 | % | 33.7 | % | |||||||||||||||||||
American Land Lease
Units Closed Trend by Quarter
AMERICAN LAND LEASE, INC. AND SUBSIDIARIES
DEVELOPMENT SUMMARY
Summary of 2004 Program
Community | Sites to be Developed | Projected Completion | ||
Savanna Club: | ||||
Phase 7 | 216 | Completed | ||
Phase 8 | 192 | 9/04 | ||
Riverside Club: | ||||
Phase 2 | 148 | 8/04 | ||
Phase 4 & 5 | 212 | 7/05 | ||
Phase 6 | 208 | 8/06 | ||
Royal Palm | 114 | 8/04 | ||
Blue Heron Pines: | 65 | 11/04 | ||
Brentwood | 48 | 8/04 | ||
Gulfstream | ||||
Phase 1 | 37 | 6/05 | ||
Phase 2 | 50 | 6/05 |
Outlook and Forward Looking Statement
2004
(unaudited)
The Outlook information provided on this Supplemental Schedule contains information that is forward-looking, including, statements concerning projected 2004 results. These forward-looking statements are based on current expectations, estimates, and projections about the markets and the industry in which American Land Lease operates as well as management’s beliefs and assumptions. These forward-looking statements are also based on certain risks and uncertainties, including but not limited to general economic and business conditions; interest rate changes; financing and refinancing risks; risks inherent in owning real estate or debt secured by real estate; future development rate of home sites; competition; the availability of real estate assets at prices which meet our investment criteria; our ability to reduce expense levels, implement rent increases, use leverage and other risks set forth in our SEC filings. Readers should carefully review American Land Lease’s Annual Report on Form 10-K for the year ended December 31, 2003 and the other documents American Land Lease files from time to time with the Securities and Exchange Commission.
Full Year 2004 Projected | ||
FFO | $1.40 to $1.60 | |
AFFO | $1.28 to $1.44 | |
Diluted EPS | $1.03 to $1.24 | |
Same Store Sales | ||
Revenue Growth | 5.0% to 9.0% | |
Expense Growth | 4.5% to 7.5% | |
NOI Growth | 6.0% to 9.5% | |
Home Sales Operating Income | $2,000,000 to $3,250,000 | |
General and Administrative Expenses | $3,200,000 to $3,700,000 | |
Other Income | $210,000 to $280,000 | |
Capital Replacements (per site) | $115 to $135 | |
Depreciation | $2,900,000 to $3,200,000 |