Table of Contents
Exhibit 99.1
American Land Lease Announces Fourth Quarter 2004 and Full Year Financial Results
– 3.5% Increase in Funds From Operations per share over 2003 –
CLEARWATER, Fla., February 14, 2005 /PRNewswire/ — American Land Lease, Inc. (NYSE:ANL -news) today released results for fourth quarter and full year 2004 and expectations for full year 2005.
Please refer to the Supplemental Information which the Company also released today for definitions of measures of performance not determined in accordance with generally accepted accounting principles (“non-GAAP”) and reconciliation of non-GAAP measures to measures determined in accordance with generally accepted accounting principles (“GAAP”).
Summary Financial Results
Fourth Quarter
| • | Diluted Earnings Per Share (“Diluted EPS”) were $0.35 for the three-month period ended December 31, 2004 as compared to $0.27 from the same period one year ago, an increase of 30% on a per share basis. Earnings per share were positively impacted by a $337,000 non-recurring casualty gain and negatively impacted by $210,000 of Hurricane related expenses. |
| • | Funds from Operations (“FFO”; a non-GAAP financial measure defined in the Supplemental Information) were $3.2 million, or $0.38 per diluted common share, for the quarter compared to $2.9 million, or $0.36 per diluted common share from the same period one year ago, an increase of 6% on a per share basis. |
| • | Unit volume in home sales was 121 new home closings, including 117 new homes sold on expansion home sites. This compares with 103 new home closings in fourth quarter 2003. |
| • | “Same Store” results provided a revenue increase of 9.2%, an expense increase of 8.7% and an increase of 9.4% in Net Operating Income (“NOI”). |
| • | “Same Site” results provided a revenue increase of 3.0%, an expense increase of 3.9% and an increase of 3.0% in NOI. |
| • | Results include an increased charge of $326,000 for Sarbanes Oxley compliance efforts compared to the fourth quarter 2003. |
2004 Year
| • | Diluted EPS were $1.19 for the year ended December 31, 2004 as compared to $1.24 for the year ended December 31, 2003, a decrease of 4% on a per share basis. Earnings per share were positively impacted by a $337,000 non-recurring casualty gain and negatively impacted by $221,000 of Hurricane related expenses. |
| • | FFO was $12.4 million, or $1.50 per diluted common share, for the year compared to $11.6 million, or $1.45 per diluted common share from the same period one year ago, an increase of 3.5% on a per share basis. |
1
Table of Contents
| • | Unit volume in home sales was 392 new home closings, including 373 new homes sold on expansion home sites, for 2004 as compared to 414 new home closings in 2003. |
| • | “Same Store” results provided a revenue increase of 9.8%, an expense increase of 6.7% and an increase of 11.3% in NOI. |
| • | “Same Site” results provided a revenue increase of 3.6%, an expense increase of 3.0% and an increase of 3.9% in NOI. |
| • | Physical occupancy at December 31, 2004 was 6,618 sites or 95.5%, as compared to 6,349 sites or 96.5% as of December 31, 2003. |
| • | Results include an increased charge of $512,000 for Sarbanes Oxley compliance efforts compared to 2003. |
Supplemental Information
The full text of this press release and Supplemental Information are available upon request or through the Company’s web site at www.americanlandlease.com.
Management Comments
Bob Blatz, President of American Land Lease, commented, “We are pleased to report strong results for the fourth quarter and full year of 2004. These results reflect continuing better than projected performance of our home sales division, and the resulting positive effect that absorption from home sales is having on our property operations. The strength and stability of our focus in the senior community sector have been demonstrated throughout this year as we have weathered three significant hurricanes.”
Mr. Blatz added, “2004 demonstrated the resiliency of our home sales business. Despite the low number of closings in third quarter we were able to end the year with a record number of closings for fourth quarter. Our fourth quarter new home price averaged $105,000 and our full year results reflect an average new home price of $101,000, a 12% increase in average new home price over the 2003’s average price of $90,000. As we look at 2005, we forecast continued success in our core property ownership business and continued improvement in our home sales/development business.”
Dividend Declaration
On January 25, 2005, the Board of Directors declared a regular fourth quarter dividend of $0.25 per share payable on February 28, 2005, to stockholders of record on February 14, 2005.
The Board of Directors reviews the dividend policy quarterly. The Company’s dividend is set quarterly and is subject to change or elimination at any time. The Company’s primary financial objective is to maximize long term, risk adjusted returns on investment for shareholders. While the dividend policy is considered within the context of this
2
Table of Contents
objective, maintenance of past dividend levels is not a primary investment objective of the Company and is subject to numerous factors including the Company’s profitability, capital expenditure plans, obligations related to principal payments and capitalized interest, and the availability of debt and equity capital at terms deemed attractive by the Company to finance these expenditures. The Company’s net operating loss may be used to offset all or a portion of its real estate investment trust (“REIT”) taxable income, which may allow the Company to reduce or eliminate its dividends and still maintain its REIT status.
Operational Results – Fourth Quarter
Fourth Quarter Property Operations
Fourth quarter revenue from property operations was $7,412,000 as compared to $6,824,000 in the same period one year ago, an 8.6% increase. Fourth quarter property operating expenses totaled $3,119,000 as compared to $2,682,000 in the same period one year ago, a 16.3% increase. The increase in property operating expenses in the fourth quarter of 2004 include $210,000 in casualty expense related to damage from hurricanes that impacted several properties. Additional recoveries from our insurance carriers will be a recovery of these expenses in the period in which the collection is probable. The Company realized significant increases in rental income driven by annual rental rate increases, the absorption of new home sites through its home sales efforts and the acquisition of one community during fourth quarter 2003. In addition to the increase in property operating expenses for the casualty loss, other property operating expenses increased in the fourth quarter 2004 as compared to the same period in the prior year that were driven primarily by increases in labor and benefit costs, the acquisition of one community during the fourth quarter 2003, tenant related legal costs and utility costs and waste water treatment, offset by decreases in natural gas costs as a result of lower consumption due to conversion of several pool heating systems to heat pumps. The property operating margins before depreciation expense decreased from 60.7% in the prior year’s fourth quarter to 57.9%, driven primarily by casualty expenses. Excluding the casualty loss, the combination of increased revenue and expenses resulted in an overall improvement in property operating margins before depreciation expense from 60.7% in the prior year’s fourth quarter to 60.8% in the fourth quarter 2004.
Fourth Quarter “Same Store” Results
Fourth quarter “same store” results reflect the results of operations for properties and golf courses owned for both the fourth quarter of 2004 and the prior year periods. The same store properties account for 95% of the property operating revenues for the fourth quarter of 2004. We believe that same store information provides the ability to understand the changes in profitability for properties owned during both reporting periods that could not be obtained from a review of the consolidated income statement in periods where properties are acquired. A reconciliation of “same store” operating results reported below to total property revenues and property expenses, as determined under GAAP, can be found in the Supplemental Information, page 29.
3
Table of Contents
The same store % change results are as follows:
| 4Q04 | |||
Revenue | 9.2 | % | |
Expense | 8.7 | % | |
Net Operating Income | 9.4 | % |
We derive our increase in property revenue (i) from increases in rental rates and other charges at our properties and (ii) through the origination of leases on expansion home sites (“absorption”). “Same site” results reflect the results of operations excluding those sites leased subsequent to the beginning of the prior year period. We believe that “same site” information provides the ability to understand the changes in profitability without the growth related to the newly leased sites. Our presentation of same site results is a non-GAAP measure and should not be considered in isolation from and is not intended to represent an alternative measure to operating income or cash flow or any other measure of performance as determined in accordance with GAAP.
We calculate absorption revenues as the rental revenue recognized on sites leased subsequent to the beginning of the prior year period. We estimate that 50% of the increase in expenses over the prior year period is attributable to newly leased sites in our calculation of same site results. We believe that the allocation of expenses between same site and absorption is an appropriate allocation between fixed and variable costs of operating our properties.
Our same site, absorption, golf operations and total same store results for fourth quarter are as follows:
| Same Site Rental | Absorption | Same Site Golf | Same Store | |||||||||
Revenue | 3.0 | % | 5.7 | % | 0.5 | % | 9.2 | % | ||||
Expense | 3.9 | % | 3.9 | % | 1.0 | % | 8.7 | % | ||||
NOI | 3.0 | % | 6.6 | % | (0.2 | )% | 9.4 | % |
A reconciliation of same site and same store operating results used in the above calculations to total property revenues and property expenses, as determined under GAAP, for the three months ended December 31, 2004 and 2003 can be found in the Supplemental Information, page 29.
Fourth Quarter Home Sales Operations
Fourth quarter 2004 new home sales volume was 121 closings, a 17.5% increase from the 103 closings in the same period in the prior year. Average selling price per home was $105,000 as compared to $95,000 in the same period in the prior year, a 10.5% increase. The increase in closings compared to the same period in the prior year was balanced across the Company’s expansion communities, with increases in eight
4
Table of Contents
communities, level sales in two communities and decreases in three communities. Brokerage profits were down 19% as compared with the same period in the prior year. Selling gross margins, excluding brokerage activities, improved to 32.7% in the quarter as compared to 29.7% in the same period in the prior year. This increase was driven by increased selling prices, increased manufacturer rebates associated with higher purchasing volumes, and the sale of higher margin finishes and features. These increases in revenue and cost savings were offset by increases in cost of homes purchased. Selling costs as a percentage of sales revenue decreased from 21.8% in the prior year’s period to 20.2% in the fourth quarter of 2004, reflecting additional investments in personnel and advertising in support of a higher operating level for the business. The backlog of contracts for closing stood at 88 home sales, a decrease of 1 contract from the same period in the prior year.
The Company remains committed to its program of generating continued revenue growth through new lease originations in its existing portfolio. The home sales business continues to provide the Company with additional earning home sites that have a greater return on investment than is currently available through the purchase of occupied communities.
Summary of home sales activity:
Quarter ended December 31, 2004 | Quarter ended December 31, 2003 | |||
New home closings | 121 | 103 | ||
New home contracts | 65 | 76 | ||
Home resales | 3 | 7 | ||
Brokered home sales | 55 | 51 | ||
New home contract backlog | 88 | 89 |
Operational Results – 2004 Year
2004 Property Operations
2004 revenue from property operations was $29,221,000 as compared to $26,416,000 in 2003, a 10.6% increase. 2004 property operating expenses totaled $11,410,000 as compared to $10,440,000 in 2003, a 9.3% increase. The increase in property operating expenses in 2004 includes $221,000 in casualty expense related to damage from hurricanes that impacted several properties. Additional recoveries from our insurance carriers will be a recovery of these expenses in the period in which the collection is probable. The Company realized significant increases in rental income driven by annual rental rate increases, the absorption of new home sites through its home sales efforts and the acquisition of one community during fourth quarter 2004. Property operating expenses increased in 2004 as compared to 2003 driven primarily by increases in labor and benefit costs, property tax expense, utility costs including water and waste water treatment, and tenant legal costs, offset by decreases in property management overhead. The property operating margins before depreciation expense increased from 60.5% in the
5
Table of Contents
prior year to 61.0% in 2004. Excluding the impact of hurricane casualty expenses, the combination of increased revenue and expenses resulted in an overall improvement in property operating margins before depreciation expense from 60.5% in the prior year to 61.7% in 2004.
2004 “Same Store” Results
2004 “same store” results reflect the results of operations for properties and golf courses owned for both 2004 and 2003. The same store properties account for 95% of the property operating revenues for 2004. We believe that same store information provides the ability to understand the changes in profitability for properties owned during both reporting periods that could not be obtained from a review of the consolidated income statement in periods where properties are acquired. A reconciliation of “same store” operating results reported below to total property revenues and property expenses, as determined under GAAP, can be found in the Supplemental Information, page 30.
The same store % change results are as follows:
| 2004 | |||
Revenue | 9.8 | % | |
Expense | 6.7 | % | |
Net Operating Income | 11.3 | % |
We derive our increase in property revenue (i) from increases in rental rates and other charges at our properties and (ii) through the origination of leases on expansion home sites (“absorption”). We believe that “same site” information provides the ability to understand the changes in profitability related to the newly leased sites. “Same site” results reflect the results of operations excluding those sites leased subsequent to the beginning of the prior year period. Our presentation of same site results is a non-GAAP measure and should not be considered in isolation from and is not intended to represent an alternative measure to operating income or cash flow or any other measure of performance as determined in accordance with GAAP.
We calculate absorption revenues as the rental revenue recognized on sites leased subsequent to the beginning of the prior year. We estimate that 50% of the increase in expenses over the prior year is attributable to newly leased sites in our calculation of same site results. We believe that the allocation of expenses between same site and absorption is an appropriate allocation between fixed and variable costs of operating our properties.
6
Table of Contents
Our same site, absorption, golf operations and total same store results for 2004 are as follows:
| Same Site Rental | Absorption | Same Site Golf | Same Store | |||||||||
Revenue | 3.6 | % | 5.8 | % | 0.4 | % | 9.8 | % | ||||
Expense | 3.0 | % | 3.7 | % | 0.0 | % | 6.7 | % | ||||
NOI | 3.9 | % | 6.9 | % | 0.5 | % | 11.3 | % |
A reconciliation of same site and same store operating results used in the above calculations to total property revenues and property expenses, as determined under GAAP, for the years ended December 31, 2004 and 2003 can be found in Supplemental Information, page 30.
2004 Home Sales Operations
2004 new home sales volume was 392 closings, a 5% decrease from the 414 closings in the prior year. Average selling price per home in 2004 was $101,000 as compared to $90,000 in the prior year, a 12% increase. The decrease in closings compared to the prior year was balanced across the Company’s expansion communities, with increases in six communities and decreases in seven communities. Brokerage profits were up 12% as compared with the prior year’s results. Selling gross margins, excluding brokerage activities, improved to 32.6% for 2004 as compared to 28.3% for 2003. This increase was driven by increased selling prices, increased manufacturer rebates associated with higher purchasing volumes, the initial impact of cost savings efforts in home construction and the sale of higher margin finishes and features. These increases in revenue and cost savings were offset by increases in cost of homes purchased. Selling costs as a percentage of sales revenue increased from 20.2% in the prior year to 23.9% in 2004, reflecting additional marketing costs for new subdivisions in advance of sales. The backlog of contracts for closing stood at 88 home sales, a decrease of 1 contract from the same period in the prior year.
The Company remains committed to its program of generating continued revenue growth through new lease originations in its existing portfolio. The home sales business continues to provide the Company with additional earning home sites that have a greater return on investment than is currently available through the purchase of occupied communities.
Summary of home sales activity:
Year ended December 31, 2004 | Year ended December 31, 2003 | |||
New home closings | 392 | 414 | ||
Home resales | 23 | 41 | ||
Brokered home sales | 265 | 193 | ||
New home contract backlog | 88 | 89 |
7
Table of Contents
Outlook for 2005
The table below summarizes the Company’s projected financial outlook for 2005 as of the date of this release and is based on the estimates and assumptions disclosed in this and previous press releases:
| Full Year 2005 Projected | ||
FFO | $1.45 to $1.75 | |
AFFO | $1.32 to $1.61 | |
Diluted EPS | $1.06 to $1.35 | |
Same Store Sales | ||
Revenue Growth | 5.0% to 9.0% | |
Expense Growth | 5.5% to 8.0% | |
NOI Growth | 6.0% to 9.5% | |
Home Sales Operating Income | $2,800,000 to $6,000,000 | |
General and Administrative Expenses | $4,000,000 to $5,000,000 | |
Other Income | $50,000 to $150,000 | |
Capital Replacements (per site) | $125 to $145 | |
Depreciation | $3,200,000 to $3,700,000 |
A portion of the Company’s earnings is from the sale of new homes on expansion home sites in its developing communities. The earnings from the new home sales are subject to greater volatility than the earnings from rental property activities. The Company’s earnings estimates would be impacted positively by increases in the unit volume of new home sales or increases in the gross margins from new home sales. Conversely, decreases in the unit volume of new home sales or decreases in the gross margins from new home sales would negatively impact the Company’s earnings estimates. Home sales volume is dependent upon a number of factors, including consumer confidence and consumer access to financing sources for home purchases and the sale of their current home.
The Company’s projected results for 2005 include a reduction in corporate governance costs based upon current estimates of the cost of compliance. Non-employee director compensation continues to be paid in stock and all stock based compensation is expensed within the 2005 projections. In addition, the projected results include the expense for performance based restricted stock. The Company’s earnings estimates would be adversely impacted by the increased cost of compliance with regulations and laws applicable to public companies and financial reporting.
8
Table of Contents
The financial and operating projections provided in this release are the result of management’s consideration of past operating performance, current and anticipated market conditions and other factors that management considers relevant from its past experience. However, no assurance can be provided as to the achievement of these projections and actual results will vary, perhaps materially.
Land Acquisition
As previously announced, on February 4, 2005 the Company acquired a 260-acre tract of land in Micco, Florida, south of Melbourne, Florida for an aggregate price of $15.5 million.
The land will be used to develop a new senior community for the company –Savanna Club North at Crystal Bay.Savanna Club North at Crystal Baywill be a 533 home site community incorporating the high value homes and the country club style living that are characteristic of the company’s Savanna Club and Riverside Club communities. Situated across US-1 from the inter-coastal waterway leading to the Atlantic Ocean, the purchase includes frontage on US-1 for a new home information and sales center and a small tract of land on the inter-coastal that will be used by the community’s residents for access to boating and other water activities.
The company intends to use its current sales and community development team from the successful Savanna Club Community to expand its sales activities into this new community as sales activities at Savanna Club close down in 2006. Construction will begin in second quarter on infrastructure, site development and new home sales are projected for 2007.
Casualty Event
Several of the Company’s properties were impacted by the hurricanes that challenged the state of Florida during the 2004 season. During the fourth quarter, the Company recognized $210,000 in expense associated with these storms. In addition, the Company recognized a gain of $337,000 from the amount by which insurance proceeds exceeded the net book value of assets destroyed in the storms. While the Company expects to recover additional amounts from its insurance carriers, it will recognize these additional amounts as additional gain or a recovery of expense in the period the collection becomes probable.
Financing Activity
During fourth quarter 2004, the Company renewed and extended its corporate line of credit, which now matures December 31, 2006.
9
Table of Contents
The Company modified its floor plan facility used to finance the Company’s inventory of homes. The credit facility was increased to $20 million and the advances were modified to include amounts above the invoice cost from the manufacturer to fund construction costs.
Development Activity
The Company completed development of several new subdivisions during the quarter.
| • | at Savanna Club, “Eagles Retreat,” that provides an additional 216 developed home sites available for immediate occupancy |
| • | at Riverside Club, “the Fairways,” that provides 148 developed home sites available for immediate occupancy |
| • | at Royal Palm, an additional 114 developed home sites available for immediate occupancy |
| • | at Brentwood, an additional 48 developed home sites available for immediate occupancy |
Construction commenced at the Company’s Blue Heron community on a new subdivision of 65 home sites. Construction continued on the last phase of the Company’s Savanna Club project that will provide an additional 192 home sites. Planning and permitting for subdivisions at two additional communities continued during the quarter.
American Land Lease, Inc. is a REIT that holds interests in 28 manufactured home communities with 6,931 operational home sites, 1,101 developed expansion sites, 958 undeveloped expansion sites and 129 recreational vehicle sites as of December 31, 2004.
Some of the statements in this press release, as well as oral statements made by the Company’s officials to analysts and stockholders in the course of presentations about the Company and conference calls following quarterly earnings releases, constitute “forward looking statements” within the meaning of the Private Securities Litigation Reform Act of 1995. Such statements may include projections of the Company’s cash flow, dividends and anticipated returns on real estate investments. Such forward-looking statements involve known and unknown risks, uncertainties and other factors that may cause actual results, performance or achievements of the Company to be materially different from any future results, performance or achievements expressed or implied by the forward-looking statements. Such factors include, but not limited to: general economic and business conditions; interest rate changes, financing and refinancing risks; risks inherent in owning real estate; future development rate of home sites; competition; the availability of real estate assets at prices which meet the Company’s investment criteria; the Company’s ability to reduce expense levels, implement rent increases, use leverage and other risks set forth in the Company’s Securities and Exchange Commission filings. We assume no obligation to update or revise any forward-looking statements or to update the reasons why actual results could differ from those projected in any forward-looking statements.
10
Table of Contents
Management will hold a teleconference call, Monday, February 14, 2005 at 4:00 p.m. Eastern Standard Time to discuss fourth quarter 2004 results. You can participate in the conference call by dialing, toll-free, (800) 374-5458 approximately five minutes before the conference call is scheduled to begin and indicating that you wish to join the American Land Lease fourth quarter 2004 results conference call. If you are unable to participate at the scheduled time, this information will be available for recorded playback from 5:30 p.m. EST, February 14, 2005 until midnight on February 21, 2005. To access the replay, dial toll free, (800) 642-1687 and request information from conference ID 3720446.
| Contact: | Robert G. Blatz, President (727) 726-8868 | |
| Shannon E. Smith, Chief Financial Officer (727) 726-8868 |
SOURCE: American Land Lease, Inc.
11
Table of Contents
Table of Contents
SUPPLEMENTAL INFORMATION
FOR THE QUARTER ENDED DECEMBER 31, 2004
| Page | ||
Press Release | 2 | |
| 12 | ||
| 14 | ||
Financial Statements | ||
| 23 | ||
| 24 | ||
| 25 | ||
| 26 | ||
| 27 | ||
| 28 | ||
Selected Financial Information | ||
| 29 | ||
| 30 | ||
| 31 | ||
| 32 | ||
| 33 | ||
| 34 | ||
| 35 | ||
Other Information | ||
| 36 | ||
| 37 | ||
1
Table of Contents
American Land Lease Announces Fourth Quarter 2004 and Full Year Financial Results
– 3.5% Increase in Funds From Operations per share over 2003 –
CLEARWATER, Fla., February 14th, 2005 /PRNewswire/ — American Land Lease, Inc. (NYSE:ANL -news) today released results for fourth quarter and full year 2004 and expectations for full year 2005.
Please refer to the Supplemental Information which the Company also released today for definitions of measures of performance not determined in accordance with generally accepted accounting principles (“non-GAAP”) and reconciliation of non-GAAP measures to measures determined in accordance with generally accepted accounting principles (“GAAP”).
Summary Financial Results
Fourth Quarter
| • | Diluted Earnings Per Share (“Diluted EPS”) were $0.35 for the three-month period ended December 31, 2004 as compared to $0.27 from the same period one year ago, an increase of 30% on a per share basis. Earnings per share were positively impacted by a $337,000 non-recurring casualty gain and negatively impacted by $210,000 of Hurricane related expenses. |
| • | Funds from Operations (“FFO”; a non-GAAP financial measure defined in the Supplemental Information) were $3.2 million, or $0.38 per diluted common share, for the quarter compared to $2.9 million, or $0.36 per diluted common share from the same period one year ago, an increase of 6% on a per share basis. |
| • | Unit volume in home sales was 121 new home closings, including 117 new homes sold on expansion home sites. This compares with 103 new home closings in fourth quarter 2003. |
| • | “Same Store” results provided a revenue increase of 9.2%, an expense increase of 8.7% and an increase of 9.4% in Net Operating Income (“NOI”). |
| • | “Same Site” results provided a revenue increase of 3.0%, an expense increase of 3.9% and an increase of 3.0% in NOI. |
| • | Results include an increased charge of $326,000 for Sarbanes Oxley compliance efforts compared to the fourth quarter 2003. |
2004 Year
| • | Diluted EPS were $1.19 for the year ended December 31, 2004 as compared to $1.24 for the year ended December 31, 2003, a decrease of 4% on a per share basis. Earnings per share were positively impacted by a $337,000 non-recurring casualty gain and negatively impacted by $221,000 of Hurricane related expenses. |
| • | FFO was $12.4 million, or $1.50 per diluted common share, for the year compared to $11.6 million, or $1.45 per diluted common share from the same period one year ago, an increase of 3.5% on a per share basis. |
| • | Unit volume in home sales was 392 new home closings, including 373 new homes sold on expansion home sites, for 2004 as compared to 414 new home closings in 2003. |
2
Table of Contents
| • | “Same Store” results provided a revenue increase of 9.8%, an expense increase of 6.7% and an increase of 11.3% in NOI. |
| • | “Same Site” results provided a revenue increase of 3.6%, an expense increase of 3.0% and an increase of 3.9% in NOI. |
| • | Physical occupancy at December 31, 2004 was 6,618 sites or 95.5%, as compared to 6,349 sites or 96.5% as of December 31, 2003. |
| • | Results include an increased charge of $512,000 for Sarbanes Oxley compliance efforts compared to 2003. |
Supplemental Information
The full text of this press release and Supplemental Information are available upon request or through the Company’s web site at www.americanlandlease.com.
Management Comments
Bob Blatz, President of American Land Lease, commented, “We are pleased to report strong results for the fourth quarter and full year of 2004. These results reflect continuing better than projected performance of our home sales division, and the resulting positive effect that absorption from home sales is having on our property operations. The strength and stability of our focus in the senior community sector have been demonstrated throughout this year as we have weathered three significant hurricanes.”
Mr. Blatz added, “2004 demonstrated the resiliency of our home sales business. Despite the low number of closings in third quarter we were able to end the year with a record number of closings for fourth quarter. Our fourth quarter new home price averaged $105,000 and our full year results reflect an average new home price of $101,000, a 12% increase in average new home price over the 2003’s average price of $90,000. As we look at 2005, we forecast continued success in our core property ownership business and continued improvement in our home sales/development business.”
Dividend Declaration
On January 25, 2005, the Board of Directors declared a regular fourth quarter dividend of $0.25 per share payable on February 28, 2005, to stockholders of record on February 14, 2005.
The Board of Directors reviews the dividend policy quarterly. The Company’s dividend is set quarterly and is subject to change or elimination at any time. The Company’s primary financial objective is to maximize long term, risk adjusted returns on investment for shareholders. While the dividend policy is considered within the context of this objective, maintenance of past dividend levels is not a primary investment objective of the Company and is subject to numerous factors including the Company’s profitability, capital expenditure plans, obligations related to principal payments and capitalized interest, and the availability of debt and equity capital at terms deemed attractive by the Company to finance these expenditures. The Company’s net operating loss may be used to offset all or a portion of its real estate investment trust (“REIT”) taxable income, which may allow the Company to reduce or eliminate its dividends and still maintain its REIT status.
3
Table of Contents
Operational Results – Fourth Quarter
Fourth Quarter Property Operations
Fourth quarter revenue from property operations was $7,412,000 as compared to $6,824,000 in the same period one year ago, an 8.6% increase. Fourth quarter property operating expenses totaled $3,119,000 as compared to $2,682,000 in the same period one year ago, a 16.3% increase. The increase in property operating expenses in the fourth quarter of 2004 include $210,000 in casualty expense related to damage from hurricanes that impacted several properties. Additional recoveries from our insurance carriers will be a recovery of these expenses in the period in which the collection is probable. The Company realized significant increases in rental income driven by annual rental rate increases, the absorption of new home sites through its home sales efforts and the acquisition of one community during fourth quarter 2003. In addition to the increase in property operating expenses for the casualty loss, other property operating expenses increased in the fourth quarter 2004 as compared to the same period in the prior year that were driven primarily by increases in labor and benefit costs, the acquisition of one community during the fourth quarter 2003, tenant related legal costs and utility costs and waste water treatment, offset by decreases in natural gas costs as a result of lower consumption due to conversion of several pool heating systems to heat pumps. The property operating margins before depreciation expense decreased from 60.7% in the prior year’s fourth quarter to 57.9%, driven primarily by casualty expenses. Excluding the casualty loss, the combination of increased revenue and expenses resulted in an overall improvement in property operating margins before depreciation expense from 60.7% in the prior year’s fourth quarter to 60.8% in the fourth quarter 2004.
Fourth Quarter “Same Store” Results
Fourth quarter “same store” results reflect the results of operations for properties and golf courses owned for both the fourth quarter of 2004 and the prior year periods. The same store properties account for 95% of the property operating revenues for the fourth quarter of 2004. We believe that same store information provides the ability to understand the changes in profitability for properties owned during both reporting periods that could not be obtained from a review of the consolidated income statement in periods where properties are acquired. A reconciliation of “same store” operating results reported below to total property revenues and property expenses, as determined under GAAP, can be found in the Supplemental Information, page 29.
The same store % change results are as follows:
| 4Q04 | |||
Revenue | 9.2 | % | |
Expense | 8.7 | % | |
Net Operating Income | 9.4 | % |
We derive our increase in property revenue (i) from increases in rental rates and other charges at our properties and (ii) through the origination of leases on expansion home sites (“absorption”). “Same site” results reflect the results of operations excluding those sites leased subsequent to the beginning of the prior year period. We believe that “same site”
4
Table of Contents
information provides the ability to understand the changes in profitability without the growth related to the newly leased sites. Our presentation of same site results is a non-GAAP measure and should not be considered in isolation from and is not intended to represent an alternative measure to operating income or cash flow or any other measure of performance as determined in accordance with GAAP.
We calculate absorption revenues as the rental revenue recognized on sites leased subsequent to the beginning of the prior year period. We estimate that 50% of the increase in expenses over the prior year period is attributable to newly leased sites in our calculation of same site results. We believe that the allocation of expenses between same site and absorption is an appropriate allocation between fixed and variable costs of operating our properties.
Our same site, absorption, golf operations and total same store results for fourth quarter are as follows:
| Same Site Rental | Absorption | Same Site Golf | Same Store | |||||||||
Revenue | 3.0 | % | 5.7 | % | 0.5 | % | 9.2 | % | ||||
Expense | 3.9 | % | 3.9 | % | 1.0 | % | 8.7 | % | ||||
NOI | 3.0 | % | 6.6 | % | (0.2 | )% | 9.4 | % |
A reconciliation of same site and same store operating results used in the above calculations to total property revenues and property expenses, as determined under GAAP, for the three months ended December 31, 2004 and 2003 can be found in the Supplemental Information, page 29.
Fourth Quarter Home Sales Operations
Fourth quarter 2004 new home sales volume was 121 closings, a 17.5% increase from the 103 closings in the same period in the prior year. Average selling price per home was $105,000 as compared to $95,000 in the same period in the prior year, a 10.5% increase. The increase in closings compared to the same period in the prior year was balanced across the Company’s expansion communities, with increases in eight communities, level sales in two communities and decreases in three communities. Brokerage profits were down 19% as compared with the same period in the prior year. Selling gross margins, excluding brokerage activities, improved to 32.7% in the quarter as compared to 29.7% in the same period in the prior year. This increase was driven by increased selling prices, increased manufacturer rebates associated with higher purchasing volumes, and the sale of higher margin finishes and features. These increases in revenue and cost savings were offset by increases in cost of homes purchased. Selling costs as a percentage of sales revenue decreased from 21.8% in the prior year’s period to 20.2% in the fourth quarter of 2004, reflecting additional investments in personnel and advertising in support of a higher operating level for the business. The backlog of contracts for closing stood at 88 home sales, a decrease of 1 contract from the same period in the prior year.
The Company remains committed to its program of generating continued revenue growth through new lease originations in its existing portfolio. The home sales business continues to provide the Company with additional earning home sites that have a greater return on investment than is currently available through the purchase of occupied communities.
5
Table of Contents
Summary of home sales activity:
Quarter ended December 31, 2004 | Quarter ended December 31, 2003 | |||
New home closings | 121 | 103 | ||
New home contracts | 65 | 76 | ||
Home resales | 3 | 7 | ||
Brokered home sales | 55 | 51 | ||
New home contract backlog | 88 | 89 |
Operational Results – 2004 Year
2004 Property Operations
2004 revenue from property operations was $29,221,000 as compared to $26,416,000 in 2003, a 10.6% increase. 2004 property operating expenses totaled $11,410,000 as compared to $10,440,000 in 2003, a 9.3% increase. The increase in property operating expenses in 2004 includes $221,000 in casualty expense related to damage from hurricanes that impacted several properties. Additional recoveries from our insurance carriers will be a recovery of these expenses in the period in which the collection is probable. The Company realized significant increases in rental income driven by annual rental rate increases, the absorption of new home sites through its home sales efforts and the acquisition of one community during fourth quarter 2004. Property operating expenses increased in 2004 as compared to 2003 driven primarily by increases in labor and benefit costs, property tax expense, utility costs including water and waste water treatment, and tenant legal costs, offset by decreases in property management overhead. The property operating margins before depreciation expense increased from 60.5% in the prior year to 61.0% in 2004. Excluding the impact of hurricane casualty expenses, the combination of increased revenue and expenses resulted in an overall improvement in property operating margins before depreciation expense from 60.5% in the prior year to 61.7% in 2004.
2004 “Same Store” Results
2004 “same store” results reflect the results of operations for properties and golf courses owned for both 2004 and 2003. The same store properties account for 95% of the property operating revenues for 2004. We believe that same store information provides the ability to understand the changes in profitability for properties owned during both reporting periods that could not be obtained from a review of the consolidated income statement in periods where properties are acquired. A reconciliation of “same store” operating results reported below to total property revenues and property expenses, as determined under GAAP, can be found in the Supplemental Information, page 30.
6
Table of Contents
The same store % change results are as follows:
| 2004 | |||
Revenue | 9.8 | % | |
Expense | 6.7 | % | |
Net Operating Income | 11.3 | % |
We derive our increase in property revenue (i) from increases in rental rates and other charges at our properties and (ii) through the origination of leases on expansion home sites (“absorption”). We believe that “same site” information provides the ability to understand the changes in profitability related to the newly leased sites. “Same site” results reflect the results of operations excluding those sites leased subsequent to the beginning of the prior year period. Our presentation of same site results is a non-GAAP measure and should not be considered in isolation from and is not intended to represent an alternative measure to operating income or cash flow or any other measure of performance as determined in accordance with GAAP.
We calculate absorption revenues as the rental revenue recognized on sites leased subsequent to the beginning of the prior year. We estimate that 50% of the increase in expenses over the prior year is attributable to newly leased sites in our calculation of same site results. We believe that the allocation of expenses between same site and absorption is an appropriate allocation between fixed and variable costs of operating our properties.
Our same site, absorption, golf operations and total same store results for 2004 are as follows:
| Same Site Rental | Absorption | Same Site Golf | Same Store | |||||||||
Revenue | 3.6 | % | 5.8 | % | 0.4 | % | 9.8 | % | ||||
Expense | 3.0 | % | 3.7 | % | 0.0 | % | 6.7 | % | ||||
NOI | 3.9 | % | 6.9 | % | 0.5 | % | 11.3 | % |
A reconciliation of same site and same store operating results used in the above calculations to total property revenues and property expenses, as determined under GAAP, for the years ended December 31, 2004 and 2003 can be found in Supplemental Information, page 30.
2004 Home Sales Operations
2004 new home sales volume was 392 closings, a 5% decrease from the 414 closings in the prior year. Average selling price per home in 2004 was $101,000 as compared to $90,000 in the prior year, a 12% increase. The decrease in closings compared to the prior year was balanced across the Company’s expansion communities, with increases in six communities and decreases in seven communities. Brokerage profits were up 12% as compared with the prior year’s results. Selling gross margins, excluding brokerage activities, improved to 32.6% for 2004 as compared to 28.3% for 2003. This increase was driven by increased selling prices, increased manufacturer rebates associated with higher purchasing volumes, the initial impact of cost savings efforts in home construction and the sale of higher margin finishes and features. These increases in revenue and cost savings were offset by increases in cost of homes purchased. Selling costs as a percentage of sales revenue increased from 20.2% in the prior year to 23.9% in 2004, reflecting additional marketing costs for new subdivisions in advance of sales. The backlog of contracts for closing stood at 88 home sales, a decrease of 1 contract from the same period in the prior year.
7
Table of Contents
The Company remains committed to its program of generating continued revenue growth through new lease originations in its existing portfolio. The home sales business continues to provide the Company with additional earning home sites that have a greater return on investment than is currently available through the purchase of occupied communities.
Summary of home sales activity:
Year ended December 31, 2004 | Year ended December 31, 2003 | |||
New home closings | 392 | 414 | ||
Home resales | 23 | 41 | ||
Brokered home sales | 265 | 193 | ||
New home contract backlog | 88 | 89 |
Outlook for 2005
The table below summarizes the Company’s projected financial outlook for 2005 as of the date of this release and is based on the estimates and assumptions disclosed in this and previous press releases:
Full Year 2005 Projected | ||
FFO | $1.45 to $1.75 | |
AFFO | $1.32 to $1.61 | |
Diluted EPS | $1.06 to $1.35 | |
Same Store Sales | ||
Revenue Growth | 5.0% to 9.0% | |
Expense Growth | 5.5% to 8.0% | |
NOI Growth | 6.0% to 9.5% | |
Home Sales Operating Income | $2,800,000 to $6,000,000 | |
General and Administrative Expenses | $4,000,000 to $5,000,000 | |
Other Income | $50,000 to $150,000 | |
Capital Replacements (per site) | $125 to $145 | |
Depreciation | $3,200,000 to $3,700,000 |
A portion of the Company’s earnings is from the sale of new homes on expansion home sites in its developing communities. The earnings from the new home sales are subject to greater
8
Table of Contents
volatility than the earnings from rental property activities. The Company’s earnings estimates would be impacted positively by increases in the unit volume of new home sales or increases in the gross margins from new home sales. Conversely, decreases in the unit volume of new home sales or decreases in the gross margins from new home sales would negatively impact the Company’s earnings estimates. Home sales volume is dependent upon a number of factors, including consumer confidence and consumer access to financing sources for home purchases and the sale of their current home.
The Company’s projected results for 2005 include a reduction in corporate governance costs based upon current estimates of the cost of compliance. Non-employee director compensation continues to be paid in stock and all stock based compensation is expensed within the 2005 projections. In addition, the projected results include the expense for performance based restricted stock. The Company’s earnings estimates would be adversely impacted by the increased cost of compliance with regulations and laws applicable to public companies and financial reporting.
The financial and operating projections provided in this release are the result of management’s consideration of past operating performance, current and anticipated market conditions and other factors that management considers relevant from its past experience. However, no assurance can be provided as to the achievement of these projections and actual results will vary, perhaps materially.
Land Acquisition
As previously announced, on February 4, 2005 the Company acquired a 260-acre tract of land in Micco, Florida, south of Melbourne, Florida for an aggregate price of $15.5 million.
The land will be used to develop a new senior community for the company –Savanna Club North at Crystal Bay.Savanna Club North at Crystal Baywill be a 533 home site community incorporating the high value homes and the country club style living that are characteristic of the company’s Savanna Club and Riverside Club communities. Situated across US-1 from the inter-coastal waterway leading to the Atlantic Ocean, the purchase includes frontage on US-1 for a new home information and sales center and a small tract of land on the inter-coastal that will be used by the community’s residents for access to boating and other water activities.
The company intends to use its current sales and community development team from the successful Savanna Club Community to expand its sales activities into this new community as sales activities at Savanna Club close down in 2006. Construction will begin in second quarter on infrastructure, site development and new home sales are projected for 2007.
Casualty Event
Several of the Company’s properties were impacted by the hurricanes that challenged the state of Florida during the 2004 season. During the fourth quarter, the Company recognized $210,000 in expense associated with these storms. In addition, the Company recognized a gain of $337,000 from the amount by which insurance proceeds exceeded the net book value of
9
Table of Contents
assets destroyed in the storms. While the Company expects to recover additional amounts from its insurance carriers, it will recognize these additional amounts as additional gain or a recovery of expense in the period the collection becomes probable.
Financing Activity
During fourth quarter 2004, the Company renewed and extended its corporate line of credit, which now matures December 31, 2006.
The Company modified its floor plan facility used to finance the Company’s inventory of homes. The credit facility was increased to $20 million and the advances were modified to include amounts above the invoice cost from the manufacturer to fund construction costs.
Development Activity
The Company completed development of several new subdivisions during the quarter.
| • | at Savanna Club, “Eagles Retreat,” that provides an additional 216 developed home sites available for immediate occupancy |
| • | at Riverside Club, “the Fairways,” that provides 148 developed home sites available for immediate occupancy |
| • | at Royal Palm, an additional 114 developed home sites available for immediate occupancy |
| • | at Brentwood, an additional 48 developed home sites available for immediate occupancy |
Construction commenced at the Company’s Blue Heron community on a new subdivision of 65 home sites. Construction continued on the last phase of the Company’s Savanna Club project that will provide an additional 192 home sites. Planning and permitting for subdivisions at two additional communities continued during the quarter.
American Land Lease, Inc. is a REIT that holds interests in 28 manufactured home communities with 6,931 operational home sites, 1,101 developed expansion sites, 958 undeveloped expansion sites and 129 recreational vehicle sites as of December 31, 2004.
Some of the statements in this press release, as well as oral statements made by the Company’s officials to analysts and stockholders in the course of presentations about the Company and conference calls following quarterly earnings releases, constitute “forward looking statements” within the meaning of the Private Securities Litigation Reform Act of 1995. Such statements may include projections of the Company’s cash flow, dividends and anticipated returns on real estate investments. Such forward-looking statements involve known and unknown risks, uncertainties and other factors that may cause actual results, performance or achievements of the Company to be materially different from any future results, performance or achievements expressed or implied by the forward-looking statements. Such factors include, but not limited to: general economic and business conditions; interest rate changes, financing and refinancing risks; risks inherent in owning real estate; future development rate of home sites; competition; the availability of real estate assets at prices which meet the Company’s investment criteria; the
10
Table of Contents
Company’s ability to reduce expense levels, implement rent increases, use leverage and other risks set forth in the Company’s Securities and Exchange Commission filings. We assume no obligation to update or revise any forward-looking statements or to update the reasons why actual results could differ from those projected in any forward-looking statements.
Management will hold a teleconference call, Monday, February 14, 2005 at 4:00 p.m. Eastern Standard Time to discuss fourth quarter 2004 results. You can participate in the conference call by dialing, toll-free, (800) 374-5458 approximately five minutes before the conference call is scheduled to begin and indicating that you wish to join the American Land Lease fourth quarter 2004 results conference call. If you are unable to participate at the scheduled time, this information will be available for recorded playback from 5:30 p.m. EST, February 14, 2005 until midnight on February 21, 2005. To access the replay, dial toll free, (800) 642-1687 and request information from conference ID 3720446.
| Contact: | Robert G. Blatz, President (727) 726-8868 | |
| Shannon E. Smith, Chief Financial Officer (727) 726-8868 |
SOURCE: American Land Lease, Inc.
11
Table of Contents
GLOSSARY OF NON-GAAP FINANCIAL AND OPERATING MEASUREMENTS Financial and operational measurements found in the Earnings Release and Supplemental Information include certain non-GAAP financial measurements standardly used by American Land Lease management. Measurements include Funds from Operations (“FFO”), which is an industry-accepted measurement as based on the definition of the National Association of Real Estate Investment Trusts (NAREIT). These terms are defined below and, where appropriate, reconciled to the most comparable Generally Accepted Accounting Principles (GAAP) measurements on the accompanying supplement schedules.
FUNDS FROM OPERATIONS (“FFO”): is a commonly used term defined by NAREIT as net income (loss), computed in accordance with GAAP, excluding gains and losses from extraordinary items, dispositions of depreciable real estate property, disposals of discontinued operations, net of related income taxes, plus real estate related depreciation and amortization (excluding amortization of financing costs), including depreciation for unconsolidated real estate partnerships, joint ventures and discontinued operations. American Land Lease calculates FFO based on the NAREIT definition, as further adjusted for the minority interest in the American Land Leases’s operating partnership (Asset Investors Operating Partnership). This supplemental measure captures real estate performance by recognizing that real estate generally appreciates over time or maintains residual value to a much greater extent than do other depreciable assets such as machinery, computers or other personal property. There can be no assurance that American Land Lease’s method for computing FFO is comparable with that of other real estate investments trusts.
ADJUSTED FUNDS FROM OPERATIONS (“AFFO”): is FFO less both Capital Replacement expenditures and Capital Enhancement expenditures. Similar to FFO, AFFO captures real estate performance by recognizing that real estate generally appreciates over time or maintains residual value to a much greater extent than do other depreciating assets such as machinery, computers or other personal property, and AFFO also reflects that Capital Replacements are necessary to maintain the associated real estate assets.
SAME STORE RESULTS:represent an operating measure that is used commonly to describe properties that have been in the portfolio for a period of time and therefore serve as a good basis upon which to review comparative performance data. American Land Lease’s definition of Same Store communities are communities that are owned during both the current and comparable prior year period.
SAME SITE RESULTS: represent an operating measure that is used to describe homesites that have been in the portfolio for a period of time and therefore serve as a good basis upon which to review comparative performance data. American Land Lease’s definition of Same Site is individual homesites that were operational during both the current and comparable prior year period. Absorbed incremental homesites are not included in this calculation.
OPERATIONAL HOME SITE:represents those sites within our portfolio that are/or have been leased to a tenant. Operational Home Sites and their relative occupancy provide a measure of stabilized portfolio status.
DEVELOPED HOME SITE:represents those sites within our portfolio that have not been occupied, but for which a majority of the infrastructure has been completed.
UNDEVELOPED HOME SITE:represent those sites within our portfolio that have not been fully developed and require construction of substantial lateral improvements such as roads.
CAPITAL REPLACEMENT:represents capitalized spending which maintains a property. American Land Lease generally capitalizes spending for items that cost more than $250 and have a useful life of more than one year. A common example is street repaving. This spending is better considered a recurring cost of preserving an asset rather than as an additional investment. It is a cash proxy for depreciation.
12
Table of Contents
CAPITAL ENHANCEMENT:represents capitalized spending which adds a material feature increases overall community value or revenue source. An example is the addition of a marina facility to an existing community.
USED HOME SALE:represents the sale of a home previously owned by a third party and where American Land Lease has acquired title through an eviction proceeding or through purchase from a third party.
GROSS DISTRIBUTION PAYOUT RATIO: This is calculated as the dividend per share divided by FFO and AFFO per share, respectively.
DISTRIBUTION PAYOUT RATIO NET OF DRIP:this is calculated as dividend per share less amounts reinvested pursuant to the dividend reinvestment plan divided by FFO and AFFO per share, respectively.
13
Table of Contents
American Land Lease – Selected Properties
Riverside Club – Ruskin, Florida
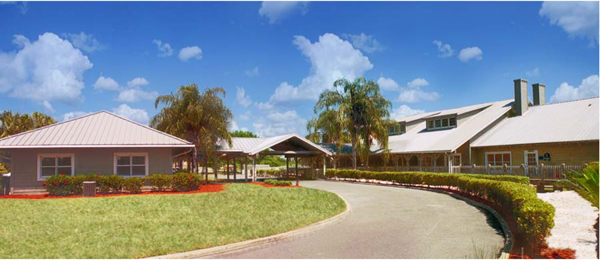
Riverside Clubhouse
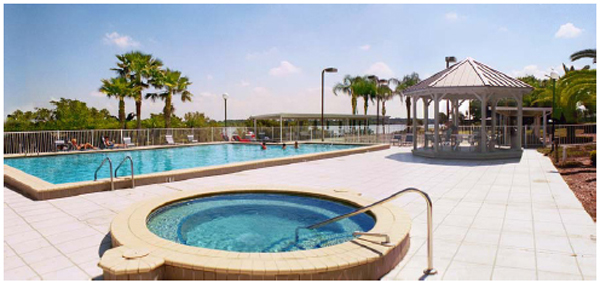
Riverside Club Pool
14
Table of Contents
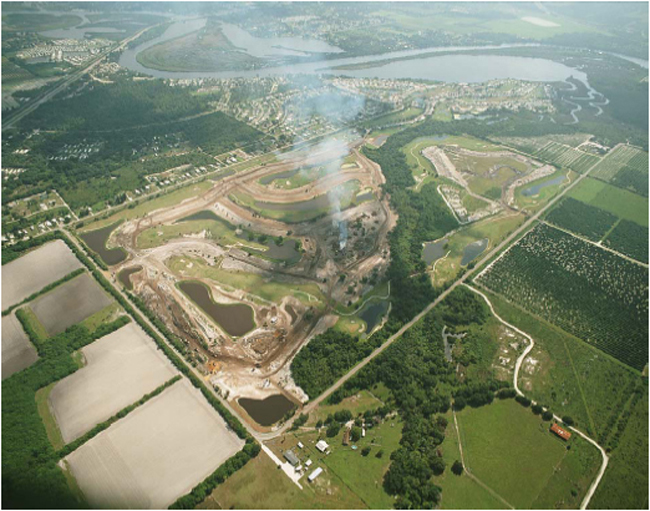
Riverside Club Project Aerial
 | ||||
| Riverside Home | ||||
15
Table of Contents
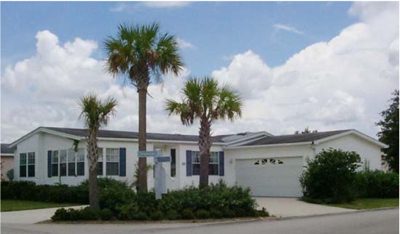
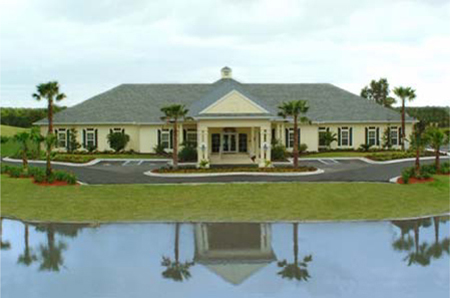
Savanna Club – Port St. Lucie, Florida
|
Savanna Clubhouse |
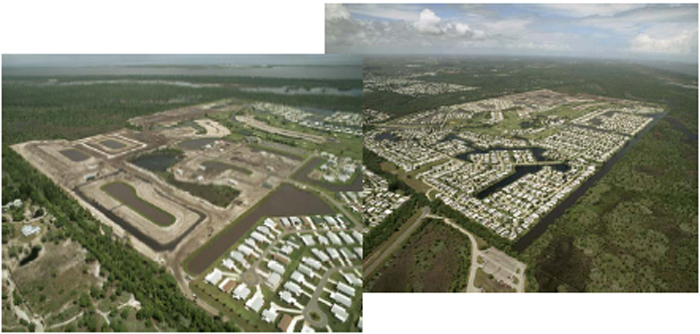
Savanna Aerials
16
Table of Contents
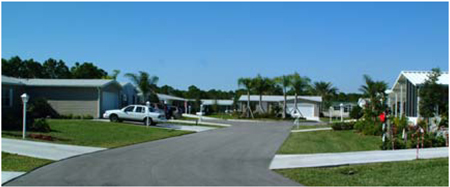
Savanna Streetcapes
Savanna Club Home
Savanna Club Home
17
Table of Contents
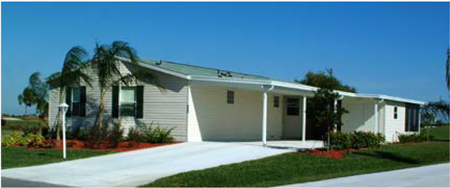
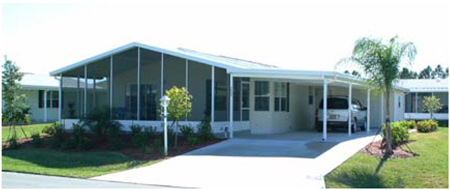
Desert Harbor - Apache Junction, Arizona
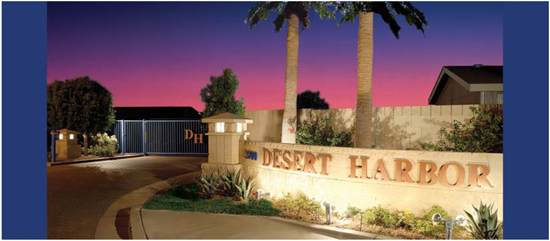
Desert Harbor - Entrance
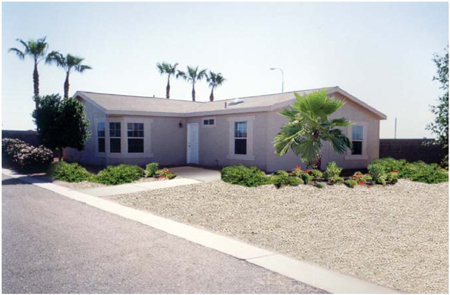
Desert Harbor - Home
18
Table of Contents
Desert Harbor - Home
19
Table of Contents
Forest View Estates – Homosassa, Florida
|
Forest View Clubhouse |
|
Forest View Home |
20
Table of Contents
Royal Palm – Haines City, Florida
 | ||||
Royal Palm Clubhouse | ||||
 | ||||
Royal Palm Home | ||||
21
Table of Contents
Lost Dutchman – Apache Junction, Arizona
 | ||||
| Lost Dutchman Recreation Area | ||||
 | ||||
| Lost Dutchman Home | ||||
22
Table of Contents
AMERICAN LAND LEASE INC. AND SUBSIDIARIES
CONSOLIDATED BALANCE SHEETS
(in thousands)
| As of | ||||||||||||||||||||
| December 31, 2004 | September 30, 2004 | June 30, 2004 | March 31, 2004 | December 31, 2003 | ||||||||||||||||
| (unaudited) | (unaudited) | (unaudited) | (unaudited) | |||||||||||||||||
| ASSETS | ||||||||||||||||||||
Real Estate | $ | 222,311 | $ | 217,310 | $ | 215,155 | $ | 209,849 | $ | 204,777 | ||||||||||
Less accumulated depreciation | (22,803 | ) | (22,116 | ) | (21,474 | ) | (20,779 | ) | (20,112 | ) | ||||||||||
Real estate under development | 49,360 | 47,662 | 44,636 | 42,223 | 41,413 | |||||||||||||||
Total Real Estate | 248,868 | 242,856 | 238,317 | 231,293 | 226,078 | |||||||||||||||
Cash and cash equivalents | 820 | 987 | 1,207 | 776 | 2,064 | |||||||||||||||
Inventory | 16,788 | 14,987 | 13,073 | 11,330 | 10,403 | |||||||||||||||
Other Assets | 9,480 | 10,425 | 9,729 | 8,566 | 8,162 | |||||||||||||||
Assets held for sale | — | — | 313 | 361 | 389 | |||||||||||||||
Total Assets | $ | 275,956 | $ | 269,255 | $ | 262,639 | $ | 252,326 | $ | 247,096 | ||||||||||
| LIABILITIES AND EQUITY | ||||||||||||||||||||
Liabilities | ||||||||||||||||||||
Secured long-term notes payable | $ | 127,338 | $ | 128,130 | $ | 119,876 | $ | 118,478 | $ | 119,194 | ||||||||||
Secured short-term financing | 24,644 | 18,622 | 20,142 | 13,495 | 10,659 | |||||||||||||||
Accounts payable and accrued liabilities | 9,795 | 9,523 | 10,982 | 9,883 | 8,423 | |||||||||||||||
Liabilities related to assets held for sale | — | 8 | 6 | 4 | 5 | |||||||||||||||
Total Liabilities | 161,777 | 156,283 | 151,006 | 141,860 | 138,281 | |||||||||||||||
Minority Interest in Operating Partnership | 14,746 | 14,552 | 14,497 | 14,319 | 14,014 | |||||||||||||||
| STOCKHOLDERS’ EQUITY | ||||||||||||||||||||
Preferred Stock, par value $.01 per share; 1,000 shares authorized, no shares issues or outstanding | — | — | — | — | — | |||||||||||||||
Common Stock, par value $.01 per share; 12,000 shares authorized | 91 | 91 | 90 | 90 | 88 | |||||||||||||||
Additional paid-in-capital | 286,649 | 286,611 | 285,517 | 285,207 | 282,818 | |||||||||||||||
Notes receivable from officers re common stock purchases | (748 | ) | (766 | ) | (775 | ) | (785 | ) | (799 | ) | ||||||||||
Deferred compensation re restricted stock | (2,250 | ) | (2,472 | ) | (2,719 | ) | (3,049 | ) | (1,354 | ) | ||||||||||
Dividends in excess of accumulated earnings | (157,697 | ) | (158,432 | ) | (158,365 | ) | (158,704 | ) | (159,340 | ) | ||||||||||
Treasury stock at cost | (26,612 | ) | (26,612 | ) | (26,612 | ) | (26,612 | ) | (26,612 | ) | ||||||||||
Total Stockholders’ Equity | 99,433 | 98,420 | 97,136 | 96,147 | 94,801 | |||||||||||||||
Total Liabilities and Stockholders’ Equity | $ | 275,956 | $ | 269,255 | $ | 262,639 | $ | 252,326 | $ | 247,096 | ||||||||||
23
Table of Contents
AMERICAN LAND LEASE INC. AND SUBSIDIARIES
CONSOLIDATED STATEMENTS OF INCOME
(in thousands, except per share data)
(unaudited)
| Three Months Ended | ||||||||||||||||
| December 31, 2004 | September 30, 2004 | June 30, 2004 | March 31, 2004 | |||||||||||||
| (unaudited) | ||||||||||||||||
RENTAL PROPERTY OPERATIONS | ||||||||||||||||
Rental and other property revenues | $ | 7,187 | $ | 7,146 | $ | 7,001 | $ | 6,969 | ||||||||
Golf course operating revenues | 225 | 114 | 176 | 403 | ||||||||||||
Total property operating revenues | 7,412 | 7,260 | 7,177 | 7,372 | ||||||||||||
Property operating expenses | (2,790 | ) | (2,463 | ) | (2,422 | ) | (2,510 | ) | ||||||||
Golf course operating expenses | (329 | ) | (283 | ) | (305 | ) | (308 | ) | ||||||||
Total property operating expenses | (3,119 | ) | (2,746 | ) | (2,727 | ) | (2,818 | ) | ||||||||
Depreciation | (766 | ) | (746 | ) | (737 | ) | (705 | ) | ||||||||
Income from rental property operations | 3,527 | 3,768 | 3,713 | 3,849 | ||||||||||||
SALES OPERATIONS | ||||||||||||||||
Home sales revenue | 12,871 | 8,495 | 9,714 | 9,280 | ||||||||||||
Cost of home sales | (8,665 | ) | (5,843 | ) | (6,474 | ) | (6,204 | ) | ||||||||
Gross profit on home sales | 4,206 | 2,652 | 3,240 | 3,076 | ||||||||||||
Commissions earned on brokered sales | 125 | 115 | 227 | 185 | ||||||||||||
Commissions paid on brokered sales | (69 | ) | (64 | ) | (122 | ) | (100 | ) | ||||||||
Gross profit on brokered sales | 56 | 51 | 105 | 85 | ||||||||||||
Selling and marketing expenses | (2,616 | ) | (2,236 | ) | (2,455 | ) | (2,343 | ) | ||||||||
Income (loss) from sales operations | 1,646 | 467 | 890 | 818 | ||||||||||||
General and administrative expenses | (1,220 | ) | (959 | ) | (904 | ) | (911 | ) | ||||||||
Interest and other income | 16 | 51 | 27 | 272 | ||||||||||||
Gain (loss) on sale of real estate | 438 | — | — | — | ||||||||||||
Interest expense | (1,555 | ) | (1,426 | ) | (1,374 | ) | (1,343 | ) | ||||||||
Income before minority interest in Operating Partnership | 2,852 | 1,901 | 2,352 | 2,685 | ||||||||||||
Minority interest in Operating Partnership | (342 | ) | (223 | ) | (285 | ) | (323 | ) | ||||||||
Income from continuing operations | 2,510 | 1,678 | 2,067 | 2,362 | ||||||||||||
DISCONTINUED OPERATIONS: | ||||||||||||||||
(Loss) Income from discontinued operations | — | 26 | 20 | 13 | ||||||||||||
NET INCOME | $ | 2,510 | $ | 1,704 | $ | 2,087 | $ | 2,375 | ||||||||
Basic earnings from continuing operations | $ | 0.35 | $ | 0.24 | $ | 0.30 | $ | 0.34 | ||||||||
Basic (loss) earnings from discontinued operations | — | — | — | — | ||||||||||||
Basic earnings per share | $ | 0.35 | $ | 0.24 | $ | 0.30 | $ | 0.34 | ||||||||
Diluted earnings from continuing operations | $ | 0.35 | $ | 0.23 | $ | 0.29 | $ | 0.32 | ||||||||
Diluted (loss) earnings from discontinued operations | — | — | — | — | ||||||||||||
Diluted earnings per share | $ | 0.35 | $ | 0.23 | $ | 0.29 | $ | 0.32 | ||||||||
Weighted average common shares outstanding | 7,089 | 7,050 | 6,971 | 6,938 | ||||||||||||
Weighted average common shares and common share equivalents outstanding | 7,402 | 7,297 | 7,236 | 7,301 | ||||||||||||
Dividends paid per share | $ | 0.25 | $ | 0.25 | $ | 0.25 | $ | 0.25 | ||||||||
24
Table of Contents
AMERICAN LAND LEASE INC. AND SUBSIDIARIES
DEBT ANALYSIS
(in thousands)
(unaudited)
| As of | ||||||||||||||||||||
| December 31, 2004 | September 30, 2004 | June 30, 2004 | March 31, 2004 | December 31, 2003 | ||||||||||||||||
| DEBT OUTSTANDING | ||||||||||||||||||||
Mortgage Loans Payable - Fixed | $ | 101,710 | $ | 102,502 | $ | 93,377 | $ | 94,107 | $ | 94,819 | ||||||||||
Mortgage Loans Payable - Floating | 25,628 | 25,628 | 26,499 | 24,371 | 24,375 | |||||||||||||||
Floor Plan Facility | 17,588 | 12,907 | 10,762 | 9,077 | 8,269 | |||||||||||||||
Line of Credit | 6,965 | 5,715 | 9,380 | 4,418 | 2,390 | |||||||||||||||
Total Debt | $ | 151,891 | $ | 146,752 | $ | 140,018 | $ | 131,973 | $ | 129,853 | ||||||||||
| % FIXED/FLOATING | ||||||||||||||||||||
Fixed | 67.0 | % | 69.8 | % | 66.7 | % | 71.3 | % | 73.0 | % | ||||||||||
Floating | 33.0 | % | 30.2 | % | 33.3 | % | 28.7 | % | 27.0 | % | ||||||||||
Total | 100.00 | % | 100.00 | % | 100.00 | % | 100.00 | % | 100.00 | % | ||||||||||
| AVERAGE INTEREST RATES | ||||||||||||||||||||
Mortgage Loans Payable - Fixed | 7.0 | % | 7.0 | % | 7.1 | % | 7.1 | % | 7.1 | % | ||||||||||
Mortgage Loans Payable - Floating | 4.7 | % | 4.7 | % | 4.9 | % | 4.8 | % | 4.8 | % | ||||||||||
Floor Plan Facility | 6.8 | % | 5.9 | % | 6.5 | % | 6.1 | % | 7.1 | % | ||||||||||
Line of Credit | 4.6 | % | 3.6 | % | 3.2 | % | 3.1 | % | 3.1 | % | ||||||||||
Total Weighted Average | 6.5 | % | 6.4 | % | 6.4 | % | 6.5 | % | 6.6 | % | ||||||||||
| DEBT RATIOS | ||||||||||||||||||||
Debt/Total Market Cap(1) | 44.6 | % | 47.4 | % | 47.5 | % | 45.2 | % | 48.4 | % | ||||||||||
Debt/Gross Assets | 55.1 | % | 54.5 | % | 53.3 | % | 52.3 | % | 52.6 | % | ||||||||||
| December 31, 2005 | December 31, 2006 | December 31, 2007 | December 31, 2008 | December 31, 2009 | ||||||||||||||||
MATURITIES | ||||||||||||||||||||
Mortgage Loans Maturities - Scheduled | 3,308 | 3,552 | 3,809 | 4,042 | 4,291 | |||||||||||||||
Mortgage Loans Maturities - Balloon | — | — | — | 13,278 | 2,069 | |||||||||||||||
Floor Plan Facility(2) | — | — | — | — | — | |||||||||||||||
Total | $ | 3,308 | $ | 3,552 | $ | 3,809 | $ | 17,320 | $ | 6,360 | ||||||||||
| (1) | Computed based upon closing price as reported on NYSE as of the period ended. |
| (2) | Discretionary, non-committed facility whose individual advances mature at different dates between 360 and 540 days from advance date. |
25
Table of Contents
26
Table of Contents
27
Table of Contents
AMERICAN LAND LEASE INC. AND SUBSIDIARIES
RECONCILIATION OF NET INCOME TO FFO AND AFFO
(Amounts in thousands, except per share/OP unit amounts) (Unaudited)
| Three Months Ended December 31, | ||||||||
| 2004 | 2003 | |||||||
Net Income | $ | 2,510 | $ | 1,976 | ||||
Adjustments: | ||||||||
Minority interest in operating partnership | 342 | 265 | ||||||
(Gain) loss on sale of real estate | (438 | ) | (15 | ) | ||||
Real estate depreciation | 766 | 694 | ||||||
Discontinued Operations | ||||||||
Real estate depreciation | — | 4 | ||||||
Minority interest in operating partnership attributed to discontinued operations | — | 3 | ||||||
Funds From Operations (FFO) | 3,180 | 2,927 | ||||||
Capital Replacements | (241 | ) | (213 | ) | ||||
Adjusted Funds from Operations (AFFO) | $ | 2,939 | $ | 2,714 | ||||
Weighted Average Common Shares/OP Units Outstanding: | 8,366 | 8,136 | ||||||
Per Common Share and OP Unit: | ||||||||
FFO: | $ | 0.38 | $ | 0.36 | ||||
AFFO: | $ | 0.35 | $ | 0.33 | ||||
Payout Ratio Per Common Share and OP Unit: | ||||||||
Gross Distribution Payout | ||||||||
FFO: | 65.8 | % | 69.4 | % | ||||
AFFO: | 71.4 | % | 75.8 | % | ||||
28
Table of Contents
AMERICAN LAND LEASE INC. AND SUBSIDIARIES
RECONCILIATION OF SAME SITE AND SAME STORE OPERATING RESULTS
FOR THE QUARTER ENDED DECEMBER 31, 2004
(in thousands)(unaudited)
| Three Months Ended December 31, 2004 | Three Months Ended December 31, 2003 | Change | % Change | Contribution to % Change(1) | ||||||||||||||
Same site rental revenues | $ | 6,194 | $ | 5,999 | $ | 195 | 3.3 | % | 3.0 | % | ||||||||
Absorption rental revenues | 629 | 260 | 369 | 141.9 | % | 5.7 | % | |||||||||||
Same site golf revenues | 224 | 196 | 28 | 14.3 | % | 0.5 | % | |||||||||||
Same store revenues | A | 7,047 | 6,455 | 592 | 9.2 | % | 9.2 | % | ||||||||||
Properties not in same store | 366 | 362 | 4 | 1.1 | % | |||||||||||||
Other Income | — | 7 | (7 | ) | -100.0 | % | ||||||||||||
Total property revenues | C | $ | 7,413 | $ | 6,824 | 589 | 8.6 | % | ||||||||||
Same site rental expenses | $ | 1,919 | $ | 1,836 | 83 | 4.5 | % | 3.9 | % | |||||||||
Absorption rental expenses | 83 | — | 83 | 100.0 | % | 3.9 | % | |||||||||||
Same site golf expenses | 328 | 307 | 21 | 6.8 | % | 0.9 | % | |||||||||||
Same store expenses | B | 2,330 | 2,143 | 187 | 8.7 | % | 8.7 | % | ||||||||||
Properties not in same store expenses | 169 | 362 | (193 | ) | -53.3 | % | ||||||||||||
Expenses related to offsite management2 | 619 | 177 | 442 | 249.7 | % | |||||||||||||
Total property operating expenses | D | $ | 3,118 | $ | 2,682 | $ | 436 | 16.3 | % | |||||||||
Same Store net operating income | A-B | $ | 4,717 | $ | 4,312 | $ | 405 | 9.4 | % | |||||||||
Total net operating income | C-D | $ | 4,295 | $ | 4,142 | $ | 153 | 3.7 | % | |||||||||
| (1) | Contribution to Same Store% change is computed as the change in the individual component of same store revenue or expense divided by the total applicable same store base (revenue or expense) for the 2003 period. For example, same site rental revenue of $195 as compared to the total same store revenues in 2003 of $6,455 is a 3.0% increase ($195/$6,455=3.0%). |
| (2) | Expenses related to offsite management reflect portfolio property management costs not attributable to a specific property. |
29
Table of Contents
AMERICAN LAND LEASE INC. AND SUBSIDIARIES
RECONCILIATION OF SAME SITE AND SAME STORE OPERATING RESULTS
FOR THE YEAR ENDED DECEMBER 31, 2004
(in thousands)
| Year Ended December 31, 2004 | Year Ended December 31, 2003 | Change | % Change | Contribution to % Change(1) | ||||||||||||||
Same site rental revenues | $ | 24,719 | $ | 23,821 | $ | 898 | 3.8 | % | 3.6 | % | ||||||||
Absorption rental revenues | 1,994 | 519 | 1,475 | 284.2 | % | 5.8 | % | |||||||||||
Same site golf revenues | 918 | 827 | 91 | 11.0 | % | 0.4 | % | |||||||||||
Same store revenues | A | 27,631 | 25,167 | 2,464 | 9.8 | % | 9.8 | % | ||||||||||
Properties not in same store | 1,574 | 1,129 | 445 | 39.4 | % | |||||||||||||
Other Income | 16 | 120 | (104 | ) | -86.7 | % | ||||||||||||
Total property revenues | C | $ | 29,221 | $ | 26,416 | 2,805 | 10.6 | % | ||||||||||
Same site rental expenses | $ | 7,462 | $ | 7,208 | 254 | 3.5 | % | 3.0 | % | |||||||||
Absorption rental expenses | 309 | — | 309 | 100.0 | % | 3.7 | % | |||||||||||
Same site golf expenses | 1,225 | 1,222 | 3 | 0.2 | % | 0.0 | % | |||||||||||
Same store expenses | B | 8,996 | 8,430 | 566 | 6.7 | % | 6.7 | % | ||||||||||
Properties not in same store expenses | 731 | 401 | 330 | 82.3 | % | |||||||||||||
Expenses related to offsite management2 | 1,683 | 1,609 | 74 | 4.6 | % | |||||||||||||
Total property operating expenses | D | $ | 11,410 | $ | 10,440 | $ | 970 | 9.3 | % | |||||||||
Same Store net operating income | A-B | $ | 18,635 | $ | 16,737 | $ | 1,898 | 11.3 | % | |||||||||
Total net operating income | C-D | $ | 17,811 | $ | 15,976 | $ | 1,835 | 11.5 | % | |||||||||
| (1) | Contribution to Same Store % change is computed as the change in the individual component of same store revenue or expense divided by the total applicable same store base (revenue or expense) for the 2003 period. For example, same site rental revenue of $898 as compared to the total same store revenues in 2003 of $25,167 is a 3.5% increase ($898/$25,167=3.6%). |
| (2) | Expenses related to offsite management reflect portfolio property management costs not attributable to a specific property. |
30
Table of Contents
AMERICAN LAND LEASE, INC. AND SUBSIDIARIES
NUMBER OF HOMESITES AND AVERAGE RENT BY COMMUNITY
AS OF DECEMBER 31, 2004
Community | Location | Operational Home Sites | Occupancy | Average Monthly Rent | RV Sites | Undeveloped Home Sites | Developed Home Sites | Year(s) First Developed | ||||||||||
Owned Communities | ||||||||||||||||||
Blue Heron Pines | Punta Gorda, FL | 304 | 98 | % | $ | 366 | — | 65 | 22 | 1983/1999 | ||||||||
Brentwood | Hudson, FL | 116 | 97 | % | 254 | — | 0 | 75 | 1984 | |||||||||
Serendipity | Ft. Myers, FL | 338 | 96 | % | 331 | — | — | — | 1971/1974 | |||||||||
Stonebrook | Homosassa, FL | 165 | 100 | % | 282 | — | — | 46 | 1987/1997 | |||||||||
Sun Lake | Grand Island, FL | 326 | 100 | % | 334 | — | — | 68 | 1980 | |||||||||
Sun Valley | Tarpon Springs, FL | 261 | 99 | % | 372 | — | — | — | 1972 | |||||||||
Caribbean Cove | Orlando, FL | 272 | 75 | % | 398 | — | — | 13 | 1984 | |||||||||
Forest View | Homosassa, FL | 252 | 100 | % | 295 | — | — | 52 | 1987/1997 | |||||||||
Gulfstream Harbor | Orlando, FL | 382 | 97 | % | 392 | — | 50 | — | 1980 | |||||||||
Gulfstream Harbor II | Orlando, FL | 306 | 99 | % | 385 | — | 37 | 1 | 1988 | |||||||||
Lakeshore Villas | Tampa, FL | 281 | 100 | % | 403 | — | — | — | 1972 | |||||||||
Park Royale | Pinellas Park, FL | 284 | 95 | % | 414 | — | — | 25 | 1971 | |||||||||
Pleasant Living | Riverview, FL | 245 | 96 | % | 335 | — | — | — | 1979 | |||||||||
Riverside GCC | Ruskin, FL | 367 | 100 | % | 494 | — | 421 | 149 | 1981 | |||||||||
Royal Palm | Haines City, FL | 262 | 97 | % | 329 | — | 0 | 123 | 1971 | |||||||||
Cypress Greens | Lakeland, FL | 158 | 100 | % | 231 | — | — | 100 | 1986 | |||||||||
Savanna Club | Port St. Lucie, FL | 750 | 100 | % | 327 | — | 192 | 118 | 1999 | |||||||||
Woodlands | Groveland, FL | 133 | 99 | % | 243 | — | — | 159 | ||||||||||
| Sub-total Florida | 5,202 | 765 | 951 | |||||||||||||||
Blue Star | Apache Junction, AZ | 22 | 73 | % | 298 | 129 | — | — | 1955 | |||||||||
Brentwood West | Mesa, AZ | 350 | 93 | % | 437 | — | — | — | 1972/1987 | |||||||||
Casa Encanta | Mesa, AZ | — | 0 | % | 0 | — | 193 | — | 1970 | |||||||||
Desert Harbor | Apache Junction, AZ | 142 | 97 | % | 367 | — | — | 64 | 1997 | |||||||||
Fiesta Village | Mesa, AZ | 174 | 73 | % | 358 | — | — | — | 1962 | |||||||||
La Casa Blanca | Apache Junction, AZ | 198 | 89 | % | 374 | — | — | — | 1993 | |||||||||
Lost Dutchman | Apache Junction, AZ | 173 | 90 | % | 306 | — | — | 86 | 1971/1979/1999 | |||||||||
Rancho Mirage | Apache Junction, AZ | 312 | 89 | % | 410 | — | — | — | 1994 | |||||||||
Sun Valley | Apache Junction, AZ | 268 | 94 | % | 317 | — | — | — | 1984 | |||||||||
| Sub-total Arizona | 1,639 | 193 | 150 | |||||||||||||||
Mullica Woods | Egg Harbor City, NJ | 90 | 100 | % | 480 | — | — | — | 1985 | |||||||||
Total Communities | 28 | 6,931 | 96 | % | $ | 340 | 129 | 958 | 1,101 | |||||||||
| (1) | We define opertional home sites as those sites within our portfolio that have been leased to a tenant during our ownership of the community. Since our porfolio contains a large inventory of developed home sites that have not been occupied during our ownership, we have expressed occupancy as the number of occupied sites as a percentage of operational home sites. We believe this measure most accurately describes the performance of an individual property relative to prior periods and other properties within our portfolio. The occupancy of all developed sites was 81.1% across the entire portfolio. Including sites not yet developed, occupancy was at 73.6% December 31, 2004. |
31
Table of Contents
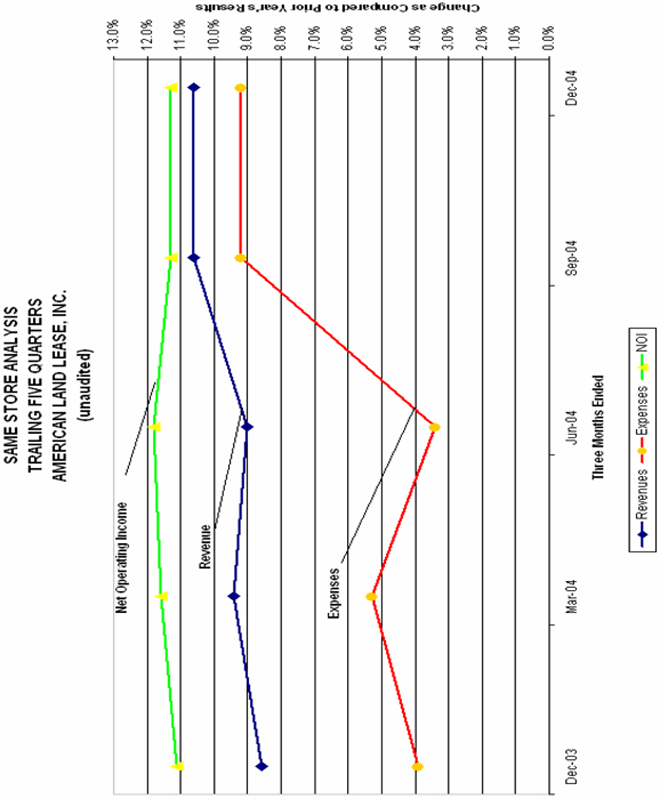
32
Table of Contents
Operational Home sites | Developed Home sites | Undeveloped Home sites | RV Sites | Total | ||||||||||
As of December 31, 2003 | 6,579 | 979 | 1,437 | 129 | 9,124 | |||||||||
Properties developed | — | 525 | (525 | ) | — | — | ||||||||
New lots purchased | — | 14 | — | — | 14 | |||||||||
Lots sold | (17 | ) | — | — | — | (17 | ) | |||||||
New leases originated | 367 | (367 | ) | — | — | — | ||||||||
Adjust for site plan changes | 2 | (50 | ) | 46 | — | (2 | ) | |||||||
As of December 31, 2004 | 6,931 | (1) | 1,101 | 958 | 129 | 9,119 | ||||||||
| (1) | As of December 31, 2004, 6,618 of these operational home sites were occupied. |
Occupancy Roll Forward
Occupied Home sites | Operational Home sites | Occupancy | |||||||
As of December 31, 2003 | 6,349 | 6,579 | 96.5 | % | |||||
New home sales | 393 | 367 | |||||||
Used home sales | 21 | — | |||||||
Used homes acquired | (50 | ) | — | ||||||
Lots Sold | (17 | ) | (17 | ) | |||||
Homes constructed by others | 2 | — | |||||||
Site plan changes | (1 | ) | 2 | ||||||
Homes removed from previously leased sites | (79 | ) | — | ||||||
As of December 31, 2004 | 6,618 | 6,931 | 95.5 | % | |||||
33
Table of Contents
AMERICAN LAND LEASE, INC. AND SUBSIDIARIES
RETURN ON INVESTMENT FROM HOME SALES
(unaudited)
Three Months Ended December 31, 2004 | Three Months Ended December 31, 2003 | |||||||||
Expansion sites leased during the year | 117 | 97 | ||||||||
Estimated first year annualized profit on leases originated during the year | A | $ | 438,000 | $ | 360,000 | |||||
Costs, including development costs of sites leased | $ | 5,499,000 | $ | 4,390,000 | ||||||
Home sales income (loss) attributable to sites leased | 1,590,000 | 783,000 | ||||||||
Total costs incurred to originate ground leases | B | $ | 3,909,000 | $ | 3,607,000 | |||||
Estimated first year annualized return on investment for leases originated during the year | A/B | 11.2 | % | 10 | % | |||||
For the three months ended December 31, 2004 and 2003, we estimate our profit or loss attributable to the sale of homes situated on expansion home sites as follows (in thousands):
Three Months Ended December 31, 2004 | Three Months Ended December 31, 2003 | |||||||
Reported income (loss) from sales operations | $ | 1,646,000 | $ | 852,000 | ||||
Used home sales and brokerage business income | (56,000 | ) | (69,000 | ) | ||||
Adjusted income (loss) for pro forma analysis | $ | 1,590,000 | $ | 783,000 | ||||
The reconciliation of our estimated first year return on investment in expansion home sites, a non-GAAP financial measure, to our return on investment in operational home sites in accordance with GAAP is shown below (in thousands):
Total Portfolio for Year Ended December 31, 2003 | ||||||
Property income before depreciation1 | A | $ | 16,105 | |||
Total investment in operating home sites1 | B | $ | 201,660 | |||
Return on investment from earning home sites1 | A/B | 8.0 | % | |||
34
Table of Contents
AMERICAN LAND LEASE INC. AND SUBSIDIARIES
KEY HOME SALES STATISTICS
September 30, 2003 | December 31, 2003 | March 31, 2004 | June 30, 2004 | September 30, 2004 | December 31, 2004 | Qtr over Qtr Decrease | Qtr over Qtr Change | ||||||||||||||||||||||||
New home closings | 125 | 103 | 91 | 103 | 77 | 121 | 44 | 57.1 | % | ||||||||||||||||||||||
New home contracts | 86 | 76 | 168 | 144 | 69 | 65 | (4 | ) | -5.8 | % | |||||||||||||||||||||
Home resales | 9 | 7 | 12 | 5 | 3 | 3 | 0 | 0.0 | % | ||||||||||||||||||||||
Brokered home sales | 53 | 51 | 79 | 83 | 48 | 55 | 7 | 14.6 | % | ||||||||||||||||||||||
New home contract backlog | 102 | 89 | 164 | 189 | 175 | 88 | (87 | ) | -49.7 | % | |||||||||||||||||||||
Average Selling Price | $ | 96,000 | $ | 95,000 | $ | 100,000 | $ | 92,000 | $ | 108,000 | $ | 105,000 | $ | (3,000 | ) | -2.8 | % | ||||||||||||||
Average Gross Margin | 27.8 | % | 29.7 | % | 33.2 | % | 33.7 | % | 33.1 | % | 32.7 | % | |||||||||||||||||||
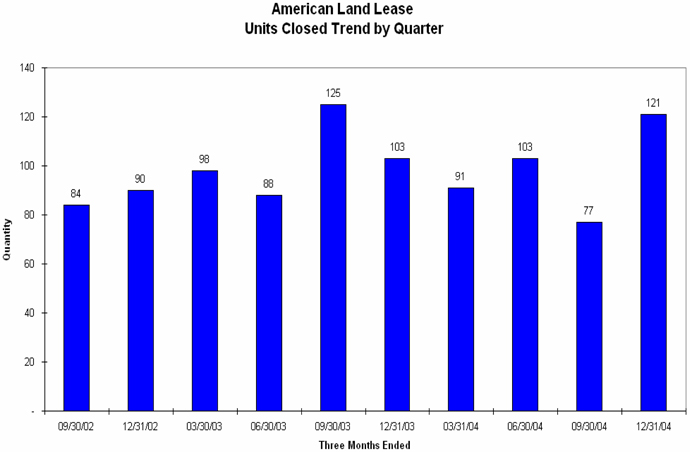
35
Table of Contents
AMERICAN LAND LEASE, INC. AND SUBSIDIARIES
DEVELOPMENT SUMMARY
Summary of 2004 Program
as of 12/31/04
Community | Sites to be Developed | Projected Completion | ||
| Savanna Club: | ||||
Phase 7 | 216 | Completed | ||
Phase 8 | 192 | 1/05 | ||
| Riverside Club: | ||||
Phase 2 | 148 | Completed | ||
Phase 4 & 5 | 212 | 7/05 | ||
Phase 6 | 208 | 8/06 | ||
| Royal Palm | 114 | Completed | ||
| Blue Heron Pines: | ||||
Phase 3 | 50 | 4/05 | ||
Phase 4 | 15 | 5/05 | ||
| Brentwood | 48 | Completed | ||
| Gulfstream | ||||
Phase 1 | 37 | 6/05 | ||
Phase 2 | 50 | 10/05 |
36
Table of Contents
Outlook and Forward Looking Statement
2005
(unaudited)
The Outlook information provided on this Supplemental Schedule contains information that is forward-looking, including, statements concerning projected 2005 results. These forward-looking statements are based on current expectations, estimates, and projections about the markets and the industry in which American Land Lease operates as well as management’s beliefs and assumptions. These forward-looking statements are also based on certain risks and uncertainties, including but not limited to general economic and business conditions; interest rate changes; financing and refinancing risks; risks inherent in owning real estate or debt secured by real estate; future development rate of home sites; competition; the availability of real estate assets at prices which meet our investment criteria; our ability to reduce expense levels, implement rent increases, use leverage and other risks set forth in our SEC filings. Readers should carefully review American Land Lease’s Annual Report on Form 10-K for the year ended December 31, 2004 and the other documents American Land Lease files from time to time with the Securities and Exchange Commission.
Full Year 2005 Projected | ||
FFO | $1.45 to $1.75 | |
AFFO | $1.32 to $1.61 | |
Diluted EPS | $1.06 to $1.35 | |
Same Store Sales | ||
Revenue Growth | 5.0% to 9.0% | |
Expense Growth | 5.5% to 8.0% | |
NOI Growth | 6.0% to 9.5% | |
Home Sales Operating Income | $2,800,000 to $6,000,000 | |
General and Administrative Expenses | $4,000,000 to $5,000,000 | |
Other Income | $50,000 to $150,000 | |
Capital Replacements (per site) | $125 to $145 | |
Depreciation | $3,200,000 to $3,700,000 |
37