Table of Contents
UNITED STATES
SECURITIES AND EXCHANGE COMMISSION
Washington, D.C. 20549
FORM N-CSRS
CERTIFIED SHAREHOLDER REPORT OF REGISTERED
MANAGEMENT INVESTMENT COMPANIES
Investment Company Act file number 811-04878
SEI Institutional Managed Trust
(Exact name of registrant as specified in charter)
SEI Investments
One Freedom Valley Drive
Oaks, PA 19456
(Address of principal executive offices) (Zip code)
SEI Investments
One Freedom Valley Drive
Oaks, PA 19456
CT Corporation
101 Federal Street
Boston, MA 02110
(Name and address of agent for service)
Registrant’s telephone number, including area code: 1-800-342-5734
Date of fiscal year end: September 30, 2010
Date of reporting period: March 31, 2010
Table of Contents
| Item 1. | Reports to Stockholders. |
Table of Contents

SEI Institutional Managed Trust
Semi-Annual Report as of March 31, 2010
Large Cap Fund
Large Cap Value Fund
Large Cap Growth Fund
Tax-Managed Large Cap Fund
S&P 500 Index Fund
Small Cap Fund
Small Cap Value Fund
Small Cap Growth Fund
Tax-Managed Small Cap Fund
Mid-Cap Fund
U.S. Managed Volatility Fund
Global Managed Volatility Fund
Tax-Managed Managed Volatility Fund
Real Estate Fund
Enhanced Income Fund
Core Fixed Income Fund
U.S. Fixed Income Fund
High Yield Bond Fund
Real Return Fund
Multi-Strategy Alternative Fund
Table of Contents
| 1 | ||
| 102 | ||
| 106 | ||
| 110 | ||
| 116 | ||
| 120 | ||
| 136 | ||
Board of Trustees Considerations in Approving the Advisory and Sub-Advisory Agreements | 138 | |
The Trust files its complete schedule of portfolio holdings with the Securities and Exchange Commission (“Commission”) for the first and third quarters of each fiscal year on Form N-Q within sixty days after period end. The Trust’s Form N-Q is available on the Commission’s website at http://www.sec.gov, and may be reviewed and copied at the Commission’s Public Reference Room in Washington, DC. Information on the operation of the Public Reference Room may be obtained by calling 1-800-SEC-0330.
A description of the policies and procedures that the Trust uses to determine how to vote proxies relating to portfolio securities, as well as information relating to how a Fund voted proxies relating to portfolio securities during the most recent 12-month period ended June 30, is available (i) without charge, upon request, by calling 1-800-DIAL-SEI; and (ii) on the Commission’s website at http://www.sec.gov.
Table of Contents
SUMMARY SCHEDULE OF INVESTMENTS (Unaudited)
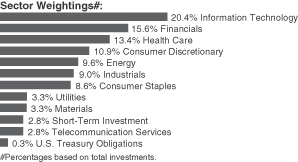
Large Cap Fund
March 31, 2010
| Description | Percentage of Net Assets (%) | Shares | Market Value ($ Thousands) | |||||
COMMON STOCK — 96.8% | ||||||||
Consumer Discretionary — 10.9% | ||||||||
Amazon.com* | 0.8 | % | 72,155 | $ | 9,793 | |||
Comcast, Cl A | 0.5 | 344,660 | 6,487 | |||||
Ford Motor* | 0.6 | 638,454 | 8,025 | |||||
Time Warner | 0.7 | 284,617 | 8,900 | |||||
Time Warner Cable, Cl A | 0.6 | 130,100 | 6,936 | |||||
Other Securities | 7.7 | 99,356 | ||||||
| 139,497 | ||||||||
Consumer Staples — 8.6% | ||||||||
Coca-Cola | 0.6 | 140,805 | 7,744 | |||||
PepsiCo | 0.8 | 150,817 | 9,978 | |||||
Philip Morris International | 0.8 | 205,029 | 10,694 | |||||
Procter & Gamble | 1.3 | 264,754 | 16,751 | |||||
SYSCO | 0.5 | 197,077 | 5,814 | |||||
Walgreen | 0.8 | 271,986 | 10,088 | |||||
Wal-Mart Stores | 0.5 | 123,320 | 6,857 | |||||
Other Securities | 3.3 | 42,321 | ||||||
| 110,247 | ||||||||
Energy — 9.5% | ||||||||
Chevron | 1.8 | 294,864 | 22,359 | |||||
ConocoPhillips | 1.2 | 303,933 | 15,552 | |||||
Exxon Mobil | 2.2 | 425,332 | 28,489 | |||||
Murphy Oil | 0.5 | 113,328 | 6,368 | |||||
Other Securities | 3.8 | 49,635 | ||||||
| 122,403 | ||||||||
Financials — 15.6% | ||||||||
Aflac | 0.5 | 124,716 | 6,771 | |||||
American Express | 1.0 | 300,394 | 12,394 | |||||
Bank of America | 1.3 | 924,222 | 16,497 | |||||
Goldman Sachs Group | 0.9 | 65,699 | 11,210 | |||||
JPMorgan Chase | 1.5 | 441,126 | 19,740 | |||||
US Bancorp | 0.6 | 268,459 | 6,948 | |||||
Wells Fargo | 1.6 | 658,423 | 20,490 | |||||
Other Securities | 8.2 | 106,363 | ||||||
| 200,413 | ||||||||
| Description | Percentage of Net Assets (%) | Shares | Market Value ($ Thousands) | |||||
Health Care — 13.4% | ||||||||
Aetna | 0.6 | % | 203,086 | $ | 7,130 | |||
Allergan | 0.8 | 165,465 | 10,808 | |||||
Amgen* | 1.0 | 212,690 | 12,710 | |||||
Cardinal Health | 0.5 | 157,039 | 5,658 | |||||
Johnson & Johnson | 1.2 | 238,413 | 15,545 | |||||
McKesson | 0.5 | 91,297 | 6,000 | |||||
Medtronic | 0.5 | 131,492 | 5,921 | |||||
Pfizer | 1.1 | 813,215 | 13,947 | |||||
UnitedHealth Group | 0.9 | 350,100 | 11,438 | |||||
WellPoint* | 0.5 | 92,301 | 5,942 | |||||
Other Securities | 5.8 | 76,496 | ||||||
| 171,595 | ||||||||
Industrials — 9.0% | ||||||||
General Electric | 1.2 | 837,444 | 15,242 | |||||
United Technologies | 0.6 | 111,530 | 8,210 | |||||
Other Securities | 7.2 | 91,868 | ||||||
| 115,320 | ||||||||
Information Technology — 20.4% | ||||||||
Apple* | 1.7 | 92,628 | 21,761 | |||||
Cisco Systems* | 1.3 | 607,217 | 15,806 | |||||
eBay* | 0.5 | 252,400 | 6,802 | |||||
EMC* | 0.6 | 419,450 | 7,567 | |||||
Google, Cl A* | 1.4 | 30,566 | 17,331 | |||||
Hewlett-Packard | 1.1 | 260,464 | 13,844 | |||||
Intel | 0.9 | 511,401 | 11,384 | |||||
International Business Machines | 1.6 | 156,515 | 20,073 | |||||
Microsoft | 2.0 | 894,315 | 26,177 | |||||
Qualcomm | 1.0 | 293,800 | 12,337 | |||||
Texas Instruments | 0.7 | 344,021 | 8,418 | |||||
Visa, Cl A | 0.7 | 97,175 | 8,846 | |||||
Other Securities | 6.9 | 91,685 | ||||||
| 262,031 | ||||||||
Materials — 3.3% | ||||||||
Other Securities | 3.3 | 41,720 | ||||||
Telecommunication Services — 2.8% | ||||||||
AT&T | 1.5 | 721,388 | 18,641 | |||||
Verizon Communications | 0.7 | 275,645 | 8,551 | |||||
Other Securities | 0.6 | 8,816 | ||||||
| 36,008 | ||||||||
Utilities — 3.3% | ||||||||
AES* | 0.6 | 644,000 | 7,084 | |||||
Other Securities | 2.7 | % | 35,156 | |||||
| 42,240 | ||||||||
Total Common Stock | 1,241,474 | |||||||
| SEI Institutional Managed Trust / Semi-Annual Report / March 31, 2010 | 1 |
Table of Contents
SUMMARY SCHEDULE OF INVESTMENTS (Unaudited)
Large Cap Fund (Concluded)
March 31, 2010
| Description | Percentage of Net Assets (%) | Shares | Market Value ($ Thousands) | |||||
CASH EQUIVALENT — 2.8% | ||||||||
SEI Daily Income Trust, Prime Obligation Fund, Cl A, 0.070%**† | 2.8 | % | 36,024,392 | $ | 36,024 | |||
Total Cash Equivalent | 36,024 | |||||||
U.S. TREASURY OBLIGATIONS (A) — 0.3% | ||||||||
Other Securities | 0.3 | 4,251 | ||||||
Total U.S. Treasury Obligations | 4,251 | |||||||
Total Investments — 99.9% | $ | 1,281,749 | ||||||
A summary of the open futures contracts held by the Fund at March 31, 2010, is as follows:
| Type of Contract | Number of Contracts Long (Short) | Expiration Date | Unrealized Appreciation ($ Thousands) | ||||
S&P 500 Index E-MINI | 63 | Jun-2010 | $ | 58 | |||
S&P 500 Composite Index | 89 | Jun-2010 | 418 | ||||
S&P Mid 400 Index E-MINI | 43 | Jun-2010 | 41 | ||||
| $ | 517 | ||||||
For the period ended March 31, 2010, the total amount of all open futures contracts, as presented in the table above, are representative of the volume of activity for this derivative type during the period.
Percentages are based on Net Assets of $1,283,092 ($ Thousands).
| * | Non-income producing security. |
| ** | Rate shown is the 7-day effective yield as of March 31, 2010. |
| † | Investment in Affiliated Security (see Note 5). |
| (A) | Security, or portion thereof, has been pledged as collateral on open futures. |
Cl — Class
The Summary Schedule of Investments does not reflect the complete portfolio holdings. It includes the Fund’s 50 largest unaffiliated holdings and each investment of any issuer that exceeds 1% of the Fund’s net assets. “Other Securities” represent all issues not required to be disclosed under the rules adopted by the U.S. Securities and Exchange Commission (“SEC”). In certain instances, securities for which footnotes listed above may otherwise apply are included in the Other Securities caption. The complete schedule of portfolio holdings is available (i) without charge, upon request, by calling (800) 342-5734; and (ii) on the SEC’s website at http://www.sec.gov.
The following is a summary of the inputs used as of March 31, 2010 in valuing the Fund’s investments carried at value ($ Thousands):
| Investments in Securities | Level 1 | Level 2 | Level 3 | Total | ||||||||
Common Stock | $ | 1,241,474 | $ | — | $ | — | $ | 1,241,474 | ||||
Cash Equivalent | 36,024 | — | — | 36,024 | ||||||||
U.S. Treasury Obligations | — | 4,251 | — | 4,251 | ||||||||
Total Investments in Securities | $ | 1,277,498 | $ | 4,251 | $ | — | $ | 1,281,749 | ||||
| Other Financial Instruments | Level 1 | Level 2 | Level 3 | Total | ||||||||
Futures Contracts* | $ | 517 | $ | — | $ | — | $ | 517 | ||||
| * | Futures contracts are valued at unrealized appreciation on the instrument. |
For more information on valuation inputs, see Note 2 — Significant Accounting Policies in Notes to Financial Statements.
The accompanying notes are an integral part of the financial statements.
| 2 | SEI Institutional Managed Trust / Semi-Annual Report / March 31, 2010 |
Table of Contents
SUMMARY SCHEDULE OF INVESTMENTS (Unaudited)
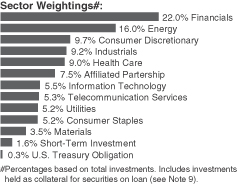
Large Cap Value Fund
March 31, 2010
| Description | Percentage of Net Assets (%) | Shares | Market Value ($ Thousands) | |||||
COMMON STOCK — 96.8% | ||||||||
Consumer Discretionary — 10.4% | ||||||||
Comcast, Cl A (A) | 1.3 | % | 1,273,300 | $ | 23,964 | |||
Ford Motor* (A) | 0.5 | 754,600 | 9,485 | |||||
Home Depot | 0.5 | 297,300 | 9,618 | |||||
Time Warner | 0.5 | 315,733 | 9,873 | |||||
Time Warner Cable, Cl A (A) | 0.5 | 164,424 | 8,765 | |||||
Viacom, Cl B* | 0.4 | 225,800 | 7,763 | |||||
Walt Disney | 0.6 | 335,000 | 11,695 | |||||
Whirlpool (A) | 0.4 | 88,200 | 7,696 | |||||
Other Securities | 5.7 | 107,271 | ||||||
| 196,130 | ||||||||
Consumer Staples — 5.5% | ||||||||
CVS Caremark | 0.6 | 298,700 | 10,921 | |||||
Procter & Gamble | 0.9 | 264,800 | 16,754 | |||||
Other Securities | 4.0 | 75,994 | ||||||
| 103,669 | ||||||||
Energy — 17.1% | ||||||||
Apache | 0.5 | 92,700 | 9,409 | |||||
Chevron | 3.0 | 744,700 | 56,471 | |||||
ConocoPhillips | 1.6 | 588,586 | 30,118 | |||||
Exxon Mobil (A) | 5.0 | 1,409,200 | 94,388 | |||||
Marathon Oil | 0.7 | 443,600 | 14,035 | |||||
Occidental Petroleum | 0.9 | 192,400 | 16,265 | |||||
Schlumberger (A) | 0.5 | 134,500 | 8,535 | |||||
Other Securities | 4.9 | 92,988 | ||||||
| 322,209 | ||||||||
Financials — 23.5% | ||||||||
Allstate | 0.7 | 381,400 | 12,323 | |||||
Ameriprise Financial | 0.5 | 194,200 | 8,809 | |||||
Bank of America | 2.1 | 2,267,569 | 40,476 | |||||
Chubb (A) | 0.5 | 184,800 | 9,582 | |||||
Citigroup* (A) | 0.7 | 3,428,700 | 13,886 | |||||
Franklin Resources (A) | 0.4 | 74,300 | 8,240 | |||||
Goldman Sachs Group | 1.4 | 149,100 | 25,441 | |||||
| Description | Percentage of Net Assets (%) | Shares | Market Value ($ Thousands) | |||||
JPMorgan Chase | 2.8 | % | 1,170,000 | $ | 52,358 | |||
Morgan Stanley | 0.5 | 330,700 | 9,686 | |||||
PNC Financial Services Group (A) | 0.6 | 179,055 | 10,689 | |||||
Travelers | 0.9 | 299,900 | 16,177 | |||||
US Bancorp | 0.6 | 456,300 | 11,809 | |||||
Wells Fargo | 1.9 | 1,140,595 | 35,495 | |||||
Other Securities | 9.9 | 187,924 | ||||||
| 442,895 | ||||||||
Health Care — 9.6% | ||||||||
Eli Lilly (A) | 0.5 | 238,900 | 8,653 | |||||
Johnson & Johnson | 0.9 | 272,400 | 17,761 | |||||
Merck | 0.9 | 449,857 | 16,802 | |||||
Pfizer | 2.3 | 2,464,622 | 42,268 | |||||
UnitedHealth Group | 0.6 | 361,300 | 11,804 | |||||
WellPoint* | 0.7 | 213,000 | 13,713 | |||||
Other Securities | 3.7 | 68,999 | ||||||
| 180,000 | ||||||||
Industrials — 9.8% | ||||||||
Boeing | 0.5 | 139,400 | 10,122 | |||||
General Dynamics | 0.6 | 133,700 | 10,321 | |||||
General Electric | 2.8 | 2,912,600 | 53,010 | |||||
Northrop Grumman | 0.7 | 189,000 | 12,393 | |||||
RR Donnelley & Sons | 0.5 | 408,400 | 8,719 | |||||
Other Securities | 4.7 | 89,859 | ||||||
| 184,424 | ||||||||
Information Technology — 5.9% | ||||||||
Hewlett-Packard | 0.6 | 226,700 | 12,049 | |||||
Intel | 0.8 | 650,500 | 14,480 | |||||
Other Securities | 4.5 | 83,835 | ||||||
| 110,364 | ||||||||
Materials — 3.7% | ||||||||
Eastman Chemical | 0.5 | 150,500 | 9,584 | |||||
Lubrizol | 0.4 | 86,200 | 7,906 | |||||
Other Securities | 2.8 | 53,079 | ||||||
| 70,569 | ||||||||
Telecommunication Services — 5.7% | ||||||||
AT&T | 3.2 | 2,337,395 | 60,398 | |||||
Verizon Communications (A) | 1.6 | 955,500 | 29,640 | |||||
Other Securities | 0.9 | 17,165 | ||||||
| 107,203 | ||||||||
Utilities — 5.6% | ||||||||
DTE Energy | 0.5 | 196,800 | 8,777 | |||||
Energen | 0.4 | 156,800 | 7,296 | |||||
Southern Union | 0.4 | 320,800 | 8,139 | |||||
| SEI Institutional Managed Trust / Semi-Annual Report / March 31, 2010 | 3 |
Table of Contents
SUMMARY SCHEDULE OF INVESTMENTS (Unaudited)
Large Cap Value Fund (Concluded)
March 31, 2010
| Description | Percentage of Net Assets (%) | Shares | Market Value ($ Thousands) | |||||
Other Securities | 4.3 | % | $ | 80,820 | ||||
| 105,032 | ||||||||
Total Common Stock | 1,822,495 | |||||||
AFFILIATED PARTNERSHIP — 8.1% | ||||||||
SEI Liquidity Fund, L.P., 0.210% (B)**† | 8.1 | 157,054,366 | 151,767 | |||||
Total Affiliated Partnership | 151,767 | |||||||
CASH EQUIVALENT — 1.7% | ||||||||
SEI Daily Income Trust, Prime Obligation Fund, Cl A, 0.070%**† | 1.7 | 32,279,797 | 32,280 | |||||
Total Cash Equivalent | 32,280 | |||||||
U.S. TREASURY OBLIGATION (C) — 0.3% | ||||||||
Other Securities | 0.3 | 5,643 | ||||||
Total U.S. Treasury Obligation | 5,643 | |||||||
Total Investments — 106.9% | $ | 2,012,185 | ||||||
A summary of the open futures contracts held by the Fund at March 31, 2010, is as follows:
| Type of Contract | Number of Contracts Long (Short) | Expiration Date | Unrealized Appreciation ($ Thousands) | ||||
S&P 500 Composite Index | 204 | Jun-2010 | $ | 561 | |||
For the period ended March 31, 2010, the total number of all open futures contracts, as presented in the table above, are representative of the volume of activity for this derivative type during the period.
Percentages are based on Net Assets of $1,882,657 ($ Thousands).
| * | Non-income producing security. |
| ** | Rate shown is the 7-day effective yield as of March 31, 2010. |
| † | Investment in Affiliated Security (see note 5). |
| (A) | This security or a partial position of this security is on loan at March 31, 2010 (see Note 9). The total market value of securities on loan at March 31, 2010 was $151,940 ($ Thousands). |
| (B) | This security was purchased with cash collateral received from securities on loan (see Note 9). The total value of such securities as of March 31, 2010 was 151,767 ($ Thousands). |
| (C) | Security, or portion thereof, has been pledged as collateral on open futures. |
Cl — Class
L.P. — Limited Partnership
The Summary Schedule of Investments does not reflect the complete portfolio holdings. It includes the Fund’s 50 largest unaffiliated holdings and each investment of any issuer that exceeds 1% of the Fund’s net assets. “Other Securities” represent all issues not required to be disclosed under the rules adopted by the U.S. Securities and Exchange Commission (“SEC”). In certain instances, securities for which footnotes listed above may otherwise apply are included in the Other Securities caption. The complete schedule of portfolio holdings is available (i) without charge, upon request, by calling (800) 342-5734; and (ii) on the SEC’s website at http://www.sec.gov.
The following is a summary of the inputs used as of March 31, 2010 in valuing the Fund’s investments carried at value ($ Thousands):
| Investments in Securities | Level 1 | Level 2 | Level 3 | Total | ||||||||
Common Stock | $ | 1,822,495 | $ | — | $ | — | $ | 1,822,495 | ||||
Affiliated Partnership | — | 151,767 | — | 151,767 | ||||||||
Cash Equivalent | 32,280 | — | — | 32,280 | ||||||||
U.S. Treasury Obligation | — | 5,643 | — | 5,643 | ||||||||
Total Investments in Securities | $ | 1,854,775 | $ | 157,410 | $ | — | $ | 2,012,185 | ||||
| Other Financial Instruments | Level 1 | Level 2 | Level 3 | Total | ||||||||
Futures Contracts* | $ | 561 | $ | — | $ | — | $ | 561 | ||||
| * | Futures contracts are valued at the unrealized appreciation on the instrument. |
For more information on valuation inputs, see Note 2 — Significant Accounting Policies in Notes to Financial Statements.
The accompanying notes are an integral part of the financial statements.
| 4 | SEI Institutional Managed Trust / Semi-Annual Report / March 31, 2010 |
Table of Contents
SUMMARY SCHEDULE OF INVESTMENTS (Unaudited)
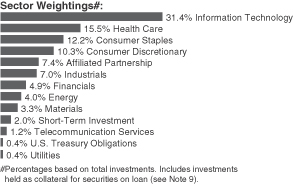
Large Cap Growth Fund
March 31, 2010
| Description | Percentage of Net Assets (%) | Shares | Market Value ($ Thousands) | |||||
COMMON STOCK — 93.9%‡ | ||||||||
Consumer Discretionary — 10.7% | ||||||||
Amazon.com* | 1.0 | % | 153,335 | $ | 20,812 | |||
Lowe’s | 0.8 | 682,634 | 16,547 | |||||
McDonald’s | 0.6 | 181,560 | 12,114 | |||||
Nike, Cl B (A) | 0.9 | 244,660 | 17,983 | |||||
priceline.com* (A) | 0.5 | 40,400 | 10,302 | |||||
Staples (A) | 0.9 | 785,571 | 18,375 | |||||
Target | 1.0 | 380,955 | 20,038 | |||||
Other Securities | 5.0 | 98,524 | ||||||
| 214,695 | ||||||||
Consumer Staples — 12.7% | ||||||||
Coca-Cola | 1.4 | 520,483 | 28,626 | |||||
Colgate-Palmolive (A) | 0.6 | 148,774 | 12,685 | |||||
Costco Wholesale (A) | 0.6 | 201,870 | 12,054 | |||||
PepsiCo | 2.1 | 633,439 | 41,908 | |||||
Philip Morris International | 1.1 | 412,090 | 21,495 | |||||
Procter & Gamble | 2.3 | 729,793 | 46,174 | |||||
Walgreen | 0.7 | 392,252 | 14,549 | |||||
Wal-Mart Stores | 1.4 | 485,710 | 27,005 | |||||
Other Securities | 2.5 | 50,262 | ||||||
| 254,758 | ||||||||
Energy — 4.2% | ||||||||
Exxon Mobil | 0.5 | 151,900 | 10,174 | |||||
Schlumberger (A) | 0.9 | 273,011 | 17,325 | |||||
Other Securities | 2.8 | 56,818 | ||||||
| 84,317 | ||||||||
Financials — 5.1% | ||||||||
American Express | 0.7 | 344,012 | 14,194 | |||||
CME Group | 0.7 | 42,585 | 13,462 | |||||
Other Securities | 3.7 | 73,704 | ||||||
| 101,360 | ||||||||
| Description | Percentage of Net Assets (%) | Shares | Market Value ($ Thousands) | |||||
Health Care — 16.2% | ||||||||
Abbott Laboratories | 0.8 | % | 300,070 | $ | 15,808 | |||
Allergan | 1.4 | 435,067 | 28,419 | |||||
Amgen* | 0.7 | 246,039 | 14,703 | |||||
Baxter International | 0.9 | 293,601 | 17,088 | |||||
Gilead Sciences* | 0.9 | 395,185 | 17,973 | |||||
Johnson & Johnson | 1.7 | 528,362 | 34,449 | |||||
Medco Health Solutions* | 0.8 | 234,882 | 15,164 | |||||
Medtronic | 0.7 | 285,200 | 12,843 | |||||
St. Jude Medical* (A) | 0.5 | 260,383 | 10,689 | |||||
UnitedHealth Group | 0.6 | 360,341 | 11,772 | |||||
Other Securities | 7.2 | 144,764 | ||||||
| 323,672 | ||||||||
Industrials — 7.3% | ||||||||
3M | 0.7 | 155,746 | 13,016 | |||||
Expeditors International of Washington (A) | 0.5 | 301,700 | 11,139 | |||||
United Technologies | 1.2 | 336,493 | 24,769 | |||||
Other Securities | 4.9 | 96,907 | ||||||
| 145,831 | ||||||||
Information Technology — 32.7% | ||||||||
Adobe Systems* | 0.6 | 346,179 | 12,244 | |||||
Apple* | 4.0 | 340,071 | 79,893 | |||||
Broadcom, Cl A (A) | 0.5 | 313,640 | 10,407 | |||||
Cisco Systems* | 2.7 | 2,029,772 | 52,835 | |||||
EMC* | 0.8 | 911,736 | 16,448 | |||||
Google, Cl A* | 2.6 | 92,269 | 52,317 | |||||
Hewlett-Packard | 1.3 | 500,660 | 26,610 | |||||
Intel | 0.9 | 809,615 | 18,022 | |||||
International Business Machines | 1.8 | 272,852 | 34,993 | |||||
Intuit* (A) | 0.6 | 343,400 | 11,792 | |||||
Mastercard, Cl A (A) | 0.6 | 49,230 | 12,504 | |||||
Microsoft | 3.4 | 2,343,869 | 68,605 | |||||
Oracle | 1.3 | 1,024,665 | 26,324 | |||||
Qualcomm | 2.1 | 980,159 | 41,157 | |||||
Visa, Cl A (A) | 1.3 | 289,797 | 26,380 | |||||
Other Securities | 8.2 | 164,509 | ||||||
| 655,040 | ||||||||
Materials — 3.4% | ||||||||
Freeport-McMoRan Copper & Gold, Cl B (A) | 0.5 | 128,446 | 10,730 | |||||
Praxair | 0.6 | 138,796 | 11,520 | |||||
Other Securities | 2.3 | 46,476 | ||||||
| 68,726 | ||||||||
| SEI Institutional Managed Trust / Semi-Annual Report / March 31, 2010 | 5 |
Table of Contents
SUMMARY SCHEDULE OF INVESTMENTS (Unaudited)
Large Cap Growth Fund (Concluded)
March 31, 2010
| Description | Percentage of Net Assets (%) | Shares | Market Value ($ Thousands) | |||||
Telecommunication Services — 1.2% | ||||||||
Crown Castle International* | 0.8 | % | 422,047 | $ | 16,135 | |||
Other Securities | 0.4 | 8,208 | ||||||
| 24,343 | ||||||||
Utilities — 0.4% | ||||||||
Other Securities | 0.4 | 7,271 | ||||||
Total Common Stock | 1,880,013 | |||||||
AFFILIATED PARTNERSHIP — 7.7% | ||||||||
SEI Liquidity Fund, L.P., 0.210% (B)**† | 7.7 | 157,797,853 | 153,929 | |||||
Total Affiliated Partnership | 153,929 | |||||||
CASH EQUIVALENT — 2.1% | ||||||||
SEI Daily Income Trust, Prime Obligation Fund, Cl A, 0.070%**† | 2.1 | 41,431,747 | 41,432 | |||||
Total Cash Equivalent | 41,432 | |||||||
U.S. TREASURY OBLIGATION (C) — 0.5% | ||||||||
Other Securities | 0.5 | 9,425 | ||||||
Total U.S. Treasury Obligation | 9,425 | |||||||
Total Investments — 104.2% | $ | 2,084,799 | ||||||
A summary of the open futures contracts held by the Fund at March 31, 2010, is as follows:
| Type of Contract | Number of Contracts Long (Short) | Expiration Date | Unrealized Appreciation ($ Thousands) | ||||
S&P 500 Composite Index | 308 | Jun-2010 | $ | 16 | |||
For the period ended March 31, 2010, the total amount of all open futures contracts, as presented in the table above, are representative of the volume of activity for this derivative type during the period.
Percentages are based on Net Assets of $2,001,069 ($ Thousands).
| * | Non-income producing security. |
| ** | Rate shown is the 7-day effective yield as of March 31, 2010. |
| † | Investment in Affiliated Security (see Note 5). |
| ‡ | Narrow Industries are utilized for compliance purposes, whereas broad sectors are utilized for reporting. |
| (A) | This security or a partial position of this security is on loan at March 31, 2010 (see Note 9). The total market value of securities on loan at March 31, 2010 was $154,182 ($ Thousands). |
| (B) | This security was purchased with cash collateral received from securities on loan (see Note 9). The total value of such securities as of March 31, 2010 was $153,929 ($ Thousands). |
| (C) | Security, or portion thereof, has been pledged as collateral on open futures. |
Cl — Class
L.P. — Limited Partnership
The Summary Schedule of Investments does not reflect the complete portfolio holdings. It includes the Fund’s 50 largest unaffiliated holdings and each investment of any issuer that exceeds 1% of the Fund’s net assets. “Other Securities” represent all issues not required to be disclosed under the rules adopted by the U.S. Securities and Exchange Commission (“SEC”). In certain instances, securities for which footnotes listed above may otherwise apply are included in the Other Securities caption. The complete schedule of portfolio holdings is available (i) without charge, upon request, by calling (800) 342-5734; and (ii) on the SEC’s website at http://www.sec.gov.
The following is a summary of the inputs used as of March 31, 2010 in valuing the Fund’s investments carried at value ($ Thousands):
| Investments in Securities | Level 1 | Level 2 | Level 3 | Total | ||||||||
Common Stock | $ | 1,880,013 | $ | — | $ | — | $ | 1,880,013 | ||||
Affiliated Partnership | — | 153,929 | — | 153,929 | ||||||||
Cash Equivalent | 41,432 | — | — | 41,432 | ||||||||
U.S. Treasury Obligation | — | 9,425 | — | 9,425 | ||||||||
Total Investments in Securities | $ | 1,921,445 | $ | 163,354 | $ | — | $ | 2,084,799 | ||||
| Other Financial Instruments | Level 1 | Level 2 | Level 3 | Total | ||||||||
Futures Contracts* | $ | 16 | $ | — | $ | — | $ | 16 | ||||
| * | Futures contracts are valued at the unrealized appreciation on the instrument. |
For more information on valuation inputs, see Note 2 — Significant Accounting Policies in Notes to Financial Statements.
The accompanying notes are an integral part of the financial statements.
| 6 | SEI Institutional Managed Trust / Semi-Annual Report / March 31, 2010 |
Table of Contents
SUMMARY SCHEDULE OF INVESTMENTS (Unaudited)
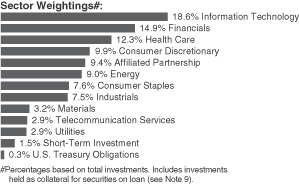
Tax-Managed Large Cap Fund
March 31, 2010
| Description | Percentage of Net Assets (%) | Shares | Market Value ($ Thousands) | |||||
COMMON STOCK — 95.6% | ||||||||
Consumer Discretionary — 10.7% | ||||||||
Amazon.com* | 0.6 | % | 74,104 | $ | 10,058 | |||
Comcast, Cl A | 0.6 | 498,700 | 9,385 | |||||
Lowe’s | 0.6 | 454,741 | 11,023 | |||||
Nike, Cl B (A) | 0.6 | 145,770 | 10,714 | |||||
Staples | 0.6 | 459,706 | 10,753 | |||||
Target | 0.5 | 171,189 | 9,004 | |||||
Time Warner | 0.5 | 282,847 | 8,845 | |||||
Other Securities | 6.7 | 113,114 | ||||||
| 182,896 | ||||||||
Consumer Staples — 8.2% | ||||||||
Coca-Cola | 0.6 | 200,076 | 11,004 | |||||
PepsiCo | 0.9 | 235,046 | 15,551 | |||||
Procter & Gamble | 1.6 | 434,202 | 27,472 | |||||
Wal-Mart Stores | 0.5 | 150,346 | 8,359 | |||||
Other Securities | 4.6 | 76,904 | ||||||
| 139,290 | ||||||||
Energy — 9.7% | ||||||||
Chevron | 1.5 | 326,609 | 24,767 | |||||
ConocoPhillips | 0.9 | 305,807 | 15,648 | |||||
Exxon Mobil | 2.2 | 567,176 | 37,989 | |||||
Occidental Petroleum | 0.6 | 124,829 | 10,553 | |||||
Other Securities | 4.5 | 76,741 | ||||||
| 165,698 | ||||||||
Financials — 16.1% | ||||||||
Aflac | 0.5 | 161,160 | 8,749 | |||||
American Express | 0.6 | 219,817 | 9,070 | |||||
Bank of America | 1.4 | 1,375,424 | 24,551 | |||||
Bank of New York Mellon (A) | 0.5 | 262,804 | 8,115 | |||||
CME Group | 0.6 | 33,010 | 10,435 | |||||
Goldman Sachs Group | 0.9 | 87,400 | 14,913 | |||||
JPMorgan Chase | 1.8 | 674,758 | 30,196 | |||||
Wells Fargo | 1.3 | 711,367 | 22,138 | |||||
Other Securities | 8.5 | 145,629 | ||||||
| 273,796 | ||||||||
| Description | Percentage of Net Assets (%) | Shares | Market Value ($ Thousands) | |||||
Health Care — 13.2% | ||||||||
Allergan | 0.9 | % | 222,420 | $ | 14,528 | |||
Amgen* | 0.6 | 173,963 | 10,396 | |||||
Gilead Sciences* | 0.7 | 248,630 | 11,308 | |||||
Johnson & Johnson | 1.2 | 304,122 | 19,829 | |||||
Medco Health Solutions* | 0.6 | 150,386 | 9,709 | |||||
Merck | 0.8 | 368,722 | 13,772 | |||||
Pfizer | 1.1 | 1,107,860 | 19,000 | |||||
UnitedHealth Group | 0.9 | 477,188 | 15,590 | |||||
Other Securities | 6.4 | 111,859 | ||||||
| 225,991 | ||||||||
Industrials — 8.0% | ||||||||
General Electric | 1.4 | 1,341,455 | 24,415 | |||||
United Technologies | 0.7 | 157,207 | 11,572 | |||||
Other Securities | 5.9 | 101,003 | ||||||
| 136,990 | ||||||||
Information Technology — 20.0% | ||||||||
Apple* | 2.1 | 152,943 | 35,931 | |||||
Cisco Systems* | 1.4 | 908,232 | 23,641 | |||||
eBay* | 0.5 | 312,591 | 8,424 | |||||
EMC* | 0.5 | 498,086 | 8,986 | |||||
Google, Cl A* | 1.5 | 44,421 | 25,187 | |||||
Hewlett-Packard | 1.0 | 318,121 | 16,908 | |||||
Intel | 0.9 | 653,945 | 14,557 | |||||
International Business Machines | 0.9 | 114,089 | 14,632 | |||||
Mastercard, Cl A (A) | 0.5 | 36,390 | 9,243 | |||||
Microsoft | 1.6 | 909,666 | 26,626 | |||||
Oracle | 0.5 | 351,141 | 9,021 | |||||
Qualcomm | 1.2 | 496,874 | 20,864 | |||||
Texas Instruments (A) | 0.5 | 338,100 | 8,273 | |||||
Visa, Cl A | 0.9 | 157,978 | 14,381 | |||||
Other Securities | 6.0 | 104,542 | ||||||
| 341,216 | ||||||||
Materials — 3.4% | ||||||||
Other Securities | 3.4 | 57,983 | ||||||
Telecommunication Services — 3.2% | ||||||||
AT&T | 1.3 | 841,446 | 21,743 | |||||
Crown Castle International* | 0.6 | 283,962 | 10,856 | |||||
Verizon Communications | 0.8 | 428,059 | 13,278 | |||||
Other Securities | 0.5 | 8,032 | ||||||
| 53,909 | ||||||||
Utilities — 3.1% | ||||||||
Other Securities | 3.1 | 52,557 | ||||||
Total Common Stock | 1,630,326 | |||||||
| SEI Institutional Managed Trust / Semi-Annual Report / March 31, 2010 | 7 |
Table of Contents
SUMMARY SCHEDULE OF INVESTMENTS (Unaudited)
Tax-Managed Large Cap Fund (Concluded)
March 31, 2010
| Description | Percentage of Net Assets (%) | Shares | Market Value ($ Thousands) | |||||
AFFILIATED PARTNERSHIP — 10.2% | ||||||||
SEI Liquidity Fund, L.P., 0.210% (B)**† | 10.2 | % | 178,313,760 | $ | 173,839 | |||
Total Affiliated Partnership | 173,839 | |||||||
CASH EQUIVALENT — 1.7% | ||||||||
SEI Daily Income Trust, Prime Obligation Fund, Cl A, 0.070%**† | 1.7 | 28,232,937 | 28,233 | |||||
Total Cash Equivalent | 28,233 | |||||||
U.S. TREASURY OBLIGATIONS (C) — 0.3% | ||||||||
Other Securities | 0.3 | 6,210 | ||||||
Total U.S. Treasury Obligations | 6,210 | |||||||
Total Investments — 107.8% | $ | 1,838,608 | ||||||
A summary of the open futures contracts held by the Fund at March 31, 2010, is as follows:
| Type of Contract | Number of Contracts Long (Short) | Expiration Date | Unrealized Appreciation ($ Thousands) | ||||
S&P 500 Index E-MINI | 3 | Jun-2010 | $ | 3 | |||
S&P 500 Composite Index | 219 | Jun-2010 | 257 | ||||
S&P Mid 400 Index E-MINI | 107 | Jun-2010 | 11 | ||||
| $ | 271 | ||||||
For the period ended March 31, 2010, the total number of all open futures contracts, as presented in the table above, are representative of the volume of activity for this derivative type during the period.
Percentages are based on Net Assets of $1,705,505 ($ Thousands).
| * | Non-income producing security. |
| ** | Rate shown is the 7-day effective yield as of March 31, 2010. |
| † | Investment in Affiliated Security (see Note 4). |
| (A) | This security or a partial position of this security is on loan at March 31, 2010 (see Note 9). The total market value of securities on loan at March 31, 2010 was $173,152 ($ Thousands). |
| (B) | This security was purchased with cash collateral received from securities on loan (see Note 9). The total value of such securities as of March 31, 2010 was $173,839 ($ Thousands). |
| (C) | Security, or portion thereof, has been pledged as collateral on open futures contracts. |
Cl — Class
L.P. — Limited Partnership
The Summary Schedule of Investments does not reflect the complete portfolio holdings. It includes the Fund’s 50 largest unaffiliated holdings and each investment of any issuer that exceeds 1% of the Fund’s net assets. “Other Securities” represent all issues not required to be disclosed under the rules adopted by the U.S. Securities and Exchange Commission (“SEC”). In certain instances, securities for which footnotes listed above may otherwise apply are included in the Other Securities caption. The complete schedule of portfolio holdings is available (i) without charge, upon request, by calling (800) 342-5734; and (ii) on the SEC’s website at http://www.sec.gov.
The following is a summary of the inputs used as of March 31, 2010 in valuing the Fund’s investments carried at value ($ Thousands):
| Investments in Securities | Level 1 | Level 2 | Level 3 | Total | ||||||||
Common Stock | $ | 1,630,326 | $ | — | $ | — | $ | 1,630,326 | ||||
Affiliated Partnership | — | 173,839 | — | 173,839 | ||||||||
Cash Equivalent | 28,233 | — | — | 28,233 | ||||||||
U.S. Treasury Obligations | — | 6,210 | — | 6,210 | ||||||||
Total Investments in Securities | $ | 1,658,559 | $ | 180,049 | $ | — | $ | 1,838,608 | ||||
| Other Financial Instruments | Level 1 | Level 2 | Level 3 | Total | ||||||||
Futures Contracts* | $ | 271 | $ | — | $ | — | $ | 271 | ||||
| * | Futures contracts are valued at the unrealized appreciation on the instrument. |
For more information on valuation inputs, see Note 2 — Significant Accounting Policies in Notes to Financial Statements.
The accompanying notes are an integral part of the financial statements.
| 8 | SEI Institutional Managed Trust / Semi-Annual Report / March 31, 2010 |
Table of Contents
SUMMARY SCHEDULE OF INVESTMENTS (Unaudited)
S&P 500 Index Fund
March 31, 2010
| Description | Percentage of Net Assets (%) | Shares | Market Value ($ Thousands) | |||||
COMMON STOCK — 97.9% | ||||||||
Consumer Discretionary — 10.0% | ||||||||
Amazon.com* | 0.4 | % | 44,200 | $ | 5,999 | |||
Comcast, Cl A | 0.5 | 369,322 | 6,951 | |||||
Ford Motor*(A) | 0.4 | 438,280 | 5,509 | |||||
Home Depot | 0.5 | 221,396 | 7,162 | |||||
McDonald’s | 0.7 | 138,870 | 9,265 | |||||
Walt Disney | 0.6 | 250,327 | 8,739 | |||||
Other Securities | 6.9 | 95,307 | ||||||
| 138,932 | ||||||||
Consumer Staples — 11.0% | ||||||||
Altria Group | 0.4 | 271,156 | 5,564 | |||||
Coca-Cola | 1.2 | 297,953 | 16,388 | |||||
CVS Caremark | 0.5 | 180,935 | 6,615 | |||||
Kraft Foods, Cl A | 0.5 | 226,098 | 6,837 | |||||
PepsiCo | 1.0 | 211,185 | 13,972 | |||||
Philip Morris International | 0.9 | 242,965 | 12,673 | |||||
Procter & Gamble | 1.7 | 375,601 | 23,764 | |||||
Wal-Mart Stores | 1.1 | 275,744 | 15,331 | |||||
Other Securities | 3.7 | 52,847 | ||||||
| 153,991 | ||||||||
Energy — 10.6% | ||||||||
Chevron | 1.4 | 259,678 | 19,691 | |||||
ConocoPhillips | 0.7 | 191,943 | 9,822 | |||||
Exxon Mobil (A) | 2.9 | 610,844 | 40,914 | |||||
Occidental Petroleum | 0.6 | 104,759 | 8,856 | |||||
Schlumberger (A) | 0.7 | 154,525 | 9,806 | |||||
Other Securities | 4.3 | 59,453 | ||||||
| 148,542 | ||||||||
Financials — 16.1% | ||||||||
American Express | 0.5 | 155,715 | 6,425 | |||||
Bank of America | 1.7 | 1,297,328 | 23,157 | |||||
Berkshire Hathaway, Cl B* | 1.0 | 171,947 | 13,974 | |||||
| Description | Percentage of Net Assets (%) | Shares | Market Value ($ Thousands) | |||||
Berkshire Hathaway, Cl A* | 0.2 | % | 28 | $ | 3,410 | |||
Citigroup*(A) | 0.7 | 2,537,185 | 10,276 | |||||
Goldman Sachs Group | 0.8 | 67,956 | 11,595 | |||||
JPMorgan Chase | 1.6 | 513,757 | 22,991 | |||||
US Bancorp | 0.5 | 249,006 | 6,444 | |||||
Wells Fargo | 1.5 | 669,863 | 20,846 | |||||
Other Securities | 7.6 | 106,032 | ||||||
| 225,150 | ||||||||
Health Care — 11.9% | ||||||||
Abbott Laboratories | 0.8 | 200,446 | 10,560 | |||||
Amgen* | 0.5 | 127,518 | 7,621 | |||||
Bristol-Myers Squibb (A) | 0.4 | 222,975 | 5,953 | |||||
Johnson & Johnson | 1.7 | 355,882 | 23,204 | |||||
Medtronic | 0.5 | 143,717 | 6,472 | |||||
Merck | 1.1 | 402,644 | 15,039 | |||||
Pfizer | 1.3 | 1,043,276 | 17,892 | |||||
Other Securities | 5.6 | 79,317 | ||||||
| 166,058 | ||||||||
Industrials — 10.3% | ||||||||
3M | 0.6 | 92,682 | 7,745 | |||||
Boeing (A) | 0.5 | 98,532 | 7,154 | |||||
General Electric | 1.8 | 1,379,874 | 25,114 | |||||
United Parcel Service, Cl B | 0.6 | 128,111 | 8,251 | |||||
United Technologies | 0.6 | 120,832 | 8,894 | |||||
Other Securities | 6.2 | 86,063 | ||||||
| 143,221 | ||||||||
Information Technology — 18.5% | ||||||||
Apple* | 2.0 | 117,331 | 27,564 | |||||
Cisco Systems* | 1.4 | 740,304 | 19,270 | |||||
Google, Cl A* | 1.3 | 31,191 | 17,686 | |||||
Hewlett-Packard | 1.2 | 304,265 | 16,172 | |||||
Intel | 1.1 | 713,915 | 15,892 | |||||
International Business Machines | 1.5 | 167,937 | 21,538 | |||||
Microsoft | 2.1 | 986,993 | 28,889 | |||||
Oracle | 0.9 | 504,988 | 12,973 | |||||
Qualcomm | 0.7 | 216,932 | 9,109 | |||||
Other Securities | 6.3 | 89,561 | ||||||
| 258,654 | ||||||||
Materials — 3.4% | ||||||||
Other Securities | 3.4 | 47,518 | ||||||
Telecommunication Services — 2.7% | ||||||||
AT&T | 1.4 | 763,040 | 19,717 | |||||
| SEI Institutional Managed Trust / Semi-Annual Report / March 31, 2010 | 9 |
Table of Contents
SUMMARY SCHEDULE OF INVESTMENTS (Unaudited)
S&P 500 Index Fund (Concluded)
March 31, 2010
| Description | Percentage of Net Assets (%) | Shares | Market Value ($ Thousands) | |||||
Verizon Communications | 0.8 | % | 366,298 | $ | 11,363 | |||
Other Securities | 0.5 | 7,245 | ||||||
| 38,325 | ||||||||
Utilities — 3.4% | ||||||||
Other Securities | 3.4 | 46,794 | ||||||
Total Common Stock | 1,367,185 | |||||||
AFFILIATED PARTNERSHIP — 15.5% | ||||||||
SEI Liquidity Fund, L.P., 0.210% (B)**† | 15.5 | 220,012,375 | 216,555 | |||||
Total Affiliated Partnership | 216,555 | |||||||
CASH EQUIVALENT — 2.5% | ||||||||
SEI Daily Income Trust, Prime Obligation Fund, Cl A, 0.070%**† | 2.5 | 34,230,982 | 34,231 | |||||
Total Cash Equivalent | 34,231 | |||||||
U.S. TREASURY OBLIGATIONS (C) — 0.2% | ||||||||
Other Securities | 0.2 | 3,044 | ||||||
Total U.S. Treasury Obligations | 3,044 | |||||||
Total Investments — 116.1% | $ | 1,621,015 | ||||||
A summary of the open futures contracts held by the Fund at March 31, 2010, is as follows:
| Type of Contract | Number of Contracts Long (Short) | Expiration Date | Unrealized Appreciation ($ Thousands) | ||||
S&P 500 Index E-MINI | 668 | Jun-2010 | $ | 640 | |||
For the period ended March 31, 2010, the total amount of all open futures contracts, as presented in the table above, are representative of the volume of activity for this derivative type during the period.
Percentages are based on Net Assets of $1,396,111 ($ Thousands).
| * | Non-income producing security. |
| ** | Rate shown is the 7-day effective yield as of March 31, 2010. |
| † | Investment in Affiliated Security (see Note 5). |
| (A) | This security or a partial position of this security is on loan at March 31, 2010 (see Note 9). The total market value of securities on loan at March 31, 2010 was $213,600 ($ Thousands). |
| (B) | This security was purchased with cash collateral received from securities on loan (see Note 9). The total value of such securities as of March 31, 2010 was $216,555 ($ Thousands). |
| (C) | Security, or portion thereof, is pledged as collateral on open futures contracts. |
Cl — Class
L.P. — Limited Partnership
The Summary Schedule of Investments does not reflect the complete portfolio holdings. It includes the Fund’s 50 largest unaffiliated holdings and each investment of any issuer that exceeds 1% of the Fund’s net assets. ��Other Securities” represent all issues not required to be disclosed under the rules adopted by the U.S. Securities and Exchange Commission (“SEC”). In certain instances, securities for which footnotes listed above may otherwise apply are included in the Other Securities caption. The complete schedule of portfolio holdings is available (i) without charge, upon request, by calling (800) 342-5734; and (ii) on the SEC’s website at http://www.sec.gov.
The following is a summary of the inputs used as of March 31, 2010 in valuing the Fund’s investments carried at value ($ Thousands):
| Investments in Securities | Level 1 | Level 2 | Level 3 | Total | ||||||||
Common Stock | $ | 1,367,185 | $ | — | $ | — | $ | 1,367,185 | ||||
Affiliated Partnership | — | 216,555 | — | 216,555 | ||||||||
Cash Equivalent | 34,231 | — | — | 34,231 | ||||||||
U.S. Treasury Obligations | — | 3,044 | — | 3,044 | ||||||||
Total Investments in Securities | $ | 1,401,416 | $ | 219,599 | $ | — | $ | 1,621,015 | ||||
| Other Financial Instruments | Level 1 | Level 2 | Level 3 | Total | ||||||||
Futures Contracts* | $ | 640 | $ | — | $ | — | $ | 640 | ||||
| * | Futures contracts are valued at unrealized appreciation on the instrument. |
For more information on valuation inputs, see Note 2 — Significant Accounting Policies in Notes to Financial Statements.
The accompanying notes are an integral part of the financial statements.
| 10 | SEI Institutional Managed Trust / Semi-Annual Report / March 31, 2010 |
Table of Contents
SUMMARY SCHEDULE OF INVESTMENTS (Unaudited)
Small Cap Fund
March 31, 2010
| Description | Percentage of Net Assets (%) | Shares | Market Value ($ Thousands) | |||||
COMMON STOCK — 81.9% | ||||||||
Consumer Discretionary — 13.4% | ||||||||
Brown Shoe | 0.3 | % | 46,300 | $ | 717 | |||
Cato, Cl A | 0.3 | 39,394 | 845 | |||||
HSN* | 0.3 | 29,455 | 867 | |||||
Iconix Brand Group* | 0.3 | 59,875 | 920 | |||||
Kirkland’s* | 0.3 | 46,302 | 972 | |||||
Lululemon Athletica* | 0.3 | 23,294 | 967 | |||||
MDC Partners, Cl A | 0.3 | 75,600 | 782 | |||||
Ryland Group | 0.3 | 32,400 | 727 | |||||
Tempur-Pedic International* | 0.3 | 32,695 | 986 | |||||
Tenneco* | 0.3 | 41,743 | 987 | |||||
Tupperware Brands | 0.3 | 14,985 | 723 | |||||
Other Securities | 10.1 | 29,124 | ||||||
| 38,617 | ||||||||
Consumer Staples — 3.6% | ||||||||
Medifast* | 0.3 | 28,633 | 719 | |||||
Ruddick | 0.2 | 23,350 | 739 | |||||
Other Securities | 3.1 | 8,951 | ||||||
| 10,409 | ||||||||
Energy — 5.0% | ||||||||
PetroHawk Energy* | 0.2 | 35,100 | 712 | |||||
World Fuel Services | 0.3 | 27,000 | 719 | |||||
Other Securities | 4.5 | 12,989 | ||||||
| 14,420 | ||||||||
Financials — 13.2% | ||||||||
First Financial Bancorp | 0.3 | 54,140 | 963 | |||||
MGIC Investment* | 0.3 | 63,890 | 701 | |||||
Radian Group | 0.3 | 53,963 | 844 | |||||
Susquehanna Bancshares | 0.3 | 85,540 | 839 | |||||
World Acceptance* | 0.4 | 28,391 | 1,024 | |||||
Other Securities | 11.6 | 33,485 | ||||||
| 37,856 | ||||||||
| Description | Percentage of Net Assets (%) | Shares | Market Value ($ Thousands) | |||||
Health Care — 10.8% | ||||||||
Acorda Therapeutics* | 0.3 | % | 21,000 | $ | 718 | |||
Chemed | 0.3 | 14,908 | 811 | |||||
ICU Medical* | 0.3 | 23,500 | 810 | |||||
PDL BioPharma | 0.3 | 135,211 | 840 | |||||
Questcor Pharmaceuticals* | 0.2 | 85,625 | 705 | |||||
STERIS | 0.3 | 26,448 | 890 | |||||
Other Securities | 9.1 | 26,338 | ||||||
| 31,112 | ||||||||
Industrials — 10.9% | ||||||||
Airtran Holdings* | 0.3 | 175,800 | 893 | |||||
Atlas Air Worldwide Holdings* | 0.3 | 17,385 | 922 | |||||
UAL* | 0.3 | 42,609 | 833 | |||||
Other Securities | 10.0 | 28,785 | ||||||
| 31,433 | ||||||||
Information Technology — 17.7% | ||||||||
Applied Micro Circuits* | 0.2 | 79,200 | 683 | |||||
Arris Group* | 0.3 | 72,900 | 875 | |||||
Benchmark Electronics* | 0.3 | 36,788 | 763 | |||||
Digital River* | 0.3 | 23,365 | 708 | |||||
JDA Software Group* | 0.4 | 41,859 | 1,164 | |||||
Mantech International, Cl A* | 0.3 | 14,800 | 723 | |||||
MicroStrategy, Cl A* | 0.3 | 9,919 | 844 | |||||
Netgear* | 0.3 | 34,144 | 891 | |||||
Parametric Technology* | 0.3 | 41,700 | 753 | |||||
Quest Software* | 0.3 | 45,138 | 803 | |||||
Teradyne* | 0.3 | 65,985 | 737 | |||||
TIBCO Software* | 0.2 | 62,900 | 679 | |||||
Unisys* | 0.3 | 23,750 | 829 | |||||
Valueclick* | 0.3 | 77,422 | 785 | |||||
Veeco Instruments* | 0.3 | 21,247 | 924 | |||||
Other Securities | 13.3 | 38,754 | ||||||
| 50,915 | ||||||||
Materials — 4.7% | ||||||||
Carpenter Technology | 0.3 | 25,490 | 933 | |||||
NewMarket | 0.4 | 12,672 | 1,305 | |||||
WR Grace* | 0.4 | 40,428 | 1,122 | |||||
Other Securities | 3.6 | 10,080 | ||||||
| 13,440 | ||||||||
Telecommunication Services — 0.7% | ||||||||
Other Securities | 0.7 | 1,999 | ||||||
Utilities — 1.9% | ||||||||
Other Securities | 1.9 | 5,398 | ||||||
Total Common Stock | 235,599 | |||||||
| SEI Institutional Managed Trust / Semi-Annual Report / March 31, 2010 | 11 |
Table of Contents
SUMMARY SCHEDULE OF INVESTMENTS (Unaudited)
Small Cap Fund (Concluded)
March 31, 2010
| Description | Percentage of Net Assets (%) | Shares/Face Amount ($ in Thousands) | Market Value ($ Thousands) | ||||||
PREFERRED STOCK — 0.4% | |||||||||
Grubb & Ellis Cumulative* | 0.3 | % | 5,800 | $ | 853 | ||||
Other Securities | 0.1 | 208 | |||||||
Total Preferred Stock | 1,061 | ||||||||
EXCHANGE TRADED FUND — 0.3% | |||||||||
iShares Russell 2000 Value Index Fund | 0.3 | 11,600 | 741 | ||||||
Total Exchange Traded Fund | 741 | ||||||||
WARRANTS — 0.0% | |||||||||
Other Securities | 0.0 | — | |||||||
Total Warrants | — | ||||||||
CONVERTIBLE BOND — 0.0% | |||||||||
Energy — 0.0% | |||||||||
Other Securities | 0.0 | 141 | |||||||
Total Convertible Bond | 141 | ||||||||
CORPORATE OBLIGATION — 0.0% | |||||||||
Financials — 0.0% | |||||||||
Other Securities | 0.0 | 47 | |||||||
Total Corporate Obligation | 47 | ||||||||
CASH EQUIVALENT — 4.4% | |||||||||
SEI Daily Income Trust, Prime Obligation Fund, Cl A, 0.070%**† | 4.4 | 12,602,483 | 12,602 | ||||||
Total Cash Equivalent | 12,602 | ||||||||
U.S. TREASURY OBLIGATION (A) (B) — 0.3% | |||||||||
U.S. Treasury Bills, 0.135%, | 0.3 | $ | 942 | 942 | |||||
Total U.S. Treasury Obligation | 942 | ||||||||
Total Investments — 87.3% | $ | 251,133 | |||||||
A summary of the open futures contracts held by the Fund at March 31, 2010, is as follows:
| Type of Contract | Number of Contracts Long (Short) | Expiration Date | Unrealized Depreciation ($ Thousands) | |||||
Russell 2000 Index E-MINI | 686 | Jun-2010 | $ | (296 | ) | |||
For the period ended March 31, 2010, the total amount of all open futures contracts, as presented in the table above, are representative of the volume of activity for this derivative type during the period.
Percentages are based on Net Assets of $287,704 ($ Thousands).
| * | Non-income producing security. |
| ** | Rate shown is the 7-day effective yield as of March 31, 2010. |
| † | Invested in Affiliated Security (see Note 5). |
| (A) | The rate reported is the effective yield at the time of purchase. |
| (B) | Security, or portion thereof, has been pledged as collateral on open futures. |
Cl — Class
The Summary Schedule of Investments does not reflect the complete portfolio holdings. It includes the Fund’s 50 largest unaffiliated holdings and each investment of any issuer that exceeds 1% of the Fund’s net assets. “Other Securities” represent all issues not required to be disclosed under the rules adopted by the U.S. Securities and Exchange Commission (“SEC”). In certain instances, securities for which footnotes listed above may otherwise apply are included in the Other Securities caption. The complete schedule of portfolio holdings is available (i) without charge, upon request, by calling (800) 342-5734; and (ii) on the SEC’s website at http://www.sec.gov.
The following is a summary of the inputs used as of March 31, 2010 in valuing the Fund’s investments carried at value ($ Thousands):
| Investments in Securities | Level 1 | Level 2 | Level 3 | Total | ||||||||
Common Stock | $ | 235,485 | $ | 68 | $ | 46 | $ | 235,599 | ||||
Preferred Stock | — | 208 | 853 | 1,061 | ||||||||
Exchange Traded Fund | 741 | — | — | 741 | ||||||||
Warrants | — | — | — | — | ||||||||
Convertible Bond | — | 141 | — | 141 | ||||||||
Corporate Obligation | — | — | 47 | 47 | ||||||||
Cash Equivalent | 12,602 | — | — | 12,602 | ||||||||
U.S. Treasury Obligation | — | 942 | — | 942 | ||||||||
Total Investments in Securities | $ | 248,828 | $ | 1,359 | $ | 946 | $ | 251,133 | ||||
| Other Financial Instruments | Level 1 | Level 2 | Level 3 | Total | ||||||||||
Futures Contracts* | $ | (296 | ) | $ | — | $ | — | $ | (296 | ) | ||||
| * | Futures contracts are valued at unrealized depreciation on the instrument. |
The following is a reconciliation of the investments in which significant unobservable inputs (Level 3) were used in determining value ($ Thousands):
| Common Stock | Preferred Stock | Corporate Obligation | ||||||||
Beginning balance as of October 1, 2009 | $ | — | $ | — | $ | — | ||||
Accrued discounts/premiums | — | — | 1 | |||||||
Realized gain/(loss) | — | — | — | |||||||
Change in unrealized appreciation/(depreciation) | (15 | ) | 273 | 1 | ||||||
Net purchases/sales | 61 | 580 | 45 | |||||||
Net transfer in and/or out of Level 3 | — | — | — | |||||||
Ending balance as of March 31, 2010 | $ | 46 | $ | 853 | $ | 47 | ||||
Changes in unrealized gains (losses) included earnings related to securities still held at reporting date | $ | — | $ | — | $ | — | ||||
For more information on valuation inputs, see Note 2 — Significant Accounting Policies in Notes to Financial Statements.
The accompanying notes are an integral part of the financial statements.
| 12 | SEI Institutional Managed Trust / Semi-Annual Report / March 31, 2010 |
Table of Contents
SUMMARY SCHEDULE OF INVESTMENTS (Unaudited)
Small Cap Value Fund
March 31, 2010
| Description | Percentage of Net Assets (%) | Shares | Market Value ($ Thousands) | |||||
COMMON STOCK — 93.7%‡ | ||||||||
Consumer Discretionary — 9.0% | ||||||||
Jack in the Box* | 0.4 | % | 95,070 | $ | 2,239 | |||
MDC Partners, Cl A | 0.4 | 250,870 | 2,596 | |||||
Rent-A-Center* | 0.6 | 136,800 | 3,235 | |||||
Other Securities | 7.6 | 46,736 | ||||||
| 54,806 | ||||||||
Consumer Staples — 4.3% | ||||||||
Universal (A) | 0.6 | 65,300 | 3,441 | |||||
Other Securities | 3.7 | 22,368 | ||||||
| 25,809 | ||||||||
Energy — 4.8% | ||||||||
Berry Petroleum, Cl A (A) | 0.4 | 92,672 | 2,610 | |||||
Comstock Resources* | 0.4 | 69,700 | 2,216 | |||||
Holly (A) | 0.4 | 82,400 | 2,300 | |||||
Other Securities | 3.6 | 21,767 | ||||||
| 28,893 | ||||||||
Financials — 31.7% | ||||||||
AMB Property† (A) | 0.6 | 141,000 | 3,841 | |||||
Douglas Emmett† (A) | 0.4 | 159,700 | 2,455 | |||||
Employers Holdings | 0.5 | 209,615 | 3,113 | |||||
First Financial Bancorp | 0.5 | 158,902 | 2,827 | |||||
Forest City Enterprises, Cl A* (A) | 0.4 | 157,079 | 2,263 | |||||
Host Hotels & Resorts† (A) | 0.5 | 208,010 | 3,047 | |||||
Infinity Property & Casualty (A) | 0.4 | 55,473 | 2,521 | |||||
Kimco Realty† (A) | 0.6 | 232,100 | 3,630 | |||||
Platinum Underwriters Holdings (A) | 0.6 | 97,479 | 3,615 | |||||
ProAssurance* (A) | 0.4 | 39,555 | 2,316 | |||||
Public Storage† (A) | 0.5 | 29,900 | 2,751 | |||||
Regency Centers† (A) | 0.6 | 92,600 | 3,470 | |||||
Simon Property Group† (A) | 0.4 | 25,618 | 2,149 | |||||
Vornado Realty Trust† (A) | 0.6 | 49,297 | 3,732 | |||||
| Description | Percentage of Net Assets (%) | Shares | Market Value ($ Thousands) | |||||
Other Securities | 24.7 | % | $ | 150,906 | ||||
| 192,636 | ||||||||
Health Care — 4.4% | ||||||||
Conmed* | 0.4 | 92,741 | 2,208 | |||||
Other Securities | 4.0 | 24,406 | ||||||
| 26,614 | ||||||||
Industrials — 16.1% | ||||||||
BE Aerospace* | 0.4 | 70,447 | 2,145 | |||||
EMCOR Group* | 0.5 | 133,000 | 3,276 | |||||
FTI Consulting* (A) | 0.4 | 60,500 | 2,379 | |||||
Granite Construction | 0.5 | 100,300 | 3,031 | |||||
IDEX | 0.4 | 77,673 | 2,571 | |||||
School Specialty* (A) | 0.5 | 145,892 | 3,313 | |||||
Teledyne Technologies* | 0.6 | 87,689 | 3,619 | |||||
Towers Watson, Cl A (A) | 0.8 | 103,115 | 4,898 | |||||
Triumph Group | 0.4 | 31,189 | 2,186 | |||||
Woodward Governor (A) | 0.4 | 70,300 | 2,248 | |||||
Other Securities | 11.2 | 68,052 | ||||||
| 97,718 | ||||||||
Information Technology — 13.0% | ||||||||
Benchmark Electronics* (A) | 0.4 | 130,000 | 2,696 | |||||
CACI International, Cl A* | 0.5 | 63,241 | 3,089 | |||||
Diebold (A) | 0.4 | 72,160 | 2,292 | |||||
Digital River* | 0.4 | 89,746 | 2,719 | |||||
Lawson Software* | 0.6 | 575,427 | 3,804 | |||||
Manhattan Associates* | 0.4 | 89,400 | 2,278 | |||||
Zoran* | 0.5 | 247,802 | 2,666 | |||||
Other Securities | 9.8 | 59,672 | ||||||
| 79,216 | ||||||||
Materials — 4.5% | ||||||||
H.B. Fuller | 0.4 | 93,200 | 2,163 | |||||
OM Group* (A) | 0.4 | 63,555 | 2,153 | |||||
Schweitzer-Mauduit International | 0.4 | 54,911 | 2,612 | |||||
Other Securities | 3.3 | 20,575 | ||||||
| 27,503 | ||||||||
Telecommunication Services — 0.3% | ||||||||
Other Securities | 0.3 | 1,558 | ||||||
Utilities — 5.6% | ||||||||
AGL Resources | 0.4 | 59,681 | 2,307 | |||||
El Paso Electric* | 0.5 | 146,600 | 3,020 | |||||
Great Plains Energy (A) | 0.6 | 188,761 | 3,505 | |||||
Idacorp | 0.4 | 73,265 | 2,536 | |||||
NorthWestern | 0.4 | 89,000 | 2,386 | |||||
Portland General Electric | 0.9 | 284,064 | 5,485 | |||||
| SEI Institutional Managed Trust / Semi-Annual Report / March 31, 2010 | 13 |
Table of Contents
SUMMARY SCHEDULE OF INVESTMENTS (Unaudited)
Small Cap Value Fund (Concluded)
March 31, 2010
| Description | Percentage of Net Assets (%) | Shares/Face Amount ($ Thousands) | Market Value ($ Thousands) | ||||||
Other Securities | 2.4 | % | $ | 14,997 | |||||
| 34,236 | |||||||||
Total Common Stock | 568,989 | ||||||||
EXCHANGE TRADED FUNDS — 0.6% | |||||||||
iShares Russell 2000 Value Index Fund | 0.4 | 38,400 | 2,451 | ||||||
Other Securities | 0.2 | 903 | |||||||
Total Exchange Traded Funds | 3,354 | ||||||||
WARRANTS — 0.0% | |||||||||
Other Securities | 0.0 | 5 | |||||||
Total Warrants | 5 | ||||||||
AFFILIATED PARTNERSHIP — 21.8% | |||||||||
SEI Liquidity Fund, L.P., 0.210% (B)**†† | 21.8 | 136,752,874 | 132,606 | ||||||
Total Affiliated Partnership | 132,606 | ||||||||
CASH EQUIVALENT — 6.1% | |||||||||
SEI Daily Income Trust, | 6.1 | 37,323,543 | 37,324 | ||||||
Total Cash Equivalent | 37,324 | ||||||||
U.S. TREASURY OBLIGATION (C) (D) — 0.4% | |||||||||
U.S. Treasury Bill, | 0.4 | $ | 2,387 | 2,386 | |||||
Total U.S. Treasury Obligation | 2,386 | ||||||||
Total Investments — 122.6% | $ | 744,664 | |||||||
A summary of the open futures contracts held by the Fund at March 31, 2010, is as follows:
| Type of Contract | Number of Contracts Long (Short) | Expiration Date | Unrealized Depreciation ($ Thousands) | |||||
Russell 2000 Index E-MINI | 357 | Jun-2010 | $ | (8 | ) | |||
For the period ended March 31, 2010, the total amount of all open futures contracts, as presented in the table above, are representative of the volume of activity for this derivative type during the period.
Percentages are based on Net Assets of $607,328 ($ Thousands).
| * | Non-income producing security. |
| ** | Rate shown is the 7-day effective yield as of March 31, 2010. |
| ‡ | Narrow Industries are utilized for compliance purposes, whereas broad sectors are utilized for reporting. |
| † | Real Estate Investment Trust. |
| †† | Investment in Affiliated Security (see Note 5). |
| (A) | This security or a partial position of this security is on loan at March 31, 2010 (see Note 9). The total market value of securities on loan at March 31, 2010 was $132,009 ($ Thousands). |
| (B) | This security was purchased with cash collateral received from securities on loan (see Note 9). The total value of such securities as of March 31, 2010 was $132,606 ($ Thousands). |
| (C) | The rate reported is the effective yield at the time of purchase. |
| (D) | Security, or portion thereof, has been pledged as collateral on open futures. |
Cl — Class
L.P. — Limited Partnership
The Summary Schedule of Investments does not reflect the complete portfolio holdings. It includes the Fund’s 50 largest unaffiliated holdings and each investment of any issuer that exceeds 1% of the Fund’s net assets. “Other Securities” represent all issues not required to be disclosed under the rules adopted by the U.S. Securities and Exchange Commission (“SEC”). In certain instances, securities for which footnotes listed above may otherwise apply are included in the Other Securities caption. The complete schedule of portfolio holdings is available (i) without charge, upon request, by calling (800) 342-5734; and (ii) on the SEC’s website at http://www.sec.gov.
The following is a summary of the inputs used as of March 31, 2010 in valuing the Fund’s investments carried at value ($ Thousands):
| Investments in Securities | Level 1 | Level 2 | Level 3 | Total | ||||||||
Common Stock | $ | 568,521 | $ | — | $ | 468 | $ | 568,989 | ||||
Exchange Traded Funds | 3,354 | — | — | 3,354 | ||||||||
Warrants | 5 | — | — | 5 | ||||||||
Affiliated Partnership | — | 132,606 | — | 132,606 | ||||||||
Cash Equivalent | 37,324 | — | — | 37,324 | ||||||||
U.S. Treasury Obligation | — | 2,386 | — | 2,386 | ||||||||
Total Investments in Securities | $ | 609,204 | $ | 134,992 | $ | 468 | $ | 744,664 | ||||
| Other Financial Instruments | Level 1 | Level 2 | Level 3 | Total | ||||||||||
Futures Contracts* | $ | (8 | ) | $ | — | $ | — | $ | (8 | ) | ||||
| * | Futures contracts are value at unrealized depreciation on the instrument. |
The following is a reconciliation of the investments in which significant unobservable inputs (Level 3) were used in determining value ($ Thousands):
| Common Stock | |||
Beginning balance as of October 1, 2009 | $ | 445 | |
Accrued discounts/premiums | — | ||
Realized gain/(loss) | — | ||
Change in unrealized appreciation/(depreciation) | 23 | ||
Net purchases/sales | — | ||
Net transfer in and/or out of Level 3 | — | ||
Ending balance as of March 31, 2010 | $ | 468 | |
| Changes in unrealized gains (losses) included in earnings related to securities still held at reporting date | $ | 23 | |
For more information on valuation inputs, see Note 2 — Significant Accounting Policies in Notes to Financial Statements.
The accompanying notes are an integral part of the financial statements.
| 14 | SEI Institutional Managed Trust / Semi-Annual Report / March 31, 2010 |
Table of Contents
SUMMARY SCHEDULE OF INVESTMENTS (Unaudited)
Small Cap Growth Fund
March 31, 2010
| Description | Percentage of Net Assets (%) | Shares | Market Value ($ Thousands) | |||||
COMMON STOCK — 96.7%‡ | ||||||||
Consumer Discretionary — 18.0% | ||||||||
American Public Education* | 0.6 | % | 57,918 | $ | 2,699 | |||
Capella Education* (A) | 0.4 | 17,507 | 1,625 | |||||
Finish Line, Cl A | 0.5 | 123,793 | 2,020 | |||||
J Crew Group* | 0.5 | 43,484 | 1,996 | |||||
Life Time Fitness* (A) | 0.8 | 125,550 | 3,528 | |||||
Live Nation* | 0.4 | 114,300 | 1,657 | |||||
Lululemon Athletica* (A) | 0.6 | 65,940 | 2,736 | |||||
Tempur-Pedic International* (A) | 0.5 | 72,845 | 2,197 | |||||
Tupperware Brands | 0.6 | 54,727 | 2,639 | |||||
Other Securities | 13.1 | 56,571 | ||||||
| 77,668 | ||||||||
Consumer Staples — 3.0% | ||||||||
Other Securities | 3.0 | 13,044 | ||||||
Energy — 4.8% | ||||||||
Comstock Resources* | 0.4 | 57,793 | 1,838 | |||||
PetroHawk Energy* | 0.6 | 120,083 | 2,435 | |||||
SandRidge Energy* | 0.5 | 293,087 | 2,257 | |||||
World Fuel Services (A) | 0.5 | 80,312 | 2,140 | |||||
Other Securities | 2.8 | 11,934 | ||||||
| 20,604 | ||||||||
Financials — 4.7% | ||||||||
Affiliated Managers Group* (A) | 0.4 | 22,963 | 1,814 | |||||
CapitalSource | 0.4 | 284,484 | 1,590 | |||||
MarketAxess Holdings | 0.4 | 108,173 | 1,702 | |||||
MGIC Investment* | 0.5 | 218,327 | 2,395 | |||||
Other Securities | 3.0 | 12,724 | ||||||
| 20,225 | ||||||||
Health Care — 18.8% | ||||||||
Abaxis* | 0.4 | 67,856 | 1,845 | |||||
Acorda Therapeutics* | 0.6 | 68,777 | 2,352 | |||||
| Description | Percentage of Net Assets (%) | Shares | Market Value ($ Thousands) | |||||
AMAG Pharmaceuticals* | 0.6 | % | 75,252 | $ | 2,627 | |||
Amedisys* | 0.4 | 28,367 | 1,566 | |||||
Healthsouth* (A) | 0.5 | 109,380 | 2,045 | |||||
Human Genome Sciences* | 0.5 | 68,716 | 2,075 | |||||
NuVasive* (A) | 0.5 | 51,985 | 2,350 | |||||
PDL BioPharma (A) | 0.5 | 372,789 | 2,315 | |||||
STERIS | 0.4 | 56,920 | 1,916 | |||||
Other Securities | 14.4 | 61,594 | ||||||
| 80,685 | ||||||||
Industrials — 15.6% | ||||||||
Aegean Marine Petroleum Network | 0.5 | 80,705 | 2,290 | |||||
AerCap Holdings* | 0.5 | 177,694 | 2,047 | |||||
CoStar Group* (A) | 0.5 | 51,644 | 2,144 | |||||
EnerNOC* | 0.4 | 57,571 | 1,709 | |||||
Innerworkings* (A) | 0.4 | 328,148 | 1,706 | |||||
Old Dominion Freight Line* | 0.4 | 47,505 | 1,586 | |||||
Other Securities | 12.8 | 55,705 | ||||||
| 67,187 | ||||||||
Information Technology — 27.2% | ||||||||
Advanced Energy Industries* | 0.7 | 186,605 | 3,090 | |||||
Art Technology Group* | 0.6 | 569,948 | 2,513 | |||||
Atheros Communications* | 0.7 | 82,190 | 3,182 | |||||
Blackboard* | 0.4 | 40,421 | 1,684 | |||||
DTS* | 0.5 | 64,233 | 2,186 | |||||
MicroStrategy, Cl A* | 0.5 | 24,831 | 2,112 | |||||
Net 1 UEPS Technologies* | 0.5 | 108,742 | 2,000 | |||||
Power Integrations (A) | 0.5 | 48,154 | 1,984 | |||||
Quality Systems (A) | 0.4 | 26,205 | 1,610 | |||||
Solera Holdings | 0.4 | 41,065 | 1,587 | |||||
Taleo, Cl A* | 0.4 | 68,530 | 1,776 | |||||
Teradyne* | 0.5 | 181,238 | 2,024 | |||||
Veeco Instruments* (A) | 0.5 | 49,871 | 2,169 | |||||
VistaPrint* | 0.5 | 39,542 | 2,264 | |||||
Volterra Semiconductor* | 0.4 | 62,961 | 1,580 | |||||
Other Securities | 19.7 | 85,343 | ||||||
| 117,104 | ||||||||
Materials — 2.6% | ||||||||
WR Grace* | 0.4 | 58,731 | 1,630 | |||||
Other Securities | 2.3 | 9,494 | ||||||
| 11,124 | ||||||||
Telecommunication Services — 1.4% | ||||||||
SBA Communications, Cl A* (A) | 0.5 | 64,789 | 2,337 | |||||
Other Securities | 0.9 | 3,673 | ||||||
| 6,010 | ||||||||
| SEI Institutional Managed Trust / Semi-Annual Report / March 31, 2010 | 15 |
Table of Contents
SUMMARY SCHEDULE OF INVESTMENTS (Unaudited)
Small Cap Growth Fund (Concluded)
March 31, 2010
| Description | Percentage of Net Assets (%) | Shares/Face Amount ($ Thousands) | Market Value ($ Thousands) | |||||
Utilities — 0.6% | ||||||||
Other Securities | 0.6 | % | $ | 2,464 | ||||
Total Common Stock | 416,115 | |||||||
WARRANTS — 0.0% | ||||||||
Other Securities | 0.0 | 2 | ||||||
Total Warrants | 2 | |||||||
AFFILIATED PARTNERSHIP — 13.5% | ||||||||
SEI Liquidity Fund, L.P., 0.210% (B)**† | 13.5 | 60,996,621 | 58,038 | |||||
Total Affiliated Partnership | 58,038 | |||||||
CASH EQUIVALENT — 7.8% | ||||||||
SEI Daily Income Trust, Prime Obligation Fund, Cl A, 0.070%**† | 7.8 | 33,674,766 | 33,675 | |||||
Total Cash Equivalent | 33,675 | |||||||
U.S. TREASURY OBLIGATION (C) (D) — 0.5% | ||||||||
U.S. Treasury Bills, 0.112%, 06/03/2010 | 0.5 | $2,160 | 2,159 | |||||
Total U.S. Treasury Obligation | 2,159 | |||||||
Total Investments — 118.5% | $ | 509,989 | ||||||
A summary of the open futures contracts held by the Fund at March 31, 2010, is as follows:
| Type of Contract | Number of Contracts Long (Short) | Expiration Date | Unrealized Depreciation ($ Thousands) | |||||
Russell 2000 Index E-MINI | 207 | Jun-2010 | $ | (77 | ) | |||
For the period ended March 31, 2010, the total amount of all open futures contracts, as presented in the table above, are representative of the volume of activity for this derivative type during the period.
Percentages are based on Net Assets of $430,316 ($ Thousands).
| * | Non-income producing security. |
| ** | Rate shown is the 7-day effective yield as of March 31, 2010. |
| ‡ | Narrow Industries are utilized for compliance purposes, whereas broad sectors are utilized for reporting. |
| † | Investment in Affiliated Security (see Note 5). |
| (A) | This security or a partial position of this security is on loan at March 31, 2010 (see Note 9). The total market value of securities on loan at March 31, 2010 was $51,325 ($ Thousands). |
| (B) | This security was purchased with cash collateral received from securities on loan (see Note 9). The total value of such securities as of March 31, 2010 was $58,038 ($ Thousands). |
| (C) | The rate reported is the effective yield at the time of purchase. |
| (D) | Security, or portion thereof, has been pledged as collateral on open futures. |
Cl — Class
L.P. — Limited Partnership
The Summary Schedule of Investments does not reflect the complete portfolio holdings. It includes the Fund’s 50 largest unaffiliated holdings and each investment of any issuer that exceeds 1% of the Fund’s net assets. “Other Securities” represent all issues not required to be disclosed under the rules adopted by the U.S. Securities and Exchange Commission (“SEC”). In certain instances, securities for which footnotes listed above may otherwise apply are included in the Other Securities caption. The complete schedule of portfolio holdings is available (i) without charge, upon request, by calling (800) 342-5734; and (ii) on the SEC’s website at http://www.sec.gov.
The following is a summary of the inputs used as of March 31, 2010 in valuing the Fund’s investments carried at value ($ Thousands):
| Investments in Securities | Level 1 | Level 2 | Level 3 | Total | ||||||||
Common Stock | $ | 415,587 | $ | 108 | $ | 420 | $ | 416,115 | ||||
Warrants | — | 2 | — | 2 | ||||||||
Affiliated Partnership | — | 58,038 | — | 58,038 | ||||||||
Cash Equivalent | 33,675 | — | — | 33,675 | ||||||||
U.S. Treasury Obligation | — | 2,159 | — | 2,159 | ||||||||
Total Investments in Securities | $ | 449,262 | $ | 60,307 | $ | 420 | $ | 509,989 | ||||
| Other Financial Instruments | Level 1 | Level 2 | Level 3 | Total | ||||||||||
Futures Contracts* | $ | (77 | ) | $ | — | $ | — | $ | (77 | ) | ||||
| * | Futures contracts are valued at unrealized depreciation on the instrument. |
The following is a reconciliation of the investments in which significant unobservable inputs (Level 3) were used in determining value ($ Thousands):
| Common Stock | ||||
Beginning balance as of October 1, 2009 | $ | 571 | ||
Accrued discounts/premiums | — | |||
Realized gain/(loss) | — | |||
Change in unrealized appreciation/(depreciation) | (139 | ) | ||
Net purchases/sales | — | |||
Net transfer in and/or out of Level 3 | (12 | ) | ||
Ending balance as of March 31, 2010 | $ | 420 | ||
Changes in unrealized gains (losses) included in earnings related to securities still held at reporting date | $ | (139 | ) | |
For more information on valuation inputs, see Note 2 — Significant Accounting Policies in Notes to Financial Statements.
The accompanying notes are an integral part of the financial statements.
| 16 | SEI Institutional Managed Trust / Semi-Annual Report / March 31, 2010 |
Table of Contents
SUMMARY SCHEDULE OF INVESTMENTS (Unaudited)
Tax-Managed Small Cap Fund
March 31, 2010
| Description | Percentage of Net Assets (%) | Shares | Market Value ($ Thousands) | |||||
COMMON STOCK — 95.1% | ||||||||
Consumer Discretionary — 17.4% | ||||||||
American Eagle Outfitters | 0.4 | % | 60,363 | $ | 1,118 | |||
Cracker Barrel Old Country Store | 0.3 | 19,258 | 893 | |||||
Dick’s Sporting Goods* | 0.3 | 35,380 | 924 | |||||
DreamWorks Animation SKG, Cl A* | 0.4 | 27,350 | 1,077 | |||||
Hanesbrands* | 0.4 | 44,740 | 1,245 | |||||
Jarden | 0.3 | 29,000 | 965 | |||||
Live Nation* | 0.4 | 80,103 | 1,161 | |||||
National CineMedia | 0.3 | 51,363 | 887 | |||||
PetSmart | 0.4 | 32,570 | 1,041 | |||||
Phillips-Van Heusen | 0.3 | 15,880 | 911 | |||||
Polaris Industries | 0.3 | 20,535 | 1,051 | |||||
Scientific Games, Cl A* | 0.5 | 96,490 | 1,359 | |||||
Williams-Sonoma | 0.3 | 35,090 | 923 | |||||
WMS Industries* | 0.4 | 29,636 | 1,243 | |||||
Wyndham Worldwide | 0.3 | 33,410 | 860 | |||||
Other Securities | 12.1 | 35,951 | ||||||
| 51,609 | ||||||||
Consumer Staples — 4.1% | ||||||||
Green Mountain Coffee Roasters* | 0.3 | 8,820 | 854 | |||||
Herbalife | 0.3 | 21,480 | 991 | |||||
Other Securities | 3.5 | 10,401 | ||||||
| 12,246 | ||||||||
Energy — 4.1% | ||||||||
Overseas Shipholding Group | 0.3 | 21,540 | 845 | |||||
Other Securities | 3.8 | 11,390 | ||||||
| 12,235 | ||||||||
Financials — 14.6% | ||||||||
ProAssurance* | 0.3 | 16,694 | 977 | |||||
Unum Group | 0.4 | 41,668 | 1,032 | |||||
Zions Bancorporation | 0.4 | 45,316 | 989 | |||||
| Description | Percentage of Net Assets (%) | Shares | Market Value ($ Thousands) | |||||
Other Securities | 13.5 | % | $ | 40,245 | ||||
| 43,243 | ||||||||
Health Care — 12.1% | ||||||||
Coventry Health Care* | 0.3 | 39,700 | 981 | |||||
ev3* | 0.3 | 55,300 | 877 | |||||
Health Net* | 0.4 | 45,715 | 1,137 | |||||
Onyx Pharmaceuticals* | 0.3 | 30,500 | 924 | |||||
Parexel International* | 0.3 | 36,450 | 850 | |||||
SXC Health Solutions* | 0.4 | 15,940 | 1,073 | |||||
Other Securities | 10.1 | 30,028 | ||||||
| 35,870 | ||||||||
Industrials — 14.0% | ||||||||
BE Aerospace* | 0.5 | 48,707 | 1,483 | |||||
Continental Airlines, Cl B* | 0.5 | 63,045 | 1,385 | |||||
Gardner Denver | 0.4 | 23,929 | 1,054 | |||||
JB Hunt Transport Services | 0.4 | 27,570 | 989 | |||||
SYKES Enterprises* | 0.7 | 90,497 | 2,067 | |||||
Triumph Group | 0.3 | 12,317 | 863 | |||||
Other Securities | 11.2 | 33,466 | ||||||
| 41,307 | ||||||||
Information Technology — 17.8% | ||||||||
Alliance Data Systems* | 0.3 | 15,000 | 960 | |||||
Equinix* | 0.5 | 14,380 | 1,400 | |||||
Gartner* | 0.4 | 49,740 | 1,106 | |||||
GSI Commerce* | 0.6 | 68,220 | 1,888 | |||||
Lawson Software* | 0.3 | 134,411 | 888 | |||||
Lexmark International, Cl A* | 0.4 | 35,150 | 1,268 | |||||
Microsemi* | 0.3 | 58,572 | 1,016 | |||||
PMC - Sierra* | 0.4 | 114,800 | 1,024 | |||||
TiVo* | 0.5 | 79,170 | 1,355 | |||||
VistaPrint* | 0.5 | 27,109 | 1,552 | |||||
Other Securities | 13.6 | 40,335 | ||||||
| 52,792 | ||||||||
Materials — 5.0% | ||||||||
Silgan Holdings | 0.4 | 18,495 | 1,114 | |||||
Other Securities | 4.6 | 13,759 | ||||||
| 14,873 | ||||||||
Telecommunication Services — 1.8% | ||||||||
NII Holdings* | 0.5 | 36,200 | 1,508 | |||||
SBA Communications, Cl A* | 0.6 | 47,710 | 1,721 | |||||
Other Securities | 0.7 | 2,114 | ||||||
| 5,343 | ||||||||
Utilities — 4.2% | ||||||||
AGL Resources | 0.5 | 34,098 | 1,318 | |||||
Great Plains Energy | 0.4 | 56,292 | 1,045 | |||||
NorthWestern | 0.3 | 32,525 | 872 | |||||
| SEI Institutional Managed Trust / Semi-Annual Report / March 31, 2010 | 17 |
Table of Contents
SUMMARY SCHEDULE OF INVESTMENTS (Unaudited)
Tax-Managed Small Cap Fund (Concluded)
March 31, 2010
| Description | Percentage of Net Assets (%) | Shares | Market Value ($ Thousands) | |||||
Portland General Electric | 0.4 | % | 53,681 | $ | 1,037 | |||
Other Securities | 2.6 | 7,986 | ||||||
| 12,258 | ||||||||
Total Common Stock | 281,776 | |||||||
EXCHANGE TRADED FUND — 0.1% | ||||||||
Other Securities | 0.1 | 172 | ||||||
Total Exchange Traded Fund | 172 | |||||||
CLOSED-END FUND — 0.0% | ||||||||
Other Securities | 0.0 | 13 | ||||||
Total Closed-End Fund | 13 | |||||||
CASH EQUIVALENT — 4.9% | ||||||||
SEI Daily Income Trust, | 4.9 | 14,667,326 | 14,667 | |||||
Total Cash Equivalent | 14,667 | |||||||
U.S. TREASURY OBLIGATION (B) — 0.2% | ||||||||
Other Securities | 0.2 | 623 | ||||||
Total U.S. Treasury Obligation | 623 | |||||||
AFFILIATED PARTNERSHIP — 0.2% | ||||||||
SEI Liquidity Fund, L.P., 0.210% (A)**† | 0.2 | 649,899 | 480 | |||||
Total Affiliated Partnership | 480 | |||||||
Total Investments — 100.5% | $ | 297,731 | ||||||
A summary of the open futures contracts held by the Fund at March 31, 2010, is as follows:
| Type of Contract | Number of Contracts Long (Short) | Expiration Date | Unrealized Appreciation ($ Thousands) | ||||
Russell 2000 Index E-MINI | 76 | Jun-2010 | $ | 24 | |||
S&P Mid 400 Index E-MINI | 50 | Jun-2010 | 57 | ||||
| $ | 81 | ||||||
For the period ended March 31, 2010, the total amount of all open futures contracts, as presented in the table above, are representative of the volume of activity for this derivative type during the period.
Percentages are based on Net Assets of $296,136 ($ Thousands).
| * | Non-income producing security. |
| ** | Rate shown is the 7-day effective yield as of March 31, 2010. |
| † | Investment in Affiliated Security (see Note 5). |
| (A) | This security was purchased with cash collateral received from securities on loan (see Note 9). The total value of such securities as of March 31, 2010 was $480 ($ Thousands). |
| (B) | Security, or portion thereof, has been pledged as collateral on open futures. |
Cl — Class
L.P. — Limited Partnership
The Summary Schedule of Investments does not reflect the complete portfolio holdings. It includes the Fund’s 50 largest unaffiliated holdings and each investment of any issuer that exceeds 1% of the Fund’s net assets. “Other Securities” represent all issues not required to be disclosed under the rules adopted by the U.S. Securities and Exchange Commission (“SEC”). In certain instances, securities for which footnotes listed above may otherwise apply are included in the Other Securities caption. The complete schedule of portfolio holdings is available (i) without charge, upon request, by calling (800) 342-5734; and (ii) on the SEC’s website at http://www.sec.gov.
The following is a summary of the inputs used as of March 31, 2010 in valuing the Fund’s investments carried at value ($ Thousands).
| Investments in Securities | Level 1 | Level 2 | Level 3 | Total | ||||||||
Common Stock | $ | 281,776 | $ | — | $ | — | $ | 281,776 | ||||
Exchange Traded Fund | 172 | — | — | 172 | ||||||||
Closed-End Fund | 13 | — | — | 13 | ||||||||
Cash Equivalent | 14,667 | — | — | 14,667 | ||||||||
U.S. Treasury Obligation | — | 623 | — | 623 | ||||||||
Affiliated Partnership | — | 480 | — | 480 | ||||||||
Total Investments in Securities | $ | 296,628 | $ | 1,103 | $ | — | $ | 297,731 | ||||
| Other Financial Instruments | Level 1 | Level 2 | Level 3 | Total | ||||||||
Futures Contracts* | $ | 81 | $ | — | $ | — | $ | 81 | ||||
| * | Futures contracts are valued at unrealized appreciation on the instrument. |
| 18 | SEI Institutional Managed Trust / Semi-Annual Report / March 31, 2010 |
Table of Contents
SUMMARY SCHEDULE OF INVESTMENTS (Unaudited)
Mid-Cap Fund
March 31, 2010
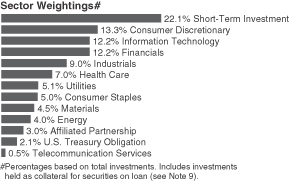
| Description | Percentage of Net Assets (%) | Shares | Market Value ($ Thousands) | |||||
COMMON STOCK — 75.3% | ||||||||
Consumer Discretionary — 13.7% | ||||||||
Dollar Tree* | 0.6 | % | 18,400 | $ | 1,090 | |||
Macy’s | 0.6 | 48,300 | 1,051 | |||||
Mattel | 0.5 | 42,000 | 955 | |||||
Ross Stores (A) | 0.6 | 21,900 | 1,171 | |||||
TJX | 1.0 | 41,400 | 1,760 | |||||
Wyndham Worldwide | 0.5 | 31,000 | 798 | |||||
Other Securities | 9.9 | 17,718 | ||||||
| 24,543 | ||||||||
Consumer Staples — 5.2% | ||||||||
ConAgra Foods | 0.5 | 34,900 | 875 | |||||
Constellation Brands, Cl A* | 0.4 | 43,500 | 715 | |||||
Del Monte Foods | 0.6 | 75,200 | 1,098 | |||||
Sara Lee | 0.4 | 55,300 | 770 | |||||
Other Securities | 3.3 | 5,806 | ||||||
| 9,264 | ||||||||
Energy — 4.2% | ||||||||
Cimarex Energy | 0.5 | 15,400 | 915 | |||||
El Paso | 0.6 | 104,100 | 1,128 | |||||
Murphy Oil | 0.6 | 20,300 | 1,141 | |||||
Spectra Energy | 0.5 | 35,700 | 804 | |||||
Other Securities | 2.0 | 3,413 | ||||||
| 7,401 | ||||||||
Financials — 12.6% | ||||||||
American Financial Group | 0.4 | 25,200 | 717 | |||||
Annaly Capital Management† | 0.6 | 65,500 | 1,125 | |||||
Hospitality Properties Trust† | 0.4 | 31,600 | 757 | |||||
RenaissanceRe Holdings | 0.4 | 14,100 | 800 | |||||
SL Green Realty† (A) | 0.4 | 12,400 | 710 | |||||
Other Securities | 10.4 | 18,372 | ||||||
| 22,481 | ||||||||
Health Care — 7.2% | ||||||||
AmerisourceBergen | 0.4 | 26,800 | 775 | |||||
Hospira* | 0.6 | 18,200 | 1,031 | |||||
| Description | Percentage of Net Assets (%) | Shares | Market Value ($ Thousands) | |||||
Humana* | 0.4 | % | 15,200 | $ | 711 | |||
Intuitive Surgical* | 0.4 | 2,200 | 766 | |||||
Kinetic Concepts* | 0.5 | 19,700 | 942 | |||||
Universal Health Services, Cl B | 0.5 | 23,600 | 828 | |||||
Other Securities | 4.4 | 7,857 | ||||||
| 12,910 | ||||||||
Industrials — 9.3% | ||||||||
Hubbell, Cl B | 0.4 | 14,500 | 731 | |||||
ITT | 0.5 | 17,900 | 960 | |||||
Joy Global | 0.5 | 16,400 | 928 | |||||
L-3 Communications Holdings | 0.6 | 12,400 | 1,136 | |||||
Oshkosh Truck | 0.6 | 26,800 | 1,081 | |||||
Timken | 0.4 | 24,200 | 726 | |||||
Other Securities | 6.3 | 11,017 | ||||||
| 16,579 | ||||||||
Information Technology — 12.7% | ||||||||
Arrow Electronics* | 0.4 | 25,200 | 759 | |||||
Avnet* | 0.6 | 33,500 | 1,005 | |||||
CA | 0.5 | 34,600 | 812 | |||||
Computer Sciences* | 0.5 | 15,600 | 850 | |||||
DST Systems (A) | 0.4 | 17,500 | 725 | |||||
Harris | 0.5 | 17,600 | 836 | |||||
Jabil Circuit | 0.6 | 63,100 | 1,022 | |||||
Marvell Technology Group* | 0.4 | 35,900 | 732 | |||||
Micron Technology* (A) | 0.5 | 87,000 | 904 | |||||
Seagate Technology | 0.6 | 57,800 | 1,055 | |||||
Western Digital* | 0.7 | 33,900 | 1,322 | |||||
Other Securities | 7.0 | 12,586 | ||||||
| 22,608 | ||||||||
Materials — 4.6% | ||||||||
Ashland | 0.6 | 19,300 | 1,019 | |||||
Celanese, Ser A | 0.4 | 25,500 | 812 | |||||
Lubrizol | 0.6 | 12,200 | 1,119 | |||||
Other Securities | 3.0 | 5,332 | ||||||
| 8,282 | ||||||||
Telecommunication Services — 0.5% | ||||||||
Other Securities | 0.5 | 864 | ||||||
Utilities — 5.3% | ||||||||
AES* | 0.4 | 65,000 | 715 | |||||
Constellation Energy Group | 0.6 | 29,600 | 1,039 | |||||
DTE Energy | 0.4 | 17,800 | 794 | |||||
Energen | 0.4 | 15,700 | 731 | |||||
Other Securities | 3.5 | 6,242 | ||||||
| 9,521 | ||||||||
Total Common Stock | 134,453 | |||||||
| SEI Institutional Managed Trust / Semi-Annual Report / March 31, 2010 | 19 |
Table of Contents
SUMMARY SCHEDULE OF INVESTMENTS (Unaudited)
Mid-Cap Fund (Concluded)
March 31, 2010
| Description | Percentage of Net Assets (%) | Shares/Face Amount ($ Thousands) | Market Value ($ Thousands) | |||||
CASH EQUIVALENT — 22.9% | ||||||||
SEI Daily Income Trust, Prime Obligation Fund, Cl A, 0.070%**†† | 22.9 | % | 40,839,175 | $ | 40,839 | |||
Total Cash Equivalent | 40,839 | |||||||
AFFILIATED PARTNERSHIP — 3.1% | ||||||||
SEI Liquidity Fund, L.P., 0.210% (B)**†† | 3.1 | 5,856,421 | 5,548 | |||||
Total Affiliated Partnership | 5,548 | |||||||
U.S. TREASURY OBLIGATION (C) (D) — 2.1% | ||||||||
U.S. Treasury Bills, | 2.1 | $3,854 | 3,853 | |||||
Total U.S. Treasury Obligation | 3,853 | |||||||
Total Investments — 103.4% | $ | 184,693 | ||||||
A summary of the open futures contracts held by the Fund at March 31, 2010, is as follows:
Type of Contract | Number of Contracts Long (Short) | Expiration Date | Unrealized Depreciation ($ Thousands) | |||||
S&P Mid 400 Index E-MINI | 560 | Jun-2010 | $ | (28 | ) | |||
For the year ended March 31, 2010, the total amount of all open futures contracts, as presented in the table above, are representative of the volume of activity for this derivative type during the period.
Percentages are based on Net Assets of $178,618 ($ Thousands).
| * | Non-income producing security. |
| ** | Rate shown is the 7-day effective yield as of March 31, 2010. |
| † | Real Estate Investment Trust. |
| †† | Investment in Affiliated Security (see Note 5). |
| (A) | This security or a partial position of this security is on loan at March 31, 2010 (see Note 9). The total market value of securities on loan at March 31, 2010 was $5,657 ($ Thousands). |
| (B) | This security was purchased with cash collateral received from securities on loan (see Note 9). The total value of such securities as of March 31, 2010 was $5,548 ($ Thousands). |
| (C) | The rate reported is the effective yield at the time of purchase. |
| (D) | Security, or portion thereof, has been pledged as collateral on open futures. |
Cl — Class
L.P. — Limited Partnership
Ser — Series
The Summary Schedule of Investments does not reflect the complete portfolio holdings. It includes the Fund’s 50 largest unaffiliated holdings and each investment of any issuer that exceeds 1% of the Fund’s net assets. “Other Securities” represent all issues not required to be disclosed under the rules adopted by the U.S. Securities and Exchange Commission (“SEC”). In certain instances, securities for which footnotes listed above may otherwise apply are included in the Other Securities caption. The complete schedule of portfolio holdings is available (i) without charge, upon request, by calling (800) 342-5734; and (ii) on the SEC’s website at http://www.sec.gov.
The following is a summary of the inputs used as of March 31, 2010 in valuing the Fund’s investments carried at value ($ Thousands):
| Investments in Securities | Level 1 | Level 2 | Level 3 | Total | ||||||||
Common Stock | $ | 134,453 | $ | — | $ | — | $ | 134,453 | ||||
Cash Equivalent | 40,839 | — | — | 40,839 | ||||||||
Affiliated Partnership | — | 5,548 | — | 5,548 | ||||||||
U.S. Treasury Obligation | — | 3,853 | — | 3,853 | ||||||||
Total Investments in Securities | $ | 175,292 | $ | 9,401 | $ | — | $ | 184,693 | ||||
| Other Financial Instruments | Level 1 | Level 2 | Level 3 | Total | ||||||||||
Futures Contracts* | $ | (28 | ) | $ | — | $ | — | $ | (28 | ) | ||||
| * | Futures contracts are valued at unrealized depreciation on the instrument. |
For more information on valuation inputs, see Note 2 — Significant Accounting Policies in Notes to Financial Statements.
The accompanying notes are an integral part of the financial statements.
| 20 | SEI Institutional Managed Trust / Semi-Annual Report / March 31, 2010 |
Table of Contents
SUMMARY SCHEDULE OF INVESTMENTS (Unaudited)
U.S. Managed Volatility Fund
March 31, 2010
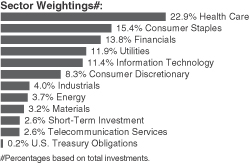
| Description | Percentage of Net Assets (%) | Shares | Market Value ($ Thousands) | |||||
COMMON STOCK — 95.4% | ||||||||
Consumer Discretionary — 8.1% | ||||||||
Amazon.com* | 1.2 | % | 33,471 | $ | 4,543 | |||
Strayer Education | 0.7 | 10,371 | 2,526 | |||||
Other Securities | 6.2 | 24,156 | ||||||
| 31,225 | ||||||||
Consumer Staples — 15.1% | ||||||||
Altria Group | 1.0 | 196,175 | 4,025 | |||||
Brown-Forman, Cl B | 1.2 | 73,714 | 4,382 | |||||
Campbell Soup | 0.7 | 73,907 | 2,613 | |||||
Hershey | 0.8 | 76,186 | 3,261 | |||||
Hormel Foods | 1.6 | 147,215 | 6,184 | |||||
Kimberly-Clark | 0.7 | 44,866 | 2,821 | |||||
Lorillard | 1.2 | 60,366 | 4,542 | |||||
Philip Morris International | 1.2 | 87,091 | 4,543 | |||||
Reynolds American | 1.2 | 83,320 | 4,498 | |||||
SYSCO | 1.2 | 152,839 | 4,509 | |||||
Other Securities | 4.3 | 16,544 | ||||||
| 57,922 | ||||||||
Energy — 3.6% | ||||||||
Chevron | 0.5 | 26,900 | 2,040 | |||||
Other Securities | 3.1 | 11,916 | ||||||
| 13,956 | ||||||||
Financials — 13.6% | ||||||||
Bank of Hawaii | 1.1 | 95,373 | 4,287 | |||||
Capitol Federal Financial | 0.6 | 57,298 | 2,147 | |||||
Commerce Bancshares | 1.4 | 133,173 | 5,479 | |||||
Cullen/Frost Bankers | 1.0 | 66,031 | 3,684 | |||||
First Citizens BancShares, Cl A | 0.6 | 11,436 | 2,273 | |||||
People’s United Financial | 0.8 | 194,780 | 3,046 | |||||
TFS Financial | 0.8 | 238,535 | 3,185 | |||||
Other Securities | 7.3 | 28,024 | ||||||
| 52,125 | ||||||||
Health Care — 22.5% | ||||||||
Abbott Laboratories | 1.4 | 102,280 | 5,388 | |||||
| Description | Percentage of Net Assets (%) | Shares | Market Value ($ Thousands) | |||||
AmerisourceBergen | 1.6 | % | 218,226 | $ | 6,311 | |||
Amgen* | 1.2 | 76,076 | 4,546 | |||||
Baxter International | 0.8 | 55,195 | 3,212 | |||||
Becton Dickinson | 1.2 | 57,460 | 4,524 | |||||
Biogen Idec* | 1.2 | 78,674 | 4,513 | |||||
C.R. Bard | 1.1 | 49,614 | 4,298 | |||||
Cardinal Health | 1.2 | 125,211 | 4,511 | |||||
Forest Laboratories* | 1.0 | 123,040 | 3,859 | |||||
Genzyme* | 1.3 | 95,329 | 4,941 | |||||
Gilead Sciences* | 1.1 | 91,190 | 4,147 | |||||
Johnson & Johnson | 1.2 | 69,099 | 4,505 | |||||
McKesson | 1.7 | 98,316 | 6,461 | |||||
Millipore* | 0.8 | 29,987 | 3,167 | |||||
Techne | 1.0 | 63,609 | 4,051 | |||||
Other Securities | 4.7 | 17,849 | ||||||
| 86,283 | ||||||||
Industrials — 3.9% | ||||||||
Other Securities | 3.9 | 14,875 | ||||||
Information Technology — 11.2% | ||||||||
Analog Devices | 0.9 | 114,926 | 3,312 | |||||
Google, Cl A* | 1.1 | 7,534 | 4,272 | |||||
Intel | 1.2 | 204,628 | 4,555 | |||||
International Business Machines | 1.2 | 35,604 | 4,566 | |||||
Tech Data* | 1.0 | 94,708 | 3,968 | |||||
Texas Instruments | 1.1 | 169,858 | 4,157 | |||||
Other Securities | 4.7 | 18,072 | ||||||
| 42,902 | ||||||||
Materials — 3.2% | ||||||||
Newmont Mining | 0.9 | 69,372 | 3,533 | |||||
Other Securities | 2.3 | 8,700 | ||||||
| 12,233 | ||||||||
Telecommunication Services — 2.5% | ||||||||
AT&T | 0.5 | 79,900 | 2,065 | |||||
Other Securities | 2.0 | 7,593 | ||||||
| 9,658 | ||||||||
Utilities — 11.7% | ||||||||
AGL Resources | 0.8 | 82,355 | 3,183 | |||||
Atmos Energy | 0.9 | 125,435 | 3,584 | |||||
Nicor | 1.1 | 96,596 | 4,049 | |||||
NSTAR | 0.9 | 98,046 | 3,473 | |||||
UGI | 0.7 | 92,584 | 2,457 | |||||
Vectren | 0.7 | 105,405 | 2,606 | |||||
Wisconsin Energy | 1.2 | 94,324 | 4,661 | |||||
Other Securities | 5.4 | 20,696 | ||||||
| 44,709 | ||||||||
Total Common Stock | 365,888 | |||||||
| SEI Institutional Managed Trust / Semi-Annual Report / March 31, 2010 | 21 |
Table of Contents
SUMMARY SCHEDULE OF INVESTMENTS (Unaudited)
U.S. Managed Volatility Fund (Concluded)
March 31, 2010
| Description | Percentage of Net Assets (%) | Shares | Market Value ($ Thousands) | |||||
CASH EQUIVALENT — 2.6% | ||||||||
SEI Daily Income Trust, | 2.6 | % | 9,834,857 | $ | 9,835 | |||
Total Cash Equivalent | 9,835 | |||||||
U.S. TREASURY OBLIGATIONS (A) — 0.2% | ||||||||
Other Securities | 0.2 | 888 | ||||||
Total U.S. Treasury Obligations | 888 | |||||||
Total Investments — 98.2% | $ | 376,611 | ||||||
A summary of the open futures contracts held by the Fund at March 31, 2010, is as follows:
| Type of Contract | Number of Contracts Long (Short) | Expiration Date | Unrealized Appreciation ($ Thousands) | ||||
S&P 500 Index E-MINI | 182 | Jun-2010 | $ | 90 | |||
For the period ended March 31, 2010, the total amount of all open futures contracts, as presented in the table above, are representative of the volume of activity for this derivative type during the period.
Percentages are based on Net Assets of $383,651 ($ Thousands).
| * | Non-income producing security. |
| ** | Rate shown is the 7-day effective yield as of March 31, 2010. |
| † | Investment in Affiliated Investment (see Note 5). |
| (A) | Security, or portion thereof, has been pledged as collateral on open futures contracts. |
Cl — Class
The Summary Schedule of Investments does not reflect the complete portfolio holdings. It includes the Fund’s 50 largest unaffiliated holdings and each investment of any issuer that exceeds 1% of the Fund’s net assets. “Other Securities” represent all issues not required to be disclosed under the rules adopted by the U.S. Securities and Exchange Commission (“SEC”). In certain instances, securities for which footnotes listed above may otherwise apply are included in the Other Securities caption. The complete schedule of portfolio holdings is available (i) without charge, upon request, by calling (800) 342-5734; and (ii) on the SEC’s website at http://www.sec.gov.
The following is a summary of the inputs used as of March 31, 2010 in valuing the Fund’s investments carried at value ($ Thousands):
| Investments in Securities | Level 1 | Level 2 | Level 3 | Total | ||||||||
Common Stock | $ | 365,888 | $ | — | $ | — | $ | 365,888 | ||||
Cash Equivalent | 9,835 | — | — | 9,835 | ||||||||
U.S. Treasury Obligations | — | 888 | — | 888 | ||||||||
Total Investments in Securities | $ | 375,723 | $ | 888 | $ | — | $ | 376,611 | ||||
| Other Financial Instruments | Level 1 | Level 2 | Level 3 | Total | ||||||||
Futures* | $ | 90 | $ | — | $ | — | $ | 90 | ||||
| * | Futures contracts are valued at unrealized appreciation on the instrument. |
For more information on valuation inputs, see Note 2 — Significant Accounting Policies in Notes to Financial Statements.
The accompanying notes are an integral part of the financial statements.
| 22 | SEI Institutional Managed Trust / Semi-Annual Report / March 31, 2010 |
Table of Contents
SUMMARY SCHEDULE OF INVESTMENTS (Unaudited)
Global Managed Volatility Fund
March 31, 2010
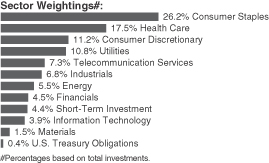
| Description | Percentage of Net Assets (%) | Shares | Market Value ($ Thousands) | |||||
COMMON STOCK — 94.2% | ||||||||
Australia — 5.1% | ||||||||
Origin Energy | 0.6 | % | 101,311 | $ | 1,539 | |||
TABCORP Holdings | 0.7 | 292,471 | 1,852 | |||||
Tatts Group | 0.6 | 719,343 | 1,624 | |||||
Wesfarmers | 1.3 | 112,832 | 3,298 | |||||
Other Securities | 1.9 | 5,012 | ||||||
| 13,325 | ||||||||
Belgium — 2.1% | ||||||||
Colruyt | 1.1 | 11,515 | 2,840 | |||||
Mobistar | 0.5 | 21,195 | 1,307 | |||||
Other Securities | 0.5 | 1,369 | ||||||
| 5,516 | ||||||||
Canada — 11.8% | ||||||||
Alimentation Couche Tard, Cl B | 1.2 | 177,900 | 3,246 | |||||
BCE | 1.2 | 103,400 | 3,039 | |||||
CGI Group, Cl A* | 0.8 | 138,500 | 2,075 | |||||
Empire, Cl A | 0.7 | 36,200 | 1,880 | |||||
Enbridge | 1.0 | 52,200 | 2,492 | |||||
Goldcorp | 0.7 | 50,700 | 1,897 | |||||
Metro, Cl A | 0.7 | 46,200 | 1,917 | |||||
Saputo | 1.1 | 100,700 | 2,936 | |||||
Other Securities | 4.4 | 11,097 | ||||||
| 30,579 | ||||||||
| �� | ||||||||
Cayman Islands — 0.0% | ||||||||
Other Securities | 0.0 | 105 | ||||||
Denmark — 1.7% | ||||||||
Coloplast, Cl B | 0.8 | 18,992 | 2,095 | |||||
Novo Nordisk, Cl B | 0.9 | 29,483 | 2,292 | |||||
| 4,387 | ||||||||
Finland — 0.9% | ||||||||
Other Securities | 0.9 | 2,196 | ||||||
| Description | Percentage of Net Assets (%) | Shares | Market Value ($ Thousands) | |||||
France — 1.9% | ||||||||
France Telecom | 0.6 | % | 69,456 | $ | 1,665 | |||
Societe BIC | 0.7 | 23,393 | 1,794 | |||||
Other Securities | 0.6 | 1,510 | ||||||
| 4,969 | ||||||||
Germany — 1.7% | ||||||||
Other Securities | 1.7 | 4,309 | ||||||
Greece — 0.1% | ||||||||
Other Securities | 0.1 | 222 | ||||||
Hong Kong — 2.7% | ||||||||
CLP Holdings | 1.3 | 470,500 | 3,363 | |||||
HongKong Electric Holdings | 0.9 | 399,500 | 2,369 | |||||
Other Securities | 0.5 | 1,298 | ||||||
| 7,030 | ||||||||
Ireland — 0.4% | ||||||||
Other Securities | 0.4 | 1,128 | ||||||
Italy — 2.2% | ||||||||
Snam Rete Gas | 1.4 | 677,461 | 3,440 | |||||
Other Securities | 0.8 | 2,247 | ||||||
| 5,687 | ||||||||
Japan — 21.1% | ||||||||
Asahi Breweries | 1.0 | 133,700 | 2,508 | |||||
Benesse | 0.6 | 36,200 | 1,569 | |||||
Chubu Electric Power | 0.9 | 94,700 | 2,368 | |||||
Fuji Electric Holdings | 0.8 | 789,000 | 2,153 | |||||
Kansai Electric Power | 0.9 | 105,100 | 2,409 | |||||
Kyushu Electric Power | 0.6 | 70,600 | 1,538 | |||||
Lawson | 0.8 | 47,400 | 2,024 | |||||
Nippon Telegraph & Telephone | 0.5 | 28,100 | 1,185 | |||||
NTT DoCoMo | 1.4 | 2,415 | 3,680 | |||||
Sankyo | 0.6 | 31,200 | 1,544 | |||||
Yamato Holdings | 0.6 | 117,100 | 1,647 | |||||
Other Securities | 12.4 | 32,111 | ||||||
| 54,736 | ||||||||
Luxembourg — 0.2% | ||||||||
Other Securities | 0.2 | 423 | ||||||
Netherlands — 1.0% | ||||||||
Other Securities | 1.0 | 2,689 | ||||||
New Zealand — 0.0% | ||||||||
Other Securities | 0.0 | 108 | ||||||
Singapore — 0.1% | ||||||||
Other Securities | 0.1 | 130 | ||||||
| SEI Institutional Managed Trust / Semi-Annual Report / March 31, 2010 | 23 |
Table of Contents
SUMMARY SCHEDULE OF INVESTMENTS (Unaudited)
Global Managed Volatility Fund (Concluded)
March 31, 2010
| Description | Percentage of Net Assets (%) | Shares | Market Value ($ Thousands) | |||||
Spain — 0.4% | ||||||||
Other Securities | 0.4 | % | $ | 1,037 | ||||
Sweden — 1.2% | ||||||||
Electrolux | 1.0 | 107,721 | 2,469 | |||||
Other Securities | 0.2 | 645 | ||||||
| 3,114 | ||||||||
Switzerland — 1.5% | ||||||||
Other Securities | 1.5 | 3,747 | ||||||
United Kingdom — 6.4% | ||||||||
AstraZeneca | 1.5 | 90,347 | 4,028 | |||||
BP | 1.6 | 444,355 | 4,202 | |||||
Reckitt Benckiser Group | 1.3 | 59,547 | 3,267 | |||||
Other Securities | 2.0 | 5,133 | ||||||
| 16,630 | ||||||||
United States — 31.7% | ||||||||
Abbott Laboratories | 1.0 | 49,000 | 2,581 | |||||
Amgen* | 0.7 | 30,289 | 1,810 | |||||
Annaly Capital Management† | 1.1 | 171,800 | 2,952 | |||||
C.R. Bard | 1.0 | 30,700 | 2,659 | |||||
Campbell Soup | 0.9 | 67,969 | 2,403 | |||||
Clorox | 1.0 | 40,200 | 2,579 | |||||
Constellation Energy Group | 0.8 | 56,400 | 1,980 | |||||
Family Dollar Stores | 1.1 | 80,949 | 2,963 | |||||
General Mills | 1.3 | 45,900 | 3,249 | |||||
Hormel Foods | 1.0 | 64,281 | 2,701 | |||||
Kimberly-Clark | 0.6 | 25,626 | 1,611 | |||||
Lorillard | 0.7 | 25,640 | 1,929 | |||||
Magellan Health Services* | 0.6 | 34,700 | 1,509 | |||||
Raytheon | 1.1 | 50,800 | 2,902 | |||||
TJX | 1.0 | 61,000 | 2,594 | |||||
Wal-Mart Stores | 1.4 | 66,600 | 3,703 | |||||
Other Securities | 16.4 | 42,194 | ||||||
| 82,319 | ||||||||
Total Common Stock | 244,386 | |||||||
CASH EQUIVALENT — 4.3% | ||||||||
SEI Daily Income Trust, Prime Obligation Fund, Cl A, 0.070%**†† | 4.3 | 11,262,948 | 11,263 | |||||
Total Cash Equivalent | 11,263 | |||||||
| Description | Percentage of Net Assets (%) | Market Value ($ Thousands) | ||||
U.S. TREASURY OBLIGATIONS (A) — 0.4% | ||||||
Other Securities | 0.4 | % | $ | 983 | ||
Total U.S. Treasury Obligations |
| 983 | ||||
Total Investments — 98.9% |
| $ | 256,632 | |||
A summary of the open futures contracts held by the Fund at March 31, 2010, is as follows:
Type of Contract | Number of Contracts Long (Short) | Expiration Date | Unrealized Appreciation ($ Thousands) | ||||
DJ Euro Stoxx 50 Index | 47 | Jun-2010 | $ | 13 | |||
FTSE 100 Index | 15 | Jun-2010 | 8 | ||||
Hang Seng Index | 1 | Apr-2010 | 1 | ||||
S&P 500 Composite Index | 17 | Jun-2000 | 68 | ||||
SPI 200 Index | 3 | Jun-2010 | 1 | ||||
| $ | 91 | ||||||
For the period ended March 31, 2010, the total amount of all open futures contracts, as presented in the table above, are representative of the volume of activity for this derivative type during the period.
A summary of the outstanding forward foreign currency contracts held by the Fund at March 31, 2010, is as follows:
| Maturity Date | Currency to Deliver (Thousands) | Currency to Receive (Thousands) | Unrealized Appreciation (Depreciation) ($ Thousands) | |||||||||
4/28/10 | AUD | 12,539 | USD | 11,299 | $ | (175 | ) | |||||
4/28/10 | CAD | 33,388 | USD | 32,475 | (441 | ) | ||||||
4/28/10 | EUR | 27,674 | USD | 37,084 | (358 | ) | ||||||
4/28/10 | GBP | 11,582 | USD | 17,257 | (307 | ) | ||||||
4/28/10 | JPY | 5,751,491 | USD | 62,147 | 574 | |||||||
4/28/10 | USD | 153 | AUD | 167 | 1 | |||||||
4/28/10 | USD | 323 | CAD | 329 | 1 | |||||||
4/28/10 | USD | 539 | EUR | 400 | 2 | |||||||
4/28/10 | USD | 209 | GBP | 139 | 2 | |||||||
4/28/10 | USD | 76 | JPY | 7,046 | (1 | ) | ||||||
| $ | (702 | ) | ||||||||||
Percentages are based on Net Assets of $259,365 ($ Thousands).
| * | Non-income producing security. |
| ** | Rate shown is the 7-day effective yield as of March 31, 2010. |
| † | Real Estate Investment Trust. |
| †† | Investment in Affiliated Security (see Note 5). |
| (A) | Security, or portion thereof, has been pledged as collateral on open futures. |
AUD — Australia Dollar
CAD — Canadian Dollar
Cl — Class
EUR — Euro
GBP — British Pound Sterling
JPY — Japanese Yen
USD — United States Dollar
The Summary Schedule of Investments does not reflect the complete portfolio holdings. It includes the Fund’s 50 largest unaffiliated holdings and each investment of any issuer that exceeds 1% of the Fund’s net assets. “Other Securities” represent all issues not required to be disclosed under the rules adopted by the U.S. Securities and Exchange Commission (“SEC”). In certain instances, securities for which footnotes listed above may otherwise apply are included in the Other Securities caption. The complete schedule of portfolio holdings is available (i) without charge, upon request, by calling (800) 342-5734; and (ii) on the SEC’s website at http://www.sec.gov.
| 24 | SEI Institutional Managed Trust / Semi-Annual Report / March 31, 2010 |
Table of Contents
The following is a summary of the inputs used as of March 31, 2010 in valuing the Fund’s investments carried at value ($ Thousands):
| Investments in Securities | Level 1 | Level 2 | Level 3 | Total | ||||||||
Common Stock | $ | 244,386 | $ | — | $ | — | $ | 244,386 | ||||
Cash Equivalent | 11,263 | — | — | 11,263 | ||||||||
U.S. Treasury Obligations | — | 983 | — | 983 | ||||||||
Total Investments in Securities | $ | 255,649 | $ | 983 | $ | — | $ | 256,632 | ||||
| Other Financial Instruments | Level 1 | Level 2 | Level 3 | Total | ||||||||||
Futures Contracts* | $ | 91 | $ | — | $ | — | $ | 91 | ||||||
Forwards* | — | (702 | ) | — | (702 | ) | ||||||||
Total Other Financial Instruments | $ | 91 | $ | (702 | ) | $ | — | $ | (611 | ) | ||||
| * | Futures contracts and Forwards are valued at unrealized appreciation (depreciation) on the instrument. |
For more information on valuation inputs, see Note 2 — Significant Accounting Policies in Notes to Financial Statements.
The accompanying notes are an integral part of the financial statements.
| SEI Institutional Managed Trust / Semi-Annual Report / March 31, 2010 | 25 |
Table of Contents
SUMMARY SCHEDULE OF INVESTMENTS (Unaudited)
Tax-Managed Managed Volatility Fund
March 31, 2010
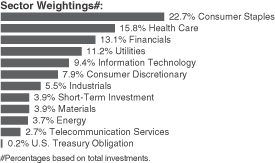
| Description | Percentage of Net Assets (%) | Shares | Market Value ($ Thousands) | |||||
COMMON STOCK — 95.9% | ||||||||
Consumer Discretionary — 7.9% | ||||||||
priceline.com* | 1.3 | % | 10,422 | $ | 2,658 | |||
Other Securities | 6.6 | 13,161 | ||||||
| 15,819 | ||||||||
Consumer Staples — 22.7% | ||||||||
Altria Group | 1.2 | 115,481 | 2,370 | |||||
Brown-Forman, Cl B | 0.7 | 25,558 | 1,519 | |||||
Church & Dwight | 1.4 | 42,119 | 2,820 | |||||
Coca-Cola | 0.9 | 33,334 | 1,833 | |||||
Colgate-Palmolive | 1.2 | 28,403 | 2,422 | |||||
General Mills | 1.6 | 43,826 | 3,103 | |||||
Hershey | 0.7 | 33,694 | 1,442 | |||||
HJ Heinz | 0.6 | 25,538 | 1,165 | |||||
Hormel Foods | 1.2 | 58,497 | 2,458 | |||||
JM Smucker | 0.8 | 27,275 | 1,644 | |||||
Kellogg | 1.4 | 53,143 | 2,839 | |||||
Kimberly-Clark | 1.4 | 43,911 | 2,761 | |||||
Lorillard | 1.2 | 31,111 | 2,341 | |||||
McCormick | 0.8 | 41,483 | 1,591 | |||||
PepsiCo | 0.6 | 17,439 | 1,154 | |||||
Philip Morris International | 1.1 | 43,777 | 2,283 | |||||
Procter & Gamble | 0.9 | 28,324 | 1,792 | |||||
Reynolds American | 1.2 | 45,068 | 2,433 | |||||
Wal-Mart Stores | 0.9 | 33,220 | 1,847 | |||||
Other Securities | 2.9 | 5,537 | ||||||
| 45,354 | ||||||||
Energy — 3.7% | ||||||||
Other Securities | 3.7 | 7,396 | ||||||
Financials — 13.1% | ||||||||
Capitol Federal Financial | 1.3 | 69,452 | 2,602 | |||||
Commerce Bancshares | 1.0 | 47,924 | 1,972 | |||||
People’s United Financial | 1.0 | 133,778 | 2,092 | |||||
TFS Financial | 1.6 | 234,620 | 3,132 | |||||
Wesco Financial | 0.8 | 4,402 | 1,697 | |||||
Other Securities | 7.4 | 14,680 | ||||||
| 26,175 | ||||||||
| Description | Percentage of Net Assets (%) | Shares | Market Value ($ Thousands) | |||||
Health Care — 15.8% | ||||||||
Abbott Laboratories | 1.1 | % | 40,451 | $ | 2,131 | |||
Allscripts Healthcare Solutions* | 1.2 | 125,429 | 2,454 | |||||
AmerisourceBergen | 1.3 | 92,948 | 2,688 | |||||
C.R. Bard | 0.7 | 14,896 | 1,290 | |||||
Dentsply International | 0.8 | 47,105 | 1,642 | |||||
Edwards Lifesciences* | 0.8 | 15,744 | 1,557 | |||||
Henry Schein* | 1.1 | 36,204 | 2,132 | |||||
Idexx Laboratories* | 1.0 | 34,700 | 1,997 | |||||
Johnson & Johnson | 1.0 | 31,109 | 2,028 | |||||
Laboratory Corp of America Holdings* | 0.7 | 18,250 | 1,382 | |||||
Techne | 0.8 | 24,870 | 1,584 | |||||
Other Securities | 5.3 | 10,783 | ||||||
| 31,668 | ||||||||
Industrials — 5.5% | ||||||||
Dun & Bradstreet | 0.7 | 18,905 | 1,407 | |||||
Stericycle* | 1.0 | 37,446 | 2,041 | |||||
Other Securities | 3.8 | 7,594 | ||||||
| 11,042 | ||||||||
Information Technology — 9.5% | ||||||||
Cree* | 0.7 | 20,029 | 1,406 | |||||
Google, Cl A* | 1.3 | 4,572 | 2,592 | |||||
IAC* | 1.2 | 102,041 | 2,321 | |||||
Tech Data* | 0.7 | 34,512 | 1,446 | |||||
Zebra Technologies, Cl A* | 0.7 | 48,247 | 1,428 | |||||
Other Securities | 4.9 | 9,715 | ||||||
| 18,908 | ||||||||
Materials — 3.8% | ||||||||
Newmont Mining | 1.2 | 45,183 | 2,301 | |||||
Other Securities | 2.6 | 5,267 | ||||||
| 7,568 | ||||||||
Telecommunication Services — 2.7% | ||||||||
Other Securities | 2.7 | 5,361 | ||||||
Utilities — 11.2% | ||||||||
Hawaiian Electric Industries | 0.7 | 58,670 | 1,317 | |||||
NSTAR | 1.4 | 78,413 | 2,777 | |||||
OGE Energy | 1.0 | 51,903 | 2,021 | |||||
SCANA | 0.6 | 33,337 | 1,253 | |||||
Vectren | 0.6 | 53,148 | 1,314 | |||||
Wisconsin Energy | 0.8 | 32,605 | 1,611 | |||||
Other Securities | 6.1 | 12,106 | ||||||
| 22,399 | ||||||||
Total Common Stock | 191,690 | |||||||
| 26 | SEI Institutional Managed Trust / Semi-Annual Report / March 31, 2010 |
Table of Contents
| Description | Percentage of Net Assets (%) | Shares | Market Value ($ Thousands) | |||||
CASH EQUIVALENT — 3.9% | ||||||||
SEI Daily Income Trust, Prime Obligation Fund, Cl A, 0.070%**† | 3.9 | % | 7,790,116 | $ | 7,790 | |||
Total Cash Equivalent | 7,790 | |||||||
U.S. TREASURY OBLIGATION (A) — 0.3% | ||||||||
Other Securities | 0.3 | 545 | ||||||
Total U.S. Treasury Obligation | 545 | |||||||
Total Investments — 100.1% | $ | 200,025 | ||||||
A summary of the open futures contracts held by the Fund at March 31, 2010, is as follows:
| Type of Contract | Number of Contracts Long (Short) | Expiration Date | Unrealized Appreciation ($ Thousands) | ||||
S&P 500 Index EMINI | 70 | Jun-2010 | $ | 66 | |||
For the period ended March 31, 2010, the total amount of all open futures contracts, as presented in the table above, are representative of the volume of activity for this derivative type during the period.
Percentages are based on Net Assets of $199,921 ($ Thousands).
| * | Non-income producing security. |
| ** | Rate shown is the 7-day effective yield as of March 31, 2010. |
| † | Investment in Affiliated Security (see Note 5). |
| (A) | Security, or portion thereof, has been pledged as collateral on open futures. |
Cl — Class
The Summary Schedule of Investments does not reflect the complete portfolio holdings. It includes the Fund’s 50 largest unaffiliated holdings and each investment of any issuer that exceeds 1% of the Fund’s net assets. “Other Securities” represent all issues not required to be disclosed under the rules adopted by the U.S. Securities and Exchange Commission (“SEC”). In certain instances, securities for which footnotes listed above may otherwise apply are included in the Other Securities caption. The complete schedule of portfolio holdings is available (i) without charge, upon request, by calling (800) 342-5734; and (ii) on the SEC’s website at http://www.sec.gov.
The following is a summary of the inputs used as of March 31, 2010 in valuing the Fund’s investments carried at value ($ Thousands):
| Investments in Securities | Level 1 | Level 2 | Level 3 | Total | ||||||||
Common Stock | $ | 191,690 | $ | — | $ | — | $ | 191,690 | ||||
Cash Equivalent | 7,790 | — | — | 7,790 | ||||||||
U.S. Treasury Obligation | — | 545 | — | 545 | ||||||||
Total Investments in Securities | $ | 199,480 | $ | 545 | $ | — | $ | 200,025 | ||||
| Other Financial Instruments | Level 1 | Level 2 | Level 3 | Total | ||||||||
Futures Contracts* | $ | 66 | $ | — | $ | — | $ | 66 | ||||
| * | Futures contracts are valued at unrealized appreciation on the instrument. |
For more information on valuation inputs, see Note 2 — Significant Accounting Policies in Notes to Financial Statements.
The accompanying notes are an integral part of the financial statements.
| SEI Institutional Managed Trust / Semi-Annual Report / March 31, 2010 | 27 |
Table of Contents
SCHEDULE OF INVESTMENTS (Unaudited)
Real Estate Fund
March 31, 2010
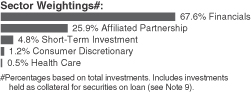
| Description | Shares | Market Value ($ Thousands) | |||
COMMON STOCK — 87.4% | |||||
Consumer Discretionary — 1.5% | |||||
Accor | 20,376 | $ | 1,129 | ||
Marriott International, Cl A (A) | 63,700 | 2,008 | |||
Thomas Cook Group | 138,405 | 566 | |||
| 3,703 | |||||
Financials — 85.2% | |||||
Alexandria Real Estate Equities† (A) | 29,900 | 2,021 | |||
AMB Property† (A) | 518,500 | 14,124 | |||
Apartment Investment & Management, Cl A† (A) | 235,084 | 4,328 | |||
AvalonBay Communities† (A) | 91,398 | 7,892 | |||
Boston Properties† (A) | 153,983 | 11,617 | |||
Brookfield Asset Management, Cl A | 151,800 | 3,859 | |||
Camden Property Trust† | 62,800 | 2,614 | |||
Corporate Office Properties Trust† (A) | 71,400 | 2,865 | |||
CreXus Investment† | 55,700 | 745 | |||
Dexus Property Group† | 730,302 | 543 | |||
Douglas Emmett† (A) | 442,899 | 6,807 | |||
Duke Realty† (A) | 135,000 | 1,674 | |||
Equity Residential† (A) | 296,350 | 11,602 | |||
Essex Property Trust† (A) | 68,150 | 6,130 | |||
Extra Space Storage† (A) | 105,550 | 1,338 | |||
Federal Realty Investment Trust† (A) | 65,450 | 4,765 | |||
Forest City Enterprises, Cl A* (A) | 340,100 | 4,901 | |||
Hammerson (United Kingdom)† | 92,038 | 549 | |||
HCP† (A) | 229,450 | 7,572 | |||
Health Care† (A) | 33,800 | 1,529 | |||
Host Hotels & Resorts† (A) | 758,029 | 11,105 | |||
Kimco Realty† | 448,400 | 7,013 | |||
Liberty Property Trust† | 51,300 | 1,741 | |||
Macerich† (A) | 141,083 | 5,405 | |||
Mack-Cali Realty† | 148,850 | 5,247 | |||
MFA Financial† | 61,900 | 456 | |||
Piedmont Office Realty Trust, Cl A† (A) | 38,200 | 758 | |||
Plum Creek Timber† | 73,700 | 2,868 | |||
PS Business Parks† | 7,900 | 422 | |||
Public Storage† (A) | 138,454 | 12,736 | |||
Regency Centers† (A) | 185,900 | 6,966 | |||
RioCan Real Estate Investment Trust† | 28,700 | 523 | |||
Saul Centers† | 83,900 | 3,473 | |||
Senior Housing Properties Trust† | 134,550 | 2,980 | |||
Simon Property Group† (A) | 175,263 | 14,705 | |||
Sunstone Hotel Investors* † (A) | 132,250 | 1,477 | |||
| Description | Shares | Market Value ($ Thousands) | |||
Taubman Centers† (A) | 64,800 | $ | 2,587 | ||
Terreno Realty* † | 26,300 | 519 | |||
UDR† (A) | 198,700 | 3,505 | |||
Unibail (France)† | 15,170 | 3,079 | |||
Ventas† (A) | 138,400 | 6,571 | |||
Verde Realty PIPE* (C) (D) | 21,400 | 475 | |||
Vornado Realty Trust† (A) | 147,831 | 11,191 | |||
Westfield Group† | 152,012 | 1,683 | |||
| 204,960 | |||||
Health Care — 0.7% | |||||
Brookdale Senior Living* (A) | 76,800 | 1,600 | |||
Total Common Stock | 210,263 | ||||
AFFILIATED PARTNERSHIP — 32.7% | |||||
SEI Liquidity Fund, L.P., 0.210% (B)**†† | 80,159,605 | 78,501 | |||
Total Affiliated Partnership | 78,501 | ||||
CASH EQUIVALENT — 6.0% | |||||
SEI Daily Income Trust, Prime Obligation Fund, Cl A, 0.070%**†† | 14,390,213 | 14,390 | |||
Total Cash Equivalent | 14,390 | ||||
Total Investments — 126.1% | $ | 303,154 | |||
Percentages are based on Net Assets of $240,497 ($ Thousands).
| * | Non-income producing security. |
| ** | Rate shown is the 7-day effective yield as of March 31, 2010. |
| † | Real Estate Investment Trust. |
| †† | Investment in Affiliated Security (see Note 5). |
| (A) | This security or a partial position of this security is on loan at March 31, 2010 (see Note 9). The total market value of securities on loan at March 31, 2010 was $77,454 ($ Thousands) |
| (B) | This security was purchased with cash collateral received from securities on loan (see Note 9). The total value of such securities as of March 31, 2010 was $78,501 ($ Thousands). |
| (C) | Security fair valued using methods determined in good faith by the Valuation Committee of the Board of Trustees. The total market value of such securities as of March 31, 2010 was $475 ($ Thousands) and represented 0.2% of net Assets. |
| (D) | Security considered illiquid and restricted. The total market value of such securities as of March 31, 2010 was $475 ($ Thousands) and represented 0.2% of net Assets. |
Cl — Class
L.P. — Limited Partnership
PIPE — Private Investment in Public Entity
| 28 | SEI Institutional Managed Trust / Semi-Annual Report / March 31, 2010 |
Table of Contents
The following is a summary of the inputs used as of March 31, 2010 in valuing the Fund’s investments carried at value ($ Thousands):
| Investments in Securities | Level 1 | Level 2 | Level 3 | Total | ||||||||
Common Stock | $ | 209,788 | $ | — | $ | 475 | $ | 210,263 | ||||
Affiliated Partnership | — | 78,501 | — | 78,501 | ||||||||
Cash Equivalent | 14,390 | — | — | 14,390 | ||||||||
Total Investments in Securities | $ | 224,178 | $ | 78,501 | $ | 475 | $ | 303,154 | ||||
The following is a reconciliation on the investments in which significant unobservable inputs (Level 3) were used in determining value ($ Thousands):
| Common Stock | |||
Beginning balance as of October 1, 2009 | $ | 451 | |
Accrued discounts/premiums | — | ||
Realized gain/(loss) | — | ||
Change in unrealized appreciation/(depreciation) | 24 | ||
Net purchases/sales | — | ||
Net transfer in and/or out of Level 3 | — | ||
Ending balance as of March 31, 2010 | $ | 475 | |
Changes in unrealized gains (losses) included in earnings related to securities still held at reporting date | $ | 24 | |
For more information on valuation inputs, see Note 2 — Significant Accounting Policies in Notes to Financial Statements.
The accompanying notes are an integral part of the financial statements.
| SEI Institutional Managed Trust / Semi-Annual Report / March 31, 2010 | 29 |
Table of Contents
SCHEDULE OF INVESTMENTS (Unaudited)
Enhanced Income Fund
March 31, 2010
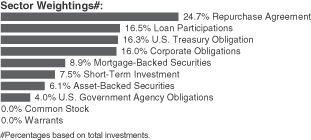
| Description | Face Amount ($ Thousands) | Market Value ($ Thousands) | ||||
LOAN PARTICIPATIONS — 16.6% | ||||||
Affinion, Term B Loan | ||||||
2.746%, 10/17/12 | $ | 544 | $ | 541 | ||
Allison Transmission | ||||||
3.010%, 08/07/14 | 256 | 244 | ||||
3.000%, 08/07/14 | 624 | 593 | ||||
2.980%, 08/07/14 | 11 | 10 | ||||
Aramark | ||||||
2.126%, 01/26/14 | 490 | 480 | ||||
Aramark LOC | ||||||
2.025%, 01/26/14 | 32 | 32 | ||||
Asurion, 1st Lien Term Loan | ||||||
3.250%, 07/03/14 | 96 | 95 | ||||
3.230%, 07/03/14 | 310 | 306 | ||||
3.228%, 07/03/14 | 266 | 263 | ||||
BBN Acquisitions | ||||||
5.750%, 09/14/15 | 470 | 475 | ||||
Biomet | ||||||
3.284%, 03/25/15 | 527 | 518 | ||||
3.229%, 03/25/15 | 27 | 27 | ||||
Booz Allen Hamilton, Tranche B | ||||||
7.500%, 07/31/15 | 136 | 137 | ||||
Burlington Coat Factory | ||||||
2.510%, 05/28/13 | 390 | 373 | ||||
2.490%, 05/28/13 | 403 | 386 | ||||
Calpine Corporation | ||||||
3.135%, 03/29/14 | 690 | 668 | ||||
Cedar Fair | ||||||
2.229%, 08/30/12 | 147 | 146 | ||||
Cedar Fair, Term B Loan | ||||||
4.229%, 08/30/14 | 638 | 636 | ||||
Celanese Holdings | ||||||
2.001%, 04/02/14 | 537 | 526 | ||||
Cengage Learning Hollding | ||||||
2.750%, 06/28/14 | 742 | 654 | ||||
Cequel, 2nd Lien | ||||||
6.251%, 05/05/14 | 283 | 284 | ||||
Charter, Term B Loan | ||||||
2.230%, 03/15/14 | 695 | 670 | ||||
Cinemark | ||||||
2.010%, 10/05/13 | 387 | 379 | ||||
| Description | Face Amount ($ Thousands) | Market Value ($ Thousands) | ||||
2.000%, 10/05/13 | $ | 62 | $ | 61 | ||
1.980%, 10/05/13 | 88 | 86 | ||||
Clear Channel | ||||||
3.879%, 01/29/16 | 466 | 377 | ||||
Community Health Systems | ||||||
2.502%, 07/25/14 | 674 | 656 | ||||
Community Health Systems, Delayed Draw | ||||||
2.502%, 07/25/14 | 23 | 23 | ||||
Dana Corporation | ||||||
6.500%, 01/31/15 | 42 | 42 | ||||
4.550%, 01/31/15 | 10 | 10 | ||||
4.500%, 01/31/15 | 285 | 280 | ||||
4.490%, 01/31/15 | 73 | 71 | ||||
4.480%, 01/31/15 | 44 | 43 | ||||
Dealer Computer Services | ||||||
2.251%, 10/26/12 | 818 | 796 | ||||
Discovery Communications | ||||||
5.250%, 05/14/14 | 670 | 675 | ||||
Dynegy Holdings | ||||||
3.980%, 04/02/13 | 815 | 801 | ||||
Education Media, 1st Lien Term Loan | ||||||
0.000%, 06/12/14 (G) | 500 | 472 | ||||
Federal Mogul | ||||||
2.177%, 12/29/14 | 62 | 57 | ||||
2.167%, 12/29/14 | 528 | 487 | ||||
Federal Mogul, Term C Loan | ||||||
2.167%, 12/28/15 | 295 | 272 | ||||
2.158%, 12/28/15 | 6 | 5 | ||||
Flextronics International, Term Loan A-2 | ||||||
2.479%, 10/01/14 | 331 | 316 | ||||
Flextronics International, Term Loan A-3 | ||||||
2.479%, 10/01/14 | 386 | 369 | ||||
Fontainebleau Miami, Term B Loan | ||||||
10.000%, 06/06/12 (A) | 2,500 | 850 | ||||
Graphic Packaging International, Incremental Term Loan | ||||||
3.001%, 05/16/14 | 61 | 61 | ||||
3.001%, 05/16/14 | 281 | 280 | ||||
2.999%, 05/16/14 | 156 | 156 | ||||
Green Valley Ranch Gaming, 1st Lien | ||||||
2.251%, 02/16/14 | 7 | 6 | ||||
2.249%, 02/16/14 | 351 | 267 | ||||
2.249%, 02/16/14 | 189 | 144 | ||||
Hanesbrands, Term B Loan | ||||||
5.250%, 12/10/15 | 251 | 253 | ||||
Harrah’s Operation, Tranche B-2 | ||||||
2.249%, 01/28/15 | 799 | 689 | ||||
HCA, Tranche B | ||||||
2.501%, 11/18/13 | 564 | 549 | ||||
Hertz LOC | ||||||
1.750%, 12/21/12 | 85 | 84 | ||||
| 30 | SEI Institutional Managed Trust / Semi-Annual Report / March 31, 2010 |
Table of Contents
| Description | Face Amount ($ Thousands) | Market Value ($ Thousands) | ||||
Hertz, Term B Loan | ||||||
2.000%, 12/21/12 | $ | 68 | $ | 67 | ||
1.990%, 12/21/12 | 88 | 87 | ||||
1.980%, 12/21/12 | 305 | 302 | ||||
Hexion Specialty Chemical, Term Loan C-1 | ||||||
2.563%, 05/05/13 | 320 | 301 | ||||
Hexion Specialty Chemical, Term Loan C-2 | ||||||
2.563%, 05/05/13 | 141 | 133 | ||||
Hub International Ltd., Delayed Draw | ||||||
2.751%, 06/13/14 | 132 | 123 | ||||
Hub International Ltd., Initial Term Loan | ||||||
2.751%, 06/13/14 | 586 | 546 | ||||
Iasis Healthcare LOC | ||||||
2.100%, 03/15/14 | 35 | 34 | ||||
Iasis Healthcare, Delayed Draw | ||||||
2.229%, 03/15/14 | 129 | 123 | ||||
Iasis Healthcare, Term B Loan | ||||||
2.229%, 03/15/14 | 372 | 357 | ||||
IMS Health, Term B Loan | ||||||
5.250%, 02/26/16 | 200 | 202 | ||||
Infor Enterprise Solutions | ||||||
4.000%, 07/28/12 | 325 | 313 | ||||
3.980%, 07/28/12 | 169 | 163 | ||||
Infor Global Enterprise Solutions | ||||||
6.479%, | 33 | 27 | ||||
Infor Global Enterprise Solutions, Tranche 1 | ||||||
6.479%, 03/02/14 | 169 | 140 | ||||
Infor Global Solutions, 2nd Lien | ||||||
6.479%, 03/02/14 | 329 | 272 | ||||
Integra Telecom | ||||||
10.500%, 08/31/13 | 695 | 695 | ||||
Intelsat Bermuda | ||||||
3.228%, 02/01/14 | 900 | 835 | ||||
Inverness Medical | ||||||
4.502%, 06/26/15 | 560 | 549 | ||||
JHT Holding, 2nd Lien | ||||||
12.500%, 12/21/12 (B) (H) | 38 | 36 | ||||
Lake at Las Vegas | ||||||
14.350%, 06/20/12 (A) | 2,524 | 2 | ||||
Lake at Las Vegas, DIP | ||||||
9.729%, 07/16/10 | 2,353 | 588 | ||||
Lake at Las Vegas, Revolving Loan | ||||||
15.000%, 06/20/12 (A) | 241 | — | ||||
Lamar Media | ||||||
5.500%, 09/30/12 | 345 | 346 | ||||
Meg Energy, Term Loan | ||||||
6.000%, 04/03/16 | 554 | 548 | ||||
Mylan Laboratories, Term B Loan | ||||||
3.562%, 10/02/14 | 322 | 322 | ||||
3.500%, 10/02/14 | 73 | 73 | ||||
| Description | Face Amount ($ Thousands) | Market Value ($ Thousands) | ||||
Nalco, Term B Loan | ||||||
6.500%, 05/06/16 | $ | 557 | $ | 562 | ||
Nielson Finance | ||||||
2.229%, 12/31/17 | 778 | 744 | ||||
NRG Holdings LOC | ||||||
0.151%, 02/01/13 | 195 | 191 | ||||
NRG Holdings, Term B Loan | ||||||
2.001%, 02/01/13 | 261 | 255 | ||||
1.979%, 02/01/13 | 71 | 69 | ||||
Oshkosh, Term B Loan | ||||||
6.260%, 12/06/13 | 370 | 371 | ||||
Pilot Travel Centers, Term Loan B-1 | ||||||
0.000%, 11/12/15 (G) | 250 | 252 | ||||
Reable Therapeutics, Term B Loan | ||||||
3.229%, 05/20/14 | 499 | 485 | ||||
Regal Cinemas | ||||||
4.001%, 10/27/13 | 412 | 414 | ||||
Remax International, Term Loan B-1 | ||||||
5.760%, 12/17/12 | 78 | 78 | ||||
5.730%, 12/17/12 | 55 | 55 | ||||
Remax International, Term Loan B-2 | ||||||
9.760%, 12/17/12 | 119 | 119 | ||||
9.730%, 12/17/12 | 93 | 93 | ||||
Sally Holdings, Term B Loan | ||||||
2.500%, 11/16/13 | 500 | 492 | ||||
Sensata Technology | ||||||
1.999%, 04/27/13 | 536 | 516 | ||||
Sirva Revolving Credit Loan Exit Finance | ||||||
13.000%, 05/12/12 | 115 | 63 | ||||
9.500%, 05/12/12 | 147 | 81 | ||||
Sirva Worldwide | ||||||
0.500%, 05/12/12 (C) | 523 | 235 | ||||
Solutia, 1st Lien Term Loan | ||||||
4.750%, 03/02/17 | 170 | 171 | ||||
Sungard Data Systems | ||||||
7.650%, 05/13/14 | 220 | 222 | ||||
3.874%, 02/28/16 | 498 | 493 | ||||
3.864%, 02/28/16 | 39 | 39 | ||||
Texas Competitive Electric Holdings, Tranche B-2 | ||||||
3.790%, 10/10/14 | 10 | 8 | ||||
3.729%, 10/10/14 | 1,313 | 1,077 | ||||
Travelport LLC, LOC | ||||||
2.751%, 08/23/13 | 57 | 56 | ||||
Travelport LLC, Term B Loan | ||||||
2.751%, 08/23/13 | 115 | 111 | ||||
2.741%, 08/23/13 | 149 | 144 | ||||
2.739%, 08/23/13 | 238 | 231 | ||||
Travelport LLC, Term Loan C-1 | ||||||
10.500%, 08/23/13 | 209 | 210 | ||||
Univision Communications | ||||||
2.501%, 09/29/14 | 396 | 352 | ||||
| SEI Institutional Managed Trust / Semi-Annual Report / March 31, 2010 | 31 |
Table of Contents
SCHEDULE OF INVESTMENTS (Unaudited)
Enhanced Income Fund (Continued)
March 31, 2010
| Description | Face Amount ($ Thousands) | Market Value ($ Thousands) | ||||
Vanguard Health | ||||||
5.000%, 01/15/16 | $ | 400 | $ | 401 | ||
Verint Systems | ||||||
3.540%, 05/25/14 | 664 | 629 | ||||
VWR International, Term B Loan | ||||||
2.729%, 06/30/14 | 613 | 574 | ||||
Waiccs Las Vegas 3 LLC, 2nd Lien | ||||||
0.000%, 07/30/10 (G) | 2,000 | 183 | ||||
Warner Chilcott, Term Loan A-1 | ||||||
5.500%, 10/30/14 | 132 | 132 | ||||
Warner Chilcott, Term Loan B-1 | ||||||
5.750%, 04/30/15 | 61 | 61 | ||||
Warner Chilcott, Term Loan B-2 | ||||||
5.750%, 04/30/15 | 101 | 101 | ||||
WideOpenWest Finance, 1st Lien | ||||||
2.752%, 06/30/14 | 147 | 138 | ||||
2.750%, 06/30/14 | 145 | 136 | ||||
2.749%, 06/30/14 | 148 | 139 | ||||
Total Loan Participations | 35,548 | |||||
CORPORATE OBLIGATIONS — 16.1% | ||||||
Consumer Discretionary — 0.5% | ||||||
President and Fellows of Harvard College | ||||||
3.700%, 04/01/13 | 1,060 | 1,108 | ||||
Financials — 12.9% | ||||||
Bank of America | ||||||
0.471%, 06/22/12 (D) | 1,500 | 1,506 | ||||
BTM Curacao Holdings MTN | ||||||
4.760%, 07/21/15 (D) (E) | 530 | 534 | ||||
Citigroup | ||||||
0.802%, 08/25/36 (D) | 1,500 | 938 | ||||
Citigroup Funding | ||||||
0.579%, 04/30/12 (D) | 375 | 377 | ||||
0.202%, 06/03/11 (D) | 375 | 375 | ||||
General Electric Capital | ||||||
1.800%, 03/11/11 | 2,500 | 2,530 | ||||
0.271%, 12/21/12 (D) | 5,150 | 5,150 | ||||
GMAC | ||||||
0.266%, 09/19/09 (D) | 1,250 | 1,250 | ||||
Goldman Sachs Group | ||||||
1.700%, 03/15/11 | 3,180 | 3,215 | ||||
ILFC E-Capital Trust I | ||||||
5.900%, 12/21/65 (D) (E) | 1,000 | 770 | ||||
JPMorgan Chase Capital XXI, Ser U | ||||||
1.199%, 02/02/37 (D) | 1,300 | 989 | ||||
Liberty Property L.P. | ||||||
7.250%, 03/15/11‡ | 1,000 | 1,046 | ||||
MBIA Insurance | ||||||
14.000%, 01/15/33 (D) (E) | 1,000 | 700 | ||||
| Description | Face Amount ($ Thousands) | Market Value ($ Thousands) | ||||
Mellon Funding | ||||||
0.400%, 05/15/14 (D) | $ | 900 | $ | 885 | ||
Merrill Lynch | ||||||
1.017%, 09/15/36 (D) | 700 | 533 | ||||
Monumental Global Funding III | ||||||
0.451%, 01/15/14 (D) (E) | 900 | 857 | ||||
Morgan Stanley | ||||||
0.530%, 02/10/12 (D) | 1,150 | 1,157 | ||||
State Street | ||||||
0.349%, 04/30/12 (D) | 615 | 614 | ||||
State Street Bank and Trust | ||||||
0.457%, 09/15/11 (D) | 960 | 963 | ||||
State Street Capital Trust IV | ||||||
1.257%, 06/15/37 (D) | 375 | 281 | ||||
Unitrin | ||||||
6.000%, 05/15/17 | 670 | 645 | ||||
4.875%, 11/01/10 | 1,000 | 1,009 | ||||
Western Union | ||||||
5.400%, 11/17/11 | 1,175 | 1,256 | ||||
| 27,580 | ||||||
Health Care — 0.5% | ||||||
UnitedHealth Group | ||||||
1.549%, 02/07/11 (D) | 1,000 | 1,006 | ||||
Industrials — 0.5% | ||||||
Continental Airlines, Ser 061G | ||||||
0.602%, 06/02/13 (D) | 600 | 486 | ||||
Seminole Indian Tribe of Florida | ||||||
6.535%, 10/01/20 (E) | 550 | 490 | ||||
| 976 | ||||||
Materials — 0.7% | ||||||
Berry Plastics | ||||||
5.001%, 02/15/15 (D) | 540 | 516 | ||||
NewPage | ||||||
11.375%, 12/31/14 | 480 | 477 | ||||
Verso Paper Holdings | ||||||
11.500%, 07/01/14 (E) | 400 | 432 | ||||
| 1,425 | ||||||
Telecommunication Services — 0.7% | ||||||
Corning | ||||||
6.050%, 06/15/15 | 400 | 402 | ||||
Telecom Italia Capital | ||||||
0.861%, 07/18/11 (D) | 550 | 548 | ||||
Vodafone Group PLC | ||||||
0.532%, 02/27/12 (D) | 650 | 650 | ||||
| 1,600 | ||||||
Utilities — 0.3% | ||||||
Southern, Ser A | ||||||
5.300%, 01/15/12 | 665 | 707 | ||||
Total Corporate Obligations | 34,402 | |||||
| 32 | SEI Institutional Managed Trust / Semi-Annual Report / March 31, 2010 |
Table of Contents
| Description | Face Amount ($ Thousands) | Market Value ($ Thousands) | ||||
MORTGAGE-BACKED SECURITIES — 8.9% | ||||||
Agency Mortgage-Backed Obligations — 4.3% | ||||||
FHLMC | ||||||
6.000%, 09/01/26 | $ | 595 | $ | 639 | ||
FNMA TBA | ||||||
6.500%, 04/30/37 | 2,500 | 2,709 | ||||
6.000%, 11/01/14 to 11/01/26 | 3,569 | 3,840 | ||||
FNMA | ||||||
6.500%, 09/01/26 | 385 | 418 | ||||
6.000%, 01/01/27 | 1,565 | 1,673 | ||||
| 9,279 | ||||||
Non-Agency Mortgage-Backed Obligations — 4.6% | ||||||
American Tower Trust, | ||||||
5.957%, 04/15/37 (E) | 625 | 658 | ||||
Banc of America Mortgage Securities, Ser 2004-J, Cl 2A1 | ||||||
3.580%, 11/25/34 (D) | 236 | 218 | ||||
Banc of America Mortgage Securities, Ser 2005-C, Cl 2A2 | ||||||
3.950%, 04/25/35 (D) | 698 | 559 | ||||
Banc of America Mortgage Securities, Ser 2005-I, Cl 2A1 | ||||||
4.862%, 10/25/35 (D) | 529 | 437 | ||||
Bayview Commercial Asset Trust, Ser 2006-4A, Cl A2 | ||||||
0.516%, 12/25/36 (D) (E) | 447 | 275 | ||||
Citigroup Commercial Mortgage Trust, Ser 2006-FL2, Cl D | ||||||
0.439%, 08/15/21 (D) (E) | 400 | 302 | ||||
Citigroup Mortgage Loan Trust, Ser 2004-HYB3, Cl 1A | ||||||
3.462%, 09/25/34 (D) | 158 | 141 | ||||
Commercial Mortgage Pass-Through Certificates, Ser 2006-FL12, Cl A2 | ||||||
0.330%, 12/15/20 (D) (E) | 944 | 859 | ||||
Crusade Global Trust, Ser 2007-1, Cl A1 | ||||||
0.311%, 04/19/38 (D) | 798 | 752 | ||||
Greenwich Capital Commercial Funding, Ser 2006-FL4A, Cl C | ||||||
0.458%, 11/15/21 (D) (E) | 810 | 358 | ||||
Impac CMB Trust, Ser 2005-1, Cl 1A1 | ||||||
0.766%, 04/25/35 (D) | 329 | 223 | ||||
JPMorgan Mortgage Trust, Ser 2006-A6, Cl 4A1 | ||||||
5.251%, 10/25/36 (D) | 897 | 698 | ||||
Merrill Lynch Mortgage Investors, Ser 2005-A1, Cl 1A | ||||||
3.283%, 12/25/34 (D) | 340 | 281 | ||||
| Description | Face Amount ($ Thousands) | Market Value ($ Thousands) | ||||
MortgageIT Trust, Ser 2005-5, Cl A1 | ||||||
0.506%, 12/25/35 (D) | $ | 1,089 | $ | 773 | ||
Prudential Commercial Mortgage Trust, Ser 2003-PWR1, Cl A1 | ||||||
3.669%, 02/11/36 | 539 | 544 | ||||
Residential Funding Mortgage Securities I, Ser 2006-SA1, Cl 1A1 | ||||||
5.666%, 02/25/36 (D) | 486 | 358 | ||||
Sequoia Mortgage Trust, | ||||||
0.560%, 11/20/34 (D) | 236 | 196 | ||||
Sequoia Mortgage Trust, | ||||||
0.540%, 12/20/34 (D) | 193 | 161 | ||||
Sequoia Mortgage Trust, | ||||||
0.460%, 03/20/35 (D) | 103 | 85 | ||||
Washington Mutual Mortgage | ||||||
5.276%, 03/25/37 (D) | 545 | 447 | ||||
Wells Fargo Mortgage-Backed Securities Trust, Ser 2004-BB, Cl A2 | ||||||
2.906%, 01/25/35 (D) | 513 | 464 | ||||
Wells Fargo Mortgage-Backed Securities Trust, | ||||||
4.489%, 02/25/35 (D) | 633 | 579 | ||||
Wells Fargo Mortgage-Backed Securities Trust, | ||||||
2.879%, 03/25/35 (D) | 553 | 495 | ||||
| 9,863 | ||||||
Total Mortgage-Backed Securities | 19,142 | |||||
ASSET-BACKED SECURITIES — 6.1% | ||||||
Automotive — 2.2% | ||||||
Americredit Prime Automobile Receivable, Ser 2007-1, Cl D | ||||||
5.520%, 09/08/14 | 775 | 759 | ||||
Carmax Auto Owner Trust, | ||||||
5.530%, 07/15/13 | 190 | 198 | ||||
Daimler Chrysler Auto Trust, Ser 2007-A, Cl A3A | ||||||
5.000%, 02/08/12 | 574 | 582 | ||||
Ford Credit Auto Owner Trust, Ser 2007-A, Cl C | ||||||
5.800%, 02/15/13 | 515 | 549 | ||||
Harley-Davidson Motorcycle Trust, Ser 2006-1, Cl B | ||||||
5.240%, 11/15/13 (E) | 1,550 | 1,584 | ||||
| SEI Institutional Managed Trust / Semi-Annual Report / March 31, 2010 | 33 |
Table of Contents
SCHEDULE OF INVESTMENTS (Unaudited)
Enhanced Income Fund (Concluded)
March 31, 2010
| Description | Face Amount ($ Thousands) | Market Value ($ Thousands) | ||||
Hyundai Auto Receivables Trust, Ser 2006-B, Cl D | ||||||
5.410%, 05/15/13 | $ | 131 | $ | 130 | ||
Hyundai Auto Receivables Trust, Ser 2007-A, Cl A3A | ||||||
5.040%, 01/17/12 | 194 | 196 | ||||
Merrill Auto Trust Securitization, Ser 2007-1, Cl C | ||||||
5.960%, 12/15/13 | 681 | 689 | ||||
| 4,687 | ||||||
Credit Cards — 1.4% | ||||||
Citibank Credit Card Issuance Trust, Ser 2007-B5, Cl B5 | ||||||
0.848%, 11/07/14 (D) | 1,100 | 1,077 | ||||
GE Capital Credit Card Master Note Trust, Ser 2007-4, Cl B | ||||||
0.430%, 06/15/15 (D) | 1,150 | 1,084 | ||||
MBNA Master Credit Card Trust, Ser 1997-B, Cl B | ||||||
0.580%, 08/15/14 (D) | 1,000 | 971 | ||||
| 3,132 | ||||||
Mortgage Related Securities — 0.1% | ||||||
New Century Home Equity Loan Trust, Ser 2005-1, Cl A1MZ | ||||||
0.536%, 03/25/35 (D) | 35 | 33 | ||||
Option One Mortgage Loan Trust, Ser 2007-FXD1, Cl 3A3 | ||||||
5.611%, 01/25/37 (D) | 285 | 103 | ||||
| 136 | ||||||
Other Asset-Backed Securities — 2.4% | ||||||
Babson CLO, Ser 2007-1A, Cl A1 | ||||||
0.476%, 01/18/21 (D) (E) | 1,060 | 903 | ||||
CapitalSource Commercial Loan Trust, Ser 2006-2A, Cl A1A | ||||||
0.450%, 09/20/22 (D) (E) | 235 | 220 | ||||
CapitalSource Commercial Loan Trust, Ser 2007-1, Cl C | ||||||
0.890%, 03/20/17 (D) (E) | 458 | 271 | ||||
CIT Equipment Collateral, | ||||||
5.290%, 04/20/14 | 23 | 23 | ||||
Dominos Pizza Master Issuer LLC, Ser 2007-1, Cl A2 | ||||||
5.261%, 04/25/37 (E) | 2,200 | 1,987 | ||||
First Franklin Mortgage Loan Asset Backed Certificates, | ||||||
0.506%, 01/25/38 (D) | 257 | 1 | ||||
GE Business Loan Trust, | ||||||
1.230%, 11/15/31 (D) (E) | 84 | 59 | ||||
| Description | Face Amount ($ Thousands) | Market Value ($ Thousands) | ||||
GE Business Loan Trust, | ||||||
0.450%, 12/15/32 (D) (E) | $ | 120 | $ | 103 | ||
GE Business Loan Trust, | ||||||
0.710%, 12/15/32 (D) (E) | 90 | 53 | ||||
GE Business Loan Trust, | ||||||
0.980%, 11/15/34 (D) (E) | 261 | 71 | ||||
Katonah, Ser 2005-7A, Cl B | ||||||
0.670%, 11/15/17 (D) (E) | 700 | 539 | ||||
Marriott Vacation Club Owner Trust, Ser 2006-2A, Cl A | ||||||
5.362%, 10/20/28 (E) | 90 | 91 | ||||
Marriott Vacation Club Owner Trust, Ser 2007-1A, Cl D | ||||||
6.135%, 05/20/29 (E) | 501 | 406 | ||||
Prima, Ser 2006-1, Cl A1 | ||||||
5.417%, 12/28/48 | 4 | 4 | ||||
Triton Container Finance LLC, Ser 2006-1A, Cl N | ||||||
0.416%, 11/26/21 (D) (E) | 500 | 406 | ||||
| 5,137 | ||||||
Total Asset-Backed Securities | 13,092 | |||||
U.S. GOVERNMENT AGENCY OBLIGATIONS — 4.0% | ||||||
FHLB | ||||||
1.375%, 05/16/11 | 7,000 | 7,057 | ||||
FNMA | ||||||
1.375%, 04/28/11 | 1,560 | 1,572 | ||||
Total U.S. Government Agency Obligations | 8,629 | |||||
U.S. TREASURY OBLIGATIONS — 16.3% | ||||||
U.S. Treasury Bond TIPS | ||||||
0.875%, 04/15/10 | 15,185 | 17,373 | ||||
U.S. Treasury Note | ||||||
0.875%, 01/31/11 to 03/31/11 | 17,500 | 17,571 | ||||
Total U.S. Treasury Obligations | 34,944 | |||||
Number of | ||||||
WARRANTS — 0.0% | ||||||
Monitor Oil, 2nd Lien Expires 01/25/15* | 47 | — | ||||
Total Warrants | — | |||||
| 34 | SEI Institutional Managed Trust / Semi-Annual Report / March 31, 2010 |
Table of Contents
| Description | Face Amount ($ Thousands)/ Shares | Market Value ($ Thousands) | |||
COMMON STOCK — 0.0% | |||||
JHT Holding* | 4,002 | $ | — | ||
Total Common Stock | — | ||||
CASH EQUIVALENT — 7.5% | |||||
SEI Daily Income Trust, Prime Obligation Fund, Cl A, 0.070%**† | 16,094,596 | 16,095 | |||
Total Cash Equivalent | 16,095 | ||||
REPURCHASE AGREEMENT — 24.7% | |||||
Bank of America (F) | $53,000 | 53,000 | |||
Total Repurchase Agreement | 53,000 | ||||
Total Investments — 100.2% | $ | 214,852 | |||
A summary of the open futures contracts held by the Fund at March 31, 2010, is as follows:
| Type of Contract | Number of Contracts Long (Short) | Expiration Date | Unrealized Appreciation (Depreciation) ($ Thousands) | ||||||
U.S. 10-Year Treasury Note | (25 | ) | Jun-2010 | $ | 22 | ||||
U.S. 2-Year Treasury Note | (45 | ) | Jul-2010 | 4 | |||||
U.S. 5-Year Treasury Note | 35 | Jul-2010 | (31 | ) | |||||
U.S. Long Treasury Bond | (15 | ) | Jun-2010 | 11 | |||||
| $ | 6 | ||||||||
For the period ended March 31, 2010, the total amount of all open futures contracts, as presented in the table above, are representative of the volume of activity for the derivative type during the period.
Percentages are based on a Net Assets of $214,470 ($ Thousands).
| * | Non-income producing security. |
| ** | Rate shown is the 7-day effective yield as of March 31, 2010. |
| † | Investment in Affiliated Security (see Note 5). |
| ‡ | Real Estate Investment Trust. |
| (A) | Security in default on interest payments. |
| (B) | Security fair valued using methods determined in good faith by the Valuation Committee of the Board of Trustees. The total market value of such securities as of March 31, 2010 was $36 ($ Thousands) and represented 0.00% of Net Assets. |
| (C) | Unfunded bank loan. |
| (D) | Variable Rate Security — The rate reported on the Schedule of Investments is the rate in effects as of March 31, 2010. The date reported on the Schedule of Investments is the next reset date. |
| (E) | Securities sold within terms of a private placement memorandum, exempt from registration under Section 144A of the Securities Act of 1933, as amended, and may |
| be sold only to dealers in that program or other “accredited investors.” These securities have been determined to be liquid under guidelines established by the board of Trustees. |
| (F) | Tri-Party Repurchase Agreement. |
| (G) | Unsettled bank loan. |
| (H) | Security considered restricted. The total market value of such securities as of March 31, 2010 was $36 ($ Thousands) and represented 0.00% of Net Assets. |
Cl — Class
CLO — Collateralized Loan Obligation
FHLB — Federal Home Loan Bank
FHLMC — Federal Home Loan Mortgage Corporation
FNMA — Federal National Mortgage Association
LTD — Limited
LLC — Limited Liability Company
LOC — Line of Credit
L.P. — Limited Partnership
MTN — Medium Term Note
PLC — Public Limited Company
Ser — Series
TBA — To Be Announced
TIPS — Treasury Inflation Protected Security
Amounts designated as “—” are $O or have been rounded to $O
The following is a summary of the inputs used as of March 31, 2010 in valuing the Fund’s investments carried at value ($ Thousands):
Investments in Securities | Level 1 | Level 2 | Level 3 | Total | ||||||||
U.S. Treasury Obligations | $ | 7,531 | $ | 27,413 | $ | — | $ | 34,944 | ||||
Corporate Obligations | — | 34,402 | — | 34,402 | ||||||||
Mortgage-Backed Securities | — | 19,142 | — | 19,142 | ||||||||
Asset-Backed Securities | — | 12,333 | 759 | 13,092 | ||||||||
U.S. Government Agency Obligations | — | 8,629 | — | 8,629 | ||||||||
Repurchase Agreement | — | 53,000 | — | 53,000 | ||||||||
Loan Participations | — | 35,512 | 36 | 35,548 | ||||||||
Warrants | — | — | — | — | ||||||||
Common Stock | — | — | — | — | ||||||||
Cash Equivalent | 16,095 | — | — | 16,095 | ||||||||
Total Investments in Securities | $ | 23,626 | $ | 190,431 | $ | 795 | $ | 214,852 | ||||
| Other Financial Instruments | Level 1 | Level 2 | Level 3 | Total | ||||||||
Futures Contracts* | $ | 6 | $ | — | $ | — | $ | 6 | ||||
| * | Futures contracts are valued at unrealized appreciation on the instrument. |
The following is a reconciliation of the investments in which significant unobservable inputs (Level 3) were used in determining value ($ Thousands):
| Asset-Backed Securities | Loan Participation | |||||||
Beginning balance as of October 1, 2009 | $ | 425 | $ | 29 | ||||
Accrued discounts/premiums | — | (5 | ) | |||||
Realized gain/(loss) | (501 | ) | — | |||||
Change in unrealized appreciation/(depreciation) | 634 | 11 | ||||||
Net purchases/sales | (19 | ) | 1 | |||||
Net transfer in and/or out of Level 3 | 220 | — | ||||||
Ending balance as of March 31, 2010 | $ | 759 | $ | 36 | ||||
Changes in unrealized gains (losses) included in earnings related to securities held at reporting date | $ | 140 | $ | 11 | ||||
For more information on valuation inputs, see Note 2 — Significant Accounting Policies in Notes to Financial Statements.
The accompanying notes are an integral part of the financial statements.
| SEI Institutional Managed Trust / Semi-Annual Report / March 31, 2010 | 35 |
Table of Contents
SCHEDULE OF INVESTMENTS (Unaudited)
Core Fixed Income Fund
March 31, 2010
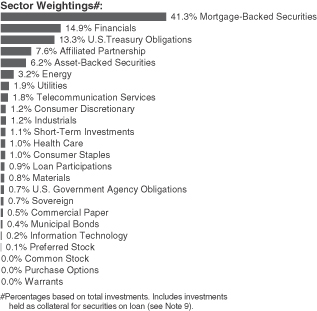
| Description | Face Amount ($ Thousands) | Market Value ($ Thousands) | ||||
MORTGAGE-BACKED SECURITIES — 46.1% | ||||||
Agency Mortgage-Backed Obligations — 30.2% | ||||||
FHLMC | ||||||
7.500%, 11/01/29 to 09/01/32 | $ | 1,531 | $ | 1,749 | ||
7.000%, 10/01/10 to 01/01/32 | 318 | 357 | ||||
6.500%, 12/01/13 to 09/01/38 | 14,582 | 15,902 | ||||
6.000%, 10/01/19 to 09/01/38 | 38,375 | 41,323 | ||||
5.500%, 12/01/13 to 03/01/38 | 24,290 | 25,830 | ||||
5.000%, 10/01/18 to 02/01/39 | 66,509 | 69,262 | ||||
4.500%, 04/01/35 to 11/01/35 | 2,307 | 2,324 | ||||
4.000%, 04/01/19 to 10/01/33 | 1,730 | 1,685 | ||||
2.875%, 02/09/15 | 5,690 | 5,725 | ||||
0.100%, 05/18/10 (A) | 16,450 | 16,448 | ||||
FHLMC ARM | ||||||
6.429%, 11/01/37 (B) | 5 | 5 | ||||
6.218%, 08/01/37 (B) | 274 | 291 | ||||
6.141%, 06/01/37 (B) | 175 | 187 | ||||
6.084%, 04/01/37 (B) | 338 | 362 | ||||
5.952%, 01/01/37 (B) | 1,069 | 1,127 | ||||
5.915%, 03/01/37 (B) | 167 | 178 | ||||
5.803%, 11/01/36 (B) | 740 | 788 | ||||
5.717%, 03/01/36 (B) | 336 | 358 | ||||
5.688%, 03/01/36 (B) | 282 | 300 | ||||
5.650%, 10/01/38 (B) | 364 | 387 | ||||
5.126%, 01/01/36 (B) | 4,151 | 4,368 | ||||
FHLMC CMO, Cl PD | ||||||
5.000%, 04/15/33 | 930 | 981 | ||||
FHLMC CMO, Cl MC | ||||||
4.500%, 10/15/36 | 1,538 | 1,481 | ||||
FHLMC CMO, Cl PE | ||||||
5.000%, 04/15/37 | 745 | 784 | ||||
| Description | Face Amount ($ Thousands) | Market Value ($ Thousands) | ||||
FHLMC CMO, Cl OG | ||||||
5.000%, 06/15/34 | $ | 629 | $ | 663 | ||
FHLMC CMO STRIPS, | ||||||
5.000%, 08/01/35 | 7,163 | 1,566 | ||||
FHLMC CMO STRIPS, | ||||||
5.000%, 09/15/35 | 2,448 | 409 | ||||
FHLMC CMO STRIPS, | ||||||
4.500%, 08/15/35 | 373 | 77 | ||||
FHLMC CMO STRIPS, Ser 245, Cl IO, IO | ||||||
5.000%, 05/15/37 | 1,950 | 434 | ||||
FHLMC CMO, Ser 1, Cl Z | ||||||
9.300%, 04/15/19 | 104 | 117 | ||||
FHLMC CMO, Ser 1611, Cl Z | ||||||
6.500%, 11/15/23 | 15,251 | 16,317 | ||||
FHLMC CMO, Ser 1983, Cl Z | ||||||
6.500%, 12/15/23 | 1,909 | 2,075 | ||||
FHLMC CMO, Ser 2043, Cl CJ | ||||||
6.500%, 04/15/28 | 1,299 | 1,379 | ||||
FHLMC CMO, Ser 2277, Cl B | ||||||
7.500%, 01/15/31 | 323 | 343 | ||||
FHLMC CMO, Ser 2399, Cl XG | ||||||
6.500%, 01/15/32 | 3,287 | 3,584 | ||||
FHLMC CMO, Ser 2542, Cl ES | ||||||
5.000%, 12/15/17 | 80 | 85 | ||||
FHLMC CMO, Ser 2558, Cl BD | ||||||
5.000%, 01/15/18 | 612 | 656 | ||||
FHLMC CMO, Ser 2590, Cl BY | ||||||
5.000%, 03/15/18 | 251 | 269 | ||||
FHLMC CMO, Ser 2676, Cl CY | ||||||
4.000%, 09/15/18 | 716 | 744 | ||||
FHLMC CMO, Ser 2690, Cl TV | ||||||
4.500%, 11/15/25 | 520 | 534 | ||||
FHLMC CMO, Ser 2694, Cl QG | ||||||
4.500%, 01/15/29 | 95 | 99 | ||||
FHLMC CMO, Ser 2727, Cl PW | ||||||
3.570%, 06/15/29 | 157 | 161 | ||||
FHLMC CMO, Ser 2733, Cl ME | ||||||
5.000%, 01/15/34 | 4,915 | 4,988 | ||||
FHLMC CMO, Ser 2765, Cl CT | ||||||
4.000%, 03/15/19 | 414 | 424 | ||||
FHLMC CMO, Ser 2790, Cl TN | ||||||
4.000%, 05/15/24 | 1,090 | 1,096 | ||||
FHLMC CMO, Ser 2843, Cl BC | ||||||
5.000%, 08/15/19 | 921 | 986 | ||||
FHLMC CMO, Ser 2875, Cl HB | ||||||
4.000%, 10/15/19 | 163 | 164 | ||||
FHLMC CMO, Ser 2945, Cl SA | ||||||
11.880%, 03/15/20 (B) | 3,073 | 3,337 | ||||
FHLMC CMO, Ser 2985, Cl JR | ||||||
4.500%, 06/15/25 | 1,954 | 2,031 | ||||
FHLMC CMO, Ser 3028, Cl PG | ||||||
5.500%, 09/15/35 | 620 | 669 | ||||
FHLMC CMO, Ser 3035, Cl PA | ||||||
5.500%, 09/15/35 | 276 | 298 | ||||
FHLMC CMO, Ser 3372, Cl BD | ||||||
4.500%, 10/15/22 | 926 | 960 | ||||
| 36 | SEI Institutional Managed Trust / Semi-Annual Report / March 31, 2010 |
Table of Contents
| Description | Face Amount ($ Thousands) | Market Value ($ Thousands) | ||||
FHLMC CMO, Ser 3465, Cl HA | ||||||
4.000%, 07/15/17 | $ | 917 | $ | 956 | ||
FNMA | ||||||
7.000%, 09/01/26 to 01/01/39 | 5,809 | 6,488 | ||||
6.500%, 05/01/17 to 08/01/35 | 1,958 | 2,123 | ||||
6.000%, 10/01/19 to 07/01/37 | 43,209 | 46,345 | ||||
5.500%, 06/01/14 to 08/01/37 | 72,305 | 77,605 | ||||
5.000%, 01/01/20 to 02/01/39 | 47,140 | 49,112 | ||||
4.500%, 06/01/35 to 04/01/38 | 10,066 | 10,156 | ||||
4.000%, 08/01/20 | 1,858 | 1,892 | ||||
FNMA ARM (B) | ||||||
6.284%, 09/01/37 | 124 | 130 | ||||
6.280%, 10/01/36 | 366 | 386 | ||||
6.273%, 09/01/37 | 226 | 241 | ||||
6.124%, 12/01/36 | 425 | 450 | ||||
6.080%, 09/01/37 | 197 | 207 | ||||
6.028%, 01/01/37 | 550 | 581 | ||||
6.014%, 10/01/37 | 209 | 219 | ||||
6.013%, 10/01/37 | 1,093 | 1,149 | ||||
6.012%, 11/01/37 | 322 | 338 | ||||
5.977%, 04/01/37 | 581 | 613 | ||||
5.976%, 07/01/37 | 740 | 777 | ||||
5.961%, 07/01/37 | 351 | 369 | ||||
5.957%, 01/01/37 | 704 | 743 | ||||
5.936%, 07/01/37 | 648 | 681 | ||||
5.930%, 07/01/37 | 647 | 681 | ||||
5.928%, 10/01/37 | 878 | 922 | ||||
5.926%, 03/01/37 | 362 | 381 | ||||
5.913%, 04/01/37 | 529 | 555 | ||||
5.904%, 09/01/37 | 316 | 334 | ||||
5.896%, 02/01/37 | 170 | 179 | ||||
5.886%, 03/01/37 | 305 | 320 | ||||
5.882%, 12/01/37 | 2,093 | 2,205 | ||||
5.879%, 05/01/37 | 301 | 315 | ||||
5.878%, 02/01/37 | 462 | 486 | ||||
5.876%, 10/01/37 | 470 | 494 | ||||
5.869%, 03/01/37 | 818 | 857 | ||||
5.868%, 04/01/37 | 700 | 733 | ||||
5.817%, 11/01/37 | 554 | 583 | ||||
5.814%, 03/01/37 | 686 | 718 | ||||
5.808%, 08/01/37 | 878 | 921 | ||||
5.718%, 05/01/37 | 388 | 408 | ||||
5.668%, 02/01/39 | 967 | 1,015 | ||||
5.661%, 05/01/37 | 322 | 338 | ||||
5.643%, 09/01/37 | 447 | 470 | ||||
5.635%, 02/01/36 | 520 | 542 | ||||
5.606%, 01/01/37 | 829 | 868 | ||||
5.571%, 05/01/37 | 594 | 625 | ||||
5.494%, 05/01/38 | 3,041 | 3,223 | ||||
5.479%, 09/01/37 | 365 | 383 | ||||
2.446%, 10/01/35 to 11/01/35 | 12,168 | 12,444 | ||||
2.437%, 11/01/35 | 1,475 | 1,507 | ||||
2.430%, 11/01/35 | 1,662 | 1,697 | ||||
2.429%, 11/01/35 | 5,268 | 5,377 | ||||
| Description | Face Amount ($ Thousands) | Market Value ($ Thousands) | ||||
2.425%, 10/01/35 | $ | 873 | $ | 891 | ||
2.424%, 11/01/35 | 1,563 | 1,595 | ||||
2.415%, 11/01/35 | 1,625 | 1,658 | ||||
2.410%, 10/01/35 | 7,475 | 7,623 | ||||
FNMA CMO, Cl J | ||||||
5.000%, 09/25/19 | 1,958 | 2,067 | ||||
FNMA CMO, Cl PE | ||||||
5.000%, 03/25/34 | 683 | 726 | ||||
FNMA CMO, Cl XB | ||||||
5.000%, 03/25/38 | 1,913 | 1,965 | ||||
FNMA CMO, Cl A2 | ||||||
4.450%, 09/25/19 | 467 | 474 | ||||
4.287%, 07/25/19 | 1,339 | 1,348 | ||||
FNMA CMO, Cl UE | ||||||
5.000%, 01/25/34 | 811 | 853 | ||||
FNMA CMO, Cl A3 | ||||||
4.001%, 01/25/19 | 1,437 | 1,422 | ||||
FNMA CMO, Cl A | ||||||
5.000%, 04/25/34 | 562 | 593 | ||||
FNMA CMO, Cl A1 | ||||||
3.305%, 06/25/19 | 299 | 303 | ||||
FNMA CMO, Cl JT | ||||||
6.000%, 06/25/36 | 97 | 104 | ||||
FNMA CMO STRIPS, | ||||||
5.000%, 11/01/35 | 1,112 | 208 | ||||
FNMA CMO STRIPS, | ||||||
5.000%, 08/01/35 | 16,926 | 3,560 | ||||
FNMA CMO, Ser 1999-11, Cl Z | ||||||
5.500%, 03/25/29 | 2,970 | 3,182 | ||||
FNMA CMO, Ser 2001-81, Cl HE | ||||||
6.500%, 01/25/32 | 6,699 | 7,260 | ||||
FNMA CMO, Ser 2002-94, Cl HQ | ||||||
4.500%, 01/25/18 | 775 | 818 | ||||
FNMA CMO, Ser 2003-108, Cl BE | ||||||
4.000%, 11/25/18 | 550 | 570 | ||||
FNMA CMO, Ser 2003-125, Cl AY | ||||||
4.000%, 12/25/18 | 176 | 182 | ||||
FNMA CMO, Ser 2004-60, Cl PA | ||||||
5.500%, 04/25/34 | 535 | 573 | ||||
FNMA CMO, Ser 2004-80, Cl LE | ||||||
4.000%, 11/25/19 | 3,301 | 3,372 | ||||
FNMA CMO, Ser 2004-81, Cl KE | ||||||
4.500%, 11/25/19 | 177 | 186 | ||||
FNMA CMO, Ser 2005-57, Cl EG | ||||||
0.529%, 03/25/35 (B) | 2,465 | 2,451 | ||||
FNMA CMO, Ser 2005-58, Cl MA | ||||||
5.500%, 07/25/35 | 443 | 479 | ||||
FNMA CMO, Ser 2006-10, Cl FD | ||||||
0.579%, 03/25/36 (B) | 1,547 | 1,541 | ||||
FNMA CMO, Ser 2006-112, IO | ||||||
6.471%, 11/25/36 (B) | 14,927 | 1,685 | ||||
FNMA CMO, Ser 2007-113, Cl DB | ||||||
4.500%, 12/25/22 | 1,186 | 1,221 | ||||
| SEI Institutional Managed Trust / Semi-Annual Report / March 31, 2010 | 37 |
Table of Contents
SCHEDULE OF INVESTMENTS (Unaudited)
Core Fixed Income Fund (Continued)
March 31, 2010
| Description | Face Amount ($ Thousands) | Market Value ($ Thousands) | ||||
FNMA CMO, Ser 2007-77, Cl MH | ||||||
6.000%, 12/25/36 | $ | 2,091 | $ | 2,254 | ||
FNMA CMO, Ser 2007-T2, Cl B | ||||||
6.022%, 11/25/10 | 4,500 | 4,630 | ||||
FNMA CMO, Ser 2008-22 | ||||||
6.184%, 03/25/37 (B) | 14,883 | 1,884 | ||||
FNMA CMO, Ser 2008-35, Cl B | ||||||
5.000%, 08/25/23 | 178 | 188 | ||||
FNMA CMO, Ser 365, Cl 2, IO | ||||||
5.000%, 02/01/36 | 1,049 | 204 | ||||
FNMA CMO, Ser 365, IO | ||||||
5.000%, 04/01/36 | 1,041 | 195 | ||||
FNMA, Ser K003, Cl AAB | ||||||
4.768%, 05/25/18 | 857 | 907 | ||||
FNMA TBA | ||||||
5.500%, 04/30/22 to 06/12/37 | 24,000 | 25,192 | ||||
5.000%, 04/30/37 to 06/01/38 | 14,400 | 14,761 | ||||
4.500%, 04/14/33 to 05/01/38 | 59,150 | 59,141 | ||||
GNMA | ||||||
8.000%, 11/15/29 to 09/15/30 | 116 | 134 | ||||
7.500%, 03/15/29 to 01/15/32 | 288 | 326 | ||||
7.000%, 08/15/13 | 51 | 55 | ||||
6.500%, 04/15/26 to 09/15/35 | 11,543 | 12,630 | ||||
6.000%, 03/15/14 to 10/15/35 | 17,941 | 19,397 | ||||
5.000%, 05/15/33 to 10/15/35 | 4,186 | 4,381 | ||||
GNMA ARM (B) | ||||||
6.000%, 06/20/35 | 349 | 361 | ||||
5.500%, 01/10/36 | 214 | 220 | ||||
4.625%, 08/20/34 | 482 | 493 | ||||
4.000%, 03/20/36 | 727 | 742 | ||||
3.500%, 05/20/36 | 3,505 | 3,608 | ||||
3.000%, 02/20/36 | 845 | 862 | ||||
2.750%, 12/20/33 | 8,283 | 8,389 | ||||
GNMA CMO, Ser 2001-18, Cl WH | ||||||
31.548%, 04/20/31 (B) | 217 | 332 | ||||
GNMA CMO, Ser 2002-51, Cl SG | ||||||
31.461%, 04/20/31 (B) | 199 | 301 | ||||
GNMA CMO, Ser 2003-86, Cl ZK | ||||||
5.000%, 10/20/33 | 5,441 | 5,488 | ||||
GNMA CMO, Ser 2004-80, Cl IP, IO | ||||||
5.500%, 07/20/34 | 357 | — | ||||
GNMA CMO, Ser 2006-37, Cl JG | ||||||
5.000%, 07/20/36 | 685 | 717 | ||||
GNMA TBA | ||||||
6.000%, 04/28/36 | 100 | 107 | ||||
4.500%, 04/01/38 to 05/01/39 | 14,100 | 14,187 | ||||
4.500%, 04/15/40 to 04/15/40 | 39,970 | 40,438 | ||||
| 749,243 | ||||||
Non-Agency Mortgage-Backed Obligations — 15.9% | ||||||
American Home Mortgage Assets, Ser 2007-2, Cl A1 | ||||||
0.371%, 03/25/47 (B) | 9,204 | 5,246 | ||||
| Description | Face Amount ($ Thousands) | Market Value ($ Thousands) | ||||
American Home Mortgage Investment Trust, Ser 2005-1, Cl 6A | ||||||
2.394%, 06/25/45 (B) | $ | 4,493 | $ | 3,549 | ||
American Home Mortgage Investment Trust, Ser 2005-4, Cl 5A | ||||||
5.350%, 11/25/45 (B) | 4,288 | 3,088 | ||||
Asset Securitization, Cl A2 | ||||||
7.776%, 10/13/26 (B) | 745 | 786 | ||||
Banc of America Commercial Mortgage, Cl E | ||||||
7.634%, 09/15/32 (B) | 263 | 262 | ||||
Banc of America Commercial Mortgage, Cl A4 | ||||||
5.414%, 09/10/47 | 625 | 626 | ||||
5.372%, 09/10/45 (B) | 588 | 603 | ||||
Banc of America Commercial Mortgage Securities, Ser 2002-PB2, Cl B | ||||||
6.309%, 06/11/35 | 514 | 543 | ||||
Banc of America Commercial Mortgage Securities, Ser 2005-3, Cl A4 | ||||||
4.668%, 07/10/43 | 4,000 | 3,986 | ||||
Banc of America Commercial Mortgage Securities, Ser 2005-6, Cl A4 | ||||||
5.179%, 09/10/47 (B) | 296 | 308 | ||||
Banc of America Commercial Mortgage Securities, Ser 2006-2, Cl A1 | ||||||
5.611%, 05/10/45 | 1,139 | 1,160 | ||||
Banc of America Commercial Mortgage, Ser 2006-3, Cl A4 | ||||||
5.889%, 07/10/44 (B) | 329 | 322 | ||||
Banc of America Commercial Mortgage, Ser 2007-3, Cl A3 | ||||||
5.658%, 06/10/49 (B) | 1,360 | 1,414 | ||||
Banc of America Funding, Ser 2003-1, Cl A1 | ||||||
6.000%, 05/20/33 | 47 | 47 | ||||
Banc of America Funding, Ser 2005-B, Cl 2A1 | ||||||
4.791%, 04/20/35 (B) | 4,411 | 3,043 | ||||
Bear Stearns Adjustable Rate Mortgage Trust, Ser 2004-2, Cl 24A | ||||||
5.273%, 05/25/34 (B) | 3,267 | 3,184 | ||||
Bear Stearns Commercial Mortgage Securities, Cl A2 | ||||||
6.460%, 10/15/36 | 1,620 | 1,724 | ||||
5.286%, 06/11/41 (B) | 505 | 525 | ||||
| 38 | SEI Institutional Managed Trust / Semi-Annual Report / March 31, 2010 |
Table of Contents
| Description | Face Amount ($ Thousands) | Market Value ($ Thousands) | ||||
Bear Stearns Commercial Mortgage Securities, Cl A3 | ||||||
5.468%, 06/11/41 (B) | $ | 1,324 | $ | 1,375 | ||
Bear Stearns Commercial Mortgage Securities, Ser 2001-TOP2, Cl A2 | ||||||
6.480%, 02/15/35 | 644 | 663 | ||||
Bear Stearns Commercial Mortgage Securities, Ser 2001-TOP4, Cl A3 | ||||||
5.610%, 11/15/33 | 340 | 354 | ||||
Bear Stearns Commercial Mortgage Securities, Ser 2002-PBW1, Cl A2 | ||||||
4.720%, 11/11/35 (B) | 628 | 655 | ||||
Bear Stearns Commercial Mortgage Securities, Ser 2002-TOP8, Cl A2 | ||||||
4.830%, 08/15/38 | 894 | 935 | ||||
Bear Stearns Commercial Mortgage Securities, Ser 2003-T12, Cl A3 | ||||||
4.240%, 08/13/39 (B) | 193 | 198 | ||||
Bear Stearns Commercial Mortgage Securities, Ser 2005-PW10, Cl A4 | ||||||
5.405%, 12/11/40 (B) | 1,962 | 2,009 | ||||
Bear Stearns Commercial Mortgage Securities, Ser 2005-T20, Cl A4A | ||||||
5.149%, 10/12/42 (B) | 3,250 | 3,358 | ||||
Chase Commercial Mortgage Securities, Ser 2000-3, Cl A2 | ||||||
7.319%, 10/15/32 | 1,842 | 1,864 | ||||
Chase Mortgage Finance, Ser 2005-A1, Cl 2A3 | ||||||
5.233%, 12/25/35 (B) | 12,400 | 9,772 | ||||
Citigroup Mortgage Loan Trust, Ser 2005-11, Cl A3 | ||||||
4.900%, 12/25/35 (B) | 7,633 | 6,942 | ||||
Commercial Mortgage Asset Trust, Ser 1999-C1, Cl A4 | ||||||
6.975%, 01/17/32 (B) | 1,564 | 1,691 | ||||
Commercial Mortgage Asset Trust, Ser 1999-C2, Cl A2 | ||||||
7.546%, 10/17/32 (B) | 293 | 295 | ||||
Commercial Mortgage Loan Trust, Cl AJ | ||||||
6.020%, 12/10/49 (B) | 1,190 | 572 | ||||
Commercial Mortgage Loan Trust, Ser 2008-LS1, Cl A4B | ||||||
6.020%, 12/10/49 (B) | 13,025 | 12,802 | ||||
Commercial Mortgage Pass Through Certificates, Cl A4 | ||||||
4.715%, 03/10/39 | 560 | 572 | ||||
Commercial Mortgage Pass Through Certificates, Cl A5 | ||||||
5.314%, 07/10/37 (B) | 647 | 677 | ||||
Commercial Mortgage Pass-Through Certificates, Ser 2001-J2A, Cl A2 | ||||||
6.096%, 07/16/34 (C) | 569 | 601 | ||||
| Description | Face Amount ($ Thousands) | Market Value ($ Thousands) | ||||
Countrywide Alternative Loan Trust, Ser 2003-20BC, Cl 1A1 | ||||||
5.500%, 10/25/33 | $ | 1,333 | $ | 1,318 | ||
Countrywide Alternative Loan Trust, Ser 2004-J1, Cl 1A1 | ||||||
6.000%, 02/25/34 | 453 | 449 | ||||
Countrywide Alternative Loan Trust, Ser 2005-21, Cl 3A2 | ||||||
1.571%, 08/25/35 (B) | 524 | 259 | ||||
Countrywide Alternative Loan Trust, Ser 2005-56, Cl 4A1 | ||||||
0.556%, 11/25/35 (B) | 7,509 | 4,051 | ||||
Countrywide Alternative Loan Trust, Ser 2005-59, Cl 1A1 | ||||||
0.559%, 11/20/35 (B) | 9,179 | 4,838 | ||||
Countrywide Home Loan Mortgage Pass-Through Trust, Ser 2005-R3, Cl AF | ||||||
0.646%, 09/25/35 (B) (C) | 4,652 | 3,928 | ||||
Credit Suisse Mortgage Capital Certificates, Ser 2006-C5, Cl A3 | ||||||
5.311%, 12/15/39 | 6,045 | 5,705 | ||||
CS First Boston Mortgage Securities, Cl A3 | ||||||
4.813%, 02/15/38 | 129 | 130 | ||||
CS First Boston Mortgage Securities, Cl A4 | ||||||
5.100%, 08/15/38 (B) | 462 | 471 | ||||
5.014%, 02/15/38 (B) | 649 | 663 | ||||
CS First Boston Mortgage Securities, Ser 2002-CKN2, Cl A3 | ||||||
6.133%, 04/15/37 | 201 | 213 | ||||
CS First Boston Mortgage Securities, Ser 2002-CKS4, Cl A2 | ||||||
5.183%, 11/15/36 | 1,892 | 1,989 | ||||
CS First Boston Mortgage Securities, Ser 2002-CKS4, Cl A1 | ||||||
4.485%, 11/15/36 | 17 | 17 | ||||
CS First Boston Mortgage Securities, Ser 2002-CP5, Cl A2 | ||||||
4.940%, 12/15/35 | 343 | 360 | ||||
CS First Boston Mortgage Securities, Ser 2003-AR24, Cl 2A4 | ||||||
3.124%, 10/25/33 (B) | 3,284 | 2,743 | ||||
CS First Boston Mortgage Securities, Ser 2003-CK2, Cl A4 | ||||||
4.801%, 03/15/36 | 419 | 437 | ||||
CS First Boston Mortgage Securities, Ser C2, Cl A4 | ||||||
4.832%, 04/15/37 | 405 | 402 | ||||
CS First Boston Mortgage Securities, Ser CPN1, Cl A2 | ||||||
4.597%, 03/15/35 | 595 | 618 | ||||
| SEI Institutional Managed Trust / Semi-Annual Report / March 31, 2010 | 39 |
Table of Contents
SCHEDULE OF INVESTMENTS (Unaudited)
Core Fixed Income Fund (Continued)
March 31, 2010
| Description | Face Amount ($ Thousands) | Market Value ($ Thousands) | ||||
CW Capital Cobalt, Ser 2006-C1, Cl A4 | ||||||
5.223%, 08/15/48 | $ | 5,505 | $ | 5,255 | ||
Deutsche Mortgage Securities, Ser 2004-4, Cl 7AR2 | ||||||
0.679%, 06/20/34 (B) | 986 | 739 | ||||
Downey Savings & Loan Association Mortgage Loan Trust, Ser 2004-AR2, Cl A2B | ||||||
0.637%, 11/19/44 (B) | 2,366 | 870 | ||||
FFCA Secured Lending, | ||||||
1.218%, 09/18/25 (B) (C) | 3,429 | 58 | ||||
FHLMC Multifamily Structured Pass Through Certificates, Cl A1 | ||||||
3.398%, 07/25/19 | 804 | 812 | ||||
First Union National Bank Commercial Mortgage, Cl A2 | ||||||
6.141%, 02/12/34 | 321 | 338 | ||||
First Union National Bank Commercial Mortgage, Ser 2001-C4, Cl B | ||||||
6.417%, 12/12/33 | 631 | 647 | ||||
Fund America Investors II, Ser 1993-A, Cl A2 | ||||||
5.475%, 06/25/23 (B) | 207 | 196 | ||||
GE Capital Assurance, Ser 2003-1, Cl A4 | ||||||
5.254%, 05/12/35 (B) (C) | 5,798 | 6,116 | ||||
GE Capital Commercial Mortgage, Cl A1 | ||||||
5.560%, 06/10/38 | 57 | 58 | ||||
GE Capital Commercial Mortgage, Ser 2001-2, Cl A3 | ||||||
6.030%, 08/11/33 | 62 | 62 | ||||
GE Capital Commercial Mortgage, Ser 2002-1A, Cl A3 | ||||||
6.269%, 12/10/35 | 4,802 | 5,104 | ||||
GE Capital Commercial Mortgage, Ser 2002-3A, Cl A2 | ||||||
4.996%, 12/10/37 | 10,500 | 11,011 | ||||
GE Capital Commercial Mortgage, Ser 2005-C4, Cl A4 | ||||||
5.339%, 11/10/45 (B) | 3,375 | 3,479 | ||||
GE Capital Commercial Mortgage, Ser 2006-C1, Cl A3 | ||||||
5.337%, 03/10/44 (B) | 2,845 | 2,981 | ||||
GMAC Commercial Mortgage Securities, Cl A4 | ||||||
5.301%, 08/10/38 (B) | 516 | 532 | ||||
GMAC Commercial Mortgage Securities, Cl B | ||||||
6.790%, 04/15/34 | 161 | 169 | ||||
| Description | Face Amount ($ Thousands) | Market Value ($ Thousands) | ||||
GMAC Commercial Mortgage Securities, Ser 2000-C2, Cl A2 | ||||||
7.455%, 08/16/33 (B) | $ | 19 | $ | 19 | ||
GMAC Commercial Mortgage Securities, Ser 2003-C2, Cl A2 | ||||||
5.485%, 05/10/40 (B) | 417 | 445 | ||||
GMAC Commercial Mortgage Securities, Ser 2003-C3, Cl A4 | ||||||
5.023%, 04/10/40 | 2,432 | 2,553 | ||||
Greenwich Capital Commercial Funding, Cl A4 | ||||||
5.444%, 03/10/39 | 8,645 | 8,407 | ||||
Greenwich Capital Commercial Funding | ||||||
5.190%, 04/10/37 (B) | 230 | 241 | ||||
Greenwich Capital Commercial Funding, Cl A6 | ||||||
5.135%, 06/10/36 (B) | 395 | 416 | ||||
Greenwich Capital Commercial Funding, Cl A2 | ||||||
5.381%, 03/10/39 | 883 | 909 | ||||
Greenwich Capital Commercial Funding, Ser 2005-GG3, Cl AAB | ||||||
4.619%, 08/10/42 | 5,205 | 5,354 | ||||
Greenwich Capital Commercial Funding, Ser 2005-GG5, Cl A5 | ||||||
5.224%, 04/10/37 (B) | 2,551 | 2,562 | ||||
Greenwich Capital Commercial Funding, Ser 2006-GG7, Cl A4 | ||||||
5.883%, 08/10/09 (B) | 9,153 | 9,331 | ||||
GS Mortgage Securities II, Cl A2 | ||||||
5.506%, 04/10/38 (B) | 1,296 | 1,320 | ||||
5.479%, 11/10/39 | 1,132 | 1,165 | ||||
4.319%, 10/10/28 | 654 | 659 | ||||
GS Mortgage Securities II, Ser 2001-GL3A, Cl A2 | ||||||
6.449%, 08/15/18 (B) (C) | 1,487 | 1,588 | ||||
GS Mortgage Securities II, Ser 2005-GG4, Cl AABA | ||||||
4.680%, 07/10/39 | 351 | 363 | ||||
GSMPS Mortgage Loan Trust, Ser 1998-1, Cl A | ||||||
8.000%, 09/19/27 (B) (C) | 65 | 65 | ||||
GSR Mortgage Loan Trust, Cl 3A5 | ||||||
4.565%, 07/25/35 (B) | 7,000 | 4,756 | ||||
GSR Mortgage Loan Trust, Ser 2003-13, Cl 1A1 | ||||||
4.468%, 10/25/33 (B) | 3,221 | 3,182 | ||||
Harborview Mortgage Loan Trust, Ser 2005-12, Cl X2B, IO | ||||||
2.141%, 10/19/35 (B) | 20,032 | 720 | ||||
Heller Financial Commercial Mortgage Asset, Ser 1999-PH1, Cl C | ||||||
7.023%, 05/15/31 (B) | 23 | 23 | ||||
| 40 | SEI Institutional Managed Trust / Semi-Annual Report / March 31, 2010 |
Table of Contents
| Description | Face Amount ($ Thousands) | Market Value ($ Thousands) | ||||
Impac Secured Assets CMO Owner Trust, Ser 2006-2, Cl 2A1 | ||||||
0.596%, 08/25/36 (B) | $ | 823 | $ | 653 | ||
Indymac INDA Mortgage Loan Trust, Ser 2007-AR7, Cl 1A1 | ||||||
6.154%, 11/01/37 (B) | 1,504 | 1,105 | ||||
Indymac Index Mortgage Loan Trust, Ser 2007-AR15, Cl 2A1 | ||||||
5.996%, 08/25/37 (B) | 8,182 | 3,995 | ||||
JPMorgan Alternative Loan Trust, Ser 2006-A7, Cl 2A6 | ||||||
5.750%, 12/25/36 (B) | 12,253 | 4,729 | ||||
JPMorgan Chase Commercial Mortgage Securities, Cl A1 | ||||||
5.017%, 02/12/51 | 41 | 42 | ||||
JPMorgan Chase Commercial Mortgage Securities, Cl A2 | ||||||
5.633%, 12/05/27 (C) | 1,865 | 1,973 | ||||
JPMorgan Chase Commercial Mortgage Securities, Cl A2S | ||||||
5.305%, 01/15/49 | 2,674 | 2,658 | ||||
JPMorgan Chase Commercial Mortgage Securities, Cl A4 | ||||||
5.481%, 12/12/44 (B) | 750 | 763 | ||||
5.376%, 06/12/41 (B) | 546 | 562 | ||||
JPMorgan Chase Commercial Mortgage Securities, Ser 2001-CIB2, Cl A3 | ||||||
6.429%, 04/15/35 | 4,000 | 4,159 | ||||
JPMorgan Chase Commercial Mortgage Securities, Ser 2002-CIB5, Cl A2 | ||||||
5.161%, 10/12/37 | 460 | 485 | ||||
JPMorgan Chase Commercial Mortgage Securities, Ser 2003-PM1A, Cl A4 | ||||||
5.326%, 11/12/08 (B) | 144 | 152 | ||||
JPMorgan Chase Commercial Mortgage Securities, Ser 2005-LDP4, Cl A4 | ||||||
4.918%, 10/15/42 (B) | 442 | 447 | ||||
JPMorgan Chase Commercial Mortgage Securities, Ser 2006-LDP9, Cl A3 | ||||||
5.336%, 05/15/47 | 762 | 743 | ||||
JPMorgan Chase Commercial Mortgage Securities, Ser 2007-CB18, Cl A4 | ||||||
5.716%, 02/15/51 | 982 | 928 | ||||
JPMorgan Chase Commercial Mortgage Securities, Ser 2007-CB19, Cl A2 | ||||||
5.747%, 02/12/49 (B) | 231 | 238 | ||||
| Description | Face Amount ($ Thousands) | Market Value ($ Thousands) | ||||
JPMorgan Chase Commercial Mortgage Securities, Ser 2007-LD12, Cl A4 | ||||||
5.882%, 02/15/51 (B) | $ | 3,030 | $ | 2,962 | ||
JPMorgan Chase Commercial Mortgage Securities, Ser 2007-LDPX, Cl A3 | ||||||
5.420%, 01/15/49 | 10,000 | 9,634 | ||||
JPMorgan Chase Commercial Mortgage Securities, Ser CIB4, Cl A3 | ||||||
6.162%, 05/12/34 | 839 | 892 | ||||
JPMorgan Commercial Mortgage Finance, Cl C | ||||||
7.753%, 08/15/32 (B) | 306 | 306 | ||||
JPMorgan Commercial Mortgage Finance, Ser 2000-C10, Cl A2 | ||||||
7.371%, 08/15/32 (B) | 35 | 35 | ||||
JPMorgan Mortgage Trust, Ser 2005-A3, Cl 11A2 | ||||||
4.500%, 11/25/08 (B) | 10,900 | 8,151 | ||||
JPMorgan Mortgage Trust, Ser 2006-A2, Cl 2A2 | ||||||
5.759%, 11/25/08 (B) | 12,600 | 10,058 | ||||
JPMorgan Mortgage Trust, Ser 2006-A3, Cl 3A4 | ||||||
5.733%, 05/25/36 (B) | 13,560 | 11,015 | ||||
JPMorgan Chase Commercial Mortgage Securities, Ser 2003-CB7, Cl A4 | ||||||
4.879%, 01/12/38 (B) | 732 | 761 | ||||
LB-UBS Commercial Mortgage Trust | ||||||
6.155%, 04/15/41 (B) | 240 | 251 | ||||
LB-UBS Commercial Mortgage Trust, Cl A5 | ||||||
4.628%, 10/15/29 | 294 | 299 | ||||
LB-UBS Commercial Mortgage Trust, Cl A4 | ||||||
5.883%, 06/15/38 (B) | 1,036 | 1,088 | ||||
5.372%, 09/15/39 | 1,103 | 1,122 | ||||
4.563%, 09/15/26 | 307 | 316 | ||||
4.166%, 05/15/32 | 197 | 201 | ||||
LB-UBS Commercial Mortgage Trust, Cl AAB | ||||||
5.403%, 02/15/40 | 144 | 147 | ||||
LB-UBS Commercial Mortgage Trust, Ser 2002-C2, Cl A4 | ||||||
5.594%, 06/15/31 | 1,180 | 1,254 | ||||
LB-UBS Commercial Mortgage Trust, Ser 2002-C4, Cl A5 | ||||||
4.853%, 09/15/31 | 631 | 662 | ||||
LB-UBS Commercial Mortgage Trust, Ser 2003-C8, Cl A4 | ||||||
5.124%, 11/15/32 (B) | 205 | 216 | ||||
| SEI Institutional Managed Trust / Semi-Annual Report / March 31, 2010 | 41 |
Table of Contents
SCHEDULE OF INVESTMENTS (Unaudited)
Core Fixed Income Fund (Continued)
March 31, 2010
| Description | Face Amount ($ Thousands) | Market Value ($ Thousands) | ||||
LB-UBS Commercial Mortgage Trust, Ser 2007-C1, Cl A3 | ||||||
5.398%, 02/15/40 | $ | 554 | $ | 575 | ||
LB-UBS Commercial Mortgage Trust, Ser 2007-C1, Cl A2 | ||||||
5.318%, 02/15/40 | 817 | 833 | ||||
Master Reperforming Loan Trust, Ser 2005-1, Cl 1A1 | ||||||
6.000%, 08/25/34 (C) | 3,550 | 3,239 | ||||
Master Seasoned Securities Trust, Ser 2004-2, Cl A2 | ||||||
6.500%, 08/25/32 | 1,754 | 1,765 | ||||
Merrill Lynch Mortgage Investors, Ser 2004-A1, Cl 4A | ||||||
5.261%, 02/25/34 (B) | 3,577 | 3,390 | ||||
Merrill Lynch Mortgage Trust, Cl A3A | ||||||
4.949%, 07/12/38 (B) | 433 | 438 | ||||
Merrill Lynch Mortgage Trust, Ser 2005-MCP1, Cl A4 | ||||||
4.747%, 06/12/43 (B) | 2,480 | 2,516 | ||||
Merrill Lynch Mortgage Trust, Ser KEY1, Cl A4 | ||||||
5.236%, 11/12/35 (B) | 1,769 | 1,839 | ||||
Merrill Lynch/Countrywide Commercial Mortgage, Ser 2006-4, Cl A3 | ||||||
5.172%, 12/12/49 (B) | 7,000 | 6,773 | ||||
MLCC Mortgage Investors, Ser 2004-B, Cl A3 | ||||||
2.425%, 05/25/29 (B) | 826 | 706 | ||||
Morgan Stanley Capital I | ||||||
5.385%, 03/12/44 (B) | 1,133 | 1,177 | ||||
5.168%, 01/14/42 | 232 | 242 | ||||
Morgan Stanley Capital I, Cl A7 | ||||||
4.970%, 04/14/40 | 2,179 | 2,195 | ||||
Morgan Stanley Capital I, Cl A4 | ||||||
5.811%, 08/12/41 (B) | 663 | 701 | ||||
5.402%, 06/15/38 (B) | 1,480 | 1,537 | ||||
5.270%, 06/13/41 (B) | 363 | 372 | ||||
4.900%, 06/15/40 | 886 | 888 | ||||
4.520%, 12/13/41 | 73 | 75 | ||||
Morgan Stanley Capital I, Cl A2 | ||||||
4.690%, 06/13/41 | 208 | 210 | ||||
4.070%, 05/15/40 | 154 | 158 | ||||
Morgan Stanley Capital I, Ser 2003-T11, Cl A4 | ||||||
5.150%, 06/13/41 | 768 | 810 | ||||
Morgan Stanley Capital I, Ser 2004-HQ3, Cl A4 | ||||||
4.800%, 01/13/41 | 364 | 374 | ||||
Morgan Stanley Capital I, Ser 2005-HQ5, Cl AAB | ||||||
5.037%, 01/14/42 | 1,542 | 1,606 | ||||
| Description | Face Amount ($ Thousands) | Market Value ($ Thousands) | ||||
Morgan Stanley Capital I, Ser 2005-HQ6, Cl A4A | ||||||
4.989%, 08/13/42 | $ | 2,671 | $ | 2,720 | ||
Morgan Stanley Capital I, Ser 2005-HQ7, Cl AAB | ||||||
5.184%, 11/14/42 (B) | 802 | 842 | ||||
Morgan Stanley Capital I, Ser 2006-T21, Cl A4 | ||||||
5.162%, 10/12/52 (B) | 2,500 | 2,564 | ||||
Morgan Stanley Capital I, Ser 2007-IQ14, Cl A4 | ||||||
5.692%, 04/15/49 (B) | 4,200 | 3,852 | ||||
Morgan Stanley Dean Witter Capital I, Cl A4 | ||||||
5.740%, 12/15/35 | 185 | 195 | ||||
Morgan Stanley Dean Witter Capital I | ||||||
6.510%, 04/15/34 | 223 | 235 | ||||
Morgan Stanley Dean Witter Capital I, Cl A2 | ||||||
4.740%, 11/13/36 | 460 | 478 | ||||
Morgan Stanley Dean Witter Capital I, Cl B | ||||||
6.550%, 07/15/33 | 325 | 338 | ||||
Morgan Stanley Dean Witter Capital I, Ser 2001-TOP5, Cl A4 | ||||||
6.390%, 10/15/35 | 1,148 | 1,210 | ||||
Morgan Stanley Dean Witter Capital I, Ser 2003-HQ2, Cl A2 | ||||||
4.920%, 03/12/35 | 1,439 | 1,497 | ||||
Morgan Stanley Mortgage Loan Trust, Ser 2007-6XS, Cl 2A1S | ||||||
0.356%, 02/25/47 (B) | 292 | 226 | ||||
Prudential Mortgage Capital Funding, Cl B | ||||||
6.760%, 05/10/34 | 295 | 310 | ||||
RBS Greenwhich Capital Mortgage Pass-Through Certificates, Ser 2007-B, Cl 1A4 | ||||||
0.696%, 01/25/37 (B) | 4,410 | 2,496 | ||||
Residential Asset Mortgage Products, Ser 2004-SL1, Cl A8 | ||||||
6.500%, 11/25/31 | 513 | 499 | ||||
Residential Asset Securitization Trust, Cl A1 | ||||||
5.000%, 08/25/19 | 796 | 760 | ||||
Residential Asset Securitization Trust, Ser 2004-IP2, Cl 2A1 | ||||||
3.151%, 12/25/34 (B) | 1,043 | 912 | ||||
Salomon Brothers Mortgage Securities VII, Cl C | ||||||
7.727%, 07/18/33 (B) | 470 | 470 | ||||
Salomon Brothers Mortgage Securities VII, Ser 2001-C2, Cl A3 | ||||||
6.499%, 10/13/11 | 4,995 | 5,249 | ||||
| 42 | SEI Institutional Managed Trust / Semi-Annual Report / March 31, 2010 |
Table of Contents
| Description | Face Amount ($ Thousands) | Market Value ($ Thousands) | ||||
Salomon Brothers Mortgage Securities VII, Ser 2002-KEY2, Cl A2 | ||||||
4.467%, 03/18/36 | $ | 404 | $ | 416 | ||
Structured Adjustable Rate Mortgage Loan Trust, Ser 2005-19, Cl 1A1 | ||||||
0.566%, 10/25/35 (B) | 1,667 | 989 | ||||
Structured Adjustable Rate Mortgage Loan Trust, Ser 2007-7, Cl 2AS2 | ||||||
5.574%, 08/25/15 (B) | 10,042 | 6,529 | ||||
Structured Asset Mortgage Investments, Ser 2006-AR8, Cl A1A | ||||||
0.446%, 10/25/36 (B) | 4,581 | 2,558 | ||||
Structured Asset Securities, Cl 1A | ||||||
0.579%, 06/25/35 (B) (C) | 2,567 | 2,037 | ||||
Structured Asset Securities, Cl A | ||||||
0.579%, 03/25/35 to 04/25/35 (B) (C) | 5,062 | 4,065 | ||||
Structured Asset Securities, Ser 2005-17, Cl 5A1 | ||||||
5.500%, 10/25/35 | 2,929 | 2,393 | ||||
Thornburg Mortgage Securities Trust, Ser 2007-4, Cl 2A1 | ||||||
6.201%, 08/30/37 (B) | 4,619 | 4,114 | ||||
Thornburg Mortgage Securities Trust, Ser 2007-4, Cl 3A1 | ||||||
6.192%, 09/25/37 (B) | 4,769 | 4,074 | ||||
US Bank, Ser 2007-1, Cl A | ||||||
5.920%, 05/25/12 | 2,363 | 2,429 | ||||
Wachovia Bank Commercial Mortgage Trust, Ser 2002-C1A, Cl A4 | ||||||
6.287%, 04/15/34 | 1,202 | 1,281 | ||||
Wachovia Bank Commercial Mortgage Trust, Ser 2003-C6, Cl A3 | ||||||
4.957%, 08/15/35 (B) | 463 | 472 | ||||
Wachovia Bank Commercial Mortgage Trust, Ser 2003-C7, Cl A1 | ||||||
4.241%, 10/15/35 (C) | 164 | 166 | ||||
Wachovia Bank Commercial Mortgage Trust, Ser 2003-C8, Cl A3 | ||||||
4.445%, 11/15/35 | 681 | 690 | ||||
Wachovia Bank Commercial Mortgage Trust, Ser 2004-C11, Cl A4 | ||||||
5.030%, 01/15/41 | 467 | 476 | ||||
Washington Mutual Mortgage Pass-Through Certificates, Cl 1A | ||||||
1.351%, 10/25/46 (B) | 3,969 | 2,392 | ||||
| Description | Face Amount ($ Thousands) | Market Value ($ Thousands) | ||||
Washington Mutual Mortgage Pass-Through Certificates, Cl 1A1 | ||||||
5.677%, 02/25/37 (B) | $ | 3,361 | $ | 2,433 | ||
Washington Mutual Mortgage Pass-Through Certificates, Ser 2003-MS1, Cl 1A | ||||||
5.000%, 02/25/18 | 897 | 910 | ||||
Washington Mutual Mortgage Pass-Through Certificates, Ser 2005-AR13, Cl A1A1 | ||||||
0.536%, 10/25/47 (B) | 4,041 | 3,114 | ||||
Washington Mutual Mortgage Pass-Through Certificates, Ser 2005-AR15, Cl A1A2 | ||||||
0.526%, 11/25/47 (B) | 6,164 | 4,129 | ||||
Washington Mutual Mortgage Pass-Through Certificates, Ser 2005-AR16, Cl 1A4A | ||||||
5.077%, 12/25/35 (B) | 12,955 | 10,268 | ||||
Washington Mutual Mortgage Pass-Through Certificates, Ser 2005-AR19, Cl A1A2 | ||||||
0.536%, 12/25/45 (B) | 5,764 | 3,860 | ||||
Washington Mutual Mortgage Pass-Through Certificates, Ser 2005-AR5, Cl A6 | ||||||
4.642%, 05/25/35 (B) | 9,220 | 7,820 | ||||
Washington Mutual Mortgage Pass-Through Certificates, Ser 2007-OA6, Cl 1A | ||||||
1.281%, 07/25/47 (B) | 8,616 | 5,096 | ||||
Wells Fargo Mortgage-Backed Securities Trust, Ser 2004-H, Cl 1A1 | ||||||
4.531%, 06/25/34 (B) | 3,542 | 3,440 | ||||
| 393,272 | ||||||
Total Mortgage-Backed Securities | 1,142,515 | |||||
CORPORATE OBLIGATIONS — 31.3% | ||||||
Consumer Discretionary — 1.4% | ||||||
American Achievement | ||||||
8.250%, 04/01/12 (C) | 900 | 891 | ||||
Boyd Gaming | ||||||
7.125%, 02/01/16 (D) | 350 | 292 | ||||
6.750%, 04/15/14 (D) | 570 | 498 | ||||
British Sky Broadcasting Group | ||||||
9.500%, 11/15/18 (C) | 782 | 1,006 | ||||
Comcast | ||||||
6.500%, 01/15/17 | 720 | 801 | ||||
6.500%, 01/15/15 | 985 | 1,109 | ||||
6.400%, 03/01/40 | 690 | 701 | ||||
5.450%, 11/15/10 | 525 | 538 | ||||
| SEI Institutional Managed Trust / Semi-Annual Report / March 31, 2010 | 43 |
Table of Contents
SCHEDULE OF INVESTMENTS (Unaudited)
Core Fixed Income Fund (Continued)
March 31, 2010
| Description | Face Amount ($ Thousands) | Market Value ($ Thousands) | ||||
5.300%, 01/15/14 | $ | 2,340 | $ | 2,516 | ||
5.150%, 03/01/20 | 1,005 | 1,014 | ||||
Comcast Cable Communications | ||||||
8.375%, 03/15/13 | 1,179 | 1,367 | ||||
6.750%, 01/30/11 (D) | 2,310 | 2,414 | ||||
COX Communications | ||||||
4.625%, 06/01/13 | 805 | 851 | ||||
Daimler Finance LLC | ||||||
7.300%, 01/15/12 | 1,400 | 1,525 | ||||
6.500%, 11/15/13 | 1,320 | 1,463 | ||||
DISH DBS | ||||||
7.875%, 09/01/19 | 690 | 718 | ||||
Eastman Kodak | ||||||
7.250%, 11/15/13 | 1,420 | 1,353 | ||||
Echostar DBS | ||||||
7.750%, 05/31/15 | 220 | 230 | ||||
General Motors | ||||||
8.250%, 07/15/23 (D) (E) | 3,100 | 1,147 | ||||
Grupo Televisa | ||||||
6.625%, 01/15/40 | 1,005 | 1,003 | ||||
Inn of the Mountain Gods Resort & Casino | ||||||
12.000%, 11/15/10 (E) | 1,010 | 485 | ||||
Lamar Media, Ser B | ||||||
6.625%, 08/15/15 | 150 | 144 | ||||
MGM Mirage | ||||||
8.500%, 09/15/10 | 10 | 10 | ||||
7.625%, 01/15/17 (D) | 440 | 366 | ||||
News America | ||||||
6.650%, 11/15/37 | 180 | 189 | ||||
6.200%, 12/15/34 | 65 | 65 | ||||
Station Casinos | ||||||
7.750%, 08/15/16 (E) | 1,495 | 108 | ||||
Sun Media | ||||||
7.625%, 02/15/13 | 470 | 461 | ||||
Thomson Reuters | ||||||
5.950%, 07/15/13 | 577 | 638 | ||||
Time Warner | ||||||
7.700%, 05/01/32 | 835 | 964 | ||||
6.875%, 05/01/12 | 2,225 | 2,447 | ||||
Time Warner Cable | ||||||
8.750%, 02/14/19 | 210 | 261 | ||||
8.250%, 04/01/19 | 4,895 | 5,923 | ||||
6.750%, 06/15/39 | 920 | 965 | ||||
Time Warner Entertainment | ||||||
8.375%, 07/15/33 | 60 | 72 | ||||
| 34,535 | ||||||
Consumer Staples — 1.1% | ||||||
Altria Group | ||||||
10.200%, 02/06/39 | 350 | 469 | ||||
9.700%, 11/10/18 | 1,650 | 2,032 | ||||
9.250%, 08/06/19 | 920 | 1,118 | ||||
| Description | Face Amount ($ Thousands) | Market Value ($ Thousands) | ||||
Anheuser-Busch | ||||||
5.050%, 10/15/16 | $ | 940 | $ | 987 | ||
Anheuser-Busch InBev Worldwide | ||||||
7.750%, 01/15/19 (C) | 571 | 679 | ||||
5.375%, 01/15/20 | 1,580 | 1,630 | ||||
5.000%, 04/15/20 (C) | 560 | 562 | ||||
4.125%, 01/15/15 | 1,860 | 1,914 | ||||
CVS Caremark | ||||||
9.350%, 01/10/23 (C) | 4,300 | 4,190 | ||||
Diageo Capital | ||||||
7.375%, 01/15/14 | 4,870 | 5,664 | ||||
Dr Pepper Snapple Group | ||||||
6.820%, 05/01/18 | 1,470 | 1,679 | ||||
HJ Heinz | ||||||
5.350%, 07/15/13 | 510 | 553 | ||||
Kraft Foods | ||||||
6.500%, 02/09/40 | 1,165 | 1,207 | ||||
5.375%, 02/10/20 | 2,060 | 2,094 | ||||
PepsiCo | ||||||
5.500%, 01/15/40 | 1,245 | 1,233 | ||||
Reynolds American | ||||||
6.750%, 06/15/17 | 1,260 | 1,350 | ||||
Wal-Mart Stores | ||||||
5.625%, 04/01/40 | 1,060 | 1,056 | ||||
| 28,417 | ||||||
Energy — 3.6% | ||||||
Anadarko Finance, Ser B | ||||||
7.500%, 05/01/31 | 860 | 966 | ||||
Anadarko Petroleum | ||||||
6.450%, 09/15/36 | 3,450 | 3,516 | ||||
Apache | ||||||
6.000%, 09/15/13 | 2,570 | 2,879 | ||||
Baker Hughes | ||||||
7.500%, 11/15/18 | 2,530 | 3,025 | ||||
Canadian Natural Resources | ||||||
5.850%, 02/01/35 | 800 | 778 | ||||
5.700%, 05/15/17 | 265 | 283 | ||||
Chesapeake Energy | ||||||
7.250%, 12/15/18 | 660 | 660 | ||||
6.500%, 08/15/17 | 275 | 266 | ||||
Cie Generale de Geophysique-Veritas | ||||||
7.750%, 05/15/17 | 110 | 110 | ||||
7.500%, 05/15/15 | 1,205 | 1,208 | ||||
Conoco Funding | ||||||
7.250%, 10/15/31 | 50 | 59 | ||||
6.350%, 10/15/11 | 920 | 992 | ||||
ConocoPhillips | ||||||
5.900%, 10/15/32 | 10 | 10 | ||||
5.900%, 05/15/38 | 1,500 | 1,548 | ||||
ConocoPhillips Holding | ||||||
6.950%, 04/15/29 | 700 | 803 | ||||
| 44 | SEI Institutional Managed Trust / Semi-Annual Report / March 31, 2010 |
Table of Contents
| Description | Face Amount ($ Thousands) | Market Value ($ Thousands) | ||||
Consol Energy | ||||||
8.250%, 04/01/20 (C) | $ | 660 | $ | 678 | ||
El Paso | ||||||
6.950%, 06/01/28 | 6,750 | 6,096 | ||||
El Paso Performance-Linked Trust | ||||||
7.750%, 07/15/11 (C) | 3,830 | 3,965 | ||||
El Paso Pipeline Partners Operating | ||||||
6.500%, 04/01/20 | 675 | 683 | ||||
Energy Transfer Partners | ||||||
9.000%, 04/15/19 | 1,075 | 1,320 | ||||
8.500%, 04/15/14 | 434 | 505 | ||||
6.700%, 07/01/18 | 2,220 | 2,425 | ||||
Enterprise Products Operating | ||||||
9.750%, 01/31/14 | 1,910 | 2,319 | ||||
GAZ Capital | ||||||
6.212%, 11/22/16 (C) | 220 | 228 | ||||
Hess | ||||||
7.875%, 10/01/29 | 1,070 | 1,282 | ||||
7.300%, 08/15/31 | 1,650 | 1,880 | ||||
Husky Energy | ||||||
7.250%, 12/15/19 | 656 | 760 | ||||
5.900%, 06/15/14 | 572 | 622 | ||||
Kerr-McGee | ||||||
7.875%, 09/15/31 | 820 | 953 | ||||
6.950%, 07/01/24 | 450 | 501 | ||||
Kinder Morgan Energy Partners | ||||||
7.125%, 03/15/12 | 90 | 99 | ||||
6.750%, 03/15/11 | 450 | 473 | ||||
6.000%, 02/01/17 | 505 | 542 | ||||
5.850%, 09/15/12 | 130 | 141 | ||||
5.000%, 12/15/13 | 720 | 772 | ||||
Occidental Petroleum | ||||||
7.000%, 11/01/13 | 4,000 | 4,633 | ||||
OPTI Canada | ||||||
7.875%, 12/15/14 | 70 | 65 | ||||
Peabody Energy, Ser B | ||||||
6.875%, 03/15/13 | 35 | 35 | ||||
Pemex Project Funding Master Trust | ||||||
6.625%, 06/15/35 | 1,667 | 1,642 | ||||
Petrobras International Finance | ||||||
7.875%, 03/15/19 | 654 | 765 | ||||
6.875%, 01/20/40 | 645 | 666 | ||||
6.125%, 10/06/16 | 655 | 705 | ||||
5.750%, 01/20/20 | 574 | 588 | ||||
Petro-Canada | ||||||
6.800%, 05/15/38 | 365 | 391 | ||||
Ras Laffan Liquefied Natural Gas III | ||||||
5.500%, 09/30/14 (C) (D) | 1,185 | 1,272 | ||||
4.500%, 09/30/12 (C) | 785 | 824 | ||||
Rockies Express Pipeline | ||||||
5.625%, 04/15/20 (C) | 1,245 | 1,226 | ||||
3.900%, 04/15/15 (C) | 1,045 | 1,031 | ||||
SandRidge Energy | ||||||
9.875%, 05/15/16 (C) | 870 | 894 | ||||
| Description | Face Amount ($ Thousands) | Market Value ($ Thousands) | ||||
Shell International Finance BV | ||||||
4.375%, 03/25/20 | $ | 1,980 | $ | 1,963 | ||
Southern Natural Gas | ||||||
8.000%, 03/01/32 | 170 | 192 | ||||
Southern Union | ||||||
8.250%, 11/15/29 | 1,315 | 1,501 | ||||
Suncor Energy | ||||||
6.500%, 06/15/38 | 815 | 850 | ||||
Tennessee Gas Pipeline | ||||||
7.625%, 04/01/37 | 830 | 918 | ||||
Tosco | ||||||
8.125%, 02/15/30 | 400 | 503 | ||||
Total Capital | ||||||
3.125%, 10/02/15 | 1,345 | 1,336 | ||||
Valero Energy | ||||||
10.500%, 03/15/39 | 1,750 | 2,248 | ||||
9.375%, 03/15/19 | 4,406 | 5,246 | ||||
6.625%, 06/15/37 | 1,125 | 1,070 | ||||
Williams | ||||||
8.750%, 03/15/32 (D) | 1,732 | 2,110 | ||||
7.875%, 09/01/21 | 3,884 | 4,573 | ||||
7.750%, 06/15/31 | 1,392 | 1,562 | ||||
Williams Partners | ||||||
6.300%, 04/15/40 (C) | 985 | 979 | ||||
3.800%, 02/15/15 (C) | 505 | 504 | ||||
Williams, Ser A | ||||||
7.500%, 01/15/31 | 808 | 888 | ||||
XTO Energy | ||||||
7.500%, 04/15/12 | 850 | 952 | ||||
6.750%, 08/01/37 | 495 | 580 | ||||
5.500%, 06/15/18 | 2,030 | 2,204 | ||||
| 88,263 | ||||||
Financials — 16.7% | ||||||
Achmea Hypotheekbank | ||||||
3.200%, 11/03/14 (C) | 2,510 | 2,542 | ||||
Aiful | ||||||
5.000%, 08/10/10 (C) (D) | 1,010 | 965 | ||||
Allied World Assurance Holdings | ||||||
7.500%, 08/01/16 | 2,355 | 2,549 | ||||
Allstate Life Global Funding Trusts MTN | ||||||
5.375%, 04/30/13 (D) | 1,410 | 1,536 | ||||
American Express | ||||||
7.250%, 05/20/14 | 858 | 972 | ||||
6.800%, 09/01/66 (B) | 2,010 | 1,960 | ||||
American Express Credit MTN | ||||||
5.125%, 08/25/14 | 2,100 | 2,230 | ||||
American General Finance MTN | ||||||
6.900%, 12/15/17 | 2,820 | 2,470 | ||||
American International Group | ||||||
6.250%, 03/15/37 | 2,560 | 1,894 | ||||
5.850%, 01/16/18 | 4,340 | 4,033 | ||||
| SEI Institutional Managed Trust / Semi-Annual Report / March 31, 2010 | 45 |
Table of Contents
SCHEDULE OF INVESTMENTS (Unaudited)
Core Fixed Income Fund (Continued)
March 31, 2010
| Description | Face Amount ($ Thousands) | Market Value ($ Thousands) | ||||
ASIF Global Financing XIX | ||||||
4.900%, 01/17/13 (C) | $ | 390 | $ | 394 | ||
BAC Capital Trust XIV | ||||||
5.630%, 03/15/12 (B) | 130 | 98 | ||||
BAC Capital Trust XV | ||||||
1.052%, 06/01/56 (B) | 5,715 | 3,870 | ||||
Banco Nacional de Desenvolvimento Economico e Social | ||||||
5.500%, 07/12/20 | 1,415 | 1,401 | ||||
Bank of America | ||||||
7.625%, 06/01/19 | 635 | 726 | ||||
7.375%, 05/15/14 | 1,095 | 1,231 | ||||
6.500%, 08/01/16 | 2,250 | 2,432 | ||||
6.000%, 09/01/17 | 745 | 775 | ||||
5.750%, 12/01/17 | 3,165 | 3,245 | ||||
5.420%, 03/15/17 | 4,300 | 4,250 | ||||
4.500%, 04/01/15 | 1,285 | 1,296 | ||||
Bank of Tokyo-Mitsubishi UFJ | ||||||
3.850%, 01/22/15 (C) | 690 | 697 | ||||
Bank One | ||||||
7.875%, 08/01/10 | 995 | 1,019 | ||||
Barclays Bank MTN | ||||||
6.050%, 12/04/17 (C) | 1,230 | 1,269 | ||||
5.200%, 07/10/14 | 630 | 673 | ||||
5.125%, 01/08/20 | 760 | 749 | ||||
5.000%, 09/22/16 | 1,175 | 1,208 | ||||
Barnett Capital III | ||||||
0.874%, 02/01/27 (B) | 425 | 292 | ||||
Bear Stearns | ||||||
7.250%, 02/01/18 | 1,120 | 1,294 | ||||
6.950%, 08/10/12 | 580 | 643 | ||||
6.400%, 10/02/17 | 70 | 77 | ||||
5.350%, 02/01/12 | 3,280 | 3,506 | ||||
4.650%, 07/02/18 | 995 | 970 | ||||
4.500%, 10/28/10 | 1,470 | 1,504 | ||||
Berkshire Hathaway | ||||||
3.200%, 02/11/15 | 1,840 | 1,856 | ||||
Berkshire Hathaway Finance | ||||||
5.400%, 05/15/18 (D) | 830 | 882 | ||||
Boeing Capital | ||||||
4.700%, 10/27/19 | 490 | 493 | ||||
BP Capital Markets | ||||||
5.250%, 11/07/13 | 680 | 748 | ||||
3.875%, 03/10/15 | 210 | 218 | ||||
Capital One Bank USA | ||||||
8.800%, 07/15/19 | 855 | 1,033 | ||||
Caterpillar Financial Services MTN | ||||||
6.200%, 09/30/13 | 3,650 | 4,122 | ||||
Chase Capital VI | ||||||
0.874%, 08/01/28 (B) | 2,500 | 1,951 | ||||
Citigroup | ||||||
8.125%, 07/15/39 | 332 | 383 | ||||
6.875%, 03/05/38 (D) | 6,555 | 6,624 | ||||
6.500%, 08/19/13 | 1,310 | 1,413 | ||||
6.375%, 08/12/14 | 1,095 | 1,170 | ||||
6.125%, 05/15/18 (D) | 4,770 | 4,874 | ||||
| Description | Face Amount ($ Thousands) | Market Value ($ Thousands) | ||||
6.010%, 01/15/15 | $ | 660 | $ | 693 | ||
5.875%, 02/22/33 | 1,685 | 1,454 | ||||
5.500%, 04/11/13 | 2,683 | 2,819 | ||||
5.500%, 02/15/17 | 2,350 | 2,322 | ||||
5.000%, 09/15/14 | 3,245 | 3,241 | ||||
0.524%, 06/09/16 (B) | 3,650 | 3,123 | ||||
Citigroup Capital III | ||||||
7.625%, 12/01/36 | 1,500 | 1,233 | ||||
Citigroup Funding | ||||||
1.875%, 10/22/12 | 2,165 | 2,182 | ||||
Commonwealth Bank of Australia | ||||||
5.000%, 03/19/20 (C) | 890 | 884 | ||||
5.000%, 10/15/19 (C) | 1,465 | 1,472 | ||||
3.750%, 10/15/14 (C) | 2,075 | 2,104 | ||||
Countrywide Financial | ||||||
6.250%, 05/15/16 | 1,080 | 1,109 | ||||
5.800%, 06/07/12 | 2,745 | 2,918 | ||||
Countrywide Financial, Cl A | ||||||
0.492%, 10/15/28 (B) | 101 | 79 | ||||
Countrywide Home Loans MTN | ||||||
4.000%, 03/22/11 | 2,100 | 2,159 | ||||
Credit Agricole | ||||||
8.375%, 12/31/49 (B) (C) (D) | 2,460 | 2,663 | ||||
Credit Suisse | ||||||
5.400%, 01/14/20 | 850 | 857 | ||||
Credit Suisse New York | ||||||
6.000%, 02/15/18 | 4,420 | 4,680 | ||||
Credit Suisse NY | ||||||
5.500%, 05/01/14 | 3,000 | 3,265 | ||||
5.300%, 08/13/19 | 585 | 600 | ||||
Credit Suisse USA | ||||||
4.875%, 08/15/10 | 2,210 | 2,244 | ||||
Depfa ACS Bank | ||||||
5.125%, 03/16/37 (C) | 3,000 | 2,217 | ||||
Deutsche Bank | ||||||
4.875%, 05/20/13 | 1,830 | 1,961 | ||||
Deutsche Bank Capital Funding Trust VII | ||||||
5.628%, 01/19/49 (B) (C) | 2,760 | 2,305 | ||||
East Lane Re | ||||||
6.249%, 05/06/11 (B) (C) | 650 | 650 | ||||
Export-Import Bank of Korea | ||||||
5.875%, 01/14/15 | 1,255 | 1,353 | ||||
5.500%, 10/17/12 | 772 | 824 | ||||
Farmer Mac Guaranteed Notes Trust 2007-1 | ||||||
5.125%, 04/19/17 (C) | 3,540 | 3,703 | ||||
Farmers Exchange Capital | ||||||
7.050%, 07/15/28 (C) | 1,434 | 1,321 | ||||
Farmers Insurance Exchange | ||||||
8.625%, 05/01/24 (C) | 3,017 | 3,244 | ||||
First Industrial L.P. MTN | ||||||
7.500%, 12/01/17 | 970 | 822 | ||||
Fleet Capital Trust II | ||||||
7.920%, 12/11/26 | 1,050 | 1,043 | ||||
| 46 | SEI Institutional Managed Trust / Semi-Annual Report / March 31, 2010 |
Table of Contents
| Description | Face Amount ($ Thousands) | Market Value ($ Thousands) | ||||
Ford Motor Credit LLC | ||||||
8.000%, 12/15/16 | $ | 2,680 | $ | 2,824 | ||
5.507%, 06/15/11 (B) | 3,863 | 3,940 | ||||
Forest City Enterprises | ||||||
6.500%, 02/01/17 | 270 | 217 | ||||
General Electric Capital MTN | ||||||
6.375%, 11/15/19 (B) | 5,870 | 5,510 | ||||
6.000%, 08/07/19 | 710 | 750 | ||||
5.900%, 05/13/14 | 2,800 | 3,081 | ||||
5.875%, 01/14/38 | 1,300 | 1,236 | ||||
5.625%, 05/01/18 (D) | 7,235 | 7,573 | ||||
5.450%, 01/15/13 | 20 | 22 | ||||
0.629%, 05/05/26 (B) | 3,500 | 2,870 | ||||
0.517%, 09/15/14 (B) | 2,460 | 2,338 | ||||
0.381%, 03/20/14 (B) | 1,900 | 1,780 | ||||
Glitnir Banki HF | ||||||
7.451%, 09/14/16 (C) (E) | 400 | — | ||||
6.693%, 06/15/16 (C) (E) | 3,960 | — | ||||
6.375%, 09/25/12 (C) (E) | 2,330 | 687 | ||||
6.330%, 07/28/11 (C) (E) | 1,980 | 584 | ||||
GMAC | ||||||
7.500%, 12/31/13 | 103 | 105 | ||||
7.250%, 03/02/11 | 2,228 | 2,267 | ||||
6.875%, 09/15/11 | 2,735 | 2,779 | ||||
2.452%, 12/01/14 (B) | 2,234 | 1,967 | ||||
1.750%, 10/30/12 | 2,010 | 2,022 | ||||
Goldman Sachs Capital I | ||||||
6.345%, 02/15/34 | 520 | 480 | ||||
Goldman Sachs Capital II | ||||||
5.793%, 12/29/49 (B) | 1,867 | 1,582 | ||||
Goldman Sachs Group | ||||||
7.500%, 02/15/19 | 2,329 | 2,662 | ||||
6.750%, 10/01/37 | 1,011 | 1,010 | ||||
6.150%, 04/01/18 | 3,780 | 3,999 | ||||
5.950%, 01/18/18 | 260 | 273 | ||||
5.450%, 11/01/12 | 3,670 | 3,967 | ||||
5.375%, 03/15/20 | 3,230 | 3,200 | ||||
5.350%, 01/15/16 | 660 | 695 | ||||
5.250%, 10/15/13 (D) | 3,565 | 3,832 | ||||
4.500%, 06/15/10 | 1,000 | 1,007 | ||||
0.751%, 01/12/15 (B) | 1,750 | 1,711 | ||||
0.649%, 07/22/15 (B) | 500 | 483 | ||||
Hartford Financial Services Group | ||||||
5.500%, 03/30/20 | 810 | 798 | ||||
HBOS Capital Funding | ||||||
6.071%, 06/30/49 (B) (C) | 1,330 | 1,037 | ||||
HBOS PLC | ||||||
6.750%, 05/21/18 (C) | 2,100 | 1,930 | ||||
HCP MTN | ||||||
6.700%, 01/30/18 ‡ | 401 | 409 | ||||
6.300%, 09/15/16 ‡ | 1,429 | 1,452 | ||||
6.000%, 01/30/17 ‡ | 4,231 | 4,214 | ||||
5.650%, 12/15/13 ‡ | 1,149 | 1,201 | ||||
| Description | Face Amount ($ Thousands) | Market Value ($ Thousands) | ||||
Highwoods Properties | ||||||
7.500%, 04/15/18 ‡ | $ | 1,142 | $ | 1,159 | ||
HSBC Finance | ||||||
8.000%, 07/15/10 | 3,475 | 3,544 | ||||
4.625%, 09/15/10 | 650 | 661 | ||||
HSBC Holdings PLC | ||||||
6.800%, 06/01/38 | 600 | 643 | ||||
ICICI Bank | ||||||
6.375%, 04/30/22 (B) (C) | 1,260 | 1,186 | ||||
ILFC E-Capital Trust II | ||||||
6.250%, 12/21/65 (B) (C) | 900 | 693 | ||||
Jackson National Life Global Funding MTN | ||||||
5.375%, 05/08/13 (C) | 700 | 748 | ||||
Japan Bank for International Cooperation | ||||||
2.875%, 02/02/15 | 4,200 | 4,206 | ||||
JP Morgan Chase Capital XIII | ||||||
1.239%, 09/30/34 (B) | 1,000 | 781 | ||||
JP Morgan Chase Capital XXIII | ||||||
1.250%, 05/15/47 (B) | 1,900 | 1,426 | ||||
JP Morgan Chase Capital XXV | ||||||
6.800%, 10/01/37 | 1,094 | 1,092 | ||||
JPMorgan Chase | ||||||
6.000%, 01/15/18 | 225 | 244 | ||||
5.750%, 01/02/13 | 3,785 | 4,108 | ||||
4.950%, 03/25/20 | 1,040 | 1,031 | ||||
4.750%, 05/01/13 | 510 | 544 | ||||
3.700%, 01/20/15 | 875 | 880 | ||||
JPMorgan Chase Bank | ||||||
6.000%, 10/01/17 | 1,323 | 1,411 | ||||
6.000%, 07/05/17 | 2,250 | 2,398 | ||||
0.587%, 06/13/16 (B) | 1,300 | 1,220 | ||||
Kaupthing Bank MTN | ||||||
7.625%, 02/28/15 (C) (E) | 8,810 | 2,357 | ||||
7.125%, 05/19/16 (C) (E) | 1,350 | — | ||||
5.750%, 10/04/11 (C) (E) | 960 | 257 | ||||
Korea Development Bank | ||||||
4.375%, 08/10/15 (D) | 1,280 | 1,299 | ||||
Landsbanki Islands | ||||||
6.100%, 08/25/11 (C) (E) | 5,570 | 641 | ||||
Lazard Group | ||||||
7.125%, 05/15/15 | 1,607 | 1,687 | ||||
6.850%, 06/15/17 | 1,582 | 1,610 | ||||
LBG Capital No.1 MTN | ||||||
8.000%, 12/15/49 (B) | 5,850 | 5,060 | ||||
Lehman Brothers Holdings MTN | ||||||
14.500%, 06/20/16 (B) (E) | 3,977 | 855 | ||||
11.000%, 11/07/16 (B) (E) | 4,283 | 921 | ||||
8.910%, 02/16/17 (E) | 2,370 | 509 | ||||
6.750%, 12/28/17 (E) | 4,320 | 11 | ||||
6.200%, 09/26/14 (E) | 1,160 | 270 | ||||
5.250%, 02/06/12 (E) | 1,220 | 284 | ||||
Lehman Brothers Holdings Capital Trust V MTN | ||||||
5.857%, 11/29/49 (E) | 4,280 | 11 | ||||
| SEI Institutional Managed Trust / Semi-Annual Report / March 31, 2010 | 47 |
Table of Contents
SCHEDULE OF INVESTMENTS (Unaudited)
Core Fixed Income Fund (Continued)
March 31, 2010
| Description | Face Amount ($ Thousands) | Market Value ($ Thousands) | ||||
Liberty Mutual Group | ||||||
7.500%, 08/15/36 (C) | $ | 714 | $ | 689 | ||
Lloyds TSB Bank | ||||||
5.800%, 01/13/20 (C) | 1,570 | 1,532 | ||||
4.375%, 01/12/15 (C) | 1,470 | 1,449 | ||||
Mack-Cali Realty | ||||||
7.750%, 08/15/19 ‡ | 370 | 408 | ||||
MBNA Capital A | ||||||
8.278%, 12/01/26 | 1,450 | 1,461 | ||||
Merna Reinsurance, Ser B | ||||||
2.001%, 07/07/10 (B) (C) | 3,750 | 3,719 | ||||
Merrill Lynch MTN | ||||||
8.950%, 05/18/17 (B) | 1,790 | 1,871 | ||||
8.680%, 05/02/17 (B) | 3,160 | 3,286 | ||||
7.430%, 09/01/22 | 3 | 3 | ||||
6.050%, 05/16/16 | 350 | 357 | ||||
5.700%, 05/02/17 | 1,300 | 1,292 | ||||
5.450%, 02/05/13 | 2,080 | 2,201 | ||||
MetLife | ||||||
6.400%, 12/15/36 | 570 | 510 | ||||
MetLife Capital Trust IV | ||||||
7.875%, 12/15/37 (C) | 800 | 816 | ||||
MetLife Capital Trust X | ||||||
9.250%, 04/08/38 (B) (C) | 1,800 | 2,025 | ||||
Metropolitan Life Global Funding I | ||||||
5.125%, 04/10/13 (C) | 580 | 623 | ||||
5.125%, 06/10/14 (C) | 2,750 | 2,913 | ||||
Morgan Stanley MTN | ||||||
7.250%, 04/01/32 | 510 | 580 | ||||
6.750%, 04/15/11 | 30 | 32 | ||||
6.625%, 04/01/18 | 3,570 | 3,808 | ||||
6.000%, 04/28/15 | 630 | 675 | ||||
6.000%, 05/13/14 | 5,710 | 6,168 | ||||
5.950%, 12/28/17 | 605 | 622 | ||||
5.500%, 01/26/20 | 1,090 | 1,066 | ||||
0.701%, 10/18/16 (B) | 5,020 | 4,590 | ||||
0.549%, 01/09/14 (B) | 4,120 | 3,939 | ||||
MUFG Capital Finance 1 | ||||||
6.346%, 07/25/49 (B) | 1,670 | 1,656 | ||||
National Australia Bank | ||||||
5.350%, 06/12/13 (C) | 2,500 | 2,694 | ||||
National Capital Trust II | ||||||
5.486%, 12/29/49 (B) (C) | 2,231 | 2,035 | ||||
National City Bank MTN | ||||||
5.800%, 06/07/17 | 1,290 | 1,342 | ||||
0.622%, 06/07/17 (B) | 4,600 | 4,097 | ||||
Nationwide Mutual Insurance | ||||||
6.600%, 04/15/34 (C) | 2,440 | 2,051 | ||||
5.810%, 06/15/09 (B) (C) | 1,975 | 1,692 | ||||
NB Capital Trust IV | ||||||
8.250%, 04/15/27 | 1,055 | 1,066 | ||||
New Communications Holdings | ||||||
8.750%, 04/15/22 (C) | 703 | 703 | ||||
8.500%, 04/15/20 (C) | 605 | 610 | ||||
8.250%, 04/15/17 (C) | 700 | 712 | ||||
| Description | Face Amount ($ Thousands) | Market Value ($ Thousands) | ||||
NIBC Bank MTN | ||||||
2.800%, 12/02/14 (C) | $ | 1,725 | $ | 1,716 | ||
Nordea Bank | ||||||
4.875%, 01/27/20 (C) | 1,000 | 992 | ||||
3.700%, 11/13/14 (C) (D) | 2,695 | 2,715 | ||||
2.500%, 11/13/12 (C) | 995 | 1,004 | ||||
Pacific Life Global Funding | ||||||
5.150%, 04/15/13 (C) | 370 | 390 | ||||
Power Receivables Financial | ||||||
6.290%, 01/01/12 | 1,673 | 1,716 | ||||
Pricoa Global Funding I | ||||||
5.450%, 06/11/14 (C) (D) | 3,400 | 3,648 | ||||
Prime Property Fund | ||||||
5.600%, 06/15/11 (C) | 1,384 | 1,437 | ||||
5.500%, 01/15/14 ‡(C) | 1,850 | 1,809 | ||||
Private Export Funding | ||||||
3.050%, 10/15/14 | 445 | 451 | ||||
Prudential Holdings | ||||||
8.695%, 12/18/23 (C) | 1,300 | 1,498 | ||||
Rabobank Nederland | ||||||
11.000%, 12/31/49 (B) (C) | 1,810 | 2,329 | ||||
Reckson Operating Partnership | ||||||
7.750%, 03/15/20 ‡(C) | 1,305 | 1,327 | ||||
Residential Capital | ||||||
9.625%, 05/15/15 | 15 | 15 | ||||
Resona Preferred Global Securities | ||||||
7.191%, 07/30/49 (B) (C) | 580 | 544 | ||||
Royal Bank of Scotland | ||||||
4.875%, 03/16/15 | 400 | 400 | ||||
Royal Bank of Scotland Group | ||||||
7.640%, 09/29/17 (B) | 1,000 | 630 | ||||
6.400%, 10/21/19 | 2,230 | 2,229 | ||||
5.050%, 01/08/15 | 660 | 625 | ||||
5.000%, 10/01/14 | 990 | 947 | ||||
5.000%, 11/12/13 | 520 | 505 | ||||
Santander US Debt Unipersonal | ||||||
3.724%, 01/20/15 (C) | 1,600 | 1,594 | ||||
Shinsei Finance Cayman | ||||||
6.418%, 01/25/49 (B) (C) | 3,690 | 2,559 | ||||
Simon Property Group L.P. | ||||||
5.750%, 12/01/15 ‡ | 910 | 963 | ||||
SLM MTN | ||||||
8.000%, 03/25/20 | 1,200 | 1,168 | ||||
5.625%, 08/01/33 | 695 | 536 | ||||
5.375%, 05/15/14 | 2,655 | 2,515 | ||||
5.050%, 11/14/14 | 690 | 639 | ||||
5.000%, 10/01/13 | 2,500 | 2,388 | ||||
5.000%, 04/15/15 | 120 | 109 | ||||
SunTrust Preferred Capital I | ||||||
5.853%, 12/15/11 (B) | 259 | 199 | ||||
Svensk Exportkredit | ||||||
3.250%, 09/16/14 | 2,359 | 2,410 | ||||
Teachers Insurance & Annuity Association of America | ||||||
6.850%, 12/16/39 (C) | 1,300 | 1,410 | ||||
| 48 | SEI Institutional Managed Trust / Semi-Annual Report / March 31, 2010 |
Table of Contents
| Description | Face Amount ($ Thousands) | Market Value ($ Thousands) | ||||
TNK-BP Finance | ||||||
7.500%, 07/18/16 (C) | $ | 1,170 | $ | 1,272 | ||
6.625%, 03/20/17 (C) | 280 | 288 | ||||
Travelers | ||||||
6.250%, 03/15/37 (B) | 1,470 | 1,447 | ||||
5.375%, 06/15/12 | 370 | 399 | ||||
UBS MTN | ||||||
3.875%, 01/15/15 | 1,320 | 1,302 | ||||
UDR MTN | ||||||
5.000%, 01/15/12 ‡ | 2,000 | 2,040 | ||||
Ventas Realty L.P. | ||||||
9.000%, 05/01/12 ‡ | 180 | 192 | ||||
6.500%, 06/01/16 ‡ | 495 | 506 | ||||
Wachovia MTN | ||||||
5.750%, 02/01/18 | 2,260 | 2,403 | ||||
5.300%, 10/15/11 | 2,155 | 2,280 | ||||
5.250%, 08/01/14 | 2,570 | 2,700 | ||||
4.875%, 02/15/14 | 875 | 906 | ||||
Wachovia Capital Trust III | ||||||
5.800%, 03/15/11 (B) | 1,930 | 1,636 | ||||
WEA Finance | ||||||
7.500%, 06/02/14 (C) | 698 | 781 | ||||
7.125%, 04/15/18 (C) | 4,429 | 4,791 | ||||
6.750%, 09/02/19 (C) | 1,700 | 1,814 | ||||
Wells Fargo Capital X | ||||||
5.950%, 12/15/36 | 760 | 697 | ||||
Wells Fargo Capital XV | ||||||
9.750%, 12/31/49 (B) | 3,790 | 4,245 | ||||
Westfield Capital | ||||||
4.375%, 11/15/10 (C) | 2,103 | 2,136 | ||||
Westfield Group | ||||||
5.400%, 10/01/12 (C) | 898 | 952 | ||||
Westpac Banking | ||||||
4.875%, 11/19/19 | 750 | 745 | ||||
2.250%, 11/19/12 | 1,720 | 1,732 | ||||
Woodbourne Capital Trust I | ||||||
1.328%, 04/08/49 (B) (C) | 625 | 137 | ||||
Woodbourne Capital Trust II | ||||||
1.328%, 04/08/49 (B) (C) | 625 | 137 | ||||
Woodbourne Capital Trust III | ||||||
1.328%, 04/08/49 (B) (C) | 625 | 137 | ||||
Woodbourne Capital Trust IV | ||||||
1.328%, 04/08/49 (B) (C) | 625 | 137 | ||||
ZFS Finance USA Trust I | ||||||
6.150%, 12/15/65 (B) (C) | 4,272 | 4,165 | ||||
| 413,009 | ||||||
Health Care — 1.2% | ||||||
Amgen | ||||||
5.750%, 03/15/40 | 1,045 | 1,035 | ||||
CareFusion | ||||||
4.125%, 08/01/12 | 640 | 668 | ||||
Coventry Health Care | ||||||
5.950%, 03/15/17 | 1,109 | 1,058 | ||||
| Description | Face Amount ($ Thousands) | Market Value ($ Thousands) | ||||
FMC Finance III | ||||||
6.875%, 07/15/17 | $ | 600 | $ | 624 | ||
GlaxoSmithKline Capital | ||||||
5.650%, 05/15/18 | 1,870 | 2,031 | ||||
HCA | ||||||
9.625%, 11/15/16 | 1 | 1 | ||||
7.500%, 11/15/95 | 3,800 | 2,983 | ||||
6.250%, 02/15/13 | 119 | 118 | ||||
5.750%, 03/15/14 | 3,090 | 2,916 | ||||
Humana | ||||||
7.200%, 06/15/18 | 1,150 | 1,244 | ||||
Life Technologies | ||||||
6.000%, 03/01/20 | 1,340 | 1,372 | ||||
4.400%, 03/01/15 | 730 | 735 | ||||
Medtronic | ||||||
4.450%, 03/15/20 | 730 | 726 | ||||
Pfizer | ||||||
5.350%, 03/15/15 | 1,337 | 1,473 | ||||
Roche Holdings | ||||||
6.000%, 03/01/19 (C) | 1,410 | 1,558 | ||||
Tenet Healthcare | ||||||
8.875%, 07/01/19 (C) (D) | 1,695 | 1,835 | ||||
7.375%, 02/01/13 (D) | 336 | 339 | ||||
UnitedHealth Group | ||||||
6.875%, 02/15/38 | 1,201 | 1,275 | ||||
6.000%, 06/15/17 | 51 | 55 | ||||
WellPoint | ||||||
6.800%, 08/01/12 | 1,000 | 1,105 | ||||
5.875%, 06/15/17 | 2,190 | 2,351 | ||||
5.250%, 01/15/16 | 465 | 490 | ||||
Wyeth | ||||||
5.950%, 04/01/37 (D) | 2,680 | 2,806 | ||||
| 28,798 | ||||||
Industrials — 1.4% | ||||||
Boeing | ||||||
4.875%, 02/15/20 | 1,380 | 1,412 | ||||
Cedar Brakes I LLC | ||||||
8.500%, 02/15/14 (C) | 941 | 948 | ||||
Cedar Brakes II LLC | ||||||
9.875%, 09/01/13 (C) | 1,604 | 1,633 | ||||
Complete Production Services | ||||||
8.000%, 12/15/16 | 1,005 | 995 | ||||
Continental Airlines | ||||||
9.000%, 07/08/16 | 2,939 | 3,175 | ||||
Continental Airlines, Ser 1999-2 | ||||||
7.256%, 03/15/20 | 2,805 | 2,777 | ||||
Continental Airlines, Ser A | ||||||
5.983%, 04/19/22 (D) | 2,036 | 2,000 | ||||
Delta Air Lines | ||||||
6.821%, 08/10/22 | 1,601 | 1,601 | ||||
6.619%, 03/18/11 | 197 | 197 | ||||
Delta Air Lines, Ser 2001-1 | ||||||
7.111%, 09/18/11 (D) | 4,475 | 4,676 | ||||
| SEI Institutional Managed Trust / Semi-Annual Report / March 31, 2010 | 49 |
Table of Contents
SCHEDULE OF INVESTMENTS (Unaudited)
Core Fixed Income Fund (Continued)
March 31, 2010
| Description | Face Amount ($ Thousands) | Market Value ($ Thousands) | ||||
General Electric | ||||||
5.000%, 02/01/13 (D) | $ | 1,140 | $ | 1,229 | ||
Hutchison Whampoa International 09 | ||||||
4.625%, 09/11/15 (C) | 2,545 | 2,616 | ||||
JetBlue Airways 2004-2 G-1 Pass Through Trust | ||||||
0.625%, 08/15/16 (B) | 3,449 | 2,862 | ||||
Kansas City Southern de Mexico | ||||||
12.500%, 04/01/16 | 800 | 946 | ||||
L-3 Communications | ||||||
5.875%, 01/15/15 | 300 | 305 | ||||
L-3 Communications, Ser B | ||||||
6.375%, 10/15/15 (D) | 220 | 226 | ||||
RailAmerica | ||||||
9.250%, 07/01/17 | 1,134 | 1,209 | ||||
Reynolds Group Issuer | ||||||
7.750%, 10/15/16 (C) | 900 | 925 | ||||
Systems 2001 Asset Trust | ||||||
6.664%, 09/15/13 (C) | 991 | 1,047 | ||||
Tyco International | ||||||
6.875%, 01/15/21 | 286 | 327 | ||||
United Air Lines | ||||||
9.750%, 01/15/17 | 640 | 674 | ||||
United Parcel Service | ||||||
4.500%, 01/15/13 (D) | 2,190 | 2,341 | ||||
| 34,121 | ||||||
Information Technology — 0.2% | ||||||
Adobe Systems | ||||||
4.750%, 02/01/20 | 840 | 825 | ||||
3.250%, 02/01/15 | 680 | 683 | ||||
Cisco Systems | ||||||
5.500%, 01/15/40 | 1,070 | 1,026 | ||||
4.450%, 01/15/20 | 1,515 | 1,507 | ||||
Freescale Semiconductor | ||||||
10.125%, 12/15/16 | 60 | 53 | ||||
Hewlett-Packard | ||||||
4.750%, 06/02/14 | 127 | 137 | ||||
National Semiconductor | ||||||
6.600%, 06/15/17 | 220 | 239 | ||||
| 4,470 | ||||||
Materials — 0.9% | ||||||
Alcoa | ||||||
6.000%, 07/15/13 (D) | 1,300 | 1,387 | ||||
Ball | ||||||
6.750%, 09/15/20 | 790 | 804 | ||||
CodelCo | ||||||
4.750%, 10/15/14 (C) | 470 | 493 | ||||
Dow Chemical | ||||||
8.550%, 05/15/19 | 1,097 | 1,327 | ||||
5.900%, 02/15/15 | 625 | 677 | ||||
4.850%, 08/15/12 | 1,200 | 1,269 | ||||
| Description | Face Amount ($ Thousands) | Market Value ($ Thousands) | ||||
Freeport-McMoRan Copper & Gold | ||||||
8.375%, 04/01/17 | $ | 4,790 | $ | 5,329 | ||
PPG Industries | ||||||
6.650%, 03/15/18 | 435 | 484 | ||||
5.750%, 03/15/13 | 435 | 471 | ||||
Rio Tinto Finance USA | ||||||
9.000%, 05/01/19 | 843 | 1,082 | ||||
6.500%, 07/15/18 | 3,480 | 3,917 | ||||
5.875%, 07/15/13 | 953 | 1,048 | ||||
Steel Dynamics | ||||||
6.750%, 04/01/15 | 810 | 816 | ||||
Teck Resources | ||||||
10.750%, 05/15/19 | 180 | 221 | ||||
10.250%, 05/15/16 | 90 | 107 | ||||
Vale Overseas | ||||||
8.250%, 01/17/34 | 195 | 229 | ||||
6.875%, 11/21/36 | 1,300 | 1,345 | ||||
6.875%, 11/10/39 | 1,015 | 1,052 | ||||
Westlake Chemicals | ||||||
6.625%, 01/15/16 (D) | 391 | 381 | ||||
| 22,439 | ||||||
Sovereign — 0.7% | ||||||
Hellenic Republic Government Bond | ||||||
6.100%, 08/20/15 | 2,040 | 2,751 | ||||
Province of Ontario Canada | ||||||
4.100%, 06/16/14 | 1,881 | 2,010 | ||||
2.950%, 02/05/15 | 6,080 | 6,096 | ||||
Qatar Govt International Bond | ||||||
6.400%, 01/20/40 (C) | 635 | 663 | ||||
4.000%, 01/20/15 (C) | 420 | 428 | ||||
Republic of Korea | ||||||
7.125%, 04/16/19 | 788 | 923 | ||||
RSHB Capital | ||||||
6.299%, 05/15/17 (C) | 700 | 726 | ||||
Russian Foreign Bond - Eurobond | ||||||
7.500%, 03/31/30 | 160 | 184 | ||||
Societe Financement de l’Economie Francaise | ||||||
2.875%, 09/22/14 (C) | 1,120 | 1,127 | ||||
South Africa Government International Bond | ||||||
5.500%, 03/09/20 | 975 | 987 | ||||
Tennessee Valley Authority | ||||||
5.250%, 09/15/39 | 880 | 870 | ||||
United Mexican States, Ser A MTN | ||||||
7.500%, 04/08/33 | 176 | 210 | ||||
6.750%, 09/27/34 | 968 | 1,065 | ||||
| 18,040 | ||||||
| 50 | SEI Institutional Managed Trust / Semi-Annual Report / March 31, 2010 |
Table of Contents
| Description | Face Amount ($ Thousands) | Market Value ($ Thousands) | ||||
Telecommunication Services — 2.0% | ||||||
America Movil | ||||||
6.125%, 03/30/40 (C) | $ | 660 | $ | 645 | ||
5.625%, 11/15/17 | 440 | 465 | ||||
5.000%, 10/16/19 (C) | 989 | 979 | ||||
5.000%, 03/30/20 (C) | 1,055 | 1,040 | ||||
3.625%, 03/30/15 (C) | 820 | 823 | ||||
AT&T | ||||||
6.500%, 09/01/37 | 1,380 | 1,431 | ||||
6.450%, 06/15/34 | 625 | 637 | ||||
5.500%, 02/01/18 | 1,360 | 1,444 | ||||
5.100%, 09/15/14 (D) | 2,200 | 2,380 | ||||
AT&T Mobility LLC | ||||||
6.500%, 12/15/11 | 1,455 | 1,577 | ||||
BellSouth | ||||||
4.750%, 11/15/12 (D) | 170 | 181 | ||||
British Telecommunications | ||||||
9.625%, 12/15/30 | 367 | 462 | ||||
British Telecommunications PLC | ||||||
8.625%, 12/15/10 | 1,250 | 1,320 | ||||
Cellco Partnership | ||||||
8.500%, 11/15/18 | 630 | 786 | ||||
7.375%, 11/15/13 | 1,928 | 2,230 | ||||
3.750%, 05/20/11 | 1,300 | 1,340 | ||||
Cricket Communications | ||||||
7.750%, 05/15/16 (D) | 840 | 871 | ||||
Deutsche Telekom International Finance | ||||||
5.750%, 03/23/16 | 1,920 | 2,064 | ||||
France Telecom | ||||||
7.750%, 03/01/11 | 664 | 705 | ||||
Frontier Communications | ||||||
8.250%, 05/01/14 | 555 | 580 | ||||
8.125%, 10/01/18 | 465 | 465 | ||||
Intelsat | ||||||
9.250%, 08/15/14 | 280 | 287 | ||||
Intelsat Jackson Holdings | ||||||
9.500%, 06/15/16 | 180 | 192 | ||||
8.500%, 11/01/19 (C) | 250 | 262 | ||||
Koninklijke | ||||||
8.000%, 10/01/10 | 650 | 673 | ||||
New Cingular Wireless Services | ||||||
8.125%, 05/01/12 | 1,595 | 1,800 | ||||
Qwest | ||||||
7.500%, 10/01/14 | 911 | 995 | ||||
Rogers Communications | ||||||
7.875%, 05/01/12 | 550 | 613 | ||||
6.800%, 08/15/18 | 450 | 513 | ||||
6.750%, 03/15/15 | 1,015 | 1,155 | ||||
6.375%, 03/01/14 | 1,816 | 2,015 | ||||
5.500%, 03/15/14 | 246 | 265 | ||||
Sprint Capital | ||||||
8.750%, 03/15/32 | 660 | 612 | ||||
8.375%, 03/15/12 | 745 | 779 | ||||
6.900%, 05/01/19 | 100 | 91 | ||||
| Description | Face Amount ($ Thousands) | Market Value ($ Thousands) | ||||
Telecom Italia Capital | ||||||
6.999%, 06/04/18 (D) | $ | 2,080 | $ | 2,250 | ||
6.200%, 07/18/11 | 1,730 | 1,817 | ||||
5.250%, 11/15/13 | 790 | 827 | ||||
5.250%, 10/01/15 | 90 | 92 | ||||
4.950%, 09/30/14 | 1,250 | 1,282 | ||||
Telefonica Emisiones | ||||||
5.984%, 06/20/11 | 840 | 883 | ||||
Telefonica Europe | ||||||
7.750%, 09/15/10 | 1,925 | 1,983 | ||||
Verizon Communications | ||||||
6.100%, 04/15/18 | 465 | 509 | ||||
5.500%, 02/15/18 | 1,920 | 2,035 | ||||
Verizon New Jersey, Ser A | ||||||
7.850%, 11/15/29 | 1,135 | 1,235 | ||||
5.875%, 01/17/12 | 2,175 | 2,317 | ||||
Verizon New York, Ser A | ||||||
6.875%, 04/01/12 | 660 | 719 | ||||
Virgin Media Finance PLC | ||||||
9.125%, 08/15/16 | 70 | 74 | ||||
| 48,700 | ||||||
Utilities — 2.1% | ||||||
Aquila | ||||||
11.875%, 07/01/12 | 2,535 | 2,950 | ||||
Baltimore Gas & Electric | ||||||
6.125%, 07/01/13 | 360 | 399 | ||||
Calpine Construction Finance | ||||||
8.000%, 06/01/16 (C) | 975 | 997 | ||||
Dominion Resources | ||||||
8.875%, 01/15/19 | 2,255 | 2,845 | ||||
4.750%, 12/15/10 | 935 | 961 | ||||
DPL | ||||||
6.875%, 09/01/11 | 1,323 | 1,415 | ||||
Duke Energy | ||||||
6.300%, 02/01/14 | 983 | 1,095 | ||||
Duke Energy Carolinas | ||||||
6.250%, 01/15/12 | 2,000 | 2,170 | ||||
5.625%, 11/30/12 | 1,470 | 1,610 | ||||
Edison Mission Energy | ||||||
7.750%, 06/15/16 | 500 | 365 | ||||
7.625%, 05/15/27 | 420 | 269 | ||||
Enel Finance International | ||||||
6.000%, 10/07/39 (C) | 725 | 690 | ||||
Energy Future Holdings | ||||||
11.250%, 11/01/17 | 10,234 | 6,959 | ||||
10.875%, 11/01/17 | 40 | 30 | ||||
Exelon | ||||||
5.625%, 06/15/35 | 2,720 | 2,526 | ||||
Exelon Generation | ||||||
6.250%, 10/01/39 | 315 | 319 | ||||
5.200%, 10/01/19 | 305 | 308 | ||||
FirstEnergy Solutions | ||||||
6.800%, 08/15/39 | 315 | 308 | ||||
| SEI Institutional Managed Trust / Semi-Annual Report / March 31, 2010 | 51 |
Table of Contents
SCHEDULE OF INVESTMENTS (Unaudited)
Core Fixed Income Fund (Continued)
March 31, 2010
| Description | Face Amount ($ Thousands) | Market Value ($ Thousands) | ||||
6.050%, 08/15/21 | $ | 1,310 | $ | 1,312 | ||
4.800%, 02/15/15 | 365 | 374 | ||||
FirstEnergy, Ser B | ||||||
6.450%, 11/15/11 | 23 | 24 | ||||
FirstEnergy, Ser C | ||||||
7.375%, 11/15/31 | 2,995 | 3,099 | ||||
Florida Power | ||||||
6.400%, 06/15/38 | 240 | 261 | ||||
KCP&L Greater Missouri Operations | ||||||
8.270%, 11/15/21 | 2,700 | 2,809 | ||||
Nevada Power, Ser A | ||||||
8.250%, 06/01/11 | 1,935 | 2,076 | ||||
Nisource Finance | ||||||
6.800%, 01/15/19 | 2,261 | 2,458 | ||||
NRG Energy | ||||||
7.250%, 02/01/14 | 1,610 | 1,622 | ||||
Oncor Electric Delivery | ||||||
6.800%, 09/01/18 | 2,000 | 2,247 | ||||
Pacific Gas & Electric | ||||||
8.250%, 10/15/18 | 210 | 256 | ||||
6.050%, 03/01/34 | 890 | 917 | ||||
5.800%, 03/01/37 | 800 | 794 | ||||
Progress Energy | ||||||
6.850%, 04/15/12 | 601 | 656 | ||||
Public Service of New Mexico | ||||||
7.950%, 05/15/18 | 1,805 | 1,883 | ||||
PVNGS II Funding | ||||||
8.000%, 12/30/15 | 2,322 | 2,481 | ||||
Sempra Energy | ||||||
9.800%, 02/15/19 | 200 | 260 | ||||
South Carolina Electric & Gas | ||||||
6.500%, 11/01/18 | 215 | 244 | ||||
Texas-New Mexico Power | ||||||
9.500%, 04/01/19 (C) | 2,880 | 3,509 | ||||
| 53,498 | ||||||
Total Corporate Obligations | 774,290 | |||||
ASSET-BACKED SECURITIES — 6.9% | ||||||
Automotive — 0.2% | ||||||
Avis Budget Rental Car Funding AESOP | ||||||
4.640%, 05/20/16 (C) | 1,260 | 1,260 | ||||
Harley-Davidson Motorcycle Trust, Cl A4 | ||||||
3.320%, 02/15/17 | 705 | 728 | ||||
2.540%, 04/15/17 | 482 | 486 | ||||
2.400%, 07/15/14 | 342 | 344 | ||||
Harley-Davidson Motorcycle Trust, Ser 2009-1, Cl A4 | ||||||
5.000%, 01/15/17 | 197 | 209 | ||||
Hertz Vehicle Financing, Cl A2 | ||||||
5.290%, 03/25/16 (C) | 1,570 | 1,639 | ||||
| 4,666 | ||||||
| Description | Face Amount ($ Thousands) | Market Value ($ Thousands) | ||||
Credit Cards — 1.0% | ||||||
BA Credit Card Trust, Cl A2 | ||||||
0.250%, 06/17/13 (B) | $ | 733 | $ | 731 | ||
BA Credit Card Trust, Cl A6 | ||||||
0.260%, 11/15/13 (B) | 464 | 462 | ||||
Bank of America Credit Card Trust, Ser 2008-A1, Cl A1 | ||||||
0.810%, 04/15/13 (B) | 5,710 | 5,719 | ||||
Capital One Multi-Asset Execution Trust, Ser 2008-A5, Cl A5 | ||||||
4.850%, 02/18/14 | 760 | 791 | ||||
Citibank Credit Card Issuance Trust, Cl A3 | ||||||
5.300%, 03/15/18 | 1,549 | 1,702 | ||||
Discover Card Master Trust, Cl A1 | ||||||
1.530%, 12/15/14 (B) | 912 | 921 | ||||
Discover Card Master Trust, Cl A | ||||||
1.530%, 02/17/15 (B) | 5,840 | 5,944 | ||||
Discover Card Master Trust | ||||||
0.880%, 09/15/15 (B) | 1,129 | 1,131 | ||||
Discover Card Master Trust I, Cl A1 | ||||||
0.290%, 06/18/13 (B) | 304 | 303 | ||||
Discover Card Master Trust, Ser 2007-A2, Cl A2 | ||||||
0.597%, 06/15/15 (B) | 6,403 | 6,362 | ||||
Nordstrom Private Label Credit Card Master Note Trust, Cl A | ||||||
0.290%, 05/15/15 (B) (C) | 804 | 787 | ||||
| 24,853 | ||||||
Mortgage Related Securities — 1.2% | ||||||
ABS Home Equity Loan Trust, Ser 2007-HE3, Cl A1 | ||||||
0.770%, 11/25/31 (B) | 378 | 288 | ||||
AFC Home Equity Loan Trust, Ser 1998-1, Cl 1A2 | ||||||
0.499%, 04/25/28 (B) | 84 | 59 | ||||
AFC Home Equity Loan Trust, Ser 2000-1, Cl 2A | ||||||
0.486%, 03/25/30 (B) | 3,447 | 959 | ||||
Asset-Backed Securities Home Equity, Ser 2003-HE4, Cl M2 | ||||||
3.232%, 08/15/33 (B) | 157 | 55 | ||||
Bear Stearns Asset-Backed Securities Trust, Ser 2000-2, Cl M2 | ||||||
8.280%, 08/25/30 | 4,380 | 4,039 | ||||
Bear Stearns Asset-Backed Securities Trust, Ser 2007-HE2, Cl 1A1 | ||||||
0.346%, 03/25/37 (B) | 3,109 | 2,786 | ||||
BNC Mortgage Loan Trust, Ser 2007-1, Cl M1 | ||||||
0.469%, 03/25/37 (B) | 6,300 | 80 | ||||
| 52 | SEI Institutional Managed Trust / Semi-Annual Report / March 31, 2010 |
Table of Contents
| Description | Face Amount ($ Thousands) | Market Value ($ Thousands) | ||||
Centex Home Equity, Ser 2006-A, Cl AV4 | ||||||
0.479%, 06/25/36 (B) | $ | 4,917 | $ | 2,535 | ||
Citigroup Mortgage Loan Trust, Ser 2007-AHL1, Cl A2A | ||||||
0.286%, 12/25/36 (B) | 275 | 256 | ||||
Conseco Finance, Ser 2001-D, Cl A5 | ||||||
6.190%, 11/15/32 (B) | 1,195 | 1,203 | ||||
Contimortgage Home Equity Trust, Ser 1997-1, Cl A9 | ||||||
7.050%, 03/15/28 | 7 | 7 | ||||
Contimortgage Home Equity Trust, Ser 1997-2, Cl A9 | ||||||
7.090%, 04/15/28 | 11 | 10 | ||||
Countrywide Asset-Backed Certificates, Ser 2007-S2, Cl A2 | ||||||
5.649%, 05/25/37 (B) | 1,938 | 977 | ||||
EMC Mortgage Loan Trust, Ser 2002-AA, Cl A1 | ||||||
0.716%, 05/25/39 (B) (C) | 1,533 | 1,159 | ||||
Morgan Stanley Capital I, Ser 2007-HE2, Cl A2A | ||||||
0.286%, 01/25/37 (B) | 118 | 115 | ||||
Morgan Stanley Dean Witter Capital I, Ser 2003-NC4, Cl M2 | ||||||
3.246%, 04/25/33 (B) | 79 | 31 | ||||
Morgan Stanley Home Equity Loans, Ser 2007-1, Cl A1 | ||||||
0.296%, 12/25/36 (B) | 110 | 107 | ||||
Nationstar Home Equity Loan Trust, Ser 2007-C, Cl 2AV2 | ||||||
0.359%, 06/25/37 (B) | 5,500 | 3,934 | ||||
Option One Mortgage Loan Trust, Ser 2001-4, Cl A | ||||||
0.846%, 01/25/32 (B) | 349 | 284 | ||||
Option One Mortgage Loan Trust, Ser 2007-14, Cl 2A3 | ||||||
0.386%, 01/25/37 (B) | 9,500 | 3,646 | ||||
Option One Mortgage Loan Trust, Ser 2007-6, Cl 2A4 | ||||||
0.479%, 07/25/37 (B) | 4,574 | 1,872 | ||||
Residential Funding Mortgage Securities II, Ser 2000-HI1, Cl AI7 | ||||||
8.290%, 02/25/25 | 1,308 | 1,106 | ||||
Soundview Home Equity Loan Trust, Ser 2006-EQ2, Cl A3 | ||||||
0.389%, 01/25/37 (B) | 6,450 | 2,625 | ||||
Soundview Home Equity Loan Trust, Ser 2007-OPT1, Cl 2A1 | ||||||
0.326%, 06/25/37 (B) | 2,081 | 1,755 | ||||
Terwin Mortgage Trust, Ser 2005-9HG3, Cl A1 | ||||||
4.000%, 08/25/35 (B) (C) | 491 | 458 | ||||
| Description | Face Amount ($ Thousands) | Market Value ($ Thousands) | ||||
Truman Capital Mortgage Loan Trust, Ser 2006-1, Cl A | ||||||
0.489%, 03/25/36 (B) (C) | $ | 437 | $ | 271 | ||
Wells Fargo Home Equity Trust, Ser 2004-2, Cl M8B | ||||||
5.000%, 05/25/34 (B) (C) | 311 | 79 | ||||
| 30,696 | ||||||
Other Asset-Backed Securities — 4.5% | ||||||
Bank America Manufactured Housing Contract Trust, Ser 1997-1, Cl M | ||||||
6.800%, 01/10/28 | 3,310 | 3,695 | ||||
Carrington Mortgage Loan Trust, Ser 2007-RFC1, Cl A1 | ||||||
0.279%, 07/27/09 (B) | 2,623 | 2,339 | ||||
Chase Funding Mortgage Loan Asset-Backed Certificates, Ser 2002-1, Cl 2A2 | ||||||
0.746%, 03/25/32 (B) | 1,364 | 875 | ||||
Citicorp Residential Mortgage Securities, Ser 2007-1, Cl A5 | ||||||
6.046%, 03/25/37 | 1,970 | 1,743 | ||||
Conseco Finance Home Loan Trust, Ser 2000-E, Cl M1 | ||||||
8.130%, 08/15/31 (B) | 977 | 918 | ||||
Conseco Finance Securitizations, Ser 2000-4, Cl A6 | ||||||
8.310%, 05/01/32 (B) | 1,206 | 908 | ||||
Countrywide Asset-Backed Certificates, Cl 2A2 | ||||||
1.029%, 10/25/47 (B) | 5,313 | 3,744 | ||||
Countrywide Asset-Backed Certificates, Ser 2003-BC2, Cl 2A1 | ||||||
0.846%, 06/25/33 (B) | 38 | 32 | ||||
Countrywide Asset-Backed Certificates, Ser 2005-17, Cl 1AF3 | ||||||
5.711%, 05/25/36 (B) | 6,450 | 2,239 | ||||
Countrywide Asset-Backed Certificates, Ser 2005-4, Cl MV1 | ||||||
0.706%, 10/25/35 (B) | 5,150 | 4,983 | ||||
Countrywide Asset-Backed Certificates, Ser 2006-10, Cl MV1 | ||||||
0.489%, 09/25/46 (B) | 10,450 | 779 | ||||
Countrywide Home Equity Loan Trust, Cl 2A1B | ||||||
0.382%, 11/15/36 (B) | 276 | 200 | ||||
Countrywide Home Equity Loan Trust, Ser 2004-K, Cl A2 | ||||||
0.530%, 02/15/34 (B) | 1,069 | 492 | ||||
Countrywide Home Equity Loan Trust, Ser 2005-F, Cl 2A | ||||||
0.470%, 12/15/35 (B) | 1,920 | 662 | ||||
| SEI Institutional Managed Trust / Semi-Annual Report / March 31, 2010 | 53 |
Table of Contents
SCHEDULE OF INVESTMENTS (Unaudited)
Core Fixed Income Fund (Continued)
March 31, 2010
| Description | Face Amount ($ Thousands) | Market Value ($ Thousands) | ||||
Countrywide Home Equity Loan Trust, Ser 2007-GW, Cl A | ||||||
0.782%, 11/15/28 (B) | $ | 10,632 | $ | 7,831 | ||
Credit Suisse First Boston Mortgage Securities, Ser 2001-MH29, Cl A | ||||||
5.600%, 09/25/31 | 648 | 652 | ||||
Credit-Based Asset Servicing and Securitization, Ser 2007-CB4, Cl A1A | ||||||
0.336%, 04/25/37 (B) | 1,753 | 1,474 | ||||
Embarcadero Aircraft Securitization Trust, Ser 2000-A, Cl A1 | ||||||
0.711%, 08/15/25 (B) (C) | 3,449 | 1,604 | ||||
First Franklin Mortgage Loan Asset-Backed Certificates, Ser 2005-FF10, Cl A4 | ||||||
0.549%, 11/25/35 (B) | 5,965 | 4,786 | ||||
First Franklin Mortgage Loan Asset-Backed Certificates, Ser 2006-FFA, Cl A3 | ||||||
0.366%, 09/25/26 (B) | 4,333 | 658 | ||||
First Horizon ABS Trust, Ser 2004-HE2, Cl A | ||||||
0.466%, 02/25/34 (B) | 1,326 | 720 | ||||
Ford Credit Floorplan Master Owner Trust | ||||||
1.880%, 12/15/14 (B) (C) | 898 | 902 | ||||
Ford Credit Floorplan Master Owner Trust, Cl A1 | ||||||
4.200%, 02/15/17 (C) | 4,334 | 4,345 | ||||
GE Seaco Finance Srl, Cl A | �� | |||||
0.480%, 11/17/20 (B) (C) | 1,544 | 1,359 | ||||
Green Tree Financial, Ser 1993-4, Cl A5 | ||||||
7.050%, 01/15/19 | 229 | 230 | ||||
Green Tree Financial, Ser 1996-5, Cl A6 | ||||||
7.750%, 07/15/27 | 709 | 719 | ||||
GSAMP Trust, Cl A | ||||||
0.529%, 05/25/36 (B) (C) | 643 | 445 | ||||
GSAMP Trust, Ser 2003-SEA, Cl A1 | ||||||
0.646%, 02/25/33 (B) | 2,906 | 1,794 | ||||
HSI Asset Securitization Trust, Ser 2005-I1, Cl 2A3 | ||||||
0.536%, 11/25/35 (B) | 4,905 | 3,473 | ||||
Lehman XS Trust, Ser 2005-5N, Cl 1A1 | ||||||
0.546%, 11/25/35 (B) | 4,209 | 2,733 | ||||
Lehman XS Trust, Ser 2006-GP1, Cl A4A | ||||||
0.576%, 05/25/46 (B) | 5,569 | 918 | ||||
Lehman XS Trust, Ser 2007-1, Cl WF1 | ||||||
7.000%, 01/25/37 | 2,309 | 1,100 | ||||
| Description | Face Amount ($ Thousands) | Market Value ($ Thousands) | ||||
Lehman XS Trust, Ser 2007-9, Cl 1A1 | ||||||
0.349%, 05/25/37 (B) | $ | 7,552 | $ | 4,157 | ||
Master Specialized Loan Trust, Ser 2007-2, Cl A | ||||||
0.579%, 05/25/37 (B) (C) | 7,851 | 4,632 | ||||
Merrill Lynch Mortgage Investors, Ser 2005-SL3, Cl A1 | ||||||
0.459%, 07/25/36 (B) | 225 | 205 | ||||
Merrill Lynch Mortgage Investors, Ser 2006-WMC2, Cl A2D | ||||||
5.895%, 03/25/37 | 4,963 | 2,084 | ||||
Merrill Lynch Mortgage Investors, Ser 2007-MLN1, Cl M1 | ||||||
0.629%, 03/25/37 (B) | 3,010 | 22 | ||||
Merrill Lynch Mortgage Investors, Ser 2007-SL1, Cl A1 | ||||||
0.529%, 02/25/37 (B) | 6,088 | 197 | ||||
Mid-State Trust, Ser 11, Cl A1 | ||||||
4.864%, 07/15/38 | 3,370 | 3,047 | ||||
Morgan Stanley Dean Witter Capital Heloc Trust, Ser 2005-1, Cl A | ||||||
0.436%, 07/25/17 (B) | 541 | 258 | ||||
N, Cl A | ||||||
1.980%, 01/15/15 (B) (C) | 4,540 | 4,563 | ||||
Nelnet Student Loan Trust, Ser 2008-4, Cl A4 | ||||||
1.729%, 04/25/24 (B) | 2,740 | 2,880 | ||||
Residential Asset Mortgage Products, Ser 2003-RS11, Cl MII1 | ||||||
1.341%, 12/25/33 (B) | 188 | 134 | ||||
Residential Asset Mortgage Products, Ser 2003-RS2, Cl AII | ||||||
0.909%, 03/25/33 (B) | 58 | 37 | ||||
Saco I, Ser 2005-9, Cl A1 | ||||||
0.496%, 12/25/35 (B) | 796 | 177 | ||||
Saco I, Ser 2005-WM3, Cl A1 | ||||||
0.766%, 09/25/35 (B) | 833 | 236 | ||||
Saco I, Ser 2006-6, Cl A1 | ||||||
0.376%, 06/25/36 (B) | 2,335 | 429 | ||||
SLC Student Loan Trust, Cl A4A | ||||||
1.857%, 12/15/32 (B) | 4,761 | 5,007 | ||||
SLC Student Loan Trust, Ser 2006-2, Cl B | ||||||
0.484%, 12/15/39 (B) | 5,250 | 3,917 | ||||
SLM Student Loan Trust, Cl A4 | ||||||
1.949%, 07/25/23 (B) | 4,617 | 4,881 | ||||
0.477%, 12/15/17 (B) | 203 | 203 | ||||
0.457%, 12/17/18 (B) | 175 | 174 | ||||
SLM Student Loan Trust, Cl A4L | ||||||
0.407%, 09/17/18 (B) | 224 | 222 | ||||
SLM Student Loan Trust, | ||||||
0.479%, 01/25/41 (B) | 4,000 | 3,027 | ||||
| 54 | SEI Institutional Managed Trust / Semi-Annual Report / March 31, 2010 |
Table of Contents
| Description | Face Amount ($ Thousands) | Market Value ($ Thousands) | ||||
SLM Student Loan Trust, | ||||||
0.644%, 12/15/39 (B) | $ | 4,000 | $ | 372 | ||
SLM Student Loan Trust, Ser 2008-8, Cl A4 | ||||||
1.899%, 07/25/22 (B) | 724 | 760 | ||||
Small Business Administration, Ser 2003-P10A, Cl 1 | ||||||
4.524%, 02/01/13 | 769 | 800 | ||||
Structured Asset Investment Loan Trust, Ser 2003-BC4, Cl M2 | ||||||
3.229%, 06/25/33 (B) | 94 | 62 | ||||
Structured Asset Securities, Ser 2007-BC2, Cl A2 | ||||||
0.336%, 03/25/37 (B) | 3,311 | 3,124 | ||||
Structured Asset Securities, Ser 2007-BC4, Cl A3 | ||||||
0.479%, 11/25/37 (B) | 3,868 | 3,596 | ||||
Structured Asset Securities, Ser 2007-TC1, Cl A | ||||||
0.529%, 04/25/31 (B) (C) | 411 | 292 | ||||
Swift Master Auto Receivables Trust, Ser 2007-1, Cl A | ||||||
0.330%, 06/15/12 (B) | 733 | 732 | ||||
Triton Container Finance LLC, Ser 2006-1A, Cl N | ||||||
0.416%, 11/26/21 (B) (C) | 1,733 | 1,407 | ||||
| 110,986 | ||||||
Total Asset-Backed Securities | 171,201 | |||||
LOAN PARTICIPATIONS — 1.0% | ||||||
Allison Transmission | ||||||
3.010%, 08/07/14 | 159 | 152 | ||||
3.000%, 08/07/14 | 705 | 671 | ||||
2.980%, 08/07/14 | 79 | 75 | ||||
Aramark | ||||||
2.126%, 01/26/14 | 416 | 407 | ||||
0.088%, 01/26/14 | 29 | 28 | ||||
Charter, Term B Loan | ||||||
2.230%, 03/15/14 | 1,470 | 1,417 | ||||
Chrysler Financial, Term B Loan | ||||||
4.230%, 08/03/12 | 363 | 362 | ||||
CMP Susquehanna | ||||||
2.250%, 05/05/13 | 931 | 785 | ||||
DAE Aviation, Tranche B-1 | ||||||
4.000%, 07/31/14 | 287 | 270 | ||||
DAE Aviation, Tranche B-2 | ||||||
4.000%, 09/27/14 | 280 | 264 | ||||
Enterprise GP Holdings | ||||||
2.500%, 11/10/14 | 588 | 579 | ||||
2.480%, 11/10/14 | 392 | 386 | ||||
| Description | Face Amount ($ Thousands) | Market Value ($ Thousands) | ||||
First Data, Term Loan B-2 | ||||||
3.032%, 09/24/14 | $ | 3,559 | $ | 3,145 | ||
3.001%, 09/24/14 | 187 | 165 | ||||
Harrah’s Operating, Term Loan B-2 | ||||||
2.249%, 01/28/15 | 605 | 521 | ||||
HCR Healthcare, Initial Term Loan | ||||||
2.729%, 12/22/14 | 968 | 937 | ||||
IASIS, Delayed Draw | ||||||
2.229%, 03/15/14 | 236 | 226 | ||||
IASIS, Sythentic LOC | ||||||
2.100%, 03/15/14 | 64 | 61 | ||||
IASIS, Term B Loan | ||||||
2.229%, 03/15/14 | 681 | 654 | ||||
Iconix, Term B Loan | ||||||
2.480%, 04/30/13 | 628 | 618 | ||||
Insight Midwest | ||||||
2.250%, 04/07/14 | 675 | 654 | ||||
Las Vegas Sands, Delayed Draw | ||||||
2.010%, 05/17/14 | 362 | 330 | ||||
Las Vegas Sands, Term B Loan | ||||||
2.010%, 05/17/14 | 1,596 | 1,458 | ||||
Lodgenet Entertainment, Term B Loan | ||||||
2.260%, 04/04/14 | 797 | 749 | ||||
Petco, Term B Loan | ||||||
2.501%, 10/26/13 | 432 | 424 | ||||
2.479%, 10/26/13 | 546 | 535 | ||||
Regal Cinemas | ||||||
4.001%, 10/27/13 | 382 | 383 | ||||
Sunguard | ||||||
3.874%, 02/28/16 | 1,094 | 1,084 | ||||
3.864%, 02/28/16 | 86 | 85 | ||||
Supermedia | ||||||
11.000%, 12/31/15 | 389 | 366 | ||||
Telesat Canada, U.S. Term I Loan | ||||||
3.240%, 10/31/14 | 1,047 | 1,030 | ||||
Telesat Canada, U.S. Term II Loan | ||||||
3.240%, 10/31/14 | 90 | 89 | ||||
Texas Competitive, Term Loan B-2 | ||||||
3.790%, 10/10/14 | 20 | 16 | ||||
3.729%, 10/10/14 | 1,935 | 1,588 | ||||
Tribune | ||||||
0.000%, 06/04/10 (E) | 366 | 228 | ||||
United Air Lines, Tranche B | ||||||
2.250%, 02/01/14 | 696 | 602 | ||||
Univision Communications | ||||||
2.501%, 09/29/14 | 2,500 | 2,225 | ||||
UPC Financing Partnership | ||||||
3.930%, 12/30/16 | 352 | 346 | ||||
2.180%, 12/31/14 | 648 | 630 | ||||
Total Loan Participations | 24,545 | |||||
| SEI Institutional Managed Trust / Semi-Annual Report / March 31, 2010 | 55 |
Table of Contents
SCHEDULE OF INVESTMENTS (Unaudited)
Core Fixed Income Fund (Continued)
March 31, 2010
| Description | Face Amount ($ Thousands)/Shares | Market Value ($ Thousands) | ||||
U.S. GOVERNMENT AGENCY OBLIGATIONS — 0.8% | ||||||
FHLB | ||||||
1.500%, 01/16/13 | $ | 1,050 | $ | 1,048 | ||
FICO STRIPS, PO | ||||||
0.000%, 02/08/18 to 09/26/19 (A) | 11,780 | 8,121 | ||||
FNMA | ||||||
7.125%, 01/15/30 | 2,100 | 2,639 | ||||
6.250%, 05/15/29 | 2,110 | 2,384 | ||||
5.250%, 08/01/12 | 1,860 | 2,003 | ||||
0.180%, 08/23/10 (A) | 1,800 | 1,799 | ||||
0.000%, 10/09/19 (A) | 1,520 | 889 | ||||
Total U.S. Government Agency Obligations | 18,883 | |||||
MUNICIPAL BONDS — 0.4% | ||||||
County of Clark Nevada, Ser C-BUILD, RB | ||||||
6.820%, 07/01/45 | 790 | 811 | ||||
Los Angeles Unified School District, GO | ||||||
6.758%, 07/01/34 | 790 | 817 | ||||
Municipal Electric Authority of Georgia, RB | ||||||
6.655%, 04/01/57 | 320 | 318 | ||||
6.637%, 04/01/57 | 570 | 565 | ||||
North Texas Tollway Authority, RB | ||||||
6.718%, 01/01/49 | 420 | 441 | ||||
State of California, GO | ||||||
7.625%, 03/01/40 | 515 | 536 | ||||
7.550%, 04/01/39 | 1,605 | 1,659 | ||||
7.300%, 10/01/39 | 5,645 | 5,665 | ||||
Total Municipal Bonds | 10,812 | |||||
PREFERRED STOCK — 0.1% | ||||||
Citigroup Capital XII | ||||||
8.500% 03/30/40* (B) | 53,075 | 1,362 | ||||
GMAC (C) | 379 | 289 | ||||
Total Preferred Stock (Cost $1,327) ($ Thousands) | 1,651 | |||||
Number of | ||||||
WARRANT — 0.0% | ||||||
Semgroup Warrants, Expires 11/30/14 * | 1 | 10 | ||||
Total Warrant | 10 | |||||
| Description | Shares/Contracts/ Face Amount ($ Thousands) | Market Value ($ Thousands) | ||||
COMMON STOCK — 0.0% | ||||||
SemGroup, Cl A* | 1,294 | $ | 37 | |||
SuperMedia* | 1,802 | 74 | ||||
Total Common Stock | 111 | |||||
PURCHASED OPTIONS — 0.0% | ||||||
June 2010 U.S. 10 Year Treasury Note Call, Expires 05/24/10 | 24 | 4 | ||||
May 2010 U.S. 10 Year Treasury Note Call, Expires 04/26/10 Strike Price $120.00* | 130 | 10 | ||||
June 2010 U.S. 10 Year Treasury Note Call, Expires 05/24/10 | 288 | 50 | ||||
Total Purchased Options (Cost $177) ($ Thousands) | 64 | |||||
CASH EQUIVALENT — 1.2% | ||||||
Evergreen Institutional Money Market Fund, | 11,784,637 | 11,784 | ||||
SEI Daily Income Trust, Prime Obligation Fund, Cl A, 0.070%**† | 18,311,817 | 18,312 | ||||
Total Cash Equivalent (Cost $30,096) ($ Thousands) | 30,096 | |||||
COMMERCIAL PAPER — 0.5% | ||||||
Lloyds TSB Bank | ||||||
0.210%, 04/26/10 | $ | 12,340 | 12,338 | |||
Total Commercial Paper | 12,338 | |||||
U.S. TREASURY OBLIGATIONS — 14.8% | ||||||
U.S. Treasury Bills | ||||||
0.132%, 04/15/10 (A) | 12,620 | 12,619 | ||||
0.081%, 05/13/10 (A) | 1,475 | 1,475 | ||||
U.S. Treasury Bond | ||||||
8.875%, 02/15/19 | 1,595 | 2,226 | ||||
8.000%, 11/15/21 (D) | 9,935 | 13,536 | ||||
7.125%, 02/15/23 (D) | 624 | 804 | ||||
5.375%, 02/15/31 (D) | 10,496 | 11,611 | ||||
4.625%, 02/15/40 (D) | 7,250 | 7,146 | ||||
4.610%, 02/15/25 (A) | 11,400 | 5,676 | ||||
4.500%, 02/15/36 to 08/15/39 (D) | 14,305 | 13,834 | ||||
4.375%, 11/15/39 (D) | 12,452 | 11,775 | ||||
4.250%, 05/15/39 (D) | 8,052 | 7,461 | ||||
3.500%, 02/15/39 (D) | 25,833 | 20,905 | ||||
| 56 | SEI Institutional Managed Trust / Semi-Annual Report / March 31, 2010 |
Table of Contents
| Description | Face Amount ($ Thousands)/ Shares/Contracts | Market Value ($ Thousands) | ||||||
U.S. Treasury Bond TIPS | ||||||||
3.875%, 04/15/29 (D) | $ | 6,980 | $ | 11,677 | ||||
3.625%, 04/15/28 (D) | 5,570 | 9,098 | ||||||
2.375%, 01/15/25 to 01/15/27 (D) | 15,863 | 18,413 | ||||||
2.125%, 02/15/40 | 1,090 | 1,083 | ||||||
2.000%, 01/15/16 to 01/15/26 (D) | 5,341 | 6,156 | ||||||
1.750%, 01/15/28 (D) | 12,937 | 12,667 | ||||||
U.S. Treasury Note | ||||||||
3.625%, 08/15/19 to 02/15/20 (D) | 32,020 | 31,490 | ||||||
3.375%, 11/15/19 (D) | 31,125 | 30,033 | ||||||
3.125%, 01/31/17 (D) | 8,390 | 8,330 | ||||||
2.750%, 11/30/16 to 02/15/19 (D) | 16,577 | 15,409 | ||||||
2.500%, 03/31/15 | 19,898 | 19,842 | ||||||
2.375%, 02/28/15 (D) | 69,350 | 68,874 | ||||||
1.375%, 03/15/13 (D) | 8,562 | 8,512 | ||||||
1.000%, 03/31/12 | 9,623 | 9,618 | ||||||
U.S. Treasury STRIPS | ||||||||
4.712%, 11/15/27 (A) | 16,990 | 7,301 | ||||||
Total U.S. Treasury Obligations | 367,571 | |||||||
AFFILIATED PARTNERSHIP — 8.5% |
| |||||||
SEI Liquidity Fund, L.P., 0.210%(F)**† | 213,329,537 | 209,068 | ||||||
Total Affiliated Partnership (Cost $213,330) ($ Thousands) | 209,068 | |||||||
Total Investments — 111.6% | $ | 2,763,155 | ||||||
WRITTEN OPTIONS — 0.0% |
| |||||||
June 2010 Euro$ Future Call, Expires 06/15/10, Strike Price $99.38 | (33 | ) | (22 | ) | ||||
May 2010 U.S.$ Future Call, Expires 04/26/10, Strike Price $118.50 | (193 | ) | (15 | ) | ||||
September 2010 Euro$ Future Call, Expires 09/14/10, Strike Price $99.25 | (39 | ) | (27 | ) | ||||
Total Written Options |
| (64 | ) | |||||
| Description | Notional Amount (Thousands) | Market Value ($ Thousands) | |||||
WRITTEN SWAPTIONS — (0.1)% |
| ||||||
U.S. Swaption Call, Deutsche Bank* | (18,270 | ) | $ | (730 | ) | ||
U.S. Swaption Put, Deutsche Bank* | (18,270 | ) | (589 | ) | |||
Total Written Swaptions (Premiums Received $(1,595)) ($ Thousands) |
| (1,319 | ) | ||||
A summary of the open futures contracts held by the Fund at March 31, 2010, is as follows:
| Type of Contract | Number of Contracts Long (Short) | Expiration Date | Unrealized Appreciation (Depreciation) ($ Thousands) | ||||||
90-Day Euro$ | (17 | ) | Dec-2010 | $ | (164 | ) | |||
90-Day Euro$ | (17 | ) | Jun-2011 | (137 | ) | ||||
90-Day Euro$ | (17 | ) | Mar-2011 | (151 | ) | ||||
90-Day Euro$ | (17 | ) | Sep-2010 | (36 | ) | ||||
Euro-Bund | (72 | ) | Jun-2010 | (66 | ) | ||||
U.S. 10-Year Treasury Note | 468 | Jun-2010 | 94 | ||||||
U.S. 2-Year Treasury Note | 47 | Jul-2010 | (3 | ) | |||||
U.S. 5-Year Treasury Note | 1,427 | Jul-2010 | (274 | ) | |||||
U.S. Long Treasury Bond | 134 | Jun-2010 | 35 | ||||||
U.S. Ultra Long Treasury Bond | 53 | Jul-2010 | 1 | ||||||
| $ | (701 | ) | |||||||
For the period ended March 31, 2010, the total amount of all open futures contracts, as presented in the table above, are representative of the volume of activity for this derivative type during the period.
A summary of the outstanding forward foreign currency contracts held by the Fund at March 31, 2010, is as follows:
| Settlement Date | Currency to Deliver (Thousands) | Currency to Receive (Thousands) | Unrealized Appreciation ($ Thousands) | ||||||||
5/18/10 | EUR | 8,677 | USD | 11,855 | $ | 116 | |||||
| SEI Institutional Managed Trust / Semi-Annual Report / March 31, 2010 | 57 |
Table of Contents
SCHEDULE OF INVESTMENTS (Unaudited)
Core Fixed Income Fund (Continued)
March 31, 2010
A summary of outstanding swap agreements held by the Fund at March 31, 2010, is as follows (see Note 2 in Notes to Financial Statements):
| Credit Default Swaps | |||||||||||||||||
| Counterparty | Reference Entity/Obligation | Buy/Sell Protection | (Pays)/ Receives Rate | Termination Date | Notional Amount (Thousands) | Net Unrealized Appreciation (Depreciation) ($ Thousands) | |||||||||||
| Bank of America | CMBX-NA-AJ 1 Index | BUY | (0.84 | )% | 10/12/52 | $ | 245 | $ | (91 | ) | |||||||
| Bank of America | CMBX-NA-AJ 1 Index | BUY | (0.84 | ) | 10/12/52 | 2,750 | (1,048 | ) | |||||||||
| Bank of America | CMBX-NA-AJ 1 Index | BUY | (0.84 | ) | 10/12/52 | 2,900 | (1,105 | ) | |||||||||
| Barclays Bank PLC | ABX.HE.PENAAA 07-2 Index | SELL | 0.76 | 01/25/38 | (2,500 | ) | 120 | ||||||||||
| Barclays Bank PLC | ABX.HE.PENAAA 07-2 Index | SELL | 0.76 | 01/25/38 | (2,000 | ) | 115 | ||||||||||
| Barclays Bank PLC | CMBX-NA-AJ 1 Index | BUY | (0.84 | ) | 10/12/52 | 2,590 | (1,000 | ) | |||||||||
| Citigroup | ABX.HE.AAA 06-2 Index | SELL | 0.11 | 05/25/46 | (1,339 | ) | (176 | ) | |||||||||
| Citigroup | ABX.HE.AAA 07-1 Index | SELL | 0.09 | 08/25/37 | (5,795 | ) | (2,692 | ) | |||||||||
| Citigroup | ABX.HE.PENAAA 07-2 Index | SELL | 0.76 | 01/25/38 | (2,900 | ) | 253 | ||||||||||
| Citigroup | ABX.HE.PENAAA 07-2 Index | SELL | 0.76 | 01/25/38 | (8,250 | ) | 880 | ||||||||||
| Citigroup | Arrow Electric, 6.875% 06/01/18 | BUY | (0.82 | ) | 03/20/14 | 965 | 10 | ||||||||||
| Citigroup | Darden Restaurants Inc., 6.000% 08/15/35 | BUY | (2.73 | ) | 03/20/14 | 440 | (33 | ) | |||||||||
| Citigroup | Darden Restaurants Inc., 7.125% 02/01/16 | BUY | (2.40 | ) | 03/20/15 | 800 | (56 | ) | |||||||||
| Citigroup | DR Horton Inc., 5.375% 6/15/12 | BUY | (1.00 | ) | 09/20/16 | 520 | 8 | ||||||||||
| Citigroup | DR Horton Inc., 5.375% 6/15/12 | BUY | (1.00 | ) | 09/20/16 | 480 | 7 | ||||||||||
| Citigroup | Hewlett Packard, 5.400% 03/01/17 | BUY | (0.72 | ) | 03/20/14 | 965 | (14 | ) | |||||||||
| Citigroup | Home Depot, 5.875% 12/16/36 | BUY | (2.67 | ) | 03/20/14 | 2,900 | (239 | ) | |||||||||
| Citigroup | KB Home 5.750% 2/1/14 | BUY | (1.00 | ) | 09/20/16 | 520 | 26 | ||||||||||
| Citigroup | KB Home 5.750% 2/1/14 | BUY | (1.00 | ) | 09/20/16 | 480 | 24 | ||||||||||
| Citigroup | Lowes Cos. Inc., 8.250% 06/01/10 | BUY | (1.20 | ) | 03/20/14 | 3,025 | (78 | ) | |||||||||
| Citigroup | Nordstrom Inc., 6.950%, 03/15/28 | BUY | (3.15 | ) | 03/20/14 | 240 | (22 | ) | |||||||||
| Credit Suisse | ABX.HE.AA 06-2 Index | SELL | 0.17 | 05/25/46 | (2,370 | ) | (196 | ) | |||||||||
| Credit Suisse | ABX.HE.AA 06-2 Index | SELL | 0.17 | 05/25/46 | (3,253 | ) | (293 | ) | |||||||||
| Credit Suisse | ABX.HE.AAA 07-1 Index | SELL | 0.09 | 08/25/37 | (2,000 | ) | (186 | ) | |||||||||
| Credit Suisse | CMBX-NA-AJ 1 Index | BUY | (0.84 | ) | 10/12/49 | 7,735 | (2,899 | ) | |||||||||
| Credit Suisse | General Electric Corp., 5.625% 09/15/17 | SELL | 6.55 | 12/20/10 | (1,480 | ) | 64 | ||||||||||
| Credit Suisse | Pulte Homes, Inc., 5.250% 1/15/14 | BUY | (1.00 | ) | 09/20/16 | 1,500 | 30 | ||||||||||
| Credit Suisse | Toll Brothers Inc., 5.150% 05/15/15 | BUY | (1.00 | ) | 09/20/16 | 1,210 | 39 | ||||||||||
| Credit Suisse | Toll Brothers Inc., 5.150% 05/15/15 | BUY | (1.00 | ) | 09/20/16 | 4,885 | 157 | ||||||||||
| Deutsche Bank | Centex Corporation, 5.250% 06/15/15 | BUY | (4.40 | ) | 12/20/13 | 125 | (16 | ) | |||||||||
| Deutsche Bank | Darden Restaurants Inc., 6.000% 08/15/35 | BUY | (2.25 | ) | 03/20/14 | 1,075 | (62 | ) | |||||||||
| Deutsche Bank | Darden Restaurants Inc., 7.125% 02/01/16 | BUY | (2.25 | ) | 03/20/13 | 400 | (19 | ) | |||||||||
| Deutsche Bank | DR Horton Inc., 5.375% 6/15/12 | BUY | (1.00 | ) | 09/20/16 | 410 | — | ||||||||||
| Deutsche Bank | DR Horton Inc., 5.375% 6/15/12 | BUY | (1.00 | ) | 09/20/16 | 375 | — | ||||||||||
| Deutsche Bank | Kohl’S Corporation, 6.250% 12/15/17 | BUY | (1.00 | ) | 12/20/14 | 655 | (8 | ) | |||||||||
| Deutsche Bank | Kohl’S Corporation, 6.250% 12/15/17 | BUY | (1.00 | ) | 12/20/14 | 655 | (8 | ) | |||||||||
| Deutsche Bank | Kohl’S Corporation, 6.250% 12/15/17 | BUY | (1.00 | ) | 12/20/14 | 600 | (8 | ) | |||||||||
| Deutsche Bank | Kohl’S Corporation, 6.250% 12/15/17 | BUY | (1.00 | ) | 12/20/14 | 600 | (7 | ) | |||||||||
| Deutsche Bank | Nordstrom Inc., 6.950%, 03/15/28 | BUY | (2.10 | ) | 03/20/14 | 1,325 | (70 | ) | |||||||||
| Deutsche Bank | Pulte Homes, Inc., 5.250% 1/15/14 | BUY | (1.00 | ) | 09/20/16 | 2,200 | 47 | ||||||||||
| Deutsche Bank | Pulte Homes, Inc., 5.250% 1/15/14 | BUY | (1.00 | ) | 09/20/16 | 1,500 | 56 | ||||||||||
| Deutsche Bank | Target Corporation, 4.000% 6/15/13 | BUY | (1.00 | ) | 12/20/14 | 655 | (7 | ) | |||||||||
| Deutsche Bank | Target Corporation, 4.000% 6/15/13 | BUY | (1.00 | ) | 12/20/14 | 655 | (7 | ) | |||||||||
| Deutsche Bank | Target Corporation, 4.000% 6/15/13 | BUY | (1.00 | ) | 12/20/14 | 600 | (7 | ) | |||||||||
| Deutsche Bank | Target Corporation, 4.000% 6/15/13 | BUY | (1.00 | ) | 12/20/14 | 600 | (7 | ) | |||||||||
| Goldman Sachs | ABX.HE.AA 06-2 Index | SELL | 0.17 | 05/25/46 | (2,324 | ) | (198 | ) | |||||||||
| Goldman Sachs | DR Horton, Inc., 5.375% 6/15/12 | BUY | (1.00 | ) | 09/20/16 | 405 | — | ||||||||||
| Goldman Sachs | DR Horton, Inc., 5.375% 6/15/12 | BUY | (1.00 | ) | 09/20/16 | 370 | — | ||||||||||
| Goldman Sachs | Pulte Homes, Inc., 5.250% 1/15/14 | BUY | (1.00 | ) | 09/20/16 | 1,150 | 28 | ||||||||||
| Greenwich Capital Markets | ABX.HE.AA 06-2 Index | SELL | 0.17 | 05/25/46 | (1,859 | ) | (154 | ) | |||||||||
| JPMorgan Chase Bank | CDX.IG HVOL.12 Index | SELL | 5.00 | 06/20/14 | (3,287 | ) | 394 | ||||||||||
| Merrill Lynch | Centex Corporation, 5.250% 06/15/15 | BUY | (3.56 | ) | 12/20/12 | 1,350 | (103 | ) | |||||||||
| Merrill Lynch | Centex Corporation, 5.250% 06/15/15 | BUY | (3.65 | ) | 12/20/12 | 925 | (73 | ) | |||||||||
| Morgan Stanley | ABX.HE.AAA 07-1 Index | SELL | 0.09 | 08/25/37 | (1,700 | ) | (255 | ) | |||||||||
| Morgan Stanley | ABX.HE.AAA 07-1 Index | SELL | 0.09 | 08/25/37 | (3,800 | ) | (540 | ) | |||||||||
| Morgan Stanley | Darden Restaurants Inc., 7.125% 02/01/16 | BUY | (2.25 | ) | 03/20/13 | 400 | (19 | ) | |||||||||
| Morgan Stanley | Midamerican Energy Corp., 4.625% 10/15/13 | SELL | 4.00 | 03/20/11 | (2,800 | ) | 103 | ||||||||||
| $ | (9,335 | ) | |||||||||||||||
| 58 | SEI Institutional Managed Trust / Semi-Annual Report / March 31, 2010 |
Table of Contents
| Interest Rate Swaps | ||||||||||||
| Counterparty | Fund Pays | Fund Receives | Termination Date | Notional Amount (Thousands) | Net Unrealized Appreciation (Depreciation) ($Thousands) | |||||||
| Goldman Sachs | 4.21% | 10-YR CMS | 05/25/10 | 7,500,000 | $ | 113 | ||||||
| JPMorgan Chase Bank | 2.91% | 3-Month LIBOR | 02/28/14 | 44,100,000 | (1,176 | ) | ||||||
| Morgan Stanley | 0.00% | 3-Month LIBOR (PAYMENT AT MATURITY) | 11/15/27 | 16,210,000 | 48 | |||||||
| Morgan Stanley | 0.00% | 3-Month LIBOR (PAYMENT AT MATURITY) | 02/15/25 | 10,530,000 | (6 | ) | ||||||
| $ | (1,021 | ) | ||||||||||
Percentages are based on a Net Assets of $2,477,052 ($ Thousands).
| * | Non-income producing security. |
| ** | The rate shown is the 7-day effective yield as of March 31, 2010. |
| † | Investment in Affiliated Security (see Note 5). |
| ‡ | Real Estate Investment Trust. |
| (A) | Zero coupon security. The rate reported on the Schedule of Investments is the effective yield at time of purchase. |
| (B) | Variable Rate Security — The rate reported on the Schedule of Investments is the rate in effects as of March 31, 2010. The date reported on the Schedule of Investments is the next reset date. |
| (C) | Securities sold within terms of a private placement memorandum, exempt from registration under Section 144A of the Securities Act of 1933, as amended, and may be sold only to dealers in that program or other “accredited investors.” These securities have been determined to be liquid under guidelines established by the board of Trustees. |
| (D) | This security or a partial position of this security is on loan at March 31, 2010 (see Note 9). The total value of securities on loan at March 31, 2010 was $205,987 ($ Thousands). |
| (E) | Security in default on interest payments. |
| (F) | This security was purchased with cash collateral held from securities on loan (see Note 9). The total market value of such securities as of March 31, 2010 was $209,068 ($ Thousands). |
ABS — Asset-Based Security
ARM — Adjustable Rate Mortgage
Cl — Class
CMO — Collateralized Mortgage Obligation
EUR — Euro
FHLB — Federal Home Loan Bank
FHLMC — Federal Home Loan Mortgage Corporation
FICO — Financing Corporation
FNMA — Federal National Mortgage Association
GNMA — Government National Mortgage Association
GO — General Obligation
IO — Interest Only face amount represents notional amount
LLC — Limited Liability Company
L.P. — Limited Partnership
MTN — Medium Term Note
PLC — Public Limited Company
PO — Principal Only
RB — Revenue Bond
Ser — Series
STRIPS — Separately Traded Registered Interest and Principal Securities
TBA — To Be Announced
TIPS — Treasury Inflation Protected Security
USD — United States Dollar
Amounts designated as “—” are $0 or have been rounded to $0
| SEI Institutional Managed Trust / Semi-Annual Report / March 31, 2010 | 59 |
Table of Contents
SCHEDULE OF INVESTMENTS (Unaudited)
Core Fixed Income Fund (Concluded)
March 31, 2010
The following is a summary of the inputs used as of March 31, 2010 in valuing the Fund’s investments carried at value ($ Thousands):
| Investments in Securities | Level 1 | Level 2 | Level 3 | Total | ||||||||
Mortgage-Backed Securities | $ | — | $ | 1,135,024 | $ | 7,491 | $ | 1,142,515 | ||||
Corporate Obligations | — | 771,115 | 3,175 | 774,290 | ||||||||
U.S. Treasury Obligations | — | 367,571 | — | 367,571 | ||||||||
Asset-Backed Securities | — | 171,201 | — | 171,201 | ||||||||
U.S. Government Agency Obligations | — | 18,883 | — | 18,883 | ||||||||
Municipal Bonds | — | 10,812 | — | 10,812 | ||||||||
Preferred Stock | 1,362 | 289 | — | 1,651 | ||||||||
Warrant | — | 10 | — | 10 | ||||||||
Common Stock | 111 | — | — | 111 | ||||||||
Purchased Options | 64 | — | — | 64 | ||||||||
Cash Equivalents | 30,096 | — | — | 30,096 | ||||||||
Loan Participations | — | 24,545 | — | 24,545 | ||||||||
Commercial Paper | — | 12,338 | — | 12,338 | ||||||||
Affiliated Partnership | — | 209,068 | — | 209,068 | ||||||||
Total Investments in Securities | $ | 31,633 | $ | 2,720,856 | $ | 10,666 | $ | 2,763,155 | ||||
| Other Financial Instruments | Level 1 | Level 2 | Level 3 | Total | ||||||||||||
Written Options | $ | (64 | ) | $ | — | $ | — | $ | (64 | ) | ||||||
Written Swaptions | — | — | (1,319 | ) | (1,319 | ) | ||||||||||
Futures Contracts* | (701 | ) | — | — | (701 | ) | ||||||||||
Forwards* | — | 116 | — | 116 | ||||||||||||
Credit Default Swaps* | — | (9,335 | ) | — | (9,335 | ) | ||||||||||
Interest Rate Swaps* | — | (1,021 | ) | — | (1,021 | ) | ||||||||||
Total Other Financial Instruments | $ | (765 | ) | $ | (10,240 | ) | $ | (1,319 | ) | $ | (12,324 | ) | ||||
| * | Futures contracts, forwards and swaps are valued at the unrealized appreciation (depreciation) on the instrument. |
The following is a reconciliation of the investments in which significant unobservable inputs (Level 3) were used in determining value ($ Thousands):
| Corporate Obligations | Mortgage-Backed Securities | Written Swaptions | |||||||||
Beginning balance as of October 1, 2009 | $ | 3,150 | $ | 4,779 | $ | (2,359 | ) | ||||
Accrued discounts/premiums | — | 43 | — | ||||||||
Realized gain/(loss) | — | 143 | 296 | ||||||||
Change in unrealized appreciation/(depreciation) | 85 | 800 | 164 | ||||||||
Net purchases/sales | (60 | ) | 1,726 | 580 | |||||||
Net transfer in and/or out of Level 3 | — | — | — | ||||||||
Ending balance as of March 31, 2010 | $ | 3,175 | $ | 7,491 | $ | (1,319 | ) | ||||
Changes in unrealized gains (losses) included in earnings related to securities held at reporting date | $ | 85 | $ | 480 | $ | 279 | |||||
For more information on valuation inputs, see Note 2 — Significant Accounting Policies in Notes to Financial Statements.
The accompanying notes are an integral part of the financial statements.
| 60 | SEI Institutional Managed Trust / Semi-Annual Report / March 31, 2010 |
Table of Contents
SCHEDULE OF INVESTMENTS (Unaudited)
U.S. Fixed Income Fund
March 31, 2010
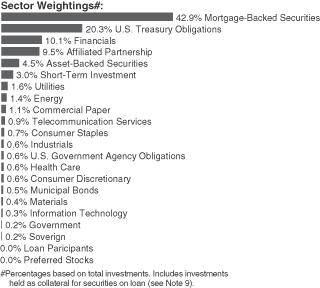
| Description | Face Amount ($ Thousands) | Market Value ($ Thousands) | ||||
MORTGAGE-BACKED SECURITIES — 49.0% | ||||||
Agency Mortgage-Backed Obligations — 37.2% | ||||||
FHLB | ||||||
0.750%, 10/05/10 | $ | 4,040 | $ | 4,048 | ||
FHLB CMO, Cl 1 | ||||||
5.300%, 06/15/12 | 280 | 296 | ||||
FHLMC | ||||||
11.000%, 02/17/21 | 650 | 716 | ||||
10.000%, 03/17/26 to 10/01/30 | 1,794 | 2,081 | ||||
7.500%, 01/01/32 to 09/01/38 | 2,348 | 2,630 | ||||
6.500%, 10/01/31 to 09/01/38 | 4,007 | 4,381 | ||||
6.000%, 08/01/15 to 09/01/38 | 6,655 | 7,171 | ||||
5.500%, 01/01/18 to 03/01/38 | 8,671 | 9,226 | ||||
5.000%, 03/01/34 to 02/01/39 | 10,770 | 11,158 | ||||
4.500%, 04/01/35 to 04/01/39 | 4,029 | 4,046 | ||||
4.000%, 10/01/33 | 731 | 711 | ||||
1.250%, 01/26/12 | 2,940 | 2,937 | ||||
0.374%, 02/03/12 (B) | 6,485 | 6,491 | ||||
0.000%, 05/04/10 to 05/10/10 (C) | 9,060 | 9,060 | ||||
FHLMC ARM (B) | ||||||
6.466%, 02/01/37 | 634 | 675 | ||||
6.367%, 10/01/36 | 2,020 | 2,132 | ||||
6.365%, 10/01/37 | 816 | 872 | ||||
6.349%, 12/01/36 | 816 | 866 | ||||
6.302%, 10/01/36 | 740 | 782 | ||||
6.218%, 08/01/37 | 134 | 142 | ||||
6.170%, 12/01/36 | 986 | 1,045 | ||||
6.141%, 06/01/37 | 85 | 91 | ||||
6.084%, 04/01/37 | 391 | 419 | ||||
6.059%, 11/01/36 | 154 | 164 | ||||
6.054%, 10/01/37 | 259 | 274 | ||||
6.012%, 04/01/37 | 218 | 232 | ||||
| Description | Face Amount ($ Thousands) | Market Value ($ Thousands) | ||||
5.992%, 04/01/37 | $ | 407 | $ | 431 | ||
5.972%, 05/01/37 | 624 | 663 | ||||
5.952%, 01/01/37 | 1,123 | 1,184 | ||||
5.933%, 03/01/37 | 745 | 790 | ||||
5.924%, 11/01/36 | 1,179 | 1,250 | ||||
5.915%, 03/01/37 | 51 | 54 | ||||
5.832%, 04/01/37 | 245 | 260 | ||||
5.823%, 05/01/37 | 991 | 1,048 | ||||
5.818%, 06/01/37 | 635 | 675 | ||||
5.803%, 11/01/36 to 05/01/37 | 1,091 | 1,158 | ||||
5.717%, 03/01/36 | 165 | 176 | ||||
5.688%, 03/01/36 | 171 | 182 | ||||
5.650%, 10/01/38 | 174 | 185 | ||||
5.627%, 03/01/36 | 1,229 | 1,287 | ||||
5.423%, 05/01/38 | 524 | 553 | ||||
FHLMC CMO, Cl BS | ||||||
16.733%, 02/15/40 (B) | 100 | 102 | ||||
FHLMC CMO, Cl SC | ||||||
8.702%, 11/15/33 (B) | 81 | 68 | ||||
FHLMC CMO, Cl OG | ||||||
5.000%, 06/15/34 | 1,826 | 1,924 | ||||
FHLMC CMO, Cl LZ | ||||||
6.000%, 06/15/38 | 222 | 235 | ||||
FHLMC CMO, Cl YT | ||||||
0.000%, 09/15/34 (B) | 7 | 7 | ||||
FHLMC CMO, Cl XP | ||||||
6.000%, 04/15/36 | 312 | 338 | ||||
FHLMC CMO, Cl VG | ||||||
6.000%, 11/15/23 | 300 | 328 | ||||
FHLMC CMO, Cl 4A | ||||||
7.500%, 09/25/43 | 780 | 874 | ||||
FHLMC CMO, Cl NB | ||||||
5.500%, 07/15/33 | 1,007 | 1,074 | ||||
FHLMC CMO, Cl SA | ||||||
14.428%, 06/15/33 (B) | 375 | 403 | ||||
FHLMC CMO, Cl 1A2 | ||||||
7.000%, 07/25/43 to 03/25/44 | 841 | 946 | ||||
FHLMC CMO, PO | ||||||
6.360%, 09/15/36 (B) | 1,174 | 129 | ||||
6.220%, 11/15/37 (B) | 1,224 | 119 | ||||
5.500%, 07/15/37 | 443 | 86 | ||||
0.000%, 03/15/20 to 04/15/37 | 1,858 | 1,524 | ||||
FHLMC CMO, Cl 2A | ||||||
6.500%, 02/25/43 | 163 | 179 | ||||
4.831%, 10/25/37 (B) | 400 | 405 | ||||
FHLMC CMO, Cl LK | ||||||
0.600%, 10/15/34 (B) | 531 | 528 | ||||
FHLMC CMO, Cl QS | ||||||
19.530%, 07/15/35 (B) | 380 | 439 | ||||
FHLMC CMO, Cl HC | ||||||
6.500%, 02/15/28 | 283 | 300 | ||||
FHLMC CMO, Cl HP | ||||||
21.080%, 05/15/35 (B) | 132 | 141 | ||||
FHLMC CMO, Cl MC | ||||||
4.500%, 10/15/36 | 27 | 26 | ||||
| SEI Institutional Managed Trust / Semi-Annual Report / March 31, 2010 | 61 |
Table of Contents
SCHEDULE OF INVESTMENTS (Unaudited)
U.S. Fixed Income Fund (Continued)
March 31, 2010
| Description | Face Amount ($ Thousands) | Market Value ($ Thousands) | ||||
FHLMC CMO, Cl SX | ||||||
15.954%, 10/15/33 (B) | $ | 85 | $ | 86 | ||
FHLMC CMO, Cl SJ | ||||||
8.805%, 10/15/33 (B) | 351 | 301 | ||||
FHLMC CMO, Cl QO | ||||||
4.500%, 03/15/18 | 300 | 317 | ||||
FHLMC CMO, Cl 1A | ||||||
6.500%, 09/25/43 (B) | 238 | 259 | ||||
FHLMC CMO, Cl SE | ||||||
16.875%, 02/15/38 (B) | 123 | 140 | ||||
9.219%, 12/15/28 (B) | 191 | 196 | ||||
FHLMC CMO, Cl SV | ||||||
8.655%, 11/15/33 (B) | 184 | 164 | ||||
FHLMC CMO, Cl GK | ||||||
23.715%, 06/15/35 (B) | 141 | 146 | ||||
FHLMC CMO, Cl PV | ||||||
6.250%, 10/15/23 | 1,711 | 1,835 | ||||
FHLMC CMO, Cl FA | ||||||
0.460%, 02/15/19 (B) | 4,398 | 4,414 | ||||
FHLMC CMO, Cl PD | ||||||
5.000%, 04/15/33 | 114 | 120 | ||||
FHLMC CMO, Cl MA | ||||||
5.000%, 02/15/30 | 3,365 | 3,598 | ||||
FHLMC CMO, Cl CI | ||||||
5.000%, 01/15/34 | 2,510 | 2,662 | ||||
FHLMC CMO, Cl A5 | ||||||
7.500%, 02/25/42 | 979 | 1,117 | ||||
FHLMC CMO, Cl PE | ||||||
5.000%, 04/15/37 | 397 | 418 | ||||
FHLMC CMO, Cl ZM | ||||||
6.500%, 06/15/32 | 517 | 566 | ||||
FHLMC CMO, Cl ZA | ||||||
6.500%, 04/15/32 | 656 | 723 | ||||
FHLMC CMO, Cl D | ||||||
6.500%, 08/15/28 | 611 | 659 | ||||
FHLMC CMO, Cl 3A | ||||||
7.000%, 02/25/43 | 527 | 593 | ||||
FHLMC CMO STRIPS, | ||||||
5.000%, 08/01/35 | 1,264 | 276 | ||||
FHLMC CMO, Ser 1611, Cl Z | ||||||
6.500%, 11/15/23 | 1,326 | 1,419 | ||||
FHLMC CMO, Ser 2043, Cl CJ | ||||||
6.500%, 04/15/28 | 866 | 919 | ||||
FHLMC CMO, Ser 2399, Cl XG | ||||||
6.500%, 01/15/32 | 823 | 897 | ||||
FHLMC CMO, Ser 2542, Cl ES | ||||||
5.000%, 12/15/17 | 39 | 42 | ||||
FHLMC CMO, Ser 2558, Cl BD | ||||||
5.000%, 01/15/18 | 173 | 186 | ||||
FHLMC CMO, Ser 2590, Cl BY | ||||||
5.000%, 03/15/18 | 71 | 76 | ||||
FHLMC CMO, Ser 2676, Cl CY | ||||||
4.000%, 09/15/18 | 202 | 210 | ||||
FHLMC CMO, Ser 2690, Cl TV | ||||||
4.500%, 11/15/25 | 147 | 151 | ||||
| Description | Face Amount ($ Thousands) | Market Value ($ Thousands) | ||||
FHLMC CMO, Ser 2694, Cl QG | ||||||
4.500%, 01/15/29 | $ | 46 | $ | 48 | ||
FHLMC CMO, Ser 2727, Cl PW | ||||||
3.570%, 06/15/29 | 45 | 45 | ||||
FHLMC CMO, Ser 2733, Cl ME | ||||||
5.000%, 01/15/34 | 1,080 | 1,096 | ||||
FHLMC CMO, Ser 2765, Cl CT | ||||||
4.000%, 03/15/19 | 117 | 120 | ||||
FHLMC CMO, Ser 2790, Cl TN | ||||||
4.000%, 05/15/24 | 308 | 310 | ||||
FHLMC CMO, Ser 2843, Cl BC | ||||||
5.000%, 08/15/19 | 261 | 280 | ||||
FHLMC CMO, Ser 2875, Cl HB | ||||||
4.000%, 10/15/19 | 45 | 45 | ||||
FHLMC CMO, Ser 2945, Cl SA | ||||||
11.880%, 03/15/20 (B) | 163 | 177 | ||||
FHLMC CMO, Ser 2985, Cl JR | ||||||
4.500%, 06/15/25 | 383 | 398 | ||||
FHLMC CMO, Ser 3028, Cl PG | ||||||
5.500%, 09/15/35 | 187 | 202 | ||||
FHLMC CMO, Ser 3035, Cl PA | ||||||
5.500%, 09/15/35 | 78 | 84 | ||||
FHLMC CMO, Ser 3372, Cl BD | ||||||
4.500%, 10/15/22 | 262 | 272 | ||||
FHLMC CMO, Ser 3465, Cl HA | ||||||
4.000%, 07/15/17 | 277 | 289 | ||||
FHLMC, Ser K003, Cl AAB | ||||||
4.768%, 05/25/18 | 342 | 362 | ||||
FHLMC-GNMA CMO, Cl L | ||||||
6.250%, 10/25/23 | 554 | 585 | ||||
FHLMC TBA | ||||||
5.000%, 05/14/33 | 1,000 | 1,028 | ||||
FNMA | ||||||
7.500%, 10/01/37 to 04/01/39 | 2,354 | 2,628 | ||||
7.000%, 04/01/32 to 01/01/39 | 2,360 | 2,619 | ||||
6.500%, 05/01/27 to 06/01/36 | 2,421 | 2,654 | ||||
6.000%, 03/01/19 to 04/01/36 | 10,509 | 11,373 | ||||
5.500%, 11/01/17 to 09/01/36 | 30,946 | 33,208 | ||||
5.000%, 01/01/20 to 02/01/39 | 6,096 | 6,325 | ||||
4.500%, 06/01/35 | 1,148 | 1,160 | ||||
FNMA ARM (B) | ||||||
6.590%, 09/01/36 | 742 | 779 | ||||
6.348%, 09/01/36 | 1,255 | 1,319 | ||||
6.308%, 09/01/37 | 258 | 271 | ||||
6.284%, 09/01/37 | 35 | 37 | ||||
6.280%, 10/01/36 | 144 | 152 | ||||
6.273%, 09/01/37 | 110 | 118 | ||||
6.248%, 07/01/37 | 1,044 | 1,098 | ||||
6.229%, 02/01/37 | 1,552 | 1,630 | ||||
6.227%, 11/01/37 | 787 | 821 | ||||
6.202%, 06/01/36 | 1,168 | 1,220 | ||||
6.200%, 08/01/36 | 307 | 324 | ||||
6.124%, 12/01/36 | 132 | 139 | ||||
6.103%, 09/01/37 | 642 | 675 | ||||
6.080%, 09/01/37 | 96 | 101 | ||||
6.047%, 05/01/36 | 1,148 | 1,200 | ||||
| 62 | SEI Institutional Managed Trust / Semi-Annual Report / March 31, 2010 |
Table of Contents
| Description | Face Amount ($ Thousands) | Market Value ($ Thousands) | ||||
6.028%, 01/01/37 | $ | 169 | $ | 179 | ||
6.021%, 07/01/37 | 487 | 510 | ||||
6.014%, 10/01/37 | 101 | 106 | ||||
6.013%, 10/01/37 | 318 | 335 | ||||
6.012%, 11/01/37 | 157 | 165 | ||||
5.991%, 04/01/36 | 898 | 940 | ||||
5.985%, 10/01/37 | 119 | 125 | ||||
5.977%, 04/01/37 | 179 | 189 | ||||
5.976%, 07/01/37 | 360 | 378 | ||||
5.961%, 07/01/37 | 171 | 180 | ||||
5.957%, 01/01/37 | 215 | 227 | ||||
5.936%, 07/01/37 | 317 | 333 | ||||
5.930%, 07/01/37 | 316 | 333 | ||||
5.928%, 10/01/37 | 426 | 448 | ||||
5.926%, 03/01/37 | 114 | 121 | ||||
5.922%, 04/01/37 | 459 | 480 | ||||
5.913%, 04/01/37 | 259 | 271 | ||||
5.910%, 11/01/36 | 487 | 512 | ||||
5.904%, 09/01/37 | 155 | 163 | ||||
5.900%, 12/01/36 | 668 | 702 | ||||
5.896%, 02/01/37 | 82 | 87 | ||||
5.886%, 03/01/37 | 149 | 156 | ||||
5.882%, 12/01/37 | 712 | 750 | ||||
5.879%, 05/01/37 | 147 | 154 | ||||
5.878%, 02/01/37 | 143 | 150 | ||||
5.876%, 10/01/37 | 230 | 242 | ||||
5.869%, 03/01/37 | 399 | 419 | ||||
5.868%, 04/01/37 | 342 | 358 | ||||
5.817%, 11/01/37 | 271 | 285 | ||||
5.814%, 03/01/37 | 335 | 351 | ||||
5.808%, 08/01/37 | 429 | 450 | ||||
5.747%, 09/01/36 | 414 | 434 | ||||
5.718%, 05/01/37 | 189 | 199 | ||||
5.686%, 01/01/23 | 293 | 311 | ||||
5.668%, 02/01/39 | 473 | 496 | ||||
5.666%, 11/01/36 | 587 | 615 | ||||
5.661%, 05/01/37 | 127 | 134 | ||||
5.643%, 09/01/37 | 218 | 230 | ||||
5.615%, 11/01/37 | 957 | 1,005 | ||||
5.606%, 01/01/37 | 405 | 424 | ||||
5.588%, 12/01/36 | 1,004 | 1,050 | ||||
5.571%, 05/01/37 | 230 | 242 | ||||
5.570%, 03/01/36 | 485 | 512 | ||||
5.500%, 07/01/37 | 1,164 | 1,220 | ||||
5.494%, 05/01/38 | 1,164 | 1,233 | ||||
5.479%, 09/01/37 | 178 | 187 | ||||
FNMA CMO, Cl PE | ||||||
5.000%, 03/25/34 | 3,000 | 3,188 | ||||
FNMA CMO, Cl UE | ||||||
5.000%, 01/25/34 | 397 | 418 | ||||
FNMA CMO, Cl JT | ||||||
6.000%, 06/25/36 | 47 | 51 | ||||
FNMA CMO, Cl MB | ||||||
4.000%, 12/25/39 | 800 | 838 | ||||
| Description | Face Amount ($ Thousands) | Market Value ($ Thousands) | ||||
FNMA CMO, Cl BA | ||||||
7.000%, 03/25/45 | $ | 296 | $ | 331 | ||
5.250%, 11/25/33 | 331 | 335 | ||||
5.000%, 01/25/24 | 250 | 263 | ||||
FNMA CMO, Cl ES | ||||||
16.260%, 10/25/35 (B) | 272 | 314 | ||||
FNMA CMO, Cl A1 | ||||||
3.305%, 06/25/19 | 146 | 148 | ||||
FNMA CMO, Cl A2 | ||||||
4.450%, 09/25/19 | 228 | 232 | ||||
4.287%, 07/25/19 | 651 | 655 | ||||
0.306%, 12/25/36 (B) | 538 | 531 | ||||
FNMA CMO, Cl PD | ||||||
6.000%, 10/25/36 | 1,000 | 1,076 | ||||
FNMA CMO, Cl A6 | ||||||
0.447%, 10/27/37 (B) | 500 | 499 | ||||
FNMA CMO, Cl FA | ||||||
0.646%, 06/25/37 (B) | 664 | 662 | ||||
FNMA CMO, Cl XT | ||||||
4.500%, 12/25/17 | 907 | 931 | ||||
FNMA CMO, Cl WA | ||||||
6.428%, 03/25/40 | 248 | 268 | ||||
6.286%, 12/25/39 (B) | 489 | 519 | ||||
6.133%, 02/25/40 (B) | 246 | 268 | ||||
FNMA CMO, Cl SM | ||||||
17.198%, 09/25/24 (B) | 568 | 674 | ||||
FNMA CMO, Cl ZH | ||||||
6.500%, 07/25/36 | 507 | 551 | ||||
FNMA CMO, Cl VB | ||||||
6.500%, 10/25/17 | 370 | 401 | ||||
FNMA CMO, Cl BP | ||||||
5.900%, 02/25/15 | 874 | 899 | ||||
FNMA CMO, PO | ||||||
6.854%, 02/25/40 (B) | 1,000 | 151 | ||||
6.677%, 01/25/38 (B) | 1,028 | 63 | ||||
6.204%, 10/25/37 to 12/25/37 (B) | 1,776 | 197 | ||||
6.000%, 10/25/33 | 1,000 | 1,077 | ||||
5.934%, 12/25/39 (B) | 1,474 | 101 | ||||
5.754%, 02/25/38 (B) | 1,511 | 174 | ||||
5.654%, 10/25/39 (B) | 851 | 73 | ||||
5.000%, 07/25/39 | 665 | 107 | ||||
0.642%, 10/25/16 (B) | 2,164 | 23 | ||||
0.000%, 10/25/31 to 04/25/36 | 2,068 | 1,821 | ||||
FNMA CMO, Cl DP | ||||||
5.000%, 06/25/19 | 1,000 | 1,057 | ||||
FNMA CMO, Cl SB | ||||||
16.260%, 08/25/35 (B) | 401 | 459 | ||||
FNMA CMO, Cl MA | ||||||
5.500%, 11/25/29 | 139 | 145 | ||||
FNMA CMO, Cl J | ||||||
5.000%, 09/25/19 | 982 | 1,037 | ||||
FNMA CMO, Cl BZ | ||||||
6.500%, 08/25/36 | 127 | 137 | ||||
| SEI Institutional Managed Trust / Semi-Annual Report / March 31, 2010 | 63 |
Table of Contents
SCHEDULE OF INVESTMENTS (Unaudited)
U.S. Fixed Income Fund (Continued)
March 31, 2010
| Description | Face Amount ($ Thousands) | Market Value ($ Thousands) | ||||
FNMA CMO, Cl SK | ||||||
15.708%, 01/25/34 (B) | $ | 338 | $ | 376 | ||
FNMA CMO, Cl US | ||||||
23.664%, 11/25/35 (B) | 1,101 | 1,397 | ||||
FNMA CMO, Cl A3 | ||||||
4.001%, 01/25/19 | 680 | 673 | ||||
FNMA CMO, Cl VD | ||||||
6.500%, 05/25/17 | 732 | 787 | ||||
FNMA CMO, Cl XB | ||||||
5.000%, 03/25/38 | 933 | 958 | ||||
FNMA CMO STRIPS, | ||||||
5.000%, 08/01/35 | 1,881 | 396 | ||||
FNMA CMO, Ser 1999-11, Cl Z | ||||||
5.500%, 03/25/29 | 746 | 799 | ||||
FNMA CMO, Ser 2001-81, Cl HE | ||||||
6.500%, 01/25/32 | 3,907 | 4,234 | ||||
FNMA CMO, Ser 2002-94, Cl HQ | ||||||
4.500%, 01/25/18 | 219 | 231 | ||||
FNMA CMO, Ser 2003-108, Cl BE | ||||||
4.000%, 11/25/18 | 156 | 162 | ||||
FNMA CMO, Ser 2003-125, Cl AY | ||||||
4.000%, 12/25/18 | 49 | 51 | ||||
FNMA CMO, Ser 2004-60, Cl PA | ||||||
5.500%, 04/25/34 | 151 | 162 | ||||
FNMA CMO, Ser 2004-80, Cl LE | ||||||
4.000%, 11/25/19 | 936 | 956 | ||||
FNMA CMO, Ser 2004-81, Cl KE | ||||||
4.500%, 11/25/19 | 49 | 51 | ||||
FNMA CMO, Ser 2005-58, Cl MA | ||||||
5.500%, 07/25/35 | 125 | 135 | ||||
FNMA CMO, Ser 2007-113, Cl DB | ||||||
4.500%, 12/25/22 | 336 | 346 | ||||
FNMA CMO, Ser 2007-77, Cl MH | ||||||
6.000%, 12/25/36 | 593 | 639 | ||||
FNMA CMO, Ser 2008-35, Cl B | ||||||
5.000%, 08/25/23 | 50 | 53 | ||||
FNMA CMO, Ser 30, Cl MA | ||||||
4.250%, 02/25/37 | 1,601 | 1,665 | ||||
FNMA Grantor Trust CMO, Cl A2 | ||||||
7.500%, 12/25/41 | 527 | 591 | ||||
7.000%, 07/25/42 | 530 | 589 | ||||
FNMA Grantor Trust CMO, Cl A1 | ||||||
7.000%, 12/25/41 | 840 | 931 | ||||
6.500%, 11/25/31 | 645 | 707 | ||||
FNMA Grantor Trust CMO, Cl 1A3 | ||||||
7.000%, 02/25/44 | 509 | 572 | ||||
FNMA TBA | ||||||
5.500%, 04/30/22 to 06/12/37 | 1,900 | 1,958 | ||||
5.000%, 06/01/38 | 19,500 | 19,969 | ||||
4.500%, 04/14/33 to 05/01/38 | 14,200 | 14,198 | ||||
FNMA Whole Loan CMO, Cl 2A | ||||||
7.500%, 12/25/42 | 328 | 368 | ||||
7.000%, 10/25/42 | 441 | 491 | ||||
| Description | Face Amount ($ Thousands) | Market Value ($ Thousands) | ||||
FNMA Whole Loan CMO, Cl 2A2 | ||||||
7.000%, 12/25/33 to 02/25/44 | $ | 1,619 | $ | 1,824 | ||
FNMA Whole Loan CMO, IO | ||||||
7.854%, 06/25/42 (B) | 646 | 115 | ||||
FNMA Whole Loan CMO, Cl 1A3 | ||||||
7.500%, 12/25/45 | 455 | 519 | ||||
FNMA Whole Loan CMO, Cl 1AF1 | ||||||
0.506%, 11/25/46 (B) | 802 | 812 | ||||
0.466%, 02/25/36 (B) | 509 | 492 | ||||
FNMA Whole Loan CMO, Cl 1A8 | ||||||
4.550%, 06/25/43 | 406 | 423 | ||||
FNMA Whole Loan CMO, Cl 2AF | ||||||
0.466%, 03/25/45 (B) | 439 | 417 | ||||
GNMA | ||||||
7.500%, 10/15/37 | 984 | 1,076 | ||||
7.000%, 09/15/31 | 140 | 157 | ||||
6.500%, 12/15/32 to 12/15/35 | 2,297 | 2,494 | ||||
4.500%, 11/15/39 | 3,931 | 3,982 | ||||
GNMA ARM | ||||||
4.500%, 02/20/34 (B) | 743 | 769 | ||||
3.500%, 05/20/36 (B) | 865 | 890 | ||||
2.750%, 12/20/33 (B) | 920 | 932 | ||||
GNMA CMO, Cl SX | ||||||
16.804%, 02/20/34 (B) | 37 | 39 | ||||
GNMA CMO, Cl ST | ||||||
7.000%, 09/20/34 (B) | 260 | 267 | ||||
GNMA CMO | ||||||
7.470%, 04/16/38 (B) | 515 | 64 | ||||
7.360%, 09/20/38 (B) | 885 | 115 | ||||
6.500%, 03/20/39 | 696 | 78 | ||||
6.320%, 11/16/33 (B) | 805 | 107 | ||||
6.310%, 11/20/37 (B) | 528 | 45 | ||||
6.290%, 12/20/37 (B) | 713 | 60 | ||||
6.170%, 11/16/39 (B) | 1,374 | 121 | ||||
6.160%, 12/20/38 (B) | 1,744 | 160 | ||||
6.060%, 03/20/39 (B) | 1,882 | 185 | ||||
6.000%, 12/20/38 | 436 | 61 | ||||
5.960%, 03/20/37 to 06/20/38 (B) | 3,143 | 296 | ||||
5.800%, 02/20/39 (B) | 862 | 78 | ||||
5.710%, 06/20/39 (B) | 1,029 | 82 | ||||
5.590%, 02/20/38 (B) | 1,116 | 91 | ||||
0.430%, 04/16/37 (B) | 672 | 667 | ||||
0.000%, 01/17/33 to 11/16/37 | 1,481 | 1,189 | ||||
GNMA CMO, Cl SV | ||||||
8.760%, 04/20/34 (B) | 481 | 480 | ||||
GNMA CMO, Cl SB | ||||||
7.407%, 03/17/33 (B) | 423 | 399 | ||||
GNMA CMO, Cl MN | ||||||
5.500%, 09/20/39 | 500 | 511 | ||||
GNMA CMO, Cl PB | ||||||
6.000%, 12/20/35 | 400 | 426 | ||||
GNMA CMO, Cl MV | ||||||
6.000%, 04/20/20 | 1,899 | 2,065 | ||||
| 64 | SEI Institutional Managed Trust / Semi-Annual Report / March 31, 2010 |
Table of Contents
| Description | Face Amount ($ Thousands) | Market Value ($ Thousands) | ||||
GNMA CMO, Cl Z | ||||||
7.500%, 12/20/29 | $ | 727 | $ | 815 | ||
6.500%, 12/20/31 | 854 | 947 | ||||
GNMA CMO, Ser 2003-86, Cl ZK | ||||||
5.000%, 10/20/33 | 1,033 | 1,042 | ||||
GNMA CMO, Ser 2006-37, Cl JG | ||||||
5.000%, 07/20/36 | 194 | 203 | ||||
GNMA TBA | ||||||
4.500%, 04/15/40 to 04/15/40 | 22,280 | 22,541 | ||||
Vendee Mortgage Trust CMO, Cl ZB | ||||||
7.250%, 02/15/23 | 1,116 | 1,239 | ||||
| 333,184 | ||||||
Non-Agency Mortgage-Backed Obligations — 11.8% | ||||||
American General Mortgage Loan Trust, Cl A1 | ||||||
5.150%, 03/25/58 (B) (D) | 300 | 300 | ||||
American Home Mortgage Investment Trust, Ser 2004-4, Cl 4A | ||||||
2.430%, 02/25/45 (B) | 1,429 | 1,119 | ||||
ASG Resecuritization Trust | ||||||
5.800%, 05/24/36 (B) (D) | 390 | 390 | ||||
5.594%, 03/26/37 (B) (D) | 1,276 | 1,237 | ||||
Asset Securitization, Cl A2 | ||||||
7.776%, 10/13/26 (B) | 293 | 309 | ||||
Banc of America Alternative Loan Trust, Cl 2A4 | ||||||
5.000%, 09/25/18 | 165 | 166 | ||||
Banc of America Alternative Loan Trust, Cl 1CB2 | ||||||
5.500%, 11/25/33 | 305 | 307 | ||||
Banc of America Alternative Loan Trust, Cl 1A1 | ||||||
6.000%, 01/25/34 | 209 | 201 | ||||
Banc of America Alternative Loan Trust, Cl 3A1 | ||||||
5.500%, 09/25/19 | 184 | 184 | ||||
Banc of America Alternative Loan Trust, Cl 2A1 | ||||||
6.000%, 01/25/34 | 487 | 469 | ||||
Banc of America Alternative Loan Trust, Cl 5A1 | ||||||
5.500%, 02/25/19 | 139 | 135 | ||||
Banc of America Commercial Mortgage, Cl E | ||||||
7.634%, 09/15/32 (B) | 128 | 128 | ||||
Banc of America Commercial Mortgage, Cl AM | ||||||
4.727%, 07/10/43 | 150 | 134 | ||||
Banc of America Commercial Mortgage, Cl A4 | ||||||
6.186%, 06/11/35 | 1,130 | 1,194 | ||||
5.634%, 07/10/46 | 225 | 228 | ||||
5.414%, 09/10/47 | 305 | 305 | ||||
| Description | Face Amount ($ Thousands) | Market Value ($ Thousands) | ||||
5.372%, 09/10/45 (B) | $ | 290 | $ | 297 | ||
Banc of America Commercial Mortgage Securities, Ser 2002-PB2, Cl B | ||||||
6.309%, 06/11/35 | 145 | 153 | ||||
Banc of America Commercial Mortgage Securities, Ser 2005-3, Cl A4 | ||||||
4.668%, 07/10/43 | 100 | 100 | ||||
Banc of America Commercial Mortgage Securities, Ser 2005-6, Cl A4 | ||||||
5.179%, 09/10/47 (B) | 145 | 151 | ||||
Banc of America Commercial Mortgage, Ser 2005-5, Cl A4 | ||||||
5.115%, 10/10/45 (B) | 100 | 102 | ||||
Banc of America Commercial Mortgage, Ser 2006-3, Cl A4 | ||||||
5.889%, 07/10/44 (B) | 160 | 157 | ||||
Banc of America Funding, Cl 1A7 | ||||||
5.500%, 10/25/34 | 237 | 236 | ||||
Banc of America Funding, Cl 1A1 | ||||||
5.052%, 12/20/34 (B) | 178 | 170 | ||||
Banc of America Mortgage Securities, Cl 1A23 | ||||||
4.500%, 04/25/34 | 229 | 230 | ||||
Banc of America Mortgage Securities, Cl 4A1 | ||||||
4.750%, 06/25/19 | 264 | 263 | ||||
Banc of America Mortgage Securities, Cl 3A1 | ||||||
5.000%, 04/25/19 | 172 | 173 | ||||
Banc of America Mortgage Securities, Cl 2A1 | ||||||
0.796%, 05/25/18 (B) | 253 | 240 | ||||
0.696%, 08/25/18 (B) | 107 | 105 | ||||
BCAP Trust, Cl 17A1 | ||||||
5.750%, 06/26/37 (D) | 445 | 440 | ||||
BCAP Trust, Cl 11A1 | ||||||
5.250%, 05/26/37 (B) (D) | 239 | 239 | ||||
BCAP Trust | ||||||
5.500%, 11/26/34 (D) | 942 | 933 | ||||
Bear Stearns Adjustable Rate Mortgage Trust, Cl A1 | ||||||
2.530%, 08/25/35 (B) | 263 | 245 | ||||
Bear Stearns Adjustable Rate Mortgage Trust, Cl 14A | ||||||
5.173%, 05/25/34 (B) | 230 | 231 | ||||
Bear Stearns Commercial Mortgage Securities, Cl A2 | ||||||
6.460%, 10/15/36 | 796 | 847 | ||||
5.286%, 06/11/41 (B) | 212 | 220 | ||||
| SEI Institutional Managed Trust / Semi-Annual Report / March 31, 2010 | 65 |
Table of Contents
SCHEDULE OF INVESTMENTS (Unaudited)
U.S. Fixed Income Fund (Continued)
March 31, 2010
| Description | Face Amount ($ Thousands) | Market Value ($ Thousands) | ||||
Bear Stearns Commercial Mortgage Securities, Cl A3 | ||||||
5.468%, 06/11/41 (B) | $ | 124 | $ | 129 | ||
Bear Stearns Commercial Mortgage Securities | ||||||
5.456%, 03/11/39 (B) | 100 | 104 | ||||
Bear Stearns Commercial Mortgage Securities, Ser 2001-TOP2, Cl A2 | ||||||
6.480%, 02/15/35 | 310 | 319 | ||||
Bear Stearns Commercial Mortgage Securities, Ser 2001-TOP4, Cl A3 | ||||||
5.610%, 11/15/33 | 96 | 100 | ||||
Bear Stearns Commercial Mortgage Securities, Ser 2002-PBW1, Cl A2 | ||||||
4.720%, 11/11/35 (B) | 178 | 186 | ||||
Bear Stearns Commercial Mortgage Securities, Ser 2002-TOP8, Cl A2 | ||||||
4.830%, 08/15/38 | 253 | 265 | ||||
Bear Stearns Commercial Mortgage Securities, Ser 2003-T12, Cl A3 | ||||||
4.240%, 08/13/39 (B) | 54 | 55 | ||||
Bear Stearns Commercial Mortgage Securities, Ser 2005-PW10, Cl A4 | ||||||
5.405%, 12/11/40 (B) | 945 | 968 | ||||
Bear Stearns Commercial Mortgage Securities, Ser 2005-T20, Cl A4A | ||||||
5.149%, 10/12/42 (B) | 450 | 465 | ||||
Chase Mortgage Finance, Cl 9A1 | ||||||
4.554%, 02/25/37 (B) | 144 | 144 | ||||
Chase Mortgage Finance | ||||||
0.696%, 01/25/34 (B) | 326 | 323 | ||||
0.000%, 10/25/18 | 172 | 144 | ||||
Chase Mortgage Finance, Cl 1A1 | ||||||
3.968%, 07/25/37 (B) | 227 | 211 | ||||
Chase Mortgage Finance, Cl 2A1 | ||||||
4.125%, 02/25/37 (B) | 195 | 185 | ||||
Citicorp Mortgage Securities, Cl 1A2 | ||||||
4.500%, 05/25/33 | 103 | 104 | ||||
Commercial Mortgage Asset Trust, Ser 1999-C1, Cl A4 | ||||||
6.975%, 01/17/32 (B) | 691 | 747 | ||||
Commercial Mortgage Loan Trust, Ser 2008-LS1, Cl A4B | ||||||
6.020%, 12/10/49 (B) | 2,630 | 2,585 | ||||
Commercial Mortgage Pass Through Certificates, Cl A4 | ||||||
4.715%, 03/10/39 | 277 | 283 | ||||
Commercial Mortgage Pass Through Certificates, Cl A5 | ||||||
5.314%, 07/10/37 (B) | 249 | 261 | ||||
Commercial Mortgage Pass Through Certificates, Ser 2001-J2A, Cl A2 | ||||||
6.096%, 07/16/34 (D) | 274 | 289 | ||||
| Description | Face Amount ($ Thousands) | Market Value ($ Thousands) | ||||
Countrywide Home Loan Mortgage Pass Through Trust, Cl A6 | ||||||
5.250%, 09/25/33 | $ | 350 | $ | 354 | ||
Countrywide Home Loan Mortgage Pass Through Trust | ||||||
9.455%, 08/25/18 (B) | 112 | 109 | ||||
Countrywide Home Loan Mortgage Pass Through Trust, Cl 2A1 | ||||||
4.500%, 06/25/19 | 311 | 307 | ||||
Credit Suisse First Boston Mortgage Securities, Cl 5A1 | ||||||
7.000%, 12/25/33 | 169 | 168 | ||||
Credit Suisse Mortgage Capital Certificates, Cl 7A1 | ||||||
5.500%, 10/27/35 (D) | 164 | 163 | ||||
Credit Suisse Mortgage Capital Certificates, Ser 2006-C5, Cl A3 | ||||||
5.311%, 12/15/39 | 2,450 | 2,312 | ||||
CS First Boston Mortgage Securities, Cl A4 | ||||||
5.100%, 08/15/38 (B) | 220 | 224 | ||||
5.014%, 02/15/38 (B) | 322 | 329 | ||||
CS First Boston Mortgage Securities, Cl A3 | ||||||
4.813%, 02/15/38 | 1,069 | 1,073 | ||||
CS First Boston Mortgage Securities, Cl 8A1 | ||||||
6.000%, 11/25/18 | 223 | 218 | ||||
CS First Boston Mortgage Securities, Ser 2002-CKN2, Cl A3 | ||||||
6.133%, 04/15/37 | 81 | 86 | ||||
CS First Boston Mortgage Securities, Ser 2002-CKS4, Cl A2 | ||||||
5.183%, 11/15/36 | 536 | 563 | ||||
CS First Boston Mortgage Securities, Ser 2002-CKS4, Cl A1 | ||||||
4.485%, 11/15/36 | 10 | 11 | ||||
CS First Boston Mortgage Securities, Ser 2002-CP5, Cl A2 | ||||||
4.940%, 12/15/35 | 161 | 169 | ||||
CS First Boston Mortgage Securities, Ser 2003-AR24, Cl 2A4 | ||||||
3.124%, 10/25/33 (B) | 1,407 | 1,175 | ||||
CS First Boston Mortgage Securities, Ser 2003-CK2, Cl A4 | ||||||
4.801%, 03/15/36 | 118 | 123 | ||||
CS First Boston Mortgage Securities, Ser C2, Cl A4 | ||||||
4.832%, 04/15/37 | 205 | 204 | ||||
CS First Boston Mortgage Securities, Ser CPN1, Cl A2 | ||||||
4.597%, 03/15/35 | 287 | 298 | ||||
| 66 | SEI Institutional Managed Trust / Semi-Annual Report / March 31, 2010 |
Table of Contents
| Description | Face Amount ($ Thousands) | Market Value ($ Thousands) | ||||
CW Capital Cobalt, Ser 2006-C1, Cl A4 | ||||||
5.223%, 08/15/48 | $ | 1,300 | $ | 1,241 | ||
Deutsche ALT-A Securities Alternate Loan Trust, Cl 2A1 | ||||||
5.601%, 02/25/20 (B) | 151 | 149 | ||||
FHLMC Multifamily Structured Pass Through Certificates, Cl A1 | ||||||
3.398%, 07/25/19 | 387 | 391 | ||||
First Horizon Asset Securities, Cl 2A1 | ||||||
4.500%, 09/25/18 | 310 | 309 | ||||
First Union National Bank Commercial Mortgage, Cl B | ||||||
7.281%, 10/15/32 (B) | 200 | 204 | ||||
First Union National Bank Commercial Mortgage, Cl A2 | ||||||
6.141%, 02/12/34 | 154 | 162 | ||||
First Union National Bank Commercial Mortgage, Ser 2001-C4, Cl B | ||||||
6.417%, 12/12/33 | 178 | 183 | ||||
GE Capital Assurance, Ser 2003-1, Cl A4 | ||||||
5.254%, 05/12/35 (B) (D) | 1,187 | 1,252 | ||||
GE Capital Commercial Mortgage, Cl A1 | ||||||
5.560%, 06/10/38 | 53 | 54 | ||||
GE Capital Commercial Mortgage, Ser 2001-2, Cl A3 | ||||||
6.030%, 08/11/33 | 17 | 18 | ||||
GE Capital Commercial Mortgage, Ser 2002-1A, Cl A3 | ||||||
6.269%, 12/10/35 | 1,516 | 1,611 | ||||
GE Capital Commercial Mortgage, Ser 2002-3A, Cl A2 | ||||||
4.996%, 12/10/37 | 2,000 | 2,097 | ||||
GE Capital Commercial Mortgage, Ser 2005-C4, Cl A4 | ||||||
5.339%, 11/10/45 (B) | 1,753 | 1,807 | ||||
GMAC Commercial Mortgage Securities, Cl A4 | ||||||
5.301%, 08/10/38 (B) | 252 | 260 | ||||
GMAC Commercial Mortgage Securities, Cl B | ||||||
6.790%, 04/15/34 | 78 | 82 | ||||
GMAC Commercial Mortgage Securities, Ser 2000-C2, Cl A2 | ||||||
7.455%, 08/16/33 (B) | 9 | 9 | ||||
GMAC Commercial Mortgage Securities, Ser 2003-C2, Cl A2 | ||||||
5.485%, 05/10/40 (B) | 118 | 126 | ||||
GMAC Commercial Mortgage Securities, Ser 2003-C3, Cl A4 | ||||||
5.023%, 04/10/40 | 689 | 723 | ||||
| Description | Face Amount ($ Thousands) | Market Value ($ Thousands) | ||||
GMAC Mortgage Loan Trust, Cl 1A1 | ||||||
5.000%, 01/25/20 | $ | 270 | $ | 271 | ||
GMAC Mortgage Loan Trust, Cl A7 | ||||||
6.500%, 01/25/35 | 359 | 375 | ||||
5.000%, 11/25/33 | 343 | 300 | ||||
GMAC Mortgage Loan Trust, Cl A4 | ||||||
5.000%, 10/25/33 | 257 | 245 | ||||
4.098%, 10/19/33 (B) | 344 | 327 | ||||
Greenwich Capital Commercial Funding, Cl A6 | ||||||
5.135%, 06/10/36 (B) | 171 | 180 | ||||
Greenwich Capital Commercial Funding | ||||||
5.190%, 04/10/37 (B) | 247 | 259 | ||||
Greenwich Capital Commercial Funding, Cl A2 | ||||||
5.381%, 03/10/39 | 425 | 437 | ||||
Greenwich Capital Commercial Funding, Cl A4 | ||||||
5.444%, 03/10/39 | 1,500 | 1,459 | ||||
Greenwich Capital Commercial Funding, Ser 2005-GG3, Cl AAB | ||||||
4.619%, 08/10/42 | 762 | 784 | ||||
Greenwich Capital Commercial Funding, Ser 2005-GG5, Cl A5 | ||||||
5.224%, 04/10/37 (B) | 1,232 | 1,238 | ||||
Greenwich Capital Commercial Funding, Ser 2006-GG7, Cl A4 | ||||||
5.883%, 07/10/38 (B) | 3,013 | 3,071 | ||||
GS Mortgage Securities II, Cl A2 | ||||||
5.506%, 04/10/38 (B) | 626 | 638 | ||||
5.479%, 11/10/39 | 545 | 561 | ||||
4.319%, 10/10/28 | 330 | 333 | ||||
GS Mortgage Securities II, Ser 2001-GL3A, Cl A2 | ||||||
6.449%, 08/05/18 (B) (D) | 717 | 766 | ||||
GSR Mortgage Loan Trust, Cl 2A4 | ||||||
5.500%, 01/25/37 | 50 | 39 | ||||
GSR Mortgage Loan Trust, Cl 2A3 | ||||||
6.000%, 09/25/34 | 173 | 156 | ||||
GSR Mortgage Loan Trust, Cl 8A3 | ||||||
0.746%, 06/25/35 (B) | 298 | 268 | ||||
GSR Mortgage Loan Trust, Ser 2003-13, Cl 1A1 | ||||||
4.468%, 10/25/33 (B) | 1,074 | 1,060 | ||||
Homestar Mortgage Acceptance, Cl A1 | ||||||
0.696%, 10/25/34 (B) | 2,108 | 1,332 | ||||
Impac Secured Assets CMN Owner Trust, Cl A1 | ||||||
5.500%, 08/25/33 | 193 | 194 | ||||
JPMorgan Chase Commercial Mortgage Securities, Cl A2S | ||||||
5.305%, 01/15/49 | 1,272 | 1,265 | ||||
| SEI Institutional Managed Trust / Semi-Annual Report / March 31, 2010 | 67 |
Table of Contents
SCHEDULE OF INVESTMENTS (Unaudited)
U.S. Fixed Income Fund (Continued)
March 31, 2010
| Description | Face Amount ($ Thousands) | Market Value ($ Thousands) | ||||
JPMorgan Chase Commercial Mortgage Securities, Cl A1 | ||||||
5.017%, 02/12/51 | $ | 20 | $ | 20 | ||
JPMorgan Chase Commercial Mortgage Securities, Cl A4 | ||||||
5.481%, 12/12/44 (B) | 332 | 338 | ||||
5.376%, 06/12/41 (B) | 264 | 272 | ||||
JPMorgan Chase Commercial Mortgage Securities, Cl A2 | ||||||
5.633%, 12/05/27 (D) | 901 | 953 | ||||
JPMorgan Chase Commercial Mortgage Securities, Ser 2001-CIB2, Cl A3 | ||||||
6.429%, 04/15/35 | 1,170 | 1,217 | ||||
JPMorgan Chase Commercial Mortgage Securities, Ser 2002-CIB5, Cl A2 | ||||||
5.161%, 10/12/37 | 130 | 137 | ||||
JPMorgan Chase Commercial Mortgage Securities, Ser 2003-CB7, Cl A4 | ||||||
4.879%, 01/12/38 (B) | 353 | 367 | ||||
JPMorgan Chase Commercial Mortgage Securities, Ser 2003-PM1A, Cl A4 | ||||||
5.326%, 08/12/40 (B) | 40 | 42 | ||||
JPMorgan Chase Commercial Mortgage Securities, Ser 2005-LDP4, Cl A4 | ||||||
4.918%, 10/15/42 (B) | 177 | 179 | ||||
JPMorgan Chase Commercial Mortgage Securities, Ser 2006-LDP9, Cl A3 | ||||||
5.336%, 05/15/47 | 373 | 364 | ||||
JPMorgan Chase Commercial Mortgage Securities, Ser 2007-CB18, Cl A4 | ||||||
5.716%, 02/15/51 | 480 | 453 | ||||
5.440%, 06/12/47 | 1,200 | 1,173 | ||||
JPMorgan Chase Commercial Mortgage Securities, Ser 2007-CB19, Cl A2 | ||||||
5.747%, 02/12/49 (B) | 93 | 96 | ||||
JPMorgan Chase Commercial Mortgage Securities, Ser 2007-LD12, Cl A4 | ||||||
5.882%, 02/15/51 (B) | 2,350 | 2,297 | ||||
JPMorgan Chase Commercial Mortgage Securities, Ser 2007-LDPX, Cl A3 | ||||||
5.420%, 01/15/49 | 2,435 | 2,346 | ||||
| Description | Face Amount ($ Thousands) | Market Value ($ Thousands) | ||||
JPMorgan Chase Commercial Mortgage Securities, Ser CIB4, Cl A3 | ||||||
6.162%, 05/12/34 | $ | 404 | $ | 430 | ||
JPMorgan Commercial Mortgage Finance, Cl C | ||||||
7.753%, 08/15/32 (B) | 150 | 150 | ||||
JPMorgan Commercial Mortgage Finance, Ser 2000-C10, Cl A2 | ||||||
7.371%, 08/15/32 (B) | 10 | 10 | ||||
JPMorgan Mortgage Trust, Cl 4A1 | ||||||
4.278%, 07/25/34 (B) | 116 | 115 | ||||
4.054%, 08/25/34 (B) | 804 | 764 | ||||
JPMorgan Mortgage Trust, Cl 1A1 | ||||||
4.626%, 09/25/34 (B) | 145 | 146 | ||||
JPMorgan Mortgage Trust, Cl 6A1 | ||||||
3.993%, 08/25/34 (B) | 449 | 393 | ||||
JPMorgan Mortgage Trust, Ser 2005-A3, Cl 11A2 | ||||||
4.500%, 06/25/35 (B) | 1,485 | 1,110 | ||||
LB-UBS Commercial Mortgage Trust, Cl A4 | ||||||
5.883%, 06/15/38 (B) | 627 | 659 | ||||
5.372%, 09/15/39 | 538 | 547 | ||||
4.563%, 09/15/26 | 129 | 133 | ||||
4.166%, 05/15/32 | 86 | 88 | ||||
LB-UBS Commercial Mortgage Trust | ||||||
6.155%, 04/15/41 (B) | 117 | 122 | ||||
5.156%, 02/15/31 | 200 | 203 | ||||
LB-UBS Commercial Mortgage Trust, Cl A5 | ||||||
4.628%, 10/15/29 | 101 | 103 | ||||
LB-UBS Commercial Mortgage Trust, Cl AAB | ||||||
5.403%, 02/15/40 | 68 | 69 | ||||
LB-UBS Commercial Mortgage Trust, Ser 2002-C2, Cl A4 | ||||||
5.594%, 06/15/31 | 334 | 355 | ||||
LB-UBS Commercial Mortgage Trust, Ser 2002-C4, Cl A5 | ||||||
4.853%, 09/15/31 | 179 | 188 | ||||
LB-UBS Commercial Mortgage Trust, Ser 2003-C8, Cl A4 | ||||||
5.124%, 11/15/32 (B) | 101 | 106 | ||||
LB-UBS Commercial Mortgage Trust, Ser 2007-C1, Cl A3 | ||||||
5.398%, 02/15/40 | 156 | 162 | ||||
LB-UBS Commercial Mortgage Trust, Ser 2007-C1, Cl A2 | ||||||
5.318%, 02/15/40 | 399 | 407 | ||||
Master Adjustable Rate Mortgages Trust, Cl 3A6 | ||||||
3.097%, 11/21/34 (B) | 572 | 567 | ||||
| 68 | SEI Institutional Managed Trust / Semi-Annual Report / March 31, 2010 |
Table of Contents
| Description | Face Amount ($ Thousands) | Market Value ($ Thousands) | ||||
Master Alternative Loans Trust, Cl 2A1 | ||||||
6.000%, 12/25/33 | $ | 258 | $ | 251 | ||
Master Asset Securitization Trust, Cl 1A1 | ||||||
5.000%, 03/25/18 | 107 | 110 | ||||
Master Resecuritization Trust, PO | ||||||
0.000%, 05/28/35 (D) | 209 | 121 | ||||
Master Seasoned Securities Trust, Ser 2004-2, Cl A2 | ||||||
6.500%, 08/25/32 | 945 | 950 | ||||
Master Asset Securitization Trust, Cl 3A18 | ||||||
5.500%, 04/25/33 | 196 | 198 | ||||
Merrill Lynch, Cl A4 | ||||||
5.747%, 06/12/50 (B) | 2,460 | 2,255 | ||||
Merrill Lynch Mortgage Investors | ||||||
3.401%, 07/25/33 (B) | 78 | 77 | ||||
Merrill Lynch Mortgage Investors, Ser 2004-A1, Cl 4A | ||||||
5.261%, 02/25/34 (B) | 1,192 | 1,129 | ||||
Merrill Lynch Mortgage Trust, Cl A3A | ||||||
4.949%, 07/12/38 (B) | 171 | 173 | ||||
Merrill Lynch Mortgage Trust | ||||||
5.656%, 05/12/39 (B) | 150 | 156 | ||||
Merrill Lynch Mortgage Trust, Ser KEY1, Cl A4 | ||||||
5.236%, 11/12/35 (B) | 852 | 886 | ||||
Merrill Lynch/Countrywide Commercial Mortgage, Ser 2006-4, Cl A3 | ||||||
5.172%, 12/12/49 (B) | 1,400 | 1,355 | ||||
MLCC Mortgage Investors, Cl A2 | ||||||
0.684%, 04/25/29 (B) | 117 | 101 | ||||
Morgan Stanley Capital I, Cl A2 | ||||||
4.690%, 06/13/41 | 106 | 107 | ||||
4.070%, 05/15/40 | 75 | 77 | ||||
Morgan Stanley Capital I, Cl A4 | ||||||
5.811%, 08/12/41 (B) | 324 | 343 | ||||
5.809%, 12/12/49 | 846 | 832 | ||||
5.649%, 06/11/42 (B) | 100 | 103 | ||||
5.402%, 06/15/38 (B) | 642 | 667 | ||||
5.270%, 06/13/41 (B) | 176 | 180 | ||||
4.900%, 06/15/40 | 427 | 428 | ||||
4.520%, 12/13/41 | 35 | 36 | ||||
Morgan Stanley Capital I | ||||||
5.385%, 03/12/44 (B) | 554 | 575 | ||||
5.168%, 01/14/42 | 81 | 85 | ||||
Morgan Stanley Capital I, Cl A7 | ||||||
4.970%, 04/14/40 | 1,050 | 1,058 | ||||
Morgan Stanley Capital I, Ser 2003-IQ5, Cl A4 | ||||||
5.010%, 04/15/38 | 184 | 191 | ||||
| Description | Face Amount ($ Thousands) | Market Value ($ Thousands) | ||||
Morgan Stanley Capital I, Ser 2003-T11, Cl A4 | ||||||
5.150%, 06/13/41 | $ | 386 | $ | 407 | ||
Morgan Stanley Capital I, Ser 2004-HQ3, Cl A4 | ||||||
4.800%, 01/13/41 | 173 | 178 | ||||
Morgan Stanley Capital I, Ser 2005-HQ5, Cl AAB | ||||||
5.037%, 01/14/42 | 526 | 548 | ||||
Morgan Stanley Capital I, Ser 2005-HQ6, Cl A4A | ||||||
4.989%, 08/13/42 | 328 | 334 | ||||
Morgan Stanley Capital I, Ser 2005-HQ7, Cl AAB | ||||||
5.184%, 11/14/42 (B) | 227 | 238 | ||||
Morgan Stanley Capital I, Ser 2006-T21, Cl A4 | ||||||
5.162%, 10/12/52 (B) | 300 | 308 | ||||
Morgan Stanley Dean Witter Capital I | ||||||
6.510%, 04/15/34 | 104 | 110 | ||||
Morgan Stanley Dean Witter Capital I, Cl A2 | ||||||
4.740%, 11/13/36 | 795 | 825 | ||||
Morgan Stanley Dean Witter Capital I, Cl B | ||||||
6.550%, 07/15/33 | 159 | 166 | ||||
Morgan Stanley Dean Witter Capital I, Cl A4 | ||||||
5.740%, 12/15/35 | 71 | 75 | ||||
Morgan Stanley Dean Witter Capital I, Ser 2001-TOP5, Cl A4 | ||||||
6.390%, 10/15/35 | 557 | 587 | ||||
Morgan Stanley Dean Witter Capital I, Ser 2003-HQ2, Cl A2 | ||||||
4.920%, 03/12/35 | 1,180 | 1,228 | ||||
Prime Mortgage Trust, PO | ||||||
0.000%, 02/25/34 | 78 | 52 | ||||
Prudential Mortgage Capital Funding, Cl B | ||||||
6.760%, 05/10/34 | 144 | 151 | ||||
Residential Accredit Loans, Cl A4 | ||||||
5.500%, 05/25/34 | 274 | 195 | ||||
Residential Accredit Loans, Cl A1 | ||||||
5.000%, 09/25/18 | 270 | 266 | ||||
Residential Asset Mortgage Products, Ser 2004-SL1, Cl A8 | ||||||
6.500%, 11/25/31 | 952 | 927 | ||||
Residential Asset Securitization Trust, Cl A4 | ||||||
5.250%, 12/25/17 | 262 | 260 | ||||
Residential Asset Securitization Trust, Cl A1 | ||||||
5.500%, 06/25/33 | 178 | 169 | ||||
| SEI Institutional Managed Trust / Semi-Annual Report / March 31, 2010 | 69 |
Table of Contents
SCHEDULE OF INVESTMENTS (Unaudited)
U.S. Fixed Income Fund (Continued)
March 31, 2010
| Description | Face Amount ($ Thousands) | Market Value ($ Thousands) | ||||
Residential Asset Securitization Trust, Ser 2004-IP2, Cl 2A1 | ||||||
3.151%, 12/25/34 (B) | $ | 1,043 | $ | 911 | ||
Salomon Brothers Mortgage Securities VII, Cl A | ||||||
3.691%, 09/25/33 (B) | 251 | 239 | ||||
Salomon Brothers Mortgage Securities VII, Cl C | ||||||
7.727%, 07/18/33 (B) | 232 | 232 | ||||
Salomon Brothers Mortgage Securities VII, Ser 2002-KEY2, Cl A2 | ||||||
4.467%, 03/18/36 | 179 | 185 | ||||
Station Place Securitization Trust | ||||||
1.746%, 01/25/40 (B) (D) | 250 | 250 | ||||
Structured Asset Securities, Cl 2A | ||||||
4.997%, 12/25/33 (B) | 188 | 186 | ||||
Structured Asset Securities, Cl 1A1 | ||||||
5.500%, 10/25/33 | 317 | 307 | ||||
5.146%, 11/25/33 (B) | 168 | 169 | ||||
Structured Asset Securities, Cl A4 | ||||||
5.540%, 12/25/33 | 400 | 388 | ||||
Structured Asset Securities, Cl 3A2 | ||||||
2.698%, 07/25/33 (B) | 382 | 368 | ||||
Structured Asset Securities, Cl A3 | ||||||
0.746%, 06/25/33 (B) | 273 | 249 | ||||
TIAA Seasoned Commercial Mortgage Trust, Cl A3 | ||||||
6.072%, 08/15/39 (B) | 1,000 | 1,082 | ||||
US Bank, Ser 2007-1, Cl A | ||||||
5.920%, 05/25/12 | 670 | 689 | ||||
Wachovia Bank Commercial Mortgage Trust, Ser 2002-C1A, Cl A4 | ||||||
6.287%, 04/15/34 | 341 | 363 | ||||
Wachovia Bank Commercial Mortgage Trust, Ser 2003-C6, Cl A3 | ||||||
4.957%, 08/15/35 (B) | 193 | 197 | ||||
Wachovia Bank Commercial Mortgage Trust, Ser 2003-C7, Cl A1 | ||||||
4.241%, 10/15/35 (D) | 46 | 47 | ||||
Wachovia Bank Commercial Mortgage Trust, Ser 2003-C8, Cl A3 | ||||||
4.445%, 11/15/35 | 192 | 195 | ||||
Wachovia Bank Commercial Mortgage Trust, Ser 2004-C11, Cl A4 | ||||||
5.030%, 01/15/41 | 132 | 135 | ||||
WaMu Mortgage Pass Through Certificates, Cl A | ||||||
2.846%, 08/25/33 (B) | 91 | 90 | ||||
WaMu Mortgage Pass Through Certificates, Cl A7 | ||||||
2.842%, 08/25/33 (B) | 202 | 191 | ||||
2.824%, 10/25/33 (B) | 348 | 310 | ||||
| Description | Face Amount ($ Thousands) | Market Value ($ Thousands) | ||||
WaMu Mortgage Pass Through Certificates, Cl 2A10 | ||||||
16.786%, 06/25/33 (B) | $ | 80 | $ | 74 | ||
WaMu Mortgage Pass Through Certificates, Cl A2 | ||||||
4.243%, 06/25/34 (B) | 212 | 198 | ||||
WaMu Mortgage Pass Through Certificates, Cl 2A4 | ||||||
5.500%, 06/25/34 | 219 | 206 | ||||
WaMu Mortgage Pass Through Certificates, Cl 21A1 | ||||||
4.500%, 12/25/18 | 216 | 218 | ||||
WaMu Mortgage Pass Through Certificates, Cl 3A | ||||||
7.500%, 07/25/34 | 746 | 721 | ||||
WaMu Mortgage Pass Through Certificates, Cl A8 | ||||||
5.250%, 10/25/33 | 700 | 626 | ||||
WaMu Mortgage Pass Through Certificates, Cl 1A6 | ||||||
2.829%, 09/25/33 (B) | 324 | 317 | ||||
WaMu Mortgage Pass Through Certificates, Cl A1 | ||||||
3.120%, 06/25/34 (B) | 141 | 132 | ||||
2.753%, 01/25/35 (B) | 447 | 425 | ||||
WaMu Mortgage Pass Through Certificates, Ser 2004-CB2, Cl 7A | ||||||
5.500%, 08/25/19 | 305 | 305 | ||||
Wells Fargo Mortgage Backed Securities Trust, Cl A2 | ||||||
4.500%, 05/25/34 (B) | 132 | 131 | ||||
Wells Fargo Mortgage Backed Securities Trust, Cl 3A1 | ||||||
3.901%, 12/25/34 (B) | 177 | 173 | ||||
Wells Fargo Mortgage Backed Securities Trust, Cl 2A5 | ||||||
4.437%, 10/25/33 (B) | 220 | 222 | ||||
Wells Fargo Mortgage Backed Securities Trust, Cl A6 | ||||||
3.246%, 02/25/33 (B) | 222 | 224 | ||||
Wells Fargo Mortgage Backed Securities Trust, Cl 2A2 | ||||||
3.091%, 12/25/34 (B) | 370 | 353 | ||||
Wells Fargo Mortgage Backed Securities Trust, Cl 2A1 | ||||||
3.206%, 06/25/35 (B) | 308 | 286 | ||||
3.091%, 12/25/34 (B) | 370 | 360 | ||||
3.063%, 09/25/34 (B) | 176 | 164 | ||||
Wells Fargo Mortgage Backed Securities Trust, Cl 1A2 | ||||||
3.170%, 10/25/34 (B) | 373 | 355 | ||||
Wells Fargo Mortgage Backed Securities Trust, Cl A8 | ||||||
4.858%, 05/25/34 (B) | 250 | 244 | ||||
| 70 | SEI Institutional Managed Trust / Semi-Annual Report / March 31, 2010 |
Table of Contents
| Description | Face Amount ($ Thousands) | Market Value ($ Thousands) | ||||
Wells Fargo Mortgage Backed Securities Trust, Cl 1A1 | ||||||
4.750%, 12/25/18 | $ | 561 | $ | 569 | ||
4.472%, 11/25/33 (B) | 330 | 332 | ||||
3.365%, 07/25/34 (B) | 308 | 286 | ||||
3.172%, 10/25/34 (B) | 187 | 182 | ||||
Wells Fargo Mortgage-Backed Securities Trust, Ser 2004-H, Cl 1A1 | ||||||
4.531%, 06/25/34 (B) | 778 | 756 | ||||
| 105,518 | ||||||
Total Mortgage-Backed Securities | 438,702 | |||||
CORPORATE OBLIGATIONS — 20.1% | ||||||
Consumer Discretionary — 0.7% | ||||||
British Sky Broadcasting Group | ||||||
9.500%, 11/15/18 (D) | 378 | 486 | ||||
CBS | ||||||
5.750%, 04/15/20 | 25 | 25 | ||||
Comcast | ||||||
6.400%, 03/01/40 | 335 | 341 | ||||
5.850%, 11/15/15 | 465 | 510 | ||||
5.150%, 03/01/20 | 490 | 494 | ||||
Comcast Cable Communications | ||||||
8.375%, 03/15/13 | 567 | 657 | ||||
COX Communications | ||||||
5.450%, 12/15/14 | 70 | 76 | ||||
Daimler Finance LLC | ||||||
7.300%, 01/15/12 | 170 | 185 | ||||
6.500%, 11/15/13 | 80 | 89 | ||||
Grupo Televisa | ||||||
6.625%, 01/15/40 | 490 | 489 | ||||
Historic TW | ||||||
9.150%, 02/01/23 | 200 | 260 | ||||
Lowe’s MTN | ||||||
7.110%, 05/15/37 | 110 | 130 | ||||
News America | ||||||
7.300%, 04/30/28 | 100 | 107 | ||||
7.250%, 05/18/18 | 50 | 58 | ||||
Staples | ||||||
9.750%, 01/15/14 | 80 | 97 | ||||
TCI Communications | ||||||
8.750%, 08/01/15 | 210 | 255 | ||||
7.125%, 02/15/28 | 200 | 212 | ||||
Thomson Reuters | ||||||
5.950%, 07/15/13 | 278 | 307 | ||||
4.700%, 10/15/19 | 75 | 75 | ||||
Time Warner Cable | ||||||
8.250%, 04/01/19 | 200 | 242 | ||||
7.300%, 07/01/38 (E) | 110 | 122 | ||||
6.750%, 07/01/18 | 400 | 447 | ||||
| Description | Face Amount ($ Thousands) | Market Value ($ Thousands) | ||||
Viacom | ||||||
6.250%, 04/30/16 | $ | 100 | $ | 111 | ||
| 5,775 | ||||||
Consumer Staples — 0.8% | ||||||
Altria Group | ||||||
10.200%, 02/06/39 | 170 | 228 | ||||
9.700%, 11/10/18 | 800 | 985 | ||||
Anheuser-Busch InBev Worldwide | ||||||
7.750%, 01/15/19 (D) | 274 | 326 | ||||
7.200%, 01/15/14 (D) (E) | 120 | 137 | ||||
4.125%, 01/15/15 | 895 | 921 | ||||
Bunge Finance | ||||||
8.500%, 06/15/19 | 120 | 139 | ||||
Cargill | ||||||
7.350%, 03/06/19 (D) | 250 | 293 | ||||
Diageo Capital | ||||||
7.375%, 01/15/14 | 90 | 105 | ||||
Diageo Finance BV | ||||||
5.500%, 04/01/13 | 90 | 98 | ||||
General Mills | ||||||
5.250%, 08/15/13 | 90 | 98 | ||||
Kraft Foods | ||||||
6.500%, 02/09/40 | 565 | 586 | ||||
6.125%, 08/23/18 | 225 | 245 | ||||
5.375%, 02/10/20 | 1,876 | 1,907 | ||||
PepsiCo | ||||||
7.900%, 11/01/18 | 50 | 62 | ||||
5.500%, 01/15/40 | 605 | 599 | ||||
SABMiller | ||||||
5.500%, 08/15/13 (D) | 90 | 97 | ||||
Wal-Mart Stores | ||||||
5.625%, 04/01/40 | 510 | 508 | ||||
| 7,334 | ||||||
Energy — 1.6% | ||||||
Anadarko Petroleum | ||||||
7.625%, 03/15/14 | 180 | 207 | ||||
6.450%, 09/15/36 | 515 | 525 | ||||
Baker Hughes | ||||||
7.500%, 11/15/18 | 205 | 245 | ||||
Cenovus Energy | ||||||
5.700%, 10/15/19 (D) | 55 | 58 | ||||
CenterPoint Energy Resources | ||||||
5.950%, 01/15/14 | 70 | 75 | ||||
ConocoPhillips | ||||||
6.000%, 01/15/20 (E) | 100 | 111 | ||||
EnCana | ||||||
6.500%, 05/15/19 | 150 | 167 | ||||
Energy Transfer Partners | ||||||
9.000%, 04/15/19 | 525 | 645 | ||||
8.500%, 04/15/14 | 211 | 245 | ||||
Halliburton | ||||||
6.150%, 09/15/19 | 80 | 90 | ||||
| SEI Institutional Managed Trust / Semi-Annual Report / March 31, 2010 | 71 |
Table of Contents
SCHEDULE OF INVESTMENTS (Unaudited)
U.S. Fixed Income Fund (Continued)
March 31, 2010
| Description | Face Amount ($ Thousands) | Market Value ($ Thousands) | ||||
Husky Energy | ||||||
7.250%, 12/15/19 | $ | 319 | $ | 370 | ||
5.900%, 06/15/14 | 278 | 303 | ||||
Marathon Oil | ||||||
7.500%, 02/15/19 (E) | 100 | 117 | ||||
Petrobras International Finance | ||||||
7.875%, 03/15/19 | 316 | 369 | ||||
6.875%, 01/20/40 | 315 | 325 | ||||
Petro-Canada | ||||||
6.050%, 05/15/18 | 115 | 124 | ||||
Ras Laffan Liquefied Natural Gas III | ||||||
5.500%, 09/30/14 (D) | 500 | 537 | ||||
4.500%, 09/30/12 (D) | 270 | 283 | ||||
Rockies Express Pipeline | ||||||
5.625%, 04/15/20 (D) | 600 | 591 | ||||
3.900%, 04/15/15 (D) | 505 | 498 | ||||
Shell International Finance BV | ||||||
4.300%, 09/22/19 | 300 | 296 | ||||
Southern Union | ||||||
8.250%, 11/15/29 | 1,200 | 1,370 | ||||
Spectra Energy Capital | ||||||
8.000%, 10/01/19 | 200 | 236 | ||||
Suncor Energy | ||||||
6.500%, 06/15/38 | 395 | 412 | ||||
Talisman Energy | ||||||
7.750%, 06/01/19 | 100 | 119 | ||||
Tosco | ||||||
7.800%, 01/01/27 | 65 | 77 | ||||
Total Capital | ||||||
3.125%, 10/02/15 | 650 | 646 | ||||
TransCanada Pipelines | ||||||
6.500%, 08/15/18 | 175 | 198 | ||||
Union Pacific Resources Group | ||||||
7.150%, 05/15/28 | 52 | 57 | ||||
Valero Energy | ||||||
9.375%, 03/15/19 | 489 | 582 | ||||
6.625%, 06/15/37 | 1,935 | 1,840 | ||||
Williams | ||||||
7.875%, 09/01/21 | 1,022 | 1,203 | ||||
7.750%, 06/15/31 | 550 | 617 | ||||
Williams Partners | ||||||
6.300%, 04/15/40 (D) | 480 | 477 | ||||
3.800%, 02/15/15 (D) | 245 | 245 | ||||
XTO Energy | ||||||
6.750%, 08/01/37 | 180 | 211 | ||||
6.250%, 08/01/17 | 100 | 114 | ||||
4.625%, 06/15/13 | 30 | 32 | ||||
| 14,617 | ||||||
Financials — 11.6% | ||||||
Achmea Hypotheekbank | ||||||
3.200%, 11/03/14 (D) | 1,190 | 1,205 | ||||
Allstate | ||||||
5.000%, 08/15/14 | 70 | 75 | ||||
| Description | Face Amount ($ Thousands) | Market Value ($ Thousands) | ||||
Allstate Life Global Funding Trusts MTN | ||||||
5.375%, 04/30/13 (E) | $ | 610 | $ | 665 | ||
American Express | ||||||
7.250%, 05/20/14 | 412 | 467 | ||||
7.000%, 03/19/18 (E) | 170 | 193 | ||||
American Express Credit MTN | ||||||
7.300%, 08/20/13 | 680 | 763 | ||||
ANZ National International | ||||||
2.375%, 12/21/12 (D) | 100 | 100 | ||||
Associates Corp of North America | ||||||
6.950%, 11/01/18 | 200 | 211 | ||||
AvalonBay Communities MTN | ||||||
5.700%, 03/15/17‡ | 1,300 | 1,370 | ||||
Bank of America MTN | ||||||
7.625%, 06/01/19 | 310 | 354 | ||||
7.375%, 05/15/14 | 1,130 | 1,271 | ||||
6.500%, 08/01/16 | 500 | 540 | ||||
6.100%, 06/15/17 | 1,875 | 1,930 | ||||
6.000%, 09/01/17 | 360 | 374 | ||||
5.750%, 12/01/17 | 160 | 164 | ||||
5.650%, 05/01/18 | 1,370 | 1,386 | ||||
4.500%, 04/01/15 | 692 | 698 | ||||
Bank of New York Mellon MTN | ||||||
4.600%, 01/15/20 | 40 | 40 | ||||
Bank of Nova Scotia | ||||||
3.400%, 01/22/15 | 94 | 95 | ||||
Bank of Tokyo-Mitsubishi UFJ | ||||||
3.850%, 01/22/15 (D) (E) | 100 | 101 | ||||
Barclays Bank | ||||||
5.200%, 07/10/14 | 150 | 160 | ||||
5.125%, 01/08/20 | 490 | 483 | ||||
5.000%, 09/22/16 | 1,885 | 1,938 | ||||
2.500%, 01/23/13 | 150 | 150 | ||||
BB&T | ||||||
4.900%, 06/30/17 | 200 | 199 | ||||
3.850%, 07/27/12 | 150 | 156 | ||||
3.375%, 09/25/13 | 195 | 199 | ||||
Bear Stearns | ||||||
7.250%, 02/01/18 | 1,500 | 1,734 | ||||
6.950%, 08/10/12 | 275 | 305 | ||||
Berkshire Hathaway Finance | ||||||
5.400%, 05/15/18 (E) | 110 | 117 | ||||
BlackRock | ||||||
6.250%, 09/15/17 | 75 | 83 | ||||
Capital One Bank USA | ||||||
8.800%, 07/15/19 | 325 | 393 | ||||
Capital One Financial | ||||||
7.375%, 05/23/14 | 225 | 257 | ||||
6.750%, 09/15/17 | 70 | 78 | ||||
Caterpillar Financial Services MTN | ||||||
7.150%, 02/15/19 | 110 | 129 | ||||
5.850%, 09/01/17 | 140 | 152 | ||||
| 72 | SEI Institutional Managed Trust / Semi-Annual Report / March 31, 2010 |
Table of Contents
| Description | Face Amount ($ Thousands) | Market Value ($ Thousands) | ||||
Chase Capital II | ||||||
0.749%, 02/01/27 (B) | $ | 560 | $ | 437 | ||
Citigroup | ||||||
8.500%, 05/22/19 | 364 | 425 | ||||
8.125%, 07/15/39 | 2,861 | 3,303 | ||||
6.500%, 08/19/13 | 250 | 270 | ||||
6.375%, 08/12/14 | 530 | 566 | ||||
6.125%, 05/15/18 | 455 | 465 | ||||
6.125%, 08/25/36 | 1,200 | 1,047 | ||||
5.500%, 10/15/14 | 325 | 336 | ||||
1.029%, 12/09/11 (B) | 885 | 898 | ||||
Citigroup Funding | ||||||
1.875%, 10/22/12 | 915 | 922 | ||||
City National Capital Trust I | ||||||
9.625%, 02/01/40 | 1,300 | 1,444 | ||||
Commonwealth Bank of Australia | ||||||
5.000%, 03/19/20 (D) | 430 | 427 | ||||
5.000%, 10/15/19 (D) | 495 | 497 | ||||
3.750%, 10/15/14 (D) | 490 | 497 | ||||
Credit Suisse NY | ||||||
6.000%, 02/15/18 | 470 | 498 | ||||
5.400%, 01/14/20 | 415 | 418 | ||||
5.300%, 08/13/19 | 1,685 | 1,728 | ||||
Credit Suisse USA | ||||||
5.125%, 08/15/15 | 1,250 | 1,339 | ||||
Deutsche Bank | ||||||
3.875%, 08/18/14 | 100 | 102 | ||||
2.375%, 01/11/13 | 1,355 | 1,357 | ||||
Discover Financial Services | ||||||
6.450%, 06/12/17 | 250 | 246 | ||||
ERP Operating | ||||||
5.750%, 06/15/17‡ | 125 | 129 | ||||
5.125%, 03/15/16‡ | 830 | 854 | ||||
Export-Import Bank of Korea | ||||||
5.875%, 01/14/15 | 600 | 647 | ||||
5.500%, 10/17/12 | 333 | 355 | ||||
Farmers Exchange Capital | ||||||
7.200%, 07/15/48 (D) | 1,721 | 1,488 | ||||
7.050%, 07/15/28 (D) | 480 | 442 | ||||
General Electric Capital MTN | ||||||
6.750%, 03/15/32 | 1,665 | 1,762 | ||||
6.000%, 08/07/19 | 545 | 576 | ||||
5.900%, 05/13/14 | 850 | 935 | ||||
5.625%, 09/15/17 | 700 | 738 | ||||
5.500%, 01/08/20 (E) | 180 | 184 | ||||
5.400%, 02/15/17 | 200 | 209 | ||||
1.151%, 05/22/13 (B) | 760 | 758 | ||||
0.369%, 04/10/12 (B) | 500 | 493 | ||||
Goldman Sachs Capital II | ||||||
5.793%, 12/29/49 (B) (E) | 804 | 681 | ||||
Goldman Sachs Group MTN | ||||||
7.500%, 02/15/19 | 125 | 143 | ||||
6.750%, 10/01/37 | 490 | 489 | ||||
| Description | Face Amount ($ Thousands) | Market Value ($ Thousands) | ||||
6.250%, 09/01/17 | $ | 650 | $ | 700 | ||
6.150%, 04/01/18 (E) | 250 | 265 | ||||
6.000%, 05/01/14 (E) | 2,800 | 3,066 | ||||
5.375%, 03/15/20 | 950 | 941 | ||||
3.625%, 08/01/12 (E) | 140 | 145 | ||||
1.029%, 12/05/11 (B) | 2,030 | 2,058 | ||||
Guardian Life Insurance of America | ||||||
7.375%, 09/30/39 (D) | 1,250 | 1,338 | ||||
Hartford Financial Services Group | ||||||
5.500%, 03/30/20 | 390 | 384 | ||||
HCP MTN | ||||||
6.700%, 01/30/18‡ | 199 | 203 | ||||
6.300%, 09/15/16‡ | 546 | 555 | ||||
6.000%, 01/30/17‡ | 114 | 114 | ||||
5.950%, 09/15/11‡ | 1,155 | 1,205 | ||||
5.650%, 12/15/13‡ | 556 | 581 | ||||
Health Care | ||||||
6.125%, 04/15/20‡ | 1,775 | 1,781 | ||||
Healthcare Realty Trust | ||||||
6.500%, 01/17/17‡ | 1,400 | 1,436 | ||||
HRPT Properties Trust | ||||||
6.250%, 08/15/16‡ | 100 | 100 | ||||
HSBC Bank USA NY | ||||||
4.625%, 04/01/14 | 175 | 183 | ||||
HSBC Finance | ||||||
5.500%, 01/19/16 | 140 | 147 | ||||
4.750%, 07/15/13 | 160 | 168 | ||||
HSBC Holdings PLC | �� | |||||
6.800%, 06/01/38 | 340 | 365 | ||||
International Lease Finance MTN | ||||||
5.250%, 01/10/13 | 100 | 95 | ||||
Jackson National Life Global Funding MTN | ||||||
5.375%, 05/08/13 (D) | 200 | 214 | ||||
Jefferies Group | ||||||
6.450%, 06/08/27 | 160 | 143 | ||||
6.250%, 01/15/36 | 120 | 102 | ||||
John Deere Capital MTN | ||||||
5.750%, 09/10/18 | 100 | 109 | ||||
JPMorgan Chase Capital XIII | ||||||
1.239%, 09/30/34 (B) | 500 | 390 | ||||
JPMorgan Chase | ||||||
4.950%, 03/25/20 | 500 | 496 | ||||
3.700%, 01/20/15 | 425 | 428 | ||||
JPMorgan Chase Bank | ||||||
6.000%, 10/01/17 | 1,634 | 1,742 | ||||
JPMorgan Chase Capital XV | ||||||
5.875%, 03/15/35 | 1,645 | 1,497 | ||||
JPMorgan Chase Capital XXV | ||||||
6.800%, 10/01/37 | 531 | 530 | ||||
KeyBank | ||||||
5.800%, 07/01/14 | 250 | 256 | ||||
Korea Development Bank | ||||||
4.375%, 08/10/15 (E) | 625 | 634 | ||||
| SEI Institutional Managed Trust / Semi-Annual Report / March 31, 2010 | 73 |
Table of Contents
SCHEDULE OF INVESTMENTS (Unaudited)
U.S. Fixed Income Fund (Continued)
March 31, 2010
| Description | Face Amount ($ Thousands) | Market Value ($ Thousands) | ||||
Lazard Group | ||||||
7.125%, 05/15/15 | $ | 778 | $ | 817 | ||
6.850%, 06/15/17 | 769 | 783 | ||||
Liberty Mutual Group | ||||||
7.500%, 08/15/36 (D) | 349 | 337 | ||||
M&T Bank | ||||||
5.375%, 05/24/12 | 80 | 85 | ||||
Mack-Cali Realty | ||||||
7.750%, 08/15/19‡ | 180 | 198 | ||||
Macquarie Group | ||||||
7.300%, 08/01/14 | 1,475 | 1,647 | ||||
Merrill Lynch | ||||||
6.875%, 04/25/18 (E) | 100 | 108 | ||||
6.400%, 08/28/17 | 150 | 158 | ||||
6.150%, 04/25/13 | 140 | 151 | ||||
6.110%, 01/29/37 | 1,405 | 1,293 | ||||
6.050%, 05/16/16 | 920 | 938 | ||||
MetLife | ||||||
6.400%, 12/15/36 | 695 | 622 | ||||
Metropolitan Life Global Funding I | ||||||
2.875%, 09/17/12 (D) | 200 | 203 | ||||
2.500%, 01/11/13 (D) | 110 | 110 | ||||
Monumental Global Funding | ||||||
5.500%, 04/22/13 (D) | 65 | 69 | ||||
Morgan Stanley | ||||||
7.250%, 04/01/32 | 245 | 279 | ||||
6.625%, 04/01/18 | 1,770 | 1,888 | ||||
6.250%, 08/28/17 | 200 | 210 | ||||
5.950%, 12/28/17 | 297 | 305 | ||||
5.750%, 08/31/12 | 180 | 193 | ||||
5.625%, 09/23/19 | 150 | 150 | ||||
5.550%, 04/27/17 | 100 | 102 | ||||
5.500%, 01/26/20 | 1,225 | 1,198 | ||||
5.450%, 01/09/17 | 470 | 477 | ||||
4.750%, 04/01/14 | 620 | 633 | ||||
4.200%, 11/20/14 (E) | 156 | 156 | ||||
0.621%, 06/20/12 (B) | 2,385 | 2,404 | ||||
0.501%, 01/18/11 (B) | 325 | 325 | ||||
National Australia Bank | ||||||
3.750%, 03/02/15 (D) (E) | 120 | 120 | ||||
2.500%, 01/08/13 (D) | 150 | 150 | ||||
National City | ||||||
4.900%, 01/15/15 | 200 | 209 | ||||
National City Bank | ||||||
0.622%, 06/07/17 (B) | 1,300 | 1,158 | ||||
National Rural Utilities Cooperative Finance | ||||||
2.625%, 09/16/12 | 25 | 25 | ||||
New York Life Global Funding | ||||||
4.650%, 05/09/13 (D) | 150 | 161 | ||||
NIBC Bank MTN | ||||||
2.800%, 12/02/14 (D) | 825 | 821 | ||||
Nomura Holdings | ||||||
6.700%, 03/04/20 | 115 | 119 | ||||
| Description | Face Amount ($ Thousands) | Market Value ($ Thousands) | ||||
Nordea Bank | ||||||
3.700%, 11/13/14 (D) (E) | $ | 540 | $ | 544 | ||
2.500%, 11/13/12 (D) | 465 | 469 | ||||
Northern Trust | ||||||
5.500%, 08/15/13 | 200 | 221 | ||||
Pacific Life Global Funding | ||||||
5.150%, 04/15/13 (D) | 100 | 105 | ||||
Pipeline Funding | ||||||
7.500%, 01/15/30 (D) | 1,500 | 1,433 | ||||
PNC Funding | ||||||
5.125%, 02/08/20 | 40 | 40 | ||||
Power Receivables Financial | ||||||
6.290%, 01/01/12 (D) | 137 | 141 | ||||
Principal Life Income Funding Trusts MTN | ||||||
5.300%, 04/24/13 | 125 | 134 | ||||
5.300%, 12/14/12 | 125 | 135 | ||||
5.100%, 04/15/14 | 225 | 236 | ||||
Private Export Funding | ||||||
3.050%, 10/15/14 | 215 | 218 | ||||
Prudential Holdings | ||||||
8.695%, 12/18/23 (D) | 1,200 | 1,382 | ||||
1.136%, 12/18/17 (B) (D) | 750 | 635 | ||||
Rabobank Nederland MTN | ||||||
3.200%, 03/11/15 (D) | 200 | 198 | ||||
Simon Property Group | ||||||
10.350%, 04/01/19‡ | 130 | 163 | ||||
6.750%, 05/15/14‡ | 50 | 55 | ||||
5.650%, 02/01/20‡ (E) | 38 | 37 | ||||
Standard Chartered Bank | ||||||
6.400%, 09/26/17 (D) | 715 | 758 | ||||
Svensk Exportkredit | ||||||
3.250%, 09/16/14 | 1,137 | 1,162 | ||||
Travelers Property Casualty | ||||||
7.750%, 04/15/26 | 100 | 113 | ||||
UBS | ||||||
5.875%, 12/20/17 | 120 | 124 | ||||
US Bancorp MTN | ||||||
2.875%, 11/20/14 | 138 | 136 | ||||
Wachovia | ||||||
5.750%, 06/15/17 (E) | 485 | 517 | ||||
Wachovia Bank MTN | ||||||
0.587%, 03/15/16 (B) | 400 | 368 | ||||
WEA Finance | ||||||
7.500%, 06/02/14 (D) | 1,477 | 1,653 | ||||
7.125%, 04/15/18 (D) | 751 | 812 | ||||
6.750%, 09/02/19 (D) | 300 | 320 | ||||
Wells Fargo | ||||||
5.625%, 12/11/17 (E) | 180 | 191 | ||||
3.750%, 10/01/14 | 390 | 395 | ||||
Westfield Group | ||||||
5.400%, 10/01/12 (D) | 434 | 460 | ||||
| 74 | SEI Institutional Managed Trust / Semi-Annual Report / March 31, 2010 |
Table of Contents
| Description | Face Amount ($ Thousands) | Market Value ($ Thousands) | ||||
Westpac Banking | ||||||
4.875%, 11/19/19 (E) | $ | 510 | $ | 507 | ||
2.250%, 11/19/12 | 830 | 836 | ||||
ZFS Finance USA Trust I | ||||||
5.875%, 05/09/32 (B) (D) | 1,750 | 1,644 | ||||
| 103,755 | ||||||
Government — 0.2% | ||||||
Banco Nacional de Desenvolvimento Economico e Social | ||||||
5.500%, 07/12/20 | 620 | 614 | ||||
Mexico Government International Bond MTN | ||||||
6.375%, 01/16/13 | 200 | 222 | ||||
Province of Ontario Canada | ||||||
2.950%, 02/05/15 | 240 | 241 | ||||
Qatar Govt International Bond | ||||||
6.400%, 01/20/40 (D) | 310 | 324 | ||||
4.000%, 01/20/15 (D) | 195 | 198 | ||||
South Africa Government International Bond | ||||||
5.500%, 03/09/20 | 465 | 471 | ||||
| 2,070 | ||||||
Health Care — 0.7% | ||||||
Aetna | ||||||
6.000%, 06/15/16 | 1,570 | 1,721 | ||||
Amgen | ||||||
5.750%, 03/15/40 | 567 | 562 | ||||
4.500%, 03/15/20 | 22 | 22 | ||||
Bristol-Myers Squibb | ||||||
5.450%, 05/01/18 | 245 | 263 | ||||
CareFusion | ||||||
4.125%, 08/01/12 | 275 | 287 | ||||
Coventry Health Care | ||||||
5.950%, 03/15/17 | 541 | 516 | ||||
Hospira | ||||||
5.550%, 03/30/12 | 100 | 106 | ||||
Life Technologies | ||||||
6.000%, 03/01/20 | 650 | 666 | ||||
4.400%, 03/01/15 | 350 | 352 | ||||
Pfizer | ||||||
5.350%, 03/15/15 | 644 | 710 | ||||
Pharmacia | ||||||
6.500%, 12/01/18 | 120 | 136 | ||||
UnitedHealth Group | ||||||
6.875%, 02/15/38 | 584 | 620 | ||||
| 5,961 | ||||||
Industrials — 0.7% | ||||||
Browning-Ferris Industries | ||||||
9.250%, 05/01/21 | 45 | 55 | ||||
Burlington Northern Santa Fe | ||||||
7.290%, 06/01/36 | 90 | 103 | ||||
| Description | Face Amount ($ Thousands) | Market Value ($ Thousands) | ||||
5.750%, 03/15/18 | $ | 440 | $ | 471 | ||
4.700%, 10/01/19 | 75 | 74 | ||||
Canadian National Railway | ||||||
5.850%, 11/15/17 | 50 | 55 | ||||
Continental Airlines 2000-1 Class A-1 Pass Through Trust | ||||||
8.048%, 11/01/20 | 438 | 444 | ||||
Continental Airlines 2009-2 Class A Pass Through Trust | ||||||
7.250%, 11/10/19 | 500 | 535 | ||||
CSX | ||||||
6.250%, 03/15/18 (E) | 155 | 168 | ||||
Delta Air Lines | ||||||
7.750%, 12/17/19 | 1,400 | 1,470 | ||||
Hutchison Whampoa International 09 | ||||||
4.625%, 09/11/15 (D) | 1,260 | 1,295 | ||||
JetBlue Airways 2004-1 G-1 Pass Through Trust | ||||||
0.632%, 12/15/13 (B) | 656 | 577 | ||||
Lockheed Martin | ||||||
8.500%, 12/01/29 | 61 | 79 | ||||
Northwest Airlines | ||||||
1.001%, 05/20/14 (B) | 828 | 712 | ||||
Tyco International Finance | ||||||
8.500%, 01/15/19 | 50 | 62 | ||||
Union Pacific | ||||||
7.000%, 02/01/16 | 150 | 174 | ||||
United Parcel Service of America | ||||||
8.375%, 04/01/20 | 50 | 65 | ||||
United Technologies | ||||||
8.875%, 11/15/19 | 110 | 142 | ||||
| 6,481 | ||||||
Information Technology — 0.4% | ||||||
Adobe Systems | ||||||
4.750%, 02/01/20 | 405 | 398 | ||||
3.250%, 02/01/15 | 330 | 331 | ||||
Arrow Electronics | ||||||
6.875%, 07/01/13 | 25 | 28 | ||||
6.875%, 06/01/18 | 95 | 101 | ||||
Cisco Systems | ||||||
5.900%, 02/15/39 | 150 | 152 | ||||
5.500%, 01/15/40 | 620 | 595 | ||||
4.450%, 01/15/20 | 735 | 731 | ||||
Dell | ||||||
5.650%, 04/15/18 | 90 | 95 | ||||
Hewlett-Packard | ||||||
4.750%, 06/02/14 | 61 | 66 | ||||
International Business Machines | ||||||
8.000%, 10/15/38 | 100 | 131 | ||||
Intuit | ||||||
5.750%, 03/15/17 | 75 | 79 | ||||
Oracle | ||||||
5.000%, 07/08/19 | 200 | 210 | ||||
| SEI Institutional Managed Trust / Semi-Annual Report / March 31, 2010 | 75 |
Table of Contents
SCHEDULE OF INVESTMENTS (Unaudited)
U.S. Fixed Income Fund (Continued)
March 31, 2010
| Description | Face Amount ($ Thousands) | Market Value ($ Thousands) | ||||
Xerox | ||||||
8.250%, 05/15/14 | $ | 90 | $ | 104 | ||
| 3,021 | ||||||
Materials — 0.4% | ||||||
BHP Billiton Finance USA | ||||||
6.500%, 04/01/19 | 125 | 143 | ||||
Dow Chemical | ||||||
8.550%, 05/15/19 | 588 | 711 | ||||
5.900%, 02/15/15 | 300 | 325 | ||||
4.850%, 08/15/12 | 770 | 814 | ||||
PPG Industries | ||||||
9.000%, 05/01/21 | 145 | 176 | ||||
Rio Tinto Finance USA | ||||||
9.000%, 05/01/19 | 412 | 529 | ||||
5.875%, 07/15/13 | 457 | 502 | ||||
Vale Overseas | ||||||
6.875%, 11/10/39 | 495 | 513 | ||||
| 3,713 | ||||||
Sovereign — 0.2% | ||||||
Province of Manitoba Canada | ||||||
2.125%, 04/22/13 | 46 | 47 | ||||
Province of Ontario Canada | ||||||
4.100%, 06/16/14 | 904 | 966 | ||||
Republic of Korea | ||||||
7.125%, 04/16/19 | 352 | 412 | ||||
Societe Financement de l’Economie Francaise | ||||||
2.875%, 09/22/14 (D) | 540 | 543 | ||||
Tennessee Valley Authority | ||||||
5.250%, 09/15/39 | 40 | 39 | ||||
| 2,007 | ||||||
Telecommunication Services — 1.0% | ||||||
America Movil | ||||||
6.125%, 03/30/40 (D) | 320 | 313 | ||||
5.000%, 03/30/20 (D) | 150 | 148 | ||||
5.000%, 10/16/19 (D) | 475 | 470 | ||||
3.625%, 03/30/15 (D) | 395 | 396 | ||||
AT&T | ||||||
8.000%, 11/15/31 | 370 | 450 | ||||
5.875%, 02/01/12 | 200 | 214 | ||||
5.500%, 02/01/18 (E) | 100 | 106 | ||||
BellSouth | ||||||
6.000%, 11/15/34 | 850 | 821 | ||||
BellSouth Telecommunications | ||||||
6.300%, 12/15/15 | 175 | 185 | ||||
British Telecommunications | ||||||
9.875%, 06/15/10 (A) | 178 | 224 | ||||
5.950%, 01/15/18 | 200 | 205 | ||||
| Description | Face Amount ($ Thousands) | Market Value ($ Thousands) | ||||
Cellco Partnership | ||||||
8.500%, 11/15/18 | $ | 305 | $ | 381 | ||
7.375%, 11/15/13 | 927 | 1,072 | ||||
Deutsche Telekom International Finance BV | ||||||
6.000%, 07/08/19 | 175 | 188 | ||||
France Telecom | ||||||
7.750%, 03/01/11 | 321 | 341 | ||||
GTE | ||||||
8.750%, 11/01/21 | 300 | 370 | ||||
Qwest | ||||||
7.875%, 09/01/11 | 640 | 678 | ||||
7.500%, 10/01/14 | 444 | 485 | ||||
Rogers Communications | ||||||
6.375%, 03/01/14 | 874 | 970 | ||||
5.500%, 03/15/14 | 119 | 128 | ||||
Telecom Italia Capital | ||||||
6.999%, 06/04/18 (E) | 150 | 162 | ||||
Telefonica Emisiones | ||||||
5.984%, 06/20/11 | 345 | 363 | ||||
Verizon Communications | ||||||
8.950%, 03/01/39 | 50 | 68 | ||||
5.850%, 09/15/35 | 40 | 39 | ||||
Verizon Global Funding | ||||||
7.750%, 12/01/30 | 175 | 208 | ||||
Vodafone Group | ||||||
5.450%, 06/10/19 | 75 | 78 | ||||
| 9,063 | ||||||
Utilities — 1.8% | ||||||
AGL Capital | ||||||
5.250%, 08/15/19 | 50 | 51 | ||||
4.450%, 04/15/13 | 120 | 125 | ||||
Appalachian Power | ||||||
5.950%, 05/15/33 | 100 | 98 | ||||
Aquila | ||||||
11.875%, 07/01/12 | 1,210 | 1,408 | ||||
Carolina Power & Light | ||||||
5.300%, 01/15/19 | 175 | 184 | ||||
Cleveland Electric Illuminating | ||||||
7.880%, 11/01/17 | 170 | 201 | ||||
Consumers Energy | ||||||
6.700%, 09/15/19 | 100 | 113 | ||||
Dominion Resources | ||||||
8.875%, 01/15/19 | 1,095 | 1,381 | ||||
6.400%, 06/15/18 | 180 | 201 | ||||
DPL | ||||||
6.875%, 09/01/11 | 637 | 681 | ||||
Duke Energy | ||||||
6.300%, 02/01/14 | 472 | 526 | ||||
Enel Finance International | ||||||
6.000%, 10/07/39 (D) | 350 | 333 | ||||
5.125%, 10/07/19 (D) | 100 | 99 | ||||
| 76 | SEI Institutional Managed Trust / Semi-Annual Report / March 31, 2010 |
Table of Contents
| Description | Face Amount ($ Thousands) | Market Value ($ Thousands) | ||||
Exelon Generation | ||||||
6.250%, 10/01/39 | $ | 155 | $ | 157 | ||
5.200%, 10/01/19 | 150 | 151 | ||||
FirstEnergy Solutions | ||||||
6.800%, 08/15/39 | 150 | 147 | ||||
6.050%, 08/15/21 | 640 | 641 | ||||
4.800%, 02/15/15 | 175 | 179 | ||||
FPL Group Capital | ||||||
5.350%, 06/15/13 | 280 | 302 | ||||
Georgia Power | ||||||
6.000%, 11/01/13 | 205 | 231 | ||||
Jersey Central Power & Light | ||||||
7.350%, 02/01/19 | 100 | 116 | ||||
Massachusetts Electric | ||||||
5.900%, 11/15/39 (D) | 55 | 56 | ||||
MidAmerican Energy | ||||||
5.300%, 03/15/18 | 200 | 208 | ||||
Midamerican Energy Holdings | ||||||
5.750%, 04/01/18 | 615 | 651 | ||||
Nevada Power | ||||||
7.125%, 03/15/19 | 110 | 124 | ||||
Nevada Power, Ser A | ||||||
8.250%, 06/01/11 | 1,040 | 1,116 | ||||
Niagara Mohawk Power | ||||||
4.881%, 08/15/19 (D) | 80 | 79 | ||||
Nisource Finance | ||||||
10.750%, 03/15/16 | 100 | 127 | ||||
6.125%, 03/01/22 | 1,400 | 1,461 | ||||
Northern States Power | ||||||
6.250%, 06/01/36 | 100 | 108 | ||||
5.350%, 11/01/39 | 19 | 18 | ||||
Oncor Electric Delivery | ||||||
6.800%, 09/01/18 | 460 | 517 | ||||
Pacific Gas & Electric | ||||||
8.250%, 10/15/18 | 60 | 73 | ||||
5.400%, 01/15/40 | 42 | 39 | ||||
Pacificorp | ||||||
6.250%, 10/15/37 | 90 | 96 | ||||
5.650%, 07/15/18 | 175 | 189 | ||||
Panhandle Eastern Pipeline | ||||||
6.200%, 11/01/17 | 625 | 664 | ||||
Progress Energy | ||||||
6.850%, 04/15/12 | 289 | 315 | ||||
PSEG Power | ||||||
5.500%, 12/01/15 | 100 | 108 | ||||
5.320%, 09/15/16 (D) | 40 | 42 | ||||
5.125%, 04/15/20 (D) | 45 | 45 | ||||
Public Service Electric & Gas MTN | ||||||
5.375%, 11/01/39 | 28 | 27 | ||||
Public Service of Oklahoma | ||||||
5.150%, 12/01/19 | 33 | 33 | ||||
Sempra Energy | ||||||
8.900%, 11/15/13 | 180 | 215 | ||||
6.000%, 10/15/39 | 50 | 49 | ||||
| Description | Face Amount ($ Thousands) | Market Value ($ Thousands) | ||||
Southern California Edison | ||||||
5.500%, 03/15/40 | $ | 50 | $ | 49 | ||
Southwestern Public Service | ||||||
8.750%, 12/01/18 | 90 | 112 | ||||
Texas-New Mexico Power | ||||||
9.500%, 04/01/19 (D) | 1,290 | 1,572 | ||||
Virginia Electric and Power | ||||||
5.400%, 04/30/18 | 545 | 578 | ||||
| 15,996 | ||||||
Total Corporate Obligations | 179,793 | |||||
ASSET-BACKED SECURITIES — 5.2% | ||||||
Automotive — 0.3% | ||||||
Ally Auto Receivables Trust, Cl A3 | ||||||
2.330%, 06/17/13 (D) | 100 | 102 | ||||
1.450%, 05/15/14 | 100 | 100 | ||||
AmeriCredit Automobile Receivables Trust, Cl A3 | ||||||
1.660%, 03/17/14 | 40 | 40 | ||||
AmeriCredit Automobile Receivables Trust, Cl A2 | ||||||
0.970%, 01/15/13 | 60 | 60 | ||||
Bank of America Auto Trust, Cl A3 | ||||||
2.130%, 09/15/13 (D) | 100 | 101 | ||||
1.670%, 12/15/13 (D) | 105 | 106 | ||||
1.390%, 03/15/14 (D) | 130 | 130 | ||||
Bank of America Auto Trust, Cl A4 | ||||||
2.180%, 02/15/17 (D) | 100 | 100 | ||||
CarMax Auto Owner Trust, Cl A3 | ||||||
1.560%, 07/15/14 | 80 | 80 | ||||
CitiFinancial Auto Issuance Trust, Cl A3 | ||||||
2.590%, 10/15/13 (D) | 235 | 238 | ||||
Harley-Davidson Motorcycle Trust, Cl A4 | ||||||
5.220%, 06/15/13 | 86 | 89 | ||||
3.320%, 02/15/17 | 376 | 388 | ||||
2.540%, 04/15/17 | 210 | 212 | ||||
Harley-Davidson Motorcycle Trust, Ser 2009-1, Cl A4 | ||||||
5.000%, 01/15/17 | 252 | 267 | ||||
USAA Auto Owner Trust, Cl A4 | ||||||
2.530%, 07/15/15 | 145 | 147 | ||||
USAA Auto Owner Trust, Cl A3 | ||||||
1.540%, 02/18/14 | 140 | 141 | ||||
World Omni Auto Receivables Trust, Cl A4 | ||||||
2.210%, 05/15/15 | 135 | 135 | ||||
| 2,436 | ||||||
Credit Cards — 1.4% | ||||||
BA Credit Card Trust, Cl A6 | ||||||
0.260%, 11/15/13 (B) | 223 | 222 | ||||
| SEI Institutional Managed Trust / Semi-Annual Report / March 31, 2010 | 77 |
Table of Contents
SCHEDULE OF INVESTMENTS (Unaudited)
U.S. Fixed Income Fund (Continued)
March 31, 2010
| Description | Face Amount ($ Thousands) | Market Value ($ Thousands) | ||||
BA Credit Card Trust, Cl A2 | ||||||
0.250%, 06/17/13 (B) | $ | 355 | $ | 354 | ||
Bank of America Credit Card Trust, Ser 2008-A1, Cl A1 | ||||||
0.810%, 04/15/13 (B) | 2,750 | 2,755 | ||||
Capital One Multi-Asset Execution Trust, Ser 2008-A5, Cl A5 | ||||||
4.850%, 02/18/14 | 371 | 386 | ||||
Citibank Credit Card Issuance Trust, Cl A3 | ||||||
5.300%, 03/15/18 | 746 | 819 | ||||
Discover Card Master Trust, Cl A | ||||||
1.530%, 02/17/15 (B) | 2,820 | 2,870 | ||||
Discover Card Master Trust, Cl A1 | ||||||
1.530%, 12/15/14 (B) | 448 | 452 | ||||
Discover Card Master Trust | ||||||
0.880%, 09/15/15 (B) | 533 | 534 | ||||
Discover Card Master Trust I, Cl A1 | ||||||
0.290%, 06/18/13 (B) | 147 | 147 | ||||
Discover Card Master Trust, Ser 2007-A2, Cl A2 | ||||||
0.597%, 06/15/15 (B) | 3,092 | 3,072 | ||||
Nordstrom Private Label Credit Card Master Note Trust, Cl A | ||||||
0.290%, 05/15/15 (B) (D) | 399 | 391 | ||||
| 12,002 | ||||||
Mortgage Related Securities — 1.5% | ||||||
Aegis Asset Backed Securities Trust, Cl M1 | ||||||
0.896%, 12/25/34 (B) | 1,423 | 1,284 | ||||
0.786%, 03/25/35 (B) | 1,467 | 1,360 | ||||
Aegis Asset-Backed Securities Trust, Ser 2003-3, Cl M1 | ||||||
1.296%, 01/25/34 (B) | 505 | 430 | ||||
Argent Securities, Ser 2003-W5, Cl M1 | ||||||
0.946%, 10/25/33 (B) | 533 | 399 | ||||
Asset Backed Securities Home Equity, Cl M1 | �� | |||||
0.736%, 07/25/35 (B) | 1,391 | 1,324 | ||||
Bear Stearns Asset-Backed Securities Trust, Ser 2007-HE2, Cl 1A1 | ||||||
0.346%, 03/25/37 (B) | 1,098 | 984 | ||||
Citigroup Mortgage Loan Trust, Cl A | ||||||
0.656%, 12/25/33 (B) (D) | 1,285 | 1,067 | ||||
Contimortgage Home Equity Trust, Ser 1997-1, Cl A9 | ||||||
7.050%, 03/15/28 | 2 | 2 | ||||
Contimortgage Home Equity Trust, Ser 1997-2, Cl A9 | ||||||
7.090%, 04/15/28 | 3 | 3 | ||||
HSBC Home Equity Loan Trust | ||||||
0.390%, 03/20/36 (B) | 129 | 120 | ||||
| Description | Face Amount ($ Thousands) | Market Value ($ Thousands) | ||||
HSBC Home Equity Loan Trust, Cl AS | ||||||
0.440%, 03/20/36 (B) | $ | 141 | $ | 129 | ||
HSBC Home Equity Loan Trust, Cl A1 | ||||||
0.510%, 01/20/35 (B) | 111 | 92 | ||||
0.400%, 01/20/36 (B) | 420 | 367 | ||||
HSBC Home Equity Loan Trust, Cl A2F | ||||||
5.600%, 03/20/36 | 200 | 205 | ||||
HSBC Home Equity Loan Trust, Cl APT | ||||||
1.440%, 11/20/36 (B) | 330 | 299 | ||||
HSBC Home Equity Loan Trust, Cl M2 | ||||||
0.730%, 01/20/35 (B) | 138 | 113 | ||||
0.720%, 03/20/36 (B) | 2,000 | 457 | ||||
IXIS Real Estate Capital Trust, Cl M2 | ||||||
0.981%, 06/25/35 (B) | 1,117 | 1,050 | ||||
Morgan Stanley ABS Capital I, Cl M1 | ||||||
0.996%, 01/25/35 (B) | 90 | 89 | ||||
Morgan Stanley Capital I, Ser 2003-NC8, Cl M1 | ||||||
1.296%, 09/25/33 (B) | 1,688 | 1,269 | ||||
Morgan Stanley Capital I, Ser 2007-HE2, Cl A2A | ||||||
0.286%, 01/25/37 (B) | 33 | 32 | ||||
Morgan Stanley Home Equity Loans, Ser 2007-1, Cl A1 | ||||||
0.296%, 12/25/36 (B) | 31 | 30 | ||||
Option One Mortgage Loan Trust, Ser 2003-5, Cl M1 | ||||||
1.221%, 08/25/33 (B) | 273 | 143 | ||||
Residential Asset Securities, Cl AI4 | ||||||
0.616%, 09/25/35 (B) | 1,300 | 1,210 | ||||
Salomon Brothers Mortgage Securities VII, Cl A | ||||||
3.450%, 04/25/32 (D) | 200 | 166 | ||||
Soundview Home Equity Loan Trust, Ser 2007-OPT1, Cl 2A1 | ||||||
0.326%, 06/25/37 (B) | 1,044 | 880 | ||||
| 13,504 | ||||||
Other Asset-Backed Securities — 2.0% | ||||||
Ally Master Owner Trust, Cl A | ||||||
1.980%, 01/15/15 (B) (D) | 2,219 | 2,230 | ||||
CNH Equipment Trust, Cl A3 | ||||||
1.850%, 12/16/13 | 40 | 40 | ||||
1.540%, 07/15/14 | 380 | 380 | ||||
Countrywide Asset-Backed Certificates, Ser 2005-4, Cl MV1 | ||||||
0.706%, 10/25/35 (B) | 1,100 | 1,064 | ||||
Ford Credit Floorplan Master Owner Trust | ||||||
1.880%, 12/15/14 (B) (D) | 434 | 436 | ||||
| 78 | SEI Institutional Managed Trust / Semi-Annual Report / March 31, 2010 |
Table of Contents
| Description | Face Amount ($ Thousands) | Market Value ($ Thousands) | ||||
Ford Credit Floorplan Master Owner Trust, Cl A1 | ||||||
4.200%, 02/15/17 (D) | $ | 2,087 | $ | 2,092 | ||
Indymac Residential Asset Backed Trust, Cl 2A1 | ||||||
0.326%, 07/25/37 (B) | 1,110 | 1,085 | ||||
JP Morgan Mortgage Acquisition, Cl AV2 | ||||||
0.306%, 10/25/36 (B) | 817 | 778 | ||||
Mid-State Trust, Ser 11, Cl A1 | ||||||
4.864%, 07/15/38 | 1,098 | 993 | ||||
SLC Student Loan Trust, Cl A4A | ||||||
1.857%, 12/15/32 (B) | 1,973 | 2,075 | ||||
SLM Student Loan Trust, Cl A4L | ||||||
0.407%, 09/17/18 (B) | 93 | 92 | ||||
SLM Student Loan Trust, Cl A4 | ||||||
1.949%, 07/25/23 (B) | 2,458 | 2,599 | ||||
0.477%, 12/15/17 (B) | 116 | 116 | ||||
0.457%, 12/17/18 (B) | 87 | 87 | ||||
SLM Student Loan Trust, Ser 2008-8, Cl A4 | ||||||
1.899%, 07/25/22 (B) | 345 | 362 | ||||
Soundview Home Equity Loan Trust, Cl A4 | ||||||
0.546%, 11/25/35 (B) | 1,484 | 1,327 | ||||
Structured Asset Securities, Ser 2006-GEL4, Cl A1 | ||||||
0.366%, 10/25/36 (B) (D) | 1,216 | 1,096 | ||||
Structured Asset Securities, Ser 2007-BC2, Cl A2 | ||||||
0.336%, 03/25/37 (B) | 1,091 | 1,029 | ||||
Swift Master Auto Receivables Trust, Ser 2007-1, Cl A | ||||||
0.330%, 06/15/12 (B) | 207 | 207 | ||||
| 18,088 | ||||||
Total Asset-Backed Securities (Cost $45,154) ($ Thousands) | 46,030 | |||||
U.S. GOVERNMENT AGENCY OBLIGATIONS — 0.7% | ||||||
FHLB | ||||||
1.500%, 05/10/10 (A) | 1,955 | 1,955 | ||||
FICO STRIPS, PO | ||||||
0.000%, 09/26/19 (C) | 100 | 64 | ||||
FNMA | ||||||
2.625%, 07/22/10 (A) | 4,015 | 4,018 | ||||
Total U.S. Government Agency Obligations | 6,037 | |||||
MUNICIPAL BONDS — 0.5% | ||||||
Bay Area Toll Authority, RB | ||||||
6.263%, 04/01/49 | 1,330 | 1,329 | ||||
| Description | Face Amount ($ Thousands)/Shares | Market Value ($ Thousands) | ||||
County of Clark Nevada, Ser C-BUILD, RB | ||||||
6.820%, 07/01/45 | $ | 385 | $ | 395 | ||
Los Angeles Unified School District, GO | ||||||
6.758%, 07/01/34 | 380 | 393 | ||||
North Texas Tollway Authority, RB | ||||||
6.718%, 01/01/49 | 205 | 215 | ||||
State of California, GO | ||||||
7.625%, 03/01/40 | 245 | 255 | ||||
7.550%, 04/01/39 | 235 | 243 | ||||
7.300%, 10/01/39 | 1,660 | 1,666 | ||||
6.650%, 03/01/22 | 175 | 182 | ||||
State of Illinois, GO | ||||||
5.100%, 06/01/33 | 60 | 49 | ||||
Total Municipal Bonds | 4,727 | |||||
COMMERCIAL PAPER — 1.3% | ||||||
Credit Agricole North America | ||||||
0,195%, 05/03/10 | 5,980 | 5,979 | ||||
Lloyds TSB Bank | ||||||
0.210%, 04/26/10 | 5,290 | 5,289 | ||||
Total Commercial Paper (Cost $11,268) ($ Thousands) | 11,268 | |||||
CASH EQUIVALENT — 3.4% | ||||||
SEI Daily Income Trust, Prime Obligation Fund, Cl A, 0.070%*† | 30,584,437 | 30,584 | ||||
Total Cash Equivalent (Cost $30,584) ($ Thousands) | 30,584 | |||||
U.S. TREASURY OBLIGATIONS — 23.2% | ||||||
U.S. Treasury Bills | ||||||
0.142%, 05/06/10 (C) | 9,035 | 9,034 | ||||
0.000%, 05/13/10 (C) | 315 | 315 | ||||
U.S. Treasury Bond | ||||||
8.875%, 08/15/17 to 02/15/19 (E) | 18,727 | 25,657 | ||||
8.750%, 05/15/17 to 08/15/20 (E) | 5,925 | 8,016 | ||||
8.500%, 02/15/20 | 50 | 69 | ||||
8.000%, 11/15/21 (E) | 3,855 | 5,252 | ||||
7.500%, 11/15/16 (E) | 1,300 | 1,642 | ||||
7.125%, 02/15/23 | 176 | 227 | ||||
6.750%, 08/15/26 | 250 | 318 | ||||
6.500%, 11/15/26 | 200 | 248 | ||||
6.375%, 08/15/27 | 50 | 61 | ||||
6.125%, 11/15/27 | 500 | 599 | ||||
5.500%, 08/15/28 | 100 | 112 | ||||
5.375%, 02/15/31 (E) | 3,314 | 3,666 | ||||
4.625%, 02/15/17 (E) | 3,750 | 4,086 | ||||
4.375%, 11/15/39 | 2,133 | 2,017 | ||||
| SEI Institutional Managed Trust / Semi-Annual Report / March 31, 2010 | 79 |
Table of Contents
SCHEDULE OF INVESTMENTS (Unaudited)
U.S. Fixed Income Fund (Concluded)
March 31, 2010
| Description | Face Amount ($ Thousands) | Market Value ($ Thousands) | ||||
4.250%, 05/15/39 | $ | 2,934 | $ | 2,719 | ||
3.625%, 02/15/20 | 8,879 | 8,728 | ||||
3.375%, 11/15/19 (E) | 14,825 | 14,305 | ||||
2.625%, 02/29/16 | 1,500 | 1,474 | ||||
2.375%, 10/31/14 | 500 | 499 | ||||
U.S. Treasury Bond TIPS | ||||||
2.000%, 01/15/16 (E) | 2,000 | 2,317 | ||||
1.750%, 01/15/28 | 4,000 | 3,917 | ||||
U.S. Treasury Note | ||||||
4.750%, 08/15/17 (E) | 1,000 | 1,094 | ||||
4.500%, 05/15/17 | 900 | 972 | ||||
3.625%, 08/15/19 (E) | 6,551 | 6,471 | ||||
3.125%, 10/31/16 | 2,000 | 1,993 | ||||
2.750%, 11/30/16 to 02/15/19 (E) | 3,897 | 3,629 | ||||
2.625%, 07/31/14 | 400 | 405 | ||||
2.500%, 03/31/15 | 9,283 | 9,257 | ||||
2.375%, 02/28/15 (E) | 54,041 | 53,670 | ||||
1.875%, 02/28/14 | 5,650 | 5,602 | ||||
1.375%, 03/15/13 | 4,954 | 4,925 | ||||
1.000%, 03/31/12 | 8,156 | 8,152 | ||||
U.S. Treasury STRIPS | ||||||
6.291%, 05/15/24 (C) | 200 | 103 | ||||
4.978%, 11/15/27 (C) | 200 | 85 | ||||
4.858%, 08/15/27 (C) | 100 | 43 | ||||
4.850%, 05/15/28 (C) | 50 | 21 | ||||
4.801%, 11/15/24 (C) | 50 | 25 | ||||
4.780%, 08/15/25 (C) | 100 | 48 | ||||
4.754%, 02/15/27 (C) | 100 | 44 | ||||
4.568%, 05/15/36 (C) | 100 | 27 | ||||
4.523%, 05/15/29 (C) | 100 | 39 | ||||
4.472%, 02/15/24 (C) | 75 | 39 | ||||
4.397%, 08/15/20 (C) | 1,350 | 868 | ||||
4.338%, 08/15/24 (C) | 500 | 254 | ||||
4.333%, 11/15/20 (C) | 1,050 | 666 | ||||
| Description | Face Amount ($ Thousands)/Shares | Market Value ($ Thousands) | ||||
4.302%, 02/15/32 (C) | $ | 100 | $ | 34 | ||
4.283%, 02/15/17 (C) | 3,660 | 2,902 | ||||
4.060%, 02/15/22 (C) | 100 | 59 | ||||
4.029%, 08/15/19 (C) | 1,350 | 922 | ||||
3.951%, 05/15/20 (C) | 200 | 130 | ||||
3.934%, 05/15/19 (C) | 125 | 87 | ||||
3.724%, 08/15/17 (C) | 500 | 385 | ||||
3.704%, 08/15/18 (C) | 400 | 290 | ||||
3.666%, 11/15/17 (C) | 1,550 | 1,178 | ||||
3.421%, 02/15/18 (C) | 725 | 542 | ||||
3.279%, 11/15/16 (C) | 200 | 161 | ||||
2.773%, 05/15/14 (C) | 5,200 | 4,744 | ||||
2.662%, 02/15/15 (C) | 100 | 88 | ||||
2.473%, 02/15/14 (C) | 2,900 | 2,673 | ||||
Total U.S. Treasury Obligations (Cost $207,899) ($ Thousands) | 207,905 | |||||
AFFILIATED PARTNERSHIP — 10.8% | ||||||
SEI Liquidity Fund, L.P., 0.210%(A)*† | 96,780,613 | 96,781 | ||||
Total Affiliated Partnership (Cost $96,781) ($ Thousands) | 96,781 | |||||
Total Investments — 114.2% (Cost $1,004,454) ($ Thousands) | $ | 1,021,827 | ||||
A summary of the open futures contracts held by the Fund at March 31, 2010, is as follows:
Type of Contract | Number of Contracts Long (Short) | Expiration Date | Unrealized Appreciation ($ Thousands) | ||||
U.S. Long Treasury Bond | 31 | Jun-2010 | $ | 16 | |||
For the period ended March 31, 2010, the total amount of all open futures contracts, as presented in the table above, are representative of the volume of activity for this derivative type during the period.
A summary of outstanding swap agreements held by the Fund at March 31, 2010, is as follows (see Note 2 in Notes to Financial Statements):
| Credit Default Swaps | |||||||||||||||
| Counterparty | Reference Entity/Obligation | Buy/Sell Protection | (Pays)/ Receives Rate | Termination Date | Notional Amount (Thousands) | Net Unrealized Depreciation ($ Thousands) | |||||||||
| Bank of America | CMBX-NA-AJ 1 Index | BUY | (0.84 | ) | 10/12/52 | 1,500 | $ | (302 | ) | ||||||
| Bank of America | CMBX-NA-AJ 1 Index | BUY | (0.84 | ) | 10/12/52 | 3,030 | (171 | ) | |||||||
| Bank of America | CMBX-NA-AJ 1 Index | BUY | (0.84 | ) | 10/12/52 | 1,050 | (32 | ) | |||||||
| $ | (505 | ) | |||||||||||||
Percentages are based on a Net Assets of $895,112 ($ Thousands).
| * | Rate shown is the 7-day effective yield as of March 31, 2010. |
| † | Investment in Affiliated Security (see Note 5). |
| ‡ | Real Estate Investment Trust. |
| (A) | This security was purchased with cash collateral received from securities on loan (see Note 9). The total market value of such securities as of March 31, 2010 was $96,781 ($ Thousands). |
| (B) | Variable Rate Security—The rate reported on the Schedule of Investments is the rate in effects as of March 31, 2010. The date reported on the Schedule of Investments is the maturity date. The effective date may be shorter. |
| (C) | Zero coupon security. The rate reported on the Schedule of Investments is the effective yield at time of purchase. |
| (D) | Securities sold within terms of a private placement memorandum, exempt from registration under Section 144A of the Securities Act of 1933, as amended, and may be sold only to dealers in that program or other “accredited investors.” These securities have been determined to be liquid under guidelines established by the board of Trustees. |
| (E) | This security or a partial position of this security is on loan at March 31, 2010 (see Note 9). The total value of securities on loan at March 31, 2010 was $94,139 ($ Thousands). |
| 80 | SEI Institutional Managed Trust / Semi-Annual Report / March 31, 2010 |
Table of Contents
ABS — Asset-Based Security
ARM — Adjustable Rate Mortgage
Cl — Class
CMO — Collateralized Mortgage Obligation
FHLB — Federal Home Loan Bank
FHLMC — Federal Home Loan Mortgage Corporation
FNMA — Federal National Mortgage Association
GNMA — Government National Mortgage Association
GO — General Obligation
IO — Interest Only—face amount represents notional amount
LLC — Limited Liability Company
L.P. — Limited Partnership
MTN — Medium Term Note
PLC — Public Limited Company
PO — Principal Only
RB — Revenue Bond
Ser — Series
STRIPS — Separately Traded Registered Interest and Principal Securities
TBA — To Be Announced
TIPS — Treasury Inflation Protected Security
Amounts designated as “—” are $O or have been rounded to $O
The following is a summary of the inputs used as of March 31, 2010 in valuing the Fund’s investments carried at value ($ Thousands):
| Investments in Securities | Level 1 | Level 2 | Level 3 | Total | ||||||||
Mortgage-Backed Securities | $ | — | $ | 438,702 | $ | — | $ | 438,702 | ||||
U.S. Treasury Obligations | — | 207,905 | — | 207,905 | ||||||||
Corporate Obligations | — | 179,793 | — | 179,793 | ||||||||
Asset-Backed Securities | — | 46,030 | — | 46,030 | ||||||||
U.S. Government Agency Obligations | — | 6,037 | — | 6,037 | ||||||||
Municipal Bonds | — | 4,727 | — | 4,727 | ||||||||
Cash Equivalent | 30,584 | — | — | 30,584 | ||||||||
Commercial Paper | — | 11,268 | — | 11,268 | ||||||||
Affiliated Partnership | — | 96,781 | — | 96,781 | ||||||||
Total Investments in Securities | $ | 30,584 | $ | 991,243 | $ | — | $ | 1,021,827 | ||||
| Other Financial Instruments | Level 1 | Level 2 | Level 3 | Total | ||||||||||
Futures Contracts* | $ | 16 | $ | — | $ | — | $ | 16 | ||||||
Credit Default Swaps* | — | (505 | ) | — | (505 | ) | ||||||||
Total Other Financial Instruments | $ | 16 | $ | (505 | ) | $ | — | $ | (489 | ) | ||||
| * | Future and swap contracts are valued at unrealized appreciation (depreciation) on the instruments. |
For more information on valuation inputs, see Note 2 — Significant Accounting Policies in Notes to Financial Statements.
The accompanying notes are an integral part of the financial statements.
| SEI Institutional Managed Trust / Semi-Annual Report / March 31, 2010 | 81 |
Table of Contents
SCHEDULE OF INVESTMENTS (Unaudited)
High Yield Bond Fund
March 31, 2010
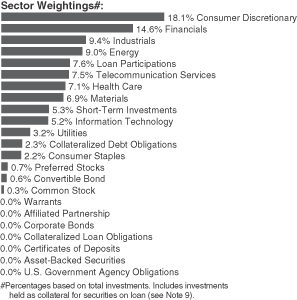
| Description | Face Amount ($ Thousands) | Market Value ($ Thousands) | ||||
CORPORATE OBLIGATIONS — 82.7% | ||||||
Consumer Discretionary — 17.9% | ||||||
Adelphia Communications | ||||||
10.250%, 06/15/11 (C) | $ | 150 | $ | 2 | ||
0.000%, 01/15/09 (C) | 225 | 3 | ||||
Adelphia Communications | ||||||
0.000%, 02/15/04 (C) | 25 | — | ||||
Affinion Group | ||||||
11.500%, 10/15/15 | 1,550 | 1,589 | ||||
10.125%, 10/15/13 | 2,100 | 2,152 | ||||
10.125%, 10/15/13 | 750 | 769 | ||||
American Axle & Manufacturing Holdings | ||||||
9.250%, 01/15/17 (A) | 380 | 406 | ||||
Ameristar Casinos | ||||||
9.250%, 06/01/14 | 800 | 838 | ||||
Amscan Holdings | ||||||
8.750%, 05/01/14 | 2,845 | 2,838 | ||||
Applebee’s Enterprises | ||||||
6.427%, 12/20/37 (A) | 3,650 | 3,340 | ||||
ArvinMeritor | ||||||
10.625%, 03/15/18 | 445 | 461 | ||||
8.125%, 09/15/15 | 1,150 | 1,110 | ||||
Ashtead Capital | ||||||
9.000%, 08/15/16 (A) | 1,665 | 1,686 | ||||
Avis Budget Car Rental | ||||||
9.625%, 03/15/18 (A) | 1,445 | 1,510 | ||||
7.750%, 05/15/16 | 1,160 | 1,137 | ||||
Beazer Homes USA | ||||||
12.000%, 10/15/17 | 1,260 | 1,436 | ||||
8.375%, 04/15/12 | 700 | 698 | ||||
8.125%, 06/15/16 | 680 | 604 | ||||
| Description | Face Amount ($ Thousands) | Market Value ($ Thousands) | ||||
Belo | ||||||
8.000%, 11/15/16 | $ | 1,080 | $ | 1,126 | ||
7.750%, 06/01/27 | 1,675 | 1,376 | ||||
Bon-Ton Department Stores | ||||||
10.250%, 03/15/14 | 400 | 390 | ||||
Boyd Gaming | ||||||
7.125%, 02/01/16 | 1,275 | 1,065 | ||||
Brunswick | ||||||
11.750%, 08/15/13 | 1,500 | 1,680 | ||||
11.250%, 11/01/16 (A) | 1,223 | 1,391 | ||||
Burlington Coat Factory Investment Holdings | ||||||
14.500%, 10/15/14 | 3,920 | 4,155 | ||||
Burlington Coat Factory Warehouse | ||||||
11.125%, 04/15/14 | 1,895 | 2,004 | ||||
Cablevision Systems | ||||||
8.625%, 09/15/17 (A) | 2,305 | 2,438 | ||||
CCH II | ||||||
13.500%, 11/30/16 | 2,768 | 3,329 | ||||
CCO Holdings LLC | ||||||
0.000%, 11/15/13 (C) | 3,380 | 3,464 | ||||
Cequel Communications Holdings I and Cequel Capital | ||||||
8.625%, 11/15/17 (A) | 1,465 | 1,505 | ||||
Charter Communications Operating | ||||||
0.000%, 04/30/14 (A) (C) | 625 | 642 | ||||
Choctaw Resort Development Enterprise | ||||||
7.250%, 11/15/19 (A) | 998 | 679 | ||||
Clear Channel Communications | ||||||
10.750%, 08/01/16 | 680 | 532 | ||||
Clear Channel Worldwide Holdings | ||||||
9.250%, 12/15/17 (A) | 3,635 | 3,799 | ||||
9.250%, 12/15/17 (A) | 900 | 935 | ||||
Cleveland Unlimited | ||||||
13.000%, 12/15/10 (A) (B) | 4,304 | 4,153 | ||||
Columbus International | ||||||
11.500%, 11/20/14 (A) | 1,040 | 1,139 | ||||
Community Health Systems | ||||||
8.875%, 07/15/15 | 1,440 | 1,491 | ||||
Couche-Tard US | ||||||
7.500%, 12/15/13 | 310 | 315 | ||||
CSC Holdings | ||||||
8.625%, 02/15/19 (A) | 2,200 | 2,409 | ||||
Dana (Escrow Security) (C) | ||||||
0.000%, 03/01/09 | 350 | 9 | ||||
0.000%, 03/01/29 | 850 | 21 | ||||
0.000%, 03/15/08 | 100 | 3 | ||||
0.000%, 03/15/28 | 200 | 5 | ||||
Dex One | ||||||
12.000%, 01/29/17 | 489 | 496 | ||||
DISH DBS | ||||||
7.875%, 09/01/19 | 700 | 728 | ||||
Dollar General | ||||||
11.875%, 07/15/17 | 1,505 | 1,753 | ||||
Dominos Pizza Master Issuer LLC, Ser 2007-1, Cl A2 | ||||||
5.261%, 04/25/37 (A) | 1,169 | 1,056 | ||||
| 82 | SEI Institutional Managed Trust / Semi-Annual Report / March 31, 2010 |
Table of Contents
| Description | Face Amount ($ Thousands) | Market Value ($ Thousands) | ||||
Eastman Kodak | ||||||
9.750%, 03/01/18 (A) | $ | 1,730 | $ | 1,713 | ||
7.250%, 11/15/13 | 2,510 | 2,391 | ||||
Easton-Bell Sports | ||||||
9.750%, 12/01/16 (A) | 2,240 | 2,358 | ||||
Echostar DBS | ||||||
7.750%, 05/31/15 | 4,185 | 4,373 | ||||
7.125%, 02/01/16 | 2,015 | 2,053 | ||||
El Dorado Casino Shreveport PIK | ||||||
10.000%, 08/01/12 | 1,191 | 1,012 | ||||
El Pollo Loco | ||||||
11.750%, 12/01/12 | 2,000 | 2,060 | ||||
Equinox Holdings | ||||||
9.500%, 02/01/16 (A) | 1,105 | 1,113 | ||||
Ferrellgas Partners | ||||||
8.625%, 06/15/20 | 660 | 660 | ||||
Fontainebleau Las Vegas Holdings | ||||||
11.000%, 06/15/15 (A) (C) | 3,125 | 35 | ||||
Ford Motor | ||||||
7.450%, 07/16/31 | 1,495 | 1,413 | ||||
6.375%, 02/01/29 | 1,075 | 873 | ||||
Gaylord Entertainment | ||||||
6.750%, 11/15/14 | 730 | 699 | ||||
Goodyear Tire & Rubber | ||||||
10.500%, 05/15/16 | 215 | 232 | ||||
9.000%, 07/01/15 | 600 | 620 | ||||
8.750%, 08/15/20 | 340 | 335 | ||||
GWR Operating Partnership LLP | ||||||
10.875%, 04/01/17 (A) | 840 | 801 | ||||
Hanesbrands | ||||||
8.000%, 12/15/16 | 2,254 | 2,333 | ||||
Hanesbrands, Ser B | ||||||
4.592%, 12/15/14 (B) | 340 | 324 | ||||
Harrah’s Operating | ||||||
11.250%, 06/01/17 | 7,425 | 8,000 | ||||
10.000%, 12/15/18 | 4,066 | 3,365 | ||||
Harry & David Operations | ||||||
9.000%, 03/01/13 | 415 | 313 | ||||
Hertz | ||||||
8.875%, 01/01/14 | 916 | 941 | ||||
HSN | ||||||
11.250%, 08/01/16 | 1,475 | 1,674 | ||||
Inergy | ||||||
8.750%, 03/01/15 | 845 | 884 | ||||
Isle of Capri Casinos | ||||||
7.000%, 03/01/14 | 3,280 | 2,804 | ||||
Jarden | ||||||
8.000%, 05/01/16 | 970 | 1,016 | ||||
7.500%, 05/01/17 | 1,195 | 1,211 | ||||
JC Penney | ||||||
7.400%, 04/01/37 | 1,550 | 1,550 | ||||
K Hovnanian Enterprises | ||||||
10.625%, 10/15/16 | 570 | 607 | ||||
| Description | Face Amount ($ Thousands) | Market Value ($ Thousands) | ||||
Landry’s Restaurants | ||||||
11.625%, 12/01/15 (A) | $ | 1,939 | $ | 2,084 | ||
Laureate Education | ||||||
11.750%, 08/15/17 (A) | 1,000 | 1,040 | ||||
10.000%, 08/15/15 (A) | 525 | 537 | ||||
Lear | ||||||
8.125%, 03/15/20 | 1,198 | 1,217 | ||||
7.875%, 03/15/18 | 640 | 647 | ||||
Levi Strauss | ||||||
9.750%, 01/15/15 | 640 | 670 | ||||
Libbey Glass | ||||||
10.000%, 02/15/15 (A) | 675 | 710 | ||||
Liberty Media LLC | ||||||
8.250%, 02/01/30 | 1,970 | 1,835 | ||||
Lions Gate Entertainment | ||||||
10.250%, 11/01/16 (A) | 3,890 | 3,982 | ||||
M/I Homes | ||||||
6.875%, 04/01/12 | 545 | 529 | ||||
Macy’s Retail Holdings | ||||||
8.875%, 07/15/15 | 1,290 | 1,458 | ||||
MDC Partners | ||||||
11.000%, 11/01/16 (A) | 3,200 | 3,460 | ||||
MGM Mirage | ||||||
13.000%, 11/15/13 | 50 | 58 | ||||
11.375%, 03/01/18 (A) | 3,290 | 3,175 | ||||
11.125%, 11/15/17 (A) | 450 | 506 | ||||
10.375%, 05/15/14 (A) | 620 | 684 | ||||
9.000%, 03/15/20 (A) | 2,405 | 2,477 | ||||
8.375%, 02/01/11 | 25 | 25 | ||||
7.500%, 06/01/16 | 2,950 | 2,456 | ||||
6.875%, 04/01/16 | 1,870 | 1,515 | ||||
5.875%, 02/27/14 | 1,485 | 1,251 | ||||
Mohegan Tribal Gaming Authority | ||||||
7.125%, 08/15/14 | 765 | 593 | ||||
6.875%, 02/15/15 | 265 | 201 | ||||
MTR Gaming Group | ||||||
12.625%, 07/15/14 | 1,025 | 1,012 | ||||
NCL | ||||||
11.750%, 11/15/16 (A) | 555 | 604 | ||||
Neiman-Marcus Group PIK | ||||||
9.000%, 10/15/15 | 1,696 | 1,730 | ||||
Norcraft | ||||||
10.500%, 12/15/15 (A) | 550 | 580 | ||||
Norcraft Holdings | ||||||
9.750%, 09/01/12 | 571 | 542 | ||||
OSI Restaurant Partners | ||||||
10.000%, 06/15/15 | 3,435 | 3,375 | ||||
Peninsula Gaming | ||||||
10.750%, 08/15/17 (A) | 1,535 | 1,466 | ||||
8.375%, 08/15/15 (A) | 2,100 | 2,095 | ||||
Penn National Gaming | ||||||
6.750%, 03/01/15 | 2,985 | 2,936 | ||||
Pinnacle Entertainment | ||||||
7.500%, 06/15/15 | 1,200 | 1,038 | ||||
| SEI Institutional Managed Trust / Semi-Annual Report / March 31, 2010 | 83 |
Table of Contents
SCHEDULE OF INVESTMENTS (Unaudited)
High Yield Bond Fund (Continued)
March 31, 2010
| Description | Face Amount ($ Thousands) | Market Value ($ Thousands) | ||||
Quebecor Media | ||||||
7.750%, 03/15/16 | $ | 3,735 | $ | 3,782 | ||
Quebecor Media (Escrow Security) | ||||||
0.000%, 11/15/13 (C) (D) | 1,725 | — | ||||
0.000%, 03/15/16 (E) (K) | 1,915 | 105 | ||||
Quiksilver | ||||||
6.875%, 04/15/15 | 1,510 | 1,397 | ||||
QVC | ||||||
7.500%, 10/01/19 (A) | 3,220 | 3,284 | ||||
7.375%, 10/15/20 (A) | 415 | 417 | ||||
Rental Services | ||||||
9.500%, 12/01/14 | 2,685 | 2,658 | ||||
River Rock Entertainment Authority | ||||||
9.750%, 11/01/11 | 4,515 | 4,165 | ||||
RJ Tower | ||||||
12.000%, 06/01/13 (C) | 172 | 1 | ||||
Royal Caribbean Cruises | ||||||
11.875%, 07/15/15 | 900 | 1,060 | ||||
7.250%, 06/15/16 | 770 | 760 | ||||
7.000%, 06/15/13 | 685 | 694 | ||||
6.875%, 12/01/13 | 165 | 167 | ||||
RSC Equipment Rental | ||||||
10.000%, 07/15/17 (A) | 1,750 | 1,855 | ||||
Salem Communications | ||||||
9.625%, 12/15/16 | 1,056 | 1,103 | ||||
Sally Holdings LLC | ||||||
10.500%, 11/15/16 | 870 | 948 | ||||
9.250%, 11/15/14 | 1,360 | 1,442 | ||||
San Pasqual Casino | ||||||
8.000%, 09/15/13 (A) | 1,670 | 1,605 | ||||
Sbarro | ||||||
10.375%, 02/01/15 | 674 | 566 | ||||
Sealy Mattress | ||||||
10.875%, 04/15/16 (A) | 27 | 30 | ||||
8.250%, 06/15/14 | 3,491 | 3,491 | ||||
Seminole Indian Tribe of Florida | ||||||
5.798%, 10/01/13 (A) | 1,665 | 1,649 | ||||
Service International | ||||||
7.375%, 10/01/14 | 1,170 | 1,199 | ||||
6.750%, 04/01/15 | 1,005 | 1,000 | ||||
Shingle Springs Tribal Gaming Authority | ||||||
9.375%, 06/15/15 (A) | 1,310 | 1,087 | ||||
Simmons Bedding | ||||||
11.250%, 07/15/15 (A) | 4,310 | 4,698 | ||||
Sinclair Television Group | ||||||
9.250%, 11/01/17 (A) | 375 | 395 | ||||
Sirius XM Radio | ||||||
9.750%, 09/01/15 (A) | 2,105 | 2,273 | ||||
8.750%, 04/01/15 (A) | 1,750 | 1,743 | ||||
Sitel | ||||||
11.500%, 04/01/18 (A) | 1,020 | 1,028 | ||||
Speedway Motorsports | ||||||
8.750%, 06/01/16 | 1,470 | 1,566 | ||||
Stanadyne Holdings | ||||||
12.000%, 02/15/15 | 1,575 | 1,181 | ||||
| Description | Face Amount ($ Thousands) | Market Value ($ Thousands) | ||||
Stanadyne Holdings, Ser 1 | ||||||
10.000%, 08/15/14 | $ | 450 | $ | 412 | ||
Standard Pacific | ||||||
10.750%, 09/15/16 | 1,955 | 2,080 | ||||
Starwood Hotels & Resorts Worldwide | ||||||
7.875%, 10/15/14 | 285 | 309 | ||||
6.750%, 05/15/18 | 875 | 877 | ||||
Station Casinos | ||||||
6.875%, 03/01/16 (C) | 225 | — | ||||
6.625%, 03/15/18 (C) | 1,900 | 2 | ||||
Steinway Musical Instruments | ||||||
7.000%, 03/01/14 (A) | 4,595 | 4,434 | ||||
Suburban Propane Partners | ||||||
7.375%, 03/15/20 | 2,200 | 2,236 | ||||
Sun Media | ||||||
7.625%, 02/15/13 | 660 | 648 | ||||
Tenneco | ||||||
8.625%, 11/15/14 | 525 | 533 | ||||
TL Acquisitions | ||||||
10.500%, 01/15/15 (A) | 1,300 | 1,248 | ||||
Toys R Us Property I | ||||||
10.750%, 07/15/17 (A) | 910 | 1,015 | ||||
Travelport LLC | ||||||
11.875%, 09/01/16 | 5,705 | 6,254 | ||||
4.877%, 09/01/14 (B) | 1,571 | 1,540 | ||||
TRW Automotive | ||||||
7.250%, 03/15/17 (A) | 1,475 | 1,423 | ||||
7.000%, 03/15/14 (A) | 170 | 167 | ||||
Turning Stone Resort Casino Enterprise | ||||||
9.125%, 09/15/14 (A) | 2,035 | 2,035 | ||||
United Components | ||||||
9.375%, 06/15/13 | 870 | 874 | ||||
United Rentals North America | ||||||
10.875%, 06/15/16 | 2,600 | 2,828 | ||||
9.250%, 12/15/19 | 900 | 918 | ||||
Univision Communications | ||||||
12.000%, 07/01/14 (A) | 1,227 | 1,344 | ||||
9.750%, 03/15/15 (A) | 1,400 | 1,207 | ||||
UPC Holding | ||||||
9.875%, 04/15/18 (A) | 3,635 | 3,817 | ||||
Vail Resorts | ||||||
6.750%, 02/15/14 | 1,825 | 1,832 | ||||
Videotron | ||||||
9.125%, 04/15/18 | 800 | 889 | ||||
6.875%, 01/15/14 | 2,160 | 2,192 | ||||
Visant Holding | ||||||
10.250%, 12/01/13 | 3,920 | 4,038 | ||||
WMG Acquisition | ||||||
9.500%, 06/15/16 (A) | 2,460 | 2,629 | ||||
Wynn Las Vegas | ||||||
6.625%, 12/01/14 | 445 | 444 | ||||
Wynn Las Vegas Capital | ||||||
6.625%, 12/01/14 | 135 | 135 | ||||
| 84 | SEI Institutional Managed Trust / Semi-Annual Report / March 31, 2010 |
Table of Contents
| Description | Face Amount ($ Thousands) | Market Value ($ Thousands) | ||||
XM Satellite Radio | ||||||
11.250%, 06/15/13 (A) | $ | 1,920 | $ | 2,078 | ||
XM Satellite Radio Holdings | ||||||
13.000%, 08/01/13 (A) | 3,875 | 4,364 | ||||
| 261,069 | ||||||
Consumer Staples — 2.2% | ||||||
Alliance One International | ||||||
10.000%, 07/15/16 (A) | 185 | 193 | ||||
10.000%, 07/15/16 (A) | 595 | 622 | ||||
B&G Foods | ||||||
7.625%, 01/15/18 | 1,425 | 1,452 | ||||
Bumble Bee Foods | ||||||
7.750%, 12/15/15 (A) | 575 | 582 | ||||
Central Garden and Pet | ||||||
8.250%, 03/01/18 | 685 | 694 | ||||
Chiquita Brands International | ||||||
8.875%, 12/01/15 | 1,435 | 1,489 | ||||
Constellation Brands | ||||||
8.375%, 12/15/14 | 485 | 524 | ||||
7.250%, 09/01/16 | 1,090 | 1,120 | ||||
7.250%, 05/15/17 | 1,000 | 1,025 | ||||
Cott Beverages | ||||||
8.375%, 11/15/17 (A) | 2,385 | 2,463 | ||||
Del Monte | ||||||
7.500%, 10/15/19 (A) | 215 | 226 | ||||
Dole Food | ||||||
13.875%, 03/15/14 | 386 | 465 | ||||
8.000%, 10/01/16 (A) | 405 | 415 | ||||
Fleming | ||||||
0.000%,04/01/08 (C) | 1,010 | — | ||||
JBS USA | ||||||
11.625%, 05/01/14 (A) | 510 | 581 | ||||
JohnsonDiversey Holdings | ||||||
10.500%, 05/15/20 (A) | 1,925 | 2,098 | ||||
8.250%, 11/15/19 (A) | 925 | 957 | ||||
Pantry | ||||||
7.750%, 02/15/14 | 1,525 | 1,479 | ||||
Rite Aid | ||||||
10.375%, 07/15/16 | 2,640 | 2,792 | ||||
10.250%, 10/15/19 | 210 | 224 | ||||
9.500%, 06/15/17 | 2,525 | 2,121 | ||||
9.375%, 12/15/15 | 875 | 753 | ||||
7.700%, 02/15/27 | 150 | 91 | ||||
7.500%, 03/01/17 | 395 | 366 | ||||
6.875%, 12/15/28 (A) | 375 | 214 | ||||
Smithfield Foods | ||||||
7.750%, 07/01/17 | 300 | 296 | ||||
7.750%, 05/15/13 | 695 | 702 | ||||
Southern States Cooperative | ||||||
11.000%, 11/01/11 (A) | 1,500 | 1,504 | ||||
Spectrum Brands | ||||||
12.000%, 08/28/19 | 1,241 | 1,316 | ||||
| Description | Face Amount ($ Thousands) | Market Value ($ Thousands) | ||||
SuperValu | ||||||
8.000%, 05/01/16 | $ | 3,675 | $ | 3,721 | ||
Tops Markets | ||||||
10.125%, 10/15/15 (A) | 930 | 967 | ||||
| 31,452 | ||||||
Energy — 9.0% | ||||||
Anadarko Petroleum | ||||||
6.450%, 09/15/36 | 2,545 | 2,594 | ||||
Antero Resources Finance | ||||||
9.375%, 12/01/17 (A) | 885 | 912 | ||||
Aquilex Holdings | ||||||
11.125%, 12/15/16 (A) | 2,380 | 2,559 | ||||
Arch Coal | ||||||
8.750%, 08/01/16 (A) | 1,985 | 2,099 | ||||
Arch Western Finance | ||||||
6.750%, 07/01/13 | 1,115 | 1,119 | ||||
Atlas Energy Operating | ||||||
12.125%, 08/01/17 | 2,870 | 3,286 | ||||
10.750%, 02/01/18 | 1,705 | 1,875 | ||||
Aventine Renewable Energy Holdings | ||||||
13.000%, 03/15/15 (A) (E) (K) | 986 | 1,035 | ||||
0.000%, 04/01/17 (C) | 2,750 | 2,578 | ||||
Basic Energy Services | ||||||
11.625%, 08/01/14 | 1,100 | 1,210 | ||||
Bill Barrett | ||||||
9.875%, 07/15/16 | 1,000 | 1,078 | ||||
Chesapeake Energy | ||||||
9.500%, 02/15/15 | 750 | 816 | ||||
7.500%, 06/15/14 | 306 | 311 | ||||
7.250%, 12/15/18 | 461 | 461 | ||||
6.500%, 08/15/17 | 1,155 | 1,117 | ||||
Cie Generale de Geophysique-Veritas | ||||||
9.500%, 05/15/16 | 2,685 | 2,873 | ||||
7.750%, 05/15/17 | 175 | 175 | ||||
7.500%, 05/15/15 | 300 | 301 | ||||
Cloud Peak Energy Resources | �� | |||||
8.250%, 12/15/17 (A) | 615 | 627 | ||||
Compton Petroleum Finance | ||||||
7.625%, 12/01/13 | 375 | 317 | ||||
Consol Energy | ||||||
8.250%, 04/01/20 (A) | 2,510 | 2,579 | ||||
8.000%, 04/01/17 (A) | 2,030 | 2,086 | ||||
Continental Resources | ||||||
7.375%, 10/01/20 (A) | 2,200 | 2,181 | ||||
Copano Energy | ||||||
7.750%, 06/01/18 | 2,600 | 2,594 | ||||
Crosstex Energy | ||||||
8.875%, 02/15/18 (A) | 1,845 | 1,903 | ||||
Denbury Resources | ||||||
9.750%, 03/01/16 | 840 | 924 | ||||
7.500%, 04/01/13 | 500 | 505 | ||||
7.500%, 12/15/15 | 1,225 | 1,249 | ||||
| SEI Institutional Managed Trust / Semi-Annual Report / March 31, 2010 | 85 |
Table of Contents
SCHEDULE OF INVESTMENTS (Unaudited)
High Yield Bond Fund (Continued)
March 31, 2010
| Description | Face Amount ($ Thousands) | Market Value ($ Thousands) | ||||
Drummond | ||||||
9.000%, 10/15/14 (A) | $ | 1,090 | $ | 1,123 | ||
Dynegy Holdings | ||||||
8.375%, 05/01/16 | 850 | 706 | ||||
7.750%, 06/01/19 | 3,115 | 2,352 | ||||
7.625%, 10/15/26 | 1,115 | 714 | ||||
7.500%, 06/01/15 | 1,770 | 1,469 | ||||
El Paso | ||||||
8.250%, 02/15/16 | 150 | 160 | ||||
8.050%, 10/15/30 | 175 | 175 | ||||
7.800%, 08/01/31 | 150 | 147 | ||||
7.420%, 02/15/37 | 950 | 856 | ||||
7.250%, 06/01/18 | 2,240 | 2,311 | ||||
El Paso Performance-Linked Trust | ||||||
7.750%, 07/15/11 (A) | 200 | 207 | ||||
Enterprise Products Operating | ||||||
8.375%, 08/01/66 (B) | 545 | 553 | ||||
Forbes Energy Services | ||||||
11.000%, 02/15/15 | 1,882 | 1,769 | ||||
Forest Oil | ||||||
8.500%, 02/15/14 | 315 | 332 | ||||
8.000%, 12/15/11 | 585 | 617 | ||||
7.250%, 06/15/19 | 2,075 | 2,085 | ||||
General Maritime | ||||||
12.000%, 11/15/17 (A) | 1,100 | 1,177 | ||||
Gibson Energy ULC | ||||||
10.000%, 01/15/18 (A) | 605 | 594 | ||||
Helix Energy Solutions Group | ||||||
9.500%, 01/15/16 (A) | 2,495 | 2,570 | ||||
Hercules Offshore | ||||||
10.500%, 10/15/17 (A) | 955 | 953 | ||||
Hilcorp Energy I | ||||||
7.750%, 11/01/15 (A) | 680 | 672 | ||||
Holly | ||||||
9.875%, 06/15/17 (A) | 1,830 | 1,885 | ||||
International Coal Group | ||||||
9.125%, 04/01/18 | 1,065 | 1,081 | ||||
Key Energy Services | ||||||
8.375%, 12/01/14 | 820 | 829 | ||||
Linn Energy | ||||||
11.750%, 05/15/17 (A) | 230 | 261 | ||||
8.625%, 04/15/20 (A) | 5,515 | 5,380 | ||||
Mariner Energy | ||||||
8.000%, 05/15/17 | 1,090 | 1,071 | ||||
MarkWest Energy Partners | ||||||
8.750%, 04/15/18 | 970 | 995 | ||||
McMoRan Exploration | ||||||
11.875%, 11/15/14 | 300 | 323 | ||||
Murray Energy | ||||||
10.250%, 10/15/15 (A) | 980 | 1,004 | ||||
Newfield Exploration | ||||||
7.125%, 05/15/18 | 1,320 | 1,340 | ||||
6.875%, 02/01/20 | 1,850 | 1,864 | ||||
NFR Energy | ||||||
9.750%, 02/15/17 (A) | 760 | 758 | ||||
| Description | Face Amount ($ Thousands) | Market Value ($ Thousands) | ||||
OPTI Canada | ||||||
8.250%, 12/15/14 | $ | 3,255 | $ | 3,060 | ||
7.875%, 12/15/14 | 1,235 | 1,155 | ||||
Parker Drilling | ||||||
9.125%, 04/01/18 (A) | 2,295 | 2,349 | ||||
Penn Virginia | ||||||
10.375%, 06/15/16 | 400 | 434 | ||||
PetroHawk Energy | ||||||
10.500%, 08/01/14 | 1,800 | 1,987 | ||||
9.125%, 07/15/13 | 1,490 | 1,555 | ||||
7.875%, 06/01/15 | 1,915 | 1,951 | ||||
Petroleum Development | ||||||
12.000%, 02/15/18 | 2,000 | 2,120 | ||||
Pioneer Drilling | ||||||
9.875%, 03/15/18 (A) | 965 | 955 | ||||
Plains Exploration & Production | ||||||
10.000%, 03/01/16 | 1,085 | 1,199 | ||||
7.750%, 06/15/15 | 75 | 76 | ||||
7.625%, 06/01/18 | 550 | 555 | ||||
7.000%, 03/15/17 | 625 | 616 | ||||
Quicksilver Resources | ||||||
11.750%, 01/01/16 | 2,500 | 2,862 | ||||
7.125%, 04/01/16 | 2,595 | 2,465 | ||||
Range Resources | ||||||
8.000%, 05/15/19 | 3,960 | 4,227 | ||||
7.500%, 05/15/16 | 650 | 669 | ||||
Sabine Pass LNG L.P. | ||||||
7.500%, 11/30/16 | 4,560 | 4,024 | ||||
SandRidge Energy | ||||||
9.875%, 05/15/16 (A) | 1,185 | 1,218 | ||||
8.750%, 01/15/20 (A) | 2,515 | 2,452 | ||||
8.625%, 04/01/15 | 1,070 | 1,041 | ||||
Southwestern Energy | ||||||
7.500%, 02/01/18 | 900 | 977 | ||||
Stone Energy | ||||||
8.625%, 02/01/17 | 2,230 | 2,197 | ||||
Targa Resources Partners | ||||||
11.250%, 07/15/17 (A) | 3,815 | 4,292 | ||||
Tesoro | ||||||
9.750%, 06/01/19 | 3,050 | 3,187 | ||||
Valero Energy | ||||||
10.500%, 03/15/39 | 1,950 | 2,504 | ||||
Williams | ||||||
7.875%, 09/01/21 | 93 | 109 | ||||
7.750%, 06/15/31 | 278 | 312 | ||||
| 130,245 | ||||||
Financials — 14.5% | ||||||
ALH Finance LLC | ||||||
8.500%, 01/15/13 | 2,090 | 2,090 | ||||
Alliant Holdings I | ||||||
11.000%, 05/01/15 (A) | 2,900 | 3,002 | ||||
Allied Capital | ||||||
6.625%, 07/15/11 | 3,755 | 3,683 | ||||
6.000%, 04/01/12 | 1,050 | 1,009 | ||||
| 86 | SEI Institutional Managed Trust / Semi-Annual Report / March 31, 2010 |
Table of Contents
| Description | Face Amount ($ Thousands) | Market Value ($ Thousands) | ||||
American Financial Group | ||||||
9.875%, 06/15/19 | $ | 500 | $ | 590 | ||
American General Finance MTN | ||||||
5.375%, 10/01/12 | 275 | 259 | ||||
4.875%, 07/15/12 | 925 | 871 | ||||
0.504%, 12/15/11 (B) | 2,915 | 2,726 | ||||
American International Group | ||||||
8.175%, 05/15/58 (B) | 1,430 | 1,208 | ||||
BAC Capital Trust XIV | ||||||
5.630%, 03/15/12 (B) | 1,815 | 1,366 | ||||
Bank of America | ||||||
8.000%, 12/29/49 (B) | 1,130 | 1,153 | ||||
Buffalo Thunder Development Authority | ||||||
9.375%, 12/15/14 (A) (C) | 2,175 | 288 | ||||
C5 Capital SPV | ||||||
6.196%, 12/31/11 (A) (B) | 145 | 101 | ||||
Calfrac Holdings | ||||||
7.750%, 02/15/15 (A) | 2,850 | 2,832 | ||||
Capital One Capital V | ||||||
10.250%, 08/15/39 | 1,370 | 1,623 | ||||
Cardtronics | ||||||
9.250%, 08/15/13 | 560 | 578 | ||||
9.250%, 08/15/13 | 1,445 | 1,492 | ||||
Cemex Finance | ||||||
9.500%, 12/14/16 (A) | 3,655 | 3,783 | ||||
CEVA Group | ||||||
11.625%, 10/01/16 (A) | 2,925 | 3,122 | ||||
11.500%, 04/01/18 (A) | 2,500 | 2,594 | ||||
Chukchansi Economic Development Authority | ||||||
4.024%, 11/15/12 (A) (B) | 1,795 | 1,400 | ||||
CIT Group | ||||||
7.000%, 05/01/14 | 595 | 563 | ||||
7.000%, 05/01/15 | 595 | 555 | ||||
7.000%, 05/01/13 | 397 | 386 | ||||
7.000%, 05/01/17 | 2,764 | 2,550 | ||||
7.000%, 05/01/16 | 4,191 | 3,866 | ||||
Citigroup Capital XXI | ||||||
8.300%, 12/21/57 (B) | 605 | 613 | ||||
City National Bank | ||||||
9.000%, 08/12/19 | 3,384 | 3,384 | ||||
City National Capital Trust I | ||||||
9.625%, 02/01/40 | 2,150 | 2,389 | ||||
Comerica Bank | ||||||
5.200%, 08/22/17 | 1,000 | 970 | ||||
Corporate Office Properties | ||||||
3.500%, 09/15/26 ‡(A) | 197 | 195 | ||||
Credit Acceptance | ||||||
9.125%, 02/01/17 (A) | 2,400 | 2,466 | ||||
Delphi Financial Group | ||||||
7.875%, 01/31/20 | 3,250 | 3,356 | ||||
E*Trade Financial PIK | ||||||
12.500%, 11/30/17 | 1,396 | 1,668 | ||||
E*Trade Financial | ||||||
7.875%, 12/01/15 | 860 | 825 | ||||
| Description | Face Amount ($ Thousands) | Market Value ($ Thousands) | ||||
Felcor Lodging | ||||||
10.000%, 10/01/14 ‡ | $ | 1,130 | $ | 1,164 | ||
FireKeepers Development Authority | ||||||
13.875%, 05/01/15 (A) | 3,450 | 3,993 | ||||
Ford Motor Credit LLC | ||||||
12.000%, 05/15/15 | 860 | 1,027 | ||||
8.700%, 10/01/14 | 360 | 390 | ||||
8.000%, 12/15/16 | 3,050 | 3,214 | ||||
8.000%, 06/01/14 | 1,900 | 2,000 | ||||
7.800%, 06/01/12 | 2,095 | 2,173 | ||||
7.500%, 08/01/12 | 1,110 | 1,149 | ||||
7.000%, 10/01/13 | 3,056 | 3,162 | ||||
5.507%, 06/15/11 (B) | 900 | 918 | ||||
Fresenius US Finance II | ||||||
9.000%, 07/15/15 (A) | 300 | 334 | ||||
Galaxy Entertainment Finance | ||||||
9.875%, 12/15/12 (A) | 1,305 | 1,360 | ||||
Genworth Financial | ||||||
8.625%, 12/15/16 | 700 | 764 | ||||
6.500%, 06/15/34 | 1,090 | 947 | ||||
6.150%, 11/15/66 (B) | 4,700 | 3,619 | ||||
GMAC | ||||||
8.000%, 12/31/18 | 1,065 | 1,049 | ||||
8.000%, 11/01/31 | 3,035 | 2,898 | ||||
6.875%, 09/15/11 | 1,521 | 1,546 | ||||
6.875%, 08/28/12 | 961 | 974 | ||||
6.750%, 12/01/14 | 2,713 | 2,699 | ||||
6.625%, 05/15/12 | 997 | 1,007 | ||||
HBOS Capital Funding | ||||||
6.071%, 06/30/49 (A) (B) | 3,940 | 3,073 | ||||
Hellas Telecommunications II | ||||||
6.881%, 01/15/15 (A) (B) (C) | 2,250 | 90 | ||||
Hexion US Finance | ||||||
9.750%, 11/15/14 | 2,519 | 2,569 | ||||
4.750%, 11/15/14 (B) | 500 | 460 | ||||
Host Marriott LP, Ser O | ||||||
6.375%, 03/15/15 ‡ | 115 | 114 | ||||
Host Marriott LP, Ser Q | ||||||
6.750%, 06/01/16 ‡ | 2,595 | 2,601 | ||||
HUB International Holdings | ||||||
10.250%, 06/15/15 (A) | 360 | 345 | ||||
9.000%, 12/15/14 (A) | 2,440 | 2,367 | ||||
Icahn Enterprises | ||||||
8.000%, 01/15/18 (A) | 3,075 | 2,964 | ||||
7.750%, 01/15/16 (A) | 5,100 | 4,909 | ||||
ILFC E-Capital Trust II | ||||||
6.250%, 12/21/65 (A) (B) | 1,535 | 1,182 | ||||
Inergy L.P. | ||||||
8.250%, 03/01/16 | 285 | 294 | ||||
6.875%, 12/15/14 | 225 | 225 | ||||
International Lease Finance | ||||||
8.750%, 03/15/17 (A) | 4,270 | 4,368 | ||||
8.625%, 09/15/15 (A) | 2,230 | 2,280 | ||||
6.375%, 03/25/13 | 800 | 782 | ||||
| SEI Institutional Managed Trust / Semi-Annual Report / March 31, 2010 | 87 |
Table of Contents
SCHEDULE OF INVESTMENTS (Unaudited)
High Yield Bond Fund (Continued)
March 31, 2010
| Description | Face Amount ($ Thousands) | Market Value ($ Thousands) | ||||
5.650%, 06/01/14 | $ | 595 | $ | 551 | ||
5.000%, 09/15/12 | 2,150 | 2,066 | ||||
LBG Capital No.1 | ||||||
7.875%, 11/01/20 | 1,220 | 1,098 | ||||
LBI Escrow | ||||||
8.000%, 11/01/17 (A) | 9,020 | 9,358 | ||||
Lehman Brothers Holdings MTN | ||||||
6.875%, 05/02/18 (C) | 2,750 | 650 | ||||
5.625%, 01/24/13 (C) | 825 | 198 | ||||
Liberty Mutual Group | ||||||
7.000%, 03/15/37 (A) (B) | 1,275 | 1,087 | ||||
Lincoln National | ||||||
6.050%, 04/20/67 (B) | 985 | 820 | ||||
Lloyds Banking Group | ||||||
6.267%, 11/14/16 (A) | 335 | 199 | ||||
5.920%, 09/29/49 (A) (B) | 505 | 299 | ||||
Marlin Water Trust II | ||||||
6.310%, 07/15/03 (A) (C) | 4,200 | — | ||||
MBIA | ||||||
5.700%, 12/01/34 | 2,500 | 1,280 | ||||
MetLife | ||||||
10.750%, 08/01/39 | 2,160 | 2,784 | ||||
MetLife Capital Trust X | ||||||
9.250%, 04/08/38 (A) (B) | 3,550 | 3,994 | ||||
Midwest Gaming Borrower | ||||||
11.625%, 04/15/16 (A) | 1,130 | 1,147 | ||||
MU Finance | ||||||
8.375%, 02/01/17 (A) | 305 | 301 | ||||
National Life Insurance | ||||||
10.500%, 09/15/39 (A) | 990 | 1,060 | ||||
National Money Mart | ||||||
10.375%, 12/15/16 (A) | 315 | 334 | ||||
NCO Group | ||||||
11.875%, 11/15/14 | 800 | 732 | ||||
Nielsen Finance | ||||||
10.000%, 08/01/14 | 840 | 880 | ||||
0.000%, 08/01/16 (F) | 3,620 | 3,439 | ||||
Novelis | ||||||
11.500%, 02/15/15 | 580 | 624 | ||||
7.250%, 02/15/15 | 1,805 | 1,742 | ||||
Nuveen Investments | ||||||
10.500%, 11/15/15 | 8,630 | 8,371 | ||||
10.500%, 11/15/15 | 1,070 | 1,038 | ||||
5.500%, 09/15/15 | 780 | 600 | ||||
Ohio Casualty | ||||||
7.300%, 06/15/14 | 905 | 986 | ||||
Omega Healthcare Investors | ||||||
7.500%, 02/15/20 ‡ (A) | 3,495 | 3,530 | ||||
Pinnacle Foods Finance | ||||||
10.625%, 04/01/17 | 775 | 820 | ||||
9.250%, 04/01/15 | 165 | 169 | ||||
9.250%, 04/01/15 (A) | 1,980 | 2,029 | ||||
PNC Preferred Funding Trust II | ||||||
6.113%, 03/29/49 (A) (B) | 1,570 | 1,236 | ||||
| Description | Face Amount ($ Thousands) | Market Value ($ Thousands) | ||||
Protective Life | ||||||
8.450%, 10/15/39 | $ | 2,800 | $ | 2,937 | ||
Rabobank Nederland | ||||||
11.000%, 12/31/49 (A) (B) | 1,295 | 1,666 | ||||
Radian Group | ||||||
5.625%, 02/15/13 | 1,095 | 931 | ||||
Radnet Management | ||||||
10.375%, 04/01/18 | 1,235 | 1,219 | ||||
Realogy | ||||||
12.375%, 04/15/15 | 1,300 | 946 | ||||
10.500%, 04/15/14 | 1,450 | 1,251 | ||||
Regions Financing Trust II | ||||||
6.625%, 05/15/47 (B) | 469 | 349 | ||||
Royal Bank of Scotland Group | ||||||
7.640%, 09/29/17 (B) | 1,685 | 1,062 | ||||
Senior Housing Properties Trust | ||||||
7.875%, 04/15/15 ‡ | 671 | 676 | ||||
Snoqualmie Entertainment Authority | ||||||
9.125%, 02/01/15 (A) | 2,715 | 2,091 | ||||
4.136%, 02/01/14 (A) (B) | 770 | 562 | ||||
Susquehanna Capital II | ||||||
11.000%, 03/23/40 | 1,300 | 1,359 | ||||
Symetra Financial | ||||||
6.125%, 04/01/16 (A) | 635 | 630 | ||||
Torchmark | ||||||
9.250%, 06/15/19 | 2,000 | 2,395 | ||||
Unitrin | ||||||
6.000%, 05/15/17 | 1,025 | 986 | ||||
Universal City Development Partners | ||||||
8.875%, 11/15/15 (A) | 1,550 | 1,562 | ||||
USB Capital IX | ||||||
6.189%, 04/15/49 (B) | 820 | 701 | ||||
USI Holdings | ||||||
9.750%, 05/15/15 (A) | 3,369 | 3,184 | ||||
Ventas Realty L.P. | ||||||
9.000%, 05/01/12 ‡ | 675 | 720 | ||||
7.125%, 06/01/15 ‡ | 391 | 406 | ||||
6.750%, 04/01/17 ‡ | 850 | 873 | ||||
Wind Acquisition Holdings Finance | ||||||
12.250%, 07/15/17 (A) | 1,900 | 1,881 | ||||
XL Capital | ||||||
6.500%, 12/31/49 (B) | 670 | 569 | ||||
Yankee Acquisition, Ser B | ||||||
9.750%, 02/15/17 | 1,620 | 1,673 | ||||
8.500%, 02/15/15 | 1,370 | 1,411 | ||||
Zions Bancorporation | ||||||
6.000%, 09/15/15 | 1,095 | 1,007 | ||||
5.650%, 05/15/14 | 200 | 183 | ||||
5.500%, 11/16/15 | 415 | 386 | ||||
| 211,604 | ||||||
Health Care — 7.1% | ||||||
Accellent | ||||||
10.500%, 12/01/13 | 820 | 832 | ||||
8.375%, 02/01/17 (A) | 1,700 | 1,726 | ||||
| 88 | SEI Institutional Managed Trust / Semi-Annual Report / March 31, 2010 |
Table of Contents
| Description | Face Amount ($ Thousands) | Market Value ($ Thousands) | ||||
Alion Science and Technology | ||||||
12.000%, 11/01/14 (A) | $ | 3,165 | $ | 3,205 | ||
Apria Healthcare Group | ||||||
12.375%, 11/01/14 (A) | 5,680 | 6,220 | ||||
Bausch & Lomb | ||||||
9.875%, 11/01/15 | 2,065 | 2,184 | ||||
Biomet | ||||||
11.625%, 10/15/17 | 6,450 | 7,224 | ||||
10.375%, 10/15/17 | 5,930 | 6,523 | ||||
10.000%, 10/15/17 | 3,570 | 3,936 | ||||
BioScrip | ||||||
10.250%, 10/01/15 (A) | 4,140 | 4,212 | ||||
Catalent Pharma Solutions | ||||||
9.500%, 04/15/15 | 5,764 | 5,664 | ||||
Cooper | ||||||
7.125%, 02/15/15 | 1,040 | 1,039 | ||||
DJO Finance | ||||||
10.875%, 11/15/14 | 4,595 | 4,991 | ||||
10.875%, 11/15/14 (A) | 2,135 | 2,319 | ||||
HCA | ||||||
9.875%, 02/15/17 (A) | 160 | 174 | ||||
9.625%, 11/15/16 | 8,031 | 8,603 | ||||
9.250%, 11/15/16 | 1,000 | 1,066 | ||||
8.500%, 04/15/19 (A) | 2,160 | 2,323 | ||||
7.875%, 02/15/20 (A) | 3,100 | 3,245 | ||||
Health Management Associates | ||||||
6.125%, 04/15/16 | 2,030 | 1,934 | ||||
Healthsouth | ||||||
8.125%, 02/15/20 | 2,220 | 2,209 | ||||
Inverness Medical Innovations | ||||||
9.000%, 05/15/16 | 5,630 | 5,743 | ||||
Novasep Holding SAS | ||||||
9.750%, 12/15/16 (A) | 780 | 757 | ||||
PharmaNet Development Group | ||||||
10.875%, 04/15/17 (A) | 2,250 | 2,250 | ||||
Phibro Animal Health | ||||||
10.000%, 08/01/13 (A) | 100 | 104 | ||||
Psychiatric Solutions | ||||||
7.750%, 07/15/15 | 2,150 | 2,190 | ||||
ReAble Therapeutics Finance | ||||||
11.750%, 11/15/14 | 2,317 | 2,456 | ||||
Select Medical | ||||||
7.625%, 02/01/15 | 2,115 | 2,015 | ||||
Surgical Care Affiliates | ||||||
8.875%, 07/15/15 (A) | 1,554 | 1,555 | ||||
Talecris Biotherapeutics Holdings | ||||||
7.750%, 11/15/16 (A) | 1,435 | 1,442 | ||||
Tenet Healthcare | ||||||
10.000%, 05/01/18 (A) | 95 | 106 | ||||
9.250%, 02/01/15 | 1,765 | 1,851 | ||||
8.875%, 07/01/19 (A) | 370 | 401 | ||||
United Surgical Partners International PIK | ||||||
9.250%, 05/01/17 | 1,630 | 1,687 | ||||
| Description | Face Amount ($ Thousands) | Market Value ($ Thousands) | ||||
Universal Hospital Services | ||||||
8.500%, 06/01/15 | $ | 640 | $ | 637 | ||
US Oncology | ||||||
9.125%, 08/15/17 | 1,295 | 1,353 | ||||
US Oncology Holdings | ||||||
6.904%, 03/15/12 (B) | 1,147 | 1,087 | ||||
Vanguard Health Holding II | ||||||
8.000%, 02/01/18 (A) | 1,805 | 1,755 | ||||
VWR Funding PIK | ||||||
10.250%, 07/15/15 | 5,555 | 5,888 | ||||
| 102,906 | ||||||
Industrials — 9.3% | ||||||
ACCO Brands | ||||||
10.625%, 03/15/15 (A) | 3,095 | 3,381 | ||||
7.625%, 08/15/15 | 1,225 | 1,147 | ||||
Actuant | ||||||
6.875%, 06/15/17 | 2,000 | 1,940 | ||||
Aleris International | ||||||
0.000%, 12/15/16 (C) | 1,800 | 8 | ||||
Aleris International PIK | ||||||
4.414%, 12/15/14 (C) | 725 | 6 | ||||
Alliant Techsystems | ||||||
6.750%, 04/01/16 | 3,025 | 3,040 | ||||
Allison Transmission | ||||||
11.000%, 11/01/15 (A) | 1,228 | 1,308 | ||||
America West Airlines 1999-1 | ||||||
7.930%, 01/02/19 | 336 | 317 | ||||
America West Airlines 2000-1 | ||||||
8.057%, 07/02/20 | 2,340 | 2,214 | ||||
American Airlines | ||||||
13.000%, 08/01/16 | 2,782 | 3,129 | ||||
American Axle & Manufacturing | ||||||
7.875%, 03/01/17 | 1,190 | 1,110 | ||||
Ames True Temper | ||||||
10.000%, 07/15/12 | 330 | 326 | ||||
4.284%, 01/15/12 (B) | 1,610 | 1,526 | ||||
Amsted Industries | ||||||
8.125%, 03/15/18 (A) | 3,085 | 3,085 | ||||
Associated Materials | ||||||
11.250%, 03/01/14 | 830 | 854 | ||||
9.875%, 11/15/16 | 540 | 583 | ||||
Atrium PIK | ||||||
15.000%, 12/15/12 (A) (C) | 1,625 | 24 | ||||
Baker & Taylor | ||||||
11.500%, 07/01/13 (A) | 950 | 504 | ||||
Baldor Electric | ||||||
8.625%, 02/15/17 | 1,055 | 1,116 | ||||
BE Aerospace | ||||||
8.500%, 07/01/18 | 1,100 | 1,174 | ||||
Belden | ||||||
9.250%, 06/15/19 (A) | 610 | 651 | ||||
| SEI Institutional Managed Trust / Semi-Annual Report / March 31, 2010 | 89 |
Table of Contents
SCHEDULE OF INVESTMENTS (Unaudited)
High Yield Bond Fund (Continued)
March 31, 2010
| Description | Face Amount ($ Thousands) | Market Value ($ Thousands) | ||||
Case New Holland | ||||||
7.750%, 09/01/13 (A) | $ | 410 | $ | 425 | ||
Casella Waste Systems | ||||||
11.000%, 07/15/14 (A) | 170 | 182 | ||||
9.750%, 02/01/13 | 1,030 | 1,030 | ||||
Chart Industries | ||||||
9.125%, 10/15/15 | 1,600 | 1,600 | ||||
Clean Harbors | ||||||
7.625%, 08/15/16 | 535 | 543 | ||||
Coleman Cable | ||||||
9.000%, 02/15/18 (A) | 4,965 | 5,014 | ||||
Complete Production Services | ||||||
8.000%, 12/15/16 | 650 | 644 | ||||
Continental Airlines | ||||||
7.339%, 04/19/14 (E) (K) | 1,192 | 1,120 | ||||
Continental Airlines 2000-1 Class B Pass Through Trust | ||||||
8.388%, 11/01/20 | 1,425 | 1,411 | ||||
Cornell | ||||||
10.750%, 07/01/12 | 315 | 319 | ||||
Corrections Corp of America | ||||||
7.750%, 06/01/17 | 1,395 | 1,458 | ||||
CPM Holdings | ||||||
10.625%, 09/01/14 (A) | 655 | 698 | ||||
DAE Aviation Holdings | ||||||
11.250%, 08/01/15 (A) | 870 | 813 | ||||
Delta Air Lines | ||||||
12.250%, 03/15/15 (A) | 4,200 | 4,478 | ||||
7.711%, 09/18/11 | 1,700 | 1,692 | ||||
Delta Air Lines, Ser 2002-1, Cl C | ||||||
7.779%, 01/02/12 | 190 | 184 | ||||
Douglas Dynamics | ||||||
7.750%, 01/15/12 (A) | 3,192 | 3,224 | ||||
DP World Sukuk | ||||||
6.250%, 07/02/17 (A) | 650 | 594 | ||||
Dycom Investments | ||||||
8.125%, 10/15/15 | 2,180 | 2,027 | ||||
Esco | ||||||
8.625%, 12/15/13 (A) | 95 | 95 | ||||
4.129%, 12/15/13 (A) (B) | 375 | 333 | ||||
Express | ||||||
8.750%, 03/01/18 (A) | 485 | 495 | ||||
General Cable | ||||||
7.125%, 04/01/17 | 1,050 | 1,041 | ||||
Geo Group | ||||||
7.750%, 10/15/17 (A) | 700 | 714 | ||||
GeoEye | ||||||
9.625%, 10/01/15 (A) | 750 | 767 | ||||
Global Aviation Holdings | ||||||
14.000%, 08/15/13 (A) | 2,750 | 2,795 | ||||
Goodman Global Group | ||||||
0.000%, 12/15/14 (A) (G) | 4,400 | 2,574 | ||||
Harland Clarke Holdings | ||||||
9.500%, 05/15/15 | 3,530 | 3,309 | ||||
6.000%, 05/15/15 (B) | 865 | 711 | ||||
| Description | Face Amount ($ Thousands) | Market Value ($ Thousands) | ||||
Intcomex | ||||||
13.250%, 12/15/14 (A) | $ | 3,250 | $ | 3,287 | ||
Interface | ||||||
11.375%, 11/01/13 | 400 | 451 | ||||
9.500%, 02/01/14 | 131 | 135 | ||||
Interline Brands | ||||||
8.125%, 06/15/14 | 570 | 587 | ||||
Iron Mountain | ||||||
8.375%, 08/15/21 | 1,030 | 1,071 | ||||
K Hovnanian Enterprises | ||||||
7.500%, 05/15/16 | 580 | 455 | ||||
6.250%, 01/15/15 | 325 | 257 | ||||
Kansas City Southern de Mexico | ||||||
12.500%, 04/01/16 | 220 | 260 | ||||
8.000%, 02/01/18 (A) | 1,495 | 1,532 | ||||
Koppers | ||||||
7.875%, 12/01/19 (A) | 1,620 | 1,669 | ||||
L-3 Communications | ||||||
5.875%, 01/15/15 | 255 | 259 | ||||
L-3 Communications, Ser B | ||||||
6.375%, 10/15/15 | 95 | 98 | ||||
Manitowoc | ||||||
9.500%, 02/15/18 | 1,115 | 1,162 | ||||
Masco | ||||||
7.125%, 03/15/20 | 735 | 742 | ||||
McJunkin Red Man | ||||||
9.500%, 12/15/16 (A) | 665 | 679 | ||||
Neenah Foundary | ||||||
9.500%, 01/01/17 (C) | 400 | 217 | ||||
Niska Gas Storage US | ||||||
8.875%, 03/15/18 (A) | 1,585 | 1,621 | ||||
Oshkosh | ||||||
8.500%, 03/01/20 (A) | 960 | 994 | ||||
8.250%, 03/01/17 (A) | 810 | 836 | ||||
Ply Gem Industries | ||||||
13.125%, 07/15/14 (A) | 1,075 | 1,115 | ||||
Quality Distribution | ||||||
11.750%, 11/01/13 (A) | 832 | 732 | ||||
RailAmerica | ||||||
9.250%, 07/01/17 | 647 | 690 | ||||
RBS Global and Rexnord | ||||||
11.750%, 08/01/16 | 1,255 | 1,346 | ||||
9.500%, 08/01/14 (A) | 2,331 | 2,424 | ||||
Reynolds Group Issuer | ||||||
7.750%, 10/15/16 (A) | 6,890 | 7,080 | ||||
Sabine Pass LNG | ||||||
7.500%, 11/30/16 (A) | 680 | 600 | ||||
Seminole Indian Tribe of Florida | ||||||
6.535%, 10/01/20 (A) | 850 | 756 | ||||
Sequa | ||||||
11.750%, 12/01/15 (A) | 1,745 | 1,745 | ||||
ServiceMaster | ||||||
10.750%, 07/15/15 (A) | 4,230 | 4,442 | ||||
7.450%, 08/15/27 | 1,500 | 1,144 | ||||
| 90 | SEI Institutional Managed Trust / Semi-Annual Report / March 31, 2010 |
Table of Contents
| Description | Face Amount ($ Thousands) | Market Value ($ Thousands) | ||||
7.250%, 03/01/38 | $ | 1,195 | $ | 860 | ||
7.100%, 03/01/18 | 1,260 | 1,071 | ||||
Spirit Aerosystems | ||||||
7.500%, 10/01/17 (A) | 745 | 764 | ||||
SPX | ||||||
7.625%, 12/15/14 | 1,190 | 1,245 | ||||
Terex | ||||||
10.875%, 06/01/16 | 950 | 1,052 | ||||
8.000%, 11/15/17 | 4,760 | 4,629 | ||||
Thermadyne Holdings | ||||||
9.500%, 02/01/14 | 860 | 862 | ||||
Ticketmaster Entertainment | ||||||
10.750%, 08/01/16 | 3,430 | 3,824 | ||||
Titan International | ||||||
8.000%, 01/15/12 | 1,660 | 1,660 | ||||
Trimas | ||||||
9.750%, 12/15/17 (A) | 555 | 575 | ||||
Triumph Group | ||||||
8.000%, 11/15/17 | 120 | 120 | ||||
UAL Pass Through Trust Series 2000-1 | ||||||
8.030%, 07/01/11 | 563 | 833 | ||||
UCI Holdings | ||||||
8.257%, 12/15/13 (B) | 1,150 | 1,081 | ||||
United Air Lines | ||||||
12.000%, 11/01/13 (A) | 1,120 | 1,159 | ||||
10.400%, 11/01/16 | 1,535 | 1,650 | ||||
9.875%, 08/01/13 (A) | 1,815 | 1,906 | ||||
9.750%, 01/15/17 | 3,655 | 3,847 | ||||
9.125%, 01/15/12 (C) | 1,075 | — | ||||
United Air Lines, Ser 95A1 | ||||||
9.560%, 10/19/18 (C) | 569 | 205 | ||||
9.020%, 04/19/12 (C) | 362 | 91 | ||||
United Air Lines, Ser A | ||||||
0.000%, 05/01/04 (C) | 525 | — | ||||
USG | ||||||
9.750%, 08/01/14 (A) | 225 | 239 | ||||
Wyle Services | ||||||
10.500%, 04/01/18 (A) | 1,745 | 1,745 | ||||
| 135,537 | ||||||
Information Technology — 5.2% | ||||||
Activant Solutions | ||||||
9.500%, 05/01/16 | 1,645 | 1,579 | ||||
Aeroflex | ||||||
11.750%, 02/15/15 | 1,170 | 1,252 | ||||
Amkor Technology | ||||||
9.250%, 06/01/16 | 2,775 | 2,928 | ||||
7.750%, 05/15/13 | 1,500 | 1,511 | ||||
Avaya | ||||||
10.125%, 11/01/15 | 690 | 662 | ||||
9.750%, 11/01/15 | 665 | 648 | ||||
Brocade Communications Systems | ||||||
6.875%, 01/15/20 (A) | 440 | 449 | ||||
6.625%, 01/15/18 (A) | 440 | 447 | ||||
| Description | Face Amount ($ Thousands) | Market Value ($ Thousands) | ||||
Compucom Systems | ||||||
12.500%, 10/01/15 (A) | $ | 3,015 | $ | 3,196 | ||
Equinix | ||||||
8.125%, 03/01/18 | 2,900 | 3,002 | ||||
First Data | ||||||
10.550%, 09/24/15 | 1,800 | 1,521 | ||||
9.875%, 09/24/15 | 8,955 | 7,724 | ||||
9.875%, 09/24/15 | 1,900 | 1,620 | ||||
Flextronics International | ||||||
6.250%, 11/15/14 | 928 | 940 | ||||
Freescale Semiconductor | ||||||
10.125%, 03/15/18 (A) | 400 | 431 | ||||
10.125%, 12/15/16 | 1,715 | 1,518 | ||||
8.875%, 12/15/14 | 230 | 220 | ||||
GXS Worldwide | ||||||
9.750%, 06/15/15 (A) | 10,005 | 9,630 | ||||
Innophos | ||||||
8.875%, 08/15/14 | 1,280 | 1,318 | ||||
Iron Mountain | ||||||
8.750%, 07/15/18 | 1,020 | 1,068 | ||||
JDA Software Group | ||||||
8.000%, 12/15/14 (A) | 915 | 952 | ||||
NXP Funding LLC | ||||||
10.000%, 07/15/13 (A) | 489 | 518 | ||||
9.500%, 10/15/15 | 1,050 | 1,040 | ||||
7.875%, 10/15/14 | 1,980 | 1,931 | ||||
Open Solutions | ||||||
9.750%, 02/01/15 (A) | 3,000 | 2,584 | ||||
Sabre Holdings | ||||||
8.350%, 03/15/16 | 1,675 | 1,591 | ||||
Sanmina-SCI | ||||||
8.125%, 03/01/16 | 825 | 830 | ||||
3.004%, 06/15/14 (A) (B) | 1,250 | 1,181 | ||||
Sensata Technologies | ||||||
8.000%, 05/01/14 | 900 | 929 | ||||
Smart Modular Technologies | ||||||
5.790%, 04/01/12 (B) | 670 | 630 | ||||
Spansion | ||||||
0.000%, 06/01/13 (A) (B) (C) | 490 | 492 | ||||
SunGard Data Systems | ||||||
10.625%, 05/15/15 | 1,555 | 1,695 | ||||
10.250%, 08/15/15 | 4,983 | 5,238 | ||||
9.125%, 08/15/13 | 320 | 328 | ||||
Terremark Worldwide | ||||||
12.250%, 06/15/17 (A) | 2,475 | 2,846 | ||||
Travelport | ||||||
9.875%, 09/01/14 | 1,115 | 1,165 | ||||
Unisys | ||||||
14.250%, 09/15/15 (A) | 1,540 | 1,836 | ||||
12.750%, 10/15/14 (A) | 6,085 | 7,097 | ||||
Viasat | ||||||
8.875%, 09/15/16 (A) | 565 | 578 | ||||
| SEI Institutional Managed Trust / Semi-Annual Report / March 31, 2010 | 91 |
Table of Contents
SCHEDULE OF INVESTMENTS (Unaudited)
High Yield Bond Fund (Continued)
March 31, 2010
| Description | Face Amount ($ Thousands) | Market Value ($ Thousands) | ||||
Zayo Group | ||||||
10.250%, 03/15/17 (A) | $ | 515 | $ | 520 | ||
| 75,645 | ||||||
Materials — 6.8% | ||||||
Algoma Acquisition | ||||||
9.875%, 06/15/15 (A) | 1,255 | 1,155 | ||||
Appleton Papers | ||||||
10.500%, 06/15/15 (A) | 940 | 935 | ||||
Ashland | ||||||
9.125%, 06/01/17 (A) | 3,265 | 3,657 | ||||
Berry Plastics | ||||||
10.250%, 03/01/16 | 2,200 | 2,068 | ||||
Boise Paper Holdings | ||||||
9.000%, 11/01/17 (A) | 2,715 | 2,851 | ||||
BWAY | ||||||
10.000%, 04/15/14 | 3,620 | 3,891 | ||||
C8 Capital SPV | ||||||
6.640%, 12/31/14 (A) (B) | 760 | 528 | ||||
Cascades | ||||||
7.875%, 01/15/20 (A) | 1,320 | 1,327 | ||||
Century Aluminum | ||||||
8.000%, 05/15/14 | 889 | 882 | ||||
Clearwater Paper | ||||||
10.625%, 06/15/16 (A) | 790 | 877 | ||||
CPG International I | ||||||
10.500%, 07/01/13 | 1,865 | 1,870 | ||||
Crown Americas | ||||||
7.750%, 11/15/15 | 600 | 624 | ||||
7.625%, 05/15/17 (A) | 285 | 297 | ||||
Domtar | ||||||
10.750%, 06/01/17 | 2,700 | 3,280 | ||||
9.500%, 08/01/16 | 275 | 304 | ||||
Evraz Group | ||||||
9.500%, 04/24/18 (A) | 625 | 671 | ||||
FMG Finance Property Ltd. | ||||||
10.625%, 09/01/16 (A) | 3,690 | 4,253 | ||||
Freeport-McMoRan Copper & Gold | ||||||
8.375%, 04/01/17 | 4,025 | 4,478 | ||||
Georgia-Pacific LLC | ||||||
8.250%, 05/01/16 (A) | 3,090 | 3,368 | ||||
8.000%, 01/15/24 | 1,690 | 1,791 | ||||
7.125%, 01/15/17 (A) | 5,480 | 5,699 | ||||
7.000%, 01/15/15 (A) | 1,155 | 1,195 | ||||
Glatfelter | ||||||
7.125%, 05/01/16 (A) | 250 | 246 | ||||
7.125%, 05/01/16 | 990 | 973 | ||||
Graham Packaging | ||||||
9.875%, 10/15/14 | 3,003 | 3,116 | ||||
8.250%, 01/01/17 (A) | 270 | 272 | ||||
Graphic Packaging International | ||||||
9.500%, 06/15/17 | 1,265 | 1,350 | ||||
Headwaters | ||||||
11.375%, 11/01/14 (A) | 1,135 | 1,185 | ||||
| Description | Face Amount ($ Thousands) | Market Value ($ Thousands) | ||||
Hexion Finance Escrow | ||||||
8.875%, 02/01/18 (A) | $ | 480 | $ | 473 | ||
Huntsman International | ||||||
8.625%, 03/15/20 (A) | 1,705 | 1,714 | ||||
7.875%, 11/15/14 | 2,175 | 2,197 | ||||
7.375%, 01/01/15 | 415 | 412 | ||||
5.500%, 06/30/16 (A) | 685 | 622 | ||||
Innophos Holdings | ||||||
9.500%, 04/15/12 (A) | 725 | 725 | ||||
Intertape Polymer | ||||||
8.500%, 08/01/14 | 710 | 607 | ||||
MacDermid | ||||||
9.500%, 04/15/17 (A) | 1,945 | 1,998 | ||||
Millennium America | ||||||
7.625%, 11/15/26 (C) | 175 | 71 | ||||
Momentive Performance Materials | ||||||
12.500%, 06/15/14 (A) | 520 | 588 | ||||
Nalco | ||||||
8.250%, 05/15/17 (A) | 930 | 988 | ||||
NewPage | ||||||
11.375%, 12/31/14 | 4,065 | 4,045 | ||||
Noranda Aluminium Acquisition PIK | ||||||
4.524%, 05/15/15 (B) | 2,493 | 1,982 | ||||
Packaging Dynamics Finance | ||||||
10.000%, 05/01/16 (A) | 1,020 | 761 | ||||
PE Paper Escrow GmbH | ||||||
12.000%, 08/01/14 (A) | �� | 520 | 588 | |||
Plastipak Holdings | ||||||
10.625%, 08/15/19 (A) | 590 | 656 | ||||
8.500%, 12/15/15 (A) | 135 | 137 | ||||
PolyOne | ||||||
8.875%, 05/01/12 | 960 | 1,015 | ||||
Pregis | ||||||
12.375%, 10/15/13 | 2,081 | 2,112 | ||||
Reichhold Industries | ||||||
9.000%, 08/15/14 (A) | 1,969 | 1,866 | ||||
Ryerson | ||||||
12.000%, 11/01/15 | 1,525 | 1,609 | ||||
Scotts Miracle-Gro | ||||||
7.250%, 01/15/18 | 160 | 163 | ||||
Sealed Air | ||||||
7.875%, 06/15/17 (A) | 1,120 | 1,216 | ||||
Solo Cup | ||||||
10.500%, 11/01/13 | 790 | 833 | ||||
8.500%, 02/15/14 | 1,425 | 1,393 | ||||
Solutia | ||||||
8.750%, 11/01/17 | 2,350 | 2,479 | ||||
7.875%, 03/15/20 | 865 | 876 | ||||
Steel Dynamics | ||||||
7.750%, 04/15/16 | 1,200 | 1,254 | ||||
7.625%, 03/15/20 (A) | 785 | 805 | ||||
Teck Resources | ||||||
10.750%, 05/15/19 | 625 | 765 | ||||
10.250%, 05/15/16 | 1,510 | 1,797 | ||||
| 92 | SEI Institutional Managed Trust / Semi-Annual Report / March 31, 2010 |
Table of Contents
| Description | Face Amount ($ Thousands) | Market Value ($ Thousands) | ||||
Terra Capital | ||||||
7.750%, 11/01/19 | $ | 1,330 | $ | 1,606 | ||
Vedanta Resources | ||||||
9.500%, 07/18/18 (A) | 1,550 | 1,713 | ||||
Verso Paper Holdings | ||||||
11.500%, 07/01/14 (A) | 1,280 | 1,382 | ||||
9.125%, 08/01/14 | 2,910 | 2,823 | ||||
Viskase | ||||||
9.875%, 01/15/18 (A) | 1,075 | 1,088 | ||||
Vitro | ||||||
9.125%, 02/01/17 (C) | 2,270 | 1,027 | ||||
| 99,529 | ||||||
Telecommunication Services — 7.5% | ||||||
Citizens Communications | ||||||
6.625%, 03/15/15 | 980 | 963 | ||||
Clearwire Communications | ||||||
12.000%, 12/01/15 (A) | 4,800 | 4,896 | ||||
12.000%, 12/01/15 (A) | 3,825 | 3,892 | ||||
Cricket Communications | ||||||
10.000%, 07/15/15 | 575 | 598 | ||||
9.375%, 11/01/14 | 3,309 | 3,367 | ||||
Crown Castle International | ||||||
9.000%, 01/15/15 | 2,405 | 2,603 | ||||
Digicel | ||||||
12.000%, 04/01/14 (A) | 500 | 566 | ||||
Digicel Group | ||||||
10.500%, 04/15/18 (A) | 1,195 | 1,240 | ||||
9.125%, 01/15/15 (A) | 300 | 298 | ||||
8.875%, 01/15/15 (A) | 785 | 771 | ||||
8.250%, 09/01/17 (A) | 1,295 | 1,282 | ||||
GCI | ||||||
8.625%, 11/15/19 (A) | 2,395 | 2,440 | ||||
Global Crossing | ||||||
12.000%, 09/15/15 (A) | 1,370 | 1,520 | ||||
Inmarsat Finance | ||||||
7.375%, 12/01/17 (A) | 2,125 | 2,210 | ||||
Intelsat | ||||||
9.250%, 06/15/16 | 350 | 367 | ||||
Intelsat Jackson Holding | ||||||
11.250%, 06/15/16 | 3,950 | 4,276 | ||||
9.500%, 06/15/16 | 1,370 | 1,459 | ||||
8.500%, 11/01/19 (A) | 1,355 | 1,423 | ||||
Intelsat Luxembourg | ||||||
11.500%, 02/04/17 | 3,937 | 4,036 | ||||
11.250%, 02/04/17 | 3,340 | 3,532 | ||||
Intelsat Subsidiary Holding | ||||||
8.875%, 01/15/15 (A) | 1,950 | 2,004 | ||||
8.875%, 01/15/15 | 1,775 | 1,833 | ||||
iPCS PIK | ||||||
3.733%, 05/01/14 (B) | 2,451 | 2,170 | ||||
ITC Deltacom | ||||||
10.500%, 04/01/16 (A) | 570 | 568 | ||||
| Description | Face Amount ($ Thousands) | Market Value ($ Thousands) | ||||
Level 3 Financing | ||||||
10.000%, 02/01/18 (A) | $ | 2,780 | $ | 2,655 | ||
8.750%, 02/15/17 | 1,200 | 1,098 | ||||
4.140%, 02/15/15 (B) | 125 | 104 | ||||
MetroPCS Wireless | ||||||
9.250%, 11/01/14 | 3,375 | 3,451 | ||||
9.250%, 11/01/14 | 825 | 839 | ||||
Nextel Communications | ||||||
6.875%, 10/31/13 | 1,750 | 1,706 | ||||
NII Capital | ||||||
10.000%, 08/15/16 (A) | 2,665 | 2,918 | ||||
Nordic Telephone Holdings | ||||||
8.875%, 05/01/16 (A) | 1,765 | 1,893 | ||||
Orascom Telecom Finance | ||||||
7.875%, 02/08/14 (A) | 1,800 | 1,706 | ||||
PAETEC Holding | ||||||
9.500%, 07/15/15 | 1,830 | 1,853 | ||||
8.875%, 06/30/17 | 1,740 | 1,788 | ||||
Qwest | ||||||
7.500%, 06/15/23 | 1,015 | 1,015 | ||||
7.250%, 10/15/35 | 1,200 | 1,158 | ||||
7.250%, 09/15/25 | 745 | 752 | ||||
6.875%, 09/15/33 | 225 | 217 | ||||
Qwest Capital Funding | ||||||
7.750%, 02/15/31 | 695 | 660 | ||||
Qwest Communications International | ||||||
7.125%, 04/01/18 (A) | 1,130 | 1,167 | ||||
Qwest Communications International, Ser B | ||||||
7.500%, 02/15/14 | 1,720 | 1,750 | ||||
Sable International Finance | ||||||
7.750%, 02/15/17 (A) | 1,085 | 1,128 | ||||
SBA Telecommunications | ||||||
8.250%, 08/15/19 (A) | 360 | 383 | ||||
8.000%, 08/15/16 (A) | 360 | 379 | ||||
Sprint Capital | ||||||
8.750%, 03/15/32 | 2,960 | 2,745 | ||||
6.900%, 05/01/19 | 3,810 | 3,486 | ||||
Telcordia Technologies | ||||||
10.000%, 03/15/13 (A) | 4,485 | 4,384 | ||||
4.034%, 07/15/12 (A) (B) | 1,890 | 1,824 | ||||
Telesat Canada | ||||||
12.500%, 11/01/17 | 760 | 874 | ||||
11.000%, 11/01/15 | 765 | 851 | ||||
tw telecom holdings inc | ||||||
8.000%, 03/01/18 (A) | 2,190 | 2,239 | ||||
Virgin Media Finance PLC | ||||||
9.500%, 08/15/16 | 2,540 | 2,775 | ||||
8.375%, 10/15/19 | 1,900 | 1,952 | ||||
West | ||||||
11.000%, 10/15/16 | 2,830 | 3,000 | ||||
9.500%, 10/15/14 | 1,000 | 1,027 | ||||
Wind Acquisition Finance | ||||||
11.750%, 07/15/17 (A) | 2,013 | 2,224 | ||||
| SEI Institutional Managed Trust / Semi-Annual Report / March 31, 2010 | 93 |
Table of Contents
SCHEDULE OF INVESTMENTS (Unaudited)
High Yield Bond Fund (Continued)
March 31, 2010
| Description | Face Amount ($ Thousands) | Market Value ($ Thousands) | ||||
10.750%, 12/01/09 (A) | $ | 2,335 | $ | 2,522 | ||
Windstream | ||||||
8.625%, 08/01/16 | 1,920 | 1,973 | ||||
8.125%, 08/01/13 | 40 | 42 | ||||
| 108,852 | ||||||
Utilities — 3.2% | ||||||
AES | ||||||
9.750%, 04/15/16 (A) | 1,620 | 1,754 | ||||
8.000%, 10/15/17 | 475 | 484 | ||||
8.000%, 06/01/20 | 475 | 473 | ||||
7.750%, 03/01/14 | 50 | 51 | ||||
Calpine Generating | ||||||
14.320%, 04/01/11 (B) (C) | 1,600 | 216 | ||||
Edison Mission Energy | ||||||
7.625%, 05/15/27 | 1,400 | 896 | ||||
7.500%, 06/15/13 | 605 | 525 | ||||
7.200%, 05/15/19 | 1,650 | 1,139 | ||||
7.000%, 05/15/17 | 2,667 | 1,860 | ||||
Elwood Energy | ||||||
8.159%, 07/05/26 | 808 | 765 | ||||
Energy Future Holdings | ||||||
10.875%, 11/01/17 | 3,220 | 2,391 | ||||
10.000%, 01/15/20 (A) | 5,425 | 5,656 | ||||
6.500%, 11/15/24 | 1,055 | 549 | ||||
Ferrellgas Partners | ||||||
9.125%, 10/01/17 (A) | 2,100 | 2,200 | ||||
6.750%, 05/01/14 | 1,250 | 1,237 | ||||
Mirant (Escrow Security) | ||||||
0.000%, 07/15/04 (C) | 450 | 4 | ||||
0.000%, 10/15/49 (C) | 50 | — | ||||
Mirant Americas Generation LLC | ||||||
8.500%, 10/01/21 | 2,382 | 2,239 | ||||
Mirant North America LLC | ||||||
7.375%, 12/31/13 | 2,080 | 2,075 | ||||
North American Energy Alliance | ||||||
10.875%, 06/01/16 (A) | 1,100 | 1,171 | ||||
NRG Energy | ||||||
8.500%, 06/15/19 | 2,185 | 2,212 | ||||
7.375%, 01/15/17 | 3,120 | 3,089 | ||||
7.375%, 02/01/16 | 2,445 | 2,427 | ||||
7.250%, 02/01/14 | 1,320 | 1,330 | ||||
Orion Power Holdings | ||||||
12.000%, 05/01/10 | 900 | 903 | ||||
Public Service of New Mexico | ||||||
7.950%, 05/15/18 | 2,600 | 2,713 | ||||
Puget Sound Energy | ||||||
6.974%, 06/01/67 (B) | 905 | 806 | ||||
Texas Competitive Electric Holdings | ||||||
10.250%, 11/01/15 | 2,140 | 1,487 | ||||
TXU, Ser P | ||||||
5.550%, 11/15/14 | 1,015 | 741 | ||||
TXU, Ser R | ||||||
6.550%, 11/15/34 | 2,210 | 1,138 | ||||
| Description | Face Amount ($ Thousands) | Market Value ($ Thousands) | ||||
United Maritime Group | ||||||
11.750%, 06/15/15 (A) | $ | 4,200 | $ | 4,305 | ||
| 46,836 | ||||||
Total Corporate Obligations | 1,203,675 | |||||
LOAN PARTICIPATIONS — 7.5% | ||||||
Affinion Group | ||||||
7.641%, 03/01/12 | 4,690 | 4,409 | ||||
Alliant Insurance Services, Tranche C | ||||||
8.000%, 08/21/14 | 696 | 690 | ||||
Allison Transmission | ||||||
3.010%, 08/07/14 | 67 | 64 | ||||
3.000%, 08/07/14 | 94 | 90 | ||||
2.990%, 08/07/14 | 202 | 192 | ||||
2.980%, 08/07/14 | 34 | 32 | ||||
American General Finance | ||||||
0.850%, 07/14/10 | 545 | 532 | ||||
Aspect Software, 2nd Lien | ||||||
7.313%, 06/20/12 | 1,680 | 1,613 | ||||
Asurion, 2nd Lien | ||||||
6.734%, 07/03/15 | 2,200 | 2,171 | ||||
ATP Oil and Gas | ||||||
12.250%, 12/26/13 | 85 | 86 | ||||
11.750%, 12/26/13 | 44 | 44 | ||||
11.250%, 12/26/13 | 914 | 923 | ||||
Boston Generating, 2nd Lien | ||||||
4.501%, 06/20/14 | 700 | 183 | ||||
Boston Generating, Mezzanine | ||||||
7.251%, 12/20/16 | 204 | 2 | ||||
CDW | ||||||
4.230%, 10/12/14 | 997 | 875 | ||||
Central Parking | ||||||
1.843%, 05/22/14 | 608 | 483 | ||||
Central Parking, 1st Lien | ||||||
2.563%, 05/22/14 | 1,437 | 1,155 | ||||
CF Industries Holdings | ||||||
0.000%, 12/02/16 | 2,640 | 2,640 | ||||
Charter, Term B Loan | ||||||
2.260%, 03/15/14 | 6 | 6 | ||||
Chester Downs | ||||||
12.375%, 12/31/49 | 579 | 591 | ||||
CIT Group, Term Loan A-1 | ||||||
13.000%, 01/20/12 | 1,690 | 1,751 | ||||
CIT Group, Term Loan A-2 | ||||||
9.500%, 01/20/12 | 1,296 | 1,326 | ||||
CIT Group, Tranche A | ||||||
0.000%, 01/20/12 | 2,633 | 2,694 | ||||
Claire’s Stores | ||||||
3.001%, 05/27/14 | 4,122 | 3,626 | ||||
0.000%, 05/29/14 | 1,160 | 1,020 | ||||
Clear Channel | ||||||
3.884%, 01/29/16 | 318 | 257 | ||||
| 94 | SEI Institutional Managed Trust / Semi-Annual Report / March 31, 2010 |
Table of Contents
| Description | Face Amount ($ Thousands) | Market Value ($ Thousands) | ||||
DAE Aviation Holdings, Tranche B-1 | ||||||
4.000%, 07/31/14 | $ | 125 | $ | 118 | ||
4.000%, 07/31/14 | 235 | 221 | ||||
DAE Aviation Holdings, Tranche B-2 | ||||||
4.000%, 09/27/14 | 350 | 330 | ||||
3.990%, 09/27/14 | 1 | 1 | ||||
Dana, Term B Loan | ||||||
0.000%, 01/31/15 (J) | 655 | 643 | ||||
Dealer Computer Services | ||||||
7.751%, 04/26/14 | 3,450 | 3,260 | ||||
2.251%, 10/26/12 | 3 | 3 | ||||
Dex Media West | ||||||
7.500%, 10/24/14 | 146 | 140 | ||||
Dex Media West | ||||||
7.500%, 10/24/14 | 1,225 | 1,168 | ||||
Dex Media, Term Loan D-2 | ||||||
3.750%, 06/30/11 | 1,092 | 1,065 | ||||
Federal Mogul | ||||||
2.167%, 12/29/14 | 1,226 | 1,132 | ||||
Federal Mogul, Term C Loan | ||||||
2.167%, 12/28/15 | 623 | 575 | ||||
2.158%, 12/28/15 | 3 | 2 | ||||
First Data, Initial Tranche B-1 | ||||||
3.001%, 09/24/14 | 50 | 44 | ||||
2.999%, 09/24/14 | 28 | 25 | ||||
2.982%, 09/24/14 | 921 | 815 | ||||
First Data, Initial Tranche B-2 | ||||||
3.001%, 09/24/14 | 16 | 14 | ||||
2.999%, 09/24/14 | 310 | 274 | ||||
Ford Motor | ||||||
3.480%, 12/14/11 | 1,068 | 940 | ||||
Ford Motor, Revolving Credit | ||||||
0.000%, 12/14/11 (H) | 102 | 12 | ||||
Freescale Semiconductor | ||||||
12.500%, 12/15/14 | 2,656 | 2,725 | ||||
4.479%, 12/01/16 | 641 | 601 | ||||
2.005%, 12/01/13 (B) | 135 | 127 | ||||
Gambro Aktiebolag | ||||||
10.000%, 11/24/16 | 965 | 772 | ||||
5.000%, 05/24/16 | 922 | 820 | ||||
Georgia Pacific | ||||||
2.256%, 12/20/12 | 36 | 36 | ||||
2.240%, 12/20/12 | 213 | 212 | ||||
Greektown Casino | ||||||
0.000%, 12/03/12 (C) | 614 | 658 | ||||
Greektown Casino DIP, Revolving Credit | ||||||
0.000%, 09/30/10 (C) | 114 | — | ||||
Greektown Casino DIP, Term A Loan | ||||||
0.000%, 09/30/10 (J) | 1,086 | 1,097 | ||||
Greektown Casino, Incremental Term Loan | ||||||
0.000%, 12/03/12 (C) | 36 | 39 | ||||
Green Valley Ranch Gaming, 2nd Lien | ||||||
3.504%, 08/06/14 | 2,000 | 124 | ||||
| Description | Face Amount ($ Thousands) | Market Value ($ Thousands) | ||||
Green Valley Ranch, 1st Lien | ||||||
2.251%, 02/16/14 | $ | 12 | $ | 9 | ||
2.249%, 02/16/14 | 234 | 178 | ||||
2.249%, 02/16/14 | 310 | 236 | ||||
Guitar Center | ||||||
3.750%, 10/09/13 | 1,705 | 1,589 | ||||
3.740%, 10/09/13 | 128 | 119 | ||||
Harrah’s Operating | ||||||
9.500%, 01/28/15 | 3,000 | 3,102 | ||||
3.250%, 01/28/15 | 18 | 15 | ||||
3.249%, 01/28/15 | 1,240 | 1,066 | ||||
Hexion Specialty Chemicals, Term Loan C-1 | ||||||
2.563%, 05/05/13 | 1,217 | 1,146 | ||||
Hexion Specialty Chemicals, Term Loan C-2 | ||||||
2.563%, 05/05/13 | 462 | 435 | ||||
Iasis Healthcare | ||||||
5.499%, 06/13/14 | 4,111 | 3,820 | ||||
Ineos Group, Term C Loan | ||||||
0.000%, 12/16/14 (J) | 2 | 2 | ||||
Ineos Group, Term Loan B-2 | ||||||
9.501%, 12/16/13 | 1,539 | 1,506 | ||||
Ineos Group, Term Loan C-2 | ||||||
10.001%, 12/16/14 | 1,539 | 1,514 | ||||
Infor Enterprise Solutions, 2nd Lien | ||||||
0.000%, 03/02/14 (J) | 781 | 648 | ||||
0.000%, 03/02/14 (J) | 286 | 238 | ||||
Infor Global Enterprise Solutions, Tranche 1 | ||||||
6.479%, 03/02/14 | 1,583 | 1,313 | ||||
Infor Global Solutions | ||||||
8.230%, 08/29/14 | 2,425 | 1,524 | ||||
0.000%, 07/28/12 (J) | 573 | 553 | ||||
0.000%, 08/29/14 (J) | 210 | 132 | ||||
0.000%, 08/29/14 (J) | 800 | 503 | ||||
Infor Global Solutions, 2nd Lien | ||||||
6.479%, 03/02/14 | 917 | 760 | ||||
Intelsat Jackson Holding | ||||||
2.734%, 02/01/14 | 2,100 | 1,877 | ||||
Jacuzzi | ||||||
2.499%, 02/14/14 | 1,040 | 856 | ||||
2.489%, 02/14/14 | 1 | 1 | ||||
0.151%, 02/07/14 | 54 | 45 | ||||
Landry’s Restaurants | ||||||
8.000%, 05/13/11 | 1,649 | 1,647 | ||||
Lyondell Chemical Dutch, Tranche A | ||||||
3.731%, 12/20/13 | 166 | 130 | ||||
Lyondell Chemical, Dutch Revolving Credit Loan | ||||||
3.731%, 12/20/13 | 73 | 57 | ||||
Lyondell Chemical, German Tranche B-1 | ||||||
3.981%, 12/22/14 | 211 | 164 | ||||
| SEI Institutional Managed Trust / Semi-Annual Report / March 31, 2010 | 95 |
Table of Contents
SCHEDULE OF INVESTMENTS (Unaudited)
High Yield Bond Fund (Continued)
March 31, 2010
| Description | Face Amount ($ Thousands) | Market Value ($ Thousands) | ||||
Lyondell Chemical, German Tranche B-3 | ||||||
3.981%, 12/22/14 | $ | 211 | $ | 164 | ||
Lyondell Chemical, New DIP | ||||||
13.000%, 12/15/09 | 2,130 | 1,445 | ||||
Lyondell Chemical, Primary Revolving Credit | ||||||
3.731%, 04/30/14 | 275 | 215 | ||||
Lyondell Chemical, Roll-Up DIP | ||||||
6.560%, 12/15/09 | 1 | 1 | ||||
5.793%, 12/15/09 | 1,332 | 1,416 | ||||
Lyondell Chemical, Tranche A | ||||||
3.731%, 12/20/13 | 525 | 409 | ||||
Lyondell Chemical, Tranche B-2 | ||||||
3.981%, 12/22/14 | 211 | 164 | ||||
Lyondell Chemical, U.S. Tranche B-1 | ||||||
7.000%, 12/20/14 | 915 | 714 | ||||
Lyondell Chemical, U.S. Tranche B-2 | ||||||
7.000%, 12/22/13 | 915 | 714 | ||||
Lyondell Chemical, U.S. Tranche B-3 | ||||||
3.731%, 12/22/14 | 915 | 714 | ||||
Metroflag, 2nd Lien (C) | ||||||
14.000%, 01/06/09 | 300 | — | ||||
Nuveen Investments | ||||||
3.322%, 11/09/14 | 52 | 48 | ||||
Nuveen Investments, 2nd Lien | ||||||
12.500%, 07/31/15 | 543 | 579 | ||||
12.500%, 11/09/14 | 690 | 737 | ||||
Open Link Financial | ||||||
10.250%, 11/06/15 | 2,250 | 2,351 | ||||
OSI Restaurant Partners | ||||||
4.500%, 06/14/14 | 181 | 168 | ||||
2.563%, 06/14/13 | 56 | 51 | ||||
2.563%, 06/14/14 | 3,575 | 3,327 | ||||
0.077%, 06/14/13 | 186 | 173 | ||||
0.000%, 06/14/14 (B) | 315 | 293 | ||||
PQ | ||||||
6.730%, 06/14/14 | 1,297 | 1,185 | ||||
ProQuest, 2nd Lien | ||||||
6.010%, 02/09/15 | 1,100 | 1,015 | ||||
5.990%, 02/09/15 | 100 | 92 | ||||
Realogy, Tranche 1 | ||||||
3.250%, 10/13/13 | 495 | 436 | ||||
Realogy, Tranche 2 | ||||||
3.250%, 10/13/13 | 529 | 467 | ||||
Rexnord, Term B Loan | ||||||
7.252%, 03/01/13 | 2,220 | 1,443 | ||||
Reynold, 1st Lien | ||||||
6.250%, 10/24/12 | 1,500 | 1,513 | ||||
Rite Aid | ||||||
9.500%, 06/01/15 | 3,030 | 3,163 | ||||
Sabre Holdings | ||||||
2.479%, 09/30/14 | 631 | 588 | ||||
| Description | Face Amount ($ Thousands) | Market Value ($ Thousands) | ||||
Sabre, Initial Term Loan | ||||||
2.499%, 09/30/14 | $ | 588 | $ | 547 | ||
Simmons | ||||||
7.351%, 02/15/12 | 409 | 4 | ||||
7.313%, 02/15/12 | 1,227 | 12 | ||||
Targa Resources, Term B Loan | ||||||
0.000%, 02/09/16 (J) | 1,500 | 1,215 | ||||
Texas Competitive Electric Holdings, Term Loan B-2 | ||||||
3.751%, 10/10/14 | 80 | 66 | ||||
3.735%, 10/10/14 | 9,394 | 7,707 | ||||
Texas Competitive Electric Holdings, Term Loan B-3 | ||||||
3.751%, 10/10/14 | 3 | 2 | ||||
3.735%, 10/10/14 | 379 | 308 | ||||
Tronox DIP, Term Loan B-1 | ||||||
9.000%, 06/01/10 | 682 | 695 | ||||
Tronox DIP, Term Loan B-2 | ||||||
9.000%, 06/01/10 | 183 | 187 | ||||
Wide Open West Finance | ||||||
7.230%, 06/27/15 | 2,410 | �� | 2,104 | |||
Wide Open West Finance, 2nd Lien | ||||||
0.000%, 06/27/15 | 475 | 415 | ||||
Zuffa | ||||||
7.500%, 06/18/15 | 1,746 | 1,754 | ||||
Total Loan Participations | 109,234 | |||||
COLLATERALIZED DEBT OBLIGATIONS — 2.3% | ||||||
Financials — 2.0% | ||||||
ACAS Business Loan Trust, Ser 2007-2A, Cl A | ||||||
0.650%, 11/18/09 (A) (B) | 1,131 | 1,001 | ||||
ACAS CLO, Ser 2007-1A, Cl A1J | ||||||
0.559%, 04/20/21 (A) (B) | 3,150 | 2,425 | ||||
ARES CLO, Ser 2007-1A, Cl SUB | ||||||
0.000%, 04/16/21 (A) | 3,800 | 1,254 | ||||
CIFC Funding, Ser 2007-3A, Cl B | ||||||
1.499%, 07/26/21 (A) (B) | 2,500 | 1,496 | ||||
CIT CLO, Ser 2007-1A, Cl E | ||||||
5.271%, 06/20/21 (B) | 1,900 | 665 | ||||
CIT CLO, Ser 2007-1A, Cl D | ||||||
2.271%, 06/20/21 (A) (B) | 2,800 | 1,330 | ||||
Connecticut Valley Structured Credit CDO, Ser 2006-3A, Cl NOTE | ||||||
0.000%, 03/23/23 (A) | 2,200 | 5 | ||||
De Meer Middle Market CLO, Ser 2006-1A, Cl INC | ||||||
0.000%, 10/20/18 (A) | 3,366 | 1,119 | ||||
De Meer Middle Market CLO, Ser 2006-1A, Cl B | ||||||
0.649%, 10/20/18 (A) (B) | 1,029 | 813 | ||||
| 96 | SEI Institutional Managed Trust / Semi-Annual Report / March 31, 2010 |
Table of Contents
| Description | Face Amount ($ Thousands)/Shares | Market Value ($ Thousands) | ||||
Duane Street CLO, Ser 2007-5A, Cl SN | ||||||
0.000%, 10/14/21 (A) | $ | 3,300 | $ | 297 | ||
Emporia Preferred Funding, Cl C | ||||||
1.149%, 04/23/21 (A) (B) | 1,708 | 991 | ||||
Gleneagles CLO, Ser AI | ||||||
0.000%, 11/01/17 (B) | 7 | 260 | ||||
Hudson Straits CLO, Ser 2004-1A, Cl B | ||||||
1.001%, 10/15/16 (A) (B) | 2,100 | 1,722 | ||||
ING Investment Management II CLO | ||||||
0.000%, 08/01/20 (A) (B) | 3 | 1,056 | ||||
Lightpoint CLO, Ser 2006-4A, Cl INC | ||||||
0.000%, 04/15/18 (A) | 2,500 | 225 | ||||
Marathon CLO, Ser 2005-2A, Cl INC | ||||||
0.000%, 12/20/19 (A) | 3,000 | 750 | ||||
Peritus I CDO, Ser 2005-1A, Cl C | ||||||
9.000%, 05/24/15 (A) (C) | 12,701 | 6,732 | ||||
Rockwall CDO, Cl A1LA | ||||||
0.549%, 08/01/21 (A) (B) | 5,857 | 4,656 | ||||
Stanfield Bristol CLO, Ser 2005-1A, Cl SUB | ||||||
0.000%, 10/15/19 (A) | 6,300 | 630 | ||||
Stanfield Veyron CLO, Ser 2006-1A, Cl SUB | ||||||
0.000%, 07/15/18 | 2,300 | 552 | ||||
Tralee CDO, Ser 2007-1A, Cl SUB | ||||||
0.000%, 04/16/22 (A) | 2,700 | 270 | ||||
Waterfront CLO, Ser 2007-1A, Cl A2 | ||||||
0.684%, 08/02/20 (A) (B) | 1,181 | 903 | ||||
| 29,152 | ||||||
Other Asset-Backed Securities — 0.3% | ||||||
Grayson CLO, Cl A1B | ||||||
0.609%, 11/01/21 (A) (B) | 3,316 | 2,213 | ||||
Stone Tower CDO, Cl A1LA | ||||||
0.749%, 01/29/20 (A) (B) | 1,787 | 1,493 | ||||
| 3,706 | ||||||
Total Collateralized Debt Obligations | 32,858 | |||||
PREFERRED STOCK — 0.7% | ||||||
Axis Capital Holdings | 13 | 1,115 | ||||
7.500%, 12/01/15 (B) (F) | ||||||
BlackRock Insured Municipal Income Trust (B) | 14 | 1,169 | ||||
BlackRock Municipal Income Trust (B) | 42 | 3,527 | ||||
BlackRock MuniVest Fund (B) | 13 | 1,084 | ||||
BlackRock MuniYield Insured Fund (B) | 11 | 893 | ||||
Dana* | 5 | 345 | ||||
| Description | Shares/Face Amount ($ Thousands) | Market Value ($ Thousands) | ||||
GMAC | ||||||
7.000%, 12/31/11 (A) | 1 | $ | 530 | |||
Peritus I CDO, Ser 2007-1A* | 3,750 | 225 | ||||
Rockwall Investors* (A) | 4,000 | 40 | ||||
Stanfield Daytona CLO* | 3,200 | 1,208 | ||||
Total Preferred Stock | 10,136 | |||||
CONVERTIBLE BONDS — 0.6% | ||||||
ADC Telecommunications | ||||||
3.500%, 07/15/17 | $ | 555 | 415 | |||
ADC Telecommunications CV to 37.0336 | ||||||
3.500%, 07/15/15 | 750 | 612 | ||||
Century Aluminum CV to 32.7430 | ||||||
1.750%, 08/01/24 | 165 | 149 | ||||
Hologic CV to 25.9110 | ||||||
2.000%, 12/15/37 | 2,040 | 1,826 | ||||
L-1 Identity Solutions CV to 31.25 | ||||||
3.750%, 05/15/27 | 640 | 611 | ||||
Leap Wireless International CV to 10.729 | ||||||
4.500%, 07/15/14 | 1,200 | 1,044 | ||||
Liberty Media CV to 16.7764 | ||||||
3.750%, 02/15/30 | 540 | 284 | ||||
Liberty Media CV to 22.94686 | ||||||
4.000%, 11/15/29 | 375 | 203 | ||||
Lions Gate Entertainment CV to 86.9565 | ||||||
2.938%, 10/15/24 | 1,124 | 1,075 | ||||
Mirant | ||||||
0.000%, 07/15/49 (C) | 1,150 | — | ||||
Mirant CV to 14.7167 | ||||||
0.000%, 06/15/21 (C) | 2,200 | 4 | ||||
Morgans Hotel Group CV to 37.1903 | ||||||
2.375%, 10/15/14 | 1,275 | 953 | ||||
Standard Pacific | ||||||
6.000%, 10/01/12 | 430 | 421 | ||||
Vector Group | ||||||
5.750%, 06/15/26 (B) | 415 | 441 | ||||
Total Convertible Bonds | 8,038 | |||||
COMMON STOCK — 0.3% | ||||||
CIT Group* | 31,946 | 1,245 | ||||
Dana Holding* | 64,570 | 767 | ||||
Delta Air Lines* | 264 | 4 | ||||
Dex One* | 32,547 | 909 | ||||
Shreveport Gaming Holdings | 13,948 | 101 | ||||
Solutia* | 186 | 3 | ||||
Spectrum Brands* | 28,614 | 783 | ||||
VSS AHC, Cl A* (E) (K) | 38,453 | 459 | ||||
World Color Press* | 23,326 | 273 | ||||
Total Common Stock | 4,544 | |||||
| SEI Institutional Managed Trust / Semi-Annual Report / March 31, 2010 | 97 |
Table of Contents
SCHEDULE OF INVESTMENTS (Unaudited)
High Yield Bond Fund (Concluded)
March 31, 2010
| Description | Shares | Market Value ($ Thousands) | |||
Number of | |||||
WARRANTS — 0.0% | |||||
Atrium, Expires 2018* | 706 | $ | — | ||
Grande Communications, Expires 2011* | 850 | — | |||
World Color Press, Expires 2014* | 13,219 | 40 | |||
World Color Press, Expires 2014* | 13,219 | 69 | |||
Total Warrants | 109 | ||||
AFFILIATED PARTNERSHIP — 0.0% | |||||
SEI Liquidity Fund, L.P., | 6,085 | 6 | |||
Total Affiliated Partnership (Cost $6) ($ Thousands) | 6 | ||||
| Description | Shares | Market Value ($ Thousands) | |||
CASH EQUIVALENT — 5.2% | |||||
SEI Daily Income Trust, Prime Obligation Fund, Cl A, 0.070%**† | 76,429,084 | $ | 76,429 | ||
Total Cash Equivalent | 76,429 | ||||
Total Investments — 99.3% | $ | 1,445,029 | |||
A summary of outstanding swap agreements held by the Fund at March 31, 2010, is as follows:
| Credit Default Swaps | ||||||||||||||
| Counterparty | Reference Entity/Obligation | Buy/Sell Protection | (Pays)/ Receives Rate | Termination Date | Notional Amount (Thousands) | Net Unrealized Depreciation ($Thousands) | ||||||||
| Barclays Bank PLC | CDX.NA.HY.SERIES 13 12/14 | BUY | 5.00 | 12/20/14 | 14,355 | $ | (1,013 | ) | ||||||
Percentages are based on a Net Assets of $1,455,313 ($ Thousands).
| * | Non-income producing security. |
| ** | Rate shown is the 7-day effective yield as of March 31, 2010. |
| † | Investment in Affiliated Security (see Note 5). |
| ‡ | Real Estate Investment Trust. |
| (A) | Securities sold within terms of a private placement memorandum, exempt from registration under Section 144A of the Securities Act of 1933, as amended, and may be sold only to dealers in that program or other “accredited investors.” These securities have been determined to be liquid under guidelines established by the board of Trustees. |
| (B) | Variable Rate Security—The rate reported on the Schedule of Investments is the rate in effect as of March 31, 2010. The date reported on the Schedule of Investments is the maturity date. The effective date may be shorter. |
| (C) | Security in default on interest payments. |
| (D) | This security or a partial position of this security is on loan at March 31, 2010 (see Note 9). The total value of securities on loan at March 31, 2010 was $— ($ Thousands). |
| (E) | Security fair valued using methods determined in good faith by the Valuation Committee of the Board of Trustees. The total market value of such securities as of March 31, 2010 was $2,719 ($ Thousands) and represented 0.2% of Net Assets. |
| (F) | Step Bonds—The rate reflected on the Schedule of Investments is the effective yield on March 31, 2010. The coupon on a step bond changes on a specified date. |
| (G) | Zero coupon security. The rate reported on the Schedule of Investments is the effective yield at time of purchase. |
| (H) | Unfunded bank loan. |
| (I) | This security was purchased with cash collateral held from securities on loan (see Note 9). The total market value of such securities as of March 31, 2010 was $6 ($ Thousands). |
| (J) | Unsettled bank loan. Interest rate not available. |
| (K) | Security considered restricted. The total market value of such securities as of March 31, 2010 was $2,719 ($ Thousands) and represented 0.2% of Net Assets. |
CDO — Collateralized Debt Obligation
Cl — Class
CLO — Collateralized Loan Obligation
CV — Convertible Security
LTD — Limited
LLC — Limited Liability Company
LLP — Limited Liability Partnership
L.P. — Limited Partnership
MTN — Medium Term Note
PIK — Payment-in-Kind
PLC — Public Limited Company
Ser — Series
Amounts designated as “—” are $0 or have been rounded to $0
The following is a summary of the inputs used as of March 31, 2010 in valuing the Fund’s investments carried at value ($ Thousands):
| Investments in Securities | Level 1 | Level 2 | Level 3 | Total | ||||||||
Corporate Obligations | $ | — | $ | 1,199,851 | $ | 3,824 | $ | 1,203,675 | ||||
Collateralized Debt Obligations | — | 1,005 | 31,853 | 32,858 | ||||||||
Preferred Stock | — | 2,853 | 7,283 | 10,136 | ||||||||
Convertible Bonds | — | 8,034 | 4 | 8,038 | ||||||||
Common Stock | 4,085 | — | 459 | 4,544 | ||||||||
Warrants | — | 109 | — | 109 | ||||||||
Loan Participations | — | 101,644 | 7,590 | 109,234 | ||||||||
Cash Equivalent | 76,429 | — | — | 76,429 | ||||||||
Affiliated Partnership | — | 6 | — | 6 | ||||||||
Total Investments in Securities | $ | 80,514 | $ | 1,313,502 | $ | 51,013 | $ | 1,445,029 | ||||
| Other Financial Instruments | Level 1 | Level 2 | Level 3 | Total | ||||||||||
Credit Default Swaps* | $ | — | $ | (1,013 | ) | $ | — | $ | (1,013 | ) | ||||
| * | Swaps are valued at the unrealized depreciation on the instrument. |
| 98 | SEI Institutional Managed Trust / Semi-Annual Report / March 31, 2010 |
Table of Contents
The following is a reconciliation of the investments in which significant unobservable inputs (Level 3) were used in determining value ($ Thousands):
Corporate Obligations | Collateralized Debt Obligations | Preferred Stock | Convertible Bonds | Common Stock | Loan Participations | ||||||||||||||||||
Beginning balance as of October 1, 2009 | $ | 3,544 | $ | 36,616 | $ | — | $ | 4 | $ | 279 | $ | 20,916 | |||||||||||
Accrued discounts/premiums | 38 | 101 | — | — | — | 4 | |||||||||||||||||
Realized gain/(loss) | — | (9,028 | ) | — | — | — | (744 | ) | |||||||||||||||
Change in unrealized appreciation/(depreciation) | 2,783 | 32,907 | (116 | ) | — | — | (13,167 | ) | |||||||||||||||
Net purchases/sales | 114 | (16,337 | ) | 7,134 | — | (35 | ) | 29 | |||||||||||||||
Net transfer in and/or out of Level 3 | (2,655 | ) | (12,406 | ) | 265 | — | 215 | 552 | |||||||||||||||
Ending balance as of March 31, 2010 | $ | 3,824 | $ | 31,853 | $ | 7,283 | $ | 4 | $ | 459 | $ | 7,590 | |||||||||||
| Changes in unrealized gains (losses) included in earnings related to securities held at reporting date | $ | 157 | $ | 6,413 | $ | 150 | $ | — | $ | — | $ | 158 | |||||||||||
For more information on valuation inputs, see Note 2 — Significant Accounting Policies in Notes to Financial Statements.
The accompanying notes are an integral part of the financial statements.
| SEI Institutional Managed Trust / Semi-Annual Report / March 31, 2010 | 99 |
Table of Contents
SCHEDULE OF INVESTMENTS (Unaudited)
Real Return Fund
March 31, 2010
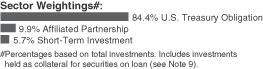
| Description | Face Amount ($ Thousands)/ Shares | Market Value ($ Thousands) | ||||
U.S. TREASURY OBLIGATIONS — 94.2% | ||||||
U.S. Treasury Bond TIPS | ||||||
2.000%, 04/15/12 to 01/15/16 (A) | $ | 33,700 | $ | 41,038 | ||
1.875%, 07/15/13 | 8,395 | 10,479 | ||||
1.625%, 01/15/15 | 13,275 | 15,738 | ||||
1.250%, 04/15/14 | 7,550 | 7,990 | ||||
0.875%, 04/15/10 | 6,725 | 7,694 | ||||
0.625%, 04/15/13 | 16,275 | 17,005 | ||||
U.S. Treasury Note | ||||||
3.375%, 07/31/13 | 3,900 | 4,105 | ||||
2.375%, 02/28/15 | 4,200 | 4,171 | ||||
1.500%, 07/15/12 | 15,575 | 15,697 | ||||
Total U.S. Treasury Obligations (Cost $122,491) ($ Thousands) | 123,917 | |||||
AFFILIATED PARTNERSHIP — 11.0% | ||||||
SEI Liquidity Fund, L.P., | 14,446,658 | 14,447 | ||||
Total Affiliated Partnership (Cost $14,447) ($ Thousands) | 14,447 | |||||
CASH EQUIVALENT — 6.3% | ||||||
SEI Daily Income Trust, | 8,365,890 | 8,366 | ||||
Total Cash Equivalent (Cost $8,366) ($ Thousands) | 8,366 | |||||
Total Investments — 111.5% (Cost $145,304) ($ Thousands) | $ | 146,730 | ||||
Percentages are based on a Net Assets of $131,584 ($ Thousands).
| * | Rate shown is the 7-day effective yield as of March 31, 2010. |
| † | Investment in Affiliated Security (see Note 5). |
| (A) | This security or a partial position of this security is on loan at March 31, 2010. The total value of securities on loan at March 31, 2010 was $12,287 ($ Thousands). |
| (B) | This security was purchased with cash collateral held from securities on loan (see Note 9). The total market value of such securities as of March 31, 2010 was $14,447 ($ Thousands). |
Cl — Class
L.P. — Limited Partnership
TIPS — Treasury Inflation Protected Security
The following is a summary of the inputs used as of March 31, 2010 in valuing the Fund’s investments carried at value ($ Thousands):
| Investments in Securities | Level 1 | Level 2 | Level 3 | Total | ||||||||
U.S. Treasury Obligations | $ | — | $ | 123,917 | $ | — | $ | 123,917 | ||||
Affiliated Partnership | — | 14,447 | — | 14,447 | ||||||||
Cash Equivalent | 8,366 | — | — | 8,366 | ||||||||
Total Investments in Securities | $ | 8,366 | $ | 138,364 | $ | — | $ | 146,730 | ||||
For more information on valuation inputs, see Note 2 — Significant Accounting Policies in Notes to Financial Statements.
The accompanying notes are an integral part of the financial statements.
| 100 | SEI Institutional Managed Trust / Semi-Annual Report / March 31, 2010 |
Table of Contents
SCHEDULE OF INVESTMENTS (Unaudited)
Multi-Strategy Alternative Fund
March 31, 2010

| Description | Shares | Market Value ($ Thousands) | |||
REGISTERED INVESTMENT COMPANIES — 98.0% | |||||
Aberdeen Equity Long Short Fund | 711 | $ | 8 | ||
AQR Diversified Arbitrage Fund | 738 | 8 | |||
Driehaus Active Income Fund | 1,084 | 12 | |||
DWS Disciplined Market Neutral Fund | 755 | 7 | |||
Highbridge Statistical Market Neutral Fund, Cl A | 630 | 10 | |||
JPMorgan Research Market Neutral Fund | 765 | 12 | |||
Manager AMG FW Alternative Fund* | 685 | 7 | |||
Merger Fund | 759 | 12 | |||
Rydex Managed Futures Strategy Fund, Cl H | 426 | 11 | |||
TFS Market Neutral Fund | 709 | 11 | |||
Total Registered Investment Companies | 98 | ||||
Total Investments — 98.0% | $ | 98 | |||
Percentages are based on Net Assets of $100 ($Thousands).
| * | Non-income producing security. |
Cl — Class
The following is a summary of the inputs used as of March 31, 2010 in valuing the Fund’s investments carried at value ($ Thousands):
| Investments in Securities | Level 1 | Level 2 | Level 3 | Total | ||||||||
Registered Investment Companies | $ | 98 | $ | — | $ | — | $ | 98 | ||||
Total Investments in Securities | $ | 98 | $ | — | $ | — | $ | 98 | ||||
For more information on valuation inputs, see Note 2 — Significant Accounting Policies in Notes to Financial Statements.
The accompanying notes are an integral part of the financial statements.
| SEI Institutional Managed Trust / Semi-Annual Report / March 31, 2010 | 101 |
Table of Contents
Statements of Assets and Liabilities ($ Thousands)
March 31, 2010 (Unaudited)
| Large Cap Fund(1) | Large Cap Value Fund | Large Cap Growth Fund | Tax-Managed Large Cap Fund | |||||||||||||
ASSETS: | ||||||||||||||||
Investments, at value† | $ | 1,245,725 | $ | 1,828,138 | * | $ | 1,889,438 | * | $ | 1,636,536 | * | |||||
Affiliated investment, at value†† | 36,024 | 184,047 | 195,361 | 202,072 | ||||||||||||
Cash | 13 | 61 | 7 | 14 | ||||||||||||
Foreign currency, at value††† | — | — | — | — | ||||||||||||
Receivable for investment securities sold | 5,282 | 28,326 | 91,170 | 48,614 | ||||||||||||
Receivable for fund shares sold | 2,703 | 743 | 831 | 1,090 | ||||||||||||
Dividends and interest receivable | 1,426 | 2,277 | 1,958 | 1,809 | ||||||||||||
Receivable for variation margin | — | — | — | 72,402 | ||||||||||||
Unrealized gain on foreign spot currency contracts | — | — | — | — | ||||||||||||
Prepaid expenses | 45 | 46 | 72 | 38 | ||||||||||||
Total Assets | 1,291,218 | 2,043,638 | 2,178,837 | 1,962,575 | ||||||||||||
LIABILITIES: | ||||||||||||||||
Payable upon return on securities loaned | — | 157,054 | 157,798 | 178,314 | ||||||||||||
Payable for investment securities purchased | 5,319 | — | 15,804 | 1,391 | ||||||||||||
Payable for fund shares redeemed | 1,755 | 2,194 | 2,213 | 3,320 | ||||||||||||
Payable to custodian | — | — | — | — | ||||||||||||
Payable for variation margin | 135 | 222 | 331 | 72,683 | ||||||||||||
Administration fees payable | 375 | 554 | 590 | 501 | ||||||||||||
Investment advisory fees payable | 381 | 458 | 584 | 471 | ||||||||||||
Shareholder servicing fees payable Class A | 161 | 338 | 270 | 253 | ||||||||||||
Shareholder servicing fees payable Class I | — | 2 | 2 | — | ||||||||||||
Chief Compliance Officer fees payable | — | 5 | 5 | 4 | ||||||||||||
Trustees fees payable | — | — | — | — | ||||||||||||
Administration servicing fees payable Class I | — | 2 | 2 | — | ||||||||||||
Unrealized loss on forward foreign currency contracts | — | — | — | — | ||||||||||||
Accrued expense payable | — | 152 | 169 | 133 | ||||||||||||
Total Liabilities | 8,126 | 160,981 | 177,768 | 257,070 | ||||||||||||
Net Assets | $1,283,092 | $1,882,657 | $2,001,069 | $1,705,505 | ||||||||||||
† Cost of investments and repurchase agreements | 1,130,684 | 1,576,661 | 1,475,141 | 1,304,120 | ||||||||||||
†† Cost of affiliated investments | 36,024 | 189,334 | 199,230 | 206,547 | ||||||||||||
††† Cost of foreign currency/(overdraft of foreign currency) | — | — | — | — | ||||||||||||
* Includes market value of securities on loan | — | 151,940 | 154,182 | 173,152 | ||||||||||||
NET ASSETS: | ||||||||||||||||
Paid-in-Capital — (unlimited authorization — no par value) | $ | 1,149,283 | $ | 2,257,867 | $ | 3,071,869 | $ | 2,079,607 | ||||||||
Undistributed (distributions in excess of) net investment income | 264 | 784 | 176 | 360 | ||||||||||||
Accumulated net realized gain (loss) on investments, option contracts, futures, swap contracts, swaptions and foreign currency | 17,987 | (622,745 | ) | (1,481,420 | ) | (702,674 | ) | |||||||||
Net unrealized appreciation on investments, affiliated investments and option contracts | 115,041 | 246,190 | 410,428 | 327,941 | ||||||||||||
Net unrealized appreciation (depreciation) on futures contracts | 517 | 561 | 16 | 271 | ||||||||||||
Net unrealized appreciation on forward foreign currency contracts, foreign currencies and translation of other assets and liabilities denominated in foreign currencies | — | — | — | — | ||||||||||||
Net Assets | $ | 1,283,092 | $ | 1,882,657 | $ | 2,001,069 | $ | 1,705,505 | ||||||||
Net Asset Value, Offering and Redemption Price Per Share — Class A | $11.01 | $15.18 | $19.68 | $11.26 | ||||||||||||
| | ($1,283,091,787 ÷ 116,546,993 shares | ) | | ($1,870,940,193 ÷ 123,239,771 shares | ) | | ($1,991,568,309 ÷ 101,214,487 shares | ) | | ($1,702,368,514 ÷ 151,235,796 shares | ) | |||||
Net Asset Value, Offering and Redemption Price Per Share — Class E | N/A | N/A | N/A | N/A | ||||||||||||
Net Asset Value, Offering and Redemption Price Per Share — Class I | N/A | $15.19 | $19.49 | N/A | ||||||||||||
| | ($11,716,961 ÷ 771,479 shares | ) | | ($9,500,836 ÷ 487,492 shares | ) | |||||||||||
Net Asset Value, Offering and Redemption Price Per Share — Class Y | N/A | N/A | N/A | $11.47 | ||||||||||||
| | ($3,136,020 ÷ 273,453 shares | ) | ||||||||||||||
Amounts designated as “—” are $0 or have been rounded to $0.
| (1) | Commenced operations on October 1, 2009. |
The accompanying notes are an integral part of the financial statements.
| 102 | SEI Institutional Managed Trust / Semi-Annual Report / March 31, 2010 |
Table of Contents
| S&P 500 Index Fund | Small Cap Fund(1) | Small Cap Value Fund | Small Cap Growth Fund | Tax-Managed Small Cap Fund | |||||||||
| $1,370,229 | * | $238,531 | $ 574,734 | * | $ 418,276 | * | $282,584 | * | |||||
| 250,786 | 12,602 | 169,930 | 91,713 | 15,147 | |||||||||
| 4 | 5 | 32 | — | 18 | |||||||||
| — | — | — | — | 1 | |||||||||
| 7,476 | 38,956 | 2,693 | 4,838 | 1,300 | |||||||||
| 259 | 593 | 306 | 252 | 336 | |||||||||
| 1,772 | 294 | 719 | 313 | 282 | |||||||||
| — | — | — | — | — | |||||||||
| — | — | 56 | — | — | |||||||||
| 107 | 1 | 15 | 11 | 6 | |||||||||
| 1,630,633 | 290,982 | 748,485 | 515,403 | 299,674 | |||||||||
| 220,012 | — | 136,753 | 60,997 | 650 | |||||||||
| — | 2,213 | 2,480 | 22,677 | 2,068 | |||||||||
| 13,984 | 357 | 1,035 | 661 | 457 | |||||||||
| — | — | — | 204 | — | |||||||||
| 140 | 385 | 225 | 130 | 69 | |||||||||
| 208 | 87 | 174 | 123 | 87 | |||||||||
| 36 | 147 | 316 | 213 | 135 | |||||||||
| 28 | 22 | 59 | 40 | 49 | |||||||||
| 1 | — | 1 | 1 | — | |||||||||
| 3 | — | 2 | 1 | 1 | |||||||||
| — | 3 | — | — | — | |||||||||
| 2 | — | 1 | 1 | — | |||||||||
| — | — | 56 | — | — | |||||||||
| 108 | 64 | 55 | 39 | 22 | |||||||||
| 234,522 | 3,278 | 141,157 | 85,087 | 3,538 | |||||||||
| $ 1,396,111 | $287,704 | $ 607,328 | $ 430,316 | $296,136 | |||||||||
| 760,658 | 209,468 | 496,107 | 336,026 | 223,774 | |||||||||
| 254,243 | 12,602 | 174,077 | 94,672 | 15,317 | |||||||||
| — | — | — | — | 1 | |||||||||
| 213,600 | — | 132,009 | 51,325 | 628 | |||||||||
| $ 844,635 | $249,336 | $ 732,959 | $ 681,799 | $325,529 | |||||||||
| 445 | (108 | ) | 49 | (89 | ) | 40 | |||||||
(55,723 | ) | 9,706 | (200,152 | ) | (330,608 | ) | (88,154 | ) | |||||
| 606,114 | 29,063 | 74,480 | 79,291 | 58,640 | |||||||||
| 640 | (296 | ) | (8 | ) | (77 | ) | 81 | ||||||
| — | | 3 | — | — | — | ||||||||
| $ 1,396,111 | $287,704 | $ 607,328 | $ 430,316 | $296,136 | |||||||||
| $31.90 | $11.20 | $15.43 | $14.61 | $10.87 | |||||||||
| ($415,791,977 ÷ 13,033,454 shares | ) | ($287,703,901 ÷ 25,679,233 shares) | | ($599,630,762 ÷ 38,860,469 shares | ) | ($425,805,475 ÷ 29,154,382 shares | ) | ($296,135,794 ÷ 27,250,337 shares | ) | ||||
| $32.02 | N/A | N/A | N/A | N/A | |||||||||
| ($970,962,806 ÷ 30,324,671 shares | ) | ||||||||||||
| $31.99 | N/A | $15.32 | $14.28 | N/A | |||||||||
| ($9,356,147 ÷ 292,458 shares | ) | ($7,697,216 ÷ 502,274 shares | ) | ($4,510,138 ÷ 315,927 shares | ) | ||||||||
| N/A | N/A | N/A | N/A | N/A | |||||||||
| SEI Institutional Managed Trust / Semi-Annual Report / March 31, 2010 | 103 |
Table of Contents
Statements of Assets and Liabilities ($ Thousands)
March 31, 2010 (Unaudited)
| Mid-Cap Fund | U.S. Managed Volatility Fund | Global Managed Volatility Fund | ||||||||||
ASSETS: | ||||||||||||
Investments, at value† | $ | 138,306 | * | $ | 366,776 | $ | 245,369 | |||||
Affiliated investment, at value†† | 46,387 | 9,835 | 11,263 | |||||||||
Repurchase agreement† | — | — | — | |||||||||
Cash | 10 | 17 | 1,718 | |||||||||
Foreign currency, at value††† | — | — | 603 | |||||||||
Cash collateral on futures | — | — | — | |||||||||
Cash collateral on swaps | — | — | — | |||||||||
Receivable for investment securities sold | — | 8,139 | — | |||||||||
Receivable for fund shares sold | 58 | 501 | 250 | |||||||||
Dividends and interest receivable | 207 | 703 | 1,391 | |||||||||
Receivable for variation margin | — | — | — | |||||||||
Swap contracts, at value†††† | — | — | — | |||||||||
Unrealized gain on forward foreign currency contracts | — | — | 580 | |||||||||
Prepaid expenses | 3 | 9 | 5 | |||||||||
Total Assets | 184,971 | 385,980 | 261,179 | |||||||||
LIABILITIES: | ||||||||||||
Payable upon return on securities loaned | 5,856 | — | — | |||||||||
Payable for investment securities purchased | — | 1,163 | — | |||||||||
Payable for fund shares redeemed | 123 | 804 | 218 | |||||||||
Payable to Affiliate | — | — | — | |||||||||
Payable for variation margin | 240 | 18 | 46 | |||||||||
Administration fees payable | 44 | 113 | 76 | |||||||||
Investment advisory fees payable | 47 | 128 | 100 | |||||||||
Shareholder servicing fees payable Class A | 31 | 71 | 54 | |||||||||
Shareholder servicing fees payable Class I | — | — | — | |||||||||
Chief Compliance Officer fees payable | — | 1 | 1 | |||||||||
Administration servicing fees payable Class I | — | — | — | |||||||||
Income distribution payable | — | — | — | |||||||||
Swap contracts, at value†††† | — | — | — | |||||||||
Options written, at value# | — | — | — | |||||||||
Swaptions, written, at value‡ | — | — | — | |||||||||
Unrealized loss on forward foreign currency contracts | — | — | 1,282 | |||||||||
Accrued expense payable | 12 | 31 | 37 | |||||||||
Total Liabilities | 6,353 | 2,329 | 1,814 | |||||||||
Net Assets | $ | 178,618 | $ | 383,651 | $ | 259,365 | ||||||
† Cost of investments and repurchase agreements | 113,378 | 307,313 | 224,898 | |||||||||
†† Cost of affiliated investments | 46,696 | 9,835 | 11,263 | |||||||||
††† Cost of foreign currency/(overdraft of foreign currency) | — | — | 602 | |||||||||
†††† Premiums received/(paid) | — | — | — | |||||||||
# Premiums received | — | — | — | |||||||||
‡ Premium received | — | — | — | |||||||||
* Includes market value of securities on loan | 5,657 | — | — | |||||||||
NET ASSETS: | ||||||||||||
Paid-in-Capital — (unlimited authorization — no par value) | $ | 209,601 | $ | 435,424 | $ | 307,268 | ||||||
Undistributed (distributions in excess of) net investment income | 56 | 148 | (12,375 | ) | ||||||||
Accumulated net realized gain (loss) on investments, option contracts, futures, swap contracts, swaptions and foreign currency | (55,630 | ) | (111,474 | ) | (55,393 | ) | ||||||
Net unrealized appreciation (depreciation) on investments, affiliated investments and option contracts | 24,619 | 59,463 | 20,471 | |||||||||
Net unrealized appreciation (depreciation) on futures contracts | (28 | ) | 90 | 91 | ||||||||
Net unrealized depreciation on swap contracts | — | — | — | |||||||||
Net unrealized appreciation on written swaptions | — | — | — | |||||||||
Net unrealized appreciation (depreciation) on forward foreign currency contracts, foreign currencies and translation of other assets and liabilities denominated in foreign currencies | — | — | (697 | ) | ||||||||
Net Assets | $ | 178,618 | $ | 383,651 | $ | 259,365 | ||||||
Net Asset Value, Offering and Redemption Price Per Share — Class A | $15.75 | $10.63 | $8.24 | |||||||||
| | ($177,898,798 ÷ 11,293,592 shares | ) | | ($383,605,826 ÷ 36,070,590 shares | ) | | ($259,350,702 ÷ 31,456,631 shares | ) | ||||
Net Asset Value, Offering and Redemption Price Per Share — Class I | $15.76 | $10.62 | $8.18 | |||||||||
| | ($718,807 ÷ 45,604 shares | ) | | ($44,694 ÷ 4,208 shares | ) | | ($14,009 ÷ 1,712 shares | ) | ||||
Amounts designated as “—” are $0 or have been rounded to $0.
(1) Commenced operations on March 31, 2010.
The accompanying notes are an integral part of the financial statements.
| 104 | SEI Institutional Managed Trust / Semi-Annual Report / March 31, 2010 |
Table of Contents
| Tax-Managed Managed Volatility Fund | Real Estate Fund | Enhanced Income Fund | Core Fixed Income Fund | U.S. Fixed Income Fund | High Yield Bond Fund | Real Return Fund | Multi-Strategy | |||||||||||||||
| $192,235 | $ 210,263 | * | $ 145,757 | $2,535,775 | * | $ 894,462 | * | $1,368,594 | * | $123,917 | * | $98 | ||||||||||
| 7,790 | 92,891 | 16,095 | 227,380 | 127,365 | 76,435 | 22,813 | — | |||||||||||||||
| — | — | 53,000 | — | — | — | — | — | |||||||||||||||
| 9 | — | 322 | 57 | 782 | 259 | — | 100 | |||||||||||||||
| — | — | — | 104 | — | — | — | — | |||||||||||||||
| — | — | 850 | — | — | — | — | — | |||||||||||||||
| — | — | — | 26,119 | — | — | — | — | |||||||||||||||
| — | 9,725 | 9,830 | 221,251 | 165,450 | 27,793 | — | — | |||||||||||||||
| 261 | 10,276 | 135 | 1,671 | 2,642 | 23,798 | 223 | — | |||||||||||||||
| 339 | 788 | 531 | 20,054 | 5,586 | 28,988 | 475 | — | |||||||||||||||
| — | — | 8 | 586 | 15 | 1,020 | — | — | |||||||||||||||
| — | — | — | 14,113 | 1,207 | — | — | — | |||||||||||||||
| — | — | — | 116 | — | — | — | — | |||||||||||||||
| 5 | 5 | 9 | 59 | 17 | 32 | 2 | — | |||||||||||||||
| 200,639 | 323,948 | 226,537 | 3,047,285 | 1,197,526 | 1,526,919 | 147,430 | 198 | |||||||||||||||
| — | 80,160 | — | 213,330 | 96,781 | 6 | 14,447 | — | |||||||||||||||
| 26 | 2,491 | 8,774 | 309,851 | 203,929 | 62,810 | — | 98 | |||||||||||||||
| 503 | 571 | 3,157 | 5,495 | 1,021 | 4,581 | 1,342 | — | |||||||||||||||
| — | — | — | — | — | 1,667 | — | — | |||||||||||||||
| 15 | — | 22 | 24 | — | — | — | — | |||||||||||||||
| 58 | 67 | 25 | 591 | 209 | 411 | 25 | — | |||||||||||||||
| 64 | 118 | 65 | 534 | 191 | 527 | 24 | — | |||||||||||||||
| 39 | 26 | — | 192 | 78 | 48 | — | — | |||||||||||||||
| — | — | — | 3 | — | — | — | — | |||||||||||||||
| — | 1 | 1 | 6 | 2 | 3 | — | — | |||||||||||||||
| — | — | — | 3 | — | — | — | — | |||||||||||||||
| — | — | — | 645 | 115 | 1,364 | — | — | |||||||||||||||
| — | — | — | 37,857 | — | 24 | — | — | |||||||||||||||
| — | — | — | 64 | — | — | — | — | |||||||||||||||
| — | — | — | 1,319 | — | — | — | — | |||||||||||||||
| — | — | — | — | — | — | — | — | |||||||||||||||
| 13 | 17 | 23 | 319 | 88 | 165 | 8 | — | |||||||||||||||
| 718 | 83,451 | 12,067 | 570,233 | 302,414 | 71,606 | 15,846 | 98 | |||||||||||||||
| $199,921 | $ 240,497 | $ 214,470 | $2,477,052 | $ 895,112 | $1,455,313 | $131,584 | $100 | |||||||||||||||
| 158,209 | 149,963 | 209,815 | 2,608,266 | 877,089 | 1,323,000 | 122,491 | 98 | |||||||||||||||
| 7,790 | 94,550 | 16,095 | 231,641 | 127,365 | 76,435 | 22,813 | — | |||||||||||||||
| — | — | — | 102 | — | — | — | — | |||||||||||||||
| — | — | — | (13,388 | ) | 1,712 | 989 | — | — | ||||||||||||||
| — | — | — | (95 | ) | — | — | — | — | ||||||||||||||
| — | — | — | 1,595 | — | — | — | — | |||||||||||||||
| — | 77,454 | — | 205,987 | 94,139 | — | 12,287 | — | |||||||||||||||
| $186,518 | $ 301,636 | $ 343,244 | $2,689,002 | $ 873,956 | $1,766,728 | $128,707 | $100 | |||||||||||||||
| 31 | (648 | ) | 816 | (3,293 | ) | (4,378 | ) | 10,365 | 33 | — | ||||||||||||
| (20,720 | ) | (119,132 | ) | (118,542 | ) | (121,252 | ) | 8,650 | (366,361 | ) | 1,418 | — | ||||||||||
| 34,026 | 58,641 | (11,058 | ) | (76,721 | ) | 17,373 | 45,594 | 1,426 | — | |||||||||||||
| 66 | — | 6 | (701 | ) | 16 | — | — | — | ||||||||||||||
| — | — | — | (10,356 | ) | (505 | ) | (1,013 | ) | — | — | ||||||||||||
| — | — | — | 276 | — | — | — | — | |||||||||||||||
| — | — | 4 | 97 | — | — | — | — | |||||||||||||||
| $199,921 | $ 240,497 | $ 214,470 | $2,477,052 | $ 895,112 | $1,455,313 | $131,584 | $100 | |||||||||||||||
| $8.99 | $10.86 | $7.44 | $10.36 | $10.34 | $7.12 | $10.35 | $10.00 | |||||||||||||||
| ($199,920,909 ÷ 22,229,621 shares | ) | ($240,242,916 ÷ 22,119,684 shares | ) | ($214,407,876 ÷ 28,817,970 shares | ) | ($2,462,808,394 ÷ 237,697,876 shares | ) | ($895,111,756 ÷ 86,601,575 shares | ) | ($1,455,050,057 ÷ 204,249,838 shares | ) | ($131,584,310 ÷ 12,712,980 shares | ) | ($100,000 ÷ 10,000 shares | ) | |||||||
| N/A | $10.85 | $7.44 | $10.36 | N/A | $7.13 | N/A | N/A | |||||||||||||||
| ($253,601 ÷ 23,364 shares | ) | ($62,601 ÷ 8,419.59 shares | ) | ($14,243,558 ÷ 1,375,402 shares | ) | ($262,512 36,827 shares | ) | |||||||||||||||
| SEI Institutional Managed Trust / Semi-Annual Report / March 31, 2010 | 105 |
Table of Contents
Statements of Operations ($ Thousands)
For the six month period ended March 31, 2010 (Unaudited)
| Large Cap Fund(1) | Large Cap Value Fund | Large Cap Growth Fund | ||||||||||
Investment Income: | ||||||||||||
Dividends | $ | 11,278 | $ | 22,405 | $ | 16,291 | ||||||
Dividends from Affiliated Investments* | 23 | 20 | 26 | |||||||||
Interest Income | 35 | 5 | 8 | |||||||||
Securities Lending Income — Net** | — | 270 | 138 | |||||||||
Less: Foreign Taxes Witheld | (11 | ) | (12 | ) | (39 | ) | ||||||
Total Investment Income | 11,325 | 22,688 | 16,424 | |||||||||
Expenses: | ||||||||||||
Investment Advisory Fees | 2,268 | 3,196 | 3,992 | |||||||||
Administration Fees | 2,035 | 3,196 | 3,493 | |||||||||
Shareholder Servicing Fees Class (A) | 1,454 | 2,269 | 2,483 | |||||||||
Shareholder Servicing Fees Class (I) | — | 14 | 12 | |||||||||
Shareholder Servicing Fees Class (Y) | — | — | — | |||||||||
Trustee Fees | 3 | 18 | 20 | |||||||||
Administration Servicing Fees Class (I) | — | 14 | 12 | |||||||||
Chief Compliance Officer Fees | 1 | 5 | 5 | |||||||||
Printing Fees | 17 | 83 | 92 | |||||||||
Professional Fees | 13 | 61 | 68 | |||||||||
Custodian/Wire Agent Fees | 14 | 73 | 79 | |||||||||
Registration Fees | 1 | 31 | 28 | |||||||||
Licensing Fees | — | — | — | |||||||||
Other Expenses | 6 | 31 | 33 | |||||||||
Total Expenses | 5,812 | 8,991 | 10,317 | |||||||||
Less: | ||||||||||||
Waiver of Investment Advisory Fees | (194 | ) | (548 | ) | (490 | ) | ||||||
Waiver of Shareholder Servicing Fees Class (A) | (438 | ) | (299 | ) | (891 | ) | ||||||
Waiver of Shareholder Servicing Fees Class (I) | — | (4 | ) | (6 | ) | |||||||
Waiver of Shareholder Servicing Fees Class (Y) | — | — | — | |||||||||
Waiver of Administration Fees | — | — | — | |||||||||
Fees Paid Indirectly | (5 | ) | — | (38 | ) | |||||||
Net Expenses | 5,175 | 8,140 | 8,892 | |||||||||
Net Investment Income (Loss) | 6,150 | 14,548 | 7,532 | |||||||||
Net Realized and Unrealized Gain on Investments: | ||||||||||||
Net Realized Gain (Loss) on: | ||||||||||||
Investments | 15,714 | 34,135 | 98,442 | |||||||||
Futures Contracts | 7,593 | 2,443 | 1,631 | |||||||||
Foreign Currency Transactions | — | — | — | |||||||||
Net Change in Unrealized Appreciation (Depreciation) on: | ||||||||||||
Investments | 115,041 | 139,520 | 122,709 | |||||||||
Affiliated Investments | — | 976 | 603 | |||||||||
Futures Contracts | 517 | 305 | (277 | ) | ||||||||
Foreign Currency and Translation of Other Assets and Liabilities Denominated in Foreign Currency | — | — | — | |||||||||
Net Increase in Net Assets from Operations | $ | 145,015 | $ | 191,927 | $ | 230,640 | ||||||
Amounts designated as “—” are $0 or have been rounded to $0.
| * | See Note 5 in Notes to Financial Statements. |
| ** | Affiliated |
| (1) | Commenced operations on October 1, 2009. |
The accompanying notes are an integral part of the financial statements.
| 106 | SEI Institutional Managed Trust / Semi-Annual Report / March 31, 2010 |
Table of Contents
| Tax-Managed Large Cap Fund | S&P 500 Index Fund | Small Cap Fund(1) | Small Cap Value Fund | Small Cap Growth Fund | Tax-Managed Small Cap Fund | |||||||||||||||||
| $ | 15,189 | $ | 15,979 | $ | 1,686 | $ | 4,866 | $ | 2,110 | $ | 1,936 | |||||||||||
| 19 | 12 | 8 | 27 | 8 | 6 | |||||||||||||||||
| 3 | 1 | 16 | 1 | 1 | 1 | |||||||||||||||||
| 309 | 149 | — | 109 | 80 | 49 | |||||||||||||||||
| (25 | ) | — | (4 | ) | (11 | ) | (1 | ) | (2 | ) | ||||||||||||
| 15,495 | 16,141 | 1,706 | 4,992 | 2,198 | 1,990 | |||||||||||||||||
| 3,273 | 199 | 817 | 1,855 | 1,294 | 882 | |||||||||||||||||
| 2,864 | 1,459 | 440 | 999 | 697 | 475 | |||||||||||||||||
| 2,042 | 508 | 314 | 705 | 493 | 339 | |||||||||||||||||
| — | 11 | — | 9 | 5 | — | |||||||||||||||||
| 2 | — | — | — | — | — | |||||||||||||||||
| 16 | 13 | 5 | 6 | 4 | 3 | |||||||||||||||||
| — | 11 | — | 9 | 5 | — | |||||||||||||||||
| 4 | 3 | 1 | 2 | 1 | 1 | |||||||||||||||||
| 74 | 59 | 29 | 27 | 20 | 12 | |||||||||||||||||
| 54 | 43 | 22 | 20 | 14 | 9 | |||||||||||||||||
| 64 | 52 | 24 | 23 | 17 | 10 | |||||||||||||||||
| 21 | 22 | 1 | 9 | 6 | 3 | |||||||||||||||||
| — | 76 | — | — | — | — | |||||||||||||||||
| 29 | 21 | 8 | 13 | 11 | 9 | |||||||||||||||||
| 8,443 | 2,477 | 1,661 | 3,677 | 2,567 | 1,743 | |||||||||||||||||
| (561 | ) | — | (55 | ) | (45 | ) | (76 | ) | (139 | ) | ||||||||||||
| (584 | ) | (142 | ) | (171 | ) | (351 | ) | (272 | ) | (83 | ) | |||||||||||
| — | (4 | ) | — | (6 | ) | (3 | ) | — | ||||||||||||||
| (2 | ) | — | — | — | — | — | ||||||||||||||||
| (3 | ) | (289 | ) | — | — | — | — | |||||||||||||||
| (16 | ) | — | (2 | ) | (13 | ) | (1 | ) | (15 | ) | ||||||||||||
| 7,277 | 2,042 | 1,433 | 3,262 | 2,215 | 1,506 | |||||||||||||||||
| 8,218 | 14,099 | 273 | 1,730 | (17 | ) | 484 | ||||||||||||||||
| 37,103 | 1,305 | 7,937 | 26,587 | 34,227 | 13,263 | |||||||||||||||||
| 2,823 | 2,962 | 1,950 | 561 | 429 | 1,108 | |||||||||||||||||
| — | — | 5 | (6 | ) | 2 | (1 | ) | |||||||||||||||
| 129,225 | 129,463 | 29,063 | 39,960 | 10,964 | 25,655 | |||||||||||||||||
| 144 | (15 | ) | — | (74 | ) | (50 | ) | 10 | ||||||||||||||
| (353 | ) | 340 | (296 | ) | 141 | (191 | ) | (114 | ) | |||||||||||||
| — | — | 3 | 4 | — | — | |||||||||||||||||
| $ | 177,160 | $ | 148,154 | $ | 38,935 | $ | 68,903 | $ | 45,364 | $ | 40,405 | |||||||||||
| SEI Institutional Managed Trust / Semi-Annual Report / March 31, 2010 | 107 |
Table of Contents
Statements of Operations ($ Thousands)
For the six month period ended March 31, 2010 (Unaudited)
| Mid-Cap Fund | U.S. Managed Volatility Fund | Global Managed Volatility Fund | ||||||||||
Investment Income: | ||||||||||||
Dividends | $ | 1,072 | $ | 4,689 | $ | 2,935 | ||||||
Dividends from Affiliated Investments* | 3 | 5 | 6 | |||||||||
Interest Income | — | 1 | 8 | |||||||||
Securities Lending Income — Net** | 10 | — | — | |||||||||
Less: Foreign Taxes Witheld | — | (26 | ) | (182 | ) | |||||||
Total Investment Income | 1,085 | 4,669 | 2,767 | |||||||||
Expenses: | ||||||||||||
Investment Advisory Fees | 271 | 1,213 | 769 | |||||||||
Administration Fees | 237 | 653 | 414 | |||||||||
Shareholder Servicing Fees Class (A) | 168 | 466 | 296 | |||||||||
Shareholder Servicing Fees Class (I) | 1 | — | — | |||||||||
Trustee Fees | 1 | 4 | 2 | |||||||||
Administration Servicing Fees Class (I) | 1 | — | — | |||||||||
Chief Compliance Officer Fees | — | 1 | 1 | |||||||||
Printing Fees | 6 | 17 | 10 | |||||||||
Professional Fees | 4 | 13 | 7 | |||||||||
Custodian/Wire Agent Fees | 5 | 15 | 24 | |||||||||
Registration Fees | 1 | 5 | 3 | |||||||||
Overdraft fees | — | — | 1 | |||||||||
Other Expenses | 4 | 8 | 13 | |||||||||
Total Expenses | 699 | 2,395 | 1,540 | |||||||||
Less: | ||||||||||||
Waiver of Investment Advisory Fees | (4 | ) | (476 | ) | (226 | ) | ||||||
Waiver of Shareholder Servicing Fees Class (A) | (5 | ) | (53 | ) | — | |||||||
Waiver of Shareholder Servicing Fees Class (I) | — | — | — | |||||||||
Waiver of Administration Fees | — | — | — | |||||||||
Fees Paid Indirectly | — | — | — | |||||||||
Net Expenses | 690 | 1,866 | 1,314 | |||||||||
Net Investment Income | 395 | 2,803 | 1,453 | |||||||||
Net Realized and Unrealized Gain on Investments: | ||||||||||||
Net Realized Gain (Loss) on: | ||||||||||||
Investments | 8,600 | 12,139 | 7,065 | |||||||||
Affiliated Investments | — | — | — | |||||||||
Futures Contracts | 256 | 268 | 1,204 | |||||||||
Written Options | — | — | — | |||||||||
Written Swaptions | — | — | — | |||||||||
Swap Contracts | — | — | — | |||||||||
Foreign Currency Transactions | — | — | 2,752 | |||||||||
Net Change in Unrealized Appreciation (Depreciation) on: | ||||||||||||
Investments | 6,877 | 25,043 | 1,597 | |||||||||
Affiliated Investments | 57 | — | — | |||||||||
Futures Contracts | (139 | ) | (91 | ) | (8 | ) | ||||||
Written Options | — | — | — | |||||||||
Swaptions | — | — | — | |||||||||
Swap Contracts | — | — | — | |||||||||
Foreign Currency and Translation of Other Assets and Liabilities Denominated in Foreign Currency | — | — | 145 | |||||||||
Net Increase in Net Assets from Operations | $ | 16,046 | $ | 40,162 | $ | 14,208 | ||||||
Amounts designated as “—” are $0 or have been rounded to $0.
| * | See Note 5 in Notes to Financial Statements. |
| ** | Affiliated |
| (1) | Commenced operations on March 31, 2010. Fund did not generate any income or expenses during the period indicated. |
The accompanying notes are an integral part of the financial statements.
| 108 | SEI Institutional Managed Trust / Semi-Annual Report / March 31, 2010 |
Table of Contents
| Tax-Managed Managed Volatility Fund | Real Estate Fund | Enhanced Income Fund | Core Fixed Income Fund | U.S. Fixed Income Fund | High Yield Bond Fund | Real Return Fund | Multi-Strategy Alternative Fund(1) | ||||||||||||||||||||||
| $ | 2,383 | $ | 3,416 | $ | — | $ | 59 | $ | — | $ | 401 | $ | 2 | $ | — | ||||||||||||||
| 5 | 8 | 7 | 25 | 17 | 28 | — | — | ||||||||||||||||||||||
| — | — | 4,685 | 65,285 | 15,908 | 73,931 | 1,087 | — | ||||||||||||||||||||||
| — | 46 | — | 124 | 74 | 1 | 4 | — | ||||||||||||||||||||||
| (11 | ) | (19 | ) | — | (279 | ) | — | (14 | ) | — | — | ||||||||||||||||||
| 2,377 | 3,451 | 4,692 | 65,214 | 15,999 | 74,347 | 1,093 | — | ||||||||||||||||||||||
| 597 | 681 | 411 | 3,379 | 1,115 | 3,340 | 123 | — | ||||||||||||||||||||||
| 321 | 367 | 359 | 3,441 | 1,135 | 2,398 | 195 | — | ||||||||||||||||||||||
| 229 | 262 | 257 | 3,055 | 1,013 | 1,713 | 140 | — | ||||||||||||||||||||||
| — | — | — | 18 | — | — | — | — | ||||||||||||||||||||||
| 2 | 2 | 2 | 24 | 7 | 13 | 1 | — | ||||||||||||||||||||||
| — | — | — | 18 | — | — | — | — | ||||||||||||||||||||||
| — | 1 | 1 | 6 | 2 | 4 | — | — | ||||||||||||||||||||||
| 8 | 10 | 10 | 107 | 34 | 61 | 5 | — | ||||||||||||||||||||||
| 6 | 7 | 7 | 80 | 24 | 45 | 3 | — | ||||||||||||||||||||||
| 7 | 9 | 28 | 104 | 20 | 51 | 2 | — | ||||||||||||||||||||||
| 2 | 3 | 3 | 39 | 4 | 16 | — | — | ||||||||||||||||||||||
| — | — | — | — | — | — | — | — | ||||||||||||||||||||||
| 4 | 4 | 36 | 216 | 23 | 120 | 4 | — | ||||||||||||||||||||||
| 1,176 | 1,346 | 1,114 | 10,487 | 3,377 | 7,761 | 473 | — | ||||||||||||||||||||||
| (245 | ) | (36 | ) | (56 | ) | (276 | ) | (72 | ) | (266 | ) | (6 | ) | — | |||||||||||||||
| (13 | ) | (109 | ) | (257 | ) | (1,948 | ) | (630 | ) | (1,396 | ) | (131 | ) | — | |||||||||||||||
| — | — | — | (13 | ) | — | — | — | — | |||||||||||||||||||||
| — | — | (184 | ) | — | — | — | (83 | ) | — | ||||||||||||||||||||
| — | (5 | ) | — | — | — | — | — | — | |||||||||||||||||||||
| 918 | 1,196 | 617 | 8,250 | 2,675 | 6,099 | 253 | — | ||||||||||||||||||||||
| 1,459 | 2,255 | 4,075 | 56,964 | 13,324 | 68,248 | 840 | — | ||||||||||||||||||||||
| 1,624 | 7,948 | (21,038 | ) | 11,778 | 6,646 | 37,112 | 1,544 | — | |||||||||||||||||||||
| — | — | — | — | — | (2 | ) | — | — | |||||||||||||||||||||
| 360 | — | (659 | ) | 5,327 | 131 | — | — | — | |||||||||||||||||||||
| — | — | — | 530 | — | — | — | — | ||||||||||||||||||||||
| — | — | — | 758 | — | — | — | — | ||||||||||||||||||||||
| — | — | — | (6,185 | ) | (204 | ) | (329 | ) | — | — | |||||||||||||||||||
| — | 3 | — | 107 | — | — | — | — | ||||||||||||||||||||||
| 17,203 | 25,216 | 29,039 | 74,704 | 2,350 | 80,118 | 667 | — | ||||||||||||||||||||||
| — | (17 | ) | — | (390 | ) | — | — | — | — | ||||||||||||||||||||
| 5 | — | 299 | (3,001 | ) | 16 | — | — | — | |||||||||||||||||||||
| — | — | — | 112 | — | — | — | — | ||||||||||||||||||||||
| — | — | — | 164 | — | — | — | — | ||||||||||||||||||||||
| — | — | — | 8,695 | (207 | ) | (1,013 | ) | — | — | ||||||||||||||||||||
| | — | | (1 | ) | — | (226 | ) | — | — | — | — | ||||||||||||||||||
| $ | 20,651 | $ | 35,404 | $ | 11,716 | $ | 149,337 | $ | 22,056 | $ | 184,134 | $ | 3,051 | $ | — | ||||||||||||||
| SEI Institutional Managed Trust / Semi-Annual Report / March 31, 2010 | 109 |
Table of Contents
Statements of Changes in Net Assets ($ Thousands)
For the six month period ended March 31, 2010 (Unaudited) and the year ended September 30, 2009
| Large Cap Fund(2) | Large Cap | Large Cap | ||||||||||||||||||
| 10/01/09 to 03/31/10 | 10/01/09 to 03/31/10 | 10/01/08 to 09/30/09 | 10/01/09 to 03/31/10 | 10/01/08 to 09/30/09 | ||||||||||||||||
Operations: | ||||||||||||||||||||
Net Investment Income (Loss) | $ | 6,150 | $ | 14,548 | $ | 41,578 | $ | 7,532 | $ | 13,342 | ||||||||||
Net Realized Gain (Loss) from Investments and Futures Contracts | 23,307 | 36,578 | (573,490 | ) | 100,073 | (477,760 | ) | |||||||||||||
Net Realized Gain (Loss) on Foreign Currency Transactions | — | — | — | — | — | |||||||||||||||
Net Change in Unrealized Appreciation (Depreciation) of Investments, Affiliated Investments and Futures Contracts | 115,558 | 140,801 | 221,865 | 123,035 | 276,995 | |||||||||||||||
Net Change in Unrealized Appreciation (Depreciation) on Foreign Currency and Translation of Other Assets and Liabilities Denominated in Foreign Currency | — | — | — | — | — | |||||||||||||||
Net Decrease in Net Assets from Operations | 145,015 | 191,927 | (310,047 | ) | 230,640 | (187,423 | ) | |||||||||||||
Dividends and Distributions From: | ||||||||||||||||||||
Net Investment Income: | ||||||||||||||||||||
Class A | (5,886 | ) | (21,575 | ) | (47,346 | ) | (9,894 | ) | (13,281 | ) | ||||||||||
Class E | — | — | — | — | — | |||||||||||||||
Class I | — | (114 | ) | (239 | ) | (30 | ) | (37 | ) | |||||||||||
Class Y | — | — | — | — | — | |||||||||||||||
Net Capital Gains: | ||||||||||||||||||||
Class A | (5,320 | ) | — | — | — | — | ||||||||||||||
Class E | — | — | — | — | — | |||||||||||||||
Class I | — | — | — | — | — | |||||||||||||||
Total Dividends and Distributions | (11,206 | ) | (21,689 | ) | (47,585 | ) | (9,924 | ) | (13,318 | ) | ||||||||||
Capital Share Transactions(1): | ||||||||||||||||||||
Class A: | ||||||||||||||||||||
Proceeds from Shares Issued | 1,423,253 | 157,275 | 645,382 | 152,187 | 680,308 | |||||||||||||||
Reinvestment of Dividends and Distributions | 10,832 | 20,538 | 44,915 | 9,430 | 12,627 | |||||||||||||||
Cost of Shares Redeemed | (284,802 | ) | (319,561 | ) | (870,910 | ) | (423,800 | ) | (929,855 | ) | ||||||||||
Increase (Decrease) in Net Assets Derived from Class A Transactions | 1,149,283 | (141,748 | ) | (180,613 | ) | (262,183 | ) | (236,920 | ) | |||||||||||
Class E: | ||||||||||||||||||||
Proceeds from Shares Issued | — | — | — | — | — | |||||||||||||||
Reinvestment of Dividends and Distributions | — | — | — | — | — | |||||||||||||||
Cost of Shares Redeemed | — | — | — | — | — | |||||||||||||||
Increase in Net Assets Derived from Class E Transactions | — | — | — | — | — | |||||||||||||||
Class I: | ||||||||||||||||||||
Proceeds from Shares Issued | — | 1,361 | 5,835 | 1,375 | 5,304 | |||||||||||||||
Reinvestment of Dividends and Distributions | — | 98 | 217 | 24 | 31 | |||||||||||||||
Cost of Shares Redeemed | — | (2,255 | ) | (4,716 | ) | (2,112 | ) | (4,172 | ) | |||||||||||
Increase (Decrease) in Net Assets Derived from Class I Transactions | — | (796 | ) | 1,336 | (713 | ) | 1,163 | |||||||||||||
Class Y: | ||||||||||||||||||||
Proceeds from Shares Issued | — | — | — | — | — | |||||||||||||||
Reinvestment of Dividends and Distributions | — | — | — | — | — | |||||||||||||||
Cost of Shares Redeemed | — | — | — | — | — | |||||||||||||||
Increase (Decrease) in Net Assets Derived from Class Y Transactions | — | — | — | — | — | |||||||||||||||
Increase (Decrease) in Net Assets Derived from Capital Share Transactions | 1,149,283 | (142,544 | ) | (179,277 | ) | (262,896 | ) | (235,757 | ) | |||||||||||
Net Increase (Decrease) in Net Assets | 1,283,092 | 27,694 | (536,909 | ) | (42,180 | ) | (436,498 | ) | ||||||||||||
Net Assets: | ||||||||||||||||||||
Beginning of Year/Period | — | 1,854,963 | 2,391,872 | 2,043,249 | 2,479,747 | |||||||||||||||
End of Year/Period | 1,283,092 | $ | 1,882,657 | $ | 1,854,963 | $ | 2,001,069 | $ | 2,043,249 | |||||||||||
Undistributed (Distributions in Excess of) Net Investment Income Included in Net Assets at Period End | $ | 264 | $ | 784 | $ | 7,925 | $ | 176 | $ | 2,568 | ||||||||||
| (1) | See Note 6 in Notes to Financial Statements for additional information. |
| (2) | Commenced operations on October 1, 2009. |
Amounts designated as “—” are $0 or have been rounded to $0.
The accompanying notes are an integral part of the financial statements.
| 110 | SEI Institutional Managed Trust / Semi-Annual Report / March 31, 2010 |
Table of Contents
Tax-Managed | S&P 500 | Small Cap Fund(2) | Small Cap | Small Cap | ||||||||||||||||||||||||||||||
10/01/09 to 03/31/10 | 10/01/08 to 09/30/09 | 10/01/09 to 03/31/10 | 10/01/08 to 09/30/09 | 10/01/09 to 03/31/10 | 10/01/09 to 03/31/10 | 10/01/08 to 09/30/09 | 10/01/09 to 03/31/10 | 10/01/08 to 09/30/09 | ||||||||||||||||||||||||||
| $ | 8,218 | $ | 21,534 | $ | 14,099 | $ | 25,014 | $ | 273 | $ | 1,730 | $ | 5,722 | $ | (17 | ) | $ | 706 | ||||||||||||||||
| 39,926 | (429,914 | ) | 4,267 | (48,076 | ) | 9,887 | 27,148 | (180,523 | ) | 34,656 | (258,412 | ) | ||||||||||||||||||||||
| — | — | — | — | 5 | (6 | ) | 48 | 2 | (96 | ) | ||||||||||||||||||||||||
| 129,016 | 175,923 | 129,788 | (52,363 | ) | 28,767 | 40,027 | 68,486 | 10,723 | 181,991 | |||||||||||||||||||||||||
| — | — | — |
| — |
| 3 | 4 | (4 | ) | — | 7 | |||||||||||||||||||||||
| 177,160 | (232,457 | ) | 148,154 | (75,425 | ) | 38,935 | 68,903 | (106,271 | ) | 45,364 | (75,804 | ) | ||||||||||||||||||||||
| (12,067 | ) | (23,986 | ) | (5,859 | ) | (9,014 | ) | (381 | ) | (3,099 | ) | (6,670 | ) | (30 | ) | (98 | ) | |||||||||||||||||
| — | — | (13,750 | ) | (16,627 | ) | — | — | — | — | — | ||||||||||||||||||||||||
| — | — | (110 | ) | (134 | ) | — | (29 | ) | (67 | ) | — | — | ||||||||||||||||||||||
| (24 | ) | (45 | ) | — | — | — | — | — | — | — | ||||||||||||||||||||||||
| — | — | — | (3,784 | ) | (186 | ) | — | (4,119 | ) | — | — | |||||||||||||||||||||||
| — | — | — | (6,354 | ) | — | — | — | — | — | |||||||||||||||||||||||||
| — | — | — | (160 | ) | — | — | (43 | ) | — | — | ||||||||||||||||||||||||
| (12,091 | ) | (24,031 | ) | (19,719 | ) | (36,073 | ) | (567 | ) | (3,128 | ) | (10,899 | ) | (30 | ) | (98 | ) | |||||||||||||||||
| 180,618 | 924,843 | 76,883 | 430,336 | 334,716 | 90,570 | 268,370 | 57,883 | 206,264 | ||||||||||||||||||||||||||
| 11,060 | 22,190 | 5,571 | 11,884 | 547 | 2,836 | 10,175 | 28 | 94 | ||||||||||||||||||||||||||
| (250,071 | ) | (1,243,735 | ) | (158,910 | ) | (395,893 | ) | (85,927 | ) | (196,999 | ) | (370,346 | ) | (155,344 | ) | (290,286 | ) | |||||||||||||||||
| (58,393 | ) | (296,702 | ) | (76,456 | ) | 46,327 | 249,336 | (103,593 | ) | (91,801 | ) | (97,433 | ) | (83,928 | ) | |||||||||||||||||||
| — | — | 125,902 | 274,071 | — | — | — | — | — | ||||||||||||||||||||||||||
| — | — | 12,979 | 21,275 | — | — | — | — | — | ||||||||||||||||||||||||||
| — | — | (110,195 | ) | (192,042 | ) | — | — | — | — | — | ||||||||||||||||||||||||
| — | — | 28,686 | 103,304 | — | — | — | — | — | ||||||||||||||||||||||||||
| — | — | 1,537 | 17,809 | — | 990 | 3,127 | 825 | 2,291 | ||||||||||||||||||||||||||
| — | — | 71 | 267 | — | 27 | 107 | — | — | ||||||||||||||||||||||||||
| — | — | (1,673 | ) | (14,749 | ) | — | (1,601 | ) | (3,420 | ) | (790 | ) | (1,706 | ) | ||||||||||||||||||||
| — | — | (65 | ) | 3,327 | — | (584 | ) | (186 | ) | 35 | 585 | |||||||||||||||||||||||
| 4 | 411 | — | — | — | — | — | — | — | ||||||||||||||||||||||||||
| 23 | 45 | — | — | — | — | — | — | — | ||||||||||||||||||||||||||
| (312 | ) | (321 | ) | — | — | — | — | — | — | — | ||||||||||||||||||||||||
| (285 | ) | 135 | — | — | — | — | — | — | — | |||||||||||||||||||||||||
| (58,678 | ) | (296,567 | ) | (47,835 | ) | | 152,958 | | 249,336 | (104,177 | ) | (91,987 | ) | (97,398 | ) | (83,343 | ) | |||||||||||||||||
| 106,391 | (553,055 | ) | 80,600 | 41,460 | 287,704 | (38,402 | ) | (209,157 | ) | (52,064 | ) | (159,245 | ) | |||||||||||||||||||||
| 1,599,114 | 2,152,169 | 1,315,511 | 1,274,051 | — | 645,730 | 854,887 | 482,380 | 641,625 | ||||||||||||||||||||||||||
| $ | 1,705,505 | $ | 1,599,114 | $ | 1,396,111 | $ | 1,315,511 | $ | 287,704 | $ | 607,328 | $ | 645,730 | $ | 430,316 | $ | 482,380 | |||||||||||||||||
| $ | 360 | $ | 4,233 | $ | 445 | $ | 6,065 |
| $ | (108 | ) | $ | 49 | $ | 1,447 | $ | (89 | ) | $ | (42 | ) | |||||||||||||
| SEI Institutional Managed Trust / Semi-Annual Report / March 31, 2010 | 111 |
Table of Contents
Statements of Changes in Net Assets ($ Thousands)
For the six month period ended March 31, 2010 (Unaudited) and the year ended September 30, 2009
Tax-Managed | ||||||||
10/01/09 to 03/31/10 | 10/01/08 to 09/30/09 | |||||||
Operations: | ||||||||
Net Investment Income | $ | 484 | $ | 1,061 | ||||
Net Realized Gain (Loss) from Investments and Futures Contracts | 14,371 | (86,558 | ) | |||||
Net Realized Loss on Foreign Currency Transactions | (1 | ) | — | |||||
Net Change in Unrealized Appreciation of Investments, Affiliated Investments and Futures Contracts | 25,551 | 52,954 | ||||||
Net Increase (Decrease) in Net Assets from Operations | 40,405 | (32,543 | ) | |||||
Dividends and Distributions From: | ||||||||
Net Investment Income: | ||||||||
Class A | (532 | ) | (1,496 | ) | ||||
Class I | — | — | ||||||
Total Dividends and Distributions | (532 | ) | (1,496 | ) | ||||
Capital Share Transactions(1): | ||||||||
Class A: | ||||||||
Proceeds from Shares Issued | 44,578 | 184,323 | ||||||
Reinvestment of Dividends and Distributions | 475 | 1,360 | ||||||
Cost of Shares Redeemed | (51,254 | ) | (207,700 | ) | ||||
Increase (Decrease) in Net Assets Derived from Class A Transactions | (6,201 | ) | (22,017 | ) | ||||
Class I: | ||||||||
Proceeds from Shares Issued | — | — | ||||||
Reinvestment of Dividends and Distributions | — | — | ||||||
Cost of Shares Redeemed | — | — | ||||||
Increase in Net Assets Derived from Class I Transactions | — | — | ||||||
Increase (Decrease) in Net Assets Derived from Capital Share Transactions | (6,201 | ) | (22,017 | ) | ||||
Net Increase (Decrease) in Net Assets | 33,672 | (56,056 | ) | |||||
Net Assets: | ||||||||
Beginning of Year/Period | 262,464 | 318,520 | ||||||
End of Year/Period | $ | 296,136 | $ | 262,464 | ||||
Undistributed Net Investment Income Included in Net Assets at Period End | $ | 40 | $ | 88 | ||||
| (1) | See Note 6 in Notes to Financial Statements for additional information. |
Amounts designated as “—” are $0 or have been rounded to $0.
The accompanying notes are an integral part of the financial statements.
| 112 | SEI Institutional Managed Trust / Semi-Annual Report / March 31, 2010 |
Table of Contents
Mid-Cap | U.S. Managed | |||||||||||||
10/01/09 to 03/31/10 | 10/01/08 to 09/30/09 | 10/01/09 to 03/31/10 | 10/01/08 to 09/30/09 | |||||||||||
| $ | 395 | $ | 942 | $ | 2,803 | $ | 5,514 | |||||||
| 8,856 | (46,851 | ) | 12,407 | (111,935 | ) | |||||||||
| — | — | — | — | |||||||||||
| 6,795 | 39,752 | 24,952 | 53,205 | |||||||||||
| 16,046 | (6,157 | ) | 40,162 | (53,216 | ) | |||||||||
| (525 | ) | (1,063 | ) | (3,810 | ) | (5,650 | ) | |||||||
| (1 | ) | (1 | ) | — | — | |||||||||
| (526 | ) | (1,064 | ) | (3,810 | ) | (5,650 | ) | |||||||
| 75,230 | 74,360 | 78,745 | 356,268 | |||||||||||
| 447 | 896 | 3,505 | 5,326 | |||||||||||
| (33,071 | ) | (74,607 | ) | (115,980 | ) | (380,409 | ) | |||||||
| 42,606 | 649 | (33,730 | ) | (18,815 | ) | |||||||||
| 520 | 311 | 26 | 14 | |||||||||||
| 1 | 1 | — | — | |||||||||||
| (175 | ) | (155 | ) | (1 | ) | (3 | ) | |||||||
| 346 | 157 | 25 | 11 | |||||||||||
| 42,952 | 806 | (33,705 | ) | (18,804 | ) | |||||||||
| 58,472 | (6,415 | ) | 2,647 | (77,670 | ) | |||||||||
| 120,146 | 126,561 | 381,004 | 458,674 | |||||||||||
| $ | 178,618 | $ | 120,146 | $ | 383,651 | $ | 381,004 | |||||||
| $ | 56 | $ | 187 | $ | 148 | $ | 1,155 | |||||||
| SEI Institutional Managed Trust / Semi-Annual Report / March 31, 2010 | 113 |
Table of Contents
Statements of Changes in Net Assets ($ Thousands)
For the six month period ended March 31, 2010 (Unaudited) and the year ended September 30, 2009
Global Managed | Tax-Managed Managed | Real Estate | ||||||||||||||||||||||
| 10/01/09 to 03/31/10 | 10/01/08 to 09/30/09 | 10/01/09 to 03/31/10 | 10/01/08 to 09/30/09 | 10/01/09 to 03/31/10 | 10/01/08 to 09/30/09 | |||||||||||||||||||
Operations: | ||||||||||||||||||||||||
Net Investment Income | $ | 1,453 | $ | 3,008 | $ | 1,459 | $ | 2,270 | $ | 2,255 | $ | 3,521 | ||||||||||||
Net Realized Gain (Loss) from Investments, Affiliated Investments, Futures Contracts, Written Options, Written Swaptions and Swap Contracts | 8,269 | (47,360 | ) | 1,984 | (19,058 | ) | 7,948 | (110,434 | ) | |||||||||||||||
Net Realized Gain (Loss) on Foreign Currency Transactions | 2,752 | (11,869 | ) | — | — | �� | 3 | 84 | ||||||||||||||||
Net Change in Unrealized Appreciation of Investments, Affiliated Investments, Futures Contracts, Written Options, Written Swaptions and Swap Contracts | 1,589 | | 30,162 | | 17,208 | 20,265 | 25,199 | 44,829 | ||||||||||||||||
Net Change in Unrealized Appreciation (Depreciation) on Foreign Currency and Translation of Other Assets and Liabilities Denominated in Foreign Currency | 145 | (2,353 | ) | — | — | (1 | ) | 2 | ||||||||||||||||
Net Increase (Decrease) in Net Assets from Operations | 14,208 | (28,412 | ) | 20,651 | 3,477 | 35,404 | (61,998 | ) | ||||||||||||||||
Dividends and Distributions From: | ||||||||||||||||||||||||
Net Investment Income: | ||||||||||||||||||||||||
Class A | (864 | ) | — | (2,019 | ) | (2,063 | ) | (5,513 | ) | (6,052 | ) | |||||||||||||
Class I | — | — | — | — | (5 | ) | (1 | ) | ||||||||||||||||
Net Capital Gains: | ||||||||||||||||||||||||
Class A | — | — | — | — | — | — | ||||||||||||||||||
Class I | — | — | — | — | — | — | ||||||||||||||||||
Return of Capital | ||||||||||||||||||||||||
Class A | — | — | — | — | — | (37 | ) | |||||||||||||||||
Total Dividends and Distributions | (864 | ) | — | (2,019 | ) | (2,063 | ) | (5,518 | ) | (6,090 | ) | |||||||||||||
Capital Share Transactions(1): | ||||||||||||||||||||||||
Class A: | ||||||||||||||||||||||||
Proceeds from Shares Issued | 89,284 | 238,774 | 49,198 | 191,230 | 69,196 | 264,480 | ||||||||||||||||||
Reinvestment of Dividends and Distributions | 807 | — | 1,738 | 1,758 | 4,767 | 5,834 | ||||||||||||||||||
Cost of Shares Redeemed | (57,856 | ) | (200,745 | ) | (41,912 | ) | (118,660 | ) | (84,801 | ) | (232,334 | ) | ||||||||||||
Increase (Decrease) in Net Assets Derived from Class A Transactions | 32,235 | 38,029 | 9,024 | 74,328 | (10,838 | ) | 37,980 | |||||||||||||||||
Class I: | ||||||||||||||||||||||||
Proceeds from Shares Issued | 4 | 21 | — | — | 102 | 87 | ||||||||||||||||||
Reinvestment of Dividends and Distributions | — | — | — | — | 4 | 1 | ||||||||||||||||||
Cost of Shares Redeemed | (8 | ) | (14 | ) | — | — | (17 | ) | (4 | ) | ||||||||||||||
Increase (Decrease) in Net Assets Derived from Class I Transactions | (4 | ) | 7 | — | — | 89 | 84 | |||||||||||||||||
Increase (Decrease) in Net Assets Derived from Capital Share Transactions | 32,231 | 38,036 | 9,024 | 74,328 | (10,749 | ) | 38,064 | |||||||||||||||||
Net Increase (Decrease) in Net Assets | 45,575 | 9,624 | 27,656 | 75,742 | 19,137 | (30,024 | ) | |||||||||||||||||
Net Assets: | ||||||||||||||||||||||||
Beginning of Year/Period | 213,790 | 204,166 | 172,265 | 96,523 | 221,360 | 251,384 | ||||||||||||||||||
End of Year/Period | $ | 259,365 | $ | 213,790 | $ | 199,921 | $ | 172,265 | $ | 240,497 | $ | 221,360 | ||||||||||||
Undistributed (Distributions in Excess of) Net Investment Income/(Accumulated Net Investment Loss) Included in Net Assets at Period End | $ | (12,375 | ) | $ | (12,964 | ) | $ | 31 | $ | 591 | $ | (648 | ) | $ | 2,615 | |||||||||
| (1) | See Note 6 in Notes to Financial Statements for additional information. |
| (2) | Commenced operations on July 2, 2009. |
| (3) | Commenced operations on March 31, 2010. |
Amounts designated as “—” are $0 or have been rounded to $0.
The accompanying notes are an integral part of the financial statements.
| 114 | SEI Institutional Managed Trust / Semi-Annual Report / March 31, 2010 |
Table of Contents
Enhanced | Core Fixed | U.S. Fixed | High Yield | Real | Multi-Strategy Alternative Fund(3) | ||||||||||||||||||||||||||||||||||||
| 10/01/09 to 03/31/10 | 10/01/08 to 09/30/09 | 10/01/09 to 03/31/10 | 10/01/08 to 09/30/09 | 10/01/09 to 03/31/10 | 07/02/09 to 09/30/09 | 10/01/09 to 03/31/10 | 10/01/08 to 09/30/09 | 10/01/09 to 03/31/10 | 07/02/09 to 09/30/09 | 03/31/10 | |||||||||||||||||||||||||||||||
| $ | 4,075 | $ | 9,863 | $ | 56,964 | $ | 149,672 | $ | 13,324 | $ | 4,579 | $ | 68,248 | $ | 107,446 | $ | 840 | $ | 664 | $ | — | ||||||||||||||||||||
| (21,697 | ) | (64,915 | ) | 12,208 |
| (75,201 | ) | 6,573 | 2,009 | 36,781 | (158,689 | ) | 1,544 | 22 | — | ||||||||||||||||||||||||||
| — | (2,170 | ) | 107 | 10,277 | — | — | — | — | — | — | — | ||||||||||||||||||||||||||||||
| 29,338 | 25,876 | 80,284 |
| 197,739 |
| 2,159 | 14,725 | 79,105 | 201,560 | 667 | 759 | — | |||||||||||||||||||||||||||||
| — | 1,024 | (226 | ) |
| (4,211 | ) | — | — | — | — | — | — | — | ||||||||||||||||||||||||||||
| 11,716 | (30,322 | ) | 149,337 | 278,276 | 22,056 | 21,313 | 184,134 | 150,317 | 3,051 | 1,445 | — | ||||||||||||||||||||||||||||||
| (5,574 | ) | (7,069 | ) | (56,441 | ) | (153,233 | ) | (14,467 | ) | (4,508 | ) | (61,066 | ) | (99,645 | ) | (1,472 | ) | — | — | ||||||||||||||||||||||
| (1 | ) | — | (312 | ) | (541 | ) | (3,238 | ) | — | (12 | ) | (8 | ) | — | — | — | |||||||||||||||||||||||||
| — | — | — | — | — | — | (3,632 | ) | (11,445 | ) | (147 | ) | — | — | ||||||||||||||||||||||||||||
| — | — | — | — | — | — | (1 | ) | (1 | ) | — | — | — | |||||||||||||||||||||||||||||
| — | — | — | — | — | — | — | — | — | — | — | |||||||||||||||||||||||||||||||
| (5,575 | ) | (7,069 | ) | (56,753 | ) | (153,774 | ) | (17,705 | ) | (4,508 | ) | (64,711 | ) | (111,099 | ) | (1,619 | ) | — | — | ||||||||||||||||||||||
| 60,484 | 173,449 | 349,745 | 1,276,299 | 377,593 | 711,444 | 441,278 | 975,088 | 66,919 | 86,333 | 100 | |||||||||||||||||||||||||||||||
| 5,172 | 6,549 | 52,565 | 143,816 | 16,964 | 4,323 | 54,454 | 99,105 | 1,509 | — | — | |||||||||||||||||||||||||||||||
| (91,134 | ) | (223,654 | ) | (482,310 | ) | (2,779,389 | ) | (181,519 | ) | (54,849 | ) | (450,046 | ) | (899,807 | ) | (21,844 | ) | (4,210 | ) | — | |||||||||||||||||||||
| (25,478 | ) | (43,656 | ) | (80,000 | ) |
| (1,359,274 | ) | 213,038 | 660,918 | 45,686 | 174,386 | 46,584 | 82,123 | 100 | ||||||||||||||||||||||||||
| 14 | 28 | 3,635 | 8,717 | — | — | 179 | 158 | — | — | — | |||||||||||||||||||||||||||||||
| 1 | — | 210 | 420 | — | — | 13 | 8 | — | — | — | |||||||||||||||||||||||||||||||
| — | — | (3,781 | ) | (4,684 | ) | — | — | (152 | ) | (32 | ) | — | — | — | |||||||||||||||||||||||||||
| 15 | 28 | 64 |
| 4,453 |
| — | — | 40 | 134 | — | — | — | |||||||||||||||||||||||||||||
| (25,463 | ) | (43,628 | ) | (79,936 | ) |
| (1,354,821 | ) | 213,038 | 660,918 | 45,726 | 174,520 | 46,584 | 82,123 | 100 | ||||||||||||||||||||||||||
| (19,322 | ) | (81,019 | ) | 12,648 | (1,230,319 | ) | 217,389 | 677,723 | 165,149 | 213,738 | 48,016 | 83,568 | 100 | ||||||||||||||||||||||||||||
| 233,792 | 314,811 | 2,464,404 | 3,694,723 | 677,723 | — | 1,290,164 | 1,076,426 | 83,568 | — | — | |||||||||||||||||||||||||||||||
| $ | 214,470 | $ | 233,792 | $ | 2,477,052 | $ | 2,464,404 | $ | 895,112 | $ | 677,723 | $ | 1,455,313 | $ | 1,290,164 | $ | 131,584 | $ | 83,568 | $ | 100 | ||||||||||||||||||||
| $ | 816 | $ | 2,316 | $ | (3,293 | ) | $ | (3,504 | ) | $ | (4,378 | ) | $ | 3 | $ | 10,365 | $ | 3,195 | $ | 33 | $ | 665 | $ | — | |||||||||||||||||
| SEI Institutional Managed Trust / Semi-Annual Report / March 31, 2010 | 115 |
Table of Contents
For the period ended March 31, 2010 (Unaudited) and the years or periods ended September 30, (unless otherwise indicated)
For a Share Outstanding Throughout the Periods
| Net Asset Value, Beginning of Period | Net Investment Income (Loss)(1) | Net Realized and Unrealized Gains (Losses) on Securities(1) | Total from Operations | Dividends from Net Investment Income | Distributions from Realized Capital Gains | Total Dividends and Distributions | Net Asset Value, End of Period | Total Return† | Net Assets End of Period ($Thousands) | Ratio of Expenses to Average Net Assets | Ratio of Expenses to Average Net Assets (Excluding Fees Paid Indirectly) | Ratio of Expenses to Average Net Assets (Excluding Fees Paid Indirectly and Waivers) | Ratio of Net Investment Income (Loss) to Average Net Assets | Portfolio Turnover Rate† | |||||||||||||||||||||||||||||||||||||
Large Cap Fund |
| ||||||||||||||||||||||||||||||||||||||||||||||||||
Class A | |||||||||||||||||||||||||||||||||||||||||||||||||||
2010(12) | $ | 10.00 | $ | 0.06 | $ | 1.05 | $ | 1.11 | $ | (0.05 | ) | $ | (0.05 | ) | $ | (0.10 | ) | $ | 11.01 | 11.12 | % | $ | 1,283,092 | 0.89 | % | 0.89 | % | 1.00 | % | 1.06 | % | 37 | % | ||||||||||||||||||
Large Cap Value Fund |
| ||||||||||||||||||||||||||||||||||||||||||||||||||
Class A | |||||||||||||||||||||||||||||||||||||||||||||||||||
2010** | $ | 13.83 | $ | 0.11 | $ | 1.41 | $ | 1.52 | $ | (0.17 | ) | $ | — | $ | (0.17 | ) | $ | 15.18 | 11.06 | % | $ | 1,870,940 | 0.89 | % | 0.89 | % | 0.98 | % | 1.59 | % | 22 | % | |||||||||||||||||||
2009 | 15.79 | 0.30 | (1.92 | ) | (1.62 | ) | (0.34 | ) | — | (0.34 | ) | 13.83 | (9.88 | ) | 1,843,530 | 0.89 | 0.90 | 0.99 | 2.51 | 69 | |||||||||||||||||||||||||||||||
2008 | 23.97 | 0.40 | (6.10 | ) | (5.70 | ) | (0.41 | ) | (2.07 | ) | (2.48 | ) | 15.79 | (25.95 | ) | 2,381,011 | 0.88 | 0.88 | 0.97 | 2.09 | 53 | ||||||||||||||||||||||||||||||
2007 | 23.54 | 0.41 | 2.69 | 3.10 | (0.41 | ) | (2.26 | ) | (2.67 | ) | 23.97 | 13.91 | 3,616,120 | 0.86 | 0.86 | 0.97 | 1.74 | 36 | |||||||||||||||||||||||||||||||||
2006 | 22.45 | 0.37 | 2.41 | 2.78 | (0.37 | ) | (1.32 | ) | (1.69 | ) | 23.54 | 13.42 | 3,762,101 | 0.86 | 0.87 | 0.97 | 1.67 | 58 | |||||||||||||||||||||||||||||||||
2005 | 19.80 | 0.35 | 2.76 | 3.11 | (0.34 | ) | (0.12 | ) | (0.46 | ) | 22.45 | 15.87 | 4,230,717 | 0.86 | 0.86 | 0.97 | 1.63 | 44 | |||||||||||||||||||||||||||||||||
Class I | |||||||||||||||||||||||||||||||||||||||||||||||||||
2010** | $ | 13.83 | $ | 0.10 | $ | 1.40 | $ | 1.50 | $ | (0.14 | ) | $ | — | $ | (0.14 | ) | $ | 15.19 | 10.93 | % | $ | 11,717 | 1.11 | % | 1.11 | % | 1.23 | % | 1.38 | % | 22 | % | |||||||||||||||||||
2009 | 15.78 | 0.26 | (1.90 | ) | (1.64 | ) | (0.31 | ) | — | (0.31 | ) | 13.83 | (10.05 | ) | 11,433 | 1.11 | 1.12 | 1.24 | 2.19 | 69 | |||||||||||||||||||||||||||||||
2008 | 23.95 | 0.36 | (6.11 | ) | (5.75 | ) | (0.35 | ) | (2.07 | ) | (2.42 | ) | 15.78 | (26.13 | ) | 10,861 | 1.11 | 1.11 | 1.22 | 1.85 | 53 | ||||||||||||||||||||||||||||||
2007 | 23.52 | 0.35 | 2.69 | 3.04 | (0.35 | ) | (2.26 | ) | (2.61 | ) | 23.95 | 13.64 | 29,072 | 1.11 | 1.11 | 1.22 | 1.49 | 36 | |||||||||||||||||||||||||||||||||
2006 | 22.43 | 0.31 | 2.42 | 2.73 | (0.32 | ) | (1.32 | ) | (1.64 | ) | 23.52 | 13.16 | 31,308 | 1.11 | 1.12 | 1.22 | 1.40 | 58 | |||||||||||||||||||||||||||||||||
2005 | 19.78 | 0.29 | 2.77 | 3.06 | (0.29 | ) | (0.12 | ) | (0.41 | ) | 22.43 | 15.61 | 24,735 | 1.11 | 1.11 | 1.22 | 1.37 | 44 | |||||||||||||||||||||||||||||||||
Large Cap Growth Fund |
| ||||||||||||||||||||||||||||||||||||||||||||||||||
Class A | |||||||||||||||||||||||||||||||||||||||||||||||||||
2010** | $ | 17.62 | $ | 0.07 | $ | 2.08 | $ | 2.15 | $ | (0.09 | ) | $ | — | $ | (0.09 | ) | $ | 19.68 | 12.24 | % | $ | 1,991,568 | 0.89 | % | 0.89 | % | 1.03 | % | 0.76 | % | 32 | % | |||||||||||||||||||
2009 | 18.39 | 0.11 | (0.77 | ) | (0.66 | ) | (0.11 | ) | — | (0.11 | ) | 17.62 | (3.47 | ) | 2,034,096 | 0.89 | 0.90 | 1.04 | 0.74 | 96 | |||||||||||||||||||||||||||||||
2008 | 23.74 | 0.08 | (5.35 | ) | (5.27 | ) | (0.08 | ) | — | (0.08 | ) | 18.39 | (22.26 | ) | 2,472,052 | 0.88 | 0.88 | 1.02 | 0.37 | 78 | |||||||||||||||||||||||||||||||
2007 | 19.95 | 0.06 | 3.78 | 3.84 | (0.05 | ) | — | (0.05 | ) | 23.74 | 19.26 | 3,622,963 | 0.86 | 0.86 | 1.02 | 0.26 | 55 | ||||||||||||||||||||||||||||||||||
2006 | 19.23 | 0.04 | 0.71 | 0.75 | (0.03 | ) | — | (0.03 | ) | 19.95 | 3.92 | 3,387,749 | 0.86 | 0.87 | 1.02 | 0.18 | 89 | ||||||||||||||||||||||||||||||||||
2005 | 17.13 | 0.09 | 2.09 | 2.18 | (0.08 | ) | — | (0.08 | ) | 19.23 | 12.75 | 4,004,347 | 0.86 | 0.86 | 1.02 | 0.47 | 52 | ||||||||||||||||||||||||||||||||||
Class I | |||||||||||||||||||||||||||||||||||||||||||||||||||
2010** | $ | 17.44 | $ | 0.05 | $ | 2.06 | $ | 2.11 | $ | (0.06 | ) | $ | — | $ | (0.06 | ) | $ | 19.49 | 12.11 | % | $ | 9,501 | 1.11 | % | 1.11 | % | 1.28 | % | 0.54 | % | 32 | % | |||||||||||||||||||
2009 | 18.20 | 0.07 | (0.76 | ) | (0.69 | ) | (0.07 | ) | — | (0.07 | ) | 17.44 | (3.69 | ) | 9,153 | 1.11 | 1.12 | 1.29 | 0.51 | 96 | |||||||||||||||||||||||||||||||
2008 | 23.48 | 0.03 | (5.29 | ) | (5.26 | ) | (0.02 | ) | — | (0.02 | ) | 18.20 | (22.43 | ) | 7,695 | 1.11 | 1.11 | 1.27 | 0.13 | 78 | |||||||||||||||||||||||||||||||
2007 | 19.75 | — | * | 3.73 | 3.73 | — | * | — | — | 23.48 | 18.91 | 25,196 | 1.11 | 1.11 | 1.27 | 0.01 | 55 | ||||||||||||||||||||||||||||||||||
2006 | 19.04 | (0.01 | ) | 0.72 | 0.71 | — | — | — | 19.75 | 3.73 | 27,780 | 1.11 | 1.12 | 1.27 | (0.07 | ) | 89 | ||||||||||||||||||||||||||||||||||
2005 | 17.00 | 0.04 | 2.07 | 2.11 | (0.07 | ) | — | (0.07 | ) | 19.04 | 12.42 | 29,689 | 1.11 | 1.11 | 1.27 | 0.22 | 52 | ||||||||||||||||||||||||||||||||||
Tax-Managed Large Cap Fund |
| ||||||||||||||||||||||||||||||||||||||||||||||||||
Class A | |||||||||||||||||||||||||||||||||||||||||||||||||||
2010** | $ | 10.19 | $ | 0.05 | $ | 1.10 | $ | 1.15 | $ | (0.08 | ) | $ | — | $ | (0.08 | ) | $ | 11.26 | 11.32 | % | $ | 1,702,369 | 0.89 | % | 0.89 | % | 1.03 | % | 1.00 | % | 21 | % | |||||||||||||||||||
2009 | 11.08 | 0.13 | (0.87 | ) | (0.74 | ) | (0.15 | ) | — | (0.15 | ) | 10.19 | (6.44 | ) | 1,596,020 | 0.89 | 0.90 | 1.04 | 1.54 | 67 | |||||||||||||||||||||||||||||||
2008 | 14.70 | 0.15 | (3.62 | ) | (3.47 | ) | (0.15 | ) | — | (0.15 | ) | 11.08 | (23.76 | ) | 2,148,949 | 0.88 | 0.88 | 1.02 | 1.13 | 61 | |||||||||||||||||||||||||||||||
2007 | 12.68 | 0.14 | 2.01 | 2.15 | (0.13 | ) | — | (0.13 | ) | 14.70 | 17.05 | 2,892,866 | 0.86 | 0.86 | 1.02 | 1.02 | 44 | ||||||||||||||||||||||||||||||||||
2006 | 11.78 | 0.11 | 0.90 | 1.01 | (0.11 | ) | — | (0.11 | ) | 12.68 | 8.58 | 2,373,507 | 0.86 | 0.87 | 1.02 | 0.91 | 65 | ||||||||||||||||||||||||||||||||||
2005 | 10.41 | 0.12 | 1.37 | 1.49 | (0.12 | ) | — | (0.12 | ) | 11.78 | 14.40 | 2,172,885 | 0.86 | 0.86 | 1.02 | 1.08 | 31 | ||||||||||||||||||||||||||||||||||
Class Y | |||||||||||||||||||||||||||||||||||||||||||||||||||
2010** | $ | 10.37 | $ | 0.07 | $ | 1.11 | $ | 1.18 | $ | (0.08 | ) | $ | — | $ | (0.08 | ) | $ | 11.47 | 11.45 | % | $ | 3,136 | 0.56 | % | 0.56 | % | 0.73 | % | 1.34 | % | 21 | % | |||||||||||||||||||
2009 | 11.24 | 0.16 | (0.88 | ) | (0.72 | ) | (0.15 | ) | — | (0.15 | ) | 10.37 | (6.12 | ) | 3,094 | 0.56 | 0.57 | 0.74 | 1.85 | 67 | |||||||||||||||||||||||||||||||
2008 | 14.87 | 0.19 | (3.66 | ) | (3.47 | ) | (0.16 | ) | — | (0.16 | ) | 11.24 | (23.52 | ) | 3,220 | 0.56 | 0.56 | 0.72 | 1.44 | 61 | |||||||||||||||||||||||||||||||
2007 | 12.79 | 0.18 | 2.04 | 2.22 | (0.14 | ) | — | (0.14 | ) | 14.87 | 17.43 | 4,711 | 0.56 | 0.56 | 0.72 | 1.32 | 44 | ||||||||||||||||||||||||||||||||||
2006 | 11.86 | 0.15 | 0.89 | 1.04 | (0.11 | ) | — | (0.11 | ) | 12.79 | 8.83 | 4,558 | 0.56 | 0.57 | 0.72 | 1.21 | 65 | ||||||||||||||||||||||||||||||||||
2005 | 10.45 | 0.16 | 1.38 | 1.54 | (0.13 | ) | — | (0.13 | ) | 11.86 | 14.78 | 5,067 | 0.56 | 0.56 | 0.72 | 1.39 | 31 | ||||||||||||||||||||||||||||||||||
| 116 | SEI Institutional Managed Trust / Semi-Annual Report / March 31, 2010 |
Table of Contents
| Net Asset Value, Beginning of Period | Net Investment Income (Loss)(1) | Net Realized and Unrealized Gains (Losses) on Securities(1) | Total from Operations | Dividends from Net Investment Income | Distributions from Realized Capital Gains | Total Dividends and Distributions | Net Asset Value, End of Period | Total Return† | Net Assets End of Period ($Thousands) | Ratio of Expenses to Average Net Assets | Ratio of Expenses to Average Net Assets (Excluding Fees Paid Indirectly) | Ratio of Expenses to Average Net Assets (Excluding Fees Paid Indirectly and Waivers) | Ratio of Net Investment Income (Loss) to Average Net Assets | Portfolio Turnover Rate† | |||||||||||||||||||||||||||||||||||||
S&P 500 Index Fund |
| ||||||||||||||||||||||||||||||||||||||||||||||||||
Class A | |||||||||||||||||||||||||||||||||||||||||||||||||||
2010** | $ | 29.01 | $ | 0.30 | $ | 3.02 | $ | 3.32 | $ | (0.43 | ) | $ | — | $ | (0.43 | ) | $ | 31.90 | 11.52 | % | $ | 415,792 | 0.43 | % | 0.43 | % | 0.54 | % | 2.00 | % | 9 | % | |||||||||||||||||||
2009 | 32.43 | 0.57 | (3.12 | ) | (2.55 | ) | (0.61 | ) | (0.26 | ) | (0.87 | ) | 29.01 | (7.33 | ) | 451,069 | 0.43 | 0.43 | 0.55 | 2.31 | 29 | ||||||||||||||||||||||||||||||
2008 | 44.71 | 0.68 | (10.10 | ) | (9.42 | ) | (0.70 | ) | (2.16 | ) | (2.86 | ) | 32.43 | (22.30 | ) | 462,947 | 0.41 | 0.41 | 0.53 | 1.77 | 27 | ||||||||||||||||||||||||||||||
2007(4) | 41.45 | 0.34 | 3.09 | 3.43 | (0.17 | ) | — | (0.17 | ) | 44.71 | 8.28 | 650,792 | 0.40 | 0.40 | 0.43 | 1.55 | 2 | ||||||||||||||||||||||||||||||||||
2007(5) | 38.38 | 0.63 | 3.70 | 4.33 | (0.68 | ) | (0.58 | ) | (1.26 | ) | 41.45 | 11.38 | 621,898 | 0.40 | 0.40 | 0.43 | 1.59 | 6 | |||||||||||||||||||||||||||||||||
2006(5) | 36.21 | 0.56 | 3.47 | 4.03 | (0.54 | ) | (1.32 | ) | (1.86 | ) | 38.38 | 11.32 | 614,246 | 0.40 | 0.40 | 0.43 | 1.49 | 18 | |||||||||||||||||||||||||||||||||
2005(5) | 34.66 | 0.59 | 1.57 | 2.16 | (0.58 | ) | (0.03 | ) | (0.61 | ) | 36.21 | 6.25 | 655,378 | 0.40 | 0.40 | 0.43 | 1.67 | 11 | |||||||||||||||||||||||||||||||||
Class E | |||||||||||||||||||||||||||||||||||||||||||||||||||
2010** | $ | 29.12 | $ | 0.33 | $ | 3.03 | $ | 3.36 | $ | (0.46 | ) | $ | — | $ | (0.46 | ) | $ | 32.02 | 11.63 | % | $ | 970,963 | 0.25 | % | 0.25 | % | 0.29 | % | 2.18 | % | 9 | % | |||||||||||||||||||
2009 | 32.54 | 0.61 | (3.12 | ) | (2.51 | ) | (0.65 | ) | (0.26 | ) | (0.91 | ) | 29.12 | (7.16 | ) | 855,876 | 0.25 | 0.25 | 0.30 | 2.44 | 29 | ||||||||||||||||||||||||||||||
2008 | 44.85 | 0.75 | (10.14 | ) | (9.39 | ) | (0.76 | ) | (2.16 | ) | (2.92 | ) | 32.54 | (22.19 | ) | 805,606 | 0.25 | 0.25 | 0.53 | 1.95 | 27 | ||||||||||||||||||||||||||||||
2007(4) | 41.57 | 0.30 | 3.17 | 3.47 | (0.19 | ) | — | (0.19 | ) | 44.85 | 8.34 | 1,072,141 | 0.25 | 0.25 | 0.53 | 1.70 | 2 | ||||||||||||||||||||||||||||||||||
2007(5) | 38.48 | 0.69 | 3.72 | 4.41 | (0.74 | ) | (0.58 | ) | (1.32 | ) | 41.57 | 11.57 | 1,127,189 | 0.25 | 0.25 | 0.53 | 1.74 | 6 | |||||||||||||||||||||||||||||||||
2006(5) | 36.31 | 0.62 | 3.48 | 4.10 | (0.61 | ) | (1.32 | ) | (1.93 | ) | 38.48 | 11.49 | 1,684,857 | 0.25 | 0.25 | 0.53 | 1.65 | 18 | |||||||||||||||||||||||||||||||||
2005(5) | 34.76 | 0.66 | 1.55 | 2.21 | (0.63 | ) | (0.03 | ) | (0.66 | ) | 36.31 | 6.39 | 1,307,631 | 0.25 | 0.25 | 0.53 | 1.86 | 11 | |||||||||||||||||||||||||||||||||
Class I | |||||||||||||||||||||||||||||||||||||||||||||||||||
2010** | $ | 29.07 | $ | 0.27 | $ | 3.02 | $ | 3.29 | $ | (0.37 | ) | $ | — | $ | (0.37 | ) | $ | 31.99 | 11.40 | % | $ | 9,356 | 0.65 | % | 0.65 | % | 0.79 | % | 1.79 | % | 9 | % | |||||||||||||||||||
2009 | 32.47 | 0.51 | (3.12 | ) | (2.61 | ) | (0.53 | ) | (0.26 | ) | (0.79 | ) | 29.07 | (7.53 | ) | 8,566 | 0.65 | 0.65 | 0.80 | 2.07 | 29 | ||||||||||||||||||||||||||||||
2008 | 44.74 | 0.60 | (10.12 | ) | (9.52 | ) | (0.59 | ) | (2.16 | ) | (2.75 | ) | 32.47 | (22.49 | ) | 5,498 | 0.65 | 0.65 | 0.78 | 1.53 | 27 | ||||||||||||||||||||||||||||||
2007(4) | 41.51 | 0.28 | 3.09 | 3.37 | (0.14 | ) | — | (0.14 | ) | 44.74 | 8.12 | 13,233 | 0.65 | 0.65 | 0.78 | 1.29 | 2 | ||||||||||||||||||||||||||||||||||
2007(5) | 38.43 | 0.53 | 3.71 | 4.24 | (0.58 | ) | (0.58 | ) | (1.16 | ) | 41.51 | 11.12 | 14,346 | 0.65 | 0.65 | 0.78 | 1.34 | 6 | |||||||||||||||||||||||||||||||||
2006(5) | 36.26 | 0.47 | 3.46 | 3.93 | (0.44 | ) | (1.32 | ) | (1.76 | ) | 38.43 | 11.02 | 13,144 | 0.65 | 0.65 | 0.78 | 1.25 | 18 | |||||||||||||||||||||||||||||||||
2005(5) | 34.72 | 0.51 | 1.56 | 2.07 | (0.50 | ) | (0.03 | ) | (0.53 | ) | 36.26 | 5.97 | 11,452 | 0.65 | 0.65 | 0.78 | 1.44 | 11 | |||||||||||||||||||||||||||||||||
Small Cap Fund |
| ||||||||||||||||||||||||||||||||||||||||||||||||||
Class A | |||||||||||||||||||||||||||||||||||||||||||||||||||
2010(12) | $ | 10.00 | $ | 0.01 | $ | 1.21 | $ | 1.22 | $ | (0.01 | ) | $ | (0.01 | ) | $ | (0.02 | ) | $ | 11.20 | 12.24 | % | $ | 287,704 | 1.14 | % | 1.14 | % | 1.32 | % | 0.22 | % | 56 | % | ||||||||||||||||||
Small Cap Value Fund |
| ||||||||||||||||||||||||||||||||||||||||||||||||||
Class A | |||||||||||||||||||||||||||||||||||||||||||||||||||
2010** | $ | 13.66 | $ | 0.04 | $ | 1.80 | $ | 1.84 | $ | (0.07 | ) | $ | — | $ | (0.07 | ) | $ | 15.43 | 13.55 | % | $ | 599,631 | 1.14 | % | 1.14 | % | 1.28 | % | 0.61 | % | 33 | % | |||||||||||||||||||
2009 | 15.38 | 0.11 | (1.62 | ) | (1.51 | ) | (0.13 | ) | (0.08 | ) | (0.21 | ) | 13.66 | (9.31 | ) | 638,341 | 1.14 | 1.16 | 1.29 | 1.03 | 110 | ||||||||||||||||||||||||||||||
2008 | 21.26 | 0.09 | (3.22 | ) | (3.13 | ) | (0.07 | ) | (2.68 | ) | (2.75 | ) | 15.38 | (16.02 | ) | 846,492 | 1.13 | 1.15 | 1.28 | 0.55 | 91 | ||||||||||||||||||||||||||||||
2007 | 21.28 | 0.04 | 2.23 | 2.27 | (0.14 | ) | (2.15 | ) | (2.29 | ) | 21.26 | 10.70 | 1,122,027 | 1.11 | 1.13 | 1.27 | 0.19 | 86 | |||||||||||||||||||||||||||||||||
2006 | 21.58 | 0.05 | 1.97 | 2.02 | (0.06 | ) | (2.26 | ) | (2.32 | ) | 21.28 | 10.34 | 1,160,178 | 1.11 | 1.13 | 1.27 | 0.31 | 72 | |||||||||||||||||||||||||||||||||
2005 | 20.74 | 0.06 | 4.02 | 4.08 | (0.05 | ) | (3.19 | ) | (3.24 | ) | 21.58 | 21.21 | 1,066,189 | 1.11 | 1.11 | 1.27 | 0.27 | 71 | |||||||||||||||||||||||||||||||||
Class I | |||||||||||||||||||||||||||||||||||||||||||||||||||
2010** | $ | 13.56 | $ | 0.03 | $ | 1.79 | $ | 1.82 | $ | (0.06 | ) | $ | — | $ | (0.06 | ) | $ | 15.32 | 13.43 | % | $ | 7,697 | 1.36 | % | 1.37 | % | 1.54 | % | 0.39 | % | 33 | % | |||||||||||||||||||
2009 | 15.29 | 0.08 | (1.62 | ) | (1.54 | ) | (0.11 | ) | (0.08 | ) | (0.19 | ) | 13.56 | (9.59 | ) | 7,389 | 1.36 | 1.38 | 1.54 | 0.77 | 110 | ||||||||||||||||||||||||||||||
2008 | 21.17 | 0.05 | (3.21 | ) | (3.16 | ) | (0.04 | ) | (2.68 | ) | (2.72 | ) | 15.29 | (16.21 | ) | 8,395 | 1.36 | 1.39 | 1.53 | 0.31 | 91 | ||||||||||||||||||||||||||||||
2007 | 21.21 | (0.01 | ) | 2.21 | 2.20 | (0.09 | ) | (2.15 | ) | (2.24 | ) | 21.17 | 10.41 | 14,089 | 1.36 | 1.38 | 1.52 | (0.04 | ) | 86 | |||||||||||||||||||||||||||||||
2006 | 21.52 | — | 1.98 | 1.98 | (0.03 | ) | (2.26 | ) | (2.29 | ) | 21.21 | 10.11 | 14,293 | 1.36 | 1.38 | 1.52 | 0.06 | 72 | |||||||||||||||||||||||||||||||||
2005 | 20.71 | (0.01 | ) | 4.03 | 4.02 | (0.02 | ) | (3.19 | ) | (3.21 | ) | 21.52 | 20.88 | 12,713 | 1.36 | 1.36 | 1.52 | (0.03 | ) | 71 | |||||||||||||||||||||||||||||||
Small Cap Growth Fund |
| ||||||||||||||||||||||||||||||||||||||||||||||||||
Class A | |||||||||||||||||||||||||||||||||||||||||||||||||||
2010** | $ | 12.96 | $ | — | $ | 1.65 | $ | 1.65 | $ | — | * | $ | — | $ | — | $ | 14.61 | 12.74 | % | $ | 425,806 | 1.11 | % | 1.11 | % | 1.29 | % | (0.01 | )% | 46 | % | ||||||||||||||||||||
2009 | 13.98 | 0.02 | (1.04 | ) | (1.02 | ) | — | * | — | — | 12.96 | (7.27 | ) | 478,405 | 1.11 | 1.12 | 1.29 | 0.17 | 163 | ||||||||||||||||||||||||||||||||
2008 | 21.91 | 0.01 | (6.22 | ) | (6.21 | ) | (0.01 | ) | (1.71 | ) | (1.72 | ) | 13.98 | (30.36 | ) | 638,257 | 1.11 | 1.12 | 1.28 | 0.04 | 124 | ||||||||||||||||||||||||||||||
2007 | 18.56 | (0.09 | ) | 3.44 | 3.35 | — | — | — | 21.91 | 18.05 | 1,154,000 | 1.11 | 1.13 | 1.27 | (0.43 | ) | 135 | ||||||||||||||||||||||||||||||||||
2006 | 17.86 | (0.07 | ) | 0.77 | 0.70 | — | — | — | 18.56 | 3.92 | 1,111,329 | 1.11 | 1.13 | 1.27 | (0.40 | ) | 99 | ||||||||||||||||||||||||||||||||||
2005 | 15.14 | (0.10 | ) | 2.82 | 2.72 | — | — | — | 17.86 | 17.97 | 1,058,413 | 1.11 | 1.11 | 1.27 | (0.60 | ) | 116 | ||||||||||||||||||||||||||||||||||
Class I | |||||||||||||||||||||||||||||||||||||||||||||||||||
2010** | $ | 12.68 | $ | (0.02 | ) | $ | 1.62 | $ | 1.60 | $ | — | $ | — | $ | — | $ | 14.28 | 12.62 | % | $ | 4,510 | 1.36 | % | 1.36 | % | 1.54 | % | (0.25 | )% | 46 | % | ||||||||||||||||||||
2009 | 13.71 | (0.02 | ) | (1.01 | ) | (1.03 | ) | — | — | — | 12.68 | (7.51 | ) | 3,975 | 1.36 | 1.37 | 1.55 | (0.17 | ) | 163 | |||||||||||||||||||||||||||||||
2008 | 21.57 | (0.03 | ) | (6.12 | ) | (6.15 | ) | — | (1.71 | ) | (1.71 | ) | 13.71 | (30.57 | ) | 3,368 | 1.36 | 1.37 | 1.53 | (0.19 | ) | 124 | |||||||||||||||||||||||||||||
2007 | 18.32 | (0.14 | ) | 3.39 | 3.25 | — | — | — | 21.57 | 17.74 | 9,323 | 1.36 | 1.38 | 1.52 | (0.67 | ) | 135 | ||||||||||||||||||||||||||||||||||
2006 | 17.67 | (0.12 | ) | 0.77 | 0.65 | — | — | — | 18.32 | 3.68 | 11,910 | 1.36 | 1.38 | 1.52 | (0.65 | ) | 99 | ||||||||||||||||||||||||||||||||||
2005 | 15.02 | (0.14 | ) | 2.79 | 2.65 | — | — | — | 17.67 | 17.64 | 11,077 | 1.36 | 1.36 | 1.52 | (0.85 | ) | 116 | ||||||||||||||||||||||||||||||||||
Tax-Managed Small Cap Fund |
| ||||||||||||||||||||||||||||||||||||||||||||||||||
Class A | |||||||||||||||||||||||||||||||||||||||||||||||||||
2010** | $ | 9.42 | $ | 0.02 | $ | 1.45 | $ | 1.47 | $ | (0.02 | ) | $ | — | $ | (0.02 | ) | $ | 10.87 | 15.61 | % | $ | 296,136 | 1.11 | % | 1.12 | % | 1.29 | % | 0.36 | % | 35 | % | |||||||||||||||||||
2009 | 10.16 | 0.04 | (0.73 | ) | (0.69 | ) | (0.05 | ) | — | (0.05 | ) | 9.42 | (6.62 | ) | 262,464 | 1.11 | 1.15 | 1.30 | 0.50 | 136 | |||||||||||||||||||||||||||||||
2008 | 14.14 | 0.05 | (3.19 | ) | (3.14 | ) | (0.04 | ) | (0.80 | ) | (0.84 | ) | 10.16 | (23.34 | ) | 318,520 | 1.11 | 1.13 | 1.28 | 0.41 | 96 | ||||||||||||||||||||||||||||||
2007 | 13.10 | 0.04 | 2.00 | 2.04 | (0.06 | ) | (0.94 | ) | (1.00 | ) | 14.14 | 16.00 | 416,945 | 1.11 | 1.14 | 1.27 | 0.31 | 72 | |||||||||||||||||||||||||||||||||
2006 | 13.13 | 0.01 | 0.68 | 0.69 | — | (0.72 | ) | (0.72 | ) | 13.10 | 5.50 | 314,333 | 1.11 | 1.14 | 1.27 | 0.09 | 73 | ||||||||||||||||||||||||||||||||||
2005 | 11.63 | (0.02 | ) | 2.36 | 2.34 | — | (0.84 | ) | (0.84 | ) | 13.13 | 20.80 | 269,519 | 1.11 | 1.11 | 1.27 | (0.17 | ) | 99 | ||||||||||||||||||||||||||||||||
| SEI Institutional Managed Trust / Semi-Annual Report / March 31, 2010 | 117 |
Table of Contents
Financial Highlights
For the period ended March 31, 2010 (Unaudited) and the years or periods ended September 30, (unless otherwise indicated)
For a Share Outstanding Throughout the Periods
| Net Asset Value, Beginning of Period | Net Investment Income(1) | Net Realized and Unrealized Gains (Losses) on Securities(1) | Total from Operations | Dividends from Net Investment Income | Distributions from Realized Capital Gains | Total Dividends, Distributions and Return of Capital | Net Asset Value, End of Period | Total Return† | Net Assets End of Period ($Thousands) | Ratio of Expenses to Average Net Assets | Ratio of Expenses to Average Net Assets (Excluding Fees Paid Indirectly) | Ratio of Expenses to Average Net Assets (Excluding Fees Paid Indirectly and Waivers) | Ratio of Net Investment Income to Average Net Assets | Portfolio Turnover Rate† | ||||||||||||||||||||||||||||||||||||
Mid-Cap Fund | ||||||||||||||||||||||||||||||||||||||||||||||||||
Class A | ||||||||||||||||||||||||||||||||||||||||||||||||||
2010** | $ | 13.92 | $ | 0.04 | $ | 1.85 | $ | 1.89 | $ | (0.06 | ) | $ | — | $ | (0.06 | ) | $ | 15.75 | 13.59 | % | $ | 177,899 | 1.02 | % | 1.02 | % | 1.03 | % | 0.58 | % | 58 | % | ||||||||||||||||||
2009 | 14.87 | 0.11 | (0.94 | ) | (0.83 | ) | (0.12 | ) | — | (0.12 | ) | 13.92 | (5.34 | ) | 119,872 | 1.02 | 1.02 | 1.04 | 0.95 | 143 | ||||||||||||||||||||||||||||||
2008 | 22.22 | 0.11 | (5.28 | ) | (5.17 | ) | (0.09 | ) | (2.09 | ) | (2.18 | ) | 14.87 | (25.45 | ) | 126,509 | 1.02 | 1.02 | 1.03 | 0.58 | 126 | |||||||||||||||||||||||||||||
2007 | 20.40 | 0.06 | 3.40 | 3.46 | (0.10 | ) | (1.54 | ) | (1.64 | ) | 22.22 | 17.51 | 183,287 | 1.01 | 1.01 | 1.02 | 0.26 | 176 | ||||||||||||||||||||||||||||||||
2006 | 20.29 | 0.14 | 1.49 | 1.63 | (0.12 | ) | (1.40 | ) | (1.52 | ) | 20.40 | 8.50 | 90,208 | 1.01 | 1.01 | 1.03 | 0.67 | 135 | ||||||||||||||||||||||||||||||||
2005 | 17.84 | 0.06 | 4.61 | 4.67 | (0.06 | ) | (2.16 | ) | (2.22 | ) | 20.29 | 28.15 | 71,162 | 1.01 | 1.01 | 1.03 | 0.30 | 137 | ||||||||||||||||||||||||||||||||
Class I | ||||||||||||||||||||||||||||||||||||||||||||||||||
2010** | $ | 13.92 | $ | 0.03 | $ | 1.84 | $ | 1.87 | $ | (0.03 | ) | $ | — | $ | (0.03 | ) | $ | 15.76 | 13.46 | % | $ | 719 | 1.26 | % | 1.26 | % | 1.28 | % | 0.36 | % | 58 | % | ||||||||||||||||||
2009 | 14.86 | 0.05 | (0.89 | ) | (0.84 | ) | (0.10 | ) | — | (0.10 | ) | 13.92 | (5.47 | ) | 274 | 1.26 | 1.26 | 1.30 | 0.48 | 143 | ||||||||||||||||||||||||||||||
2008(6) | 22.56 | 0.06 | (5.63 | ) | (5.57 | ) | (0.04 | ) | (2.09 | ) | (2.13 | ) | 14.86 | (26.82 | ) | 52 | 1.26 | 1.26 | 1.27 | 0.33 | 126 | |||||||||||||||||||||||||||||
U.S. Managed Volatility Fund |
| |||||||||||||||||||||||||||||||||||||||||||||||||
Class A | ||||||||||||||||||||||||||||||||||||||||||||||||||
2010** | $ | 9.65 | $ | 0.08 | $ | 1.00 | $ | 1.08 | $ | (0.10 | ) | $ | — | $ | (0.10 | ) | $ | 10.63 | 11.27 | % | $ | 383,606 | 1.00 | % | 1.00 | % | 1.28 | % | 1.50 | % | 20 | % | ||||||||||||||||||
2009 | 11.25 | 0.13 | (1.59 | ) | (1.46 | ) | (0.14 | ) | — | (0.14 | ) | 9.65 | (12.88 | ) | 380,987 | 1.00 | 1.00 | 1.29 | 1.56 | 126 | ||||||||||||||||||||||||||||||
2008 | 13.45 | 0.10 | (1.69 | ) | (1.59 | ) | (0.10 | ) | (0.51 | ) | (0.61 | ) | 11.25 | (12.38 | ) | 458,668 | 1.00 | 1.00 | 1.27 | 0.85 | 85 | |||||||||||||||||||||||||||||
2007 | 12.02 | 0.15 | 1.74 | 1.89 | (0.14 | ) | (0.32 | ) | (0.46 | ) | 13.45 | 16.09 | 585,858 | 1.04 | 1.04 | 1.27 | 1.19 | 112 | ||||||||||||||||||||||||||||||||
2006 | 11.41 | 0.10 | 0.75 | 0.85 | (0.09 | ) | (0.15 | ) | (0.24 | ) | 12.02 | 7.64 | 303,523 | 1.11 | 1.11 | 1.27 | 0.91 | 133 | ||||||||||||||||||||||||||||||||
2005(7) | 10.00 | 0.10 | 1.39 | 1.49 | (0.08 | ) | — | * | (0.08 | ) | 11.41 | 14.94 | 160,047 | 1.11 | 1.11 | 1.27 | 1.03 | 102 | ||||||||||||||||||||||||||||||||
Class I | ||||||||||||||||||||||||||||||||||||||||||||||||||
2010** | $ | 9.63 | $ | 0.07 | $ | 1.01 | $ | 1.08 | $ | (0.09 | ) | $ | — | $ | (0.09 | ) | $ | 10.62 | 11.23 | % | $ | 45 | 1.25 | % | 1.25 | % | 1.54 | % | 1.32 | % | 20 | % | ||||||||||||||||||
2009 | 11.24 | 0.12 | (1.61 | ) | (1.49 | ) | (0.12 | ) | — | (0.12 | ) | 9.63 | (13.17 | ) | 17 | 1.25 | 1.25 | 1.55 | 1.38 | 126 | ||||||||||||||||||||||||||||||
2008 | 13.43 | 0.09 | (1.71 | ) | (1.62 | ) | (0.06 | ) | (0.51 | ) | (0.57 | ) | 11.24 | (12.58 | ) | 6 | 1.25 | 1.25 | 1.57 | 0.71 | 85 | |||||||||||||||||||||||||||||
2007(10) | 13.54 | 0.01 | (0.05 | ) | (0.04 | ) | (0.07 | ) | — | (0.07 | ) | 13.43 | (0.32 | ) | 1 | 1.36 | 1.36 | 1.86 | 0.19 | 112 | ||||||||||||||||||||||||||||||
Global Managed Volatility Fund |
| |||||||||||||||||||||||||||||||||||||||||||||||||
Class A | ||||||||||||||||||||||||||||||||||||||||||||||||||
2010** | $ | 7.82 | $ | 0.05 | $ | 0.40 | $ | 0.45 | $ | (0.03 | ) | $ | — | $ | (0.03 | ) | $ | 8.24 | 5.75 | % | $ | 259,351 | 1.11 | % | 1.11 | % | 1.30 | % | 1.23 | % | 62 | % | ||||||||||||||||||
2009 | 9.07 | 0.12 | (1.37 | ) | (1.25 | ) | — | — | — | 7.82 | (13.78 | ) | 213,773 | 1.13 | (3) | 1.13 | (3) | 1.35 | 1.59 | 155 | ||||||||||||||||||||||||||||||
2008 | 11.22 | 0.12 | (1.92 | ) | (1.80 | ) | (0.18 | ) | (0.17 | ) | (0.35 | ) | 9.07 | (16.60 | ) | 204,156 | 1.11 | 1.11 | 1.31 | 1.24 | 113 | |||||||||||||||||||||||||||||
2007 | 10.37 | 0.17 | 0.85 | 1.02 | (0.11 | ) | (0.06 | ) | (0.17 | ) | 11.22 | 9.88 | 275,748 | 1.11 | 1.11 | 1.32 | 1.56 | 119 | ||||||||||||||||||||||||||||||||
2006(8) | 10.00 | 0.02 | 0.35 | 0.37 | — | — | — | 10.37 | 3.70 | 94,951 | 1.10 | 1.10 | 1.30 | 1.22 | 13 | |||||||||||||||||||||||||||||||||||
Class I | ||||||||||||||||||||||||||||||||||||||||||||||||||
2010** | $ | 7.76 | $ | 0.04 | $ | 0.40 | $ | 0.44 | $ | (0.02 | ) | $ | — | $ | (0.02 | ) | $ | 8.18 | 5.71 | % | $ | 14 | 1.35 | % | 1.35 | % | 1.55 | % | 0.93 | % | 62 | % | ||||||||||||||||||
2009 | 9.02 | 0.11 | (1.37 | ) | (1.26 | ) | — | — | — | 7.76 | (13.97 | ) | 17 | 1.38 | (3) | 1.38 | (3) | 1.62 | 1.56 | 155 | ||||||||||||||||||||||||||||||
2008 | 11.20 | 0.14 | (1.97 | ) | (1.83 | ) | (0.18 | ) | (0.17 | ) | (0.35 | ) | 9.02 | (16.86 | ) | 10 | 1.36 | 1.36 | 1.56 | 1.49 | 113 | |||||||||||||||||||||||||||||
2007(10) | 11.45 | 0.01 | (0.26 | ) | (0.25 | ) | — | — | — | 11.20 | (2.18 | ) | 1 | 1.36 | 1.36 | 2.26 | 0.23 | 119 | ||||||||||||||||||||||||||||||||
Tax-Managed Managed Volatility Fund |
| |||||||||||||||||||||||||||||||||||||||||||||||||
Class A | ||||||||||||||||||||||||||||||||||||||||||||||||||
2010** | $ | 8.14 | $ | 0.07 | $ | 0.87 | $ | 0.94 | $ | (0.09 | ) | $ | — | $ | (0.09 | ) | $ | 8.99 | 11.66 | % | $ | 199,921 | 1.00 | % | 1.00 | % | 1.28 | % | 1.59 | % | 12 | % | ||||||||||||||||||
2009 | 9.02 | 0.12 | (0.88 | ) | (0.76 | ) | (0.12 | ) | — | (0.12 | ) | 8.14 | (8.28 | ) | 172,265 | 1.00 | 1.00 | 1.29 | 1.69 | 94 | ||||||||||||||||||||||||||||||
2008(11) | 10.00 | 0.10 | (1.02 | ) | (0.92 | ) | (0.06 | ) | — | (0.06 | ) | 9.02 | (9.24 | ) | 96,523 | 1.00 | 1.00 | 1.29 | 1.43 | 65 | ||||||||||||||||||||||||||||||
Real Estate Fund | ||||||||||||||||||||||||||||||||||||||||||||||||||
Class A | ||||||||||||||||||||||||||||||||||||||||||||||||||
2010** | $ | 9.42 | $ | 0.10 | $ | 1.59 | $ | 1.69 | $ | (0.25 | ) | $ | — | $ | (0.25 | ) | $ | 10.86 | 18.23 | % | $ | 240,243 | 1.14 | % | 1.14 | % | 1.28 | % | 2.15 | % | 34 | % | ||||||||||||||||||
2009 | 13.73 | 0.16 | (4.18 | ) | (4.02 | ) | (0.29 | )(2) | — | (0.29 | ) | 9.42 | (28.69 | ) | 221,228 | 1.14 | 1.15 | 1.29 | 2.08 | 97 | ||||||||||||||||||||||||||||||
2008 | 18.20 | 0.13 | (3.11 | ) | (2.98 | ) | (0.38 | ) | (1.11 | ) | (1.49 | ) | 13.73 | (17.15 | ) | 251,359 | 1.13 | 1.13 | 1.27 | 0.86 | 52 | |||||||||||||||||||||||||||||
2007 | 18.43 | 0.30 | 0.76 | 1.06 | (0.36 | ) | (0.93 | ) | (1.29 | ) | 18.20 | 5.49 | 244,991 | 1.11 | 1.12 | 1.27 | 1.55 | 84 | ||||||||||||||||||||||||||||||||
2006 | 14.86 | 0.23 | 4.15 | 4.38 | (0.36 | ) | (0.45 | ) | (0.81 | ) | 18.43 | 30.44 | 192,674 | 1.11 | 1.12 | 1.27 | 1.39 | 65 | ||||||||||||||||||||||||||||||||
2005 | 11.89 | 0.27 | 3.22 | 3.49 | (0.26 | ) | (0.26 | ) | (0.52 | ) | 14.86 | 29.97 | 96,405 | 1.11 | 1.11 | 1.27 | 1.95 | 58 | ||||||||||||||||||||||||||||||||
Class I | ||||||||||||||||||||||||||||||||||||||||||||||||||
2010** | $ | 9.41 | $ | 0.10 | $ | 1.58 | $ | 1.68 | $ | (0.24 | ) | $ | — | $ | (0.24 | ) | $ | 10.85 | 18.07 | % | $ | 254 | 1.36 | % | 1.37 | % | 1.54 | % | 2.06 | % | 34 | % | ||||||||||||||||||
2009 | 13.72 | 0.09 | (4.12 | ) | (4.03 | ) | (0.28 | )(2) | — | (0.28 | ) | 9.41 | (28.83 | ) | 132 | 1.36 | 1.37 | 1.55 | 1.26 | 97 | ||||||||||||||||||||||||||||||
2008(6) | 18.55 | 0.13 | (3.49 | ) | (3.36 | ) | (0.36 | ) | (1.11 | ) | (1.47 | ) | 13.72 | (18.89 | ) | 25 | 1.36 | 1.36 | 1.52 | 0.86 | 52 | |||||||||||||||||||||||||||||
Enhanced Income Fund |
| |||||||||||||||||||||||||||||||||||||||||||||||||
Class A | ||||||||||||||||||||||||||||||||||||||||||||||||||
2010** | $ | 7.21 | $ | 0.15 | $ | 0.27 | $ | 0.42 | $ | (0.19 | ) | $ | — | $ | (0.19 | ) | $ | 7.44 | 5.86 | % | $ | 214,407 | 0.60 | % | 0.60 | % | 1.08 | % | 3.97 | % | 43 | % | ||||||||||||||||||
2009 | 8.21 | 0.29 | (1.09 | ) | (0.80 | ) | (0.20 | ) | — | (0.20 | ) | 7.21 | (9.56 | ) | 233,747 | 0.60 | 0.60 | 1.06 | 4.30 | 132 | ||||||||||||||||||||||||||||||
2008 | 9.92 | 0.49 | (1.68 | ) | (1.19 | ) | (0.52 | ) | — | (0.52 | ) | 8.21 | (12.42 | ) | 314,795 | 0.60 | 0.60 | 1.04 | 5.40 | 42 | ||||||||||||||||||||||||||||||
2007 | 10.11 | 0.57 | (0.27 | ) | 0.30 | (0.49 | ) | — | (0.49 | ) | 9.92 | 2.96 | 620,931 | 0.60 | 0.60 | 1.03 | 5.67 | 43 | ||||||||||||||||||||||||||||||||
2006(8) | 10.00 | 0.10 | 0.01 | 0.11 | — | — | — | 10.11 | 1.10 | 235,981 | 0.60 | 0.60 | 1.10 | 5.54 | 70 | |||||||||||||||||||||||||||||||||||
Class I | ||||||||||||||||||||||||||||||||||||||||||||||||||
2010** | $ | 7.20 | $ | 0.14 | $ | 0.27 | $ | 0.41 | $ | (0.17 | ) | $ | — | $ | (0.17 | ) | $ | 7.44 | 5.82 | % | $ | 63 | 0.85 | % | 0.85 | % | 1.34 | % | 3.70 | % | 43 | % | ||||||||||||||||||
2009 | 8.20 | 0.25 | (1.06 | ) | (0.81 | ) | (0.19 | ) | — | (0.19 | ) | 7.20 | (9.79 | ) | 45 | 0.85 | 0.85 | 1.31 | 3.73 | 132 | ||||||||||||||||||||||||||||||
2008 | 9.91 | 0.43 | (1.63 | ) | (1.20 | ) | (0.51 | ) | — | (0.51 | ) | 8.20 | (12.61 | ) | 16 | 0.85 | 0.85 | 1.29 | 4.82 | 42 | ||||||||||||||||||||||||||||||
2007(10) | 10.25 | 0.15 | (0.35 | ) | (0.20 | ) | (0.14 | ) | — | (0.14 | ) | 9.91 | (2.01 | ) | 11 | 1.09 | 1.09 | 1.56 | 5.78 | 43 | ||||||||||||||||||||||||||||||
| 118 | SEI Institutional Managed Trust / Semi-Annual Report / March 31, 2010 |
Table of Contents
| Net Asset Value, Beginning of Period | Net Investment Income(1) | Net Realized and Unrealized Gains (Losses) on Securities(1) | Total from Operations | Dividends from Net Investment Income | Distributions from Realized Capital Gains | Total Dividends and Distributions | Net Asset Value, End of Period | Total Return† | Net Assets End of Period ($Thousands) | Ratio of Expenses to Average Net Assets | Ratio of Expenses to Average Net Assets (Excluding Fees Paid Indirectly) | Ratio of Expenses to Average Net Assets (Excluding Fees Paid Indirectly and Waivers) | Ratio of Net Investment Income to Average Net Assets | Portfolio Turnover Rate† | ||||||||||||||||||||||||||||||||||||
Core Fixed Income Fund |
| |||||||||||||||||||||||||||||||||||||||||||||||||
Class A | ||||||||||||||||||||||||||||||||||||||||||||||||||
2010** | $ | 9.98 | $ | 0.24 | $ | 0.38 | $ | 0.62 | $ | (0.24 | ) | $ | — | $ | (0.24 | ) | $ | 10.36 | 6.21 | % | $ | 2,462,808 | 0.67 | % | 0.67 | % | 0.85 | % | 4.64 | % | 94 | % | ||||||||||||||||||
2009 | 9.37 | 0.50 | 0.62 | 1.12 | (0.51 | ) | — | (0.51 | ) | 9.98 | 12.55 | 2,450,746 | 0.67 | 0.67 | 0.86 | 5.42 | 329 | |||||||||||||||||||||||||||||||||
2008 | 10.19 | 0.51 | (0.82 | ) | (0.31 | ) | (0.51 | ) | — | (0.51 | ) | 9.37 | (3.25 | ) | 3,686,633 | 0.66 | 0.66 | 0.84 | 5.12 | 335 | ||||||||||||||||||||||||||||||
2007 | 10.29 | 0.50 | (0.10 | ) | 0.40 | (0.50 | ) | — | (0.50 | ) | 10.19 | 4.00 | 4,600,629 | 0.64 | 0.64 | 0.84 | 4.89 | 413 | ||||||||||||||||||||||||||||||||
2006 | 10.44 | 0.47 | (0.11 | ) | 0.36 | (0.48 | ) | (0.03 | ) | (0.51 | ) | 10.29 | 3.60 | 4,293,309 | 0.63 | 0.63 | 0.84 | 4.62 | 478 | |||||||||||||||||||||||||||||||
2005 | 10.65 | 0.40 | (0.11 | ) | 0.29 | (0.41 | ) | (0.09 | ) | (0.50 | ) | 10.44 | 2.83 | 4,094,011 | 0.61 | 0.61 | 0.84 | 3.83 | 557 | |||||||||||||||||||||||||||||||
Class I | ||||||||||||||||||||||||||||||||||||||||||||||||||
2010** | $ | 9.97 | $ | 0.22 | $ | 0.39 | $ | 0.61 | $ | (0.22 | ) | $ | — | $ | (0.22 | ) | $ | 10.36 | 6.21 | % | $ | 14,244 | 0.89 | % | 0.89 | % | 1.10 | % | 4.42 | % | 94 | % | ||||||||||||||||||
2009 | 9.36 | 0.48 | 0.62 | 1.10 | (0.49 | ) | — | (0.49 | ) | 9.97 | 12.32 | 13,658 | 0.89 | 0.89 | 1.11 | 5.21 | 329 | |||||||||||||||||||||||||||||||||
2008 | 10.19 | 0.49 | (0.84 | ) | (0.35 | ) | (0.48 | ) | — | (0.48 | ) | 9.36 | (3.58 | ) | 8,090 | 0.90 | 0.90 | 1.09 | 4.87 | 335 | ||||||||||||||||||||||||||||||
2007 | 10.29 | 0.41 | (0.03 | ) | 0.38 | (0.48 | ) | — | (0.48 | ) | 10.19 | 3.74 | 12,890 | 0.89 | 0.89 | 1.09 | 3.96 | 413 | ||||||||||||||||||||||||||||||||
2006 | 10.43 | 0.45 | (0.11 | ) | 0.34 | (0.45 | ) | (0.03 | ) | (0.48 | ) | 10.29 | 3.44 | 14,035 | 0.88 | 0.88 | 1.09 | 4.37 | 478 | |||||||||||||||||||||||||||||||
2005 | 10.65 | 0.38 | (0.12 | ) | 0.26 | (0.39 | ) | (0.09 | ) | (0.48 | ) | 10.43 | 2.48 | 12,979 | 0.86 | 0.86 | 1.09 | 3.60 | 557 | |||||||||||||||||||||||||||||||
U.S. Fixed Income Fund |
| |||||||||||||||||||||||||||||||||||||||||||||||||
Class A | ||||||||||||||||||||||||||||||||||||||||||||||||||
2010** | $ | 10.28 | $ | 0.17 | $ | 0.11 | $ | 0.28 | $ | (0.18 | ) | $ | (0.04 | ) | $ | (0.22 | ) | $ | 10.34 | 2.80 | % | $ | 895,112 | 0.66 | % | 0.66 | % | 0.83 | % | 3.29 | % | 129 | % | |||||||||||||||||
2009(9) | 10.00 | 0.08 | 0.27 | 0.35 | (0.07 | ) | — | (0.07 | ) | 10.28 | 3.55 | 677,723 | 0.66 | 0.66 | 0.87 | 3.23 | 51 | |||||||||||||||||||||||||||||||||
High Yield Bond Fund |
| |||||||||||||||||||||||||||||||||||||||||||||||||
Class A | ||||||||||||||||||||||||||||||||||||||||||||||||||
2010** | $ | 6.52 | $ | 0.34 | $ | 0.58 | $ | 0.92 | $ | (0.30 | ) | $ | (0.02 | ) | $ | (0.32 | ) | $ | 7.12 | 14.42 | % | $ | 1,455,050 | 0.89 | % | 0.89 | % | 1.13 | % | 9.96 | % | 57 | % | |||||||||||||||||
2009 | 6.57 | 0.60 | (0.02 | ) | 0.58 | (0.56 | ) | (0.07 | ) | (0.63 | ) | 6.52 | 11.88 | 1,289,964 | 0.89 | 0.89 | 1.15 | 11.03 | 98 | |||||||||||||||||||||||||||||||
2008 | 8.26 | 0.66 | (1.60 | ) | (0.94 | ) | (0.66 | ) | (0.09 | ) | (0.75 | ) | 6.57 | (12.09 | ) | 1,076,379 | 0.88 | 0.88 | 1.13 | 8.73 | 69 | |||||||||||||||||||||||||||||
2007 | 8.38 | 0.67 | (0.11 | ) | 0.56 | (0.68 | ) | — | (0.68 | ) | 8.26 | 6.72 | 1,247,613 | 0.86 | 0.86 | 1.12 | 7.89 | 91 | ||||||||||||||||||||||||||||||||
2006 | 8.50 | 0.65 | (0.12 | ) | 0.53 | (0.65 | ) | — | (0.65 | ) | 8.38 | 6.51 | 1,068,711 | 0.86 | 0.86 | 1.12 | 7.69 | 126 | ||||||||||||||||||||||||||||||||
2005 | 8.58 | 0.64 | (0.08 | ) | 0.56 | (0.64 | ) | — | (0.64 | ) | 8.50 | 6.71 | 1,599,921 | 0.86 | 0.86 | 1.12 | 7.46 | 132 | ||||||||||||||||||||||||||||||||
Class I | ||||||||||||||||||||||||||||||||||||||||||||||||||
2010** | $ | 6.53 | $ | 0.33 | $ | 0.59 | $ | 0.92 | $ | (0.30 | ) | $ | (0.02 | ) | $ | (0.32 | ) | $ | 7.13 | 14.37 | % | $ | 263 | 1.11 | % | 1.11 | % | 1.38 | % | 9.72 | % | 57 | % | |||||||||||||||||
2009 | 6.58 | 0.58 | (0.01 | ) | 0.57 | (0.55 | ) | (0.07 | ) | (0.62 | ) | 6.53 | 11.65 | 200 | 1.11 | 1.11 | 1.40 | 10.45 | 98 | |||||||||||||||||||||||||||||||
2008(6) | 8.26 | 0.66 | (1.61 | ) | (0.95 | ) | (0.64 | ) | (0.09 | ) | (0.73 | ) | 6.58 | (12.20 | ) | 47 | 1.11 | 1.11 | 1.38 | 8.96 | 69 | |||||||||||||||||||||||||||||
Real Return Fund |
| |||||||||||||||||||||||||||||||||||||||||||||||||
Class A |
| |||||||||||||||||||||||||||||||||||||||||||||||||
2010** | $ | 10.19 | $ | 0.08 | $ | 0.23 | $ | 0.31 | $ | (0.14 | ) | $ | (0.01 | ) | $ | (0.15 | ) | $ | 10.35 | 3.05 | % | $ | 131,584 | 0.45 | % | 0.45 | % | 0.85 | % | 1.50 | % | 92 | % | |||||||||||||||||
2009(9) | 10.00 | 0.10 | 0.09 | 0.19 | — | — | — | 10.19 | 1.90 | 83,568 | 0.45 | 0.45 | 0.88 | 4.11 | 23 | |||||||||||||||||||||||||||||||||||
Multi-Strategy Alternative Fund |
| |||||||||||||||||||||||||||||||||||||||||||||||||
Class A | ||||||||||||||||||||||||||||||||||||||||||||||||||
2010(13) | $ | 10.00 | $ | — | $ | — | $ | — | $ | — | $ | — | $ | — | $ | 10.00 | — | % | $ | 100 | — | % | — | % | — | % | — | % | — | % | ||||||||||||||||||||
| † | Returns and turnover rates are for the period indicated and have not been annualized. |
| * | Amount represents less than $0.01. |
| ** | For the six month period ended March 31, 2010. All ratios for the period have been annualized. |
| (1) | Per share net investment income and net realized and unrealized gains/(losses) calculated using average shares. |
| (2) | Includes return of capital of less than $0.01. |
| (3) | The expense ratios include overdraft fees. Had these fees been excluded the ratios would have been 1.11% and 1.36% for Class A and Class I, respectively. |
| (4) | For the six months ended September 30, 2007. The Fund’s fiscal year end changed from March 31 to September 30. All ratios for the period have been annualized. |
| (5) | For the year or period ended March 31. |
| (6) | Commenced operations on October 1, 2007. All ratios for the period have been annualized. |
| (7) | Commenced operations on October 28, 2004. All ratios for the period have been annualized. |
| (8) | Commenced operations on July 27, 2006. All ratios for the period have been annualized. |
| (9) | Commenced operations on July 2, 2009. All ratios for the period have been annualized. |
| (10) | Commenced operations on June 29, 2007. All ratios for the period have been annualized. |
| (11) | Commenced operations on December 20, 2007. All ratios for the period have been annualized. |
| (12) | Commenced operations on October 1, 2009. All ratios for the period have been annualized. |
| (13) | Commenced operations on March 31, 2010. Fund did not generate any income or expenses during the period indicated. |
Amounts designated as “—” are $0 or have been rounded to $0.
The accompanying notes are an integral part of the financial statements.
| SEI Institutional Managed Trust / Semi-Annual Report / March 31, 2010 | 119 |
Table of Contents
Notes to Financial Statements (Unaudited)
March 31, 2010
1. ORGANIZATION
SEI Institutional Managed Trust (the “Trust”) is organized as a Massachusetts business trust under a Declaration of Trust dated October 20, 1986.
The Trust is registered under the Investment Company Act of 1940, as amended, as an open-end investment company with 21 funds: Large Cap, Large Cap Value, Large Cap Growth, Tax-Managed Large Cap, S&P 500 Index, Small Cap, Small Cap Value, Small Cap Growth, Tax-Managed Small Cap, Mid-Cap, U.S. Managed Volatility, Global Managed Volatility, Tax-Managed Managed Volatility, Real Estate, Enhanced Income, Core Fixed Income, U.S. Fixed Income, High Yield Bond, Real Return, Prime Obligation and Multi-Strategy Alternative Funds (each a “Fund,” collectively the “Funds”). The Trust is registered to offer: Class A shares of the Funds; Class E shares of the S&P 500 Fund; Class I shares of the Large Cap Value, Large Cap Growth, S&P 500 Index, Small Cap Value, Small Cap Growth, Mid-Cap, U.S. Managed Volatility, Global Managed Volatility, Real Estate, Enhanced Income, Core Fixed Income, High Yield Bond and Real Return Funds; and Class Y shares of the Tax-Managed Large Cap Fund. The assets of each Fund are segregated, and a shareholder’s interest is limited to the Fund in which shares are held. The Funds’ prospectuses provide a description of each Fund’s investment objective, policies, and strategies.
As of March 31, 2010, the Prime Obligation Fund had not yet commenced operations.
2. SIGNIFICANT ACCOUNTING POLICIES
The following is a summary of the significant accounting policies followed by the Funds.
Use of Estimates — The preparation of financial statements, in conformity with U.S. generally accepted accounting principles (“GAAP”) requires management to make estimates and assumptions that affect the reported amounts of assets and liabilities and disclosure of contingent assets and liabilities as of the date of the financial statements and the reported amounts of increases and decreases in net assets from operations during the reporting period. Actual results could differ from those estimates.
Security Valuation — Securities listed on a securities exchange, market or automated quotation system for which quotations are readily available (except for securities traded on NASDAQ) are valued at the last quoted sale price on the primary exchange or market (foreign or domestic) on which they are traded, or, if there is no such reported sale, at the most recent quoted bid price. For securities traded on NASDAQ, the NASDAQ Official Closing Price will be used. If available, debt securities are priced based upon valuations provided by independent, third-party pricing agents. Such values generally reflect the last reported sales price if the security is actively traded. The third-party pricing agents may also value debt securities at an evaluated bid price by employing methodologies that utilize actual market
transactions, broker-supplied valuations, or other methodologies designed to identify the market value for such securities. Debt obligations with remaining maturities of sixty days or less may be valued at their amortized cost, which approximates market value. Prices for most securities held in the Funds are provided daily by recognized independent pricing agents. If a security price cannot be obtained from an independent, third-party pricing agent, the Funds seek to obtain a bid price from at least one independent broker.
Securities for which market prices are not “readily available” are valued in accordance with Fair Value Procedures established by the Trust’s Board of Trustees. The Trust’s Fair Value Procedures are implemented through a Fair Value Committee (the “Committee”) designated by the Trust’s Board of Trustees. Some of the more common reasons that may necessitate that a security be valued using Fair Value Procedures include: the security’s trading has been halted or suspended; the security has been de-listed from a national exchange; the security’s primary trading market is temporarily closed at a time when, under normal conditions, it would be open; or the security’s primary pricing source is not able or willing to provide a price. When a security is valued in accordance with the Fair Value Procedures, the Committee will determine the value after taking into consideration relevant information reasonably available to the Committee.
For securities that principally trade on a foreign market or exchange, a significant gap in time can exist between the time of a particular security’s last trade and the time at which a Fund calculates its net asset value. The closing prices of such securities may no longer reflect their market value at the time a Fund calculates net asset value if an event that could materially affect the value of those securities (a “Significant Event”) has occurred between the time of the security’s last close and the time that a Fund calculates net asset value. A Significant Event may relate to a single issuer or to an entire market sector. If the adviser or sub-adviser of a Fund becomes aware of a Significant Event that has occurred with respect to a security or group of securities after the closing of the exchange or market on which the security or securities principally trade, but before the time at which a Fund calculates net asset value, it may request that a Committee meeting be called. In addition, the Trust’s administrator monitors price movements among certain selected indices, securities and/or baskets of securities that may be an indicator that the closing prices received earlier from foreign exchanges or markets may not reflect market value at the time a Fund calculates net asset value. If price movements in a monitored index or security exceed levels established by the administrator, the administrator notifies the adviser or sub-adviser for any Fund holding the relevant securities that such limits have been exceeded. In such event, the adviser or sub-adviser makes the determination whether a Committee meeting should be called based on the information provided.
Options and warrants for which the primary market is a national securities exchange are valued at the last sale price on the exchange on which they are traded, or, in the absence of any sale, at the closing
| 120 | SEI Institutional Managed Trust / Semi-Annual Report / March 31, 2010 |
Table of Contents
bid price. Options and warrants not traded on a national securities exchange are valued at the last quoted bid price.
In accordance with GAAP, Fair Value is defined as the price that a Fund would receive upon selling an investment in a timely transaction to an independent buyer in the principal or most advantageous market of the investment. A three-tier hierarchy has been established to maximize the use of observable and minimize the use of unobservable inputs and to establish classification of fair value measurements for disclosure purposes. Inputs refer broadly to the assumptions that market participants would use in pricing an asset. Inputs may be observable or unobservable. Observable inputs are inputs that reflect the assumptions market participants would use in pricing the asset or liability based on market data obtained from sources independent of the reporting entity. Unobservable inputs are inputs that reflect the reporting entity’s own assumptions about the assumptions market participants would use in pricing the asset or liability based on the best information available in the circumstances.
The three-tier hierarchy of inputs is summarized in the three broad Levels listed below:
Level 1 — quoted prices in active markets for identical investments
Level 2 — other significant observable inputs (including quoted prices for similar investments, interest rates, prepayment speeds, credit risks, etc.)
Level 3 — significant unobservable inputs (including the Fund’s own assumptions in determining the fair value of investments)
The valuation techniques used by the Funds to measure fair value during the six month period ended March 31, 2010 maximized the use of observable inputs and minimized the use of unobservable inputs.
For the six month period ended March 31, 2010, there have been no significant changes to the Trust’s fair valuation methodologies.
Security Transactions and Investment Income — Security transactions are recorded on the trade date. Costs used in determining net realized capital gains and losses on the sale of securities are on the basis of specific identification. Dividend income is recognized on the ex-dividend date, and interest income is recognized using the accrual basis of accounting. Income from payment-in-kind securities is recorded daily based on the effective interest method of accrual.
Distributions received on securities that represent a return of capital or capital gain are recorded as a reduction of cost of investments and/or as a realized gain. The Trust estimates the components of distributions received that may be considered nontaxable distributions or capital gain distributions.
Amortization and accretion is calculated using the scientific interest method, which approximates the effective interest method over
the holding period of the security. Amortization of premiums and discounts is included in interest income.
Repurchase Agreements — Securities pledged as collateral for repurchase agreements are held by each Fund’s custodian bank until the repurchase date of the repurchase agreement. The Funds also invest in tri-party repurchase agreements. Securities held as collateral for tri-party repurchase agreements are maintained by the broker’s custodian bank in a segregated account until the repurchase date of the repurchase agreement. Provisions of the repurchase agreements and the Trust’s policies require that the market value of the collateral, including accrued interest thereon, is sufficient in the event of default by the counterparty. If the counterparty defaults and the value of the collateral declines, or if the counterparty enters into an insolvency proceeding, realization of the collateral by the Funds may be delayed or limited.
Reverse Repurchase Agreements — To the extent consistent with its Investment Objective and Strategies, a Fund may issue reverse repurchase agreements. A reverse repurchase agreement involves the sale of portfolio assets together with an agreement to repurchase the same assets later at a fixed price. Additional assets are maintained in an account with the broker. The segregated assets may consist of cash, U.S. Government securities, or other liquid securities at least equal in value to the obligations under the reverse repurchase agreements. In the event the buyer of securities under a reverse repurchase agreement files for bankruptcy or becomes insolvent, a Fund’s use of the proceeds under the agreement may be restricted pending a determination by the other party, or its trustee or receiver, whether to enforce the obligation to repurchase the securities. There were no reverse repurchase agreements outstanding as of March 31, 2010.
Expenses — Expenses that are directly related to a Fund are charged directly to that Fund. Other operating expenses of the Funds are prorated to the Funds on the basis of relative daily net assets.
Classes — Class-specific expenses are borne by that class of shares. Income, realized and unrealized gains/losses and non class-specific expenses are allocated to the respective class on the basis of relative daily net assets.
Foreign Currency Translation — The books and records of the Funds are maintained in U.S. dollars on the following basis:
(I) market value of investment securities, assets and liabilities at the current rate of exchange; and
(II) purchases and sales of investment securities, income and expenses at the relevant rates of exchange prevailing on the respective dates of such transactions.
The Funds do not isolate that portion of gains and losses on investments in equity securities that is due to changes in the foreign exchange rates from that which is due to changes in market prices of equity securities.
| SEI Institutional Managed Trust / Semi-Annual Report / March 31, 2010 | 121 |
Table of Contents
Notes to Financial Statements (Unaudited) (Continued)
March 31, 2010
The Funds report certain foreign-currency-related transactions as components of realized gains for financial reporting purposes, whereas such components are treated as ordinary income for Federal income tax purposes.
Forward Foreign Currency Contracts — To the extent consistent with its Investment Objective and Strategies, a Fund may enter into forward foreign currency contracts as hedges against either specific transactions, fund positions or anticipated fund positions. To the extent consistent with its Investment Objective and Strategies, a Fund may also engage in currency transactions to enhance that Fund’s returns. All commitments are “marked-to-market” daily at the applicable foreign exchange rate, and any resulting unrealized gains or losses are recorded currently. The Funds realize gains and losses at the time forward contracts are extinguished. Unrealized gains or losses on outstanding positions in forward foreign currency contracts held at the close of the period are recognized as ordinary income or loss for Federal income tax purposes. The Funds could be exposed to risk if the counterparties to the contracts are unable to meet the terms of the contract and from unanticipated movements in the value of a foreign currency relative to the U.S. dollar. Finally, the risk exists that losses could exceed amounts disclosed on the Statements of Assets and Liabilities. The Global Managed Volatility and Core Fixed Income Funds held Forward Foreign currency contracts as of March 31, 2010, as disclosed in the Funds Schedules of Investments.
Futures Contracts — All Funds, with the exception of the Real Estate, U.S. Fixed Income, High Yield Bond, Real Return and Multi-Strategy Alternative Funds, utilized futures contracts during the six month period ended March 31, 2010. These Funds’ investments in futures contracts are designed to enable the Funds to more closely approximate the performance of their benchmark indices. To the extent consistent with its Investment Objective and Strategies, a Fund may use futures contracts for tactical hedging purposes as well as to enhance the Fund’s returns. Initial margin deposits of cash or securities are made upon entering into futures contracts. The contracts are marked to market daily and the resulting changes in value are accounted for as unrealized gains and losses. Variation margin payments are paid or received, depending upon whether unrealized gains or losses are incurred. When the contract is closed, the Funds record a realized gain or loss equal to the difference between the proceeds from (or cost of) the closing transaction and the amount invested in the contract.
Risks of entering into futures contracts include the possibility that there will be an imperfect price correlation between the futures and the underlying securities. Second, it is possible that a lack of liquidity for futures contracts could exist in the secondary market, resulting in an inability to close a position prior to its maturity date. Third, the futures contract involves the risk that the Fund could lose more than the original margin deposit required to initiate a futures transaction.
Finally, the risk exists that losses could exceed amounts disclosed on the Statements of Assets and Liabilities.
Options/Swaptions Writing/Purchasing — To the extent consistent with its Investment Objective and Strategies, a Fund may invest in
financial options/swaptions contracts for the purpose of hedging its existing fund securities, or securities that a Fund intends to purchase, against fluctuations in fair value caused by changes in prevailing market interest rates. To the extent consistent with its Investment Objective and Strategies, a Fund may also invest in financial option/swaption contracts to enhance the Fund’s returns. When a Fund writes or purchases an option/swaption, an amount equal to the premium received or paid by the Fund is recorded as a liability or an asset and is subsequently adjusted to the current market value of the option/swaption written or purchased. Premiums received or paid from writing or purchasing options/swaptions which expire unexercised are treated by the Fund on the expiration date as realized gains or losses. The difference between the premium and the amount paid or received on effecting a closing purchase or sale transaction, including brokerage commissions, is also treated as a realized gain or loss. If an option/swaption is exercised, the premium paid or received is added to the cost of the purchase or proceeds from the sale in determining whether the Fund has realized a gain or a loss on investment transactions. The Core Fixed Income Fund had option/swaption contracts as of March 31, 2010 as disclosed in the Fund’s Schedules of Investments.
The risk in writing a call option/swaption is that the Funds give up the opportunity for profit if the market price of the security increases. The risk in writing a put option/swaption is that the Funds may incur a loss if the market price of the security decreases and the option/swaption is exercised. The risk in purchasing an option/swaption is that the Funds pay a premium whether or not the option/swaption is exercised. The Funds also have the additional risk of being unable to enter into a closing transaction at an acceptable price if a liquid secondary market does not exist. Option/swaption contracts also involve the risk that they may not work as intended due to unanticipated developments in market conditions or other causes.
Finally, the risk exists that losses on written options could exceed amounts disclosed on the Statements of Assets and Liabilities.
Securities Sold Short — As consistent with each Fund’s investment objectives, a Fund may engage in short sales. Short sales are transactions under which a Fund sells a security it does not own. To complete such a transaction, the Fund must borrow the security to make delivery to the buyer. A Fund then is obligated to replace the security borrowed by purchasing the security at the market price at the time of the replacement. The price at such time may be more or less than the price at which the security was sold by a Fund. Until the security is replaced, a Fund is required to pay the lender amounts equal to any dividends or interest that accrue during the period of the loan. Dividends and interest are shown as an expense for financial reporting purposes. To borrow the security, a Fund also may be required to pay a premium, which would decrease proceeds of the security sold. The proceeds of the short sale are retained by the broker, to the extent necessary to meet margin requirements, until the short position is closed out. A gain, limited to the price at which a
| 122 | SEI Institutional Managed Trust / Semi-Annual Report / March 31, 2010 |
Table of Contents
Fund sold the security short, or a loss, unlimited in size, will be recognized upon the close of a short sale.
Until a Fund closes its short position or replaces the borrowed security, a Fund will: (a) maintain a segregated account containing cash or liquid securities at such a level that (i) the amount deposited in the account plus the amount deposited with the broker as collateral will equal the current value of the security sold short; and (ii) the amount deposited in the segregated account plus the amount deposited with the broker as collateral will not be less than the market value of the security at the time the security was sold short, or (b) otherwise cover the Fund’s short positions. At March 31, 2010, none of the Funds held any short positions.
Swap Agreements — A Fund’s investments in swap contracts is mainly used as an efficient means to take and manage risk in the portfolio, including interest rate risk, credit risk and overall yield sensitivity. A swap agreement is a two-party contract under which an agreement is made to exchange returns from predetermined investments or instruments, including a particular interest rate, foreign currency, or “basket” of securities representing a particular index. Interest rate swaps involve the exchange by a Fund with another party of their respective commitments to pay or receive interest (e.g., an exchange of floating rate payments for fixed rate payments) with respect to a notional amount of principal. Credit-default swaps involve periodic payments by a Fund or counterparty based on a specified rate multiplied by a notional amount assigned to an underlying debt instrument or group of debt instruments in exchange for the assumption of credit risk on the same instruments. In the event of a credit event, usually in the form of a credit rating downgrade, the party receiving periodic payments (i.e. floating rate payer) must pay the other party (i.e. fixed rate payer) an amount equal to the recovery rate used to settle the contracts. The recovery rate is a function of how many credit default swap investors wish to deliver the security or receive the security. The recovery rate is determined through an auction process. Total return swaps allow an investor to benefit from the cash flow without ever actually owning the underlying security. The receiver must pay any decline in value to the payer at the end of the total return swap. However, the investor does not need to make a payment if there is no decline in price. Payments can be made on various indices, bonds (i.e. mortgage backed securities, bank debt and corporate), loans or commodities. The value of a total return swap is equal to the change in value of the underlying asset versus the accrued income payment based on LIBOR or some other form of indices on the notional amount. Interest rate swaps involve the exchange by a Fund with another party of their respective commitments to pay or receive interest (e.g., an exchange of floating rate payments for fixed rate payments) with respect to a notional amount of principal to manage a Fund’s exposure to interest rates. Payments received or made are recorded as realized gains or loss. A Fund could be exposed to credit or market risk due to unfavorable changes in the fluctuation of interest rates or if the counterparty defaults on its obligation to perform. Risk of loss may exceed amounts recognized on the statement of assets and
liabilities. Interest rate swap contracts outstanding at period end, if any, are listed after a Fund’s portfolio. In connection with swap agreements securities may be set aside as collateral by a Fund’s custodian. A Fund may enter into swap agreements in order to, among other things, change the maturity or duration of the investment portfolio, to protect a Fund’s value from changes in interest rates, or to expose a Fund to a different security or market.
Swaps are marked-to-market daily based upon quotations from market makers and the resulting changes in market values, if any, are recorded as an unrealized gain or loss in the Statement of Operations. Net payments of interest are recorded as realized gains or losses.
Entering into swap agreements involves, to varying degrees, elements of credit and market risk in excess of the amounts recognized on the Statement of Assets and Liabilities. Such risks involve the possibility that there will be no liquid market for these agreements, that the counterparty to the agreement may default on its obligation to perform and that there may be unfavorable changes in the fluctuation of interest rates. Risks also arise from potential losses from adverse market movements.
This risk is mitigated by having a master netting arrangement between a Fund and the counterparty and by having the counterparty post collateral to cover a Fund’s exposure to the counterparty. See Note 3 for further details.
Delayed Delivery Transactions — To the extent consistent with its Investment Objective and Strategies, a Fund may purchase or sell securities on a when-issued or delayed delivery basis. These transactions involve a commitment by the Fund to purchase or sell securities for a predetermined price or yield, with payment and delivery taking place beyond the customary settlement period. When delayed delivery purchases are outstanding, the Fund will set aside liquid assets in an amount sufficient to meet the purchase price. When purchasing a security on a delayed delivery basis, the Fund assumes the rights and risks of ownership of the security, including the risk of price and yield fluctuations, and takes such fluctuations into account when determining its net asset value. The Fund may dispose of or renegotiate a delayed delivery transaction after it is entered into, and may sell when-issued securities before they are delivered, which may result in a capital gain or loss. When the Fund has sold a security on a delayed delivery basis, the Fund does not participate in future gains and losses with respect to the security.
Collateralized Debt Obligations — A Fund may invest in collateralized debt obligations (“CDOs”), which include collateralized loan obligations (“CLOs”) and other similarly structured securities. CLOs are a type of asset-backed securities. A CLO is a trust typically collateralized by a pool of loans, which may include, among others, domestic and foreign senior secured loans, senior unsecured loans, and subordinate corporate loans, including loans that may be rated below investment grade or equivalent unrated loans. CDOs may charge management fees and administrative expenses.
| SEI Institutional Managed Trust / Semi-Annual Report / March 31, 2010 | 123 |
Table of Contents
Notes to Financial Statements (Unaudited) (Continued)
March 31, 2010
For CDOs, the cashflows from the trust are split into two or more portions, called tranches, varying in risk and yield. The riskiest portion is the “equity” tranche which bears the bulk of defaults from the bonds or loans in the trust and serves to protect the other, more senior tranches from default in all but the most severe circumstances. Since it is partially protected from defaults, a senior tranche from a CDO trust typically has a higher rating and lower yield than its underlying securities, and can be rated investment grade. Despite the protection from the equity tranche, CDO tranches can experience substantial losses due to actual defaults, increased sensitivity to defaults due to collateral default and disappearance of protecting tranches, market anticipation of defaults, as well as aversion to CDO securities as a class.
The risks of an investment in a CDO depend largely on its Class and its collateral securities. Normally, CLOs and other CDOs are privately offered and sold, and thus, are not registered under the securities laws. As a result, investments in CDOs may be characterized by the Funds as illiquid securities; however, an active dealer market may exist for CDOs, allowing a CDO to qualify for Rule 144A transactions. In addition to the normal risks associated with fixed income securities (e.g., interest rate risk and default risk), CDOs carry additional risks including, but not limited to: (i) the possibility that distributions from collateral securities will not be adequate to make interest or other payments; (ii) the quality of the collateral may decline in value or
default; (iii) the Funds may invest in CDOs that are subordinate to other classes; and (iv) the complex structure of the security may not be fully understood at the time of investment and may produce disputes with the issuer or unexpected investment results.
Illiquid Securities — A security is considered illiquid if it cannot be sold or disposed of in the ordinary course of business within seven days or less for its approximate carrying value on the books of a Fund. Valuations of illiquid securities may differ significantly from the values that would have been used had an active market value for these securities existed.
Restricted Securities — At March 31, 2010, the following Funds owned private placement investments that were purchased through private offerings or acquired through initial public offerings and cannot be sold without prior registration under the Securities Act of 1933 or pursuant to an exemption therefrom. In addition, the Funds have generally agreed to further restrictions on the disposition of certain holdings as set forth in various agreements entered into in connection with the purchase of these investments. These investments are valued at fair value as determined in accordance with the procedures approved by the Board of Trustees. The acquisition dates of these investments, the enforceable right to acquire these securities, along with their cost and values at March 31, 2010, were as follows:
| Number of Shares/ Face Amount ($ Thousands) | Acquisition Date | Right to Acquire Date | Cost ($ Thousands) | Market Value ($ Thousands) | % of Net Assets | |||||||||||
| Small Cap Value Fund | ||||||||||||||||
Verde Realty PIPE | 21,100 | 02/16/07 | 02/16/07 | $ | 696 | $ | 468 | 0.08 | % | |||||||
| Small Cap Growth Fund | ||||||||||||||||
Rentech Warrant | 19,400 | 04/20/07 | 04/20/07 | $ | — | $ | 2 | — | % | |||||||
Titanium Asset Management PIPE | 140,900 | 06/14/07 | 06/14/07 | 845 | 420 | 0.10 | ||||||||||
Titanium Asset Management Warrants | 147,800 | 08/06/07 | 08/06/07 | — | — | — | ||||||||||
Value Creation | 145,600 | 08/10/06 | 08/10/06 | 1,491 | 108 | 0.02 | ||||||||||
| $ | 2,336 | $ | 530 | 0.12 | % | |||||||||||
| Small Cap Fund | ||||||||||||||||
Oil Sands Warrants | 1,200 | 10/06/09 | 10/06/09 | $ | — | $ | — | — | % | |||||||
Scorpio Mining PIPE | 52,300 | 10/06/09 | 10/06/09 | 46 | 48 | 0.02 | ||||||||||
Thunderbird Resorts PIPE | 15,400 | 10/06/09 | 10/06/09 | 61 | 46 | 0.01 | ||||||||||
| $ | 107 | $ | 94 | 0.03 | % | |||||||||||
| Real Estate Fund | ||||||||||||||||
Verde Realty PIPE | 21,400 | 02/16/07 | 02/16/07 | $ | 706 | $ | 475 | 0.20 | % | |||||||
| Enhanced Income Fund | ||||||||||||||||
JHT Holding | 38 | 12/16/08 | 12/16/08 | $ | 60 | $ | 36 | 0.02 | % | |||||||
| High Yield Bond Fund | ||||||||||||||||
Aventine Renewable Energy Holdings | $ | 986 | 04/17/10 | 04/17/10 | $ | 912 | $ | 1,035 | 0.07 | % | ||||||
Quebecore Media (Escrow Security) | $ | 1,915 | 09/24/09 | 09/24/09 | — | 105 | 0.01 | |||||||||
Continental Airlines | $ | 1,192 | 05/04/09 | 05/04/09 | 820 | 1,120 | 0.08 | |||||||||
VSS AHC, Cl A | 38,453 | 10/08/09 | 10/08/09 | 485 | 459 | 0.03 | ||||||||||
| $ | 2,217 | $ | 2,719 | 0.19 | % | |||||||||||
| �� | ||||||||||||||||
| 124 | SEI Institutional Managed Trust / Semi-Annual Report / March 31, 2010 |
Table of Contents
Dividends and Distributions to Shareholders — Dividends from net investment income are declared and paid to shareholders quarterly for the Large Cap, Large Cap Value, Large Cap Growth, Tax-Managed Large Cap, S&P 500 Index, Small Cap, Small Cap Value, Small Cap Growth, Tax-Managed Small Cap, Mid-Cap, U.S. Managed Volatility, Tax-Managed Managed Volatility, Real Estate, Enhanced Income and Real Return Funds; are declared and paid annually for the Global Managed Volatility and Multi-Strategy Alternative Funds; and declared daily and paid monthly for the Core Fixed Income, U.S. Fixed Income and High Yield Bond Funds. Any net realized capital gains on sales of securities are distributed to shareholders at least annually. Dividends and distributions are recorded on the ex-dividend date.
Investments in REITs — With respect to the Real Estate Fund, dividend income is recorded based on the income included in distributions received from the REIT investments using published REIT reclassifications including some management estimates when actual amounts are not available. Distributions received in excess of this estimated amount are recorded as a reduction of the cost of investments or reclassified to capital gains. The actual amounts of income, return of capital, and capital gains are only determined by each REIT after its fiscal year-end, and may differ from the estimated amounts.
3. CREDIT DERIVATIVES
A Fund enters into credit default swaps to simulate long and short bond positions that are either unavailable or considered to be less attractively priced in the bond market. A Fund uses these swaps to reduce risk where a Fund has exposure to the issuer, or to take an active long or short position with respect to the likelihood of an event of default. The reference obligation of the swap can be a single issuer, a “basket” of issuers, or an index. The underlying referenced assets are corporate debt, sovereign debt and asset backed securities.
The buyer of a credit default swap is generally obligated to pay the seller a periodic stream of payments over the term of the contract in return for a contingent payment upon the occurrence of a credit event with respect to an underlying reference obligation. Generally, a credit
event for corporate or sovereign reference obligations means bankruptcy, failure to pay, obligation acceleration, repudiation/moratorium or restructuring. For credit default swaps on asset-backed securities, a credit event may be triggered by events such as failure to pay principal, maturity extension, rating downgrade or write-down.
If a Fund is a seller of protection, and a credit event occurs, as defined under the terms of that particular swap agreement, a Fund will generally either (i) pay to the buyer an amount equal to the notional amount of the swap and take delivery of the referenced obligation, other deliverable obligations, or underlying securities comprising a referenced index or (ii) pay a net settlement amount in the form of cash or securities equal to the notional amount of the swap less the recovery value of the referenced obligation or underlying securities comprising a referenced index.
If a Fund is a buyer of protection and a credit event occurs, as defined under the terms of that particular swap agreement, a Fund will either (i) receive from the seller of protection an amount equal to the notional amount of the swap and deliver the referenced obligation, other deliverable obligations or underlying securities comprising the referenced index or (ii) receive a net settlement amount in the form of cash or securities equal to the notional amount of the swap less the recovery value of the referenced obligation or underlying securities comprising the referenced index. Recovery values are assumed by market makers considering either industry standard recovery rates or entity specific factors and considerations until a credit event occurs. If a credit event has occurred, the recovery value is determined by a facilitated auction whereby a minimum number of allowable broker bids, together with a specified valuation method, are used to calculate the settlement value.
Certain Funds are party to International Swap Dealers Association, Inc. Master Agreements (“ISDA Master Agreements”). These agreements are with select counterparties and they govern transactions, including certain over-the counter derivative and foreign exchange contracts, entered into by the Funds and the counterparty.
As of March 31, 2010, the Core Fixed Income Fund is the buyer (“receiving protection”) on a total notional amount of $52.2 million, and is the seller (“providing protection”) on a total notional amount of $47.7 million,. The notional amounts of the swaps are not recorded in the financial statements. The notional amounts approximate the maximum potential amount of future payments that the Fund could be required to make if the Fund was the seller of protection and a credit event was to occur. Those credit default swaps (“CDS”) for which the Fund is providing protection at the balance sheet date are summarized as follows:
| CORE FIXED INCOME FUND WRITTEN CREDIT DERIVATIVE CONTRACTS | SINGLE NAME CDS | CDS ON AN INDEX | ||||||||||||||||
| REFERENCE ASSET | CORP US$ | SOVEREIGN US$ | ABS US$ | CORP US$ | Total | |||||||||||||
Fair value of written credit derivatives | $ | 159,489 | — | $ | (26,823,640 | ) | $ | 475,909 | $ | (26,188,242 | ) | |||||||
Maximum potential amount of future payments | $ | (4,280,000 | ) | — | $ | (40,089,372 | ) | $ | (3,286,644 | ) | $ | (47,656,016 | ) | |||||
Recourse provisions with third parties to recover any amounts paid under the credit derivative (including any purchased credit protection)1 | — | — | — | — | — | |||||||||||||
Collateral held by the fund can obtain upon occurrence of triggering event | — | — | — | $ | (2,000,000 | ) | $ | (2,000,000 | ) | |||||||||
| 1 | Potential recoveries would include purchased credit derivatives to the extent they offset written credit derivatives which have an identical underlying, or a netting arrangement or credit support annex with the counterparty. There may be other potential recoveries from recourse provisions where agreements cover multiple derivative arrangements but those amounts have not been included. |
| SEI Institutional Managed Trust / Semi-Annual Report / March 31, 2010 | 125 |
Table of Contents
Notes to Financial Statements (Unaudited) (Continued)
March 31, 2010
| MAXIMUM POTENTIAL AMOUNT OF FUTURE PAYMENTS BY CONTRACT TERM | ||||||||||||||||||||
| CORE FIXED INCOME FUND | 0-6 MONTHS | 6-12 MONTHS | 1-5 YEARS | 5-10 YEARS | > 10 YEARS | Total | ||||||||||||||
Current credit spread* on underlying (in basis points) | ||||||||||||||||||||
0-1,500 | — | $ | (4,280,000 | ) | $ | (3,286,644 | ) | — | — | $ | (7,566,644 | ) | ||||||||
1,501-3,000 | — | — | — | — | $ | (14,633,956 | ) | $ | (14,633,956 | ) | ||||||||||
3,001-4,500 | — | — | — | — | $ | (15,650,000 | ) | $ | (15,650,000 | ) | ||||||||||
> than 4,501 | — | — | — | — | $ | (9,805,416 | ) | $ | (9,805,416 | ) | ||||||||||
Total | — | $ | (4,280,000 | ) | $ | (3,286,644 | ) | — | $ | (40,089,372 | ) | $ | (47,656,016 | ) | ||||||
| * | The credit spread on the underlying asset is generally indicative of the current status of the underlying risk of the Fund having to perform. The spread also reflects the cost of buying/selling protection and may include upfront payments required to be made to enter into a contract. Higher credit spreads with a shorter contract term is indicative of a higher likelihood of performance by the Fund. |
The credit spread disclosed above for each reference obligation where the Fund is the seller of protection is a representation of the current payment/performance risk of the swap.
4. DERIVATIVE TRANSACTIONS
The fair value of derivative instruments as of March 31, 2010 was as follows:
| Asset Derivatives | Liability Derivatives | |||||||||||
| For the six month period ended March 31, 2010 ($ Thousands) | For the six month period ended March 31, 2010 ($ Thousands) | |||||||||||
| Statement of Assets and Liabilites Location | Fair Value | Statement of Assets and Liabilites Location | Fair Value | |||||||||
Derivatives not accounted for as hedging instruments: | ||||||||||||
| Global Managed Volatility Fund | ||||||||||||
Foreign exchange contracts | Unrealized gain on forward foreign currency contracts | $ | 580 | Unrealized loss on forward foreign currency contracts | $ | 1,282 | ||||||
Equity contracts | Net Assets — Unrealized appreciation on futures contracts | 91 | * | Net Assets — Unrealized depreciation on futures contracts | — | |||||||
Total Derivatives not accounted for as hedging instruments | $ | 671 | $ | 1,282 | ||||||||
| Core Fixed Income Fund | ||||||||||||
Interest rate contracts | Net Assets — Unrealized appreciation on futures contracts | $ | 130 | * | Net Assets — Unrealized depreciation on futures contracts | $ | 831 | * | ||||
Net Assets — Unrealized appreciation on swap contracts | 161 | † | Net Assets — Unrealized depreciation on swap contracts | 1,182 | † | |||||||
Investments, at value | — | Options written, at value | 64 | |||||||||
Investments, at value | — | Swaptions written, at value | 1,319 | |||||||||
Foreign exchange contracts | Unrealized gain on forward foreign currency contracts | 116 | * | Unrealized gain on forward foreign currency contracts | — | |||||||
Credit contracts | Net Assets — Unrealized appreciation on swap contracts | 2,361 | † | Net Assets — Unrealized depreciation on swap contracts | 11,696 | † | ||||||
Total Derivatives not accounted for as hedging instruments | $ | 2,768 | $ | 15,092 | ||||||||
| * | Includes cumulative appreciation/depreciation of futures contracts as reported in the Schedules of Investments. Only current day’s variation margin is reported within the Statements of Assets & Liabilities. |
| † | Includes cumulative appreciation/depreciation of swap contracts as reported in the Schedules of Investments. Market Value is reported within the Statements of Assets & Liabilities for swap contracts that have paid premiums. |
The effect of derivative instruments on the Statement of Operations for the six month period ended March 31, 2010.
Amount of realized Gain or (Loss) on Derivatives Recognized in Income ($ Thousands)
| Derivatives Not Accounted for as Hedging Instruments | Options | Swaptions | Futures | Forward Currency Contracts | Swaps | Total | ||||||||||||||
| Small Cap Value Fund | ||||||||||||||||||||
Equity contracts | $ | — | $ | — | $ | 561 | $ | — | $ | — | $ | 561 | ||||||||
Foreign Exchange contracts | — | — | — | (1 | ) | — | (1 | ) | ||||||||||||
Total | $ | — | $ | — | $ | 561 | $ | (1 | ) | $ | — | $ | 560 | |||||||
| 126 | SEI Institutional Managed Trust / Semi-Annual Report / March 31, 2010 |
Table of Contents
| Derivatives Not Accounted for as Hedging Instruments | Options | Swaptions | Futures | Forward Currency Contracts | Swaps | Total | ||||||||||||||
| Global Managed Volatility Fund | ||||||||||||||||||||
Equity contracts | $ | — | $ | — | $ | 1,204 | $ | — | $ | — | $ | 1,204 | ||||||||
Foreign Exchange contracts | — | — | — | 2,824 | — | 2,824 | ||||||||||||||
Total | $ | — | $ | — | $ | 1,204 | $ | 2,824 | $ | — | $ | 4,028 | ||||||||
| Core Fixed Income Fund | ||||||||||||||||||||
Interest Rate contracts | $ | 530 | $ | 758 | $ | 5,327 | $ | — | $ | — | $ | 6,615 | ||||||||
Credit contracts | — | — | — | — | (6,185 | ) | (6,185 | ) | ||||||||||||
Foreign Exchange contracts | — | — | — | 107 | — | 107 | ||||||||||||||
Total | $ | 530 | $ | 758 | $ | 5,327 | $ | 107 | $ | (6,185 | ) | $ | 537 | |||||||
| U.S. Fixed Income Fund | ||||||||||||||||||||
Interest Rate contracts | $ | — | $ | — | $ | 131 | $ | — | $ | — | $ | 131 | ||||||||
Credit contracts | — | — | — | — | (204 | ) | (204 | ) | ||||||||||||
Total | $ | — | $ | — | $ | 131 | $ | — | $ | (204 | ) | $ | (73 | ) | ||||||
Change in Unrealized Appreciation or (Depreciation) on Derivatives Recognized in Income ($ Thousands):
| Derivatives Not Accounted for as Hedging Instruments: | Options | Swaptions | Futures | Forward Currency Contracts | Swaps | Total | |||||||||||||||
| Global Managed Volatility Fund | |||||||||||||||||||||
Foreign exchange contracts | $ | — | $ | — | $ | — | $ | 161 | $ | — | $ | 161 | |||||||||
Equity contracts | — | — | (8 | ) | — | — | (8 | ) | |||||||||||||
Total | $ | — | $ | — | $ | (8 | ) | $ | 161 | $ | — | $ | 153 | ||||||||
| Core Fixed Income Fund | |||||||||||||||||||||
Interest rate contracts | $ | 112 | $ | 164 | $ | (3,001 | ) | $ | — | $ | (503 | ) | $ | (3,228 | ) | ||||||
Credit contracts | — | — | — | — | 9,198 | 9,198 | |||||||||||||||
Foreign Exchange contacts | — | — | — | 33 | — | 33 | |||||||||||||||
Total | $ | 112 | $ | 164 | $ | (3,001 | ) | $ | 33 | $ | 8,695 | $ | 6,003 | ||||||||
| U.S. Fixed Income Fund | |||||||||||||||||||||
Interest rate contracts | $ | — | $ | — | $ | 16 | $ | — | $ | — | $ | 16 | |||||||||
Credit contracts | — | — | — | — | (207 | ) | (207 | ) | |||||||||||||
Total | $ | — | $ | — | $ | 16 | $ | — | $ | (207 | ) | $ | (191 | ) | |||||||
The ISDA Master Agreements maintain provisions for general obligations, representations, agreements, collateral, and events of default or termination. The occurrence of a specified event of termination may give a counterparty the right to terminate all of its contracts and affect settlement of all outstanding transactions under the applicable ISDA Master Agreement.
Written options transactions entered into during the six month period ended March 31, 2010 are summarized as follows:
| Core Fixed Income Fund | |||||||
| Number of Contracts | Premium ($ Thousands) | ||||||
| Balance at the beginning of period | 473 | $ | 562 | ||||
| Written | 1,655 | 644 | |||||
| Expired | (459 | ) | (152 | ) | |||
| Closing buys | (1,404 | ) | (959 | ) | |||
| Balance at the end of period | 265 | $ | 95 | ||||
Written swaptions transactions entered into during the six month period ended March 31, 2010 are summarized as follows:
| Core Fixed Income Fund | |||||||
| Notional Amount (Thousands) | Premium ($ Thousands) | ||||||
| Balance at the beginning of period | 64,020 | $ | 2,471 | ||||
| Written | 24,600 | 510 | |||||
| Expired | (26,040 | ) | (693 | ) | |||
| Closing buys | (26,040 | ) | (693 | ) | |||
| Balance at the end of period | 36,540 | $ | 1,595 | ||||
At March 31, 2010 the Funds had cash and/or securities at least equal to the value of written options.
5. AGREEMENTS AND OTHER TRANSACTIONS WITH AFFILIATES
Administration and Transfer Agency Agreement — The Trust and SEI Investments Global Funds Services (the “Administrator”) are parties to an amended and restated Administration and Transfer Agency Agreement dated December 10, 2003 under which the Administrator provides administrative and transfer agency services to the Funds for
| SEI Institutional Managed Trust / Semi-Annual Report / March 31, 2010 | 127 |
Table of Contents
Notes to Financial Statements (Unaudited) (Continued)
March 31, 2010
an annual fee of 0.35% of the average daily net assets of the Large Cap, Large Cap Value, Large Cap Growth, Tax-Managed Large Cap Class A, Small Cap, Small Cap Value, Small Cap Growth, Tax-Managed Small Cap, Mid-Cap, U.S. Managed Volatility, Global Managed Volatility, Tax-Managed Managed Volatility, Real Estate, Enhanced Income, High Yield Bond, Real Return and Multi-Strategy Alternative Funds; 0.15% of the average daily net assets of the Tax-Managed Large Cap Class Y; 0.22% of the average daily net assets of the S&P 500 Index Fund; and 0.28% of the average daily net assets of the Core Fixed Income and U.S. Fixed Income Funds. The Administrator has agreed voluntarily to waive all or a portion of its fee in order to limit the operating expenses of a Fund. Any such waiver is voluntary and may be terminated at any time at the Administrator’s sole discretion.
Investment Advisory Agreement — SEI Investments Management Corporation (“SIMC”) serves as investment adviser (the “Adviser”) to each Fund. In connection with serving as Adviser, SIMC is entitled to a fee, which is calculated daily and paid monthly, based on the average daily net assets of each Fund. SIMC has voluntarily agreed to waive a portion of its fee so that the total annual expenses of each Fund, exclusive of short sale expenses and acquired fund fee expenses, will not exceed certain voluntary expense limitations adopted by SIMC. These waivers may be terminated at any time. Accordingly, the advisory fee and voluntary expense limitations for each Fund are as follows:
| Advisory Fees | Voluntary Expense Limitations | |||||
Large Cap Fund, Class A | 0.3900 | % | 0.8900 | % | ||
Large Cap Value Fund, Class A | 0.3500 | 0.8900 | ||||
Large Cap Value Fund, Class I | 0.3500 | 1.1100 | ||||
Large Cap Growth Fund, Class A | 0.4000 | 0.8900 | ||||
Large Cap Growth Fund, Class I | 0.4000 | 1.1100 | ||||
Tax-Managed Large Cap Fund, Class A | 0.4000 | 0.8900 | ||||
Tax-Managed Large Cap Fund, Class Y | 0.4000 | 0.5600 | ||||
S&P 500 Index Fund, Class A | 0.0300 | 0.4300 | ||||
S&P 500 Index Fund, Class E | 0.0300 | 0.2500 | ||||
S&P 500 Index Fund, Class I | 0.0300 | 0.6500 | ||||
Small Cap Fund, Class A | 0.6500 | 1.1400 | ||||
Small Cap Value Fund, Class A | 0.6500 | 1.1400 | ||||
Small Cap Value Fund, Class I | 0.6500 | 1.3600 | ||||
Small Cap Growth Fund, Class A | 0.6500 | 1.1100 | ||||
Small Cap Growth Fund, Class I | 0.6500 | 1.3600 | ||||
Tax-Managed Small Cap Fund, Class A | 0.6500 | 1.1100 | ||||
Mid-Cap Fund, Class A | 0.4000 | 1.0200 | ||||
Mid-Cap Fund, Class I | 0.4000 | 1.2600 | ||||
U.S. Managed Volatility Fund, Class A | 0.6500 | 1.0000 | ||||
U.S. Managed Volatility Fund, Class I | 0.6500 | 1.2500 | ||||
Global Managed Volatility Fund, Class A | 0.6500 | 1.1100 | ||||
Global Managed Volatility Fund, Class I | 0.6500 | 1.3600 | ||||
Tax-Managed Managed Volatility Fund, Class A | 0.6500 | 1.0000 | ||||
Real Estate Fund, Class A | 0.6500 | 1.1400 | ||||
Real Estate Fund, Class I | 0.6500 | 1.3600 |
| Advisory Fees | Voluntary Expense Limitations | |||
Enhanced Income Fund, Class A | 0.4000 | 0.6000 | ||
Enhanced Income Fund, Class I | 0.4000 | 0.8500 | ||
Core Fixed Income Fund, Class A | 0.2750 | 0.6700 | ||
Core Fixed Income Fund, Class I | 0.2750 | 0.8900 | ||
U.S. Fixed Income, Class A | 0.2750 | 0.6600 | ||
High Yield Bond Fund, Class A | 0.4875 | 0.8900 | ||
High Yield Bond Fund, Class I | 0.4875 | 1.1100 | ||
Real Return, Class A | 0.2200 | 0.4500 | ||
Multi-Strategy Alternative Fund, Class A | 1.5000 | 0.5000 |
As of March 31, 2010, SIMC has entered into investment sub-advisory agreements with the following parties:
| Investment Sub-Adviser |
Large Cap Fund |
Analytic Investors, LLC |
Aronson+Johnson+Ortiz, L.P. |
Delaware Management Company |
INTECH Investment management, LLC |
Legg Mason Capital Management, Inc. |
LSV Asset Management |
Neuberger Berman Management, LLC |
Quantitative Management Associates, LLC |
Large Cap Value Fund |
Aronson + Johnson + Ortiz, LP |
INTECH Investment Management, LLC |
Legg Mason Capital Management Inc. |
LSV Asset Management |
Large Cap Growth Fund |
Delaware Management Company |
Goldman Sachs Asset Management, L.P. |
INTECH Investment Management, LLC |
Legg Mason Capital Management Inc. |
Neuberger Berman Management LLC |
Quantitative Management Associates LLC |
Tax-Managed Large Cap Fund |
Aronson + Johnson + Ortiz, LP |
Delaware Management Company |
Goldman Sachs Asset Management, L.P. |
Legg Mason Capital Management Inc. |
LSV Asset Management |
Neuberger Berman Management LLC |
Parametric Portfolio Associates |
Quantitative Management Associates LLC |
S&P 500 Index Fund |
SSgA Funds Management, Inc. |
Small Cap Fund |
AQR Capital Management, LLC |
Integrity Asset Management LLC |
Los Angeles Capital Management and Equity Research, Inc. |
Oppenheimer Capital LLC |
Robeco Investment Management, Inc. |
Wellington Management Company, LLP |
| 128 | SEI Institutional Managed Trust / Semi-Annual Report / March 31, 2010 |
Table of Contents
| Investment Sub-Adviser |
Small Cap Value Fund |
Artisan Partners Limited Partnership |
Lee Munder Capital Group LLC |
LSV Asset Management |
Martingale Asset Management, L.P. |
Panagora Asset Management, Inc. |
Robeco Investment Management, Inc. |
Wellington Management Company, LLP |
Small Cap Growth Fund |
AQR Capital Management, LLC |
Janus Capital Management, LLC |
Lee Munder Capital Group LLC |
Los Angeles Capital Management and Equity Research Inc. |
Oppenheimer Capital LLC |
Tax-Managed Small Cap Fund |
Lee Munder Capital Group LLC |
Los Angeles Capital Management and Equity Research, Inc. |
LSV Asset Management |
Parametric Portfolio Associates |
Wellington Management Company, LLP |
Wells Capital Management, Inc. |
Mid-Cap Fund |
Martingale Asset Management, L.P. |
Quantitative Management Associates LLC |
U.S. Managed Volatility Fund |
Analytic Investors, LLC |
Aronson + Johnson + Ortiz, LP |
Global Managed Volatility Fund |
Acadian Asset Management, LLC |
Analytic Investors, LLC |
Tax-Managed Managed Volatility Fund |
Analytic Investors, LLC |
Aronson + Johnson + Ortiz, LP |
Parametric Portfolio Associates |
Real Estate Fund |
Security Capital Research and Management, Inc. |
Wellington Management Company, LLP |
Enhanced Income Fund |
UBS Global Asset Management (Americas) Inc. |
Wellington Management Company, LLP |
Core Fixed Income Fund |
J.P. Morgan Investment Management, Inc. |
Metropolitan West Asset Management LLC |
Wells Capital Management, Inc. |
Western Asset Management Company |
Western Asset Management Company Limited |
U.S. Fixed Income Fund |
J.P. Morgan Investment Management, Inc. |
Metropolitan West Asset Management LLC |
Wells Capital Management, Inc. |
Western Asset Management Company |
Western Asset Management Company Limited |
High Yield Bond Fund |
Ares Management LLC |
Brigade Capital Management, LLC |
| Investment Sub-Adviser |
High Yield Bond Fund (continued) |
Delaware Management Company |
Guggenheim Investment Management, LLC |
J.P. Morgan Investment Management, Inc. |
Real Return Fund |
Wellington Management Company, LLP |
Multi-Strategy Alternative Fund |
SEI Investments Management Corporation |
Under the investment sub-advisory agreements, each party receives an annual fee paid by SIMC.
Distribution Agreement — SEI Investments Distribution Co. (the “Distributor”), a wholly owned subsidiary of SEI Investments Company (“SEI”), serves as each Fund’s Distributor pursuant to a distribution agreement with the Trust. The Trust has adopted a shareholder servicing plan for Class A, Class I and Class Y shares (the “Shareholder Servicing Plans”) under which a shareholder servicing fee of up to 0.25% of average daily net assets attributable to Class A and Class I shares, and a shareholder servicing fee of up to 0.15% of average daily net assets attributable to the Class Y shares, will be paid to the Distributor. In addition to the Shareholder Servicing Plans, the Class I shares have adopted administrative service plans that provide for administrative service fees payable to the Distributor of up to 0.25% of the average daily net assets attributed to that class.
Other — The Distribution Agreement between the Distributor and the Trust provides that the Distributor may receive compensation on fund transactions effected for the Trust in accordance with the rules of the Securities and Exchange Commission (“SEC”). Accordingly, it is expected that fund transactions may result in brokerage commissions being paid to the Distributor. SEC rules require that such commissions not exceed usual and customary commissions.
Such commissions for the six month period ended March 31, 2010 were as follows ($ Thousands):
| Large Cap Fund | $ | 10 | |
| Large Cap Growth Fund | 46 | ||
| Tax-Managed Large Cap Fund | 20 | ||
| Small Cap Fund | 3 | ||
| Small Cap Value Fund | 15 | ||
| Small Cap Growth Fund | 2 | ||
| Tax-Managed Small Cap Fund | 27 | ||
| Real Estate Fund | 8 | ||
| $ | 131 | ||
Under both the Shareholder Servicing Plans and administrative service plan, the Distributor may retain as profit any difference between the fee it receives and the amount it pays to third parties. For the six month period ended March 31, 2010, the Distributor retained 100% of the shareholder servicing fees, less the waiver, and 100% of the administration servicing fees.
| SEI Institutional Managed Trust / Semi-Annual Report / March 31, 2010 | 129 |
Table of Contents
Notes to Financial Statements (Unaudited) (Continued)
March 31, 2010
Certain officers and/or trustees of the Trust are also officers of the Administrator or the Distributor. The Trust pays each unaffiliated Trustee an annual fee for attendance at quarterly, interim and committee meetings. Compensation of officers and affiliated Trustees of the Trust is paid by the Administrator or Distributor.
A portion of the services provided by the Chief Compliance Officer (“CCO”) and his staff, whom are employees of the Administrator, are paid for by the Trust as incurred. The services include regulatory oversight of the Trust’s Adviser, sub-advisers and service providers as required by SEC regulations. The CCO’s services have been approved by and are reviewed annually by the Board.
LSV Asset Management (a partially owned subsidiary of SIMC) serves as the sub-adviser to the Large Cap Value, Tax-Managed Large Cap, Small Cap Value and Tax-Managed Small Cap Funds. For this service LSV Asset Management is entitled to receive a fee from SIMC. Such fees for the six month period ended March 31, 2010 were as follows ($ Thousands):
| Large Cap Fund | $ | 99 | |
| Large Cap Value Fund | 378 | ||
| Tax-Managed Large Cap Fund | 168 | ||
| Small Cap Value Fund | 281 | ||
| Tax-Managed Small Cap Fund | 88 | ||
| $ | 1,104 | ||
Fees Paid Indirectly — The Funds may direct certain fund trades to the Distributor who pays a portion of the Fund’s expenses. Accordingly, the expenses reduced, which were used to pay third party expenses, and the effect on the Fund’s expense ratio, as a percentage of the Fund’s average daily net assets for the six month period ended March 31, 2010, can be found on the Statement of Operations and Financial Highlights, respectively.
Investment in Affiliated Security — The Funds may invest the cash collateral from the securities lending program in the SEI Liquidity Fund, L.P.
6. CAPITAL SHARE TRANSACTIONS
Capital Share Transactions for the Funds were as follows (Thousands):
For the six month period ended March 31, 2010 (Unaudited) and the year or period ended September 30, 2009
| Large Cap Fund(2) | Large Cap | Large Cap | Tax-Managed | S&P 500 | |||||||||||||||||||||||
| 10/01/09 to 03/31/10 | 10/01/09 to 03/31/10 | 10/01/08 to 09/30/09 | 10/01/09 to 03/31/10 | 10/01/08 to 09/30/09 | 10/01/09 to 03/31/10 | 10/01/08 to 09/30/09 | 10/01/09 to 03/31/10 | 10/01/08 to 09/30/09 | |||||||||||||||||||
Class A: | |||||||||||||||||||||||||||
Shares Issued | 142,982 | 11,062 | 53,643 | 8,177 | 45,603 | 17,016 | 110,266 | 2,554 | 17,291 | ||||||||||||||||||
Shares Issued in Lieu of Cash Distributions | 1,025 | 1,424 | 3,739 | 499 | 865 | 1,042 | 2,568 | 185 | 486 | ||||||||||||||||||
Shares Redeemed | (27,460 | ) | (22,527 | ) | (74,868 | ) | (22,889 | ) | (65,464 | ) | (23,478 | ) | (150,117 | ) | (5,256 | ) | (16,504 | ) | |||||||||
Total Class A Transactions | 116,547 | (10,041 | ) | (17,486 | ) | (14,213 | ) | (18,996 | ) | (5,420 | ) | (37,283 | ) | (2,517 | ) | 1,273 | |||||||||||
Class E: | |||||||||||||||||||||||||||
Shares Issued | — | — | — | — | — | — | — | 4,169 | 11,627 | ||||||||||||||||||
Shares Issued in Lieu of Cash Distributions | — | — | — | — | — | — | — | 428 | 865 | ||||||||||||||||||
Shares Redeemed | — | — | — | — | — | — | — | (3,664 | ) | (7,857 | ) | ||||||||||||||||
Total Class I Transactions | — | — | — | — | — | — | — | 933 | 4,635 | ||||||||||||||||||
Class I: | |||||||||||||||||||||||||||
Shares Issued | — | 94 | 534 | 75 | 389 | — | — | 50 | 732 | ||||||||||||||||||
Shares Issued in Lieu of Cash Distributions | — | 7 | 18 | 1 | 2 | — | — | 2 | 11 | ||||||||||||||||||
Shares Redeemed | — | (157 | ) | (413 | ) | (114 | ) | (289 | ) | — | — | (55 | ) | (617 | ) | ||||||||||||
Total Class I Transactions | — | (56 | ) | 139 | (38 | ) | 102 | — | — | (3 | ) | 126 | |||||||||||||||
Class Y: | |||||||||||||||||||||||||||
Shares Issued | — | — | — | — | — | — | 44 | — | — | ||||||||||||||||||
Shares Issued in Lieu of Cash Distributions | — | — | — | — | — | 2 | 6 | — | — | ||||||||||||||||||
Shares Redeemed | — | — | — | — | — | (28 | ) | (37 | ) | — | — | ||||||||||||||||
Total Class Y Transactions | — | — | — | — | — | (26 | ) | 13 | — | — | |||||||||||||||||
Increase (Decrease) in Share Transactions | 116,547 | (10,097 | ) | (17,347 | ) | (14,251 | ) | (18,894 | ) | (5,446 | ) | (37,270 | ) | (1,587 | ) | 6,034 | |||||||||||
| 130 | SEI Institutional Managed Trust / Semi-Annual Report / March 31, 2010 |
Table of Contents
| Small Cap Fund(2) | Small Cap | Small Cap | Tax-Managed | Mid-Cap | |||||||||||||||||||||||
| 10/01/09 to 03/31/10 | 10/01/09 to 03/31/10 | 10/01/08 to 09/30/09 | 10/01/09 to 03/31/10 | 10/01/08 to 09/30/09 | 10/01/09 to 03/31/10 | 10/01/08 to 09/30/09 | 10/01/09 to 03/31/10 | 10/01/08 to 09/30/09 | |||||||||||||||||||
Class A: | |||||||||||||||||||||||||||
Shares Issued | 33,993 | 6,243 | 25,312 | 4,180 | 20,496 | 4,534 | 25,443 | 4,979 | 6,949 | ||||||||||||||||||
Shares Issued in Lieu of Cash Distributions | 53 | 205 | 1,004 | 2 | 10 | 47 | 182 | 31 | 81 | ||||||||||||||||||
Shares Redeemed | (8,367 | ) | (14,323 | ) | (34,603 | ) | (11,940 | ) | (29,258 | ) | (5,193 | ) | (29,105 | ) | (2,329 | ) | (6,927 | ) | |||||||||
Total Class A Transactions | 25,679 | (7,875 | ) | (8,287 | ) | (7,758 | ) | (8,752 | ) | (612 | ) | (3,480 | ) | 2,681 | 103 | ||||||||||||
Class I: | |||||||||||||||||||||||||||
Shares Issued | — | 71 | 303 | 64 | 236 | — | — | 38 | 33 | ||||||||||||||||||
Shares Issued in Lieu of Cash Distributions | — | 2 | 11 | — | — | — | — | — | — | ||||||||||||||||||
Shares Redeemed | — | (116 | ) | (318 | ) | (61 | ) | (169 | ) | — | — | (12 | ) | (16 | ) | ||||||||||||
Total Class I Transactions | — | (43 | ) | (4 | ) | 3 | 67 | — | — | 26 | 17 | ||||||||||||||||
Increase (Decrease) in Share Transactions | 25,679 | (7,918 | ) | (8,291 | ) | (7,755 | ) | (8,685 | ) | (612 | ) | (3,480 | ) | 2,707 | 120 | ||||||||||||
| U.S. Managed Volatility Fund | Global Managed Volatility Fund | Tax-Managed Managed Volatility Fund | Real Estate Fund | Enhanced Income Fund | ||||||||||||||||||||||||||
| 10/01/09 to 03/31/10 | 10/01/08 to 09/30/09 | 10/01/09 to 03/31/10 | 10/01/08 to 09/30/09 | 10/01/09 to 03/31/10 | 10/01/08 to 09/30/09 | 10/01/09 to 03/31/10 | 10/01/08 to 09/30/09 | 10/01/09 to 03/31/10 | 10/01/08 to 09/30/09 | |||||||||||||||||||||
Class A: | ||||||||||||||||||||||||||||||
Shares Issued | 7,879 | 42,006 | 11,355 | 32,422 | 5,811 | 26,871 | 7,076 | 36,459 | 8,247 | 25,463 | ||||||||||||||||||||
Shares Issued in Lieu of Cash Distributions | 348 | 604 | 101 | — | 203 | 241 | 483 | 809 | 712 | 950 | ||||||||||||||||||||
Shares Redeemed | (11,646 | ) | (43,906 | ) | (7,339 | ) | (27,602 | ) | (4,950 | ) | (16,652 | ) | (8,912 | ) | (32,102 | ) | (12,564 | ) | (32,330 | ) | ||||||||||
Total Class A Transactions | (3,419 | ) | (1,296 | ) | 4,117 | 4,820 | 1,064 | 10,460 | (1,353 | ) | 5,166 | (3,605 | ) | (5,917 | ) | |||||||||||||||
Class I: | ||||||||||||||||||||||||||||||
Shares Issued | 2 | 2 | 1 | 3 | — | — | 11 | 13 | 2 | 4 | ||||||||||||||||||||
Shares Redeemed | — | — | (1 | ) | (2 | ) | — | — | (2 | ) | (1 | ) | — | — | ||||||||||||||||
Total Class I Transactions | 2 | 2 | — | 1 | — | — | 9 | 12 | 2 | 4 | ||||||||||||||||||||
Increase (Decrease) in Share Transactions | (3,417 | ) | (1,294 | ) | 4,117 | 4,821 | 1,064 | 10,460 | (1,344 | ) | 5,178 | (3,603 | ) | (5,913 | ) | |||||||||||||||
| Core Fixed Income Fund | U.S. Fixed Income Fund(1) | High Yield Bond Fund | Real Return Fund(1) | Multi-Strategy Alternative Fund(3) | ||||||||||||||||||||||
| 10/01/09 to 03/31/10 | 10/01/08 to | 10/01/09 to 03/31/10 | 10/01/08 to | 10/01/09 to 03/31/10 | 10/01/08 to | 10/01/09 to 03/31/10 | 10/01/08 to | 03/31/10 | ||||||||||||||||||
Class A: | ||||||||||||||||||||||||||
Shares Issued | 34,330 | 140,720 | 36,600 | 70,927 | 64,229 | 186,696 | 6,474 | 13,379 | 10 | |||||||||||||||||
Shares Issued in Lieu of Cash Distributions | 5,133 | 15,730 | 1,643 | 424 | 7,929 | 18,815 | 146 | — | — | |||||||||||||||||
Shares Redeemed | (47,371 | ) | (304,425 | ) | (17,582 | ) | (5,410 | ) | (65,727 | ) | (171,534 | ) | (2,107 | ) | (5,179 | ) | — | |||||||||
Total Class A Transactions | (7,908 | ) | (147,975 | ) | 20,661 | 65,941 | 6,431 | 33,977 | 4,513 | 8,200 | 10 | |||||||||||||||
Class I: | ||||||||||||||||||||||||||
Shares Issued | 357 | 968 | — | — | 26 | 28 | — | — | — | |||||||||||||||||
Shares Issued in Lieu of Cash Distributions | 21 | 45 | — | — | 2 | 2 | — | — | — | |||||||||||||||||
Shares Redeemed | (372 | ) | (508 | ) | — | — | (22 | ) | (6 | ) | — | — | — | |||||||||||||
Total Class I Transactions | 6 | 505 | — | — | 6 | 24 | — | — | — | |||||||||||||||||
Increase (Decrease) in Share Transactions | (7,902 | ) | (147,470 | ) | 20,661 | 65,941 | 6,437 | 34,001 | 4,513 | 8,200 | 10 | |||||||||||||||
| (1) | Commenced operations on July 2, 2009. |
| (2) | Commenced operations on October 1, 2009. |
| (3) | Commenced operations on March 31, 2010. |
| Amounts designated as “—” are zero or have been rounded to zero. |
| SEI Institutional Managed Trust / Semi-Annual Report / March 31, 2010 | 131 |
Table of Contents
Notes to Financial Statements (Unaudited) (Continued)
March 31, 2010
7. INVESTMENT TRANSACTIONS
The cost of security purchases and proceeds from the sale of securities, other than temporary cash investments and futures, during the six month period ended March 31, 2010, were as follows:
| U.S. Gov’t ($Thousands) | Other ($Thousands) | Total ($Thousands) | |||||||
Large Cap Fund(1) | |||||||||
Purchases | $ | — | $ | 1,541,289 | $ | 1,541,289 | |||
Sales | — | 430,505 | 430,505 | ||||||
Large Cap Value Fund | |||||||||
Purchases | — | 378,800 | 378,800 | ||||||
Sales | — | 497,993 | 497,993 | ||||||
Large Cap Growth Fund | |||||||||
Purchases | — | 621,336 | 621,336 | ||||||
Sales | — | 904,341 | 904,341 | ||||||
Tax-Managed Large Cap Fund | |||||||||
Purchases | — | 324,449 | 324,449 | ||||||
Sales | — | 423,851 | 423,851 | ||||||
S&P 500 Index Fund | |||||||||
Purchases | — | 120,295 | 120,295 | ||||||
Sales | — | 171,462 | 171,462 | ||||||
Small Cap Fund(1) | |||||||||
Purchases | — | 335,794 | 335,794 | ||||||
Sales | — | 135,173 | 135,173 | ||||||
Small Cap Value Fund | |||||||||
Purchases | — | 179,961 | 179,961 | ||||||
Sales | — | 264,009 | 264,009 | ||||||
Small Cap Growth Fund | |||||||||
Purchases | — | 179,235 | 179,235 | ||||||
Sales | — | 260,468 | 260,468 | ||||||
Tax-Managed Small Cap Fund | |||||||||
Purchases | — | 90,843 | 90,843 | ||||||
Sales | — | 99,933 | 99,933 | ||||||
Mid-Cap Fund | |||||||||
Purchases | — | 75,748 | 75,748 | ||||||
Sales | — | 73,749 | 73,749 | ||||||
U.S. Managed Volatility Fund | |||||||||
Purchases | — | 72,779 | 72,779 | ||||||
Sales | — | 105,154 | 105,154 | ||||||
Global Managed Volatility Fund | |||||||||
Purchases | — | 168,113 | 168,113 | ||||||
Sales | — | 137,683 | 137,683 | ||||||
Tax-Managed Managed Volatility | |||||||||
Purchases | — | 31,854 | 31,854 | ||||||
Sales | — | 21,244 | 21,244 | ||||||
Real Estate Fund | |||||||||
Purchases | — | 66,872 | 66,872 | ||||||
Sales | — | 91,330 | 91,330 | ||||||
Enhanced Income Fund | |||||||||
Purchases | 33,689 | 2,616 | 36,305 | ||||||
Sales | 39,849 | 37,241 | 77,090 | ||||||
Core Fixed Income Fund | |||||||||
Purchases | 1,808,744 | 358,670 | 2,167,414 | ||||||
Sales | 1,790,177 | 475,681 | 2,265,858 | ||||||
U.S Fixed Income Fund | |||||||||
Purchases | 866,619 | 242,192 | 1,108,811 | ||||||
Sales | 801,151 | 134,374 | 935,525 | ||||||
High Yield Bond Fund | |||||||||
Purchases | — | 713,586 | 713,586 | ||||||
Sales | 597 | 670,613 | 671,210 | ||||||
| U.S. Gov’t ($Thousands) | Other ($Thousands) | Total ($Thousands) | |||||||
Real Return Fund | |||||||||
Purchases | $ | 136,691 | $ | — | $ | 136,691 | |||
Sales | 96,420 | — | 96,420 | ||||||
Multi-Strategy Alternative Fund(2) | |||||||||
Purchases | — | 98 | 98 | ||||||
Sales | — | — | — | ||||||
| (1) | For the period October 1, 2009 through March 31, 2010. |
| (2) | For March 31, 2010. |
8. FEDERAL TAX INFORMATION
It is each Fund’s intention to continue to qualify as a regulated investment company under Subchapter M of The Internal Revenue Code and distribute all of its taxable income (including net capital gains). Accordingly, no provision for Federal income taxes is required.
Dividends from net investment income and distributions from net realized capital gains are determined in accordance with U.S. Federal income tax regulations, which may differ from those amounts determined under GAAP. These book/tax differences are either temporary or permanent in nature. To the extent these differences are permanent, they are charged or credited to paid-in capital, undistributed net investment income or accumulated net realized gain, as appropriate, in the period that the differences arise. Accordingly, the following permanent differences, primarily attributable to different treatment for gains and losses on paydowns of mortgage- and asset-backed securities for tax purposes, return of capital, investments in swaps, master limited partnerships, municipal bonds, collateralized debt obligations, distribution reclassification, REIT income reclassification, foreign currency transactions, accretion and amortization on defaulted bonds reclassification and net operating losses have been reclassified to/from the following accounts as of September 30, 2009:
| Paid-in- Capital ($ Thousands) | Undistributed Net Investment Income/(Loss) ($ Thousands) | Accumulated Realized Gain/(Loss) ($ Thousands) | ||||||||||
Large Cap Value Fund | $ | — | $ | 439 | $ | (439 | ) | |||||
Large Cap Growth Fund | — | 117 | (117 | ) | ||||||||
Tax-Managed Large Cap Fund | — | 237 | (237 | ) | ||||||||
S&P 500 Index Fund | — | 175 | (175 | ) | ||||||||
Small Cap Value Fund | — | 971 | (971 | ) | ||||||||
Small Cap Growth Fund | (102 | ) | 342 | (240 | ) | |||||||
Tax-Managed Small Cap Fund | (3 | ) | 122 | (119 | ) | |||||||
Mid-Cap Fund | — | 73 | (73 | ) | ||||||||
U.S. Managed Volatility | — | 34 | (34 | ) | ||||||||
Global Managed Volatility Fund | 66 | (11,877 | ) | 11,811 | ||||||||
Tax-Managed Managed Volatility Fund | — | 15 | (15 | ) | ||||||||
Real Estate Fund | (37 | ) | 1,998 | (1,961 | ) | |||||||
Enhanced Income Fund | — | (2,162 | ) | 2,162 | ||||||||
Core Fixed Income Fund | 43 | 9,116 | (9,159 | ) | ||||||||
U.S. Fixed Income Fund | — | (68 | ) | 68 | ||||||||
High Yield Bond Fund | — | 10,611 | (10,611 | ) | ||||||||
Real Return Fund | — | 1 | (1 | ) | ||||||||
| 132 | SEI Institutional Managed Trust / Semi-Annual Report / March 31, 2010 |
Table of Contents
The tax character of dividends and distributions paid during the years or periods ended September 30, 2009 and September 30, 2008 (unless otherwise indicated) was as follows:
| Ordinary Income ($ Thousands) | Long-Term Capital Gain ($ Thousands) | Return of Capital ($ Thousands) | Total ($ Thousands) | |||||||||||
Large Cap Value Fund | 2009 | $ | 47,585 | $ | — | $ | — | $ | 47,585 | |||||
| 2008 | 93,371 | 282,073 | — | 375,444 | ||||||||||
Large Cap Growth Fund | 2009 | 13,318 | — | — | 13,318 | |||||||||
| 2008 | 11,663 | — | — | 11,663 | ||||||||||
Tax-Managed Large Cap Fund | 2009 | 24,031 | — | — | 24,031 | |||||||||
| 2008 | 30,277 | — | — | 30,277 | ||||||||||
S&P 500 Index Fund | 2009 | 25,778 | 10,295 | — | 36,073 | |||||||||
| 2008 | 30,514 | 81,651 | — | 112,165 | ||||||||||
Small Cap Value Fund | 2009 | 7,732 | 3,167 | — | 10,899 | |||||||||
| 2008 | 35,546 | 106,276 | — | 141,822 | ||||||||||
Small Cap Growth Fund | 2009 | 98 | — | — | 98 | |||||||||
| 2008 | 728 | 86,250 | — | 86,978 | ||||||||||
Tax-Managed Small Cap Fund | 2009 | 1,496 | — | — | 1,496 | |||||||||
| 2008 | 4,502 | 20,515 | — | 25,017 | ||||||||||
Mid-Cap Fund | 2009 | 1,064 | — | — | 1,064 | |||||||||
| 2008 | 7,244 | 10,547 | — | 17,791 | ||||||||||
U.S. Managed Volatility Fund | 2009 | 5,650 | — | — | 5,650 | |||||||||
| 2008 | 15,544 | 11,019 | — | 26,563 | ||||||||||
Global Managed Volatility Fund | 2009 | — | — | — | — | |||||||||
| 2008 | 7,306 | 774 | — | 8,080 | ||||||||||
Tax-Managed Managed Volatility Fund | 2009 | 2,063 | — | — | 2,063 | |||||||||
| 2008 | 375 | — | — | 375 | ||||||||||
Real Estate Fund | 2009 | 6,053 | — | 37 | 6,090 | |||||||||
| 2008 | 8,331 | 11,379 | 1,951 | 21,661 | ||||||||||
Enhanced Income Fund | 2009 | 7,069 | — | — | 7,069 | |||||||||
| 2008 | 27,075 | — | — | 27,075 | ||||||||||
Core Fixed Income Fund | 2009 | 153,774 | — | — | 153,774 | |||||||||
| 2008 | 217,874 | — | — | 217,874 | ||||||||||
U.S. Fixed Income Fund | 2009 | 4,508 | — | — | 4,508 | |||||||||
High Yield Bond Fund | 2009 | 111,099 | — | — | 111,099 | |||||||||
| 2008 | 123,943 | — | — | 123,943 | ||||||||||
Real Return Fund | 2009 | — | — | — | — | |||||||||
As of September 30, 2009, the components of Distributable Earnings/(Accumulated Losses) were as follows:
| Undistributed Ordinary Income ($ Thousands) | Undistributed Long-Term Capital Gain ($ Thousands) | Capital Loss Carryforwards ($ Thousands) | Post October Losses ($ Thousands) | Post October Currency Losses ($ Thousands) | Unrealized Appreciation (Depreciation) ($ Thousands) | Other Temporary Differences ($ Thousands) | Total Distributable Earnings (Accumulated Losses) ($ Thousands) | |||||||||||||||||||||||
Large Cap Value Fund | $ | 7,581 | $ | — | $ | (61,698 | ) | $ | (509,105 | ) | $ | — | $ | 17,774 | $ | — | $ | (545,448 | ) | |||||||||||
Large Cap Growth Fund | 2,313 | — | (1,089,193 | ) | (394,221 | ) | — | 189,585 | — | (1,291,516 | ) | |||||||||||||||||||
Tax-Managed Large Cap Fund | 4,009 | — | (324,438 | ) | (323,617 | ) | — | 104,875 | — | (539,171 | ) | |||||||||||||||||||
S&P 500 Index Fund | 5,815 | — | (5,841 | ) | (37,225 | ) | — | 460,292 | — | 423,041 | ||||||||||||||||||||
Small Cap Value Fund | 1,782 | — | (59,890 | ) | (141,408 | ) | — | 8,099 | 11 | (191,406 | ) | |||||||||||||||||||
Small Cap Growth Fund | — | — | (119,606 | ) | (222,945 | ) | — | 45,864 | (130 | ) | (296,817 | ) | ||||||||||||||||||
Tax-Managed Small Cap Fund | 101 | — | (24,197 | ) | (70,772 | ) | — | 25,591 | 11 | (69,266 | ) | |||||||||||||||||||
Mid-Cap Fund | 174 | — | (21,942 | ) | (38,236 | ) | — | 13,501 | — | (46,503 | ) | |||||||||||||||||||
U.S. Managed Volatility Fund | 1,155 | — | (20,519 | ) | (98,669 | ) | — | 29,908 | — | (88,125 | ) | |||||||||||||||||||
Global Managed Volatility Fund | 793 | — | (27,992 | ) | (36,082 | ) | (14,568 | ) | 15,739 | 863 | (61,247 | ) | ||||||||||||||||||
Tax-Managed Managed Volatility Fund | 591 | — | (5,025 | ) | (16,629 | ) | — | 15,834 | — | (5,229 | ) | |||||||||||||||||||
Real Estate Fund | 2,685 | — | (93,497 | ) | (8,772 | ) | — | 7,929 | 630 | (91,025 | ) | |||||||||||||||||||
Enhanced Income Fund | 2,320 | — | (35,788 | ) | (61,350 | ) | — | (40,097 | ) | — | (134,915 | ) | ||||||||||||||||||
Core Fixed Income Fund | 6,610 | — | (52,922 | ) | (68,559 | ) | — | (180,436 | ) | (9,227 | ) | (304,534 | ) | |||||||||||||||||
| SEI Institutional Managed Trust / Semi-Annual Report / March 31, 2010 | 133 |
Table of Contents
Notes to Financial Statements (Unaudited) (Continued)
March 31, 2010
| Undistributed Ordinary Income ($ Thousands) | Undistributed Long-Term Capital Gain ($ Thousands) | Capital Loss Carryforwards ($ Thousands) | Post October Losses ($ Thousands) | Post October Currency Losses ($ Thousands) | Unrealized Appreciation (Depreciation) ($ Thousands) | Other Temporary Differences ($ Thousands) | Total Distributable Earnings (Accumulated Losses) ($ Thousands) | ||||||||||||||||||||||
U.S. Fixed Income Fund | $ | 4,071 | $ | — | $ | — | $ | — | $ | — | $ | 14,577 | $ | (1,843 | ) | $ | 16,805 | ||||||||||||
High Yield Bond Fund | 14,230 | — | (222,302 | ) | (137,848 | ) | — | (73,146 | ) | (11,772 | ) | (430,838 | ) | ||||||||||||||||
Real Return Fund | 740 | — | — | — | — | 712 | (7 | ) | 1,445 | ||||||||||||||||||||
Post October losses represent losses realized on investment transactions from November 1, 2008 through September 30, 2009 that, in accordance with Federal income tax regulations, the Funds may defer and treat as having arisen in the following fiscal year. For Federal income tax purposes, capital loss carryforwards may be carried forward and applied against future capital gains as follows:
| Expires 2017 ($ Thousands) | Expires 2016 ($ Thousands) | Expires 2015 ($ Thousands) | Expires 2014 ($ Thousands) | Expires 2013 ($ Thousands) | Expires 2012 ($ Thousands) | Expires 2011 ($ Thousands) | Expires 2010 ($ Thousands) | Total Carryforwards ($ Thousands) | |||||||||||||||||||
Large Cap Value Fund | $ | 61,698 | $ | — | $ | — | $ | — | $ | — | $ | — | $ | — | $ | — | $ | 61,698 | |||||||||
Large Cap Growth Fund | 64,163 | — | — | — | — | 7,113 | 625,971 | 391,946 | 1,089,193 | ||||||||||||||||||
Tax-Managed Large Cap Fund | 52,635 | — | — | — | — | 16,066 | 203,461 | 52,276 | 324,438 | ||||||||||||||||||
S&P 500 Index Fund | 5,841 | — | — | — | — | — | — | — | 5,841 | ||||||||||||||||||
Small Cap Value Fund | 59,890 | — | — | — | — | — | — | — | 59,890 | ||||||||||||||||||
Small Cap Growth Fund | 119,606 | — | — | — | — | — | — | — | 119,606 | ||||||||||||||||||
Tax-Managed Small Cap Fund | 24,197 | — | — | — | — | — | — | — | 24,197 | ||||||||||||||||||
Mid-Cap Fund | 21,639 | 303 | — | — | — | — | — | — | 21,942 | ||||||||||||||||||
U.S. Managed Volatility | 20,519 | — | — | — | — | — | — | — | 20,519 | ||||||||||||||||||
Global Managed Volatility Fund | 27,992 | — | — | — | — | — | — | — | 27,992 | ||||||||||||||||||
Tax-Managed Managed Volatility Fund | 5,025 | — | — | — | — | — | — | — | 5,025 | ||||||||||||||||||
Real Estate Fund | — | 93,497 | — | — | — | — | — | — | 93,497 | ||||||||||||||||||
Enhanced Income Fund | 31,835 | 3,427 | 526 | — | — | — | — | — | 35,788 | ||||||||||||||||||
Core Fixed Income Fund | 2,581 | — | 40,684 | 9,657 | — | — | — | — | 52,922 | ||||||||||||||||||
High Yield Bond Fund | 63,877 | 3,037 | 21,474 | 8,149 | — | — | 57,113 | 68,652 | 222,302 | ||||||||||||||||||
During the year ended September 30, 2009, none of the Funds utilized capital loss carryforward to offset capital gains.
For Federal income tax purposes, the cost of securities owned at March 31, 2010, and the net realized gains or losses on securities sold for the period, were different from amounts reported for financial reporting purposes, primarily due to wash sales which cannot be used for Federal income tax purposes in the current year and have been deferred for use in future years. The Federal tax cost and aggregate gross unrealized appreciation and depreciation on investments held by the Funds at March 31, 2010, were as follows:
| Federal Tax Cost ($Thousands) | Appreciated Securities ($Thousands) | Depreciated Securities ($Thousands) | Net Unrealized Appreciation (Depreciation) ($Thousands) | ||||||||||
Large Cap Fund | $ | 1,166,708 | $ | 127,361 | $ | (12,320 | ) | $ | 115,041 | ||||
Large Cap Value Fund | 1,765,995 | 399,600 | (153,410 | ) | 246,190 | ||||||||
Large Cap Growth Fund | 1,674,371 | 433,671 | (23,243 | ) | 410,428 | ||||||||
Tax-Managed Large Cap Fund | 1,510,667 | 422,323 | (94,382 | ) | 327,941 | ||||||||
S&P 500 Index Fund | 1,026,255 | 660,449 | (65,689 | ) | 594,760 | ||||||||
Small Cap Fund | 222,070 | 35,195 | (6,132 | ) | 29,063 | ||||||||
Small Cap Value Fund | 670,184 | 119,363 | (44,883 | ) | 74,480 | ||||||||
Small Cap Growth Fund | 430,698 | 96,630 | (17,339 | ) | 79,291 | ||||||||
Tax-Managed Small Cap Fund | 239,091 | 70,750 | (12,110 | ) | 58,640 | ||||||||
Mid-Cap Fund | 160,074 | 27,360 | (2,741 | ) | 24,619 | ||||||||
| Federal Tax Cost ($Thousands) | Appreciated Securities ($Thousands) | Depreciated Securities ($Thousands) | Net Unrealized Appreciation (Depreciation) ($Thousands) | |||||||||||
U.S. Managed Volatility Fund | $ | 317,148 | $ | 65,210 | $ | (5,747 | ) | $ | 59,463 | |||||
Global Managed Volatility Fund | 236,161 | 308,203 | (287,732 | ) | 20,471 | |||||||||
Tax-Managed Managed Volatility Fund | 165,999 | 36,017 | (1,991 | ) | 34,026 | |||||||||
Real Estate | 244,513 | 68,553 | (9,912 | ) | 58,641 | |||||||||
Enhanced Income Fund | 225,910 | 3,183 | (14,241 | ) | (11,058 | ) | ||||||||
Core Fixed Income Fund | 2,839,907 | 131,789 | (208,541 | ) | (76,752 | ) | ||||||||
U.S. Fixed Income Fund | 1,004,454 | 20,699 | (3,326 | ) | 17,373 | |||||||||
High Yield Bond Fund | 1,399,435 | 112,117 | (66,523 | ) | 45,594 | |||||||||
Real Return Fund | 145,304 | 1,700 | (274 | ) | 1,426 | |||||||||
Multi-Strategy Alternative Fund | 98 | — | — | — | ||||||||||
Management has analyzed the Funds’ tax position taken on federal income tax returns for all open tax years and has concluded that as of March 31, 2010, no provision for income tax would be required in the Funds’ financial statements. The Funds’ federal and state income and federal excise tax returns for tax years for which the applicable statutes of limitations have not expired are subject to examination by the Internal Revenue Service and state departments of revenue.
| 134 | SEI Institutional Managed Trust / Semi-Annual Report / March 31, 2010 |
Table of Contents
9. SECURITIES LENDING
Each Fund may lend portfolio securities to brokers, dealers and other financial organizations that meet capital and other credit requirements or other criteria established by the Trust’s Board of Trustees. These loans may not exceed 33 1/3% of the total asset value of the Fund (including the loan collateral). No Fund will lend portfolio securities to its Adviser, sub-adviser or their affiliates unless it has applied for and received specific authority to do so from the SEC. Loans of portfolio securities will be fully collateralized by cash. Collateral will be maintained in an amount equal to at least 100% of the current market value of the loaned securities by marking to market daily, although the borrower will be required to deliver collateral between 102% and 105% of the market value of borrowed securities for domestic and foreign securities, respectively. However, due to market fluctuations during the day, the value of securities loaned on a particular day may, during the course of the day, exceed the value of collateral. On each business day, the amount of collateral is adjusted based on the prior day’s market fluctuations and the current day’s lending activity. Income from lending activity is determined by the amount of interest earned on collateral, less any amounts payable to the borrowers of the securities and the lending agent. Lending securities involves certain risks, including the risk that the Fund may be delayed or prevented from recovering the collateral if the borrower fails to return the securities.
Cash collateral received in connection with securities lending is invested in short-term investments by the lending agent. These investments may include the SEI Liquidity Fund L.P., and the Fund bears all of the gains and losses on such investment. There is no guarantee that these investments will not lose value.
10. CONCENTRATIONS/RISKS
In the normal course of business, the Trust enters into contracts that provide general indemnifications by the Trust to the counterparty to the contract. The Trust’s maximum exposure under these arrangements is dependent on future claims that may be made against the
Trust’s and, therefore, cannot be estimated; however, Management believes that, based on experience, the risk of loss from such claims is considered remote.
The market values of the Core Fixed Income, U.S. Fixed Income and High Yield Bond Funds’ investments will change in response to interest rate changes and other factors. During periods of falling interest rates, the values of fixed income securities generally rise. Conversely, during periods of rising interest rates, the values of such securities generally decline. Changes by recognized rating agencies in the ratings of any fixed income security and in the ability of an issuer to make payments of interest and principal may also affect the value of these investments.
11. RECENT ACCOUNTING PRONOUNCEMENT
In January 2010, the Financial Accounting Standards Board issued Accounting Standards Update (“ASU”) No. 2010-6, Fair Value Measurements and Disclosures (Topic 820): Improving Disclosures about Fair Value Measurements. ASU No. 2010-6 enhances and clarifies existing fair value measurement disclosure requirements and is effective for interim and annual periods beginning after December 15, 2009. The Trust is currently evaluating the impact, if any, of applying the provisions of ASU No. 2010-6.
12. SUBSEQUENT EVENTS
Management has evaluated the need for disclosures and/or adjustments resulting from subsequent events through the date the financial statements were issued. Based on this evaluation, no adjustments were required to the Financial Statements as of March 31, 2010.
13. OTHER MATTERS
Due to volatility in the fixed income and equity markets, the market value of a Fund’s holdings may currently be lower than shown in the Summary Schedules of Investments (“SOI”). The values shown in the SOI’s were the market values as of March 31, 2010 and do not reflect any market events after March 31, 2010.
| SEI Institutional Managed Trust / Semi-Annual Report / March 31, 2010 | 135 |
Table of Contents
Disclosure of Fund Expenses (Unaudited)
All mutual funds have operating expenses. As a shareholder of a mutual fund, your investment is affected by these ongoing costs, which include (among others) costs for portfolio management, administrative services, and shareholder reports like this one. It is important for you to understand the impact of these costs on your investment returns.
Operating expenses such as these are deducted from the mutual fund’s gross income and directly reduce your final investment return. These expenses are expressed as a percentage of the mutual fund’s average net assets; this percentage is known as the mutual fund’s expense ratio.
The following examples use the expense ratio and are intended to help you understand the ongoing costs (in dollars) of investing in your Fund and to compare these costs with those of other mutual funds. The examples are based on an investment of $1,000 made at the beginning of the period shown and held for the entire period.
The table on the next page illustrates your Fund’s costs in two ways:
• Actual Fund return. This section helps you to estimate the actual expenses after fee waivers that your Fund incurred over the period. The “Expenses Paid During Period” column shows the actual dollar expense cost incurred by a $1,000 investment in the Fund, and the “Ending Account Value” number is derived from deducting that expense cost from the Fund’s gross investment return.
You can use this information, together with the actual amount you invested in your Fund, to estimate the expenses you paid over that period. Simply divide your actual starting account value by $1,000 to arrive at a ratio (for example, an $8,600 account value divided by $1,000 = 8.6), then multiply that ratio by the number shown for your Fund under “Expenses Paid During Period.”
• Hypothetical 5% return. This section helps you compare your Fund’s costs with those of other mutual funds. It assumes that your Fund had an annual 5% return before expenses during the year, but that the expense ratio (Column 3) is unchanged. This example is useful in making comparisons because the Securities and Exchange Commission requires all mutual funds to make this 5% calculation. You can assess your Fund’s comparative cost by comparing the hypothetical result for your Fund in the “Expense Paid During Period” column with those that appear in the same charts in the shareholder reports for other mutual funds.
NOTE: Because the return is set at 5% for comparison purposes — NOT your Fund’s actual return — the account values shown do not apply to your specific investment.
| Beginning Account Value 10/01/09 | Ending Account Value 03/31/10 | Annualized Expense Ratios | Expense Paid During Period* | |||||||||
Large Cap Fund | ||||||||||||
Actual Fund Return | ||||||||||||
Class A Shares | $ | 1,000.00 | $ | 1,111.20 | 0.89 | % | $ | 4.68 | ||||
Hypothetical 5% Return | ||||||||||||
Class A Shares | $ | 1,000.00 | $ | 1,020.49 | 0.89 | % | $ | 4.48 | ||||
Large Cap Value Fund | ||||||||||||
Actual Fund Return | ||||||||||||
Class A Shares | $ | 1,000.00 | $ | 1,110.60 | 0.89 | % | $ | 4.68 | ||||
Class I Shares | 1,000.00 | 1,109.30 | 1.11 | % | 5.84 | |||||||
Hypothetical 5% Return | ||||||||||||
Class A Shares | $ | 1,000.00 | $ | 1,020.49 | 0.89 | % | $ | 4.48 | ||||
Class I Shares | 1,000.00 | 1,019.40 | 1.11 | % | 5.59 | |||||||
Large Cap Growth Fund | ||||||||||||
Actual Fund Return | ||||||||||||
Class A Shares | $ | 1,000.00 | $ | 1,122.40 | 0.89 | % | $ | 4.71 | ||||
Class I Shares | 1,000.00 | 1,121.10 | 1.11 | % | 5.87 | |||||||
Hypothetical 5% Return | ||||||||||||
Class A Shares | $ | 1,000.00 | $ | 1,020.49 | 0.89 | % | $ | 4.48 | ||||
Class I Shares | 1,000.00 | 1,019.40 | 1.11 | % | 5.59 | |||||||
| Beginning Account Value 10/01/09 | Ending Account Value 03/31/10 | Annualized Expense Ratios | Expense Paid During Period* | |||||||||
Tax-Managed Large Cap Fund | ||||||||||||
Actual Fund Return | ||||||||||||
Class A Shares | $ | 1,000.00 | $ | 1,113.20 | 0.89 | % | $ | 4.69 | ||||
Class Y Shares | 1,000.00 | 1,114.50 | 0.56 | % | 2.95 | |||||||
Hypothetical 5% Return | ||||||||||||
Class A Shares | $ | 1,000.00 | $ | 1,020.49 | 0.89 | % | $ | 4.48 | ||||
Class Y Shares | 1,000.00 | 1,022.14 | 0.56 | % | 2.82 | |||||||
S &P 500 Index Fund | ||||||||||||
Actual Fund Return | ||||||||||||
Class A Shares | $ | 1,000.00 | $ | 1,115.20 | 0.43 | % | $ | 2.27 | ||||
Class E Shares | 1,000.00 | 1,116.30 | 0.25 | % | 1.32 | |||||||
Class I Shares | 1,000.00 | 1,114.00 | 0.65 | % | 3.43 | |||||||
Hypothetical 5% Return | ||||||||||||
Class A Shares | $ | 1,000.00 | $ | 1,022.79 | 0.43 | % | $ | 2.17 | ||||
Class E Shares | 1,000.00 | 1,023.68 | 0.25 | % | 1.26 | |||||||
Class I Shares | 1,000.00 | 1,021.69 | 0.65 | % | 3.28 | |||||||
Small Cap Fund | ||||||||||||
Actual Fund Return | ||||||||||||
Class A Shares | $ | 1,000.00 | $ | 1,122.40 | 1.14 | % | $ | 6.03 | ||||
Hypothetical 5% Return | ||||||||||||
Class A Shares | $ | 1,000.00 | $ | 1,019.25 | 1.14 | % | $ | 5.74 | ||||
| 136 | SEI Institutional Managed Trust / Semi-Annual Report / March 31, 2010 |
Table of Contents
| Beginning Account Value 10/01/09 | Ending Account Value 03/31/10 | Annualized Expense Ratios | Expense Paid During Period* | |||||||||
Small Cap Value Fund | ||||||||||||
Actual Fund Return | ||||||||||||
Class A Shares | $ | 1,000.00 | $ | 1,135.50 | 1.14 | % | $ | 6.07 | ||||
Class I Shares | 1,000.00 | 1,134.30 | 1.36 | % | 7.24 | |||||||
Hypothetical 5% Return | ||||||||||||
Class A Shares | $ | 1,000.00 | $ | 1,019.25 | 1.14 | % | $ | 5.74 | ||||
Class I Shares | 1,000.00 | 1,018.15 | 1.36 | % | 6.84 | |||||||
Small Cap Growth Fund | ||||||||||||
Actual Fund Return | ||||||||||||
Class A Shares | $ | 1,000.00 | $ | 1,127.40 | 1.11 | % | $ | 5.89 | ||||
Class I Shares | 1,000.00 | 1,126.20 | 1.36 | % | 7.21 | |||||||
Hypothetical 5% Return | ||||||||||||
Class A Shares | $ | 1,000.00 | $ | 1,019.40 | 1.11 | % | $ | 5.59 | ||||
Class I Shares | 1,000.00 | 1,018.15 | 1.36 | % | 6.84 | |||||||
Tax-Managed Small Cap Fund | ||||||||||||
Actual Fund Return | ||||||||||||
Class A Shares | $ | 1,000.00 | $ | 1,156.10 | 1.11 | % | $ | 5.97 | ||||
Hypothetical 5% Return | ||||||||||||
Class A Shares | $ | 1,000.00 | $ | 1,019.40 | 1.11 | % | $ | 5.59 | ||||
Mid-Cap Fund | ||||||||||||
Actual Fund Return | ||||||||||||
Class A Shares | $ | 1,000.00 | $ | 1,135.90 | 1.02 | % | $ | 5.43 | ||||
Class I Shares | 1,000.00 | 1,134.60 | 1.26 | % | 6.71 | |||||||
Hypothetical 5% Return | ||||||||||||
Class A Shares | $ | 1,000.00 | $ | 1,019.85 | 1.02 | % | $ | 5.14 | ||||
Class I Shares | 1,000.00 | 1,018.65 | 1.26 | % | 6.34 | |||||||
U.S. Managed Volatility Fund | ||||||||||||
Actual Fund Return | ||||||||||||
Class A Shares | $ | 1,000.00 | $ | 1,112.70 | 1.00 | % | $ | 5.27 | ||||
Class I Shares | 1,000.00 | 1,112.30 | 1.25 | % | 6.58 | |||||||
Hypothetical 5% Return | ||||||||||||
Class A Shares | $ | 1,000.00 | $ | 1,019.95 | 1.00 | % | $ | 5.04 | ||||
Class I Shares | 1,000.00 | 1,018.70 | 1.25 | % | 6.29 | |||||||
Global Managed Volatility Fund | ||||||||||||
Actual Fund Return | ||||||||||||
Class A Shares | $ | 1,000.00 | $ | 1,057.50 | 1.11 | % | $ | 5.69 | ||||
Class I Shares | 1,000.00 | 1,057.10 | 1.35 | % | 6.92 | |||||||
Hypothetical 5% Return | ||||||||||||
Class A Shares | $ | 1,000.00 | $ | 1,019.40 | 1.11 | % | $ | 5.59 | ||||
Class I Shares | 1,000.00 | 1,018.20 | 1.35 | % | 6.79 | |||||||
Tax-Managed Managed Volatility Fund | ||||||||||||
Actual Fund Return | ||||||||||||
Class A Shares | $ | 1,000.00 | $ | 1,116.60 | 1.00 | % | $ | 5.28 | ||||
Hypothetical 5% Return | ||||||||||||
Class A Shares | $ | 1,000.00 | $ | 1,019.95 | 1.00 | % | $ | 5.04 | ||||
Real Estate Fund | ||||||||||||
Actual Fund Return | ||||||||||||
Class A Shares | $ | 1,000.00 | $ | 1,182.30 | 1.14 | % | $ | 6.20 | ||||
Class I Shares | 1,000.00 | 1,180.70 | 1.36 | % | 7.39 | |||||||
Hypothetical 5% Return | ||||||||||||
Class A Shares | $ | 1,000.00 | $ | 1,019.25 | 1.14 | % | $ | 5.74 | ||||
Class I Shares | 1,000.00 | 1,018.15 | 1.36 | % | 6.84 | |||||||
Enhanced Income Fund | ||||||||||||
Actual Fund Return | ||||||||||||
Class A Shares | $ | 1,000.00 | $ | 1,058.60 | 0.60 | % | $ | 3.08 | ||||
Class I Shares | 1,000.00 | 1,058.20 | 0.85 | % | 4.36 | |||||||
Hypothetical 5% Return | ||||||||||||
Class A Shares | $ | 1,000.00 | $ | 1,021.94 | 0.60 | % | $ | 3.02 | ||||
Class I Shares | 1,000.00 | 1,020.69 | 0.85 | % | 4.28 | |||||||
Core Fixed Income Fund | ||||||||||||
Actual Fund Return | ||||||||||||
Class A Shares | $ | 1,000.00 | $ | 1,062.10 | 0.67 | % | $ | 3.44 | ||||
Class I Shares | 1,000.00 | 1,062.10 | 0.89 | % | 4.58 | |||||||
Hypothetical 5% Return | ||||||||||||
Class A Shares | $ | 1,000.00 | $ | 1,021.59 | 0.67 | % | $ | 3.38 | ||||
Class I Shares | 1,000.00 | 1,020.49 | 0.89 | % | 4.48 | |||||||
| Beginning Account Value 10/01/09 | Ending Account Value 03/31/10 | Annualized Expense Ratios | Expense Paid During Period* | |||||||||
U.S. Fixed Income Fund | ||||||||||||
Actual Fund Return | ||||||||||||
Class A Shares | $ | 1,000.00 | $ | 1,028.00 | 0.66 | % | $ | 3.34 | ||||
Hypothetical 5% Return | ||||||||||||
Class A Shares | $ | 1,000.00 | $ | 1,021.64 | 0.66 | % | $ | 3.33 | ||||
High Yield Bond Fund | ||||||||||||
Actual Fund Return | ||||||||||||
Class A Shares | $ | 1,000.00 | $ | 1,144.20 | 0.89 | % | $ | 4.76 | ||||
Class I Shares | 1,000.00 | 1,143.70 | 1.11 | % | 5.93 | |||||||
Hypothetical 5% Return | ||||||||||||
Class A Shares | $ | 1,000.00 | $ | 1,020.49 | 0.89 | % | $ | 4.48 | ||||
Class I Shares | 1,000.00 | 1,019.40 | 1.11 | % | 5.59 | |||||||
Real Return Fund | ||||||||||||
Actual Fund Return | ||||||||||||
Class A Shares | $ | 1,000.00 | $ | 1,030.50 | 0.45 | % | $ | 2.28 | ||||
Hypothetical 5% Return | ||||||||||||
Class A Shares | 1,000.00 | 1,022.69 | 0.45 | % | 2.27 | |||||||
| * | Expenses are equal to the Fund’s annualized expense ratio multiplied by the average account value over the period, multiplied by 182/365 (to reflect one-half year period shown). |
| The SIMT Multi-Strategy Alternative Fund commenced operations on March 31, 2010. No values are shown in the “Disclosure of Fund Expenses” as the Fund did not incur any expenses for the one-day of operation. |
| SEI Institutional Managed Trust / Semi-Annual Report / March 31, 2010 | 137 |
Table of Contents
Board of Trustee Considerations in Approving the Advisory and Sub-Advisory Agreements (Unaudited)
SEI Institutional Managed Trust (the “Trust”) and SEI Investments Management Corporation (“SIMC”) have entered into an investment advisory agreement (the “Advisory Agreement”). Pursuant to the Advisory Agreement, SIMC oversees the investment advisory services to the series of the Trust (the “Funds”), provides direct investment management for the Multi-Strategy Alternative Fund and may manage the cash portion of the Funds’ assets. Pursuant to separate sub-advisory agreements (the “Sub-Advisory Agreements” and, together with the Advisory Agreement, the “Investment Advisory Agreements”) with SIMC, and under the supervision of SIMC and the Trust’s Board of Trustees (the “Board”), the Sub-Advisers are responsible for the day-to-day investment management of all or a discrete portion of the assets of certain Funds, except for the Multi-Strategy Alternative Fund, which is directly managed by SIMC. The Sub-Advisers also are responsible for managing their employees who provide services to these Funds. The Sub-Advisers are selected based primarily upon the research and recommendations of SIMC, which evaluates quantitatively and qualitatively the Sub-Advisers’ skills and investment results in managing assets for specific asset classes, investment styles and strategies.
The Investment Company Act of 1940, as amended (the “1940 Act”) requires that the initial approval of, as well as the continuation of, the Funds’ Investment Advisory Agreements must be specifically approved: (i) by the vote of the Board of Trustees or by a vote of the shareholders of the Funds; and (ii) by the vote of a majority of the Trustees who are not parties to the Investment Advisory Agreements or “interested persons” of any party (the “Independent Trustees”), cast in person at a meeting called for the purpose of voting on such approval. In connection with their consideration of such approvals, the Funds’ Trustees must request and evaluate, and SIMC and the Sub-Advisers are required to furnish, such information as may be reasonably necessary to evaluate the terms of the Investment Advisory Agreements. In addition, the Securities and Exchange Commission (“SEC”) takes the position that, as part of their fiduciary duties with respect to a mutual fund’s fees, mutual fund boards are required to evaluate the material factors applicable to a decision to approve an Investment Advisory Agreement.
Consistent with these responsibilities, the Trust’s Board of Trustees calls and holds meetings each year that are dedicated to considering whether to renew the Investment Advisory Agreements between the Trust and SIMC and SIMC and the Sub-Advisers with respect to the Funds of the Trust. In preparation for these meetings, the Board requests and reviews a wide variety of materials provided by SIMC and the Sub-Advisers, including information about SIMC’s and the Sub-Advisers’ affiliates, personnel and operations. The Board also receives extensive data provided by third parties. This information is in addition to the detailed information about the Funds that the Board reviews during the course of each year, including information that relates to Fund operations and Fund performance. The Trustees also receive a memorandum from Fund counsel and independent counsel to the Independent Trustees regarding the responsibilities of Trustees in connection with their consideration of whether to approve the Trust’s Investment Advisory Agreements. Finally, the Independent Trustees receive advice from independent counsel to the Independent Trustees, meet in executive session outside the presence of Fund management and participate in question and answer sessions with representatives of SIMC and the Sub-Advisers.
Specifically, the Board requested and received written materials from SIMC and the Sub-Advisers regarding: (a) the quality of SIMC’s and the Sub-Advisers’ investment management and other services; (b) SIMC’s and the Sub-Advisers’ investment management personnel; (c) SIMC’s and the Sub-Advisers’ operations and financial condition; (d) SIMC’s and the Sub-Advisers’ brokerage practices (including any soft dollar arrangements) and investment strategies; (e) the level of the advisory fees that SIMC and the Sub-Advisers charge the Funds compared with the fees each charge to comparable mutual funds; (f) the Funds’ overall fees and operating expenses compared with similar mutual funds; (g) the level of SIMC’s and the Sub-Advisers’ profitability from their Fund-related operations; (h) SIMC’s and the Sub-Advisers’ compliance systems; (i) SIMC’s and the Sub-Advisers’ policies on and compliance procedures for personal securities transactions; (j) SIMC’s and the Sub-Advisers’ reputation, expertise and resources in domestic and/or international financial markets; and (k) the Funds’ performance compared with similar mutual funds.
| 138 | SEI Institutional Managed Trust / Semi-Annual Report / March 31, 2010 |
Table of Contents
At the December 9-10, 2009 and March 24-25, 2010 meetings of the Board of Trustees, the Trustees, including a majority of the Independent Trustees, approved the Investment Advisory Agreements and approved the selection of SIMC and the Sub-Advisers to act in their respective capacities for the Funds. The Board’s approval was based on its consideration and evaluation of a variety of specific factors discussed at the meetings and at prior meetings, including:
| • | the nature, extent and quality of the services provided to the Funds under the Investment Advisory Agreements, including the resources of SIMC and the Sub-Advisers and their affiliates dedicated to the Funds; |
| • | the Funds’ investment performance and how it compared to that of other comparable mutual funds; |
| • | the Funds’ expenses under each Investment Advisory Agreement and how those expenses compared to those of other comparable mutual funds; |
| • | the profitability of SIMC and the Sub-Advisers and their affiliates with respect to the Funds, including both direct and indirect benefits accruing to SIMC and the Sub-Advisers and their affiliates; and |
| • | the extent to which economies of scale would be realized as the Funds grow and whether fee levels in the Investment Advisory Agreements reflect those economies of scale for the benefit of Fund investors. |
Nature, Extent and Quality of Services. The Board of Trustees considered the nature, extent and quality of the services provided by SIMC and the Sub-Advisers to the Funds and the resources of SIMC and the Sub-Advisers and their affiliates dedicated to the Funds. In this regard, the Trustees evaluated, among other things, SIMC’s and the Sub-Advisers’ personnel, experience, track record and compliance program. The Trustees found the level of SIMC’s professional staff and culture of compliance satisfactory. Following evaluation, the Board concluded that, within the context of its full deliberations, the nature, extent and quality of services provided by SIMC and the Sub-Advisers to the Funds and the resources of SIMC and the Sub-Advisers and their affiliates dedicated to the Funds supported renewal of the Investment Advisory Agreements.
Fund Performance. The Board of Trustees considered Fund performance in determining whether to renew the Investment Advisory Agreements. Specifically, the Trustees considered the Funds’ performance relative to their peer groups and appropriate indices/benchmarks, in light of total return, yield and market trends. As part of this review, the Trustees considered the composition of each peer group and selection criteria. In evaluating performance, the Trustees considered both market risk and shareholder risk expectations for the Funds. The Trustees found Fund performance satisfactory, and where performance was below the benchmark, the Trustees were satisfied that appropriate steps were being taken. Following evaluation, the Board concluded that, within the context of its full deliberations, the performance of the Funds supported renewal of the Investment Advisory Agreements.
Fund Expenses. With respect to the Funds’ expenses under the Investment Advisory Agreements, the Trustees considered the rate of compensation called for by the Investment Advisory Agreements and the Funds’ net operating expense ratio in comparison to those of other comparable mutual funds. The Trustees also considered information about average expense ratios of comparable mutual funds in the Funds’ respective peer groups. The Trustees further considered the fact that the comparative fee analysis either showed that the various fees were below average or that there was a reasonable basis for the fee level. Finally, the Trustees considered the effects of SIMC’s voluntary waiver of management and other fees and the Sub-Advisers’ fees to prevent total Fund expenses from exceeding a specified cap and that SIMC and the Sub-Advisers, through waivers, have maintained the Funds’ net operating expenses at competitive levels for their respective distribution channels. Following evaluation, the Board concluded that, within the context of its full deliberations, the expenses of the Funds are reasonable and supported renewal of the Investment Advisory Agreements.
| SEI Institutional Managed Trust / Semi-Annual Report / March 31, 2010 | 139 |
Table of Contents
Board of Trustee Considerations in Approving the Advisory and Sub-Advisory Agreements (Unaudited) (concluded)
Profitability. With regard to profitability, the Trustees considered all compensation flowing to SIMC and the Sub-Advisers and their affiliates, directly or indirectly. The Trustees considered whether the varied levels of compensation and profitability under the Investment Advisory Agreements and other service agreements were reasonable and justified in light of the quality of all services rendered to the Funds by SIMC and the Sub-Advisers and their affiliates. The Trustees found that profitability was reasonable and that the margin was not increasing despite growth in assets. When considering the profitability of the Sub-Advisers, the Board took into account the fact that the Sub-Advisers are compensated by SIMC, and not by the Funds directly, and such compensation with respect to any Sub-Adviser reflects an arms-length negotiation between the Sub-Adviser and SIMC. Based on this evaluation, the Board concluded that, within the context of its full deliberations, the profitability of SIMC and the Sub-Advisers is reasonable and supported renewal of the Investment Advisory Agreements.
Economies of Scale. The Trustees considered the existence of any economies of scale and whether those were passed along to the Funds’ shareholders through a graduated investment advisory fee schedule or other means, including any fee waivers by SIMC and its affiliates. Based on this evaluation, the Board concluded that, within the context of its full deliberations, the Funds obtain reasonable benefit from economies of scale.
Based on the Trustees’ deliberation and their evaluation of the information described above, the Board, including all of the Independent Trustees, unanimously approved the continuation of the Investment Advisory Agreements and concluded that the compensation under the Investment Advisory Agreements is fair and reasonable in light of such services and expenses and such other matters as the Trustees considered to be relevant in the exercise of their reasonable judgment. In the course of their deliberations, the Trustees did not identify any particular information that was all-important or controlling.
| 140 | SEI Institutional Managed Trust / Semi-Annual Report / March 31, 2010 |
Table of Contents
SEI INSTITUTIONAL MANAGED TRUST SEMI-ANNUAL REPORT MARCH 31, 2009
Robert A. Nesher, Chairman
Trustees
William M. Doran
James M. Storey
George J. Sullivan, Jr.
Rosemarie B. Greco
Nina Lesavoy
James M. Williams
Mitchell A. Johnson
Hubert L. Harris, Jr.
Officers
Robert A. Nesher
President and Chief Executive Officer
Stephen F. Panner
Controller and Chief Financial Officer
Russell Emery
Chief Compliance Officer
Timothy D. Barto
Vice President, Secretary
James Ndiaye
Vice President, Assistant Secretary
Aaron Buser
Vice President, Assistant Secretary
David F. McCann
Vice President, Assistant Secretary
John J. McCue
Vice President
Andrew S. Decker
Anti-Money Laundering Compliance Officer
Keri E. Rohn
Privacy Officer
Investment Adviser
SEI Investments Management Corporation
Administrator
SEI Investments Global Funds Services
Distributor
SEI Investments Distribution Co.
Legal Counsel
Morgan, Lewis & Bockius LLP
Independent Registered Public Accounting Firm
KPMG LLP
This report and the financial statements contained herein are submitted for the general information of the shareholders of the Trust and must be preceded or accompanied by a current prospectus. Shares of the Funds are not deposits or obligations of, or guaranteed or endorsed by, any bank. The shares are not federally insured by the Federal Deposit Insurance Corporation (FDIC), the Federal Reserve Board, or any other government agency. Investment in the shares involves risk, including the possible loss of principal.
For more information call
1 800 DIAL SEI
(1 800 342 5734)
Table of Contents
SEI Investments Distribution Co.
Oaks, PA 19456 1.800.DIAL.SEI (1.800.342.5734)
SEI-F-092 (3/10)
Table of Contents
| Item 2. | Code of Ethics. |
Not applicable for semi-annual report.
| Item 3. | Audit Committee Financial Expert. |
Not applicable for semi-annual report.
| Item 4. | Principal Accountant Fees and Services. |
Not applicable for semi-annual report.
| Item 5. | Audit Committee of Listed Registrants. |
Not applicable.
| Item 6. | Schedule of Investments. |
The Schedules of Investments in securities of unaffiliated issuers as of the close of the reporting period for the Large Cap Fund, Large Cap Value Fund, Large Cap Growth Fund, Tax-Managed Large Cap Fund, S&P 500 Index Fund, Small Cap Fund, Small Cap Value Fund, Small Cap Growth Fund, Tax-Managed Small Cap Fund, Mid-Cap Fund, U.S. Managed Volatility Fund, Global Managed Volatility Fund and Tax-Managed Managed Volatility Fund are listed below. The Schedule of Investments in securities of unaffiliated issuers as of the close of the reporting period for the Real Estate Fund, Enhanced Income Fund, Core Fixed Income Fund, U.S. Fixed Income Fund, High Yield Bond Fund , Real Return Fund and Multi-Strategy Alternative Fund is included as part of the report to shareholders filed under Item 1 of this form.
Table of Contents
Schedule of Investments (Unaudited)
Large Cap Fund
March 31, 2010
| Description | Shares | Market Value ($ Thousands) | |||
COMMON STOCK — 96.8% | |||||
Consumer Discretionary — 10.9% | |||||
99 Cents Only Stores * | 14,200 | $ | 232 | ||
Abercrombie & Fitch, Cl A | 2,400 | 110 | |||
Advance Auto Parts | 3,700 | 155 | |||
Aeropostale * | 33,446 | 964 | |||
Amazon.com * | 72,155 | 9,793 | |||
American Eagle Outfitters | 5,000 | 93 | |||
American Greetings, Cl A | 14,200 | 296 | |||
Apollo Group, Cl A * | 38,650 | 2,369 | |||
ArvinMeritor * | 4,700 | 63 | |||
Autoliv | 20,900 | 1,077 | |||
Autonation * | 1,700 | 31 | |||
Autozone * | 283 | 49 | |||
Bed Bath & Beyond * | 3,300 | 144 | |||
Best Buy | 33,600 | 1,429 | |||
Big 5 Sporting Goods | 2,900 | 44 | |||
Big Lots * | 19,300 | 703 | |||
BorgWarner * | 2,800 | 107 | |||
Brinker International | 1,600 | 31 | |||
Brink’s Home Security Holdings * | 4,618 | 196 | |||
Cablevision Systems, Cl A | 13,710 | 331 | |||
Career Education * | 4,900 | 155 | |||
Carmax * | 14,000 | 352 | |||
Carnival | 800 | 31 | |||
CBS, Cl B | 1,100 | 15 | |||
Chico’s FAS | 62,800 | 906 | |||
Chipotle Mexican Grill, Cl A * | 6,000 | 676 | |||
Coach | 102,810 | 4,063 | |||
Comcast, Cl A | 344,660 | 6,487 | |||
Cooper Tire & Rubber | 7,600 | 145 | |||
Core-Mark Holding * | 1,800 | 55 | |||
Darden Restaurants | 15,900 | 708 | |||
Deckers Outdoor * | 2,300 | 317 | |||
DeVry | 900 | 59 | |||
Dick’s Sporting Goods * | 2,000 | 52 | |||
DIRECTV, Cl A * | 147,991 | 5,004 | |||
Discovery Communications, Cl C * | 12,100 | 356 | |||
DISH Network, Cl A | 59,074 | 1,230 | |||
Dollar Tree * | 11,100 | 657 | |||
DreamWorks Animation SKG, Cl A * | 4,400 | 173 | |||
Eastman Kodak | 391,600 | 2,267 | |||
Education Management * | 15,500 | 339 | |||
Expedia | 11,500 | 287 | |||
Family Dollar Stores | 22,900 | 838 | |||
Ford Motor * | 638,454 | 8,025 | |||
Fossil * | 6,000 | 227 | |||
Gannett | 46,000 | 760 | |||
Gap | 87,200 | 2,015 | |||
Garmin | 30,300 | 1,166 | |||
Gentex | 6,900 | 134 | |||
H&R Block | 1,900 | 34 | |||
Hanesbrands * | 900 | 25 | |||
Harley-Davidson | 1,200 | 34 | |||
Harman International Industries | 2,800 | 131 | |||
Helen of Troy * | 8,900 | 232 | |||
Home Depot | 70,400 | 2,277 | |||
| Description | Shares | Market Value ($ Thousands) | |||
International Game Technology | 11,500 | $ | 212 | ||
Interpublic Group * | 4,600 | 38 | |||
J.C. Penney | 89,300 | 2,873 | |||
Jarden | 1,400 | 47 | |||
Johnson Controls | 101,774 | 3,357 | |||
Jones Apparel Group | 14,300 | 272 | |||
Kenneth Cole Productions, Cl A * | 2,800 | 36 | |||
Kohl’s * | 7,956 | 436 | |||
Lamar Advertising, Cl A * | 400 | 14 | |||
Leggett & Platt | 23,900 | 517 | |||
Lennar, Cl A | 2,600 | 45 | |||
Liberty Global, Cl A * | 22,600 | 659 | |||
Liberty Media - Capital, Ser A * | 4,200 | 153 | |||
Liberty Media - Interactive, Cl A * | 11,100 | 170 | |||
Liberty Media - Starz * | 4,750 | 260 | |||
Limited Brands | 12,000 | 295 | |||
LKQ * | 22,800 | 463 | |||
Lowe’s | 173,435 | 4,204 | |||
Macy’s | 112,700 | 2,454 | |||
Madison Square Garden, Cl A * | 4,252 | 92 | |||
Marriott International, Cl A | 6,636 | 209 | |||
McDonald’s | 20,942 | 1,397 | |||
McGraw-Hill | 10,300 | 367 | |||
MGM Mirage * | 7,300 | 88 | |||
NetFlix * | 500 | 37 | |||
Newell Rubbermaid | 16,600 | 252 | |||
News, Cl A | 73,800 | 1,063 | |||
Nike, Cl B | 69,024 | 5,073 | |||
Nordstrom | 1,300 | 53 | |||
NVR * | 200 | 145 | |||
Office Depot * | 4,600 | 37 | |||
Omnicom Group | 5,700 | 221 | |||
O’Reilly Automotive * | 3,400 | 142 | |||
Oxford Industries | 5,700 | 116 | |||
Penn National Gaming * | 500 | 14 | |||
PetSmart | 23,600 | 754 | |||
Phillips-Van Heusen | 1,600 | 92 | |||
Polo Ralph Lauren | 11,400 | 970 | |||
priceline.com * | 14,200 | 3,621 | |||
RadioShack | 31,000 | 702 | |||
Ross Stores | 17,100 | 914 | |||
Royal Caribbean Cruises * | 1,300 | 43 | |||
Scholastic | 4,100 | 115 | |||
Scripps Networks Interactive, Cl A | 6,700 | 297 | |||
Sears Holdings * | 36,700 | 3,979 | |||
Service International | 24,200 | 222 | |||
Signet Jewelers * | 4,100 | 133 | |||
Sonic Automotive, Cl A * | 2,800 | 31 | |||
Stanley Black & Decker | 2,548 | 146 | |||
Staples | 226,220 | 5,291 | |||
Starbucks | 22,100 | 536 | |||
Starwood Hotels & Resorts Worldwide | 700 | 33 | |||
Superior Industries International | 3,200 | 51 | |||
Target | 85,075 | 4,475 | |||
Tempur-Pedic International * | 16,300 | 492 | |||
Thor Industries | 9,300 | 281 | |||
Tiffany | 3,300 | 157 | |||
| 1 | SEI Institutional Managed Trust / Semi-Annual Report / March 31, 2010 |
Table of Contents
Schedule of Investments (Unaudited)
Large Cap Fund
March 31, 2010
| Description | Shares | Market Value ($ Thousands) | |||
Time Warner | 284,617 | $ | 8,900 | ||
Time Warner Cable, Cl A | 130,100 | 6,936 | |||
TJX | 35,100 | 1,493 | |||
TRW Automotive Holdings * | 27,500 | 786 | |||
Ulta Salon Cosmetics & Fragrance * | 5,500 | 124 | |||
Universal Technical Institute * | 4,600 | 105 | |||
Urban Outfitters * | 7,000 | 266 | |||
VF | 13,218 | 1,059 | |||
Viacom, Cl B * | 73,304 | 2,520 | |||
Virgin Media | 16,100 | 278 | |||
WABCO Holdings | 13,800 | 413 | |||
Walt Disney | 106,126 | 3,705 | |||
Whirlpool | 18,200 | 1,588 | |||
Williams-Sonoma | 3,000 | 79 | |||
Winnebago Industries * | 4,100 | 60 | |||
WMS Industries * | 4,900 | 205 | |||
Wyndham Worldwide | 15,500 | 399 | |||
Yum! Brands | 77,900 | 2,986 | |||
| 139,497 | |||||
Consumer Staples — 8.6% | |||||
Altria Group | 8,407 | 173 | |||
Archer-Daniels-Midland | 66,500 | 1,922 | |||
Avon Products | 9,100 | 308 | |||
BJ’s Wholesale Club * | 900 | 33 | |||
Bunge | 23,800 | 1,467 | |||
Campbell Soup | 900 | 32 | |||
Casey’s General Stores | 16,100 | 505 | |||
Clorox | 3,200 | 205 | |||
Coca-Cola | 140,805 | 7,744 | |||
Coca-Cola Enterprises | 48,800 | 1,350 | |||
Colgate-Palmolive | 38,612 | 3,292 | |||
ConAgra Foods | 90,100 | 2,259 | |||
Constellation Brands, Cl A * | 2,200 | 36 | |||
Corn Products International | 800 | 28 | |||
Costco Wholesale | 26,050 | 1,555 | |||
CVS Caremark | 89,388 | 3,268 | |||
Dean Foods * | 62,618 | 982 | |||
Del Monte Foods | 63,900 | 933 | |||
Diageo ADR | 33,300 | 2,246 | |||
Dole Food * | 23,900 | 283 | |||
Dr Pepper Snapple Group | 22,100 | 777 | |||
Estee Lauder, Cl A | 2,300 | 149 | |||
General Mills | 17,700 | 1,253 | |||
Green Mountain Coffee Roasters * | 1,900 | 184 | |||
Herbalife | 37,400 | 1,725 | |||
Hershey | 32,467 | 1,390 | |||
HJ Heinz | 7,074 | 323 | |||
Hormel Foods | 1,200 | 50 | |||
JM Smucker | 4,600 | 277 | |||
Kellogg | 7,175 | 383 | |||
Kimberly-Clark | 16,184 | 1,018 | |||
Kraft Foods, Cl A | 18,839 | 570 | |||
Kroger | 2,321 | 50 | |||
Lorillard | 6,606 | 497 | |||
Mead Johnson Nutrition, Cl A | 52,200 | 2,716 | |||
Medifast * | 17,900 | 450 | |||
Molson Coors Brewing, Cl B | 1,700 | 72 | |||
NBTY * | 4,800 | 231 | |||
PepsiCo | 150,817 | 9,978 | |||
| Description | Shares | Market Value ($ Thousands) | |||
Philip Morris International | 205,029 | $ | 10,694 | ||
Prestige Brands Holdings * | 12,000 | 108 | |||
Procter & Gamble | 264,754 | 16,751 | |||
Reynolds American | 33,766 | 1,823 | |||
Safeway | 65,100 | 1,618 | |||
Sanderson Farms | 7,300 | 391 | |||
Sara Lee | 235,442 | 3,280 | |||
Smithfield Foods * | 6,000 | 124 | |||
SUPERVALU | 60,345 | 1,007 | |||
SYSCO | 197,077 | 5,814 | |||
Tyson Foods, Cl A | 35,976 | 689 | |||
USANA Health Sciences * | 1,600 | 50 | |||
Walgreen | 271,986 | 10,088 | |||
Wal-Mart Stores | 123,320 | 6,857 | |||
Whole Foods Market * | 6,600 | 239 | |||
| 110,247 | |||||
Energy — 9.5% | |||||
Anadarko Petroleum | 5,500 | 401 | |||
Apache | 29,300 | 2,974 | |||
Arch Coal | 1,100 | 25 | |||
Atwood Oceanics * | 1,800 | 62 | |||
Baker Hughes | 1,830 | 86 | |||
BJ Services | 15,241 | 326 | |||
Cabot Oil & Gas | 4,300 | 158 | |||
Cameron International * | 4,676 | 200 | |||
Canadian Natural Resources | 32,372 | 2,397 | |||
Chesapeake Energy | 51,700 | 1,222 | |||
Chevron | 294,864 | 22,359 | |||
Cimarex Energy | 5,200 | 309 | |||
Concho Resources * | 1,300 | 65 | |||
ConocoPhillips | 303,933 | 15,552 | |||
Consol Energy | 100 | 4 | |||
Continental Resources * | 1,800 | 77 | |||
Denbury Resources * | 53,473 | 902 | |||
Devon Energy | 31,400 | 2,023 | |||
Diamond Offshore Drilling | 8,500 | 755 | |||
Dresser-Rand Group * | 4,200 | 132 | |||
El Paso | 70,700 | 766 | |||
EOG Resources | 35,900 | 3,337 | |||
Exxon Mobil | 425,332 | 28,489 | |||
FMC Technologies * | 2,600 | 168 | |||
Halliburton | 92,200 | 2,778 | |||
Helix Energy Solutions Group * | 39,500 | 515 | |||
Helmerich & Payne | 17,300 | 659 | |||
Hess | 10,245 | 641 | |||
Holly | 18,300 | 511 | |||
Marathon Oil | 121,010 | 3,829 | |||
Massey Energy | 400 | 21 | |||
Murphy Oil | 113,328 | 6,368 | |||
Nabors Industries * | 300 | 6 | |||
National Oilwell Varco | 47,034 | 1,909 | |||
Newfield Exploration * | 2,000 | 104 | |||
Noble | 16,100 | 673 | |||
Noble Energy | 1,600 | 117 | |||
Occidental Petroleum | 63,860 | 5,399 | |||
Oceaneering International * | 1,900 | 121 | |||
Oil States International * | 13,500 | 612 | |||
Patterson-UTI Energy | 47,600 | 665 | |||
Peabody Energy | 7,300 | 334 | |||
PetroHawk Energy * | 1,000 | 20 | |||
Pioneer Natural Resources | 800 | 45 | |||
| 2 | SEI Institutional Managed Trust / Semi-Annual Report / March 31, 2010 |
Table of Contents
Schedule of Investments (Unaudited)
Large Cap Fund
March 31, 2010
| Description | Shares | Market Value ($ Thousands) | |||
Plains Exploration & Production * | 900 | $ | 27 | ||
Pride International * | 1,000 | 30 | |||
Quicksilver Resources * | 800 | 11 | |||
Range Resources | 34,930 | 1,637 | |||
Rowan * | 31,100 | 905 | |||
Schlumberger | 57,700 | 3,662 | |||
SEACOR Holdings * | 200 | 16 | |||
Smith International | 3,489 | 149 | |||
Southwestern Energy * | 38,900 | 1,584 | |||
Spectra Energy | 18,800 | 424 | |||
St. Mary Land & Exploration | 1,200 | 42 | |||
Stone Energy * | 23,600 | 419 | |||
Sunoco | 16,700 | 496 | |||
Tidewater | 2,200 | 104 | |||
Transocean * | 26,800 | 2,315 | |||
Unit * | 7,500 | 317 | |||
Williams | 46,900 | 1,083 | |||
XTO Energy | 22,598 | 1,066 | |||
| 122,403 | |||||
Financials — 15.6% | |||||
Affiliated Managers Group * | 900 | 71 | |||
Aflac | 124,716 | 6,771 | |||
Allied World Assurance Holdings | 8,900 | 399 | |||
Allstate | 126,700 | 4,094 | |||
American Equity Investment Life Holding | 8,900 | 95 | |||
American Express | 300,394 | 12,394 | |||
American Financial Group | 25,500 | 725 | |||
American International Group * | 5,600 | 191 | |||
AmeriCredit * | 5,300 | 126 | |||
Ameriprise Financial | 36,800 | 1,669 | |||
Annaly Capital Management † | 102,200 | 1,756 | |||
Anworth Mortgage Asset † | 18,300 | 123 | |||
Assurant | 25,174 | 865 | |||
AvalonBay Communities † | 215 | 19 | |||
Axis Capital Holdings | 29,700 | 928 | |||
Bank of America | 924,222 | 16,497 | |||
Bank of Hawaii | 5,400 | 243 | |||
Bank of New York Mellon | 117,532 | 3,629 | |||
BB&T | 7,539 | 244 | |||
BlackRock | 3,900 | 849 | |||
Boston Properties † | 600 | 45 | |||
Brandywine Realty Trust † | 41,700 | 509 | |||
BRE Properties, Cl A † | 900 | 32 | |||
Brookfield Asset Management, Cl A | 25,100 | 638 | |||
Camden Property Trust † | 1,500 | 62 | |||
Capital One Financial | 93,700 | 3,880 | |||
CB Richard Ellis Group, Cl A * | 7,700 | 122 | |||
Charles Schwab | 4,300 | 80 | |||
Chimera Investment † | 448,213 | 1,744 | |||
Chubb | 53,200 | 2,758 | |||
Citigroup * | 1,367,348 | 5,538 | |||
CME Group | 13,900 | 4,394 | |||
CNA Financial * | 21,200 | 566 | |||
Colony Financial † | 3,500 | 70 | |||
Comerica | 23,200 | 882 | |||
Compass Diversified Holdings | 1,800 | 28 | |||
Cowen Group, Cl A * | 2,400 | 14 | |||
| Description | Shares | Market Value ($ Thousands) | |||
Credicorp | 9,300 | $ | 820 | ||
Cullen/Frost Bankers | 300 | 17 | |||
Discover Financial Services | 102,598 | 1,529 | |||
Douglas Emmett † | 2,200 | 34 | |||
Eaton Vance | 4,700 | 158 | |||
Endurance Specialty Holdings | 34,800 | 1,293 | |||
Equity Residential † | 200 | 8 | |||
Essex Property Trust † | 400 | 36 | |||
Everest Re Group | 600 | 49 | |||
Federated Investors, Cl B | 22,500 | 594 | |||
Fifth Third Bancorp | 95,300 | 1,295 | |||
First American | 3,800 | 129 | |||
First Citizens BancShares, Cl A | 973 | 193 | |||
First Commonwealth Financial | 15,900 | 107 | |||
First Community Bancshares | 1,700 | 21 | |||
First Horizon National * | 1,971 | 28 | |||
Flagstone Reinsurance Holdings | 5,400 | 62 | |||
Forest City Enterprises, Cl A * | 54,300 | 782 | |||
Franklin Resources | 19,781 | 2,194 | |||
Fulton Financial | 26,400 | 269 | |||
Genworth Financial, Cl A * | 15,100 | 277 | |||
Goldman Sachs Group | 65,699 | 11,210 | |||
Greenhill | 100 | 8 | |||
Hanover Insurance Group | 700 | 31 | |||
Hartford Financial Services Group | 34,903 | 992 | |||
HCP † | 3,100 | 102 | |||
Health Care † | 800 | 36 | |||
Hospitality Properties Trust † | 26,700 | 639 | |||
Host Hotels & Resorts † | 5,566 | 82 | |||
HRPT Properties Trust † | 216,700 | 1,686 | |||
Hudson City Bancorp | 152,204 | 2,155 | |||
Huntington Bancshares | 182,900 | 982 | |||
IntercontinentalExchange * | 32,000 | 3,590 | |||
Invesco | 6,400 | 140 | |||
Invesco Mortgage Capital † | 5,500 | 127 | |||
Jefferies Group | 7,400 | 175 | |||
Jones Lang LaSalle | 11,000 | 802 | |||
JPMorgan Chase | 441,126 | 19,740 | |||
Keycorp | 10,300 | 80 | |||
LaBranche * | 18,500 | 97 | |||
Lazard, Cl A | 3,600 | 129 | |||
Legg Mason | 900 | 26 | |||
Liberty Property Trust † | 3,800 | 129 | |||
Lincoln National | 3,000 | 92 | |||
Loews | 14,957 | 558 | |||
M&T Bank | 1,900 | 151 | |||
Macerich † | 1,345 | 52 | |||
Mack-Cali Realty † | 1,000 | 35 | |||
Marsh & McLennan | 2,300 | 56 | |||
Marshall & Ilsley | 14,600 | 118 | |||
Mercury General | 16,800 | 734 | |||
MetLife | 41,742 | 1,809 | |||
MFA Financial † | 52,700 | 388 | |||
Moody’s | 35,800 | 1,065 | |||
Morgan Stanley | 87,462 | 2,562 | |||
MSCI, Cl A * | 7,400 | 267 | |||
Nationwide Health Properties † | 2,100 | 74 | |||
Nelnet, Cl A | 4,100 | 76 | |||
New York Community Bancorp | 104,256 | 1,724 | |||
Northern Trust | 1,662 | 92 | |||
| 3 | SEI Institutional Managed Trust / Semi-Annual Report / March 31, 2010 |
Table of Contents
Schedule of Investments (Unaudited)
Large Cap Fund
March 31, 2010
| Description | Shares | Market Value ($ Thousands) | |||
NYSE Euronext | 150,835 | $ | 4,466 | ||
OceanFirst Financial | 2,600 | 30 | |||
Parkway Properties † | 5,800 | 109 | |||
PartnerRe | 100 | 8 | |||
PHH * | 17,900 | 422 | |||
Phoenix * | 16,300 | 39 | |||
Piper Jaffray * | 1,200 | 48 | |||
Plum Creek Timber † | 7,568 | 294 | |||
PNC Financial Services Group | 50,521 | 3,016 | |||
Presidential Life | 5,700 | 57 | |||
Principal Financial Group | 7,000 | 204 | |||
Progressive | 8,000 | 153 | |||
Prosperity Bancshares | 3,400 | 139 | |||
Protective Life | 7,500 | 165 | |||
Prudential Financial | 71,200 | 4,308 | |||
Public Storage † | 1,300 | 120 | |||
Raymond James Financial | 1,100 | 29 | |||
Rayonier † | 200 | 9 | |||
Regions Financial | 28,084 | 220 | |||
Reinsurance Group of America, Cl A | 14,500 | 762 | |||
RenaissanceRe Holdings | 4,200 | 238 | |||
Resource Capital † | 53,000 | 358 | |||
Senior Housing Properties Trust † | 32,300 | 715 | |||
Simon Property Group † | 1,663 | 140 | |||
SL Green Realty † | 1,400 | 80 | |||
SLM * | 57,300 | 718 | |||
St. Joe * | 1,300 | 42 | |||
StanCorp Financial Group | 1,300 | 62 | |||
State Street | 72,900 | 3,291 | |||
Stewart Information Services | 7,300 | 101 | |||
SunTrust Banks | 5,900 | 158 | |||
Susquehanna Bancshares | 5,300 | 52 | |||
SWS Group | 9,100 | 105 | |||
T. Rowe Price Group | 59,913 | 3,291 | |||
Taubman Centers † | 20,800 | 830 | |||
TD Ameritrade Holding * | 5,600 | 107 | |||
Torchmark | 34,471 | 1,845 | |||
Transatlantic Holdings | 2,200 | 116 | |||
Travelers | 85,652 | 4,620 | |||
Trustco Bank NY | 28,300 | 175 | |||
UDR † | 8,100 | 143 | |||
United America Indemnity, Cl A * | 3,000 | 29 | |||
Unitrin | 4,800 | 135 | |||
Unum Group | 84,800 | 2,100 | |||
US Bancorp | 268,459 | 6,948 | |||
Ventas † | 2,100 | 100 | |||
Vornado Realty Trust † | 700 | 53 | |||
Waddell & Reed Financial, Cl A | 22,100 | 797 | |||
Washington Federal | 1,300 | 26 | |||
Webster Financial | 3,700 | 65 | |||
Weingarten Realty Investors † | 25,800 | 556 | |||
Wells Fargo | 658,423 | 20,490 | |||
WesBanco | 3,300 | 54 | |||
White Mountains Insurance Group | 500 | 177 | |||
XL Capital, Cl A | 58,200 | 1,100 | |||
Zions Bancorporation | 11,100 | 242 | |||
| 200,413 | |||||
| Description | Shares | Market Value ($ Thousands) | |||
Health Care — 13.4% | |||||
Abbott Laboratories | 73,690 | $ | 3,882 | ||
Aetna | 203,086 | 7,130 | |||
Alexion Pharmaceuticals * | 600 | 33 | |||
Allergan | 165,465 | 10,808 | |||
Allscripts Healthcare Solutions * | 29,000 | 567 | |||
AmerisourceBergen | 148,684 | 4,300 | |||
Amgen * | 212,690 | 12,710 | |||
Amylin Pharmaceuticals * | 3,400 | 76 | |||
Baxter International | 36,459 | 2,122 | |||
Beckman Coulter | 3,200 | 201 | |||
Becton Dickinson | 28,940 | 2,279 | |||
Biogen Idec * | 51,862 | 2,975 | |||
Bio-Rad Laboratories, Cl A * | 300 | 31 | |||
Boston Scientific * | 23,600 | 170 | |||
Bristol-Myers Squibb | 178,667 | 4,770 | |||
Bruker BioSciences * | 12,000 | 176 | |||
C.R. Bard | 1,200 | 104 | |||
Cardinal Health | 157,039 | 5,658 | |||
CareFusion * | 1,600 | 42 | |||
Celgene * | 2,406 | 149 | |||
Cerner * | 3,100 | 264 | |||
Charles River Laboratories International * | 6,700 | 263 | |||
Cigna | 11,391 | 417 | |||
Community Health Systems * | 2,800 | 103 | |||
Cooper | 1,400 | 54 | |||
Covance * | 3,700 | 227 | |||
Coventry Health Care * | 12,500 | 309 | |||
Covidien | 43,639 | 2,194 | |||
DaVita * | 700 | 44 | |||
Dendreon * | 6,900 | 252 | |||
Dentsply International | 800 | 28 | |||
Edwards Lifesciences * | 1,400 | 138 | |||
Eli Lilly | 96,789 | 3,506 | |||
Express Scripts * | 2,200 | 224 | |||
Forest Laboratories * | 74,700 | 2,343 | |||
Genzyme * | 84,700 | 4,390 | |||
Gilead Sciences * | 110,200 | 5,012 | |||
Health Management Associates, Cl A * | 7,300 | 63 | |||
Health Net * | 33,800 | 841 | |||
Henry Schein * | 1,900 | 112 | |||
Hill-Rom Holdings | 5,200 | 142 | |||
Hologic * | 1,400 | 26 | |||
Hospira * | 5,600 | 317 | |||
Humana * | 13,400 | 627 | |||
Idexx Laboratories * | 9,500 | 547 | |||
Intuitive Surgical * | 4,200 | 1,462 | |||
Inverness Medical Innovations * | 3,700 | 144 | |||
Johnson & Johnson | 238,413 | 15,545 | |||
Kinetic Concepts * | 3,900 | 187 | |||
King Pharmaceuticals * | 58,600 | 689 | |||
Laboratory Corp of America Holdings * | 5,145 | 390 | |||
Life Technologies * | 10,300 | 538 | |||
LifePoint Hospitals * | 900 | 33 | |||
Lincare Holdings * | 1,000 | 45 | |||
McKesson | 91,297 | 6,000 | |||
Medco Health Solutions * | 84,828 | 5,476 | |||
Mednax * | 4,600 | 268 | |||
| 4 | SEI Institutional Managed Trust / Semi-Annual Report / March 31, 2010 |
Table of Contents
Schedule of Investments (Unaudited)
Large Cap Fund
March 31, 2010
| Description | Shares | Market Value ($ Thousands) | |||
Medtronic | 131,492 | $ | 5,921 | ||
Merck | 129,004 | 4,818 | |||
Mettler Toledo International * | 5,700 | 623 | |||
Millipore * | 1,379 | 146 | |||
Mylan Laboratories * | 50,700 | 1,151 | |||
Novo Nordisk ADR | 45,100 | 3,478 | |||
OSI Pharmaceuticals * | 815 | 48 | |||
Par Pharmaceutical * | 10,800 | 268 | |||
Patterson | 5,000 | 155 | |||
PerkinElmer | 6,700 | 160 | |||
Perrigo | 4,300 | 252 | |||
Pfizer | 813,215 | 13,947 | |||
Quest Diagnostics | 15,200 | 886 | |||
ResMed * | 100 | 6 | |||
St. Jude Medical * | 34,102 | 1,400 | |||
Stryker | 56,100 | 3,210 | |||
Tenet Healthcare * | 37,900 | 217 | |||
Teva Pharmaceutical Industries ADR | 26,770 | 1,689 | |||
Thermo Fisher Scientific * | 24,700 | 1,271 | |||
United Therapeutics * | 2,400 | 133 | |||
UnitedHealth Group | 350,100 | 11,438 | |||
Universal Health Services, Cl B | 9,000 | 316 | |||
Valeant Pharmaceuticals International * | 19,900 | 854 | |||
Varian Medical Systems * | 500 | 28 | |||
Vertex Pharmaceuticals * | 1,400 | 57 | |||
Waters * | 2,300 | 155 | |||
Watson Pharmaceuticals * | 3,000 | 125 | |||
WellPoint * | 92,301 | 5,942 | |||
Zimmer Holdings * | 25,300 | 1,498 | |||
| 171,595 | |||||
Industrials — 9.0% | |||||
3M | 49,345 | 4,124 | |||
Aecom Technology * | 1,400 | 40 | |||
AGCO * | 800 | 29 | |||
Alexander & Baldwin | 2,900 | 96 | |||
Alliant Techsystems * | 8,900 | 723 | |||
Avery Dennison | 3,800 | 138 | |||
BE Aerospace * | 1,200 | 36 | |||
Boeing | 29,309 | 2,128 | |||
Bucyrus International, Cl A | 400 | 26 | |||
C.H. Robinson Worldwide | 1,183 | 66 | |||
Canadian National Railway | 12,400 | 751 | |||
Carlisle | 20,200 | 770 | |||
Caterpillar | 6,200 | 390 | |||
Cintas | 200 | 5 | |||
Con-way | 3,400 | 120 | |||
Copa Holdings, Cl A | 2,400 | 146 | |||
Corrections Corp of America * | 12,300 | 244 | |||
Crane | 14,700 | 522 | |||
CSX | 11,542 | 588 | |||
Cummins | 44,387 | 2,750 | |||
Danaher | 21,175 | 1,692 | |||
Deere | 2,400 | 143 | |||
Delta Air Lines * | 74,585 | 1,088 | |||
Dollar Thrifty Automotive Group * | 5,700 | 183 | |||
Dover | 24,000 | 1,122 | |||
Dun & Bradstreet | 174 | 13 | |||
DynCorp International, Cl A * | 7,900 | 91 | |||
| Description | Shares | Market Value ($ Thousands) | |||
Eaton | 10,200 | $ | 773 | ||
EMCOR Group * | 23,800 | 586 | |||
Emerson Electric | 36,630 | 1,844 | |||
Ennis | 8,100 | 132 | |||
Expeditors International of Washington | 116,500 | 4,301 | |||
FedEx | 22,000 | 2,055 | |||
Flowserve | 1,400 | 154 | |||
Fluor | 89,500 | 4,163 | |||
Gardner Denver | 23,600 | 1,039 | |||
General Dynamics | 71,339 | 5,507 | |||
General Electric | 837,444 | 15,242 | |||
Goodrich | 30,800 | 2,172 | |||
Graco | 1,000 | 32 | |||
Harsco | 5,400 | 172 | |||
Hertz Global Holdings * | 200 | 2 | |||
Honeywell International | 26,721 | 1,210 | |||
Hubbell, Cl B | 34,739 | 1,752 | |||
IDEX | 7,200 | 238 | |||
Illinois Tool Works | 60,017 | 2,842 | |||
ITT | 19,018 | 1,020 | |||
JB Hunt Transport Services | 1,000 | 36 | |||
Joy Global | 18,726 | 1,060 | |||
Kansas City Southern * | 2,600 | 94 | |||
KBR | 64,600 | 1,431 | |||
Kirby * | 1,900 | 72 | |||
L-3 Communications Holdings | 27,400 | 2,511 | |||
Lennox International | 2,900 | 129 | |||
Lockheed Martin | 67,761 | 5,639 | |||
Manpower | 8,100 | 463 | |||
Masco | 1,600 | 25 | |||
Monster Worldwide * | 6,000 | 100 | |||
Mueller Industries | 1,300 | 35 | |||
NACCO Industries, Cl A | 1,100 | 82 | |||
Norfolk Southern | 900 | 50 | |||
Northrop Grumman | 79,380 | 5,205 | |||
Oshkosh Truck | 23,400 | 944 | |||
Owens Corning * | 14,200 | 361 | |||
Parker Hannifin | 40,895 | 2,648 | |||
Precision Castparts | 2,580 | 327 | |||
Quanta Services * | 94,500 | 1,811 | |||
Raytheon | 90,071 | 5,145 | |||
Republic Services | 29,240 | 848 | |||
Rockwell Automation | 16,600 | 935 | |||
Rockwell Collins | 34,400 | 2,153 | |||
RR Donnelley & Sons | 65,800 | 1,405 | |||
Ryder System | 800 | 31 | |||
Schawk, Cl A | 3,300 | 60 | |||
Shaw Group * | 900 | 31 | |||
Southwest Airlines | 5,800 | 77 | |||
Spirit Aerosystems Holdings, Cl A * | 5,600 | 131 | |||
SPX | 10,900 | 723 | |||
Taser International * | 3,900 | 23 | |||
Teleflex | 600 | 38 | |||
Textron | 4,200 | 89 | |||
Thomas & Betts * | 15,000 | 589 | |||
Timken | 900 | 27 | |||
Toro | 5,600 | 275 | |||
Towers Watson, Cl A | 6,900 | 328 | |||
Tyco International | 36,300 | 1,388 | |||
Union Pacific | 17,778 | 1,303 | |||
| 5 | SEI Institutional Managed Trust / Semi-Annual Report / March 31, 2010 |
Table of Contents
Schedule of Investments (Unaudited)
Large Cap Fund
March 31, 2010
| Description | Shares | Market Value ($ Thousands) | |||
United Parcel Service, Cl B | 46,179 | $ | 2,974 | ||
United Technologies | 111,530 | 8,210 | |||
URS * | 300 | 15 | |||
Valmont Industries | 500 | 41 | |||
Verisk Analytics, Cl A * | 1,400 | 39 | |||
Waste Management | 29,675 | 1,022 | |||
WESCO International * | 1,300 | 45 | |||
WW Grainger | 10,100 | 1,092 | |||
| 115,320 | |||||
Information Technology — 20.4% | |||||
Accenture, Cl A | 12,700 | 533 | |||
Activision Blizzard | 6,000 | 72 | |||
Adobe Systems * | 128,420 | 4,542 | |||
Advanced Micro Devices * | 9,700 | 90 | |||
Agilent Technologies * | 9,500 | 327 | |||
Alliance Data Systems * | 1,100 | 70 | |||
Altera | 3,700 | 90 | |||
Amdocs * | 41,900 | 1,262 | |||
Amphenol, Cl A | 1,900 | 80 | |||
Analog Devices | 8,300 | 239 | |||
Ansys * | 2,300 | 99 | |||
AOL * | 741 | 19 | |||
Apple * | 92,628 | 21,761 | |||
Applied Materials | 4,400 | 59 | |||
Arrow Electronics * | 4,000 | 120 | |||
Autodesk * | 61,300 | 1,803 | |||
Automatic Data Processing | 1,201 | 53 | |||
Avnet * | 40,900 | 1,227 | |||
AVX | 2,900 | 41 | |||
BMC Software * | 17,100 | 650 | |||
Brightpoint * | 10,900 | 82 | |||
Broadcom, Cl A | 27,700 | 919 | |||
Broadridge Financial Solutions | 14,200 | 303 | |||
Brocade Communications Systems * | 9,000 | 51 | |||
CA | 129,400 | 3,037 | |||
Cadence Design Systems * | 9,900 | 66 | |||
Cirrus Logic * | 8,600 | 72 | |||
Cisco Systems * | 607,217 | 15,806 | |||
Citrix Systems * | 48,265 | 2,291 | |||
Cognizant Technology Solutions, Cl A * | 10,600 | 540 | |||
CommScope * | 1,100 | 31 | |||
Computer Sciences * | 52,867 | 2,881 | |||
Corning | 118,400 | 2,393 | |||
Cree * | 2,900 | 204 | |||
Cypress Semiconductor * | 2,400 | 28 | |||
Dell * | 280,558 | 4,211 | |||
Diebold | 2,400 | 76 | |||
Dolby Laboratories, Cl A * | 300 | 18 | |||
DST Systems | 5,500 | 228 | |||
eBay * | 252,400 | 6,802 | |||
EMC * | 419,450 | 7,567 | |||
Equinix * | 800 | 78 | |||
F5 Networks * | 5,600 | 344 | |||
Factset Research Systems | 2,900 | 213 | |||
Fairchild Semiconductor International * | 4,600 | 49 | |||
Fidelity National Information Services | 21,231 | 498 | |||
Fiserv * | 5,700 | 289 | |||
| Description | Shares | Market Value ($ Thousands) | |||
Flextronics International * | 94,200 | $ | 738 | ||
Flir Systems * | 1,300 | 37 | |||
Global Payments | 3,000 | 137 | |||
Google, Cl A * | 30,566 | 17,331 | |||
Harris | 28,800 | 1,368 | |||
Hewlett-Packard | 260,464 | 13,844 | |||
IAC * | 8,300 | 189 | |||
Ingram Micro, Cl A * | 81,631 | 1,433 | |||
Intel | 511,401 | 11,384 | |||
International Business Machines | 156,515 | 20,073 | |||
Intersil, Cl A | 17,200 | 254 | |||
Intuit * | 127,200 | 4,368 | |||
Iron Mountain | 500 | 14 | |||
Jabil Circuit | 148,110 | 2,398 | |||
Juniper Networks * | 5,000 | 153 | |||
Kla-Tencor | 11,100 | 343 | |||
Lam Research * | 10,400 | 388 | |||
Lender Processing Services | 6,000 | 226 | |||
Lexmark International, Cl A * | 2,000 | 72 | |||
Linear Technology | 6,200 | 175 | |||
Loral Space & Communications * | 1,200 | 42 | |||
LSI Logic * | 5,900 | 36 | |||
Marvell Technology Group * | 57,500 | 1,172 | |||
Mastercard, Cl A | 15,400 | 3,911 | |||
Maxim Integrated Products | 7,800 | 151 | |||
McAfee * | 12,500 | 502 | |||
Microchip Technology | 10,000 | 282 | |||
Micron Technology * | 348,037 | 3,616 | |||
Micros Systems * | 6,400 | 210 | |||
Microsoft | 894,315 | 26,177 | |||
Molex | 3,400 | 71 | |||
Motorola * | 55,700 | 391 | |||
National Instruments | 1,000 | 33 | |||
National Semiconductor | 18,400 | 266 | |||
NetApp * | 13,700 | 446 | |||
NeuStar, Cl A * | 2,300 | 58 | |||
Nokia ADR | 161,500 | 2,510 | |||
Novellus Systems * | 9,200 | 230 | |||
Nuance Communications * | 88,400 | 1,471 | |||
Nvidia * | 1,600 | 28 | |||
ON Semiconductor * | 400 | 3 | |||
Oplink Communications * | 900 | 17 | |||
Oracle | 126,669 | 3,254 | |||
Paychex | 71,100 | 2,183 | |||
PMC - Sierra * | 35,600 | 317 | |||
Power Integrations | 1,200 | 49 | |||
QLogic * | 1,800 | 37 | |||
Qualcomm | 293,800 | 12,337 | |||
Quest Software * | 25,100 | 447 | |||
Rackspace Hosting * | 106,300 | 1,991 | |||
Rambus * | 5,200 | 114 | |||
Red Hat * | 57,500 | 1,683 | |||
Rovi * | 8,300 | 308 | |||
SAIC * | 35,700 | 632 | |||
Salesforce.com * | 2,900 | 216 | |||
Seagate Technology | 133,712 | 2,442 | |||
Silicon Laboratories * | 3,000 | 143 | |||
Sybase * | 1,200 | 56 | |||
Symantec * | 239,656 | 4,055 | |||
Synopsys * | 2,900 | 65 | |||
| 6 | SEI Institutional Managed Trust / Semi-Annual Report / March 31, 2010 |
Table of Contents
Schedule of Investments (Unaudited)
Large Cap Fund
March 31, 2010
| Description | Shares | Market Value ($ Thousands) | |||
Tech Data * | 21,000 | $ | 880 | ||
Tellabs | 19,300 | 146 | |||
Teradata * | 112,200 | 3,241 | |||
Teradyne * | 700 | 8 | |||
Texas Instruments | 344,021 | 8,418 | |||
Total System Services | 15,500 | 243 | |||
Trimble Navigation * | 1,700 | 49 | |||
Tyco Electronics | 20,400 | 561 | |||
Varian Semiconductor Equipment Associates * | 900 | 30 | |||
VeriSign * | 143,900 | 3,743 | |||
Visa, Cl A | 97,175 | 8,846 | |||
Vishay Intertechnology * | 22,800 | 233 | |||
VMware, Cl A * | 1,300 | 69 | |||
WebMD Health, Cl A * | 4,599 | 213 | |||
Western Digital * | 47,500 | 1,852 | |||
Western Union | 37,600 | 638 | |||
Xerox | 92,918 | 906 | |||
Xilinx | 8,000 | 204 | |||
Yahoo! * | 151,600 | 2,506 | |||
Zebra Technologies, Cl A * | 5,200 | 154 | |||
| 262,031 | |||||
Materials — 3.3% | |||||
Air Products & Chemicals | 7,200 | 532 | |||
Airgas | 1,152 | 73 | |||
Albemarle | 3,600 | 153 | |||
Alcoa | 74,200 | 1,057 | |||
Alpha Natural Resources * | 592 | 30 | |||
Ashland | 17,600 | 929 | |||
Ball | 15,200 | 811 | |||
Bemis | 22,900 | 658 | |||
Boise * | 12,900 | 79 | |||
Cabot | 1,200 | 36 | |||
Celanese, Ser A | 22,500 | 717 | |||
CF Industries Holdings | 1,349 | 123 | |||
Compass Minerals International | 400 | 32 | |||
Crown Holdings * | 8,900 | 240 | |||
Cytec Industries | 1,100 | 51 | |||
Dow Chemical | 2,800 | 83 | |||
E.I. Du Pont de Nemours | 117,030 | 4,358 | |||
Eagle Materials | 900 | 24 | |||
Eastman Chemical | 16,800 | 1,070 | |||
Ecolab | 300 | 13 | |||
FMC | 200 | 12 | |||
Freeport-McMoRan Copper & Gold, Cl B | 51,785 | 4,326 | |||
Greif, Cl A | 2,600 | 143 | |||
Huntsman | 237,161 | 2,858 | |||
International Flavors & Fragrances | 600 | 29 | |||
International Paper | 28,400 | 699 | |||
Lubrizol | 25,500 | 2,339 | |||
MeadWestvaco | 10,500 | 268 | |||
Monsanto | 42,112 | 3,008 | |||
Nalco Holding | 97,800 | 2,379 | |||
Newmont Mining | 41,442 | 2,111 | |||
Nucor | 33,000 | 1,497 | |||
Owens-Illinois * | 5,100 | 181 | |||
Packaging Corp of America | 1,300 | 32 | |||
Pactiv * | 4,300 | 108 | |||
PPG Industries | 5,200 | 340 | |||
| Description | Shares | Market Value ($ Thousands) | |||
Praxair | 30,115 | $ | 2,500 | ||
Reliance Steel & Aluminum | 12,500 | 615 | |||
Rock-Tenn, Cl A | 17,200 | 784 | |||
RPM International | 10,300 | 220 | |||
Scotts Miracle-Gro, Cl A | 900 | 42 | |||
Sealed Air | 11,000 | 232 | |||
Sigma-Aldrich | 700 | 38 | |||
Solutia * | 2,600 | 42 | |||
Sonoco Products | 17,300 | 533 | |||
Southern Copper | 52,600 | 1,666 | |||
Spartech * | 9,900 | 116 | |||
Stepan | 1,300 | 73 | |||
Syngenta ADR | 48,300 | 2,681 | |||
Temple-Inland | 5,200 | 106 | |||
Terra Industries | 3,613 | 165 | |||
Valspar | 6,700 | 197 | |||
Walter Energy | 2,200 | 203 | |||
WR Grace * | 3,900 | 108 | |||
| 41,720 | |||||
Telecommunication Services — 2.8% | |||||
AT&T | 721,388 | 18,641 | |||
BCE | 22,700 | 666 | |||
CenturyTel | 12,701 | 450 | |||
Crown Castle International * | 111,200 | 4,251 | |||
NII Holdings * | 18,000 | 750 | |||
Qwest Communications International | 3,700 | 19 | |||
SBA Communications, Cl A * | 1,900 | 68 | |||
Sprint Nextel * | 494,640 | 1,880 | |||
Telephone & Data Systems | 21,200 | 718 | |||
tw telecom, Cl A * | 800 | 15 | |||
Verizon Communications | 275,645 | 8,550 | |||
| 36,008 | |||||
Utilities — 3.3% | |||||
AES * | 644,000 | 7,084 | |||
Allegheny Energy | 4,500 | 104 | |||
Alliant Energy | 12,600 | 419 | |||
Ameren | 24,100 | 629 | |||
American Electric Power | 40,500 | 1,384 | |||
American Water Works | 4,700 | 102 | |||
Aqua America | 13,200 | 232 | |||
Atmos Energy | 22,000 | 629 | |||
Calpine * | 14,000 | 166 | |||
CMS Energy | 9,900 | 153 | |||
Constellation Energy Group | 8,500 | 298 | |||
Dominion Resources | 40,300 | 1,657 | |||
DPL | 35,597 | 968 | |||
DTE Energy | 33,496 | 1,494 | |||
Edison International | 85,700 | 2,928 | |||
Energen | 30,286 | 1,409 | |||
Entergy | 13,900 | 1,131 | |||
Equities | 10,300 | 422 | |||
Exelon | 56,699 | 2,484 | |||
FirstEnergy | 34,594 | 1,352 | |||
FPL Group | 38,500 | 1,861 | |||
Great Plains Energy | 2,000 | 37 | |||
Hawaiian Electric Industries | 1,400 | 31 | |||
Integrys Energy Group | 19,534 | 926 | |||
Mirant * | 72,300 | 785 | |||
National Fuel Gas | 5,500 | 278 | |||
NiSource | 52,200 | 825 | |||
| 7 | SEI Institutional Managed Trust / Semi-Annual Report / March 31, 2010 |
Table of Contents
Schedule of Investments (Unaudited)
Large Cap Fund
March 31, 2010
Description | Shares/Face Amount ($ Thousands) | Market Value ($ Thousands) | ||||
NorthWestern | 1,500 | $ | 40 | |||
NRG Energy * | 6,100 | 128 | ||||
NSTAR | 47,767 | 1,692 | ||||
NV Energy | 77,500 | 956 | ||||
OGE Energy | 16,700 | 650 | ||||
Oneok | 2,200 | 100 | ||||
PG&E | 23,436 | 994 | ||||
Pinnacle West Capital | 2,700 | 102 | ||||
PPL | 21,540 | 597 | ||||
Public Service Enterprise Group | 95,302 | 2,813 | ||||
Questar | 1,800 | 78 | ||||
Sempra Energy | 37,192 | 1,856 | ||||
Southern Union | 60,100 | 1,525 | ||||
TECO Energy | 4,800 | 76 | ||||
Xcel Energy | 39,871 | 845 | ||||
| 42,240 | ||||||
Total Common Stock | 1,241,474 | |||||
CASH EQUIVALENT — 2.8% | ||||||
SEI Daily Income Trust, Prime Obligation Fund, Cl A, 0.070%**†† | 36,024,392 | 36,024 | ||||
Total Cash Equivalent | 36,024 | |||||
U.S. TREASURY OBLIGATIONS (A) (B) — 0.3% | ||||||
U.S. Treasury Bills | ||||||
0.326%, 02/10/11 | $ | 400 | 399 | |||
0.130%, 06/03/10 | 3,736 | 3,735 | ||||
U.S. Cash Management Bills | ||||||
0.000%, 06/10/10 | 117 | 117 | ||||
Total U.S. Treasury Obligations | 4,251 | |||||
Total Investments — 99.9% | $ | 1,281,749 | ||||
A summary of the open futures contracts held by the Fund at March 31, 2010, is as follows:
| Type of Contract | Number of Contracts Long (Short) | Expiration Date | Unrealized Appreciation ($ Thousands) | ||||
S&P 500 Index E-MINI | 63 | Jun-2010 | $ | 58 | |||
S&P 500 Composite Index | 89 | Jun-2010 | 418 | ||||
S&P Mid 400 Index E-MINI | 43 | Jun-2010 | 41 | ||||
| $ | 517 | ||||||
For the period ended March 31, 2010, the total amount of all open futures contracts, as presented in the table above, are representative of the volume of activity for this derivative type during the period.
Percentages are based on Net Assets of $1,283,092 ($ Thousands).
| * | Non-income producing security. |
| ** | Rate shown is the 7-day effective yield as of March 31, 2010. |
| † | Real Estate Investment Trust. |
| †† | Investment in Affiliated Security. |
| (A) | The rate reported is the rate effective yield at the time of purchase. |
| (B) | Security, or portion thereof, has been pledged as collateral on open futures. |
ADR — American Depositary Receipt
CL — Class
Ser — Series
| 8 | SEI Institutional Managed Trust / Semi-Annual Report / March 31, 2010 |
Table of Contents
Schedule of Investments (Unaudited)
Large Cap Value Fund
March 31, 2010
| Description | Shares | Market Value ($ Thousands) | |||
COMMON STOCK — 96.8% | |||||
Consumer Discretionary — 10.4% | |||||
Abercrombie & Fitch, Cl A | 12,800 | $ | 584 | ||
Autoliv (A) | 133,800 | 6,895 | |||
Autonation * (A) | 5,300 | 96 | |||
Big Lots * | 13,200 | 481 | |||
BorgWarner * | 2,800 | 107 | |||
Brinker International | 83,800 | 1,616 | |||
Cablevision Systems, Cl A | 75,000 | 1,810 | |||
Carmax * (A) | 45,300 | 1,138 | |||
Carnival | 19,500 | 758 | |||
CBS, Cl B (A) | 180,600 | 2,518 | |||
Coach (A) | 87,400 | 3,454 | |||
Comcast, Cl A (A) | 1,273,300 | 23,964 | |||
DIRECTV, Cl A * | 215,510 | 7,286 | |||
Discovery Communications, Cl C * | 15,200 | 447 | |||
DISH Network, Cl A | 106,100 | 2,209 | |||
DreamWorks Animation SKG, Cl A * | 21,700 | 855 | |||
Expedia | 3,500 | 87 | |||
Family Dollar Stores (A) | 45,500 | 1,666 | |||
Foot Locker | 27,800 | 418 | |||
Ford Motor * (A) | 754,600 | 9,485 | |||
Gannett (A) | 142,000 | 2,346 | |||
Gap | 271,700 | 6,279 | |||
Garmin (A) | 9,800 | 377 | |||
Harley-Davidson (A) | 43,000 | 1,207 | |||
Harman International Industries | 12,300 | 575 | |||
Hasbro | 65,000 | 2,488 | |||
Home Depot | 297,300 | 9,618 | |||
International Game Technology | 7,500 | 138 | |||
Interpublic Group * | 74,600 | 621 | |||
J.C. Penney | 93,600 | 3,011 | |||
Jarden | 67,900 | 2,260 | |||
Johnson Controls | 52,900 | 1,745 | |||
Kohl’s * | 13,200 | 723 | |||
Lamar Advertising, Cl A * (A) | 2,700 | 93 | |||
Lennar, Cl A (A) | 45,600 | 785 | |||
Liberty Global, Cl A * (A) | 68,700 | 2,003 | |||
Liberty Media - Capital, Ser A * | 7,600 | 276 | |||
Liberty Media - Interactive, Cl A * | 21,800 | 334 | |||
Liberty Media - Starz * | 23,400 | 1,280 | |||
Limited Brands (A) | 203,100 | 5,000 | |||
Lowe’s | 48,000 | 1,164 | |||
Macy’s | 285,400 | 6,213 | |||
Madison Square Garden, Cl A * | 33,150 | 720 | |||
Marriott International, Cl A (A) | 66,969 | 2,111 | |||
Mattel | 6,300 | 144 | |||
MDC Holdings | 900 | 31 | |||
MGM Mirage * (A) | 62,300 | 747 | |||
Mohawk Industries * | 5,700 | 310 | |||
New York Times, Cl A * (A) | 41,700 | 464 | |||
Newell Rubbermaid (A) | 117,300 | 1,783 | |||
News, Cl A | 406,500 | 5,858 | |||
NVR * | 1,200 | 872 | |||
Office Depot * | 2,300 | 18 | |||
Penn National Gaming * | 20,000 | 556 | |||
PetSmart | 93,000 | 2,972 | |||
| Description | Shares | Market Value ($ Thousands) | |||
Phillips-Van Heusen | 7,400 | $ | 424 | ||
Polo Ralph Lauren | 1,700 | 145 | |||
Pulte Homes * (A) | 9,445 | 106 | |||
RadioShack (A) | 137,100 | 3,103 | |||
Royal Caribbean Cruises * | 9,900 | 327 | |||
Scripps Networks Interactive, Cl A (A) | 29,200 | 1,295 | |||
Sears Holdings * (A) | 24,200 | 2,624 | |||
Service International | 171,500 | 1,574 | |||
Sherwin-Williams (A) | 36,300 | 2,457 | |||
Stanley Black & Decker | 10,140 | 582 | |||
Starwood Hotels & Resorts Worldwide | 13,800 | 644 | |||
Tiffany | 6,200 | 294 | |||
Time Warner | 315,733 | 9,873 | |||
Time Warner Cable, Cl A (A) | 164,424 | 8,765 | |||
TRW Automotive Holdings * | 4,400 | 126 | |||
VF | 4,500 | 361 | |||
Viacom, Cl B * | 225,800 | 7,763 | |||
Virgin Media (A) | 68,800 | 1,187 | |||
WABCO Holdings | 4,700 | 140 | |||
Walt Disney | 335,000 | 11,695 | |||
Wendy’s, Cl A | 50,800 | 254 | |||
Whirlpool (A) | 88,200 | 7,696 | |||
Williams-Sonoma | 11,200 | 295 | |||
Wyndham Worldwide (A) | 131,400 | 3,381 | |||
Wynn Resorts * | 300 | 23 | |||
| 196,130 | |||||
Consumer Staples — 5.5% | |||||
Archer-Daniels-Midland | 140,400 | 4,058 | |||
BJ’s Wholesale Club * | 72,000 | 2,663 | |||
Brown-Forman, Cl B (A) | 42,900 | 2,550 | |||
Bunge | 10,700 | 659 | |||
Campbell Soup (A) | 128,900 | 4,557 | |||
Central European Distribution * | 2,500 | 88 | |||
Coca-Cola | 55,500 | 3,052 | |||
Coca-Cola Enterprises | 122,700 | 3,394 | |||
ConAgra Foods | 263,900 | 6,616 | |||
Constellation Brands, Cl A * | 11,100 | 182 | |||
Corn Products International | 66,400 | 2,301 | |||
CVS Caremark | 298,700 | 10,921 | |||
Del Monte Foods | 339,400 | 4,955 | |||
Dr Pepper Snapple Group | 35,300 | 1,242 | |||
Energizer Holdings * | 2,400 | 150 | |||
General Mills | 13,000 | 920 | |||
Herbalife | 107,800 | 4,972 | |||
Hershey (A) | 7,800 | 334 | |||
HJ Heinz | 1,500 | 68 | |||
Hormel Foods | 3,400 | 143 | |||
JM Smucker | 18,100 | 1,091 | |||
Kimberly-Clark | 42,600 | 2,679 | |||
Kraft Foods, Cl A | 68,759 | 2,079 | |||
Kroger | 213,700 | 4,629 | |||
Lorillard | 1,700 | 128 | |||
Mead Johnson Nutrition, Cl A | 17,300 | 900 | |||
Molson Coors Brewing, Cl B | 10,800 | 454 | |||
NBTY * | 12,500 | 600 | |||
Philip Morris International | 49,600 | 2,587 | |||
Procter & Gamble | 264,800 | 16,754 | |||
Safeway | 273,300 | 6,794 | |||
Sara Lee (A) | 370,700 | 5,164 | |||
| 1 | SEI Institutional Managed Trust / Semi-Annual Report / March 31, 2010 |
Table of Contents
Schedule of Investments (Unaudited)
Large Cap Value Fund
March 31, 2010
| Description | Shares | Market Value ($ Thousands) | |||
Smithfield Foods * (A) | 67,600 | $ | 1,402 | ||
SUPERVALU (A) | 134,837 | 2,249 | |||
Tyson Foods, Cl A | 102,800 | 1,969 | |||
Whole Foods Market * (A) | 10,100 | 365 | |||
| 103,669 | |||||
Energy — 17.1% | |||||
Anadarko Petroleum | 41,300 | 3,008 | |||
Apache | 92,700 | 9,409 | |||
Arch Coal | 10,900 | 249 | |||
Atwood Oceanics * | 4,000 | 138 | |||
Baker Hughes (A) | 33,300 | 1,560 | |||
BJ Services | 82,400 | 1,763 | |||
Cabot Oil & Gas (A) | 37,900 | 1,395 | |||
Cameron International * | 10,000 | 429 | |||
Chesapeake Energy (A) | 44,500 | 1,052 | |||
Chevron | 744,700 | 56,471 | |||
Cimarex Energy (A) | 55,200 | 3,278 | |||
Concho Resources * | 9,400 | 473 | |||
ConocoPhillips | 588,586 | 30,118 | |||
Denbury Resources * (A) | 55,200 | 931 | |||
Devon Energy | 83,700 | 5,393 | |||
Diamond Offshore Drilling (A) | 25,400 | 2,256 | |||
El Paso | 357,500 | 3,875 | |||
EOG Resources | 15,900 | 1,478 | |||
Exxon Mobil (A) | 1,409,200 | 94,388 | |||
FMC Technologies * | 40,100 | 2,592 | |||
Forest Oil * | 11,100 | 287 | |||
Frontline | 10,400 | 318 | |||
Halliburton | 111,000 | 3,344 | |||
Helix Energy Solutions Group * (A) | 149,100 | 1,943 | |||
Helmerich & Payne | 3,700 | 141 | |||
Hess | 62,700 | 3,922 | |||
Marathon Oil | 443,600 | 14,035 | |||
Massey Energy | 200 | 10 | |||
Murphy Oil | 127,800 | 7,181 | |||
Nabors Industries * (A) | 21,900 | 430 | |||
National Oilwell Varco | 158,600 | 6,436 | |||
Newfield Exploration * | 52,700 | 2,743 | |||
Noble | 61,300 | 2,563 | |||
Noble Energy | 17,900 | 1,307 | |||
Occidental Petroleum | 192,400 | 16,265 | |||
Oil States International * (A) | 66,100 | 2,997 | |||
Patterson-UTI Energy (A) | 233,400 | 3,261 | |||
Pioneer Natural Resources | 6,600 | 372 | |||
Plains Exploration & Production * | 17,900 | 537 | |||
Pride International * | 11,600 | 349 | |||
Range Resources (A) | 25,000 | 1,172 | |||
Rowan * (A) | 105,600 | 3,074 | |||
SandRidge Energy * (A) | 48,300 | 372 | |||
Schlumberger (A) | 134,500 | 8,535 | |||
SEACOR Holdings * | 2,400 | 194 | |||
Smith International | 12,100 | 518 | |||
Spectra Energy | 28,300 | 638 | |||
St. Mary Land & Exploration | 14,900 | 519 | |||
Sunoco (A) | 99,600 | 2,959 | |||
Superior Energy Services * | 2,400 | 50 | |||
Tesoro (A) | 102,000 | 1,418 | |||
Tidewater (A) | 58,300 | 2,756 | |||
Unit * | 24,400 | 1,032 | |||
| Description | Shares | Market Value ($ Thousands) | |||
Valero Energy | 133,800 | $ | 2,636 | ||
Williams | 239,000 | 5,521 | |||
XTO Energy | 44,900 | 2,118 | |||
| 322,209 | |||||
Financials — 23.5% | |||||
Aflac | 53,300 | 2,894 | |||
Alexandria Real Estate Equities † (A) | 2,600 | 176 | |||
Allied World Assurance Holdings | 10,300 | 462 | |||
Allstate | 381,400 | 12,323 | |||
AMB Property † | 16,700 | 455 | |||
American Express | 151,400 | 6,247 | |||
American Financial Group | 134,500 | 3,827 | |||
American International Group * (A) | 46,400 | 1,584 | |||
AmeriCredit * (A) | 22,400 | 532 | |||
Ameriprise Financial | 194,200 | 8,809 | |||
Annaly Capital Management † | 211,500 | 3,633 | |||
Apartment Investment & Management, Cl A † (A) | 149,800 | 2,758 | |||
Arthur J. Gallagher | 5,100 | 125 | |||
Associated Banc-Corp (A) | 27,800 | 384 | |||
Assurant | 155,500 | 5,346 | |||
AvalonBay Communities † (A) | 2,088 | 180 | |||
Axis Capital Holdings | 74,700 | 2,335 | |||
Bank of America | 2,267,569 | 40,476 | |||
Bank of Hawaii | 7,000 | 315 | |||
Bank of New York Mellon | 228,422 | 7,054 | |||
BB&T (A) | 98,400 | 3,187 | |||
BlackRock | 6,800 | 1,481 | |||
Boston Properties † (A) | 9,600 | 724 | |||
Brandywine Realty Trust † | 39,600 | 483 | |||
BRE Properties, Cl A † (A) | 5,500 | 197 | |||
Brookfield Asset Management, Cl A | 128,300 | 3,261 | |||
Camden Property Trust † | 19,400 | 808 | |||
Capital One Financial (A) | 42,600 | 1,764 | |||
Chimera Investment † | 153,300 | 596 | |||
Chubb (A) | 184,800 | 9,582 | |||
Citigroup * (A) | 3,428,700 | 13,886 | |||
City National (A) | 4,500 | 243 | |||
CME Group | 15,000 | 4,742 | |||
Comerica (A) | 163,700 | 6,227 | |||
Credicorp | 48,500 | 4,277 | |||
Cullen/Frost Bankers | 2,400 | 134 | |||
Discover Financial Services | 156,200 | 2,327 | |||
Douglas Emmett † (A) | 21,500 | 330 | |||
Duke Realty † | 19,000 | 236 | |||
Endurance Specialty Holdings (A) | 165,400 | 6,145 | |||
Equity Residential † | 3,600 | 141 | |||
Essex Property Trust † (A) | 4,100 | 369 | |||
Everest Re Group | 32,300 | 2,614 | |||
Federal Realty Investment Trust † (A) | 1,000 | 73 | |||
Fidelity National Financial, Cl A | 9,000 | 133 | |||
Fifth Third Bancorp | 132,200 | 1,797 | |||
First American | 34,400 | 1,164 | |||
First Horizon National * (A) | 25,184 | 354 | |||
| 2 | SEI Institutional Managed Trust / Semi-Annual Report / March 31, 2010 |
Table of Contents
Schedule of Investments (Unaudited)
Large Cap Value Fund
March 31, 2010
| Description | Shares | Market Value ($ Thousands) | |||
Forest City Enterprises, Cl A * | 4,200 | $ | 60 | ||
Franklin Resources (A) | 74,300 | 8,240 | |||
Fulton Financial | 32,100 | 327 | |||
Genworth Financial, Cl A * | 37,900 | 695 | |||
Goldman Sachs Group | 149,100 | 25,441 | |||
Hartford Financial Services Group | 94,700 | 2,691 | |||
HCC Insurance Holdings | 1,200 | 33 | |||
HCP † (A) | 15,800 | 521 | |||
Hospitality Properties Trust † | 122,900 | 2,943 | |||
Host Hotels & Resorts † (A) | 46,145 | 676 | |||
HRPT Properties Trust † (A) | 438,400 | 3,411 | |||
Hudson City Bancorp | 293,000 | 4,149 | |||
Huntington Bancshares | 770,900 | 4,140 | |||
Invesco | 80,900 | 1,773 | |||
Jefferies Group (A) | 16,200 | 383 | |||
Jones Lang LaSalle | 44,500 | 3,244 | |||
JPMorgan Chase | 1,170,000 | 52,358 | |||
Keycorp (A) | 391,000 | 3,030 | |||
Legg Mason (A) | 23,300 | 668 | |||
Leucadia National * (A) | 32,700 | 811 | |||
Liberty Property Trust † (A) | 41,000 | 1,391 | |||
Lincoln National (A) | 150,667 | 4,625 | |||
Loews | 104,700 | 3,903 | |||
M&T Bank (A) | 19,900 | 1,580 | |||
Macerich † (A) | 2,757 | 106 | |||
Mack-Cali Realty † | 4,700 | 166 | |||
Marsh & McLennan | 18,500 | 452 | |||
Marshall & Ilsley | 230,200 | 1,853 | |||
Mercury General (A) | 44,000 | 1,924 | |||
MetLife | 54,800 | 2,375 | |||
Morgan Stanley | 330,700 | 9,686 | |||
Nationwide Health Properties † | 4,100 | 144 | |||
NYSE Euronext | 223,700 | 6,624 | |||
PNC Financial Services Group (A) | 179,055 | 10,689 | |||
Progressive | 226,100 | 4,316 | |||
Protective Life (A) | 37,400 | 822 | |||
Prudential Financial | 107,400 | 6,498 | |||
Raymond James Financial (A) | 47,300 | 1,265 | |||
Rayonier † (A) | 5,000 | 227 | |||
Regency Centers † (A) | 4,500 | 169 | |||
Regions Financial (A) | 423,084 | 3,321 | |||
Senior Housing Properties Trust † | 121,200 | 2,685 | |||
Simon Property Group † (A) | 17,411 | 1,461 | |||
SL Green Realty † (A) | 8,400 | 481 | |||
SLM * | 146,700 | 1,837 | |||
StanCorp Financial Group | 11,700 | 557 | |||
State Street | 61,500 | 2,776 | |||
Sunstone Hotel Investors * † | 104,912 | 1,172 | |||
SunTrust Banks (A) | 51,800 | 1,388 | |||
T. Rowe Price Group (A) | 80,000 | 4,394 | |||
Taubman Centers † (A) | 108,000 | 4,311 | |||
TCF Financial (A) | 29,100 | 464 | |||
Torchmark | 12,500 | 669 | |||
Transatlantic Holdings | 23,500 | 1,241 | |||
Travelers | 299,900 | 16,177 | |||
UDR † (A) | 39,400 | 695 | |||
Unum Group | 212,300 | 5,259 | |||
US Bancorp | 456,300 | 11,809 | |||
Validus Holdings | 1,100 | 30 | |||
| Description | Shares | Market Value ($ Thousands) | |||
Ventas † (A) | 10,300 | $ | 489 | ||
Vornado Realty Trust † | 2,400 | 182 | |||
Washington Federal | 17,400 | 353 | |||
Wells Fargo | 1,140,595 | 35,495 | |||
White Mountains Insurance Group | 2,900 | 1,030 | |||
XL Capital, Cl A (A) | 57,400 | 1,085 | |||
Zions Bancorporation (A) | 88,700 | 1,935 | |||
| 442,895 | |||||
Health Care — 9.6% | |||||
Abbott Laboratories | 32,300 | 1,702 | |||
Aetna | 88,100 | 3,093 | |||
AmerisourceBergen | 221,200 | 6,397 | |||
Amgen * | 83,300 | 4,978 | |||
Boston Scientific * | 218,600 | 1,578 | |||
Bristol-Myers Squibb | 116,700 | 3,116 | |||
Cardinal Health | 4,300 | 155 | |||
CareFusion * | 5,400 | 143 | |||
Charles River Laboratories International * (A) | 17,600 | 692 | |||
Cigna | 131,600 | 4,814 | |||
Community Health Systems * | 16,200 | 598 | |||
Cooper (A) | 14,100 | 548 | |||
Coventry Health Care * | 172,300 | 4,259 | |||
Eli Lilly (A) | 238,900 | 8,653 | |||
Endo Pharmaceuticals Holdings * | 88,100 | 2,087 | |||
Forest Laboratories * | 206,000 | 6,460 | |||
Health Net * | 61,100 | 1,520 | |||
Hill-Rom Holdings | 29,200 | 795 | |||
Hologic * (A) | 38,000 | 705 | |||
Humana * | 79,200 | 3,704 | |||
Inverness Medical Innovations * (A) | 6,800 | 265 | |||
Johnson & Johnson | 272,400 | 17,761 | |||
Kinetic Concepts * (A) | 63,400 | 3,031 | |||
King Pharmaceuticals * (A) | 301,700 | 3,548 | |||
Life Technologies * | 17,400 | 909 | |||
LifePoint Hospitals * | 1,200 | 44 | |||
Lincare Holdings * | 3,700 | 166 | |||
McKesson | 19,900 | 1,308 | |||
Mednax * | 27,400 | 1,594 | |||
Medtronic | 32,500 | 1,463 | |||
Merck | 449,857 | 16,802 | |||
Mylan Laboratories * (A) | 28,900 | 656 | |||
PerkinElmer | 52,700 | 1,260 | |||
Pfizer | 2,464,622 | 42,268 | |||
Tenet Healthcare * | 26,900 | 154 | |||
Thermo Fisher Scientific * | 15,300 | 787 | |||
UnitedHealth Group | 361,300 | 11,804 | |||
Universal Health Services, Cl B | 49,600 | 1,741 | |||
Watson Pharmaceuticals * (A) | 10,900 | 455 | |||
WellPoint * | 213,000 | 13,713 | |||
Zimmer Holdings * | 72,200 | 4,274 | |||
| 180,000 | |||||
Industrials — 9.8% | |||||
AGCO * (A) | 9,700 | 348 | |||
Alexander & Baldwin (A) | 20,100 | 664 | |||
Avery Dennison | 11,900 | 433 | |||
BE Aerospace * | 2,300 | 70 | |||
Boeing | 139,400 | 10,122 | |||
| 3 | SEI Institutional Managed Trust / Semi-Annual Report / March 31, 2010 |
Table of Contents
Schedule of Investments (Unaudited)
Large Cap Value Fund
March 31, 2010
| Description | Shares | Market Value ($ Thousands) | |||
Canadian National Railway | 46,000 | $ | 2,787 | ||
Carlisle | 14,100 | 537 | |||
Caterpillar (A) | 26,200 | 1,647 | |||
Con-way (A) | 26,200 | 920 | |||
Corrections Corp of America * (A) | 71,700 | 1,424 | |||
Crane | 12,300 | 437 | |||
CSX | 31,300 | 1,593 | |||
Cummins | 49,100 | 3,042 | |||
Deere | 43,300 | 2,574 | |||
Dover | 59,800 | 2,796 | |||
Eaton | 12,500 | 947 | |||
EMCOR Group * | 66,900 | 1,648 | |||
Equifax | 4,200 | 151 | |||
FedEx | 43,300 | 4,044 | |||
Gardner Denver | 79,700 | 3,510 | |||
GATX | 4,500 | 129 | |||
General Cable * | 1,500 | 41 | |||
General Dynamics | 133,700 | 10,321 | |||
General Electric | 2,912,600 | 53,010 | |||
Graco | 5,500 | 176 | |||
Harsco | 68,400 | 2,185 | |||
Hertz Global Holdings * (A) | 23,900 | 239 | |||
Honeywell International (A) | 41,900 | 1,897 | |||
Illinois Tool Works | 120,300 | 5,697 | |||
ITT | 7,000 | 375 | |||
Joy Global | 1,600 | 90 | |||
Kansas City Southern * (A) | 30,600 | 1,107 | |||
KBR | 197,500 | 4,377 | |||
Kirby * (A) | 22,500 | 859 | |||
L-3 Communications Holdings | 44,300 | 4,059 | |||
Lockheed Martin | 20,100 | 1,673 | |||
Manpower | 60,700 | 3,467 | |||
Masco | 41,600 | 646 | |||
Monster Worldwide * (A) | 34,700 | 577 | |||
Norfolk Southern | 52,700 | 2,945 | |||
Northrop Grumman | 189,000 | 12,393 | |||
Oshkosh Truck | 12,900 | 520 | |||
Owens Corning * | 5,200 | 132 | |||
PACCAR | 3,200 | 139 | |||
Parker Hannifin | 15,200 | 984 | |||
Quanta Services * | 19,600 | 375 | |||
Raytheon | 111,400 | 6,363 | |||
Republic Services | 10,100 | 293 | |||
Rockwell Automation (A) | 46,200 | 2,604 | |||
RR Donnelley & Sons | 408,400 | 8,719 | |||
Ryder System | 8,300 | 322 | |||
Southwest Airlines | 32,600 | 431 | |||
Spirit Aerosystems Holdings, Cl A * | 23,500 | 549 | |||
SPX (A) | 8,200 | 544 | |||
Teleflex | 2,500 | 160 | |||
Terex * | 2,600 | 59 | |||
Textron (A) | 35,000 | 743 | |||
Thomas & Betts * (A) | 20,600 | 808 | |||
Timken | 5,900 | 177 | |||
Trinity Industries | 6,800 | 136 | |||
Tyco International | 132,600 | 5,072 | |||
Union Pacific | 44,000 | 3,225 | |||
United Parcel Service, Cl B | 43,300 | 2,789 | |||
United Technologies | 39,800 | 2,930 | |||
URS * | 4,300 | 213 | |||
| Description | Shares | Market Value ($ Thousands) | |||
WESCO International * | 5,200 | $ | 180 | ||
| 184,424 | |||||
Information Technology — 5.9% | |||||
Activision Blizzard | 42,700 | 515 | |||
Advanced Micro Devices * | 28,800 | 267 | |||
Amdocs * | 86,200 | 2,595 | |||
AOL * | 19,239 | 486 | |||
Applied Materials | 210,600 | 2,839 | |||
Arrow Electronics * | 41,200 | 1,241 | |||
Autodesk * | 16,400 | 483 | |||
Avnet * | 148,900 | 4,467 | |||
Broadridge Financial Solutions | 9,400 | 201 | |||
Brocade Communications Systems * | 88,300 | 504 | |||
CA | 4,300 | 101 | |||
CommScope * | 7,800 | 218 | |||
Computer Sciences * | 69,000 | 3,760 | |||
Corning | 41,500 | 839 | |||
Diebold | 4,900 | 156 | |||
eBay * | 175,600 | 4,732 | |||
EMC * | 80,200 | 1,447 | |||
Fairchild Semiconductor International * | 13,300 | 142 | |||
Fidelity National Information Services | 50,800 | 1,191 | |||
Harris | 124,800 | 5,927 | |||
Hewlett-Packard | 226,700 | 12,049 | |||
IAC * | 4,200 | 96 | |||
Ingram Micro, Cl A * | 128,600 | 2,257 | |||
Intel | 650,500 | 14,480 | |||
International Business Machines | 10,000 | 1,282 | |||
Intersil, Cl A (A) | 46,900 | 692 | |||
Itron * | 1,900 | 138 | |||
Jabil Circuit | 5,400 | 88 | |||
JDS Uniphase * | 11,800 | 148 | |||
Kla-Tencor | 85,100 | 2,631 | |||
Lexmark International, Cl A * | 19,700 | 711 | |||
LSI Logic * | 138,200 | 846 | |||
Marvell Technology Group * | 26,900 | 548 | |||
Maxim Integrated Products (A) | 37,900 | 735 | |||
Microchip Technology (A) | 12,100 | 341 | |||
Micron Technology * (A) | 179,000 | 1,860 | |||
Molex (A) | 26,700 | 557 | |||
Motorola * | 267,200 | 1,876 | |||
NCR * | 119,700 | 1,652 | |||
NeuStar, Cl A * | 80,500 | 2,028 | |||
Novell * | 68,800 | 412 | |||
Novellus Systems * (A) | 21,100 | 527 | |||
PMC - Sierra * | 83,900 | 748 | |||
Rovi * (A) | 23,700 | 880 | |||
Seagate Technology (A) | 295,700 | 5,399 | |||
Symantec * | 132,800 | 2,247 | |||
Synopsys * (A) | 2,800 | 63 | |||
Tech Data * (A) | 98,000 | 4,106 | |||
Tellabs | 70,600 | 534 | |||
Teradata * | 29,600 | 855 | |||
Texas Instruments | 206,500 | 5,053 | |||
Total System Services (A) | 27,000 | 423 | |||
Vishay Intertechnology * | 319,200 | 3,265 | |||
Western Digital * | 73,600 | 2,870 | |||
| 4 | SEI Institutional Managed Trust / Semi-Annual Report / March 31, 2010 |
Table of Contents
Schedule of Investments (Unaudited)
Large Cap Value Fund
March 31, 2010
| Description | Shares | Market Value ($ Thousands) | |||
Xerox | 487,009 | $ | 4,749 | ||
Yahoo! * | 59,100 | 977 | |||
Zebra Technologies, Cl A * | 4,400 | 130 | |||
| 110,364 | |||||
Materials — 3.7% | |||||
Air Products & Chemicals | 44,700 | 3,305 | |||
Airgas | 2,400 | 153 | |||
Albemarle | 36,200 | 1,543 | |||
Alcoa (A) | 131,300 | 1,870 | |||
Allegheny Technologies (A) | 1,700 | 92 | |||
Aptargroup | 1,200 | 47 | |||
Ashland | 4,800 | 253 | |||
Ball (A) | 48,500 | 2,589 | |||
Bemis | 6,100 | 175 | |||
Cabot | 24,600 | 748 | |||
CF Industries Holdings (A) | 4,400 | 401 | |||
Compass Minerals International (A) | 4,000 | 321 | |||
Cytec Industries | 17,300 | 809 | |||
Dow Chemical | 14,300 | 423 | |||
E.I. Du Pont de Nemours | 180,700 | 6,729 | |||
Eastman Chemical | 150,500 | 9,584 | |||
Freeport-McMoRan Copper & Gold, Cl B | 6,455 | 539 | |||
Greif, Cl A | 27,400 | 1,505 | |||
Huntsman | 87,700 | 1,057 | |||
International Paper (A) | 131,600 | 3,239 | |||
Lubrizol | 86,200 | 7,906 | |||
MeadWestvaco | 119,400 | 3,051 | |||
Nucor (A) | 78,900 | 3,580 | |||
Owens-Illinois * | 69,500 | 2,470 | |||
Packaging Corp of America | 10,800 | 266 | |||
PPG Industries | 33,900 | 2,217 | |||
Reliance Steel & Aluminum | 3,600 | 177 | |||
Rock-Tenn, Cl A (A) | 46,750 | 2,130 | |||
RPM International (A) | 51,800 | 1,105 | |||
Sealed Air | 69,700 | 1,469 | |||
Sonoco Products | 172,900 | 5,324 | |||
Southern Copper (A) | 123,600 | 3,914 | |||
Steel Dynamics | 1,300 | 23 | |||
Temple-Inland | 11,100 | 227 | |||
Terra Industries | 10,700 | 490 | |||
United States Steel (A) | 1,100 | 70 | |||
Valspar | 12,300 | 363 | |||
Vulcan Materials | 1,400 | 66 | |||
Weyerhaeuser (A) | 7,500 | 339 | |||
| 70,569 | |||||
Telecommunication Services — 5.7% | |||||
AT&T | 2,337,395 | 60,398 | |||
CenturyTel (A) | 138,687 | 4,918 | |||
Crown Castle International * | 57,500 | 2,198 | |||
NII Holdings * | 90,900 | 3,787 | |||
Qwest Communications International | 49,300 | 257 | |||
Sprint Nextel * | 762,400 | 2,897 | |||
Telephone & Data Systems | 91,800 | 3,108 | |||
Verizon Communications (A) | 955,500 | 29,640 | |||
| 107,203 | |||||
Utilities — 5.6% | |||||
AES * | 133,000 | 1,463 | |||
| Description | Shares | Market Value ($ Thousands) | |||
AGL Resources | 67,900 | $ | 2,624 | ||
Alliant Energy | 163,200 | 5,428 | |||
Ameren | 79,400 | 2,071 | |||
American Electric Power | 162,500 | 5,554 | |||
American Water Works | 44,600 | 971 | |||
Atmos Energy | 1,800 | 51 | |||
Calpine * | 57,100 | 679 | |||
CMS Energy (A) | 240,000 | 3,710 | |||
Constellation Energy Group | 22,900 | 804 | |||
DPL | 6,700 | 182 | |||
DTE Energy | 196,800 | 8,777 | |||
Edison International | 170,900 | 5,840 | |||
Energen | 156,800 | 7,296 | |||
Entergy | 42,400 | 3,449 | |||
Exelon | 134,900 | 5,910 | |||
FirstEnergy | 71,200 | 2,783 | |||
FPL Group | 65,300 | 3,156 | |||
Great Plains Energy | 10,300 | 191 | |||
Hawaiian Electric Industries | 11,200 | 252 | |||
Integrys Energy Group | 6,300 | 299 | |||
MDU Resources Group | 36,000 | 777 | |||
Mirant * | 384,200 | 4,172 | |||
National Fuel Gas | 30,200 | 1,526 | |||
NiSource (A) | 56,600 | 894 | |||
NRG Energy * | 56,000 | 1,170 | |||
NV Energy | 237,500 | 2,928 | |||
OGE Energy | 6,100 | 238 | |||
Oneok | 12,500 | 571 | |||
Pepco Holdings (A) | 156,600 | 2,686 | |||
PG&E (A) | 129,100 | 5,476 | |||
Pinnacle West Capital | 73,900 | 2,788 | |||
Public Service Enterprise Group | 167,000 | 4,930 | |||
Questar | 29,900 | 1,292 | |||
RRI Energy * | 32,700 | 121 | |||
Sempra Energy | 100,400 | 5,010 | |||
Southern Union | 320,800 | 8,139 | |||
TECO Energy (A) | 47,700 | 758 | |||
Xcel Energy | 3,100 | 66 | |||
| 105,032 | |||||
Total Common Stock | 1,822,495 | ||||
AFFILIATED PARTNERSHIP — 8.1% | |||||
SEI Liquidity Fund, L.P., | |||||
0.210% (B)**†† | 157,054,366 | 151,767 | |||
Total Affiliated Partnership | 151,767 | ||||
CASH EQUIVALENT — 1.7% | |||||
SEI Daily Income Trust, Prime | 32,279,797 | 32,280 | |||
Total Cash Equivalent | 32,280 | ||||
| 5 | SEI Institutional Managed Trust / Semi-Annual Report / March 31, 2010 |
Table of Contents
Schedule of Investments (Unaudited)
Large Cap Value Fund
March 31, 2010
| Description | Face Amount ($ Thousands) | Market Value ($ Thousands) | ||||
U.S. TREASURY OBLIGATION (C) (D) — 0.3% | ||||||
U.S. Treasury Bills | ||||||
0.117%, 06/03/10 | $ | 5,645 | $ | 5,643 | ||
Total U.S. Treasury Obligation | 5,643 | |||||
Total Investments — 106.9% | $ | 2,012,185 | ||||
A summary of the open futures contracts held by the Fund at March 31, 2010, is as follows:
| Type of Contract | Number of Contracts Long (Short) | Expiration Date | Unrealized Appreciation ($ Thousands) | ||||
S&P 500 Composite Index | 204 | Jun-2010 | $ | 561 | |||
For the period ended March 31, 2010 , the total amount of all open futures contracts, as presented in the table above, are representative of the volume of activity for this derivative type during the period.
Percentages are based on Net Assets of $1,882,657 ($ Thousands).
| * | Non-income producing security. |
| ** | Rate shown is the 7-day effective yield as of March 31, 2010. |
| † | Real Estate Investment Trust. |
| †† | Investment in Affiliated Security. |
| (A) | This security or a partial position of this security is on loan at March 31, 2010. The total market value of securities on loan at March 31, 2010 was $151,940 ($ Thousands). |
| (B) | This security was purchased with cash collateral received from securities on loan. The total value of such securities as of March 31, 2010 was $151,767 ($ Thousands). |
| (C) | The rate reported is the effective yield at the time of purchase. |
| (D) | Security, or portion thereof, has been pledged as collateral on open futures. |
Cl — Class
L.P. — Limited Partnership
Ser — Series
| 6 | SEI Institutional Managed Trust / Semi-Annual Report / March 31, 2010 |
Table of Contents
Schedule of Investments (Unaudited)
Large Cap Growth Fund
March 31, 2010
| Description | Shares | Market Value ($ Thousands) | |||
COMMON STOCK — 93.9% ‡ | |||||
Consumer Discretionary — 10.7% | |||||
99 Cents Only Stores * | 23,100 | $ | 377 | ||
Abercrombie & Fitch, Cl A | 5,900 | 269 | |||
Advance Auto Parts | 14,300 | 599 | |||
Aeropostale * | 8,050 | 232 | |||
Amazon.com * | 153,335 | 20,812 | |||
American Eagle Outfitters | 34,300 | 635 | |||
American Greetings, Cl A | 27,900 | 581 | |||
AnnTaylor Stores * | 6,000 | 124 | |||
Autonation * | 7,000 | 127 | |||
Autozone * | 4,969 | 860 | |||
Bed Bath & Beyond * (A) | 54,860 | 2,401 | |||
Best Buy | 43,800 | 1,863 | |||
Big 5 Sporting Goods | 3,600 | 55 | |||
BorgWarner * | 4,800 | 183 | |||
Brink’s Home Security Holdings * | 20,800 | 885 | |||
Career Education * | 31,200 | 987 | |||
Carmax * | 41,400 | 1,040 | |||
Chico’s FAS | 216,700 | 3,125 | |||
Chipotle Mexican Grill, Cl A * | 7,200 | 811 | |||
Coach (A) | 210,645 | 8,325 | |||
Comcast, Cl A | 74,514 | 1,402 | |||
Cooper Tire & Rubber | 27,900 | 531 | |||
Core-Mark Holding * | 7,200 | 220 | |||
Darden Restaurants | 6,500 | 290 | |||
Deckers Outdoor * | 400 | 55 | |||
DeVry | 20,200 | 1,317 | |||
Dick’s Sporting Goods * | 13,500 | 353 | |||
DIRECTV, Cl A * | 135,714 | 4,589 | |||
Discovery Communications, Cl C * | 77,300 | 2,273 | |||
Dollar Tree * | 35,000 | 2,073 | |||
Education Management * | 25,900 | 567 | |||
Expedia | 35,400 | 883 | |||
Family Dollar Stores | 1,100 | 40 | |||
Gap | 79,000 | 1,826 | |||
Garmin | 7,200 | 277 | |||
Gentex | 46,000 | 894 | |||
Guess? | 1,500 | 71 | |||
H&R Block | 16,100 | 287 | |||
Harman International Industries | 10,300 | 482 | |||
Helen of Troy * | 7,400 | 193 | |||
Hillenbrand | 3,800 | 84 | |||
Home Depot | 8,200 | 265 | |||
International Game Technology | 35,700 | 659 | |||
John Wiley & Sons, Cl A | 2,100 | 91 | |||
Johnson Controls | 238,492 | 7,868 | |||
Kohl’s * | 37,600 | 2,060 | |||
Leggett & Platt | 74,900 | 1,621 | |||
Limited Brands | 18,700 | 460 | |||
LKQ * | 33,900 | 688 | |||
Lowe’s | 682,634 | 16,547 | |||
Macy’s | 5,300 | 115 | |||
Maidenform Brands * | 12,500 | 273 | |||
Marriott International, Cl A | 12,217 | 385 | |||
Mattel | 7,900 | 180 | |||
McDonald’s | 181,560 | 12,114 | |||
McGraw-Hill | 52,500 | 1,872 | |||
| Description | Shares | Market Value ($ Thousands) | |||
MGM Mirage * | 2,700 | $ | 32 | ||
Monro Muffler | 2,200 | 79 | |||
NetFlix * | 1,500 | 111 | |||
Newell Rubbermaid | 43,400 | 660 | |||
Nike, Cl B (A) | 244,660 | 17,983 | |||
Nordstrom | 1,000 | 41 | |||
NVR * | 300 | 218 | |||
Omnicom Group | 26,600 | 1,032 | |||
O’Reilly Automotive * | 39,700 | 1,656 | |||
Oxford Industries | 10,200 | 207 | |||
PetSmart | 11,200 | 358 | |||
Phillips-Van Heusen | 21,100 | 1,210 | |||
Polo Ralph Lauren | 12,700 | 1,080 | |||
priceline.com * (A) | 40,400 | 10,302 | |||
RadioShack | 4,600 | 104 | |||
Ross Stores | 81,500 | 4,358 | |||
Scripps Networks Interactive, Cl A | 28,500 | 1,264 | |||
Sherwin-Williams | 1,100 | 74 | |||
Skechers U.S.A., Cl A * | 11,700 | 425 | |||
Snap-On | 2,200 | 95 | |||
Staples (A) | 785,571 | 18,375 | |||
Starbucks | 102,400 | 2,485 | |||
Stein Mart * | 4,600 | 42 | |||
Strayer Education | 400 | 97 | |||
Superior Industries International | 4,000 | 64 | |||
Target | 380,955 | 20,038 | |||
Tempur-Pedic International * | 31,100 | 938 | |||
Texas Roadhouse, Cl A * | 33,100 | 460 | |||
Thor Industries | 28,500 | 861 | |||
Tiffany | 23,800 | 1,130 | |||
Time Warner | 140,056 | 4,380 | |||
TJX | 82,300 | 3,499 | |||
TRW Automotive Holdings * | 51,200 | 1,463 | |||
Universal Technical Institute * | 3,600 | 82 | |||
Urban Outfitters * | 29,300 | 1,114 | |||
VF | 16,900 | 1,355 | |||
Viacom, Cl B * | 82,903 | 2,850 | |||
WABCO Holdings | 8,600 | 257 | |||
Williams-Sonoma | 2,700 | 71 | |||
WMS Industries * | 21,700 | 910 | |||
Wyndham Worldwide | 3,200 | 82 | |||
Yum! Brands | 121,500 | 4,657 | |||
| 214,695 | |||||
Consumer Staples — 12.7% | |||||
Altria Group | 99,640 | 2,044 | |||
Archer-Daniels-Midland | 112,700 | 3,257 | |||
Avon Products | 172,052 | 5,827 | |||
BJ’s Wholesale Club * | 2,600 | 96 | |||
Brown-Forman, Cl B | 1,600 | 95 | |||
Campbell Soup | 11,000 | 389 | |||
Clorox | 11,900 | 763 | |||
Coca-Cola | 520,483 | 28,626 | |||
Coca-Cola Enterprises | 120,200 | 3,325 | |||
Colgate-Palmolive (A) | 148,774 | 12,685 | |||
Costco Wholesale (A) | 201,870 | 12,054 | |||
CVS Caremark | 46,031 | 1,683 | |||
Dean Foods * | 40,900 | 642 | |||
Diageo ADR (A) | 94,570 | 6,379 | |||
Estee Lauder, Cl A | 16,100 | 1,044 | |||
| 1 | SEI Institutional Managed Trust / Semi-Annual Report / March 31, 2010 |
Table of Contents
Schedule of Investments (Unaudited)
Large Cap Growth Fund
March 31, 2010
| Description | Shares | Market Value ($ Thousands) | |||
Flowers Foods | 4,700 | $ | 116 | ||
General Mills | 14,600 | 1,034 | |||
Green Mountain Coffee Roasters * | 12,500 | 1,210 | |||
Hansen Natural * | 1,500 | 65 | |||
Herbalife | 17,500 | 807 | |||
Hershey | 8,400 | 360 | |||
HJ Heinz | 7,100 | 324 | |||
Kellogg | 34,800 | 1,859 | |||
Kimberly-Clark | 11,800 | 742 | |||
Kraft Foods, Cl A | 111,590 | 3,374 | |||
Kroger | 5,900 | 128 | |||
Lorillard | 25,900 | 1,949 | |||
McCormick | 2,300 | 88 | |||
Mead Johnson Nutrition, Cl A | 149,320 | 7,769 | |||
Medifast * | 55,100 | 1,385 | |||
Molson Coors Brewing, Cl B | 4,300 | 181 | |||
NBTY * | 21,100 | 1,012 | |||
Nu Skin Enterprises, Cl A | 7,900 | 230 | |||
PepsiCo | 633,439 | 41,908 | |||
Philip Morris International | 412,090 | 21,495 | |||
Procter & Gamble | 729,793 | 46,174 | |||
Reynolds American | 5,600 | 302 | |||
Sara Lee | 45,300 | 631 | |||
SYSCO | 400 | 12 | |||
USANA Health Sciences * | 6,700 | 211 | |||
Walgreen | 392,252 | 14,549 | |||
Wal-Mart Stores | 485,710 | 27,005 | |||
Whole Foods Market * | 25,700 | 929 | |||
| 254,758 | |||||
Energy — 4.2% | |||||
Cameron International * | 15,652 | 671 | |||
Canadian Natural Resources | 88,542 | 6,556 | |||
Denbury Resources * (A) | 132,242 | 2,231 | |||
Diamond Offshore Drilling | 5,500 | 488 | |||
Dresser-Rand Group * | 11,100 | 349 | |||
El Paso | 10,000 | 108 | |||
EOG Resources | 82,300 | 7,649 | |||
Exxon Mobil | 151,900 | 10,174 | |||
FMC Technologies * | 6,900 | 446 | |||
Halliburton | 312,240 | 9,408 | |||
Occidental Petroleum | 105,331 | 8,905 | |||
Oceaneering International * | 7,100 | 451 | |||
Peabody Energy | 8,600 | 393 | |||
Pride International * | 6,200 | 187 | |||
Range Resources (A) | 91,499 | 4,289 | |||
Schlumberger (A) | 273,011 | 17,325 | |||
Southwestern Energy * | 179,703 | 7,317 | |||
Suncor Energy | 79,388 | 2,583 | |||
Transocean * | 49,100 | 4,241 | |||
Unit * | 3,900 | 165 | |||
Williams | 16,500 | 381 | |||
| 84,317 | |||||
Financials — 5.1% | |||||
Affiliated Managers Group * | 4,900 | 387 | |||
Aflac | 91,634 | 4,975 | |||
Alexandria Real Estate Equities † | 1,700 | 115 | |||
American Express | 344,012 | 14,194 | |||
American International Group * | 11,600 | 396 | |||
AmeriCredit * | 3,300 | 78 | |||
| Description | Shares | Market Value ($ Thousands) | |||
Ameriprise Financial | 16,700 | $ | 758 | ||
Arthur J. Gallagher | 4,400 | 108 | |||
Axis Capital Holdings | 4,000 | 125 | |||
Bank of New York Mellon (A) | 243,501 | 7,519 | |||
BlackRock | 6,200 | 1,350 | |||
Capital One Financial | 7,800 | 323 | |||
CB Richard Ellis Group, Cl A * | 12,500 | 198 | |||
Charles Schwab (A) | 222,635 | 4,161 | |||
CME Group | 42,585 | 13,462 | |||
Endurance Specialty Holdings | 27,700 | 1,029 | |||
Federated Investors, Cl B | 3,200 | 84 | |||
Forestar Group * | 1,800 | 34 | |||
Franklin Resources | 18,500 | 2,052 | |||
Genworth Financial, Cl A * | 54,700 | 1,003 | |||
Goldman Sachs Group | 11,031 | 1,882 | |||
Greenhill | 300 | 25 | |||
Hartford Financial Services Group | 19,800 | 563 | |||
Health Care † | 2,200 | 99 | |||
Hudson City Bancorp | 83,500 | 1,182 | |||
IntercontinentalExchange * (A) | 72,200 | 8,099 | |||
Jefferies Group | 8,200 | 194 | |||
JPMorgan Chase | 213,718 | 9,564 | |||
Lincoln National | 17,400 | 534 | |||
Marsh & McLennan | 4,800 | 117 | |||
Morgan Stanley | 109,590 | 3,210 | |||
MSCI, Cl A * | 33,600 | 1,213 | |||
Nationwide Health Properties † | 2,900 | 102 | |||
Nelnet, Cl A | 22,600 | 419 | |||
Northern Trust (A) | 92,410 | 5,107 | |||
NYSE Euronext | 30,300 | 897 | |||
People’s United Financial | 175,170 | 2,740 | |||
Platinum Underwriters Holdings | 10,700 | 397 | |||
Principal Financial Group | 8,100 | 237 | |||
Prudential Financial | 60,700 | 3,672 | |||
Public Storage † | 1,000 | 92 | |||
Simon Property Group † | 2,800 | 235 | |||
SLM * | 138,300 | 1,732 | |||
St. Joe * | 2,800 | 91 | |||
State Street | 2,700 | 122 | |||
T. Rowe Price Group | 11,800 | 648 | |||
TD Ameritrade Holding * | 12,100 | 231 | |||
Waddell & Reed Financial, Cl A | 7,300 | 263 | |||
Wells Fargo | 169,400 | 5,272 | |||
WP Carey | 2,400 | 70 | |||
| 101,360 | |||||
Health Care — 16.2% | |||||
Abbott Laboratories | 300,070 | 15,808 | |||
Aetna | 132,166 | 4,640 | |||
Affymetrix * | 10,600 | 78 | |||
Alexion Pharmaceuticals * | 1,900 | 103 | |||
Allergan | 435,067 | 28,419 | |||
Allscripts Healthcare Solutions * | 80,100 | 1,567 | |||
AmerisourceBergen | 43,200 | 1,249 | |||
Amgen * | 246,039 | 14,703 | |||
Amylin Pharmaceuticals * | 6,400 | 144 | |||
Baxter International | 293,601 | 17,088 | |||
Beckman Coulter | 15,200 | 955 | |||
Becton Dickinson | 79,337 | 6,246 | |||
Biogen Idec * | 100,950 | 5,791 | |||
| 2 | SEI Institutional Managed Trust / Semi-Annual Report / March 31, 2010 |
Table of Contents
Schedule of Investments (Unaudited)
Large Cap Growth Fund
March 31, 2010
| Description | Shares | Market Value ($ Thousands) | |||
Bio-Rad Laboratories, Cl A * | 3,200 | $ | 331 | ||
Boston Scientific * | 35,000 | 253 | |||
Bristol-Myers Squibb | 219,000 | 5,847 | |||
Bruker BioSciences * | 51,800 | 759 | |||
C.R. Bard | 37,440 | 3,243 | |||
Celgene * | 13,260 | 822 | |||
Cerner * | 19,700 | 1,675 | |||
Charles River Laboratories International * | 23,100 | 908 | |||
Cigna | 8,500 | 311 | |||
Community Health Systems * | 17,300 | 639 | |||
Covance * | 17,800 | 1,093 | |||
Coventry Health Care * | 19,700 | 487 | |||
Covidien | 119,135 | 5,990 | |||
DaVita * | 6,000 | 381 | |||
Dendreon * | 38,000 | 1,386 | |||
Dentsply International | 3,500 | 122 | |||
Edwards Lifesciences * | 12,100 | 1,196 | |||
Eli Lilly | 53,258 | 1,929 | |||
Express Scripts * | 52,350 | 5,327 | |||
Genzyme * | 140,100 | 7,261 | |||
Gilead Sciences * | 395,185 | 17,973 | |||
Health Management Associates, Cl A * | 70,500 | 606 | |||
Henry Schein * | 8,700 | 513 | |||
Hill-Rom Holdings | 13,200 | 359 | |||
Hospira * | 38,700 | 2,192 | |||
Humana * | 9,100 | 426 | |||
Idexx Laboratories * | 34,800 | 2,003 | |||
Intuitive Surgical * | 12,100 | 4,212 | |||
Invacare | 17,900 | 475 | |||
Inverness Medical Innovations * | 20,800 | 810 | |||
Johnson & Johnson | 528,362 | 34,449 | |||
Kinetic Concepts * | 10,900 | 521 | |||
Laboratory Corp of America Holdings * | 7,400 | 560 | |||
Life Technologies * | 56,500 | 2,953 | |||
Lincare Holdings * | 13,300 | 597 | |||
McKesson | 24,812 | 1,631 | |||
Medco Health Solutions * | 234,882 | 15,164 | |||
Medicines * | 14,000 | 110 | |||
Mednax * | 8,300 | 483 | |||
Medtronic | 285,200 | 12,843 | |||
Merck | 208,060 | 7,771 | |||
Meridian Bioscience | 27,600 | 562 | |||
Mettler Toledo International * | 23,600 | 2,577 | |||
Millipore * | 4,000 | 422 | |||
Mylan Laboratories * | 66,000 | 1,499 | |||
Novo Nordisk ADR (A) | 108,000 | 8,329 | |||
Par Pharmaceutical * | 30,000 | 744 | |||
Patterson | 35,300 | 1,096 | |||
PerkinElmer | 12,700 | 304 | |||
Perrigo | 12,400 | 728 | |||
Pfizer | 492,861 | 8,453 | |||
Quest Diagnostics | 43,800 | 2,553 | |||
Quidel * | 27,900 | 406 | |||
ResMed * | 11,200 | 713 | |||
St. Jude Medical * (A) | 260,383 | 10,689 | |||
STERIS | 10,400 | 350 | |||
Stryker (A) | 153,200 | 8,766 | |||
Tenet Healthcare * | 185,100 | 1,059 | |||
| Description | Shares | Market Value ($ Thousands) | |||
Teva Pharmaceutical Industries ADR (A) | 117,364 | $ | 7,403 | ||
Thermo Fisher Scientific * | 118,429 | 6,092 | |||
United Therapeutics * | 10,900 | 603 | |||
UnitedHealth Group | 360,341 | 11,772 | |||
Universal Health Services, Cl B | 2,800 | 98 | |||
Valeant Pharmaceuticals International * | 18,300 | 785 | |||
Varian Medical Systems * | 5,800 | 321 | |||
VCA Antech * | 3,000 | 84 | |||
Vertex Pharmaceuticals * | 14,900 | 609 | |||
Waters * | 17,000 | 1,148 | |||
WellPoint * | 32,700 | 2,105 | |||
| 323,672 | |||||
Industrials — 7.3% | |||||
3M | 155,746 | 13,016 | |||
Aecom Technology * | 5,200 | 147 | |||
Alliant Techsystems * | 11,200 | 911 | |||
Avery Dennison | 6,900 | 251 | |||
Boeing | 17,419 | 1,265 | |||
C.H. Robinson Worldwide | 3,166 | 177 | |||
Calgon Carbon * | 18,700 | 320 | |||
Carlisle | 9,400 | 358 | |||
Caterpillar | 12,300 | 773 | |||
Con-way | 5,000 | 176 | |||
Copa Holdings, Cl A | 13,900 | 845 | |||
Corrections Corp of America * | 7,600 | 151 | |||
Crane | 23,200 | 824 | |||
Cummins | 85,076 | 5,270 | |||
Danaher | 95,673 | 7,645 | |||
Deere | 900 | 54 | |||
Delta Air Lines * | 32,300 | 471 | |||
Dover | 45,900 | 2,146 | |||
Dun & Bradstreet | 700 | 52 | |||
DynCorp International, Cl A * | 21,400 | 246 | |||
Emerson Electric | 134,012 | 6,746 | |||
Ennis | 5,700 | 93 | |||
Expeditors International of Washington (A) | 301,700 | 11,139 | |||
First Solar * | 400 | 49 | |||
Flowserve | 2,000 | 221 | |||
Fluor | 4,000 | 186 | |||
Force Protection * | 16,500 | 99 | |||
General Dynamics | 11,600 | 896 | |||
Goodrich (A) | 92,800 | 6,544 | |||
Graco | 10,500 | 336 | |||
Harsco | 11,600 | 370 | |||
Herman Miller | 6,800 | 123 | |||
Honeywell International | 36,900 | 1,670 | |||
Hubbell, Cl B | 17,100 | 862 | |||
IHS, Cl A * | 3,400 | 182 | |||
Interline Brands * | 2,100 | 40 | |||
ITT | 19,100 | 1,024 | |||
JB Hunt Transport Services | 2,300 | 82 | |||
Joy Global | 22,800 | 1,290 | |||
Kennametal | 12,300 | 346 | |||
Kirby * | 2,500 | 95 | |||
Lennox International | 12,400 | 549 | |||
Lockheed Martin | 28,515 | 2,373 | |||
Masco | 500 | 8 | |||
Monster Worldwide * | 7,000 | 116 | |||
| 3 | SEI Institutional Managed Trust / Semi-Annual Report / March 31, 2010 |
Table of Contents
Schedule of Investments (Unaudited)
Large Cap Growth Fund
March 31, 2010
| Description | Shares | Market Value ($ Thousands) | |||
MSC Industrial Direct, Cl A | 5,700 | $ | 289 | ||
Mueller Industries | 2,600 | 70 | |||
NACCO Industries, Cl A | 700 | 52 | |||
Norfolk Southern | 11,500 | 643 | |||
Northrop Grumman | 28,948 | 1,898 | |||
Owens Corning * | 33,400 | 850 | |||
PACCAR | 1,050 | 46 | |||
Pall | 4,900 | 198 | |||
Parker Hannifin (A) | 95,661 | 6,193 | |||
Precision Castparts | 11,721 | 1,485 | |||
Quanta Services * | 256,000 | 4,905 | |||
Raytheon | 142,039 | 8,113 | |||
Republic Services | 40,000 | 1,161 | |||
Robert Half International | 2,300 | 70 | |||
Rockwell Automation | 10,000 | 564 | |||
Rockwell Collins | 98,928 | 6,192 | |||
RR Donnelley & Sons | 4,500 | 96 | |||
Shaw Group * | 1,300 | 45 | |||
Southwest Airlines | 59,200 | 783 | |||
Spirit Aerosystems Holdings, Cl A * | 7,100 | 166 | |||
Taser International * | 30,700 | 180 | |||
Teleflex | 4,200 | 269 | |||
Timken | 9,200 | 276 | |||
Toro | 6,200 | 305 | |||
TransDigm Group | 9,700 | 515 | |||
Union Pacific | 10,000 | 733 | |||
United Parcel Service, Cl B | 144,392 | 9,300 | |||
United Technologies | 336,493 | 24,769 | |||
Valmont Industries | 3,900 | 323 | |||
Verisk Analytics, Cl A * | 5,400 | 152 | |||
Waste Connections * | 3,500 | 119 | |||
Waste Management | 15,300 | 527 | |||
WESCO International * | 3,300 | 115 | |||
WW Grainger | 36,000 | 3,892 | |||
| 145,831 | |||||
Information Technology — 32.7% | |||||
Activision Blizzard | 15,500 | 187 | |||
Adobe Systems * | 346,179 | 12,244 | |||
Advanced Micro Devices * | 17,500 | 162 | |||
Agilent Technologies * | 84,800 | 2,916 | |||
Altera | 6,700 | 163 | |||
Amdocs * | 12,400 | 373 | |||
Amphenol, Cl A | 8,700 | 367 | |||
Analog Devices | 47,800 | 1,378 | |||
Ansys * | 9,200 | 397 | |||
Apple * | 340,071 | 79,893 | |||
Arris Group * | 40,400 | 485 | |||
Arrow Electronics * | 14,900 | 449 | |||
Autodesk * | 175,400 | 5,160 | |||
Automatic Data Processing | 11,900 | 529 | |||
Avnet * | 66,000 | 1,980 | |||
AVX | 6,400 | 91 | |||
BMC Software * | 61,300 | 2,329 | |||
Brightpoint * | 8,600 | 65 | |||
Broadcom, Cl A (A) | 313,640 | 10,407 | |||
Broadridge Financial Solutions | 28,900 | 618 | |||
Brocade Communications Systems * | 30,400 | 174 | |||
Cadence Design Systems * | 26,900 | 179 | |||
Cirrus Logic * | 51,700 | 434 | |||
| Description | Shares | Market Value ($ Thousands) | |||
Cisco Systems * | 2,029,772 | $ | 52,835 | ||
Citrix Systems * (A) | 144,519 | 6,860 | |||
Cognizant Technology Solutions, Cl A * | 50,000 | 2,549 | |||
Corning | 336,083 | 6,792 | |||
Cree * | 18,100 | 1,271 | |||
Cypress Semiconductor * | 48,900 | 562 | |||
Dell * | 122,929 | 1,845 | |||
Diebold | 15,700 | 499 | |||
Dolby Laboratories, Cl A * | 1,900 | 112 | |||
DST Systems | 16,300 | 676 | |||
eBay * | 331,588 | 8,936 | |||
EMC * | 911,736 | 16,448 | |||
Equinix * | 3,200 | 312 | |||
F5 Networks * | 30,400 | 1,870 | |||
Factset Research Systems | 14,200 | 1,042 | |||
Fidelity National Information Services | 100,285 | 2,351 | |||
Fiserv * | 11,600 | 589 | |||
Flir Systems * | 11,500 | 324 | |||
Global Payments | 14,800 | 674 | |||
Google, Cl A * | 92,269 | 52,317 | |||
Harris | 15,100 | 717 | |||
Hewitt Associates, Cl A * | 7,800 | 310 | |||
Hewlett-Packard | 500,660 | 26,610 | |||
IAC * | 47,600 | 1,082 | |||
Intel | 809,615 | 18,022 | |||
International Business Machines | 272,852 | 34,993 | |||
Intersil, Cl A | 37,800 | 558 | |||
Intuit * (A) | 343,400 | 11,792 | |||
Iron Mountain | 8,400 | 230 | |||
Jabil Circuit | 69,800 | 1,130 | |||
Juniper Networks * | 69,200 | 2,123 | |||
Lam Research * | 20,100 | 750 | |||
Lender Processing Services | 36,100 | 1,363 | |||
Linear Technology | 41,500 | 1,174 | |||
Marvell Technology Group * | 155,300 | 3,165 | |||
Mastercard, Cl A (A) | 49,230 | 12,504 | |||
Maxim Integrated Products | 31,400 | 609 | |||
McAfee * | 41,200 | 1,653 | |||
Microchip Technology | 26,500 | 746 | |||
Micros Systems * | 20,900 | 687 | |||
Microsoft | 2,343,869 | 68,605 | |||
Motorola * | 93,400 | 656 | |||
National Instruments | 26,900 | 897 | |||
National Semiconductor | 51,500 | 744 | |||
NetApp * | 63,900 | 2,081 | |||
NeuStar, Cl A * | 6,100 | 154 | |||
Nokia ADR (A) | 459,400 | 7,139 | |||
Novellus Systems * | 27,300 | 682 | |||
Nuance Communications * | 245,400 | 4,083 | |||
Nvidia * | 14,300 | 249 | |||
Oracle | 1,024,665 | 26,324 | |||
Paychex (A) | 202,000 | 6,201 | |||
Pegasystems | 6,500 | 241 | |||
Power Integrations | 3,600 | 148 | |||
QLogic * | 11,500 | 233 | |||
Qualcomm | 980,159 | 41,157 | |||
Rackspace Hosting * (A) | 293,700 | 5,501 | |||
Rambus * | 23,300 | 509 | |||
Red Hat * (A) | 185,500 | 5,430 | |||
| 4 | SEI Institutional Managed Trust / Semi-Annual Report / March 31, 2010 |
Table of Contents
Schedule of Investments (Unaudited)
Large Cap Growth Fund
March 31, 2010
| Description | Shares | Market Value ($ Thousands) | |||
Rovi * | 36,400 | $ | 1,352 | ||
Salesforce.com * | 8,700 | 648 | |||
Seagate Technology | 128,700 | 2,350 | |||
Semtech * | 3,400 | 59 | |||
Silicon Laboratories * | 19,100 | 910 | |||
Sybase * | 9,400 | 438 | |||
Symantec * | 476,400 | 8,061 | |||
Synopsys * | 5,500 | 123 | |||
Teradata * | 323,200 | 9,337 | |||
Teradyne * | 20,100 | 225 | |||
Texas Instruments | 259,415 | 6,348 | |||
Total System Services | 56,100 | 879 | |||
Trimble Navigation * | 8,500 | 244 | |||
Varian Semiconductor Equipment Associates * | 1,500 | 50 | |||
VeriSign * (A) | 348,000 | 9,052 | |||
Visa, Cl A (A) | 289,797 | 26,380 | |||
Vishay Intertechnology * | 44,800 | 458 | |||
VMware, Cl A * | 3,200 | 171 | |||
WebMD Health, Cl A * | 26,221 | 1,216 | |||
Western Digital * | 79,100 | 3,084 | |||
Western Union | 313,430 | 5,316 | |||
Xerox | 15,728 | 153 | |||
Xilinx | 201,810 | 5,146 | |||
Yahoo! * | 55,900 | 924 | |||
Zebra Technologies, Cl A * | 28,300 | 838 | |||
Zoran * | 16,900 | 182 | |||
| 655,040 | |||||
Materials — 3.4% | |||||
Air Products & Chemicals | 19,500 | 1,442 | |||
Alcoa | 121,400 | 1,729 | |||
Ashland | 20,800 | 1,098 | |||
Ball | 18,000 | 961 | |||
Boise * | 28,900 | 177 | |||
Celanese, Ser A | 43,300 | 1,379 | |||
CF Industries Holdings | 3,900 | 356 | |||
Compass Minerals International | 1,700 | 136 | |||
Crown Holdings * | 44,100 | 1,189 | |||
E.I. Du Pont de Nemours | 35,000 | 1,303 | |||
Ecolab | 80,550 | 3,540 | |||
Freeport-McMoRan Copper & Gold, Cl B (A) | 128,446 | 10,730 | |||
International Flavors & Fragrances | 2,000 | 95 | |||
Lubrizol | 30,600 | 2,807 | |||
Monsanto | 134,574 | 9,611 | |||
Nalco Holding (A) | 255,100 | 6,207 | |||
NewMarket | 3,200 | 330 | |||
Newmont Mining | 58,900 | 3,000 | |||
Owens-Illinois * | 1,700 | 60 | |||
Packaging Corp of America | 3,800 | 94 | |||
Praxair | 138,796 | 11,520 | |||
RPM International | 34,000 | 725 | |||
Scotts Miracle-Gro, Cl A | 14,400 | 667 | |||
Sigma-Aldrich | 1,500 | 80 | |||
Southern Copper | 47,700 | 1,511 | |||
Syngenta ADR (A) | 116,300 | 6,456 | |||
Terra Industries | 10,900 | 499 | |||
Walter Energy | 11,100 | 1,024 | |||
| 68,726 | |||||
| Description | Shares/Face Amount ($Thousands) | Market Value ($ Thousands) | ||||
Telecommunication Services — 1.2% | ||||||
American Tower, Cl A * | 183,620 | $ | 7,824 | |||
Crown Castle International * | 422,047 | 16,135 | ||||
SBA Communications, Cl A * | 4,000 | 144 | ||||
tw telecom, Cl A * | 6,300 | 115 | ||||
Windstream | 11,500 | 125 | ||||
| 24,343 | ||||||
Utilities — 0.4% | ||||||
AES * | 140,400 | 1,545 | ||||
Allegheny Energy | 9,500 | 218 | ||||
American Water Works | 4,000 | 87 | ||||
Calpine * | 40,800 | 485 | ||||
Centerpoint Energy | 13,100 | 188 | ||||
Constellation Energy Group | 26,200 | 920 | ||||
DPL | 8,100 | 220 | ||||
Equities | 28,100 | 1,152 | ||||
Exelon | 1,200 | 53 | ||||
FPL Group | 24,100 | 1,165 | ||||
Integrys Energy Group | 2,300 | 109 | ||||
Mirant * | 49,100 | 533 | ||||
NV Energy | 4,300 | 53 | ||||
PPL | 19,600 | 543 | ||||
| 7,271 | ||||||
Total Common Stock | 1,880,013 | |||||
AFFILIATED PARTNERSHIP — 7.7% | ||||||
SEI Liquidity Fund, L.P., | ||||||
0.210% (B)**†† | 157,797,853 | 153,929 | ||||
Total Affiliated Partnership | 153,929 | |||||
CASH EQUIVALENT — 2.1% | ||||||
SEI Daily Income Trust, Prime Obligation Fund, Cl A, 0.070%**†† | 41,431,747 | 41,432 | ||||
Total Cash Equivalent | 41,432 | |||||
U.S. TREASURY OBLIGATION (C) (D) — 0.5% | ||||||
U.S. Treasury Bills | ||||||
0.099%, 06/03/10 | $ | 9,427 | 9,425 | |||
Total U.S. Treasury Obligation | 9,425 | |||||
Total Investments — 104.2% | $ | 2,084,799 | ||||
| 5 | SEI Institutional Managed Trust / Semi-Annual Report / March 31, 2010 |
Table of Contents
Schedule of Investments (Unaudited)
Large Cap Growth Fund
March 31, 2010
A summary of the open futures contracts held by the Fund at March 31, 2010, is as follows:
| Type of Contract | Number of Contracts Long (Short) | Expiration Date | Unrealized Appreciation ($ Thousands) | ||||
S&P 500 Composite Index | 308 | Jun-2010 | $ | 16 | |||
For the period ended March 31, 2010, the total amount of all open futures contracts, as presented in the table above, are representative of the volume of activity for this derivative type during the period.
Percentages are based on Net Assets of $2,001,069 ($ Thousands).
| * | Non-income producing security. |
| ** | Rate shown is the 7-day effective yield as of March 31, 2010. |
| ‡ | Narrow Industries are utilized for compliance purposes, whereas broad sectors are utilized for reporting. |
| † | Real Estate Investment Trust. |
| †† | Investment in Affiliated Security. |
| (A) | This security or a partial position of this security is on loan at March 31, 2010. The total market value of securities on loan at March 31, 2010 was $154,182 ($ Thousands) |
| (B) | This security was purchased with cash collateral received from securities on loan. The total value of such securities as of March 31, 2010 was $153,929 ($ Thousands). |
| (C) | The rate reported is the effective yield at the time of purchase. |
| (D) | Security, or portion thereof, has been pledged as collateral on open futures. |
ADR — American Depositary Receipt
Cl — Class
L.P. — Limited Partnership
Ser — Series
| 6 | SEI Institutional Managed Trust / Semi-Annual Report / March 31, 2010 |
Table of Contents
Schedule of Investments (Unaudited)
Tax-Managed Large Cap Fund
March 31, 2010
| Description | Shares | Market Value ($ Thousands) | |||
COMMON STOCK — 95.6% | |||||
Consumer Discretionary — 10.7% | |||||
Abercrombie & Fitch, Cl A | 1,426 | $ | 65 | ||
Advance Auto Parts (A) | 1,200 | 50 | |||
Amazon.com * | 74,104 | 10,058 | |||
American Eagle Outfitters | 3,150 | 58 | |||
American Greetings, Cl A | 16,300 | 340 | |||
Apollo Group, Cl A * | 35,575 | 2,180 | |||
Asbury Automotive Group * | 4,800 | 64 | |||
Autoliv (A) | 22,650 | 1,167 | |||
Autonation * | 7,500 | 136 | |||
Autozone * | 919 | 159 | |||
Barnes & Noble (A) | 850 | 18 | |||
Bed Bath & Beyond * | 21,860 | 957 | |||
Best Buy | 13,880 | 590 | |||
Big Lots * | 1,557 | 57 | |||
Blyth | 8,300 | 259 | |||
Bob Evans Farms | 3,300 | 102 | |||
BorgWarner * | 2,300 | 88 | |||
Brinker International | 3,400 | 66 | |||
Brink’s Home Security Holdings * | 650 | 28 | |||
Cablevision Systems, Cl A | 6,700 | 162 | |||
Career Education * (A) | 7,700 | 244 | |||
Carmax * (A) | 6,383 | 160 | |||
Carnival | 9,000 | 350 | |||
Cavco Industries * | 130 | 4 | |||
CBS, Cl B | 78,800 | 1,098 | |||
Chico’s FAS | 72,400 | 1,044 | |||
Chipotle Mexican Grill, Cl A * | 800 | 90 | |||
Coach | 138,455 | 5,472 | |||
Comcast, Cl A | 498,700 | 9,385 | |||
Cooper Tire & Rubber | 7,600 | 144 | |||
Core-Mark Holding * | 4,300 | 132 | |||
Darden Restaurants | 3,127 | 139 | |||
DeVry | 1,021 | 67 | |||
Dick’s Sporting Goods * | 3,700 | 97 | |||
DIRECTV, Cl A * | 201,590 | 6,816 | |||
Discovery Communications, Cl C * | 5,040 | 148 | |||
DISH Network, Cl A | 17,549 | 365 | |||
Dollar Tree * | 829 | 49 | |||
DR Horton | 6,500 | 82 | |||
Eastman Kodak (A) | 543,400 | 3,146 | |||
Education Management * | 5,600 | 123 | |||
Family Dollar Stores (A) | 1,500 | 55 | |||
Ford Motor * (A) | 477,400 | 6,001 | |||
Fossil * | 1,600 | 60 | |||
GameStop, Cl A * | 3,622 | 79 | |||
Gannett | 80,000 | 1,322 | |||
Gap | 183,600 | 4,243 | |||
Garmin (A) | 29,700 | 1,143 | |||
Gentex | 5,500 | 107 | |||
Genuine Parts | 850 | 36 | |||
Goodyear Tire & Rubber * | 6,550 | 83 | |||
H&R Block | 5,900 | 105 | |||
Harman International Industries | 4,200 | 196 | |||
Hasbro | 29,895 | 1,145 | |||
Helen of Troy * | 5,300 | 138 | |||
Hillenbrand | 6,100 | 134 | |||
| Description | Shares | Market Value ($ Thousands) | |||
Home Depot | 104,000 | $ | 3,364 | ||
International Game Technology | 2,853 | 53 | |||
Interpublic Group * | 13,000 | 108 | |||
ITT Educational Services * (A) | 600 | 67 | |||
J.C. Penney (A) | 81,930 | 2,636 | |||
Jarden | 4,100 | 136 | |||
Johnson Controls | 106,063 | 3,499 | |||
Jones Apparel Group | 30,800 | 586 | |||
KB Home (A) | 4,700 | 79 | |||
Kohl’s * | 4,900 | 268 | |||
Lamar Advertising, Cl A * (A) | 7,300 | 251 | |||
Las Vegas Sands * (A) | 2,500 | 53 | |||
La-Z-Boy, Cl Z * | 5,900 | 74 | |||
Leggett & Platt | 38,100 | 824 | |||
Lennar, Cl A | 5,100 | 88 | |||
Liberty Global, Cl A * | 14,200 | 414 | |||
Liberty Media—Capital, Ser A * | 10,500 | 382 | |||
Liberty Media—Interactive, Cl A * | 6,450 | 99 | |||
Liberty Media—Starz * | 906 | 50 | |||
LKQ * | 3,200 | 65 | |||
Lowe’s | 454,741 | 11,023 | |||
Macy’s | 85,200 | 1,855 | |||
Madison Square Garden, Cl A * | 1,675 | 36 | |||
Marriott International, Cl A (A) | 7,097 | 224 | |||
Mattel | 2,300 | 52 | |||
McDonald’s | 77,346 | 5,160 | |||
McGraw-Hill | 11,600 | 414 | |||
Mohawk Industries * | 2,829 | 154 | |||
New York Times, Cl A * (A) | 10,200 | 113 | |||
News, Cl A | 149,900 | 2,160 | |||
Nike, Cl B (A) | 145,770 | 10,714 | |||
Nordstrom (A) | 4,900 | 200 | |||
NVR * | 100 | 73 | |||
Omnicom Group (A) | 6,000 | 233 | |||
O’Reilly Automotive * | 1,800 | 75 | |||
Penn National Gaming * | 2,300 | 64 | |||
PetSmart | 36,108 | 1,154 | |||
Phillips-Van Heusen | 13,900 | 797 | |||
Polo Ralph Lauren | 900 | 77 | |||
priceline.com * | 25,900 | 6,604 | |||
Pulte Homes * | 3,200 | 36 | |||
RadioShack | 45,100 | 1,021 | |||
Ross Stores | 30,400 | 1,626 | |||
Sally Beauty Holdings * | 10,700 | 95 | |||
Scholastic | 1,700 | 48 | |||
Sears Holdings * (A) | 53,500 | 5,801 | |||
Service International | 28,000 | 257 | |||
Sherwin-Williams | 17,700 | 1,198 | |||
Snap-On | 778 | 34 | |||
Stanley Black & Decker | 4,250 | 244 | |||
Staples | 459,706 | 10,753 | |||
Starbucks | 10,038 | 244 | |||
Target | 171,189 | 9,004 | |||
Tempur-Pedic International * | 25,200 | 760 | |||
Thor Industries | 10,300 | 311 | |||
Tiffany | 1,800 | 86 | |||
Tim Hortons | 1,500 | 49 | |||
Time Warner | 282,847 | 8,845 | |||
Time Warner Cable, Cl A (A) | 96,150 | 5,126 | |||
TJX | 50,500 | 2,147 | |||
| 1 | SEI Institutional Managed Trust / Semi-Annual Report / March 31, 2010 |
Table of Contents
Schedule of Investments (Unaudited)
Tax-Managed Large Cap Fund
March 31, 2010
| Description | Shares | Market Value ($ Thousands) | |||
TRW Automotive Holdings * | 42,300 | $ | 1,209 | ||
Tupperware Brands | 700 | 34 | |||
Urban Outfitters * | 2,500 | 95 | |||
VF | 8,300 | 665 | |||
Viacom, Cl B * | 98,442 | 3,384 | |||
Virgin Media (A) | 12,500 | 216 | |||
Walt Disney | 166,457 | 5,811 | |||
Washington Post, Cl B | 100 | 44 | |||
Whirlpool | 31,700 | 2,766 | |||
Wyndham Worldwide | 86,600 | 2,228 | |||
Yum! Brands | 101,100 | 3,875 | |||
| 182,896 | |||||
Consumer Staples — 8.2% | |||||
Altria Group | 43,010 | 882 | |||
Archer-Daniels-Midland | 103,857 | 3,002 | |||
Avon Products | 75,516 | 2,558 | |||
BJ’s Wholesale Club * | 31,357 | 1,160 | |||
Brown-Forman, Cl B | 20,900 | 1,242 | |||
Bunge | 11,700 | 721 | |||
Campbell Soup (A) | 64,700 | 2,287 | |||
Chiquita Brands International * | 34,000 | 535 | |||
Church & Dwight | 800 | 54 | |||
Clorox | 6,969 | 447 | |||
Coca-Cola | 200,076 | 11,004 | |||
Coca-Cola Enterprises | 6,100 | 169 | |||
Colgate-Palmolive | 44,144 | 3,764 | |||
ConAgra Foods | 155,250 | 3,892 | |||
Constellation Brands, Cl A * | 3,000 | 49 | |||
Corn Products International | 16,400 | 568 | |||
Costco Wholesale | 88,470 | 5,283 | |||
CVS Caremark | 172,370 | 6,302 | |||
Del Monte Foods | 145,900 | 2,130 | |||
Diageo ADR | 32,400 | 2,185 | |||
Dole Food * | 28,000 | 332 | |||
Dr Pepper Snapple Group | 25,100 | 883 | |||
Energizer Holdings * | 1,628 | 102 | |||
Estee Lauder, Cl A (A) | 3,500 | 227 | |||
General Mills | 30,384 | 2,151 | |||
Herbalife | 52,200 | 2,408 | |||
Hershey | 1,900 | 81 | |||
HJ Heinz | 3,797 | 173 | |||
Hormel Foods | 2,000 | 84 | |||
Kellogg | 9,458 | 505 | |||
Kimberly-Clark | 26,517 | 1,667 | |||
Kraft Foods, Cl A | 113,444 | 3,431 | |||
Kroger | 58,852 | 1,275 | |||
Lorillard | 3,850 | 290 | |||
McCormick | 2,100 | 81 | |||
Mead Johnson Nutrition, Cl A | 51,862 | 2,698 | |||
Medifast * | 11,700 | 294 | |||
PepsiCo | 235,046 | 15,551 | |||
Philip Morris International | 107,050 | 5,584 | |||
Prestige Brands Holdings * | 27,700 | 249 | |||
Procter & Gamble | 434,202 | 27,472 | |||
Reynolds American (A) | 39,300 | 2,121 | |||
Safeway | 114,417 | 2,844 | |||
Sara Lee | 145,200 | 2,023 | |||
SUPERVALU | 42,400 | 707 | |||
SYSCO | 52,750 | 1,556 | |||
Tyson Foods, Cl A | 4,300 | 82 | |||
| Description | Shares | Market Value ($ Thousands) | |||
USANA Health Sciences * | 1,000 | $ | 31 | ||
Walgreen | 206,550 | 7,661 | |||
Wal-Mart Stores | 150,346 | 8,359 | |||
Whole Foods Market * (A) | 3,700 | 134 | |||
| 139,290 | |||||
Energy — 9.7% | |||||
Anadarko Petroleum | 23,700 | 1,726 | |||
Apache | 64,535 | 6,550 | |||
Arch Coal | 2,400 | 55 | |||
Baker Hughes (A) | 3,341 | 157 | |||
BJ Services | 7,900 | 169 | |||
Cabot Oil & Gas | 1,500 | 55 | |||
Cameron International * | 3,800 | 163 | |||
Canadian Natural Resources | 30,638 | 2,268 | |||
Chesapeake Energy | 96,400 | 2,279 | |||
Chevron | 326,609 | 24,767 | |||
Cimarex Energy | 21,743 | 1,291 | |||
CNX Gas * | 1,500 | 57 | |||
ConocoPhillips | 305,807 | 15,648 | |||
Consol Energy | 2,800 | 119 | |||
Denbury Resources * (A) | 49,766 | 840 | |||
Devon Energy | 47,590 | 3,066 | |||
Diamond Offshore Drilling | 13,800 | 1,226 | |||
El Paso | 130,356 | 1,413 | |||
Ensco International ADR | 3,000 | 134 | |||
EOG Resources | 68,000 | 6,320 | |||
Exterran Holdings * | 2,700 | 65 | |||
Exxon Mobil | 567,176 | 37,989 | |||
FMC Technologies * | 26,000 | 1,680 | |||
Frontline | 2,300 | 70 | |||
Gulfport Energy * | 3,100 | 35 | |||
Halliburton | 155,415 | 4,683 | |||
Harvest Natural Resources * | 9,200 | 69 | |||
Helix Energy Solutions Group * | 59,900 | 781 | |||
Helmerich & Payne | 3,395 | 129 | |||
Hess | 18,650 | 1,167 | |||
Holly | 30,600 | 854 | |||
Marathon Oil | 173,000 | 5,474 | |||
Mariner Energy * | 931 | 14 | |||
Murphy Oil | 55,116 | 3,097 | |||
Nabors Industries * (A) | 56,600 | 1,111 | |||
National Oilwell Varco | 63,741 | 2,587 | |||
Newfield Exploration * | 2,500 | 130 | |||
Noble | 31,500 | 1,317 | |||
Noble Energy | 2,600 | 190 | |||
Occidental Petroleum | 124,829 | 10,553 | |||
Oceaneering International * | 1,200 | 76 | |||
Oil States International * | 27,600 | 1,251 | |||
Overseas Shipholding Group | 15,900 | 624 | |||
Patriot Coal * | 880 | 18 | |||
Patterson-UTI Energy | 49,700 | 694 | |||
Peabody Energy | 8,000 | 366 | |||
PetroHawk Energy * | 2,100 | 43 | |||
Pioneer Natural Resources | 4,944 | 278 | |||
Plains Exploration & Production * | 4,095 | 123 | |||
Pride International * (A) | 2,700 | 81 | |||
Range Resources | 33,884 | 1,588 | |||
Rowan * (A) | 2,522 | 73 | |||
SandRidge Energy * (A) | 7,700 | 59 | |||
Schlumberger | 115,439 | 7,326 | |||
| 2 | SEI Institutional Managed Trust / Semi-Annual Report / March 31, 2010 |
Table of Contents
Schedule of Investments (Unaudited)
Tax-Managed Large Cap Fund
March 31, 2010
| Description | Shares | Market Value ($ Thousands) | |||
Smith International | 5,428 | $ | 232 | ||
Southwestern Energy * | 52,698 | 2,146 | |||
Spectra Energy | 57,943 | 1,305 | |||
Stone Energy * | 32,600 | 579 | |||
Suncor Energy | 43,518 | 1,416 | |||
Sunoco | 36,400 | 1,081 | |||
Swift Energy * | 9,800 | 301 | |||
Teekay Shipping | 3,100 | 71 | |||
Tidewater | 13,450 | 636 | |||
Transocean * | 16,850 | 1,456 | |||
Unit * | 5,900 | 250 | |||
Valero Energy (A) | 63,094 | 1,243 | |||
Venoco * | 4,800 | 62 | |||
Weatherford International * | 6,600 | 105 | |||
Williams | 67,600 | 1,562 | |||
XTO Energy | 7,528 | 355 | |||
| 165,698 | |||||
Financials — 16.1% | |||||
ACE | 27,600 | 1,443 | |||
Affiliated Managers Group * | 3,400 | 269 | |||
Aflac | 161,160 | 8,749 | |||
Alexandria Real Estate Equities † (A) | 1,000 | 68 | |||
Allied World Assurance Holdings | 7,100 | 318 | |||
Allstate | 205,650 | 6,645 | |||
American Equity Investment Life Holding | 26,600 | 283 | |||
American Express | 219,817 | 9,070 | |||
American Financial Group | 61,500 | 1,750 | |||
American International Group * (A) | 2,900 | 99 | |||
AmeriCredit * | 10,900 | 259 | |||
Ameriprise Financial | 96,990 | 4,400 | |||
Annaly Capital Management † (A) | 143,413 | 2,464 | |||
AON | 4,050 | 173 | |||
Apartment Investment & Management, Cl A † (A) | 67,115 | 1,236 | |||
Arthur J. Gallagher | 2,600 | 64 | |||
Aspen Insurance Holdings | 7,800 | 225 | |||
Associated Banc-Corp (A) | 14,100 | 195 | |||
Assurant | 50,300 | 1,729 | |||
AvalonBay Communities † (A) | 1,900 | 164 | |||
Bancorpsouth (A) | 2,100 | 44 | |||
Bank of America | 1,375,424 | 24,551 | |||
Bank of Hawaii | 50 | 2 | |||
Bank of New York Mellon (A) | 262,804 | 8,115 | |||
BB&T | 16,600 | 538 | |||
BlackRock | 5,900 | 1,285 | |||
Boston Properties † | 1,600 | 121 | |||
Brandywine Realty Trust † | 64,500 | 787 | |||
BRE Properties, Cl A † | 2,200 | 79 | |||
Brookfield Asset Management, Cl A | 55,100 | 1,401 | |||
Brown & Brown | 2,200 | 39 | |||
Camden Property Trust † | 2,200 | 92 | |||
Capital One Financial (A) | 147,600 | 6,112 | |||
Charles Schwab (A) | 137,528 | 2,570 | |||
Chimera Investment † | 48,300 | 188 | |||
Chubb (A) | 95,800 | 4,967 | |||
| Description | Shares | Market Value ($ Thousands) | |||
Cincinnati Financial | 43,600 | $ | 1,260 | ||
Citigroup * (A) | 1,809,700 | 7,329 | |||
CME Group | 33,010 | 10,435 | |||
Comerica | 35,700 | 1,358 | |||
Commerce Bancshares | 2,835 | 117 | |||
Credicorp | 15,900 | 1,402 | |||
Cullen/Frost Bankers | 1,900 | 106 | |||
Digital Realty Trust † | 1,300 | 70 | |||
Discover Financial Services | 4,800 | 71 | |||
Duke Realty † | 21,100 | 262 | |||
Endurance Specialty Holdings | 53,400 | 1,984 | |||
Equity Residential † | 4,687 | 183 | |||
Erie Indemnity, Cl A (A) | 1,400 | 60 | |||
Everest Re Group | 16,200 | 1,311 | |||
Federal Realty Investment Trust † | 800 | 58 | |||
Fidelity National Financial, Cl A | 5,399 | 80 | |||
Fifth Third Bancorp | 13,100 | 178 | |||
First American | 2,100 | 71 | |||
First Citizens BancShares, Cl A | 600 | 119 | |||
First Horizon National * (A) | 15,227 | 214 | |||
Flagstone Reinsurance Holdings | 8,900 | 102 | |||
Forest City Enterprises, Cl A * | 61,000 | 879 | |||
Franklin Resources | 26,150 | 2,900 | |||
Goldman Sachs Group | 87,400 | 14,913 | |||
Greenlight Capital Re * | 2,500 | 67 | |||
Hanover Insurance Group | 4,297 | 187 | |||
Hartford Financial Services Group | 72,700 | 2,066 | |||
HCC Insurance Holdings | 1,500 | 41 | |||
Health Care † | 1,371 | 62 | |||
Highwoods Properties † | 750 | 24 | |||
Hospitality Properties Trust † | 73,400 | 1,758 | |||
Host Hotels & Resorts † | 5,309 | 78 | |||
HRPT Properties Trust † | 145,600 | 1,133 | |||
Hudson City Bancorp | 154,800 | 2,192 | |||
Huntington Bancshares | 214,400 | 1,151 | |||
IntercontinentalExchange * | 59,191 | 6,640 | |||
Invesco | 6,000 | 132 | |||
Invesco Mortgage Capital † | 3,200 | 74 | |||
Investment Technology Group * | 2,400 | 40 | |||
Jefferies Group | 7,900 | 187 | |||
Jones Lang LaSalle | 16,400 | 1,195 | |||
JPMorgan Chase | 674,758 | 30,196 | |||
Keycorp | 78,900 | 612 | |||
Kimco Realty † (A) | 3,600 | 56 | |||
Legg Mason | 2,100 | 60 | |||
Liberty Property Trust † (A) | 1,900 | 64 | |||
Lincoln National | 66,400 | 2,038 | |||
Loews | 3,100 | 116 | |||
M&T Bank | 2,500 | 198 | |||
Macerich † (A) | 5,936 | 227 | |||
Mack-Cali Realty † | 2,700 | 95 | |||
Maiden Holdings | 5,500 | 41 | |||
Manulife Financial | 1,565 | 31 | |||
Marsh & McLennan | 5,906 | 144 | |||
Marshall & Ilsley | 11,700 | 94 | |||
Max Capital Group | 9,000 | 207 | |||
MBIA * (A) | 7,600 | 48 | |||
Mercury General | 34,500 | 1,508 | |||
| 3 | SEI Institutional Managed Trust / Semi-Annual Report / March 31, 2010 |
Table of Contents
Schedule of Investments (Unaudited)
Tax-Managed Large Cap Fund
March 31, 2010
| Description | Shares | Market Value ($ Thousands) | |||
MetLife | 35,300 | $ | 1,530 | ||
Montpelier Re Holdings | 27,100 | 456 | |||
Moody’s (A) | 3,838 | 114 | |||
Morgan Stanley | 197,550 | 5,786 | |||
Nationwide Health Properties † | 1,500 | 53 | |||
Nelnet, Cl A | 8,800 | 163 | |||
New York Community Bancorp | 3,600 | 59 | |||
Northern Trust | 51,420 | 2,842 | |||
NYSE Euronext | 172,400 | 5,105 | |||
OceanFirst Financial | 3,000 | 34 | |||
Old Republic International (A) | 5,100 | 65 | |||
OneBeacon Insurance Group, Cl A | 8,000 | 138 | |||
PartnerRe | 1,300 | 104 | |||
People’s United Financial | 99,015 | 1,549 | |||
PHH * | 32,400 | 764 | |||
Plum Creek Timber † | 2,090 | 81 | |||
PNC Financial Services Group | 80,800 | 4,824 | |||
Presidential Life | 9,700 | 97 | |||
Principal Financial Group | 8,000 | 234 | |||
Progressive | 75,782 | 1,447 | |||
Prologis † | 11,200 | 148 | |||
Protective Life | 15,600 | 343 | |||
Provident Financial Services | 7,400 | 88 | |||
Prudential Financial | 122,700 | 7,423 | |||
Public Storage † | 2,050 | 189 | |||
Ramco-Gershenson Properties † | 16,200 | 182 | |||
Raymond James Financial (A) | 2,025 | 54 | |||
Regions Financial | 85,400 | 670 | |||
Reinsurance Group of America, Cl A | 20,200 | 1,061 | |||
RenaissanceRe Holdings | 800 | 45 | |||
Resource Capital † | 38,500 | 260 | |||
Simon Property Group † | 7,848 | 658 | |||
SLM * | 14,700 | 184 | |||
StanCorp Financial Group | 10,400 | 495 | |||
State Street | 81,700 | 3,688 | |||
Stewart Information Services | 1,800 | 25 | |||
Sunstone Hotel Investors * † | 33,900 | 379 | |||
SunTrust Banks | 27,800 | 745 | |||
SVB Financial Group * (A) | 1,550 | 72 | |||
T. Rowe Price Group | 44,500 | 2,444 | |||
Taubman Centers † (A) | 49,400 | 1,972 | |||
TD Ameritrade Holding * (A) | 7,650 | 146 | |||
Torchmark | 1,000 | 54 | |||
Transatlantic Holdings | 2,400 | 127 | |||
Travelers | 124,965 | 6,741 | |||
Trustco Bank NY | 13,900 | 86 | |||
Unitrin | 4,900 | 137 | |||
Unum Group | 89,850 | 2,226 | |||
US Bancorp | 173,208 | 4,483 | |||
Validus Holdings | 22,761 | 627 | |||
Valley National Bancorp (A) | 2,168 | 33 | |||
Ventas † (A) | 3,400 | 161 | |||
Vornado Realty Trust † | 5,043 | 382 | |||
Waddell & Reed Financial, Cl A | 2,800 | 101 | |||
Walter Investment Management † | 876 | 14 | |||
Washington Federal | 3,900 | 79 | |||
| Description | Shares | Market Value ($ Thousands) | |||
Weingarten Realty Investors † (A) | 4,600 | $ | 99 | ||
Wells Fargo | 711,367 | 22,138 | |||
WesBanco | 5,500 | 89 | |||
White Mountains Insurance Group | 300 | 106 | |||
World Acceptance * | 5,200 | 188 | |||
XL Capital, Cl A | 26,000 | 491 | |||
| 273,796 | |||||
Health Care — 13.2% | |||||
Abbott Laboratories | 111,481 | 5,873 | |||
Abraxis Bioscience * | 6,000 | 310 | |||
Aetna | 222,927 | 7,827 | |||
Allergan | 222,420 | 14,528 | |||
Allscripts Healthcare Solutions * | 19,700 | 385 | |||
American Medical Systems Holdings * | 4,000 | 74 | |||
AmerisourceBergen | 90,376 | 2,614 | |||
Amgen * | 173,963 | 10,396 | |||
Amylin Pharmaceuticals * (A) | 3,700 | 83 | |||
Baxter International | 126,870 | 7,384 | |||
Beckman Coulter | 600 | 38 | |||
Becton Dickinson | 38,291 | 3,015 | |||
Biogen Idec * | 62,158 | 3,565 | |||
Boston Scientific * | 15,517 | 112 | |||
Bristol-Myers Squibb | 123,245 | 3,290 | |||
Bruker BioSciences * | 24,400 | 357 | |||
C.R. Bard | 19,300 | 1,672 | |||
Cardinal Health | 22,100 | 796 | |||
Celgene * | 7,400 | 459 | |||
Cerner * (A) | 1,100 | 94 | |||
Charles River Laboratories International * (A) | 1,600 | 63 | |||
Cigna | 3,540 | 130 | |||
Cooper | 2,100 | 82 | |||
Covance * | 1,100 | 68 | |||
Coventry Health Care * | 48,100 | 1,189 | |||
Covidien | 44,939 | 2,260 | |||
DaVita * | 1,425 | 90 | |||
Dendreon * | 1,600 | 58 | |||
Dentsply International | 2,300 | 80 | |||
Edwards Lifesciences * | 700 | 69 | |||
Eli Lilly | 138,371 | 5,012 | |||
Endo Pharmaceuticals Holdings * | 66,100 | 1,566 | |||
ev3 * | 8,600 | 136 | |||
Express Scripts * | 27,504 | 2,799 | |||
Forest Laboratories * | 120,400 | 3,776 | |||
Genzyme * | 94,150 | 4,880 | |||
Gilead Sciences * | 248,630 | 11,308 | |||
Health Management Associates, Cl A * (A) | 9,200 | 79 | |||
Health Net * | 2,900 | 72 | |||
Henry Schein * | 1,000 | 59 | |||
Hologic * | 7,600 | 141 | |||
Hospira * | 17,200 | 974 | |||
Humana * | 25,579 | 1,196 | |||
Idexx Laboratories * (A) | 9,100 | 524 | |||
Illumina * (A) | 1,600 | 62 | |||
Intuitive Surgical * | 6,250 | 2,176 | |||
Invacare | 9,200 | 244 | |||
| 4 | SEI Institutional Managed Trust / Semi-Annual Report / March 31, 2010 |
Table of Contents
Schedule of Investments (Unaudited)
Tax-Managed Large Cap Fund
March 31, 2010
| Description | Shares | Market Value ($ Thousands) | |||
Inverness Medical Innovations * (A) | 1,700 | $ | 66 | ||
Johnson & Johnson | 304,122 | 19,829 | |||
Kinetic Concepts * | 23,400 | 1,119 | |||
King Pharmaceuticals * | 62,950 | 740 | |||
Laboratory Corp of America Holdings * | 3,150 | 238 | |||
Life Technologies * | 13,991 | 731 | |||
Lincare Holdings * | 34,400 | 1,544 | |||
McKesson | 2,326 | 153 | |||
Medco Health Solutions * | 150,386 | 9,709 | |||
Mednax * | 1,500 | 87 | |||
Medtronic | 133,076 | 5,992 | |||
Merck | 368,722 | 13,772 | |||
Mettler Toledo International * | 8,050 | 879 | |||
Millipore * | 1,400 | 148 | |||
Mylan Laboratories * (A) | 7,475 | 170 | |||
Novo Nordisk ADR | 84,100 | 6,486 | |||
OSI Pharmaceuticals * | 1,100 | 66 | |||
Par Pharmaceutical * | 17,800 | 441 | |||
Patterson | 2,100 | 65 | |||
PerkinElmer | 5,950 | 142 | |||
Perrigo | 11,800 | 693 | |||
Pfizer | 1,107,860 | 19,000 | |||
Pharmaceutical Product Development | 5,200 | 124 | |||
Quest Diagnostics | 10,004 | 583 | |||
ResMed * | 900 | 57 | |||
St. Jude Medical * | 123,775 | 5,081 | |||
STERIS | 8,600 | 290 | |||
Stryker | 56,000 | 3,204 | |||
Teva Pharmaceutical Industries ADR | 49,975 | 3,152 | |||
Thermo Fisher Scientific * | 80,436 | 4,138 | |||
UnitedHealth Group | 477,188 | 15,590 | |||
Valeant Pharmaceuticals International * | 27,100 | 1,163 | |||
Varian Medical Systems * | 2,900 | 160 | |||
VCA Antech * | 2,200 | 62 | |||
Vertex Pharmaceuticals * (A) | 2,700 | 110 | |||
Waters * | 1,600 | 108 | |||
Watson Pharmaceuticals * | 2,900 | 121 | |||
WellPoint * | 101,444 | 6,531 | |||
Zimmer Holdings * | 25,026 | 1,482 | |||
| 225,991 | |||||
Industrials — 8.0% | |||||
3M | 51,960 | 4,342 | |||
Aecom Technology * | 1,500 | 43 | |||
AGCO * | 400 | 14 | |||
Alliant Techsystems * | 2,100 | 171 | |||
AMR * (A) | 25,300 | 230 | |||
AO Smith | 1,800 | 95 | |||
Boeing (A) | 77,681 | 5,641 | |||
C.H. Robinson Worldwide (A) | 2,502 | 140 | |||
Calgon Carbon * | 13,700 | 235 | |||
Caterpillar (A) | 11,935 | 750 | |||
Cintas | 1,700 | 48 | |||
Continental Airlines, Cl B * (A) | 7,650 | 168 | |||
Con-way | 3,100 | 109 | |||
Copart * | 1,600 | 57 | |||
Courier | 1,700 | 28 | |||
| Description | Shares | Market Value ($ Thousands) | |||
Crane | 15,050 | $ | 534 | ||
CSX | 15,762 | 802 | |||
Cummins | 51,537 | 3,193 | |||
Danaher | 44,959 | 3,593 | |||
Deere | 8,700 | 517 | |||
Delta Air Lines * | 8,100 | 118 | |||
Donaldson | 1,900 | 86 | |||
Dover | 44,500 | 2,080 | |||
Dun & Bradstreet | 800 | 60 | |||
Eaton | 10,979 | 832 | |||
Emerson Electric | 55,626 | 2,800 | |||
Ennis | 3,100 | 50 | |||
Equifax | 2,500 | 89 | |||
Expeditors International of Washington | 177,200 | 6,542 | |||
Fastenal (A) | 2,800 | 134 | |||
FedEx | 20,833 | 1,946 | |||
Flowserve | 2,004 | 221 | |||
Fluor | 4,700 | 219 | |||
Force Protection * | 4,700 | 28 | |||
Foster Wheeler * | 2,100 | 57 | |||
FTI Consulting * (A) | 900 | 35 | |||
Gardner Denver | 28,300 | 1,246 | |||
GATX | 1,600 | 46 | |||
General Cable * | 3,000 | 81 | |||
General Dynamics | 77,206 | 5,960 | |||
General Electric | 1,341,455 | 24,415 | |||
Goodrich | 22,050 | 1,555 | |||
Harsco | 38,100 | 1,217 | |||
Herman Miller | 5,500 | 99 | |||
Honeywell International | 40,563 | 1,836 | |||
Hubbell, Cl B | 7,100 | 358 | |||
Illinois Tool Works | 35,529 | 1,683 | |||
Ingersoll-Rand | 3,300 | 115 | |||
Iron Mountain | 3,625 | 99 | |||
ITT | 18,200 | 976 | |||
Jacobs Engineering Group * | 3,140 | 142 | |||
John Bean Technologies | 216 | 4 | |||
Joy Global | 13,500 | 764 | |||
KBR | 53,700 | 1,190 | |||
Kennametal | 18,000 | 506 | |||
L-3 Communications Holdings | 27,900 | 2,557 | |||
Lennox International | 4,900 | 217 | |||
Lockheed Martin | 19,170 | 1,595 | |||
Manpower | 800 | 46 | |||
McDermott International * | 7,400 | 199 | |||
Monster Worldwide * (A) | 3,200 | 53 | |||
MSC Industrial Direct, Cl A (A) | 2,000 | �� | 102 | ||
Norfolk Southern | 11,590 | 648 | |||
Northrop Grumman | 113,134 | 7,418 | |||
Oshkosh Truck | 38,100 | 1,537 | |||
PACCAR (A) | 6,134 | 266 | |||
Pall | 2,322 | 94 | |||
Parker Hannifin | 50,474 | 3,268 | |||
Pentair | 2,400 | 85 | |||
Precision Castparts | 1,500 | 190 | |||
Quanta Services * | 91,600 | 1,755 | |||
Raytheon | 120,343 | 6,874 | |||
Republic Services | 29,845 | 866 | |||
Robert Half International | 1,300 | 40 | |||
Rockwell Automation | 6,000 | 338 | |||
| 5 | SEI Institutional Managed Trust / Semi-Annual Report / March 31, 2010 |
Table of Contents
Schedule of Investments (Unaudited)
Tax-Managed Large Cap Fund
March 31, 2010
| Description | Shares | Market Value ($ Thousands) | |||
Rockwell Collins | 32,574 | $ | 2,039 | ||
Roper Industries | 1,900 | 110 | |||
RR Donnelley & Sons | 126,500 | 2,701 | |||
Shaw Group * | 1,550 | 53 | |||
Skywest | 821 | 12 | |||
Southwest Airlines | 20,700 | 274 | |||
SPX (A) | 19,549 | 1,297 | |||
Standex International | 1,800 | 46 | |||
Taser International * | 11,100 | 65 | |||
Thomas & Betts * (A) | 1,900 | 74 | |||
Timken | 2,700 | 81 | |||
Toro | 1,000 | 49 | |||
Towers Watson, Cl A | 6,500 | 309 | |||
Trinity Industries (A) | 5,700 | 114 | |||
Tyco International | 80,100 | 3,064 | |||
Union Pacific | 28,300 | 2,074 | |||
United Parcel Service, Cl B | 68,608 | 4,419 | |||
United Technologies | 157,207 | 11,572 | |||
URS * | 1,700 | 84 | |||
Waste Management | 23,118 | 796 | |||
Watts Water Technologies, Cl A | 3,500 | 109 | |||
WW Grainger | 11,109 | 1,201 | |||
| 136,990 | |||||
Information Technology — 20.0% | |||||
Accenture, Cl A | 7,500 | 315 | |||
Activision Blizzard | 11,700 | 141 | |||
Adobe Systems * | 193,031 | 6,828 | |||
Advent Software * | 1,378 | 62 | |||
Agilent Technologies * | 4,050 | 139 | |||
Akamai Technologies * (A) | 3,000 | 94 | |||
Altera | 2,400 | 58 | |||
Amdocs * | 68,200 | 2,053 | |||
Amphenol, Cl A | 2,800 | 118 | |||
Analog Devices | 4,050 | 117 | |||
AOL * | 2,261 | 57 | |||
Apple * | 152,943 | 35,931 | |||
Applied Materials | 25,700 | 346 | |||
Arris Group * | 10,500 | 126 | |||
Arrow Electronics * | 5,000 | 151 | |||
Autodesk * | 61,209 | 1,801 | |||
Automatic Data Processing | 5,418 | 241 | |||
Aviat Networks * | 7,477 | 50 | |||
Avnet * | 61,100 | 1,833 | |||
BMC Software * | 8,448 | 321 | |||
Broadcom, Cl A | 149,750 | 4,969 | |||
Broadridge Financial Solutions | 3,000 | 64 | |||
CA | 182,797 | 4,290 | |||
Cadence Design Systems * (A) | 11,100 | 74 | |||
Ciena * | 6,400 | 97 | |||
Cisco Systems * | 908,232 | 23,641 | |||
Citrix Systems * | 47,685 | 2,264 | |||
Cognizant Technology Solutions, Cl A * | 4,456 | 227 | |||
Computer Sciences * | 24,400 | 1,329 | |||
Compuware * | 40,600 | 341 | |||
Convergys * | 31,100 | 381 | |||
Corning | 135,331 | 2,735 | |||
Cree * | 1,200 | 84 | |||
Cypress Semiconductor * | 6,250 | 72 | |||
Dell * | 76,000 | 1,141 | |||
| Description | Shares | Market Value ($ Thousands) | |||
Diebold | 1,700 | $ | 54 | ||
Dolby Laboratories, Cl A * | 1,235 | 72 | |||
DST Systems | 850 | 35 | |||
eBay * | 312,591 | 8,424 | |||
EMC * | 498,086 | 8,986 | |||
Equinix * (A) | 800 | 78 | |||
F5 Networks * | 1,800 | 111 | |||
Factset Research Systems (A) | 900 | 66 | |||
Fairchild Semiconductor International * | 45,500 | 485 | |||
Fidelity National Information Services | 6,909 | 162 | |||
Fiserv * | 2,242 | 114 | |||
Global Payments | 2,000 | 91 | |||
Google, Cl A * | 44,421 | 25,187 | |||
Harris | 52,800 | 2,507 | |||
Hewitt Associates, Cl A * | 1,500 | 60 | |||
Hewlett-Packard | 318,121 | 16,908 | |||
IAC * | 3,695 | 84 | |||
Ingram Micro, Cl A * | 104,500 | 1,834 | |||
Intel | 653,945 | 14,557 | |||
Interactive Intelligence * | 3,600 | 67 | |||
International Business Machines | 114,089 | 14,632 | |||
International Rectifier * | 3,500 | 80 | |||
Intersil, Cl A | 17,700 | 261 | |||
Intuit * | 235,531 | 8,088 | |||
Jabil Circuit | 16,000 | 259 | |||
Juniper Networks * (A) | 28,946 | 888 | |||
Lam Research * | 3,300 | 123 | |||
Lender Processing Services | 1,632 | 62 | |||
Lexmark International, Cl A * | 27,400 | 989 | |||
LSI Logic * | 12,300 | 75 | |||
Marvell Technology Group * | 71,200 | 1,451 | |||
Mastercard, Cl A (A) | 36,390 | 9,243 | |||
McAfee * | 2,900 | 116 | |||
Microchip Technology (A) | 2,350 | 66 | |||
Micron Technology * (A) | 128,900 | 1,339 | |||
Microsoft | 909,666 | 26,626 | |||
Motorola * | 44,800 | 314 | |||
National Semiconductor | 9,100 | 132 | |||
NetApp * | 7,296 | 238 | |||
NeuStar, Cl A * | 28,600 | 721 | |||
Nokia ADR | 157,500 | 2,448 | |||
Novell * | 13,200 | 79 | |||
Novellus Systems * | 6,500 | 163 | |||
Nuance Communications * | 84,200 | 1,401 | |||
Nvidia * (A) | 12,250 | 213 | |||
Oracle | 351,141 | 9,021 | |||
Paychex (A) | 71,900 | 2,207 | |||
Pegasystems | 4,200 | 155 | |||
PMC - Sierra * | 10,600 | 95 | |||
Polycom * (A) | 1,164 | 36 | |||
QLogic * | 4,200 | 85 | |||
Qualcomm | 496,874 | 20,864 | |||
Rackspace Hosting * | 100,700 | 1,886 | |||
Rambus * (A) | 5,000 | 109 | |||
Red Hat * | 50,800 | 1,487 | |||
RightNow Technologies * | 6,200 | 111 | |||
Rovi * | 23 | 1 | |||
Salesforce.com * (A) | 1,500 | 112 | |||
SanDisk * (A) | 8,400 | 291 | |||
| 6 | SEI Institutional Managed Trust / Semi-Annual Report / March 31, 2010 |
Table of Contents
Schedule of Investments (Unaudited)
Tax-Managed Large Cap Fund
March 31, 2010
| Description | Shares | Market Value ($ Thousands) | |||
Seagate Technology (A) | 223,300 | $ | 4,077 | ||
Semtech * | 2,300 | 40 | |||
Sigma Designs * | 5,300 | 62 | |||
Silicon Laboratories * | 13,900 | 663 | |||
Symantec * | 378,514 | 6,404 | |||
Tech Data * | 33,600 | 1,408 | |||
Tellabs | 11,600 | 88 | |||
Teradata * | 179,900 | 5,197 | |||
Teradyne * (A) | 9,800 | 109 | |||
Texas Instruments (A) | 338,100 | 8,273 | |||
TIBCO Software * | 13,100 | 141 | |||
Trimble Navigation * | 2,600 | 75 | |||
Tyco Electronics | 12,900 | 354 | |||
Verigy * | 863 | 10 | |||
VeriSign * | 267,654 | 6,962 | |||
Visa, Cl A | 157,978 | 14,381 | |||
Vishay Intertechnology * | 90,400 | 925 | |||
VMware, Cl A * | 2,000 | 107 | |||
WebMD Health, Cl A * | 1,796 | 83 | |||
Western Digital * | 77,950 | 3,039 | |||
Western Union | 149,342 | 2,533 | |||
Xerox | 164,628 | 1,605 | |||
Xilinx (A) | 99,490 | 2,537 | |||
Yahoo! * | 193,250 | 3,195 | |||
Zebra Technologies, Cl A * | 2,400 | 71 | |||
Zoran * | 3,400 | 37 | |||
| 341,216 | |||||
Materials — 3.4% | |||||
AEP Industries * | 5,800 | 151 | |||
Air Products & Chemicals | 4,450 | 329 | |||
AK Steel Holding (A) | 6,500 | 149 | |||
Alcoa | 153,300 | 2,183 | |||
Allegheny Technologies | 1,800 | 97 | |||
Alpha Natural Resources * (A) | 2,600 | 130 | |||
AM Castle | 2,600 | 34 | |||
Aptargroup | 1,100 | 43 | |||
Ashland | 25,800 | 1,361 | |||
Ball | 18,200 | 972 | |||
Bemis | 2,400 | 69 | |||
Boise * | 27,400 | 168 | |||
Celanese, Ser A | 24,700 | 787 | |||
CF Industries Holdings (A) | 900 | 82 | |||
Crown Holdings * | 2,200 | 59 | |||
Dow Chemical (A) | 11,375 | 336 | |||
E.I. Du Pont de Nemours | 67,700 | 2,521 | |||
Eagle Materials | 753 | 20 | |||
Eastman Chemical | 46,300 | 2,948 | |||
Ecolab | 43,900 | 1,929 | |||
FMC | 900 | 55 | |||
Freeport-McMoRan Copper & Gold, Cl B | 79,225 | 6,618 | |||
Greif, Cl A | 1,500 | 82 | |||
International Flavors & Fragrances | 1,400 | 67 | |||
International Paper | 42,900 | 1,056 | |||
Kaiser Aluminum | 5,100 | 197 | |||
Koppers Holdings | 4,900 | 139 | |||
Lubrizol | 41,300 | 3,788 | |||
Martin Marietta Materials | 550 | 46 | |||
MeadWestvaco | 8,400 | 215 | |||
| Description | Shares | Market Value ($ Thousands) | |||
Monsanto | 48,631 | $ | 3,473 | ||
Mosaic | 3,000 | 182 | |||
Nalco Holding | 92,400 | 2,248 | |||
NewMarket | 4,300 | 443 | |||
Newmont Mining | 23,700 | 1,207 | |||
Nucor (A) | 42,100 | 1,910 | |||
OM Group * | 2,300 | 78 | |||
Omnova Solutions * | 32,800 | 257 | |||
Owens-Illinois * | 23,150 | 823 | |||
Pactiv * | 1,632 | 41 | |||
PPG Industries (A) | 3,000 | 196 | |||
Praxair | 91,140 | 7,565 | |||
Reliance Steel & Aluminum | 1,700 | 84 | |||
Rock-Tenn, Cl A | 19,300 | 879 | |||
Royal Gold (A) | 1,938 | 90 | |||
RPM International | 1,500 | 32 | |||
Sealed Air | 6,700 | 141 | |||
Sigma-Aldrich (A) | 2,200 | 118 | |||
Solutia * | 11,700 | 189 | |||
Sonoco Products | 70,400 | 2,168 | |||
Southern Copper (A) | 89,811 | 2,844 | |||
Spartech * | 19,200 | 225 | |||
Steel Dynamics | 4,900 | 86 | |||
Syngenta ADR | 90,700 | 5,035 | |||
Terra Industries | 1,900 | 87 | |||
United States Steel (A) | 1,568 | 100 | |||
Walter Energy | 4,100 | 378 | |||
Weyerhaeuser | 2,300 | 104 | |||
WR Grace * | 13,300 | 369 | |||
| 57,983 | |||||
Telecommunication Services — 3.2% | |||||
American Tower, Cl A * | 103,284 | 4,401 | |||
AT&T | 841,446 | 21,743 | |||
Atlantic Telegraph-Network | 3,100 | 139 | |||
CenturyTel | 35,417 | 1,256 | |||
Crown Castle International * | 283,962 | 10,856 | |||
MetroPCS Communications * (A) | 51,700 | 366 | |||
NII Holdings * | 34,000 | 1,416 | |||
Qwest Communications International | 19,518 | 102 | |||
SBA Communications, Cl A * | 2,100 | 76 | |||
Telephone & Data Systems, Cl L | 1,300 | 39 | |||
Telephone & Data Systems | 1,900 | 64 | |||
US Cellular * | 1,976 | 82 | |||
Verizon Communications | 428,059 | 13,278 | |||
Windstream | 8,323 | 91 | |||
| 53,909 | |||||
Utilities — 3.1% | |||||
AES * | 724,150 | 7,966 | |||
AGL Resources | 24,900 | 962 | |||
Allegheny Energy | 4,200 | 97 | |||
Alliant Energy | 68,000 | 2,262 | |||
Ameren | 76,100 | 1,985 | |||
American Electric Power | 84,600 | 2,892 | |||
Aqua America (A) | 2,033 | 36 | |||
Atmos Energy | 4,200 | 120 | |||
Calpine * | 6,300 | 75 | |||
Centerpoint Energy | 9,500 | 136 | |||
CMS Energy (A) | 82,900 | 1,282 | |||
| 7 | SEI Institutional Managed Trust / Semi-Annual Report / March 31, 2010 |
Table of Contents
Schedule of Investments (Unaudited)
Tax-Managed Large Cap Fund
March 31, 2010
| Description | Shares/Face Amount ($ Thousands) | Market Value ($ Thousands) | ||||
Consolidated Edison | 1,200 | $ | 53 | |||
Constellation Energy Group | 22,210 | 780 | ||||
Dominion Resources | 29,283 | 1,204 | ||||
DPL | 2,000 | 54 | ||||
DTE Energy | 69,800 | 3,113 | ||||
Duke Energy | 21,544 | 352 | ||||
Dynegy, Cl A * | 6,800 | 9 | ||||
Edison International | 103,500 | 3,537 | ||||
Energen | 39,200 | 1,824 | ||||
Entergy | 25,548 | 2,078 | ||||
Equities | 2,100 | 86 | ||||
Exelon | 54,776 | 2,400 | ||||
FirstEnergy | 50,200 | 1,962 | ||||
FPL Group | 6,438 | 311 | ||||
Great Plains Energy | 3,500 | 65 | ||||
Hawaiian Electric Industries (A) | 3,200 | 72 | ||||
Mirant * | 173,800 | 1,887 | ||||
National Fuel Gas | 1,300 | 66 | ||||
NiSource | 12,500 | 198 | ||||
NorthWestern | 1,100 | 29 | ||||
NRG Energy * | 2,600 | 54 | ||||
NV Energy | 36,000 | 444 | ||||
OGE Energy | 1,074 | 42 | ||||
Pepco Holdings | 55,000 | 943 | ||||
PG&E (A) | 36,050 | 1,529 | ||||
Pinnacle West Capital | 25,300 | 955 | ||||
PPL | 4,200 | 116 | ||||
Public Service Enterprise Group | 100,000 | 2,952 | ||||
Questar | 3,500 | 151 | ||||
Sempra Energy | 83,347 | 4,159 | ||||
Southern | 7,164 | 237 | ||||
Southern Union | 112,500 | 2,854 | ||||
Wisconsin Energy | 1,000 | 49 | ||||
Xcel Energy | 8,453 | 179 | ||||
| 52,557 | ||||||
Total Common Stock | 1,630,326 | |||||
AFFILIATED PARTNERSHIP — 10.2% | ||||||
SEI Liquidity Fund, L.P., | ||||||
0.210% (B)**†† | 178,313,760 | 173,839 | ||||
Total Affiliated Partnership | 173,839 | |||||
CASH EQUIVALENT — 1.7% | ||||||
SEI Daily Income Trust, Prime Obligation Fund, Cl A, 0.070%**†† | 28,232,937 | 28,233 | ||||
Total Cash Equivalent | 28,233 | |||||
U.S. TREASURY OBLIGATIONS — 0.3% | ||||||
U.S. Treasury Bills | ||||||
0.128%, 06/03/10 (C)(D) | $ | 6,162 | 6,160 | |||
| Description | Face Amount ($ Thousands) | Market Value ($ Thousands) | ||||
U.S. Cash Management Bills | ||||||
0.000%, 06/17/10 (C) | $ | 50 | $ | 50 | ||
Total U.S. Treasury Obligations | 6,210 | |||||
Total Investments — 107.8% | $ | 1,838,608 | ||||
A summary of the open futures contracts held by the Fund at March 31, 2010, is as follows:
| Type of Contract | Number of Contracts Long (Short) | Expiration Date | Unrealized Appreciation ($ Thousands) | ||||
S&P 500 Index E-MINI | 3 | Jun-2010 | $ | 3 | |||
S&P 500 Composite Index | 219 | Jun-2010 | 257 | ||||
S&P Mid 400 Index E-MINI | 107 | Jun-2010 | 11 | ||||
| $ | 271 | ||||||
For the period ended March 31, 2010 the total number of all open futures contracts, as presented in the table above, are representative of the volume of activity for this derivative type during the period.
Percentages are based on Net Assets of $1,705,505 ($ Thousands).
| * | Non-income producing security. |
| ** | Rate shown is the 7-day effective yield as of March 31, 2010. |
| † | Real Estate Investment Trust. |
| †† | Investment in Affiliated Security. |
| (A) | This security or a partial position of this security is on loan at March 31, 2010. The total market value of securities on loan at March 31, 2010 was $173,152 ($ Thousands). |
| (B) | This security was purchased with cash collateral received from on loan. The total value of such securities as of March 31, 2010 was $173,839 ($ Thousands). |
| (C) | The rate reported is the effective yield at the time of purchase. |
| (D) | Security, or portion thereof, has been pledged as collateral on open futures. |
ADR — American Depositary Receipt
Cl — Class
L.P. — Limited Partnership
Ser — Series
| 8 | SEI Institutional Managed Trust / Semi-Annual Report / March 31, 2010 |
Table of Contents
Schedule of Investments (Unaudited)
S & P 500 Index Fund
March 31, 2010
| Description | Shares | Market Value ($ Thousands) | |||
COMMON STOCK — 97.9% | |||||
Consumer Discretionary — 10.0% | |||||
Abercrombie & Fitch, Cl A (A) | 11,300 | $ | 516 | ||
Amazon.com * | 44,200 | 5,999 | |||
Apollo Group, Cl A * | 17,403 | 1,066 | |||
Autonation * (A) | 13,326 | 241 | |||
Autozone * (A) | 3,894 | 674 | |||
Bed Bath & Beyond * (A) | 33,633 | 1,472 | |||
Best Buy | 44,641 | 1,899 | |||
Big Lots * | 9,913 | 361 | |||
Carnival | 57,284 | 2,227 | |||
CBS, Cl B (A) | 88,101 | 1,228 | |||
Coach (A) | 41,210 | 1,629 | |||
Comcast, Cl A | 369,322 | 6,951 | |||
Darden Restaurants | 18,813 | 838 | |||
DeVry | 8,200 | 535 | |||
DIRECTV, Cl A * | 121,400 | 4,105 | |||
Discovery Communications, Cl A * | 37,300 | 1,260 | |||
DR Horton | 38,649 | 487 | |||
Eastman Kodak (A) | 31,610 | 183 | |||
Expedia (A) | 26,700 | 667 | |||
Family Dollar Stores (A) | 17,322 | 634 | |||
Ford Motor * (A) | 438,280 | 5,509 | |||
Fortune Brands | 19,219 | 932 | |||
GameStop, Cl A * (A) | 22,600 | 495 | |||
Gannett (A) | 28,647 | 473 | |||
Gap | 63,731 | 1,473 | |||
Genuine Parts (A) | 20,136 | 850 | |||
Goodyear Tire & Rubber * | 30,693 | 388 | |||
H&R Block (A) | 42,804 | 762 | |||
Harley-Davidson (A) | 29,908 | 840 | |||
Harman International Industries | 8,500 | 398 | |||
Hasbro | 16,391 | 628 | |||
Home Depot | 221,396 | 7,162 | |||
International Game Technology | 40,856 | 754 | |||
Interpublic Group * (A) | 63,501 | 528 | |||
J.C. Penney (A) | 30,680 | 987 | |||
Johnson Controls | 86,957 | 2,869 | |||
Kohl’s * | 40,047 | 2,194 | |||
Leggett & Platt | 19,454 | 421 | |||
Lennar, Cl A | 23,407 | 403 | |||
Limited Brands (A) | 33,827 | 833 | |||
Lowe’s | 192,336 | 4,662 | |||
Macy’s | 54,564 | 1,188 | |||
Marriott International, Cl A (A) | 32,552 | 1,026 | |||
Mattel | 46,318 | 1,053 | |||
McDonald’s | 138,870 | 9,265 | |||
McGraw-Hill (A) | 40,521 | 1,445 | |||
Meredith (A) | 5,363 | 185 | |||
New York Times, Cl A * (A) | 14,392 | 160 | |||
Newell Rubbermaid (A) | 36,747 | 559 | |||
News, Cl A | 294,233 | 4,240 | |||
Nike, Cl B (A) | 51,094 | 3,755 | |||
Nordstrom (A) | 21,902 | 895 | |||
Office Depot * | 38,120 | 304 | |||
Omnicom Group | 40,304 | 1,564 | |||
O’Reilly Automotive * (A) | 18,600 | 776 | |||
Polo Ralph Lauren (A) | 7,400 | 629 | |||
priceline.com * (A) | 5,980 | 1,525 | |||
| Description | Shares | Market Value ($ Thousands) | |||
Pulte Homes * (A) | 41,982 | $ | 472 | ||
RadioShack | 15,025 | 340 | |||
Ross Stores (A) | 15,834 | 847 | |||
Scripps Networks Interactive, Cl A | 11,600 | 514 | |||
Sears Holdings * (A) | 6,065 | 657 | |||
Sherwin-Williams | 12,116 | 820 | |||
Snap-On | 6,953 | 301 | |||
Stanley Black & Decker (A) | 19,935 | 1,145 | |||
Staples | 93,214 | 2,180 | |||
Starbucks (A) | 96,058 | 2,331 | |||
Starwood Hotels & Resorts Worldwide (A) | 24,035 | 1,121 | |||
Target | 96,919 | 5,098 | |||
Tiffany | 15,773 | 749 | |||
Time Warner | 149,412 | 4,672 | |||
Time Warner Cable, Cl A (A) | 46,083 | 2,457 | |||
TJX | 53,667 | 2,282 | |||
Urban Outfitters * | 17,000 | 646 | |||
VF | 11,214 | 899 | |||
Viacom, Cl B * | 79,501 | 2,733 | |||
Walt Disney | 250,327 | 8,739 | |||
Washington Post, Cl B | 755 | 335 | |||
Whirlpool (A) | 9,905 | 864 | |||
Wyndham Worldwide | 22,902 | 589 | |||
Wynn Resorts * (A) | 9,200 | 698 | |||
Yum! Brands | 61,070 | 2,341 | |||
| 138,932 | |||||
Consumer Staples — 11.0% | |||||
Altria Group | 271,156 | 5,564 | |||
Archer-Daniels-Midland | 84,266 | 2,435 | |||
Avon Products | 55,051 | 1,864 | |||
Brown-Forman, Cl B | 13,695 | 814 | |||
Campbell Soup (A) | 25,775 | 911 | |||
Clorox | 18,842 | 1,209 | |||
Coca-Cola | 297,953 | 16,388 | |||
Coca-Cola Enterprises | 40,717 | 1,126 | |||
Colgate-Palmolive | 64,193 | 5,473 | |||
ConAgra Foods | 57,552 | 1,443 | |||
Constellation Brands, Cl A * | 25,800 | 424 | |||
Costco Wholesale (A) | 57,218 | 3,417 | |||
CVS Caremark | 180,935 | 6,615 | |||
Dean Foods * | 24,800 | 389 | |||
Dr Pepper Snapple Group | 32,600 | 1,147 | |||
Estee Lauder, Cl A (A) | 15,000 | 973 | |||
General Mills | 42,691 | 3,022 | |||
Hershey (A) | 21,112 | 904 | |||
HJ Heinz | 40,949 | 1,868 | |||
Hormel Foods | 8,500 | 357 | |||
JM Smucker | 16,148 | 973 | |||
Kellogg | 32,767 | 1,751 | |||
Kimberly-Clark | 54,199 | 3,408 | |||
Kraft Foods, Cl A | 226,098 | 6,837 | |||
Kroger | 85,159 | 1,845 | |||
Lorillard | 19,876 | 1,495 | |||
McCormick (A) | 16,461 | 632 | |||
Mead Johnson Nutrition, Cl A | 27,134 | 1,412 | |||
Molson Coors Brewing, Cl B (A) | 20,546 | 864 | |||
PepsiCo | 211,185 | 13,972 | |||
Philip Morris International | 242,965 | 12,673 | |||
Procter & Gamble | 375,601 | 23,764 | |||
| 1 | SEI Institutional Managed Trust / Semi-Annual Report / March 31, 2010 |
Table of Contents
Schedule of Investments (Unaudited)
S & P 500 Index Fund
March 31, 2010
| Description | Shares | Market Value ($ Thousands) | |||
Reynolds American (A) | 21,540 | $ | 1,163 | ||
Safeway (A) | 49,646 | 1,234 | |||
Sara Lee (A) | 89,687 | 1,249 | |||
SUPERVALU (A) | 26,397 | 440 | |||
SYSCO | 76,520 | 2,257 | |||
Tyson Foods, Cl A | 41,990 | 804 | |||
Walgreen | 126,844 | 4,705 | |||
Wal-Mart Stores | 275,744 | 15,331 | |||
Whole Foods Market * (A) | 23,200 | 839 | |||
| 153,991 | |||||
Energy — 10.6% | |||||
Anadarko Petroleum | 63,980 | 4,660 | |||
Apache | 43,700 | 4,435 | |||
Baker Hughes (A) | 40,234 | 1,885 | |||
BJ Services | 37,256 | 797 | |||
Cabot Oil & Gas (A) | 13,600 | 500 | |||
Cameron International * (A) | 31,500 | 1,350 | |||
Chesapeake Energy (A) | 84,100 | 1,988 | |||
Chevron | 259,678 | 19,691 | |||
ConocoPhillips | 191,943 | 9,822 | |||
Consol Energy | 23,500 | 1,002 | |||
Denbury Resources * (A) | 52,100 | 879 | |||
Devon Energy | 58,013 | 3,738 | |||
Diamond Offshore Drilling (A) | 8,900 | 790 | |||
El Paso | 89,194 | 967 | |||
EOG Resources (A) | 32,744 | 3,043 | |||
Exxon Mobil (A) | 610,844 | 40,914 | |||
FMC Technologies * | 15,500 | 1,002 | |||
Halliburton | 118,579 | 3,573 | |||
Helmerich & Payne | 13,900 | 529 | |||
Hess | 38,075 | 2,382 | |||
Marathon Oil | 92,956 | 2,941 | |||
Massey Energy (A) | 10,400 | 544 | |||
Murphy Oil | 24,963 | 1,403 | |||
Nabors Industries * (A) | 37,978 | 746 | |||
National Oilwell Varco | 54,868 | 2,227 | |||
Noble Energy | 22,700 | 1,657 | |||
Occidental Petroleum | 104,759 | 8,856 | |||
Peabody Energy | 34,700 | 1,586 | |||
Pioneer Natural Resources (A) | 14,700 | 828 | |||
Range Resources (A) | 21,200 | 994 | |||
Rowan * (A) | 14,597 | 425 | |||
Schlumberger (A) | 154,525 | 9,806 | |||
Smith International | 31,700 | 1,357 | |||
Southwestern Energy * | 45,100 | 1,836 | |||
Spectra Energy | 83,961 | 1,892 | |||
Sunoco (A) | 16,457 | 489 | |||
Tesoro (A) | 16,700 | 232 | |||
Valero Energy (A) | 72,808 | 1,434 | |||
Williams | 75,565 | 1,746 | |||
XTO Energy | 76,218 | 3,596 | |||
| 148,542 | |||||
Financials — 16.1% | |||||
Aflac | 61,408 | 3,334 | |||
Allstate | 70,159 | 2,267 | |||
American Express | 155,715 | 6,425 | |||
American International Group * (A) | 18,008 | 615 | |||
Ameriprise Financial | 33,184 | 1,505 | |||
AON (A) | 34,229 | 1,462 | |||
| Description | Shares | Market Value ($ Thousands) | |||
Apartment Investment & Management, Cl A † (A) | 15,239 | $ | 281 | ||
Assurant | 14,800 | 509 | |||
AvalonBay Communities † (A) | 10,208 | 881 | |||
Bank of America | 1,297,328 | 23,157 | |||
Bank of New York Mellon (A) | 157,386 | 4,860 | |||
BB&T (A) | 89,397 | 2,896 | |||
Berkshire Hathaway, Cl B * | 171,947 | 13,974 | |||
Berkshire Hathaway, Cl A * | 28 | 3,410 | |||
Boston Properties † (A) | 18,000 | 1,358 | |||
Capital One Financial | 59,562 | 2,466 | |||
CB Richard Ellis Group, Cl A * (A) | 34,600 | 549 | |||
Charles Schwab (A) | 124,627 | 2,329 | |||
Chubb | 42,456 | 2,201 | |||
Cincinnati Financial | 22,579 | 653 | |||
Citigroup * (A) | 2,537,185 | 10,276 | |||
CME Group | 8,607 | 2,721 | |||
Comerica (A) | 19,983 | 760 | |||
Discover Financial Services | 69,630 | 1,038 | |||
E*Trade Financial * | 206,639 | 341 | |||
Equity Residential † (A) | 36,140 | 1,415 | |||
Federated Investors, Cl B (A) | 10,545 | 278 | |||
Fifth Third Bancorp (A) | 102,411 | 1,392 | |||
First Horizon National * (A) | 27,571 | 387 | |||
Franklin Resources | 19,615 | 2,175 | |||
Genworth Financial, Cl A * | 65,900 | 1,209 | |||
Goldman Sachs Group | 67,956 | 11,595 | |||
Hartford Financial Services Group | 49,286 | 1,401 | |||
HCP † (A) | 37,600 | 1,241 | |||
Health Care † (A) | 15,400 | 696 | |||
Host Hotels & Resorts † (A) | 83,448 | 1,222 | |||
Hudson City Bancorp | 60,300 | 854 | |||
Huntington Bancshares | 100,875 | 542 | |||
IntercontinentalExchange * | 9,400 | 1,054 | |||
Invesco | 54,200 | 1,188 | |||
Janus Capital Group | 22,177 | 317 | |||
JPMorgan Chase | 513,757 | 22,991 | |||
Keycorp | 117,383 | 910 | |||
Kimco Realty † (A) | 52,100 | 815 | |||
Legg Mason (A) | 20,800 | 597 | |||
Leucadia National * | 24,000 | 595 | |||
Lincoln National | 38,798 | 1,191 | |||
Loews | 46,849 | 1,746 | |||
M&T Bank (A) | 10,561 | 838 | |||
Marsh & McLennan | 68,150 | 1,664 | |||
Marshall & Ilsley | 71,170 | 573 | |||
MetLife | 105,426 | 4,569 | |||
Moody’s (A) | 26,808 | 798 | |||
Morgan Stanley | 180,161 | 5,277 | |||
NASDAQ OMX Group * | 17,400 | 367 | |||
Northern Trust (A) | 31,105 | 1,719 | |||
NYSE Euronext | 33,200 | 983 | |||
People’s United Financial | 47,600 | 744 | |||
Plum Creek Timber † (A) | 20,535 | 799 | |||
PNC Financial Services Group (A) | 66,475 | 3,968 | |||
Principal Financial Group (A) | 41,548 | 1,214 | |||
Progressive | 87,368 | 1,668 | |||
Prologis † (A) | 60,060 | 793 | |||
Prudential Financial | 60,766 | 3,676 | |||
| 2 | SEI Institutional Managed Trust / Semi-Annual Report / March 31, 2010 |
Table of Contents
Schedule of Investments (Unaudited)
S & P 500 Index Fund
March 31, 2010
| Description | Shares | Market Value ($ Thousands) | |||
Public Storage † (A) | 17,528 | $ | 1,612 | ||
Regions Financial | 160,263 | 1,258 | |||
Simon Property Group † (A) | 37,402 | 3,138 | |||
SLM * (A) | 59,143 | 740 | |||
State Street | 64,891 | 2,929 | |||
SunTrust Banks (A) | 64,496 | 1,728 | |||
T. Rowe Price Group (A) | 33,408 | 1,835 | |||
Torchmark (A) | 10,405 | 557 | |||
Travelers | 65,952 | 3,557 | |||
Unum Group | 42,452 | 1,052 | |||
US Bancorp | 249,006 | 6,444 | |||
Ventas † (A) | 20,000 | 950 | |||
Vornado Realty Trust † (A) | 20,273 | 1,535 | |||
Wells Fargo | 669,863 | 20,846 | |||
XL Capital, Cl A (A) | 43,605 | 824 | |||
Zions Bancorporation (A) | 19,060 | 416 | |||
| 225,150 | |||||
Health Care — 11.9% | |||||
Abbott Laboratories | 200,446 | 10,560 | |||
Aetna | 55,502 | 1,949 | |||
Allergan | 40,266 | 2,630 | |||
AmerisourceBergen | 35,992 | 1,041 | |||
Amgen * | 127,518 | 7,621 | |||
Baxter International | 78,838 | 4,589 | |||
Becton Dickinson | 30,462 | 2,398 | |||
Biogen Idec * | 34,800 | 1,996 | |||
Boston Scientific * | 196,012 | 1,415 | |||
Bristol-Myers Squibb (A) | 222,975 | 5,953 | |||
C.R. Bard (A) | 12,688 | 1,099 | |||
Cardinal Health | 46,955 | 1,692 | |||
CareFusion * | 22,677 | 599 | |||
Celgene * | 60,300 | 3,736 | |||
Cephalon * (A) | 9,500 | 644 | |||
Cigna | 35,171 | 1,286 | |||
Coventry Health Care * | 18,513 | 458 | |||
DaVita * | 13,100 | 830 | |||
Dentsply International (A) | 18,400 | 641 | |||
Eli Lilly (A) | 132,230 | 4,789 | |||
Express Scripts * | 36,052 | 3,669 | |||
Forest Laboratories * | 38,663 | 1,212 | |||
Genzyme * | 34,332 | 1,779 | |||
Gilead Sciences * | 117,772 | 5,356 | |||
Hospira * | 20,704 | 1,173 | |||
Humana * | 21,697 | 1,015 | |||
Intuitive Surgical * | 4,920 | 1,713 | |||
Johnson & Johnson | 355,882 | 23,204 | |||
King Pharmaceuticals * (A) | 31,686 | 373 | |||
Laboratory Corp of America Holdings * (A) | 13,363 | 1,012 | |||
Life Technologies * | 23,843 | 1,246 | |||
McKesson | 34,869 | 2,291 | |||
Medco Health Solutions * | 59,616 | 3,849 | |||
Medtronic | 143,717 | 6,472 | |||
Merck | 402,644 | 15,039 | |||
Millipore * | 7,093 | 749 | |||
Mylan Laboratories * (A) | 38,911 | 884 | |||
Patterson (A) | 11,300 | 351 | |||
PerkinElmer | 14,040 | 336 | |||
Pfizer | 1,043,276 | 17,892 | |||
Quest Diagnostics (A) | 20,224 | 1,179 | |||
St. Jude Medical * | 41,856 | 1,718 | |||
| Description | Shares | Market Value ($ Thousands) | |||
Stryker (A) | 36,842 | $ | 2,108 | ||
Tenet Healthcare * | 51,876 | 297 | |||
Thermo Fisher Scientific * | 53,543 | 2,754 | |||
UnitedHealth Group | 149,047 | 4,869 | |||
Varian Medical Systems * (A) | 15,700 | 869 | |||
Waters * | 12,197 | 824 | |||
Watson Pharmaceuticals * (A) | 13,271 | 554 | |||
WellPoint * | 57,598 | 3,708 | |||
Zimmer Holdings * | 27,655 | 1,637 | |||
| 166,058 | |||||
Industrials — 10.3% | |||||
3M | 92,682 | 7,745 | |||
Avery Dennison | 15,715 | 572 | |||
Boeing (A) | 98,532 | 7,154 | |||
C.H. Robinson Worldwide (A) | 22,000 | 1,229 | |||
Caterpillar (A) | 81,397 | 5,116 | |||
Cintas (A) | 18,307 | 514 | |||
CSX | 51,350 | 2,614 | |||
Cummins | 25,840 | 1,601 | |||
Danaher | 33,948 | 2,713 | |||
Deere | 55,502 | 3,300 | |||
Dover | 23,737 | 1,110 | |||
Dun & Bradstreet | 6,300 | 469 | |||
Eaton | 21,369 | 1,619 | |||
Emerson Electric (A) | 98,306 | 4,949 | |||
Equifax (A) | 15,725 | 563 | |||
Expeditors International of Washington | 27,000 | 997 | |||
Fastenal (A) | 17,800 | 854 | |||
FedEx | 40,205 | 3,755 | |||
First Solar * (A) | 6,640 | 814 | |||
Flowserve | 7,100 | 783 | |||
Fluor | 23,444 | 1,090 | |||
General Dynamics | 49,626 | 3,831 | |||
General Electric | 1,379,874 | 25,114 | |||
Goodrich (A) | 16,020 | 1,130 | |||
Honeywell International | 99,255 | 4,493 | |||
Illinois Tool Works | 50,524 | 2,393 | |||
ITT | 23,500 | 1,260 | |||
Jacobs Engineering Group * | 16,900 | 764 | |||
L-3 Communications Holdings | 15,023 | 1,377 | |||
Lockheed Martin | 40,894 | 3,403 | |||
Masco | 47,668 | 740 | |||
Monster Worldwide * (A) | 15,034 | 250 | |||
Norfolk Southern | 48,226 | 2,695 | |||
Northrop Grumman | 39,119 | 2,565 | |||
PACCAR (A) | 47,191 | 2,045 | |||
Pall (A) | 15,495 | 627 | |||
Parker Hannifin | 20,671 | 1,338 | |||
Pitney Bowes (A) | 28,375 | 694 | |||
Precision Castparts | 18,300 | 2,319 | |||
Quanta Services * | 28,600 | 548 | |||
Raytheon | 49,068 | 2,803 | |||
Republic Services (A) | 43,583 | 1,265 | |||
Robert Half International (A) | 18,927 | 576 | |||
Rockwell Automation | 18,126 | 1,022 | |||
Rockwell Collins | 20,178 | 1,263 | |||
Roper Industries (A) | 12,000 | 694 | |||
RR Donnelley & Sons | 27,111 | 579 | |||
Ryder System | 7,254 | 281 | |||
Southwest Airlines | 95,049 | 1,256 | |||
| 3 | SEI Institutional Managed Trust / Semi-Annual Report / March 31, 2010 |
Table of Contents
Schedule of Investments (Unaudited)
S & P 500 Index Fund
March 31, 2010
| Description | Shares | Market Value ($ Thousands) | |||
Stericycle * (A) | 11,800 | $ | 643 | ||
Textron (A) | 34,598 | 735 | |||
Union Pacific | 65,694 | 4,816 | |||
United Parcel Service, Cl B | 128,111 | 8,251 | |||
United Technologies | 120,832 | 8,894 | |||
Waste Management | 62,028 | 2,135 | |||
WW Grainger | 7,965 | 861 | |||
| 143,221 | |||||
Information Technology — 18.5% | |||||
Adobe Systems * | 68,836 | 2,435 | |||
Advanced Micro Devices * (A) | 70,763 | 656 | |||
Agilent Technologies * | 44,506 | 1,531 | |||
Akamai Technologies * (A) | 21,600 | 678 | |||
Altera (A) | 37,551 | 913 | |||
Amphenol, Cl A | 23,500 | 991 | |||
Analog Devices | 39,899 | 1,150 | |||
Apple * | 117,331 | 27,564 | |||
Applied Materials | 174,550 | 2,353 | |||
Autodesk * (A) | 29,317 | 862 | |||
Automatic Data Processing | 65,950 | 2,933 | |||
BMC Software * | 23,149 | 880 | |||
Broadcom, Cl A | 55,936 | 1,856 | |||
CA | 50,527 | 1,186 | |||
Cisco Systems * | 740,304 | 19,270 | |||
Citrix Systems * (A) | 23,442 | 1,113 | |||
Cognizant Technology Solutions, Cl A * | 38,300 | 1,952 | |||
Computer Sciences * | 20,733 | 1,130 | |||
Compuware * | 30,175 | 253 | |||
Corning | 203,178 | 4,106 | |||
Dell * (A) | 226,174 | 3,395 | |||
eBay * | 147,632 | 3,979 | |||
Electronic Arts * | 43,978 | 821 | |||
EMC * | 266,840 | 4,814 | |||
Fidelity National Information Services | 44,765 | 1,049 | |||
Fiserv * | 19,980 | 1,014 | |||
Flir Systems * | 19,200 | 541 | |||
Google, Cl A * | 31,191 | 17,686 | |||
Harris | 16,700 | 793 | |||
Hewlett-Packard | 304,265 | 16,172 | |||
Intel | 713,915 | 15,892 | |||
International Business Machines | 167,937 | 21,538 | |||
Intuit * | 40,786 | 1,401 | |||
Iron Mountain | 24,800 | 679 | |||
Jabil Circuit | 25,979 | 421 | |||
JDS Uniphase * | 29,456 | 369 | |||
Juniper Networks * (A) | 68,200 | 2,093 | |||
Kla-Tencor | 21,771 | 673 | |||
Lexmark International, Cl A * | 10,239 | 369 | |||
Linear Technology (A) | 30,494 | 862 | |||
LSI Logic * | 91,546 | 560 | |||
Mastercard, Cl A (A) | 12,600 | 3,200 | |||
McAfee * | 21,200 | 851 | |||
MEMC Electronic Materials * (A) | 29,300 | 449 | |||
Microchip Technology (A) | 23,100 | 651 | |||
Micron Technology * (A) | 109,569 | 1,138 | |||
Microsoft | 986,993 | 28,889 | |||
Molex (A) | 17,460 | 364 | |||
| Description | Shares | Market Value ($ Thousands) | |||
Motorola * | 300,906 | $ | 2,113 | ||
National Semiconductor | 29,337 | 424 | |||
NetApp * | 45,476 | 1,481 | |||
Novell * | 40,689 | 244 | |||
Novellus Systems * (A) | 11,727 | 293 | |||
Nvidia * | 74,048 | 1,287 | |||
Oracle | 504,988 | 12,973 | |||
Paychex (A) | 41,456 | 1,273 | |||
QLogic * (A) | 14,148 | 287 | |||
Qualcomm | 216,932 | 9,109 | |||
Red Hat * | 25,400 | 743 | |||
SAIC * | 38,844 | 688 | |||
Salesforce.com * (A) | 14,000 | 1,042 | |||
SanDisk * (A) | 30,200 | 1,046 | |||
Symantec * | 106,447 | 1,801 | |||
Tellabs | 50,899 | 385 | |||
Teradata * | 22,868 | 661 | |||
Teradyne * (A) | 20,307 | 227 | |||
Texas Instruments | 159,649 | 3,907 | |||
Total System Services (A) | 24,380 | 382 | |||
VeriSign * | 23,000 | 598 | |||
Visa, Cl A (A) | 57,472 | 5,232 | |||
Western Digital * | 30,400 | 1,185 | |||
Western Union | 89,812 | 1,523 | |||
Xerox (A) | 177,606 | 1,732 | |||
Xilinx (A) | 37,609 | 959 | |||
Yahoo! * | 156,338 | 2,584 | |||
| 258,654 | |||||
Materials — 3.4% | |||||
Air Products & Chemicals | 27,526 | 2,035 | |||
Airgas | 10,400 | 662 | |||
AK Steel Holding (A) | 14,800 | 338 | |||
Alcoa (A) | 126,735 | 1,805 | |||
Allegheny Technologies (A) | 12,259 | 662 | |||
Ball | 11,891 | 635 | |||
Bemis | 14,490 | 416 | |||
CF Industries Holdings (A) | 6,690 | 610 | |||
Cliffs Natural Resources (A) | 16,611 | 1,178 | |||
Dow Chemical (A) | 149,475 | 4,420 | |||
E.I. Du Pont de Nemours | 118,035 | 4,395 | |||
Eastman Chemical | 9,608 | 612 | |||
Ecolab (A) | 30,930 | 1,359 | |||
FMC | 9,000 | 545 | |||
Freeport-McMoRan Copper & Gold, Cl B | 55,968 | 4,676 | |||
International Flavors & Fragrances | 9,794 | 467 | |||
International Paper | 56,070 | 1,380 | |||
MeadWestvaco | 21,515 | 549 | |||
Monsanto | 70,248 | 5,017 | |||
Newmont Mining | 63,908 | 3,255 | |||
Nucor (A) | 40,882 | 1,855 | |||
Owens-Illinois * | 22,600 | 803 | |||
Pactiv * | 18,487 | 466 | |||
PPG Industries (A) | 21,545 | 1,409 | |||
Praxair (A) | 39,999 | 3,320 | |||
Sealed Air | 19,828 | 418 | |||
Sigma-Aldrich | 15,536 | 834 | |||
Titanium Metals * (A) | 12,100 | 201 | |||
United States Steel (A) | 18,326 | 1,164 | |||
Vulcan Materials (A) | 17,149 | 810 | |||
| 4 | SEI Institutional Managed Trust / Semi-Annual Report / March 31, 2010 |
Table of Contents
Schedule of Investments (Unaudited)
S & P 500 Index Fund
March 31, 2010
| Description | Shares | Market Value ($ Thousands) | |||
Weyerhaeuser | 26,988 | $ | 1,222 | ||
| 47,518 | |||||
Telecommunication Services — 2.7% | |||||
American Tower, Cl A * | 52,000 | 2,216 | |||
AT&T | 763,040 | 19,717 | |||
CenturyTel (A) | 37,992 | 1,347 | |||
Frontier Communications (A) | 38,531 | 287 | |||
MetroPCS Communications * (A) | 33,700 | 238 | |||
Qwest Communications International | 201,626 | 1,052 | |||
Sprint Nextel * | 378,322 | 1,438 | |||
Verizon Communications | 366,298 | 11,363 | |||
Windstream (A) | 61,246 | 667 | |||
| 38,325 | |||||
Utilities — 3.4% | |||||
AES * | 85,990 | 946 | |||
Allegheny Energy | 20,968 | 482 | |||
Ameren | 31,044 | 810 | |||
American Electric Power | 61,715 | 2,109 | |||
Centerpoint Energy | 48,868 | 702 | |||
CMS Energy (A) | 28,292 | 437 | |||
Consolidated Edison (A) | 36,133 | 1,609 | |||
Constellation Energy Group | 25,599 | 899 | |||
Dominion Resources (A) | 78,140 | 3,212 | |||
DTE Energy | 21,045 | 939 | |||
Duke Energy (A) | 169,522 | 2,767 | |||
Edison International | 42,553 | 1,454 | |||
Entergy | 24,364 | 1,982 | |||
Equities | 16,500 | 676 | |||
Exelon | 86,054 | 3,770 | |||
FirstEnergy (A) | 39,587 | 1,547 | |||
FPL Group | 54,020 | 2,611 | |||
Integrys Energy Group | 9,434 | 447 | |||
Nicor | 5,325 | 223 | |||
NiSource | 34,479 | 545 | |||
Northeast Utilities | 21,900 | 605 | |||
NRG Energy * | 33,700 | 704 | |||
Oneok | 13,900 | 635 | |||
Pepco Holdings | 27,500 | 472 | |||
PG&E (A) | 47,929 | 2,033 | |||
Pinnacle West Capital | 12,549 | 474 | |||
PPL | 48,871 | 1,354 | |||
Progress Energy | 36,483 | 1,436 | |||
Public Service Enterprise Group | 66,230 | 1,955 | |||
Questar | 22,200 | 959 | |||
SCANA | 14,500 | 545 | |||
Sempra Energy | 31,965 | 1,595 | |||
Southern | 104,335 | 3,460 | |||
TECO Energy (A) | 26,212 | 417 | |||
Wisconsin Energy | 14,700 | 726 | |||
Xcel Energy | 59,219 | 1,257 | |||
| 46,794 | |||||
Total Common Stock | 1,367,185 | ||||
| Description | Shares/Face Amount ($ Thousands) | Market Value ($ Thousands) | ||||
AFFILIATED PARTNERSHIP — 15.5% | ||||||
SEI Liquidity Fund, L.P., | ||||||
0.210% (B)**†† | 220,012,375 | $ | 216,555 | |||
Total Affiliated Partnership | 216,555 | |||||
CASH EQUIVALENT — 2.5% | ||||||
SEI Daily Income Trust, Prime Obligation Fund, Cl A, 0.070%**†† | 34,230,982 | 34,231 | ||||
Total Cash Equivalent | 34,231 | |||||
U.S. TREASURY OBLIGATIONS (C) (D) — 0.2% | ||||||
U.S. Treasury Bills | ||||||
0.000%, 05/27/10 | $ | 150 | 150 | |||
U.S. Cash Management Bill | ||||||
0.140%, 06/17/10 | 2,895 | 2,894 | ||||
Total U.S. Treasury Obligations | 3,044 | |||||
Total Investments — 116.1% | $ | 1,621,015 | ||||
A summary of the open futures contracts held by the Fund at March 31, 2010, is as follows:
| Type of Contract | Number of Contracts Long (Short) | Expiration Date | Unrealized Appreciation ($ Thousands) | ||||
S&P 500 Index EMINI | 668 | Jun-2010 | $ | 640 | |||
For the period ended March 31, 2010, the total amount of all open futures contracts as presented in the table above, are representative of the volume of activity for this derivative type during the period.
Percentages are based on Net Assets of $1,396,111 ($ Thousands).
| * | Non-income producing security. |
| ** | Rate shown is the 7-day effective yield as of March 31, 2010. |
| † | Real Estate Investment Trust. |
| †† | Investment in Affiliated Security. |
| (A) | This security or a partial position of this security is on loan at March 31, 2010. The total market value of securities on loan at March 31, 2010 was $213,600 ($ Thousands). |
| (B) | This security was purchased with cash collateral received from securities on loan. The total value of such securities as of March 31, 2010 was $216,555 ($ Thousands). |
| (C) | The rate reported is the effective yield at the time of purchase. |
| (D) | Security, or portion thereof, has been pledged as collateral on open futures. |
Cl — Class
L.P. — Limited Partnership
| 5 | SEI Institutional Managed Trust / Semi-Annual Report / March 31, 2010 |
Table of Contents
Schedule of Investments (Unaudited)
Small Cap Fund
March 31, 2010
| Description | Shares | Market Value ($ Thousands) | |||
COMMON STOCK — 81.9% | |||||
Consumer Discretionary — 13.4% | |||||
Aaron Rents | 5,400 | $ | 180 | ||
American Axle & Manufacturing Holdings * | 9,200 | 92 | |||
American Eagle Outfitters | 12,800 | 237 | |||
American Greetings, Cl A | 10,600 | 221 | |||
American Public Education * | 13,054 | 608 | |||
America’s Car-Mart * | 6,800 | 164 | |||
Ameristar Casinos | 23,701 | 432 | |||
AnnTaylor Stores * | 10,600 | 219 | |||
ArvinMeritor * | 14,800 | 198 | |||
ATC Technology * | 8,900 | 153 | |||
Bally Technologies * | 9,401 | 381 | |||
Barnes & Noble | 10,800 | 234 | |||
Beazer Homes USA * | 23,800 | 108 | |||
Big 5 Sporting Goods | 8,600 | 131 | |||
Big Lots * | 2,100 | 76 | |||
Bluegreen * | 4,600 | 15 | |||
Blyth | 900 | 28 | |||
Brinker International | 8,063 | 155 | |||
Brown Shoe | 46,300 | 717 | |||
Brunswick | 10,300 | 165 | |||
Buckle | 2,800 | 103 | |||
Buffalo Wild Wings * | 4,360 | 210 | |||
California Pizza Kitchen * | 21,700 | 364 | |||
Callaway Golf | 29,398 | 259 | |||
Capella Education * | 1,000 | 93 | |||
Carter’s * | 10,700 | 323 | |||
Casual Male Retail Group * | 53,900 | 208 | |||
Cato, Cl A | 39,394 | 845 | |||
CEC Entertainment * | 10,200 | 389 | |||
Charming Shoppes * | 13,600 | 74 | |||
Cheesecake Factory * | 16,016 | 433 | |||
Chico’s FAS | 11,264 | 162 | |||
Christopher & Banks | 18,700 | 150 | |||
Cinemark Holdings | 15,500 | 284 | |||
Citi Trends * | 9,400 | 305 | |||
Cooper Tire & Rubber | 34,202 | 650 | |||
Core-Mark Holding * | 3,100 | 95 | |||
Corinthian Colleges * | 16,600 | 292 | |||
Cracker Barrel Old Country Store | 13,700 | 635 | |||
Dana Holding * | 38,920 | 462 | |||
Deckers Outdoor * | 3,300 | 455 | |||
Dillard’s, Cl A | 8,200 | 194 | |||
DineEquity * | 2,600 | 103 | |||
Domino’s Pizza * | 9,100 | 124 | |||
Dress Barn * | 9,053 | 237 | |||
DSW, Cl A * | 11,100 | 283 | |||
Eastman Kodak | 108,800 | 630 | |||
Entercom Communications * | 21,748 | 259 | |||
Ethan Allen Interiors | 3,600 | 74 | |||
Exide Technologies * | 8,400 | 48 | |||
Finish Line, Cl A | 39,300 | 641 | |||
Foot Locker | 42,260 | 636 | |||
Fossil * | 13,546 | 511 | |||
Fred’s, Cl A | 18,150 | 217 | |||
Furniture Brands International * | 11,900 | 76 | |||
Genesco * | 11,500 | 357 | |||
Gymboree * | 755 | 39 | |||
Hillenbrand | 17,800 | 392 | |||
| Description | Shares | Market Value ($ Thousands) | |||
HOT Topic * | 64,810 | $ | 421 | ||
HSN * | 29,455 | 867 | |||
Iconix Brand Group * | 59,875 | 920 | |||
Insight Enterprises * | 19,300 | 277 | |||
Interval Leisure Group * | 2,800 | 41 | |||
Isle of Capri Casinos * | 30,402 | 237 | |||
J Crew Group * | 6,421 | 295 | |||
Jack in the Box * | 5,200 | 122 | |||
Jo-Ann Stores * | 8,811 | 370 | |||
Jones Apparel Group | 22,950 | 437 | |||
JOS A Bank Clothiers * | 9,400 | 514 | |||
Kirkland’s * | 46,302 | 972 | |||
Knology * | 16,436 | 221 | |||
Lakeland Industries * | 21,300 | 181 | |||
Las Vegas Sands * | 8,200 | 173 | |||
Leggett & Platt | 3,800 | 82 | |||
Lennar, Cl A | 9,525 | 164 | |||
Life Time Fitness * | 16,819 | 473 | |||
Lifetime Brands * | 10,600 | 125 | |||
Lincoln Educational Services * | 12,300 | 311 | |||
Lions Gate Entertainment * | 28,500 | 178 | |||
Live Nation * | 16,100 | 233 | |||
Lodgenet Entertainment * | 13,800 | 96 | |||
Lululemon Athletica * | 23,294 | 967 | |||
Lumber Liquidators Holdings * | 385 | 10 | |||
Marcus | 5,429 | 71 | |||
Matthews International, Cl A | 4,200 | 149 | |||
MDC Partners, Cl A | 75,600 | 782 | |||
Media General, Cl A * | 9,600 | 80 | |||
Men’s Wearhouse | 3,100 | 74 | |||
Morningstar * | 1,800 | 87 | |||
New Frontier Media * | 48,400 | 97 | |||
Nutri/System | 5,200 | 93 | |||
Office Depot * | 31,500 | 251 | |||
OfficeMax * | 33,320 | 547 | |||
Orient-Express Hotels, Cl A * | 20,181 | 286 | |||
Oxford Industries | 15,600 | 317 | |||
Papa John’s International * | 2,113 | 54 | |||
Penske Auto Group * | 6,200 | 89 | |||
PF Chang’s China Bistro * | 8,900 | 393 | |||
Phillips-Van Heusen | 5,277 | 303 | |||
Pinnacle Entertainment * | 50,965 | 496 | |||
Polaris Industries | 3,700 | 189 | |||
Pool | 8,400 | 190 | |||
Pre-Paid Legal Services * | 2,700 | 102 | |||
Princeton Review * | 55,100 | 192 | |||
Pulte Homes * | 19,500 | 219 | |||
RadioShack | 3,500 | 79 | |||
RC2 * | 14,700 | 220 | |||
Regis | 25,100 | 469 | |||
Ryland Group | 32,400 | 727 | |||
Sealy * | 23,300 | 82 | |||
Shutterfly * | 13,500 | 325 | |||
Signet Jewelers * | 1,700 | 55 | |||
Sonic Automotive, Cl A * | 9,200 | 101 | |||
Sotheby’s | 9,300 | 289 | |||
Spartan Motors | 6,000 | 34 | |||
Stage Stores | 39,300 | 605 | |||
Stamps.com * | 4,000 | 40 | |||
Standard-Pacific * | 23,600 | 107 | |||
Steiner Leisure * | 6,123 | 272 | |||
Stewart Enterprises, Cl A | 21,900 | 137 | |||
| 1 | SEI Institutional Managed Trust / Semi-Annual Report / March 31, 2010 |
Table of Contents
Schedule of Investments (Unaudited)
Small Cap Fund
March 31, 2010
| Description | Shares | Market Value ($ Thousands) | |||
Stoneridge * | 6,300 | $ | 62 | ||
Sturm Ruger | 30,880 | 370 | |||
Systemax | 3,900 | 85 | |||
Tempur-Pedic International * | 32,695 | 986 | |||
Tenneco * | 41,743 | 987 | |||
Texas Roadhouse, Cl A * | 5,800 | 81 | |||
Tractor Supply | 5,221 | 303 | |||
Tupperware Brands | 14,985 | 723 | |||
Ulta Salon Cosmetics & Fragrance * | 16,525 | 374 | |||
Under Armour, Cl A * | 7,425 | 218 | |||
Unifirst | 1,700 | 88 | |||
Universal Electronics * | 1,600 | 36 | |||
Universal Technical Institute * | 5,300 | 121 | |||
Volcom * | 7,300 | 142 | |||
Wendy’s, Cl A | 48,921 | 245 | |||
Williams-Sonoma | 6,800 | 179 | |||
Wolverine World Wide | 6,900 | 201 | |||
| 38,617 | |||||
Consumer Staples — 3.6% | |||||
Alliance One International * | 62,100 | 316 | |||
American Italian Pasta, Cl A * | 13,899 | 540 | |||
Andersons | 5,700 | 191 | |||
Cal-Maine Foods | 6,700 | 227 | |||
Casey’s General Stores | 8,600 | 270 | |||
China-Biotics * | 6,000 | 107 | |||
Chiquita Brands International * | 37,300 | 587 | |||
Cosan SA Industria e Comercio (Brazil) * | 22,500 | 272 | |||
Darling International * | 36,500 | 327 | |||
Del Monte Foods | 37,800 | 552 | |||
Flowers Foods | 4,100 | 102 | |||
Fresh Del Monte Produce * | 4,600 | 93 | |||
Great Atlantic & Pacific Tea * | 25,400 | 195 | |||
Herbalife | 5,654 | 261 | |||
J&J Snack Foods | 5,600 | 243 | |||
Kulim Malaysia | 161,300 | 352 | |||
Lancaster Colony | 8,197 | 483 | |||
Lance | 24,500 | 567 | |||
Mead Johnson Nutrition, Cl A | 1,300 | 68 | |||
Medifast * | 28,633 | 719 | |||
Molson Coors Brewing, Cl B | 2,600 | 109 | |||
NBTY * | 6,400 | 307 | |||
Nu Skin Enterprises, Cl A | 21,600 | 629 | |||
Pantry * | 20,000 | 250 | |||
Pricesmart | 2,200 | 51 | |||
Ruddick | 23,350 | 739 | |||
Smart Balance * | 62,169 | 403 | |||
TreeHouse Foods * | 9,600 | 421 | |||
United Natural Foods * | 6,954 | 196 | |||
Universal | 2,700 | 143 | |||
USANA Health Sciences * | 2,100 | 66 | |||
Vector Group | 8,506 | 131 | |||
Viterra, Cl Common Subscription Recei * | 26,900 | 254 | |||
Weis Markets | 690 | 25 | |||
Winn-Dixie Stores * | 17,093 | 213 | |||
| 10,409 | |||||
Energy — 5.0% | |||||
Allis-Chalmers Energy * | 21,000 | 74 | |||
American Oil & Gas * | 31,900 | 217 | |||
| Description | Shares | Market Value ($ Thousands) | |||
Approach Resources * | 29,300 | $ | 266 | ||
Arena Resources * | 300 | 10 | |||
Atlas Energy | 5,686 | 177 | |||
Basic Energy Services * | 6,100 | 47 | |||
Berry Petroleum, Cl A | 9,100 | 256 | |||
BPZ Resources * | 82,377 | 606 | |||
Brigham Exploration * | 10,800 | 172 | |||
Bristow Group * | 2,400 | 91 | |||
Cal Dive International * | 25,900 | 190 | |||
CARBO Ceramics | 4,700 | 293 | |||
Carrizo Oil & Gas * | 10,000 | 230 | |||
Clayton Williams Energy * | 8,200 | 287 | |||
Clean Energy Fuels * | 3,000 | 68 | |||
Complete Production Services * | 10,100 | 117 | |||
Comstock Resources * | 12,325 | 392 | |||
Contango Oil & Gas * | 3,515 | 180 | |||
CVR Energy * | 34,400 | 301 | |||
Delek US Holdings | 5,200 | 38 | |||
Dril-Quip * | 200 | 12 | |||
Energy Partners * | 5,600 | 68 | |||
Exterran Holdings * | 7,500 | 181 | |||
GeoMet * | 51,600 | 46 | |||
Global Industries * | 25,317 | 162 | |||
GMX Resources * | 19,461 | 160 | |||
Goodrich Petroleum * | 9,533 | 149 | |||
Gulfport Energy * | 4,400 | 49 | |||
Helix Energy Solutions Group * | 15,800 | 206 | |||
Hercules Offshore * | 34,700 | 150 | |||
Holly | 4,000 | 112 | |||
Hornbeck Offshore Services * | 9,400 | 175 | |||
Key Energy Services * | 52,000 | 497 | |||
Kodiak Oil & Gas * | 87,947 | 300 | |||
Lufkin Industries | 3,000 | 237 | |||
McMoRan Exploration * | 19,500 | 285 | |||
Nordic American Tanker Shipping, Cl US | 4,600 | 139 | |||
Northern Oil And Gas * | 21,200 | 336 | |||
Oilsands Quest * (A) | 429,500 | 318 | |||
Overseas Shipholding Group | 3,200 | 126 | |||
Patterson-UTI Energy | 3,600 | 50 | |||
PetroHawk Energy * | 35,100 | 712 | |||
Petroquest Energy * | 40,713 | 205 | |||
Pioneer Drilling * | 20,264 | 143 | |||
Quicksilver Resources * | 19,759 | 278 | |||
Rentech * | 77,000 | 79 | |||
Rosetta Resources * | 9,900 | 233 | |||
SandRidge Energy * | 85,860 | 661 | |||
Scorpio Tankers * | 30,200 | 379 | |||
Ship Finance International | 4,800 | 85 | |||
StealthGas | 27,900 | 141 | |||
Swift Energy * | 10,400 | 320 | |||
T-3 Energy Services, Cl 3 * | 9,300 | 228 | |||
Teekay Shipping | 10,700 | 243 | |||
Tesoro | 13,600 | 189 | |||
Tetra Technologies * | 3,200 | 39 | |||
Tidewater | 2,055 | 97 | |||
USEC * | 37,100 | 214 | |||
Vaalco Energy | 52,040 | 257 | |||
Venoco * | 34,235 | 439 | |||
W&T Offshore | 41,652 | 350 | |||
Western Refining * | 14,300 | 79 | |||
Willbros Group * | 46,600 | 560 | |||
| 2 | SEI Institutional Managed Trust / Semi-Annual Report / March 31, 2010 |
Table of Contents
Schedule of Investments (Unaudited)
Small Cap Fund
March 31, 2010
| Description | Shares | Market Value ($ Thousands) | |||
World Fuel Services | 27,000 | $ | 719 | ||
| 14,420 | |||||
Financials — 13.2% | |||||
Allied World Assurance Holdings | 3,300 | 148 | |||
American Campus Communities † | 4,600 | 127 | |||
Amtrust Financial Services | 20,700 | 289 | |||
Annaly Capital Management † | 14,340 | 246 | |||
Anworth Mortgage Asset † | 68,258 | 460 | |||
Apollo Investment *(B) | 11,762 | 150 | |||
Ashford Hospitality Trust * † | 8,600 | 62 | |||
Aspen Insurance Holdings | 8,200 | 236 | |||
Associated Banc-Corp | 26,756 | 369 | |||
Associated Estates Realty † | 20,100 | 277 | |||
Axis Capital Holdings | 2,800 | 87 | |||
Bancorp Rhode Island | 3,800 | 104 | |||
Bank of the Ozarks | 5,584 | 197 | |||
BGC Partners, Cl A | 26,500 | 162 | |||
Boston Private Financial Holdings | 19,600 | 145 | |||
Brasil Brokers Participacoes | 50,700 | 220 | |||
Calamos Asset Management, Cl A | 14,075 | 202 | |||
CapitalSource | 31,882 | 178 | |||
Capstead Mortgage † | 24,900 | 298 | |||
Cardinal Financial | 19,500 | 208 | |||
Cathay General Bancorp | 17,000 | 198 | |||
Cedar Shopping Centers † | 28,960 | 229 | |||
Centerstate Banks | 10,900 | 134 | |||
Chemical Financial | 4,700 | 111 | |||
Chimera Investment † | 102,168 | 397 | |||
Cincinnati Financial | 3,800 | 110 | |||
Cogdell Spencer † | 36,100 | 267 | |||
Cohen & Steers | 4,000 | 100 | |||
Colonial Properties Trust † | 20,100 | 259 | |||
Community Bank System | 10,400 | 237 | |||
Cowen Group, Cl A * | 59,400 | 336 | |||
Crawford, Cl B * | 4,200 | 17 | |||
CreXus Investment † | 14,900 | 199 | |||
Delphi Financial Group, Cl A | 14,500 | 365 | |||
Developers Diversified Realty † | 41,742 | 508 | |||
Dollar Financial * | 12,831 | 309 | |||
Duff & Phelps | 14,800 | 248 | |||
DuPont Fabros Technology † | 14,473 | 313 | |||
E*Trade Financial * | 127,900 | 211 | |||
EastGroup Properties † | 2,122 | 80 | |||
Education Realty Trust † | 48,000 | 276 | |||
eHealth * | 2,700 | 42 | |||
EMC Insurance Group | 1,200 | 27 | |||
Encore Bancshares * | 9,550 | 91 | |||
Equity Lifestyle Properties † | 2,162 | 117 | |||
Equity One † | 10,800 | 204 | |||
ESSA Bancorp | 8,486 | 106 | |||
FBR Capital Markets * | 66,900 | 304 | |||
First Bancorp | 60,700 | 146 | |||
First Cash Financial Services * | 672 | 14 | |||
First Commonwealth Financial | 9,900 | 66 | |||
First Financial Bancorp | 54,140 | 963 | |||
First Industrial Realty Trust * † | 16,400 | 127 | |||
FirstMerit | 15,447 | 333 | |||
Flushing Financial | 25,600 | 324 | |||
FNB (Pennsylvania) | 13,600 | 110 | |||
| Description | Shares | Market Value ($ Thousands) | |||
Fpic Insurance Group * | 9,300 | $ | 252 | ||
Fulton Financial | 26,380 | 269 | |||
General Shopping Brasil (Brazil) * | 50,600 | 247 | |||
Getty Realty † | 2,000 | 47 | |||
Gladstone Capital | 5,200 | 61 | |||
Gluskin Sheff + Associates | 9,900 | 217 | |||
Great American Group * | 54,800 | 121 | |||
Greenhill | 3,691 | 303 | |||
Hancock Holding | 14,520 | 607 | |||
Hanover Insurance Group | 10,400 | 453 | |||
Harleysville Group | 2,400 | 81 | |||
Hatteras Financial † | 3,600 | 93 | |||
Hercules Technology Growth Capital | 10,800 | 114 | |||
Highwoods Properties † | 20,100 | 638 | |||
Home Bancshares | 11,300 | 299 | |||
Home Federal Bancorp | 8,800 | 128 | |||
Hudson Valley Holding | 11,170 | 270 | |||
Infinity Property & Casualty | 2,500 | 114 | |||
Inland Real Estate † | 33,600 | 308 | |||
International Assets Holding * | 1 | — | |||
Investors Real Estate Trust † | 30,000 | 271 | |||
iStar Financial † | 32,928 | 151 | |||
KBW * | 7,800 | 210 | |||
Kennedy-Wilson Holdings * | 10,500 | 107 | |||
Knight Capital Group, Cl A * | 16,720 | 255 | |||
Lexington Realty Trust † | 31,400 | 204 | |||
Life Partners Holdings | 7,750 | 172 | |||
LTC Properties † | 17,523 | 474 | |||
Max Capital Group | 9,900 | 228 | |||
MB Financial | 23,100 | 521 | |||
Meadowbrook Insurance Group | 79,700 | 630 | |||
Medical Properties Trust † | 9,100 | 95 | |||
MF Global Holdings * | 26,950 | 218 | |||
MFA Financial † | 68,400 | 503 | |||
MGIC Investment * | 63,890 | 701 | |||
Mid-America Apartment Communities † | 951 | 49 | |||
National Penn Bancshares | 81,600 | 563 | |||
National Retail Properties † | 18,750 | 428 | |||
Nationwide Health Properties † | 2,200 | 77 | |||
Nelnet, Cl A | 32,200 | 598 | |||
NewAlliance Bancshares | 2,392 | 30 | |||
Northwest Bancshares | 7,700 | 90 | |||
NYSE Euronext | 3,800 | 112 | |||
Old National Bancorp | 15,000 | 179 | |||
Omega Healthcare Investors † | 1,100 | 21 | |||
optionsXpress Holdings | 12,453 | 203 | |||
Pacific Continental | 19,050 | 200 | |||
PacWest Bancorp | 12,755 | 291 | |||
Pennsylvania Real Estate Investment Trust † | 8,700 | 109 | |||
Penson Worldwide * | 400 | 4 | |||
PHH * | 10,400 | 245 | |||
Phoenix * | 33,200 | 80 | |||
Platinum Underwriters Holdings | 8,700 | 323 | |||
PMA Capital, Cl A * | 24,756 | 152 | |||
Post Properties † | 15,450 | 340 | |||
Potlatch † | 2,977 | 104 | |||
Prosperity Bancshares | 4,500 | 185 | |||
Provident Financial Services | 4,000 | 48 | |||
PS Business Parks † | 200 | 11 | |||
| 3 | SEI Institutional Managed Trust / Semi-Annual Report / March 31, 2010 |
Table of Contents
Schedule of Investments (Unaudited)
Small Cap Fund
March 31, 2010
| Description | Shares | Market Value ($ Thousands) | |||
Radian Group | 53,963 | $ | 844 | ||
RAIT Financial Trust † | 50,800 | 101 | |||
Redwood Trust † | 11,700 | 180 | |||
Renasant | 11,100 | 180 | |||
Riskmetrics Group * | 672 | 15 | |||
RLI | 5,000 | 285 | |||
S&T Bancorp | 5,000 | 105 | |||
Safeguard Scientifics * | 6,700 | 87 | |||
Safety Insurance Group | 5,209 | 196 | |||
SCBT Financial | 7,300 | 270 | |||
SeaBright Insurance Holdings | 12,300 | 135 | |||
Seacoast Banking Corp of Florida | 57,500 | 98 | |||
Selective Insurance Group | 5,100 | 85 | |||
Senior Housing Properties Trust † | 5,600 | 124 | |||
Signature Bank NY * | 1,900 | 70 | |||
Simmons First National, Cl A | 4,800 | 132 | |||
Sovran Self Storage † | 4,300 | 150 | |||
Starwood Property Trust † | 13,000 | 251 | |||
Sunstone Hotel Investors * † | 44,980 | 502 | |||
Susquehanna Bancshares | 85,540 | 839 | |||
SVB Financial Group * | 3,800 | 177 | |||
SWS Group | 12,500 | 144 | |||
Synovus Financial | 61,475 | 202 | |||
Tanger Factory Outlet Centers † | 2,200 | 95 | |||
TD Ameritrade Holding * | 11,700 | 223 | |||
Texas Capital Bancshares * | 14,843 | 282 | |||
Thomas Weisel Partners Group * | 23,600 | 93 | |||
Titanium Asset Management * (C)(F) | 15,400 | 46 | |||
Tower Group | 5,846 | 130 | |||
TradeStation Group * | 18,400 | 129 | |||
Trustco Bank NY | 47,500 | 293 | |||
Trustmark | 15,271 | 373 | |||
Umpqua Holdings | 23,177 | 307 | |||
United Community Banks * | 13,619 | 60 | |||
United Financial Bancorp | 7,200 | 101 | |||
Universal Health Realty Income Trust † | 1,700 | 60 | |||
Uranium Participation * | 51,800 | 303 | |||
U-Store-It Trust † | 43,450 | 313 | |||
Validus Holdings | 11,900 | 328 | |||
ViewPoint Financial Group | 10,000 | 162 | |||
Washington Real Estate Investment Trust † | 19,400 | 593 | |||
Westamerica Bancorporation | 4,400 | 254 | |||
Western Alliance Bancorp * | 67,749 | 386 | |||
Whitney Holding | 42,100 | 581 | |||
Wilmington Trust | 4,100 | 68 | |||
Wilshire Bancorp | 3,700 | 41 | |||
World Acceptance * | 28,391 | 1,024 | |||
WSFS Financial | 7,106 | 277 | |||
Zions Bancorporation | 14,450 | 315 | |||
| 37,856 | |||||
Health Care — 10.8% | |||||
Abaxis * | 15,598 | 424 | |||
Acorda Therapeutics * | 21,000 | 718 | |||
Affymetrix * | 46,362 | 340 | |||
Air Methods * | 10,505 | 357 | |||
Albany Molecular Research * | 5,600 | 47 | |||
Alexion Pharmaceuticals * | 4,600 | 250 | |||
Align Technology * | 13,700 | 265 | |||
| Description | Shares | Market Value ($ Thousands) | |||
Allos Therapeutics * | 9,800 | $ | 73 | ||
Allscripts Healthcare Solutions * | 10,900 | 213 | |||
Alnylam Pharmaceuticals * | 2,100 | 36 | |||
AMAG Pharmaceuticals * | 16,453 | 574 | |||
Amedisys * | 9,300 | 514 | |||
American Medical Systems Holdings * | 17,600 | 327 | |||
AMERIGROUP * | 14,801 | 492 | |||
AMN Healthcare Services * | 20,501 | 180 | |||
Amsurg * | 23,600 | 510 | |||
Analogic | 2,200 | 94 | |||
Angiodynamics * | 6,200 | 97 | |||
Arena Pharmaceuticals * | 3,800 | 12 | |||
Assisted Living Concepts, Cl A * | 7,100 | 233 | |||
Auxilium Pharmaceuticals * | 2,600 | 81 | |||
BioMarin Pharmaceuticals * | 14,976 | 350 | |||
Bio-Reference Labs * | 1,200 | 53 | |||
Bruker BioSciences * | 25,433 | 373 | |||
Cantel Medical | 16,300 | 324 | |||
Cardiome Pharma * | 57,260 | 378 | |||
Chemed | 14,908 | 811 | |||
Computer Programs & Systems | 2,800 | 109 | |||
Conmed * | 3,800 | 90 | |||
Covance * | 3,400 | 209 | |||
Cubist Pharmaceuticals * | 12,743 | 287 | |||
Cyberonics * | 6,100 | 117 | |||
Cypress Bioscience * | 2,100 | 10 | |||
Durect * | 85,275 | 257 | |||
Electro-Optical Sciences * | 9,845 | 73 | |||
Emergency Medical Services, Cl A * | 8,200 | 464 | |||
Emergent Biosolutions * | 1,185 | 20 | |||
Ensign Group | 3,800 | 66 | |||
Enzo Biochem * | 6,800 | 41 | |||
eResearchTechnology * | 25,500 | 176 | |||
Exactech * | 12,200 | 256 | |||
Exelixis * | 27,600 | 168 | |||
Genoptix * | 2,600 | 92 | |||
Gen-Probe * | 3,300 | 165 | |||
Gentiva Health Services * | 900 | 25 | |||
Haemonetics * | 6,200 | 354 | |||
Halozyme Therapeutics * | 12,700 | 101 | |||
Health Management Associates, Cl A * | 44,439 | 382 | |||
Healthsouth * | 32,769 | 613 | |||
Healthspring * | 1,700 | 30 | |||
HealthTronics * | 75,900 | 272 | |||
HMS Holdings * | 7,475 | 381 | |||
Human Genome Sciences * | 7,900 | 239 | |||
ICU Medical * | 23,500 | 810 | |||
Idexx Laboratories * | 3,300 | 190 | |||
Immucor * | 8,100 | 181 | |||
Immunogen * | 20,500 | 166 | |||
Incyte * | 25,500 | 356 | |||
Inspire Pharmaceuticals * | 27,200 | 170 | |||
Inverness Medical Innovations * | 1,300 | 51 | |||
IPC The Hospitalist * | 5,533 | 194 | |||
Isis Pharmaceuticals * | 1,300 | 14 | |||
Kendle International * | 6,400 | 112 | |||
Kensey Nash * | 6,000 | 141 | |||
Kindred Healthcare * | 7,500 | 135 | |||
King Pharmaceuticals * | 47,500 | 559 | |||
| 4 | SEI Institutional Managed Trust / Semi-Annual Report / March 31, 2010 |
Table of Contents
Schedule of Investments (Unaudited)
Small Cap Fund
March 31, 2010
| Description | Shares | Market Value ($ Thousands) | |||
LCA-Vision * | 11,600 | �� | $ | 97 | |
LHC Group * | 15,320 | 514 | |||
LifePoint Hospitals * | 12,700 | 467 | |||
Magellan Health Services * | 8,373 | 364 | |||
Masimo | 11,250 | 299 | |||
Medicines * | 50,000 | 392 | |||
Medicis Pharmaceutical, Cl A | 24,910 | 627 | |||
Medivation * | 38,826 | 407 | |||
Mednax * | 6,300 | 367 | |||
Meridian Bioscience | 12,200 | 248 | |||
Merit Medical Systems * | 4,600 | 70 | |||
MWI Veterinary Supply * | 1,900 | 77 | |||
Nektar Therapeutics * | 26,309 | 400 | |||
Nighthawk Radiology Holdings * | 10,800 | 34 | |||
NovaMed * | 19,800 | 67 | |||
NPS Pharmaceuticals * | 11,873 | 60 | |||
NuVasive * | 8,263 | 373 | |||
Odyssey HealthCare * | 24,760 | 448 | |||
Omnicare | 3,300 | 93 | |||
Omnicell * | 9,529 | 134 | |||
Optimer Pharmaceuticals * | 12,003 | 147 | |||
Orthofix International * | 6,091 | 222 | |||
Par Pharmaceutical * | 19,275 | 478 | |||
Parexel International * | 9,700 | 226 | |||
PDL BioPharma | 135,211 | 840 | |||
Perrigo | 2,500 | 147 | |||
Pharmaceutical Product Development | 6,707 | 159 | |||
Pharmasset * | 3,396 | 91 | |||
Pozen * | 36,450 | 349 | |||
Providence Service * | 8,600 | 131 | |||
PSS World Medical * | 10,400 | 245 | |||
Psychiatric Solutions * | 2,500 | 74 | |||
Questcor Pharmaceuticals * | 85,625 | 705 | |||
Quidel * | 32,329 | 470 | |||
Regeneron Pharmaceuticals * | 9,600 | 254 | |||
RehabCare Group * | 2,300 | 63 | |||
Res-Care * | 24,600 | 295 | |||
Rigel Pharmaceuticals * | 46,300 | 369 | |||
Savient Pharmaceuticals * | 37,671 | 544 | |||
Seattle Genetics * | 3,417 | 41 | |||
SIGA Technologies * | 22,393 | 148 | |||
Sirona Dental Systems * | 8,300 | 316 | |||
Spectrum Pharmaceuticals * | 22,300 | 103 | |||
StemCells * | 66,800 | 78 | |||
STERIS | 26,448 | 890 | |||
Sun Healthcare Group * | 22,900 | 218 | |||
Techne | 3,900 | 248 | |||
Theravance * | 6,600 | 88 | |||
Thoratec * | 7,016 | 235 | |||
Valeant Pharmaceuticals International * | 9,800 | 420 | |||
Varian * | 900 | 47 | |||
Viropharma * | 2,400 | 33 | |||
Vivus * | 6,200 | 54 | |||
WellCare Health Plans * | 16,632 | 496 | |||
Zoll Medical * | 5,634 | 148 | |||
| 31,112 | |||||
Industrials — 10.9% | |||||
ABM Industries | 5,955 | 126 | |||
ACCO Brands * | 14,100 | 108 | |||
| Description | Shares | Market Value ($ Thousands) | |||
Actuant, Cl A | 15,600 | $ | 305 | ||
Administaff | 8,600 | 183 | |||
Aegean Marine Petroleum Network | 15,244 | 433 | |||
AerCap Holdings * | 52,030 | 599 | |||
Aerovironment * | 11,225 | 293 | |||
Airtran Holdings * | 175,800 | 893 | |||
Alaska Air Group * | 6,800 | 280 | |||
American Science & Engineering | 1,800 | 135 | |||
Ameron International | 2,800 | 176 | |||
AMR * | 10,400 | 95 | |||
AO Smith | 8,800 | 463 | |||
APAC Customer Services * | 73,329 | 422 | |||
Apogee Enterprises | 20,746 | 328 | |||
Applied Industrial Technologies | 14,000 | 348 | |||
Arkansas Best | 4,200 | 125 | |||
Armstrong World Industries * | 9,035 | 328 | |||
Atlas Air Worldwide Holdings * | 17,385 | 922 | |||
Avis Budget Group * | 51,831 | 596 | |||
AZZ | 1,600 | 54 | |||
Baldor Electric | 9,800 | 366 | |||
BE Aerospace * | 21,700 | 661 | |||
Beacon Roofing Supply * | 5,600 | 107 | |||
Briggs & Stratton | 14,800 | 289 | |||
Brink’s | 5,100 | 144 | |||
Carlisle | 6,100 | 233 | |||
Celadon Group * | 29,911 | 417 | |||
Cenveo * | 29,800 | 258 | |||
Chart Industries * | 29,387 | 588 | |||
Columbus McKinnon * | 17,700 | 281 | |||
Comfort Systems USA | 11,600 | 145 | |||
Consolidated Graphics * | 8,200 | 340 | |||
Continental Airlines, Cl B * | 11,500 | 253 | |||
Copa Holdings, Cl A | 3,700 | 225 | |||
Cornell * | 34,600 | 633 | |||
Corporate Executive Board | 13,825 | 368 | |||
CRA International * | 19,100 | 438 | |||
Cubic | 16,660 | 599 | |||
Deluxe | 5,600 | 109 | |||
Dycom Industries * | 42,100 | 369 | |||
Dynamic Materials | 5,017 | 78 | |||
DynCorp International, Cl A * | 31,500 | 362 | |||
EMCOR Group * | 24,800 | 611 | |||
Energy Recovery * | 9,325 | 59 | |||
EnerNOC * | 8,011 | 238 | |||
EnerSys * | 17,016 | 420 | |||
Ennis | 8,200 | 133 | |||
Fastenal | 3,900 | 187 | |||
Force Protection * | 45,700 | 275 | |||
FTI Consulting * | 7,200 | 283 | |||
Generac Holdings * | 21,300 | 298 | |||
Genesee & Wyoming, Cl A * | 10,770 | 367 | |||
Geo Group * | 12,800 | 254 | |||
GeoEye * | 11,544 | 341 | |||
GrafTech International * | 5,827 | 80 | |||
Granite Construction | 9,100 | 275 | |||
Great Lakes Dredge & Dock | 108,873 | 572 | |||
GT Solar International * | 7,000 | 37 | |||
H&E Equipment Services * | 25,300 | 273 | |||
Hawaiian Holdings * | 47,300 | 349 | |||
Healthcare Services Group | 1,500 | 34 | |||
Hexcel * | 43,900 | 634 | |||
| 5 | SEI Institutional Managed Trust / Semi-Annual Report / March 31, 2010 |
Table of Contents
Schedule of Investments (Unaudited)
Small Cap Fund
March 31, 2010
| Description | Shares | Market Value ($ Thousands) | |||
Hill International * | 730 | $ | 4 | ||
HNI | 8,656 | 230 | |||
Horizon Lines, Cl A | 8,100 | 44 | |||
Innerworkings * | 51,920 | 270 | |||
Kaman | 4,000 | 100 | |||
KBR | 7,200 | 160 | |||
Kelly Services, Cl A * | 6,000 | 100 | |||
Kirby * | 7,300 | 278 | |||
Knight Transportation | 4,500 | 95 | |||
Ladish * | 9,820 | 198 | |||
Landstar System | 6,655 | 279 | |||
LECG * | 53,130 | 158 | |||
Lennox International | 3,961 | 175 | |||
Lydall * | 4,600 | 36 | |||
Manitowoc | 17,000 | 221 | |||
Marten Transport * | 8,355 | 165 | |||
Mcgrath Rentcorp | 2,800 | 68 | |||
Michael Baker * | 14,482 | 499 | |||
Middleby * | 4,174 | 240 | |||
Mine Safety Appliances | 5,700 | 159 | |||
Mueller Water Products, Cl A | 85,992 | 411 | |||
Navigant Consulting * | 2,000 | 24 | |||
Navistar International * | 5,800 | 259 | |||
Old Dominion Freight Line * | 15,051 | 503 | |||
Oshkosh Truck | 2,859 | 115 | |||
Owens Corning * | 3,800 | 97 | |||
Polypore International * | 11,576 | 202 | |||
Powell Industries * | 5,507 | 179 | |||
Rand Logistics * | 9,500 | 49 | |||
Raven Industries | 6,928 | 204 | |||
Resources Connection * | 10,175 | 195 | |||
Robbins & Myers | 12,200 | 291 | |||
RSC Holdings * | 38,500 | 306 | |||
Skywest | 4,100 | 58 | |||
Standard Register | 9,400 | 50 | |||
Standex International | 8,100 | 209 | |||
SYKES Enterprises * | 5,900 | 135 | |||
TAL International Group | 17,800 | 355 | |||
Teleflex | 1,800 | 115 | |||
Tennant | 4,147 | 114 | |||
Terex * | 13,200 | 300 | |||
Tetra Tech * | 1,242 | 29 | |||
Textainer Group Holdings | 16,000 | 345 | |||
Titan Machinery * | 26,925 | 369 | |||
Tredegar | 5,500 | 94 | |||
Triumph Group | 6,290 | 441 | |||
TrueBlue * | 10,100 | 157 | |||
Tutor Perini * | 13,394 | 291 | |||
UAL * | 42,609 | 833 | |||
US Airways Group * | 44,300 | 326 | |||
US Ecology | 4,900 | 79 | |||
Vitran * | 13,850 | 168 | |||
Wabash National * | 27,000 | 189 | |||
Werner Enterprises | 11,530 | 267 | |||
| 31,433 | |||||
Information Technology — 17.7% | |||||
3Com * | 36,680 | 282 | |||
Actel * | 4,000 | 55 | |||
ADC Telecommunications * | 53,240 | 389 | |||
Advanced Energy Industries * | 35,386 | 586 | |||
Advent Software * | 3,741 | 167 | |||
| Description | Shares | Market Value ($ Thousands) | |||
Amkor Technology * | 40,667 | $ | 288 | ||
Anixter International * | 1,300 | 61 | |||
Ansys * | 4,700 | 203 | |||
Applied Micro Circuits * | 79,200 | 683 | |||
Archipelago Learning * | 15,189 | 221 | |||
Ariba * | 19,300 | 248 | |||
Arris Group * | 72,900 | 875 | |||
Art Technology Group * | 116,292 | 513 | |||
AsiaInfo Holdings * | 16,371 | 433 | |||
Atheros Communications * | 16,314 | 632 | |||
Atmel * | 45,270 | 228 | |||
Aviat Networks * | 39,000 | 259 | |||
Benchmark Electronics * | 36,788 | 763 | |||
Blackbaud | 8,300 | 209 | |||
Blue Coat Systems * | 10,600 | 329 | |||
Brightpoint * | 38,500 | 290 | |||
Brocade Communications Systems * | 55,800 | 319 | |||
Cabot Microelectronics * | 6,140 | 232 | |||
CDC Software ADR * | 42,500 | 488 | |||
Checkpoint Systems * | 13,300 | 294 | |||
Ciber * | 77,300 | 289 | |||
Cirrus Logic * | 32,500 | 273 | |||
Cognex | 11,400 | 211 | |||
Cogo Group * | 13,300 | 93 | |||
CommScope * | 9,880 | 277 | |||
CommVault Systems * | 23,586 | 504 | |||
Comtech Telecommunications * | 9,250 | 296 | |||
Comverse Technology * | 33,100 | 275 | |||
CSG Systems International * | 19,700 | 413 | |||
CTS | 16,200 | 153 | |||
Cypress Semiconductor * | 6,000 | 69 | |||
Daktronics | 7,300 | 56 | |||
Digi International * | 31,000 | 330 | |||
Digital River * | 23,365 | 708 | |||
Diodes * | 15,050 | 337 | |||
Double-Take Software * | 19,900 | 177 | |||
DSP Group * | 23,000 | 192 | |||
DTS * | 1,165 | 40 | |||
Earthlink | 17,600 | 150 | |||
EFJ * | 15,600 | 14 | |||
Electro Rent | 3,500 | 46 | |||
Electronics for Imaging * | 6,800 | 79 | |||
Emulex * | 25,000 | 332 | |||
Entegris * | 75,200 | 379 | |||
Euronet Worldwide * | 486 | 9 | |||
Fairchild Semiconductor International * | 47,540 | 506 | |||
Flir Systems * | 6,400 | 180 | |||
Forrester Research * | 3,396 | 102 | |||
Gartner * | 3,800 | 84 | |||
GSI Commerce * | 2,100 | 58 | |||
Hackett Group * | 32,100 | 89 | |||
Heartland Payment Systems | 29,200 | 543 | |||
Hittite Microwave * | 10,900 | 479 | |||
IAC * | 10,800 | 246 | |||
Imation * | 61,598 | 678 | |||
Informatica * | 8,100 | 218 | |||
Integral Systems * | 25,000 | 241 | |||
Integrated Device Technology * | 89,471 | 548 | |||
InterDigital * | 3,600 | 100 | |||
Intermec * | 10,410 | 148 | |||
| 6 | SEI Institutional Managed Trust / Semi-Annual Report / March 31, 2010 |
Table of Contents
Schedule of Investments (Unaudited)
Small Cap Fund
March 31, 2010
| Description | Shares | Market Value ($ Thousands) | |||
Intersil, Cl A | 12,387 | $ | 183 | ||
IXYS * | 6,600 | 56 | |||
j2 Global Communications * | 14,900 | 349 | |||
Jack Henry & Associates | 5,300 | 128 | |||
JDA Software Group * | 41,859 | 1,164 | |||
KIT Digital * | 31,797 | 410 | |||
Knot * | 44,900 | 351 | |||
Lawson Software * | 5,700 | 38 | |||
Lexmark International, Cl A * | 4,100 | 148 | |||
Linear Technology | 7,000 | 198 | |||
LivePerson * | 5,300 | 41 | |||
Loral Space & Communications * | 4,100 | 144 | |||
Manhattan Associates * | 11,500 | 293 | |||
Mantech International, Cl A * | 14,800 | 723 | |||
MAXIMUS | 7,200 | 439 | |||
Mentor Graphics * | 46,510 | 373 | |||
MercadoLibre * | 11,675 | 563 | |||
Methode Electronics | 39,900 | 395 | |||
Micrel | 9,900 | 106 | |||
Microsemi * | 4,400 | 76 | |||
MicroStrategy, Cl A * | 9,919 | 844 | |||
MKS Instruments * | 15,000 | 294 | |||
ModusLink Global Solutions * | 8,900 | 75 | |||
MoneyGram International * | 34,100 | 130 | |||
Monolithic Power Systems * | 3,700 | 83 | |||
Move * | 41,100 | 86 | |||
MTS Systems | 5,200 | 151 | |||
Net 1 UEPS Technologies * | 4,144 | 76 | |||
Netgear * | 34,144 | 891 | |||
Netlogic Microsystems * | 15,178 | 447 | |||
NetSuite * | 22,333 | 325 | |||
Novatel Wireless * | 51,000 | 343 | |||
Novell * | 43,700 | 262 | |||
Omnivision Technologies * | 15,600 | 268 | |||
Openwave Systems * | 19,800 | 45 | |||
OSI Systems * | 10,700 | 300 | |||
Palm * | 11,700 | 44 | |||
Parametric Technology * | 41,700 | 753 | |||
Park Electrochemical | 19,625 | 564 | |||
Parkervision * | 94,200 | 160 | |||
Photronics * | 59,350 | 302 | |||
Plantronics | 2,400 | 75 | |||
Plexus * | 11,900 | 429 | |||
Power Integrations | 5,200 | 214 | |||
Progress Software * | 12,317 | 387 | |||
Quality Systems | 5,325 | 327 | |||
Quantum * | 182,872 | 481 | |||
Quest Software * | 45,138 | 803 | |||
Radware * | 5,700 | 126 | |||
RealNetworks * | 21,000 | 101 | |||
RF Micro Devices * | 65,074 | 324 | |||
RightNow Technologies * | 14,620 | 261 | |||
Riverbed Technology * | 19,386 | 551 | |||
Rogers * | 3,200 | 93 | |||
Rosetta Stone * | 13,850 | 329 | |||
Sapient | 68,471 | 626 | |||
Scansource * | 9,500 | 273 | |||
Seachange International * | 41,800 | 300 | |||
Semtech * | 17,400 | 303 | |||
Skyworks Solutions * | 15,819 | 247 | |||
SRA International, Cl A * | 5,200 | 108 | |||
Standard Microsystems * | 7,100 | 165 | |||
| Description | Shares | Market Value ($ Thousands) | |||
STEC * | 44,635 | $ | 535 | ||
SuccessFactors * | 11,925 | 227 | |||
Synaptics * | 7,655 | 211 | |||
Synchronoss Technologies * | 2,600 | 50 | |||
SYNNEX * | 2,500 | 74 | |||
Syntel | 10,000 | 385 | |||
Take-Two Interactive Software * | 9,500 | 94 | |||
Taleo, Cl A * | 10,000 | 259 | |||
Tech Data * | 2,200 | 92 | |||
Tekelec * | 8,400 | 152 | |||
TeleTech Holdings * | 30,028 | 513 | |||
Teradyne * | 65,985 | 737 | |||
Tessera Technologies * | 14,826 | 301 | |||
THQ * | 15,000 | 105 | |||
TIBCO Software * | 62,900 | 679 | |||
Tivo * | 12,304 | 211 | |||
Trimble Navigation * | 7,000 | 201 | |||
TriQuint Semiconductor * | 77,402 | 542 | |||
TTM Technologies * | 52,320 | 464 | |||
Tyler Technologies * | 400 | 7 | |||
Ultimate Software Group * | 3,757 | 124 | |||
Unisys * | 23,750 | 829 | |||
United Online | 51,600 | 386 | |||
Valueclick * | 77,422 | 785 | |||
VanceInfo Technologies ADR * | 17,370 | 387 | |||
Vasco Data Security International * | 9,203 | 76 | |||
Veeco Instruments * | 21,247 | 924 | |||
VeriFone Holdings * | 17,075 | 345 | |||
Verigy * | 33,830 | 378 | |||
VistaPrint * | 6,131 | 351 | |||
Vocus * | 5,200 | 89 | |||
Volterra Semiconductor * | 22,900 | 575 | |||
Websense * | 22,790 | 519 | |||
Wright Express * | 17,900 | 539 | |||
Zoran * | 61,000 | 656 | |||
| 50,915 | |||||
Materials — 4.7% | |||||
AK Steel Holding | 13,700 | 313 | |||
Allied Nevada Gold * | 21,100 | 350 | |||
AM Castle | 8,900 | 116 | |||
Aptargroup | 5,700 | 224 | |||
Arch Chemicals | 2,200 | 76 | |||
Buckeye Technologies * | 13,300 | 174 | |||
Carpenter Technology | 25,490 | 933 | |||
Century Aluminum * | 7,700 | 106 | |||
Commercial Metals | 15,000 | 226 | |||
Cytec Industries | 2,261 | 106 | |||
Domtar * | 2,600 | 168 | |||
Ferro | 7,700 | 68 | |||
Gammon Gold * | 37,400 | 269 | |||
General Steel Holdings * | 21,200 | 87 | |||
Globe Specialty Metals * | 17,900 | 200 | |||
Graham Packaging * | 5,100 | 64 | |||
H.B. Fuller | 10,000 | 232 | |||
Headwaters * | 19,700 | 90 | |||
Innophos Holdings | 16,500 | 460 | |||
Intrepid Potash * | 15,378 | 466 | |||
Jaguar Mining * | 28,500 | 263 | |||
Koppers Holdings | 12,852 | 364 | |||
Landec * | 3,400 | 23 | |||
| 7 | SEI Institutional Managed Trust / Semi-Annual Report / March 31, 2010 |
Table of Contents
Schedule of Investments (Unaudited)
Small Cap Fund
March 31, 2010
| Description | Shares | Market Value ($ Thousands) | |||
LSB Industries * | 1,697 | $ | 26 | ||
Myers Industries | 11,800 | 124 | |||
New Gold * | 65,600 | 286 | |||
NewMarket | 12,672 | 1,305 | |||
Olin | 9,400 | 184 | |||
Omnova Solutions * | 32,700 | 257 | |||
PolyOne * | 52,840 | 541 | |||
Quaker Chemical | 11,700 | �� | 317 | ||
Rockwood Holdings * | 20,786 | 553 | |||
RTI International Metals * | 4,000 | 121 | |||
Schnitzer Steel Industries, Cl A | 4,176 | 219 | |||
Schulman A | 6,500 | 159 | |||
Schweitzer-Mauduit International | 10,900 | 518 | |||
Sensient Technologies | 4,600 | 134 | |||
Solutia * | 33,500 | 540 | |||
Spartech * | 24,304 | 284 | |||
Stepan | 277 | 16 | |||
Temple-Inland | 17,378 | 355 | |||
Universal Stainless & Alloy * | 14,900 | 357 | |||
Wausau Paper * | 10,400 | 89 | |||
Worthington Industries | 32,011 | 554 | |||
WR Grace * | 40,428 | 1,122 | |||
Zep | 55 | 1 | |||
| 13,440 | |||||
Telecommunication Services — 0.7% | |||||
Alaska Communications Systems Group | 8,900 | 72 | |||
Cincinnati Bell * | 106,169 | 362 | |||
Cogent Communications Group * | 16,905 | 176 | |||
Consolidated Communications Holdings | 7,400 | 140 | |||
Frontier Communications | 15,400 | 115 | |||
Global Crossing * | 9,200 | 139 | |||
Leap Wireless International * | 16,800 | 275 | |||
Neutral Tandem * | 22,900 | 366 | |||
PAETEC Holding * | 39,400 | 185 | |||
Shenandoah Telecommunications | 2,800 | 53 | |||
USA Mobility | 9,200 | 116 | |||
| 1,999 | |||||
Utilities — 1.9% | |||||
Allete | 4,900 | 164 | |||
California Water Service Group | 3,170 | 119 | |||
Cia de Saneamento de Minas Gerais-COPASA (Brazil) | 18,100 | 258 | |||
Cleco | 13,600 | 361 | |||
El Paso Electric * | 7,000 | 144 | |||
Empire District Electric | 12,000 | 216 | |||
Great Plains Energy | 6,500 | 121 | |||
Idacorp | 11,300 | 391 | |||
Laclede Group | 2,113 | 71 | |||
MGE Energy | 3,594 | 127 | |||
New Jersey Resources | 9,904 | 372 | |||
NorthWestern | 18,500 | 496 | |||
PNM Resources | 33,794 | 423 | |||
Portland General Electric | 29,700 | 574 | |||
RRI Energy * | 14,800 | 55 | |||
UGI | 10,900 | 289 | |||
UIL Holdings | 3,299 | 91 | |||
Unisource Energy | 12,300 | 387 | |||
Vectren | 16,826 | 416 | |||
| Description | Shares | Market Value ($ Thousands) | ||||
Westar Energy | 14,500 | $ | 323 | |||
| 5,398 | ||||||
Total Common Stock | 235,599 | |||||
PREFERRED STOCK — 0.4% | ||||||
Grubb & Ellis Cumulative * | 5,800 | 853 | ||||
Callaway Golf (A) | 1,500 | 208 | ||||
Total Preferred Stock | 1,061 | |||||
EXCHANGE TRADED FUND — 0.3% | ||||||
iShares Russell 2000 Value Index Fund | 11,600 | 741 | ||||
Total Exchange Traded Fund | 741 | |||||
| Number of Warrants | ||||||
WARRANTS — 0.0% | ||||||
Oilsands Quest | ||||||
Expires 05/12/11 * (C) (F) | 1,200 | — | ||||
Total Warrants | — | |||||
CORPORATE OBLIGATION — 0.0% | ||||||
Financials — 0.0% | ||||||
Scorpio Mining PIPE | ||||||
7.000%, 05/05/11 (C) (F) | 52 | 47 | ||||
Total Corporate Obligation | 47 | |||||
CONVERTIBLE BOND — 0.0% | ||||||
Energy — 0.0% | ||||||
Rentech CV to 249.2522 | ||||||
4.000%, 04/15/13 (D) | $ | 204 | 141 | |||
Total Convertible Bond | 141 | |||||
CASH EQUIVALENT — 4.4% | ||||||
SEI Daily Income Trust, Prime Obligation Fund, Cl A, 0.070%**†† | 12,602,483 | 12,602 | ||||
Total Cash Equivalent | 12,602 | |||||
| 8 | SEI Institutional Managed Trust / Semi-Annual Report / March 31, 2010 |
Table of Contents
Schedule of Investments (Unaudited)
Small Cap Fund
March 31, 2010
| Description | Face Amount ($ Thousands) | Market Value ($ Thousands) | ||||
U.S. TREASURY OBLIGATION — 0.3% | ||||||
U.S. Treasury Bills | ||||||
0.135%, 06/03/10 (D)(E) | $ | 942 | $ | 942 | ||
Total U.S. Treasury Obligation | 942 | |||||
Total Investments — 87.3% | $ | 251,133 | ||||
A summary of the open futures contracts held by the Fund at March 31, 2010, is as follows:
| Type of Contract | Number of Contracts Long (Short) | Expiration Date | Unrealized Depreciation ($ Thousands) | |||||
Russell 2000 Index E-MINI | 686 | Jun-2010 | $ | (296 | ) | |||
For the period ended March 31, 2010, the total amount of all open futures contracts, as presented in the table above, are representative of the volume of activity for this derivative type during the year.
Percentages are based on Net Assets of $287,704 ($Thousands).
| * | Non-income producing security. |
| ** | Rate shown is the 7-day effective yield as of March 31, 2010. |
| † | Real Estate Investment Trust. |
| †† | Investment in Affiliated Security (see Note 5). |
| (A) | Securities sold within terms of a private placement memorandum, exempt from registration under Section 144A of the Securities Act of 1933, as amended, and may not be sold to dealers in that program or other “accredited investors.” These securities have been determined to be liquid under guidelines established by the Board of Trustees. |
| (B) | Business development company. |
| (C) | Security fair valued using methods determined in good faith by the Valuation Committee of the Board of Trustees. The total market value of such securities as of March 31, 2010 was $93 ($ Thousands) and represented 0.0% of Net Assets. |
| (D) | Zero Coupon Security. The rate reported is the rate in effect as of March 31, 2010. |
| (E) | Security, or portion there of, has been pledged as collateral on open futures contracts. |
| (F) | Security considered restricted. The total market value of such securities as of March 31, 2010 was $93 ($ Thousands) and represented 0.0% of Net Assets. |
ADR — American Depositary Receipt
Cl — Class
Amounts designated as “—” are $0 or have been rounded to $0.
| 9 | SEI Institutional Managed Trust / Semi-Annual Report / March 31, 2010 |
Table of Contents
Schedule of Investments (Unaudited)
Small Cap Value Fund
March 31, 2010
| Description | Shares | Market Value ($ Thousands) | |||
COMMON STOCK — 93.7% ‡ | |||||
Consumer Discretionary — 9.0% | |||||
Abercrombie & Fitch, Cl A (A) | 29,208 | $ | 1,333 | ||
Accor | 9,651 | 535 | |||
American Greetings, Cl A (A) | 44,900 | 936 | |||
America’s Car-Mart * | 22,300 | 538 | |||
Arctic Cat * | 43,600 | 473 | |||
ATC Technology * | 87,096 | 1,495 | |||
Bebe Stores (A) | 46,165 | 411 | |||
Belo, Cl A | 148,200 | 1,011 | |||
Big Lots * | 24,200 | 881 | |||
Blyth | 6,475 | 202 | |||
Bob Evans Farms (A) | 24,000 | 742 | |||
Brown Shoe | 34,100 | 528 | |||
Cabela’s * (A) | 59,800 | 1,046 | |||
California Pizza Kitchen * | 52,756 | 886 | |||
Callaway Golf (A) | 128,403 | 1,132 | |||
Carmike Cinemas * | 5,100 | 71 | |||
Casual Male Retail Group * | 178,850 | 690 | |||
Cato, Cl A | 35,000 | 750 | |||
Collective Brands * | 4,500 | 102 | |||
Cooper Tire & Rubber | 100,838 | 1,918 | |||
Core-Mark Holding * | 4,000 | 123 | |||
Cracker Barrel Old Country Store (A) | 26,000 | 1,206 | |||
CSS Industries | 35,100 | 706 | |||
Dillard’s, Cl A | 4,200 | 99 | |||
Ethan Allen Interiors (A) | 54,752 | 1,130 | |||
Finish Line, Cl A | 7,600 | 124 | |||
Foot Locker | 34,400 | 517 | |||
Genesco * | 1,400 | 43 | |||
Harte-Hanks | 43,000 | 553 | |||
hhgregg * | 52,118 | 1,316 | |||
Hillenbrand | 28,000 | 616 | |||
Iconix Brand Group * | 50,600 | 777 | |||
Insight Enterprises * (A) | 62,200 | 893 | |||
International Speedway, Cl A (A) | 59,800 | 1,541 | |||
Jack in the Box * | 95,070 | 2,239 | |||
Jakks Pacific * (A) | 39,700 | 518 | |||
Jo-Ann Stores * | 4,600 | 193 | |||
Jones Apparel Group | 10,900 | 207 | |||
Journal Communications, Cl A | 107,100 | 450 | |||
Lakeland Industries * | 71,700 | 610 | |||
Landry’s Restaurants * (A) | 19,700 | 353 | |||
Lifetime Brands * | 35,041 | 413 | |||
Lions Gate Entertainment * | 94,500 | 590 | |||
Marriott International, Cl A (A) | 30,800 | 971 | |||
Matthews International, Cl A | 39,000 | 1,384 | |||
MDC Partners, Cl A | 250,870 | 2,596 | |||
Mediacom Communications, Cl A * | 11,700 | 70 | |||
Men’s Wearhouse (A) | 21,601 | 517 | |||
Meredith (A) | 57,600 | 1,982 | |||
New Frontier Media * | 160,600 | 321 | |||
O’Charleys * | 50,700 | 453 | |||
Oxford Industries | 2,800 | 57 | |||
Perry Ellis International * | 6,800 | 154 | |||
PetSmart (A) | 42,968 | 1,373 | |||
Polaris Industries (A) | 21,800 | 1,115 | |||
Pool | 27,900 | 632 | |||
Princeton Review * | 183,546 | 641 | |||
| Description | Shares | Market Value ($ Thousands) | |||
RadioShack | 53,600 | $ | 1,213 | ||
RC2 * | 5,600 | 84 | |||
Red Robin Gourmet Burgers * (A) | 36,600 | 894 | |||
Regis (A) | 80,648 | 1,506 | |||
Rent-A-Center * | 136,800 | 3,235 | |||
Retail Ventures * | 7,400 | 71 | |||
Ruby Tuesday * (A) | 52,100 | 551 | |||
Scholastic (A) | 25,700 | 719 | |||
Scientific Games, Cl A * (A) | 61,473 | 865 | |||
Sinclair Broadcast Group, Cl A * | 68,900 | 350 | |||
Sonic Automotive, Cl A * | 7,700 | 85 | |||
Speedway Motorsports | 3,000 | 47 | |||
Sport Supply Group | 1,100 | 15 | |||
Stage Stores | 58,400 | 899 | |||
Standard Motor Products | 9,100 | 90 | |||
Stein Mart * | 8,200 | 74 | |||
Thomas Cook Group | 65,561 | 268 | |||
Unifirst | 3,300 | 170 | |||
World Wrestling Entertainment, Cl A | 29,300 | 507 | |||
| 54,806 | |||||
Consumer Staples — 4.3% | |||||
Alliance One International * | 220,900 | 1,124 | |||
American Italian Pasta, Cl A * | 2,300 | 89 | |||
American Oriental Bioengineering * (A) | 136,200 | 556 | |||
BJ’s Wholesale Club * (A) | 33,645 | 1,245 | |||
Cal-Maine Foods (A) | 14,700 | 498 | |||
Casey’s General Stores (A) | 48,276 | 1,516 | |||
Central Garden and Pet, Cl A * | 74,799 | 685 | |||
Central Garden and Pet * | 74,918 | 739 | |||
Chiquita Brands International * (A) | 111,700 | 1,757 | |||
Corn Products International | 41,879 | 1,452 | |||
Dean Foods * (A) | 125,140 | 1,964 | |||
Del Monte Foods | 125,500 | 1,832 | |||
Dole Food * (A) | 68,041 | 806 | |||
Fresh Del Monte Produce * | 56,800 | 1,150 | |||
Herbalife | 12,700 | 586 | |||
Ingles Markets, Cl A | 31,975 | 481 | |||
Nash Finch (A) | 10,700 | 360 | |||
Nutraceutical International * | 900 | 13 | |||
Pantry * | 106,588 | 1,331 | |||
Prestige Brands Holdings * | 20,200 | 182 | |||
Ruddick (A) | 58,500 | 1,851 | |||
Sanderson Farms (A) | 32,903 | 1,764 | |||
Seneca Foods, Cl A * | 3,200 | 93 | |||
Universal (A) | 65,300 | 3,441 | |||
Village Super Market, Cl A | 10,504 | 294 | |||
| 25,809 | |||||
Energy — 4.8% | |||||
Allis-Chalmers Energy * | 24,300 | 86 | |||
Alon USA Energy (A) | 22,900 | 166 | |||
Approach Resources * | 97,200 | 882 | |||
Berry Petroleum, Cl A (A) | 92,672 | 2,610 | |||
Cal Dive International * | 253,287 | 1,856 | |||
Clayton Williams Energy * | 2,200 | 77 | |||
Comstock Resources * | 69,700 | 2,216 | |||
CVR Energy * | 9,900 | 86 | |||
Energy Partners * | 18,700 | 228 | |||
Forest Oil * | 81,500 | 2,104 | |||
| 1 | SEI Institutional Managed Trust / Semi-Annual Report / March 31, 2010 |
Table of Contents
Schedule of Investments (Unaudited)
Small Cap Value Fund
March 31, 2010
| Description | Shares | Market Value ($ Thousands) | |||
Frontier Oil (A) | 62,885 | $ | 849 | ||
GeoMet * | 171,370 | 153 | |||
Goodrich Petroleum * (A) | 73,651 | 1,152 | |||
Gulfport Energy * | 8,000 | 90 | |||
Holly (A) | 82,400 | 2,300 | |||
Hornbeck Offshore Services * (A) | 17,300 | 321 | |||
Key Energy Services * (A) | 161,658 | 1,544 | |||
Oil States International * | 10,100 | 458 | |||
Overseas Shipholding Group (A) | 19,600 | 769 | |||
Parker Drilling * (A) | 231,200 | 1,140 | |||
Patterson-UTI Energy | 126,700 | 1,770 | |||
RPC (A) | 53,700 | 598 | |||
Scorpio Tankers * | 52,600 | 661 | |||
SEACOR Holdings * | 8,700 | 702 | |||
Seahawk Drilling * (A) | 45,500 | 858 | |||
Ship Finance International | 500 | 9 | |||
StealthGas | 92,600 | 468 | |||
Stone Energy * | 10,200 | 181 | |||
Superior Energy Services * | 40,400 | 849 | |||
Swift Energy * (A) | 69,382 | 2,133 | |||
Tesoro (A) | 37,300 | 518 | |||
USEC * (A) | 168,500 | 972 | |||
Western Refining * | 15,800 | 87 | |||
| 28,893 | |||||
Financials — 31.7% | |||||
1st Source | 39,900 | 700 | |||
Abington Bancorp | 1,500 | 12 | |||
Advance America Cash Advance | |||||
Centers | 110,900 | 645 | |||
Agree Realty † | 27,303 | 624 | |||
Alexandria Real Estate Equities † (A) | 14,500 | 980 | |||
Alliance Financial | 3,300 | 97 | |||
Allied Capital * | 24,600 | 122 | |||
Allied World Assurance Holdings | 43,900 | 1,969 | |||
AMB Property † (A) | 141,000 | 3,841 | |||
American Campus Communities † | 15,430 | 427 | |||
American Equity Investment Life Holding (A) | 75,800 | 807 | |||
American Physicians Capital | 15,600 | 498 | |||
Ameris Bancorp | 6,608 | 60 | |||
Ames National | 200 | 4 | |||
Anworth Mortgage Asset † | 68,800 | 464 | |||
Argo Group International Holdings | 400 | 13 | |||
Arrow Financial | 3,090 | 83 | |||
Ashford Hospitality Trust * † | 16,200 | 116 | |||
Aspen Insurance Holdings | 71,400 | 2,059 | |||
Assured Guaranty (A) | 31,200 | 686 | |||
Astoria Financial (A) | 100,400 | 1,456 | |||
Auburn National Bancorporation | 600 | 12 | |||
AvalonBay Communities † (A) | 15,100 | 1,304 | |||
Bancfirst | 5,400 | 226 | |||
Banco Latinoamericano de Exportaciones, Cl E | 59,800 | 859 | |||
Bancorp * | 10,800 | 96 | |||
Bancorp Rhode Island | 13,700 | 375 | |||
Bancorpsouth (A) | 65,465 | 1,372 | |||
Bank of Kentucky Financial | 100 | 2 | |||
Bank of Marin Bancorp | 3,100 | 103 | |||
Bank of the Ozarks | 13,000 | 457 | |||
| Description | Shares | Market Value ($ Thousands) | |||
BankFinancial | 8,700 | $ | 80 | ||
Banner | 28,400 | 109 | |||
Bar Harbor Bankshares | 1,400 | 43 | |||
Beneficial Mutual Bancorp * | 14,000 | 133 | |||
Berkshire Hills Bancorp | 4,000 | 73 | |||
BGC Partners, Cl A | 126,200 | 771 | |||
BioMed Realty Trust † (A) | 49,400 | 817 | |||
Boston Private Financial Holdings (A) | 151,591 | 1,117 | |||
Boston Properties † (A) | 17,100 | 1,290 | |||
Brandywine Realty Trust † (A) | 77,500 | 946 | |||
Brookfield Asset Management, Cl A | 75,600 | 1,922 | |||
Brookline Bancorp | 32,800 | 349 | |||
Bryn Mawr Bank | 2,900 | 53 | |||
Calamos Asset Management, Cl A | 10,600 | 152 | |||
Camden National | 20,000 | 642 | |||
Camden Property Trust † | 31,371 | 1,306 | |||
Cape Bancorp * | 1,200 | 10 | |||
Capital City Bank Group | 4,600 | 66 | |||
Capstead Mortgage † (A) | 38,400 | 459 | |||
Cardinal Financial | 106,169 | 1,134 | |||
Cathay General Bancorp (A) | 70,200 | 818 | |||
CBL & Associates Properties † (A) | 90,633 | 1,242 | |||
Cedar Shopping Centers † (A) | 47,400 | 375 | |||
Centerstate Banks | 36,000 | 441 | |||
Central Pacific Financial * (A) | 30,300 | 51 | |||
Century Bancorp, Cl A | 2,300 | 44 | |||
Chemical Financial | 6,200 | 146 | |||
Chimera Investment † | 125,500 | 488 | |||
Citizens & Northern | 3,000 | 38 | |||
Citizens Republic Bancorp * | 61,236 | 72 | |||
CNA Surety * | 32,200 | 573 | |||
CNB Financial | 2,100 | 32 | |||
CoBiz Financial | 18,700 | 117 | |||
Cogdell Spencer † | 10,000 | 74 | |||
Colonial Properties Trust † | 15,300 | 197 | |||
Columbia Banking System | 19,600 | 398 | |||
Community Bank System (A) | 80,600 | 1,836 | |||
Community Trust Bancorp | 8,000 | 217 | |||
Conseco * | 116,600 | 725 | |||
CreXus Investment † | 29,400 | 393 | |||
CVB Financial | 58,700 | 583 | |||
Delphi Financial Group, Cl A | 40,200 | 1,011 | |||
Developers Diversified Realty † | 13,000 | 158 | |||
Dexus Property Group † | 359,141 | 267 | |||
Dime Community Bancshares | 37,300 | 471 | |||
Doral Financial * | 42,200 | 182 | |||
Douglas Emmett † (A) | 159,700 | 2,455 | |||
Duke Realty † (A) | 65,200 | 808 | |||
DuPont Fabros Technology † | 31,000 | 669 | |||
Eagle Bancorp * | 2,800 | 33 | |||
East West Bancorp | 46,800 | 815 | |||
Education Realty Trust † | 138,298 | 794 | |||
Employers Holdings | 209,615 | 3,113 | |||
Encore Bancshares * | 31,500 | 298 | |||
Encore Capital Group * | 45,200 | 744 | |||
Endurance Specialty Holdings (A) | 55,951 | 2,079 | |||
Enterprise Bancorp | 1,600 | 20 | |||
Enterprise Financial Services | 4,200 | 46 | |||
Equity One † (A) | 82,049 | 1,550 | |||
| 2 | SEI Institutional Managed Trust / Semi-Annual Report / March 31, 2010 |
Table of Contents
Schedule of Investments (Unaudited)
Small Cap Value Fund
March 31, 2010
| Description | Shares | Market Value ($ Thousands) | |||
Equity Residential † | 41,100 | $ | 1,609 | ||
ESB Financial | 600 | 8 | |||
ESSA Bancorp | 28,500 | 357 | |||
Essex Property Trust † (A) | 4,600 | 414 | |||
Extra Space Storage † | 6,100 | 77 | |||
Farmers Capital Bank | 2,400 | 21 | |||
FBL Financial Group, Cl A (A) | 41,900 | 1,026 | |||
FBR Capital Markets * | 221,600 | 1,008 | |||
Federated Investors, Cl B (A) | 53,568 | 1,413 | |||
Financial Institutions | 4,400 | 64 | |||
First Bancorp (A) | 37,600 | 201 | |||
First Commonwealth Financial | 18,500 | 124 | |||
First Community Bancshares | 11,900 | 147 | |||
First Defiance Financial | 4,800 | 49 | |||
First Financial | 4,500 | 130 | |||
First Financial Bancorp | 158,902 | 2,827 | |||
First Financial Bankshares | 7,500 | 387 | |||
First Financial Holdings | 25,556 | 385 | |||
First Financial Northwest | 5,200 | 36 | |||
First Horizon National * (A) | 79,323 | 1,115 | |||
First Industrial Realty Trust * † | 27,400 | 213 | |||
First Merchants (A) | 9,100 | 63 | |||
First Mercury Financial | 5,100 | 66 | |||
First Midwest Bancorp | 40,000 | 542 | |||
First of Long Island | 1,900 | 46 | |||
First Potomac Realty Trust † | 5,600 | 84 | |||
FirstMerit (A) | 69,744 | 1,504 | |||
Flagstar Bancorp * (A) | 52,400 | 31 | |||
Flagstone Reinsurance Holdings | 8,000 | 92 | |||
Flushing Financial | 104,200 | 1,319 | |||
FNB (Pennsylvania) | 62,200 | 504 | |||
Forest City Enterprises, Cl A * (A) | 157,079 | 2,263 | |||
Fpic Insurance Group * (A) | 25,200 | 683 | |||
German American Bancorp | 2,900 | 44 | |||
GFI Group | 140,900 | 814 | |||
Glacier Bancorp | 10,700 | 163 | |||
Great American Group * | 181,900 | 400 | |||
Great Southern Bancorp | 3,700 | 83 | |||
Hammerson (United Kingdom) † | 46,277 | 276 | |||
Hancock Holding (A) | 33,345 | 1,394 | |||
Heartland Financial USA | 3,600 | 58 | |||
Hercules Technology Growth Capital | 76,600 | 811 | |||
Heritage Financial Group | 500 | 6 | |||
Highwoods Properties † | 25,700 | 815 | |||
Home Bancshares | 49,200 | 1,301 | |||
Home Federal Bancorp | 31,800 | 461 | |||
Horace Mann Educators | 67,397 | 1,015 | |||
Hospitality Properties Trust † | 26,000 | 623 | |||
Host Hotels & Resorts † (A) | 208,010 | 3,047 | |||
HRPT Properties Trust † | 185,800 | 1,446 | |||
IBERIABANK (A) | 29,014 | 1,741 | |||
Independent Bank | 9,700 | 239 | |||
Infinity Property & Casualty (A) | 55,473 | 2,521 | |||
International Bancshares (A) | 71,300 | 1,639 | |||
Invesco Mortgage Capital † | 300 | 7 | |||
Investors Bancorp * | 30,300 | 400 | |||
Kearny Financial | 2,100 | 22 | |||
Kennedy-Wilson Holdings * | 34,800 | 353 | |||
K-Fed Bancorp | 500 | 5 | |||
Kimco Realty † (A) | 232,100 | 3,630 | |||
Lakeland Bancorp | 8,800 | 78 | |||
| Description | Shares | Market Value ($ Thousands) | |||
Lakeland Financial | 4,400 | $ | 84 | ||
Legacy Bancorp | 1,400 | 13 | |||
Liberty Property Trust † (A) | 24,400 | 828 | |||
Macerich † (A) | 31,640 | 1,212 | |||
MainSource Financial Group (A) | 56,400 | 380 | |||
Max Capital Group | 76,200 | 1,752 | |||
MB Financial | 67,360 | 1,518 | |||
MCG Capital * | 2,200 | 12 | |||
Meadowbrook Insurance Group | 237,000 | 1,872 | |||
Medical Properties Trust † (A) | 90,200 | 945 | |||
Merchants Bancshares | 2,400 | 52 | |||
Meridian Interstate Bancorp * | 2,900 | 30 | |||
MFA Financial † | 188,167 | 1,385 | |||
MGIC Investment * | 62,800 | 689 | |||
Mid-America Apartment | |||||
Communities † (A) | 28,419 | 1,472 | |||
Midsouth Bancorp | 1,200 | 20 | |||
Monmouth Real Estate Investment, Cl A † | 2,900 | 24 | |||
Montpelier Re Holdings | 65,500 | 1,101 | |||
Nara Bancorp * | 29,700 | 260 | |||
NASB Financial | 1,100 | 25 | |||
National Bankshares | 2,400 | 65 | |||
National Financial Partners * | 13,700 | 193 | |||
National Penn Bancshares (A) | 195,709 | 1,350 | |||
NBT Bancorp | 14,100 | 322 | |||
Nelnet, Cl A | 104,211 | 1,934 | |||
NewAlliance Bancshares | 26,300 | 332 | |||
NGP Capital Resources | 6,300 | 54 | |||
Northrim BanCorp | 2,900 | 50 | |||
Northwest Bancshares | 50,735 | 596 | |||
Norwood Financial | 600 | 16 | |||
NYMAGIC | 2,500 | 53 | |||
OceanFirst Financial | 37,850 | 430 | |||
Ocwen Financial * | 40,400 | 448 | |||
Ohio Valley Banc | 200 | 4 | |||
Old National Bancorp | 65,100 | 778 | |||
Old Second Bancorp | 8,700 | 57 | |||
Oppenheimer Holdings, Cl A | 2,700 | 69 | |||
Oriental Financial Group | 64,109 | 865 | |||
Orrstown Financial Services | 500 | 13 | |||
Pacific Capital Bancorp (A) | 22,900 | 41 | |||
PacWest Bancorp (A) | 80,570 | 1,839 | |||
Park National (A) | 4,749 | 296 | |||
Parkway Properties † | 8,800 | 165 | |||
Peapack Gladstone Financial | 2,615 | 41 | |||
Pebblebrook Hotel Trust * † | 32,400 | 681 | |||
Pennsylvania Real Estate Investment Trust † (A) | 47,300 | 590 | |||
Peoples Bancorp | 4,200 | 69 | |||
Peoples Financial | 1,500 | 22 | |||
PHH * | 25,900 | 610 | |||
Pico Holdings * | 46,000 | 1,711 | |||
Pinnacle Financial Partners * | 100 | 2 | |||
Platinum Underwriters Holdings (A) | 97,479 | 3,615 | |||
Plum Creek Timber † | 35,900 | 1,397 | |||
PMA Capital, Cl A * | 57,500 | 353 | |||
Porter Bancorp | 1,015 | 13 | |||
Post Properties † | 7,000 | 154 | |||
Presidential Life | 13,900 | 139 | |||
PrivateBancorp, Cl A (A) | 31,000 | 425 | |||
| 3 | SEI Institutional Managed Trust / Semi-Annual Report / March 31, 2010 |
Table of Contents
Schedule of Investments (Unaudited)
Small Cap Value Fund
March 31, 2010
| Description | Shares | Market Value ($ Thousands) | |||
ProAssurance * (A) | 39,555 | $ | 2,316 | ||
Prosperity Bancshares | 29,100 | 1,193 | |||
Provident Financial Services | 40,500 | 482 | |||
Provident New York Bancorp | 10,200 | 97 | |||
PS Business Parks † | 4,400 | 235 | |||
Public Storage † (A) | 29,900 | 2,751 | |||
Radian Group | 13,200 | 206 | |||
RAIT Financial Trust † (A) | 29,400 | 58 | |||
Regency Centers † (A) | 92,600 | 3,470 | |||
Reinsurance Group of America, Cl A | 34,719 | 1,823 | |||
Renasant | 50,200 | 812 | |||
Republic Bancorp, Cl A (A) | 42,678 | 804 | |||
Resource Capital † | 13,000 | 88 | |||
Rewards Network | 1,300 | 17 | |||
RioCan Real Estate Investment Trust † | 14,100 | 257 | |||
Rockville Financial | 1,800 | 22 | |||
S&T Bancorp | 29,600 | 619 | |||
Safeguard Scientifics * | 22,100 | 287 | |||
Safety Insurance Group | 18,200 | 686 | |||
Sandy Spring Bancorp | 8,250 | 124 | |||
Santander BanCorp * | 15,600 | 191 | |||
Saul Centers † | 21,300 | 882 | |||
SCBT Financial | 26,640 | 987 | |||
SeaBright Insurance Holdings | 41,300 | 455 | |||
Selective Insurance Group | 43,400 | 720 | |||
Shore Bancshares | 2,500 | 36 | |||
Sierra Bancorp (A) | 20,500 | 264 | |||
Signature Bank NY * (A) | 47,802 | 1,771 | |||
Simmons First National, Cl A | 19,700 | 543 | |||
Simon Property Group † (A) | 25,618 | 2,149 | |||
Smithtown Bancorp | 17,100 | 71 | |||
South Financial Group (A) | 21,700 | 15 | |||
Southside Bancshares | 7,851 | 169 | |||
Southwest Bancorp | 13,000 | 108 | |||
Sovran Self Storage † | 2,600 | 91 | |||
StanCorp Financial Group | 12,100 | 576 | |||
Starwood Property Trust † | 43,100 | 832 | |||
State Bancorp | 4,700 | 37 | |||
Sterling Bancorp, Cl N | 17,400 | 175 | |||
Sterling Bancshares | 58,700 | 328 | |||
Stewart Information Services (A) | 69,300 | 956 | |||
Student Loan | 24,700 | 878 | |||
Suffolk Bancorp | 1,600 | 49 | |||
Sun Bancorp * | 6,825 | 27 | |||
Susquehanna Bancshares | 151,200 | 1,483 | |||
SVB Financial Group * | 18,700 | 873 | |||
SY Bancorp | 800 | 18 | |||
Synovus Financial (A) | 545,711 | 1,795 | |||
Terreno Realty * † | 12,900 | 255 | |||
Territorial Bancorp | 1,500 | 29 | |||
Texas Capital Bancshares * | 40,080 | 761 | |||
Thomas Weisel Partners Group * | 78,200 | 307 | |||
TICC Capital | 10,900 | 72 | |||
Tompkins Financial, Cl US | 6,270 | 229 | |||
Tower Bancorp | 2,900 | 78 | |||
Trico Bancshares | 8,400 | 167 | |||
Trustco Bank NY | 69,300 | 428 | |||
Trustmark (A) | 38,300 | 936 | |||
UDR † (A) | 101,400 | 1,789 | |||
UMB Financial | 7,700 | 313 | |||
| Description | Shares | Market Value ($ Thousands) | |||
Umpqua Holdings | 58,900 | $ | 781 | ||
Unibail (France) † | 7,338 | 1,489 | |||
United Bankshares | 9,000 | 236 | |||
United Community Banks * | 33,197 | 146 | |||
United Financial Bancorp | 34,000 | 475 | |||
Univest Corp of Pennsylvania | 3,000 | 56 | |||
Validus Holdings | 52,900 | 1,456 | |||
Ventas † (A) | 29,200 | 1,386 | |||
Verde Realty PIPE * (B) (G) | 21,100 | 468 | |||
ViewPoint Financial Group | 33,030 | 535 | |||
Vornado Realty Trust † (A) | 49,297 | 3,732 | |||
Washington Banking | 3,500 | 44 | |||
Washington Real Estate Investment Trust † | 20,900 | 639 | |||
Washington Trust Bancorp | 5,500 | 103 | |||
Webster Financial | 19,200 | 336 | |||
WesBanco | 19,800 | 322 | |||
West Bancorporation | 2,500 | 16 | |||
Westamerica Bancorporation | 9,200 | 530 | |||
Western Alliance Bancorp * | 37,700 | 215 | |||
Westfield Group † | 74,343 | 823 | |||
White Mountains Insurance Group | 2,700 | 959 | |||
Whitney Holding (A) | 76,099 | 1,049 | |||
Wilber | 1,100 | 7 | |||
Willis Group Holdings | 23,451 | 734 | |||
Wilmington Trust | 13,600 | 225 | |||
Wilshire Bancorp (A) | 50,100 | 553 | |||
Wintrust Financial | 3,200 | 119 | |||
World Acceptance * | 1,400 | 51 | |||
WSFS Financial | 27,700 | 1,080 | |||
Yadkin Valley Financial | 4,100 | 18 | |||
Zenith National Insurance (A) | 52,300 | 2,004 | |||
Zions Bancorporation (A) | 86,115 | 1,879 | |||
| 192,636 | |||||
Health Care — 4.4% | |||||
AMN Healthcare Services * | 137,600 | 1,211 | |||
Amsurg * (A) | 48,450 | 1,046 | |||
Assisted Living Concepts, Cl A * | 23,400 | 768 | |||
Brookdale Senior Living * | 39,800 | 829 | |||
Cambrex * | 91,200 | 370 | |||
Cantel Medical | 3,800 | 75 | |||
Conmed * | 92,741 | 2,208 | |||
Cooper (A) | 30,322 | 1,179 | |||
Cross Country Healthcare * (A) | 118,300 | 1,196 | |||
eResearchTechnology * | 5,800 | 40 | |||
Exactech * | 40,360 | 846 | |||
Healthspring * | 37,300 | 657 | |||
HealthTronics * | 251,800 | 902 | |||
Healthways * (A) | 31,100 | 500 | |||
Hill-Rom Holdings | 31,800 | 865 | |||
ICU Medical * | 39,500 | 1,361 | |||
Invacare | 6,100 | 162 | |||
inVentiv Health * | 8,400 | 189 | |||
Kendle International * | 34,796 | 608 | |||
Kensey Nash * | 15,527 | 366 | |||
Kindred Healthcare * | 55,800 | 1,007 | |||
Kinetic Concepts * (A) | 31,000 | 1,482 | |||
Magellan Health Services * | 17,100 | 744 | |||
Martek Biosciences * | 2,300 | 51 | |||
Medical Action Industries * | 5,500 | 68 | |||
| 4 | SEI Institutional Managed Trust / Semi-Annual Report / March 31, 2010 |
Table of Contents
Schedule of Investments (Unaudited)
Small Cap Value Fund
March 31, 2010
| Description | Shares | Market Value ($ Thousands) | |||
Medical Staffing Network Holdings * | 105,900 | $ | 15 | ||
Molina Healthcare * (A) | 27,300 | 687 | |||
National Dentex * | 12,500 | 122 | |||
Nighthawk Radiology Holdings * | 79,300 | 252 | |||
NovaMed * | 65,440 | 223 | |||
Owens & Minor | 100 | 5 | |||
Par Pharmaceutical * | 58,500 | 1,451 | |||
Patterson (A) | 32,702 | 1,015 | |||
PDL BioPharma | 64,700 | 402 | |||
PharMerica * (A) | 20,400 | 372 | |||
Providence Service * | 22,871 | 347 | |||
Psychiatric Solutions * | 8,100 | 241 | |||
Skilled Healthcare Group, Cl A * | 53,200 | 328 | |||
Symmetry Medical * | 6,900 | 69 | |||
Universal American Financial * (A) | 64,530 | 994 | |||
Universal Health Services, Cl B | 38,000 | 1,333 | |||
Young Innovations | 1,000 | 28 | |||
| 26,614 | |||||
Industrials — 16.1% | |||||
AAR * (A) | 27,900 | 692 | |||
Acuity Brands (A) | 41,400 | 1,747 | |||
Aircastle | 6,900 | 65 | |||
Airtran Holdings * | 289,200 | 1,469 | |||
Alamo Group | 29,300 | 586 | |||
Alaska Air Group * (A) | 17,200 | 709 | |||
Altra Holdings * | 7,300 | 100 | |||
Ampco-Pittsburgh | 31,900 | 792 | |||
AO Smith | 20,500 | 1,078 | |||
Apogee Enterprises | 36,300 | 574 | |||
Arkansas Best (A) | 26,800 | 801 | |||
Astec Industries * (A) | 67,000 | 1,940 | |||
Avis Budget Group * | 4,500 | 52 | |||
BE Aerospace * | 70,447 | 2,145 | |||
Beacon Roofing Supply * | 18,500 | 354 | |||
Belden (A) | 68,230 | 1,874 | |||
Brady, Cl A | 50,674 | 1,577 | |||
CAI International * | 24,800 | 306 | |||
Celadon Group * | 52,900 | 737 | |||
Clean Harbors * | 19,408 | 1,078 | |||
Columbus McKinnon * | 31,800 | 505 | |||
Comfort Systems USA (A) | 138,400 | 1,729 | |||
Consolidated Graphics * | 11,500 | 476 | |||
Cornell * | 114,800 | 2,102 | |||
Courier | 32,443 | 536 | |||
CRA International * | 20,400 | 468 | |||
Crane | 37,200 | 1,320 | |||
Deluxe | 55,900 | 1,086 | |||
Diamond Management & Technology Consultants | 41,600 | 327 | |||
Dollar Thrifty Automotive Group * | 1,000 | 32 | |||
Dycom Industries * | 69,700 | 611 | |||
DynCorp International, Cl A * | 27,500 | 316 | |||
EMCOR Group * | 133,000 | 3,276 | |||
EnerSys * | 7,900 | 195 | |||
Ennis | 5,400 | 88 | |||
EnPro Industries * (A) | 27,900 | 811 | |||
Esterline Technologies * | 24,038 | 1,188 | |||
Force Protection * | 90,500 | 545 | |||
FTI Consulting * (A) | 60,500 | 2,379 | |||
| Description | Shares | Market Value ($ Thousands) | |||
G&K Services | 47,842 | $ | 1,238 | ||
Gardner Denver | 33,309 | 1,467 | |||
Genco Shipping & Trading * (A) | 21,500 | 454 | |||
Generac Holdings * | 70,800 | 992 | |||
Geo Group * | 42,400 | 840 | |||
Gibraltar Industries * | 6,000 | 76 | |||
Granite Construction | 100,300 | 3,031 | |||
Healthcare Services Group | 5,000 | 112 | |||
Hexcel * | 34,600 | 500 | |||
Horizon Lines, Cl A | 7,600 | 41 | |||
Hudson Highland Group * | 79,100 | 348 | |||
IDEX | 77,673 | 2,571 | |||
Interface, Cl A | 114,290 | 1,323 | |||
International Shipholding | 1,400 | 41 | |||
Kadant * | 65,136 | 939 | |||
Kaman | 1,600 | 40 | |||
Kaydon (A) | 55,567 | 2,089 | |||
Kelly Services, Cl A * (A) | 14,000 | 233 | |||
Kirby * (A) | 39,600 | 1,511 | |||
Knoll | 28,100 | 316 | |||
Korn/Ferry International * (A) | 23,200 | 409 | |||
LECG * | 176,653 | 526 | |||
M&F Worldwide * | 4,500 | 138 | |||
McDermott International * | 18,100 | 487 | |||
Mcgrath Rentcorp | 3,432 | 83 | |||
Monster Worldwide * (A) | 113,900 | 1,892 | |||
Mueller Industries | 61,800 | 1,656 | |||
NACCO Industries, Cl A | 8,700 | 645 | |||
Navigant Consulting * | 6,500 | 79 | |||
Pacer International * (A) | 42,000 | 253 | |||
Preformed Line Products | 400 | 15 | |||
Quanex Building Products | 82,375 | 1,361 | |||
Rand Logistics * | 31,678 | 163 | |||
Regal-Beloit | 2,500 | 149 | |||
Republic Airways Holdings * (A) | 21,500 | 127 | |||
Ryder System | 53,700 | 2,081 | |||
School Specialty * (A) | 145,892 | 3,313 | |||
Seaboard | 60 | 78 | |||
Skywest | 40,400 | 577 | |||
Spirit Aerosystems Holdings, Cl A * (A) | 63,800 | 1,492 | |||
Standex International | 20,000 | 515 | |||
Steelcase, Cl A (A) | 36,800 | 238 | |||
Sterling Construction * | 900 | 14 | |||
SYKES Enterprises * | 47,400 | 1,083 | |||
TAL International Group (A) | 33,100 | 661 | |||
Teledyne Technologies * | 87,689 | 3,619 | |||
Teleflex | 27,817 | 1,782 | |||
Terex * | 67,103 | 1,524 | |||
Tetra Tech * | 45,254 | 1,043 | |||
Thomas & Betts * (A) | 29,100 | 1,142 | |||
Titan Machinery * | 19,350 | 265 | |||
Towers Watson, Cl A (A) | 103,115 | 4,898 | |||
Tredegar | 5,000 | 86 | |||
Trimas * | 5,600 | 36 | |||
Triumph Group | 31,189 | 2,186 | |||
TrueBlue * | 84,000 | 1,302 | |||
Tutor Perini * | 24,600 | 535 | |||
United Stationers * (A) | 14,500 | 853 | |||
US Airways Group * | 44,600 | 328 | |||
Watts Water Technologies, Cl A | 40,761 | 1,266 | |||
WESCO International * (A) | 49,771 | 1,728 | |||
| 5 | SEI Institutional Managed Trust / Semi-Annual Report / March 31, 2010 |
Table of Contents
Schedule of Investments (Unaudited)
Small Cap Value Fund
March 31, 2010
| Description | Shares | Market Value ($ Thousands) | |||
Woodward Governor (A) | 70,300 | $ | 2,248 | ||
YRC Worldwide * | 24,900 | 14 | |||
| 97,718 | |||||
Information Technology — 13.0% | |||||
3Com * | 73,700 | 567 | |||
Actel * | 101,300 | 1,403 | |||
Acxiom * | 9,500 | 171 | |||
Agilysys | 6,700 | 75 | |||
Anixter International * (A) | 33,800 | 1,584 | |||
Arris Group * | 90,700 | 1,089 | |||
Arrow Electronics * | 56,900 | 1,714 | |||
ATMI * | 27,400 | 529 | |||
Benchmark Electronics * (A) | 130,000 | 2,696 | |||
Black Box | 11,400 | 351 | |||
Brocade Communications Systems * | 202,454 | 1,156 | |||
CACI International, Cl A * | 63,241 | 3,089 | |||
CDC Software ADR * | 141,430 | 1,624 | |||
Checkpoint Systems * | 2,000 | 44 | |||
Ciber * | 290,700 | 1,087 | |||
Coherent * | 65,771 | 2,102 | |||
CPI International * | 2,600 | 34 | |||
CSG Systems International * | 64,800 | 1,358 | |||
CTS | 54,900 | 517 | |||
Diebold (A) | 72,160 | 2,292 | |||
Digi International * | 102,800 | 1,094 | |||
Digital River * | 89,746 | 2,719 | |||
Double-Take Software * | 66,100 | 589 | |||
DSP Group * | 6,900 | 57 | |||
Earthlink (A) | 191,200 | 1,633 | |||
Emulex * | 86,176 | 1,145 | |||
Fair Isaac (A) | 68,500 | 1,736 | |||
Hackett Group * | 106,816 | 297 | |||
Imation * | 99,400 | 1,094 | |||
Intermec * | 116,900 | 1,658 | |||
Jack Henry & Associates (A) | 45,900 | 1,104 | |||
Lawson Software * | 575,427 | 3,804 | |||
LeCroy * | 38,900 | 193 | |||
Lexmark International, Cl A * (A) | 38,800 | 1,400 | |||
Littelfuse * | 39,618 | 1,506 | |||
LTX-Credence * | 230,300 | 698 | |||
Manhattan Associates * | 89,400 | 2,278 | |||
Mantech International, Cl A * | 7,900 | 386 | |||
MAXIMUS (A) | 28,200 | 1,718 | |||
Methode Electronics (A) | 18,991 | 188 | |||
MicroStrategy, Cl A * | 18,300 | 1,557 | |||
ModusLink Global Solutions * | 6,900 | 58 | |||
Multi-Fineline Electronix * | 30,200 | 778 | |||
NCR * | 41,100 | 567 | |||
Novell * | 106,289 | 637 | |||
Omnivision Technologies * | 25,700 | 442 | |||
Oplink Communications * | 1,300 | 24 | |||
Orbotech * | 138,300 | 1,498 | |||
Parametric Technology * (A) | 96,003 | 1,733 | |||
Photronics * (A) | 41,400 | 211 | |||
Plantronics | 8,000 | 250 | |||
Progress Software * | 45,200 | 1,421 | |||
Quest Software * | 1,800 | 32 | |||
Radisys * (A) | 90,400 | 810 | |||
RADWARE * | 18,900 | 417 | |||
RF Micro Devices* | 17,700 | 88 | |||
| Description | Shares | Market Value ($ Thousands) | |||
Richardson Electronics | 54,504 | $ | 433 | ||
Rudolph Technologies * | 121,200 | 1,039 | |||
SRA International, Cl A * (A) | 87,600 | 1,821 | |||
Standard Microsystems * (A) | 33,000 | 768 | |||
Sybase * (A) | 30,469 | 1,420 | |||
SYNNEX * (A) | 23,800 | 704 | |||
Synopsys * | 42,212 | 944 | |||
Technitrol (A) | 81,000 | 428 | |||
TIBCO Software * | 77,800 | 839 | |||
Ultra Clean Holdings * | 92,200 | 786 | |||
Ultratech * | 97,900 | 1,331 | |||
Unisys * | 2,900 | 101 | |||
United Online | 113,900 | 852 | |||
Varian Semiconductor Equipment Associates * | 25,300 | 838 | |||
Web.com Group * | 65,400 | 357 | |||
Websense * (A) | 56,700 | 1,291 | |||
Xyratex * | 83,242 | 1,409 | |||
Zebra Technologies, Cl A * (A) | 63,765 | 1,887 | |||
Zoran * | 247,802 | 2,666 | |||
| 79,216 | |||||
Materials — 4.5% | |||||
AEP Industries * | 16,792 | 437 | |||
Aptargroup | 34,249 | 1,348 | |||
Boise * | 15,500 | 95 | |||
Buckeye Technologies * | 102,000 | 1,334 | |||
Bway Holding * | 14,000 | 281 | |||
Cabot | 30,523 | 928 | |||
Carpenter Technology | 26,900 | 985 | |||
Cytec Industries | 25,752 | 1,204 | |||
Domtar * | 100 | 6 | |||
Eagle Materials (A) | 18,900 | 502 | |||
Globe Specialty Metals * | 56,200 | 629 | |||
Graham Packaging * | 17,000 | 213 | |||
H.B. Fuller | 93,200 | 2,163 | |||
Hecla Mining * | 4,300 | 23 | |||
Innospec | 36,600 | 416 | |||
Kaiser Aluminum (A) | 11,000 | 424 | |||
KapStone Paper and Packaging * | 7,500 | 89 | |||
Landec * | 8,500 | 56 | |||
Myers Industries | 4,200 | 44 | |||
Neenah Paper | 29,806 | 472 | |||
NewMarket | 10,000 | 1,030 | |||
Olin (A) | 100,462 | 1,971 | |||
OM Group * (A) | 63,555 | 2,153 | |||
PolyOne * | 107,400 | 1,100 | |||
Quaker Chemical | 43,700 | 1,185 | |||
RTI International Metals * | 54,806 | 1,662 | |||
Schulman A | 3,200 | 78 | |||
Schweitzer-Mauduit International | 54,911 | 2,612 | |||
Sensient Technologies | 68,900 | 2,002 | |||
Silgan Holdings | 23,351 | 1,407 | |||
Solutia * | 1,400 | 22 | |||
Stepan | 11,300 | 632 | |||
| 27,503 | |||||
Telecommunication Services — 0.3% | |||||
Atlantic Telegraph-Network | 1,900 | 86 | |||
Cincinnati Bell * (A) | 242,900 | 828 | |||
Premiere Global Services * | 3,900 | 32 | |||
USA Mobility | 48,300 | 612 | |||
| 1,558 | |||||
| 6 | SEI Institutional Managed Trust / Semi-Annual Report / March 31, 2010 |
Table of Contents
Schedule of Investments (Unaudited)
Small Cap Value Fund
March 31, 2010
| Description | Shares | Market Value ($ Thousands) | |||
Utilities — 5.6% | |||||
AGL Resources | 59,681 | $ | 2,307 | ||
Allete (A) | 61,000 | 2,042 | |||
Avista (A) | 16,100 | 334 | |||
Black Hills | 3,300 | 100 | |||
Cleco | 79,000 | 2,098 | |||
El Paso Electric * | 146,600 | 3,020 | |||
Empire District Electric (A) | 54,600 | 984 | |||
Great Plains Energy (A) | 188,761 | 3,505 | |||
Idacorp | 73,265 | 2,536 | |||
Laclede Group | 5,400 | 182 | |||
Nicor | 5,200 | 218 | |||
Northwest Natural Gas (A) | 15,900 | 741 | |||
NorthWestern | 89,000 | 2,386 | |||
NV Energy | 59,600 | 735 | |||
Portland General Electric | 284,064 | 5,485 | |||
South Jersey Industries | 27,404 | 1,151 | |||
Southwest Gas | 28,500 | 853 | |||
UGI | 36,100 | 958 | |||
UIL Holdings | 14,800 | 407 | |||
Unisource Energy | 17,700 | 557 | |||
Vectren | 81,000 | 2,002 | |||
Westar Energy | 53,106 | 1,184 | |||
WGL Holdings | 13,000 | 451 | |||
| 34,236 | |||||
Total Common Stock | 568,989 | ||||
EXCHANGE TRADED FUNDS — 0.6% | |||||
iShares Russell 2000 Index Fund (A) | 13,312 | 903 | |||
iShares Russell 2000 Value Index Fund | 38,400 | 2,451 | |||
Total Exchange Traded Funds | 3,354 | ||||
Number of Warrants | |||||
WARRANTS — 0.0% | |||||
Washington Mutual (C) | 30,242 | 5 | |||
Total Warrants | 5 | ||||
AFFILIATED PARTNERSHIP — 21.8% | |||||
SEI Liquidity Fund, L.P., 0.210% (D)**†† | 136,752,874 | 132,606 | |||
Total Affiliated Partnership | 132,606 | ||||
| Description | Shares/Face Amount ($ Thousands) | Market Value ($ Thousands) | ||||
CASH EQUIVALENT — 6.1% | ||||||
SEI Daily Income Trust, Prime Obligation Fund, Cl A, 0.070%**†† | 37,323,543 | $ | 37,324 | |||
Total Cash Equivalent | 37,324 | |||||
U.S. TREASURY OBLIGATION (E) (F) — 0.4% | ||||||
U.S. Treasury Bills 0.119%, 06/03/10 | $ | 2,387 | 2,386 | |||
Total U.S. Treasury Obligation | 2,386 | |||||
Total Investments — 122.6% | $ | 744,664 | ||||
A summary of the open futures contracts held by the Fund at March 31, 2010, is as follows:
| Type of Contract | Number of Contracts Long (Short) | Expiration Date | Unrealized Depreciation ($ Thousands) | |||||
Russell 2000 Index E-MINI | 357 | Jun-2010 | $ | (8 | ) | |||
For the period ended March 31, 2010, the total amount of all open futures contracts, as presented in the table above, are representative of the volume of activity for this derivative type during the year.
Percentages are based on Net Assets of $607,328 ($ Thousands).
| † | Real Estate Investment Trust. |
| †† | Investment in Affiliated Security. |
| ‡ | Narrow Industries are utilized for compliance purposes, whereas broad sectors are utilized for reporting. |
| * | Non-income producing security. |
| ** | Rate shown is the 7-day effective yield as of March 31, 2010. |
| (A) | This security or a partial position of this security is on loan at March 31, 2010. The total market value of securities on loan at March 31, 2010 was $132,009 ($ Thousands). |
| (B) | Security fair valued using methods determined in good faith by the Valuation Committee of the Board of Trustees. The total market value of such securities as of March 31, 2010 was $468 ($ Thousands) and represented 0.1% of Net Assets. |
| (C) | This warrant represents a potential distribution settlement in a legal claim and does not have a strike price or expiration date. |
| (D) | This security was purchased with cash collateral received from securities on loan. The total value of such securities as of March 31, 2010 was $132,606 ($ Thousands). |
| (E) | The rate reported is the effective yield at the time of purchase. |
| (F) | Security, or portion thereof, has been pledged as collateral on open futures. |
| (G) | Security considered restricted. The total market value of such securities as of March 31, 2010 was $468 ($ Thousands) and represented 0.1% of Net Assets. |
ADR — American Depositary Receipt
Cl — Class
L.P. — Limited Partnership
PIPE — Private Investment in Public Entity
| 7 | SEI Institutional Managed Trust / Semi-Annual Report / March 31, 2010 |
Table of Contents
Schedule of Investments (Unaudited)
Small Cap Growth Fund
March 31, 2010
| Description | Shares | Market Value ($ Thousands) | |||
COMMON STOCK — 96.7% ‡ | |||||
Consumer Discretionary — 18.0% | |||||
Aaron Rents | 14,619 | $ | 487 | ||
Aeropostale * | 6,690 | 193 | |||
American Axle & Manufacturing Holdings * | 19,700 | 197 | |||
American Eagle Outfitters | 35,600 | 659 | |||
American Greetings, Cl A | 11,149 | 232 | |||
American Public Education * | 57,918 | 2,699 | |||
Amerigon * (A) | 39,559 | 400 | |||
Ameristar Casinos (A) | 1,600 | 29 | |||
AnnTaylor Stores * | 1,900 | 39 | |||
ArvinMeritor * (A) | 33,600 | 448 | |||
ATC Technology * | 9,600 | 165 | |||
Bally Technologies * | 27,759 | 1,125 | |||
Barnes & Noble | 2,900 | 63 | |||
Belo, Cl A | 23,662 | 161 | |||
Big 5 Sporting Goods | 13,400 | 204 | |||
Blue Nile * | 3,654 | 201 | |||
Brinker International | 12,637 | 244 | |||
Brown Shoe | 23,996 | 371 | |||
Brunswick | 3,400 | 54 | |||
Buckle | 9,238 | 340 | |||
Buffalo Wild Wings * | 19,925 | 959 | |||
Build-A-Bear Workshop * | 12,660 | 90 | |||
California Pizza Kitchen * | 33,800 | 567 | |||
Capella Education * (A) | 17,507 | 1,625 | |||
Cato, Cl A | 34,788 | 746 | |||
Century Casinos * | 67,553 | 169 | |||
Charming Shoppes * | 19,500 | 106 | |||
Cheesecake Factory * (A) | 25,084 | 679 | |||
Chico’s FAS (A) | 16,936 | 244 | |||
Christopher & Banks | 28,450 | 228 | |||
Citi Trends * (A) | 14,700 | 477 | |||
Coldwater Creek * | 22,031 | 153 | |||
Collective Brands * | 7,746 | 176 | |||
Cooper Tire & Rubber | 40,318 | 767 | |||
Core-Mark Holding * | 7,300 | 223 | |||
Corinthian Colleges * | 33,490 | 589 | |||
Cracker Barrel Old Country Store | 18,509 | 858 | |||
Deckers Outdoor * | 6,492 | 896 | |||
Denny’s * | 83,981 | 322 | |||
Dick’s Sporting Goods * (A) | 46,743 | 1,220 | |||
Dillard’s, Cl A | 3,900 | 92 | |||
DineEquity * | 4,833 | 191 | |||
Domino’s Pizza * | 21,649 | 295 | |||
Dress Barn * (A) | 9,047 | 237 | |||
Eastman Kodak | 124,800 | 723 | |||
EW Scripps, Cl A * | 1,000 | 8 | |||
Exide Technologies * | 20,300 | 117 | |||
Finish Line, Cl A | 123,793 | 2,020 | |||
Foot Locker | 19,530 | 294 | |||
Fossil * | 32,657 | 1,232 | |||
Fred’s, Cl A | 20,850 | 250 | |||
Grand Canyon Education * | 56,443 | 1,475 | |||
Gymboree * | 6,291 | 325 | |||
Hibbett Sports * (A) | 28,838 | 738 | |||
Hillenbrand | 9,800 | 216 | |||
HOT Topic * | 9,290 | 60 | |||
HSN * | 43,645 | 1,285 | |||
Iconix Brand Group * | 94,603 | 1,453 | |||
| Description | Shares | Market Value ($ Thousands) | |||
Insight Enterprises * | 20,976 | $ | 301 | ||
Interactive Data | 24,581 | 787 | |||
Interval Leisure Group * | 4,200 | 61 | |||
Isle of Capri Casinos * | 16,904 | 132 | |||
J Crew Group * | 43,484 | 1,996 | |||
Jarden | 41,950 | 1,396 | |||
Jo-Ann Stores * (A) | 7,012 | 294 | |||
JOS A Bank Clothiers * (A) | 13,900 | 760 | |||
K12 * (A) | 21,378 | 475 | |||
Kirkland's * | 70,298 | 1,476 | |||
Knology * | 25,464 | 342 | |||
Leggett & Platt | 19,400 | 420 | |||
Lennar, Cl A | 6,800 | 117 | |||
Life Time Fitness * (A) | 125,550 | 3,528 | |||
Live Nation * | 114,300 | 1,657 | |||
Liz Claiborne * | 12,971 | 96 | |||
Lululemon Athletica * (A) | 65,940 | 2,736 | |||
Maidenform Brands * | 13,112 | 286 | |||
Marcus | 8,371 | 109 | |||
Matthews International, Cl A | 6,119 | 217 | |||
Mediacom Communications, Cl A * | 31,032 | 185 | |||
Meritage Homes * | 32,365 | 680 | |||
Morningstar * (A) | 15,532 | 747 | |||
National CineMedia | 53,590 | 925 | |||
Nutri/System (A) | 16,427 | 293 | |||
NVR * | 930 | 676 | |||
Office Depot * | 17,571 | 140 | |||
OfficeMax * | 23,319 | 383 | |||
Orient-Express Hotels, Cl A * | 68,902 | 977 | |||
Overstock.com * | 7,662 | 124 | |||
Oxford Industries | 22,800 | 464 | |||
Papa John’s International * | 3,287 | 85 | |||
Peet’s Coffee & Tea * (A) | 17,026 | 675 | |||
Penske Auto Group * | 8,589 | 124 | |||
PetMed Express | 6,566 | 146 | |||
PetSmart | 25,445 | 813 | |||
PF Chang’s China Bistro * (A) | 25,714 | 1,135 | |||
Pinnacle Entertainment * | 156,765 | 1,527 | |||
Polaris Industries | 1,800 | 92 | |||
Pre-Paid Legal Services * | 4,200 | 159 | |||
RadioShack | 6,103 | 138 | |||
Red Robin Gourmet Burgers * | 30,189 | 738 | |||
Rue21 * | 25,721 | 892 | |||
Ryland Group | 49,700 | 1,115 | |||
Saks * | 152,765 | 1,314 | |||
Sally Beauty Holdings * | 6,500 | 58 | |||
Signet Jewelers * | 1,487 | 48 | |||
Sinclair Broadcast Group, Cl A * | 83,837 | 426 | |||
Sonic Automotive, Cl A * | 2,344 | 26 | |||
Sotheby’s | 24,485 | 761 | |||
Stage Stores | 9,100 | 140 | |||
Stamps.com * | 14,419 | 146 | |||
Steiner Leisure * | 9,477 | 420 | |||
Sturm Ruger (A) | 54,980 | 659 | |||
Superior Industries International | 5,300 | 85 | |||
Talbots * | 61,495 | 797 | |||
Tempur-Pedic International * (A) | 72,845 | 2,197 | |||
Tenneco * | 48,925 | 1,157 | |||
Tractor Supply (A) | 19,619 | 1,139 | |||
Tupperware Brands | 54,727 | 2,639 | |||
| 1 | SEI Institutional Managed Trust / Semi-Annual Report / March 31, 2010 |
Table of Contents
Schedule of Investments (Unaudited)
Small Cap Growth Fund
March 31, 2010
| Description | Shares | Market Value ($ Thousands) | |||
Ulta Salon Cosmetics & Fragrance * | 47,333 | $ | 1,071 | ||
Under Armour, Cl A * | 25,360 | 746 | |||
Unifirst | 3,500 | 180 | |||
Universal Electronics * | 2,400 | 54 | |||
Universal Technical Institute * | 17,873 | 408 | |||
Volcom * | 11,052 | 216 | |||
Warnaco Group * | 13,698 | 654 | |||
Wendy's, Cl A | 61,450 | 307 | |||
Williams-Sonoma | 6,354 | 167 | |||
Wolverine World Wide | 8,557 | 250 | |||
Zumiez * | 37,480 | 768 | |||
| 77,668 | |||||
Consumer Staples — 3.0% | |||||
Alliance One International * | 14,799 | 75 | |||
American Italian Pasta, Cl A * | 12,401 | 482 | |||
American Oriental Bioengineering * | 31,604 | 129 | |||
Andersons | 1,000 | 34 | |||
Cal-Maine Foods | 8,258 | 280 | |||
Casey’s General Stores | 16,128 | 506 | |||
Chiquita Brands International * | 40,641 | 639 | |||
Darling International * | 84,009 | 753 | |||
Diamond Foods | 10,730 | 451 | |||
Flowers Foods | 8,092 | 200 | |||
Fresh Del Monte Produce * | 6,506 | 132 | |||
Great Atlantic & Pacific Tea * | 12,800 | 98 | |||
Herbalife | 8,715 | 402 | |||
J&J Snack Foods | 8,700 | 378 | |||
Lancaster Colony (A) | 12,703 | 749 | |||
Medifast * | 43,167 | 1,085 | |||
Nash Finch | 9,488 | 319 | |||
Nu Skin Enterprises, Cl A | 34,600 | 1,007 | |||
Pantry * | 12,332 | 154 | |||
Prestige Brands Holdings * | 10,300 | 93 | |||
Ruddick | 12,500 | 396 | |||
Sanderson Farms | 10,998 | 590 | |||
Smart Balance * | 212,252 | 1,375 | |||
Spartan Stores | 10,546 | 152 | |||
United Natural Foods * | 19,501 | 549 | |||
Universal | 6,700 | 353 | |||
USANA Health Sciences * | 6,735 | 211 | |||
Vector Group | 72,700 | 1,122 | |||
Weis Markets | 1,210 | 44 | |||
Winn-Dixie Stores * | 22,916 | 286 | |||
| 13,044 | |||||
Energy — 4.8% | |||||
Arena Resources * (A) | 23,307 | 778 | |||
Atlas Energy | 5,414 | 168 | |||
BPZ Energy PIPE * | 12,500 | 92 | |||
BPZ Resources * | 26,693 | 196 | |||
Brigham Exploration * | 15,900 | 254 | |||
Bronco Drilling * | 25,800 | 121 | |||
CARBO Ceramics (A) | 3,700 | 231 | |||
Clean Energy Fuels * | 4,600 | 105 | |||
CNX Gas * | 2,397 | 91 | |||
Complete Production Services * | 1,500 | 17 | |||
Comstock Resources * | 57,793 | 1,838 | |||
Contango Oil & Gas * | 5,585 | 286 | |||
CVR Energy * | 8,098 | 71 | |||
Delek US Holdings | 8,165 | 59 | |||
| Description | Shares | Market Value ($ Thousands) | |||
Dresser-Rand Group * | 35,235 | $ | 1,107 | ||
Dril-Quip * | 300 | 18 | |||
Global Industries * (A) | 37,383 | 240 | |||
GMX Resources * | 66,403 | 546 | |||
Goodrich Petroleum * (A) | 57,061 | 892 | |||
Gulf Island Fabrication | 8,417 | 183 | |||
Hercules Offshore * | 24,300 | 105 | |||
Infinity Bio-Energy * | 741,494 | — | |||
Lufkin Industries | 6,782 | 537 | |||
Matrix Service * | 9,406 | 101 | |||
McMoRan Exploration * (A) | 30,800 | 451 | |||
Nordic American Tanker Shipping, Cl US | 6,924 | 210 | |||
PetroHawk Energy * | 120,083 | 2,435 | |||
Petroquest Energy * | 138,940 | 699 | |||
Quicksilver Resources * | 67,432 | 949 | |||
RPC | 3,800 | 42 | |||
SandRidge Energy * | 293,087 | 2,257 | |||
Scorpio Tankers * | 49,250 | 619 | |||
Tesoro | 2,000 | 28 | |||
Tetra Technologies * | 4,400 | 54 | |||
Tidewater | 1,100 | 52 | |||
USEC * | 41,800 | 241 | |||
Vaalco Energy | 99,860 | 493 | |||
Vantage Drilling * | 78,100 | 115 | |||
Venoco * | 18,193 | 233 | |||
W&T Offshore | 29,200 | 245 | |||
Willbros Group * (A) | 108,633 | 1,305 | |||
World Fuel Services (A) | 80,312 | 2,140 | |||
| 20,604 | |||||
Financials — 4.7% | |||||
Affiliated Managers Group * (A) | 22,963 | 1,814 | |||
Alexander’s * † | 100 | 30 | |||
Amtrust Financial Services | 3,800 | 53 | |||
Apollo Investment *(B) | 2,900 | 37 | |||
Assured Guaranty | 1,000 | 22 | |||
Axis Capital Holdings | 2,000 | 63 | |||
Bank of the Ozarks (A) | 8,616 | 303 | |||
Banner | 45,500 | 175 | |||
Calamos Asset Management, Cl A | 12,625 | 181 | |||
CapitalSource | 284,484 | 1,590 | |||
Cardtronics * | 65,999 | 830 | |||
Citizens Republic Bancorp * | 21,200 | 25 | |||
Cohen & Steers | 6,919 | 173 | |||
Dollar Financial * | 1,869 | 45 | |||
DuPont Fabros Technology † (A) | 3,027 | 65 | |||
EastGroup Properties † | 3,378 | 128 | |||
eHealth * | 4,300 | 68 | |||
Equity Lifestyle Properties † | 3,438 | 185 | |||
Equity One † | 12,457 | 235 | |||
Financial Engines * | 16,691 | 282 | |||
First Bancorp | 2,600 | 6 | |||
First Cash Financial Services * | 1,028 | 22 | |||
Getty Realty † | 13,698 | 321 | |||
Greenhill | 12,639 | 1,038 | |||
Hatteras Financial † | 2,900 | 75 | |||
Hercules Technology Growth Capital | 10,189 | 108 | |||
Jones Lang LaSalle | 15,705 | 1,145 | |||
Knight Capital Group, Cl A * | 600 | 9 | |||
| 2 | SEI Institutional Managed Trust / Semi-Annual Report / March 31, 2010 |
Table of Contents
Schedule of Investments (Unaudited)
Small Cap Growth Fund
March 31, 2010
| Description | Shares | Market Value ($ Thousands) | |||
Kohlberg Capital | 6,300 | $ | 36 | ||
Life Partners Holdings (A) | 1,450 | 32 | |||
LTC Properties † | 14,955 | 405 | |||
MarketAxess Holdings | 108,173 | 1,702 | |||
MF Global Holdings * | 91,975 | 742 | |||
MGIC Investment * | 218,327 | 2,395 | |||
Mid-America Apartment Communities † | 2,949 | 153 | |||
MSCI, Cl A * | 19,957 | 720 | |||
Nelnet, Cl A | 22,100 | 410 | |||
Omega Healthcare Investors † | 1,700 | 33 | |||
optionsXpress Holdings | 21,514 | 350 | |||
Penson Worldwide * (A) | 300 | 3 | |||
PHH * | 3,500 | 83 | |||
Phoenix * | 14,900 | 36 | |||
Potlatch † | 4,623 | 162 | |||
PS Business Parks † | 300 | 16 | |||
Redwood Trust † | 13,000 | 201 | |||
Riskmetrics Group * (A) | 1,028 | 23 | |||
Senior Housing Properties Trust † | 1,100 | 24 | |||
Stifel Financial * | 2,033 | 109 | |||
SVB Financial Group * | 22,925 | 1,070 | |||
SWS Group | 5,857 | 68 | |||
Tanger Factory Outlet Centers † | 3,600 | 155 | |||
Texas Capital Bancshares * | 4,557 | 87 | |||
Titanium Asset Management *(C)(G) | 140,900 | 420 | |||
Tompkins Financial, Cl US | 1,000 | 36 | |||
Tower Group | 15,006 | 333 | |||
TradeStation Group * | 28,600 | 200 | |||
Trustco Bank NY | 46,877 | 289 | |||
Umpqua Holdings | 4,100 | 54 | |||
Value Creation * (C)(G) | 145,600 | 108 | |||
World Acceptance * | 20,575 | 742 | |||
| 20,225 | |||||
Health Care — 18.8% | |||||
Abaxis * | 67,856 | 1,845 | |||
Achillion Pharmaceuticals * | 84,225 | 233 | |||
Acorda Therapeutics * | 68,777 | 2,352 | |||
Affymetrix * (A) | 65,238 | 479 | |||
Air Methods * | 16,195 | 551 | |||
Albany Molecular Research * | 17,215 | 144 | |||
Alexion Pharmaceuticals * | 13,237 | 720 | |||
Align Technology * (A) | 54,794 | 1,060 | |||
Allos Therapeutics * | 15,200 | 113 | |||
Allscripts Healthcare Solutions * | 10,300 | 201 | |||
Alnylam Pharmaceuticals * (A) | 19,673 | 335 | |||
AMAG Pharmaceuticals * | 75,252 | 2,627 | |||
Amedisys * | 28,367 | 1,566 | |||
American Medical Systems Holdings * | 27,400 | 509 | |||
AMERIGROUP * | 23,631 | 786 | |||
AMN Healthcare Services * | 31,899 | 281 | |||
Analogic | 2,156 | 92 | |||
Angiodynamics * | 5,752 | 90 | |||
athenahealth * | 27,005 | 987 | |||
Auxilium Pharmaceuticals * (A) | 4,100 | 128 | |||
BioMarin Pharmaceuticals * | 51,181 | 1,196 | |||
Bio-Reference Labs * | 1,800 | 79 | |||
BioScrip * | 7,717 | 62 | |||
Biovail | 42,190 | 708 | |||
Bruker BioSciences * | 61,214 | 897 | |||
| Description | Shares | Market Value ($ Thousands) | |||
Cantel Medical | 25,500 | $ | 506 | ||
Cardiome Pharma * | 179,451 | 1,186 | |||
Catalyst Health Solutions * | 34,750 | 1,438 | |||
Centene * | 11,384 | 274 | |||
Cepheid * (A) | 25,947 | 453 | |||
Chemed (A) | 23,633 | 1,285 | |||
Computer Programs & Systems | 7,554 | 295 | |||
Conceptus * (A) | 59,847 | 1,194 | |||
Conmed * | 28,950 | 689 | |||
Corvel * | 3,873 | 139 | |||
Covance * | 2,984 | 183 | |||
Cubist Pharmaceuticals * | 40,720 | 918 | |||
Cyberonics * | 20,071 | 385 | |||
Cypress Bioscience * (A) | 12,973 | 64 | |||
Dendreon * | 4,300 | 157 | |||
Dionex * | 2,414 | 180 | |||
Durect * | 265,914 | 800 | |||
Electro-Optical Sciences * (A) | 15,255 | 113 | |||
Emergency Medical Services, Cl A * | 12,800 | 724 | |||
Emergent Biosolutions * | 2,415 | 40 | |||
Enzo Biochem * | 17,908 | 108 | |||
eResearchTechnology * | 37,846 | 261 | |||
Exelixis * (A) | 58,800 | 357 | |||
Genoptix * | 25,272 | 897 | |||
Gen-Probe * | 11,875 | 594 | |||
Gentiva Health Services * | 1,300 | 37 | |||
Haemonetics * | 7,500 | 429 | |||
Halozyme Therapeutics * | 19,900 | 159 | |||
Healthsouth * (A) | 109,380 | 2,045 | |||
Healthspring * | 12,608 | 222 | |||
Healthways * | 5,920 | 95 | |||
HMS Holdings * (A) | 22,813 | 1,163 | |||
Human Genome Sciences * | 68,716 | 2,075 | |||
ICU Medical * | 6,900 | 238 | |||
Idexx Laboratories * | 9,607 | 553 | |||
Immucor * | 33,866 | 758 | |||
Immunogen * | 32,100 | 260 | |||
Incyte * | 48,730 | 680 | |||
Insmed * | 44,914 | 53 | |||
Integra LifeSciences Holdings * (A) | 8,786 | 385 | |||
InterMune * (A) | 10,626 | 474 | |||
Inverness Medical Innovations * | 2,000 | 78 | |||
IPC The Hospitalist * | 18,866 | 662 | |||
Isis Pharmaceuticals * (A) | 11,557 | 126 | |||
Kendle International * | 9,127 | 159 | |||
Kensey Nash * | 9,400 | 222 | |||
Landauer | 6,873 | 448 | |||
LCA-Vision * | 18,200 | 151 | |||
LHC Group * (A) | 44,752 | 1,501 | |||
Luminex * (A) | 29,388 | 495 | |||
Magellan Health Services * | 2,162 | 94 | |||
Martek Biosciences * (A) | 21,597 | 486 | |||
Masimo | 38,397 | 1,019 | |||
MedAssets * | 24,295 | 510 | |||
Medicis Pharmaceutical, Cl A | 43,510 | 1,095 | |||
Medivation * (A) | 68,374 | 717 | |||
Mednax * | 13,549 | 788 | |||
Meridian Bioscience | 31,401 | 640 | |||
Merit Medical Systems * | 9,620 | 147 | |||
Mettler Toledo International * | 1,000 | 109 | |||
| 3 | SEI Institutional Managed Trust / Semi-Annual Report / March 31, 2010 |
Table of Contents
Schedule of Investments (Unaudited)
Small Cap Growth Fund
March 31, 2010
| Description | Shares | Market Value ($ Thousands) | |||
Molina Healthcare * | 5,267 | $ | 133 | ||
MWI Veterinary Supply * | 23,097 | 933 | |||
Myriad Genetics * | 31,008 | 746 | |||
National Healthcare | 3,706 | 131 | |||
Natus Medical * | 16,330 | 260 | |||
Nektar Therapeutics * | 41,091 | 625 | |||
Neogen * (A) | 20,816 | 522 | |||
NPS Pharmaceuticals * | 18,227 | 92 | |||
NuVasive * (A) | 51,985 | 2,350 | |||
Obagi Medical Products * | 47,886 | 583 | |||
Odyssey HealthCare * | 7,200 | 130 | |||
Omnicell * (A) | 61,616 | 865 | |||
Onyx Pharmaceuticals * (A) | 5,339 | 162 | |||
Optimer Pharmaceuticals * (A) | 18,697 | 230 | |||
Orthofix International * | 9,409 | 342 | |||
Owens & Minor | 16,714 | 775 | |||
Par Pharmaceutical * | 36,149 | 896 | |||
Parexel International * | 29,444 | 686 | |||
PDL BioPharma (A) | 372,789 | 2,315 | |||
Perrigo | 5,311 | 312 | |||
Pharmaceutical Product Development | 4,487 | 107 | |||
Pharmasset * | 5,404 | 145 | |||
Phase Forward * | 87,352 | 1,142 | |||
Pozen * | 124,424 | 1,192 | |||
PSS World Medical * (A) | 36,737 | 864 | |||
Questcor Pharmaceuticals * | 152,553 | 1,255 | |||
Quidel * (A) | 17,050 | 248 | |||
Regeneron Pharmaceuticals * | 24,046 | 637 | |||
Savient Pharmaceuticals * (A) | 57,429 | 830 | |||
Seattle Genetics * (A) | 47,977 | 573 | |||
SIGA Technologies * (A) | 34,807 | 231 | |||
Sirona Dental Systems * | 15,984 | 608 | |||
Spectrum Pharmaceuticals * (A) | 34,700 | 160 | |||
StemCells * (A) | 104,300 | 121 | |||
STERIS | 56,920 | 1,916 | |||
Techne | 17,727 | 1,129 | |||
Theravance * (A) | 68,564 | 913 | |||
Thoratec * | 35,069 | 1,173 | |||
United Therapeutics * | 8,678 | 480 | |||
Universal American Financial * | 7,500 | 116 | |||
Valeant Pharmaceuticals International * (A) | 4,543 | 195 | |||
Varian * | 1,500 | 78 | |||
Viropharma * | 53,279 | 726 | |||
Vivus * (A) | 9,500 | 83 | |||
Volcano * | 19,134 | 462 | |||
Waters * | 3,654 | 247 | |||
WellCare Health Plans * | 40,450 | 1,205 | |||
Zoll Medical * | 15,461 | 407 | |||
| 80,685 | |||||
Industrials — 15.6% | |||||
Actuant, Cl A | 8,053 | 157 | |||
Acuity Brands | 34,846 | 1,471 | |||
Administaff | 24,687 | 527 | |||
Advisory Board * (A) | 15,584 | 491 | |||
Aegean Marine Petroleum Network | 80,705 | 2,290 | |||
AerCap Holdings * | 177,694 | 2,047 | |||
Aerovironment * | 38,319 | 1,001 | |||
Air Transport Services Group * | 30,200 | 102 | |||
| Description | Shares | Market Value ($ Thousands) | |||
Airtran Holdings * (A) | 304,120 | $ | 1,545 | ||
Alaska Air Group * | 3,833 | 158 | |||
Allegiant Travel, Cl A * | 1,000 | 58 | |||
Alliant Techsystems * | 7,460 | 607 | |||
American Science & Engineering | 2,400 | 180 | |||
AO Smith | 2,816 | 148 | |||
APAC Customer Services * | 114,671 | 659 | |||
Apogee Enterprises | 26,354 | 417 | |||
Arkansas Best | 3,773 | 113 | |||
Armstrong World Industries * (A) | 14,165 | 514 | |||
Atlas Air Worldwide Holdings * | 27,622 | 1,465 | |||
Avis Budget Group * (A) | 78,469 | 902 | |||
AZZ | 3,200 | 108 | |||
Badger Meter (A) | 3,235 | 125 | |||
Barnes Group | 40,529 | 788 | |||
Beacon Roofing Supply * | 37,984 | 727 | |||
Brady, Cl A | 4,124 | 128 | |||
Briggs & Stratton | 10,076 | 196 | |||
Bucyrus International, Cl A | 3,600 | 238 | |||
Celadon Group * | 47,467 | 662 | |||
Cenveo * | 34,750 | 301 | |||
Chart Industries * | 45,913 | 918 | |||
Chicago Bridge & Iron * | 17,160 | 399 | |||
Comfort Systems USA | 18,100 | 226 | |||
Continental Airlines, Cl B * | 43,000 | 945 | |||
Copa Holdings, Cl A | 12,658 | 769 | |||
Copart * | 43,901 | 1,563 | |||
Corporate Executive Board | 47,241 | 1,256 | |||
CoStar Group * (A) | 51,644 | 2,144 | |||
CRA International * | 4,900 | 112 | |||
Cubic | 18,283 | 658 | |||
Curtiss-Wright | 1,995 | 69 | |||
Deluxe | 13,933 | 270 | |||
Diamond Management & Technology Consultants | 1,900 | 15 | |||
Dycom Industries * | 5,300 | 46 | |||
Dynamic Materials | 7,783 | 122 | |||
EMCOR Group * | 8,600 | 212 | |||
Energy Recovery * | 31,900 | 201 | |||
EnerNOC * | 57,571 | 1,709 | |||
EnerSys * | 25,484 | 629 | |||
Forward Air | 28,293 | 744 | |||
Gardner Denver | 25,925 | 1,142 | |||
GenCorp * | 49,700 | 286 | |||
General Cable * | 10,388 | 281 | |||
Genesee & Wyoming, Cl A * | 4,030 | 138 | |||
Geo Group * | 8,987 | 178 | |||
GeoEye * (A) | 28,901 | 853 | |||
GrafTech International * | 9,173 | 125 | |||
Graham | 37,541 | 675 | |||
GT Solar International * (A) | 10,900 | 57 | |||
Hawaiian Holdings * | 86,371 | 636 | |||
Healthcare Services Group | 46,187 | 1,034 | |||
Heico, Cl A | 10,128 | 402 | |||
Hill International * | 1,270 | 7 | |||
HNI | 13,544 | 361 | |||
Horizon Lines, Cl A | 106,786 | 581 | |||
ICF International * | 38,096 | 946 | |||
IHS, Cl A * | 16,380 | 876 | |||
II-VI * | 14,966 | 507 | |||
Innerworkings * (A) | 328,148 | 1,706 | |||
Interface, Cl A | 69,840 | 809 | |||
| 4 | SEI Institutional Managed Trust / Semi-Annual Report / March 31, 2010 |
Table of Contents
Schedule of Investments (Unaudited)
Small Cap Growth Fund
March 31, 2010
| Description | Shares | Market Value ($ Thousands) | |||
Kaman | 18,398 | $ | 460 | ||
Kaydon (A) | 24,538 | 923 | |||
KBR | 10,200 | 226 | |||
Kelly Services, Cl A * | 9,300 | 155 | |||
Knight Transportation (A) | 27,854 | 587 | |||
Landstar System | 36,445 | 1,530 | |||
Lennox International | 7,339 | 325 | |||
Marten Transport * | 12,945 | 255 | |||
Michael Baker * | 7,218 | 249 | |||
Middleby * | 14,236 | 820 | |||
Mine Safety Appliances | 11,400 | 319 | |||
MYR Group * (A) | 28,051 | 457 | |||
Navistar International * | 7,300 | 327 | |||
Nordson | 5,010 | 340 | |||
Old Dominion Freight Line * | 47,505 | 1,586 | |||
Oshkosh Truck | 1,200 | 48 | |||
Owens Corning * | 13,700 | 349 | |||
Polypore International * | 17,300 | 302 | |||
Powell Industries * | 8,493 | 276 | |||
Raven Industries | 10,672 | 315 | |||
Resources Connection * | 72,699 | 1,394 | |||
Ritchie Bros. Auctioneers | 28,390 | 611 | |||
Rollins | 38,728 | 840 | |||
Rush Enterprises, Cl A * | 61,229 | 809 | |||
Standard Parking * | 62,595 | 1,028 | |||
Standard Register | 19,382 | 104 | |||
Sun Hydraulics | 1,351 | 35 | |||
SYKES Enterprises * (A) | 9,100 | 208 | |||
Teledyne Technologies * | 5,629 | 232 | |||
Tennant (A) | 33,063 | 906 | |||
Tetra Tech * | 46,021 | 1,060 | |||
Titan Machinery * (A) | 60,286 | 825 | |||
TransDigm Group | 28,285 | 1,500 | |||
Tredegar | 10,379 | 177 | |||
TrueBlue * | 9,600 | 149 | |||
Tutor Perini * | 8,214 | 179 | |||
UAL * | 64,902 | 1,269 | |||
US Airways Group * | 15,912 | 117 | |||
US Ecology | 3,300 | 53 | |||
Vitran * | 47,250 | 572 | |||
Wabtec | 29,325 | 1,235 | |||
WESCO International * | 37,550 | 1,303 | |||
| 67,187 | |||||
Information Technology — 27.2% | |||||
3Com * | 57,182 | 440 | |||
ACI Worldwide * | 12,074 | 249 | |||
Actuate * | 33,096 | 185 | |||
ADC Telecommunications * | 23,200 | 170 | |||
Adtran | 12,541 | 330 | |||
Advanced Energy Industries * | 186,605 | 3,090 | |||
Advent Software * (A) | 29,223 | 1,308 | |||
Amkor Technology * (A) | 78,189 | 553 | |||
Ancestry.com * | 47,068 | 798 | |||
Ansys * | 11,887 | 513 | |||
AOL * | 26,685 | 675 | |||
Applied Micro Circuits * | 59,700 | 515 | |||
Archipelago Learning * | 51,896 | 757 | |||
Ariba * | 19,300 | 248 | |||
Arris Group * (A) | 88,749 | 1,066 | |||
Art Technology Group * | 569,948 | 2,513 | |||
AsiaInfo Holdings * | 28,309 | 750 | |||
| Description | Shares | Market Value ($ Thousands) | |||
Atheros Communications * | 82,190 | $ | 3,182 | ||
Atmel * | 209,865 | 1,056 | |||
ATMI * | 54,568 | 1,054 | |||
Aviat Networks * | 29,600 | 196 | |||
Benchmark Electronics * | 27,342 | 567 | |||
Blackbaud | 11,900 | 300 | |||
Blackboard * | 40,421 | 1,684 | |||
Blue Coat Systems * | 33,220 | 1,031 | |||
Brightpoint * | 80,841 | 609 | |||
Brocade Communications Systems * | 8,300 | 47 | |||
Cabot Microelectronics * | 5,449 | 206 | |||
CACI International, Cl A * | 3,470 | 169 | |||
Checkpoint Systems * | 18,516 | 410 | |||
Ciber * | 5,300 | 20 | |||
Cirrus Logic * | 51,712 | 434 | |||
Cogent * (A) | 26,234 | 268 | |||
Cognex | 15,509 | 287 | |||
CommScope * | 28,590 | 801 | |||
CommVault Systems * | 57,914 | 1,236 | |||
Comtech Telecommunications * | 31,254 | 1,000 | |||
Concur Technologies * (A) | 13,360 | 548 | |||
CSG Systems International * | 7,400 | 155 | |||
CTS | 23,404 | 220 | |||
Daktronics | 16,330 | 124 | |||
DealerTrack Holdings * (A) | 91,417 | 1,561 | |||
Digital River * (A) | 36,417 | 1,103 | |||
Diodes * | 13,187 | 295 | |||
Dolby Laboratories, Cl A * | 1 | — | |||
Double-Take Software * | 3,468 | 31 | |||
DTS * | 64,233 | 2,186 | |||
Earthlink | 106,571 | 910 | |||
EchoStar, Cl A * | 600 | 12 | |||
Emulex * | 14,922 | 198 | |||
Entegris * | 39,500 | 199 | |||
Euronet Worldwide * | 44,532 | 821 | |||
Exar * | 4,300 | 30 | |||
Forrester Research * (A) | 5,404 | 162 | |||
Gartner * | 61,685 | 1,372 | |||
GSI Commerce * (A) | 49,671 | 1,374 | |||
Hackett Group * | 10,233 | 28 | |||
Harmonic * | 12,457 | 79 | |||
Heartland Payment Systems | 53,608 | 997 | |||
Hittite Microwave * | 16,916 | 744 | |||
Hypercom * | 31,720 | 123 | |||
IAC * | 23,300 | 530 | |||
Imation * | 48,931 | 539 | |||
Infinera * | 9,490 | 81 | |||
infoGROUP * | 33,039 | 258 | |||
Informatica * | 12,700 | 341 | |||
Integrated Device Technology * | 74,400 | 456 | |||
InterDigital * | 27,217 | 758 | |||
Intermec * | 55,586 | 788 | |||
Internet Capital Group * | 87,671 | 741 | |||
Intersil, Cl A | 27,400 | 404 | |||
Ipass | 51,600 | 59 | |||
IXYS * | 25,166 | 215 | |||
j2 Global Communications * | 61,825 | 1,447 | |||
Jack Henry & Associates | 14,600 | 351 | |||
JDA Software Group * | 26,781 | 745 | |||
Kenexa * | 6,800 | 93 | |||
Knot * | 46,710 | 365 | |||
| 5 | SEI Institutional Managed Trust / Semi-Annual Report / March 31, 2010 |
Table of Contents
Schedule of Investments (Unaudited)
Small Cap Growth Fund
March 31, 2010
| Description | Shares | Market Value ($ Thousands) | |||
L-1 Identity Solutions, Cl 1 * | 27,396 | $ | 245 | ||
Lawson Software * | 8,800 | 58 | |||
Lionbridge Technologies * | 2,900 | 11 | |||
Loral Space & Communications * | 6,300 | 221 | |||
Manhattan Associates * | 17,800 | 453 | |||
Marchex, Cl A | 2,100 | 11 | |||
MAXIMUS | 13,781 | 840 | |||
MercadoLibre * | 17,925 | 864 | |||
Meru Networks * | 6,053 | 91 | |||
Methode Electronics | 68,174 | 675 | |||
Micrel | 26,574 | 283 | |||
Micros Systems * | 5,114 | 168 | |||
Microsemi * (A) | 72,293 | 1,254 | |||
MicroStrategy, Cl A * | 24,831 | 2,112 | |||
MIPS Technologies * | 29,794 | 133 | |||
MKS Instruments * | 26,263 | 515 | |||
ModusLink Global Solutions * | 10,360 | 87 | |||
Molex | 2,100 | 44 | |||
MoneyGram International * | 91,580 | 349 | |||
Monolithic Power Systems * (A) | 5,900 | 132 | |||
Monotype Imaging Holdings * | 49,189 | 479 | |||
Move * | 35,904 | 75 | |||
Multi-Fineline Electronix * | 10,455 | 269 | |||
Net 1 UEPS Technologies * | 108,742 | 2,000 | |||
Netgear * | 26,456 | 691 | |||
Netlogic Microsystems * (A) | 51,845 | 1,526 | |||
Netscout Systems * | 7,746 | 115 | |||
NetSuite * | 76,260 | 1,109 | |||
Nuance Communications * (A) | 35,885 | 597 | |||
ON Semiconductor * | 21,125 | 169 | |||
Openwave Systems * | 13,820 | 32 | |||
Palm * (A) | 85,600 | 322 | |||
Parametric Technology * | 23,700 | 428 | |||
Park Electrochemical | 14,875 | 428 | |||
Plantronics | 5,784 | 181 | |||
Plexus * | 9,825 | 354 | |||
Power Integrations (A) | 48,154 | 1,984 | |||
Progress Software * | 3,193 | 100 | |||
Quality Systems (A) | 26,205 | 1,610 | |||
Quantum * | 56,700 | 149 | |||
Quest Software * | 62,462 | 1,111 | |||
Radisys * | 9,501 | 85 | |||
RealNetworks * | 29,600 | 143 | |||
RF Micro Devices * (A) | 179,167 | 892 | |||
RightNow Technologies * | 29,064 | 519 | |||
Riverbed Technology * | 36,003 | 1,023 | |||
Rofin-Sinar Technologies * | 5,664 | 128 | |||
Rogers * | 3,454 | 100 | |||
Rosetta Stone * | 47,311 | 1,125 | |||
Rubicon Technology * (A) | 35,954 | 726 | |||
Sapient | 170,499 | 1,558 | |||
SAVVIS * | 39,954 | 659 | |||
Scansource * | 19,390 | 558 | |||
Semtech * (A) | 26,500 | 462 | |||
Skyworks Solutions * (A) | 38,060 | 594 | |||
Smith Micro Software * | 56,969 | 504 | |||
Solera Holdings | 41,065 | 1,587 | |||
Sonic Solutions * | 32,605 | 305 | |||
Sourcefire * | 16,732 | 384 | |||
SRA International, Cl A * | 7,411 | 154 | |||
SS&C Technologies Holdings * | 76,031 | 1,146 | |||
Standard Microsystems * | 9,406 | 219 | |||
| Description | Shares | Market Value ($ Thousands) | |||
STEC * (A) | 67,065 | $ | 803 | ||
SuccessFactors * | 40,700 | 775 | |||
Synaptics * (A) | 13,299 | 367 | |||
Synchronoss Technologies * | 48,231 | 934 | |||
Syntel | 38,654 | 1,487 | |||
Take-Two Interactive Software * | 18,812 | 185 | |||
Taleo, Cl A * | 68,530 | 1,776 | |||
Technitrol | 11,000 | 58 | |||
Tekelec * | 5,030 | 91 | |||
TeleCommunication Systems, Cl A * | 11,536 | 85 | |||
TeleTech Holdings * | 69,108 | 1,180 | |||
Teradyne * | 181,238 | 2,024 | |||
Tessera Technologies * (A) | 33,131 | 672 | |||
THQ * | 22,772 | 160 | |||
TIBCO Software * | 132,700 | 1,432 | |||
Tivo * | 19,196 | 329 | |||
Trimble Navigation * | 37,170 | 1,068 | |||
TriQuint Semiconductor * | 105,747 | 740 | |||
TTM Technologies * | 11,368 | 101 | |||
Tyler Technologies * | 4,572 | 86 | |||
Ultimate Software Group * | 5,943 | 196 | |||
Ultratech * | 1,914 | 26 | |||
Unisys * (A) | 35,999 | 1,256 | |||
United Online | 102,361 | 766 | |||
Valueclick * | 125,749 | 1,275 | |||
VanceInfo Technologies ADR * | 59,292 | 1,322 | |||
Vasco Data Security International * | 34,349 | 283 | |||
Veeco Instruments * (A) | 49,871 | 2,169 | |||
VeriFone Holdings * | 59,611 | 1,205 | |||
Verigy * | 115,530 | 1,292 | |||
Vishay Intertechnology * | 27,200 | 278 | |||
VistaPrint * | 39,542 | 2,264 | |||
Vocus * | 61,975 | 1,057 | |||
Volterra Semiconductor * | 62,961 | 1,580 | |||
Websense * | 35,710 | 813 | |||
Wright Express * | 27,500 | 828 | |||
Zoran * | 77,568 | 835 | |||
| 117,104 | |||||
Materials — 2.6% | |||||
AM Castle | 7,411 | 97 | |||
Carpenter Technology | 5,900 | 216 | |||
Commercial Metals | 4,779 | 72 | |||
Crown Holdings * | 27,200 | 733 | |||
Domtar * | 3,600 | 232 | |||
General Steel Holdings * | 18,620 | 76 | |||
Glatfelter | 4,300 | 62 | |||
H.B. Fuller | 15,357 | 356 | |||
Innophos Holdings | 8,987 | 251 | |||
Innospec | 11,536 | 131 | |||
Intrepid Potash * | 25,643 | 778 | |||
James River Coal * | 21,900 | 348 | |||
Koppers Holdings | 22,946 | 650 | |||
LSB Industries * | 3,003 | 46 | |||
Myers Industries | 8,324 | 87 | |||
Nalco Holding | 34,915 | 849 | |||
Neenah Paper | 6,327 | 100 | |||
NewMarket | 13,928 | 1,434 | |||
Olin | 20,938 | 411 | |||
PolyOne * | 57,245 | 586 | |||
| 6 | SEI Institutional Managed Trust / Semi-Annual Report / March 31, 2010 |
Table of Contents
Schedule of Investments (Unaudited)
Small Cap Growth Fund
March 31, 2010
| Description | Shares | Market Value ($ Thousands) | |||
Rock-Tenn, Cl A | 7,538 | $ | 344 | ||
Rockwood Holdings * | 2,900 | 77 | |||
Royal Gold | 600 | 28 | |||
Schulman A | 8,903 | 218 | |||
Silvercorp Metals PIPE * | 34,000 | 233 | |||
Spartech * | 3,814 | 45 | |||
Stepan | 423 | 24 | |||
Stillwater Mining * | 1,357 | 17 | |||
Wausau Paper * | 33,301 | 285 | |||
Worthington Industries (A) | 40,870 | 707 | |||
WR Grace * | 58,731 | 1,630 | |||
Zep | 45 | 1 | |||
| 11,124 | |||||
Telecommunication Services — 1.4% | |||||
Atlantic Telegraph-Network | 6,117 | 275 | |||
Cbeyond * (A) | 25,066 | 343 | |||
Cincinnati Bell * | 72,600 | 247 | |||
Cogent Communications Group * | |||||
(A) | 25,995 | 271 | |||
Global Crossing * | 34,985 | 530 | |||
Neutral Tandem * | 37,846 | 605 | |||
NTELOS Holdings | 10,703 | 190 | |||
SBA Communications, Cl A * (A) | 64,789 | 2,337 | |||
Shenandoah Telecommunications | 4,300 | 81 | |||
tw telecom, Cl A * | 46,120 | 837 | |||
USA Mobility | 23,200 | 294 | |||
| 6,010 | |||||
Utilities — 0.6% | |||||
California Water Service Group (A) | 4,930 | 185 | |||
ITC Holdings | 18,579 | 1,022 | |||
Laclede Group | 3,287 | 111 | |||
MGE Energy | 5,706 | 202 | |||
NorthWestern | 33,639 | 902 | |||
RRI Energy * | 11,000 | 42 | |||
| 2,464 | |||||
Total Common Stock | 416,115 | ||||
| Number of Warrants | |||||
WARRANTS — 0.0% | |||||
Rentech Expires 04/25/12 * (C) (G) | 19,400 | 2 | |||
Titanium Asset Management Expires 06/21/11 * (C) (D) (G) | 147,800 | — | |||
Total Warrants | 2 | ||||
AFFILIATED PARTNERSHIP — 13.5% | |||||
SEI Liquidity Fund, L.P., | |||||
0.210% (E)**†† | 60,996,621 | 58,038 | |||
Total Affiliated Partnership | 58,038 | ||||
| Description | Shares/Face Amount ($ | Market Value ($ Thousands) | ||||
CASH EQUIVALENT — 7.8% | ||||||
SEI Daily Income Trust, Prime Obligation Fund, Cl A, | ||||||
0.070%**†† | 33,674,766 | $ | 33,675 | |||
Total Cash Equivalent | 33,675 | |||||
U.S. TREASURY OBLIGATION (F) (G) — 0.5% | ||||||
U.S. Treasury Bills | ||||||
0.112%, 06/03/10 | $ | 2,160 | 2,159 | |||
Total U.S. Treasury Obligation | 2,159 | |||||
Total Investments — 118.5% (Cost $430,698) ($ Thousands) | $ | 509,989 | ||||
A summary of the open futures contracts held by the Fund at March 31, 2010, is as follows:
| Type of Contract | Number of Contracts Long (Short) | Expiration Date | Unrealized Depreciation ($ Thousands) | |||||
Russell 2000 Index E-MINI | 207 | Jun-2010 | $ | (77 | ) | |||
For the period ended March 31, 2010, the total amount of all open futures contracts as presented in the table above, are representative of the volume of activity for the derivative type during the period.
Percentages are based on Net Assets of $430,316 ($ Thousands).
| † | Real Estate Investment Trust. |
| †† | Investment in Affiliated Security. |
| ‡ | Narrow Industries are utilized for compliance purposes, whereas broad sectors are utilized for reporting. |
| * | Non-income producing security. |
| ** | Rate shown is the 7-day effective yield as of March 31, 2010. |
| (A) | This security or a partial position of this security is on loan at March 31, 2010. The total market value of securities on loan at March 31, 2010 was $51,325 ($ Thousands) |
| (B) | Business development company. |
| (C) | Security fair valued using methods determined in good faith by the Valuation Committee of the Board of Trustees. The total market value of such securities as of March 31, 2010 was $530 ($ Thousands) and represented 0.1% of Net Assets. |
| (D) | Securities considered illiquid. The total market value of such securities as of March 31, 2010 was $— ($ Thousands) and represented 0.00% of Net Assets. |
| (E) | This security was purchased with cash collateral received from securities on loan. The total value of such securities as of March 31, 2010 was $58,038 ($ Thousands). |
| (F) | The rate reported is the effective yield at the time of purchase. |
| (G) | Security, or portion thereof, has been pledged as collateral on open futures. |
| (H) | Security considered restricted. The total market value of such securities as of March 31, 2010 was $530 ($ Thousands) and represented 0.1% of Net Assets. |
ADR — American Depositary Receipt
Cl — Class
L.P. — Limited Partnership
PIPE — Private Investment in Public Entity
Amounts designated as “-” are $0 or have been rounded to $0.
| 7 | SEI Institutional Managed Trust / Semi-Annual Report / March 31, 2010 |
Table of Contents
Schedule of Investments (Unaudited)
Tax-Managed Small Cap Fund
March 31, 2010
| Description | Shares | Market Value ($ Thousands) | |||
COMMON STOCK — 95.1% | |||||
Consumer Discretionary — 17.4% | |||||
Aaron Rents | 9,618 | $ | 321 | ||
Abercrombie & Fitch, Cl A | 6,872 | 314 | |||
Aeropostale * | 11,050 | 319 | |||
AFC Enterprises * | 4,700 | 50 | |||
American Eagle Outfitters | 60,363 | 1,118 | |||
American Greetings, Cl A | 20,300 | 423 | |||
Amerigon * | 3,300 | 33 | |||
Ameristar Casinos | 1,300 | 24 | |||
AnnTaylor Stores * | 11,100 | 230 | |||
Apollo Group, Cl A * | 9,400 | 576 | |||
Arbitron | 800 | 21 | |||
ArvinMeritor * | 15,000 | 200 | |||
ATC Technology * | 9,310 | 160 | |||
Autoliv | 16,100 | 830 | |||
Autonation * | 1,400 | 25 | |||
Bally Technologies * | 3,100 | 126 | |||
Barnes & Noble | 4,116 | 89 | |||
Bebe Stores | 8,806 | 78 | |||
Belo, Cl A | 28,274 | 193 | |||
Big Lots * | 7,400 | 269 | |||
BJ’s Restaurants * | 1,000 | 23 | |||
BorgWarner * | 14,911 | 569 | |||
Bridgepoint Education * | 20,300 | 499 | |||
Brinker International | 1,700 | 33 | |||
Brink’s Home Security Holdings * | 3,400 | 145 | |||
Brown Shoe | 2,700 | 42 | |||
Brunswick | 21,500 | 343 | |||
Buckle | 2,200 | 81 | |||
Build-A-Bear Workshop * | 2,700 | 19 | |||
Cabela’s * | 17,200 | 301 | |||
Cablevision Systems, Cl A | 4,800 | 116 | |||
California Pizza Kitchen * | 10,065 | 169 | |||
Callaway Golf | 24,497 | 216 | |||
Capella Education * | 700 | 65 | |||
Career Education * | 5,100 | 161 | |||
Carmax * | 3,100 | 78 | |||
Carter’s * | 27,300 | 823 | |||
Cato, Cl A | 25,935 | 556 | |||
CBS, Cl B | 9,300 | 130 | |||
Central European Media | |||||
Enterprises, Cl A * | 1,800 | 53 | |||
Cheesecake Factory * | 21,400 | 579 | |||
Chico’s FAS | 1,900 | 27 | |||
Chipotle Mexican Grill, Cl A * | 1,100 | 124 | |||
Christopher & Banks | 16,769 | 134 | |||
Citi Trends * | 9,940 | 322 | |||
CKE Restaurants | 1,400 | 15 | |||
Columbia Sportswear | 500 | 26 | |||
Cooper Tire & Rubber | 24,243 | 461 | |||
Corinthian Colleges * | 3,300 | 58 | |||
Cracker Barrel Old Country Store | 19,258 | 893 | |||
Dana Holding * | 7,201 | 86 | |||
Darden Restaurants | 7,585 | 338 | |||
Dick’s Sporting Goods * | 35,380 | 924 | |||
Dillard’s, Cl A | 17,100 | 404 | |||
DineEquity * | 2,338 | 92 | |||
Dollar Tree * | 1,800 | 107 | |||
Domino’s Pizza * | 9,625 | 131 | |||
DR Horton | 9,500 | 120 | |||
| Description | Shares | Market Value ($ Thousands) | |||
DreamWorks Animation SKG, Cl A * | 27,350 | $ | 1,077 | ||
Eastman Kodak | 79,593 | 461 | |||
Ethan Allen Interiors | 11,546 | 238 | |||
Expedia | 20,100 | 502 | |||
Family Dollar Stores | 1,399 | 51 | |||
Focus Media Holding ADR * | 43,350 | 792 | |||
Foot Locker | 24,300 | 365 | |||
Fossil * | 3,800 | 143 | |||
GameStop, Cl A * | 36,129 | 792 | |||
Gannett | 20,364 | 336 | |||
Gaylord Entertainment * | 4,500 | 132 | |||
Genesco * | 8,000 | 248 | |||
Gentex | 32,460 | 630 | |||
Goodyear Tire & Rubber * | 8,400 | 106 | |||
Grand Canyon Education * | 17,800 | 465 | |||
Group 1 Automotive * | 1,200 | 38 | |||
H&R Block | 25,122 | 447 | |||
Hanesbrands * | 44,740 | 1,245 | |||
Harley-Davidson | 14,782 | 415 | |||
Harte-Hanks | 1,800 | 23 | |||
Hasbro | 9,600 | 368 | |||
Helen of Troy * | 1,000 | 26 | |||
hhgregg * | 9,943 | 251 | |||
Hillenbrand | 6,800 | 150 | |||
HOT Topic * | 6,900 | 45 | |||
Hyatt Hotels, Cl A * | 14,400 | 561 | |||
Iconix Brand Group * | 6,200 | 95 | |||
Insight Enterprises * | 23,400 | 336 | |||
International Game Technology | 19,693 | 363 | |||
International Speedway, Cl A | 900 | 23 | |||
Interpublic Group * | 67,533 | 562 | |||
Isle of Capri Casinos * | 3,300 | 26 | |||
ITT Educational Services * | 700 | 79 | |||
J Crew Group * | 500 | 23 | |||
Jakks Pacific * | 12,500 | 163 | |||
Jarden | 29,000 | 965 | |||
Jo-Ann Stores * | 4,970 | 209 | |||
Jones Apparel Group | 21,722 | 413 | |||
Journal Communications, Cl A | 39,400 | 165 | |||
KB Home | 1,800 | 30 | |||
Kenneth Cole Productions, Cl A * | 1,600 | 21 | |||
Lamar Advertising, Cl A * | 1,300 | 45 | |||
Landry’s Restaurants * | 3,400 | 61 | |||
Las Vegas Sands * | 10,100 | 214 | |||
Leggett & Platt | 23,300 | 504 | |||
Lennar, Cl A | 11,100 | 191 | |||
Life Time Fitness * | 800 | 22 | |||
Lin TV, Cl A * | 2,000 | 12 | |||
Live Nation * | 80,103 | 1,161 | |||
LKQ * | 17,400 | 353 | |||
MDC Holdings | 400 | 14 | |||
Men’s Wearhouse | 4,900 | 117 | |||
Meredith | 1,900 | 65 | |||
Meritage Homes * | 900 | 19 | |||
Morningstar * | 300 | 14 | |||
National CineMedia | 51,363 | 887 | |||
Navitas | 67,032 | 314 | |||
NetFlix * | 7,700 | 568 | |||
New York Times, Cl A * | 4,800 | 53 | |||
Newell Rubbermaid | 12,800 | 195 | |||
Nutri/System | 3,500 | 62 | |||
| 1 | SEI Institutional Managed Trust / Semi-Annual Report / March 31, 2010 |
Table of Contents
Schedule of Investments (Unaudited)
Tax-Managed Small Cap Fund
March 31, 2010
| Description | Shares | Market Value ($ Thousands) | |||
NVR * | 100 | $ | 73 | ||
Office Depot * | 17,200 | 137 | |||
O’Reilly Automotive * | 1,000 | 42 | |||
Orient-Express Hotels, Cl A * | 5,400 | 77 | |||
Panera Bread, Cl A * | 700 | 54 | |||
Penn National Gaming * | 21,730 | 604 | |||
Penske Auto Group * | 13,200 | 190 | |||
PEP Boys-Manny Moe & Jack | 3,200 | 32 | |||
PetSmart | 32,570 | 1,041 | |||
PF Chang’s China Bistro * | 500 | 22 | |||
Phillips-Van Heusen | 15,880 | 911 | |||
Polaris Industries | 20,535 | 1,051 | |||
Polo Ralph Lauren | 900 | 77 | |||
Pool | 19,100 | 432 | |||
Pre-Paid Legal Services * | 6,200 | 235 | |||
Pulte Homes * | 48,897 | 550 | |||
RadioShack | 32,100 | 726 | |||
RC2 * | 32,380 | 485 | |||
RCN * | 3,100 | 47 | |||
Red Robin Gourmet Burgers * | 15,100 | 369 | |||
Regal Entertainment Group, Cl A | 21,200 | 372 | |||
Regis | 11,898 | 222 | |||
Rent-A-Center * | 3,686 | 87 | |||
Ross Stores | 1,400 | 75 | |||
Rossi Residencial | 55,770 | 384 | |||
Royal Caribbean Cruises * | 2,000 | 66 | |||
Ruby Tuesday * | 37,800 | 400 | |||
Ryland Group | 12,700 | 285 | |||
Sauer-Danfoss * | 1,700 | 23 | |||
Scholastic | 1,000 | 28 | |||
Scientific Games, Cl A * | 96,490 | 1,359 | |||
Sealy * | 5,500 | 19 | |||
Service International | 10,900 | 100 | |||
Shutterfly * | 1,700 | 41 | |||
Signet Jewelers * | 3,000 | 97 | |||
Sonic * | 14,700 | 162 | |||
Sonic Automotive, Cl A * | 3,675 | 40 | |||
Sotheby’s | 1,400 | 43 | |||
Speedway Motorsports | 800 | 12 | |||
Stage Stores | 28,771 | 443 | |||
Stamps.com * | 1,579 | 16 | |||
Stanley Black & Decker | 500 | 29 | |||
Steak N Shake * | 90 | 34 | |||
Stewart Enterprises, Cl A | 2,900 | 18 | |||
Strayer Education | 3,000 | 731 | |||
Systemax | 2,442 | 53 | |||
Tempur-Pedic International * | 22,390 | 675 | |||
Tenneco * | 9,700 | 229 | |||
Texas Roadhouse, Cl A * | 6,200 | 86 | |||
Thor Industries | 900 | 27 | |||
Timberland, Cl A * | 900 | 19 | |||
Town Sports International Holdings * | 4,600 | 18 | |||
TRW Automotive Holdings * | 1,800 | 52 | |||
Tupperware Brands | 16,171 | 780 | |||
Ulta Salon Cosmetics & Fragrance * | 1,800 | 41 | |||
WABCO Holdings | 1,500 | 45 | |||
Warnaco Group * | 2,610 | 125 | |||
Wendy’s, Cl A | 28,000 | 140 | |||
Whirlpool | 9,200 | 803 | |||
Williams-Sonoma | 35,090 | 923 | |||
| Description | Shares | Market Value ($ Thousands) | |||
Winnebago Industries * | 20,700 | $ | 303 | ||
WMS Industries * | 29,636 | 1,243 | |||
Wolverine World Wide | 600 | 17 | |||
World Wrestling Entertainment, | |||||
Cl A | 900 | 16 | |||
Wyndham Worldwide | 33,410 | 860 | |||
| 51,609 | |||||
Consumer Staples — 4.1% | |||||
Alliance One International * | 17,900 | 91 | |||
American Italian Pasta, Cl A * | 1,500 | 58 | |||
Andersons | 1,200 | 40 | |||
Avon Products | 6,952 | 235 | |||
BJ’s Wholesale Club * | 15,628 | 578 | |||
Boston Beer, Cl A * | 800 | 42 | |||
Brown-Forman, Cl B | 7,225 | 429 | |||
Cal-Maine Foods | 8,700 | 295 | |||
Casey’s General Stores | 14,110 | 443 | |||
Central European Distribution * | 12,760 | 447 | |||
Central Garden and Pet, Cl A * | 19,700 | 181 | |||
Central Garden and Pet * | 13,800 | 136 | |||
Chiquita Brands International * | 23,014 | 362 | |||
Church & Dwight | 1,600 | 107 | |||
Constellation Brands, Cl A * | 17,056 | 280 | |||
Corn Products International | 7,990 | 277 | |||
Dean Foods * | 52,735 | 828 | |||
Del Monte Foods | 41,300 | 603 | |||
Diamond Foods | 1,500 | 63 | |||
Dole Food * | 12,981 | 154 | |||
Flowers Foods | 3,400 | 84 | |||
Fresh Del Monte Produce * | 4,800 | 97 | |||
Great Atlantic & Pacific Tea * | 7,000 | 54 | |||
Green Mountain Coffee Roasters * | 8,820 | 854 | |||
Hansen Natural * | 2,925 | 127 | |||
Herbalife | 21,480 | 991 | |||
J&J Snack Foods | 1,300 | 57 | |||
Lancaster Colony | 1,000 | 59 | |||
Lance | 400 | 9 | |||
McCormick | 9,977 | 383 | |||
Mead Johnson Nutrition, Cl A | 5,000 | 260 | |||
Molson Coors Brewing, Cl B | 11,506 | 484 | |||
Nash Finch | 2,960 | 100 | |||
Nu Skin Enterprises, Cl A | 900 | 26 | |||
Pantry * | 21,602 | 270 | |||
PepsiCo | 751 | 50 | |||
Ralcorp Holdings * | 1,000 | 68 | |||
Reddy Ice Holdings * | 5,700 | 26 | |||
Rite Aid * | 82,900 | 124 | |||
Ruddick | 2,500 | 79 | |||
Sanderson Farms | 7,649 | 410 | |||
Sara Lee | 51,500 | 717 | |||
Schiff Nutrition International | 2,200 | 18 | |||
Smithfield Foods * | 3,100 | 64 | |||
SUPERVALU | 25,600 | 427 | |||
Tootsie Roll Industries | 752 | 20 | |||
TreeHouse Foods * | 1,800 | 79 | |||
Universal | 5,700 | 300 | |||
USANA Health Sciences * | 400 | 13 | |||
Village Super Market, Cl A | 800 | 23 | |||
Weis Markets | 6,300 | 229 | |||
Whole Foods Market * | 2,000 | 72 | |||
| 2 | SEI Institutional Managed Trust / Semi-Annual Report / March 31, 2010 |
Table of Contents
Schedule of Investments (Unaudited)
Tax-Managed Small Cap Fund
March 31, 2010
| Description | Shares | Market Value ($ Thousands) | |||
Winn-Dixie Stores * | 1,831 | $ | 23 | ||
| 12,246 | |||||
Energy — 4.1% | |||||
Atlas Energy | 1,000 | 31 | |||
Atwood Oceanics * | 100 | 3 | |||
Berry Petroleum, Cl A | 14,396 | 405 | |||
Bill Barrett * | 600 | 18 | |||
Brigham Exploration * | 8,000 | 128 | |||
Cabot Oil & Gas | 1,000 | 37 | |||
Carrizo Oil & Gas * | 1,100 | 25 | |||
Cloud Peak Energy * | 700 | 12 | |||
Complete Production Services * | 3,100 | 36 | |||
Continental Resources * | 1,800 | 77 | |||
Denbury Resources * | 2,748 | 46 | |||
Dresser-Rand Group * | 20,040 | 630 | |||
Dril-Quip * | 600 | 37 | |||
EXCO Resources | 1,800 | 33 | |||
Exterran Holdings * | 18,554 | 448 | |||
FMC Technologies * | 1,800 | 116 | |||
Frontier Oil | 11,999 | 162 | |||
General Maritime | 4,300 | 31 | |||
Global Industries * | 2,300 | 15 | |||
Goodrich Petroleum * | 14,052 | 220 | |||
Helix Energy Solutions Group * | 1,800 | 23 | |||
Helmerich & Payne | 1,300 | 50 | |||
Hercules Offshore * | 25,300 | 109 | |||
Hess | 1,100 | 69 | |||
International Coal Group * | 3,900 | 18 | |||
Key Energy Services * | 33,939 | 324 | |||
Mariner Energy * | 1,200 | 18 | |||
Massey Energy | 7,570 | 396 | |||
McMoRan Exploration * | 5,900 | 86 | |||
Mitcham Industries * | 3,000 | 22 | |||
Murphy Oil | 7,555 | 425 | |||
Nabors Industries * | 21,366 | 419 | |||
National Oilwell Varco | 1,800 | 73 | |||
Newfield Exploration * | 6,744 | 351 | |||
Nordic American Tanker | |||||
Shipping, Cl US | 8,600 | 260 | |||
Oceaneering International * | 1,000 | 64 | |||
Oil States International * | 700 | 32 | |||
Overseas Shipholding Group | 21,540 | 845 | |||
Patterson-UTI Energy | 7,100 | 99 | |||
Peabody Energy | 1,500 | 69 | |||
PetroHawk Energy * | 19,200 | 389 | |||
Pioneer Natural Resources | 7,515 | 423 | |||
Quicksilver Resources * | 1,500 | 21 | |||
Range Resources | 7,194 | 337 | |||
Rowan * | 11,900 | 346 | |||
SEACOR Holdings * | 4,800 | 387 | |||
Ship Finance International | 2,300 | 41 | |||
Southwestern Energy * | 1,000 | 41 | |||
Spectra Energy | 18,217 | 410 | |||
St. Mary Land & Exploration | 600 | 21 | |||
Stone Energy * | 7,700 | 137 | |||
Sunoco | 17,409 | 517 | |||
Superior Energy Services * | 700 | 15 | |||
Swift Energy * | 13,237 | 407 | |||
Teekay Shipping | 8,800 | 200 | |||
Tesoro | 28,400 | 395 | |||
Tidewater | 11,516 | 544 | |||
| Description | Shares | Market Value ($ Thousands) | |||
Ultra Petroleum * | 900 | $ | 42 | ||
USEC * | 51,000 | 294 | |||
Western Refining * | 16,400 | 90 | |||
Whiting Petroleum * | 6,725 | 544 | |||
Willbros Group * | 1,500 | 18 | |||
World Fuel Services | 13,300 | 354 | |||
| 12,235 | |||||
Financials — 14.6% | |||||
Acadia Realty Trust † | 900 | 16 | |||
Advance America Cash Advance | |||||
Centers | 39,200 | 228 | |||
Affiliated Managers Group * | 500 | 39 | |||
Alexander’s * † | 100 | 30 | |||
Alexandria Real Estate Equities † | 300 | 20 | |||
Allied Capital * | 36,400 | 181 | |||
Allied World Assurance Holdings | 9,300 | 417 | |||
Altisource Portfolio Solutions * | 1,400 | 32 | |||
AMB Property † | 2,100 | 57 | |||
American Campus Communities † | 600 | 17 | |||
American Capital * | 8,900 | 45 | |||
American Capital Agency † | 3,317 | 85 | |||
American Financial Group | 19,300 | 549 | |||
American National Insurance | 700 | 79 | |||
AmeriCredit * | 600 | 14 | |||
Ameriprise Financial | 18,476 | 838 | |||
Amerisafe * | 1,877 | 31 | |||
Annaly Capital Management † | 10,800 | 186 | |||
Anworth Mortgage Asset † | 48,200 | 325 | |||
Apartment Investment & Management, Cl A † | 1,800 | 33 | |||
Arch Capital Group * | 300 | 23 | |||
Ares Capital | 2,000 | 30 | |||
Arthur J. Gallagher | 900 | 22 | |||
Aspen Insurance Holdings | 12,800 | 369 | |||
Assured Guaranty | 26,730 | 587 | |||
Axis Capital Holdings | 2,600 | 81 | |||
Banco Latinoamericano de Exportaciones, Cl E | 21,300 | 306 | |||
Bancorpsouth | 15,190 | 318 | |||
Bank Mutual | 4,600 | 30 | |||
Bank of Hawaii | 400 | 18 | |||
BGC Partners, Cl A | 40,700 | 249 | |||
BioMed Realty Trust † | 17,200 | 284 | |||
BlackRock | 356 | 77 | |||
BlackRock Kelso Capital | 2,400 | 24 | |||
Boston Private Financial Holdings | 6,000 | 44 | |||
Boston Properties † | 6,546 | 494 | |||
BRE Properties, Cl A † | 1,000 | 36 | |||
Calamos Asset Management, Cl A | 1,800 | 26 | |||
Camden Property Trust † | 600 | 25 | |||
Capstead Mortgage † | 8,300 | 99 | |||
Cardinal Financial | 18,587 | 199 | |||
CB Richard Ellis Group, Cl A * | 25,000 | 396 | |||
CBL & Associates Properties † | 14,200 | 195 | |||
Central Pacific Financial * (A) | 13,300 | 22 | |||
Century Bancorp, Cl A | 2,700 | 52 | |||
Chemical Financial | 3,800 | 90 | |||
Chimera Investment † | 49,700 | 193 | |||
Cincinnati Financial | 2,100 | 61 | |||
| 3 | SEI Institutional Managed Trust / Semi-Annual Report / March 31, 2010 |
Table of Contents
Schedule of Investments (Unaudited)
Tax-Managed Small Cap Fund
March 31, 2010
| Description | Shares | Market Value ($ Thousands) | |||
Citizens Republic Bancorp * | 23,500 | $ | 28 | ||
CNA Financial * | 27,500 | 735 | |||
CNA Surety * | 6,600 | 117 | |||
Colonial Properties Trust † | 4,500 | 58 | |||
Comerica | 13,799 | 525 | |||
Commerce Bancshares | 1,455 | 60 | |||
Community Bank System | 11,300 | 257 | |||
Cousins Properties † | 3,006 | 25 | |||
Cullen/Frost Bankers | 300 | 17 | |||
CVB Financial | 9,600 | 95 | |||
DCT Industrial Trust † | 3,100 | 16 | |||
Delphi Financial Group, Cl A | 3,900 | 98 | |||
Developers Diversified Realty † | 2,300 | 28 | |||
Digital Realty Trust † | 300 | 16 | |||
Dime Community Bancshares | 1,700 | 21 | |||
Dollar Financial * | 1,600 | 39 | |||
Doral Financial * | 23,400 | 101 | |||
Douglas Emmett † | 1,400 | 22 | |||
Duke Realty † | 1,700 | 21 | |||
E*Trade Financial * | 62,500 | 103 | |||
EastGroup Properties † | 400 | 15 | |||
Eaton Vance | 7,579 | 254 | |||
Education Realty Trust † | 28,058 | 161 | |||
eHealth * | 20,800 | 328 | |||
EMC Insurance Group | 2,620 | 59 | |||
Employers Holdings | 39,991 | 594 | |||
Encore Capital Group * | 23,500 | 386 | |||
Endurance Specialty Holdings | 21,240 | 789 | |||
Enstar Group * | 300 | 21 | |||
Entertainment Properties Trust † | 1,000 | 41 | |||
Equity One † | 21,647 | 409 | |||
Erie Indemnity, Cl A | 2,000 | 86 | |||
Essex Property Trust † | 400 | 36 | |||
Everest Re Group | 4,400 | 356 | |||
FBL Financial Group, Cl A | 2,500 | 61 | |||
Federal Agricultural Mortgage, Cl C | 14,900 | 169 | |||
Federal Realty Investment Trust † | 500 | 36 | |||
Federated Investors, Cl B | 28,666 | 756 | |||
FelCor Lodging Trust * † | 6,100 | 35 | |||
Fifth Street Finance | 3,100 | 36 | |||
Fifth Third Bancorp | 31,704 | 431 | |||
Financial Institutions | 1,100 | 16 | |||
First American | 2,100 | 71 | |||
First Bancorp | 64,348 | 155 | |||
First Financial Bancorp | 19,444 | 346 | |||
First Financial Holdings | 1,000 | 15 | |||
First Horizon National * | 45,078 | 633 | |||
First Midwest Bancorp | 600 | 8 | |||
First Niagara Financial Group | 4,300 | 61 | |||
First Potomac Realty Trust † | 16,500 | 248 | |||
FirstMerit | 8,762 | 189 | |||
Flagstone Reinsurance Holdings | 6,300 | 72 | |||
Flushing Financial | 3,400 | 43 | |||
FNB (Pennsylvania) | 11,200 | 91 | |||
Franklin Street Properties † | 5,100 | 74 | |||
Fulton Financial | 4,400 | 45 | |||
GAMCO Investors, Cl A | 400 | 18 | |||
Getty Realty † | 3,100 | 73 | |||
GFI Group | 37,000 | 214 | |||
GLG Partners * | 6,700 | 21 | |||
Greenlight Capital Re * | 700 | 19 | |||
| Description | Shares | Market Value ($ Thousands) | |||
Hancock Holding | 9,419 | $ | 394 | ||
Hanover Insurance Group | 11,400 | 497 | |||
Harleysville Group | 400 | 13 | |||
Hatteras Financial † | 4,400 | 113 | |||
HCC Insurance Holdings | 1,000 | 28 | |||
Health Care † | 3,000 | 136 | |||
Healthcare Realty Trust † | 700 | 16 | |||
Hercules Technology Growth Capital | 29,456 | 312 | |||
Highwoods Properties † | 500 | 16 | |||
Hilltop Holdings * | 1,700 | 20 | |||
Home Properties † | 400 | 19 | |||
Horace Mann Educators | 18,700 | 282 | |||
Hospitality Properties Trust † | 11,300 | 271 | |||
Host Hotels & Resorts † | 32,236 | 472 | |||
HRPT Properties Trust † | 98,500 | 766 | |||
Hudson City Bancorp | 14,300 | 203 | |||
Huntington Bancshares | 98,200 | 527 | |||
IBERIABANK | 4,658 | 280 | |||
Independence Holding | 2,800 | 27 | |||
Independent Bank | 800 | 20 | |||
Infinity Property & Casualty | 11,251 | 511 | |||
Interactive Brokers Group, Cl A * | 800 | 13 | |||
Janus Capital Group | 1,900 | 27 | |||
Jefferies Group | 2,400 | 57 | |||
Jones Lang LaSalle | 400 | 29 | |||
KBW * | 700 | 19 | |||
Kilroy Realty † | 3,175 | 98 | |||
Kimco Realty † | 3,900 | 61 | |||
Kite Realty Group Trust † | 3,700 | 17 | |||
Knight Capital Group, Cl A * | 2,300 | 35 | |||
LaSalle Hotel Properties † | 1,400 | 33 | |||
Lazard, Cl A | 7,900 | 282 | |||
Lexington Realty Trust † | 17,367 | 113 | |||
Liberty Property Trust † | 15,852 | 538 | |||
LTC Properties † | 4,600 | 124 | |||
M&T Bank | 1,258 | 100 | |||
Macerich † | 4,534 | 174 | |||
MarketAxess Holdings | 1,200 | 19 | |||
MBIA * | 5,600 | 35 | |||
Meadowbrook Insurance Group | 44,700 | 353 | |||
Medical Properties Trust † | 34,000 | 356 | |||
Mercury General | 1,100 | 48 | |||
MF Global Holdings * | 5,200 | 42 | |||
MFA Financial † | 91,411 | 673 | |||
Mid-America Apartment Communities † | 5,721 | 296 | |||
Montpelier Re Holdings | 15,200 | 256 | |||
MSCI, Cl A * | 3,500 | 126 | |||
National Penn Bancshares | 23,217 | 160 | |||
National Retail Properties † | 1,200 | 27 | |||
National Western Life Insurance, Cl A | 400 | 74 | |||
Nationwide Health Properties † | 12,400 | 436 | |||
NewAlliance Bancshares | 9,000 | 114 | |||
Northfield Bancorp | 800 | 12 | |||
NorthStar Realty Finance † | 14,709 | 62 | |||
NYSE Euronext | 1,675 | 50 | |||
Ocwen Financial * | 4,200 | 47 | |||
Old National Bancorp | 3,600 | 43 | |||
Omega Healthcare Investors † | 5,100 | 99 | |||
One Liberty Properties † | 140 | 2 | |||
| 4 | SEI Institutional Managed Trust / Semi-Annual Report / March 31, 2010 |
Table of Contents
Schedule of Investments (Unaudited)
Tax-Managed Small Cap Fund
March 31, 2010
| Description | Shares | Market Value ($ Thousands) | |||
OneBeacon Insurance Group, Cl A | 2,700 | $ | 47 | ||
optionsXpress Holdings | 1,400 | 23 | |||
Oriental Financial Group | 13,000 | 175 | |||
PacWest Bancorp | 15,123 | 345 | |||
Park National | 3,300 | 206 | |||
Parkway Properties † | 20,600 | 387 | |||
PartnerRe | 9,359 | 746 | |||
Pennsylvania Real Estate Investment Trust † | 14,700 | 183 | |||
People's United Financial | 29,114 | 455 | |||
PHH * | 12,042 | 284 | |||
Piper Jaffray * | 300 | 12 | |||
Platinum Underwriters Holdings | 9,116 | 338 | |||
Plum Creek Timber † | 1,400 | 54 | |||
Popular | 28,900 | 84 | |||
Portfolio Recovery Associates * | 400 | 22 | |||
Post Properties † | 800 | 18 | |||
Premierwest Bancorp | 47,850 | 22 | |||
Presidential Life | 1,400 | 14 | |||
ProAssurance * | 16,694 | 977 | |||
Prospect Capital | 2,812 | 34 | |||
Protective Life | 6,456 | 142 | |||
Provident Financial Services | 1,100 | 13 | |||
Pzena Investment Management, Cl A * | 5,400 | 41 | |||
Radian Group | 4,100 | 64 | |||
RAIT Financial Trust † | 42,000 | 83 | |||
Ramco-Gershenson Properties † | 2,300 | 26 | |||
Raymond James Financial | 13,500 | 361 | |||
Redwood Trust † | 19,692 | 304 | |||
Regency Centers † | 2,500 | 94 | |||
Regions Financial | 37,600 | 295 | |||
Reinsurance Group of America, Cl A | 14,786 | 777 | |||
RenaissanceRe Holdings | 800 | 45 | |||
Resource Capital † | 2,600 | 18 | |||
Roma Financial | 900 | 11 | |||
S&T Bancorp | 9,200 | 192 | |||
Selective Insurance Group | 7,900 | 131 | |||
Senior Housing Properties Trust † | 4,900 | 109 | |||
Signature Bank NY * | 9,120 | 338 | |||
SL Green Realty † | 2,800 | 160 | |||
Sovran Self Storage † | 3,900 | 136 | |||
StanCorp Financial Group | 11,800 | 562 | |||
Stifel Financial * | 8,505 | 457 | |||
Stratus Properties * | 1,900 | 19 | |||
Sun Communities † | 1,400 | 35 | |||
SVB Financial Group * | 600 | 28 | |||
SWS Group | 7,400 | 85 | |||
Synovus Financial | 197,312 | 649 | |||
Tanger Factory Outlet Centers † | 800 | 35 | |||
Taubman Centers † | 1,400 | 56 | |||
TCF Financial | 2,200 | 35 | |||
TD Ameritrade Holding * | 17,829 | 340 | |||
Tejon Ranch * | 400 | 12 | |||
Teton Advisors, Cl A | 6 | 0 | |||
Tower Group | 4,200 | 93 | |||
TradeStation Group * | 1,800 | 13 | |||
Transatlantic Holdings | 600 | 32 | |||
Trustco Bank NY | 26,900 | 166 | |||
Trustmark | 1,100 | 27 | |||
| Description | Shares | Market Value ($ Thousands) | |||
UDR † | 1,400 | $ | 25 | ||
Umpqua Holdings | 6,716 | 89 | |||
United America Indemnity, Cl A * | 1,081 | 10 | |||
United Bankshares | 4,300 | 113 | |||
United Community Banks * | 3,375 | 15 | |||
United Fire & Casualty | 4,000 | 72 | |||
Unitrin | 18,100 | 508 | |||
Universal Health Realty Income Trust † | 700 | 25 | |||
Unum Group | 41,668 | 1,032 | |||
Validus Holdings | 8,900 | 245 | |||
Valley National Bancorp | 2,100 | 32 | |||
W Holding * | 900 | 9 | |||
Waddell & Reed Financial, Cl A | 8,900 | 321 | |||
Walter Investment Management † | 657 | 10 | |||
Washington Federal | 10,600 | 215 | |||
Washington Real Estate Investment Trust † | 500 | 15 | |||
Webster Financial | 7,700 | 135 | |||
Weingarten Realty Investors † | 1,600 | 34 | |||
WesBanco | 1,900 | 31 | |||
Westamerica Bancorporation | 1,500 | 86 | |||
Westfield Financial | 2,625 | 24 | |||
White Mountains Insurance Group | 900 | 319 | |||
Whitney Holding | 28,155 | 388 | |||
Willis Group Holdings | 14,340 | 449 | |||
Wilmington Trust | 1,100 | 18 | |||
Wintrust Financial | 600 | 22 | |||
World Acceptance * | 1,300 | 47 | |||
WR Berkley | 5,400 | 141 | |||
WSFS Financial | 400 | 16 | |||
Zions Bancorporation | 45,316 | 989 | |||
| 43,243 | |||||
Health Care — 12.1% | |||||
Abaxis * | 1,600 | 44 | |||
Accuray * | 1,900 | 12 | |||
Acorda Therapeutics * | 14,700 | 503 | |||
Affymax * | 12,200 | 286 | |||
Affymetrix * | 3,600 | 26 | |||
Air Methods * | 600 | 20 | |||
Albany Molecular Research * | 4,700 | 39 | |||
Alexion Pharmaceuticals * | 5,500 | 299 | |||
Align Technology * | 3,800 | 74 | |||
Alkermes * | 17,300 | 224 | |||
Allergan | 1,600 | 105 | |||
Allos Therapeutics * | 2,400 | 18 | |||
Allscripts Healthcare Solutions * | 12,700 | 248 | |||
AMAG Pharmaceuticals * | 5,150 | 180 | |||
Amedisys * | 1,900 | 105 | |||
American Medical Systems Holdings * | 25,400 | 472 | |||
AMERIGROUP * | 9,625 | 320 | |||
AmerisourceBergen | 26,016 | 752 | |||
Amsurg * | 12,137 | 262 | |||
Amylin Pharmaceuticals * | 15,000 | 337 | |||
Analogic | 874 | 37 | |||
Angiodynamics * | 2,514 | 39 | |||
Auxilium Pharmaceuticals * | 26,460 | 825 | |||
Beckman Coulter | 4,351 | 273 | |||
Bio-Reference Labs * | 500 | 22 | |||
| 5 | SEI Institutional Managed Trust / Semi-Annual Report / March 31, 2010 |
Table of Contents
Schedule of Investments (Unaudited)
Tax-Managed Small Cap Fund
March 31, 2010
| Description | Shares | Market Value ($ Thousands) | |||
Biovail | 31,300 | $ | 525 | ||
Brookdale Senior Living * | 1,700 | 35 | |||
Bruker BioSciences * | 3,400 | 50 | |||
Capital Senior Living * | 3,600 | 19 | |||
Catalyst Health Solutions * | 600 | 25 | |||
Celgene * | 622 | 39 | |||
Celldex Therapeutics * | 2,400 | 15 | |||
Cephalon * | 3,800 | 258 | |||
Cerner * | 300 | 26 | |||
Charles River Laboratories International * | 5,150 | 202 | |||
Chemed | 3,864 | 210 | |||
Community Health Systems * | 3,600 | 133 | |||
Conmed * | 5,732 | 136 | |||
Cooper | 14,071 | 547 | |||
Corvel * | 393 | 14 | |||
Covance * | 5,775 | 355 | |||
Coventry Health Care * | 39,700 | 981 | |||
Cubist Pharmaceuticals * | 17,000 | 383 | |||
Cyberonics * | 18,090 | 347 | |||
Dendreon * | 15,800 | 576 | |||
Dentsply International | 15,600 | 544 | |||
Dionex * | 500 | 37 | |||
Eclipsys * | 1,200 | 24 | |||
Edwards Lifesciences * | 1,200 | 119 | |||
Emeritus * | 1,400 | 28 | |||
Endo Pharmaceuticals Holdings * | 15,900 | 377 | |||
Enzo Biochem * | 1,249 | 8 | |||
Enzon Pharmaceuticals * | 2,600 | 26 | |||
eResearchTechnology * | 4,548 | 31 | |||
ev3 * | 55,300 | 877 | |||
Exelixis * | 2,200 | 13 | |||
Express Scripts * | 700 | 71 | |||
Forest Laboratories * | 20,275 | 636 | |||
Gen-Probe * | 13,100 | 655 | |||
Gentiva Health Services * | 700 | 20 | |||
Geron * | 8,900 | 51 | |||
Greatbatch * | 2,000 | 42 | |||
Haemonetics * | 700 | 40 | |||
Health Management Associates, Cl A * | 11,500 | 99 | |||
Health Net * | 45,715 | 1,137 | |||
Healthsouth * | 21,400 | 400 | |||
Healthspring * | 1,200 | 21 | |||
Healthways * | 200 | 3 | |||
Henry Schein * | 5,527 | 326 | |||
Hill-Rom Holdings | 24,400 | 664 | |||
Hologic * | 9,984 | 185 | |||
Human Genome Sciences * | 3,600 | 109 | |||
Humana * | 8,300 | 388 | |||
ICON ADR * | 14,010 | 370 | |||
Idexx Laboratories * | 5,600 | 322 | |||
Illumina * | 2,300 | 89 | |||
Immucor * | 1,950 | 44 | |||
Incyte * | 31,700 | 443 | |||
Intuitive Surgical * | 550 | 191 | |||
Inverness Medical Innovations * | 10,688 | 416 | |||
Kendle International * | 1,800 | 31 | |||
Kensey Nash * | 2,964 | 70 | |||
Kinetic Concepts * | 14,800 | 708 | |||
King Pharmaceuticals * | 40,000 | 470 | |||
| Description | Shares | Market Value ($ Thousands) | |||
Laboratory Corp of America Holdings * | 3,000 | $ | 227 | ||
Landauer | 600 | 39 | |||
LHC Group * | 500 | 17 | |||
Life Technologies * | 2,637 | 138 | |||
LifePoint Hospitals * | 19,200 | 706 | |||
Lincare Holdings * | 18,200 | 817 | |||
Magellan Health Services * | 1,400 | 61 | |||
Masimo | 7,100 | 189 | |||
Mednax * | 3,243 | 189 | |||
Meridian Bioscience | 6,400 | 130 | |||
Merit Medical Systems * | 2,500 | 38 | |||
Mettler Toledo International * | 400 | 44 | |||
Millipore * | 500 | 53 | |||
Mylan Laboratories * | 31,035 | 705 | |||
Myriad Genetics * | 3,900 | 94 | |||
Myriad Pharmaceuticals * | 550 | 2 | |||
Nektar Therapeutics * | 9,000 | 137 | |||
Neogen * | 600 | 15 | |||
NuVasive * | 12,429 | 562 | |||
Obagi Medical Products * | 1,600 | 19 | |||
Odyssey HealthCare * | 1,000 | 18 | |||
Omnicell * | 1,300 | 18 | |||
Onyx Pharmaceuticals * | 30,500 | 924 | |||
Orthofix International * | 600 | 22 | |||
OSI Pharmaceuticals * | 1,118 | 67 | |||
Owens & Minor | 14,935 | 693 | |||
Par Pharmaceutical * | 2,270 | 56 | |||
Parexel International * | 36,450 | 850 | |||
Patterson | 7,500 | 233 | |||
PDL BioPharma | 57,400 | 356 | |||
PerkinElmer | 18,100 | 433 | |||
Perrigo | 10,000 | 587 | |||
Pharmaceutical Product Development | 6,300 | 150 | |||
Providence Service * | 1,900 | 29 | |||
PSS World Medical * | 1,400 | 33 | |||
Regeneron Pharmaceuticals * | 18,400 | 487 | |||
RehabCare Group * | 700 | 19 | |||
ResMed * | 4,181 | 266 | |||
Rigel Pharmaceuticals * | 28,400 | 226 | |||
Salix Pharmaceuticals * | 10,130 | 377 | |||
Seattle Genetics * | 24,370 | 291 | |||
Sirona Dental Systems * | 10,619 | 404 | |||
STERIS | 23,030 | 775 | |||
SXC Health Solutions * | 15,940 | 1,073 | |||
Symmetry Medical * | 1,500 | 15 | |||
Team Health Holdings * | 20,165 | 339 | |||
Techne | 4,100 | 261 | |||
Tenet Healthcare * | 14,100 | 81 | |||
Thermo Fisher Scientific * | 1,600 | 82 | |||
Thoratec * | 1,500 | 50 | |||
TomoTherapy * | 20,700 | 71 | |||
Universal Health Services, Cl B | 800 | 28 | |||
US Physical Therapy * | 900 | 16 | |||
Valeant Pharmaceuticals International * | 4,500 | 193 | |||
Vertex Pharmaceuticals * | 7,400 | 302 | |||
Viropharma * | 5,100 | 70 | |||
Volcano * | 30,100 | 727 | |||
Waters * | 1,525 | 103 | |||
Watson Pharmaceuticals * | 9,800 | 409 | |||
| 6 | SEI Institutional Managed Trust / Semi-Annual Report / March 31, 2010 |
Table of Contents
Schedule of Investments (Unaudited)
Tax-Managed Small Cap Fund
March 31, 2010
| Description | Shares | Market Value ($ Thousands) | |||
WellCare Health Plans * | 800 | $ | 24 | ||
Zoll Medical * | 1,800 | 47 | |||
| 35,870 | |||||
Industrials — 14.0% | |||||
AAON | 1,500 | 34 | |||
ACCO Brands * | 12,500 | 96 | |||
Acuity Brands | 9,934 | 419 | |||
Advisory Board * | 13,260 | 418 | |||
AGCO * | 1,700 | 61 | |||
Aircastle | 4,300 | 41 | |||
Airtran Holdings * | 2,900 | 15 | |||
Alaska Air Group * | 7,098 | 293 | |||
Albany International, Cl A | 1,900 | 41 | |||
Alexander & Baldwin | 2,539 | 84 | |||
Allegiant Travel, Cl A * | 4,900 | 284 | |||
Alliant Techsystems * | 488 | 40 | |||
American Commercial Lines * | 725 | 18 | |||
American Superconductor * | 2,200 | 63 | |||
Ametek | 750 | 31 | |||
Ampco-Pittsburgh | 8,000 | 199 | |||
AMR * | 4,000 | 36 | |||
AO Smith | 8,100 | 426 | |||
Apogee Enterprises | 16,300 | 258 | |||
Argon ST * | 10,000 | 266 | |||
Atlas Air Worldwide Holdings * | 10,700 | 568 | |||
Avery Dennison | 13,264 | 483 | |||
Baldor Electric | 900 | 34 | |||
Barnes Group | 1,100 | 21 | |||
BE Aerospace * | 48,707 | 1,483 | |||
Beacon Roofing Supply * | 40,890 | 782 | |||
Belden | 14,017 | 385 | |||
Brady, Cl A | 9,667 | 301 | |||
Briggs & Stratton | 20,320 | 396 | |||
Brink's | 3,100 | 87 | |||
Bucyrus International, Cl A | 10,400 | 686 | |||
C.H. Robinson Worldwide | 1,344 | 75 | |||
Carlisle | 600 | 23 | |||
Cenveo * | 5,300 | 46 | |||
Cintas | 13,215 | 371 | |||
Clean Harbors * | 3,703 | 206 | |||
CNH Global | 2,460 | 76 | |||
Colfax * | 7,500 | 88 | |||
Columbus McKinnon * | 3,949 | 63 | |||
Continental Airlines, Cl B * | 63,045 | 1,385 | |||
Con-way | 600 | 21 | |||
Copa Holdings, Cl A | 8,880 | 540 | |||
Copart * | 600 | 21 | |||
Corporate Executive Board | 15,800 | 420 | |||
Corrections Corp of America * | 37,850 | 752 | |||
Courier | 6,189 | 102 | |||
Crane | 9,800 | 348 | |||
Cummins | 2,100 | 130 | |||
Delta Air Lines * | 8,725 | 127 | |||
Deluxe | 18,000 | 350 | |||
Dollar Thrifty Automotive Group * | 3,000 | 96 | |||
Donaldson | 600 | 27 | |||
Dover | 8,671 | 405 | |||
EMCOR Group * | 20,814 | 513 | |||
EnergySolutions | 1,900 | 12 | |||
EnerNOC * | 1,300 | 39 | |||
Ennis | 3,200 | 52 | |||
| Description | Shares | Market Value ($ Thousands) | |||
EnPro Industries * | 11,900 | $ | 346 | ||
Esterline Technologies * | 9,110 | 450 | |||
Fastenal | 5,748 | 276 | |||
Flowserve | 1,100 | 121 | |||
Forward Air | 600 | 16 | |||
Foster Wheeler * | 7,300 | 198 | |||
FTI Consulting * | 8,733 | 343 | |||
G&K Services | 9,726 | 252 | |||
Gardner Denver | 23,929 | 1,054 | |||
GATX | 3,000 | 86 | |||
Geo Group * | 5,088 | 101 | |||
Goodrich | 1,600 | 113 | |||
Gorman-Rupp | 1,250 | 32 | |||
Graco | 600 | 19 | |||
GrafTech International * | 1,400 | 19 | |||
Hansen Transmissions International * | 36,014 | 49 | |||
Harsco | 3,200 | 102 | |||
Heartland Express | 2,100 | 35 | |||
Heidrick & Struggles International | 700 | 20 | |||
Herman Miller | 1,500 | 27 | |||
Hertz Global Holdings * | 4,900 | 49 | |||
Hexcel * | 1,400 | 20 | |||
HNI | 1,400 | 37 | |||
Hubbell, Cl B | 5,700 | 287 | |||
Huron Consulting Group * | 400 | 8 | |||
IDEX | 6,500 | 215 | |||
IHS, Cl A * | 13,200 | 706 | |||
Interface, Cl A | 21,806 | 252 | |||
Interline Brands * | 1,300 | 25 | |||
International Shipholding | 5,600 | 165 | |||
Jacobs Engineering Group * | 1,849 | 84 | |||
JB Hunt Transport Services | 27,570 | 989 | |||
John Bean Technologies | 777 | 14 | |||
Joy Global | 1,800 | 102 | |||
Kadant * | 12,422 | 179 | |||
Kaman | 2,407 | 60 | |||
Kansas City Southern * | 3,600 | 130 | |||
Kaydon | 10,601 | 399 | |||
KBR | 5,200 | 115 | |||
Kelly Services, Cl A * | 12,500 | 208 | |||
Kennametal | 500 | 14 | |||
Kirby * | 800 | 30 | |||
Knoll | 30,690 | 345 | |||
Landstar System | 600 | 25 | |||
Layne Christensen * | 700 | 19 | |||
Lennox International | 5,600 | 248 | |||
Lincoln Electric Holdings | 2,905 | 158 | |||
Localiza Rent a Car | 33,160 | 348 | |||
Manpower | 8,200 | 468 | |||
Middleby * | 400 | 23 | |||
Mine Safety Appliances | 5,500 | 154 | |||
Monster Worldwide * | 1,600 | 27 | |||
Moog, Cl A * | 2,300 | 81 | |||
MSC Industrial Direct, Cl A | 100 | 5 | |||
Mueller Industries | 11,400 | 305 | |||
NACCO Industries, Cl A | 400 | 30 | |||
Navistar International * | 6,500 | 291 | |||
NCI Building Systems * | 5,260 | 58 | |||
Nordson | 300 | 20 | |||
Old Dominion Freight Line * | 1,350 | 45 | |||
| 7 | SEI Institutional Managed Trust / Semi-Annual Report / March 31, 2010 |
Table of Contents
Schedule of Investments (Unaudited)
Tax-Managed Small Cap Fund
March 31, 2010
| Description | Shares | Market Value ($ Thousands) | |||
Orbital Sciences * | 4,400 | $ | 84 | ||
Oshkosh Truck | 9,200 | 371 | |||
Owens Corning * | 7,600 | 193 | |||
PACCAR | 10,561 | 458 | |||
Pall | 3,500 | 142 | |||
Park-Ohio Holdings * | 2,900 | 25 | |||
Pentair | 800 | 28 | |||
Pitney Bowes | 17,546 | 429 | |||
Quanex Building Products | 1,800 | 30 | |||
Quanta Services * | 3,656 | 70 | |||
Regal-Beloit | 10,230 | 608 | |||
Resources Connection * | 34,695 | 665 | |||
Ritchie Bros. Auctioneers | 10,100 | 217 | |||
Robert Half International | 1,400 | 43 | |||
Rockwell Collins | 4,923 | 308 | |||
Roper Industries | 400 | 23 | |||
RR Donnelley & Sons | 31,294 | 668 | |||
RSC Holdings * | 1,700 | 14 | |||
Rush Enterprises, Cl A * | 30,730 | 406 | |||
Ryder System | 12,600 | 488 | |||
School Specialty * | 11,516 | 261 | |||
Seaboard | 89 | 116 | |||
Skywest | 11,800 | 169 | |||
Spirit Aerosystems Holdings, Cl A * | 19,360 | 453 | |||
Standard Register | 5,164 | 28 | |||
Steelcase, Cl A | 4,600 | 30 | |||
Stericycle * | 1,000 | 54 | |||
SYKES Enterprises * | 90,497 | 2,067 | |||
TAL International Group | 5,800 | 116 | |||
Teledyne Technologies * | 10,398 | 429 | |||
Teleflex | 8,133 | 521 | |||
Terex * | 12,802 | 291 | |||
Tetra Tech * | 9,934 | 229 | |||
Thomas & Betts * | 12,100 | 475 | |||
Timken | 17,300 | 519 | |||
Towers Watson, Cl A | 11,872 | 564 | |||
Trex * | 20,501 | 436 | |||
Triumph Group | 12,317 | 863 | |||
Tutor Perini * | 2,700 | 59 | |||
UAL * | 30,500 | 596 | |||
United Stationers * | 8,821 | 519 | |||
Universal Forest Products | 2,200 | 85 | |||
URS * | 6,800 | 337 | |||
US Airways Group * | 49,163 | 361 | |||
USG * | 1,100 | 19 | |||
UTI Worldwide | 16,300 | 250 | |||
Valmont Industries | 200 | 17 | |||
Vicor * | 2,300 | 32 | |||
Wabtec | 1,800 | 76 | |||
Watsco | 3,400 | 193 | |||
Watts Water Technologies, Cl A | 7,204 | 224 | |||
WESCO International * | 17,694 | 614 | |||
| 41,307 | |||||
Information Technology — 17.8% | |||||
3Com * | 40,300 | 310 | |||
Activision Blizzard | 1,500 | 18 | |||
Advanced Analogic Technologies * | 3,400 | 12 | |||
Advanced Energy Industries * | 1,400 | 23 | |||
Advanced Micro Devices * | 7,300 | 68 | |||
| Description | Shares | Market Value ($ Thousands) | |||
Advent Software * | 500 | $ | 22 | ||
Agilysys | 2,800 | 31 | |||
Akamai Technologies * | 2,300 | 72 | |||
Alliance Data Systems * | 15,000 | 960 | |||
Amkor Technology * | 13,600 | 96 | |||
Analog Devices | 14,873 | 429 | |||
Anixter International * | 500 | 23 | |||
Ansys * | 9,900 | 427 | |||
Applied Micro Circuits * | 52,600 | 454 | |||
Ariba * | 2,700 | 35 | |||
Arris Group * | 7,200 | 86 | |||
Arrow Electronics * | 1,900 | 57 | |||
AsiaInfo Holdings * | 8,000 | 212 | |||
Atheros Communications * | 20,920 | 810 | |||
ATMI * | 800 | 16 | |||
Autodesk * | 1,000 | 29 | |||
Aviat Networks * | 198 | 1 | |||
Avnet * | 10,000 | 300 | |||
Benchmark Electronics * | 19,000 | 394 | |||
Black Box | 5,800 | 178 | |||
Blackbaud | 1,000 | 25 | |||
Blue Coat Systems * | 7,400 | 230 | |||
BMC Software * | 1,700 | 65 | |||
Brightpoint * | 36,183 | 272 | |||
Broadridge Financial Solutions | 1,700 | 36 | |||
Brocade Communications Systems * | 134,610 | 769 | |||
CACI International, Cl A * | 5,120 | 250 | |||
Cadence Design Systems * | 5,600 | 37 | |||
Celestica * | 36,390 | 398 | |||
Checkpoint Systems * | 6,577 | 145 | |||
Ciber * | 20,463 | 77 | |||
Ciena * | 1,200 | 18 | |||
Citrix Systems * | 900 | 43 | |||
Cognex | 4,700 | 87 | |||
Cognizant Technology Solutions, Cl A * | 1,800 | 92 | |||
Cogo Group * | 7,800 | 54 | |||
Coherent * | 12,148 | 388 | |||
CommScope * | 900 | 25 | |||
Computer Sciences * | 9,800 | 534 | |||
Comverge * | 2,600 | 29 | |||
Concur Technologies * | 10,100 | 414 | |||
Convergys * | 27,500 | 337 | |||
Cree * | 2,949 | 207 | |||
CSG Systems International * | 18,734 | 393 | |||
CTS | 32,288 | 304 | |||
Cybersource * | 20,700 | 365 | |||
Cymer * | 1,901 | 71 | |||
Cypress Semiconductor * | 44,800 | 515 | |||
Daktronics | 4,000 | 30 | |||
DealerTrack Holdings * | 1,000 | 17 | |||
Deltek * | 4,647 | 36 | |||
DG FastChannel * | 800 | 26 | |||
Diebold | 24,562 | 780 | |||
Digital River * | 10,849 | 329 | |||
Diodes * | 1,800 | 40 | |||
Dolby Laboratories, Cl A * | 7,700 | 452 | |||
DST Systems | 3,200 | 133 | |||
Earthlink | 11,200 | 96 | |||
EchoStar, Cl A * | 2,900 | 59 | |||
Electronics for Imaging * | 6,290 | 73 | |||
| 8 | SEI Institutional Managed Trust / Semi-Annual Report / March 31, 2010 |
Table of Contents
Schedule of Investments (Unaudited)
Tax-Managed Small Cap Fund
March 31, 2010
| Description | Shares | Market Value ($ Thousands) | |||
Emulex * | 18,333 | $ | 243 | ||
Equinix * | 14,380 | 1,400 | |||
Euronet Worldwide * | 22,800 | 420 | |||
F5 Networks * | 2,000 | 123 | |||
Factset Research Systems | 300 | 22 | |||
Fair Isaac | 700 | 18 | |||
Fairchild Semiconductor International * | 59,188 | 630 | |||
Fidelity National Information Services | 1,480 | 35 | |||
Finisar * | 22,400 | 352 | |||
Flir Systems * | 8,260 | 233 | |||
Formfactor * | 800 | 14 | |||
Forrester Research * | 900 | 27 | |||
Gartner * | 49,740 | 1,106 | |||
Genpact * | 1,200 | 20 | |||
Global Payments | 800 | 36 | |||
GSI Commerce * | 68,220 | 1,888 | |||
Harris | 14,100 | 670 | |||
Heartland Payment Systems | 14,860 | 276 | |||
Hewitt Associates, Cl A * | 3,334 | 133 | |||
Hughes Communications * | 1,200 | 33 | |||
IAC * | 9,650 | 220 | |||
Imation * | 1,900 | 21 | |||
Informatica * | 31,250 | 839 | |||
Ingram Micro, Cl A * | 6,642 | 117 | |||
Integrated Device Technology * | 9,900 | 61 | |||
InterDigital * | 1,000 | 28 | |||
Intermec * | 3,701 | 52 | |||
International Rectifier * | 1,600 | 37 | |||
Intersil, Cl A | 6,800 | 100 | |||
Itron * | 600 | 44 | |||
Ixia * | 2,700 | 25 | |||
Jabil Circuit | 36,597 | 593 | |||
JDS Uniphase * | 2,700 | 34 | |||
Lam Research * | 6,950 | 259 | |||
Lawson Software * | 134,411 | 888 | |||
Lexmark International, Cl A * | 35,150 | 1,268 | |||
Limelight Networks * | 3,000 | 11 | |||
Linear Technology | 5,600 | 158 | |||
Littelfuse * | 7,558 | 287 | |||
LoopNet * | 1,700 | 19 | |||
Loral Space & Communications * | 800 | 28 | |||
LSI Logic * | 20,725 | 127 | |||
Mantech International, Cl A * | 900 | 44 | |||
McAfee * | 400 | 16 | |||
Measurement Specialties * | 2,900 | 43 | |||
Mentor Graphics * | 2,400 | 19 | |||
Methode Electronics | 46,156 | 457 | |||
Micrel | 10,900 | 116 | |||
Micros Systems * | 12,600 | 414 | |||
Microsemi * | 58,572 | 1,016 | |||
MicroStrategy, Cl A * | 200 | 17 | |||
Microtune * | 5,035 | 14 | |||
Molex | 26,509 | 553 | |||
Monolithic Power Systems * | 4,628 | 103 | |||
Motorola * | 18,200 | 128 | |||
Move * | 40,345 | 84 | |||
MTS Systems | 1,819 | 53 | |||
Multi-Fineline g* | 4,000 | 103 | |||
National Semiconductor | 2,800 | 41 | |||
NCR * | 12,025 | 166 | |||
| Description | Shares | Market Value ($ Thousands) | |||
Netezza * | 29,140 | $ | 373 | ||
Netgear * | 2,100 | 55 | |||
Netlogic Microsystems * | 9,300 | 274 | |||
NetSuite * | 1,400 | 20 | |||
NeuStar, Cl A * | 1,200 | 30 | |||
Novell * | 26,778 | 160 | |||
Novellus Systems * | 1,600 | 40 | |||
Omnivision Technologies * | 1,400 | 24 | |||
Parametric Technology * | 19,718 | 356 | |||
Plantronics | 1,100 | 34 | |||
Plexus * | 7,150 | 258 | |||
PMC - Sierra * | 114,800 | 1,024 | |||
Polycom * | 19,300 | 590 | |||
Power Integrations | 7,240 | 298 | |||
QLogic * | 33,930 | 689 | |||
Quality Systems | 8,381 | 515 | |||
Quest Software * | 100 | 2 | |||
Rackspace Hosting * | 20,280 | 380 | |||
Radisys * | 4,300 | 39 | |||
Rambus * | 1,900 | 42 | |||
RealNetworks * | 11,200 | 54 | |||
Red Hat * | 17,500 | 512 | |||
RF Micro Devices * | 59,990 | 299 | |||
Richardson Electronics | 11,300 | 90 | |||
Riverbed Technology * | 22,850 | 649 | |||
Rofin-Sinar Technologies * | 700 | 16 | |||
Rovi * | 10,624 | 395 | |||
S1 * | 3,900 | 23 | |||
SAIC * | 29,000 | 513 | |||
Salesforce.com * | 800 | 60 | |||
Sanmina-SCI * | 51,100 | 843 | |||
Sapient | 63,847 | 584 | |||
SAVVIS * | 1,900 | 31 | |||
Scansource * | 3,200 | 92 | |||
Seagate Technology | 33,840 | 618 | |||
Semtech * | 3,100 | 54 | |||
Silicon Graphics International * | 2,400 | 26 | |||
Silicon Laboratories * | 3,550 | 169 | |||
Skyworks Solutions * | 46,650 | 728 | |||
Solera Holdings | 14,248 | 551 | |||
SonicWALL * | 2,600 | 23 | |||
Supertex * | 900 | 23 | |||
Sybase * | 15,848 | 739 | |||
Symyx Technologies * | 7,803 | 35 | |||
Synaptics * | 4,450 | 123 | |||
SYNNEX * | 1,918 | 57 | |||
Synopsys * | 31,528 | 705 | |||
Syntel | 1,400 | 54 | |||
Take-Two Interactive Software * | 11,200 | 110 | |||
Taleo, Cl A * | 3,892 | 101 | |||
Tech Data * | 12,800 | 536 | |||
Technitrol | 19,700 | 104 | |||
Tekelec * | 3,400 | 62 | |||
TeleTech Holdings * | 25,821 | 441 | |||
Tellabs | 7,100 | 54 | |||
Teradata * | 4,200 | 121 | |||
Teradyne * | 4,782 | 53 | |||
Tessera Technologies * | 900 | 18 | |||
TIBCO Software * | 10,000 | 108 | |||
TiVo * | 79,170 | 1,355 | |||
Total System Services | 1,600 | 25 | |||
Trimble Navigation * | 5,500 | 158 | |||
| 9 | SEI Institutional Managed Trust / Semi-Annual Report / March 31, 2010 |
Table of Contents
Schedule of Investments (Unaudited)
Tax-Managed Small Cap Fund
March 31, 2010
| Description | Shares | Market Value ($ Thousands) | |||
TriQuint Semiconductor * | 44,620 | $ | 312 | ||
Ultimate Software Group * | 600 | 20 | |||
Unisys * | 10,373 | 362 | |||
United Online | 54,330 | 406 | |||
Utstarcom * | 6,700 | 19 | |||
Valueclick * | 16,500 | 167 | |||
Varian Semiconductor Equipment | |||||
Associates * | 5,375 | 178 | |||
Veeco Instruments * | 2,300 | 100 | |||
Viasat * | 5,200 | 180 | |||
Virtusa * | 1,600 | 16 | |||
Vishay Intertechnology * | 68,300 | 699 | |||
VistaPrint * | 27,109 | 1,552 | |||
WebMD Health, Cl A * | 1,121 | 52 | |||
Websense * | 24,670 | 562 | |||
Western Digital * | 15,900 | 620 | |||
Wright Express * | 11,695 | 352 | |||
Xyratex * | 15,881 | 269 | |||
Zebra Technologies, Cl A * | 13,166 | 390 | |||
Zoran * | 39,511 | 425 | |||
| 52,792 | |||||
Materials — 5.0% | |||||
Airgas | 800 | 51 | |||
AK Steel Holding | 8,400 | 192 | |||
Albemarle | 4,500 | 192 | |||
Allegheny Technologies | 14,584 | 787 | |||
Alpha Natural Resources * | 3,120 | 156 | |||
AM Castle | 8,068 | 105 | |||
Aptargroup | 8,533 | 336 | |||
Ashland | 2,600 | 137 | |||
Ball | 5,000 | 267 | |||
Cabot | 10,992 | 334 | |||
Celanese, Ser A | 11,400 | 363 | |||
Century Aluminum * | 12,207 | 168 | |||
China Green Agriculture * | 7,900 | 111 | |||
Cliffs Natural Resources | 4,862 | 345 | |||
Commercial Metals | 11,469 | 173 | |||
Compass Minerals International | 1,100 | 88 | |||
Crown Holdings * | 4,800 | 129 | |||
Cytec Industries | 10,764 | 503 | |||
Domtar * | 4,500 | 290 | |||
Eagle Materials | 600 | 16 | |||
Eastman Chemical | 11,200 | 713 | |||
FMC | 2,882 | 174 | |||
General Steel Holdings * | 16,528 | 68 | |||
Greif, Cl A | 1,200 | 66 | |||
H.B. Fuller | 9,200 | 214 | |||
Headwaters * | 12,723 | 58 | |||
Huntsman | 2,900 | 35 | |||
Innophos Holdings | 9,500 | 265 | |||
Innospec | 3,100 | 35 | |||
Kaiser Aluminum | 3,000 | 116 | |||
Koppers Holdings | 4,297 | 122 | |||
Lubrizol | 8,200 | 752 | |||
Mosaic | 500 | 30 | |||
Nalco Holding | 12,600 | 307 | |||
Neenah Paper | 11,949 | 189 | |||
NewMarket | 992 | 102 | |||
Nucor | 8,524 | 387 | |||
Olin | 9,500 | 186 | |||
OM Group * | 6,097 | 207 | |||
| Description | Shares | Market Value ($ Thousands) | |||
Owens-Illinois * | 22,661 | $ | 805 | ||
Packaging Corp of America | 14,921 | 367 | |||
Pactiv * | 12,111 | 305 | |||
PolyOne * | 60,035 | 615 | |||
Reliance Steel & Aluminum | 7,200 | 354 | |||
Rockwood Holdings * | 13,300 | 354 | |||
Royal Gold | 900 | 42 | |||
RPM International | 900 | 19 | |||
RTI International Metals * | 7,918 | 240 | |||
Schnitzer Steel Industries, Cl A | 2,800 | 147 | |||
Schulman A | 14,022 | 343 | |||
Schweitzer-Mauduit International | 4,489 | 214 | |||
Scotts Miracle-Gro, Cl A | 1,500 | 70 | |||
Sealed Air | 100 | 2 | |||
Sensient Technologies | 6,800 | 198 | |||
Silgan Holdings | 18,495 | 1,114 | |||
Solutia * | 9,900 | 160 | |||
Spartech * | 4,727 | 55 | |||
Stillwater Mining * | 2,600 | 34 | |||
Temple-Inland | 2,300 | 47 | |||
Terra Industries | 3,900 | 178 | |||
Texas Industries | 500 | 17 | |||
Titanium Metals * | 6,000 | 100 | |||
Walter Energy | 100 | 9 | |||
Westlake Chemical | 2,015 | 52 | |||
Worthington Industries | 8,000 | 138 | |||
WR Grace * | 4,500 | 125 | |||
| 14,873 | |||||
Telecommunication Services — 1.8% | |||||
Alaska Communications Systems Group | 18,870 | 153 | |||
American Tower, Cl A * | 1,015 | 43 | |||
CenturyTel | 14,200 | 504 | |||
Cincinnati Bell * | 59,635 | 203 | |||
Consolidated Communications Holdings | 1,000 | 19 | |||
Frontier Communications | 6,500 | 48 | |||
General Communication, Cl A * | 5,600 | 32 | |||
Global Crossing * | 1,400 | 21 | |||
Iowa Telecommunications Services | 2,800 | 47 | |||
MetroPCS Communications * | 68,225 | 483 | |||
NII Holdings * | 36,200 | 1,508 | |||
NTELOS Holdings | 5,100 | 91 | |||
PAETEC Holding * | 6,400 | 30 | |||
Price Communication * | 3,800 | 0 | |||
Qwest Communications International | 13,800 | 72 | |||
SBA Communications, Cl A * | 47,710 | 1,721 | |||
tw telecom, Cl A * | 8,590 | 156 | |||
USA Mobility | 16,700 | 212 | |||
| 5,343 | |||||
Utilities — 4.2% | |||||
AGL Resources | 34,098 | 1,318 | |||
Alliant Energy | 8,800 | 293 | |||
Ameren | 13,600 | 355 | |||
American Water Works | 4,800 | 104 | |||
Avista | 16,100 | 333 | |||
Black Hills | 3,085 | 94 | |||
California Water Service Group | 900 | 34 | |||
Centerpoint Energy | 800 | 11 | |||
| 10 | SEI Institutional Managed Trust / Semi-Annual Report / March 31, 2010 |
Table of Contents
Schedule of Investments (Unaudited)
Tax-Managed Small Cap Fund
March 31, 2010
| Description | Shares | Market Value ($ Thousands) | |||
CH Energy Group | 1,800 | $ | 74 | ||
Chesapeake Utilities | 400 | 12 | |||
Cleco | 1,200 | 32 | |||
CMS Energy (A) | 47,700 | 737 | |||
Connecticut Water Service | 500 | 12 | |||
Consolidated Edison | 5,929 | 264 | |||
Dynegy, Cl A * | 56,500 | 71 | |||
Edison International | 9,690 | 331 | |||
El Paso Electric * | 4,700 | 97 | |||
Empire District Electric | 8,731 | 157 | |||
Energen | 2,800 | 130 | |||
Great Plains Energy | 56,292 | 1,045 | |||
Hawaiian Electric Industries | 12,900 | 290 | |||
Idacorp | 3,400 | 118 | |||
ITC Holdings | 1,000 | 55 | |||
Laclede Group | 2,575 | 87 | |||
MDU Resources Group | 5,300 | 114 | |||
Mirant * | 19,400 | 211 | |||
New Jersey Resources | 750 | 28 | |||
NiSource | 47,500 | 750 | |||
Northeast Utilities | 4,000 | 111 | |||
Northwest Natural Gas | 400 | 19 | |||
NorthWestern | 32,525 | 872 | |||
NV Energy | 4,400 | 54 | |||
Oneok | 600 | 27 | |||
Ormat Technologies | 300 | 9 | |||
Pepco Holdings | 12,500 | 214 | |||
Pinnacle West Capital | 18,372 | 693 | |||
PNM Resources | 1,700 | 21 | |||
Portland General Electric | 53,681 | 1,037 | |||
PPL | 1,900 | 53 | |||
RRI Energy * | 67,813 | 250 | |||
SCANA | 13,806 | 519 | |||
Sempra Energy | 1,600 | 80 | |||
South Jersey Industries | 5,227 | 220 | |||
Southern Union | 600 | 15 | |||
Southwest Water | 2,600 | 27 | |||
TECO Energy | 1,800 | 29 | |||
UGI | 8,400 | 223 | |||
UIL Holdings | 700 | 19 | |||
Westar Energy | 5,800 | 129 | |||
Wisconsin Energy | 1,900 | 94 | |||
Xcel Energy | 18,194 | 386 | |||
| 12,258 | |||||
Total Common Stock | 281,776 | ||||
EXCHANGE TRADED FUND — 0.1% | 2,540 | 172 | |||
Total Exchange Traded Fund | 172 | ||||
CLOSED-END FUND — 0.0% | 800 | 13 | |||
Total Closed-End Fund | 13 | ||||
| Description | Shares/Face Amount ($ Thousands) | Market Value ($ Thousands) | ||||
CASH EQUIVALENT — 4.9% | ||||||
SEI Daily Income Trust, Prime Obligation Fund, Cl A, 0.070%**†† | 14,667,326 | $ | 14,667 | |||
Total Cash Equivalent | 14,667 | |||||
AFFILIATED PARTNERSHIP — 0.2% | ||||||
SEI Liquidity Fund, L.P., 0.210% (B)** †† | 649,899 | 480 | ||||
Total Affiliated Partnership | 480 | |||||
U.S. TREASURY OBLIGATION (C) (D) — 0.2% | ||||||
U.S. Treasury Bills 0.135%, 06/03/10 | $ | 623 | 623 | |||
Total U.S. Treasury Obligation | 623 | |||||
Total Investments — 100.5% | $ | 297,731 | ||||
A summary of the open futures contracts held by the Fund at March 31, 2010, is as follows:
| Type of Contract | Number of Contracts Long (Short) | Expiration Date | Unrealized Appreciation ($ Thousands) | ||||
Russell 2000 Index E- MINI | 76 | Jun-2010 | $ | 24 | |||
S&P Mid 400 Index E- MINI | 50 | Jun-2010 | 57 | ||||
| $ | 81 | ||||||
For the period ended March 31, 2010, the total amount of all open futures contracts, as presented in the table above, are representative of the volume of activity for this derivative type during the period.
Percentages are based on Net Assets of $296,136 ($ Thousands).
| * | Non-income producing security. |
| ** | Rate shown is the 7-day effective yield as of March 31, 2010. |
| † | Real Estate Investment Trust. |
| †† | Investment in Affiliated Security. |
| (A) | This security or a partial position of this security is on loan at March 31, 2010. The total market value of securities on loan at March 31, 2010 was $628 ($ Thousands). (B) This security was purchased with cash collateral received from securities on loan. The total value of such securities as of March 31, 2010 was $480 ($ Thousands). |
| (C) | The rate reported is the effective yield at the time of purchase. |
| (D) | Security, or portion thereof, has been pledged as collateral on open futures. |
ADR — American Depositary Receipt
Cl — Class
L.P. — Limited Partnership
Ser — Series
| 11 | SEI Institutional Managed Trust / Semi-Annual Report / March 31, 2010 |
Table of Contents
Schedule of Investments (Unaudited)
Mid-Cap Fund
March 31, 2010
| Description | Shares | Market Value ($ Thousands) | |||
COMMON STOCK — 75.3% | |||||
Consumer Discretionary — 13.7% | |||||
99 Cents Only Stores * | 2,500 | $ | 41 | ||
Advance Auto Parts (A) | 12,500 | 524 | |||
Aeropostale * | 11,250 | 324 | |||
Autonation * (A) | 6,400 | 116 | |||
Autozone * | 700 | 121 | |||
Bed Bath & Beyond * | 3,200 | 140 | |||
Big Lots * | 2,900 | 105 | |||
Bob Evans Farms | 1,400 | 43 | |||
BorgWarner * | 4,300 | 164 | |||
Brinker International | 27,600 | 532 | |||
Cablevision Systems, Cl A | 1,500 | 36 | |||
Career Education * (A) | 5,800 | 184 | |||
CBS, Cl B | 2,700 | 38 | |||
Cheesecake Factory * (A) | 1,100 | 30 | |||
Chico’s FAS | 25,900 | 374 | |||
Chipotle Mexican Grill, Cl A * | 2,600 | 293 | |||
Coach | 17,900 | 707 | |||
Cooper Tire & Rubber | 1,300 | 25 | |||
Core-Mark Holding * | 1,800 | 55 | |||
Darden Restaurants | 1,600 | 71 | |||
DeVry | 10,500 | 685 | |||
Discovery Communications, Cl C * | 4,400 | 129 | |||
DISH Network, Cl A | 15,300 | 319 | |||
Dollar General * | 400 | 10 | |||
Dollar Tree * | 18,400 | 1,090 | |||
Education Management * | 26,500 | 580 | |||
Expedia | 23,800 | 594 | |||
Family Dollar Stores (A) | 6,300 | 231 | |||
Gannett (A) | 41,000 | 677 | |||
Gap | 1,100 | 25 | |||
Garmin (A) | 17,000 | 654 | |||
Gentex | 11,100 | 215 | |||
Genuine Parts | 6,700 | 283 | |||
H&R Block | 29,400 | 523 | |||
Hanesbrands * | 10,700 | 298 | |||
Hasbro | 12,000 | 460 | |||
ITT Educational Services * | 6,000 | 675 | |||
J.C. Penney | 4,500 | 145 | |||
Jarden | 7,800 | 260 | |||
Jones Apparel Group | 3,100 | 59 | |||
Leggett & Platt | 12,700 | 275 | |||
Liberty Media—Interactive, Cl A * | 15,900 | 244 | |||
Limited Brands (A) | 8,200 | 202 | |||
Lithia Motors, Cl A * | 1,100 | 7 | |||
LKQ * | 16,200 | 329 | |||
Macy’s | 48,300 | 1,051 | |||
Maidenform Brands * | 5,000 | 109 | |||
Mattel | 42,000 | 955 | |||
McGraw-Hill | 9,000 | 321 | |||
Newell Rubbermaid (A) | 30,500 | 464 | |||
Oxford Industries | 1,500 | 31 | |||
PetSmart | 14,300 | 457 | |||
Phillips-Van Heusen | 6,000 | 344 | |||
priceline.com * | 800 | 204 | |||
Regis | 1,000 | 19 | |||
Ross Stores (A) | 21,900 | 1,171 | |||
Scripps Networks Interactive, Cl A | 11,300 | 501 | |||
| Description | Shares | Market Value ($ Thousands) | |||
Sherwin-Williams | 300 | $ | 20 | ||
Signet Jewelers * | 17,500 | 566 | |||
Stanley Black & Decker | 1,800 | 103 | |||
Tempur-Pedic International * | 4,600 | 139 | |||
Texas Roadhouse, Cl A * | 5,700 | 79 | |||
Thor Industries | 8,100 | 245 | |||
TJX | 41,400 | 1,760 | |||
TRW Automotive Holdings * | 19,700 | 563 | |||
Tupperware Brands | 1,400 | 67 | |||
Universal Technical Institute * | 4,000 | 91 | |||
Urban Outfitters * | 11,700 | 445 | |||
VF | 7,000 | 561 | |||
WABCO Holdings | 1,300 | 39 | |||
Washington Post, Cl B | 300 | 133 | |||
Weight Watchers International | 6,200 | 158 | |||
Whirlpool (A) | 2,100 | 183 | |||
Williams-Sonoma | 2,800 | 74 | |||
Wyndham Worldwide | 31,000 | 798 | |||
| 24,543 | |||||
Consumer Staples — 5.2% | |||||
Avon Products | 7,100 | 240 | |||
Bunge (A) | 9,200 | 567 | |||
Campbell Soup (A) | 8,600 | 304 | |||
Church & Dwight | 3,400 | 228 | |||
Clorox | 4,700 | 301 | |||
ConAgra Foods | 34,900 | 875 | |||
Constellation Brands, Cl A * | 43,500 | 715 | |||
Dean Foods * | 12,000 | 188 | |||
Del Monte Foods | 75,200 | 1,098 | |||
Dole Food * | 800 | 10 | |||
Dr Pepper Snapple Group | 8,500 | 299 | |||
Estee Lauder, Cl A | 8,700 | 564 | |||
Herbalife | 10,900 | 503 | |||
HJ Heinz | 2,400 | 109 | |||
Hormel Foods | 4,300 | 181 | |||
Lorillard | 3,000 | 226 | |||
Molson Coors Brewing, Cl B | 7,500 | 316 | |||
NBTY * | 1,100 | 53 | |||
Ralcorp Holdings * | 2,200 | 149 | |||
Reynolds American | 2,500 | 135 | |||
Safeway | 6,400 | 159 | |||
Sanderson Farms (A) | 2,300 | 123 | |||
Sara Lee | 55,300 | 770 | |||
SUPERVALU (A) | 13,500 | 225 | |||
Tyson Foods, Cl A | 37,000 | 709 | |||
Whole Foods Market * (A) | 6,000 | 217 | |||
| 9,264 | |||||
Energy — 4.2% | |||||
Cal Dive International * | 7,700 | 56 | |||
Cameron International * | 400 | 17 | |||
Chesapeake Energy | 3,600 | 85 | |||
Cimarex Energy | 15,400 | 915 | |||
Consol Energy | 2,600 | 111 | |||
Continental Resources * (A) | 5,900 | 251 | |||
El Paso | 104,100 | 1,128 | |||
FMC Technologies * (A) | 8,900 | 575 | |||
Harvest Natural Resources * | 6,700 | 51 | |||
Helix Energy Solutions Group * | 19,200 | 250 | |||
Helmerich & Payne | 6,000 | 229 | |||
Murphy Oil | 20,300 | 1,141 | |||
Newfield Exploration * | 4,400 | 229 | |||
| 1 | SEI Institutional Managed Trust / Semi-Annual Report / March 31, 2010 |
Table of Contents
Schedule of Investments (Unaudited)
Mid-Cap Fund
March 31, 2010
| Description | Shares | Market Value ($ Thousands) | |||
Noble Energy | 2,500 | $ | 183 | ||
Oil States International * | 11,000 | 499 | |||
Range Resources | 900 | 42 | |||
Spectra Energy | 35,700 | 804 | |||
Stone Energy * | 10,600 | 188 | |||
Sunoco | 3,000 | 89 | |||
Unit * | 12,000 | 507 | |||
Vaalco Energy | 2,200 | 11 | |||
Whiting Petroleum * | 500 | 40 | |||
| 7,401 | |||||
Financials — 12.6% | |||||
Affiliated Managers Group * | 1,600 | 126 | |||
Allied World Assurance Holdings | 15,100 | 677 | |||
American Equity Investment Life Holding | 8,200 | 87 | |||
American Financial Group | 25,200 | 717 | |||
AmeriCredit * | 21,600 | 513 | |||
Ameriprise Financial | 10,800 | 490 | |||
Annaly Capital Management † | 65,500 | 1,125 | |||
Anworth Mortgage Asset † | 4,700 | 32 | |||
Arch Capital Group * | 1,700 | 130 | |||
Aspen Insurance Holdings | 17,500 | 505 | |||
Assurant | 10,100 | 347 | |||
Axis Capital Holdings | 2,700 | 84 | |||
Bank of Hawaii | 1,600 | 72 | |||
BlackRock | 300 | 65 | |||
Brandywine Realty Trust † | 35,300 | 431 | |||
CapLease † (A) | 3,700 | 21 | |||
CBL & Associates Properties † (A) | 11,100 | 152 | |||
Chimera Investment † | 81,800 | 318 | |||
Cincinnati Financial | 4,000 | 116 | |||
Colonial Properties Trust † | 8,100 | 104 | |||
Comerica | 3,700 | 141 | |||
Douglas Emmett † (A) | 2,200 | 34 | |||
Eaton Vance | 1,100 | 37 | |||
Endurance Specialty Holdings | 16,500 | 613 | |||
Equity Residential † | 600 | 23 | |||
Everest Re Group | 3,500 | 283 | |||
Federated Investors, Cl B (A) | 2,200 | 58 | |||
Fifth Third Bancorp | 44,700 | 607 | |||
First Horizon National * | 8,031 | 113 | |||
Flagstone Reinsurance Holdings | 5,900 | 68 | |||
FNB (Pennsylvania) (A) | 11,800 | 96 | |||
Forest City Enterprises, Cl A * | 8,800 | 127 | |||
Fulton Financial | 8,100 | 82 | |||
Genworth Financial, Cl A * | 4,700 | 86 | |||
Hallmark Financial Services * | 1,900 | 17 | |||
Hartford Financial Services Group | 19,500 | 554 | |||
Hospitality Properties Trust † | 31,600 | 757 | |||
Host Hotels & Resorts † | 12,764 | 187 | |||
HRPT Properties Trust † | 80,900 | 629 | |||
Hudson City Bancorp | 36,400 | 515 | |||
IntercontinentalExchange * | 800 | 90 | |||
Invesco | 17,500 | 383 | |||
Invesco Mortgage Capital † | 8,200 | 189 | |||
Investment Technology Group * | 23,000 | 384 | |||
Keycorp | 12,600 | 98 | |||
Kimco Realty † (A) | 2,900 | 45 | |||
Legg Mason | 3,100 | 89 | |||
Leucadia National * | 2,300 | 57 | |||
| Description | Shares | Market Value ($ Thousands) | |||
Lincoln National | 15,200 | $ | 467 | ||
M&T Bank | 6,300 | 500 | |||
Mack-Cali Realty † | 3,700 | 130 | |||
Marsh & McLennan | 600 | 15 | |||
Marshall & Ilsley | 8,400 | 68 | |||
MBIA * | 4,400 | 28 | |||
MFA Financial † (A) | 44,400 | 327 | |||
Moody’s (A) | 9,800 | 292 | |||
NASDAQ OMX Group * | 5,600 | 118 | |||
New York Community Bancorp (A) | 7,500 | 124 | |||
NYSE Euronext | 14,800 | 438 | |||
OceanFirst Financial | 2,900 | 33 | |||
Oriental Financial Group | 1,000 | 13 | |||
Parkway Properties † | 800 | 15 | |||
PartnerRe | 2,500 | 199 | |||
PHH * | 15,600 | 368 | |||
Presidential Life | 2,700 | 27 | |||
Principal Financial Group | 22,300 | 651 | |||
Protective Life | 1,600 | 35 | |||
Provident Financial Services (A) | 8,800 | 105 | |||
Public Storage † | 1,900 | 175 | |||
Ramco-Gershenson Properties † | 3,000 | 34 | |||
Regions Financial | 34,400 | 270 | |||
Reinsurance Group of America, Cl A | 3,200 | 168 | |||
RenaissanceRe Holdings | 14,100 | 800 | |||
Resource Capital † | 17,700 | 120 | |||
SL Green Realty † (A) | 12,400 | 710 | |||
SLM * | 45,200 | 566 | |||
Southside Bancshares | 1,300 | 28 | |||
Starwood Property Trust † | 3,100 | 60 | |||
SunTrust Banks | 600 | 16 | |||
T. Rowe Price Group (A) | 8,200 | 451 | |||
TFS Financial | 1,400 | 19 | |||
Transatlantic Holdings | 12,000 | 634 | |||
Trustco Bank NY (A) | 6,000 | 37 | |||
Unum Group | 16,300 | 404 | |||
Vornado Realty Trust † (A) | 5,035 | 381 | |||
Waddell & Reed Financial, Cl A | 14,200 | 512 | |||
Webster Financial (A) | 7,600 | 133 | |||
WesBanco | 3,400 | 55 | |||
WR Berkley | 1,200 | 31 | |||
XL Capital, Cl A | 23,800 | 450 | |||
| 22,481 | |||||
Health Care — 7.2% | |||||
Abraxis Bioscience * | 1,400 | 72 | |||
Alexion Pharmaceuticals * | 600 | 33 | |||
Allscripts Healthcare Solutions * (A) | 20,600 | 403 | |||
American Dental Partners * | 700 | 9 | |||
AmerisourceBergen | 26,800 | 775 | |||
Biogen Idec * | 300 | 17 | |||
Bruker BioSciences * | 4,000 | 58 | |||
C.R. Bard | 3,500 | 303 | |||
Cephalon * | 2,700 | 183 | |||
Cigna | 700 | 26 | |||
Community Health Systems * | 1,400 | 52 | |||
Cooper (A) | 4,200 | 163 | |||
Coventry Health Care * | 15,300 | 378 | |||
Endo Pharmaceuticals Holdings * | 7,800 | 185 | |||
| 2 | SEI Institutional Managed Trust / Semi-Annual Report / March 31, 2010 |
Table of Contents
Schedule of Investments (Unaudited)
Mid-Cap Fund
March 31, 2010
| Description | Shares | Market Value ($ Thousands) | |||
Forest Laboratories * | 11,000 | $ | 345 | ||
Henry Schein * | 5,000 | 295 | |||
Hill-Rom Holdings | 19,200 | 523 | |||
Hologic * (A) | 28,800 | 534 | |||
Hospira * | 18,200 | 1,031 | |||
Humana * | 15,200 | 711 | |||
IDEXX Laboratories * (A) | 8,200 | 472 | |||
Intuitive Surgical * | 2,200 | 766 | |||
Invacare (A) | 2,800 | 74 | |||
Kinetic Concepts * | 19,700 | 942 | |||
Laboratory Corp of America Holdings * | 3,900 | 295 | |||
Life Technologies * | 9,600 | 502 | |||
Lincare Holdings * (A) | 4,400 | 197 | |||
Meridian Bioscience | 3,600 | 73 | |||
Mettler Toledo International * | 3,800 | 415 | |||
Par Pharmaceutical * | 3,400 | 84 | |||
Perrigo (A) | 5,400 | 317 | |||
Quest Diagnostics | 7,500 | 437 | |||
Quidel * | 3,200 | 47 | |||
Techne | 2,200 | 140 | |||
Universal Health Services, Cl B | 23,600 | 828 | |||
Valeant Pharmaceuticals International * (A) | 10,300 | 442 | |||
Vertex Pharmaceuticals * | 4,400 | 180 | |||
Waters * | 4,100 | 277 | |||
Watson Pharmaceuticals * | 7,800 | 326 | |||
| 12,910 | |||||
Industrials — 9.3% | |||||
Alliant Techsystems * (A) | 5,200 | 423 | |||
Avery Dennison | 9,400 | 342 | |||
C.H. Robinson Worldwide (A) | 6,700 | 374 | |||
Carlisle | 13,300 | 507 | |||
Cintas | 1,000 | 28 | |||
Crane | 6,900 | 245 | |||
Delta Air Lines * | 11,800 | 172 | |||
Donaldson | 3,300 | 149 | |||
Dover | 9,100 | 425 | |||
DynCorp International, Cl A * | 2,200 | 25 | |||
Eaton | 6,400 | 485 | |||
Equifax | 5,200 | 186 | |||
Flowserve | 1,600 | 176 | |||
Hubbell, Cl B | 14,500 | 731 | |||
IDEX | 6,100 | 202 | |||
ITT | 17,900 | 960 | |||
Joy Global | 16,400 | 928 | |||
Kansas City Southern * | 1,300 | 47 | |||
KBR | 7,900 | 175 | |||
Kennametal | 600 | 17 | |||
L-3 Communications Holdings | 12,400 | 1,136 | |||
Lennox International | 1,900 | 84 | |||
Masco | 18,600 | 289 | |||
McDermott International * | 17,700 | 476 | |||
Northrop Grumman | 4,400 | 289 | |||
Oshkosh Truck | 26,800 | 1,081 | |||
Owens Corning * | 10,300 | 262 | |||
Pall | 15,300 | 620 | |||
Parker Hannifin | 8,300 | 537 | |||
Pentair | 2,600 | 93 | |||
Raytheon | 4,600 | 263 | |||
Republic Services | 11,900 | 346 | |||
| Description | Shares | Market Value ($ Thousands) | |||
Robert Half International | 2,200 | $ | 67 | ||
Rockwell Automation | 10,300 | 581 | |||
Roper Industries | 3,100 | 179 | |||
RR Donnelley & Sons | 8,800 | 188 | |||
Ryder System | 1,400 | 54 | |||
Schawk, Cl A | 1,100 | 20 | |||
Shaw Group * | 16,100 | 554 | |||
Southwest Airlines | 30,800 | 407 | |||
Stericycle * (A) | 3,600 | 196 | |||
Thomas & Betts * | 5,100 | 200 | |||
Timken | 24,200 | 726 | |||
Toro (A) | 5,000 | 246 | |||
URS * | 10,800 | 536 | |||
WW Grainger | 5,100 | 552 | |||
| 16,579 | |||||
Information Technology — 12.7% | |||||
Altera | 9,800 | 238 | |||
Amdocs * | 21,900 | 660 | |||
Analog Devices | 2,800 | 81 | |||
Arrow Electronics * | 25,200 | 759 | |||
Avnet * | 33,500 | 1,005 | |||
BMC Software * | 14,200 | 540 | |||
Brightpoint * | 2,000 | 15 | |||
Broadcom, Cl A | 1,600 | 53 | |||
Broadridge Financial Solutions | 20,700 | 443 | |||
CA | 34,600 | 812 | |||
Cirrus Logic * | 2,200 | 18 | |||
Computer Sciences * | 15,600 | 850 | |||
Compuware * | 57,700 | 485 | |||
DST Systems (A) | 17,500 | 725 | |||
F5 Networks * | 4,500 | 277 | |||
Factset Research Systems (A) | 1,300 | 95 | |||
Fairchild Semiconductor International * | 20,700 | 220 | |||
Fidelity National Information Services | 22,520 | 528 | |||
Fiserv * | 6,700 | 340 | |||
Harris | 17,600 | 836 | |||
Hewitt Associates, Cl A * | 8,800 | 350 | |||
IAC * | 20,200 | 459 | |||
Ingram Micro, Cl A * | 8,400 | 147 | |||
Integrated Device Technology * | 60,900 | 373 | |||
Intersil, Cl A | 5,900 | 87 | |||
Intuit * | 16,900 | 580 | |||
Iron Mountain | 2,700 | 74 | |||
Jabil Circuit | 63,100 | 1,022 | |||
Lam Research * | 11,000 | 411 | |||
Lender Processing Services | 18,700 | 706 | |||
Linear Technology (A) | 12,600 | 356 | |||
LSI Logic * | 24,900 | 152 | |||
Marvell Technology Group * | 35,900 | 732 | |||
Maxim Integrated Products | 11,600 | 225 | |||
McAfee * | 10,400 | 417 | |||
Micron Technology * (A) | 87,000 | 904 | |||
National Instruments (A) | 6,200 | 207 | |||
National Semiconductor (A) | 26,400 | 382 | |||
Novatel Wireless * | 6,000 | 40 | |||
Nvidia * | 17,500 | 304 | |||
PMC - Sierra * | 6,200 | 55 | |||
Riverbed Technology * | 2,800 | 79 | |||
SAIC * | 4,200 | 74 | |||
| 3 | SEI Institutional Managed Trust / Semi-Annual Report / March 31, 2010 |
Table of Contents
Schedule of Investments (Unaudited)
Mid-Cap Fund
March 31, 2010
| Description | Shares | Market Value ($ Thousands) | |||
SanDisk * | 4,400 | $ | 152 | ||
Seagate Technology | 57,800 | 1,055 | |||
Silicon Laboratories * (A) | 5,500 | 262 | |||
Symantec * | 10,400 | 176 | |||
Tech Data * | 11,100 | 465 | |||
Teradata * | 18,400 | 532 | |||
Teradyne * | 3,400 | 38 | |||
Travelzoo * | 1,300 | 20 | |||
Vishay Intertechnology * | 63,300 | 648 | |||
Western Digital * | 33,900 | 1,322 | |||
Western Union | 4,100 | 70 | |||
Xerox | 57,100 | 557 | |||
Xilinx | 7,200 | 184 | |||
Zoran * | 1,000 | 11 | |||
| 22,608 | |||||
Materials — 4.6% | |||||
Alcoa | 9,200 | 131 | |||
Ashland | 19,300 | 1,019 | |||
Ball | 2,800 | 150 | |||
Celanese, Ser A | 25,500 | 812 | |||
Crown Holdings * | 25,200 | 679 | |||
Cytec Industries | 10,700 | 500 | |||
Eastman Chemical | 4,200 | 267 | |||
International Paper | 28,700 | 706 | |||
Lubrizol | 12,200 | 1,119 | |||
Nalco Holding | 19,700 | 479 | |||
NewMarket | 1,000 | 103 | |||
Owens-Illinois * | 3,800 | 135 | |||
Pactiv * | 2,300 | 58 | |||
Reliance Steel & Aluminum | 13,500 | 665 | |||
RPM International | 1,500 | 32 | |||
Solutia * | 1,100 | 18 | |||
Sonoco Products | 17,200 | 530 | |||
Spartech * | 5,300 | 62 | |||
Steel Dynamics | 1,600 | 28 | |||
Valspar | 5,800 | 171 | |||
Walter Energy (A) | 6,700 | 618 | |||
| 8,282 | |||||
Telecommunication Services — 0.5% | |||||
Atlantic Telegraph-Network | 1,100 | 49 | |||
CenturyTel | 8,200 | 291 | |||
Frontier Communications (A) | 19,200 | 143 | |||
Qwest Communications International | 21,700 | 113 | |||
Telephone & Data Systems | 1,900 | 64 | |||
Windstream | 18,700 | 204 | |||
| 864 | |||||
Utilities — 5.3% | |||||
AES * | 65,000 | 715 | |||
AGL Resources | 4,200 | 162 | |||
Allegheny Energy | 10,700 | 246 | |||
Alliant Energy | 400 | 13 | |||
Ameren | 10,200 | 266 | |||
American Water Works | 9,700 | 211 | |||
Aqua America (A) | 11,200 | 197 | |||
Atmos Energy | 4,500 | 129 | |||
CMS Energy (A) | 4,800 | 74 | |||
Consolidated Edison | 4,600 | 205 | |||
Constellation Energy Group | 29,600 | 1,039 | |||
DPL | 15,600 | 424 | |||
| Description | Shares/Face Amount ($ Thousands) | Market Value ($ Thousands) | ||||
DTE Energy | 17,800 | $ | 794 | |||
Edison International | 15,500 | 530 | ||||
Energen | 15,700 | 731 | ||||
MDU Resources Group | 22,200 | 479 | ||||
Mirant * | 17,700 | 192 | ||||
NRG Energy * | 10,500 | 219 | ||||
NSTAR | 8,000 | 283 | ||||
Oneok | 13,100 | 598 | ||||
Pepco Holdings | 3,900 | 67 | ||||
Pinnacle West Capital | 9,100 | 343 | ||||
PPL | 8,900 | 247 | ||||
RRI Energy * | 7,800 | 29 | ||||
Sempra Energy | 10,000 | 499 | ||||
Southern Union | 16,100 | 408 | ||||
UGI | 8,900 | 236 | ||||
Xcel Energy | 8,700 | 185 | ||||
| 9,521 | ||||||
Total Common Stock | 134,453 | |||||
CASH EQUIVALENT — 22.9% | ||||||
SEI Daily Income Trust, Prime Obligation Fund, Cl A, 0.070%**†† | 40,839,175 | 40,839 | ||||
Total Cash Equivalent | 40,839 | |||||
AFFILIATED PARTNERSHIP — 3.1% | ||||||
SEI Liquidity Fund, L.P., 0.210% (B)**†† | 5,856,421 | 5,548 | ||||
Total Affiliated Partnership | 5,548 | |||||
U.S. TREASURY OBLIGATION (C) (D) — 2.1% | ||||||
U.S. Treasury Bills | ||||||
0.121%, 06/03/10 | $ | 3,854 | 3,853 | |||
Total U.S. Treasury Obligation | 3,853 | |||||
Total Investments — 103.4% | $ | 184,693 | ||||
A summary of the open futures contracts held by the Fund at March 31, 2010, is as follows:
| Type of Contract | Number of Contracts Long (Short) | Expiration Date | Unrealized Depreciation ($ Thousands) | |||||
S&P Mid 400 Index E-MINI | 560 | Jun-2010 | $ | (28 | ) | |||
For the period ended March 31, 2010, the total amount of all open futures contracts as presented in the table above, are representative of the volume of activity for this derivative type during the period.
| 4 | SEI Institutional Managed Trust / Semi-Annual Report / March 31, 2010 |
Table of Contents
Schedule of Investments (Unaudited)
Mid-Cap Fund
March 31, 2010
Percentages are based on Net Assets of $178,618 ($ Thousands).
| * | Non-income producing security. |
| ** | Rate shown is the 7-day effective yield as of March 31, 2010. |
| † | Real Estate Investment Trust. |
| †† | Investment in Affiliated Security. |
| (A) | This security or a partial position of this security is on loan at March 31, 2010. The total market value of securities on loan at March 31, 2010 was $5,657 ($ Thousands). |
| (B) | This security was purchased with cash collateral received from securities on loan. The total value of such securities as of March 31, 2010 was $5,548 ($ Thousands). |
| (C) | The rate reported is the effective yield at the time of purchase. |
| (D) | Security, or portion there, has been pledged as collateral on open futures. |
Cl — Class
L.P. — Limited Partnership
Ser — Series
| 5 | SEI Institutional Managed Trust / Semi-Annual Report / March 31, 2010 |
Table of Contents
Schedule of Investments (Unaudited)
U.S. Managed Volatility Fund
March 31, 2010
| Description | Shares | Market Value ($ Thousands) | |||
COMMON STOCK — 95.4% | |||||
Consumer Discretionary — 8.1% | |||||
Aaron Rents | 49,300 | $ | 1,644 | ||
Amazon.com * | 33,471 | 4,543 | |||
Buckle | 27,000 | 992 | |||
Burger King Holdings | 69,900 | 1,486 | |||
Career Education * | 45,300 | 1,433 | |||
Carter’s * | 54,300 | 1,637 | |||
Choice Hotels International | 48,100 | 1,674 | |||
Cinemark Holdings | 86,000 | 1,577 | |||
DIRECTV, Cl A * | 51,900 | 1,755 | |||
Discovery Communications, Cl A * | 52,700 | 1,781 | |||
DreamWorks Animation SKG, Cl A * | 43,500 | 1,713 | |||
GameStop, Cl A * | 21,400 | 469 | |||
Genuine Parts | 24,800 | 1,048 | |||
Gildan Activewear * | 28,600 | 752 | |||
H&R Block | 32,000 | 570 | |||
ITT Educational Services * | 13,800 | 1,552 | |||
John Wiley & Sons, Cl A | 13,300 | 576 | |||
Panera Bread, Cl A * | 11,100 | 849 | |||
Shaw Communications, Cl B | 43,900 | 872 | |||
Strayer Education | 10,371 | 2,526 | |||
Tractor Supply | 30,600 | 1,776 | |||
| 31,225 | |||||
Consumer Staples — 15.1% | |||||
Altria Group | 196,175 | 4,025 | |||
Brown-Forman, Cl B | 73,714 | 4,382 | |||
Campbell Soup | 73,907 | 2,613 | |||
Church & Dwight | 27,100 | 1,814 | |||
Dean Foods * | 75,900 | 1,191 | |||
Flowers Foods | 57,500 | 1,423 | |||
General Mills | 27,400 | 1,940 | |||
Hansen Natural * | 19,400 | 842 | |||
Hershey | 76,186 | 3,261 | |||
Hormel Foods | 147,215 | 6,184 | |||
Kellogg | 32,800 | 1,752 | |||
Kimberly-Clark | 44,866 | 2,821 | |||
Lorillard | 60,366 | 4,542 | |||
McCormick | 39,375 | 1,510 | |||
PepsiCo | 5,642 | 373 | |||
Philip Morris International | 87,091 | 4,543 | |||
Ralcorp Holdings * | 22,600 | 1,532 | |||
Reynolds American | 83,320 | 4,498 | |||
Ruddick | 45,000 | 1,424 | |||
Safeway | 8,383 | 208 | |||
Sara Lee | 69,713 | 971 | |||
SYSCO | 152,839 | 4,509 | |||
Tyson Foods, Cl A | 81,650 | 1,564 | |||
| 57,922 | |||||
Energy — 3.6% | |||||
Chevron | 26,900 | 2,040 | |||
CNX Gas * | 46,500 | 1,769 | |||
ConocoPhillips | 2,273 | 116 | |||
Dresser-Rand Group * | 27,500 | 864 | |||
Enbridge | 36,400 | 1,738 | |||
Exxon Mobil | 29,200 | 1,956 | |||
FMC Technologies * | 25,100 | 1,622 | |||
Murphy Oil | 15,518 | 872 | |||
PetroHawk Energy * | 28,100 | 570 | |||
| Description | Shares | Market Value ($ Thousands) | |||
Teekay Shipping | 34,300 | $ | 780 | ||
TransCanada | 44,300 | 1,629 | |||
| 13,956 | |||||
Financials — 13.6% | |||||
Alexandria Real Estate Equities † | 10,000 | 676 | |||
Alleghany * | 2,040 | 593 | |||
Bancorpsouth | 59,100 | 1,239 | |||
Bank of Hawaii | 95,373 | 4,287 | |||
BOK Financial | 15,311 | 803 | |||
Capitol Federal Financial | 57,298 | 2,147 | |||
Commerce Bancshares | 133,173 | 5,479 | |||
Corporate Office Properties Trust † | 39,700 | 1,593 | |||
Cullen/Frost Bankers | 66,031 | 3,684 | |||
Endurance Specialty Holdings | 38,400 | 1,427 | |||
Erie Indemnity, Cl A | 42,500 | 1,833 | |||
Essex Property Trust † | 19,100 | 1,718 | |||
Federated Investors, Cl B | 58,600 | 1,546 | |||
First Citizens BancShares, Cl A | 11,436 | 2,273 | |||
First Niagara Financial Group | 38,408 | 546 | |||
Health Care † | 36,700 | 1,660 | |||
Hudson City Bancorp | 114,000 | 1,614 | |||
MFA Financial † | 113,400 | 835 | |||
NASDAQ OMX Group * | 30,300 | 640 | |||
National Retail Properties † | 46,100 | 1,052 | |||
Nationwide Health Properties † | 28,900 | 1,016 | |||
People’s United Financial | 194,780 | 3,046 | |||
ProAssurance * | 20,500 | 1,200 | |||
Prosperity Bancshares | 35,600 | 1,459 | |||
Realty Income † | 57,200 | 1,756 | |||
RenaissanceRe Holdings | 30,400 | 1,725 | |||
TFS Financial | 238,535 | 3,185 | |||
UMB Financial | 31,300 | 1,271 | |||
Washington Real Estate Investment Trust † | 51,700 | 1,579 | |||
Wesco Financial | 630 | 243 | |||
| 52,125 | |||||
Health Care — 22.5% | |||||
Abbott Laboratories | 102,280 | 5,388 | |||
Allscripts Healthcare Solutions * | 8,178 | 160 | |||
AmerisourceBergen | 218,226 | 6,311 | |||
Amgen * | 76,076 | 4,546 | |||
Baxter International | 55,195 | 3,212 | |||
Becton Dickinson | 57,460 | 4,524 | |||
Biogen Idec * | 78,674 | 4,513 | |||
C.R. Bard | 49,614 | 4,298 | |||
Cardinal Health | 125,211 | 4,511 | |||
Celgene * | 13,000 | 805 | |||
Edwards Lifesciences * | 19,344 | 1,913 | |||
Eli Lilly | 40,374 | 1,462 | |||
Endo Pharmaceuticals Holdings * | 67,500 | 1,599 | |||
Forest Laboratories * | 123,040 | 3,859 | |||
Genzyme * | 95,329 | 4,941 | |||
Gilead Sciences * | 91,190 | 4,147 | |||
Henry Schein * | 23,226 | 1,368 | |||
Johnson & Johnson | 69,099 | 4,505 | |||
Kinetic Concepts * | 22,800 | 1,090 | |||
Laboratory Corp of America Holdings * | 9,900 | 750 | |||
LifePoint Hospitals * | 19,200 | 706 | |||
McKesson | 98,316 | 6,461 | |||
| 1 | SEI Institutional Managed Trust / Semi-Annual Report / March 31, 2010 |
Table of Contents
Schedule of Investments (Unaudited)
U.S. Managed Volatility Fund
March 31, 2010
| Description | Shares | Market Value ($ Thousands) | |||
Medco Health Solutions * | 8,508 | $ | 549 | ||
Mettler Toledo International * | 5,600 | 611 | |||
Millipore * | 29,987 | 3,167 | |||
Myriad Genetics * | 54,800 | 1,318 | |||
Owens & Minor | 29,500 | 1,369 | |||
Patterson | 57,200 | 1,776 | |||
Perrigo | 17,500 | 1,028 | |||
Techne | 63,609 | 4,051 | |||
United Therapeutics * | 24,300 | 1,345 | |||
| 86,283 | |||||
Industrials — 3.9% | |||||
Alliant Techsystems * | 16,400 | 1,333 | |||
C.H. Robinson Worldwide | 29,300 | 1,636 | |||
Copa Holdings, Cl A | 12,407 | 754 | |||
FTI Consulting * | 27,800 | 1,093 | |||
Gardner Denver | 24,600 | 1,083 | |||
IHS, Cl A * | 10,200 | 545 | |||
KBR | 69,200 | 1,534 | |||
Landstar System | 37,900 | 1,591 | |||
Lennox International | 33,300 | 1,476 | |||
Nordson | 17,400 | 1,182 | |||
Northrop Grumman | 7,284 | 478 | |||
Raytheon | 13,000 | 743 | |||
Rollins | 65,800 | 1,427 | |||
| 14,875 | |||||
Information Technology — 11.2% | |||||
Adtran | 52,100 | 1,373 | |||
Analog Devices | 114,926 | 3,312 | |||
AVX | 47,700 | 677 | |||
Broadcom, Cl A | 1,001 | 33 | |||
Diebold | 23,500 | 747 | |||
eBay * | 1,858 | 50 | |||
Flir Systems * | 18,600 | 525 | |||
Google, Cl A * | 7,534 | 4,272 | |||
Harris | 33,700 | 1,600 | |||
Hewitt Associates, Cl A * | 41,900 | 1,667 | |||
IAC * | 48,620 | 1,106 | |||
Ingram Micro, Cl A * | 94,404 | 1,657 | |||
Intel | 204,628 | 4,555 | |||
International Business Machines | 35,604 | 4,566 | |||
Jabil Circuit | 6,057 | 98 | |||
Lender Processing Services | 16,093 | 607 | |||
Mantech International, Cl A * | 26,200 | 1,279 | |||
Microchip Technology | 33,175 | 934 | |||
NeuStar, Cl A * | 40,700 | 1,026 | |||
SAIC * | 40,450 | 716 | |||
Sybase * | 36,800 | 1,716 | |||
Tech Data * | 94,708 | 3,968 | |||
Texas Instruments | 169,858 | 4,157 | |||
Xilinx | 63,967 | 1,631 | |||
Zebra Technologies, Cl A * | 21,300 | 630 | |||
| 42,902 | |||||
Materials — 3.2% | |||||
Aptargroup | 37,800 | 1,488 | |||
Compass Minerals International | 19,000 | 1,524 | |||
Greif, Cl A | 22,600 | 1,241 | |||
Intrepid Potash * | 43,600 | 1,323 | |||
Newmont Mining | 69,372 | 3,533 | |||
Sensient Technologies | 53,000 | 1,540 | |||
| Description | Shares/Face Amount ($ Thousands) | Market Value ($ Thousands) | ||||
Silgan Holdings | 26,300 | $ | 1,584 | |||
| 12,233 | ||||||
Telecommunication Services — 2.5% | ||||||
AT&T | 79,900 | 2,065 | ||||
BCE | 54,000 | 1,585 | ||||
MetroPCS Communications * | 189,500 | 1,341 | ||||
Rogers Communications, Cl B | 59,300 | 2,024 | ||||
SBA Communications, Cl A * | 21,400 | 772 | ||||
Verizon Communications | 60,330 | 1,871 | ||||
| 9,658 | ||||||
Utilities — 11.7% | ||||||
AGL Resources | 82,355 | 3,183 | ||||
Alliant Energy | 50,200 | 1,670 | ||||
Atmos Energy | 125,435 | 3,584 | ||||
Consolidated Edison | 39,300 | 1,750 | ||||
DTE Energy | 35,500 | 1,583 | ||||
Edison International | 46,700 | 1,596 | ||||
Energen | 35,900 | 1,670 | ||||
Hawaiian Electric Industries | 35,500 | 797 | ||||
Idacorp | 42,700 | 1,478 | ||||
Nicor | 96,596 | 4,049 | ||||
NSTAR | 98,046 | 3,473 | ||||
OGE Energy | 45,900 | 1,787 | ||||
Pepco Holdings | 60,200 | 1,033 | ||||
PG&E | 15,500 | 658 | ||||
Piedmont Natural Gas | 53,200 | 1,467 | ||||
PPL | 49,011 | 1,358 | ||||
SCANA | 20,706 | 778 | ||||
TECO Energy | 105,800 | 1,681 | ||||
UGI | 92,584 | 2,457 | ||||
Vectren | 105,405 | 2,606 | ||||
WGL Holdings | 40,100 | 1,390 | ||||
Wisconsin Energy | 94,324 | 4,661 | ||||
| 44,709 | ||||||
Total Common Stock | 365,888 | |||||
CASH EQUIVALENT — 2.6% | ||||||
SEI Daily Income Trust, Prime Obligation Fund, Cl A, 0.070%**†† | 9,834,857 | 9,835 | ||||
Total Cash Equivalent | 9,835 | |||||
U.S. TREASURY OBLIGATIONS — 0.2% | ||||||
U.S. Treasury Bills | ||||||
0.112%, 06/03/10 (A) (B) | $ | 829 | 829 | |||
U.S. Cash Management Bill | ||||||
0.000%, 06/10/10 (B) | 59 | 59 | ||||
Total U.S. Treasury Obligations | 888 | |||||
Total Investments — 98.2% | $ | 376,611 | ||||
| 2 | SEI Institutional Managed Trust / Semi-Annual Report / March 31, 2010 |
Table of Contents
Schedule of Investments (Unaudited)
U.S. Managed Volatility Fund
March 31, 2010
A summary of the open futures contracts held by the Fund at March 31, 2010, is as follows:
| Type of Contract | Number of Contracts Long (Short) | Expiration Date | Unrealized Appreciation ($ Thousands) | ||||
S&P 500 Index E- MINI | 182 | Jun-2010 | $ | 90 | |||
For the period ended March 31, 2010, the total amount of all open futures contracts, as presented in the table above, are representative of the volume of activity for this derivative type during the period.
Percentages are based on Net Assets of $383,651 ($ Thousands).
| * | Non-income producing security. |
| ** | Rate shown is the 7-day effective yield as of March 31, 2010. |
| † | Real Estate Investment Trust. |
| †† | Investment in Affiliated Security. |
| (A) | The rate reported is the effective yield at the time of purchase. |
| (B) | Security, or portion thereof, has been pledged as collateral on open futures. |
Cl — Class
| 3 | SEI Institutional Managed Trust / Semi-Annual Report / March 31, 2010 |
Table of Contents
Schedule of Investments (Unaudited)
Global Managed Volatility Fund
March 31, 2010
| Description | Shares | Market Value ($ Thousands) | |||
COMMON STOCK—94.2% | |||||
Australia—5.1% | |||||
AGL Energy | 14,711 | $ | 203 | ||
Amcor | 82,898 | 486 | |||
Australia & New Zealand Banking Group | 18,141 | 422 | |||
Cape Lambert Resources * | 206,463 | 93 | |||
Centennial Coal | 107,804 | 422 | |||
CFS Retail Property Trust † | 91,638 | 158 | |||
Coal & Allied Industries | 7,478 | 617 | |||
CSL | 23,427 | 783 | |||
Decmil Group * | 77,458 | 113 | |||
Forge Group | 4,334 | 12 | |||
Foster’s Group | 201,593 | 979 | |||
Gujarat NRE Coking Coal * | 24,727 | 16 | |||
McPherson’s | 16,139 | 46 | |||
Metcash | 96,419 | 367 | |||
Mount Gibson Iron * | 56,386 | 97 | |||
Origin Energy | 101,311 | 1,539 | |||
RHG * | 89,178 | 50 | |||
Silver Lake Resources * | 34,271 | 39 | |||
Specialty Fashion Group | 19,378 | 27 | |||
TABCORP Holdings | 292,471 | 1,852 | |||
Tatts Group | 719,343 | 1,624 | |||
Telstra | 29,975 | 82 | |||
Wesfarmers | 112,832 | 3,298 | |||
| 13,325 | |||||
Belgium—2.1% | |||||
Belgacom | 23,111 | 904 | |||
Cofinimmo † | 2,631 | 372 | |||
Colruyt | 11,515 | 2,840 | |||
Delhaize Group | 814 | 65 | |||
Intervest Offices † | 868 | 28 | |||
Mobistar | 21,195 | 1,307 | |||
| 5,516 | |||||
Canada—11.8% | |||||
Aastra Technologies | 1,100 | 35 | |||
Alimentation Couche Tard, Cl B | 177,900 | 3,246 | |||
BCE | 103,400 | 3,039 | |||
Canadian Tire, Cl A | 4,000 | 219 | |||
Canadian Utilities, Cl A | 9,700 | 469 | |||
Cash Store Financial Services | 3,100 | 46 | |||
CGI Group, Cl A * | 138,500 | 2,075 | |||
Cott * | 20,000 | 156 | |||
Empire, Cl A | 36,200 | 1,880 | |||
Enbridge | 52,200 | 2,492 | |||
Fairfax Financial Holdings | 600 | 226 | |||
Fortis | 38,200 | 1,088 | |||
Garda World Security, Cl A * | 18,000 | 191 | |||
Genworth MI Canada | 3,431 | 93 | |||
George Weston | 20,900 | 1,445 | |||
Goldcorp | 50,700 | 1,897 | |||
Laurentian Bank of Canada | 22,200 | 943 | |||
MacDonald Dettwiler & Associates * | 2,800 | 104 | |||
Manitoba Telecom Services | 22,300 | 701 | |||
Metro, Cl A | 46,200 | 1,917 | |||
National Bank of Canada | 11,700 | 713 | |||
Provident Energy Trust | 17,200 | 134 | |||
Rogers Communications, Cl B | 34,200 | 1,169 | |||
| Description | Shares | Market Value ($ Thousands) | |||
Royal Bank of Canada | 7,500 | $ | 440 | ||
Saputo | 100,700 | 2,936 | |||
Shoppers Drug Mart | 27,500 | 1,183 | |||
SXC Health Solutions * | 1,356 | 91 | |||
TMX Group | 13,100 | 386 | |||
Toronto-Dominion Bank | 16,100 | 1,201 | |||
West Energy * | 13,000 | 64 | |||
| 30,579 | |||||
Cayman Islands—0.0% | |||||
Hutchison Telecommunications International * | 51,000 | 14 | |||
Pacific Textile Holdings | 144,000 | 91 | |||
| 105 | |||||
Denmark—1.7% | |||||
Coloplast, Cl B | 18,992 | 2,095 | |||
Novo Nordisk, Cl B | 29,483 | 2,292 | |||
| 4,387 | |||||
Finland—0.9% | |||||
Componenta | 2,696 | 16 | |||
Oriola-KD | 19,184 | 126 | |||
Orion, Cl B | 67,842 | 1,504 | |||
Tietoenator | 23,696 | 550 | |||
| 2,196 | |||||
France—1.9% | |||||
Boiron | 5,001 | 213 | |||
Bonduelle S.C.A. | 533 | 60 | |||
France Telecom | 69,456 | 1,665 | |||
PagesJaunes Groupe | 856 | 10 | |||
Sanofi-Aventis | 16,432 | 1,227 | |||
Societe BIC | 23,393 | 1,794 | |||
| 4,969 | |||||
Germany—1.7% | |||||
Balda * | 29,337 | 133 | |||
Beiersdorf | 16,959 | 1,016 | |||
Deutsche Telekom | 87,769 | 1,192 | |||
Hannover Rueckversicherung | 4,272 | 211 | |||
Hornbach Holding | 313 | 34 | |||
Software | 9,486 | 1,132 | |||
Suedzucker | 26,720 | 591 | |||
| 4,309 | |||||
Greece—0.1% | |||||
Public Power | 12,644 | 222 | |||
Hong Kong—2.7% | |||||
Cheung Kong Infrastructure Holdings | 78,000 | 302 | |||
CLP Holdings | 470,500 | 3,363 | |||
HongKong Electric Holdings | 399,500 | 2,369 | |||
Link † | 369,500 | 911 | |||
NAM TAI Electronics * | 16,900 | 85 | |||
| 7,030 | |||||
Ireland—0.4% | |||||
Kerry Group, Cl A | 2,259 | 70 | |||
Warner Chilcott, Cl A * | 41,411 | 1,058 | |||
| 1,128 | |||||
Italy—2.2% | |||||
CSP International Fashion Group | 6,238 | 8 | |||
| 1 | SEI Institutional Managed Trust / Semi-Annual Report / March 31, 2010 |
Table of Contents
Schedule of Investments (Unaudited)
Global Managed Volatility Fund
March 31, 2010
| Description | Shares | Market Value ($ Thousands) | |||
DiaSorin | 15,198 | $ | 573 | ||
Parmalat | 397,107 | 1,089 | |||
Snam Rete Gas | 677,461 | 3,440 | |||
Terna Rete Elettrica Nazionale | 133,119 | 577 | |||
| 5,687 | |||||
Japan—21.1% | |||||
77 Bank | 25,000 | 143 | |||
ABC-Mart | 18,100 | 579 | |||
Able | 3,000 | 24 | |||
Adores | 12,000 | 22 | |||
Ain Pharmaciez | 1,200 | 35 | |||
Aisin Seiki | 20,700 | 620 | |||
Ajis | 1,300 | 21 | |||
Amiyaki Tei | 13 | 37 | |||
Asahi Breweries | 133,700 | 2,508 | |||
Bank of Kyoto | 35,000 | 322 | |||
Benesse | 36,200 | 1,569 | |||
BML | 2,800 | 71 | |||
Chubu Electric Power | 94,700 | 2,368 | |||
Chugoku Bank | 13,000 | 176 | |||
Combi | 9,500 | 71 | |||
Dainippon Sumitomo Pharma | 153,900 | 1,412 | |||
Doshisha | 2,400 | 62 | |||
Faith | 242 | 29 | |||
FamilyMart | 30,700 | 978 | |||
Fuji | 1,900 | 37 | |||
Fuji Electric Holdings | 789,000 | 2,153 | |||
Fuji Oil | 77,500 | 1,096 | |||
FUJI SOFT | 8,000 | 134 | |||
Fukuyama Transporting | 71,000 | 355 | |||
Hachijuni Bank | 34,000 | 194 | |||
Haruyama Trading | 2,000 | 9 | |||
Hazama | 14,000 | 12 | |||
Hibiya Engineering | 2,500 | 22 | |||
Hokkaido Electric Power | 6,500 | 125 | |||
Hokuriku Electric Power | 38,500 | 847 | |||
Iida Home Max | 1,900 | 31 | |||
Ito En | 40,800 | 632 | |||
Itochu Techno-Solutions | 3,700 | 122 | |||
Iyo Bank | 47,000 | 447 | |||
Kagawa Bank | 10,000 | 34 | |||
Kamigumi | 115,000 | 925 | |||
Kansai Electric Power | 105,100 | 2,409 | |||
Kansai Paint | 32,000 | 261 | |||
KDDI | 93 | 482 | |||
Keihin Electric Express Railway | 174,000 | 1,430 | |||
Kintetsu | 115,000 | 358 | |||
Koito Manufacturing | 73,000 | 1,085 | |||
Kojima | 20,300 | 182 | |||
Kokuyo | 27,300 | 227 | |||
Komatsu Seiren | 5,000 | 20 | |||
Kyushu Electric Power | 70,600 | 1,538 | |||
Lawson | 47,400 | 2,024 | |||
Lion | 167,000 | 842 | |||
Mabuchi Motor | 200 | 11 | |||
Marudai Food | 82,000 | 234 | |||
Maruzen Showa Unyu | 7,000 | 26 | |||
McDonald’s Holdings Japan | 8,000 | 163 | |||
Miraca Holdings | 24,500 | 747 | |||
Morinaga Milk Industry | 83,025 | 327 | |||
MOS Food Services | 2,000 | 33 | |||
| Description | Shares | Market Value ($ Thousands) | |||
NEC Mobiling | 1,700 | $ | 41 | ||
NET One Systems | 107 | 136 | |||
Nichirei | 45,000 | 168 | |||
Nihon Shokuhin Kako | 7,000 | 47 | |||
Nippon Express | 33,000 | 142 | |||
Nippon Meat Packers | 35,000 | 443 | |||
Nippon Telegraph & Telephone | 28,100 | 1,185 | |||
Nippon Television Network | 2,520 | 343 | |||
Nishi-Nippon City Bank | 50,000 | 148 | |||
Nisshin Seifun Group | 30,500 | 394 | |||
Nitori | 17,000 | 1,292 | |||
Noevir | 4,800 | 50 | |||
NTT DoCoMo | 2,415 | 3,680 | |||
Ohsho Food Service | 3,400 | 89 | |||
Oita Bank | 33,082 | 122 | |||
Okumura | 68,000 | 238 | |||
Ono Pharmaceutical | 3,400 | 151 | |||
Oracle Japan | 3,900 | 181 | |||
Oriental Land | 3,600 | 251 | |||
Oriental Yeast | 3,000 | 14 | |||
Osaka Gas | 78,000 | 280 | |||
Prima Meat Packers | 145,000 | 154 | |||
Rinnai | 5,600 | 294 | |||
Ryoshoku | 3,000 | 70 | |||
Sankyo | 31,200 | 1,544 | |||
Santen Pharmaceutical | 16,500 | 496 | |||
Shikoku Electric Power | 35,500 | 1,006 | |||
Shimachu | 4,800 | 102 | |||
Shinkin Central Bank | 18 | 31 | |||
Shizuoka Gas | 46,500 | 266 | |||
Sogo Medical | 4,600 | 101 | |||
Studio Alice | 10,500 | 94 | |||
Taisho Pharmaceutical | 1,000 | 18 | |||
Takeda Pharmaceutical | 19,900 | 876 | |||
Tobu Railway | 177,000 | 983 | |||
Toho Gas | 268,000 | 1,463 | |||
Tohoku Electric Power | 1,700 | 36 | |||
Tokyo Electric Power | 47,800 | 1,275 | |||
Tokyo Gas | 267,000 | 1,177 | |||
Tokyo Style | 5,000 | 35 | |||
TonenGeneral Sekiyu | 36,000 | 304 | |||
Toyo Suisan Kaisha | 11,000 | 285 | |||
Trancom | 1,300 | 22 | |||
Tsumura | 3,100 | 90 | |||
Unicharm | 11,200 | 1,082 | |||
Wacoal Holdings | 48,000 | 600 | |||
Yamato Holdings | 117,100 | 1,647 | |||
Yamazaki Baking | 54,000 | 669 | |||
| 54,736 | |||||
Luxembourg—0.2% | |||||
ArcelorMittal | 9,662 | 423 | |||
Netherlands—1.0% | |||||
Royal Dutch Shell, Cl A | 41,098 | 1,191 | |||
Royal KPN | 71,768 | 1,139 | |||
Teleplan International * | 116,145 | 359 | |||
| 2,689 | |||||
New Zealand—0.0% | |||||
Auckland International Airport | 15,257 | 21 | |||
Fisher & Paykel Healthcare | 24,293 | 57 | |||
| 2 | SEI Institutional Managed Trust / Semi-Annual Report / March 31, 2010 |
Table of Contents
Schedule of Investments (Unaudited)
Global Managed Volatility Fund
March 31, 2010
| Description | Shares | Market Value ($ Thousands) | |||
Restaurant Brands New Zealand | 21,157 | $ | 30 | ||
| 108 | |||||
Singapore—0.1% | |||||
Broadway Industrial Group * | 191,000 | 130 | |||
Spain—0.4% | |||||
Telefonica | 43,681 | 1,037 | |||
Sweden—1.2% | |||||
Electrolux | 107,721 | 2,469 | |||
Investor, Cl B | 33,508 | 645 | |||
| 3,114 | |||||
Switzerland—1.5% | |||||
Bell Holding | 13 | 20 | |||
Emmi | 489 | 69 | |||
LifeWatch * | 199 | 3 | |||
Nestle | 24,211 | 1,242 | |||
Novartis | 27,245 | 1,474 | |||
Schindler Holding | 460 | 40 | |||
Synthes | 7,189 | 899 | |||
| 3,747 | |||||
United Kingdom—6.4% | |||||
Associated British Foods | 38,987 | 579 | |||
AstraZeneca | 90,347 | 4,028 | |||
BAE Systems | 249,721 | 1,406 | |||
BP | 444,355 | 4,202 | |||
Fiberweb | 4,598 | 4 | |||
GlaxoSmithKline | 25,705 | 493 | |||
Imperial Tobacco Group | 12,919 | 394 | |||
JD Sports Fashion | 2,922 | 29 | |||
LSL Property Services | 9,779 | 45 | |||
Mcbride | 13,930 | 48 | |||
Rank Group | 56,915 | 101 | |||
Reckitt Benckiser Group | 59,547 | 3,267 | |||
Robert Wiseman Dairies | 15,028 | 113 | |||
Smith & Nephew | 76,581 | 763 | |||
TUI Travel | 70,749 | 324 | |||
WM Morrison Supermarkets | 187,424 | 834 | |||
| 16,630 | |||||
United States—31.7% | |||||
Abbott Laboratories | 49,000 | 2,581 | |||
Alaska Air Group * | 14,300 | 590 | |||
Allied Healthcare International * | 8,200 | 22 | |||
Altria Group | 58,348 | 1,198 | |||
American Italian Pasta, Cl A * | 4,210 | 164 | |||
AmerisourceBergen | 22,145 | 640 | |||
Amgen * | 30,289 | 1,810 | |||
Annaly Capital Management † | 171,800 | 2,952 | |||
Apollo Group, Cl A * | 13,681 | 839 | |||
Archer-Daniels-Midland | 38,100 | 1,101 | |||
AT&T | 45,111 | 1,166 | |||
Bristol-Myers Squibb | 45,100 | 1,204 | |||
C.R. Bard | 30,700 | 2,659 | |||
Campbell Soup | 67,969 | 2,403 | |||
Capella Education * | 13,382 | 1,242 | |||
Career Education * | 5,693 | 180 | |||
Cephalon * | 14,608 | 990 | |||
Chevron | 16,058 | 1,218 | |||
Clorox | 40,200 | 2,579 | |||
| Description | Shares | Market Value ($ Thousands) | |||
Compass Minerals International | 3,655 | $ | 293 | ||
Constellation Energy Group | 56,400 | 1,980 | |||
Corinthian Colleges * | 12,741 | 224 | |||
Coventry Health Care * | 100 | 2 | |||
Del Monte Foods | 15,623 | 228 | |||
DeVry | 8,658 | 564 | |||
Dollar Tree * | 12,207 | 723 | |||
Dun & Bradstreet | 6,900 | 514 | |||
Dynamics Research * | 6,300 | 71 | |||
Emergency Medical Services, Cl A * | 7,676 | 434 | |||
Endo Pharmaceuticals Holdings * | 15,025 | 356 | |||
ePlus * | 1,500 | 26 | |||
Exxon Mobil | 17,845 | 1,195 | |||
Family Dollar Stores | 80,949 | 2,963 | |||
Forest Laboratories * | 38,600 | 1,211 | |||
General Mills | 45,900 | 3,249 | |||
Gilead Sciences * | 23,147 | 1,053 | |||
Haverty Furniture | 2,100 | 34 | |||
Hormel Foods | 64,281 | 2,701 | |||
Insmed * | 260,759 | 308 | |||
International Business Machines | 9,500 | 1,218 | |||
International Shipholding | 20,260 | 595 | |||
ITT Educational Services * | 7,582 | 853 | |||
John B. Sanfilippo & Son * | 7,000 | 103 | |||
Johnson & Johnson | 18,600 | 1,213 | |||
Kimberly-Clark | 25,626 | 1,611 | |||
Kinder Morgan Management * | 65 | 4 | |||
Kirkland’s * | 2,553 | 53 | |||
Lancaster Colony | 17,625 | 1,039 | |||
Lincoln Educational Services * | 33,540 | 849 | |||
Lorillard | 25,640 | 1,929 | |||
Magellan Health Services * | 34,700 | 1,509 | |||
Mantech International, Cl A * | 11,447 | 559 | |||
MCG Capital * | 6,600 | 34 | |||
Medco Health Solutions * | 20,500 | 1,324 | |||
Metropolitan Health Networks * | 22,529 | 73 | |||
Microsoft | 31,724 | 929 | |||
Miller Industries | 13,342 | 166 | |||
Mylan Laboratories * | 53,778 | 1,221 | |||
Odyssey HealthCare * | 29,054 | 526 | |||
Par Pharmaceutical * | 43,241 | 1,072 | |||
Perrigo | 7,226 | 424 | |||
Pfizer | 63,500 | 1,089 | |||
PG&E | 21,400 | 908 | |||
Pinnacle Airlines * | 6,723 | 50 | |||
Procter & Gamble | 20,000 | 1,265 | |||
Protection One * | 4,988 | 57 | |||
Providence Service * | 24,903 | 378 | |||
Radio One, Cl D * | 23,046 | 70 | |||
Raytheon | 50,800 | 2,902 | |||
Reynolds American | 7,800 | 421 | |||
Ross Stores | 23,600 | 1,262 | |||
Rural * | 21,721 | 158 | |||
SAIC * | 63,100 | 1,117 | |||
Santarus * | 16,896 | 91 | |||
Seneca Foods, Cl A * | 24,525 | 714 | |||
Sturm Ruger | 7,806 | 94 | |||
Sunoco Logistics Partners | 1,062 | 73 | |||
Tessco Technologies | 1,531 | 36 | |||
TJX | 61,000 | 2,594 | |||
TreeHouse Foods * | 24,643 | 1,081 | |||
| 3 | SEI Institutional Managed Trust / Semi-Annual Report / March 31, 2010 |
Table of Contents
Schedule of Investments (Unaudited)
Global Managed Volatility Fund
March 31, 2010
| Description | Shares/Face Amount ($ Thousands) | Market Value ($ Thousands) | ||||
UnitedHealth Group | 6,265 | $ | 205 | |||
Viropharma * | 28,127 | 383 | ||||
Wal-Mart Stores | 66,600 | 3,703 | ||||
Watson Pharmaceuticals * | 11,600 | 485 | ||||
West Marine * | 25,618 | 278 | ||||
Western Digital * | 35,600 | 1,388 | ||||
World Fuel Services | 20,503 | 546 | ||||
| 82,319 | ||||||
Total Common Stock | 244,386 | |||||
CASH EQUIVALENT—4.3% | ||||||
SEI Daily Income Trust, Prime Obligation Fund, Cl A, 0.070%**†† | 11,262,948 | 11,263 | ||||
Total Cash Equivalent | 11,263 | |||||
U.S. TREASURY OBLIGATIONS — 0.4% | ||||||
U.S. Treasury Bills | ||||||
0.137%, 06/03/10 (A) (B) | $ | 928 | 928 | |||
U.S. Cash Management Bills | ||||||
0.000%, 06/10/10 (B) | 55 | 55 | ||||
Total U.S. Treasury Obligations | 983 | |||||
Total Investments — 98.9% | $ | 256,632 | ||||
A summary of the open futures contracts held by the Fund at March 31, 2010, is as follows:
| Type of Contract | Number of Contracts Long (Short) | Expiration Date | Unrealized Appreciation ($ Thousands) | ||||
DJ Euro Stoxx 50 | |||||||
Index | 47 | Jun-2010 | $ | 13 | |||
FTSE 100 Index | 15 | Jun-2010 | 8 | ||||
Hang Seng Index | 1 | Apr-2010 | 1 | ||||
S&P 500 Composite | |||||||
Index | 17 | Jun-2000 | 68 | ||||
SPI 200 Index | 3 | Jun-2010 | 1 | ||||
| $ | 91 | ||||||
For the period ended March 31, 2010, the total amount of all open futures contracts, as presented in the table above, are representative of the volume of activity for the derivative type during the period.
A summary of the outstanding forward foreign currency contracts held by the Fund at March 31, 2010, is as follows:
| Maturity Date | Currency to Deliver (Thousands) | Currency to Receive (Thousands) | Unrealized Appreciation (Depreciation) ($ Thousands) | |||||||||
4/28/10 | AUD | 12,539 | USD | 11,299 | $ | (175 | ) | |||||
4/28/10 | CAD | 33,388 | USD | 32,475 | (441 | ) | ||||||
4/28/10 | EUR | 27,674 | USD | 37,084 | (358 | ) | ||||||
4/28/10 | GBP | 11,582 | USD | 17,257 | (307 | ) | ||||||
4/28/10 | JPY | 5,751,491 | USD | 62,147 | 574 | |||||||
4/28/10 | USD | 153 | AUD | 167 | 1 | |||||||
4/28/10 | USD | 323 | CAD | 329 | 1 | |||||||
4/28/10 | USD | 539 | EUR | 400 | 2 | |||||||
4/28/10 | USD | 209 | GBP | 139 | 2 | |||||||
4/28/10 | USD | 76 | JPY | 7,046 | (1 | ) | ||||||
| $ | (702 | ) | ||||||||||
Percentages are based on Net Assets of $259,365 ($ Thousands).
| * | Non-income producing security. |
| ** | Rate shown is the 7-day effective yield as of March 31, 2010. |
| † | Real Estate Investment Trust. |
| †† | Investment in Affiliated Security. |
| (A) | The rate reported is the effective yield at the time of purchase. |
| (B) | Security, or portion thereof, has been pledged as collateral on open futures. |
AUD — Australian Dollar
CAD — Canadian Dollar
Cl — Class
EUR — Euro
GBP — British Pound Sterling
JPY — Japanese Yen
USD — United States Dollar
| 4 | SEI Institutional Managed Trust / Semi-Annual Report / March 31, 2010 |
Table of Contents
Schedule of Investments (Unaudited)
Tax-Managed Managed Volatility Fund
March 31, 2010
| Description | Shares | Market Value ($ Thousands) | |||
COMMON STOCK — 95.9% | |||||
Consumer Discretionary — 7.9% | |||||
Aaron Rents | 17,300 | $ | 577 | ||
Autoliv | 8,000 | 412 | |||
Buckle | 8,800 | 324 | |||
Burger King Holdings | 33,100 | 704 | |||
Career Education * | 26,000 | 823 | |||
Carter’s * | 27,700 | 835 | |||
Choice Hotels International | 18,600 | 647 | |||
Cinemark Holdings | 43,300 | 794 | |||
DIRECTV, Cl A * | 26,400 | 893 | |||
Discovery Communications, Cl A * | 24,600 | 831 | |||
DreamWorks Animation SKG, Cl A * | 18,400 | 725 | |||
GameStop, Cl A * | 23,200 | 508 | |||
Genuine Parts | 20,100 | 849 | |||
Gildan Activewear * | 17,100 | 450 | |||
Hillenbrand | 24,129 | 530 | |||
ITT Educational Services * | 6,700 | 753 | |||
John Wiley & Sons, Cl A | 7,900 | 342 | |||
Panera Bread, Cl A * | 7,400 | 566 | |||
priceline.com * | 10,422 | 2,658 | |||
Shaw Communications, Cl B | 23,700 | 471 | |||
Strayer Education | 1,600 | 390 | |||
Tractor Supply | 12,700 | 737 | |||
| 15,819 | |||||
Consumer Staples — 22.7% | |||||
Altria Group | 115,481 | 2,370 | |||
Brown-Forman, Cl B | 25,558 | 1,519 | |||
Campbell Soup | 32,391 | 1,145 | |||
Church & Dwight | 42,119 | 2,820 | |||
Clorox | 15,349 | 984 | |||
Coca-Cola | 33,334 | 1,833 | |||
Colgate-Palmolive | 28,403 | 2,422 | |||
Dean Foods * | 39,600 | 621 | |||
Flowers Foods | 28,100 | 695 | |||
General Mills | 43,826 | 3,103 | |||
Hansen Natural * | 12,100 | 525 | |||
Hershey | 33,694 | 1,442 | |||
HJ Heinz | 25,538 | 1,165 | |||
Hormel Foods | 58,497 | 2,458 | |||
JM Smucker | 27,275 | 1,644 | |||
Kellogg | 53,143 | 2,839 | |||
Kimberly-Clark | 43,911 | 2,761 | |||
Kroger | 3,751 | 81 | |||
Lorillard | 31,111 | 2,341 | |||
McCormick | 41,483 | 1,591 | |||
PepsiCo | 17,439 | 1,154 | |||
Philip Morris International | 43,777 | 2,283 | |||
Procter & Gamble | 28,324 | 1,792 | |||
Ralcorp Holdings * | 11,700 | 793 | |||
Reynolds American | 45,068 | 2,433 | |||
Ruddick | 21,900 | 693 | |||
Wal-Mart Stores | 33,220 | 1,847 | |||
| 45,354 | |||||
Energy — 3.7% | |||||
Chevron | 12,400 | 941 | |||
CNX Gas * | 26,600 | 1,012 | |||
Dresser-Rand Group * | 14,800 | 465 | |||
Enbridge | 18,300 | 874 | |||
| Description | Shares | Market Value ($ Thousands) | |||
Exxon Mobil | 13,300 | $ | 891 | ||
FMC Technologies * | 11,700 | 756 | |||
Murphy Oil | 7,800 | 438 | |||
PetroHawk Energy * | 18,300 | 371 | |||
SEACOR Holdings * | 3,500 | 282 | |||
Teekay Shipping | 23,700 | 539 | |||
TransCanada | 22,500 | 827 | |||
| 7,396 | |||||
Financials — 13.1% | |||||
Alexandria Real Estate Equities † | 6,300 | 426 | |||
Alleghany * | 1,224 | 356 | |||
Bancorpsouth | 27,200 | 570 | |||
Capitol Federal Financial | 69,452 | 2,602 | |||
Commerce Bancshares | 47,924 | 1,972 | |||
Corporate Office Properties Trust † | 18,000 | 722 | |||
Endurance Specialty Holdings | 21,000 | 780 | |||
Erie Indemnity, Cl A | 16,600 | 716 | |||
Essex Property Trust † | 9,500 | 855 | |||
Federated Investors, Cl B | 28,300 | 747 | |||
First Citizens BancShares, Cl A | 3,900 | 775 | |||
Health Care † | 19,100 | 864 | |||
Hudson City Bancorp | 59,100 | 837 | |||
MFA Financial † | 43,700 | 322 | |||
NASDAQ OMX Group * | 20,500 | 433 | |||
National Retail Properties † | 24,800 | 566 | |||
Nationwide Health Properties † | 23,000 | 808 | |||
PartnerRe | 4,000 | 319 | |||
People’s United Financial | 133,778 | 2,092 | |||
Platinum Underwriters Holdings | 7,100 | 263 | |||
ProAssurance * | 12,500 | 732 | |||
Prosperity Bancshares | 17,500 | 717 | |||
Realty Income † | 27,500 | 844 | |||
RenaissanceRe Holdings | 13,100 | 744 | |||
TFS Financial | 234,620 | 3,132 | |||
UMB Financial | 13,500 | 548 | |||
Washington Real Estate Investment Trust † | 24,100 | 736 | |||
Wesco Financial | 4,402 | 1,697 | |||
| 26,175 | |||||
Health Care — 15.8% | |||||
Abbott Laboratories | 40,451 | 2,131 | |||
Allscripts Healthcare Solutions * | 125,429 | 2,454 | |||
AmerisourceBergen | 92,948 | 2,688 | |||
Becton Dickinson | 10,075 | 793 | |||
C.R. Bard | 14,896 | 1,290 | |||
Celgene * | 4,500 | 279 | |||
Dentsply International | 47,105 | 1,642 | |||
Edwards Lifesciences * | 15,744 | 1,557 | |||
Eli Lilly | 23,462 | 850 | |||
Endo Pharmaceuticals Holdings * | 33,600 | 796 | |||
Genzyme * | 15,100 | 783 | |||
Henry Schein * | 36,204 | 2,132 | |||
Idexx Laboratories * | 34,700 | 1,997 | |||
Johnson & Johnson | 31,109 | 2,028 | |||
Kinetic Concepts * | 14,400 | 688 | |||
Laboratory Corp of America Holdings * | 18,250 | 1,382 | |||
LifePoint Hospitals * | 11,200 | 412 | |||
McKesson | 13,900 | 913 | |||
Mettler Toledo International * | 2,700 | 295 | |||
| 1 | SEI Institutional Managed Trust / Semi-Annual Report / March 31, 2010 |
Table of Contents
Schedule of Investments (Unaudited)
Tax-Managed Managed Volatility Fund
March 31, 2010
| Description | Shares | Market Value ($ Thousands) | |||
Myriad Genetics * | 30,100 | $ | 724 | ||
Owens & Minor | 16,400 | 761 | |||
Patterson | 28,700 | 891 | |||
Perrigo | 10,100 | 593 | |||
Pfizer | 41,574 | 713 | |||
Quest Diagnostics | 9,259 | 540 | |||
Techne | 24,870 | 1,584 | |||
United Therapeutics * | 13,600 | 752 | |||
| 31,668 | |||||
Industrials — 5.5% | |||||
Alliant Techsystems * | 8,600 | 699 | |||
C.H. Robinson Worldwide | 13,100 | 732 | |||
Dun & Bradstreet | 18,905 | 1,407 | |||
FTI Consulting * | 16,400 | 645 | |||
Gardner Denver | 14,400 | 634 | |||
IHS, Cl A * | 6,100 | 326 | |||
KBR | 31,300 | 693 | |||
Landstar System | 16,500 | 693 | |||
Lennox International | 18,600 | 824 | |||
Nordson | 7,700 | 523 | |||
Raytheon | 10,200 | 583 | |||
Rollins | 29,800 | 646 | |||
Stericycle * | 37,446 | 2,041 | |||
United Parcel Service, Cl B | 9,255 | 596 | |||
| 11,042 | |||||
Information Technology — 9.5% | |||||
Adtran | 24,500 | 645 | |||
Applied Materials | 35,958 | 485 | |||
Automatic Data Processing | 5,200 | 231 | |||
AVX | 22,200 | 315 | |||
Cree * | 20,029 | 1,406 | |||
Diebold | 31,849 | 1,012 | |||
Flir Systems * | 10,200 | 288 | |||
Google, Cl A * | 4,572 | 2,592 | |||
Harris | 14,000 | 665 | |||
Hewitt Associates, Cl A * | 16,800 | 668 | |||
IAC * | 102,041 | 2,321 | |||
Ingram Micro, Cl A * | 41,500 | 728 | |||
Linear Technology | 12,871 | 364 | |||
Mantech International, Cl A * | 13,000 | 635 | |||
Microchip Technology | 33,447 | 942 | |||
National Instruments | 12,748 | 425 | |||
NeuStar, Cl A * | 23,600 | 595 | |||
SAIC * | 19,400 | 344 | |||
Sybase * | 19,800 | 923 | |||
Tech Data * | 34,512 | 1,446 | |||
WebMD Health, Cl A * | 9,696 | 450 | |||
Zebra Technologies, Cl A * | 48,247 | 1,428 | |||
| 18,908 | |||||
Materials — 3.8% | |||||
Aptargroup | 15,400 | 606 | |||
Compass Minerals International | 9,800 | 786 | |||
Greif, Cl A | 12,700 | 697 | |||
Intrepid Potash * | 27,500 | 834 | |||
Newmont Mining | 45,183 | 2,301 | |||
Reliance Steel & Aluminum | 6,000 | 296 | |||
Royal Gold | 16,142 | 746 | |||
Sensient Technologies | 19,100 | 555 | |||
Silgan Holdings | 12,400 | 747 | |||
| 7,568 | |||||
| Description | Shares/Face Amount ($ Thousands) | Market Value ($ Thousands) | ||||
Telecommunication Services — 2.7% | ||||||
AT&T | 37,900 | $ | 979 | |||
BCE | 20,700 | 608 | ||||
CenturyTel | 19,103 | 677 | ||||
MetroPCS Communications * | 111,300 | 788 | ||||
Rogers Communications, Cl B | 25,200 | 860 | ||||
SBA Communications, Cl A * | 9,700 | 350 | ||||
Telephone & Data Systems | 4,700 | 159 | ||||
Verizon Communications | 30,300 | 940 | ||||
| 5,361 | ||||||
Utilities — 11.2% | ||||||
AGL Resources | 19,400 | 750 | ||||
Alliant Energy | 23,300 | 775 | ||||
Atmos Energy | 21,600 | 617 | ||||
Consolidated Edison | 24,656 | 1,098 | ||||
DTE Energy | 20,700 | 923 | ||||
Edison International | 23,600 | 806 | ||||
Energen | 6,500 | 302 | ||||
Hawaiian Electric Industries | 58,670 | 1,317 | ||||
Idacorp | 21,600 | 748 | ||||
Integrys Energy Group | 10,900 | 517 | ||||
New Jersey Resources | 8,700 | 327 | ||||
Nicor | 17,100 | 717 | ||||
NSTAR | 78,413 | 2,777 | ||||
OGE Energy | 51,903 | 2,021 | ||||
Pepco Holdings | 35,000 | 600 | ||||
PG&E | 12,300 | 522 | ||||
Piedmont Natural Gas | 24,800 | 684 | ||||
SCANA | 33,337 | 1,253 | ||||
Sempra Energy | 12,900 | 644 | ||||
Southern | 26,142 | 867 | ||||
TECO Energy | 42,300 | 672 | ||||
Vectren | 53,148 | 1,314 | ||||
WGL Holdings | 15,500 | 537 | ||||
Wisconsin Energy | 32,605 | 1,611 | ||||
| 22,399 | ||||||
Total Common Stock | 191,690 | |||||
CASH EQUIVALENT — 3.9% | ||||||
SEI Daily Income Trust, Prime | ||||||
0.070%**†† | 7,790,116 | 7,790 | ||||
Total Cash Equivalent | 7,790 | |||||
U.S. TREASURY OBLIGATION (A) (B) — 0.3% | ||||||
0.114%, 06/03/10 | $ | 545 | 545 | |||
Total U.S. Treasury Obligation | 545 | |||||
Total Investments — 100.1% | $ | 200,025 | ||||
| 2 | SEI Institutional Managed Trust / Semi-Annual Report / March 31, 2010 |
Table of Contents
Schedule of Investments (Unaudited)
Tax-Managed Managed Volatility Fund
March 31, 2010
A summary of the open futures contracts held by the Fund at March 31, 2010, is as follows:
| Type of Contract | Number of Contracts Long (Short) | Expiration Date | Unrealized Appreciation ($ Thousands) | ||||
S&P 500 Index EMINI | 70 | Jun-2010 | $ | 66 | |||
For the period ended March 31, 2010, the total amount of all open futures contracts, as presented in the table above, are representative of the volume of activity for this derivative type during the period.
Percentages are based on Net Assets of $199,921 ($ Thousands).
| * | Non-income producing security. |
| ** | Rate shown is the 7-day effective yield as of March 31, 2010. |
| † | Real Estate Investment Trust. |
| †† | Investment in Affiliated Security. |
| (A) | The rate reported is the effective yield at the time of purchase. |
| (B) | Security, or portion thereof, has been pledged as collateral on open futures. |
Cl — Class
| 3 | SEI Institutional Managed Trust / Semi-Annual Report / March 31, 2010 |
Table of Contents
| Item 7. | Disclosure of Proxy Voting Policies and Procedures for Closed-End Management Investment Companies. |
Not applicable.
| Item 8. | Portfolio Managers of Closed-End Management Investment Companies. |
Not applicable.
| Item 9. | Purchases of Equity Securities by Closed-End Management Company and Affiliated Purchasers. |
Not applicable.
| Item 10. | Submission of Matters to a Vote of Security Holders. |
The Registrant has a standing Nominating Committee (the “Committee”) currently consisting of the Independent Trustees. The Committee is responsible for evaluating and recommending nominees for election to the Registrant’s Board of Trustees (the “Board”). Pursuant to the Committee’s Charter, adopted on June 18, 2004, as amended, the Committee will review all shareholder recommendations for nominations to fill vacancies on the Board if such recommendations are submitted in writing and addressed to the Committee at the Registrant’s office.
Table of Contents
| Item 11. | Controls and Procedures. |
(a) The certifying officers, whose certifications are included herewith, have evaluated the Registrant’s disclosure controls and procedures within 90 days of the filing date of this report. Based on their evaluation, the certifying officers have concluded that the Registrant’s disclosure controls and procedures are adequately designed, and are operating effectively to ensure, that information required to be disclosed by the Registrant in the reports it files or submits under the Securities Exchange Act of 1934 is recorded, processed, summarized and reported within the time periods specified in the Securities and Exchange Commission’s rules and forms.
(b) There were no significant changes in the Registrant’s internal control over financial reporting that occurred during the Registrant’s last fiscal half-year that have materially affected, or are reasonably likely to materially affect, the Registrants internal control over financial reporting.
| Items 12. | Exhibits. |
(a)(1) Not applicable for semi-annual report.
(a)(2) A separate certification for the principal executive officer and the principal financial officer of the Registrant as required by Rule 30a-2(a) under the Investment Company Act of 1940, as amended (17 CFR 270.30a-2(a)), are filed herewith.
(b) Officer certifications as required by Rule 30a-2(b) under the Investment Company Act of 1940, as amended (17 CFR 270.30a-2(b)) also accompany this filing as an exhibit.
Table of Contents
SIGNATURES
Pursuant to the requirements of the Securities Exchange Act of 1934 and the Investment Company Act of 1940, the Registrant has duly caused this report to be signed on its behalf by the undersigned, thereunto duly authorized.
| SEI Institutional Managed Trust | ||
| By | /S/ ROBERT A. NESHER | |
| Robert A. Nesher, President & CEO | ||
Date: May 28, 2010
Pursuant to the requirements of the Securities Exchange Act of 1934 and the Investment Company Act of 1940, this report has been signed below by the following persons on behalf of the Registrant and in the capacities and on the dates indicated.
| By | /S/ ROBERT A. NESHER | |
| Robert A. Nesher, President & CEO | ||
Date: May 28, 2010
| By | /S/ STEPHEN F. PANNER | |
| Stephen F. Panner, Controller & CFO | ||
Date: May 28, 2010