UNITED STATES
SECURITIES AND EXCHANGE COMMISSION
Washington, D.C. 20549
FORM N-CSR
CERTIFIED SHAREHOLDER REPORT OF REGISTERED
MANAGEMENT INVESTMENT COMPANIES
Investment Company Act file number 811-04878
SEI Institutional Managed Trust
(Exact name of registrant as specified in charter)
SEI Investments
One Freedom Valley Drive
Oaks, PA 19456
(Address of principal executive offices) (Zip code)
CT Corporation
155 Federal Street
Boston, MA 02110
(Name and address of agent for service)
Registrant’s telephone number, including area code: 1-800-342-5734
Date of fiscal year end: September 30, 2013
Date of reporting period: September 30, 2013
Item 1. Reports to Stockholders.

September 30, 2013
ANNUAL REPORT
SEI Institutional Managed Trust
† Large Cap Fund
† Large Cap Value Fund
† Large Cap Growth Fund
† Tax-Managed Large Cap Fund
† S&P 500 Index Fund
† Small Cap Fund
† Small Cap Value Fund
† Small Cap Growth Fund
† Tax-Managed Small/Mid Cap Fund
† Mid-Cap Fund
† U.S. Managed Volatility Fund
† Global Managed Volatility Fund
† Tax-Managed Managed Volatility Fund
† Real Estate Fund
† Enhanced Income Fund
† Core Fixed Income Fund
† U.S. Fixed Income Fund
† High Yield Bond Fund
† Real Return Fund
† Multi-Strategy Alternative Fund
† Multi-Asset Accumulation Fund
† Multi-Asset Income Fund
† Multi-Asset Inflation Managed Fund
† Multi-Asset Capital Stability Fund

TABLE OF CONTENTS
The Trust files its complete schedule of portfolio holdings with the Securities and Exchange Commission (“Commission”) for the first and third quarters of each fiscal year on Form N-Q within sixty days after period end. The Trust’s Form N-Q is available on the Commission’s website at http://www.sec.gov, and may be reviewed and copied at the Commission’s Public Reference Room in Washington, DC. Information on the operation of the Public Reference Room may be obtained by calling 1-800-SEC-0330.
A description of the policies and procedures that the Trust uses to determine how to vote proxies relating to portfolio securities, as well as information relating to how a Fund voted proxies relating to portfolio securities during the most recent 12-month period ended June 30, is available (i) without charge, upon request, by calling 1-800-DIAL-SEI; and (ii) on the Commission’s website at http://www.sec.gov.
MANAGEMENT’S DISCUSSION AND ANALYSIS OF FUND PERFORMANCE
SEI INSTITUTIONAL MANAGED TRUST — SEPTEMBER 30, 2013
Large Cap Fund
I. Objective
The Large Cap Fund (the “Fund”) seeks to provide long-term growth of capital and income.
II. Multi-Manager Approach Statement
The Fund uses a multi-manager approach, relying on a number of sub-advisers with differing investment approaches to manage portions of the Fund’s portfolio, under the general supervision of SEI Investments Management Corporation (“SIMC”). The Fund utilized the following sub-advisers as of September 30, 2013: AQR Capital Management, LLC, AJO, L.P., Brown Advisory LLC, Delaware Investments Fund Advisers, LSV Asset Management, Waddell + Reed Investment Management Company and WestEnd Advisors, LLC. There were no manager changes during the year ended September 30, 2013.
III. Market Commentary
For the year ended September 30, 2013, the U.S. equity market, as measured by the Russell 1000 Index, gained 20.91%. After reaching a last minute deal to avoid the “fiscal cliff,” the U.S. equity market embarked on a quarter-long, nearly uninterrupted ascent on optimism that the U.S. economy was taking a turn for the better. Generally positive readings on the economy more than offset any negative sentiment associated with the fact that paychecks for 77% of U.S. households were smaller following the expiration of the payroll tax holiday. Interestingly, market leadership during the first quarter was sourced from more defensive areas of the market, namely staples, health care and utilities. The market continued to rise through April and May despite some volatility induced by a poor jobs report and tensions with North Korea in April. The stock market declined and long-term interest rates on U.S. debt rose sharply through most of June, as Federal Reserve Chairman Bernanke’s rhetoric suggested the potential for reduced (not eliminated) stimulus measures. Mr. Bernanke subsequently clarified his comments and reiterated that the decision to taper would be dictated by economic data. On this news, the market moved higher until early August, when tapering concerns reappeared and the prospect of U.S. military intervention in Syria (following the alleged use of chemical weapons by the Syrian government) prompted the market to retreat. The September decision by the Federal Reserve to not taper their asset purchases sent the market higher before selling off as the political stalemate in Washington regarding the budget and debt ceiling heated up. Value
stocks outperformed their growth counterparts while small caps fared better than large caps.
IV. Return vs. Benchmark
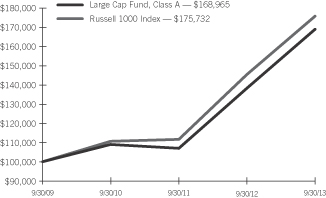
For the year ended September 30, 2013, the Large Cap Fund, Class A, outperformed the Russell 1000 Index, returning 22.23% versus the Index return of 20.91%.
V. Fund Attribution
Broad-based strong stock selection enabled the Fund to outperform for the period. Picks within Information Technology, Consumer Staples, Financials and Energy were among the top contributors to relative performance. The Fund’s consumer discretionary names and an underweight to industrials mildly detracted. From a market-cap perspective, value was added across the spectrum, with the majority of outperformance resulting from an underweight to and selection within mega-cap names.
Large Cap Fund:
AVERAGE ANNUAL TOTAL RETURN1
| One Year Return | Annualized 3 Year Return | Annualized Inception to Date | ||||||||||
| Large Cap Fund, Class A | 22.23% | 15.73% | 14.01% | |||||||||
| Russell 1000 Index | 20.91% | 16.64% | 15.13% | |||||||||
Comparison of Change in the Value of a $100,000 Investment in the Large Cap Fund, Class A, versus the Russell 1000 Index
| 1 | For the period ended 9/30/13. Past performance is no indication of future performance. Class A shares were offered beginning 10/01/09. Returns shown do not reflect the deduction of taxes that a shareholder would pay on fund distributions or the redemption of fund shares. The returns for the period reflect fee waivers and/or reimbursements in effect for the period; absent fee waivers and reimbursements, performance would have been lower. |
| SEI Institutional Managed Trust / Annual Report / September 30, 2013 | 1 |
MANAGEMENT’S DISCUSSION AND ANALYSIS OF FUND PERFORMANCE
SEI INSTITUTIONAL MANAGED TRUST — SEPTEMBER 30, 2013
Large Cap Value Fund
I. Objective
The Large Cap Value Fund (the “Fund”) seeks to provide long-term growth of capital and income.
II. Multi-Manager Approach Statement
The Fund uses a multi-manager approach, relying on a number of sub-advisers with differing investment approaches to manage portions of the Fund’s portfolio, under the general supervision of SEI Investments Management Corporation (“SIMC”). The Fund utilized the following sub-advisers as of September 30, 2013: AJO, L.P., Lazard Asset Management, LLC, LSV Asset Management and Tocqueville Asset Management, LP. There were no manager changes during the year ended September 30, 2013.
III. Market Commentary
For the year ended September 30, 2013, the U.S. equity market, as measured by the Russell 1000 Value Index, gained 22.30%. After reaching a last minute deal to avoid the “fiscal cliff,” the U.S. equity market embarked on a quarter-long, nearly uninterrupted ascent on optimism that the U.S. economy was taking a turn for the better. Generally positive readings on the economy more than offset any negative sentiment associated with the fact that paychecks for 77% of U.S. households were smaller following the expiration of the payroll tax holiday. Interestingly, market leadership during the first quarter was sourced from more defensive areas of the market, namely staples, health care and utilities. The market continued to rise through April and May despite some volatility induced by a poor jobs report and tensions with North Korea in April. The stock market declined and long-term interest rates on U.S. debt rose sharply through most of June, as Federal Reserve Chairman Bernanke’s rhetoric suggested the potential for reduced (not eliminated) stimulus measures. Mr. Bernanke subsequently clarified his comments and reiterated that the decision to taper would be dictated by economic data. On this news, the market moved higher until early August, when tapering concerns reappeared and the prospect of U.S. military intervention in Syria (following the alleged use of chemical weapons by the Syrian government) prompted the market to retreat. The September decision by the Federal Reserve to not taper their asset purchases sent the market higher before selling off as the political stalemate in Washington regarding the budget and debt ceiling heated up. Value stocks outperformed their growth counterparts while small caps fared better than large caps.
IV. Return vs. Benchmark
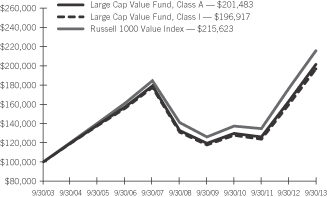
For the year ended September 30, 2013, the Large Cap Value Fund, Class A, outperformed the Russell 1000 Value Index, returning 23.55% versus the Index return of 22.30%.
V. Fund Attribution
Broad-based strong stock selection and sector-allocation decisions enabled the Fund to outperform for the period. Picks within Health Care, Financials and Energy were among the top contributors to relative performance. Underweights to Utilities and Telecommunications were also positive, as those sectors materially lagged the broader market. Stock selection within Information Technology detracted. From a market-cap perspective, value was added among all market-cap groups with the majority being sourced from names in the $10 to $50 billion range.
Large Cap Value Fund:
AVERAGE ANNUAL TOTAL RETURN1
| One Year Return | Annualized 3 Year Return | Annualized 5 Year Return | Annualized 10 Year Return | Annualized Since Inception | ||||||||||||||||
| Large Cap Value Fund, Class A | 23.55% | 15.83% | 8.72% | 7.26% | 8.87% | |||||||||||||||
| Large Cap Value Fund, Class I | 23.35% | 15.57% | 8.49% | 7.01% | 4.79% | |||||||||||||||
| Russell 1000 Value Index | 22.30% | 16.25% | 8.86% | 7.99% | 9.73% | |||||||||||||||
Comparison of Change in the Value of a $100,000 Investment in the Large Cap Value Fund, Class A or Class I, versus the Russell 1000 Value Index
| 1 | For the period ended 9/30/13. Past performance is no indication of future performance. Class A Shares were offered beginning 10/3/94 and Class I Shares were offered beginning 8/6/01. The performance of Class I Shares prior to 8/6/01 is calculated using the performance of the fund’s Class A Shares adjusted for the higher expenses of the Class I Shares. Returns shown do not reflect the deduction of taxes that a shareholder would pay on fund distributions or the redemption of fund shares. The returns for certain periods reflect fee waivers and/or reimbursements in effect for that period; absent fee waivers and reimbursements, performance would have been lower. |
| 2 | SEI Institutional Managed Trust / Annual Report / September 30, 2013 |
MANAGEMENT’S DISCUSSION AND ANALYSIS OF FUND PERFORMANCE
SEI INSTITUTIONAL MANAGED TRUST — SEPTEMBER 30, 2013
Large Cap Growth Fund
I. Objective
The Large Cap Growth Fund (the “Fund”) seeks to provide capital appreciation.
II. Multi-Manager Approach Statement
The Fund uses a multi-manager approach, relying on a number of sub-advisers with differing investment approaches to manage portions of the Fund’s portfolio, under the general supervision of SEI Investments Management Corporation (“SIMC”). The Fund utilized the following sub-advisers as of September 30, 2013: Brown Advisory LLC, Delaware Investments Fund Advisers and INTECH Investment Management, LLC. There were no manager changes made during the year ended September 30, 2013.
III. Market Commentary
For the year ended September 30, 2013, the U.S. equity market, as measured by the Russell 1000 Growth Index, gained 19.27%. After reaching a last minute deal to avoid the “fiscal cliff,” the U.S. equity market embarked on a quarter-long, nearly uninterrupted ascent on optimism that the U.S. economy was taking a turn for the better. Generally positive readings on the economy more than offset any negative sentiment associated with the fact that paychecks for 77% of U.S. households were smaller following the expiration of the payroll tax holiday. Interestingly, market leadership during the first quarter was sourced from more defensive areas of the market, namely staples, health care and utilities. The market continued to rise through April and May despite some volatility induced by a poor jobs report and tensions with North Korea in April. The stock market declined and long-term interest rates on U.S. debt rose sharply through most of June, as Federal Reserve Chairman Bernanke’s rhetoric suggested the potential for reduced (not eliminated) stimulus measures. Mr. Bernanke subsequently clarified his comments and reiterated that the decision to taper would be dictated by economic data. On this news, the market moved higher until early August, when tapering concerns reappeared and the prospect of U.S. military intervention in Syria (following the alleged use of chemical weapons by the Syrian government) prompted the market to retreat. The September decision by the Federal Reserve to not taper their asset purchases sent the market higher before selling off as the political stalemate in Washington regarding the budget and debt ceiling heated up. Value stocks outperformed their growth counterparts while small caps fared better than large caps.
IV. Return vs. Benchmark
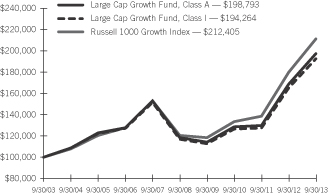
For the year ended September 30, 2013, the Large Cap Growth Fund, Class A, underperformed the Russell 1000 Growth Index, returning 18.89% versus the Index return of 19.27%.
V. Fund Attribution
Stock selection within Health Care detracted during the year. An underweight to Industrials also weighed on relative performance, as that sector outperformed the broader market by a healthy margin. Stock selection within Information Technology was a source of excess return during the year, although the Fund’s overweight to the sector detracted as it materially lagged the broader market. From a market-cap perspective, an underweight to and selection within the benchmark’s largest names added value while stock selection within small- and mid-cap names detracted.
Large Cap Growth Fund:
AVERAGE ANNUAL TOTAL RETURN1
| One Year Return | Annualized 3 Year Return | Annualized 5 Year Return | Annualized 10 Year Return | Annualized Inception to Date | ||||||||||||||||
| Large Cap Growth Fund, Class A | 18.89% | 15.83% | 10.99% | 7.11% | 7.66% | |||||||||||||||
| Large Cap Growth Fund, Class I | 18.62% | 15.57% | 10.75% | 6.87% | 3.27% | |||||||||||||||
| Russell 1000 Growth Index | 19.27% | 16.94% | 12.07% | 7.82% | 8.43% | |||||||||||||||
Comparison of Change in the Value of a $100,000 Investment in the Large Cap Growth Fund, Class A or Class I, versus the Russell 1000 Growth Index
| 1 | For the period ended 9/30/13. Past performance is no indication of future performance. Class A Shares were offered beginning 12/20/94 and Class I Shares were offered beginning 8/6/01. The performance of Class I Shares prior to 8/6/01 is calculated using the performance of the fund’s Class A Shares adjusted for the higher expenses of the Class I Shares. Returns shown do not reflect the deduction of taxes that a shareholder would pay on fund distributions or the redemption of fund shares. The returns for certain periods reflect fee waivers and/or reimbursements in effect for that period; absent fee waivers and reimbursements, performance would have been lower. |
| SEI Institutional Managed Trust / Annual Report / September 30, 2013 | 3 |
MANAGEMENT’S DISCUSSION AND ANALYSIS OF FUND PERFORMANCE
SEI INSTITUTIONAL MANAGED TRUST — SEPTEMBER 30, 2013
Tax-Managed Large Cap Fund
I. Objective
The Tax-Managed Large Cap Fund (the “Fund”) aims to provide high long-term after-tax returns.
II. Multi-Manager Approach Statement
The Fund uses a multi-manager approach, relying on a number of sub-advisers with differing investment approaches to manage portions of the Fund’s portfolio, under the general supervision of SEI Investments Management Corporation (“SIMC”). The Fund utilized the following sub-advisers as of September 30, 2013: AQR Capital Management, LLC, AJO, L.P., Brown Advisory LLC, Delaware Investments Fund Advisers, LSV Asset Management, Parametric Portfolio Associates, Waddell + Reed Investment Management Company and WestEnd Advisors, LLC. There were no manager changes during the year ended September 30, 2013.
III. Market Commentary
For the year ended September 30, 2013, the U.S. equity market, as measured by the Russell 1000 Index, gained 20.91%. After reaching a last minute deal to avoid the “fiscal cliff,” the U.S. equity market embarked on a quarter-long, nearly uninterrupted ascent on optimism that the U.S. economy was taking a turn for the better. Generally positive readings on the economy more than offset any negative sentiment associated with the fact that paychecks for 77% of U.S. households were smaller following the expiration of the payroll tax holiday. Interestingly, market leadership during the first quarter was sourced from more defensive areas of the market, namely staples, health care and utilities. The market continued to rise through April and May despite some volatility induced by a poor jobs report and tensions with North Korea in April. The stock market declined and long-term interest rates on U.S. debt rose sharply through most of June, as Federal Reserve Chairman Bernanke’s rhetoric suggested the potential for reduced (not eliminated) stimulus measures. Mr. Bernanke subsequently clarified his comments and reiterated that the decision to taper would be dictated by economic data. On this news, the market moved higher until early August, when tapering concerns reappeared and the prospect of U.S. military intervention in Syria (following the alleged use of chemical weapons by the Syrian government) prompted the market to retreat. The September decision by the Federal Reserve to not taper their asset purchases sent the market higher before selling off as the political stalemate in Washington regarding the budget and debt ceiling heated up. Value stocks outperformed their growth counterparts while small caps fared better than large caps.
IV. Return vs. Benchmark
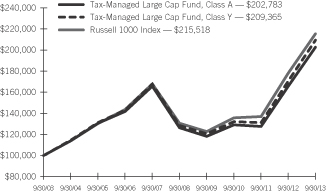
For the year ended September 30, 2013, the Tax-Managed Large Cap Fund, Class A, outperformed the Russell 1000 Index, returning 22.47% versus the Index return of 20.91%.
V. Fund Attribution
Broad-based strong stock selection enabled the Fund to outperform for the period. Picks within Information Technology, Consumer Staples, Financials and Energy were among the top contributors to relative performance. The Fund’s Consumer Discretionary names and an underweight to industrials mildly detracted. From a market-cap perspective, value was added across the spectrum, with the majority of outperformance resulting from an underweight to and selection within mega-cap names.
Tax-Managed Large Cap Fund:
AVERAGE ANNUAL TOTAL RETURN1
| One Year Return | Annualized 3 Year Return | Annualized 5 Year Return | Annualized 10 Year Return | Annualized Inception to Date | ||||||||||||||||
| Tax-Managed Large Cap Fund, Class A | 22.47% | 16.21% | 9.91% | 7.33% | 4.35% | |||||||||||||||
| Tax-Managed Large Cap Fund, Class Y | 22.80% | 16.62% | 10.28% | 7.67% | 5.61% | |||||||||||||||
| Russell 1000 Index | 20.91% | 16.64% | 10.53% | 7.98% | 5.41% | |||||||||||||||
Comparison of Change in the Value of a $100,000 Investment in the Tax-Managed Large Cap Fund, Class A or Class Y, versus the Russell 1000 Index
| 1 | For the period ended 9/30/13. Past performance is no indication of future performance. Class A Shares were offered beginning 3/5/98 and Class Y Shares were offered beginning 4/8/02. The performance of Class Y Shares prior to 4/8/02 is calculated using the performance of the fund’s Class A Shares adjusted for the lower expenses of the Class Y Shares. Returns shown do not reflect the deduction of taxes that a shareholder would pay on fund distributions or the redemption of fund shares. The returns for certain periods reflect fee waivers and/or reimbursements in effect for that period; absent fee waivers and reimbursements, performance would have been lower. |
| 4 | SEI Institutional Managed Trust / Annual Report / September 30, 2013 |
MANAGEMENT’S DISCUSSION AND ANALYSIS OF FUND PERFORMANCE
SEI INSTITUTIONAL MANAGED TRUST — SEPTEMBER 30, 2013
S&P 500 Index Fund
I. Objective
The S&P 500 Index Fund (the “Fund”) seeks to achieve investment results that correspond to the aggregate price and dividend performance of the securities in the S&P 500 Index.
II. Multi-Manager Approach Statement
The Fund uses a sub-adviser to manage the Fund under the supervision of SEI Investments Management Corporation (“SIMC”). The sole sub-adviser as of September 30, 2013 was SSgA Funds Management, Inc. There were no manager changes during the year ended September 30, 2013.
III. Market Commentary
For the year ended September 30, 2013, the U.S. equity market, as measured by the S&P 500 Index, gained 19.34%. After reaching a last minute deal to avoid the “fiscal cliff,” the U.S. equity market embarked on a quarter-long, nearly uninterrupted ascent on optimism that the U.S. economy was taking a turn for the better. Generally positive readings on the economy more than offset any negative sentiment associated with the fact that paychecks for 77% of U.S. households were smaller following the expiration of the payroll tax holiday. Interestingly, market leadership during the first quarter was sourced from more defensive areas of the market, namely staples, health care and utilities. The market continued to rise through April and May despite some volatility induced by a poor jobs report and tensions with North Korea in April. The stock market declined and long-term interest rates on U.S. debt rose sharply through most of June, as Federal Reserve Chairman Bernanke’s rhetoric suggested the potential for reduced (not eliminated) stimulus measures. Mr. Bernanke subsequently clarified his comments and reiterated that the decision to taper would be dictated by economic data. On this news, the market moved higher until early August, when tapering concerns reappeared and the prospect of U.S. military intervention in Syria (following the alleged use of chemical weapons by the Syrian government) prompted the market to retreat. The September decision by the Federal Reserve to not taper their asset purchases sent the market higher before selling off as the political stalemate in Washington regarding the budget and debt ceiling heated up. Value stocks outperformed their growth counterparts while small caps fared better than large caps.
IV. Return vs. Benchmark
For the year ended September 30, 2013, the S&P 500 Index Fund, Class A, underperformed the S&P 500 Index, returning 18.87% versus the Index return of 19.34%. Please note that one cannot invest directly in an index. Unlike a mutual fund, an index does not have an investment adviser and does not pay any commissions or expenses; therefore, its performance is higher than that of a mutual fund that passively invests in the same index.
V. Fund Attribution
The Fund’s performance followed a pattern similar to the performance of the S&P 500 Index since it invested substantially all of its assets in the same securities with generally the same weights. From a sector perspective, Consumer Discretionary and Financials led the advance, while Telecommunications, Information Technology and Utilities lagged.
S&P 500 Index Fund:
AVERAGE ANNUAL TOTAL RETURN1
| One Year Return | Annualized 3 Year Return | Annualized 5 Year Return | Annualized 10 Year Return | Annualized Inception to Date | ||||||||||||||||
| S&P 500 Index Fund, Class A | 18.87% | 15.82% | 9.62% | 7.16% | 7.14% | |||||||||||||||
| S&P 500 Index Fund, Class I | 18.60% | 15.59% | 9.39% | 6.91% | 6.31% | |||||||||||||||
| S&P 500 Index | 19.34% | 16.27% | 10.02% | 7.57% | 7.58% | |||||||||||||||
Comparison of Change in the Value of a $100,000 Investment in the S&P 500 Index Fund, Class A or Class I, versus the S&P 500 Index
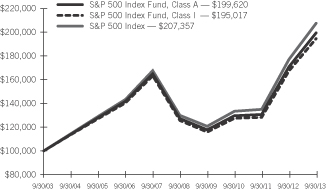
| SEI Institutional Managed Trust / Annual Report / September 30, 2013 | 5 |
MANAGEMENT’S DISCUSSION AND ANALYSIS OF FUND PERFORMANCE
SEI INSTITUTIONAL MANAGED TRUST — SEPTEMBER 30, 2013
S&P 500 Index Fund (Concluded)
AVERAGE ANNUAL TOTAL RETURN1
| One Year Return | Annualized 3 Year Return | Annualized 5 Year Return | Annualized 10 Year Return | Annualized Inception to Date | ||||||||||||||||
| S&P 500 Index Fund, Class E | 19.11% | 16.05% | 9.82% | 7.34% | 10.25% | |||||||||||||||
| S&P 500 Index | 19.34% | 16.27% | 10.02% | 7.57% | 7.58% | |||||||||||||||
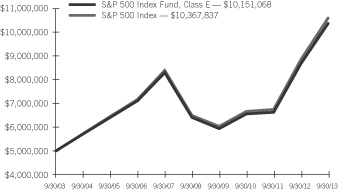
Comparison of Change in the Value of a $5,000,000 Investment in the S&P 500 Index Fund, Class E, versus the S&P 500 Index
| 1 | For the period ended 9/30/13. Past performance is no indication of future performance. Class A shares were offered beginning 2/28/96. Class E shares were offered beginning 7/31/85. Class I shares were offered beginning 6/28/02. The performance of Class I Shares prior to 6/28/02 is calculated using the performance of the fund’s Class A Shares adjusted for the higher expenses of the Class I Shares. Effective 7/31/97, the Board of Trustees approved the renaming of Class A and Class E shares to Class E and Class A shares, respectively. In addition, returns shown do not reflect the deduction of taxes that a shareholder would pay on fund distributions or the redemption of fund shares. |
| 6 | SEI Institutional Managed Trust / Annual Report / September 30, 2013 |
MANAGEMENT’S DISCUSSION AND ANALYSIS OF FUND PERFORMANCE
SEI INSTITUTIONAL MANAGED TRUST — SEPTEMBER 30, 2013
Small Cap Fund
I. Objective
The Small Cap Fund (the “Fund”) seeks to provide capital appreciation.
II. Multi-Manager Approach Statement
The Fund uses a multi-manager approach, relying on a number of sub-advisers with differing investment approaches to manage portions of the Fund’s portfolio, under the general supervision of SEI Investments Management Corporation (“SIMC”). The Fund utilized the following sub-advisers as of September 30, 2013: AllianceBernstein, L.P., AQR Capital Management, LLC, Fiduciary Management Associates, LLC, Integrity Asset Management, LLC, J.P. Morgan Investment Management, Inc. Robeco Investment Management, Inc., Timberline Asset Management, LLC and William Blair + Company, LLC.
No sub-advisers were added to or terminated from the Fund during the one-year period ending September 30, 2013.
III. Market Commentary
For the year ended September 30, 2013, the U.S. equity markets as measured by the Russell 3000 Index gained 21.60%. Stocks lost ground leading up to Election Day in November and then trended upward over the remainder of the Fund’s fiscal year, as global macroeconomic concerns subsided and investor confidence in the sustainability of the U.S. economic recovery grew. Improving employment data and strength in housing- and auto-related industries helped diminish fear of a return to recession, and both modest economic growth and expanding valuation multiples pushed equity markets higher.
Small-cap stocks (as measured by the Russell 2000 Index), aided by the improving domestic economy and continuing accommodative monetary policy, gained 30.06% and outpaced the 20.91% advance in large-cap stocks (as measured by the Russell 1000 Index). From a style perspective, growth stocks (as defined by the Russell 2000 Growth Index) outperformed value stocks (Russell 2000 Value Index).
Small-cap stocks were led higher by the Industrial, Information Technology, Consumer Discretionary and Consumer Staples sectors. The worst-performing small-cap sectors were Utilities, Materials and Telecommunications Services.
IV. Return vs. Benchmark
For the year ended September 30, 2013, the Small Cap Fund. Class A, outperformed the Russell 2000 Index, returning 32.40% versus the Index return of 30.06%.
V. Fund Attribution
The Fund outperformed its benchmark due to both sector allocation and stock selection. Underweight positions in some of the weaker areas, including Utilities, Materials and the real estate segment of Financials, were beneficial, as was an overweight to Industrials. Security selection decisions contributed significantly in the Financial sector, as well as in Industrials and Energy. This was offset by poor stock-picking performance in the Consumer Discretionary sector, where a few holdings in the specialty retail area posted disappointing results and lost value.
Small Cap Fund:
AVERAGE ANNUAL TOTAL RETURN1
| One Year Return | Annualized 3 Year Return | Annualized Inception to Date | ||||||||||
| Small Cap Fund, Class A | 32.40% | 17.15% | 15.75% | |||||||||
| Russell 2000 Index | 30.06% | 18.29% | 17.02% | |||||||||
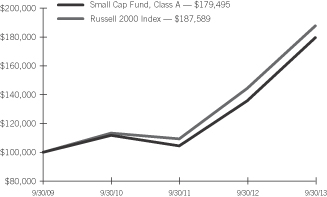
Comparison of Change in the Value of a $100,000 Investment in the Small Cap Fund, Class A, versus the Russell 2000 Index
| 1 | For the period ended 9/30/13. Past performance is no indication of future performance. Class A shares were offered beginning 10/01/09. Returns shown do not reflect the deduction of taxes that a shareholder would pay on fund distributions or the redemption of fund shares. The returns for the period reflect fee waivers and/or reimbursements in effect for the period; absent fee waivers and reimbursements, performance would have been lower. |
| SEI Institutional Managed Trust / Annual Report / September 30, 2013 | 7 |
MANAGEMENT’S DISCUSSION AND ANALYSIS OF FUND PERFORMANCE
SEI INSTITUTIONAL MANAGED TRUST — SEPTEMBER 30, 2013
Small Cap Value Fund
I. Objective
The Small Cap Value Fund (the “Fund”) seeks to provide capital appreciation.
II. Multi-Manager Approach Statement
The Fund uses a multi-manager approach, relying on a number of sub-advisers with differing investment approaches to manage portions of the Fund’s portfolio, under the general supervision of SEI Investments Management Corporation (“SIMC”). The Fund utilized the following sub-advisers as of September 30, 2013: Artisan Partners, Limited Partnership, Fiduciary Management Associates, LLC, Lee Munder Capital Group, LLC, LSV Asset Management, Martingale Asset Management, L.P., Robeco Investment Management, Inc, Security Capital Research + Management and William Blair + Company, LLC.
No sub-advisers were added to or terminated from the Fund during the one-year period ending September 30, 2013.
III. Market Commentary
For the year ended September 30, 2013, the U.S. equity markets as measured by the Russell 3000 Index gained 21.60%. Stocks lost ground leading up to Election Day in November and then trended upward over the remainder of the Fund’s fiscal year, as global macroeconomic concerns subsided and investor confidence in the sustainability of the U.S. economic recovery grew. Improving employment data and strength in housing- and auto-related industries helped diminish fear of a return to recession, and both modest economic growth and expanding valuation multiples pushed equity markets higher.
Small-cap stocks (as measured by the Russell 2000 Index), aided by the improving domestic economy and continuing accommodative monetary policy, gained 30.06% and outpaced the 20.91% advance in large-cap stocks (as measured by the Russell 1000 Index). From a style perspective, growth stocks (as defined by the Russell 2000 Growth Index) outperformed value stocks (Russell 2000 Value Index).
Small-cap stocks were led higher by the Industrials, Information Technology, Consumer Discretionary and Consumer Staples sectors. The worst-performing small-cap sectors were Utilities, Materials and Telecommunications Services.
IV. Return vs. Benchmark
For the year ended September 30, 2013, the Small Cap Value Fund, Class A, outperformed the Russell 2000 Value Index, returning 28.73% versus the Index return of 27.04%.
V. Fund Attribution
The Fund outperformed its benchmark due to both sector allocation and stock selection. Underweight positions in some of the weaker areas, including Utilities and the real estate segment of Financials, were beneficial, as was an overweight to Industrials. The Fund’s underweight to Consumer Discretionary detracted from performance. Security decisions contributed significantly in the Financial and Industrial sectors. This was offset by poor stock-picking performance in the Information Technology sector.
Small Cap Value Fund:
AVERAGE ANNUAL TOTAL RETURN1
| One Year Return | Annualized 3 Year Return | Annualized 5 Year Return | Annualized 10 Year Return | Annualized Inception to Date | ||||||||||||||||
| Small Cap Value Fund, Class A | 28.73% | 15.54% | 9.77% | 9.55% | 10.71% | |||||||||||||||
| Small Cap Value Fund, Class I | 28.51% | 15.29% | 9.52% | 9.29% | 10.37% | |||||||||||||||
| Russell 2000 Value Index | 27.04% | 16.57% | 9.13% | 9.29% | 11.13% | |||||||||||||||
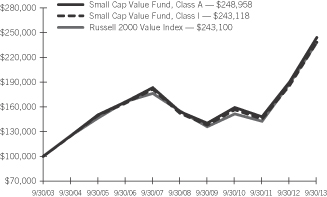
Comparison of Change in the Value of a $100,000 Investment in the Small Cap Value Fund, Class A or Class I, versus the Russell 2000 Value Index
| 1 | For the period ended 9/30/13. Past performance is no indication of future performance. Class A Shares were offered beginning 12/20/94 and Class I Shares were offered beginning 2/11/02. The performance of Class I Shares prior to 2/11/02 is calculated using the performance of the fund’s Class A Shares adjusted for the higher expenses of the Class I Shares. Returns shown do not reflect the deduction of taxes that a shareholder would pay on fund distributions or the redemption of fund shares. The returns for certain periods reflect fee waivers and/or reimbursements in effect for that period; absent fee waivers and reimbursements, performance would have been lower. |
| 8 | SEI Institutional Managed Trust / Annual Report / September 30, 2013 |
MANAGEMENT’S DISCUSSION AND ANALYSIS OF FUND PERFORMANCE
SEI INSTITUTIONAL MANAGED TRUST — SEPTEMBER 30, 2013
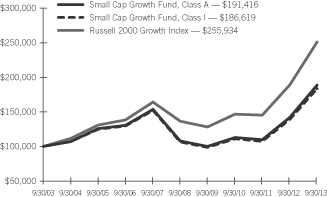
Small Cap Growth Fund
I. Objective
The Small Growth Fund (the “Fund”) seeks to provide long-term capital appreciation.
II. Multi-Manager Approach Statement
The Fund uses a multi-manager approach, relying on a number of sub-advisers with differing investment approaches to manage portions of the Fund’s portfolio, under the general supervision of SEI Investments Management Corporation (“SIMC”). The Fund utilized the following sub-advisers as of September 30, 2013: AllianceBernstein, L.P., AQR Capital Management, LLC, Janus Capital Management, LLC, J.P. Morgan Investment Management Inc. and Timberline Asset Management, LLC.
No sub-advisers were added to or terminated from the Fund during the year ended September 30, 2013.
III. Market Commentary
For the year ended September 30, 2013, the U.S. equity markets as measured by the Russell 3000 Index gained 21.60%. Stocks lost ground leading up to Election Day in November and then trended upward over the remainder of the Fund’s fiscal year, as global macroeconomic concerns subsided and investor confidence in the sustainability of the U.S. economic recovery grew. Improving employment data and strength in housing- and auto-related industries helped diminish fear of a return to recession, and both modest economic growth and expanding valuation multiples pushed equity markets higher.
Small-cap stocks (as measured by the Russell 2000 Index), aided by the improving domestic economy and continuing accommodative monetary policy, gained 30.06% and outpaced the 20.91% advance in large-cap stocks (as measured by the Russell 1000 Index). From a style perspective, growth stocks (as defined by the Russell 2000 Growth Index) outperformed value stocks (Russell 2000 Value Index).
Small-cap stocks were led higher by the Industrials, Information Technology, Consumer Discretionary and Consumer Staples sectors. The worst-performing small-cap sectors were Utilities, Materials and Telecommunications Services.
IV. Return vs. Benchmark
For the year ended September 30, 2013, the Small Cap Growth Fund, Class A, outperformed the Russell 2000 Growth Index, returning 33.21% versus the Index return of 33.07%.
V. Fund Attribution
The Fund outperformed its benchmark due to beneficial sector-allocation decisions, including an overweight to Industrials and an underweight to Materials. Stock selection detracted from the Fund’s performance in the period, as favorable security-level picks in Financials, Consumer Staples and Energy were more than offset by weaker choices in Health Care and Consumer Discretionary.
Small Cap Growth Fund:
AVERAGE ANNUAL TOTAL RETURN1
| One Year Return | Annualized 3 Year Return | Annualized 5 Year Return | Annualized 10 Year Return | Annualized Inception to Date | ||||||||||||||||
| Small Cap Growth Fund, Class A | 33.21% | 18.97% | 12.10% | 6.71% | 9.39% | |||||||||||||||
| Small Cap Growth Fund, Class I | 32.86% | 18.68% | 11.82% | 6.44% | 4.36% | |||||||||||||||
| Russell 2000 Growth Index | 33.07% | 19.96% | 13.17% | 9.85% | 7.66% | |||||||||||||||
Comparison of Change in the Value of a $100,000 Investment in the Small Cap Growth Fund, Class A or Class I, versus the Russell 2000 Growth Index
| 1 | For the period ended 9/30/13. Past performance is no indication of future performance. Class A Shares were offered beginning 4/20/92 and Class I Shares were offered beginning 8/6/01. The performance of Class I Shares prior to 08/06/01 is calculated using the performance of the fund’s Class A Shares adjusted for the higher expenses of the Class I Shares. Returns shown do not reflect the deduction of taxes that a shareholder would pay on fund distributions or the redemption of fund shares. The returns for certain periods reflect fee waivers and/or reimbursements in effect for that period; absent fee waivers and reimbursements, performance would have been lower. |
| SEI Institutional Managed Trust / Annual Report / September 30, 2013 | 9 |
MANAGEMENT’S DISCUSSION AND ANALYSIS OF FUND PERFORMANCE
SEI INSTITUTIONAL MANAGED TRUST — SEPTEMBER 30, 2013
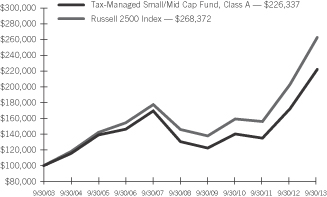
Tax-Managed Small/Mid Cap Fund
I. Objective
The Tax-Managed Small/Mid Cap Fund (the “Fund”) seeks to provide high long-term after-tax returns.
II. Multi-Manager Approach Statement
The Fund uses a multi-manager approach, relying on a number of sub-advisers with differing investment approaches to manage portions of the Fund’s portfolio, under the general supervision of SEI Investments Management Corporation (“SIMC”). The Fund utilized the following sub-advisers as of September 30, 2013: AllianceBernstein, L.P., J.P. Morgan Investment Management Inc., Lee Munder Capital Group, LLC, LSV Asset Management, Parametric Portfolio Associates LLC, Wellington Management Company, LLP and William Blair + Company, LLC.
During the year ended September 30, 2013, Century Capital Management, LLC was removed from the Fund and J.P. Morgan Investment Management Inc. was added to the Fund.
III. Market Commentary
For the year ended September 30, 2013, the U.S. equity markets as measured by the Russell 3000 Index gained 21.60%. Stocks lost ground leading up to Election Day in November and then trended upward over the remainder of the Fund’s fiscal year, as global macroeconomic concerns subsided and investor confidence in the sustainability of the U.S. economic recovery grew. Improving employment data and strength in housing- and auto-related industries helped diminish fear of a return to recession, and both modest economic growth and expanding valuation multiples pushed equity markets higher.
Small-cap stocks (as measured by the Russell 2000 Index), aided by the improving domestic economy and continuing accommodative monetary policy, gained 30.06% and outpaced the 20.91% advance in large-cap stocks (as measured by the Russell 1000 Index).
Small/mid-cap stocks, as defined by the Russell 2500 Index, climbed 29.79% and were led higher by the Consumer Staples, Industrials and Consumer Discretionary sectors. The worst-performing small/mid-cap sectors were Utilities, Materials and Telecommunications Services.
From a style perspective, growth stocks (as defined by the Russell 2500 Growth Index) outperformed value stocks (Russell 2500 Value Index).
IV. Return vs. Benchmark
For the year ended September 30, 2013, the Tax Managed Small/Mid Cap Fund, Class A, underperformed the Russell 2500 Index, returning 29.54% versus the Index return of 29.79%
V. Fund Attribution
The Fund benefited from its underweight positions in the real estate segment of the Financial sector and in the Utilities sector. Stock selection in the Financial, Material and Industrial sectors also contributed to performance. This was offset, however, by poor stock-picking results in the Information Technology, Consumer Discretionary and Consumer Staples sectors.
Tax-Managed Small/Mid Cap Fund:
AVERAGE ANNUAL TOTAL RETURN1
| One Year Return | Annualized 3 Year Return | Annualized 5 Year Return | Annualized 10 Year Return | Annualized Inception to Date | ||||||||||||||||
| Tax-Managed Small/Mid Cap Fund, Class A | 29.54% | 16.92% | 11.42% | 8.51% | 6.53% | |||||||||||||||
| Russell 2500 Index | 29.79% | 18.44% | 12.68% | 10.38% | 8.33% | |||||||||||||||
Comparison of Change in the Value of a $100,000 Investment in the Tax-Managed Small/Mid Cap Fund, Class A, versus the Russell 2500 Index
| 1 | For the period ended 9/30/13. Past performance is no indication of future performance. Fund shares were offered beginning 10/31/00. Returns shown do not reflect the deduction of taxes that a shareholder would pay on fund distributions or the redemption of fund shares. The returns for certain periods reflect fee waivers and/or reimbursements in effect for that period; absent fee waivers and reimbursements, performance would have been lower |
| 10 | SEI Institutional Managed Trust / Annual Report / September 30, 2013 |
MANAGEMENT’S DISCUSSION AND ANALYSIS OF FUND PERFORMANCE
SEI INSTITUTIONAL MANAGED TRUST — SEPTEMBER 30, 2013
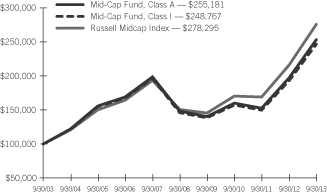
Mid-Cap Fund
I. Objective
The Mid-Cap Fund (the “Fund”) seeks to provide long-term capital appreciation.
II. Multi-Manager Approach Statement
The Fund uses a multi-manager approach, relying on a number of sub-advisers with differing investment approaches to manage portions of the Fund’s portfolio, under the general supervision of SEI Investments Management Corporation (“SIMC”). The Fund utilized the following sub-advisers as of September 30, 2013: J.P. Morgan Investment Management Inc., Lee Munder Capital Group, LLC, and Quantitative Management Associates LLC.
No sub-advisers were added to or terminated from the Fund during the year ended September 30, 2013.
III. Market Commentary
U.S. equity markets (as measured by the Russell 3000 Index) advanced 21.60% in the 12 months ending September 30, 2013. Stocks lost ground leading up to Election Day in November and then trended upward over the remainder of the Fund’s fiscal year, as global macroeconomic concerns subsided and investor confidence in the sustainability of the U.S. economic recovery grew. Improving employment data and strength in housing- and auto-related industries helped diminish fear of a return to recession, and both modest economic growth and expanding valuation multiples pushed equity markets higher.
Small-cap stocks (as measured by the Russell 2000 Index), aided by the improving domestic economy and continuing accommodative monetary policy, gained 30.06% and outpaced the 20.91% advance in large-cap stocks (as measured by the Russell 1000 Index).
Mid-cap stocks, as defined by the Russell Midcap Index, climbed 27.91% and were led by the Industrials, Consumer Discretionary and Health Care sectors. The worst-performing small/mid-cap sectors were Utilities, Materials and Financials.
From a style perspective, both value and growth (as measured by the Russell Midcap Value Index and Russell Midcap Growth Index, respectively) were essentially in line with each other. Value stocks beat growth stocks modestly among large-cap stocks, and growth outperformed value by a meaningful margin among small-cap stocks.
IV. Return vs. Benchmark
For the year ended September 30, 2013, the Mid-Cap Fund, Class A, outperformed the Russell Midcap Index, returning 28.52% versus the Index return of 27.91%.
V. Fund Attribution
The Fund outperformed the Index due to favorable stock selection and a tailwind from sector allocation. Underweight positions in the real estate portion of the Financial sector and in the Utilities sector contributed to performance, as did an overweight to Industrials. Stock selection contributed in Consumer Discretionary, Financials, Materials and Health Care, offset in part by weak stock-picking results in Energy, Utilities, and Information Technology.
Mid-Cap Fund:
AVERAGE ANNUAL TOTAL RETURN1
| One Year Return | Annualized 3 Year Return | Annualized 5 Year Return | Annualized 10 Year Return | Annualized Inception to Date | ||||||||||||||||
| Mid-Cap Fund, Class A | 28.52% | 16.63% | 11.38% | 9.82% | 9.97% | |||||||||||||||
| Mid-Cap Fund, Class I | 28.20% | 16.33% | 11.14% | 9.54% | 9.66% | |||||||||||||||
| Russell Midcap Index | 27.91% | 17.53% | 12.97% | 10.78% | 11.15% | |||||||||||||||
Comparison of Change in the Value of a $100,000 Investment in the Mid-Cap Fund, Class A and Class I, versus the Russell Midcap Index
| 1 | For the period ended 9/30/13. Past performance is no indication of future performance. Class A Shares were offered beginning 2/16/93 and Class I Shares were offered beginning 10/01/07. The performance of Class I Shares prior to 10/01/07 is calculated using the performance of the fund’s Class A Shares adjusted for the higher expenses of the Class I Shares. Returns shown do not reflect the deduction of taxes that a shareholder would pay on fund distributions or the redemption of fund shares. The returns for certain periods reflect fee waivers and/or reimbursements in effect for that period; absent fee waivers and reimbursements, performance would have been lower. |
| SEI Institutional Managed Trust / Annual Report / September 30, 2013 | 11 |
MANAGEMENT’S DISCUSSION AND ANALYSIS OF FUND PERFORMANCE
SEI INSTITUTIONAL MANAGED TRUST — SEPTEMBER 30, 2013
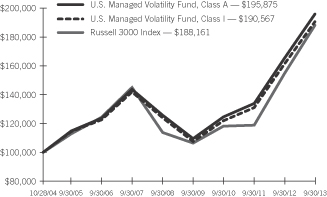
U.S. Managed Volatility Fund
I. Objective:
The U.S. Managed Volatility Fund (the “Fund”) seeks capital appreciation with less volatility than the broad U.S. equity markets.
II. Multi-Manager Approach Statement:
The Fund uses a multi-manager approach, relying on a number of sub-advisers with differing investment approaches to manage portions of the Fund’s portfolio under the general supervision of SEI Investments Management Corp. (“SIMC”). The Fund utilized the following sub-advisers as of September 30, 2013: Analytic Investors, LLC, AJO, L.P. and LSV Asset Management.
III. Market Commentary:
Due to the U.S. presidential election, looming fiscal cliff and the ongoing eurozone crisis, uncertainty and investor fears increased in autumn of 2012 which resulted in a slight market drawdown. The rally resumed at the end of 2012 after the U.S. elections, got momentum in the beginning of 2013 because of avoiding the U.S. fiscal cliff and the potential for additional easing from Japan, and continued through the end of May. With some volatility around the Federal Reserve’s expected tapering of its asset-purchases program and then not tapering, economies in the U.S. and around the world continued improving.
Optimism returned and cheap, pro-cyclical stocks benefited the most. As the value rally has now extended beyond the last 12 months, we are seeing momentum indicators acquiring pro-cyclical properties for the first time since the 2008 cycle. Thus, both trend followers and the bottom fishers are being attracted to the same economically sensitive stocks and enjoying the outperformance.
From a sector perspective, the cyclicals, namely consumer discretionary, financials, industrials and, interestingly, one defensive (healthcare) have outperformed the broad market. Value, as measured by book-to-price ratio, outperformed significantly. Lower-risk equities underperformed the broader market over the year.
IV. Return vs. Benchmark:
For the year ended September 30, 2013, the U.S. Managed Volatility Fund, Class A, underperformed the Russell 3000 Index, returning 18.39% versus the Index return of 21.60%.
V. Fund Attribution:
For the fiscal year, the Fund successfully achieved its primary objective of lowering volatility. However, with low-volatility names significantly lagging the broad market, the Fund experienced strong headwinds relative to the reference benchmark.
Sector allocation explains the underperformance, with overweights in Utilities and Consumer Staples and underweights to Industrials and Consumer Discretionary being the biggest detractors. The Fund’s underweight to Energy partially mitigated the relative performance drag. Stock selection slightly mitigated the performance with the most positive stock selection being in Consumer Staples and Information Technology sectors.
A strategy focused on reducing volatility is expected to lag during strong market rallies, and the market appreciation over the last 12 months is a good example of that. The fully invested U.S. Managed Volatility Fund benefited from strong equity markets in absolute terms, but being focused on volatility reduction and anti-cyclical sectors, it did not fully keep up with the rally. The higher interest sensitivity of defensive sectors further dampened the returns in what was a rising interest rate environment, especially in the second half of the Fund’s fiscal year.
Adjusting for the low volatility profile, we believe the results were commendable. Volatility (as measured by standard deviation, a statistical measure of how widely returns are dispersed around their average) was reduced by 18% at the cost of less than a 10% return reduction, an attractive risk/reward profile even in burgeoning markets. However, the long-term volatility reduction target of 20% was undershot.
| 12 | SEI Institutional Managed Trust / Annual Report / September 30, 2013 |
MANAGEMENT’S DISCUSSION AND ANALYSIS OF FUND PERFORMANCE
SEI INSTITUTIONAL MANAGED TRUST — SEPTEMBER 30, 2013
U.S. Managed Volatility Fund:
AVERAGE ANNUAL TOTAL RETURN1
| One Year Return | Annualized 3 Year Return | Annualized 5 Year Return | Annualized Inception to Date | |||||||||||||
| U.S. Managed Volatility Fund, Class A | 18.39% | 16.29% | 9.25% | 7.82% | ||||||||||||
| U.S. Managed Volatility Fund, Class I | 18.10% | 16.00% | 8.97% | 7.49% | ||||||||||||
| Russell 3000 Index | 21.60% | 16.76% | 10.58% | 7.34% | ||||||||||||
Comparison of Change in the Value of a $100,000 Investment in the U.S. Managed Volatility Fund, Class A and Class I, versus the Russell 3000 Index
| 1 | For the period ended 9/30/13. Past performance is no indication of future performance. Class A Shares were offered beginning 10/28/04 and Class I Shares were offered beginning 6/29/07. The performance of Class I Shares prior to 06/29/07 is calculated using the performance of the fund’s Class A Shares adjusted for the higher expenses of the Class I Shares. Returns shown do not reflect the deduction of taxes that a shareholder would pay on fund distributions or the redemption of fund shares. The returns for certain periods reflect fee waivers and/or reimbursements in effect for that period; absent fee waivers and reimbursements, performance would have been lower. |
| SEI Institutional Managed Trust / Annual Report / September 30, 2013 | 13 |
MANAGEMENT’S DISCUSSION AND ANALYSIS OF FUND PERFORMANCE
SEI INSTITUTIONAL MANAGED TRUST — SEPTEMBER 30, 2013
Global Managed Volatility Fund
I. Objective:
The Global Managed Volatility Fund (the “Fund”) seeks capital appreciation with less volatility than the broad global equity markets.
II. Multi-Manager Approach Statement:
The Fund uses a multi-manager approach, relying on a number of sub-advisors with differing investment approaches to manage portions of the Fund’s portfolio under the general supervision of SEI Investments Management Corp. (“SIMC”). The Fund utilized the following sub-advisers as of September 30, 2013: Acadian Asset Management LLC and Analytic Investors, LLC. For the year ended September 30, 2013, no sub-adviser changes were made in the Fund.
III. Market Commentary:
Due to the U.S. presidential election, looming fiscal cliff and the ongoing eurozone crisis, uncertainty and investor fears increased in autumn of 2012 which resulted in a slight market drawdown. The rally resumed at the end of 2012 after the U.S. elections, got momentum in the beginning of 2013 because of avoiding the U.S. fiscal cliff and the potential for additional easing from Japan, and continued through the end of May. With some volatility around the Federal Reserve’s expected tapering of its asset-purchases program and then not tapering, economies in the U.S. and around the world continued improving.
Optimism returned and cheap, pro-cyclical stocks benefited the most. As the value rally has now extended beyond the last 12 months, we are seeing momentum indicators acquiring pro-cyclical properties for the first time since 2008 cycle. Thus, both trend followers and the bottom fishers are being attracted to the same economically sensitive stocks and enjoying the outperformance.
From a sector perspective, the cyclicals, namely Consumer Discretionary, Financials, Industrials and, interestingly, one defensive (Health Care) have outperformed the broad market. Value, as measured by book-to-price ratio, outperformed significantly. Lower-risk equities underperformed the broader market over the year.
IV. Return vs. Benchmark:
For the year ended September 30, 2013, the Global Managed Volatility Fund, Class A, underperformed the MSCI World 100% USD Hedged Index, returning 15.12% versus the index return of 22.18%.
V. Fund Attribution:
For the fiscal year, the Fund successfully reached its objective of smoothing market volatility. (Volatility is defined here as standard deviation, a statistical measure of how widely returns are dispersed around their average.) In currency-hedged terms, it realized an annualized intra-year standard deviation approximately 29% lower than that of the MSCI World 100% USD Hedged Index.
A strategy with a focus on reducing volatility is expected to lag during strong market rallies, and the market appreciation over the last 12 months is a good example of that. The overweight to lower-beta securities is a characteristic feature of the strategy, driving the bulk of relative return discrepancy over short time horizons. (Beta is a statistical measure of a security’s degree of co-movement with the broader market.) Over full market cycles, we expect the effect to be neutral on returns while reducing volatility. Driven by the same risk considerations, the Fund’s overweights to defensive sectors (Consumer Staples, Telecommunications, Health Care and Utilities) detracted. From a geographic perspective, an underweight in outperforming Europe was the biggest detractor, while stock selection mostly hurt in the U.S. and Japan.
Adjusting for the low volatility profile, we believe the results were good. A strategy with 29% volatility reduction (with volatility defined as standard deviation) at the cost of a 26% lower return offered an attractive risk/reward profile even in burgeoning markets.
Derivatives were used in the Fund in order to manage the risk of currency appreciation and depreciation. Currency forwards were used to sell foreign currencies against the U.S. dollar in order to mitigate the impact of currency movements on the Fund’s net asset value. The currency-hedging activity added slightly to the Fund’s returns.
| 14 | SEI Institutional Managed Trust / Annual Report / September 30, 2013 |
MANAGEMENT’S DISCUSSION AND ANALYSIS OF FUND PERFORMANCE
SEI INSTITUTIONAL MANAGED TRUST — SEPTEMBER 30, 2013
Global Managed Volatility Fund:
AVERAGE ANNUAL TOTAL RETURN1
| One Year Return | Annualized 3 Year Return | Annualized 5 Year Return | Annualized Inception to Date | |||||||||||||
Global Managed Volatility Fund, Class A | 15.12% | 11.18% | 4.54% | 2.43% | ||||||||||||
Global Managed Volatility Fund, Class I | 14.91% | 10.85% | 4.30% | 2.12% | ||||||||||||
| MSCI World 100% USD Hedged Index | 22.18% | 12.09% | 7.71% | 4.54% | ||||||||||||
Comparison of Change in the Value of a $100,000 Investment in the Global Managed Volatility Fund, Class A and Class I, versus the MSCI World 100% USD Hedged Index
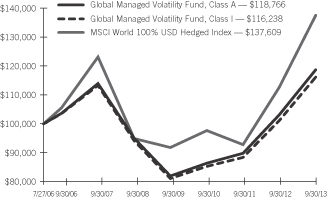
| 1 | For the period ended 9/30/13. Past performance is no indication of future performance. Class A Shares were offered beginning 7/27/06 and Class I Shares were offered beginning 6/29/07. The performance of Class I Shares prior to 06/29/07 is calculated using the performance of the fund’s Class A Shares adjusted for the higher expenses of the Class I Shares. Returns shown do not reflect the deduction of taxes that a shareholder would pay on fund distributions or the redemption of fund shares. The returns for certain periods reflect fee waivers and/or reimbursements in effect for that period; absent fee waivers and reimbursements, performance would have been lower. |
| SEI Institutional Managed Trust / Annual Report / September 30, 2013 | 15 |
MANAGEMENT’S DISCUSSION AND ANALYSIS OF FUND PERFORMANCE
SEI INSTITUTIONAL MANAGED TRUST — SEPTEMBER 30, 2013
Tax-Managed Managed Volatility Fund
I. Objective:
The Tax-Managed Managed Volatility Fund (“the Fund”) seeks to maximize after-tax returns, but with a lower level of volatility than the broad U.S. equity markets.
II. Multi-Manager Approach Statement:
The Fund uses a multi-manager approach, relying on a number of sub-advisors with differing investment approaches to manage portions of the Fund’s portfolio under the general supervision of SEI Investments Management Corp. (“SIMC”). The Fund utilized the following sub-advisors as of September 30, 2013: AJO, L.P., Analytic Investors, LLC, LSV Asset Management and Parametric Portfolio Associates.
III. Market Commentary:
Due to the U.S. presidential election, looming fiscal cliff and the ongoing eurozone crisis, uncertainty and investor fears increased in autumn of 2012 which resulted in a slight market drawdown. The rally resumed at the end of 2012 after the U.S. elections, got momentum in the beginning of 2013 because of avoiding the U.S. fiscal cliff and the potential for additional easing from Japan, and continued through the end of May. With some volatility around the Federal Reserve’s expected tapering of its asset-purchases program and then not tapering, economies in the U.S. and around the world continued improving.
Optimism returned and cheap, pro-cyclical stocks benefited the most. As the value rally has now extended beyond the last 12 months, we are seeing momentum indicators acquiring pro-cyclical properties for the first time since 2008 cycle. Thus, both trend followers and the bottom fishers are being attracted to the same economically sensitive stocks and enjoying the outperformance.
From a sector perspective, the cyclicals, namely consumer discretionary, financials, industrials and, interestingly, one defensive (healthcare) have outperformed the broad market. Value, as measured by book-to-price ratio, outperformed significantly. Lower-risk equities underperformed the broader market over the year.
IV. Return vs. Benchmark:
For the year ended September 30, 2013, the Tax-Managed Managed Volatility Fund, Class A, underperformed the Russell 3000 Index, returning 18.24% versus the Index return of 21.60%.
V. Fund Attribution:
For the fiscal year, the Fund successfully achieved its primary objective of lowering volatility. However, with low-volatility names significantly lagging the broad market, the Fund experienced strong headwinds relatively to the reference benchmark.
Sector allocation explains the underperformance, with overweights in Utilities and Consumer Staples and underweights to Industrials and Consumer Discretionary being the biggest detractors. The Fund’s underweight to Energy partially mitigated the relative performance drag. Stock selection slightly helped, especially in Consumer Staples and Information Technology.
A strategy focused on reducing volatility is expected to lag during strong market rallies, and the appreciation over the last 12 months is a good example of that. The fully invested Tax-Managed Managed Volatility Fund benefited from strong equity markets in absolute terms, but being focused on volatility reduction and anti-cyclical sectors, it did not fully keep up with the rally. The higher interest sensitivity of defensive sectors further dampened the returns in what was a rising interest rate environment, especially in the second half of the Fund’s fiscal year.
Adjusting for the low volatility profile, we believe the results were commendable. Volatility (measured by standard deviation, a statistical measure of how widely returns are dispersed around their average) was 19% lower than the market (as measured by the Russell 3000 Index) while returns were 10% lower, offering an attractive risk/reward profile even in burgeoning markets. However, the long-term volatility reduction target of 20% was undershot.
| 16 | SEI Institutional Managed Trust / Annual Report / September 30, 2013 |
MANAGEMENT’S DISCUSSION AND ANALYSIS OF FUND PERFORMANCE
SEI INSTITUTIONAL MANAGED TRUST — SEPTEMBER 30, 2013
Tax-Managed Managed Volatility Fund:
AVERAGE ANNUAL TOTAL RETURN1
| One Year Return | Annualized 3 Year Return | Annualized 5 Year Return | Annualized Inception to Date | |||||||||||||
| Tax-Managed Managed Volatility Fund, Class A | 18.24% | 15.52% | 10.24% | 6.99% | ||||||||||||
| Russell 3000 Index | 21.60% | 16.76% | 10.58% | 5.32% | ||||||||||||
Comparison of Change in the Value of a $100,000 Investment in the Tax-Managed Managed Volatility Fund, Class A, versus the Russell 3000 Index
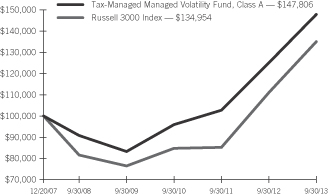
| 1 | For the period ended 9/30/13. Past performance is no indication of future performance. Fund shares were offered beginning 12/20/07. Returns shown do not reflect the deduction of taxes that a shareholder would pay on fund distributions or the redemption of fund shares. The returns for certain periods reflect fee waivers and/or reimbursements in effect for that period; absent fee waivers and reimbursements, performance would have been lower. |
| SEI Institutional Managed Trust / Annual Report / September 30, 2013 | 17 |
MANAGEMENT’S DISCUSSION AND ANALYSIS OF FUND PERFORMANCE
SEI INSTITUTIONAL MANAGED TRUST — SEPTEMBER 30, 2013
Real Estate Fund
I. Objective
The Real Estate Fund (the “Fund”) seeks to provide total return, including current income and capital appreciation.
II. Multi-Manager Approach Statement
The Fund uses a multi-manager approach, relying on a number of sub-advisers with differing investment approaches to manage portions of the Fund’s portfolio, under the general supervision of SEI Investments Management Corporation (“SIMC”). The Fund utilized the following sub-advisers as of September 30, 2013: CenterSquare Investment Management (formerly known as Urdang Capital Management Inc.) and Security Capital Research and Management, Inc. There were no manager changes during the year ended September 30, 2013.
III. Market Commentary
U.S. equity markets, as measured by the Russell 3000 Index, gained 21.60% for the year ended September 30, 2013. Stocks lost ground leading up to Election Day in November, and then trended upward over the remainder of the Fund’s fiscal year as global macroeconomic concerns subsided and investor confidence in the sustainability of the U.S. economic recovery grew. Improving employment data and strength in housing- and auto-related industries help diminish fear of a return to recession, and both modest economic growth and expanding valuation multiples pushed equity markets higher.
Small-cap stocks, as measured by the Russell 2000 Index, aided by the improving domestic economy and continuing accommodative monetary policy, gained 30.06% and outpaced the 20.91% advance in large-cap stocks, as measured by the Russell 1000 Index.
From a style perspective, value stocks (as defined by the Russell Value Indices) outperformed growth stocks (Russell Growth Indices) in the large-cap universe but growth outperformed value among small-cap stocks.
Real-estate stocks, as measured by the Wilshire U.S. Real Estate Securities Index (gained 5.47% for the year ended September 30, 2013, lagging the broader equities market by a wide margin. Storage and hotels were the leading real estate segments, while residential and retail lagged.
IV. Return vs. Benchmark
For the year ended September 30, 2013, the Real Estate Fund, Class A, underperformed the Wilshire U.S. Real Estate Securities Index, returning 4.30% versus the Index return of 5.47%.
V. Fund Attribution
The Fund benefited from stock selection in the Industrials segment. The Fund’s underweight to the Health Care area was additive as well. However, stock picking results were poor in the office space and were a drag on performance in the hotel and storage areas as well.
Real Estate Fund:
AVERAGE ANNUAL TOTAL RETURN1
| One Year Return | Annualized 3 Year Return | Annualized 5 Year Return | Annualized Inception to Date | |||||||||||||
| Real Estate Fund, Class A | 4.30% | 11.41% | 4.66% | 8.55% | ||||||||||||
| Real Estate Fund, Class I | 4.09% | 11.17% | 4.45% | 8.30% | ||||||||||||
| Wilshire U.S. Real Estate Securities Index | 5.47% | 12.43% | 5.49% | 9.02% | ||||||||||||
Comparison of Change in the Value of a $100,000 Investment in the Real Estate Fund, Class A or Class I, versus the Wilshire U.S. Real Estate Securities Index
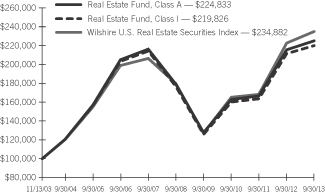
| 1 | For the period ended 9/30/13. Past performance is no indication of future performance. Class A Shares were offered beginning 11/13/03 and Class I Shares were offered beginning 10/01/07. The performance of Class I Shares prior to 10/01/07 is calculated using the performance of the fund’s Class A Shares adjusted for the higher expenses of the Class I Shares. Returns shown do not reflect the deduction of taxes that a shareholder would pay on fund distributions or the redemption of fund shares. The returns for certain periods reflect fee waivers and/or reimbursements in effect for that period; absent fee waivers and reimbursements, performance would have been lower. |
| 18 | SEI Institutional Managed Trust / Annual Report / September 30, 2013 |
MANAGEMENT’S DISCUSSION AND ANALYSIS OF FUND PERFORMANCE
SEI INSTITUTIONAL MANAGED TRUST — SEPTEMBER 30, 2013
Enhanced Income Fund
I. Objective
Using multiple sub-advisers, the Enhanced Income Fund (the “Fund”) seeks to provide an enhanced return above the three-month London Inter Bank Offering Rate (“LIBOR”).
II. Multi-Manager Approach Statement
The Fund uses a multi-manager approach, relying on a number of sub-advisers with differing investment approaches to manage portions of the Fund’s portfolio, under the general supervision of SEI Investments Management Corp. (“SIMC”). The Fund utilized the following sub-advisers as of September 30, 2013: Ares Management LLC, and Wellington Management Company, LLP . No manager changes were made during the year ended September 30, 2013.
III. Market Commentary
The U.S. fixed-income market took a rollercoaster ride for the year ended September 30, 2013. Non-treasury sectors started the period with strong performance, thanks to the global central banks’ accommodative policies. In 2012, the European Central Bank launched two rounds of Long-term Refinancing Operation (“LTRO”), which helped alleviate short-term funding pressure in the eurozone. In U.S., the Federal Reserve (the “Fed”) continued Operation Twist until December 2012, and started its third quantitative easing program (“QE3”) to purchase $85 billion of agency mortgage-backed and long-term Treasury securities every month. In addition, economic and corporate fundamentals continued to improve, while inflation remained benign in U.S. The housing market experienced a strong recovery, with the S&P/Case-Shiller national price index up double digits from a year ago. The non-agency mortgage-backed securities (“MBS”) market saw strong price appreciation over the year, helped by improving credit fundamentals and attractive valuations. After a few years of deleverage, corporations (especially financial companies) have much stronger balance sheets and solid earnings. The primary issuance was robust, which has been met with strong demand from investors.
Then the market turned a corner at the beginning of May 2013, as the fear of the Fed’s tapering of QE3 caused the surge of interest rates and triggered a broad market selloff. The 10-year Treasury yield rose
from around 1.6% at the beginning of May to almost 3% at the beginning of September. Credit spreads widened across the sectors, and fixed-income funds witnessed the largest cash outflow since beginning of the year. Liquidity was hammered and dealer balance sheets were constrained. Agency MBS were hit especially hard, as the sharp rise in Treasury yields resulted in significant extension risk, and the QE uncertainty caused selling from real estate investment trusts and overseas investors.
By mid-September, the Fed surprisingly announced its decision to not taper asset purchases and gave a more dovish economic forecast. The 10-year Treasury yield fell on the news, settling around 2.6% at the end of September; non-Treasury sectors rallied across the board. Agency MBS benefited the most, as Fed purchases will continue to support the market. Non-agency MBS and commercial MBS (“CMBS”) also recovered, as investor demand quickly picked up with the rally in other risky assets.
IV. Return vs. Benchmark
For year ended September 30, 2013, the Enhanced Income Fund, Class A, outperformed the BofA Merrill Lynch 3-Month LIBOR Constant Maturity Index, returning 2.50% versus the Index return of 0.28%.
V. Fund Attribution
The Fund outperformed its benchmark, benefiting from an allocation to bank loans as the Credit Suisse Leveraged Loan Index returned 5.83% during the period on investors’ desire for yield and safety along with an aversion to interest-rate risk leading to record-setting investor inflows. The Fund’s allocation to corporate (particularly financials) aided relative performance, as the sector was perceived as a safe haven from the troubled industrial/TMT sectors, where leveraged buyouts and shareholder-friendly activity has increased. The steep yield curve, combined with improved access to capital markets, allowed the largest of the U.S. banking institutions to strengthen their balance sheets and sustain profitability over the course of the year. An allocation to agency MBS contributed, as MBS rallied in response to the Fed’s decision to maintain its asset-purchase program. An allocation to seasoned senior CMBS tranches added to performance, as the sector benefited from investors’ yield appetite and the Fed’s
| SEI Institutional Managed Trust / Annual Report / September 30, 2013 | 19 |
MANAGEMENT’S DISCUSSION AND ANALYSIS OF FUND PERFORMANCE
SEI INSTITUTIONAL MANAGED TRUST — SEPTEMBER 30, 2013
Enhanced Income Fund (Concluded)
announcement of QE3. The Fund used derivatives, primarily Treasury futures, throughout the one-year period as a way to manage duration, yield-curve positioning and spread duration in a more efficient manner.
Enhanced Income Fund:
AVERAGE ANNUAL TOTAL RETURN1
| One Year Return | Annualized 3 Year Return | Annualized 5 Year Return | Annualized Inception to Date | |||||||||||||
| Enhanced Income Fund, Class A | 2.50% | 2.86% | 1.00% | (0.59)% | ||||||||||||
| Enhanced Income Fund, Class I | 2.17% | 2.59% | 0.71% | (0.93)% | ||||||||||||
| BofA Merrill Lynch 3-Month LIBOR Constant Maturity Index | 0.28% | 0.34% | 0.73% | 1.95% | ||||||||||||
Comparison of Change in the Value of a $100,000 Investment in the SIMT Enhanced Income Fund, Class A or Class I, versus the BofA Merrill Lynch 3-Month LIBOR Constant Maturity Index
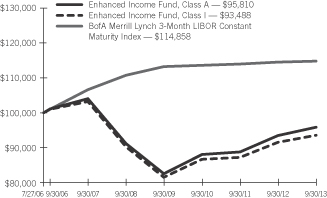
| 1 | For the period ended 9/30/13. Past performance is no indication of future performance. Class A Shares were offered beginning 7/27/06 and Class I Shares were offered beginning 6/29/07. The performance of Class I Shares prior to 6/29/07 is calculated using the performance of the fund’s Class A Shares adjusted for the higher expenses of the Class I Shares. Returns shown do not reflect the deduction of taxes that a shareholder would pay on fund distributions or the redemption of fund shares. The returns for certain periods reflect fee waivers and/or reimbursements in effect for that period; absent fee waivers and reimbursements, performance would have been lower. |
| 20 | SEI Institutional Managed Trust / Annual Report / September 30, 2013 |
MANAGEMENT’S DISCUSSION AND ANALYSIS OF FUND PERFORMANCE
SEI INSTITUTIONAL MANAGED TRUST — SEPTEMBER 30, 2013
Core Fixed Income Fund
I. Objective
The Core Fixed Income Fund (the “Fund”) seeks to provide current income consistent with the preservation of capital.
II. Multi-Manager Approach Statement
The Fund uses a multi-manager approach, relying on a number of sub-advisers with differing investment approaches to manage portions of the Fund’s portfolio, under the general supervision of SEI Investments Management Corporation (“SIMC”). The Fund utilized the following sub-advisers as of September 30, 2013: Jennison Associates, LLC, Trust Company of the West (formerly Metropolitan West Asset Management), Wells Capital Management, Inc., Western Asset Management Company and Western Asset Management Company Limited. There were no manager changes during the year ended September 30, 2013.
III. Market Commentary
The U.S. fixed-income market took a rollercoaster ride for the year ended September 30, 2013. Non-Treasury sectors started the period with strong performance, thanks to the global central banks’ accommodative policies. In 2012, the European Central Bank launched two rounds of Long-term Refinancing Operation, which helped alleviate short-term funding pressure in the eurozone. In the U.S., the Federal Reserve (the “Fed”) continued Operation Twist until December 2012, and started its third quantitative-easing program (“QE3”) to purchase $85 billion of agency mortgage-backed and long-term Treasury securities every month. In addition, economic and corporate fundamentals continued to improve, while inflation remained benign in the U.S. The housing market experienced strong recovery, with the S&P/Case-Shiller national price index up double digits from a year ago. The non-agency mortgage-backed securities (“MBS”) market saw strong price appreciation over the year, helped by improving credit fundamentals and attractive valuations. After a few years of deleverage, we believe that corporations (especially financial companies) have much stronger balance sheets and solid earnings. The primary issuance was robust, which has been met with strong demand from investors.
The market turned a corner at the beginning of May 2013, as fear of the Fed tapering QE3 caused a surge in interest rates and triggered a
broad market selloff. The 10-year Treasury yield rose from around 1.6% at the beginning of May to almost 3% at the beginning of September. Credit spreads widened across the sectors, and fixed-income funds witnessed the largest cash outflow since the beginning of the year. Liquidity declined and dealer balance sheets were constrained. Agency MBS were hit especially hard, as the sharp rise in Treasury yields resulted in significant duration extension and QE uncertainty caused selling from real estate investment trusts and overseas investors.
By mid-September, the Fed surprisingly announced its decision to not taper asset purchases and gave a more dovish economic forecast. The 10-year Treasury yield fell on the news, settling around 2.6% at the end of September; non-Treasury sectors rallied across the board. Agency MBS benefited the most, as we expect Fed purchases to continue supporting the market. Non-agency MBS and commercial MBS (“CMBS”) also recovered, as investor demand quickly picked up with the rally in other risky assets.
IV. Return vs. Benchmark
For the year ended September 30, 2013, the Core Fixed Income Fund, Class A, outperformed the Barclays Capital U.S. Aggregate Bond Index, returning (1.00)% versus the Index return of (1.68)%.
V. Fund Attribution
The Fund’s overweight positions in corporate bonds, non-agency MBS and commercial mortgage-backed securities (“CMBS”) were the key drivers of performance. Duration exposure that was shorter than the benchmark also had a positive impact on performance, as Treasury yields rose during the period. Treasury futures were utilized to help manage the Fund’s duration and yield-curve exposure.
An overweight to large financials generated significant outperformance relative to Treasurys. The steep yield curve, combined with improved access to capital markets, allowed the largest U.S. banking institutions to strengthen their balance sheets and sustain profitability over the course of the year.
Non-agency mortgages continued to perform well, as the sector experienced price appreciation as a result of an improving housing market, principal pay downs and a negative net supply.
| SEI Institutional Managed Trust / Annual Report / September 30, 2013 | 21 |
MANAGEMENT’S DISCUSSION AND ANALYSIS OF FUND PERFORMANCE
SEI INSTITUTIONAL MANAGED TRUST — SEPTEMBER 30, 2013
Core Fixed Income Fund (Concluded)
Finally, the Fund’s overweight to the CMBS sector contributed to performance. The Fund bought credit protection by utilizing credit default swaps on a basket of CMBS, which assisted in partially hedging systematic risk associated with the portfolio’s CMBS exposure. A modest allocation to high-yield corporate bonds also contributed, as the sector benefitted from improved corporate fundamentals and low default rates.
Core Fixed Income Fund:
AVERAGE ANNUAL TOTAL RETURN1
| One Year Return | Annualized 3 Year Return | Annualized 5 Year Return | Annualized 10 Year Return | Annualized Inception to Date | ||||||||||||||||
| Core Fixed Income Fund, Class A | (1.09)% | 4.26% | 7.82% | 5.01% | 6.65% | |||||||||||||||
| Core Fixed Income Fund, Class I | (1.31)% | 4.03% | 7.59% | 4.76% | 6.23% | |||||||||||||||
| Barclays Capital U.S. Aggregate Bond Index | (1.68)% | 2.86% | 5.41% | 4.59% | 6.91% | |||||||||||||||
Comparison of Change in the Value of a $100,000 Investment in the Core Fixed Income Fund, Class A and Class I, versus the Barclays Capital U.S. Aggregate Bond Index
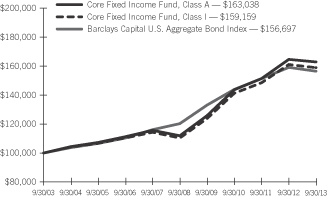
| 1 | For the period ended 9/30/13. Past performance is no indication of future performance. Class A Shares were offered beginning 5/1/87 and Class I Shares were offered beginning 8/6/01. The performance of Class I Shares prior to 8/6/01 is calculated using the performance of the fund’s Class A Shares adjusted for the higher expenses of the Class I Shares. Returns shown do not reflect the deduction of taxes that a shareholder would pay on fund distributions or the redemption of fund shares. The returns for certain periods reflect fee waivers and/or reimbursements in effect for that period; absent fee waivers and reimbursements, performance would have been lower. |
| 22 | SEI Institutional Managed Trust / Annual Report / September 30, 2013 |
MANAGEMENT’S DISCUSSION AND ANALYSIS OF FUND PERFORMANCE
SEI INSTITUTIONAL MANAGED TRUST — SEPTEMBER 30, 2013
U.S. Fixed Income Fund
I. Objective
The U.S. Fixed Income Fund (the “Fund”) seeks to provide current income consistent with the preservation of capital.
II. Multi-Manager Approach Statement
The Fund uses a multi-manager approach, relying on a number of sub-advisers with differing investment approaches to manage portions of the Fund’s portfolio, under the general supervision of SEI Investments Management Corp. (“SIMC”). The Fund utilized the following sub-advisers as of September 30, 2013: Jennison Associates LLC, J.P. Morgan Investment Management, Inc., Trust Company of the West (formerly Metropolitan West Asset Management), Wells Capital Management, Inc., Western Asset Management Company and Western Asset Management Company Limited. There were no manager changes during the year ended September 30, 2013.
III. Market Commentary
The U.S. fixed-income market took a rollercoaster ride for the year ended September 30, 2013. Non-Treasury sectors started the period with strong performance, thanks to the global central banks’ accommodative policies. In 2012, the European Central Bank launched two rounds of Long-term Refinancing Operation, which helped alleviate short-term funding pressure in the eurozone. In the U.S., the Federal Reserve (the “Fed”) continued Operation Twist until December 2012, and started its third quantitative-easing program (“QE3”) to purchase $85 billion of agency mortgage-backed and long-term Treasury securities every month. In addition, economic and corporate fundamentals continued to improve, while inflation remained benign in the U.S. The housing market experienced strong recovery, with the S&P/Case-Shiller national price index up double digits from a year ago. The non-agency mortgage-backed securities (“MBS”) market saw strong price appreciation over the year, helped by improving credit fundamentals and attractive valuations. After a few years of deleverage, we believe that corporations (especially financial companies) have much stronger balance sheets and solid earnings. The primary issuance was robust, which has been met with strong demand from investors.
The market turned a corner at the beginning of May 2013, as fear of the Fed tapering QE3 caused a surge in interest rates and triggered a
broad market selloff. The 10-year Treasury yield rose from around 1.6% at the beginning of May to almost 3% at the beginning of September. Credit spreads widened across the sectors, and fixed-income funds witnessed the largest cash outflow since the beginning of the year. Liquidity declined and dealer balance sheets were constrained. Agency MBS were hit especially hard, as the sharp rise in Treasury yields resulted in significant duration extension and QE uncertainty caused selling from real estate investment trusts and overseas investors.
By mid-September, the Fed surprisingly announced its decision to not taper asset purchases and gave a more dovish economic forecast. The 10-year Treasury yield fell on the news, settling around 2.6% at the end of September; non-Treasury sectors rallied across the board. Agency MBS benefited the most, as we expect Fed purchases to continue supporting the market. Non-agency MBS and commercial MBS (“CMBS”) also recovered, as investor demand quickly picked up with the rally in other risky assets.
IV. Return vs. Benchmark
For the year ended September 30, 2013, the U.S. Fixed Income Fund, Class A, outperformed the Barclays Capital U.S. Aggregate Bond Index, returning (1.61%) versus the Index return of (1.68%).
V. Fund Attribution
The Fund’s overweight positions in corporate bonds, non-agency MBS and CMBS were the key drivers of performance. Duration exposure that was shorter than the benchmark also had a positive impact on performance, as Treasury yields rose during the period. Treasury futures were utilized to help manage the Fund’s duration and yield-curve exposure.
An overweight to large financials generated significant outperformance relative to Treasurys. The steep yield curve, combined with improved access to capital markets, allowed the largest U.S. banking institutions to strengthen their balance sheets and sustain profitability over the course of the year.
Non-agency mortgages continued to perform well, as the sector experienced price appreciation as a result of an improving housing market, principal pay downs and a negative net supply.
| SEI Institutional Managed Trust / Annual Report / September 30, 2013 | 23 |
MANAGEMENT’S DISCUSSION AND ANALYSIS OF FUND PERFORMANCE
SEI INSTITUTIONAL MANAGED TRUST — SEPTEMBER 30, 2013
U.S. Fixed Income Fund (Concluded)
Finally, the Fund’s overweight to the CMBS sector contributed to performance. The Fund bought credit protection by utilizing credit default swaps on a basket of CMBS, which assisted in partially hedging systematic risk associated with the portfolio’s CMBS exposure. A modest allocation to high-yield corporate bonds also contributed, as the sector benefitted from improved corporate fundamentals and low default rates.
U.S. Fixed Income Fund:
AVERAGE ANNUAL TOTAL RETURN1
| One Year Return | Annualized 3 Year Return | Annualized Inception to Date | ||||||||||
| U.S. Fixed Income Fund, Class A | (1.61)% | 3.44% | 5.43% | |||||||||
| Barclays Capital U.S. Aggregate Bond Index | (1.68)% | 2.86% | 4.74% | |||||||||
Comparison of Change in the Value of a $100,000 Investment in the U.S. Fixed Income Fund, Class A, versus the Barclays Capital U.S. Aggregate Bond Index
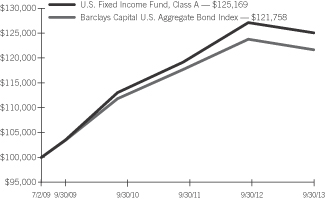
| 1 | For the period ended 9/30/13. Past performance is no indication of future performance. Class A shares were offered beginning 7/2/09. Returns shown do not reflect the deduction of taxes that a shareholder would pay on fund distributions or the redemption of fund shares. The returns for certain periods reflect fee waivers and/or reimbursements in effect for that period; absent fee waivers and reimbursements, performance would have been lower. |
| 24 | SEI Institutional Managed Trust / Annual Report / September 30, 2013 |
MANAGEMENT’S DISCUSSION AND ANALYSIS OF FUND PERFORMANCE
SEI INSTITUTIONAL MANAGED TRUST — SEPTEMBER 30, 2013
High Yield Bond Fund
I. Objective
The High Yield Bond Fund (the “Fund”) seeks total return.
II. Multi-Manager Approach Statement
The Fund uses a multi-manager approach, relying on a number of sub-advisers with differing investment approaches to manage portions of the Fund’s portfolio, under the general supervision of SEI Investments Management Corp. (“SIMC”). The Fund utilized the following sub-advisors as of September 30, 2013: Ares Management LLC, Brigade Capital Management, LLC, Delaware Investments Fund Advisers, Guggenheim Partners Investment Management, LLC and J.P. Morgan Investment Management, Inc.
III. Market Commentary
For the year ended September 30, 2013, the high-yield market, as measured by the BoA Merrill Lynch U.S. High Yield Constrained Index, returned 7.09%. Returns were strong at the beginning of the Fund’s fiscal year and continued unabated into early May before turning negative when the U.S. Federal Reserve (the “Fed”) began talking about tapering its asset purchase program. Capital markets sold off through the late spring and early summer months of 2013 before rebounding into the Fund’s fiscal year end. The high-yield market has been supported by solid fundamentals, robust issuance and a benign inflation outlook. Fundamentals within the universe of high-yield companies remain strong, with leverage ratios declining, improving free cash flows, expense reductions and modest expansion of top-line growth (but managements are more guarded about future growth). During the fiscal year, issuance totaled $415.7 billion, establishing a new 12-month issuance record. The market received support with nearly 57% of the proceeds utilized for refinancing purposes, keeping a lid on the amount of outstanding bonds and enabling companies to reduce debt-service costs. Cash flows into the asset class from both retail and institutional investors were negative over the course of the year and contributed to the volatility, with several weeks of flows in excess of +/- $1 billion after the Fed “taper talk” in May. According to Moody’s, the U.S. default rate rose to 3.4% before declining to 2.8% at the end of the period, which remains below the long-term historical average of 4.6%. Strong demand for high-yield securities early in the period enabled yields to establish a
new record low of 4.99% in early May before rising to 6.85% and ending the fiscal year at 5.71%. Spreads narrowed 88 basis points during the fiscal year, ending at 486 basis points on a combination of improving fundamentals and rising U.S. Treasury yields. With generally solid market returns, lower quality bonds outperformed higher quality bonds again with CCCs returning 12.51%, followed by Bs at 7.48% and BBs at 4.75%.
Returns were positive and broad-based, with all of the BofA Merrill Lynch sectors producing positive returns for the year. Top-performing sectors included basic industry and insurance, while the worst-performing sector was utilities.
IV. Return vs. Benchmark
For the year ended September 30, 2013, the High Yield Bond Fund, Class A, outperformed the BofA Merrill Lynch U.S. High Yield Constrained Index, returning 7.39% versus the Index return of 7.09%.
V. Fund Attribution
The Fund’s allocation to collateralized loan obligations enhanced performance, as strong new issuance, robust demand and concerns about rising interest rates all served to support the market. Selection in the Energy sector added to returns, as some of the Fund’s holdings benefited from merger and acquisition activity along with refinancing. Selection in the services sector also contributed, especially within transportation and construction companies. An underweight to and selection within the underperforming Utility sector benefited. Detracting from performance was selection in the basic industry sector, especially within metals and mining companies, which struggled with stagnant commodity prices. Selection within the Health Care sector subtracted, as several service and facility operators struggled with reduced government reimbursement rates. An allocation to municipal tobacco bonds did not benefit returns, as those securities underperformed taxable high-yield securities.
| SEI Institutional Managed Trust / Annual Report / September 30, 2013 | 25 |
MANAGEMENT’S DISCUSSION AND ANALYSIS OF FUND PERFORMANCE
SEI INSTITUTIONAL MANAGED TRUST — SEPTEMBER 30, 2013
High Yield Bond Fund (Concluded)
High Yield Bond Fund:
AVERAGE ANNUAL TOTAL RETURN1
| One Year Return | Annualized 3 Year Return | Annualized 5 Year Return | Annualized 10 Year Return | Annualized Inception to Date | ||||||||||||||||
| High Yield Bond Fund, Class A | 7.39% | 9.29% | 12.24% | 7.73% | 7.70% | |||||||||||||||
| High Yield Bond Fund, Class I | 7.19% | 8.12% | 11.44% | 7.29% | 7.42% | |||||||||||||||
| BofA Merrill Lynch U.S. High Yield Constrained Index | 7.09% | 8.86% | 13.39% | 8.71% | N/A | |||||||||||||||
Comparison of Change in the Value of a $100,000 Investment in the High Yield Bond Fund, Class A or Class I, versus the BofA Merrill Lynch U.S. High Yield Constrained Index
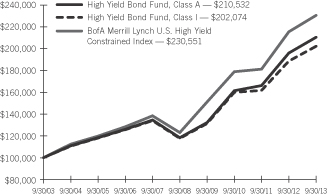
| 1 | For the period ended 9/30/13. Past performance is no indication of future performance. Class A Shares were offered beginning 1/11/95 and Class I Shares were offered beginning 10/01/07. The performance of Class I Shares prior to 10/01/07 is calculated using the performance of the fund’s Class A Shares adjusted for the higher expenses of the Class I Shares. Returns shown do not reflect the deduction of taxes that a shareholder would pay on fund distributions or the redemption of fund shares. The returns for certain periods reflect fee waivers and/or reimbursements in effect for that period; absent fee waivers and reimbursements, performance would have been lower. |
| 26 | SEI Institutional Managed Trust / Annual Report / September 30, 2013 |
MANAGEMENT’S DISCUSSION AND ANALYSIS OF FUND PERFORMANCE
SEI INSTITUTIONAL MANAGED TRUST — SEPTEMBER 30, 2013
Real Return Fund
I. Objective
The Real Return Fund (the “Fund”) seeks to provide total return exceeding the rate of inflation.
II. Multi-Manager Approach
The Fund uses a sub-adviser to manage the Fund under the supervision of SEI Investments Management Corporation (“SIMC”). As of May 16, 2013, the Fund replaced Wellington Management Company, LLC with the SEI Fixed Income Portfolio Management Team.
III. Market Commentary
The U.S. fixed-income market took a rollercoaster ride for the 12-month period ending September 30, 2013. Non-Treasury sectors started the period with strong performance, thanks to global central banks’ accommodative policies. In addition, economic and corporate fundamentals continued to improve, while inflation remained benign in the U.S. The housing market experienced a strong recovery, with the S&P/Case-Shiller national home price index up double digits from a year ago, driven in part by low supply of new and existing homes.
The market turned a corner in May 2013, as fears that the Federal Reserve (the “Fed”) would taper its asset-purchase program caused interest rates to surge and triggered a broad market selloff. The 10-year Treasury yield rose from around 1.6% at the beginning of May to almost 3% at the beginning of September. By mid-September, the Fed surprised markets by announcing it would not taper its asset purchases and by giving a more dovish economic forecast. Ten-year Treasury yields fell on the news, settling around 2.6% at the end of September, and non-Treasury sectors rallied across the board. Over the past year, five-year and 10-year TIPS real yields rose 96 and 121 basis points, respectively, to (0.56)% and 0.42%—reflecting tame inflation expectations, fears of the Fed being less accommodative, and the market implying real economic growth. The five-year TIPS breakeven inflation rate (which is the difference in yield between nominal Treasurys and TIPS of a similar maturity) narrowed from 2.2% to 1.9%, resulting in TIPS underperforming their nominal Treasury counterparts for the one-year period.
IV. Return vs. Benchmark
For the year ended September 30, 2013, the Real Return Fund, Class A, performed in line with the Barclays Capital 1-5 Year U.S. TIPS Index, returning (1.72)% versus the Index return of (1.28)%.
V. Fund Attribution
The Fund underperformed the benchmark. Curve positioning as well as tactical and timely allocations to nominal Treasurys helped performance, while security selection detracted.
Real Return Fund:
AVERAGE ANNUAL TOTAL RETURN1
| One Year Return | Annualized 3 Year Return | Annualized Inception to Date | ||||||||||
| Real Return Fund, Class A | (1.72)% | 1.78% | 2.93% | |||||||||
| Barclays Capital 1-5 Year U.S. TIPS Index | (1.28)% | 2.17% | 3.33% | |||||||||
Comparison of Change in the Value of a $100,000 Investment in the Real Return Fund, Class A, versus the Barclays Capital 1-5 Year U.S. TIPS Index
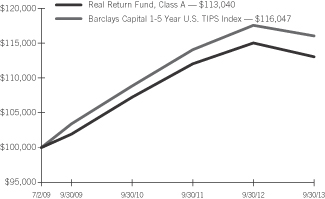
| 1 | For the period ended 9/30/13. Past performance is no indication of future performance. Class A shares were offered beginning 7/2/09. Returns shown do not reflect the deduction of taxes that a shareholder would pay on fund distributions or the redemption of fund shares. The returns for certain periods reflect for waivers and/or reimbursements in effect for that period; absent fee waivers and reimbursements, performance would have been lower. |
| SEI Institutional Managed Trust / Annual Report / September 30, 2013 | 27 |
MANAGEMENT’S DISCUSSION AND ANALYSIS OF FUND PERFORMANCE
SEI INSTITUTIONAL MANAGED TRUST — SEPTEMBER 30, 2013
Multi-Strategy Alternative Fund
I. Objective
The Multi-Strategy Alternative Fund (the “Fund”) allocates its assets among a variety of investment strategies to seek to generate an absolute return with reduced correlation to the stock and bond markets.
II. Multi-Manager Approach Statement
The Fund’s assets are managed under the direction of SEI Investments Management Corporation (“SIMC”), which manages the Fund’s assets in a way that it believes will achieve the Fund’s investment objective. In order to achieve its investment objective, the Fund may allocate its assets among a variety of investment strategies through the use of: (i) affiliated and unaffiliated funds, including open-end funds, closed-end funds and exchange traded funds (“Underlying Funds”); and (ii) one or more investment sub-advisers. The Fund currently allocates assets to one sub-adviser, Turner Investments, LP (“Turner”), pursuant to SIMC’s “manager-of-managers” model, and such sub-adviser manages a portion of the Fund’s portfolio under the general supervision of SIMC.
III. Market Commentary
For the year ended September 30, 2013, financial markets performed reasonably well in response to the Federal Reserve and other central banks’ actions, as economic recovery spread further and global uncertainties diminished somewhat. Still, the choppy market conditions presented challenges for several investment strategies. Riskier assets continued to outperform.
IV. Return vs. Benchmark
For the year ended September 30, 2013, the Multi-Strategy Alternative Fund, Class A, outperformed the benchmark BofA Merrill Lynch 3-Month U.S. Treasury Bill Index, returning 2.33% versus 0.10%, respectively. Although the Fund’s performance is benchmarked against the return of the BofA Merrill Lynch 3-Month U.S. Treasury Bill Index, an investment in the Fund is substantially different from an investment in U.S. Treasury bills. Among other things, Treasury bills are backed by the full faith and credit of the U.S. Government and have a fixed rate of return. Investors in Treasury bills do not risk losing their investment, whereas loss of money is a risk of investing in the Fund. Further, an investment in the Fund is expected to be substantially more volatile than an investment in Treasury bills because of the breadth and types of securities and other instruments in which the Fund may invest.
V. Fund Attribution
The largest positive contributor to the Fund’s returns was the Equity Hedge strategy, followed by the Relative Value and Event Driven strategies. The Tactical Directional strategy was down marginally. “Risk-on” rallies that were interrupted by sharp reversals proved challenging for the Managed Futures strategy. The Global Macro
strategy had difficulty allocating risk effectively in markets that were driven mostly by the words and actions of central bankers.
Our Equity Hedge strategies reacted positively to strong equity markets, especially in the U.S., and increased dispersion of returns between equities, an environment that tends to be better suited to alpha generation. The Relative Value strategies generated solid returns, due to narrowing credit spreads earlier on and a focus on challenging events later in the period. The Event Driven allocation’s performance improved, as merger and acquisition activity picked up on stable economic growth, although at relatively low levels, and improving corporate confidence supported by higher equity prices.
Turner made limited use of options contracts for hedging purposes, and this activity had a neutral impact on performance during the Fund’s fiscal year.
Multi-Strategy Alternative Fund:
AVERAGE ANNUAL TOTAL RETURN1
| One Year Return | Annualized 3 Year Return | Annualized Inception to Date | ||||||||||
| Multi-Strategy Alternative Fund, Class A | 2.33% | 0.87% | 0.54% | |||||||||
| BofA Merrill Lynch 3-Month U.S. Treasury Bill Index | 0.10% | 0.10% | 0.11% | |||||||||
Comparison of Change in the Value of a $100,000 Investment in the Multi-Strategy Alternative Fund, Class A, versus the BofA Merrill Lynch 3-Month U.S. Treasury Bill Index
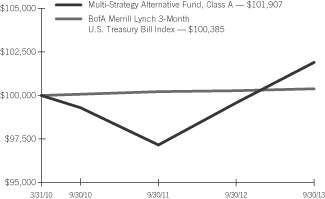
| 1 | For the period ended 9/30/13. Past performance is no indication of future performance. Class A shares were offered beginning 3/31/10. Returns shown do not reflect the deduction of taxes that a shareholder would pay on fund distributions or the redemption of fund shares. The returns for the period reflect fee waivers and/or reimbursements in effect for the period; absent fee waivers and reimbursements, performance would have been lower. Although the Fund’s performance is benchmarked against the return of the BofA Merrill Lynch 3-Month U.S. Treasury Bill Index, an investment in the Fund is substantially different from an investment in U.S. Treasury bills. Among other things, Treasury bills are backed by the full faith and credit of the U.S. Government and have a fixed rate of return. Investors in Treasury bills do not risk losing their investment, whereas loss of money is a risk of investing in the Fund. Further, an investment in the Fund is expected to be substantially more volatile than an investment in Treasury bills because of the breadth and types of securities and other instruments in which the Fund may invest. |
| 28 | SEI Institutional Managed Trust / Annual Report / September 30, 2013 |
MANAGEMENT’S DISCUSSION AND ANALYSIS OF FUND PERFORMANCE
SEI INSTITUTIONAL MANAGED TRUST — SEPTEMBER 30, 2013
Multi-Asset Accumulation Fund
I. Objective
The Multi-Asset Accumulation Fund (the “Fund”) seeks total return, including capital appreciation and income.
II. Multi-Manager Approach Statement
The Fund’s inception date was April 9, 2012. The Fund uses a multi-manager approach, relying on a number of sub-advisers with differing investment approaches to manage portions of the Fund’s portfolio, under the general supervision of SEI Investments Management Corporation (“SIMC”). The Fund utilized the following sub-advisers as of September 30, 2013: AQR Capital Management, LLC and PanAgora Asset Management Inc. For the year ended September 30, 2013 there were no manager changes.
III. Market Commentary
The last year was a period that favored concentrated risk taking over diversification. For the year ended September 30, 2013, global equities performed well. The MSCI World Index gained almost 21%, as investors shifted allocations out of low-yielding, risk-free bonds and into riskier assets. We believe this was a desired result of quantitative easing by the Federal Reserve (the “Fed”), which it hopes will jumpstart economic growth. Around the world, other central banks have tried to bolster exports by devaluing their currency, most notably the Bank of Japan. A concerted effort to devalue the yen drove the dollar-yen exchange rate from 79 in October 2012 to a peak of over 103 yen per dollar in May 2013. This devaluation has proven successful in benefiting Japanese exports and has thus helped contribute to the sharp appreciation of Japanese equities seen in the spring.
Commodities, on the other hand, experienced a poor year-over-year performance. Driven mostly by energy, the Dow Jones UBS Commodity Index has fallen over 14% since September 2012. In fixed-income markets, fears that the Fed would begin to taper its bond-buying activity led to losses. The Barclays Global Aggregate (in U.S. dollar terms) finished the last 12 months unchanged.
IV. Return vs. Benchmark
For the year ended September 30, 2013, the Multi-Asset Accumulation Fund, Class A, returned 1.12%. The MSCI World Index
(Net) (Hedged) (USD) and the blended benchmark, 60% MSCI World (Net) (Hedged) (USD) Index and 40% Barclays Global Aggregate Index, Hedged (USD), returned 22.18% and 13.12% over the same period, respectively.
V. Fund Attribution
The Fund’s underperformance was primarily driven by an underweight to equities and an overweight to inflation-related assets versus its blended benchmark. The underweight to equities detracted from relative returns, as global equities rallied during the period. Inflation-related assets (principally commodities and global inflation-linked bonds) performed poorly during the period, detracting from absolute and benchmark-relative returns. Global sovereign bonds detracted from relative returns, due to a sharp rise in rates in the second quarter of 2013.
Derivatives used in the reporting period included equity-index futures, bond-index futures, interest-rate swaps, commodity futures, total-return swaps and currency forwards. These derivatives are primarily used to provide cost-effective exposures to the desired asset classes. Derivatives had a meaningful impact on Fund performance in the period. Sovereign bond-index futures, interest-rate swaps and, to a lesser extent, sovereign bond total-return swaps (used for market exposure) negatively contributed to performance, as interest rates increased on average over the period. Bond-exposure related underperformance is primarily attributable to a larger notional exposure to bonds. Global-equity futures (used for market exposure), specifically U.S. equity futures, were a meaningful contributor to performance. While equity futures had a positive impact on total returns, a lower notional exposure to equities detracted from relative performance. Within the Fund, a controlled foreign corporation was established to provide more tax-efficient exposure, primarily to commodity futures and, to a lesser extent, commodity total-return swaps, as commodities are a key part of the Fund’s strategy. The commodity futures provide a strategic exposure to a diversified mix of underlying commodities. This exposure was a negative contributor to total returns over the period. Forward currency contracts on emerging-market currencies (used for market exposure) were a modestly negative contributor to total return and benchmark-relative returns. Forward currency contracts on developed-market currencies
| SEI Institutional Managed Trust / Annual Report / September 30, 2013 | 29 |
MANAGEMENT’S DISCUSSION AND ANALYSIS OF FUND PERFORMANCE
SEI INSTITUTIONAL MANAGED TRUST — SEPTEMBER 30, 2013
Multi-Asset Accumulation Fund (Concluded)
were principally used to hedge foreign-currency risk relative to the U.S. dollar. These exposures have slightly detracted from performance over the measurement period.
Multi-Asset Accumulation Fund:
AVERAGE ANNUAL TOTAL RETURN1
| One Year Return | Annualized Inception to Date | |||||||
| Multi-Asset Accumulation Fund, Class A | 1.12% | 4.49% | ||||||
| MSCI World Index (Net)(Hedged)(USD) | 22.18% | 17.12% | ||||||
| Barclays Global Aggregate Index, Hedged (USD) | 0.54% | 2.63% | ||||||
| 60/40 Hybrid consisting of the MSCI World Index (Net)(Hedged)(USD) and Barclays Global Aggregate Index, Hedged (USD) | 13.12% | 11.25% | ||||||
Comparison of Change in the Value of a $100,000 Investment in the Multi-Asset Accumulation Fund, Class A, versus the MSCI World Index (Net)(Hedged)(USD) and a 60/40 Hybrid of the following Indexes: the MSCI World Index (Net)(Hedged)(USD) and the Barclays Global Aggregate Index, Hedged (USD)
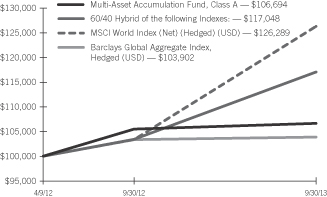
| 1 | For the period ended 9/30/13. Past performance is no indication of future performance. Class A shares were offered beginning 4/09/12. Returns shown do not reflect the deduction of taxes that a shareholder would pay on fund distributions or the redemption of fund shares. The returns for the period reflect fee waivers and/or reimbursements in effect for the period; absent fee waivers and reimbursements, performance would have been lower. |
| 30 | SEI Institutional Managed Trust / Annual Report / September 30, 2013 |
MANAGEMENT’S DISCUSSION AND ANALYSIS OF FUND PERFORMANCE
SEI INSTITUTIONAL MANAGED TRUST — SEPTEMBER 30, 2013
Multi-Asset Income Fund
I. Objective
The Multi-Asset Income Fund (the “Fund”) seeks total return with an emphasis on current income.
II. Multi-Manager Approach Statement
The Fund’s inception date was April 9, 2012. It uses a multi-manager approach, relying on a number of sub-advisers with differing investment approaches to manage portions of the Fund’s portfolio, under the general supervision of SEI Investments Management Corporation (“SIMC”). The Fund utilized the following sub-adviser as of September 30, 2013: Guggenheim Partners Investment Management, LLC. For the year ended September 30, 2013 there were no manager changes.
III. Market Commentary
The last year was a period that favored concentrated risk taking over diversification. For the year ended September 30, 2013, global equities performed well. The MSCI World Index gained almost 21%, as investors shifted allocations out of low-yielding, risk-free bonds and into riskier assets. We believe this was a desired result of quantitative easing by the Federal Reserve (the “Fed”), which it hopes will jumpstart economic growth. Around the world, other central banks have tried to bolster exports by devaluing their currency, most notably the Bank of Japan. A concerted effort to devalue the yen drove the dollar-yen exchange rate from 79 in October 2012 to a peak of over 103 yen per dollar in May 2013. This devaluation has proven successful in benefiting Japanese exports and has thus helped contribute to the sharp appreciation of Japanese equities seen in the spring.
Commodities, on the other hand, experienced a poor year-over-year performance. Driven mostly by energy, the Dow Jones UBS Commodity Index has fallen over 14% since September 2012. In fixed-income markets, fears that the Fed would begin to taper its bond-buying activity led to losses. The Barclays Global Aggregate (in U.S. dollar terms) finished the last 12 months unchanged.
IV. Return vs. Benchmark
For the year ended September 30, 2013, the Multi-Asset Income Fund, Class A, returned 8.24%. The BofA Merrill Lynch U.S. High Yield Constrained Index and the blended benchmark, 45% Barclays U.S. Aggregate Bond Index, 40% BofA Merrill Lynch U.S. High Yield Constrained Index and 15% S&P 500 Index, returned 7.09% and 4.81% over the same period, respectively.
V. Fund Attribution
The largest contributors to total return were allocations to high-yield corporate bonds and bank loans. The below-average credit quality of the Fund contributed to benchmark-relative performance. The Fund also benefitted from strong performance in the securitized sectors, including asset-backed securities and collateralized loan obligations—many of which are out of benchmark holdings.
Derivatives used by the Fund primarily consisted of options on exchange-traded funds (“ETF”). These were employed for various purposes, including equity-market exposure to specific countries and sectors as well as interest-rate risk hedging. Options were also used to generate income through covered call writing programs. Derivatives had a meaningful impact on Fund performance in the period. Interest-rate swaps were used to hedge duration risk in the portfolio for a portion of the reporting period. This position benefitted the Fund, as interest rates rose. A small covered call option position on European equity ETFs contributed through income generation from the call-option sales.
| SEI Institutional Managed Trust / Annual Report / September 30, 2013 | 31 |
MANAGEMENT’S DISCUSSION AND ANALYSIS OF FUND PERFORMANCE
SEI INSTITUTIONAL MANAGED TRUST — SEPTEMBER 30, 2013
Multi-Asset Income Fund (Concluded)
Multi-Asset Income Fund:
AVERAGE ANNUAL TOTAL RETURN1
| One Year Return | Annaulized Inception to Date | |||||||
| Multi-Asset Income Fund, Class A | 8.24% | 9.32% | ||||||
| Barclays U.S. Aggregate Bond Index | (1.68)% | 0.88% | ||||||
| BofA Merrill Lynch U.S. High Yield Constrained Index | 7.09% | 9.47% | ||||||
| S&P 500 Index | 19.34% | 16.74% | ||||||
| 45/40/15 Hybrid consisting of the Barclays U.S. Aggregate Bond Index, BofA Merrill Lynch U.S. High Yield Constrained Index and S&P 500 Index | 4.81% | 6.62% | ||||||
Comparison of Change in the Value of a $100,000 Investment in the Multi-Asset Income Fund, Class A, versus the BofA Merrill Lynch U.S. High Yield Constrained Index and a 45/40/15 Hybrid of the following Indexes: the Barclays U.S. Aggregate Bond Index, the BofA Merrill Lynch U.S. High Yield Constrained Index, and the S&P 500 Index
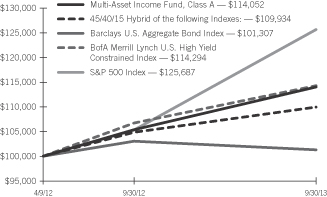
| 1 | For the period ended 9/30/13. Past performance is no indication of future performance. Class A shares were offered beginning 4/09/12. Returns shown do not reflect the deduction of taxes that a shareholder would pay on fund distributions or the redemption of fund shares. The returns for the period reflect fee waivers and/or reimbursements in effect for the period; absent fee waivers and reimbursements, performance would have been lower. |
| 32 | SEI Institutional Managed Trust / Annual Report / September 30, 2013 |
MANAGEMENT’S DISCUSSION AND ANALYSIS OF FUND PERFORMANCE
SEI INSTITUTIONAL MANAGED TRUST — SEPTEMBER 30, 2013
Multi-Asset Inflation Managed Fund
I. Objective
The Multi-Asset Inflation Managed Fund (the “Fund”) seeks total return exceeding the rate of inflation.
II. Multi-Manager Approach Statement
The Fund’s inception date was April 9, 2012. The Fund uses a multi-manager approach, relying on a number of sub-advisers with differing investment approaches to manage portions of the Fund’s portfolio, under the general supervision of SEI Investments Management Corporation (“SIMC”). The Fund utilized the following sub-adviser as of September 30, 2013: AllianceBernstein, L.P. For the year ended September 30, 2013 there were no manager changes.
III. Market Commentary
The last year was a period that favored concentrated risk taking over diversification. For the year ended September 30, 2013, global equities performed well. The MSCI World Index gained almost 21%, as investors shifted allocations out of low-yielding, risk-free bonds and into riskier assets. We believe this was a desired result of quantitative easing by the Federal Reserve (the “Fed”), which it hopes will jumpstart economic growth. Around the world, other central banks have tried to bolster exports by devaluing their currency, most notably the Bank of Japan. A concerted effort to devalue the yen drove the dollar-yen exchange rate from 79 in October 2012 to a peak of over 103 yen per dollar in May 2013. This devaluation has proven successful in benefiting Japanese exports and has thus helped contribute to the sharp appreciation of Japanese equities seen in the spring.
Commodities, on the other hand, experienced a poor year-over-year performance. Driven mostly by energy, the Dow Jones UBS Commodity Index has fallen over 14% since September 2012. In fixed-income markets, fears that the Fed would begin to taper its bond-buying activity led to losses. The Barclays Global Aggregate (in U.S. dollar terms) finished the last 12 months unchanged.
IV. Return vs. Benchmark
For the year ended September 30, 2013, the Multi-Asset Inflation Manged Fund, Class A, returned (6.27)%. The Barclays 1-5 Year
U.S. TIPS Index and the blended benchmark, 70% Barclays 1-5 Year U.S. TIPS Index and 30% MSCI All Country World Commodity Producers Index, returned (1.28)% and (1.15)% over the same period, respectively.
V. Fund Attribution
The biggest contributor to underperformance and negative total return was the allocation to commodity futures. Commodities were the worst performers in this multi-asset-class portfolio. Concerns over slowing growth in the emerging markets and Europe weighed on the sector. Another contributor to underperformance was an equity-market hedge that seeks to neutralize 50% of the Fund’s equity-market exposure. As the U.S. equity market rallied over the prior year, this hedge contributed negatively to total return and benchmark-relative return. An out-of-benchmark position in real estate investment trusts added slightly to relative returns in the period.
The Fund utilizes derivatives (specifically commodity futures, bond-index futures and total-return swaps), which had a meaningful impact on Fund performance in the period. A short position in U.S. Treasury futures was used to hedge duration risk for a portion of the Fund’s corporate-bond exposure. This hedge slightly added to total returns as interest rates rose. A short position in U.S. equity total-return swaps was used to hedge equity-market risk for a portion of the Fund’s long equity positions. This hedge detracted from total returns, as equity market returns were positive. Within the Fund, a Controlled Foreign Corporation has been established to provide more tax-efficient exposure—primarily to commodity futures, which are a key element of the Fund’s strategy. The commodity futures provide a strategic exposure to a diversified mix of underlying commodities. This exposure detracted from total returns over the period. Forward-currency contracts on developed market currencies were principally used to hedge foreign currency risk relative to the U.S. dollar and had a slightly positive effect on performance.
| SEI Institutional Managed Trust / Annual Report / September 30, 2013 | 33 |
MANAGEMENT’S DISCUSSION AND ANALYSIS OF FUND PERFORMANCE
SEI INSTITUTIONAL MANAGED TRUST — SEPTEMBER 30, 2013
Multi-Asset Inflation Managed Fund (Concluded)
Multi-Asset Inflation Managed Fund:
AVERAGE ANNUAL TOTAL RETURN1
| One Year Return | Annualized Inception to Date | |||||||
| Multi-Asset Inflation Managed Fund, Class A | (6.27)% | (3.30)% | ||||||
| Barclays 1-5 Year U.S. TIPS Index | (1.28)% | (0.37)% | ||||||
| MSCI All Country World Commodity Producers Index | (0.60)% | (0.31)% | ||||||
| 70/30 Hybrid consisting of the Barclays 1-5 Year U.S. TIPS Index and MSCI All Country World Commodity Producers Index | (1.15)% | (0.30)% | ||||||
Comparison of Change in the Value of a $100,000 Investment in the Multi-Asset Inflation Managed Fund, Class A, versus Barclays 1-5 Year U.S. TIPS Index and a 70/30 Hybrid of the following Indexes: the Barclays 1-5 Year U.S. TIPS Index, and the MSCI All Country World Commodity Producers Index
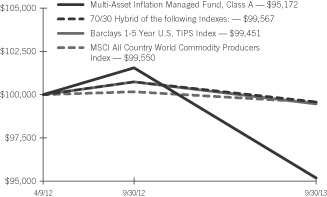
| 1 | For the period ended 9/30/13. Past performance is no indication of future performance. Class A shares were offered beginning 4/09/12. Returns shown do not reflect the deduction of taxes that a shareholder would pay on fund distributions or the redemption of fund shares. The returns for the period reflect fee waivers and/or reimbursements in effect for the period; absent fee waivers and reimbursements, performance would have been lower. |
| 34 | SEI Institutional Managed Trust / Annual Report / September 30, 2013 |
MANAGEMENT’S DISCUSSION AND ANALYSIS OF FUND PERFORMANCE
SEI INSTITUTIONAL MANAGED TRUST — SEPTEMBER 30, 2013
Multi-Asset Capital Stability Fund
I. Objective
The Multi-Asset Capital Stability Fund (the “Fund”) attempts to manage the risk of loss while providing current income and an opportunity for capital appreciation. Managing the risk of loss does not mean preventing losses, but rather managing the Fund in a manner intended to limit the level of losses that the Fund could incur over any particular period.
II. Multi-Manager Approach Statement
The Fund’s inception date was April 9, 2012. It uses a multi-manager approach, relying on a number of sub-advisers with differing investment approaches to manage portions of the Fund’s portfolio, under the general supervision of SEI Investments Management Corporation (“SIMC”). The Fund utilized the following sub-adviser as of September 30, 2013: AllianceBernstein, L.P. For the year ended September 30, 2013 there were no manager changes.
III. Market Commentary
The last year was a period that favored concentrated risk taking over diversification. For the year ended September 30, 2013, global equities performed well. The MSCI World Index gained almost 21%, as investors shifted allocations out of low-yielding, risk-free bonds and into riskier assets. We believe this was a desired result of quantitative easing by the Federal Reserve (the “Fed”), which it hopes will jumpstart economic growth. Around the world, other central banks have tried to bolster exports by devaluing their currency, most notably the Bank of Japan. A concerted effort to devalue the yen drove the dollar-yen exchange rate from 79 in October 2012 to a peak of over 103 yen per dollar in May 2013. This devaluation has proven successful in benefiting Japanese exports and has thus helped contribute to the sharp appreciation of Japanese equities seen in the spring.
Commodities, on the other hand, experienced a poor year-over-year performance. Driven mostly by energy, the Dow Jones UBS Commodity Index has fallen over 14% since September 2012. In fixed-income markets, fears that the Fed would begin to taper its bond-buying activity led to losses. The Barclays Global Aggregate (in U.S. dollar terms) finished the last 12 months unchanged.
IV. Return vs. Benchmark
For the year ended September 30, 2013, the Multi-Asset Capital Stability Fund, Class A, returned (1.23)%. The Barclays 1-3 Year U.S. Government/Credit Index and the blended benchmark, 95% Barclays 1-3 Year U.S. Government/Credit Index and 5% S&P 500 Index, returned 0.62% and 1.51% over the same period, respectively.
V. Fund Attribution
The Fund’s underperformance against the blended benchmark was primarily attributable to investments in U.S. Treasury inflation-protected securities (“TIPS”) and global sovereign bonds. The Fund’s asset-allocation changes between equities, bonds and cash detracted from relative returns, specifically in the second quarter of 2013, as a sharp rise in U.S. real rates negatively impacted the Fund’s U.S. TIPS positions and global sovereign bond positions. The Fund’s allocations to equity and credit contributed positively to performance, yet not enough to offset declines on the fixed-income portion of the portfolio.
Derivatives used in the reporting period included credit-default swaps, equity-index futures, bond-index futures, interest-rate swaps and currency forwards. These derivatives are primarily used to provide cost-effective exposures to desired asset classes, and had a meaningful impact on Fund performance in the period. Sovereign bond-index futures and interest-rate swaps (used for market exposure) were the biggest detractors from performance, as interest rates increased on average over the period. The bond futures tend to exhibit longer duration (greater sensitivity to interest rates) than the benchmark, and longer duration exposures are typically negatively impacted from rising interest rates. Stock-index futures (used for market exposure), primarily U.S. stocks, were a large positive contributor to total returns over the period. Small positions in credit-default swaps, used to gain exposure to high-yield and investment-grade credit, contributed modestly to total return. Forward currency contracts on developed market currencies were principally used to hedge foreign-currency risk relative to the U.S. dollar. The effect of these hedges on performance was largely neutral.
| SEI Institutional Managed Trust / Annual Report / September 30, 2013 | 35 |
MANAGEMENT’S DISCUSSION AND ANALYSIS OF FUND PERFORMANCE
SEI INSTITUTIONAL MANAGED TRUST — SEPTEMBER 30, 2013
Multi-Asset Capital Stability Fund (Concluded)
Multi-Asset Capital Stability Fund:
AVERAGE ANNUAL TOTAL RETURN1
| One Year Return | Annulized Inception to Date | |||||||
| Multi-Asset Capital Stability Fund, Class A | (1.23)% | 0.11% | ||||||
| Barclays 1-3 Year U.S. Government/Credit Index | 0.62% | 0.89% | ||||||
| S&P 500 Index | 19.34% | 16.74% | ||||||
| 95/5 Hybrid consisting of Barclays 1-3 Year U.S. Government/Credit Index and S&P 500 Index | 1.51% | 1.66% | ||||||
Comparison of Change in the Value of a $100,000 Investment in the Multi-Asset Capital Stability Fund, Class A, versus Barclays 1-3 Year Government/Credit Index and a 95/5 Hybrid of the following Indexes the Barclays 1-3 Year U.S. Government/Credit Index and the S&P 500 Index
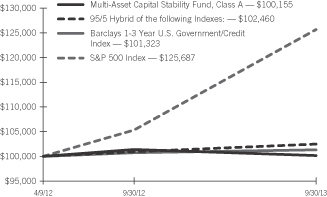
| 1 | For the period ended 9/30/13. Past performance is no indication of future performance. Class A shares were offered beginning 4/09/12. Returns shown do not reflect the deduction of taxes that a shareholder would pay on fund distributions or the redemption of fund shares. The returns for the period reflect fee waivers and/or reimbursements in effect for the period; absent fee waivers and reimbursements, performance would have been lower. |
| 36 | SEI Institutional Managed Trust / Annual Report / September 30, 2013 |
SUMMARY SCHEDULE OF INVESTMENTS
Large Cap Fund
September 30, 2013
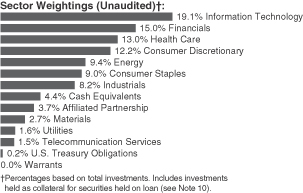
| Description | Percentage of Net Assets (%) | Shares | Market Value ($ Thousands) | |||||||||
COMMON STOCK (A) — 95.3% |
| |||||||||||
Consumer Discretionary — 12.7% |
| |||||||||||
Coach | 0.5 | % | 206,478 | $ | 11,259 | |||||||
Liberty Media - Interactive, Cl A* | 0.6 | 508,275 | 11,929 | |||||||||
Nike, Cl B | 0.9 | 262,578 | 19,074 | |||||||||
Nordstrom | 0.5 | 196,083 | 11,020 | |||||||||
priceline.com* | 0.6 | 12,250 | 12,384 | |||||||||
Target, Cl A | 0.7 | 216,409 | 13,846 | |||||||||
Walt Disney | 0.5 | 170,405 | 10,989 | |||||||||
Other Securities | 8.4 | 177,276 | ||||||||||
|
| |||||||||||
| 267,777 | ||||||||||||
|
| |||||||||||
Consumer Staples — 9.4% |
| |||||||||||
Costco Wholesale | 1.0 | 188,547 | 21,706 | |||||||||
CVS Caremark | 0.9 | 324,190 | 18,398 | |||||||||
Estee Lauder, Cl A | 0.8 | 245,556 | 17,164 | |||||||||
Mead Johnson Nutrition, Cl A | 0.5 | 146,432 | 10,874 | |||||||||
Mondelez International, Cl A | 0.5 | 356,626 | 11,205 | |||||||||
Walgreen | 0.7 | 265,175 | 14,266 | |||||||||
Whole Foods Market | 0.8 | 306,788 | 17,947 | |||||||||
Other Securities | 4.2 | 85,846 | ||||||||||
|
| |||||||||||
| 197,406 | ||||||||||||
|
| |||||||||||
Energy — 9.8% |
| |||||||||||
Chevron | 1.5 | 256,400 | 31,153 | |||||||||
ConocoPhillips | 0.6 | 179,900 | 12,505 | |||||||||
EOG Resources | 0.9 | 109,025 | 18,456 | |||||||||
Exxon Mobil | 1.4 | 353,900 | 30,449 | |||||||||
Kinder Morgan | 0.6 | 332,853 | 11,840 | |||||||||
Other Securities | 4.8 | 101,190 | ||||||||||
|
| |||||||||||
| 205,593 | ||||||||||||
|
| |||||||||||
Financials — 15.5% |
| |||||||||||
American International Group | 0.9 | 397,620 | 19,336 | |||||||||
Bank of America | 0.6 | 827,180 | 11,415 | |||||||||
| Description | Percentage of Net Assets (%) | Shares | Market Value ($ Thousands) | |||||||||
Citigroup | 1.0 | % | 429,660 | $ | 20,843 | |||||||
Discover Financial Services | 0.5 | 216,500 | 10,942 | |||||||||
Goldman Sachs Group | 0.5 | 70,400 | 11,138 | |||||||||
JPMorgan Chase | 1.4 | 580,980 | 30,031 | |||||||||
Wells Fargo | 1.0 | 506,300 | 20,920 | |||||||||
Other Securities | 9.6 | 202,763 | ||||||||||
|
| |||||||||||
| 327,388 | ||||||||||||
|
| |||||||||||
Health Care — 13.5% |
| |||||||||||
Amgen, Cl A | 0.9 | 167,313 | 18,729 | |||||||||
Biogen Idec* | 0.8 | 73,699 | 17,744 | |||||||||
Celgene, Cl A* | 1.2 | 169,728 | 26,126 | |||||||||
Express Scripts Holding* | 0.9 | 310,939 | 19,210 | |||||||||
Johnson & Johnson | 0.8 | 195,094 | 16,913 | |||||||||
Pfizer | 1.0 | 707,787 | 20,321 | |||||||||
WellPoint | 0.6 | 151,100 | 12,633 | |||||||||
Other Securities | 7.3 | 153,232 | ||||||||||
|
| |||||||||||
| 284,908 | ||||||||||||
|
| |||||||||||
Industrials — 8.4% |
| |||||||||||
Cummins | 0.5 | 80,770 | 10,732 | |||||||||
Northrop Grumman | 0.6 | 137,600 | 13,108 | |||||||||
Other Securities | 7.3 | 154,139 | ||||||||||
|
| |||||||||||
| 177,979 | ||||||||||||
|
| |||||||||||
Information Technology — 19.9% |
| |||||||||||
Adobe Systems* | 1.2 | 496,827 | 25,805 | |||||||||
Apple | 1.2 | 52,032 | 24,806 | |||||||||
Cisco Systems | 0.8 | 682,750 | 15,990 | |||||||||
EMC | 0.5 | 423,971 | 10,837 | |||||||||
Google, Cl A* | 0.9 | 21,753 | 19,054 | |||||||||
International Business Machines | 0.5 | 59,388 | 10,998 | |||||||||
Mastercard, Cl A | 1.1 | 36,265 | 24,398 | |||||||||
Microsoft | 0.7 | 444,075 | 14,792 | |||||||||
Oracle, Cl B | 0.8 | 486,713 | 16,144 | |||||||||
Qualcomm | 1.5 | 482,440 | 32,497 | |||||||||
Teradata* | 0.7 | 251,755 | 13,957 | |||||||||
Visa, Cl A | 1.2 | 133,437 | 25,500 | |||||||||
Western Digital | 0.5 | 177,300 | 11,241 | |||||||||
Other Securities | 8.3 | 173,051 | ||||||||||
|
| |||||||||||
| 419,070 | ||||||||||||
|
| |||||||||||
Materials — 2.9% |
| |||||||||||
LyondellBasell Industries, Cl A | 0.5 | 152,110 | 11,139 | |||||||||
Other Securities | 2.4 | 48,950 | ||||||||||
|
| |||||||||||
| 60,089 | ||||||||||||
|
| |||||||||||
Telecommunication Services — 1.6% |
| |||||||||||
Crown Castle International* | 1.2 | 348,190 | 25,428 | |||||||||
Other Securities | 0.4 | 7,214 | ||||||||||
|
| |||||||||||
| 32,642 | ||||||||||||
|
| |||||||||||
| SEI Institutional Managed Trust / Annual Report / September 30, 2013 | 37 |
SUMMARY SCHEDULE OF INVESTMENTS
Large Cap Fund (Concluded)
September 30, 2013
| Description | Percentage of Net Assets (%) | Shares | Market Value ($ Thousands) | |||||||||
Utilities — 1.6% |
| |||||||||||
Other Securities | 1.6 | % | $ | 34,748 | ||||||||
|
| |||||||||||
Total Common Stock |
| 2,007,600 | ||||||||||
|
| |||||||||||
WARRANTS — 0.0% |
| |||||||||||
Other Securities | 0.0 | 489 | ||||||||||
|
| |||||||||||
Total Warrants (Cost $188) ($ Thousands) |
| 489 | ||||||||||
|
| |||||||||||
AFFILIATED PARTNERSHIP — 3.9% |
| |||||||||||
SEI Liquidity Fund, L.P. 0.070%**† (B) | 3.9 | 81,401,719 | 81,402 | |||||||||
|
| |||||||||||
Total Affiliated Partnership |
| 81,402 | ||||||||||
|
| |||||||||||
CASH EQUIVALENTS — 4.5% |
| |||||||||||
SEI Daily Income Trust, | 4.4 | 92,142,522 | 92,143 | |||||||||
Other Securities | 0.1 | 3,036 | ||||||||||
|
| |||||||||||
Total Cash Equivalents |
| 95,179 | ||||||||||
|
| |||||||||||
U.S. TREASURY OBLIGATIONS (C) — 0.2% |
| |||||||||||
Other Securities | 0.2 | 5,017 | ||||||||||
|
| |||||||||||
Total U.S. Treasury Obligations |
| 5,017 | ||||||||||
|
| |||||||||||
Total Investments — 103.9% |
| $ | 2,189,687 | |||||||||
|
| |||||||||||
A list of the open futures contracts held by the Fund at September 30, 2013, are as follows:
| Type of Contract | Number of Contracts Long | Expiration Date | Unrealized (Depreciation) ($ Thousands) | |||
| S&P 500 Index EMINI | 418 | Dec-2013 | $(175) | |||
|
For the year ended September 30, 2013, the total amount of all open futures contracts, as presented in the table above, are representative of the volume of activity for this derivative type during the year.
Percentages are based on Net Assets of $2,107,192 ($Thousands).
| * | Non-income producing security. |
| ** | Rate shown is the 7-day effective yield as of September 30, 2013. |
| † | Investment in Affiliated Security (see Note 6). |
| (A) | Certain securities or partial positions of certain securities are on loan at September 30, 2013 (see Note 10). The total market value of securities on loan at September 30, 2013 was $79,181 ($ Thousands) |
| (B) | This security was purchased with cash collateral held from securities on loan (see Note 10). The total market value of such securities as of September 30, 2013 was $81,402 ($ Thousands). |
| (C) | Security, or portion thereof, has been pledged as collateral on open futures contracts. |
Cl — Class
L.P. — Limited Partnership
S&P — Standard and Poor’s
The Summary Schedule of Investments does not reflect the complete portfolio holdings. It includes the Fund’s 50 largest holdings and each investment of any issuer that exceeds 1% of the Fund’s net assets. “Other Securities” represent all issues not required to be disclosed under the rules adopted by the U.S. Securities and Exchange Commission (“SEC”). In certain instances, securities for which footnotes listed above may otherwise apply are included in the Other Securities caption. The complete schedule of portfolio holdings is available (i) without charge, upon request, by calling (800) 342-5734; and (ii) on the SEC’s website at http://www.sec.gov.
The following is a list of the level of inputs used as of September 30, 2013, in valuing the Fund’s investments and other financial instruments carried at value ($ Thousands):
| Investments in Securities | Level 1 | Level 2 | Level 3 | Total | ||||||||||||
Common Stock | $ | 2,007,600 | $ | — | $ | — | $ | 2,007,600 | ||||||||
Warrants | 489 | — | — | 489 | ||||||||||||
Affiliated Partnership | — | 81,402 | — | 81,402 | ||||||||||||
Cash Equivalents | 95,179 | — | — | 95,179 | ||||||||||||
U.S. Treasury Obligations | — | 5,017 | — | 5,017 | ||||||||||||
|
|
|
|
|
|
|
| |||||||||
Total Investments in Securities | $ | 2,103,268 | $ | 86,419 | $ | — | $ | 2,189,687 | ||||||||
|
|
|
|
|
|
|
| |||||||||
| Other Financial Instruments | Level 1 | Level 2 | Level 3 | Total | ||||||||||||
Futures Contracts* | ||||||||||||||||
Unrealized Appreciation | $ | — | $ | — | $ | — | $ | — | ||||||||
Unrealized Depreciation | (175 | ) | — | — | (175 | ) | ||||||||||
|
|
|
|
|
|
|
| |||||||||
Total Other Financial Instruments | $ | (175 | ) | $ | — | $ | — | $ | (175 | ) | ||||||
|
|
|
|
|
|
|
| |||||||||
| * | Futures contracts are valued at unrealized depreciation on the instrument. |
For the year ended September 30, 2013, there were no transfers between Level 1 and Level 2 assets and liabilities.
For the year ended September 30, 2013, there were no transfers between Level 2 and Level 3 assets and liabilities.
For more information on valuation inputs, see Note 2 – Significant Accounting Policies in Notes to Financial Statements.
Amounts designated as “—” are $0 or have been rounded to $0.
The accompanying notes are an integral part of the financial statements.
| 38 | SEI Institutional Managed Trust / Annual Report / September 30, 2013 |
SUMMARY SCHEDULE OF INVESTMENTS
Large Cap Value Fund
September 30, 2013
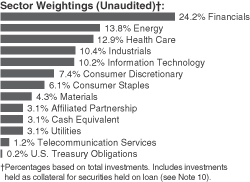
| Description | Percentage of Net Assets (%) | Shares | Market Value ($ Thousands) | |||||||||
COMMON STOCK (A) — 96.7% |
| |||||||||||
Consumer Discretionary — 7.7% |
| |||||||||||
Lear | 0.7 | % | 137,600 | $ | 9,848 | |||||||
Whirlpool | 0.6 | 61,700 | 9,035 | |||||||||
Other Securities | 6.4 | 92,919 | ||||||||||
|
| |||||||||||
| 111,802 | ||||||||||||
|
| |||||||||||
Consumer Staples — 6.3% |
| |||||||||||
CVS Caremark | 0.8 | 197,500 | 11,208 | |||||||||
Kroger | 0.7 | 262,800 | 10,601 | |||||||||
Wal-Mart Stores | 0.6 | 114,250 | 8,450 | |||||||||
Other Securities | 4.2 | 61,316 | ||||||||||
|
| |||||||||||
| 91,575 | ||||||||||||
|
| |||||||||||
Energy — 14.2% |
| |||||||||||
Chevron | 2.8 | 336,800 | 40,921 | |||||||||
ConocoPhillips | 1.2 | 247,500 | 17,204 | |||||||||
Exxon Mobil | 2.9 | 497,295 | 42,787 | |||||||||
Halliburton | 0.6 | 196,201 | 9,447 | |||||||||
Marathon Oil | 1.1 | 451,380 | 15,744 | |||||||||
Murphy Oil | 0.7 | 166,410 | 10,038 | |||||||||
Occidental Petroleum | 0.7 | 115,770 | 10,829 | |||||||||
Other Securities | 4.2 | 59,809 | ||||||||||
|
| |||||||||||
| 206,779 | ||||||||||||
|
| |||||||||||
Financials — 25.0% |
| |||||||||||
Allstate | 1.0 | 301,700 | 15,251 | |||||||||
American International Group | 0.7 | 196,600 | 9,561 | |||||||||
Assurant | 0.6 | 150,100 | 8,120 | |||||||||
Bank of America | 0.9 | 967,400 | 13,350 | |||||||||
Chubb | 0.6 | 99,300 | 8,863 | |||||||||
Citigroup | 1.4 | 409,960 | 19,887 | |||||||||
Discover Financial Services | 0.7 | 203,400 | 10,280 | |||||||||
Everest Re Group | 1.1 | 114,515 | 16,652 | |||||||||
Fifth Third Bancorp | 0.8 | 662,200 | 11,946 | |||||||||
Goldman Sachs Group | 0.9 | 85,000 | 13,448 | |||||||||
Huntington Bancshares | 0.6 | 1,025,300 | 8,469 | |||||||||
JPMorgan Chase | 2.6 | 744,500 | 38,483 | |||||||||
| Description | Percentage of Net Assets (%) | Shares | Market Value ($ Thousands) | |||||||||
KeyCorp | 0.6 | % | 751,100 | $ | 8,562 | |||||||
MetLife | 0.8 | 238,600 | 11,202 | |||||||||
PNC Financial Services Group | 0.7 | 141,100 | 10,223 | |||||||||
Regions Financial | 0.6 | 939,700 | 8,702 | |||||||||
Travelers | 0.7 | 120,100 | 10,181 | |||||||||
Wells Fargo | 2.1 | 724,100 | 29,920 | |||||||||
Other Securities | 7.6 | 111,106 | ||||||||||
|
| |||||||||||
| 364,206 | ||||||||||||
|
| |||||||||||
Health Care — 13.4% |
| |||||||||||
Aetna, Cl A | 0.7 | 161,800 | 10,359 | |||||||||
Amgen, Cl A | 0.8 | 109,040 | 12,206 | |||||||||
Cigna | 0.7 | 124,400 | 9,561 | |||||||||
Humana | 0.6 | 95,900 | 8,950 | |||||||||
Johnson & Johnson | 0.9 | 152,795 | 13,246 | |||||||||
McKesson | 0.7 | 84,700 | 10,867 | |||||||||
Merck | 0.6 | 171,600 | 8,170 | |||||||||
Pfizer | 1.8 | 927,300 | 26,623 | |||||||||
WellPoint | 0.8 | 142,000 | 11,873 | |||||||||
Other Securities | 5.8 | 82,459 | ||||||||||
|
| |||||||||||
| 194,314 | ||||||||||||
|
| |||||||||||
Industrials — 10.7% |
| |||||||||||
Delta Air Lines, Cl A | 0.5 | 340,600 | 8,035 | |||||||||
General Electric | 0.8 | 514,075 | 12,281 | |||||||||
L-3 Communications Holdings | 0.8 | 116,800 | 11,038 | |||||||||
Northrop Grumman | 1.0 | 157,030 | 14,959 | |||||||||
Raytheon | 1.0 | 190,300 | 14,666 | |||||||||
Other Securities | 6.6 | 95,034 | ||||||||||
|
| |||||||||||
| 156,013 | ||||||||||||
|
| |||||||||||
Information Technology — 10.6% |
| |||||||||||
Cisco Systems | 1.3 | 800,000 | 18,736 | |||||||||
Microsoft | 0.7 | 315,560 | 10,511 | |||||||||
Oracle, Cl B | 0.7 | 328,600 | 10,900 | |||||||||
Western Digital | 0.7 | 157,400 | 9,979 | |||||||||
Other Securities | 7.2 | 103,403 | ||||||||||
|
| |||||||||||
| 153,529 | ||||||||||||
|
| |||||||||||
Materials — 4.4% |
| |||||||||||
Other Securities | 4.4 | 64,423 | ||||||||||
|
| |||||||||||
Telecommunication Services — 1.2% |
| |||||||||||
AT&T | 0.8 | 347,300 | 11,746 | |||||||||
Other Securities | 0.4 | 5,818 | ||||||||||
|
| |||||||||||
| 17,564 | ||||||||||||
|
| |||||||||||
Utilities — 3.2% | ||||||||||||
American Electric Power | 0.9 | 289,900 | 12,567 | |||||||||
Other Securities | 2.3 | 33,639 | ||||||||||
|
| |||||||||||
| 46,206 | ||||||||||||
|
| |||||||||||
Total Common Stock |
| 1,406,411 | ||||||||||
|
| |||||||||||
| SEI Institutional Managed Trust / Annual Report / September 30, 2013 | 39 |
SUMMARY SCHEDULE OF INVESTMENTS
Large Cap Value Fund (Concluded)
September 30, 2013
| Description | Percentage of Net Assets (%) | Shares | Market Value ($ Thousands) | |||||||||
AFFILIATED PARTNERSHIP — 3.2% |
| |||||||||||
SEI Liquidity Fund, L.P. | 3.2 | % | 46,842,265 | $ | 46,842 | |||||||
|
| |||||||||||
Total Affiliated Partnership |
| 46,842 | ||||||||||
|
| |||||||||||
CASH EQUIVALENT — 3.2% |
| |||||||||||
SEI Daily Income Trust, Prime Obligation Fund, Cl A | 3.2 | 46,601,208 | 46,601 | |||||||||
|
| |||||||||||
Total Cash Equivalent |
| 46,601 | ||||||||||
|
| |||||||||||
U.S. TREASURY OBLIGATIONS (C) — 0.2% |
| |||||||||||
Other Securities | 0.2 | 2,614 | ||||||||||
|
| |||||||||||
Total U.S. Treasury Obligations |
| 2,614 | ||||||||||
|
| |||||||||||
Total Investments — 103.3% |
| $ | 1,502,468 | |||||||||
|
| |||||||||||
A list of the open futures contracts held by the Fund at September 30, 2013, are as follows:
| Type of Contract | Number of Contracts Long | Expiration Date | Unrealized Appreciation (Depreciation) ($ Thousands) | |||||||||
Russell 2000 Index E-MINI | 10 | Dec-2013 | $ | 19 | ||||||||
S&P 500 Index EMINI | 116 | Dec-2013 | (44 | ) | ||||||||
|
| |||||||||||
| $ | (25 | ) | ||||||||||
|
| |||||||||||
For the year ended September 30, 2013, the total amount of all open futures contracts, as presented in the table above, are representative of the volume of activity for this derivative type during the year.
Percentages are based on Net Assets of $1,454,341 ($Thousands).
| * | Rate shown is the 7-day effective yield as of September 30, 2013. |
| † | Investment in Affiliated Security (see Note 6). |
| (A) | Certain securities or partial positions of certain securities are on loan at September 30, 2013 (see Note 10). The total market value of securities on loan at September 30, 2013 was $45,465 ($ Thousands). |
| (B) | This security was purchased with cash collateral received from securities lending (see Note 10). The total value of such securities as of September 30, 2013 was $46,842 ($ Thousands). |
| (C) | Security, or portion thereof, has been pledged as collateral on open futures contracts. |
| Cl | — Class |
| L.P. | — Limited Partnership |
| S&P | — Standard and Poor’s |
The Summary Schedule of Investments does not reflect the complete portfolio holdings. It includes the Fund’s 50 largest holdings and each investment of any issuer that exceeds 1% of the Fund’s net assets. “Other Securities” represent all issues not required to be disclosed under the rules adopted by the U.S. Securities and Exchange Commission (“SEC”). In certain instances, securities for which footnotes listed above may otherwise apply are included in the Other Securities caption. The complete schedule of portfolio holdings is available (i) without charge, upon request, by calling (800) 342-5734; and (ii) on the SEC’s website at http://www.sec.gov.
The following is a list of the level of inputs used as of September 30, 2013, in valuing the Fund’s investments and other financial instruments carried at value ($ Thousands):
| Investments in Securities | Level 1 | Level 2 | Level 3 | Total | ||||||||||||
Common Stock | $ | 1,406,411 | $ | — | $ | — | $ | 1,406,411 | ||||||||
Affiliated Partnership | — | 46,842 | — | 46,842 | ||||||||||||
Cash Equivalent | 46,601 | — | — | 46,601 | ||||||||||||
U.S. Treasury Obligations | — | 2,614 | — | 2,614 | ||||||||||||
|
|
|
|
|
|
|
| |||||||||
Total Investments in Securities | $ | 1,453,012 | $ | 49,456 | $ | — | $ | 1,502,468 | ||||||||
|
|
|
|
|
|
|
| |||||||||
| Other Financial Instruments | Level 1 | Level 2 | Level 3 | Total | ||||||||||||
Futures Contracts* | ||||||||||||||||
Unrealized Appreciation | $ | 19 | $ | — | $ | — | $ | 19 | ||||||||
Unrealized Depreciation | (44 | ) | — | — | (44 | ) | ||||||||||
|
|
|
|
|
|
|
| |||||||||
Total Other Financial Instruments | $ | (25 | ) | $ | — | $ | — | $ | (25 | ) | ||||||
|
|
|
|
|
|
|
| |||||||||
| * | Futures contracts are valued at the unrealized appreciation (depreciation) on the instrument. |
For the year ended September 30, 2013, there were no transfers between Level 1 and Level 2 assets and liabilities.
For the year ended September 30, 2013, there were no transfers between Level 2 and Level 3 assets and liabilities.
For more information on valuation inputs, see Note 2 — Significant Accounting Policies in Notes to Financial Statements.
Amounts designated as “—” are $0 or have been rounded to $0.
The accompanying notes are an integral part of the financial statements.
| 40 | SEI Institutional Managed Trust / Annual Report / September 30, 2013 |
SUMMARY SCHEDULE OF INVESTMENTS
Large Cap Growth Fund
September 30, 2013
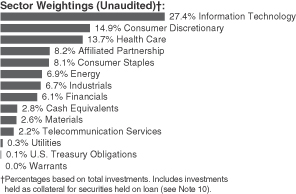
| Description | Percentage of Net Assets (%) | Shares | Market Value ($ Thousands) | |||||||||
COMMON STOCK (A) — 97.0%‡ |
| |||||||||||
Consumer Discretionary — 16.3% |
| |||||||||||
Home Depot | 1.0 | % | 200,600 | $ | 15,216 | |||||||
L Brands | 1.2 | 272,650 | 16,659 | |||||||||
Liberty Global, Cl A* | 0.8 | 147,709 | 11,721 | |||||||||
Liberty Media - Interactive, Cl A* | 1.4 | 858,310 | 20,144 | |||||||||
Liberty Ventures, Ser A* | 0.1 | 16,100 | 1,420 | |||||||||
Nike, Cl B | 0.8 | 160,925 | 11,690 | |||||||||
priceline.com* | 1.5 | 20,750 | 20,977 | |||||||||
Starbucks | 1.2 | 232,939 | 17,929 | |||||||||
Time Warner Cable, Cl A | 0.8 | 107,100 | 11,952 | |||||||||
Other Securities | 7.5 | 106,817 | ||||||||||
|
| |||||||||||
| 234,525 | ||||||||||||
|
| |||||||||||
Consumer Staples — 8.8% |
| |||||||||||
Costco Wholesale | 0.8 | 101,321 | 11,664 | |||||||||
Estee Lauder, Cl A | 0.9 | 188,208 | 13,156 | |||||||||
Mead Johnson Nutrition, Cl A | 1.0 | 187,979 | 13,959 | |||||||||
Walgreen | 1.7 | 456,700 | 24,571 | |||||||||
Whole Foods Market | 1.0 | 241,524 | 14,129 | |||||||||
Other Securities | 3.4 | 49,441 | ||||||||||
|
| |||||||||||
| 126,920 | ||||||||||||
|
| |||||||||||
Energy — 7.6% |
| |||||||||||
Core Laboratories | 0.9 | 79,362 | 13,429 | |||||||||
EOG Resources | 2.2 | 184,000 | 31,148 | |||||||||
FMC Technologies* | 1.0 | 249,060 | 13,803 | |||||||||
Kinder Morgan | 1.4 | 564,469 | 20,078 | |||||||||
Schlumberger, Cl A | 1.2 | 192,511 | 17,010 | |||||||||
Other Securities | 0.9 | 13,625 | ||||||||||
|
| |||||||||||
| 109,093 | ||||||||||||
|
| |||||||||||
Financials — 6.6% |
| |||||||||||
Charles Schwab | 1.2 | 771,715 | 16,314 | |||||||||
CME Group | 0.8 | 150,350 | 11,108 | |||||||||
IntercontinentalExchange* | 1.1 | 88,625 | 16,078 | |||||||||
Progressive | 1.1 | 565,261 | 15,392 | |||||||||
| Description | Percentage of Net Assets (%) | Shares | Market Value ($ Thousands) | |||||||||
Other Securities | 2.4 | % | $ | 37,004 | ||||||||
|
| |||||||||||
| 95,896 | ||||||||||||
|
| |||||||||||
Health Care — 15.0% |
| |||||||||||
Allergan | 1.3 | 204,350 | 18,483 | |||||||||
Amgen, Cl A | 0.9 | 114,800 | 12,851 | |||||||||
Celgene, Cl A* | 2.1 | 196,350 | 30,224 | |||||||||
Covance* | 0.9 | 154,634 | 13,370 | |||||||||
DaVita HealthCare Partners* | 1.1 | 267,060 | 15,196 | |||||||||
Express Scripts Holding* | 1.2 | 279,582 | 17,273 | |||||||||
Intuitive Surgical* | 1.0 | 39,607 | 14,903 | |||||||||
Novo Nordisk ADR | 0.9 | 71,307 | 12,066 | |||||||||
Other Securities | 5.6 | 81,764 | ||||||||||
|
| |||||||||||
| 216,130 | ||||||||||||
|
| |||||||||||
Industrials — 7.3% |
| |||||||||||
Danaher, Cl A | 1.1 | 221,588 | 15,361 | |||||||||
Fluor | 1.3 | 253,843 | 18,013 | |||||||||
Roper Industries | 0.9 | 100,444 | 13,346 | |||||||||
Stericycle, Cl A* | 1.0 | 124,851 | 14,408 | |||||||||
Other Securities | 3.0 | 44,651 | ||||||||||
|
| |||||||||||
| 105,779 | ||||||||||||
|
| |||||||||||
Information Technology — 29.9% |
| |||||||||||
Accenture, Cl A | 0.8 | 153,687 | 11,318 | |||||||||
Adobe Systems* | 1.7 | 477,050 | 24,778 | |||||||||
Amphenol, Cl A | 0.8 | 146,120 | 11,307 | |||||||||
Apple | 2.7 | 81,878 | 39,035 | |||||||||
eBay* | 1.1 | 272,600 | 15,208 | |||||||||
Google, Cl A* | 3.2 | 52,030 | 45,574 | |||||||||
Intuit | 1.0 | 220,500 | 14,621 | |||||||||
Mastercard, Cl A | 1.9 | 40,450 | 27,214 | |||||||||
Microsoft | 1.4 | 596,533 | 19,871 | |||||||||
NetApp | 0.8 | 264,124 | 11,257 | |||||||||
Qualcomm | 2.8 | 595,908 | 40,140 | |||||||||
Salesforce.com* | 0.8 | 231,492 | 12,017 | |||||||||
Teradata* | 0.8 | 209,000 | 11,587 | |||||||||
Visa, Cl A | 4.5 | 337,269 | 64,452 | |||||||||
Other Securities | 5.6 | 82,495 | ||||||||||
|
| |||||||||||
| 430,874 | ||||||||||||
|
| |||||||||||
Materials — 2.9% |
| |||||||||||
Ecolab | 1.0 | 138,050 | 13,634 | |||||||||
Other Securities | 1.9 | 27,615 | ||||||||||
|
| |||||||||||
| 41,249 | ||||||||||||
|
| |||||||||||
Telecommunication Services — 2.3% |
| |||||||||||
Crown Castle International* | 2.0 | 404,375 | 29,531 | |||||||||
Other Securities | 0.3 | 4,442 | ||||||||||
|
| |||||||||||
| 33,973 | ||||||||||||
|
| |||||||||||
| SEI Institutional Managed Trust / Annual Report / September 30, 2013 | 41 |
SUMMARY SCHEDULE OF INVESTMENTS
Large Cap Growth Fund (Concluded)
September 30, 2013
| Description | Percentage of Net Assets (%) | Shares | Market Value ($ Thousands) | |||||||||
Utilities — 0.3% | ||||||||||||
Other Securities | 0.3 | % | $ | 4,185 | ||||||||
|
| |||||||||||
Total Common Stock |
| 1,398,624 | ||||||||||
|
| |||||||||||
WARRANTS — 0.0% |
| |||||||||||
Other Securities | 0.0 | 852 | ||||||||||
|
| |||||||||||
Total Warrants |
| 852 | ||||||||||
|
| |||||||||||
AFFILIATED PARTNERSHIP — 9.0% |
| |||||||||||
SEI Liquidity Fund, L.P. 0.070%**† (B) | 9.0 | 129,353,530 | 129,354 | |||||||||
|
| |||||||||||
Total Affiliated Partnership |
| 129,354 | ||||||||||
|
| |||||||||||
CASH EQUIVALENTS — 3.1% |
| |||||||||||
SEI Daily Income Trust, | 2.8 | 39,523,759 | 39,524 | |||||||||
Other Securities | 0.3 | 4,707 | ||||||||||
|
| |||||||||||
Total Cash Equivalents |
| 44,231 | ||||||||||
|
| |||||||||||
U.S. TREASURY OBLIGATIONS (C) — 0.1% |
| |||||||||||
Other Securities | 0.1 | 1,065 | ||||||||||
|
| |||||||||||
Total U.S. Treasury Obligations |
| 1,065 | ||||||||||
|
| |||||||||||
Total Investments — 109.2% |
| $ | 1,574,126 | |||||||||
|
| |||||||||||
A list of the open futures contracts held by the Fund at September 30, 2013, are as follows:
| Type of Contract | Number of Contracts Long | Expiration Date | Unrealized Appreciation (Depreciation) ($ Thousands) | |||||||||
Russell 2000 Index E-MINI | 5 | Dec-2013 | $ | 10 | ||||||||
S&P 500 Index EMINI | 70 | Dec-2013 | (28 | ) | ||||||||
|
| |||||||||||
| $ | (18 | ) | ||||||||||
|
| |||||||||||
For the year ended September 30, 2013, the total amount of all open futures contracts, as presented in the table above, are representative of the volume of activity for this derivative type during the year.
Percentages are based on Net Assets of $1,441,608 ($Thousands).
| * | Non-income producing security. |
| ** | Rate shown is the 7-day effective yield as of September 30, 2013. |
| † | Investment in Affiliated Security (see Note 6). |
| ‡ | Narrow Industries are utilized for compliance purposes, whereas broad sectors are utilized for reporting. |
| (A) | Certain securities or partial positions of certain securities are on loan at September 30, 2013 (see Note 10). The total market value of securities on loan at September 30, 2013 was $126,277 ($ Thousands) |
| (B) | This security was purchased with cash collateral held from securities on loan (see Note 10). The total market value of such securities as of September 30, 2013 was $129,354 ($ Thousands). |
| (C) | Security, or portion thereof, has been pledged as collateral on open futures contracts. |
ADR — American Depositary Receipt
Cl — Class
L.P. — Limited Partnership
S&P — Standard and Poor’s
Ser — Series
The Summary Schedule of Investments does not reflect the complete portfolio holdings. It includes the Fund’s 50 largest holdings and each investment of any issuer that exceeds 1% of the Fund’s net assets. “Other Securities” represent all issues not required to be disclosed under the rules adopted by the U.S. Securities and Exchange Commission (“SEC”). In certain instances, securities for which footnotes listed above may otherwise apply are included in the Other Securities caption. The complete schedule of portfolio holdings is available (i) without charge, upon request, by calling (800) 342-5734; and (ii) on the SEC’s website at http://www.sec.gov.
The following is a list of the level of inputs used as of September 30, 2013, in valuing the Fund’s investments and other financial instruments carried at value ($ Thousands):
| Investments in Securities | Level 1 | Level 2 | Level 3 | Total | ||||||||||||
Common Stock | $ | 1,398,624 | $ | — | $ | — | $ | 1,398,624 | ||||||||
Warrants | 852 | — | — | 852 | ||||||||||||
Affiliated Partnership | — | 129,354 | — | 129,354 | ||||||||||||
Cash Equivalents | 44,231 | — | — | 44,231 | ||||||||||||
U.S. Treasury Obligations | — | 1,065 | — | 1,065 | ||||||||||||
|
|
|
|
|
|
|
| |||||||||
Total Investments in Securities | $ | 1,443,707 | $ | 130,419 | $ | — | $ | 1,574,126 | ||||||||
|
|
|
|
|
|
|
| |||||||||
| Other Financial Instruments | Level 1 | Level 2 | Level 3 | Total | ||||||||||||
Futures Contracts* | ||||||||||||||||
Unrealized Appreciation | $ | 10 | $ | — | $ | — | $ | 10 | ||||||||
Unrealized Depreciation | (28 | ) | — | — | (28 | ) | ||||||||||
|
|
|
|
|
|
|
| |||||||||
Total Other Financial Instruments | $ | (18 | ) | $ | — | $ | — | $ | (18 | ) | ||||||
|
|
|
|
|
|
|
| |||||||||
| * | Futures contracts are valued at the unrealized appreciation (depreciation) on the instrument. |
For the year ended September 30, 2013, there were no transfers between Level 1 and Level 2 assets and liabilities.
For the year ended September 30, 2013, there were no transfers between Level 2 and Level 3 assets and liabilities.
For more information on valuation inputs, see Note 2 — Significant Accounting Policies in Notes to Financial Statements.
Amounts designated as “—” are $0 or have been rounded to $0.
The accompanying notes are an integral part of the financial statements.
| 42 | SEI Institutional Managed Trust / Annual Report / September 30, 2013 |
SUMMARY SCHEDULE OF INVESTMENTS
Tax-Managed Large Cap Fund
September 30, 2013
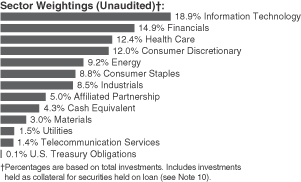
| Description | Percentage of Net Assets (%) | Shares | Market Value ($ Thousands) | |||||||||
COMMON STOCK (A) — 95.3% |
| |||||||||||
Consumer Discretionary — 12.6% |
| |||||||||||
CBS, Cl B | 0.5 | % | 208,745 | $ | 11,514 | |||||||
Harley-Davidson, Cl A | 0.5 | 184,226 | 11,835 | |||||||||
Nike, Cl B | 0.9 | 293,208 | 21,299 | |||||||||
priceline.com* | 0.6 | 13,299 | 13,445 | |||||||||
Target, Cl A | 0.6 | 238,820 | 15,280 | |||||||||
Walt Disney | 0.5 | 184,974 | 11,929 | |||||||||
Other Securities | 9.0 | 218,852 | ||||||||||
|
| |||||||||||
| 304,154 | ||||||||||||
|
| |||||||||||
Consumer Staples — 9.3% |
| |||||||||||
Costco Wholesale | 1.0 | 208,096 | 23,956 | |||||||||
CVS Caremark | 0.8 | 329,617 | 18,706 | |||||||||
Estee Lauder, Cl A | 0.8 | 260,678 | 18,221 | |||||||||
Mead Johnson Nutrition, Cl A | 0.5 | 167,228 | 12,418 | |||||||||
Walgreen | 0.6 | 281,641 | 15,152 | |||||||||
Whole Foods Market | 0.8 | 327,550 | 19,162 | |||||||||
Other Securities | 4.8 | 115,454 | ||||||||||
|
| |||||||||||
| 223,069 | ||||||||||||
|
| |||||||||||
Energy — 9.7% |
| |||||||||||
Chevron | 1.4 | 277,584 | 33,727 | |||||||||
ConocoPhillips | 0.7 | 257,902 | 17,927 | |||||||||
EOG Resources | 0.7 | 105,210 | 17,810 | |||||||||
Exxon Mobil | 1.6 | 435,386 | 37,461 | |||||||||
Other Securities | 5.3 | 126,849 | ||||||||||
|
| |||||||||||
| 233,774 | ||||||||||||
|
| |||||||||||
Financials — 15.6% |
| |||||||||||
American International Group | 0.7 | 338,405 | 16,457 | |||||||||
Capital One Financial | 0.5 | 166,405 | 11,439 | |||||||||
Citigroup | 1.0 | 516,494 | 25,055 | |||||||||
Discover Financial Services | 0.5 | 241,586 | 12,210 | |||||||||
Goldman Sachs Group | 0.5 | 71,669 | 11,339 | |||||||||
JPMorgan Chase | 1.6 | 730,992 | 37,785 | |||||||||
KeyCorp | 0.5 | 997,856 | 11,376 | |||||||||
Wells Fargo | 1.0 | 599,477 | 24,770 | |||||||||
| Description | Percentage of Net Assets (%) | Shares | Market Value ($ Thousands) | |||||||||
Other Securities | 9.3 | % | $ | 225,386 | ||||||||
|
| |||||||||||
| 375,817 | ||||||||||||
|
| |||||||||||
Health Care — 13.0% |
| |||||||||||
Allergan | 0.5 | 123,287 | 11,151 | |||||||||
Amgen, Cl A | 1.1 | 222,697 | 24,929 | |||||||||
Biogen Idec* | 0.9 | 88,036 | 21,195 | |||||||||
Celgene, Cl A* | 1.1 | 177,007 | 27,247 | |||||||||
Express Scripts Holding* | 0.8 | 317,708 | 19,628 | |||||||||
Johnson & Johnson | 0.8 | 225,980 | 19,590 | |||||||||
Pfizer | 1.0 | 870,203 | 24,984 | |||||||||
Other Securities | 6.8 | 164,942 | ||||||||||
|
| |||||||||||
| 313,666 | ||||||||||||
|
| |||||||||||
Industrials — 9.0% |
| |||||||||||
Northrop Grumman | 0.6 | 156,994 | 14,955 | |||||||||
Pentair | 0.5 | 171,938 | 11,166 | |||||||||
Raytheon | 0.5 | 160,818 | 12,394 | |||||||||
Union Pacific | 0.5 | 79,400 | 12,334 | |||||||||
Other Securities | 6.9 | 164,424 | ||||||||||
|
| |||||||||||
| 215,273 | ||||||||||||
|
| |||||||||||
Information Technology — 19.9% |
| |||||||||||
Adobe Systems* | 1.2 | 544,064 | 28,259 | |||||||||
Apple | 1.3 | 66,521 | 31,714 | |||||||||
Cisco Systems | 0.7 | 688,073 | 16,115 | |||||||||
Google, Cl A* | 1.0 | 26,677 | 23,367 | |||||||||
International Business Machines | 0.5 | 62,681 | 11,607 | |||||||||
Mastercard, Cl A | 1.2 | 44,237 | 29,762 | |||||||||
Microsoft | 0.8 | 557,909 | 18,584 | |||||||||
Oracle, Cl B | 0.6 | 472,588 | 15,676 | |||||||||
Qualcomm | 1.5 | 534,150 | 35,980 | |||||||||
Teradata* | 0.5 | 235,974 | 13,082 | |||||||||
Visa, Cl A | 1.0 | 129,061 | 24,664 | |||||||||
Western Digital | 0.6 | 230,097 | 14,588 | |||||||||
Other Securities | 9.0 | 215,880 | ||||||||||
|
| |||||||||||
| 479,278 | ||||||||||||
|
| |||||||||||
Materials — 3.1% |
| |||||||||||
Dow Chemical, Cl A | 0.5 | 296,499 | 11,386 | |||||||||
LyondellBasell Industries, Cl A | 0.6 | 195,588 | 14,323 | |||||||||
Other Securities | 2.0 | 49,138 | ||||||||||
|
| |||||||||||
| 74,847 | ||||||||||||
|
| |||||||||||
Telecommunication Services — 1.5% |
| |||||||||||
Crown Castle International* | 1.0 | 321,932 | 23,511 | |||||||||
Other Securities | 0.5 | 11,994 | ||||||||||
|
| |||||||||||
| 35,505 | ||||||||||||
|
| |||||||||||
| SEI Institutional Managed Trust / Annual Report / September 30, 2013 | 43 |
SUMMARY SCHEDULE OF INVESTMENTS
Tax-Managed Large Cap Fund (Concluded)
September 30, 2013
| Description | Percentage of Net Assets (%) | Shares | Market Value ($ Thousands) | |||||||||
Utilities — 1.6% | ||||||||||||
Other Securities | 1.6 | % | $ | 38,476 | ||||||||
|
| |||||||||||
Total Common Stock |
| 2,293,859 | ||||||||||
|
| |||||||||||
AFFILIATED PARTNERSHIP — 5.2% |
| |||||||||||
SEI Liquidity Fund, L.P. 0.070%**† (B) | 5.2 | 125,772,028 | 125,772 | |||||||||
|
| |||||||||||
Total Affiliated Partnership |
| 125,772 | ||||||||||
|
| |||||||||||
CASH EQUIVALENT — 4.6% |
| |||||||||||
SEI Daily Income Trust, | 4.6 | 109,822,447 | 109,822 | |||||||||
|
| |||||||||||
Total Cash Equivalent |
| 109,822 | ||||||||||
|
| |||||||||||
U.S. TREASURY OBLIGATIONS (C) — 0.1% |
| |||||||||||
Other Securities | 0.1 | 3,241 | ||||||||||
|
| |||||||||||
Total U.S. Treasury Obligations |
| 3,241 | ||||||||||
|
| |||||||||||
Total Investments — 105.2% |
| $ | 2,532,694 | |||||||||
|
| |||||||||||
A list of the open futures contracts held by the Fund at September 30, 2013, are as follows:
| Type of Contract | Number of Contracts Long | Expiration Date | Unrealized Appreciation | |||||||||
S&P 500 Index EMINI | 588 | Dec-2013 | $ | (301 | ) | |||||||
S&P Midcap 400 EMINI | 60 | Dec-2013 | 62 | |||||||||
|
| |||||||||||
| $ | (239 | ) | ||||||||||
|
| |||||||||||
For the year ended September 30, 2013, the total amount of all open futures contracts, as presented in the table above, are representative of the volume of activity for this derivative type during the year.
Percentages are based on Net Assets of $2,408,406 ($Thousands).
| * | Non-income producing security. |
| ** | Rate shown is the 7-day effective yield as of September 30, 2013. |
| † | Investment in Affiliated Security (see Note 6). |
| (A) | Certain securities or partial positions of certain securities are on loan at September 30, 2013 (see Note 10). The total market value of securities on loan at September 30, 2013 was $122,551 ($ Thousands). |
| (B) | This security was purchased with cash collateral received from securities lending (see Note 10). The total value of such securities as of September 30, 2013 was $125,772 ($ Thousands). |
| (C) | Security, or portion thereof, has been pledged as collateral on open futures contracts. |
Cl — Class
L.P. — Limited Partnership
S&P — Standard & Poor’s
The Summary Schedule of Investments does not reflect the complete portfolio holdings. It includes the Fund’s 50 largest holdings and each investment of any issuer that exceeds 1% of the Fund’s net assets. “Other Securities” represent all issues not required to be disclosed under the rules adopted by the U.S. Securities and Exchange Commission (“SEC”). In certain instances, securities for which footnotes listed above may otherwise apply are included in the Other Securities caption. The complete schedule of portfolio holdings is available (i) without charge, upon request, by calling (800) 342-5734; and (ii) on the SEC’s website at http://www.sec.gov.
The following is a list of the level of inputs used as of September 30, 2013, in valuing the Fund’s investments and other financial instruments carried at value ($ Thousands):
| Investments in Securities | Level 1 | Level 2 | Level 3 | Total | ||||||||||||
Common Stock | $ | 2,293,859 | $ | — | $ | — | $ | 2,293,859 | ||||||||
Affiliated Partnership | — | 125,772 | — | 125,772 | ||||||||||||
Cash Equivalent | 109,822 | — | — | 109,822 | ||||||||||||
U.S. Treasury Obligations | — | 3,241 | — | 3,241 | ||||||||||||
|
|
|
|
|
|
|
| |||||||||
Total Investments in Securities | $ | 2,403,681 | $ | 129,013 | $ | — | $ | 2,532,694 | ||||||||
|
|
|
|
|
|
|
| |||||||||
| Other Financial Instruments | Level 1 | Level 2 | Level 3 | Total | ||||||||||||
Futures Contracts* | ||||||||||||||||
Unrealized Appreciation | $ | 62 | $ | — | $ | — | $ | 62 | ||||||||
Unrealized Depreciation | (301 | ) | — | — | (301 | ) | ||||||||||
|
|
|
|
|
|
|
| |||||||||
Total Other Financial Instruments | $ | (239 | ) | $ | — | $ | — | $ | (239 | ) | ||||||
|
|
|
|
|
|
|
| |||||||||
| * | Futures contracts are valued at the unrealized appreciation (depreciation) on the instrument. |
For the year ended September 30, 2013, there were no transfers between Level 1 and Level 2 assets and liabilities.
For the year ended September 30, 2013, there were no transfers between Level 2 and Level 3 assets and liabilities.
For more information on valuation inputs, see Note 2 — Significant Accounting Policies in Notes to Financial Statements.
Amounts designated as “—” are $0 or have been rounded to $0.
The accompanying notes are an integral part of the financial statements.
| 44 | SEI Institutional Managed Trust / Annual Report / September 30, 2013 |
SUMMARY SCHEDULE OF INVESTMENTS
S&P 500 Index Fund
September 30, 2013
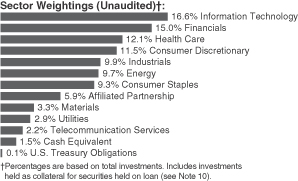
| Description | Percentage of Net Assets (%) | Shares | Market Value ($ Thousands) | |||||||||
COMMON STOCK (A) — 98.2% |
| |||||||||||
Consumer Discretionary — 12.2% |
| |||||||||||
Amazon.com, Cl A* | 0.8 | % | 66,200 | $ | 20,697 | |||||||
Comcast, Cl A | 0.8 | 468,022 | 21,131 | |||||||||
Home Depot | 0.7 | 256,396 | 19,448 | |||||||||
McDonald’s | 0.6 | 178,870 | 17,209 | |||||||||
Walt Disney | 0.7 | 297,327 | 19,175 | |||||||||
Other Securities | 8.6 | 236,115 | ||||||||||
|
| |||||||||||
| 333,775 | ||||||||||||
|
| |||||||||||
Consumer Staples — 9.9% |
| |||||||||||
Altria Group | 0.5 | 358,756 | 12,323 | |||||||||
Coca-Cola | 0.9 | 682,306 | 25,846 | |||||||||
CVS Caremark | 0.5 | 219,835 | 12,476 | |||||||||
PepsiCo | 0.8 | 275,985 | 21,941 | |||||||||
Philip Morris International | 0.9 | 289,665 | 25,082 | |||||||||
Procter & Gamble | 1.4 | 490,101 | 37,047 | |||||||||
Wal-Mart Stores | 0.8 | 291,344 | 21,548 | |||||||||
Other Securities | 4.1 | 112,385 | ||||||||||
|
| |||||||||||
| 268,648 | ||||||||||||
|
| |||||||||||
Energy — 10.3% |
| |||||||||||
Chevron | 1.5 | 345,778 | 42,012 | |||||||||
ConocoPhillips | 0.6 | 218,843 | 15,212 | |||||||||
Exxon Mobil | 2.5 | 787,698 | 67,774 | |||||||||
Occidental Petroleum | 0.5 | 144,159 | 13,485 | |||||||||
Schlumberger, Cl A | 0.8 | 236,843 | 20,927 | |||||||||
Other Securities | 4.4 | 120,696 | ||||||||||
|
| |||||||||||
| 280,106 | ||||||||||||
|
| |||||||||||
Financials — 15.9% |
| |||||||||||
American Express | 0.4 | 166,015 | 12,538 | |||||||||
American International Group | 0.5 | 264,208 | 12,848 | |||||||||
Bank of America | 1.0 | 1,922,628 | 26,532 | |||||||||
Berkshire Hathaway, Cl B* | 1.3 | 322,147 | 36,567 | |||||||||
Citigroup | 1.0 | 544,208 | 26,400 | |||||||||
JPMorgan Chase | 1.3 | 673,657 | 34,821 | |||||||||
US Bancorp | 0.4 | 329,206 | 12,042 | |||||||||
| Description | Percentage of Net Assets (%) | Shares | Market Value ($ Thousands) | |||||||||
Wells Fargo | 1.3 | % | 864,763 | $ | 35,732 | |||||||
Other Securities | 8.7 | 237,440 | ||||||||||
|
| |||||||||||
| 434,920 | ||||||||||||
|
| |||||||||||
Health Care — 12.8% |
| |||||||||||
AbbVie | 0.5 | 283,746 | 12,692 | |||||||||
Amgen, Cl A | 0.6 | 134,855 | 15,096 | |||||||||
Bristol-Myers Squibb | 0.5 | 294,675 | 13,638 | |||||||||
Gilead Sciences* | 0.6 | 273,944 | 17,214 | |||||||||
Johnson & Johnson | 1.6 | 504,282 | 43,716 | |||||||||
Merck | 0.9 | 523,744 | 24,935 | |||||||||
Pfizer | 1.2 | 1,184,791 | 34,015 | |||||||||
UnitedHealth Group | 0.5 | 181,947 | 13,029 | |||||||||
Other Securities | 6.4 | 174,702 | ||||||||||
|
| |||||||||||
| 349,037 | ||||||||||||
|
| |||||||||||
Industrials — 10.5% |
| |||||||||||
3M | 0.5 | 116,182 | 13,873 | |||||||||
Boeing | 0.5 | 124,232 | 14,597 | |||||||||
General Electric | 1.6 | 1,822,474 | 43,539 | |||||||||
Union Pacific | 0.5 | 82,994 | 12,892 | |||||||||
United Technologies | 0.6 | 151,032 | 16,284 | |||||||||
Other Securities | 6.8 | 185,940 | ||||||||||
|
| |||||||||||
| 287,125 | ||||||||||||
|
| |||||||||||
Information Technology — 17.6% |
| |||||||||||
Apple | 2.8 | 162,631 | 77,534 | |||||||||
Cisco Systems | 0.8 | 959,504 | 22,472 | |||||||||
Google, Cl A* | 1.6 | 50,063 | 43,850 | |||||||||
Intel | 0.7 | 891,615 | 20,436 | |||||||||
International Business Machines | 1.2 | 184,237 | 34,117 | |||||||||
Mastercard, Cl A | 0.5 | 18,600 | 12,514 | |||||||||
Microsoft | 1.6 | 1,356,593 | 45,188 | |||||||||
Oracle, Cl B | 0.8 | 638,088 | 21,165 | |||||||||
Qualcomm | 0.8 | 307,032 | 20,682 | |||||||||
Visa, Cl A | 0.6 | 92,372 | 17,652 | |||||||||
Other Securities | 6.2 | 163,365 | ||||||||||
|
| |||||||||||
| 478,975 | ||||||||||||
|
| |||||||||||
Materials — 3.5% |
| |||||||||||
Other Securities | 3.5 | 94,244 | ||||||||||
|
| |||||||||||
Telecommunication Services — 2.4% |
| |||||||||||
AT&T | 1.2 | 950,440 | 32,144 | |||||||||
Verizon Communications | 0.9 | 512,148 | 23,897 | |||||||||
Other Securities | 0.3 | 8,843 | ||||||||||
|
| |||||||||||
| 64,884 | ||||||||||||
|
| |||||||||||
Utilities — 3.1% |
| |||||||||||
Other Securities | 3.1 | 84,742 | ||||||||||
|
| |||||||||||
Total Common Stock |
| 2,676,456 | ||||||||||
|
| |||||||||||
| SEI Institutional Managed Trust / Annual Report / September 30, 2013 | 45 |
SUMMARY SCHEDULE OF INVESTMENTS
S&P 500 Index Fund (Concluded)
September 30, 2013
| Description | Percentage of Net Assets (%) | Shares | Market Value ($ Thousands) | |||||||||
AFFILIATED PARTNERSHIP — 6.3% |
| |||||||||||
SEI Liquidity Fund, L.P. 0.070%**† (B) | 6.3 | % | 171,382,829 | $ | 171,383 | |||||||
|
| |||||||||||
Total Affiliated Partnership |
| 171,383 | ||||||||||
|
| |||||||||||
CASH EQUIVALENT — 1.6% |
| |||||||||||
SEI Daily Income Trust, Prime Obligation Fund, Cl A | 1.6 | 43,449,539 | 43,450 | |||||||||
|
| |||||||||||
Total Cash Equivalent |
| 43,450 | ||||||||||
|
| |||||||||||
U.S. TREASURY OBLIGATIONS (C) — 0.1% |
| |||||||||||
Other Securities | 0.1 | 3,110 | ||||||||||
|
| |||||||||||
Total U.S. Treasury Obligations |
| 3,110 | ||||||||||
|
| |||||||||||
Total Investments — 106.2% |
| $ | 2,894,399 | |||||||||
|
| |||||||||||
A list of the open futures contracts held by the Fund at September 30, 2013, are as follows:
| Type of Contract | Number of Contracts Long | Expiration Date | Unrealized (Depreciation) ($ Thousands) | |||||||||
S&P 500 Index EMINI | 636 | Dec-2013 | $ | (224 | ) | |||||||
|
| |||||||||||
For the year ended September 30, 2013, the total amount of all open futures contracts, as presented in the table above, are representative of the volume of activity for this derivative type during the year.
Percentages are based on Net Assets of $2,725,862 ($Thousands).
| * | Non-income producing security. |
| ** | Rate shown is the 7-day effective yield as of September 30, 2013. |
| † | Investment in Affiliated Security (see Note 6). |
| (A) | This Security or a partial position of this security is on loan at September 30, 2013 (see Note 10). The total market value of securities on loan at September 30, 2013 was $166,618 ($ Thousands). |
| (B) | This security was purchased with cash collateral received from securities lending (see Note 10). The total value of such securities as of September 30, 2013 was $171,383 ($ Thousands). |
| (C) | Security, or portion thereof, has been pledged as collateral on open futures contracts. |
Cl — Class
L.P. — Limited Partnership
S&P — Standard & Poor’s
The Summary Schedule of Investments does not reflect the complete portfolio holdings. It includes the Fund’s 50 largest holdings and each investment of any issuer that exceeds 1% of the Fund’s net assets. “Other Securities” represent all issues not required to be disclosed under the rules adopted by the U.S. Securities and Exchange Commission (“SEC”). In certain instances, securities for which footnotes listed above may otherwise apply are included in the Other Securities caption. The complete schedule of portfolio holdings is available (i) without charge, upon request, by calling (800) 342-5734; and (ii) on the SEC’s website at http://www.sec.gov.
The following is a list of the level of inputs used as of September 30, 2013, in valuing the Fund’s investments and other financial instruments carried at value ($ Thousands):
| Investments in Securities | Level 1 | Level 2 | Level 3 | Total | ||||||||||||
Common Stock | $ | 2,676,456 | $ | — | $ | — | $ | 2,676,456 | ||||||||
Affiliated Partnership | — | 171,383 | — | 171,383 | ||||||||||||
Cash Equivalent | 43,450 | — | — | 43,450 | ||||||||||||
U.S. Treasury Obligations | — | 3,110 | — | 3,110 | ||||||||||||
|
|
|
|
|
|
|
| |||||||||
Total Investments in Securities | $ | 2,719,906 | $ | 174,493 | $ | — | $ | 2,894,399 | ||||||||
|
|
|
|
|
|
|
| |||||||||
| Other Financial Instruments | Level 1 | Level 2 | Level 3 | Total | ||||||||||||
Futures Contracts* | ||||||||||||||||
Unrealized Appreciation | $ | — | $ | — | $ | — | $ | — | ||||||||
Unrealized Depreciation | (224 | ) | — | — | (224 | ) | ||||||||||
|
|
|
|
|
|
|
| |||||||||
Total Other Financial Instruments | $ | (224 | ) | $ | — | $ | — | $ | (224 | ) | ||||||
|
|
|
|
|
|
|
| |||||||||
| * | Futures contracts are valued at unrealized depreciation on the instrument. |
For the year ended September 30, 2013, there were no transfers between Level 1 and Level 2 assets and liabilities.
For the year ended September 30, 2013, there were no transfers between Level 2 and Level 3 assets and liabilities.
For more information on valuation inputs, see Note 2 — Significant Accounting Policies in Notes to Financial Statements.
Amounts designated as “—” are $0 or have been rounded to $0.
The accompanying notes are an integral part of the financial statements.
| 46 | SEI Institutional Managed Trust / Annual Report / September 30, 2013 |
SUMMARY SCHEDULE OF INVESTMENTS
Small Cap Fund
September 30, 2013
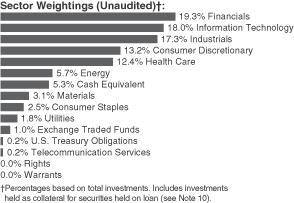
| Description | Percentage of Net Assets (%) | Shares | Market Value ($ Thousands) | |||||||||
COMMON STOCK — (A) 93.9% |
| |||||||||||
Consumer Discretionary — 13.2% |
| |||||||||||
HomeAway* | 0.4 | % | 53,174 | $ | 1,489 | |||||||
Lumber Liquidators Holdings* | 0.4 | 13,684 | 1,459 | |||||||||
Shutterfly* | 0.4 | 29,128 | 1,628 | |||||||||
Other Securities | 12.0 | 49,737 | ||||||||||
|
| |||||||||||
| 54,313 | ||||||||||||
|
| |||||||||||
Consumer Staples — 2.6% |
| |||||||||||
Other Securities | 2.6 | 10,504 | ||||||||||
|
| |||||||||||
Energy — 5.8% |
| |||||||||||
Dril-Quip* | 0.3 | 12,078 | 1,386 | |||||||||
Forum Energy Technologies* | 0.3 | 51,093 | 1,380 | |||||||||
Helix Energy Solutions Group* | 0.4 | 56,380 | 1,430 | |||||||||
Laredo Petroleum Holdings* | 0.3 | 40,699 | 1,208 | |||||||||
Oasis Petroleum* | 0.5 | 39,601 | 1,946 | |||||||||
Rosetta Resources* | 0.4 | 28,262 | 1,539 | |||||||||
Other Securities | 3.6 | 14,866 | ||||||||||
|
| |||||||||||
| 23,755 | ||||||||||||
|
| |||||||||||
Financials — 19.4% |
| |||||||||||
Amtrust Financial Services | 0.4 | 42,021 | 1,641 | |||||||||
Bancorpsouth, Cl A | 0.4 | 80,913 | 1,613 | |||||||||
Banner | 0.4 | 40,753 | 1,555 | |||||||||
Central Pacific Financial | 0.3 | 69,545 | 1,231 | |||||||||
CNO Financial Group | 0.6 | 158,150 | 2,278 | |||||||||
EastGroup Properties† | 0.3 | 20,249 | 1,199 | |||||||||
Susquehanna Bancshares | 0.3 | 110,167 | 1,383 | |||||||||
Western Alliance Bancorp* | 0.4 | 75,287 | 1,425 | |||||||||
Other Securities | 16.3 | 67,539 | ||||||||||
|
| |||||||||||
| 79,864 | ||||||||||||
|
| |||||||||||
Health Care — 12.4% |
| |||||||||||
Acadia Healthcare, Cl A* | 0.5 | 55,895 | 2,204 | |||||||||
HealthSouth | 0.4 | 53,020 | 1,828 | |||||||||
| Description | Percentage of Net Assets (%) | Shares | Market Value ($ Thousands) | |||||||||
Keryx Biopharmaceuticals* | 0.3 | % | 126,147 | $ | 1,274 | |||||||
WellCare Health Plans* | 0.4 | 25,251 | 1,761 | |||||||||
Other Securities | 10.8 | 43,968 | ||||||||||
|
| |||||||||||
| 51,035 | ||||||||||||
|
| |||||||||||
Industrials — 17.4% |
| |||||||||||
Actuant, Cl A | 0.7 | 74,156 | 2,880 | |||||||||
Carlisle | 0.3 | 18,463 | 1,298 | |||||||||
Chart Industries* | 0.3 | 10,085 | 1,241 | |||||||||
Dycom Industries* | 0.4 | 60,015 | 1,680 | |||||||||
EMCOR Group | 0.4 | 38,314 | 1,499 | |||||||||
Esterline Technologies* | 0.3 | 15,990 | 1,278 | |||||||||
Genesee & Wyoming, Cl A* | 0.3 | 13,328 | 1,239 | |||||||||
Hexcel, Cl A* | 0.6 | 62,413 | 2,422 | |||||||||
Kirby* | 0.4 | 15,472 | 1,339 | |||||||||
Middleby* | 0.4 | 7,848 | 1,640 | |||||||||
Old Dominion Freight Line, Cl A* | 0.4 | 33,880 | 1,558 | |||||||||
Swift Transportation, Cl A* | 0.4 | 75,736 | 1,529 | |||||||||
TrueBlue* | 0.4 | 73,763 | 1,771 | |||||||||
Other Securities | 12.1 | 49,920 | ||||||||||
|
| |||||||||||
| 71,294 | ||||||||||||
|
| |||||||||||
Information Technology — 18.0% |
| |||||||||||
Aspen Technology* | 0.5 | 57,485 | 1,986 | |||||||||
Cavium* | 0.5 | 53,918 | 2,221 | |||||||||
Ciena* | 0.4 | 59,074 | 1,476 | |||||||||
CoStar Group* | 0.6 | 13,164 | 2,210 | |||||||||
Dealertrack Technologies* | 0.6 | 54,254 | 2,324 | |||||||||
Envestnet* | 0.3 | 42,311 | 1,312 | |||||||||
Guidewire Software, Cl Z* | 0.4 | 39,131 | 1,843 | |||||||||
Infoblox* | 0.4 | 38,930 | 1,628 | |||||||||
OSI Systems* | 0.3 | 16,533 | 1,231 | |||||||||
PTC* | 0.4 | 59,265 | 1,685 | |||||||||
Trulia* | 0.3 | 28,084 | 1,321 | |||||||||
Ultimate Software Group* | 0.3 | 8,754 | 1,290 | |||||||||
Other Securities | 13.0 | 53,632 | ||||||||||
|
| |||||||||||
| 74,159 | ||||||||||||
|
| |||||||||||
Materials — 3.1% |
| |||||||||||
H.B. Fuller | 0.3 | 30,383 | 1,373 | |||||||||
PolyOne | 0.6 | 84,478 | 2,594 | |||||||||
Other Securities | 2.2 | 8,825 | ||||||||||
|
| |||||||||||
| 12,792 | ||||||||||||
|
| |||||||||||
Telecommunication Services — 0.2% |
| |||||||||||
Other Securities | 0.2 | 776 | ||||||||||
|
| |||||||||||
Utilities — 1.8% |
| |||||||||||
Other Securities | 1.8 | 7,271 | ||||||||||
|
| |||||||||||
Total Common Stock |
| 385,763 | ||||||||||
|
| |||||||||||
| SEI Institutional Managed Trust / Annual Report / September 30, 2013 | 47 |
SUMMARY SCHEDULE OF INVESTMENTS
Small Cap Fund (Concluded)
September 30, 2013
| Description | Percentage of Net Assets (%) | Shares | Market Value ($ Thousands) | |||||||||
EXCHANGE TRADED FUNDS — 1.0% |
| |||||||||||
iShares Russell 2000 Growth Index Fund | 0.4 | % | 13,560 | $ | 1,706 | |||||||
iShares Russell 2000 Value Index Fund | 0.6 | 24,700 | 2,264 | |||||||||
|
| |||||||||||
Total Exchange Traded Funds |
| 3,970 | ||||||||||
|
| |||||||||||
RIGHTS — 0.0% |
| |||||||||||
Other Securities | 0.0 | — | ||||||||||
|
| |||||||||||
Total Rights |
| — | ||||||||||
|
| |||||||||||
WARRANTS — 0.0% |
| |||||||||||
Other Securities | 0.0 | — | ||||||||||
|
| |||||||||||
Total Warrants |
| — | ||||||||||
|
| |||||||||||
AFFILIATED PARTNERSHIP — 17.2% |
| |||||||||||
SEI Liquidity Fund, L.P. | 17.2 | 70,638,797 | 70,639 | |||||||||
|
| |||||||||||
Total Affiliated Partnership |
| 70,639 | ||||||||||
|
| |||||||||||
CASH EQUIVALENT — 5.4% |
| |||||||||||
SEI Daily Income Trust, | 5.4 | 22,089,403 | 22,089 | |||||||||
|
| |||||||||||
Total Cash Equivalent |
| 22,089 | ||||||||||
|
| |||||||||||
U.S. TREASURY OBLIGATIONS (C) — 0.2% |
| |||||||||||
Other Securities | 0.2 | 974 | ||||||||||
|
| |||||||||||
Total U.S. Treasury Obligations |
| 974 | ||||||||||
|
| |||||||||||
Total Investments — 117.7% |
| $ | 483,435 | |||||||||
|
| |||||||||||
A list of the open futures contracts held by the Fund at September 30, 2013, is as follows:
| Type of Contract | Number of Contracts Long | Expiration Date | Unrealized Appreciation ($ Thousands) | |||||||||
Russell 2000 Index E-MINI | 132 | Dec-2013 | $ | 225 | ||||||||
|
| |||||||||||
For the year ended September 30, 2013, the total amount of all open futures contracts, as presented in the table above, are representative of the volume of activity for this derivative type during the year.
Percentages are based on Net Assets of $410,780 ($Thousands).
| * | Non-income producing security. |
| ** | Rate shown is the 7-day effective yield as of September 30, 2013. |
| † | Real Estate Investment Trust. |
| †† | Investment in Affiliated Security (see Note 6). |
| (A) | Certain securities or partial positions of certain securities are on loan at September 30, 2013 (see Note 10). The total market value of securities on loan at September 30, 2013 was $68,514 ($ Thousands). |
| (B) | This security was purchased with cash collateral held from securities on loan (see Note 10). The total market value of such securities as of September 30, 2013 was $70,639 ($ Thousands). |
| (C) | Security, or a portion thereof, has been pledged as collateral on open futures contracts. |
Cl — Class
L.P. — Limited Partnership
The Summary Schedule of Investments does not reflect the complete portfolio holdings. It includes the Fund’s 50 largest holdings and each investment of any issuer that exceeds 1% of the Fund’s net assets. “Other Securities” represent all issues not required to be disclosed under the rules adopted by the U.S. Securities and Exchange Commission (“SEC”). In certain instances, securities for which footnotes listed above may otherwise apply are included in the Other Securities caption. The complete schedule of portfolio holdings is available (i) without charge, upon request, by calling (800) 342-5734; and (ii) on the SEC’s website at http://www.sec.gov.
The following is a list of the level of inputs used as of September 30, 2013, in valuing the Fund’s investments and other financial instruments carried at value ($ Thousands):
| Investments in Securities | Level 1 | Level 2 | Level 3(1) | Total | ||||||||||||
Common Stock | $ | 385,758 | $ | — | $ | 5 | $ | 385,763 | ||||||||
Exchange Traded Funds | 3,970 | — | — | 3,970 | ||||||||||||
Rights | — | — | — | — | ||||||||||||
Warrants | — | — | — | — | ||||||||||||
U.S. Treasury Obligations | — | 974 | — | 974 | ||||||||||||
Affiliated Partnership | — | 70,639 | — | 70,639 | ||||||||||||
Cash Equivalent | 22,089 | — | — | 22,089 | ||||||||||||
|
|
|
|
|
|
|
| |||||||||
Total Investments in Securities | $ | 411,817 | $ | 71,613 | $ | 5 | $ | 483,435 | ||||||||
|
|
|
|
|
|
|
| |||||||||
| Other Financial Instruments | Level 1 | Level 2 | Level 3 | Total | ||||||||||||
Futures Contracts* | ||||||||||||||||
Unrealized Appreciation | $ | 225 | $ | — | $ | — | $ | 225 | ||||||||
|
|
|
|
|
|
|
| |||||||||
Total Other Financial Instruments | $ | 225 | $ | — | $ | — | $ | 225 | ||||||||
|
|
|
|
|
|
|
| |||||||||
| (1) | A reconciliation of Level 3 investments is presented when the Fund has a significant amount of Level 3 investments at the beginning and/or end of the period in relation to the net assets. |
| * | Futures contracts are valued at unrealized appreciation on the instrument. |
For the year ended September 30, 2013, there were no transfers between Level 1 and Level 2 assets and liabilities.
For the year ended September 30, 2013, there were no transfers between Level 2 and Level 3 assets and liabilities.
For more information on valuation inputs, see Note 2 — Significant Accounting Policies in Notes to Financial Statements.
Amounts designated as “—” are $O or have been rounded to $O.
The accompanying notes are an integral part of the financial statements.
| 48 | SEI Institutional Managed Trust / Annual Report / September 30, 2013 |
SUMMARY SCHEDULE OF INVESTMENTS
Small Cap Value Fund
September 30, 2013
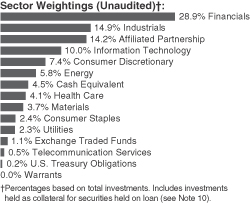
| Description | Percentage of Net Assets (%) | Shares | Market Value ($ Thousands) | |||||||||
COMMON STOCK — (A) 93.7%‡ |
| |||||||||||
Consumer Discretionary — 8.7% |
| |||||||||||
Big Lots* | 0.3 | % | 36,479 | $ | 1,353 | |||||||
DreamWorks Animation SKG, Cl A* | 0.4 | 49,600 | 1,412 | |||||||||
Libbey | 0.4 | 65,200 | 1,550 | |||||||||
Matthews International, Cl A | 0.4 | 42,506 | 1,618 | |||||||||
MDC Partners, Cl A | 0.3 | 47,500 | 1,329 | |||||||||
Rent-A-Center | 0.5 | 56,200 | 2,141 | |||||||||
Other Securities | 6.4 | 25,057 | ||||||||||
|
| |||||||||||
| 34,460 | ||||||||||||
|
| |||||||||||
Consumer Staples — 2.8% | ||||||||||||
Darling International* | 0.4 | 73,144 | 1,548 | |||||||||
Universal (A) | 0.4 | 27,900 | 1,421 | |||||||||
Other Securities | 2.0 | 7,971 | ||||||||||
|
| |||||||||||
| 10,940 | ||||||||||||
|
| |||||||||||
Energy — 6.8% | ||||||||||||
Approach Resources, Cl A* | 0.4 | 66,100 | 1,737 | |||||||||
Gulfmark Offshore, Cl A | 0.5 | 40,982 | 2,086 | |||||||||
Scorpio Tankers | 0.4 | 164,600 | 1,607 | |||||||||
World Fuel Services | 0.4 | 46,855 | 1,748 | |||||||||
Other Securities | 5.1 | 19,787 | ||||||||||
|
| |||||||||||
| 26,965 | ||||||||||||
|
| |||||||||||
Financials — 33.9% | ||||||||||||
American Equity Investment Life Holding | 0.5 | 86,600 | 1,838 | |||||||||
Bancorpsouth, Cl A | 0.4 | 86,800 | 1,731 | |||||||||
Central Pacific Financial | 0.4 | 78,650 | 1,392 | |||||||||
CNO Financial Group | 0.9 | 237,900 | 3,426 | |||||||||
Employers Holdings | 0.4 | 55,611 | 1,654 | |||||||||
Endurance Specialty Holdings | 0.4 | 26,207 | 1,408 | |||||||||
First Midwest Bancorp | 0.4 | 103,121 | 1,558 | |||||||||
Hanover Insurance Group, Cl A | 0.5 | 39,048 | 2,160 | |||||||||
Hatteras Financial† | 0.3 | 69,800 | 1,306 | |||||||||
Horace Mann Educators, Cl A | 0.3 | 48,591 | 1,379 | |||||||||
Lexington Realty Trust† | 0.3 | 120,941 | 1,358 | |||||||||
| Description | Percentage of Net Assets (%) | Shares | Market Value ($ Thousands) | |||||||||
Maiden Holdings | 0.3 | % | 115,600 | $ | 1,365 | |||||||
Meadowbrook Insurance Group | 0.4 | 260,700 | 1,694 | |||||||||
Nelnet, Cl A | 0.5 | 47,400 | 1,823 | |||||||||
Old National Bancorp, Cl A | 0.4 | 112,314 | 1,595 | |||||||||
Platinum Underwriters Holdings | 0.6 | 39,666 | 2,369 | |||||||||
Simon Property Group† | 0.5 | 13,344 | 1,978 | �� | ||||||||
Susquehanna Bancshares | 0.4 | 128,740 | 1,616 | |||||||||
WSFS Financial | 0.4 | 27,610 | 1,664 | |||||||||
Other Securities | 25.6 | 100,940 | ||||||||||
|
| |||||||||||
| 134,254 | ||||||||||||
|
| |||||||||||
Health Care — 4.8% |
| |||||||||||
Accuray* | 0.5 | 269,000 | 1,988 | |||||||||
Other Securities | 4.3 | 17,097 | ||||||||||
|
| |||||||||||
| 19,085 | ||||||||||||
|
| |||||||||||
Industrials — 17.4% |
| |||||||||||
Belden | 0.4 | 22,464 | 1,439 | |||||||||
Brink’s | 0.3 | 48,200 | 1,364 | |||||||||
Curtiss-Wright | 0.6 | 51,376 | 2,412 | |||||||||
EMCOR Group | 0.7 | 66,188 | 2,590 | |||||||||
FTI Consulting* | 0.7 | 76,383 | 2,887 | |||||||||
G&K Services | 0.4 | 24,064 | 1,453 | |||||||||
Kaydon | 0.4 | 38,960 | 1,384 | |||||||||
Ryder System | 0.5 | 33,310 | 1,989 | |||||||||
Tetra Tech* | 0.4 | 58,485 | 1,514 | |||||||||
Tutor Perini* | 0.5 | 90,300 | 1,925 | |||||||||
Other Securities | 12.5 | 50,113 | ||||||||||
|
| |||||||||||
| 69,070 | ||||||||||||
|
| |||||||||||
Information Technology — 11.7% |
| |||||||||||
Adtran | 0.6 | 93,898 | 2,502 | |||||||||
Exar* | 0.3 | 98,800 | 1,325 | |||||||||
Tech Data | 0.4 | 33,600 | 1,677 | |||||||||
Ultratech* | 0.6 | 83,500 | 2,530 | |||||||||
Other Securities | 9.8 | 38,481 | ||||||||||
|
| |||||||||||
| 46,515 | ||||||||||||
|
| |||||||||||
Materials — 4.4% |
| |||||||||||
H.B. Fuller | 0.6 | 49,550 | 2,239 | |||||||||
Other Securities | 3.8 | 15,104 | ||||||||||
|
| |||||||||||
| 17,343 | ||||||||||||
|
| |||||||||||
Telecommunication Services — 0.6% |
| |||||||||||
Other Securities | 0.6 | 2,197 | ||||||||||
|
| |||||||||||
Utilities — 2.6% | ||||||||||||
Portland General Electric | 0.5 | 62,801 | 1,773 | |||||||||
UIL Holdings | 0.3 | 35,350 | 1,314 | |||||||||
| SEI Institutional Managed Trust / Annual Report / September 30, 2013 | 49 |
SUMMARY SCHEDULE OF INVESTMENTS
Small Cap Value Fund (Concluded)
September 30, 2013
| Description | Percentage of Net Assets (%) | Shares | Market Value ($ Thousands) | |||||||||
Other Securities | 1.8 | % | $ | 7,382 | ||||||||
|
| |||||||||||
| 10,469 | ||||||||||||
|
| |||||||||||
Total Common Stock |
| 371,298 | ||||||||||
|
| |||||||||||
EXCHANGE TRADED FUNDS — 1.3% |
| |||||||||||
iShares Russell 2000 Index Fund | 0.3 | 10,790 | 1,150 | |||||||||
iShares Russell 2000 Value Index Fund | 1.0 | 44,900 | 4,115 | |||||||||
|
| |||||||||||
Total Exchange Traded Funds |
| |||||||||||
(Cost $4,935) ($ Thousands) |
| 5,265 | ||||||||||
|
| |||||||||||
WARRANTS — 0.0% |
| |||||||||||
Other Securities | 0.0 | — | ||||||||||
|
| |||||||||||
Total Warrants |
| — | ||||||||||
|
| |||||||||||
AFFILIATED PARTNERSHIP — 16.7% |
| |||||||||||
SEI Liquidity Fund, L.P. | 16.7 | 66,092,083 | 66,092 | |||||||||
|
| |||||||||||
Total Affiliated Partnership |
| 66,092 | ||||||||||
|
| |||||||||||
CASH EQUIVALENT — 5.2% |
| |||||||||||
SEI Daily Income Trust, | 5.2 | 20,733,946 | 20,734 | |||||||||
|
| |||||||||||
Total Cash Equivalent |
| 20,734 | ||||||||||
|
| |||||||||||
U.S. TREASURY OBLIGATIONS (C) — 0.2% |
| |||||||||||
Other Securities | 0.2 | 732 | ||||||||||
|
| |||||||||||
Total U.S. Treasury Obligations |
| 732 | ||||||||||
|
| |||||||||||
Total Investments — 117.1% |
| $ | 464,121 | |||||||||
|
| |||||||||||
A list of the open futures contracts held by the Fund at September 30, 2013, is as follows:
| Type of Contract | Number of Contracts Long | Expiration Date | Unrealized Appreciation ($ Thousands) | |||||||||
Russell 2000 Index E-MINI | 85 | Dec-2013 | $ | 116 | ||||||||
|
| |||||||||||
For the year ended September 30, 2013, the total amount of all open futures contracts, as presented in the table above, are representative of the volume of activity for this derivative type during the year.
Percentages are based on Net Assets of $396,421 ($Thousands).
| * | Non-income producing security. |
| ** | Rate shown is the 7-day effective yield as of September 30, 2013 |
| ‡ | Narrow Industries are utilized for compliance purposes, whereas broad sectors are utilized for reporting. |
| † | Real Estate Investment Trust |
| †† | Investment in Affiliated Security (see Note 6). |
| (A) | Certain securities or partial positions of certain securities are on loan at September 30, 2013 (see Note 10). The total market value of securities on loan at September 30, 2013 was $64,110 ($ Thousands). |
| (B) | This security was purchased with cash collateral held from securities on loan (see Note 10). The total market value of such securities as of September 30, 2013 was $66,092 ($ Thousands). |
| (C) | Security, or portion thereof has been pledged as collateral on open futures contracts. |
Cl — Class
L.P. — Limited Partnership
The Summary Schedule of Investments does not reflect the complete portfolio holdings. It includes the Fund’s 50 largest holdings and each investment of any issuer that exceeds 1% of the Fund’s net assets. “Other Securities” represent all issues not required to be disclosed under the rules adopted by the U.S. Securities and Exchange Commission (“SEC”). In certain instances, securities for which footnotes listed above may otherwise apply are included in the Other Securities caption. The complete schedule of portfolio holdings is available (i) without charge, upon request, by calling (800) 342-5734; and (ii) on the SEC’s website at http://www.sec.gov.
The following is a list of the level of inputs used as of September 30, 2013, in valuing the Fund’s investments and other financial instruments carried at value ($ Thousands):
| Investments in Securities | Level 1 | Level 2 | Level 3 | Total | ||||||||||||
Common Stock | $ | 371,298 | $ | — | $ | — | $ | 371,298 | ||||||||
Exchange Traded Funds | 5,265 | — | — | 5,265 | ||||||||||||
Warrants | — | — | — | — | ||||||||||||
U.S. Treasury Obligations | — | 732 | — | 732 | ||||||||||||
Affiliated Partnership | — | 66,092 | — | 66,092 | ||||||||||||
Cash Equivalent | 20,734 | — | — | 20,734 | ||||||||||||
|
|
|
|
|
|
|
| |||||||||
Total Investments in Securities | $ | 397,297 | $ | 66,824 | $ | — | $ | 464,121 | ||||||||
|
|
|
|
|
|
|
| |||||||||
| Other Financial Instruments | Level 1 | Level 2 | Level 3 | Total | ||||||||||||
Futures Contracts* | ||||||||||||||||
Unrealized Appreciation | $ | 116 | $ | — | $ | — | $ | 116 | ||||||||
|
|
|
|
|
|
|
| |||||||||
Total Other Financial Instruments | $ | 116 | $ | — | $ | — | $ | 116 | ||||||||
|
|
|
|
|
|
|
| |||||||||
| * | Futures contracts are valued at unrealized appreciation on the instrument. |
For the year ended September 30, 2013, there were no transfers between Level 1 and Level 2 assets and liabilities.
For the year ended September 30, 2013, there were no transfers between Level 2 and Level 3 assets and liabilities.
For more information on valuation inputs, see Note 2 — Significant Accounting Policies in Notes to Financial Statements.
Amounts designated as “—” are $0 or have been rounded to $0.
The accompanying notes are an integral part of the financial statements.
| 50 | SEI Institutional Managed Trust / Annual Report / September 30, 2013 |
SUMMARY SCHEDULE OF INVESTMENTS
Small Cap Growth Fund
September 30, 2013
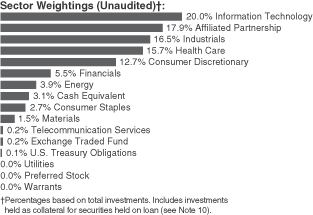
| Description | Percentage of Net Assets (%) | Shares | Market Value ($ Thousands) | |||||||||
COMMON STOCK — (A) 95.7% |
| |||||||||||
Consumer Discretionary — 15.5% |
| |||||||||||
Arctic Cat | 0.4 | % | 23,935 | $ | 1,366 | |||||||
Capella Education* | 0.4 | 24,342 | 1,377 | |||||||||
Carter’s | 0.5 | 23,615 | 1,792 | |||||||||
Conn’s* | 0.4 | 29,802 | 1,491 | |||||||||
Five Below* | 0.5 | 36,831 | 1,611 | |||||||||
Hibbett Sports* | 0.6 | 36,018 | 2,022 | |||||||||
HomeAway* | 0.5 | 58,592 | 1,641 | |||||||||
Lumber Liquidators Holdings* | 0.6 | 18,768 | 2,002 | |||||||||
National CineMedia | 0.5 | 93,230 | 1,758 | |||||||||
Shutterfly* | 0.4 | 25,702 | 1,436 | |||||||||
Wolverine World Wide | 0.8 | 48,147 | 2,804 | |||||||||
Other Securities | 10.1 | 35,816 | ||||||||||
|
| |||||||||||
| 55,116 | ||||||||||||
|
| |||||||||||
Consumer Staples — 3.3% |
| |||||||||||
Pilgrim’s Pride | 0.4 | 88,100 | 1,479 | |||||||||
Rite Aid* | 0.4 | 290,500 | 1,383 | |||||||||
Other Securities | 2.5 | 8,827 | ||||||||||
|
| |||||||||||
| 11,689 | ||||||||||||
|
| |||||||||||
Energy — 4.7% |
| |||||||||||
Dresser-Rand Group* | 0.4 | 23,847 | 1,488 | |||||||||
Dril-Quip* | 0.9 | 26,993 | 3,097 | |||||||||
Laredo Petroleum Holdings* | 0.5 | 57,643 | 1,711 | |||||||||
Oasis Petroleum* | 0.5 | 34,585 | 1,699 | |||||||||
Other Securities | 2.4 | 8,731 | ||||||||||
|
| |||||||||||
| 16,726 | ||||||||||||
|
| |||||||||||
Financials — 6.7% |
| |||||||||||
Financial Engines | 0.5 | 27,079 | 1,610 | |||||||||
Signature Bank NY, Cl B* | 0.4 | 15,394 | 1,409 | |||||||||
Other Securities | 5.8 | 20,878 | ||||||||||
|
| |||||||||||
| 23,897 | ||||||||||||
|
| |||||||||||
| Description | Percentage of Net Assets (%) | Shares | Market Value ($ Thousands) | |||||||||
Health Care — 19.1% |
| |||||||||||
Acadia Healthcare, Cl A* | 0.7 | % | 63,512 | $ | 2,504 | |||||||
athenahealth* | 0.4 | 12,241 | 1,329 | |||||||||
Cubist Pharmaceuticals* | 0.4 | 20,657 | 1,313 | |||||||||
ExamWorks Group* | 0.4 | 53,377 | 1,387 | |||||||||
Novadaq Technologies* | 0.6 | 132,975 | 2,205 | |||||||||
Puma Biotechnology* | 0.4 | 26,870 | 1,442 | |||||||||
WellCare Health Plans* | 0.4 | 21,432 | 1,495 | |||||||||
Other Securities | 15.8 | 56,442 | ||||||||||
|
| |||||||||||
| 68,117 | ||||||||||||
|
| |||||||||||
Industrials — 20.1% |
| |||||||||||
Carlisle | 0.5 | 25,520 | 1,794 | |||||||||
Heico, Cl A | 0.6 | 39,005 | 1,956 | |||||||||
Hexcel, Cl A* | 0.6 | 57,513 | 2,231 | |||||||||
Kirby* | 0.5 | 21,336 | 1,847 | |||||||||
Middleby* | 0.6 | 11,062 | 2,311 | |||||||||
Old Dominion Freight Line, Cl A* | 0.6 | 43,727 | 2,011 | |||||||||
TrueBlue* | 0.7 | 108,716 | 2,610 | |||||||||
WESCO International* | 0.4 | 18,373 | 1,406 | |||||||||
Other Securities | 15.6 | 55,338 | ||||||||||
|
| |||||||||||
| 71,504 | ||||||||||||
|
| |||||||||||
Information Technology — 24.3% |
| |||||||||||
Aspen Technology* | 0.6 | 58,535 | 2,022 | |||||||||
Blackbaud, Cl A | 0.6 | 50,808 | 1,984 | |||||||||
Cadence Design Systems* | 0.4 | 108,089 | 1,459 | |||||||||
Cavium* | 0.6 | 53,815 | 2,217 | |||||||||
CommVault Systems* | 0.4 | 16,467 | 1,446 | |||||||||
Cornerstone OnDemand* | 0.6 | 38,941 | 2,003 | |||||||||
CoStar Group* | 0.9 | 18,725 | 3,144 | |||||||||
Dealertrack Technologies* | 0.7 | 61,304 | 2,626 | |||||||||
Demandware* | 0.4 | 31,767 | 1,472 | |||||||||
Envestnet* | 0.5 | 58,678 | 1,819 | |||||||||
Guidewire Software, Cl Z* | 0.7 | 52,303 | 2,464 | |||||||||
Infinera* | 0.4 | 140,570 | 1,590 | |||||||||
Measurement Specialties* | 0.5 | 30,186 | 1,637 | |||||||||
RealPage* | 0.4 | 69,456 | 1,609 | |||||||||
SS&C Technologies Holdings* | 1.0 | 95,095 | 3,623 | |||||||||
Trulia* | 0.5 | 40,199 | 1,891 | |||||||||
Other Securities | 15.1 | 53,472 | ||||||||||
|
| |||||||||||
| 86,478 | ||||||||||||
|
| |||||||||||
Materials — 1.8% |
| |||||||||||
Other Securities | 1.8 | 6,452 | ||||||||||
|
| |||||||||||
Telecommunication Services — 0.3% |
| |||||||||||
Other Securities | 0.3 | 1,049 | ||||||||||
|
| |||||||||||
Utilities — 0.0% |
| |||||||||||
Other Securities | 0.0 | 160 | ||||||||||
|
| |||||||||||
Total Common Stock |
| 341,188 | ||||||||||
|
| |||||||||||
| SEI Institutional Managed Trust / Annual Report / September 30, 2013 | 51 |
SUMMARY SCHEDULE OF INVESTMENTS
Small Cap Growth Fund (Concluded)
September 30, 2013
| Description | Percentage of Net Assets (%) | Shares | Market Value ($ Thousands) | |||||||||
EXCHANGE TRADED FUND — 0.2% |
| |||||||||||
Other Securities | 0.2 | % | $ | 857 | ||||||||
|
| |||||||||||
Total Exchange Traded Fund |
| 857 | ||||||||||
|
| |||||||||||
WARRANTS — 0.0% |
| |||||||||||
Other Securities | 0.0 | — | ||||||||||
|
| |||||||||||
Total Warrants |
| — | ||||||||||
|
| |||||||||||
PREFERRED STOCK — 0.0% |
| |||||||||||
Utiilities — 0.0% | ||||||||||||
Other Securities | 0.0 | 75 | ||||||||||
|
| |||||||||||
Total Preferred Stock |
| 75 | ||||||||||
|
| |||||||||||
AFFILIATED PARTNERSHIP — 21.7% |
| |||||||||||
SEI Liquidity Fund, L.P. | 21.7 | 77,336,763 | 77,337 | |||||||||
|
| |||||||||||
Total Affiliated Partnership |
| 77,337 | ||||||||||
|
| |||||||||||
CASH EQUIVALENT — 3.8% |
| |||||||||||
SEI Daily Income Trust, | 3.8 | 13,411,755 | 13,412 | |||||||||
|
| |||||||||||
Total Cash Equivalent |
| 13,412 | ||||||||||
|
| |||||||||||
U.S. TREASURY OBLIGATIONS (C) — 0.1% |
| |||||||||||
Other Securities | 0.1 | 506 | ||||||||||
|
| |||||||||||
Total U.S. Treasury Obligations |
| 506 | ||||||||||
|
| |||||||||||
Total Investments — 121.6% |
| $ | 433,375 | |||||||||
|
| |||||||||||
A list of the open futures contracts held by the Fund at September 30, 2013, is as follows:
| Type of Contract | Number of Contracts Long | Expiration Date | Unrealized Appreciation ($ Thousands) | |||||||||
Russell 2000 Index E-MINI | 86 | Dec-2013 | $ | 105 | ||||||||
|
| |||||||||||
For the year ended September 30, 2013, the total amount of all open futures contracts, as presented in the table above, are representative of the volume of activity for this derivative type during the year.
Percentages are based on Net Assets of $356,481 ($Thousands).
| * | Non-income producing security. |
| ** | Rate shown is the 7-day effective yield as of September 30, 2013 |
| † | Investment in Affiliated Security (see Note 6). |
| (A) | Certain securities or partial positions of certain securities are on loan at September 30, 2013 (see Note 10). The total market value of securities on loan at September 30, 2013 was $74,817 ($ Thousands). |
| (B) | This security was purchased with cash collateral held from securities on loan (see note 10). The total value of such securities as of September 30, 2013 was $77,337 ($ Thousands). |
| (C) | Security, or portion thereof, has been pledged as collateral on open futures contracts. |
Cl — Class
L.P. — Limited Partnership
The Summary Schedule of Investments does not reflect the complete portfolio holdings. It includes the Fund’s 50 largest holdings and each investment of any issuer that exceeds 1% of the Fund’s net assets. “Other Securities” represent all issues not required to be disclosed under the rules adopted by the U.S. Securities and Exchange Commission (“SEC”). In certain instances, securities for which footnotes listed above may otherwise apply are included in the Other Securities caption. The complete schedule of portfolio holdings is available (i) without charge, upon request, by calling (800) 342-5734; and (ii) on the SEC’s website at http://www.sec.gov.
The following is a list of the level of inputs used as of September 30, 2013, in valuing the Fund’s investments and other financial instruments carried at value ($ Thousands):
| Investments in Securities | Level 1 | Level 2 | Level 3(1) | Total | ||||||||||||
Common Stock | $ | 341,003 | $ | — | $ | 185 | $ | 341,188 | ||||||||
Exchange Traded Fund | 857 | — | — | 857 | ||||||||||||
Preferred Stock | — | 75 | — | 75 | ||||||||||||
Warrants | — | — | — | — | ||||||||||||
U.S. Treasury Obligations | — | 506 | — | 506 | ||||||||||||
Affiliated Partnership | — | 77,337 | — | 77,337 | ||||||||||||
Cash Equivalent | 13,412 | — | — | 13,412 | ||||||||||||
|
|
|
|
|
|
|
| |||||||||
Total Investments in Securities | $ | 355,272 | $ | 77,918 | $ | 185 | $ | 433,375 | ||||||||
|
|
|
|
|
|
|
| |||||||||
| Other Financial Instruments | Level 1 | Level 2 | Level 3 | Total | ||||||||||||
Futures Contracts* | ||||||||||||||||
Unrealized Appreciation | $ | 105 | $ | — | $ | — | $ | 105 | ||||||||
|
|
|
|
|
|
|
| |||||||||
Total Other Financial Instruments | $ | 105 | $ | — | $ | — | $ | 105 | ||||||||
|
|
|
|
|
|
|
| |||||||||
| (1) | A reconciliation of Level 3 investments is presented when the Fund has a significant amount of Level 3 investments at the beginning and/or end of the period in relation to the net assets. |
| * | Futures contracts are valued at unrealized appreciation on the instrument. |
For the year ended September 30, 2013, there were no transfers between Level 1 and Level 2 assets and liabilities.
For the year ended September 30, 2013, there were no transfers between Level 2 and Level 3 assets and liabilities.
For more information on valuation inputs, see Note 2 — Significant Accounting Policies in Notes to Financial Statements.
Amounts designated as “—” are $0 or have been rounded to $0.
The accompanying notes are an integral part of the financial statements.
| 52 | SEI Institutional Managed Trust / Annual Report / September 30, 2013 |
SUMMARY SCHEDULE OF INVESTMENTS
Tax-Managed Small/Mid Cap Fund
September 30, 2013
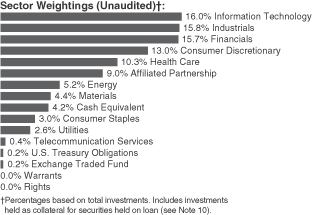
| Description | Percentage of Net Assets (%) | Shares | Market Value ($ Thousands) | |||||||||
COMMON STOCK — (A) 95.8% |
| |||||||||||
Consumer Discretionary — 14.4% |
| |||||||||||
Dana Holding | 0.4 | % | 70,265 | $ | 1,605 | |||||||
Five Below* | 0.3 | 29,741 | 1,301 | |||||||||
Harley-Davidson, Cl A | 0.4 | 29,961 | 1,925 | |||||||||
Life Time Fitness* | 0.3 | 26,269 | 1,352 | |||||||||
Lumber Liquidators Holdings* | 0.4 | 15,752 | 1,680 | |||||||||
Pier 1 Imports | 0.3 | 66,035 | 1,289 | |||||||||
Other Securities | 12.3 | 60,980 | ||||||||||
|
| |||||||||||
| 70,132 | ||||||||||||
|
| |||||||||||
Consumer Staples — 3.3% |
| |||||||||||
Darling International* | 0.3 | 73,771 | 1,561 | |||||||||
WhiteWave Foods, Cl A* | 0.2 | 63,260 | 1,263 | |||||||||
Other Securities | 2.8 | 13,372 | ||||||||||
|
| |||||||||||
| 16,196 | ||||||||||||
|
| |||||||||||
Energy — 5.7% |
| |||||||||||
Oasis Petroleum* | 0.3 | 28,237 | 1,387 | |||||||||
Other Securities | 5.4 | 26,434 | ||||||||||
|
| |||||||||||
| 27,821 | ||||||||||||
|
| |||||||||||
Financials — 17.4% |
| |||||||||||
Affiliated Managers Group* | 0.3 | 7,017 | 1,282 | |||||||||
CNO Financial Group | 0.3 | 105,533 | 1,520 | |||||||||
East West Bancorp | 0.3 | 40,152 | 1,283 | |||||||||
Hanover Insurance Group, Cl A | 0.3 | 23,986 | 1,327 | |||||||||
Signature Bank NY, Cl B* | 0.3 | 14,570 | 1,333 | |||||||||
Other Securities | 15.9 | 77,750 | ||||||||||
|
| |||||||||||
| 84,495 | ||||||||||||
|
| |||||||||||
Health Care — 11.5% |
| |||||||||||
Acadia Healthcare, Cl A* | 0.4 | 43,359 | 1,710 | |||||||||
Cubist Pharmaceuticals* | 0.3 | 25,437 | 1,616 | |||||||||
Humana | 0.3 | 12,651 | 1,181 | |||||||||
MEDNAX* | 0.4 | 21,433 | 2,152 | |||||||||
| Description | Percentage of Net Assets (%) | Shares | Market Value ($ Thousands) | |||||||||
Pacira Pharmaceuticals* | 0.3 | % | 31,083 | $ | 1,495 | |||||||
Sirona Dental Systems, Cl A | 0.3 | 18,170 | 1,216 | |||||||||
Team Health Holdings* | 0.3 | 35,068 | 1,330 | |||||||||
WellCare Health Plans* | 0.3 | 19,943 | 1,391 | |||||||||
Other Securities | 8.9 | 43,719 | ||||||||||
|
| |||||||||||
| 55,810 | ||||||||||||
|
| |||||||||||
Industrials — 17.5% |
| |||||||||||
Actuant, Cl A | 0.4 | 50,075 | 1,945 | |||||||||
Acuity Brands | 0.3 | 15,488 | 1,425 | |||||||||
Carlisle | 0.4 | 26,958 | 1,895 | |||||||||
Chart Industries* | 0.3 | 10,506 | 1,293 | |||||||||
Curtiss-Wright | 0.3 | 26,497 | 1,244 | |||||||||
Fluor | 0.3 | 17,461 | 1,239 | |||||||||
G&K Services | 0.3 | 22,348 | 1,350 | |||||||||
Generac Holdings | 0.4 | 43,048 | 1,836 | |||||||||
HD Supply Holdings* | 0.3 | 54,911 | 1,206 | |||||||||
Interface, Cl A | 0.3 | 78,455 | 1,557 | |||||||||
Kirby* | 0.4 | 20,577 | 1,781 | |||||||||
Moog, Cl A* | 0.4 | 30,666 | 1,799 | |||||||||
TrueBlue* | 0.4 | 72,166 | 1,733 | |||||||||
Other Securities | 13.0 | 64,733 | ||||||||||
|
| |||||||||||
| 85,036 | ||||||||||||
|
| |||||||||||
Information Technology — 17.7% |
| |||||||||||
Acxiom* | 0.3 | 42,207 | 1,198 | |||||||||
Alliance Data Systems* | 0.3 | 5,741 | 1,214 | |||||||||
Cadence Design Systems | 0.5 | 173,953 | 2,348 | |||||||||
CoStar Group* | 0.6 | 16,043 | 2,694 | |||||||||
Dealertrack Technologies* | 0.5 | 51,268 | 2,196 | |||||||||
FleetMatics Group* | 0.4 | 49,618 | 1,863 | |||||||||
Pandora Media* | 0.3 | 56,067 | 1,409 | |||||||||
PTC* | 0.6 | 95,914 | 2,727 | |||||||||
Trulia* | 0.3 | 35,591 | 1,674 | |||||||||
Ultimate Software Group* | 0.3 | 8,304 | 1,224 | |||||||||
Web.com Group* | 0.3 | 50,238 | 1,625 | |||||||||
Other Securities | 13.4 | 66,045 | ||||||||||
|
| |||||||||||
| 86,217 | ||||||||||||
|
| |||||||||||
Materials — 4.9% |
| |||||||||||
KapStone Paper and Packaging | 0.3 | 32,324 | 1,383 | |||||||||
PolyOne | 0.5 | 71,320 | 2,190 | |||||||||
Other Securities | 4.1 | 20,110 | ||||||||||
|
| |||||||||||
| 23,683 | ||||||||||||
|
| |||||||||||
Telecommunication Services — 0.4% |
| |||||||||||
Other Securities | 0.4 | 2,088 | ||||||||||
|
| |||||||||||
Utilities — 2.9% |
| |||||||||||
Great Plains Energy | 0.3 | 56,958 | 1,264 | |||||||||
Portland General Electric | 0.4 | 62,817 | 1,773 | |||||||||
| SEI Institutional Managed Trust / Annual Report / September 30, 2013 | 53 |
SUMMARY SCHEDULE OF INVESTMENTS
Tax-Managed Small/Mid Cap Fund (Concluded)
September 30, 2013
| Description | Percentage of Net Assets (%) | Shares | Market Value ($ Thousands) | |||||||||
Other Securities | 2.2 | % | $ | 11,193 | ||||||||
|
| |||||||||||
| 14,230 | ||||||||||||
|
| |||||||||||
Total Common Stock |
| 465,708 | ||||||||||
|
| |||||||||||
EXCHANGE TRADED FUND — 0.2% |
| |||||||||||
Other Securities | 0.2 | 866 | ||||||||||
|
| |||||||||||
Total Exchange Traded Fund |
| 866 | ||||||||||
|
| |||||||||||
RIGHTS — 0.0% |
| |||||||||||
Other Securities | 0.0 | — | ||||||||||
|
| |||||||||||
Total Rights |
| — | ||||||||||
|
| |||||||||||
WARRANTS — 0.0% |
| |||||||||||
Other Securities | 0.0 | — | ||||||||||
|
| |||||||||||
Total Warrants |
| — | ||||||||||
|
| |||||||||||
AFFILIATED PARTNERSHIP — 10.0% |
| |||||||||||
SEI Liquidity Fund, L.P. | 10.0 | 48,633,689 | 48,634 | |||||||||
|
| |||||||||||
Total Affiliated Partnership |
| 48,634 | ||||||||||
|
| |||||||||||
CASH EQUIVALENT — 4.6% |
| |||||||||||
SEI Daily Income Trust, | 4.6 | 22,677,227 | 22,677 | |||||||||
|
| |||||||||||
Total Cash Equivalent |
| 22,677 | ||||||||||
|
| |||||||||||
U.S. TREASURY OBLIGATIONS (C) — 0.2% |
| |||||||||||
Other Securities | 0.2 | 993 | ||||||||||
|
| |||||||||||
Total U.S. Treasury Obligations |
| 993 | ||||||||||
|
| |||||||||||
Total Investments — 110.8% |
| $ | 538,878 | |||||||||
|
| |||||||||||
A list of the open futures contracts held by the Fund at September 30, 2013, is as follows:
| Type of Contract | Number of Contracts Long | Expiration Date | Unrealized Appreciation ($ Thousands) | |||||||||
Russell 2000 Index E-MINI | 65 | Dec-2013 | $ | 116 | ||||||||
S&P 500 Index EMINI | 47 | Dec-2013 | 53 | |||||||||
|
| |||||||||||
| $ | 169 | |||||||||||
|
| |||||||||||
For the year ended September 30, 2013, the total amount of all open futures contracts, as presented in the table above, are representative of the volume of activity for this derivative type during the year.
Percentages are based on Net Assets of $486,216 ($Thousands).
| * | Non-income producing security. |
| ** | Rate shown is the 7-day effective yield as of September 30, 2013. |
| † | Investment in Affiliated Security (see Note 6). |
| (A) | Certain securities or partial positions of certain securities are on loan at September 30, 2013 (see Note 10). The total market value of securities on loan at September 30, 2013 was $47,136 ($ Thousands). |
| (B) | This security was purchased with cash collateral held from securities on loan (see note 10). The total market value of such securities as of September 30, 2013 was $48,634 ($Thousands). |
| (C) | Security, or portion thereof, has been pledged as collateral on open futures contracts. |
Cl — Class
L.P. — Limited Partnership
S&P — Standard & Poor’s
The Summary Schedule of Investments does not reflect the complete portfolio holdings. It includes the Fund’s 50 largest holdings and each investment of any issuer that exceeds 1% of the Fund’s net assets. “Other Securities” represent all issues not required to be disclosed under the rules adopted by the U.S. Securities and Exchange Commission (“SEC”). In certain instances, securities for which footnotes listed above may otherwise apply are included in the Other Securities caption. The complete schedule of portfolio holdings is available (i) without charge, upon request, by calling (800) 342-5734; and (ii) on the SEC’s website at http://www.sec.gov.
The following is a list of the level of inputs used as of September 30, 2013, in valuing the Fund’s investments and other financial instruments carried at value ($ Thousands):
| Investments in Securities | Level 1 | Level 2 | Level 3 | Total | ||||||||||||
Common Stock | $ | 465,708 | $ | — | $ | — | $ | 465,708 | ||||||||
Exchange Traded Fund | 866 | — | — | 866 | ||||||||||||
Rights | — | — | — | — | ||||||||||||
Warrants | — | — | — | — | ||||||||||||
U.S. Treasury Obligations | — | 993 | — | 993 | ||||||||||||
Affiliated Partnership | — | 48,634 | — | 48,634 | ||||||||||||
Cash Equivalent | 22,677 | — | — | 22,677 | ||||||||||||
|
|
|
|
|
|
|
| |||||||||
Total Investments in Securities | $ | 489,251 | $ | 49,627 | $ | — | $ | 538,878 | ||||||||
|
|
|
|
|
|
|
| |||||||||
| Other Financial Instruments | Level 1 | Level 2 | Level 3 | Total | ||||||||||||
Futures Contracts* | ||||||||||||||||
Unrealized Appreciation | $ | 169 | $ | — | $ | — | $ | 169 | ||||||||
|
|
|
|
|
|
|
| |||||||||
Total Other Financial Instruments | $ | 169 | $ | — | $ | — | $ | 169 | ||||||||
|
|
|
|
|
|
|
| |||||||||
| * | Futures contracts are valued at unrealized appreciation on the instrument. |
For the year ended September 30, 2013, there were no transfers between Level 1 and Level 2 assets and liabilities.
For the year ended September 30, 2013, there were no transfers between Level 2 and Level 3 assets and liabilities.
For more information on valuation inputs, see Note 2 — Significant Accounting Policies in Notes to Financial Statements.
Amounts designated as “—” are $0 or have been rounded to $0.
The accompanying notes are an integral part of the financial statements.
| 54 | SEI Institutional Managed Trust / Annual Report / September 30, 2013 |
SUMMARY SCHEDULE OF INVESTMENTS
Mid-Cap Fund
September 30, 2013
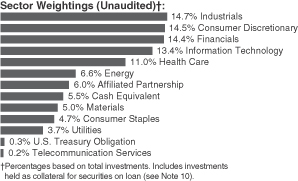
| Description | Percentage of Net Assets (%) | Shares | Market Value ($ Thousands) | |||||||||
COMMON STOCK (A) — 94.6% |
| |||||||||||
Consumer Discretionary — 15.6% |
| |||||||||||
Dollar General* | 0.6 | % | 11,920 | $ | 673 | |||||||
Harley-Davidson, Cl A | 1.4 | 23,968 | 1,540 | |||||||||
Michael Kors Holdings* | 1.0 | 14,600 | 1,088 | |||||||||
Mohawk Industries* | 0.5 | 4,200 | 547 | |||||||||
O’Reilly Automotive* | 0.7 | 6,150 | 785 | |||||||||
PetSmart | 0.6 | 8,277 | 631 | |||||||||
Ross Stores | 0.9 | 12,850 | 935 | |||||||||
Urban Outfitters* | 0.5 | 15,600 | 574 | |||||||||
Wynn Resorts | 0.5 | 3,525 | 557 | |||||||||
Other Securities | 8.9 | 9,651 | ||||||||||
|
| |||||||||||
| 16,981 | ||||||||||||
|
| |||||||||||
Consumer Staples — 5.0% |
| |||||||||||
Avon Products | 0.5 | 28,300 | 583 | |||||||||
Coca-Cola Enterprises | 0.5 | 13,892 | 559 | |||||||||
Ingredion | 0.6 | 10,096 | 668 | |||||||||
Kroger | 0.8 | 20,309 | 819 | |||||||||
Other Securities | 2.6 | 2,843 | ||||||||||
|
| |||||||||||
| 5,472 | ||||||||||||
|
| |||||||||||
Energy — 7.0% |
| |||||||||||
Cabot Oil & Gas | 0.6 | 17,200 | 642 | |||||||||
Concho Resources* | 0.6 | 5,580 | 607 | |||||||||
Range Resources | 0.5 | 7,716 | 586 | |||||||||
Other Securities | 5.3 | 5,827 | ||||||||||
|
| |||||||||||
| 7,662 | ||||||||||||
|
| |||||||||||
Financials — 15.5% |
| |||||||||||
Ameriprise Financial | 0.6 | 7,054 | 642 | |||||||||
CBRE Group, Cl A* | 0.6 | 30,600 | 708 | |||||||||
Fifth Third Bancorp | 0.7 | 41,402 | 747 | |||||||||
Moody’s | 0.7 | 10,375 | 730 | |||||||||
PartnerRe | 0.6 | 6,806 | 623 | |||||||||
Other Securities | 12.3 | 13,405 | ||||||||||
|
| |||||||||||
| 16,855 | ||||||||||||
|
| |||||||||||
| Description | Percentage of Net Assets (%) | Shares | Market Value ($ Thousands) | |||||||||
Health Care — 11.8% |
| |||||||||||
Actavis* | 0.5 | % | 3,775 | $ | 544 | |||||||
Agilent Technologies | 0.7 | 15,700 | 805 | |||||||||
Alexion Pharmaceuticals* | 0.7 | 6,570 | 763 | |||||||||
Humana | 0.7 | 8,500 | 793 | |||||||||
Illumina* (A) | 0.5 | 7,100 | 574 | |||||||||
Quest Diagnostics | 0.6 | 9,793 | 605 | |||||||||
Sirona Dental Systems, Cl A* | 0.6 | 9,350 | 626 | |||||||||
Valeant Pharmaceuticals International | 0.6 | 6,500 | 678 | |||||||||
Other Securities | 6.9 | 7,464 | ||||||||||
|
| |||||||||||
| 12,852 | ||||||||||||
|
| |||||||||||
Industrials — 15.8% |
| |||||||||||
Carlisle | 0.6 | 8,975 | 631 | |||||||||
Delta Air Lines, Cl A | 0.6 | 26,100 | 616 | |||||||||
Dover | 0.7 | 8,080 | 726 | |||||||||
Fluor | 0.9 | 14,494 | 1,028 | |||||||||
Fortune Brands Home & Security | 0.6 | 14,300 | 595 | |||||||||
JB Hunt Transport Services | 0.6 | 8,500 | 620 | |||||||||
Pall | 0.7 | 10,200 | 786 | |||||||||
Stericycle, Cl A* | 0.5 | 4,700 | 542 | |||||||||
Towers Watson, Cl A | 0.5 | 5,254 | 562 | |||||||||
Other Securities | 10.1 | 11,107 | ||||||||||
|
| |||||||||||
| 17,213 | ||||||||||||
|
| |||||||||||
Information Technology — 14.4% |
| |||||||||||
Alliance Data Systems* (A) | 0.8 | 3,850 | 814 | |||||||||
Amphenol, Cl A | 0.6 | 8,350 | 646 | |||||||||
Applied Materials | 0.8 | 49,700 | 872 | |||||||||
Avago Technologies, Cl A | 0.6 | 15,700 | 677 | |||||||||
F5 Networks, Cl A* | 0.6 | 7,335 | 629 | |||||||||
FleetCor Technologies* | 0.7 | 6,525 | 719 | |||||||||
LinkedIn, Cl A* | 0.5 | 2,270 | 559 | |||||||||
Symantec, Cl A | 0.6 | 25,719 | 637 | |||||||||
Synopsys* | 0.8 | 22,276 | 840 | |||||||||
Xilinx (A) | 0.5 | 12,050 | 565 | |||||||||
Other Securities | 7.9 | 8,697 | ||||||||||
|
| |||||||||||
| 15,655 | ||||||||||||
|
| |||||||||||
Materials — 5.4% |
| |||||||||||
Sherwin-Williams, Cl A | 0.6 | 3,860 | 703 | |||||||||
Other Securities | 4.8 | 5,180 | ||||||||||
|
| |||||||||||
| 5,883 | ||||||||||||
|
| |||||||||||
Telecommunication Services — 0.2% |
| |||||||||||
Other Securities | 0.2 | 230 | ||||||||||
|
| |||||||||||
| SEI Institutional Managed Trust / Annual Report / September 30, 2013 | 55 |
SUMMARY SCHEDULE OF INVESTMENTS
Mid-Cap Fund (Concluded)
September 30, 2013
| Description | Percentage of Net Assets (%) | Shares | Market Value ($ Thousands) | |||||||||
Utilities — 3.9% |
| |||||||||||
Xcel Energy | 0.6 | % | 25,380 | $ | 701 | |||||||
Other Securities | 3.3 | 3,599 | ||||||||||
|
| |||||||||||
| 4,300 | ||||||||||||
|
| |||||||||||
Total Common Stock |
| 103,103 | ||||||||||
|
| |||||||||||
AFFILIATED PARTNERSHIP — 6.5% |
| |||||||||||
SEI Liquidity Fund, L.P. 0.070%**† (B) | 6.5 | 7,046,466 | 7,046 | |||||||||
|
| |||||||||||
Total Affiliated Partnership |
| 7,046 | ||||||||||
|
| |||||||||||
CASH EQUIVALENT — 5.9% |
| |||||||||||
SEI Daily Income Trust, Prime Obligation Fund, Cl A 0.010%**† | 5.9 | 6,478,508 | 6,479 | |||||||||
|
| |||||||||||
Total Cash Equivalent |
| 6,479 | ||||||||||
|
| |||||||||||
U.S. TREASURY OBLIGATION (C) — 0.3% |
| |||||||||||
Other Securities | 0.3 | 356 | ||||||||||
|
| |||||||||||
Total U.S. Treasury Obligation |
| 356 | ||||||||||
|
| |||||||||||
Total Investments — 107.3% |
| $ | 116,984 | |||||||||
|
| |||||||||||
A list of the open futures contracts held by the Fund at September 30, 2013, is as follows:
| Type of Contract | Number of Contracts Long | Expiration Date | Unrealized Appreciation ($ Thousands) | |||||||||
S&P Mid 400 Index E-MINI | 42 | Dec-2013 | $ | 47 | ||||||||
|
| |||||||||||
For the year ended September 30, 2013, the total amount of all open futures contracts, as presented in the table above, are representative of the volume of activity for this derivative type during the year.
Percentages are based on Net Assets of $109,045 ($Thousands).
| * | Non-income producing security. |
| ** | Rate shown is the 7-day effective yield as of September 30, 2013. |
| † | Investment in Affiliated Security (see Note 6). |
| (A) | Certain securities or partial positions of certain securities are on loan at September 30, 2013 (see Note 10). The total market value of securities on loan at September 30, 2013 was $6,872 ($ Thousands). |
| (B) | This security was purchased with cash collateral held from securities on loan (see Note 10). The total value of such securities as of September 30, 2013 was $7,046 ($ Thousands). |
| (C) | Security, or portion thereof, has been pledged as collateral on open futures contracts. |
Cl — Class
L.P. — Limited Partnership
S&P — Standard & Poor’s
The Summary Schedule of Investments does not reflect the complete portfolio holdings. It includes the Fund’s 50 largest holdings and each investment of any issuer that exceeds 1% of the Fund’s net assets. “Other Securities” represent all issues not required to be disclosed under the rules adopted by the U.S. Securities and Exchange Commission
(“SEC”). In certain instances, securities for which footnotes listed above may otherwise apply are included in the Other Securities caption. The complete schedule of portfolio holdings is available (i) without charge, upon request, by calling (800) 342-5734; and (ii) on the SEC’s website at http://www.sec.gov.
The following is a list of the level of inputs used as of September 30, 2013, in valuing the Fund’s investments and other financial instruments carried at value ($ Thousands):
| Investments in Securities | Level 1 | Level 2 | Level 3 | Total | ||||||||||||
Common Stock | $ | 103,103 | $ | — | $ | — | $ | 103,103 | ||||||||
Affiliated Partnership | — | 7,046 | — | 7,046 | ||||||||||||
Cash Equivalent | 6,479 | — | — | 6,479 | ||||||||||||
U.S. Treasury Obligation | — | 356 | — | 356 | ||||||||||||
|
|
|
|
|
|
|
| |||||||||
Total Investments in Securities | $ | 109,582 | $ | 7,402 | $ | — | $ | 116,984 | ||||||||
|
|
|
|
|
|
|
| |||||||||
| Other Financial Instruments | Level 1 | Level 2 | Level 3 | Total | ||||||||||||
Futures Contracts* | ||||||||||||||||
Unrealized Appreciation | $ | 47 | $ | — | $ | — | $ | 47 | ||||||||
|
|
|
|
|
|
|
| |||||||||
Total Other Financial Instruments | $ | 47 | $ | — | $ | — | $ | 47 | ||||||||
|
|
|
|
|
|
|
| |||||||||
| * | Futures contracts are valued at unrealized appreciation on the instrument. |
For the year ended September 30, 2013, there were no transfers between Level 1 and Level 2 assets and liabilities.
For the year ended September 30, 2013, there were no transfers between Level 2 and Level 3 assets and liabilities.
For more information on valuation inputs, see Note 2 — Significant Accounting Policies in Notes to Financial Statements.
Amounts designated as “—” are $O or have been rounded to $O.
The accompanying notes are an integral part of the financial statements.
| 56 | SEI Institutional Managed Trust / Annual Report / September 30, 2013 |
SUMMARY SCHEDULE OF INVESTMENTS
U.S. Managed Volatility Fund
September 30, 2013
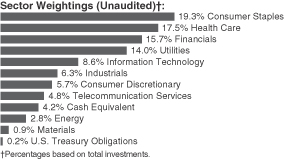
| Description | Percentage of Net Assets (%) | Shares | Market Value ($ Thousands) | |||||||||
COMMON STOCK — 95.6% |
| |||||||||||
Consumer Discretionary — 5.7% |
| |||||||||||
DIRECTV* | 0.6 | % | 86,000 | $ | 5,139 | |||||||
Target, Cl A | 1.3 | 167,867 | 10,740 | |||||||||
Other Securities | 3.8 | 32,605 | ||||||||||
|
| |||||||||||
| 48,484 | ||||||||||||
|
| |||||||||||
Consumer Staples — 19.3% |
| |||||||||||
Altria Group | 0.6 | 151,161 | 5,192 | |||||||||
Clorox | 0.9 | 94,440 | 7,718 | |||||||||
CVS Caremark | 0.6 | 95,700 | 5,431 | |||||||||
Hershey | 1.0 | 89,548 | 8,283 | |||||||||
Hormel Foods | 1.0 | 199,582 | 8,406 | |||||||||
Kroger | 0.8 | 168,500 | 6,797 | |||||||||
PepsiCo | 0.7 | 74,322 | 5,908 | |||||||||
Philip Morris International | 0.6 | 58,136 | 5,034 | |||||||||
Safeway | 0.7 | 189,400 | 6,059 | |||||||||
Tyson Foods, Cl A | 1.0 | 311,002 | 8,795 | |||||||||
Walgreen | 0.7 | 115,700 | 6,225 | |||||||||
Wal-Mart Stores | 1.5 | 170,047 | 12,577 | |||||||||
Other Securities | 9.2 | 78,270 | ||||||||||
|
| |||||||||||
| 164,695 | ||||||||||||
|
| |||||||||||
Energy — 2.8% |
| |||||||||||
Chevron | 0.9 | 62,200 | 7,557 | |||||||||
Exxon Mobil | 1.1 | 107,600 | 9,258 | |||||||||
Other Securities | 0.8 | 7,086 | ||||||||||
|
| |||||||||||
| 23,901 | ||||||||||||
|
| |||||||||||
Financials — 15.7% |
| |||||||||||
Allied World Assurance Holdings | 0.8 | 70,424 | 6,999 | |||||||||
Everest Re Group | 1.6 | 93,684 | 13,623 | |||||||||
PartnerRe | 1.6 | 143,755 | 13,159 | |||||||||
RenaissanceRe Holdings | 1.1 | 104,831 | 9,490 | |||||||||
Travelers | 0.7 | 65,600 | 5,561 | |||||||||
US Bancorp | 0.7 | 165,047 | 6,037 | |||||||||
Validus Holdings | 0.8 | 187,096 | 6,919 | |||||||||
Other Securities | 8.4 | 71,757 | ||||||||||
|
| |||||||||||
| 133,545 | ||||||||||||
|
| |||||||||||
| Description | Percentage of Net Assets (%) | Shares | Market Value ($ Thousands) | |||||||||
Health Care — 17.5% | ||||||||||||
AmerisourceBergen | 1.0 | % | 142,491 | $ | 8,706 | |||||||
Amgen, Cl A | 0.9 | 71,400 | 7,992 | |||||||||
Becton Dickinson | 0.6 | 54,194 | 5,420 | |||||||||
Cardinal Health | 1.0 | 169,131 | 8,820 | |||||||||
Johnson & Johnson | 1.2 | 118,700 | 10,290 | |||||||||
McKesson | 1.4 | 93,046 | 11,938 | |||||||||
Merck | 0.9 | 159,800 | 7,608 | |||||||||
Pfizer | 1.0 | 286,400 | 8,223 | |||||||||
Techne, Cl A | 0.8 | 77,520 | 6,206 | |||||||||
Other Securities | 8.7 | 73,609 | ||||||||||
|
| |||||||||||
| 148,812 | ||||||||||||
|
| |||||||||||
Industrials — 6.3% |
| |||||||||||
L-3 Communications Holdings | 0.9 | 77,600 | 7,333 | |||||||||
Lockheed Martin | 1.3 | 85,616 | 10,920 | |||||||||
Northrop Grumman | 1.0 | 89,268 | 8,504 | |||||||||
Raytheon | 0.9 | 103,500 | 7,977 | |||||||||
Other Securities | 2.2 | 18,686 | ||||||||||
|
| |||||||||||
| 53,420 | ||||||||||||
|
| |||||||||||
Information Technology — 8.6% |
| |||||||||||
Amdocs | 1.2 | 278,322 | 10,198 | |||||||||
Cisco Systems | 0.6 | 225,100 | 5,272 | |||||||||
International Business Machines | 0.9 | 42,800 | 7,926 | |||||||||
Microsoft | 0.8 | 196,700 | 6,552 | |||||||||
Other Securities | 5.1 | 43,655 | ||||||||||
|
| |||||||||||
| 73,603 | ||||||||||||
|
| |||||||||||
Materials — 0.9% |
| |||||||||||
Other Securities | 0.9 | 7,952 | ||||||||||
|
| |||||||||||
Telecommunication Services — 4.8% |
| |||||||||||
AT&T | 1.4 | 343,531 | 11,618 | |||||||||
Verizon Communications | 1.0 | 176,171 | 8,220 | |||||||||
Other Securities | 2.4 | 21,534 | ||||||||||
|
| |||||||||||
| 41,372 | ||||||||||||
|
| |||||||||||
Utilities — 14.0% |
| |||||||||||
American Electric Power | 0.6 | 130,309 | 5,649 | |||||||||
American Water Works | 0.8 | 170,913 | 7,055 | |||||||||
Consolidated Edison | 1.3 | 207,529 | 11,443 | |||||||||
DTE Energy | 1.1 | 138,874 | 9,163 | |||||||||
Edison International | 1.4 | 258,411 | 11,902 | |||||||||
PPL | 0.6 | 166,600 | 5,061 | |||||||||
Public Service Enterprise Group | 0.6 | 148,400 | 4,887 | |||||||||
Wisconsin Energy | 0.6 | 125,445 | 5,065 | |||||||||
Other Securities | 7.0 | 59,225 | ||||||||||
|
| |||||||||||
| 119,450 | ||||||||||||
|
| |||||||||||
Total Common Stock |
| 815,234 | ||||||||||
|
| |||||||||||
| SEI Institutional Managed Trust / Annual Report / September 30, 2013 | 57 |
SUMMARY SCHEDULE OF INVESTMENTS
U.S. Managed Volatility Fund (Concluded)
September 30, 2013
| Description | Percentage of Net Assets (%) | Shares | Market Value ($ Thousands) | |||||||||
CASH EQUIVALENT — 4.2% |
| |||||||||||
SEI Daily Income Trust, Prime Obligation Fund, Cl A | 4.2 | % | 35,766,679 | $ | 35,767 | |||||||
|
| |||||||||||
Total Cash Equivalent |
| 35,767 | ||||||||||
|
| |||||||||||
U.S. TREASURY OBLIGATIONS (A) — 0.2% |
| |||||||||||
Other Securities | 0.2 | 1,391 | ||||||||||
|
| |||||||||||
Total U.S. Treasury Obligations |
| 1,391 | ||||||||||
|
| |||||||||||
Total Investments — 100.0% |
| $ | 852,392 | |||||||||
|
| |||||||||||
A list of the open futures contracts held by the Fund at September 30, 2013, is as follows:
| Type of Contract | Number of Contracts Long | Expiration Date | Unrealized Depreciation ($ Thousands) | |||||||||
S&P 500 Index E-MINI | 277 | Dec-2013 | $ | (112 | ) | |||||||
|
| |||||||||||
For the year ended September 30, 2013, the total amount of all open futures contracts, as presented in the table above, are representative of the volume of activity for this derivative type during the year.
Percentages are based on Net Assets of $852,349 ($Thousands).
| * | Non-income producing security. |
| ** | Rate shown is the 7-day effective yield as of September 30, 2013. |
| † | Investment in Affiliated Security (see Note 6). |
Cl — Class
S&P — Standard & Poor’s
| (A) | Security, or portion thereof has been pledged as collateral on open futures contracts. |
The Summary Schedule of Investments does not reflect the complete portfolio holdings. It includes the Fund’s 50 largest holdings and each investment of any issuer that exceeds 1% of the Fund’s net assets. “Other Securities” represent all issues not required to be disclosed under the rules adopted by the U.S. Securities and Exchange Commission (“SEC”). In certain instances, securities for which footnotes listed above may otherwise apply are included in the Other Securities caption. The complete schedule of portfolio holdings is available (i) without charge, upon request, by calling (800) 342-5734; and (ii) on the SEC’s website at http://www.sec.gov.
The following is a list of the level of inputs used as of September 30, 2013, in valuing the Fund’s investments and other financial instruments carried at value ($ Thousands):
| Investments in Securities | Level 1 | Level 2 | Level 3 | Total | ||||||||||||
Common Stock | $ | 815,234 | $ | — | $ | — | $ | 815,234 | ||||||||
Cash Equivalent | 35,767 | — | — | 35,767 | ||||||||||||
U.S. Treasury Obligations | — | 1,391 | — | 1,391 | ||||||||||||
|
|
|
|
|
|
|
| |||||||||
Total Investments in Securities | $ | 851,001 | $ | 1,391 | $ | — | $ | 852,392 | ||||||||
|
|
|
|
|
|
|
| |||||||||
| Other Financial Instruments | Level 1 | Level 2 | Level 3 | Total | ||||||||||||
Futures Contracts* | ||||||||||||||||
Unrealized Depreciation | $ | (112 | ) | $ | — | $ | — | $ | (112 | ) | ||||||
|
|
|
|
|
|
|
| |||||||||
Total Other Financial Instruments | $ | (112 | ) | $ | — | $ | — | $ | (112 | ) | ||||||
|
|
|
|
|
|
|
| |||||||||
| * | Futures contracts are valued at unrealized depreciation on the instrument. |
For the year ended September 30, 2013, there were no transfers between Level 1 and Level 2 assets and liabilities.
For the year ended September 30, 2013, there were no transfers between Level 2 and Level 3 assets and liabilities.
For more information on valuation inputs, see Note 2 — Significant Accounting
Policies in Notes to Financial Statements.
Amounts designated as “—” are $O or have been rounded to $O.
The accompanying notes are an integral part of the financial statements.
| 58 | SEI Institutional Managed Trust / Annual Report / September 30, 2013 |
SUMMARY SCHEDULE OF INVESTMENTS
Global Managed Volatility Fund
September 30, 2013
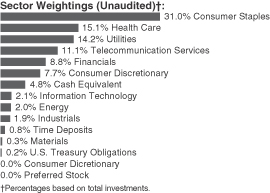
| Description | Percentage of Net Assets (%) | Shares | Market Value ($ Thousands) | |||||||||
COMMON STOCK — 91.4% |
| |||||||||||
Australia — 6.5% |
| |||||||||||
Coca-Cola Amatil | 0.8 | % | 917,571 | $ | 10,519 | |||||||
CSL | 0.8 | 192,070 | 11,494 | |||||||||
Woolworths | 0.8 | 332,164 | 10,871 | |||||||||
Other Securities | 4.1 | 58,129 | ||||||||||
|
| |||||||||||
| 91,013 | ||||||||||||
|
| |||||||||||
Austria — 0.1% |
| |||||||||||
Other Securities | 0.1 | 952 | ||||||||||
|
| |||||||||||
| 952 | ||||||||||||
|
| |||||||||||
Belgium — 0.3% |
| |||||||||||
Other Securities | 0.3 | 3,506 | ||||||||||
|
| |||||||||||
| 3,506 | ||||||||||||
|
| |||||||||||
Canada — 11.5% |
| |||||||||||
Bank of Montreal | 0.7 | 142,000 | 9,498 | |||||||||
BCE | 0.6 | 203,718 | 8,699 | |||||||||
Canadian Imperial Bank of Commerce | 0.8 | 142,100 | 11,344 | |||||||||
Canadian Tire, Cl A | 0.6 | 93,800 | 8,325 | |||||||||
Metro, Cl A | 1.0 | 225,000 | 14,103 | |||||||||
National Bank of Canada | 0.9 | 146,800 | 12,149 | |||||||||
Other Securities | 6.9 | 97,369 | ||||||||||
|
| |||||||||||
| 161,487 | ||||||||||||
|
| |||||||||||
Cayman Islands — 0.0% |
| |||||||||||
Other Securities | 0.0 | 165 | ||||||||||
|
| |||||||||||
| 165 | ||||||||||||
|
| |||||||||||
Denmark — 2.5% |
| |||||||||||
Coloplast A/S, Cl B | 0.8 | 195,722 | 11,151 | |||||||||
TDC | 0.6 | 1,001,473 | 8,479 | |||||||||
Other Securities | 1.1 | 15,309 | ||||||||||
|
| |||||||||||
| 34,939 | ||||||||||||
|
| |||||||||||
| Description | Percentage of Net Assets (%) | Shares | Market Value ($ Thousands) | |||||||||
Finland — 0.1% |
| |||||||||||
Other Securities | 0.1 | % | $ | 1,528 | ||||||||
|
| |||||||||||
| 1,528 | ||||||||||||
|
| |||||||||||
France — 0.3% |
| |||||||||||
Other Securities | 0.3 | 3,377 | ||||||||||
|
| |||||||||||
| 3,377 | ||||||||||||
|
| |||||||||||
Germany — 1.1% |
| |||||||||||
Other Securities | 1.1 | 15,973 | ||||||||||
|
| |||||||||||
| 15,973 | ||||||||||||
|
| |||||||||||
Guernsey — 0.6% |
| |||||||||||
Amdocs | 0.6 | 222,273 | 8,144 | |||||||||
|
| |||||||||||
| 8,144 | ||||||||||||
|
| |||||||||||
Hong Kong — 2.4% |
| |||||||||||
CLP Holdings, Cl B | 0.8 | 1,384,000 | 11,270 | |||||||||
Power Assets Holdings | 0.6 | 983,000 | 8,797 | |||||||||
Other Securities | 1.0 | 13,760 | ||||||||||
|
| |||||||||||
| 33,827 | ||||||||||||
|
| |||||||||||
Ireland — 0.5% |
| |||||||||||
Other Securities | 0.5 | 6,188 | ||||||||||
|
| |||||||||||
| 6,188 | ||||||||||||
|
| |||||||||||
Israel — 1.2% |
| |||||||||||
Other Securities | 1.2 | 16,638 | ||||||||||
|
| |||||||||||
| 16,638 | ||||||||||||
|
| |||||||||||
Italy — 0.1% |
| |||||||||||
Other Securities | 0.1 | 1,703 | ||||||||||
|
| |||||||||||
| 1,703 | ||||||||||||
|
| |||||||||||
Japan — 9.8% |
| |||||||||||
NTT DOCOMO | 0.8 | 708,100 | 11,488 | |||||||||
Otsuka Holdings | 0.8 | 377,800 | 10,958 | |||||||||
Other Securities | 8.2 | 115,024 | ||||||||||
|
| |||||||||||
| 137,470 | ||||||||||||
|
| |||||||||||
Netherlands — 0.1% |
| |||||||||||
Other Securities | 0.1 | 1,945 | ||||||||||
|
| |||||||||||
| 1,945 | ||||||||||||
|
| |||||||||||
New Zealand — 1.0% |
| |||||||||||
Other Securities | 1.0 | 13,960 | ||||||||||
|
| |||||||||||
| 13,960 | ||||||||||||
|
| |||||||||||
Norway — 2.5% |
| |||||||||||
Statoil | 1.1 | 659,503 | 14,968 | |||||||||
Telenor | 0.9 | 553,074 | 12,635 | |||||||||
Other Securities | 0.5 | 6,994 | ||||||||||
|
| |||||||||||
| 34,597 | ||||||||||||
|
| |||||||||||
| SEI Institutional Managed Trust / Annual Report / September 30, 2013 | 59 |
SUMMARY SCHEDULE OF INVESTMENTS
Global Managed Volatility Fund (Continued)
September 30, 2013
| Description | Percentage of Net Assets (%) | Shares | Market Value ($ Thousands) | |||||||||
Portugal — 0.5% |
| |||||||||||
Other Securities | 0.5 | % | $ | 6,757 | ||||||||
|
| |||||||||||
| 6,757 | ||||||||||||
|
| |||||||||||
Singapore — 2.5% |
| |||||||||||
StarHub | 0.7 | 2,770,000 | 9,471 | |||||||||
Other Securities | 1.8 | 25,768 | ||||||||||
|
| |||||||||||
| 35,239 | ||||||||||||
|
| |||||||||||
Spain — 0.0% |
| |||||||||||
Other Securities | 0.0 | 412 | ||||||||||
|
| |||||||||||
| 412 | ||||||||||||
|
| |||||||||||
Sweden — 1.1% |
| |||||||||||
TeliaSonera | 0.6 | 1,162,718 | 8,914 | |||||||||
Other Securities | 0.5 | 6,703 | ||||||||||
|
| |||||||||||
| 15,617 | ||||||||||||
|
| |||||||||||
Switzerland — 3.7% |
| |||||||||||
PSP Swiss Property | 0.6 | 95,057 | 8,252 | |||||||||
Swisscom | 0.6 | 18,110 | 8,704 | |||||||||
Other Securities | 2.5 | 35,112 | ||||||||||
|
| |||||||||||
| 52,068 | ||||||||||||
|
| |||||||||||
United Kingdom — 12.3% |
| |||||||||||
Associated British Foods | 0.6 | 279,126 | 8,480 | |||||||||
AstraZeneca | 1.2 | 316,366 | 16,474 | |||||||||
Centrica | 0.8 | 1,819,047 | 10,891 | |||||||||
GlaxoSmithKline | 0.8 | 442,067 | 11,150 | |||||||||
Imperial Tobacco Group | 1.2 | 435,957 | 16,146 | |||||||||
J Sainsbury | 0.9 | 1,954,659 | 12,392 | |||||||||
Next, Cl A | 0.8 | 136,540 | 11,410 | |||||||||
Smith & Nephew | 0.6 | 696,396 | 8,695 | |||||||||
SSE | 0.7 | 392,889 | 9,378 | |||||||||
Unilever | 0.8 | 288,137 | 11,385 | |||||||||
WM Morrison Supermarkets | 0.9 | 2,887,513 | 13,093 | |||||||||
Other Securities | 3.0 | 42,223 | ||||||||||
|
| |||||||||||
| 171,717 | ||||||||||||
|
| |||||||||||
United States — 30.7% |
| |||||||||||
AmerisourceBergen | 1.0 | 218,449 | 13,347 | |||||||||
AT&T | 0.8 | 329,962 | 11,159 | |||||||||
Autozone* | 0.7 | 24,920 | 10,534 | |||||||||
Becton Dickinson | 0.6 | 80,901 | 8,092 | |||||||||
Clorox | 1.3 | 212,777 | 17,388 | |||||||||
Edison International | 0.7 | 226,392 | 10,428 | |||||||||
General Mills, Cl A | 1.4 | 404,921 | 19,404 | |||||||||
Hershey | 1.0 | 144,703 | 13,385 | |||||||||
JM Smucker | 0.6 | 80,383 | 8,443 | |||||||||
Johnson & Johnson | 1.2 | 200,967 | 17,422 | |||||||||
Kimberly-Clark | 1.4 | 209,645 | 19,753 | |||||||||
| Description | Percentage of Net Assets (%) | Shares/Face (Thousands) (1) | Market Value ($ Thousands) | |||||||||
PepsiCo | 0.8 | % | 132,010 | $ | 10,495 | |||||||
Pfizer | 0.8 | 392,040 | 11,255 | |||||||||
Pinnacle West Capital | 0.6 | 149,598 | 8,189 | |||||||||
Southern | 1.2 | 423,040 | 17,421 | |||||||||
Wal-Mart Stores | 0.9 | 165,441 | 12,236 | |||||||||
Other Securities | 15.7 | 221,165 | ||||||||||
|
| |||||||||||
| 430,116 | ||||||||||||
|
| |||||||||||
Total Common Stock |
| 1,279,338 | ||||||||||
|
| |||||||||||
PREFERRED STOCK — 0.0% |
| |||||||||||
United States — 0.0% |
| |||||||||||
Other Securities | 0.0 | 133 | ||||||||||
|
| |||||||||||
Total Preferred Stock |
| 133 | ||||||||||
|
| |||||||||||
CASH EQUIVALENT — 4.6% |
| |||||||||||
SEI Daily Income Trust, Prime Obligation Fund, Cl A 0.010%**† | 4.6 | 64,403,400 | 64,403 | |||||||||
|
| |||||||||||
Total Cash Equivalent |
| 64,403 | ||||||||||
|
| |||||||||||
TIME DEPOSITS — 0.8% |
| |||||||||||
Brown Brothers Harriman |
| |||||||||||
1.698%, 10/01/2013 | 0.1 | AUD | 622 | 581 | ||||||||
1.650%, 10/01/2013 | 0.0 | NZD | 7 | 6 | ||||||||
0.672%, 10/01/2013 | 0.0 | NOK | 1 | — | ||||||||
0.400%, 10/01/2013 | 0.0 | CAD | 304 | 296 | ||||||||
0.250%, 10/01/2013 | 0.0 | SEK | 1 | — | ||||||||
0.106%, 10/01/2013 | 0.0 | GBP | 352 | 570 | ||||||||
0.030%, 10/01/2013 | 0.6 | 8,598 | 8,598 | |||||||||
0.019%, 10/01/2013 | 0.0 | EUR | — | — | ||||||||
0.005%, 10/01/2013 | 0.1 | HKD | 5,863 | 756 | ||||||||
0.005%, 10/01/2013 | 0.0 | JPY | 1,432 | 15 | ||||||||
0.005%, 10/01/2013 | 0.0 | SGD | 150 | 119 | ||||||||
0.001%, 10/01/2013 | 0.0 | CHF | — | — | ||||||||
|
| |||||||||||
Total Time Deposits |
| 10,941 | ||||||||||
|
| |||||||||||
U.S. TREASURY OBLIGATIONS (A) — 0.2% |
| |||||||||||
Other Securities | 0.2 | 2,936 | ||||||||||
|
| |||||||||||
Total U.S. Treasury Obligations |
| 2,936 | ||||||||||
|
| |||||||||||
Total Investments — 97.0% |
| $ | 1,357,751 | |||||||||
|
| |||||||||||
| 60 | SEI Institutional Managed Trust / Annual Report / September 30, 2013 |
A list of the open futures contracts held by the Fund at September 30, 2013, is as follows:
| Type of Contract | Number of Contracts Long | Expiration Date | Unrealized Appreciation (Depreciation) ($ Thousands) | |||||||||
DJ Euro Stoxx 50 Index | 262 | Dec-2013 | $ | (11 | ) | |||||||
FTSE 100 Index | 89 | Dec-2013 | (118 | ) | ||||||||
Hang Seng Index | 8 | Oct-2013 | (20 | ) | ||||||||
S&P 500 Index E-MINI | 498 | Dec-2013 | (146 | ) | ||||||||
SPI 200 Index | 20 | Dec-2013 | (20 | ) | ||||||||
Topix Index | 35 | Dec-2013 | 55 | |||||||||
|
| |||||||||||
| $ | (260 | ) | ||||||||||
|
| |||||||||||
For the year ended September 30, 2013, the total amount of all open futures contracts, as presented in the table above, are representative of the volume of activity for the derivative type during the year.
A list of the open forward foreign currency contracts held by the Fund as of September 30, 2013, is as follows:
| Maturity Date | Currency (Thousands) | Currency (Thousands) | Unrealized Appreciation (Depreciation) ($ Thousands) | |||||||||||||||||
10/30/13 | AUD | 118,371 | USD | 110,601 | $ | 171 | ||||||||||||||
10/30/13 | CAD | 169,608 | USD | 164,620 | (299 | ) | ||||||||||||||
10/30/13 | CHF | 49,170 | USD | 53,970 | (435 | ) | ||||||||||||||
10/30/13 | DKK | 207,544 | USD | 37,594 | (92 | ) | ||||||||||||||
10/30/13 | EUR | 28,542 | USD | 38,554 | (81 | ) | ||||||||||||||
10/30/13 | GBP | 115,237 | USD | 185,106 | (1,442 | ) | ||||||||||||||
10/30/13 | HKD | 289,152 | USD | 37,290 | — | |||||||||||||||
10/30/13 | JPY | 15,563,959 | USD | 157,750 | (915 | ) | ||||||||||||||
10/30/13 | NOK | 210,122 | USD | 34,876 | (33 | ) | ||||||||||||||
10/30/13 | NZD | 14,717 | USD | 12,111 | (119 | ) | ||||||||||||||
10/30/13 | SEK | 101,396 | USD | 15,759 | (20 | ) | ||||||||||||||
10/30/13 | SGD | 45,427 | USD | 36,216 | (1 | ) | ||||||||||||||
10/30/13 | USD | 1,141 | AUD | 1,222 | (1 | ) | ||||||||||||||
10/30/13 | USD | 1,112 | CAD | 1,144 | 1 | |||||||||||||||
10/30/13 | USD | 615 | CHF | 557 | 2 | |||||||||||||||
10/30/13 | USD | 290 | DKK | 1,597 | — | |||||||||||||||
10/30/13 | USD | 290 | EUR | 214 | — | |||||||||||||||
10/30/13 | USD | 2,919 | GBP | 1,809 | 10 | |||||||||||||||
10/30/13 | USD | 214 | HKD | 1,661 | — | |||||||||||||||
10/30/13 | USD | 1,937 | JPY | 190,174 | 1 | |||||||||||||||
10/30/13 | USD | 366 | NOK | 2,196 | (1 | ) | ||||||||||||||
10/30/13 | USD | 208 | NZD | 251 | 1 | |||||||||||||||
10/30/13 | USD | 114 | SEK | 733 | — | |||||||||||||||
10/30/13 | USD | 209 | SGD | 262 | — | |||||||||||||||
|
| |||||||||||||||||||
| $ | (3,253 | ) | ||||||||||||||||||
|
| |||||||||||||||||||
A list of the counterparties for the outstanding forward foreign currency contracts held by the Fund at September 30, 2013, is as follows:
| Counterparty | Currency to Deliver ($ Thousands) | Currency to Receive ($ Thousands) | Unrealized Depreciation ($ Thousands) | |||||||||
Brown Brothers Harriman | ($ | 897,127 | ) | $ | 893,874 | $ | (3,253 | ) | ||||
|
| |||||||||||
For the year ended September 30, 2013, the total amount of all open forward currency contracts, as presented in the table above, are representative of the volume of activity for the derivative type during the year.
Percentages are based on Net Assets of $1,400,270 ($Thousands).
| (1) | In U.S. Dollars unless otherwise indicated. |
| * | Non-income producing security. |
| ** | Rate shown is the 7-day effective yield as of September 30, 2013. |
| † | Investment in Affiliated Security (see Note 6). |
| (A) | Security, or portion thereof, has been pledged as collateral on open futures contracts. |
AUD — Australia Dollar
CAD — Canadian Dollar
CHF — Swiss Franc
Cl — Class
DJ — Dow Jones
DKK — Denmark Krone
EUR — Euro
FTSE — Financial Times and the London Stock Exchange
GBP — British Pound
HKD — Hong Kong Dollar
JPY — Japanese Yen
NOK — Norwegian Krone
NZD — New Zealand Dollar
S&P — Standard & Poor’s
SEK — Sweden Krona
SGD — Singapore Dollar
SPI — Swiss Performance Index
USD — U.S. Dollar
The Summary Schedule of Investments does not reflect the complete portfolio holdings. It includes the Fund’s 50 largest holdings and each investment of any issuer that exceeds 1% of the Fund’s net assets. “Other Securities” represent all issues not required to be disclosed under the rules adopted by the U.S. Securities and Exchange Commission (“SEC”). In certain instances, securities for which footnotes listed above may otherwise apply are included in the Other Securities caption. The complete schedule of portfolio holdings is available (i) without charge, upon request, by calling (800) 342-5734; and (ii) on the SEC’s website at http://www.sec.gov.
The following is a list of the level of inputs used as of September 30, 2013, in valuing the Fund’s investments and other financial investments carried at value ($ Thousands):
| Investments in Securities | Level 1 | Level 2 | Level 3 | Total | ||||||||||||
Common Stock | $ | 1,279,338 | $ | — | $ | — | $ | 1,279,338 | ||||||||
Preferred Stock | 133 | — | — | 133 | ||||||||||||
Cash Equivalent | 64,403 | — | — | 64,403 | ||||||||||||
Time Deposits | — | 10,941 | — | 10,941 | ||||||||||||
U.S. Treasury Obligations | — | 2,936 | — | 2,936 | ||||||||||||
|
|
|
|
|
|
|
| |||||||||
Total Investments in Securities | $ | 1,343,874 | $ | 13,877 | $ | — | $ | 1,357,751 | ||||||||
|
|
|
|
|
|
|
| |||||||||
| Other Financial Instruments | Level 1 | Level 2 | Level 3 | Total | ||||||||||||
Futures Contracts* | ||||||||||||||||
Unrealized Appreciation | $ | 55 | $ | — | $ | — | $ | 55 | ||||||||
Unrealized Depreciation | (315 | ) | — | — | (315 | ) | ||||||||||
Forwards Contracts* | — | — | — | — | ||||||||||||
Unrealized Appreciation | — | 186 | — | 186 | ||||||||||||
Unrealized Depreciation | — | (3,439 | ) | — | (3,439 | ) | ||||||||||
|
|
|
|
|
|
|
| |||||||||
Total Other Financial Instruments | $ | (260 | ) | $ | (3,253 | ) | $ | — | $ | (3,513 | ) | |||||
|
|
|
|
|
|
|
| |||||||||
| * | Futures contracts and forwards contracts are valued at the unrealized appreciation (depreciation) on the instrument. |
For the year ended September 30, 2013, there were transfers between Level 1 and Level 2 assets and liabilities. The primary reason for changes in the classifications between Level 1 and Level 2 occurs when foreign equity securities are fair valued using other observable market-based inputs in place of the closing exchange price due to events occurring after the close of the exchange or market on which the investment is principally traded (See Note 2).
For the year ended September 30, 2013, there were no transfers between Level 2 and Level 3 assets and liabilities.
For more information on valuation inputs, see Note 2 — Significant Accounting Policies in Notes to Financial Statements.
Amounts designated as “—” are $0 or have been rounded to $0.
The accompanying notes are an integral part of the financial statements.
| SEI Institutional Managed Trust / Annual Report / September 30, 2013 | 61 |
SUMMARY SCHEDULE OF INVESTMENTS
Tax-Managed Managed Volatility Fund
September 30, 2013
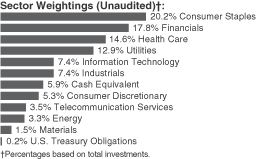
| Description | Percentage of Net Assets (%) | Shares | Market Value ($ Thousands) | |||||||||
COMMON STOCK — 93.8% |
| |||||||||||
Consumer Discretionary — 5.3% |
| |||||||||||
Target, Cl A | 0.7 | % | 70,723 | $ | 4,525 | |||||||
Other Securities | 4.6 | 28,502 | ||||||||||
|
| |||||||||||
| 33,027 | ||||||||||||
|
| |||||||||||
Consumer Staples — 20.2% |
| |||||||||||
Altria Group | 0.7 | 117,388 | 4,032 | |||||||||
Church & Dwight | 0.9 | 87,004 | 5,225 | |||||||||
Colgate-Palmolive | 0.7 | 68,913 | 4,086 | |||||||||
Costco Wholesale | 0.8 | 44,096 | 5,076 | |||||||||
CVS Caremark | 0.6 | 68,900 | 3,910 | |||||||||
General Mills, Cl A | 0.7 | 88,908 | 4,260 | |||||||||
Hershey | 1.0 | 64,957 | 6,008 | |||||||||
Hormel Foods | 0.9 | 138,034 | 5,814 | |||||||||
JM Smucker | 0.7 | 40,285 | 4,231 | |||||||||
Kimberly-Clark | 0.7 | 47,039 | 4,432 | |||||||||
Kroger | 0.9 | 138,516 | 5,588 | |||||||||
Lorillard | 0.9 | 129,979 | 5,821 | |||||||||
Procter & Gamble | 0.6 | 52,073 | 3,936 | |||||||||
Reynolds American | 0.7 | 87,275 | 4,257 | |||||||||
Safeway | 0.7 | 128,800 | 4,120 | |||||||||
Walgreen | 0.7 | 74,500 | 4,008 | |||||||||
Wal-Mart Stores | 1.5 | 129,082 | 9,547 | |||||||||
Other Securities | 6.5 | 41,111 | ||||||||||
|
| |||||||||||
| 125,462 | ||||||||||||
|
| |||||||||||
Energy — 3.3% |
| |||||||||||
Chevron | 0.8 | 42,900 | 5,212 | |||||||||
Exxon Mobil | 1.2 | 87,000 | 7,486 | |||||||||
Imperial Oil | 0.2 | 25,600 | 1,125 | |||||||||
Other Securities | 1.1 | 6,935 | ||||||||||
|
| |||||||||||
| 20,758 | ||||||||||||
|
| |||||||||||
Financials — 17.8% |
| |||||||||||
Capitol Federal Financial | 0.7 | 353,221 | 4,391 | |||||||||
Everest Re Group | 0.7 | 30,573 | 4,446 | |||||||||
HCC Insurance Holdings | 0.7 | 95,000 | 4,163 | |||||||||
PartnerRe | 1.1 | 72,979 | 6,680 | |||||||||
RenaissanceRe Holdings | 1.4 | 94,358 | 8,542 | |||||||||
| Description | Percentage of Net Assets (%) | Shares | Market Value ($ Thousands) | |||||||||
Tanger Factory Outlet Centers† | 0.7 | % | 126,106 | $ | 4,117 | |||||||
Travelers | 0.7 | 49,800 | 4,222 | |||||||||
Other Securities | 11.8 | 74,126 | ||||||||||
|
| |||||||||||
| 110,687 | ||||||||||||
|
| |||||||||||
Health Care — 14.6% |
| |||||||||||
AbbVie | 0.8 | 105,427 | 4,716 | |||||||||
AmerisourceBergen | 0.8 | 76,437 | 4,670 | |||||||||
Amgen, Cl A | 0.9 | 48,800 | 5,463 | |||||||||
Johnson & Johnson | 1.9 | 135,163 | 11,717 | |||||||||
McKesson | 0.7 | 31,900 | 4,093 | |||||||||
Merck | 0.7 | 96,500 | 4,594 | |||||||||
Perrigo | 0.6 | 31,664 | 3,907 | |||||||||
Pfizer | 0.8 | 169,600 | 4,869 | |||||||||
Other Securities | 7.4 | 46,699 | ||||||||||
|
| |||||||||||
| 90,728 | ||||||||||||
|
| |||||||||||
Industrials — 7.3% |
| |||||||||||
Alliant Techsystems | 0.7 | 44,200 | 4,312 | |||||||||
L-3 Communications Holdings | 0.9 | 57,100 | 5,396 | |||||||||
Northrop Grumman | 0.8 | 55,500 | 5,287 | |||||||||
Raytheon | 0.9 | 70,000 | 5,395 | |||||||||
Other Securities | 4.0 | 25,395 | ||||||||||
|
| |||||||||||
| 45,785 | ||||||||||||
|
| |||||||||||
Information Technology — 7.4% |
| |||||||||||
Amdocs | 0.8 | 129,100 | 4,730 | |||||||||
International Business Machines | 0.7 | 22,343 | 4,138 | |||||||||
Microsoft | 0.6 | 111,500 | 3,714 | |||||||||
Other Securities | 5.3 | 33,253 | ||||||||||
|
| |||||||||||
| 45,835 | ||||||||||||
|
| |||||||||||
Materials — 1.5% |
| |||||||||||
Other Securities | 1.5 | 9,376 | ||||||||||
|
| |||||||||||
Telecommunication Services — 3.5% |
| |||||||||||
AT&T | 0.6 | 118,000 | 3,991 | |||||||||
Other Securities | 2.9 | 17,662 | ||||||||||
|
| |||||||||||
| 21,653 | ||||||||||||
|
| |||||||||||
Utilities — 12.9% |
| |||||||||||
Consolidated Edison | 1.1 | 118,423 | 6,530 | |||||||||
DTE Energy | 0.7 | 61,757 | 4,075 | |||||||||
Duke Energy | 0.6 | 59,129 | 3,949 | |||||||||
Edison International | 0.8 | 105,400 | 4,855 | |||||||||
Northeast Utilities | 0.6 | 88,387 | 3,646 | |||||||||
PG&E | 0.6 | 93,200 | 3,814 | |||||||||
Wisconsin Energy | 0.9 | 135,904 | 5,488 | |||||||||
Other Securities | 7.6 | 47,747 | ||||||||||
|
| |||||||||||
| 80,104 | ||||||||||||
|
| |||||||||||
Total Common Stock |
| 583,415 | ||||||||||
|
| |||||||||||
| 62 | SEI Institutional Managed Trust / Annual Report / September 30, 2013 |
| Description | Percentage of Net Assets (%) | Shares | Market Value ($ Thousands) | |||||||||
CASH EQUIVALENT — 5.9% |
| |||||||||||
SEI Daily Income Trust, | 5.9 | % | 36,686,335 | $ | 36,686 | |||||||
|
| |||||||||||
Total Cash Equivalent |
| 36,686 | ||||||||||
|
| |||||||||||
U.S. TREASURY OBLIGATIONS (A) — 0.2% |
| |||||||||||
Other Securities | 0.2 | 1,057 | ||||||||||
|
| |||||||||||
Total U.S. Treasury Obligations |
| 1,057 | ||||||||||
|
| |||||||||||
Total Investments — 99.9% |
| $ | 621,158 | |||||||||
|
| |||||||||||
A list of the open futures contracts held by the Fund at September 30, 2013, are as follows:
| Type of Contract | Number of Contracts Long | Expiration Date | Unrealized (Depreciation) ($ Thousands) | |||||||||
S&P 500 Index EMINI | 235 | Dec-2013 | $ | (107 | ) | |||||||
|
| |||||||||||
For the year ended September 30, 2013, the total amount of all open futures contracts, as presented in the table above, are representative of the volume of activity for this derivative type during the year.
Percentages are based on Net Assets of $621,530 ($Thousands).
| * | Rate shown is the 7-day effective yield as of September 30, 2013. |
| † | Real Estate Investment Trust. |
| †† | Investment in Affiliated Security (see Note 6). |
| (A) | Security, or a portion thereof, has been pledged as collateral on open futures contracts. |
Cl — Class
S&P — Standard and Poor’s
The Summary Schedule of Investments does not reflect the complete portfolio holdings. It includes the Fund’s 50 largest holdings and each investment of any issuer that exceeds 1% of the Fund’s net assets. “Other Securities” represent all issues not required to be disclosed under the rules adopted by the U.S. Securities and Exchange Commission (“SEC”). In certain instances, securities for which footnotes listed above may otherwise apply are included in the Other Securities caption. The complete schedule of portfolio holdings is available (i) without charge, upon request, by calling (800) 342-5734; and (ii) on the SEC’s website at http://www.sec.gov.
The following is a list of the level of inputs used as of September 30, 2013, in valuing the Fund’s investments and other financial instruments carried at value ($ Thousands):
| Investments in Securities | Level 1 | Level 2 | Level 3 | Total | ||||||||||||
Common Stock | $ | 583,415 | $ | — | $ | — | $ | 583,415 | ||||||||
Cash Equivalent | 36,686 | — | — | 36,686 | ||||||||||||
U.S. Treasury Obligations | — | 1,057 | — | 1,057 | ||||||||||||
|
|
|
|
|
|
|
| |||||||||
Total Investments in Securities | $ | 620,101 | $ | 1,057 | $ | — | $ | 621,158 | ||||||||
|
|
|
|
|
|
|
| |||||||||
| Other Financial Instruments | Level 1 | Level 2 | Level 3 | Total | ||||||||||||
Futures Contracts* | ||||||||||||||||
Unrealized Depreciation | $ | (107 | ) | $ | — | $ | — | $ | (107 | ) | ||||||
|
|
|
|
|
|
|
| |||||||||
Total Other Financial Instruments | $ | (107 | ) | $ | — | $ | — | $ | (107 | ) | ||||||
|
|
|
|
|
|
|
| |||||||||
| * | Futures contracts are valued at unrealized depreciation on the instrument. |
For the year ended September 30, 2013, there were no transfers between Level 1 and Level 2 assets and liabilities.
For the year ended September 30, 2013, there were no transfers between Level 2 and Level 3 assets and liabilities.
For more information on valuation inputs, see Note 2 — Significant Accounting Policies in Notes to Financial Statements.
Amounts designated as “—” are $0 or have been rounded to $0.
The accompanying notes are an integral part of the financial statements.
| SEI Institutional Managed Trust / Annual Report / September 30, 2013 | 63 |
SCHEDULE OF INVESTMENTS
Real Estate Fund
September 30, 2013
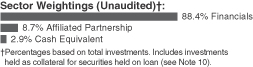
| Description | Shares | Market Value ($ Thousands) | ||||||
COMMON STOCK — 97.1%‡ |
| |||||||
Financials — 97.1% |
| |||||||
Alexandria Real Estate Equities† (A) | 52,110 | $ | 3,327 | |||||
Apartment Investment & Management, Cl A† | 174,034 | 4,862 | ||||||
Ashford Hospitality Trust† | 24,470 | 302 | ||||||
AvalonBay Communities† (A) | 75,011 | 9,533 | ||||||
Aviv† (A) | 23,950 | 546 | ||||||
BioMed Realty Trust† (A) | 189,300 | 3,519 | ||||||
Boston Properties† | 56,230 | 6,011 | ||||||
Brandywine Realty Trust† | 15,100 | 199 | ||||||
BRE Properties, Cl A† | 13,880 | 704 | ||||||
Camden Property Trust† | 48,370 | 2,972 | ||||||
Colonial Properties Trust† | 44,000 | 990 | ||||||
Cousins Properties, Cl A† | 50,540 | 520 | ||||||
CubeSmart† | 42,730 | 762 | ||||||
CyrusOne† | 10,480 | 199 | ||||||
DDR† (A) | 163,520 | 2,569 | ||||||
DiamondRock Hospitality† | 22,750 | 243 | ||||||
Digital Realty Trust, Cl A† (A) | 21,270 | 1,129 | ||||||
Douglas Emmett† | 96,250 | 2,259 | ||||||
Duke Realty† | 229,920 | 3,550 | ||||||
EastGroup Properties† | 8,960 | 530 | ||||||
Equity Residential† (A) | 184,800 | 9,900 | ||||||
Essex Property Trust† | 21,440 | 3,167 | ||||||
Extra Space Storage† | 22,900 | 1,048 | ||||||
Federal Realty Investment Trust† | 21,700 | 2,201 | ||||||
First Industrial Realty Trust† | 36,740 | 598 | ||||||
General Growth Properties† | 384,289 | 7,413 | ||||||
HCP† | 222,970 | 9,131 | ||||||
Health Care† (A) | 109,150 | 6,809 | ||||||
Highwoods Properties† (A) | 51,930 | 1,834 | ||||||
Host Hotels & Resorts† | 417,434 | 7,376 | ||||||
Hudson Pacific Properties† | 5,070 | 99 | ||||||
Kilroy Realty† | 47,070 | 2,351 | ||||||
Kimco Realty† | 252,260 | 5,091 | ||||||
LaSalle Hotel Properties† | 28,670 | 818 | ||||||
Liberty Property Trust† | 78,530 | 2,796 | ||||||
Macerich† | 135,729 | 7,660 | ||||||
Mid-America Apartment Communities† (A) | 10,010 | 626 | ||||||
Parkway Properties† | 21,150 | 376 | ||||||
ProLogis† | 350,076 | 13,170 | ||||||
Public Storage† | 65,001 | 10,436 | ||||||
Regency Centers† | 90,990 | 4,399 | ||||||
Retail Opportunity Investments† | 28,970 | 400 | ||||||
Rexford Industrial Realty*† | 24,900 | 336 | ||||||
RLJ Lodging Trust† | 134,310 | 3,155 | ||||||
Simon Property Group† | 135,628 | 20,104 | ||||||
SL Green Realty† (A) | 42,790 | 3,801 | ||||||
Sovran Self Storage† | 15,060 | 1,140 | ||||||
Sunstone Hotel Investors† | 261,200 | 3,328 | ||||||
| Description | Shares | Market Value ($ Thousands) | ||||||
Tanger Factory Outlet Centers† | 85,180 | $ | 2,781 | |||||
Taubman Centers† | 39,860 | 2,683 | ||||||
UDR† | 238,360 | 5,649 | ||||||
Ventas† | 140,370 | 8,633 | ||||||
Vornado Realty Trust† | 85,500 | 7,187 | ||||||
Weingarten Realty Investors† (A) | 41,250 | 1,210 | ||||||
|
| |||||||
Total Common Stock | 202,432 | |||||||
|
| |||||||
AFFILIATED PARTNERSHIP — 9.6% |
| |||||||
SEI Liquidity Fund, L.P. | 19,981,936 | 19,982 | ||||||
|
| |||||||
Total Affiliated Partnership | 19,982 | |||||||
|
| |||||||
CASH EQUIVALENT — 3.2% |
| |||||||
SEI Daily Income Trust, Prime Obligation Fund, Cl A | 6,658,894 | 6,659 | ||||||
|
| |||||||
Total Cash Equivalent | 6,659 | |||||||
|
| |||||||
Total Investments — 109.9% | $ | 229,073 | ||||||
|
| |||||||
Percentages are based on Net Assets of $208,441 ($Thousands).
| (A) | This security or a partial position of this security is on loan at September 30, 2013 (see Note 10). The total market value of securities on loan at September 30, 2013 was $19,282 ($ Thousands). |
| (B) | This security was purchased with cash collateral held from securities on loan (see Note 7). The total market value of such securities as of September 30, 2013 was $19,982 ($Thousands). |
| † | Real Estate Investment Trust. |
| †† | Investment in Affiliated Security (See Note 6). |
| ‡ | Narrow Industries are utilized for compliance purposes, whereas broad sectors are utilized for reporting. |
| * | Non-income producing security. |
| ** | Rate shown is the 7-day effective yield as of September 30, 2013. |
Cl — Class
L.P. — Limited Partnership
The following is a list of the level of inputs used as of September 30, 2013, in valuing the Fund’s investments carried at value ($ Thousands):
| Investments in Securities | Level 1 | Level 2 | Level 3 | Total | ||||||||||||
Common Stock | $ | 202,432 | $ | — | $ | — | $ | 202,432 | ||||||||
Affiliated Partnership | — | 19,982 | — | 19,982 | ||||||||||||
Cash Equivalent | 6,659 | — | — | 6,659 | ||||||||||||
|
|
|
|
|
|
|
| |||||||||
Total Investments in Securities | $ | 209,091 | $ | 19,982 | $ | — | $ | 229,073 | ||||||||
|
|
|
|
|
|
|
| |||||||||
For the year ended September 30, 2013, there have been no transfers between Level 1 and Level 2 assets and liabilities.
For the year ended September 30, 2013, there have been no transfers between Level 2 and Level 3 assets and liabilities.
For more information on valuation inputs, see note 2 — Significant Accounting Policies in Notes to Financial Statements.
Amounts designated as “—” are $0 or have been rounded to $0.
The accompanying notes are an integral part of the financial statements.
| 64 | SEI Institutional Managed Trust / Annual Report / September 30, 2013 |
SCHEDULE OF INVESTMENTS
Enhanced Income Fund
September 30, 2013

| Description | Face Amount ($ Thousands) | Market Value ($ Thousands) | ||||||
LOAN PARTICIPATIONS — 30.9% |
| |||||||
Acquisitions Cogeco Cable II, Term Loan B | ||||||||
3.250%, 09/20/2019 | $ | 124 | $ | 122 | ||||
Advanstar Communications, Term Loan | ||||||||
5.500%, 04/29/2019 | 199 | 196 | ||||||
Advantage Sales and Marketing, Term Loan | ||||||||
8.250%, 06/17/2018 | 396 | 400 | ||||||
Affinia Group | ||||||||
4.750%, 04/25/2020 | 222 | 222 | ||||||
Affinia Group, Term Loan B1 | ||||||||
3.500%, 04/25/2016 | 91 | 92 | ||||||
Affinion Group Holdings | ||||||||
6.500%, 10/08/2016 | 483 | 468 | ||||||
Air Medical Group Holdings, Term Loan B1 | ||||||||
6.500%, 06/30/2018 | 596 | 606 | ||||||
Air Medical Group Holdings, Term Loan, 1st Lien | ||||||||
7.625%, 05/21/2018 | 490 | 483 | ||||||
Alinta, 1st Lien Term Loan | ||||||||
11.250%, 08/13/2019 | 427 | 408 | ||||||
Alinta, Delayed Term Loan Unfunded | ||||||||
0.500%, 08/13/2018 (H) | 28 | — | ||||||
Allflex Holdings, Term Loan | ||||||||
4.250%, 06/17/2020 | 100 | 100 | ||||||
Alliance Holdings, Term Loan | ||||||||
5.000%, 12/07/2019 | 746 | 746 | ||||||
Alliance Laundry System, Term Loan | ||||||||
4.500%, 12/07/2018 | 562 | 562 | ||||||
Alpha Natural Resources, Term Loan B | ||||||||
3.500%, 05/31/2020 | 299 | 284 | ||||||
AMC Entertainment, Term Loan | ||||||||
3.500%, 04/30/2020 | 129 | 129 | ||||||
| Description | Face Amount ($ Thousands) | Market Value ($ Thousands) | ||||||
American Builders & Contract Supply, Term Loan B | ||||||||
3.500%, 04/16/2020 | $ | 500 | $ | 496 | ||||
American Renal Holdings | ||||||||
4.500%, 08/14/2019 | 547 | 541 | ||||||
American Rock Salt, Term Loan B | ||||||||
5.500%, 04/19/2017 | 489 | 488 | ||||||
Applied Systems, Term Loan B | ||||||||
4.250%, 12/08/2016 | 239 | 240 | ||||||
Applied Systems, Term Loan, 2nd Lien | ||||||||
8.250%, 06/08/2017 | 419 | 421 | ||||||
Aramark | ||||||||
3.748%, 07/26/2016 | 138 | 138 | ||||||
Aramark, 1st Lien Term Loan | ||||||||
0.447%, 07/26/2016 | 32 | 32 | ||||||
Aramark, Term Loan C | ||||||||
3.748%, 07/26/2016 | 262 | 262 | ||||||
Arris Group | ||||||||
3.500%, 02/07/2020 | 294 | 291 | ||||||
Asurion | ||||||||
4.500%, 05/24/2019 | 874 | 865 | ||||||
Atlas Energy, Term Loan B | ||||||||
6.500%, 07/31/2019 | 225 | 227 | ||||||
August U.S. Holding, Term Loan | ||||||||
5.250%, 04/27/2018 | 151 | 150 | ||||||
August UK Holding, Term Loan | ||||||||
5.000%, 04/27/2018 | 196 | 195 | ||||||
Avaya, Extended Term Loan B-5 | ||||||||
8.000%, 03/31/2018 | 81 | 76 | ||||||
Avaya, Term Loan B3 | ||||||||
4.773%, 10/26/2017 | 324 | 290 | ||||||
BJS Wholesale Club, Term Loan | ||||||||
4.250%, 09/26/2019 | 496 | 494 | ||||||
BOOZ Allen Hamilton, Term Loan B | ||||||||
3.750%, 07/27/2019 | 297 | 296 | ||||||
Calpine, Term Loan | ||||||||
4.000%, 04/01/2018 | 195 | 195 | ||||||
CDW | ||||||||
3.500%, 04/29/2020 | 62 | 61 | ||||||
CDW, Term Loan | ||||||||
3.500%, 04/29/2020 | 436 | 428 | ||||||
CeramTec | ||||||||
4.250%, 07/30/2020 | 292 | 293 | ||||||
Ceridian, Extended Term Loan | ||||||||
4.429%, 05/09/2017 | 592 | 592 | ||||||
Charter Communications Operating, Term Loan E | ||||||||
3.000%, 04/10/2020 | 319 | 315 | ||||||
Commscope | ||||||||
3.750%, 01/14/2018 | 293 | 293 | ||||||
ConvaTec, Term Loan | ||||||||
4.000%, 12/30/2016 | 658 | 660 | ||||||
Cristal Inorganic Chemicals | ||||||||
6.026%, 11/15/2014 | 333 | 333 | ||||||
| SEI Institutional Managed Trust / Annual Report / September 30, 2013 | 65 |
SCHEDULE OF INVESTMENTS
Enhanced Income Fund (Continued)
September 30, 2013
| Description | Face Amount ($ Thousands) | Market Value ($ Thousands) | ||||||
DAE Aviation Holdings, Term Loan | ||||||||
6.250%, 10/19/2018 | $ | 1 | $ | 1 | ||||
DAE Aviation Holdings, Term Loan B1 | ||||||||
6.250%, 10/19/2018 | 409 | 410 | ||||||
David’s Bridal, Initial Term Loan | ||||||||
5.000%, 10/05/2019 | 496 | 496 | ||||||
Davitia, Term Loan B2 | ||||||||
4.000%, 08/21/2019 | 496 | 497 | ||||||
Del Monte Foods, Term Loan | ||||||||
4.000%, 03/08/2018 | 372 | 370 | ||||||
Dex Media West LLC | ||||||||
8.000%, 12/30/2016 | 533 | 443 | ||||||
Doncaster PLC, Term Loan | ||||||||
5.500%, 04/09/2020 | 697 | 698 | ||||||
Eagle Parent | ||||||||
4.500%, 05/16/2018 | 591 | 591 | ||||||
Emergency Medical Services, Initial | ||||||||
4.000%, 04/27/2018 | 217 | 216 | ||||||
4.000%, 05/25/2018 | 107 | 106 | ||||||
Emergency Medical Services, | ||||||||
4.000%, 05/25/2018 | 26 | 26 | ||||||
Endurance International, 1st Lien | ||||||||
10.250%, 11/09/2019 | 362 | 363 | ||||||
Endurance International, 2nd Lien | ||||||||
6.250%, 11/06/2019 | 130 | 131 | ||||||
Equinox Fitness Club, | ||||||||
4.500%, 01/31/2020 | 2 | 2 | ||||||
4.500%, 01/31/2020 | 744 | 747 | ||||||
Essential Power LLC | ||||||||
4.250%, 08/07/2019 | 675 | 677 | ||||||
4.250%, 08/08/2019 | 7 | 7 | ||||||
First Data, Term Loan | ||||||||
2.987%, 03/24/2018 | 624 | 617 | ||||||
Firth Rixson Limited, Term Loan | ||||||||
4.250%, 06/30/2017 | 496 | 495 | ||||||
Fortescue Metals Group, | ||||||||
5.250%, 10/12/2017 | 495 | 496 | ||||||
Freescale Semiconductor | ||||||||
5.000%, 02/13/2020 | 687 | 690 | ||||||
Generac Power Systems, Term Loan B | ||||||||
3.500%, 06/22/2018 | 150 | 149 | ||||||
Genpact International, Term Loan B | ||||||||
3.500%, 08/30/2019 | 496 | 495 | ||||||
Global Cash Access, Term Loan | ||||||||
4.000%, 03/01/2016 | 203 | 203 | ||||||
Gray Television, Term Loan B | ||||||||
4.750%, 10/11/2019 | 578 | 581 | ||||||
| Description | Face Amount ($ Thousands) | Market Value ($ Thousands) | ||||||
Greeneden U.S. Holding II LLC | ||||||||
4.000%, 01/31/2020 | $ | 200 | $ | 199 | ||||
Guitar Center, Extended Term Loan | ||||||||
6.370%, 04/09/2017 | 596 | 583 | ||||||
Harbor Freight Tools | ||||||||
4.750%, 07/25/2019 | 248 | 250 | ||||||
Harron Communications, L.P. | ||||||||
3.500%, 10/05/2017 | 418 | 418 | ||||||
Hilton Hotels, Term Loan B, | ||||||||
0.000%, 09/23/2020 (A) | 700 | 699 | ||||||
Hologic | ||||||||
3.750%, 08/01/2019 | 218 | 218 | ||||||
Hub International, 1st Lien | ||||||||
0.000%, 09/17/2020 (A) | 700 | 700 | ||||||
Hub International, Extended | ||||||||
3.682%, 06/14/2017 | 694 | 695 | ||||||
IMS Health | ||||||||
3.750%, 09/01/2017 | 582 | 581 | ||||||
Ineos Holdings Limited | ||||||||
4.000%, 04/27/2018 | 611 | 604 | ||||||
Integra Telecom, Term Loan B | ||||||||
5.250%, 02/22/2019 | 153 | 154 | ||||||
5.250%, 02/22/2019 | 155 | 156 | ||||||
Intelsat Jackson Holdings, | ||||||||
4.250%, 04/02/2018 | 298 | 298 | ||||||
Inventiv Health, Term Loan B | ||||||||
7.500%, 08/04/2016 | 339 | 327 | ||||||
ION Trading Technologies, 2nd Lien | ||||||||
8.250%, 05/21/2021 | 185 | 185 | ||||||
ION Trading Technologies, Term Loan | ||||||||
4.500%, 05/22/2020 | 150 | 149 | ||||||
ISS, Term Loan B | ||||||||
3.750%, 04/18/2018 | 138 | 138 | ||||||
J. Crew Group, Term Loan B | ||||||||
4.000%, 03/07/2018 | 686 | 682 | ||||||
Jarden | ||||||||
0.000%, 09/30/2020 (A) | 400 | 399 | ||||||
JC Penney, Term Loan B, 1st Lien | ||||||||
6.000%, 05/21/2018 | 275 | 266 | ||||||
JHT Holding, 2nd Lien Term Loan | ||||||||
12.500%, 10/24/2013 (B) (D) | 52 | 17 | ||||||
Kronos, Incremental Term Loan | ||||||||
4.500%, 10/30/2019 | 993 | 991 | ||||||
Lamar Media | ||||||||
4.000%, 10/01/2016 | 17 | 17 | ||||||
Language Line LLC, Term Loan B | ||||||||
6.250%, 06/20/2016 | 451 | 445 | ||||||
Lawson Software, Term Loan B2 | ||||||||
5.250%, 04/05/2018 | 577 | 580 | ||||||
| 66 | SEI Institutional Managed Trust / Annual Report / September 30, 2013 |
| Description | Face Amount ($ Thousands) | Market Value ($ Thousands) | ||||||
Leslie’s Poolmart, Term Loan B | ||||||||
5.250%, 10/16/2019 | $ | 595 | $ | 597 | ||||
2.000%, 10/11/2019 | 2 | — | ||||||
Level 3 Communications | ||||||||
4.000%, 08/01/2019 | 750 | 749 | ||||||
Light Tower Fiber LLC | ||||||||
8.000%, 04/12/2021 | 100 | 101 | ||||||
4.500%, 04/13/2020 | 200 | 200 | ||||||
Live Nation, Term Loan | ||||||||
4.500%, 10/20/2016 | 242 | 240 | ||||||
MacDermid, Term Loan | ||||||||
4.000%, 06/05/2020 | 380 | 378 | ||||||
Media General (H) | ||||||||
0.000%, 07/30/2020 | 246 | — | ||||||
MEG Energy | ||||||||
3.750%, 03/21/2020 | 637 | 638 | ||||||
Merlin Entertainments | ||||||||
3.932%, 07/01/2019 | 300 | 300 | ||||||
MGM Resorts, Term Loan B | ||||||||
3.500%, 12/20/2019 | 399 | 397 | ||||||
Minimax & Co. | ||||||||
4.500%, 08/07/2020 | 200 | 200 | ||||||
MTL Publishing LLC, Term Loan B | ||||||||
4.250%, 06/29/2018 | 495 | 494 | ||||||
Navistar International | ||||||||
5.750%, 08/17/2017 | 155 | 157 | ||||||
Neiman Marcus Group, Term Loan | ||||||||
4.000%, 05/10/2018 | 311 | 311 | ||||||
Nelson Education Limited, | ||||||||
2.776%, 07/05/2014 | 466 | 388 | ||||||
NEP Supershooters, Term Loan | ||||||||
4.750%, 01/22/2020 | 100 | 100 | ||||||
Newpage, Term Loan | ||||||||
7.750%, 11/16/2018 | 298 | 302 | ||||||
NXP BV/Commitment, Term Loan | ||||||||
4.500%, 03/07/2017 | 390 | 394 | ||||||
Ocwen Financial | ||||||||
5.000%, 02/15/2018 | 249 | 252 | ||||||
OXEA, Term Loan | ||||||||
4.250%, 12/06/2019 | 520 | 515 | ||||||
Penn National Gaming, Term Loan B | ||||||||
3.750%, 06/14/2018 | 426 | 426 | ||||||
Pinnacle Entertainment, Term Loan | ||||||||
3.750%, 08/05/2020 | 200 | 199 | ||||||
Pinnacle Foods Group LLC | ||||||||
3.250%, 04/29/2020 | 172 | 170 | ||||||
Progressive Waste Solutions, | ||||||||
3.500%, 10/22/2019 | 149 | 149 | ||||||
Quintiles Transnational, Term Loan B | ||||||||
4.500%, 05/26/2018 | 429 | 429 | ||||||
Raycom TV Broadcasting LLC, | ||||||||
4.250%, 05/31/2017 | 393 | 395 | ||||||
| Description | Face Amount ($ Thousands) | Market Value ($ Thousands) | ||||||
Realogy, Extended Term Loan | ||||||||
4.540%, 10/10/2016 | $ | 61 | $ | 61 | ||||
Rexnord LLC | ||||||||
4.000%, 08/14/2020 | 287 | 283 | ||||||
Rice Drilling B, 2nd Lien Term Loan | ||||||||
8.500%, 10/25/2018 | 671 | 673 | ||||||
Riverbed Technology | ||||||||
4.000%, 12/13/2019 | 201 | 202 | ||||||
Roundy’s Supermarkets, | ||||||||
5.750%, 02/13/2019 | 294 | 288 | ||||||
5.750%, 02/10/2019 | 198 | 194 | ||||||
Ruby Western Pipeline | ||||||||
3.500%, 03/22/2020 | 611 | 608 | ||||||
Ruby Western Pipeline Holdings, | ||||||||
3.500%, 03/27/2020 | 89 | 89 | ||||||
Schaeffler AG, Term Loan C, 1st Lien | ||||||||
4.250%, 01/27/2017 | 425 | 426 | ||||||
Sealed Air, Term Loan B | ||||||||
4.000%, 10/03/2018 | 295 | 296 | ||||||
Seaworld | ||||||||
3.000%, 05/30/2020 | 409 | 403 | ||||||
Sedgwick CMS Holdings, Term Loan | ||||||||
8.000%, 12/12/2018 | 88 | 90 | ||||||
4.250%, 06/12/2018 | 118 | 118 | ||||||
Serta Simmons Holdings, Term Loan B | ||||||||
5.000%, 09/19/2019 | 546 | 547 | ||||||
Sheridan Healthcare, | ||||||||
4.500%, 06/29/2018 | 494 | 494 | ||||||
Sheridan Holdings, Term Loan | ||||||||
9.000%, 06/29/2019 | 150 | 150 | ||||||
Smart & Final, Term Loan | ||||||||
4.500%, 11/15/2019 | 496 | 495 | ||||||
Sophos Public | ||||||||
6.500%, 05/10/2019 | 400 | 399 | ||||||
Spectrum Brands, Term Loan | ||||||||
3.500%, 08/13/2019 | 108 | 108 | ||||||
Sprouts Farmers Markets LLC, | ||||||||
4.500%, 04/23/2020 | 206 | 205 | ||||||
Standard Aero, Term Loan B2 | ||||||||
6.250%, 10/19/2018 | 186 | 186 | ||||||
Starwood Property Trust, Term Loan B | ||||||||
3.500%, 04/17/2020 | 175 | 174 | ||||||
Surgical Care Affiliates, Term Loan B | ||||||||
4.276%, 12/29/2017 | 594 | 593 | ||||||
Teine Energy Ltd., | ||||||||
7.500%, 05/17/2019 | 464 | 459 | ||||||
Telesat Canada, Term Loan B | ||||||||
3.500%, 03/26/2019 | 397 | 394 | ||||||
| SEI Institutional Managed Trust / Annual Report / September 30, 2013 | 67 |
SCHEDULE OF INVESTMENTS
Enhanced Income Fund (Continued)
September 30, 2013
| Description | Face Amount ($ Thousands) | Market Value ($ Thousands) | ||||||
Terex | ||||||||
4.500%, 04/28/2017 | $ | 186 | $ | 188 | ||||
Texas Competitive Electric Holdings, Extending Term Loan | ||||||||
4.682%, 10/10/2017 | 212 | 143 | ||||||
4.682%, 10/10/2017 | 435 | 292 | ||||||
The Pantry, Term Loan B | ||||||||
4.750%, 07/31/2019 | 743 | 749 | ||||||
Ti Automotive, Term Loan B | ||||||||
5.500%, 03/28/2019 | 503 | 508 | ||||||
Trans Union, LLC | ||||||||
4.250%, 02/10/2019 | 387 | 388 | ||||||
Transdigm, Term Loan | ||||||||
3.750%, 02/28/2020 | 783 | 779 | ||||||
Travelport, Term Loan | ||||||||
6.250%, 06/26/2019 | 190 | 192 | ||||||
Tribune Company | ||||||||
4.000%, 12/31/2019 | 397 | 397 | ||||||
True Religion Apparel, Term Loan | ||||||||
5.875%, 07/30/2019 | 300 | 282 | ||||||
TWCC Holding, Term Loan | ||||||||
7.000%, 12/11/2020 | 500 | 512 | ||||||
U.S. Telepacific, Term Loan | ||||||||
5.750%, 02/23/2017 | 489 | 487 | ||||||
Univision Communications, Extended Term Loan B | ||||||||
4.500%, 03/31/2017 | 551 | 544 | ||||||
Valeant Pharmaceuticals International | ||||||||
4.375%, 02/13/2019 | 111 | 110 | ||||||
4.375%, 12/11/2019 | 494 | 494 | ||||||
Valeant Pharmaceuticals International, Term Loan E | ||||||||
4.500%, 06/30/2020 | 496 | 499 | ||||||
Verint Systems, Term Loan B, 1st Lien | ||||||||
4.000%, 09/06/2019 | 398 | 399 | ||||||
Virgin Media, Term Loan B | ||||||||
3.500%, 06/05/2020 | 600 | 596 | ||||||
Waiccs Las Vegas 3 LLC, 2nd Lien | ||||||||
13.250%, 07/30/2010 (G) | 2,000 | — | ||||||
Walter Energy, Term Loan B | ||||||||
6.750%, 04/02/2018 | 349 | 335 | ||||||
Warner Chilcott, Term Loan B1 | ||||||||
5.500%, 03/15/2018 | 82 | 82 | ||||||
Warner Chilcott, Term Loan B3 | ||||||||
5.500%, 03/15/2018 | 45 | 45 | ||||||
Warner Music Group, Term Loan | ||||||||
3.750%, 07/01/2020 | 250 | 249 | ||||||
Waste Industries, Term Loan B | ||||||||
4.000%, 03/17/2017 | 485 | 484 | ||||||
WCA Waste Systems, Term Loan | ||||||||
4.000%, 03/23/2018 | 246 | 246 | ||||||
West | ||||||||
3.750%, 06/30/2018 | 333 | 333 | ||||||
| Description | Face Amount ($ Thousands) | Market Value ($ Thousands) | ||||||
WideOpenWest Finance | ||||||||
4.750%, 03/26/2019 | $ | 148 | $ | 149 | ||||
Windstream, Term Loan B4 | ||||||||
3.500%, 01/10/2020 | 596 | 593 | ||||||
Yankee Candle | ||||||||
5.250%, 04/02/2019 | 451 | 451 | ||||||
Zayo Group LLC, Term Loan B | ||||||||
4.500%, 07/02/2019 | 679 | 679 | ||||||
|
| |||||||
Total Loan Participations | ||||||||
(Cost $62,446) ($ Thousands) | 60,369 | |||||||
|
| |||||||
CORPORATE OBLIGATIONS — 30.4% |
| |||||||
Consumer Discretionary — 4.3% |
| |||||||
Amazon.com | ||||||||
0.650%, 11/27/2015 | 450 | 449 | ||||||
Cequel Communications Holdings I | ||||||||
6.375%, 09/15/2020 (C) | 600 | 612 | ||||||
Comcast | ||||||||
5.850%, 11/15/2015 | 400 | 441 | ||||||
Daimler Finance North America | ||||||||
1.125%, 08/01/2018 (C) (E) | 250 | 251 | ||||||
Daimler Finance North America LLC | ||||||||
1.250%, 01/11/2016 (C) | 600 | 600 | ||||||
ERAC USA Finance | ||||||||
1.400%, 04/15/2016 (C) | 115 | 114 | ||||||
Maytag MTN | ||||||||
6.450%, 08/15/2014 | 500 | 524 | ||||||
NBCUniversal Enterprise | ||||||||
0.953%, 04/15/2018 (C) (E) | 550 | 553 | ||||||
Newell Rubbermaid | ||||||||
2.000%, 06/15/2015 | 450 | 456 | ||||||
Nissan Motor Acceptance | ||||||||
0.950%, 09/26/2016 (C) (E) | 700 | 701 | ||||||
Penske Truck Leasing | ||||||||
2.500%, 07/11/2014 (C) | 60 | 61 | ||||||
Reynolds Group Issuer | ||||||||
6.875%, 02/15/2021 | 185 | 198 | ||||||
5.750%, 10/15/2020 | 210 | 211 | ||||||
Sinclair Television Group | ||||||||
5.375%, 04/01/2021 | 500 | 475 | ||||||
Sirius XM Radio | ||||||||
5.875%, 10/01/2020 (C) | 1,000 | 1,009 | ||||||
Thomson Reuters | ||||||||
0.875%, 05/23/2016 | 600 | 597 | ||||||
Time Warner Cable | ||||||||
5.850%, 05/01/2017 | 450 | 489 | ||||||
Walt Disney MTN | ||||||||
0.450%, 12/01/2015 | 600 | 597 | ||||||
|
| |||||||
| 8,338 | ||||||||
|
| |||||||
| 68 | SEI Institutional Managed Trust / Annual Report / September 30, 2013 |
| Description | Face Amount ($ Thousands) | Market Value ($ Thousands) | ||||||
Consumer Staples — 2.1% | ||||||||
Anheuser-Busch InBev Worldwide | ||||||||
0.800%, 07/15/2015 | $ | 350 | $ | 352 | ||||
BAT International Finance | ||||||||
1.400%, 06/05/2015 (C) | 500 | 504 | ||||||
ConAgra Foods | ||||||||
1.300%, 01/25/2016 | 375 | 375 | ||||||
Costco Wholesale | ||||||||
0.650%, 12/07/2015 | 750 | 750 | ||||||
Heineken | ||||||||
0.800%, 10/01/2015 (C) | 325 | 325 | ||||||
Kellogg | ||||||||
0.495%, 02/13/2015 (E) | 550 | 551 | ||||||
Kraft Foods Group | ||||||||
1.625%, 06/04/2015 | 500 | 508 | ||||||
Reynolds American | ||||||||
1.050%, 10/30/2015 | 240 | 240 | ||||||
SABMiller Holdings | ||||||||
0.955%, 08/01/2018 (C) (E) | 500 | 503 | ||||||
|
| |||||||
| 4,108 | ||||||||
|
| |||||||
Energy — 1.9% | ||||||||
Atlas Pipeline Partners | ||||||||
4.750%, 11/15/2021 (C) | 300 | 271 | ||||||
BP Capital Markets | ||||||||
0.880%, 09/26/2018 (E) | 700 | 700 | ||||||
Enterprise Products Operating | ||||||||
1.250%, 08/13/2015 | 40 | 40 | ||||||
Gibson Energy | ||||||||
6.750%, 07/15/2021 (C) | 207 | 214 | ||||||
Kinder Morgan Energy Partners | ||||||||
5.000%, 12/15/2013 | 410 | 414 | ||||||
MEG Energy | ||||||||
6.375%, 01/30/2023 (C) | 500 | 490 | ||||||
Petrobras Global Finance BV | ||||||||
1.884%, 05/20/2016 (E) | 600 | 597 | ||||||
Total Capital Canada | ||||||||
0.648%, 01/15/2016 (E) | 170 | 171 | ||||||
Total Capital International | ||||||||
0.835%, 08/10/2018 (E) | 450 | 452 | ||||||
TransCanada PipeLines | ||||||||
0.750%, 01/15/2016 | 325 | 323 | ||||||
|
| |||||||
| 3,672 | ||||||||
|
| |||||||
Financials — 16.4% | ||||||||
American Express | ||||||||
0.852%, 05/22/2018 (E) | 700 | 699 | ||||||
American Honda Finance | ||||||||
0.637%, 05/26/2016 (C) (E) | 750 | 752 | ||||||
Australia & New Zealand Banking Group NY | ||||||||
0.824%, 05/15/2018 (E) | 300 | 300 | ||||||
| Description | Face Amount ($ Thousands) | Market Value ($ Thousands) | ||||||
Bank of America | ||||||||
1.500%, 10/09/2015 | $ | 300 | $ | 302 | ||||
Bank of Montreal MTN | ||||||||
0.870%, 04/09/2018 (E) | 650 | 651 | ||||||
Bank of New York Mellon MTN | ||||||||
0.699%, 03/06/2018 (E) | 650 | 650 | ||||||
Bank of Nova Scotia | ||||||||
0.950%, 03/15/2016 | 400 | 399 | ||||||
0.696%, 09/11/2015 (E) | 375 | 376 | ||||||
Bank of Tokyo-Mitsubishi UFJ | ||||||||
0.868%, 09/09/2016 (C) (E) | 650 | 652 | ||||||
BB&T MTN | ||||||||
1.114%, 06/15/2018 (E) | 535 | 538 | ||||||
BPCE MTN | ||||||||
1.516%, 04/25/2016 (E) | 450 | 456 | ||||||
Canadian Imperial Bank of Commerce | ||||||||
0.900%, 10/01/2015 | 525 | 526 | ||||||
Capital One | ||||||||
0.700%, 03/22/2016 (E) | 550 | 550 | ||||||
Caterpillar Financial Services MTN | ||||||||
1.375%, 05/20/2014 | 140 | 141 | ||||||
1.100%, 05/29/2015 | 500 | 504 | ||||||
Citigroup | ||||||||
0.812%, 08/25/2036 (E) | 1,500 | 1,221 | ||||||
Commonwealth Bank of Australia | ||||||||
0.753%, 09/20/2016 (C) (E) | 700 | 701 | ||||||
Cooperatieve Centrale Raiffeisen-Boerenleenbank BA | ||||||||
0.732%, 03/18/2016 (E) | 550 | 552 | ||||||
Credit Agricole | ||||||||
1.096%, 10/03/2016 (C) (E) | 750 | 750 | ||||||
Danske Bank | ||||||||
1.318%, 04/14/2014 (C) (E) | 650 | 652 | ||||||
Ford Motor Credit | ||||||||
1.516%, 05/09/2016 (E) | 400 | 405 | ||||||
General Electric Capital MTN | ||||||||
1.136%, 05/09/2016 (E) | 600 | 606 | ||||||
0.959%, 04/02/2018 (E) | 300 | 302 | ||||||
Goldman Sachs Group | ||||||||
1.600%, 11/23/2015 | 400 | 403 | ||||||
1.465%, 04/30/2018 (E) | 500 | 501 | ||||||
HSBC Bank | ||||||||
0.904%, 05/15/2018 (C) (E) | 600 | 601 | ||||||
Hyundai Capital America | ||||||||
1.625%, 10/02/2015 (C) | 150 | 150 | ||||||
ILFC E-Capital Trust I | ||||||||
5.350%, 12/21/2065 (C) (E) | 500 | 427 | ||||||
ING Bank | ||||||||
1.658%, 06/09/2014 (C) (E) | 400 | 403 | ||||||
International Lease Finance | ||||||||
6.500%, 09/01/2014 (C) | 450 | 467 | ||||||
Intesa Sanpaolo | ||||||||
3.125%, 01/15/2016 | 300 | 300 | ||||||
John Deere Capital | ||||||||
0.950%, 06/29/2015 | 350 | 352 | ||||||
| SEI Institutional Managed Trust / Annual Report / September 30, 2013 | 69 |
SCHEDULE OF INVESTMENTS
Enhanced Income Fund (Continued)
September 30, 2013
| Description | Face Amount ($ Thousands) | Market Value ($ Thousands) | ||||||
JPMorgan Chase Capital XXI, Ser U | ||||||||
1.216%, 02/02/2037 (E) | $ | 1,300 | $ | 965 | ||||
Merrill Lynch | ||||||||
1.014%, 09/15/2036 (E) | 700 | 592 | ||||||
Metropolitan Life Global Funding I | ||||||||
2.000%, 01/09/2015 (C) | 275 | 279 | ||||||
1.700%, 06/29/2015 (C) | 500 | 507 | ||||||
1.500%, 01/10/2018 (C) | 220 | 216 | ||||||
Morgan Stanley | ||||||||
1.512%, 02/25/2016 (E) | 900 | 908 | ||||||
New York Life Global Funding | ||||||||
1.300%, 01/12/2015 (C) | 500 | 504 | ||||||
0.615%, 05/23/2016 (C) (E) | 400 | 401 | ||||||
Nordea Bank | ||||||||
0.725%, 05/13/2016 (C) (E) | 600 | 602 | ||||||
Pricoa Global Funding I MTN | ||||||||
0.532%, 08/19/2015 (C) (E) | 650 | 650 | ||||||
Principal Life Global Funding II | ||||||||
1.000%, 12/11/2015 (C) | 250 | 250 | ||||||
0.632%, 05/27/2016 (C) (E) | 415 | 416 | ||||||
Prudential Financial MTN | ||||||||
1.044%, 08/15/2018 (E) | 500 | 501 | ||||||
RHP Hotel Properties‡ | ||||||||
5.000%, 04/15/2021 (C) | 217 | 203 | ||||||
Royal Bank of Canada MTN | ||||||||
0.628%, 03/08/2016 (E) | 600 | 601 | ||||||
0.501%, 01/06/2015 (E) | 300 | 301 | ||||||
Royal Bank of Scotland Group PLC | ||||||||
2.550%, 09/18/2015 | 210 | 214 | ||||||
Simon Property Group‡ | ||||||||
6.750%, 05/15/2014 | 500 | 511 | ||||||
Societe Generale | ||||||||
1.328%, 10/01/2018 (E) | 550 | 550 | ||||||
State Street Capital Trust IV | ||||||||
1.254%, 06/15/2037 (E) | 375 | 292 | ||||||
Svenska Handelsbanken | ||||||||
0.721%, 09/23/2016 (E) | 800 | 801 | ||||||
Toronto-Dominion Bank MTN | ||||||||
0.716%, 09/09/2016 (E) | 200 | 200 | ||||||
0.568%, 07/14/2014 (E) | 310 | 311 | ||||||
0.445%, 05/01/2015 (E) | 400 | 400 | ||||||
Toyota Motor Credit | ||||||||
0.553%, 05/17/2016 (E) | 500 | 501 | ||||||
0.403%, 09/18/2015 (E) | 500 | 500 | ||||||
UBS MTN | ||||||||
5.875%, 07/15/2016 | 400 | 443 | ||||||
Unitrin | ||||||||
6.000%, 05/15/2017 | 670 | 732 | ||||||
Ventas Realty‡ | ||||||||
1.550%, 09/26/2016 | 500 | 501 | ||||||
Wells Fargo MTN | ||||||||
1.500%, 07/01/2015 | 750 | 759 | ||||||
0.895%, 04/23/2018 (E) | 575 | 576 | ||||||
Westpac Banking | ||||||||
0.514%, 01/29/2015 (C) (E) | 550 | 550 | ||||||
|
| |||||||
| 32,026 | ||||||||
|
| |||||||
| Description | Face Amount ($ Thousands) | Market Value ($ Thousands) | ||||||
Health Care — 1.3% | ||||||||
AbbVie | ||||||||
1.027%, 11/06/2015 (E) | $ | 550 | $ | 555 | ||||
Biomet | ||||||||
6.500%, 08/01/2020 | 225 | 232 | ||||||
CHS | ||||||||
7.125%, 07/15/2020 | 450 | 455 | ||||||
McKesson | ||||||||
0.950%, 12/04/2015 | 235 | 235 | ||||||
Providence Health & Services Obligated Group | ||||||||
1.048%, 10/01/2016 (E) | 800 | 798 | ||||||
WellPoint | ||||||||
1.250%, 09/10/2015 | 210 | 211 | ||||||
|
| |||||||
| 2,486 | ||||||||
|
| |||||||
Industrials — 1.2% | ||||||||
Boart Longyear Management Pty | ||||||||
10.000%, 10/01/2018 (C) | 304 | 307 | ||||||
Ceridian | ||||||||
8.875%, 07/15/2019 (C) | 150 | 172 | ||||||
Clean Harbors | ||||||||
5.250%, 08/01/2020 | 350 | 346 | ||||||
Glencore Funding | ||||||||
1.422%, 05/27/2016 (C) (E) | 675 | 662 | ||||||
John Deere Capital | ||||||||
0.374%, 06/15/2015 (E) | 450 | 450 | ||||||
Pentair Finance | ||||||||
1.350%, 12/01/2015 | 285 | 286 | ||||||
Precision Castparts | ||||||||
0.700%, 12/20/2015 | 135 | 135 | ||||||
|
| |||||||
| 2,358 | ||||||||
|
| |||||||
Information Technology — 1.0% |
| |||||||
Hewlett-Packard | ||||||||
0.661%, 05/30/2014 (E) | 600 | 600 | ||||||
TSMC Global | ||||||||
0.950%, 04/03/2016 (C) | 250 | 247 | ||||||
Western Union | ||||||||
2.375%, 12/10/2015 | 85 | 87 | ||||||
1.262%, 08/21/2015 (E) | 325 | 326 | ||||||
Xerox | ||||||||
1.083%, 05/16/2014 (E) | 595 | 596 | ||||||
|
| |||||||
| 1,856 | ||||||||
|
| |||||||
Materials — 1.0% | ||||||||
Ardagh Packaging Finance PLC | ||||||||
4.875%, 11/15/2022 (C) | 375 | 357 | ||||||
FMG Resources August 2006 Pty | ||||||||
8.250%, 11/01/2019 (C) | 250 | 269 | ||||||
Packaging Dynamics | ||||||||
8.750%, 02/01/2016 (C) | 500 | 518 | ||||||
| 70 | SEI Institutional Managed Trust / Annual Report / September 30, 2013 |
| Description | Face Amount ($ Thousands) | Market Value ($ Thousands) | ||||||
Rio Tinto Finance USA | ||||||||
1.094%, 06/17/2016 (E) | $ | 625 | $ | 628 | ||||
Walter Energy | ||||||||
8.500%, 04/15/2021 (C) | 250 | 209 | ||||||
|
| |||||||
| 1,981 | ||||||||
|
| |||||||
Telecommunication Services — 1.0% |
| |||||||
AT&T | ||||||||
0.800%, 12/01/2015 | 450 | 449 | ||||||
0.650%, 02/12/2016 (E) | 450 | 449 | ||||||
Intelsat Luxembourg | ||||||||
7.750%, 06/01/2021 (C) | 325 | 337 | ||||||
Softbank | ||||||||
4.500%, 04/15/2020 (C) | 225 | 216 | ||||||
Verizon Communications | ||||||||
2.002%, 09/14/2018 (E) | 515 | 541 | ||||||
|
| |||||||
| 1,992 | ||||||||
|
| |||||||
Utilities — 0.2% | ||||||||
Duke Energy Indiana | ||||||||
0.619%, 07/11/2016 (E) | 170 | 170 | ||||||
Duke Energy Ohio | ||||||||
0.399%, 03/06/2015 (E) | 300 | 300 | ||||||
|
| |||||||
| 470 | ||||||||
|
| |||||||
Total Corporate Obligations |
| 59,287 | ||||||
|
| |||||||
ASSET-BACKED SECURITIES — 28.2% |
| |||||||
Automotive — 14.5% |
| |||||||
Ally Auto Receivables Trust, | ||||||||
2.450%, 06/15/2016 (C) | 300 | 305 | ||||||
Ally Auto Receivables Trust, | ||||||||
3.050%, 12/15/2014 (C) | 145 | 145 | ||||||
Ally Auto Receivables Trust, | ||||||||
2.230%, 03/15/2016 | 637 | 643 | ||||||
Ally Auto Receivables Trust, | ||||||||
0.590%, 01/17/2017 | 405 | 404 | ||||||
Ally Auto Receivables Trust, | ||||||||
0.700%, 12/21/2015 | 380 | 380 | ||||||
Ally Auto Receivables Trust, | ||||||||
0.630%, 05/15/2017 | 725 | 722 | ||||||
Ally Auto Receivables Trust, | ||||||||
0.720%, 05/20/2016 | 570 | 570 | ||||||
| Description | Face Amount ($ Thousands) | Market Value ($ Thousands) | ||||||
American Credit Acceptance Receivables Trust, | ||||||||
1.320%, 02/15/2017 (C) | $ | 432 | $ | 432 | ||||
American Credit Acceptance Receivables Trust, | ||||||||
1.640%, 11/15/2016 (C) | 332 | 332 | ||||||
AmeriCredit Automobile Receivables Trust, Ser 2010-4, Cl B | ||||||||
1.990%, 10/08/2015 | 345 | 346 | ||||||
AmeriCredit Automobile Receivables Trust, Ser 2011-3, Cl A3 | ||||||||
1.170%, 01/08/2016 | 127 | 127 | ||||||
AmeriCredit Automobile Receivables Trust, Ser 2012-1, Cl A2 | ||||||||
0.910%, 10/08/2015 | 16 | 16 | ||||||
AmeriCredit Automobile Receivables Trust, Ser 2012-5, Cl A3 | ||||||||
0.620%, 06/08/2017 | 525 | 524 | ||||||
AmeriCredit Automobile Receivables Trust, Ser 2013-1, Cl A2 | ||||||||
0.490%, 06/08/2016 | 302 | 302 | ||||||
AmeriCredit Automobile Receivables Trust, Ser 2013-2, Cl A3 | ||||||||
0.650%, 12/08/2017 | 440 | 438 | ||||||
ARI Fleet Lease Trust, | ||||||||
0.732%, 03/15/2020 (C) (E) | 617 | 618 | ||||||
ARI Fleet Lease Trust, | ||||||||
0.482%, 01/15/2021 (C) (E) | 360 | 360 | ||||||
ARI Fleet Lease Trust, | ||||||||
0.700%, 12/15/2015 (C) | 305 | 305 | ||||||
Bank of America Auto Trust, | ||||||||
0.780%, 06/15/2016 | 199 | 199 | ||||||
CarMax Auto Owner Trust, | ||||||||
0.990%, 02/17/2015 | 12 | 12 | ||||||
CarMax Auto Owner Trust, | ||||||||
2.170%, 07/17/2017 | 550 | 563 | ||||||
CarMax Auto Owner Trust, | ||||||||
0.890%, 09/15/2016 | 210 | 211 | ||||||
CarMax Auto Owner Trust, | ||||||||
0.520%, 07/17/2017 | 325 | 324 | ||||||
CarMax Auto Owner Trust, | ||||||||
1.500%, 08/15/2018 | 115 | 115 | ||||||
CFC, Ser 2013-1A, Cl A | ||||||||
1.650%, 07/17/2017 (C) | 80 | 80 | ||||||
| SEI Institutional Managed Trust / Annual Report / September 30, 2013 | 71 |
SCHEDULE OF INVESTMENTS
Enhanced Income Fund (Continued)
September 30, 2013
| Description | Face Amount ($ Thousands) | Market Value ($ Thousands) | ||||||
Chesapeake Funding, | ||||||||
0.932%, 11/07/2023 (C) (E) | $ | 380 | $ | 381 | ||||
Chesapeake Funding, | ||||||||
0.632%, 01/07/2025 (C) (E) | 425 | 425 | ||||||
Credit Acceptance Auto Loan Trust, | ||||||||
2.200%, 09/16/2019 (C) | 660 | 666 | ||||||
Credit Acceptance Auto Loan Trust, | ||||||||
1.210%, 10/15/2020 (C) | 270 | 270 | ||||||
Enterprise Fleet Financing, | ||||||||
1.140%, 11/20/2017 (C) | 175 | 175 | ||||||
Enterprise Fleet Financing, | ||||||||
0.680%, 09/20/2018 (C) | 515 | 515 | ||||||
Fifth Third Auto Trust, | ||||||||
0.410%, 01/15/2016 | 500 | 500 | ||||||
First Investors Auto Owner Trust, | ||||||||
1.470%, 05/15/2018 (C) | 470 | 472 | ||||||
First Investors Auto Owner Trust, | ||||||||
0.900%, 10/15/2018 (C) | 205 | 205 | ||||||
First Investors Auto Owner Trust, | ||||||||
1.230%, 03/15/2019 (C) | 700 | 700 | ||||||
Ford Credit Auto Lease Trust, | ||||||||
1.420%, 01/15/2015 | 550 | 552 | ||||||
Ford Credit Auto Lease Trust, | ||||||||
0.540%, 11/15/2014 | 288 | 289 | ||||||
Ford Credit Auto Lease Trust, | ||||||||
0.460%, 05/15/2015 | 400 | 400 | ||||||
Ford Credit Auto Owner Trust, | ||||||||
0.840%, 06/15/2015 | 78 | 78 | ||||||
Ford Credit Auto Owner Trust, | ||||||||
1.880%, 08/15/2017 | 475 | 485 | ||||||
Ford Credit Auto Owner Trust, | ||||||||
0.470%, 04/15/2015 | 50 | 50 | ||||||
Harley-Davidson Motorcycle Trust, | ||||||||
0.960%, 05/16/2016 | 346 | 346 | ||||||
Harley-Davidson Motorcycle Trust, | ||||||||
0.680%, 04/15/2017 | 145 | 145 | ||||||
| Description | Face Amount ($ Thousands) | Market Value ($ Thousands) | ||||||
Hertz Vehicle Financing, | ||||||||
2.200%, 03/25/2016 (C) | $ | 445 | $ | 452 | ||||
Honda Auto Receivables Owner | ||||||||
0.770%, 01/15/2016 | 145 | 145 | ||||||
Honda Auto Receivables Owner Trust, Ser 2012-3, Cl A3 | ||||||||
0.560%, 05/15/2016 | 325 | 325 | ||||||
Huntington Auto Trust, | ||||||||
0.510%, 04/17/2017 | 456 | 455 | ||||||
Hyundai Auto Lease Securitization Trust, Ser 2012-A, Cl A3 | ||||||||
0.920%, 08/17/2015 (C) | 495 | 496 | ||||||
Hyundai Auto Lease Securitization Trust, Ser 2012-A, Cl A4 | ||||||||
1.050%, 04/17/2017 (C) | 120 | 120 | ||||||
Hyundai Auto Receivables Trust, | ||||||||
0.620%, 09/15/2016 | 220 | 220 | ||||||
Hyundai Auto Receivables Trust, | ||||||||
0.570%, 06/15/2016 | 510 | 510 | ||||||
M&T Bank Auto Receivables Trust, | ||||||||
1.060%, 11/15/2017 | 825 | 828 | ||||||
Mercedes-Benz Auto Receivables Trust, Ser 2013-1, Cl A2 | ||||||||
0.500%, 03/15/2016 | 415 | 415 | ||||||
Mercedes-Benz Auto Receivables Trust, Ser 2012-1, Cl A3 | ||||||||
0.470%, 10/17/2016 | 455 | 455 | ||||||
Mercedes-Benz Master Owner Trust, Ser 2012-A, Cl A | ||||||||
0.790%, 11/15/2017 (C) | 310 | 309 | ||||||
Motor PLC, | ||||||||
0.679%, 02/25/2020 (C) (E) | 440 | 440 | ||||||
Motor PLC, | ||||||||
0.679%, 02/15/2021 (C) (E) | 418 | 418 | ||||||
Nissan Auto Lease Trust, | ||||||||
1.040%, 08/15/2014 | 56 | 56 | ||||||
Nissan Auto Lease, | ||||||||
0.450%, 09/15/2015 | 550 | 549 | ||||||
Nissan Auto Receivables Owner Trust, Ser 2013-B, Cl A2 | ||||||||
0.520%, 04/15/2016 | 405 | 405 | ||||||
Nissan Auto Receivables Owner Trust, Ser 2011-B, Cl A2 | ||||||||
0.740%, 09/15/2014 | 3 | 3 | ||||||
| 72 | SEI Institutional Managed Trust / Annual Report / September 30, 2013 |
| Description | Face Amount ($ Thousands) | Market Value ($ Thousands) | ||||||
Nissan Auto Receivables Owner Trust, Ser 2012-B, Cl A3 | ||||||||
0.460%, 10/17/2016 | $ | 490 | $ | 490 | ||||
Nissan Auto Receivables Owner Trust, Ser 2013-A, Cl A2 | ||||||||
0.370%, 09/15/2015 | 362 | 362 | ||||||
Nissan Auto Receivables Owner Trust, Ser 2013-A, Cl A3 | ||||||||
0.500%, 05/15/2017 | 295 | 295 | ||||||
Porsche Innovative Lease Owner Trust, Ser 2012-1, Cl A3 | ||||||||
0.540%, 12/21/2015 (C) | 335 | 335 | ||||||
Prestige Auto Receivables Trust, | ||||||||
1.090%, 02/15/2018 (C) | 654 | 655 | ||||||
Santander Drive Auto Receivables Trust, Ser 2010-2, Cl C | ||||||||
3.890%, 07/17/2017 | 345 | 352 | ||||||
Santander Drive Auto Receivables Trust, Ser 2012-1, Cl A2 | ||||||||
1.250%, 04/15/2015 | 44 | 44 | ||||||
Santander Drive Auto Receivables Trust, Ser 2013-1, Cl A2 | ||||||||
0.480%, 02/16/2016 | 207 | 207 | ||||||
Santander Drive Auto Receivables Trust, Ser 2013-3, Cl A3 | ||||||||
0.700%, 10/16/2017 | 520 | 517 | ||||||
SNAAC Auto Receivables Trust, | ||||||||
1.140%, 07/16/2018 (C) | 193 | 193 | ||||||
Toyota Auto Receivables Owner Trust, Ser 2012-A, Cl A3 | ||||||||
0.750%, 02/16/2016 | 401 | 402 | ||||||
Toyota Auto Receivables Owner Trust, Ser 2012-B, Cl A3 | ||||||||
0.460%, 07/15/2016 | 480 | 479 | ||||||
Toyota Auto Receivables Owner Trust, Ser 2013-B, Cl A2 | ||||||||
0.480%, 02/15/2016 | 320 | 320 | ||||||
Volkswagen Auto Lease Trust, Ser 2013-A, Cl A2A | ||||||||
0.630%, 12/21/2015 | 590 | 590 | ||||||
Volkswagen Auto Lease Trust, | ||||||||
0.870%, 07/20/2015 | 265 | 266 | ||||||
Westlake Automobile Receivables Trust, Ser 2013-1A | ||||||||
1.120%, 01/15/2018 | 420 | 420 | ||||||
World Omni Auto Receivables Trust, Ser 2012-A, Cl A3 | ||||||||
0.640%, 02/15/2017 | 181 | 181 | ||||||
World Omni Automobile Lease Securitization Trust, | ||||||||
0.930%, 11/16/2015 | 81 | 81 | ||||||
| Description | Face Amount ($ Thousands) | Market Value ($ Thousands) | ||||||
World Omni Automobile Lease Securitization Trust, | ||||||||
0.500%, 05/16/2016 | $ | 235 | $ | 235 | ||||
World Omni Master Owner Trust, | ||||||||
0.532%, 02/15/2018 (C) (E) | 235 | 235 | ||||||
|
| |||||||
| 28,387 | ||||||||
|
| |||||||
Credit Cards — 3.5% | ||||||||
Capital One Multi-Asset Execution Trust, Ser 2013-A2, Cl A2 | ||||||||
0.362%, 02/15/2019 (E) | 555 | 553 | ||||||
Chase Issuance Trust, | ||||||||
0.790%, 06/15/2017 | 495 | 497 | ||||||
Chase Issuance Trust, | ||||||||
0.590%, 08/15/2017 | 675 | 675 | ||||||
Chase Issuance Trust, | ||||||||
0.602%, 07/15/2020 (E) | 650 | 650 | ||||||
Citibank Credit Card Issuance Trust, Ser 2013-A3 | ||||||||
0.910%, 07/23/2018 | 600 | 602 | ||||||
Citibank Omni Master Trust, | ||||||||
2.932%, 08/15/2018 (C) (E) | 500 | 510 | ||||||
Discover Card Execution Note Trust, | ||||||||
0.362%, 10/15/2018 (E) | 555 | 554 | ||||||
Discover Card Master Trust, | ||||||||
0.810%, 08/15/2017 | 220 | 221 | ||||||
Discover Card Master Trust, | ||||||||
0.860%, 11/15/2017 | 201 | 202 | ||||||
Dryrock Issuance Trust, | ||||||||
0.640%, 08/15/2018 | 440 | 438 | ||||||
GE Capital Credit Card Master Note Trust, Ser 2012-5, Cl A | ||||||||
0.950%, 06/15/2018 | 475 | 477 | ||||||
Golden Credit Card Trust, | ||||||||
0.790%, 09/15/2017 (C) | 525 | 525 | ||||||
Gracechurch Card Funding, | ||||||||
0.882%, 06/15/2017 (C) (E) | 550 | 553 | ||||||
Master Credit Card Trust, | ||||||||
0.780%, 04/21/2017 (C) | 330 | 329 | ||||||
|
| |||||||
| 6,786 | ||||||||
|
| |||||||
| SEI Institutional Managed Trust / Annual Report / September 30, 2013 | 73 |
SCHEDULE OF INVESTMENTS
Enhanced Income Fund (Continued)
September 30, 2013
| Description | Face Amount ($ Thousands) | Market Value ($ Thousands) | ||||||
Financials — 0.2% | ||||||||
ACE Securities Home Equity Loan Trust, Ser 2005-SD3, Cl A | ||||||||
0.579%, 08/25/2045 (E) | $ | 159 | $ | 158 | ||||
New York City, Tax Lien, | ||||||||
1.190%, 11/10/2026 | 275 | 275 | ||||||
|
| |||||||
| 433 | ||||||||
|
| |||||||
Other Asset-Backed Securities — 10.0% |
| |||||||
Accredited Mortgage Loan Trust, | ||||||||
0.519%, 01/25/2035 (E) | 252 | 245 | ||||||
Ally Master Owner Trust, | ||||||||
1.540%, 09/15/2016 | 540 | 545 | ||||||
Ally Master Owner Trust, | ||||||||
1.440%, 02/15/2017 | 600 | 605 | ||||||
Ally Master Owner Trust, | ||||||||
0.882%, 06/15/2017 (E) | 500 | 502 | ||||||
Ally Master Owner Trust, | ||||||||
1.210%, 06/15/2017 | 440 | 443 | ||||||
Ally Master Owner Trust, | ||||||||
0.632%, 02/15/2018 (E) | 280 | 280 | ||||||
Ally Master Owner Trust, | ||||||||
0.632%, 04/15/2018 (E) | 675 | 673 | ||||||
Apidos CDO, | ||||||||
1.373%, 04/15/2025 (C) (E) | 550 | 542 | ||||||
Atrium CDO, | ||||||||
1.396%, 07/16/2025 (C) (E) | 560 | 552 | ||||||
Babson CLO, | ||||||||
1.373%, 04/20/2025 (C) (E) | 600 | 593 | ||||||
CIFC Funding, | ||||||||
1.432%, 04/16/2025 (C) (E) | 485 | 479 | ||||||
CNH Equipment Trust, | ||||||||
0.860%, 09/15/2017 | 220 | 221 | ||||||
CNH Equipment Trust, | ||||||||
0.570%, 12/15/2017 | 280 | 279 | ||||||
Ford Credit Floorplan Master Owner Trust | ||||||||
0.652%, 09/15/2018 | 505 | 505 | ||||||
| Description | Face Amount ($ Thousands) | Market Value ($ Thousands) | ||||||
Ford Credit Floorplan Master Owner Trust, Ser 2012-1, Cl A | ||||||||
0.652%, 01/15/2016 (E) | $ | 720 | $ | 720 | ||||
Ford Credit Floorplan Master Owner Trust, Ser 2012-4, Cl A2 | ||||||||
0.532%, 09/15/2016 (E) | 505 | 505 | ||||||
Ford Credit Floorplan Master Owner Trust, Ser 2013-1, Cl A2 | ||||||||
0.562%, 01/15/2018 (E) | 330 | 330 | ||||||
GE Business Loan Trust, | ||||||||
1.182%, 11/15/2031 (C) (E) | 40 | 35 | ||||||
GE Business Loan Trust, | ||||||||
0.402%, 12/15/2032 (C) (E) | 63 | 60 | ||||||
GE Business Loan Trust, | ||||||||
0.662%, 12/15/2032 (C) (E) | 47 | 44 | ||||||
GE Dealer Floorplan Master Note Trust, Ser 2012-1, Cl A | ||||||||
0.750%, 02/20/2017 (E) | 640 | 642 | ||||||
GE Dealer Floorplan Master Note Trust, Ser 2012-3, Cl A | ||||||||
0.670%, 06/20/2017 (E) | 455 | 456 | ||||||
GE Equipment Midticket LLC, | ||||||||
0.640%, 03/22/2016 | 215 | 215 | ||||||
GE Equipment Midticket, | ||||||||
0.600%, 05/23/2016 | 270 | 270 | ||||||
GE Equipment Small Ticket, | ||||||||
0.730%, 01/25/2016 (C) | 185 | 185 | ||||||
GE Equipment Small Ticket, | ||||||||
0.850%, 11/21/2014 (C) | 171 | 171 | ||||||
GE Equipment Transportation, | ||||||||
1.330%, 05/20/2019 | 250 | 250 | ||||||
GE Equipment Transportation, | ||||||||
0.620%, 07/25/2016 | 591 | 590 | ||||||
GE Equipment Transportation, | ||||||||
0.500%, 11/24/2015 | 260 | 260 | ||||||
Golden Credit Card Trust, | ||||||||
0.611%, 09/15/2018 | 625 | 625 | ||||||
Granite Master Issuer, | ||||||||
0.260%, 12/20/2054 (E) | 556 | 548 | ||||||
HLSS Servicer Advance Receivables Backed Notes, Ser 2012-T2, Cl A2 | ||||||||
1.990%, 10/15/2045 (C) | 280 | 281 | ||||||
| 74 | SEI Institutional Managed Trust / Annual Report / September 30, 2013 |
| Description | Face Amount ($ Thousands) | Market Value ($ Thousands) | ||||||
HLSS Servicer Advance Receivables Backed Notes, Ser 2013-T1, Cl A1 | ||||||||
0.898%, 01/15/2044 (C) | $ | 640 | $ | 640 | ||||
HLSS Servicer Advance Receivables Backed Notes, Ser 2013-T1, Cl A2 | ||||||||
1.495%, 01/16/2046 (C) | 170 | 169 | ||||||
HLSS Servicer Advance Receivables Backed Notes, Ser 2013-T2, Cl A2 | ||||||||
1.147%, 05/16/2044 (C) | 650 | 646 | ||||||
John Deere Owner Trust | ||||||||
0.550%, 01/15/2016 | 300 | 300 | ||||||
John Deere Owner Trust, | ||||||||
0.530%, 07/15/2016 | 605 | 605 | ||||||
John Deere Owner Trust, | ||||||||
0.600%, 03/15/2017 | 725 | 724 | ||||||
Katonah, | ||||||||
0.684%, 11/15/2017 (C) (E) | 700 | 680 | ||||||
MMAF Equipment Finance, | ||||||||
0.840%, 01/12/2015 (C) | 215 | 215 | ||||||
Octagon Investment Partners XVI, | ||||||||
1.392%, 07/17/2025 (C) (E) | 550 | 545 | ||||||
OHA Credit Partners VIII, | ||||||||
1.395%, 04/20/2025 (C) (E) | 330 | 326 | ||||||
OHA Intrepid Leveraged Loan Fund, | ||||||||
1.186%, 04/20/2021 (C) (E) | 527 | 527 | ||||||
SLM Student Loan Trust, | ||||||||
1.366%, 10/25/2016 (E) | 64 | 64 | ||||||
SLM Student Loan Trust, | ||||||||
0.699%, 03/25/2026 (E) | 420 | 420 | ||||||
SLM Student Loan Trust, | ||||||||
1.032%, 12/16/2024 (C) (E) | 215 | 214 | ||||||
Triton Container Finance LLC, | ||||||||
0.350%, 11/26/2021 (C) (E) | 237 | 233 | ||||||
Volvo Financial Equipment, | ||||||||
0.690%, 03/15/2017 (C) | 320 | 319 | ||||||
|
| |||||||
| 19,278 | ||||||||
|
| |||||||
Total Asset-Backed Securities | 54,884 | |||||||
|
| |||||||
MORTGAGE-BACKED SECURITIES — 11.1% |
| |||||||
Agency Mortgage-Backed Obligations — 3.7% |
| |||||||
FHLMC | ||||||||
6.000%, 09/01/2026 | 139 | 152 | ||||||
| Description | Face Amount ($ Thousands) | Market Value ($ Thousands) | ||||||
FNMA | ||||||||
6.500%, 09/01/2026 | $ | 107 | $ | 119 | ||||
6.000%, 11/01/2026 to 04/01/2040 | 853 | 934 | ||||||
5.000%, 02/01/2023 to 03/01/2025 | 259 | 278 | ||||||
FNMA TBA | ||||||||
3.000%, 10/15/2027 | 3,100 | 3,209 | ||||||
2.500%, 10/15/2027 | 1,000 | 1,006 | ||||||
NCUA Guaranteed Notes, | ||||||||
0.632%, 10/07/2020 (E) | 444 | 446 | ||||||
NCUA Guaranteed Notes, | ||||||||
0.632%, 01/08/2020 (E) | 569 | 567 | ||||||
NCUA Guaranteed Notes, | ||||||||
0.582%, 03/11/2020 (E) | 199 | 200 | ||||||
NCUA Guaranteed Notes, | ||||||||
0.562%, 03/06/2020 (E) | 198 | 199 | ||||||
NCUA Guaranteed Notes, | ||||||||
0.562%, 05/07/2020 (E) | 132 | 132 | ||||||
|
| |||||||
| 7,242 | ||||||||
|
| |||||||
Non-Agency Mortgage-Backed Obligations — 7.4% |
| |||||||
Banc of America Mortgage Securities, | ||||||||
3.104%, 11/25/2034 (E) | 132 | 131 | ||||||
Banc of America Mortgage Securities, | ||||||||
2.867%, 04/25/2035 (E) | 413 | 354 | ||||||
Banc of America Mortgage Securities, | ||||||||
3.022%, 10/25/2035 (E) | 277 | 250 | ||||||
Bear Stearns Commercial Mortgage Securities, Ser 2005-PW10, Cl A4 | ||||||||
5.405%, 12/11/2040 (E) | 475 | 507 | ||||||
Citigroup Commercial Mortgage Trust, | ||||||||
0.685%, 09/10/2045 | 384 | 382 | ||||||
Citigroup Mortgage Loan Trust, | ||||||||
2.686%, 09/25/2034 (E) | 95 | 94 | ||||||
COMM Mortgage Trust, | ||||||||
1.344%, 07/10/2045 | 255 | 255 | ||||||
COMM Mortgage Trust, | ||||||||
1.278%, 08/10/2046 | 306 | 306 | ||||||
Commercial Mortgage Pass-Through Certificates, Ser 2010-C1, Cl A1 | ||||||||
3.156%, 07/10/2046 (C) | 472 | 488 | ||||||
Commercial Mortgage Pass-Through Certificates, Ser 2012-CR1, Cl A1 | ||||||||
1.116%, 05/15/2045 | 566 | 567 | ||||||
| SEI Institutional Managed Trust / Annual Report / September 30, 2013 | 75 |
SCHEDULE OF INVESTMENTS
Enhanced Income Fund (Continued)
September 30, 2013
| Description | Face Amount ($ Thousands) | Market Value ($ Thousands) | ||||||
Commercial Mortgage Pass-Through Certificates, Ser 2012-CR3, Cl A1 | ||||||||
0.666%, 11/15/2045 | $ | 239 | $ | 237 | ||||
Commercial Mortgage Pass-Through Certificates, Ser 2012-CR4, Cl A1 | ||||||||
0.704%, 10/15/2045 | 367 | 363 | ||||||
Commercial Mortgage Pass-Through Certificates, Ser CR2, Cl A1 | ||||||||
0.824%, 08/15/2045 | 281 | 279 | ||||||
DBUBS Mortgage Trust, | ||||||||
3.742%, 11/10/2046 (C) | 464 | 488 | ||||||
Greenwich Capital Commercial Funding, Ser 2006-FL4A, Cl C | ||||||||
0.412%, 11/15/2021 (C) (E) | 810 | 794 | ||||||
GS Mortgage Securities Trust, | ||||||||
1.206%, 07/10/2046 | 190 | 190 | ||||||
GS Mortgage Securities II, | ||||||||
3.849%, 12/10/2043 (C) | 465 | 493 | ||||||
GS Mortgage Securities II, | ||||||||
0.662%, 11/10/2045 | 262 | 261 | ||||||
Impac CMB Trust, | ||||||||
0.699%, 04/25/2035 (E) | 249 | 239 | ||||||
JPMorgan Chase Commercial Mortgage Securities, | ||||||||
3.853%, 06/15/2043 (C) | 488 | 508 | ||||||
JPMorgan Chase Commercial Mortgage Securities, | ||||||||
1.525%, 07/15/2046 (C) | 64 | 64 | ||||||
JPMorgan Chase Commercial Mortgage Securities, | ||||||||
0.670%, 12/15/2047 | 135 | 134 | ||||||
JPMorgan Chase Commercial Mortgage Securities, | ||||||||
1.303%, 01/15/2046 | 341 | 342 | ||||||
JPMorgan Chase Commercial Mortgage Securities, Ser C8, Cl A1 | ||||||||
0.705%, 10/15/2045 | 137 | 136 | ||||||
JPMorgan Mortgage Trust, | ||||||||
2.691%, 10/25/2036 (E) | 526 | 451 | ||||||
Merrill Lynch Mortgage Investors, | ||||||||
2.862%, 12/25/2034 (E) | 187 | 188 | ||||||
Morgan Stanley Bank of America Merrill Lynch Trust, | ||||||||
0.664%, 11/15/2045 | 154 | 153 | ||||||
| Description | Face Amount ($ Thousands) | Market Value ($ Thousands) | ||||||
Morgan Stanley Capital I Trust, | ||||||||
5.110%, 06/15/2040 (E) | $ | 389 | $ | 397 | ||||
Morgan Stanley, | ||||||||
1.000%, 03/27/2051 (C) | 438 | 434 | ||||||
MortgageIT Trust, | ||||||||
0.439%, 12/25/2035 (E) | 780 | 691 | ||||||
Sequoia Mortgage Trust, | ||||||||
0.500%, 11/20/2034 (E) | 184 | 182 | ||||||
Sequoia Mortgage Trust, | ||||||||
0.480%, 12/20/2034 (E) | 152 | 146 | ||||||
Sequoia Mortgage Trust, | ||||||||
0.400%, 03/20/2035 (E) | 88 | 78 | ||||||
Springleaf Mortgage Loan Trust, | ||||||||
1.270%, 06/25/2058 (C) (E) | 350 | 343 | ||||||
UBS-Barclays Commercial Mortgage Trust, Ser 2012-C3, Cl A1 | ||||||||
0.726%, 08/10/2049 | 433 | 430 | ||||||
Wachovia Bank Commercial Mortgage Trust, Ser 2005-C18, Cl A4 | ||||||||
4.935%, 04/15/2042 | 295 | 308 | ||||||
Wachovia Bank Commercial Mortgage Trust, Ser 2005-C21, Cl A4 | ||||||||
5.414%, 10/15/2044 (E) | 280 | 297 | ||||||
Wachovia Bank Commercial Mortgage Trust, Ser 2005-C22, Cl A4 | ||||||||
5.465%, 12/15/2044 (E) | 300 | 321 | ||||||
Washington Mutual Mortgage Pass-Through Certificates, | ||||||||
2.486%, 03/25/2036 (E) | 339 | 296 | ||||||
Wells Fargo Commercial Mortgage Trust, Ser 2012-LC5, Cl A1 | ||||||||
0.687%, 10/15/2045 | 443 | 440 | ||||||
Wells Fargo Mortgage-Backed Securities Trust, | ||||||||
2.625%, 01/25/2035 (E) | 294 | 295 | ||||||
WF-RBS Commercial Mortgage Trust, | ||||||||
1.988%, 03/15/2044 (C) | 205 | 208 | ||||||
WF-RBS Commercial Mortgage Trust, Ser 2011-C6, Cl A1 | ||||||||
1.081%, 04/15/2045 | 249 | 250 | ||||||
WF-RBS Commercial Mortgage Trust, Ser 2013-C15 | ||||||||
1.264%, 08/15/2046 | 381 | 380 | ||||||
| 76 | SEI Institutional Managed Trust / Annual Report / September 30, 2013 |
| Description | Face Amount ($ Thousands)/Shares | Market Value ($ Thousands) | ||||||
WF-RBS Commercial Mortgage Trust, Ser C9, Cl A1 | ||||||||
0.673%, 11/15/2045 | $ | 446 | $ | 441 | ||||
|
| |||||||
| 14,591 | ||||||||
|
| |||||||
Total Mortgage-Backed Securities |
| |||||||
(Cost $21,565) ($ Thousands) | 21,833 | |||||||
|
| |||||||
MUNICIPAL BONDS — 1.6% |
| |||||||
Florida, Hurricane Catastrophe Fund, Ser A, RB | ||||||||
1.298%, 07/01/2016 | 570 | 568 | ||||||
Grand Parkway Transportation, Ser D | ||||||||
1.000%, 10/01/2017 (E) | 350 | 350 | ||||||
New Jersey State, Economic Development Authority, | ||||||||
1.059%, 03/01/2016 | 455 | 452 | ||||||
New Jersey State, Turnpike Authority, Ser B, RB, AMBAC | ||||||||
4.252%, 01/01/2016 | 375 | 388 | ||||||
North Carolina, Eastern Municipal Power Agency, Ser C, RB | ||||||||
4.430%, 01/01/2014 | 350 | 353 | ||||||
Regional Transportation Authority, Ser A, RB | ||||||||
1.064%, 06/01/2014 | 230 | 230 | ||||||
1.044%, 04/01/2014 | 220 | 221 | ||||||
State of Illinois, GO | ||||||||
4.071%, 01/01/2014 | 510 | 514 | ||||||
|
| |||||||
Total Municipal Bonds |
| |||||||
(Cost $3,077) ($ Thousands) | 3,076 | |||||||
|
| |||||||
COMMON STOCK — 0.0% |
| |||||||
JHT Holding* | 4,002 | — | ||||||
|
| |||||||
Total Common Stock |
| |||||||
(Cost $–) ($ Thousands) | — | |||||||
|
| |||||||
CASH EQUIVALENT — 1.0% |
| |||||||
SEI Daily Income Trust, Prime Obligation Fund, Cl A | 2,022,260 | 2,022 | ||||||
|
| |||||||
Total Cash Equivalent |
| |||||||
(Cost $2,022) ($ Thousands) | 2,022 | |||||||
|
| |||||||
| Description | Face Amount ($ Thousands) | Market Value ($ Thousands) | ||||||
REPURCHASE AGREEMENT (F) — 0.5% |
| |||||||
0.060% Goldman Sachs dated 09/30/13, to be repurchased on 10/01/13, repurchase price $1,000,002 (collateralized by various FNMA obligations, par value $739,449-$911,638 4.000%-4.500%, 10/01/26-05/01/43, with total market value of $1,020,000) | $ | 1,000 | $ | 1,000 | ||||
|
| |||||||
Total Repurchase Agreement | ||||||||
(Cost $1,000) ($ Thousands) | 1,000 | |||||||
|
| |||||||
Total Investments — 103.7% | ||||||||
(Cost $205,631) ($ Thousands) | $ | 202,471 | ||||||
|
| |||||||
A list of the open futures contracts held by the Fund at September 30, 2013, are as follows:
| Type of Contract | Number of Contracts Long | Expiration Date | Unrealized Appreciation (Depreciation) ($Thousands) | |||||||||
U.S. 10-Year Treasury Note | (50 | ) | Dec-2013 | $ | (111 | ) | ||||||
U.S. 2-Year Treasury Note | (24 | ) | Dec-2013 | (13 | ) | |||||||
U.S. 5-Year Treasury Note | 1 | Dec-2013 | 1 | |||||||||
|
| |||||||||||
| $ | (123 | ) | ||||||||||
|
| |||||||||||
For the year ended September 30, 2013, the total amount of all open futures contracts, as presented in the table above, are representative of the volume of activity for the derivative type during the year.
Percentages are based on a Net Assets of $195,189 ($ Thousands)
| * | Non-income producing security. |
| ** | The rate reported is the 7-day effective yield as of September 30, 2013. |
| † | Investment in Affiliated Security (See Note 6). |
| ‡ | Real Estate Investment Trust. |
| (A) | Unsettled bank loan. Interest rate not available. |
| (B) | Securities considered illiquid and restricted. The total value of such securities as of September 30, 2013 was $17 ($ Thousands) and represented 0.01% of Net Assets. |
| (C) | Securities sold within terms of a private placement memorandum, exempt from registration under Section 144A of the Securities Act of 1933, as amended, and may be sold only to dealers in that program or other “accredited investors.” These securities have been determined to be liquid under guidelines established by the Board of Trustees. |
| (D) | Security fair valued using methods determined in good faith by the Valuation Committee of the Board of Trustees. The total market value of such securities as of September 30, 2013 was $17 and represented 0.01% of Net Assets. |
| (E) | Variable Rate Security—The rate reported on the Schedule of Investments is the rate in effect as of September 30, 2013. The date reported on the Schedule of Investments is the next reset date. |
| (F) | Tri-Party Repurchase Agreement |
| (G) | Security in default on interest payments. |
| (H) | Unfunded bank loan. |
AMBAC — American Municipal Bond Assurance Corporation
Cl — Class
CDO — Collateralized Debt Obligation
CLO — Collateralized Loan Obligation
| SEI Institutional Managed Trust / Annual Report / September 30, 2013 | 77 |
SCHEDULE OF INVESTMENTS
Enhanced Income Fund (Concluded)
September 30, 2013
FHLMC — Federal Home Loan Mortgage Corporation
FNMA — Federal National Mortgage Association
GO — General Obligation
L.P. — Limited Partnership
Ltd. — Limited
LLC — Limited Liability Company
MTN — Medium Term Note
NCUA — National Credit Union Administration
PLC — Public Limited Company
RB — Revenue Bond
Ser — Series
TBA — To Be Announced
The following is a list of the level of inputs used as of September 30, 2013, in valuing the Fund’s investments and other financial instruments carried at value ($ Thousands):
| Investments in Securities | Level 1 | Level 2 | Level 3(1) | Total | ||||||||||||
Corporate Obligations | $ | — | $ | 59,287 | $ | — | $ | 59,287 | ||||||||
Asset-Backed Securities | — | 54,884 | — | 54,884 | ||||||||||||
Mortgage-Backed Securities | — | 21,833 | — | 21,833 | ||||||||||||
Common Stock | — | — | — | — | ||||||||||||
Loan Participations | — | 60,352 | 17 | 60,369 | ||||||||||||
Municipal Bonds | — | 3,076 | — | 3,076 | ||||||||||||
Cash Equivalent | 2,022 | — | — | 2,022 | ||||||||||||
Repurchase Agreement | — | 1,000 | — | 1,000 | ||||||||||||
|
|
|
|
|
|
|
| |||||||||
Total Investments in Securities | $ | 2,022 | $ | 200,432 | $ | 17 | $ | 202,471 | ||||||||
|
|
|
|
|
|
|
| |||||||||
| Other Financial Instruments | Level 1 | Level 2 | Level 3 (1) | Total | ||||||||||||
Futures Contracts* | $ | — | $ | — | $ | — | $ | — | ||||||||
Unrealized Appreciation | 1 | — | — | 1 | ||||||||||||
Unrealized Depreciation | (124 | ) | — | — | (124 | ) | ||||||||||
|
|
|
|
|
|
|
| |||||||||
Total Other Financial Instruments | $ | (123 | ) | $ | — | $ | — | $ | (123 | ) | ||||||
|
|
|
|
|
|
|
| |||||||||
| (1) | A reconciliation of Level 3 investments is presented when the Fund has a significant amount of Level 3 investments at the beginning and/or end of the period in relation to the net assets. |
| * | Futures contracts are valued at unrealized appreciation (depreciation) on the instrument. |
For the year ended September 30, 2013, there have been no transfers between Level 1 and Level 2 assets and liabilities.
For the year ended September 30, 2013, there have been no transfers between Level 2 and Level 3 assets and liabilities.
For more information on valuation inputs, see Note 2 — Significant Accounting Policies in Notes to Financial Statements.
Amounts designated as “—” are $O or have been rounded to $O.
The accompanying notes are an integral part of the financial statements.
| 78 | SEI Institutional Managed Trust / Annual Report / September 30, 2013 |
SCHEDULE OF INVESTMENTS
Core Fixed Income Fund
September 30, 2013
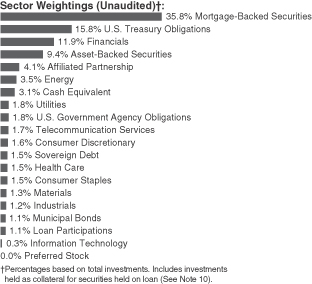
| Description | Face Amount ($ Thousands) | Market Value ($ Thousands) | ||||||
MORTGAGE-BACKED SECURITIES — 40.5% |
| |||||||
Agency Mortgage-Backed Obligations — 32.9% |
| |||||||
FHLMC | ||||||||
7.500%, 11/01/2029 to | $ | 770 | $ | 925 | ||||
7.000%, 06/01/2015 to | 855 | 930 | ||||||
6.500%, 06/01/2017 to | 1,286 | 1,386 | ||||||
6.000%, 03/01/2020 to | 4,253 | 4,654 | ||||||
5.500%, 03/01/2014 to | 12,477 | 13,530 | ||||||
5.000%, 10/01/2018 to | 24,272 | 26,373 | ||||||
4.500%, 07/01/2026 to | 2,564 | 2,733 | ||||||
4.000%, 04/01/2019 to | 19,932 | 20,912 | ||||||
3.500%, 12/01/2025 to | 20,080 | 20,586 | ||||||
3.165%, 02/01/2042 | 1,050 | 1,072 | ||||||
3.000%, 07/01/2032 to | 3,510 | 3,410 | ||||||
2.856%, 05/01/2042 | 718 | 721 | ||||||
2.673%, 07/01/2042 | 1,082 | 1,080 | ||||||
2.642%, 09/01/2042 | 1,863 | 1,856 | ||||||
2.500%, 11/01/2027 to | 7,691 | 7,748 | ||||||
1.250%, 10/02/2019 | 300 | 287 | ||||||
0.100%, 12/18/2013 (B) | 300 | 300 | ||||||
FHLMC ARM | ||||||||
2.240%, 07/01/2043 | 3,844 | 3,860 | ||||||
| Description | Face Amount ($ Thousands) | Market Value ($ Thousands) | ||||||
FHLMC CMO, Ser 1988-1, Cl Z | ||||||||
9.300%, 04/15/2019 | $ | 35 | $ | 38 | ||||
FHLMC CMO, Ser 1997-1983, Cl Z | ||||||||
6.500%, 12/15/2023 | 864 | 969 | ||||||
FHLMC CMO, Ser 2001-2277, Cl B | ||||||||
7.500%, 01/15/2031 | 213 | 246 | ||||||
FHLMC CMO, | ||||||||
6.500%, 01/15/2032 | 1,276 | 1,452 | ||||||
FHLMC CMO, Ser 2002-48, Cl 1A | ||||||||
5.931%, 07/25/2033 (C) | 16 | 19 | ||||||
FHLMC CMO, Ser 2003-57, Cl 1A2 | ||||||||
7.000%, 07/25/2043 | 214 | 254 | ||||||
FHLMC CMO, Ser 2003-57, Cl 1A3 | ||||||||
7.500%, 07/25/2043 | 171 | 199 | ||||||
FHLMC CMO, Ser 2004-59, Cl 1A3 | ||||||||
7.500%, 10/25/2043 | 237 | 287 | ||||||
FHLMC CMO, Ser 2004-60, Cl 1A3 | ||||||||
7.500%, 03/25/2044 | 250 | 301 | ||||||
FHLMC CMO, | ||||||||
11.966%, 03/15/2020 (C) | 944 | 1,097 | ||||||
FHLMC CMO, | ||||||||
6.000%, 05/15/2035 | 770 | 858 | ||||||
FHLMC CMO, | ||||||||
6.000%, 05/15/2036 | 2,727 | 3,006 | ||||||
FHLMC CMO, | ||||||||
5.500%, 03/15/2037 | 1,151 | 1,261 | ||||||
FHLMC CMO, | ||||||||
5.846%, 05/15/2038 (C) | 300 | 32 | ||||||
FHLMC CMO, | ||||||||
6.500%, 04/15/2039 | 949 | 1,045 | ||||||
FHLMC CMO, | ||||||||
6.048%, 01/15/2040 (C) | 202 | 25 | ||||||
FHLMC CMO, | ||||||||
5.500%, 09/15/2039 | 959 | 1,075 | ||||||
FHLMC CMO, | ||||||||
4.000%, 11/15/2037 | 426 | 460 | ||||||
FHLMC CMO, | ||||||||
5.000%, 08/15/2038 | 752 | 816 | ||||||
FHLMC CMO, | ||||||||
5.768%, 10/15/2041 (C) | 1,237 | 235 | ||||||
FHLMC CMO, | ||||||||
6.418%, 11/15/2041 (C) | 1,034 | 187 | ||||||
| SEI Institutional Managed Trust / Annual Report / September 30, 2013 | 79 |
SCHEDULE OF INVESTMENTS
Core Fixed Income Fund (Continued)
September 30, 2013
| Description | Face Amount ($ Thousands) | Market Value ($ Thousands) | ||||||
FHLMC CMO, | ||||||||
5.866%, 08/15/2039 (C) | $ | 2,294 | $ | 345 | ||||
FHLMC CMO, | ||||||||
5.868%, 09/15/2039 (C) | 722 | 133 | ||||||
FHLMC CMO, | ||||||||
5.868%, 04/15/2039 (C) | 1,545 | 287 | ||||||
FHLMC CMO, | ||||||||
5.768%, 06/15/2042 (C) | 178 | 45 | ||||||
FHLMC CMO, | ||||||||
5.818%, 06/15/2042 (C) | 560 | 117 | ||||||
FHLMC CMO, | ||||||||
5.786%, 07/15/2042 (C) | 2,025 | 419 | ||||||
FHLMC CMO, | ||||||||
5.868%, 07/15/2042 (C) | 93 | 20 | ||||||
FHLMC CMO, | ||||||||
3.000%, 09/15/2031 | 1,293 | 179 | ||||||
FHLMC CMO, | ||||||||
5.918%, 08/15/2042 (C) | 914 | 225 | ||||||
FHLMC CMO, | ||||||||
5.868%, 08/15/2042 (C) | 183 | 39 | ||||||
FHLMC CMO, | ||||||||
6.418%, 09/15/2042 (C) | 1,027 | 235 | ||||||
FHLMC CMO, | ||||||||
5.968%, 10/15/2042 (C) | 557 | 117 | ||||||
FHLMC CMO, | ||||||||
6.018%, 10/15/2042 (C) | 634 | 139 | ||||||
FHLMC CMO, | ||||||||
5.968%, 10/15/2042 (C) | 567 | 122 | ||||||
FHLMC CMO, | ||||||||
5.968%, 11/15/2042 (C) | 187 | 41 | ||||||
FHLMC CMO, | ||||||||
5.968%, 11/15/2042 (C) | 766 | 175 | ||||||
FHLMC CMO, | ||||||||
5.968%, 11/15/2042 (C) | 190 | 44 | ||||||
FHLMC CMO, | ||||||||
5.968%, 11/15/2042 (C) | 285 | 69 | ||||||
| Description | Face Amount ($ Thousands) | Market Value ($ Thousands) | ||||||
FHLMC CMO, | ||||||||
5.918%, 12/15/2042 (C) | $ | 483 | $ | 121 | ||||
FHLMC CMO, | ||||||||
5.968%, 01/15/2043 (C) | 844 | 168 | ||||||
FHLMC CMO, | ||||||||
6.016%, 05/15/2039 (C) | 1,751 | 372 | ||||||
FHLMC CMO, | ||||||||
5.968%, 05/15/2043 (C) | 984 | 233 | ||||||
FHLMC CMO, | ||||||||
6.018%, 05/15/2040 (C) | 685 | 144 | ||||||
FHLMC CMO, | ||||||||
6.058%, 09/15/2042 (C) | 587 | 118 | ||||||
FHLMC Multifamily Structured Pass-Through Certificates, | ||||||||
4.768%, 05/25/2018 | 857 | 929 | ||||||
FHLMC Multifamily Structured Pass-Through Certificates, | ||||||||
2.373%, 05/25/2022 | 3,540 | 3,335 | ||||||
FHLMC Multifamily Structured Pass-Through Certificates, | ||||||||
1.208%, 01/25/2020 (C) | 2,661 | 139 | ||||||
FHLMC Multifamily Structured Pass-Through Certificates, | ||||||||
1.392%, 04/25/2020 (C) | 8,592 | 509 | ||||||
FHLMC Multifamily Structured Pass-Through Certificates, | ||||||||
1.825%, 06/25/2020 (C) | 8,947 | 747 | ||||||
FHLMC Multifamily Structured Pass-Through Certificates, | ||||||||
1.664%, 08/25/2020 (C) | 3,058 | 231 | ||||||
FHLMC Multifamily Structured Pass-Through Certificates, | ||||||||
1.837%, 07/25/2021 (C) | 3,152 | 320 | ||||||
FHLMC Multifamily Structured Pass-Through Certificates, | ||||||||
1.735%, 10/25/2021 (C) | 1,268 | 125 | ||||||
FHLMC Multifamily Structured Pass-Through Certificates, | ||||||||
1.597%, 12/25/2021 (C) | 1,625 | 146 | ||||||
| 80 | SEI Institutional Managed Trust / Annual Report / September 30, 2013 |
| Description | Face Amount ($ Thousands) | Market Value ($ Thousands) | ||||||
FHLMC Multifamily Structured Pass-Through Certificates, | ||||||||
1.025%, 09/25/2022 (C) | $ | 1,315 | $ | 81 | ||||
FHLMC Multifamily Structured Pass-Through Certificates, | ||||||||
1.713%, 02/25/2018 (C) | 10,090 | 587 | ||||||
FHLMC Multifamily Structured Pass-Through Certificates, | ||||||||
2.251%, 05/25/2018 (C) | 5,720 | 469 | ||||||
FNMA | ||||||||
7.000%, 09/01/2026 to 02/01/2039 | 2,806 | 3,182 | ||||||
6.500%, 05/01/2017 to 10/01/2036 | 795 | 864 | ||||||
6.000%, 10/01/2019 to 07/01/2037 | 12,850 | 14,139 | ||||||
5.500%, 06/01/2014 to 04/01/2040 | 12,978 | 14,181 | ||||||
5.000%, 01/01/2020 to 05/01/2042 | 42,568 | 46,451 | ||||||
4.500%, 04/01/2025 to 12/01/2042 | 19,636 | 21,107 | ||||||
4.338%, 11/01/2021 | 2,972 | 3,245 | ||||||
4.303%, 07/01/2021 | 2,904 | 3,151 | ||||||
4.000%, 08/01/2020 to 08/01/2043 | 28,559 | 30,048 | ||||||
3.762%, 12/01/2020 | 3,107 | 3,313 | ||||||
3.665%, 10/01/2020 | 1,849 | 1,953 | ||||||
3.632%, 12/01/2020 | 2,116 | 2,236 | ||||||
3.500%, 07/01/2032 to 05/01/2043 | 33,260 | 33,843 | ||||||
3.027%, 03/01/2042 | 434 | 441 | ||||||
3.000%, 02/01/2033 to 06/01/2043 | 28,864 | 28,357 | ||||||
2.661%, 07/01/2042 | 1,221 | 1,218 | ||||||
2.629%, 09/01/2043 | 552 | 547 | ||||||
2.516%, 09/01/2043 | 1,105 | 1,115 | ||||||
2.500%, 10/01/2042 | 1,048 | 975 | ||||||
2.460%, 04/01/2023 | 3,393 | 3,210 | ||||||
2.374%, 02/01/2043 | 282 | 284 | ||||||
2.306%, 09/01/2043 | 1,326 | 1,328 | ||||||
2.115%, 02/01/2043 | 297 | 298 | ||||||
2.042%, 06/01/2043 | 384 | 380 | ||||||
2.019%, 05/01/2043 | 619 | 613 | ||||||
2.007%, 01/01/2043 | 250 | 248 | ||||||
1.710%, 08/01/2043 | 235 | 230 | ||||||
FNMA ARM | ||||||||
2.458%, 08/01/2043 | 174 | 170 | ||||||
2.155%, 10/01/2035 (C) | 3,119 | 3,283 | ||||||
2.140%, 11/01/2035 (C) | 369 | 388 | ||||||
2.136%, 11/01/2035 (C) | 522 | 549 | ||||||
| Description | Face Amount ($ Thousands) | Market Value ($ Thousands) | ||||||
2.131%, 11/01/2035 (C) | $ | 510 | $ | 536 | ||||
2.130%, 11/01/2035 (C) | 411 | 434 | ||||||
2.113%, 11/01/2035 (C) | 1,725 | 1,809 | ||||||
2.090%, 11/01/2035 (C) | 419 | 441 | ||||||
2.066%, 10/01/2035 (C) | 280 | 294 | ||||||
2.052%, 10/01/2035 (C) | 2,295 | 2,408 | ||||||
2.036%, 07/01/2043 | 297 | 282 | ||||||
2.031%, 07/01/2043 | 668 | 636 | ||||||
FNMA CMO STRIPS, Ser 2005-360, Cl 2, IO | ||||||||
5.000%, 08/01/2035 | 4,391 | 773 | ||||||
FNMA CMO STRIPS, Ser 2012-409, Cl C2, IO | ||||||||
3.000%, 04/25/2027 | 1,487 | 175 | ||||||
FNMA CMO STRIPS, Ser 2012-409, Cl C13, IO | ||||||||
3.500%, 11/25/2041 | 922 | 103 | ||||||
FNMA CMO STRIPS, Ser 2012-409, Cl C22, IO | ||||||||
4.500%, 11/25/2039 | 1,531 | 181 | ||||||
FNMA CMO, Ser 1999-11, Cl Z | ||||||||
5.500%, 03/25/2029 | 656 | 720 | ||||||
FNMA CMO, Ser 2002-33, Cl A2 | ||||||||
7.500%, 06/25/2032 | 185 | 220 | ||||||
FNMA CMO, Ser 2002-95, Cl DB | ||||||||
6.000%, 01/25/2033 | 740 | 841 | ||||||
FNMA CMO, Ser 2005-117, Cl LC | ||||||||
5.500%, 11/25/2035 | 1,887 | 2,061 | ||||||
FNMA CMO, Ser 2005-5, Cl PA | ||||||||
5.000%, 01/25/2035 | 246 | 267 | ||||||
FNMA CMO, | ||||||||
6.507%, 11/25/2036 (C) | 4,096 | 620 | ||||||
FNMA CMO, Ser 2006-56, Cl CA | ||||||||
6.000%, 07/25/2036 | 140 | 156 | ||||||
FNMA CMO, Ser 2008-22, Cl SI, IO | ||||||||
6.246%, 03/25/2037 (C) | 6,725 | 796 | ||||||
FNMA CMO, | ||||||||
0.000%, 03/25/2037 | 4,350 | 4,213 | ||||||
FNMA CMO, | ||||||||
6.351%, 12/25/2040 (C) | 331 | 37 | ||||||
FNMA CMO, | ||||||||
6.291%, 01/25/2041 (C) | 1,096 | 155 | ||||||
FNMA CMO, | ||||||||
6.291%, 01/25/2041 (C) | 1,233 | 172 | ||||||
FNMA CMO, | ||||||||
6.421%, 10/25/2040 (C) | 2,076 | 474 | ||||||
FNMA CMO, Ser 2011-58, Cl AT | ||||||||
4.000%, 07/25/2041 | 887 | 932 | ||||||
| SEI Institutional Managed Trust / Annual Report / September 30, 2013 | 81 |
SCHEDULE OF INVESTMENTS
Core Fixed Income Fund (Continued)
September 30, 2013
| Description | Face Amount ($ Thousands) | Market Value ($ Thousands) | ||||||
FNMA CMO, Ser 2011-59, Cl NZ | ||||||||
5.500%, 07/25/2041 | $ | 1,906 | $ | 2,132 | ||||
FNMA CMO, | ||||||||
6.461%, 07/25/2041 (C) | 2,175 | 369 | ||||||
FNMA CMO, | ||||||||
6.501%, 07/25/2041 (C) | 977 | 127 | ||||||
FNMA CMO, | ||||||||
5.771%, 09/25/2041 (C) | 2,260 | 302 | ||||||
FNMA CMO, Ser 2011-90, Cl QI, IO | ||||||||
5.000%, 05/25/2034 | 1,788 | 249 | ||||||
FNMA CMO, Ser 2011-96, Cl SA, IO | ||||||||
6.371%, 10/25/2041 (C) | 3,444 | 499 | ||||||
FNMA CMO, Ser 2012-111, Cl JS, IO | ||||||||
5.921%, 07/25/2040 (C) | 951 | 202 | ||||||
FNMA CMO, Ser 2012-111, Cl SB, IO | ||||||||
6.421%, 10/25/2042 (C) | 757 | 186 | ||||||
FNMA CMO, Ser 2012-128, Cl SL, IO | ||||||||
5.971%, 11/25/2042 (C) | 384 | 96 | ||||||
FNMA CMO, Ser 2012-128, Cl SQ, IO | ||||||||
5.971%, 11/25/2042 (C) | 569 | 131 | ||||||
FNMA CMO, Ser 2012-130, Cl DC | ||||||||
3.000%, 12/25/2042 | 5,591 | 5,352 | ||||||
FNMA CMO, Ser 2012-133, Cl CS, IO | ||||||||
5.971%, 12/25/2042 (C) | 375 | 87 | ||||||
FNMA CMO, Ser 2012-133, Cl GS, IO | ||||||||
5.971%, 12/25/2042 (C) | 568 | 120 | ||||||
FNMA CMO, | ||||||||
2.500%, 07/25/2042 | 1,488 | 1,454 | ||||||
FNMA CMO, Ser 2012-133, Cl SA, IO | ||||||||
5.971%, 12/25/2042 (C) | 193 | 47 | ||||||
FNMA CMO, Ser 2012-134, Cl LC | ||||||||
3.000%, 12/25/2042 | 509 | 502 | ||||||
FNMA CMO, Ser 2012-134, Cl SC, IO | ||||||||
5.971%, 12/25/2042 (C) | 752 | 160 | ||||||
FNMA CMO, Ser 2012-134, Cl SK, IO | ||||||||
5.971%, 12/25/2042 (C) | 381 | 86 | ||||||
FNMA CMO, Ser 2012-139, Cl NS, IO | ||||||||
6.516%, 12/25/2042 (C) | 1,096 | 269 | ||||||
| Description | Face Amount ($ Thousands) | Market Value ($ Thousands) | ||||||
FNMA CMO, | ||||||||
6.371%, 07/25/2039 (C) | $ | 567 | $ | 117 | ||||
FNMA CMO, Ser 2012-28, Cl B | ||||||||
6.500%, 06/25/2039 | 301 | 336 | ||||||
FNMA CMO, Ser 2012-35, Cl SQ, IO | ||||||||
6.421%, 04/25/2042 (C) | 393 | 66 | ||||||
FNMA CMO, Ser 2012-46, Cl BA | ||||||||
6.000%, 05/25/2042 | 1,384 | 1,528 | ||||||
FNMA CMO, Ser 2012-63, Cl DS, IO | ||||||||
6.371%, 03/25/2039 (C) | 1,099 | 225 | ||||||
FNMA CMO, | ||||||||
6.471%, 02/25/2041 (C) | 268 | 48 | ||||||
FNMA CMO, Ser 2012-74, Cl OA, PO | ||||||||
0.000%, 03/25/2042 | 87 | 83 | ||||||
FNMA CMO, Ser 2012-74, Cl SA, IO | ||||||||
6.471%, 03/25/2042 (C) | 1,136 | 196 | ||||||
FNMA CMO, Ser 2012-75, Cl AO, PO | ||||||||
0.000%, 03/25/2042 | 175 | 166 | ||||||
FNMA CMO, Ser 2012-93, Cl SG, IO | ||||||||
5.921%, 09/25/2042 (C) | 460 | 94 | ||||||
FNMA CMO, Ser 2012-93, Cl SM, IO | ||||||||
5.907%, 09/25/2042 (C) | 467 | 101 | ||||||
FNMA CMO, | ||||||||
5.871%, 05/25/2039 (C) | 557 | 102 | ||||||
FNMA CMO, Ser 2012-M12, Cl 1A | ||||||||
2.935%, 08/25/2022 (C) | 4,681 | 4,614 | ||||||
FNMA CMO, Ser 2012-M15, Cl A | ||||||||
2.745%, 10/25/2022 (C) | 3,616 | 3,486 | ||||||
FNMA CMO, | ||||||||
5.966%, 02/25/2043 (C) | 1,355 | 308 | ||||||
FNMA CMO, | ||||||||
5.966%, 02/25/2043 (C) | 1,446 | 369 | ||||||
FNMA CMO, | ||||||||
5.971%, 03/25/2043 (C) | 390 | 97 | ||||||
FNMA CMO, Ser 2013-9, Cl BC | ||||||||
6.500%, 07/25/2042 | 1,462 | 1,645 | ||||||
FNMA CMO, Ser 2013-9, Cl CB | ||||||||
5.500%, 04/25/2042 | 8,100 | 8,932 | ||||||
FNMA CMO, Ser 2013-9, Cl SA, IO | ||||||||
5.966%, 03/25/2042 (C) | 1,398 | 219 | ||||||
| 82 | SEI Institutional Managed Trust / Annual Report / September 30, 2013 |
| Description | Face Amount ($ Thousands) | Market Value ($ Thousands) | ||||||
FNMA CMO, Ser 2013-9, Cl SG, IO | ||||||||
6.021%, 03/25/2039 (C) | $ | 292 | $ | 64 | ||||
FNMA TBA | ||||||||
5.000%, 10/01/2038 | 600 | 651 | ||||||
4.500%, 10/15/2042 | 1,300 | 1,388 | ||||||
4.000%, 10/14/2039 to 10/25/2043 | 45,900 | 48,145 | ||||||
3.500%, 10/16/2027 to 10/25/2043 | 32,775 | 33,539 | ||||||
3.000%, 12/25/2026 to 10/25/2043 | 37,905 | 38,861 | ||||||
2.500%, 10/15/2027 to 10/25/2028 | 11,745 | 11,811 | ||||||
FNMA Whole Loan CMO, Ser 2003-W17, Cl 1A7 | ||||||||
5.750%, 08/25/2033 | 251 | 276 | ||||||
GNMA | ||||||||
8.000%, 11/15/2029 to 09/15/2030 | 74 | 84 | ||||||
7.500%, 03/15/2029 | 109 | 131 | ||||||
6.500%, 04/15/2026 to 09/15/2035 | 4,103 | 4,675 | ||||||
6.000%, 03/15/2014 to 10/20/2040 | 9,651 | 10,769 | ||||||
5.000%, 07/20/2040 to 11/20/2040 | 2,030 | 2,225 | ||||||
4.500%, 04/20/2041 | 2,948 | 3,190 | ||||||
GNMA CMO, Ser 2001-56, Cl PT | ||||||||
6.000%, 11/20/2031 | 2,410 | 2,725 | ||||||
GNMA CMO, Ser 2003-79, Cl PV | ||||||||
5.500%, 10/20/2023 | 341 | 368 | ||||||
GNMA CMO, | ||||||||
6.066%, 04/20/2037 (C) | 1,246 | 226 | ||||||
GNMA CMO, | ||||||||
6.320%, 03/20/2039 (C) | 340 | 51 | ||||||
GNMA CMO, Ser 2010-4, Cl NS, IO | ||||||||
6.206%, 01/16/2040 (C) | 11,941 | 1,909 | ||||||
GNMA CMO, Ser 2010-47, Cl XN, IO | ||||||||
6.366%, 04/16/2034 (C) | 156 | 9 | ||||||
GNMA CMO, Ser 2010-85, Cl HS, IO | ||||||||
6.470%, 01/20/2040 (C) | 270 | 47 | ||||||
GNMA CMO, Ser 2010-H27, Cl FA | ||||||||
0.575%, 12/20/2060 (C) | 1,872 | 1,844 | ||||||
GNMA CMO, Ser 2010-H28, Cl FE | ||||||||
0.586%, 12/20/2060 (C) | 1,138 | 1,121 | ||||||
GNMA CMO, Ser 2011-40, Cl SA, IO | ||||||||
5.946%, 02/16/2036 (C) | 1,073 | 135 | ||||||
GNMA CMO, Ser 2011-H08, Cl FG | ||||||||
0.666%, 03/20/2061 (C) | 1,162 | 1,150 | ||||||
| Description | Face Amount ($ Thousands) | Market Value ($ Thousands) | ||||||
GNMA CMO, Ser 2011-H09, Cl AF | ||||||||
0.686%, 03/20/2061 (C) | $ | 802 | $ | 795 | ||||
GNMA CMO, | ||||||||
3.500%, 02/20/2038 | 988 | 149 | ||||||
GNMA CMO, Ser 2012-98, Cl SA, IO | ||||||||
5.893%, 08/16/2042 (C) | 796 | 116 | ||||||
GNMA TBA | ||||||||
4.500%, 11/22/2033 | 2,600 | 2,788 | ||||||
4.000%, 10/01/2039 to 12/01/2039 | 18,600 | 19,573 | ||||||
3.500%, 10/15/2041 to 10/15/2041 | 9,300 | 9,560 | ||||||
3.000%, 10/01/2042 to 10/20/2043 | 14,660 | 14,473 | ||||||
NCUA Guaranteed Notes CMO, Ser 2010-C1, Cl APT | ||||||||
2.650%, 10/29/2020 | 872 | 900 | ||||||
NCUA Guaranteed Notes CMO, Ser 2010-R2, Cl 1A | ||||||||
0.556%, 11/06/2017 (C) | 1,979 | 1,983 | ||||||
NCUA Guaranteed Notes CMO, Ser 2010-R2, Cl 2A | ||||||||
0.656%, 11/05/2020 (C) | 1,512 | 1,518 | ||||||
|
| |||||||
| 631,184 | ||||||||
|
| |||||||
Non-Agency Mortgage-Backed Obligations — 7.6% |
| |||||||
Adjustable Rate Mortgage Trust, Ser 2004-2, Cl 3A1 | ||||||||
2.443%, 02/25/2035 (C) | 3,304 | 3,092 | ||||||
Adjustable Rate Mortgage Trust, Ser 2007-1, Cl 5A31 | ||||||||
0.324%, 03/25/2037 (C) | 3,684 | 2,328 | ||||||
American Home Mortgage Investment Trust, | ||||||||
2.397%, 06/25/2045 (C) | 2,925 | 2,697 | ||||||
American Home Mortgage Investment Trust, Ser 2005-4, Cl 5A | ||||||||
2.147%, 11/25/2045 (C) | 2,746 | 2,160 | ||||||
Banc of America Commercial Mortgage Trust, | ||||||||
5.421%, 09/10/2045 (C) | 253 | 271 | ||||||
Banc of America Commercial Mortgage Trust, Ser 2006-2, Cl AM | ||||||||
5.964%, 05/10/2045 (C) | 80 | 88 | ||||||
Banc of America Commercial Mortgage Trust, | ||||||||
5.448%, 09/10/2047 | 100 | 106 | ||||||
| SEI Institutional Managed Trust / Annual Report / September 30, 2013 | 83 |
SCHEDULE OF INVESTMENTS
Core Fixed Income Fund (Continued)
September 30, 2013
| Description | Face Amount ($ Thousands) | Market Value ($ Thousands) | ||||||
Banc of America Commercial Mortgage Trust, Ser 2006-6, Cl A4 | ||||||||
5.356%, 10/10/2045 | $ | 714 | $ | 776 | ||||
Banc of America Commercial Mortgage Trust, Ser 2007-3, Cl A3 | ||||||||
5.857%, 06/10/2049 (C) | 1,360 | 1,372 | ||||||
Banc of America Funding Trust, Ser 2003-1, Cl A1 | ||||||||
6.000%, 05/20/2033 | 12 | 12 | ||||||
Banc of America Funding Trust, Ser 2006-G, Cl 2A3 | ||||||||
0.350%, 07/20/2036 (C) | 1,189 | 1,180 | ||||||
Banc of America Merrill Lynch Commercial Mortgage Trust, Ser 2004-6, Cl A3 | ||||||||
4.512%, 12/10/2042 | 9 | 9 | ||||||
Banc of America Merrill Lynch Commercial Mortgage Trust, Ser 2005-2, Cl A5 | ||||||||
4.857%, 07/10/2043 (C) | 3,280 | 3,439 | ||||||
Bayview Commercial Asset Trust, Ser 2008-4, Cl A2 | ||||||||
2.684%, 07/25/2038 (C) (D) | 1,181 | 1,164 | ||||||
Bear Stearns Adjustable Rate Mortgage Trust, Ser 2004-2, Cl 24A | ||||||||
5.229%, 05/25/2034 (C) | 333 | 320 | ||||||
Bear Stearns ALT-A Trust, Ser 2004-12, Cl 1A3 | ||||||||
0.879%, 01/25/2035 (C) | 1,336 | 1,243 | ||||||
Bear Stearns Asset-Backed Securities I Trust, Ser 2005-AC6, Cl 1A3 | ||||||||
5.500%, 09/25/2035 (C) | 3,027 | 3,088 | ||||||
Bear Stearns Commercial Mortgage Securities Trust, Ser 2005-PWR7, Cl A2 | ||||||||
4.945%, 02/11/2041 | 26 | 26 | ||||||
Bear Stearns Commercial Mortgage Securities Trust, Ser 2005-T20, Cl A4A | ||||||||
5.293%, 10/12/2042 (C) | 3,875 | 4,146 | ||||||
Bear Stearns Commercial Mortgage Securities Trust, Ser 2007-PW16, Cl AM | ||||||||
5.898%, 06/11/2040 (C) | 200 | 225 | ||||||
Bear Stearns Commercial Mortgage Securities Trust, Ser 2007-PW17, Cl AM | ||||||||
5.915%, 06/11/2050 (C) | 210 | 237 | ||||||
CFCRE Commercial Mortgage Trust, Ser 2011-C1, Cl A4 | ||||||||
4.961%, 04/15/2044 (C) (D) | 729 | 793 | ||||||
| Description | Face Amount ($ Thousands) | Market Value ($ Thousands) | ||||||
Citigroup Commercial Mortgage Trust, Ser 2005-C3, Cl A4 | ||||||||
4.860%, 05/15/2043 | $ | 656 | $ | 684 | ||||
Citigroup Commercial Mortgage Trust, Ser 2013-GC11, Cl AAB | ||||||||
2.690%, 04/10/2046 | 211 | 205 | ||||||
COBALT CMBS Commercial Mortgage Trust, Ser 2007-C2, Cl AMFX | ||||||||
5.526%, 04/15/2047 (C) | 130 | 144 | ||||||
COMM Mortgage Trust, Ser 2010-C1, Cl A3 | ||||||||
4.205%, 07/10/2046 (D) | 724 | 768 | ||||||
COMM Mortgage Trust, Ser 2012-LC4, Cl A3 | ||||||||
3.069%, 12/10/2044 | 315 | 320 | ||||||
COMM Mortgage Trust, Ser 2012-LC4, Cl A4 | ||||||||
3.288%, 12/10/2044 | 500 | 495 | ||||||
COMM Mortgage Trust, Ser 2013-CR7, Cl ASB | ||||||||
2.739%, 03/10/2046 | 713 | 702 | ||||||
COMM Mortgage Trust, Ser 2013-CR9, Cl A1 | ||||||||
1.344%, 07/10/2045 | 507 | 508 | ||||||
COMM Mortgage Trust, Ser 2013-CR9, Cl A4 | ||||||||
4.380%, 07/10/2045 (C) | 768 | 801 | ||||||
COMM Mortgage Trust, Ser 2013-CR9, Cl ASB | ||||||||
3.834%, 07/10/2045 | 673 | 702 | ||||||
Commercial Mortgage Pass-Through Certificates, Ser 2007-C2, Cl AM | ||||||||
5.615%, 01/15/2049 (C) | 582 | 618 | ||||||
Commercial Mortgage Pass-Through Certificates, Ser 2012-CR3, Cl A3 | ||||||||
2.822%, 11/15/2045 | 60 | 57 | ||||||
Commercial Mortgage Pass-Through Certificates, | ||||||||
3.424%, 03/10/2031 (D) | 230 | 221 | ||||||
Commercial Mortgage Trust, Ser 2004-GG1, Cl A7 | ||||||||
5.317%, 06/10/2036 (C) (E) | 311 | 314 | ||||||
Commercial Mortgage Trust, Ser 2005-GG3, Cl AAB | ||||||||
4.619%, 08/10/2042 | 833 | 842 | ||||||
Commercial Mortgage Trust, Ser 2005-GG5, Cl A5 | ||||||||
5.224%, 04/10/2037 (C) | 2,296 | 2,440 | ||||||
Commercial Mortgage Trust, Ser 2006-GG7, Cl AM | ||||||||
6.056%, 07/10/2038 (C) | 400 | 437 | ||||||
| 84 | SEI Institutional Managed Trust / Annual Report / September 30, 2013 |
| Description | Face Amount ($ Thousands) | Market Value ($ Thousands) | ||||||
Commercial Mortgage Trust, Ser 2013-VN05, Cl A | ||||||||
3.187%, 03/13/2035 | $ | 140 | $ | 134 | ||||
Commercial Mortgage Pass-Through Certificates, Ser 2006-C5, Cl A3 | ||||||||
5.311%, 12/15/2039 | 2,024 | 2,209 | ||||||
Countrywide Alternative Loan Trust, Ser 2003-20CB, Cl 1A1 | ||||||||
5.500%, 10/25/2033 | 740 | 783 | ||||||
Countrywide Alternative Loan Trust, Ser 2004-J1, Cl 1A1 | ||||||||
6.000%, 02/25/2034 | 155 | 159 | ||||||
Countrywide Alternative Loan Trust, Ser 2005-27, Cl 3A2 | ||||||||
1.258%, 08/25/2035 (C) | 312 | 201 | ||||||
Countrywide Alternative Loan Trust, Ser 2005-59, Cl 1A1 | ||||||||
0.522%, 11/20/2035 (C) | — | — | ||||||
Countrywide Home Loan Mortgage Pass-Through Trust, Ser 2005-R3, Cl AF | ||||||||
0.579%, 09/25/2035 (C) (D) | 2,282 | 1,988 | ||||||
Credit Suisse First Boston Mortgage Securities, | ||||||||
2.598%, 10/25/2033 (C) | 2,088 | 1,964 | ||||||
Credit Suisse First Boston Mortgage Securities, Ser 2004-C5, Cl A4 | ||||||||
4.829%, 11/15/2037 | 131 | 136 | ||||||
Credit Suisse First Boston Mortgage Securities, Ser 2005-C2, Cl A4 | ||||||||
4.832%, 04/15/2037 | 290 | 303 | ||||||
Credit Suisse First Boston Mortgage Securities, Ser 2005-C5, Cl A4 | ||||||||
5.100%, 08/15/2038 (C) | 521 | 551 | ||||||
DBRR Trust, Ser 2011-LC2, Cl A4A | ||||||||
4.537%, 07/12/2044 (C) (D) | 1,320 | 1,410 | ||||||
DBRR Trust, Ser 2012-EZ1, Cl A | ||||||||
0.946%, 09/25/2045 (D) | 2,091 | 2,090 | ||||||
DBRR Trust, Ser 2013-EZ2, Cl A | ||||||||
0.853%, 02/25/2045 (C) (D) | 2,083 | 2,076 | ||||||
DBUBS Mortgage Trust, Ser 2011-LC1A, Cl A1 | ||||||||
3.742%, 11/10/2046 (D) | 357 | 376 | ||||||
DBUBS Mortgage Trust, Ser 2011-LC1A, Cl A3 | ||||||||
5.002%, 11/10/2046 (D) | 599 | 663 | ||||||
DBUBS Mortgage Trust, Ser 2011-LC2A, Cl A4 | ||||||||
4.537%, 07/10/2044 (D) | 568 | 611 | ||||||
DBUBS Mortgage Trust, Ser 2011-LC3A, Cl XA, IO | ||||||||
1.584%, 08/10/2044 (C) (D) | 2,860 | 106 | ||||||
| Description | Face Amount ($ Thousands) | Market Value ($ Thousands) | ||||||
Deutsche Mortgage Securities Mortgage Loan Trust, Ser 2004-4, Cl 7AR2 | ||||||||
0.634%, 06/20/2034 (C) | $ | 495 | $ | 446 | ||||
Developers Diversified Realty, Ser 2009-DDR1, Cl A | ||||||||
3.807%, 10/14/2022 (D) | 728 | 745 | ||||||
Downey Savings & Loan Association Mortgage Loan Trust, Ser 2004-AR2, Cl A2B | ||||||||
0.581%, 11/19/2044 (C) | 1,630 | 1,038 | ||||||
Extended Stay America Trust, Ser 2013-ESH7, Cl A27 | ||||||||
2.958%, 12/05/2031 (D) | 230 | �� | 225 | |||||
Fund America Investors II, Ser 1993-A, Cl A2 | ||||||||
3.470%, 06/25/2023 (C) | 71 | 72 | ||||||
GE Capital Assurance, Ser 2003-1, Cl A4 | ||||||||
5.254%, 05/12/2035 (C) (D) | 1,407 | 1,465 | ||||||
GMAC Commercial Mortgage Securities, Ser 2003-C3, Cl A4 | ||||||||
5.023%, 04/10/2040 | 29 | 29 | ||||||
GS Mortgage Securities II, Ser 2005-GG4, Cl A4A | ||||||||
4.751%, 07/10/2039 | 666 | 695 | ||||||
GS Mortgage Securities Trust, Ser 2011-GC5, Cl A4 | ||||||||
3.707%, 08/10/2044 | 4,535 | 4,681 | ||||||
GS Mortgage Securities Trust, Ser 2011-GC5, Cl XA, IO | ||||||||
1.902%, 08/10/2044 (C) (D) | 1,208 | 91 | ||||||
GS Mortgage Securities Trust, Ser 2013-GC13, Cl A5 | ||||||||
4.176%, 07/10/2046 (C) | 180 | 186 | ||||||
GS Mortgage Securities Trust, Ser 2013-GC14, Cl A5 | ||||||||
4.243%, 08/10/2046 | 90 | 93 | ||||||
GS Mortgage Securities, Ser 2011-GC3, Cl A4 | ||||||||
4.753%, 03/10/2044 (D) | 369 | 404 | ||||||
GSMPS Mortgage Loan Trust, Ser 1998-1, Cl A | ||||||||
8.000%, 09/19/2027 (C) (D) | 43 | 44 | ||||||
GSR Mortgage Loan Trust, Ser 2003-13, Cl 1A1 | ||||||||
3.020%, 10/25/2033 (C) | 684 | 689 | ||||||
GSR Mortgage Loan Trust, Ser 2005-AR4, Cl 3A5 | ||||||||
2.645%, 07/25/2035 (C) | 7,000 | 6,406 | ||||||
HarborView Mortgage Loan, Ser 2004-3, Cl 1A | ||||||||
2.864%, 05/19/2034 (C) | 3,098 | 3,034 | ||||||
| SEI Institutional Managed Trust / Annual Report / September 30, 2013 | 85 |
SCHEDULE OF INVESTMENTS
Core Fixed Income Fund (Continued)
September 30, 2013
| Description | Face Amount ($ Thousands) | Market Value ($ Thousands) | ||||||
Impac Secured Assets Trust, Ser 2006-2, Cl 2A1 | ||||||||
0.529%, 08/25/2036 (C) | $ | 368 | $ | 354 | ||||
Impact Funding Affordable Multifamily Housing Mortgage Loan Trust, Ser 2010-1, Cl A1 | ||||||||
5.314%, 01/25/2051 (D) | 1,703 | 1,912 | ||||||
JPMBB Commercial Mortgage Securities Trust, Ser 2013-C12, Cl A1 | ||||||||
1.085%, 07/15/2045 | 478 | 476 | ||||||
JPMBB Commercial Mortgage Securities Trust, Ser 2013-C14, Cl A2 | ||||||||
3.019%, 08/15/2046 | 905 | 934 | ||||||
JPMBB Commercial Mortgage Securities Trust, Ser 2013-C14, Cl ASB | ||||||||
3.761%, 08/15/2046 (C) | 648 | 670 | ||||||
JPMorgan Chase Commercial Mortgage Securities Trust, Ser 2006-LDP8, Cl AM | ||||||||
5.440%, 05/15/2045 | 343 | 376 | ||||||
JPMorgan Chase Commercial Mortgage Securities Trust, Ser 2006-LDP9, Cl A2 | ||||||||
5.134%, 05/15/2047 | 137 | 140 | ||||||
JPMorgan Chase Commercial Mortgage Securities Trust, Ser 2007-CB20, Cl AM | ||||||||
6.078%, 02/12/2051 (C) | 500 | 563 | ||||||
JPMorgan Chase Commercial Mortgage Securities Trust, Ser 2010-CNTR, Cl A1 | ||||||||
3.300%, 08/05/2032 (D) | 301 | 315 | ||||||
JPMorgan Chase Commercial Mortgage Securities Trust, Ser 2011-C4, Cl A4 | ||||||||
4.388%, 07/15/2046 (D) | 564 | 600 | ||||||
JPMorgan Chase Commercial Mortgage Securities Trust, Ser 2012-C8, Cl ASB | ||||||||
2.379%, 10/15/2045 | 451 | 436 | ||||||
JPMorgan Chase Commercial Mortgage Securities, Ser 2004-LN2, Cl A2 | ||||||||
5.115%, 07/15/2041 | 1,455 | 1,487 | ||||||
JPMorgan Chase Commercial Mortgage Securities, Ser 2005-LDP2, Cl A3A | ||||||||
4.678%, 07/15/2042 | 70 | 71 | ||||||
JPMorgan Chase Commercial Mortgage Securities, Ser 2005-LDP4, Cl A4 | ||||||||
4.918%, 10/15/2042 (C) | 1,109 | 1,175 | ||||||
| Description | Face Amount ($ Thousands) | Market Value ($ Thousands) | ||||||
JPMorgan Chase Commercial Mortgage Securities, Ser 2006-CB14, Cl A4 | ||||||||
5.481%, 12/12/2044 (C) | $ | 544 | $ | 585 | ||||
JPMorgan Chase Commercial Mortgage Securities, Ser 2006-CB17, Cl A4 | ||||||||
5.429%, 12/12/2043 | 1,448 | 1,580 | ||||||
JPMorgan Chase Commercial Mortgage Securities, Ser 2007-CB18, Cl A4 | ||||||||
5.716%, 02/15/2051 | 460 | 511 | ||||||
JPMorgan Chase Commercial Mortgage Securities, Ser 2010-C2, Cl A3 | ||||||||
4.070%, 11/15/2043 (D) | 434 | 456 | ||||||
JPMorgan Chase Commercial Mortgage Securities, Ser 2010-CNTR, Cl A2 | ||||||||
4.311%, 08/05/2032 (D) | 494 | 520 | ||||||
JPMorgan Chase Commercial Mortgage Securities, Ser 2013-C13, Cl A1 | ||||||||
1.303%, 01/15/2046 | 216 | 216 | ||||||
JPMorgan Chase Commercial Mortgage Securities, Ser 2013-C13, Cl A2 | ||||||||
2.665%, 01/15/2046 | 777 | 794 | ||||||
JPMorgan Chase Commercial Mortgage Securities, Ser 2013-C13, Cl ASB | ||||||||
3.414%, 01/15/2046 | 169 | 171 | ||||||
JPMorgan Chase Commercial Mortgage Securities, Ser 2013-LC11, Cl ASB | ||||||||
2.554%, 04/15/2046 | 813 | 784 | ||||||
LB Commercial Conduit Mortgage Trust, Ser 2007-C3, Cl A3 | ||||||||
6.071%, 07/15/2044 (C) | 303 | 309 | ||||||
LB Commercial Mortgage Trust, Ser 2007-C3, Cl AM | ||||||||
6.081%, 06/15/2017 (C) | 170 | 189 | ||||||
LB-UBS Commercial Mortgage Trust, Ser 2004-C7, Cl A5 | ||||||||
4.628%, 10/15/2029 | 24 | 25 | ||||||
LB-UBS Commercial Mortgage Trust, Ser 2004-C8, Cl A6 | ||||||||
4.799%, 12/15/2029 (C) | 106 | 109 | ||||||
LB-UBS Commercial Mortgage Trust, Ser 2007-C7, Cl AM | ||||||||
6.425%, 09/15/2045 (C) | 200 | 226 | ||||||
MASTR Reperforming Loan Trust, Ser 2005-1, Cl 1A1 | ||||||||
6.000%, 08/25/2034 (D) | 2,360 | 2,428 | ||||||
| 86 | SEI Institutional Managed Trust / Annual Report / September 30, 2013 |
| Description | Face Amount ($ Thousands) | Market Value ($ Thousands) | ||||||
Merrill Lynch Commercial Mortgage Ser 2006-4, Cl AM | ||||||||
5.204%, 12/12/2049 (C) | $ | 150 | $ | 163 | ||||
Merrill Lynch Mortgage Investors Trust, Ser 2004-A1, Cl 4A | ||||||||
5.103%, 02/25/2034 (C) | 943 | 952 | ||||||
Merrill Lynch Mortgage Investors Trust, Ser 2004-B, Cl A3 | ||||||||
2.078%, 05/25/2029 (C) | 670 | 673 | ||||||
Merrill Lynch Mortgage Trust, Ser 2005-CIP1, Cl A3A | ||||||||
4.949%, 07/12/2038 (C) | 371 | 382 | ||||||
Merrill Lynch Mortgage Trust, Ser 2007-C1, Cl A4 | ||||||||
6.045%, 06/12/2050 (C) | 100 | 112 | ||||||
Morgan Stanley Bank of America Merrill Lynch Trust, Ser 2012-C5, Cl A3 | ||||||||
2.825%, 08/15/2045 | 460 | 455 | ||||||
Morgan Stanley Bank of America Merrill Lynch Trust, Ser 2012-C5, Cl XA, IO | ||||||||
2.052%, 08/15/2045 (C) (D) | 2,141 | 211 | ||||||
Morgan Stanley Bank of America Merrill Lynch Trust, Ser 2012-C6, Cl A3 | ||||||||
2.506%, 11/15/2045 | 1,191 | 1,156 | ||||||
Morgan Stanley Bank of America Merrill Lynch Trust, Ser 2013-C10, Cl A1 | ||||||||
1.394%, 07/15/2046 | 983 | 986 | ||||||
Morgan Stanley Bank of America Merrill Lynch Trust, Ser 2013-C10, Cl ASB | ||||||||
3.912%, 07/15/2046 (C) | 130 | 136 | ||||||
Morgan Stanley Bank of America Merrill Lynch Trust, Ser 2013-C11, Cl A2 | ||||||||
3.085%, 08/15/2046 | 1,308 | 1,358 | ||||||
Morgan Stanley Bank of America Merrill Lynch Trust, Ser 2013-C7, Cl A4 | ||||||||
2.943%, 02/15/2046 | 270 | 255 | ||||||
Morgan Stanley Bank of America Merrill Lynch Trust, Ser 2013-C7, Cl AAB | ||||||||
2.469%, 02/15/2046 | 394 | 379 | ||||||
Morgan Stanley Bank of America Merrill Lynch Trust, Ser 2013-C7, Cl AS | ||||||||
3.446%, 02/15/2046 | 293 | 275 | ||||||
Morgan Stanley Bank of America Merrill Lynch Trust, Ser 2013-C9, Cl AS | ||||||||
3.456%, 05/15/2046 | 250 | 238 | ||||||
| Description | Face Amount ($ Thousands) | Market Value ($ Thousands) | ||||||
Morgan Stanley Capital I Trust, Ser 2011-C2, Cl A4 | ||||||||
4.661%, 06/15/2044 (D) | $ | 395 | $ | 430 | ||||
Morgan Stanley Capital I, Ser 2003-IQ6, Cl A4 | ||||||||
4.970%, 12/15/2041 | 112 | 112 | ||||||
Morgan Stanley Capital I, Ser 2004-HQ4, Cl A7 | ||||||||
4.970%, 04/14/2040 | 435 | 445 | ||||||
Morgan Stanley Capital I, Ser 2005-HQ5, Cl AAB | ||||||||
5.037%, 01/14/2042 | 31 | 31 | ||||||
Morgan Stanley Capital I, Ser 2005-HQ7, Cl AAB | ||||||||
5.355%, 11/14/2042 (C) | 19 | 19 | ||||||
Morgan Stanley Capital I, Ser 2005-T19, Cl A4A | ||||||||
4.890%, 06/12/2047 | 3,230 | 3,413 | ||||||
Morgan Stanley Capital I, Ser 2007-IQ14, Cl A4 | ||||||||
5.692%, 04/15/2049 (C) | 1,600 | 1,778 | ||||||
Morgan Stanley Capital I, Ser 2011-C3, Cl A2 | ||||||||
3.224%, 07/15/2049 | 765 | 800 | ||||||
Morgan Stanley Capital I, Ser 2011-C3, Cl A4 | ||||||||
4.118%, 07/15/2049 | 450 | 472 | ||||||
Morgan Stanley Mortgage Loan Trust, Ser 2007-6XS, Cl 2A1S | ||||||||
0.289%, 02/25/2047 (C) | 67 | 59 | ||||||
Motel 6 Trust, | ||||||||
1.948%, 10/05/2025 (D) | 1,105 | 1,084 | ||||||
Residential Asset Mortgage Products, Ser 2004-SL1, Cl A8 | ||||||||
6.500%, 11/25/2031 | 232 | 239 | ||||||
Residential Asset Securitization Trust, Ser 2004-A6, Cl A1 | ||||||||
5.000%, 08/25/2019 | 225 | 231 | ||||||
Residential Asset Securitization Trust, Ser 2004-IP2, Cl 2A1 | ||||||||
2.646%, 12/25/2034 (C) | 656 | 657 | ||||||
Sequoia Mortgage Trust, Ser 2010-H1, Cl A1 | ||||||||
3.750%, 02/25/2040 (C) | 32 | 31 | ||||||
Sequoia Mortgage Trust, Ser 2011-1, Cl A1 | ||||||||
4.125%, 02/25/2041 (C) | 44 | 44 | ||||||
Structured Adjustable Rate Mortgage Loan Trust, Ser 2004-10, Cl 2A | ||||||||
2.426%, 08/25/2034 (C) | 1,267 | 1,214 | ||||||
| SEI Institutional Managed Trust / Annual Report / September 30, 2013 | 87 |
SCHEDULE OF INVESTMENTS
Core Fixed Income Fund (Continued)
September 30, 2013
| Description | Face Amount ($ Thousands) | Market Value ($ Thousands) | ||||||
Structured Adjustable Rate Mortgage Loan Trust, Ser 2007-7, Cl 2AS2 | ||||||||
2.825%, 08/25/2015 (C) | $ | 5,367 | $ | 4,050 | ||||
Structured Asset Securities, Ser 2005-17, Cl 5A1 | ||||||||
5.500%, 10/25/2035 | 1,835 | 1,711 | ||||||
UBS-Barclays Commercial Mortgage Trust, Ser 2012-C3, Cl A3 | ||||||||
2.728%, 08/10/2049 | 555 | 547 | ||||||
UBS-Barclays Commercial Mortgage Trust, Ser 2012-C4, Cl AS | ||||||||
3.317%, 12/10/2045 (D) | 250 | 235 | ||||||
UBS-Barclays Commercial Mortgage Trust, Ser 2013-C6, Cl ASB | ||||||||
2.788%, 04/10/2046 | 1,051 | 1,031 | ||||||
VNO Mortgage Trust, | ||||||||
2.996%, 11/15/2030 (D) | 110 | 104 | ||||||
Wachovia Bank Commercial Mortgage Trust, Ser 2007-C30, Cl AM | ||||||||
5.383%, 12/15/2043 | 260 | 277 | ||||||
Wachovia Commercial Mortgage Securities Pass-Through Certificates, Ser 2003-C9, Cl A4 | ||||||||
5.012%, 12/15/2035 (C) | 282 | 283 | ||||||
WaMu Mortgage Pass-Through Certificates Trust, Ser 2005-AR13, Cl A1A1 | ||||||||
0.469%, 10/25/2047 (C) | 2,779 | 2,539 | ||||||
WaMu Mortgage Pass-Through Certificates Trust, Ser 2005-AR5, Cl A6 | ||||||||
2.413%, 05/25/2035 (C) | 9,220 | 8,643 | ||||||
WaMu Mortgage Pass-Through Certificates Trust, Ser 2006-AR13, Cl 1A | ||||||||
1.039%, 10/25/2046 (C) | 2,726 | 2,133 | ||||||
WaMu Mortgage Pass-Through Certificates Trust, Ser 2007-OA1, Cl A1A | ||||||||
0.859%, 02/25/2047 (C) | 4,121 | 3,240 | ||||||
WaMu Mortgage Pass-Through Certificates Trust, Ser 2007-OA2, Cl 1A | ||||||||
0.859%, 03/25/2047 (C) | 1,576 | 1,182 | ||||||
Washington Mutual MSC Mortgage Pass-Through Certificates, Ser 2003-MS1, Cl 1A | ||||||||
5.000%, 02/25/2018 | 177 | 179 | ||||||
| Description | Face Amount ($ Thousands) | Market Value ($ Thousands) | ||||||
Wells Fargo Commercial Mortgage Trust, Ser 2013-LC12, Cl A4 | ||||||||
4.218%, 07/15/2046 (C) | $ | 130 | $ | 135 | ||||
Wells Fargo Mortgage-Backed Securities Trust, Ser 2004-H, Cl 1A1 | ||||||||
2.617%, 06/25/2034 (C) | 1,426 | 1,446 | ||||||
WFRBS Commercial Mortgage Trust, Ser 2011-C2, Cl XA, IO | ||||||||
1.312%, 02/15/2044 (C) (D) | 3,507 | 144 | ||||||
WFRBS Commercial Mortgage Trust, Ser 2011-C5, Cl A4 | ||||||||
3.667%, 11/15/2044 | 3,125 | 3,178 | ||||||
WFRBS Commercial Mortgage Trust, Ser 2012-C7, Cl XA, IO | ||||||||
1.752%, 06/15/2045 (C) (D) | 331 | 33 | ||||||
WFRBS Commercial Mortgage Trust, Ser 2012-C8, Cl A3 | ||||||||
3.001%, 08/15/2045 | 1,685 | 1,612 | ||||||
|
| |||||||
| 145,037 | ||||||||
|
| |||||||
Total Mortgage-Backed Securities |
| 776,221 | ||||||
|
| |||||||
CORPORATE OBLIGATIONS — 29.7% |
| |||||||
Consumer Discretionary — 1.8% |
| |||||||
CCO Holdings LLC | ||||||||
6.625%, 01/31/2022 | 480 | 487 | ||||||
5.250%, 09/30/2022 (E) | 700 | 647 | ||||||
CityCenter Holdings LLC | ||||||||
7.625%, 01/15/2016 | 160 | 168 | ||||||
Comcast | ||||||||
6.500%, 01/15/2015 | 885 | 951 | ||||||
6.500%, 01/15/2017 | 2,385 | 2,769 | ||||||
5.300%, 01/15/2014 | 2,340 | 2,373 | ||||||
Comcast Cable Communications Holdings | ||||||||
9.455%, 11/15/2022 | 1,220 | 1,720 | ||||||
Daimler Finance North America LLC | ||||||||
6.500%, 11/15/2013 | 1,320 | 1,329 | ||||||
2.375%, 08/01/2018 (D) | 1,460 | 1,462 | ||||||
1.875%, 09/15/2014 (D) | 670 | 677 | ||||||
1.875%, 01/11/2018 (D) | 502 | 497 | ||||||
1.450%, 08/01/2016 (D) | 1,015 | 1,018 | ||||||
1.300%, 07/31/2015 (D) | 150 | 151 | ||||||
DIRECTV Holdings LLC | ||||||||
6.000%, 08/15/2040 | 950 | 901 | ||||||
3.800%, 03/15/2022 (E) | 215 | 201 | ||||||
DISH DBS | ||||||||
7.875%, 09/01/2019 (E) | 690 | 787 | ||||||
Echostar DBS | ||||||||
7.750%, 05/31/2015 | 30 | 33 | ||||||
| 88 | SEI Institutional Managed Trust / Annual Report / September 30, 2013 |
| Description | Face Amount ($ Thousands) | Market Value ($ Thousands) | ||||||
ERAC USA Finance LLC (D) | ||||||||
5.625%, 03/15/2042 | $ | 399 | $ | 405 | ||||
3.300%, 10/15/2022 | 183 | 174 | ||||||
General Motors (D) | ||||||||
6.250%, 10/02/2043 | 200 | 197 | ||||||
4.875%, 10/02/2023 | 200 | 195 | ||||||
3.500%, 10/02/2018 | 1,005 | 1,004 | ||||||
Hilton Worldwide Finance LLC | ||||||||
5.625%, 10/15/2021 (D) | 920 | 925 | ||||||
Home Depot | ||||||||
3.750%, 02/15/2024 | 855 | 866 | ||||||
LVMH Moet Hennessy Louis Vuitton | ||||||||
1.625%, 06/29/2017 (D) | 864 | 862 | ||||||
Michaels Stores | ||||||||
7.750%, 11/01/2018 | 190 | 204 | ||||||
NBCUniversal Enterprise | ||||||||
1.974%, 04/15/2019 (D) | 575 | 560 | ||||||
NBCUniversal Media LLC | ||||||||
4.450%, 01/15/2043 | 132 | 122 | ||||||
News America | ||||||||
6.650%, 11/15/2037 | 180 | 205 | ||||||
6.200%, 12/15/2034 | 65 | 70 | ||||||
6.150%, 03/01/2037 | 875 | 952 | ||||||
Pearson Funding Four PLC | ||||||||
3.750%, 05/08/2022 (D) | 326 | 315 | ||||||
Reynolds Group Issuer | ||||||||
7.125%, 04/15/2019 | 1,290 | 1,371 | ||||||
6.875%, 02/15/2021 | 180 | 192 | ||||||
Taylor Morrison Communities (D) | ||||||||
7.750%, 04/15/2020 | 160 | 175 | ||||||
5.250%, 04/15/2021 | 420 | 392 | ||||||
Time Warner | ||||||||
7.700%, 05/01/2032 | 90 | 113 | ||||||
6.250%, 03/29/2041 | 525 | 577 | ||||||
4.750%, 03/29/2021 | 730 | 782 | ||||||
Time Warner Cable | ||||||||
8.250%, 04/01/2019 (E) | 2,265 | 2,622 | ||||||
6.550%, 05/01/2037 | 1,645 | 1,514 | ||||||
5.875%, 11/15/2040 | 310 | 264 | ||||||
5.500%, 09/01/2041 | 325 | 266 | ||||||
United Business Media | ||||||||
5.750%, 11/03/2020 (D) | 550 | 562 | ||||||
Univision Communications | ||||||||
5.125%, 05/15/2023 (D) (E) | 310 | 297 | ||||||
Viacom | ||||||||
5.850%, 09/01/2043 | 580 | 590 | ||||||
4.250%, 09/01/2023 | 1,375 | 1,368 | ||||||
2.500%, 09/01/2018 | 290 | 289 | ||||||
WPP Finance UK | ||||||||
8.000%, 09/15/2014 | 240 | 256 | ||||||
|
| |||||||
| 34,857 | ||||||||
|
| |||||||
| Description | Face Amount ($ Thousands) | Market Value ($ Thousands) | ||||||
Consumer Staples — 1.6% | ||||||||
Altria Group | ||||||||
9.250%, 08/06/2019 | $ | 1,250 | $ | 1,651 | ||||
4.750%, 05/05/2021 | 720 | 764 | ||||||
2.850%, 08/09/2022 | 830 | 760 | ||||||
Anheuser-Busch InBev Worldwide | ||||||||
7.750%, 01/15/2019 | 2,925 | 3,681 | ||||||
5.375%, 01/15/2020 | 1,360 | 1,563 | ||||||
5.000%, 04/15/2020 | 560 | 633 | ||||||
2.500%, 07/15/2022 | 330 | 305 | ||||||
Anheuser-Busch LLC | ||||||||
5.050%, 10/15/2016 | 940 | 1,048 | ||||||
ConAgra Foods | ||||||||
1.900%, 01/25/2018 | 480 | 474 | ||||||
1.300%, 01/25/2016 | 400 | 400 | ||||||
Diageo Capital PLC | ||||||||
4.828%, 07/15/2020 | 1,580 | 1,771 | ||||||
1.125%, 04/29/2018 | 2,215 | 2,139 | ||||||
Diageo Investment | ||||||||
2.875%, 05/11/2022 | 190 | 183 | ||||||
Fomento Economico Mexicano | ||||||||
4.375%, 05/10/2043 | 220 | 181 | ||||||
2.875%, 05/10/2023 | 210 | 187 | ||||||
Hawk Acquisition Sub | ||||||||
4.250%, 10/15/2020 (D) | 440 | 420 | ||||||
Heineken | ||||||||
1.400%, 10/01/2017 (D) | 655 | 644 | ||||||
Japan Tobacco | ||||||||
2.100%, 07/23/2018 (D) | 380 | 380 | ||||||
Kraft Foods Group | ||||||||
6.500%, 02/09/2040 | 390 | 458 | ||||||
5.375%, 02/10/2020 | 455 | 518 | ||||||
3.500%, 06/06/2022 | 1,895 | 1,872 | ||||||
Kroger | ||||||||
5.150%, 08/01/2043 | 155 | 151 | ||||||
3.850%, 08/01/2023 | 210 | 207 | ||||||
Lorillard Tobacco | ||||||||
8.125%, 06/23/2019 | 20 | 24 | ||||||
Molson Coors Brewing | ||||||||
3.500%, 05/01/2022 | 100 | 99 | ||||||
Mondelez International | ||||||||
6.500%, 02/09/2040 | 655 | 769 | ||||||
5.375%, 02/10/2020 (E) | 925 | 1,044 | ||||||
PepsiCo | ||||||||
2.750%, 03/05/2022 | 735 | 700 | ||||||
2.250%, 01/07/2019 | 885 | 887 | ||||||
0.700%, 08/13/2015 | 1,090 | 1,092 | ||||||
Pernod-Ricard (D) | ||||||||
5.750%, 04/07/2021 | 454 | 506 | ||||||
4.450%, 01/15/2022 | 1,050 | 1,078 | ||||||
4.250%, 07/15/2022 | 260 | 263 | ||||||
2.950%, 01/15/2017 | 360 | 373 | ||||||
Philip Morris International | ||||||||
4.500%, 03/20/2042 (E) | 530 | 496 | ||||||
| SEI Institutional Managed Trust / Annual Report / September 30, 2013 | 89 |
SCHEDULE OF INVESTMENTS
Core Fixed Income Fund (Continued)
September 30, 2013
| Description | Face Amount ($ Thousands) | Market Value ($ Thousands) | ||||||
2.900%, 11/15/2021 | $ | 1,030 | $ | 998 | ||||
2.500%, 08/22/2022 | 460 | 423 | ||||||
Reynolds American | ||||||||
6.750%, 06/15/2017 | 1,260 | 1,456 | ||||||
3.250%, 11/01/2022 | 340 | 313 | ||||||
Tyson Foods | ||||||||
4.500%, 06/15/2022 | 545 | 566 | ||||||
|
| |||||||
| 31,477 | ||||||||
|
| |||||||
Energy — 3.9% | ||||||||
Access Midstream Partners | ||||||||
6.125%, 07/15/2022 (E) | 680 | 699 | ||||||
4.875%, 05/15/2023 | 60 | 56 | ||||||
Anadarko Finance, Ser B | ||||||||
7.500%, 05/01/2031 (E) | 910 | 1,134 | ||||||
Arch Coal | ||||||||
7.000%, 06/15/2019 (E) | 920 | 713 | ||||||
Atwood Oceanics | ||||||||
6.500%, 02/01/2020 | 220 | 231 | ||||||
Baker Hughes | ||||||||
7.500%, 11/15/2018 | 1,230 | 1,543 | ||||||
BG Energy Capital PLC | ||||||||
4.000%, 10/15/2021 (D) | 910 | 937 | ||||||
BP Capital Markets PLC | ||||||||
5.250%, 11/07/2013 | 1,790 | 1,798 | ||||||
3.875%, 03/10/2015 | 210 | 220 | ||||||
3.561%, 11/01/2021 | 100 | 99 | ||||||
3.245%, 05/06/2022 (E) | 180 | 174 | ||||||
2.750%, 05/10/2023 | 210 | 192 | ||||||
Canadian Oil Sands Ltd. (D) | ||||||||
6.000%, 04/01/2042 | 433 | 444 | ||||||
4.500%, 04/01/2022 | 314 | 316 | ||||||
CGG | ||||||||
7.750%, 05/15/2017 | 110 | 113 | ||||||
Chesapeake Energy | ||||||||
6.875%, 11/15/2020 | 450 | 486 | ||||||
6.500%, 08/15/2017 (E) | 275 | 303 | ||||||
Chevron | ||||||||
3.191%, 06/24/2023 | 260 | 255 | ||||||
1.718%, 06/24/2018 | 1,490 | 1,485 | ||||||
CNOOC Finance | ||||||||
3.000%, 05/09/2023 | 270 | 243 | ||||||
1.750%, 05/09/2018 | 370 | 358 | ||||||
Concho Resources | ||||||||
5.500%, 10/01/2022 | 560 | 559 | ||||||
5.500%, 04/01/2023 | 80 | 79 | ||||||
Conoco Funding | ||||||||
7.250%, 10/15/2031 | 50 | 66 | ||||||
ConocoPhillips | ||||||||
5.900%, 10/15/2032 | 10 | 12 | ||||||
5.900%, 05/15/2038 | 790 | 926 | ||||||
Consol Energy | ||||||||
8.250%, 04/01/2020 | 660 | 708 | ||||||
| Description | Face Amount ($ Thousands) | Market Value ($ Thousands) | ||||||
Continental Resources | ||||||||
5.000%, 09/15/2022 | $ | 90 | $ | 91 | ||||
4.500%, 04/15/2023 | 80 | 78 | ||||||
DCP Midstream Operating | ||||||||
4.950%, 04/01/2022 | 517 | 515 | ||||||
Devon Energy | ||||||||
5.600%, 07/15/2041 (E) | 1,325 | 1,354 | ||||||
3.250%, 05/15/2022 | 530 | 507 | ||||||
Devon Financing LLC | ||||||||
7.875%, 09/30/2031 | 260 | 335 | ||||||
Ecopetrol | ||||||||
7.375%, 09/18/2043 | 440 | 476 | ||||||
4.250%, 09/18/2018 | 210 | 216 | ||||||
El Paso LLC | ||||||||
6.950%, 06/01/2028 | 6,750 | 6,186 | ||||||
El Paso Pipeline Partners Operating LLC | ||||||||
4.100%, 11/15/2015 | 595 | 630 | ||||||
Encana | ||||||||
6.500%, 02/01/2038 | 360 | 394 | ||||||
Energen | ||||||||
4.625%, 09/01/2021 | 567 | 562 | ||||||
Energy Transfer Equity | ||||||||
7.500%, 10/15/2020 | 220 | 235 | ||||||
Energy Transfer Partners | ||||||||
8.250%, 11/15/2029 (D) | 1,315 | 1,592 | ||||||
6.500%, 02/01/2042 | 212 | 224 | ||||||
5.950%, 10/01/2043 | 340 | 338 | ||||||
5.150%, 02/01/2043 | 145 | 130 | ||||||
Enterprise Products Operating LLC | ||||||||
9.750%, 01/31/2014 | 1,910 | 1,965 | ||||||
6.125%, 10/15/2039 | 50 | 55 | ||||||
5.950%, 02/01/2041 | 120 | 129 | ||||||
4.850%, 03/15/2044 | 10 | 9 | ||||||
3.350%, 03/15/2023 | 580 | 549 | ||||||
Halliburton | ||||||||
3.500%, 08/01/2023 | 435 | 431 | ||||||
2.000%, 08/01/2018 | 720 | 719 | ||||||
Hess | ||||||||
7.875%, 10/01/2029 | 1,070 | 1,342 | ||||||
7.300%, 08/15/2031 | 10 | 12 | ||||||
5.600%, 02/15/2041 (E) | 135 | 139 | ||||||
Husky Energy | ||||||||
7.250%, 12/15/2019 | 309 | 378 | ||||||
Kerr-McGee | ||||||||
7.875%, 09/15/2031 | 670 | 845 | ||||||
6.950%, 07/01/2024 | 1,500 | 1,756 | ||||||
Key Energy Services | ||||||||
6.750%, 03/01/2021 (E) | 1,290 | 1,277 | ||||||
Kinder Morgan Energy Partners | ||||||||
5.000%, 12/15/2013 | 720 | 726 | ||||||
5.000%, 03/01/2043 (E) | 470 | 425 | ||||||
MarkWest Energy Partners | ||||||||
6.250%, 06/15/2022 | 128 | 135 | ||||||
| 90 | SEI Institutional Managed Trust / Annual Report / September 30, 2013 |
| Description | Face Amount ($ Thousands) | Market Value ($ Thousands) | ||||||
5.500%, 02/15/2023 | $ | 320 | $ | 321 | ||||
Murphy Oil | ||||||||
3.700%, 12/01/2022 | 675 | 629 | ||||||
Noble Energy | ||||||||
4.150%, 12/15/2021 | 1,370 | 1,426 | ||||||
Occidental Petroleum | ||||||||
3.125%, 02/15/2022 | 750 | 724 | ||||||
2.700%, 02/15/2023 | 660 | 610 | ||||||
ONEOK Partners | ||||||||
6.200%, 09/15/2043 | 285 | 294 | ||||||
3.200%, 09/15/2018 | 390 | 397 | ||||||
2.000%, 10/01/2017 | 440 | 437 | ||||||
Panhandle Eastern Pipeline | ||||||||
8.125%, 06/01/2019 | 2,500 | 3,033 | ||||||
Peabody Energy | ||||||||
6.500%, 09/15/2020 | 630 | 621 | ||||||
Pemex Project Funding Master Trust | ||||||||
6.625%, 06/15/2035 | 1,667 | 1,761 | ||||||
Petrobras Global Finance BV | ||||||||
3.000%, 01/15/2019 | 1,195 | 1,124 | ||||||
2.000%, 05/20/2016 | 550 | 546 | ||||||
1.884%, 05/20/2016 (C) | 2,700 | 2,687 | ||||||
Petrobras International Finance | ||||||||
6.125%, 10/06/2016 (E) | 655 | 715 | ||||||
5.750%, 01/20/2020 (E) | 574 | 596 | ||||||
5.375%, 01/27/2021 | 2,080 | 2,090 | ||||||
3.875%, 01/27/2016 | 600 | 619 | ||||||
Petro-Canada | ||||||||
6.800%, 05/15/2038 | 1,665 | 1,980 | ||||||
Petroleos Mexicanos | ||||||||
5.500%, 06/27/2044 (E) | 375 | 340 | ||||||
4.875%, 01/18/2024 | 270 | 270 | ||||||
2.286%, 07/18/2018 (C) (E) | 270 | 278 | ||||||
Plains Exploration & Production | ||||||||
6.875%, 02/15/2023 | 40 | 43 | ||||||
6.500%, 11/15/2020 | 160 | 172 | ||||||
QEP Resources | ||||||||
6.875%, 03/01/2021 | 520 | 553 | ||||||
5.250%, 05/01/2023 | 290 | 270 | ||||||
Range Resources | ||||||||
5.000%, 08/15/2022 | 420 | 406 | ||||||
5.000%, 03/15/2023 | 330 | 317 | ||||||
Regency Energy Partners | ||||||||
4.500%, 11/01/2023 (D) (E) | 690 | 624 | ||||||
Rowan | ||||||||
5.400%, 12/01/2042 | 281 | 254 | ||||||
Schlumberger Investment | ||||||||
1.950%, 09/14/2016 (D) | 810 | 828 | ||||||
SESI LLC | ||||||||
7.125%, 12/15/2021 | 180 | 197 | ||||||
Shell International Finance | ||||||||
4.375%, 03/25/2020 | 1,700 | 1,874 | ||||||
3.400%, 08/12/2023 | 595 | 588 | ||||||
| Description | Face Amount ($ Thousands) | Market Value ($ Thousands) | ||||||
Sinopec Group Overseas Development | ||||||||
2.750%, 05/17/2017 (D) | $ | 490 | $ | 499 | ||||
Southern Natural Gas LLC | ||||||||
8.000%, 03/01/2032 | 170 | 220 | ||||||
Spectra Energy Partners | ||||||||
5.950%, 09/25/2043 | 185 | 195 | ||||||
2.950%, 09/25/2018 | 290 | 295 | ||||||
Talisman Energy | ||||||||
7.750%, 06/01/2019 | 387 | 469 | ||||||
TC Pipelines | ||||||||
4.650%, 06/15/2021 | 360 | 366 | ||||||
Tennessee Gas Pipeline LLC | ||||||||
8.375%, 06/15/2032 | 1,638 | 2,155 | ||||||
Total Capital Canada Ltd. | ||||||||
1.450%, 01/15/2018 | 950 | 937 | ||||||
Transocean | ||||||||
6.375%, 12/15/2021 | 906 | 1,007 | ||||||
5.050%, 12/15/2016 | 300 | 329 | ||||||
Weatherford International Ltd. | ||||||||
5.950%, 04/15/2042 | 125 | 120 | ||||||
4.500%, 04/15/2022 | 310 | 307 | ||||||
Western Gas Partners | ||||||||
5.375%, 06/01/2021 | 160 | 171 | ||||||
Williams | ||||||||
7.875%, 09/01/2021 | 588 | 701 | ||||||
7.750%, 06/15/2031 | 861 | 976 | ||||||
WPX Energy | ||||||||
6.000%, 01/15/2022 | 365 | 370 | ||||||
|
| |||||||
| 75,645 | ||||||||
|
| |||||||
Financials — 13.4% | ||||||||
Allstate | ||||||||
5.750%, 08/15/2053 (C) | 465 | 453 | ||||||
3.150%, 06/15/2023 | 555 | 537 | ||||||
Ally Financial | ||||||||
7.500%, 09/15/2020 | 1,410 | 1,585 | ||||||
American Express | ||||||||
6.800%, 09/01/2066 (C) (E) | 1,970 | 2,088 | ||||||
American Express Credit MTN | ||||||||
1.750%, 06/12/2015 | 1,216 | 1,238 | ||||||
American Honda Finance MTN (D) | ||||||||
3.875%, 09/21/2020 | 1,065 | 1,110 | ||||||
1.000%, 08/11/2015 | 1,010 | 1,015 | ||||||
American International Group | ||||||||
8.250%, 08/15/2018 | 450 | 561 | ||||||
6.400%, 12/15/2020 | 355 | 418 | ||||||
6.250%, 03/15/2037 | 1,670 | 1,637 | ||||||
5.850%, 01/16/2018 | 860 | 978 | ||||||
4.875%, 06/01/2022 | 230 | 247 | ||||||
4.125%, 02/15/2024 | 505 | 505 | ||||||
3.750%, 11/30/2013 (D) | 170 | 171 | ||||||
American Tower‡ | ||||||||
5.050%, 09/01/2020 | 384 | 398 | ||||||
| SEI Institutional Managed Trust / Annual Report / September 30, 2013 | 91 |
SCHEDULE OF INVESTMENTS
Core Fixed Income Fund (Continued)
September 30, 2013
| Description | Face Amount ($ Thousands) | Market Value ($ Thousands) | ||||||
4.500%, 01/15/2018 (E) | $ | 496 | $ | 524 | ||||
3.500%, 01/31/2023 | 472 | 414 | ||||||
ANZ National International | ||||||||
1.850%, 10/15/2015 (D) | 470 | 477 | ||||||
Assurant | ||||||||
2.500%, 03/15/2018 | 570 | 560 | ||||||
AvalonBay Communities‡ | ||||||||
3.625%, 10/01/2020 | 180 | 183 | ||||||
Banco Santander Mexico Institucion de Banca Multiple Grupo Financiero Santand | ||||||||
4.125%, 11/09/2022 (D) (E) | 665 | 610 | ||||||
Bank of America MTN | ||||||||
6.000%, 09/01/2017 | 655 | 742 | ||||||
5.750%, 12/01/2017 | 1,580 | 1,782 | ||||||
5.650%, 05/01/2018 | 270 | 305 | ||||||
5.625%, 10/14/2016 | 3,135 | 3,496 | ||||||
5.420%, 03/15/2017 | 4,400 | 4,828 | ||||||
5.000%, 05/13/2021 | 90 | 97 | ||||||
4.500%, 04/01/2015 | 180 | 189 | ||||||
4.100%, 07/24/2023 (E) | 1,345 | 1,337 | ||||||
3.875%, 03/22/2017 | 280 | 298 | ||||||
3.625%, 03/17/2016 | 2,275 | 2,393 | ||||||
2.000%, 01/11/2018 | 809 | 796 | ||||||
1.500%, 10/09/2015 | 1,911 | 1,921 | ||||||
Bank of Montreal MTN | ||||||||
2.375%, 01/25/2019 | 855 | 855 | ||||||
Bank of Nova Scotia | ||||||||
0.750%, 10/09/2015 | 146 | 146 | ||||||
Bank of Tokyo-Mitsubishi UFJ | ||||||||
3.850%, 01/22/2015 (D) | 350 | 363 | ||||||
Barclays Bank PLC MTN | ||||||||
6.050%, 12/04/2017 (D) | 420 | 467 | ||||||
BBVA US Senior SAU | ||||||||
4.664%, 10/09/2015 | 1,310 | 1,364 | ||||||
3.250%, 05/16/2014 | 1,220 | 1,234 | ||||||
Bear Stearns | ||||||||
6.400%, 10/02/2017 | 70 | 82 | ||||||
4.650%, 07/02/2018 | 995 | 1,091 | ||||||
Berkshire Hathaway | ||||||||
4.500%, 02/11/2043 (E) | 195 | 182 | ||||||
3.200%, 02/11/2015 | 950 | 985 | ||||||
Berkshire Hathaway Finance | ||||||||
5.400%, 05/15/2018 | 615 | 709 | ||||||
BNP Paribas MTN | ||||||||
2.700%, 08/20/2018 | 845 | 855 | ||||||
2.375%, 09/14/2017 | 570 | 578 | ||||||
Boeing Capital | ||||||||
4.700%, 10/27/2019 | 490 | 553 | ||||||
Boston Properties‡ | ||||||||
3.850%, 02/01/2023 | 75 | 73 | ||||||
3.800%, 02/01/2024 | 425 | 409 | ||||||
3.125%, 09/01/2023 | 280 | 256 | ||||||
| Description | Face Amount ($ Thousands) | Market Value ($ Thousands) | ||||||
Chase Capital VI | ||||||||
0.890%, 08/01/2028 (C) | $ | 1,750 | $ | 1,417 | ||||
CIT Group | ||||||||
5.000%, 08/01/2023 (E) | 580 | 562 | ||||||
Citigroup | ||||||||
6.875%, 03/05/2038 | 891 | 1,101 | ||||||
6.125%, 05/15/2018 | 3,970 | 4,592 | ||||||
6.000%, 12/13/2013 | 1,320 | 1,334 | ||||||
5.950%, 12/29/2049 (C) | 360 | 336 | ||||||
5.900%, 12/29/2049 (C) (E) | 220 | 206 | ||||||
5.875%, 01/30/2042 | 255 | 283 | ||||||
5.500%, 09/13/2025 | 620 | 638 | ||||||
5.350%, 05/29/2049 (C) | 390 | 339 | ||||||
5.000%, 09/15/2014 | 125 | 130 | ||||||
4.450%, 01/10/2017 | 816 | 883 | ||||||
4.050%, 07/30/2022 | 460 | 447 | ||||||
3.500%, 05/15/2023 | 890 | 803 | ||||||
2.650%, 03/02/2015 | 385 | 394 | ||||||
2.500%, 09/26/2018 | 1,190 | 1,183 | ||||||
1.700%, 07/25/2016 | 650 | 653 | ||||||
0.528%, 06/09/2016 (C) | 3,650 | 3,563 | ||||||
Citigroup Capital III | ||||||||
7.625%, 12/01/2036 | 1,500 | 1,665 | ||||||
CME Group | ||||||||
5.300%, 09/15/2043 | 565 | 583 | ||||||
Commonwealth Bank of Australia MTN (D) | ||||||||
5.000%, 10/15/2019 | 10 | 11 | ||||||
3.750%, 10/15/2014 | 1,060 | 1,094 | ||||||
Commonwealth Bank of Australia NY MTN | ||||||||
1.250%, 09/18/2015 | 1,200 | 1,212 | ||||||
Cooperatieve Centrale Raiffeisen-Boerenleenbank MTN | ||||||||
11.000%, 12/31/2049 (C) (D) | 1,050 | 1,365 | ||||||
3.875%, 02/08/2022 | 500 | 501 | ||||||
Countrywide Financial | ||||||||
6.250%, 05/15/2016 | 1,080 | 1,194 | ||||||
Credit Agricole | ||||||||
8.375%, 12/31/2049 (C) (D) (E) | 1,550 | 1,695 | ||||||
2.625%, 10/03/2018 (D) | 985 | 983 | ||||||
Credit Suisse MTN | ||||||||
5.400%, 01/14/2020 | 1,350 | 1,478 | ||||||
Credit Suisse New York | ||||||||
6.000%, 02/15/2018 (E) | 846 | 952 | ||||||
DDR‡ | ||||||||
4.625%, 07/15/2022 | 680 | 692 | ||||||
3.375%, 05/15/2023 | 645 | 588 | ||||||
Discover Bank | ||||||||
4.200%, 08/08/2023 | 410 | 409 | ||||||
Equity One‡ | ||||||||
3.750%, 11/15/2022 | 238 | 224 | ||||||
Farmer Mac Guaranteed Notes Trust | ||||||||
5.125%, 04/19/2017 (D) | 3,540 | 4,034 | ||||||
| 92 | SEI Institutional Managed Trust / Annual Report / September 30, 2013 |
| Description | Face Amount ($ Thousands) | Market Value ($ Thousands) | ||||||
Farmers Exchange Capital | ||||||||
7.050%, 07/15/2028 (D) | $ | 634 | $ | 764 | ||||
Farmers Insurance Exchange | ||||||||
8.625%, 05/01/2024 (D) | 3,017 | 3,873 | ||||||
FDIC Structured Sale Guaranteed Notes, Ser A-3 | ||||||||
1.450%, 10/25/2013 (D) (F) | 470 | 470 | ||||||
Federal Realty Investment Trust‡ | ||||||||
3.000%, 08/01/2022 | 275 | 255 | ||||||
First Industrial MTN | ||||||||
7.500%, 12/01/2017 | 970 | 1,084 | ||||||
Ford Motor | ||||||||
4.750%, 01/15/2043 | 960 | 857 | ||||||
Ford Motor Credit LLC | ||||||||
8.125%, 01/15/2020 | 1,310 | 1,629 | ||||||
5.875%, 08/02/2021 | 1,433 | 1,593 | ||||||
5.750%, 02/01/2021 | 220 | 243 | ||||||
1.700%, 05/09/2016 | 2,000 | 2,000 | ||||||
General Electric Capital MTN | ||||||||
6.875%, 01/10/2039 | 430 | 527 | ||||||
6.375%, 11/15/2019 (C) | 5,870 | 6,266 | ||||||
5.875%, 01/14/2038 | 2,010 | 2,219 | ||||||
5.625%, 05/01/2018 | 480 | 551 | ||||||
5.550%, 05/04/2020 | 2,975 | 3,371 | ||||||
4.375%, 09/16/2020 | 2,460 | 2,617 | ||||||
3.100%, 01/09/2023 | 790 | 739 | ||||||
2.300%, 04/27/2017 | 750 | 769 | ||||||
1.625%, 07/02/2015 | 410 | 416 | ||||||
0.744%, 08/15/2036 (C) | 2,000 | 1,603 | ||||||
0.646%, 05/05/2026 (C) | 1,950 | 1,794 | ||||||
0.394%, 03/20/2014 (C) | 1,900 | 1,899 | ||||||
General Motors Financial (D) | ||||||||
4.250%, 05/15/2023 (E) | 180 | 165 | ||||||
3.250%, 05/15/2018 | 150 | 146 | ||||||
2.750%, 05/15/2016 | 200 | 199 | ||||||
Goldman Sachs Capital II | ||||||||
4.000%, 06/01/2043 (C) | 200 | 146 | ||||||
Goldman Sachs Group | ||||||||
7.500%, 02/15/2019 | 950 | 1,148 | ||||||
6.750%, 10/01/2037 | 248 | 259 | ||||||
6.250%, 02/01/2041 (E) | 2,325 | 2,605 | ||||||
6.150%, 04/01/2018 | 1,780 | 2,036 | ||||||
6.000%, 05/01/2014 | 180 | 186 | ||||||
5.950%, 01/18/2018 | 260 | 294 | ||||||
5.750%, 01/24/2022 | 110 | 122 | ||||||
5.375%, 03/15/2020 | 2,860 | 3,150 | ||||||
5.350%, 01/15/2016 (E) | 660 | 719 | ||||||
5.250%, 10/15/2013 | 390 | 391 | ||||||
5.250%, 07/27/2021 | 240 | 259 | ||||||
2.900%, 07/19/2018 (E) | 656 | 660 | ||||||
2.375%, 01/22/2018 (E) | 1,860 | 1,847 | ||||||
Hartford Financial Services Group | ||||||||
5.125%, 04/15/2022 | 170 | 186 | ||||||
4.300%, 04/15/2043 | 400 | 353 | ||||||
| Description | Face Amount ($ Thousands) | Market Value ($ Thousands) | ||||||
HBOS Capital Funding | ||||||||
6.071%, 06/30/2049 (C) (D) (E) | $ | 500 | $ | 489 | ||||
HBOS PLC MTN | ||||||||
6.750%, 05/21/2018 (D) | 2,100 | 2,334 | ||||||
HCP‡ | ||||||||
6.300%, 09/15/2016 | 1,075 | 1,216 | ||||||
6.000%, 01/30/2017 | 1,800 | 2,024 | ||||||
5.650%, 12/15/2013 | 779 | 787 | ||||||
3.750%, 02/01/2019 | 1,255 | 1,300 | ||||||
Health Care‡ | ||||||||
6.500%, 03/15/2041 | 710 | 757 | ||||||
5.250%, 01/15/2022 | 900 | 962 | ||||||
4.950%, 01/15/2021 | 2,820 | 2,986 | ||||||
Highwoods Properties‡ | ||||||||
7.500%, 04/15/2018 | 1,142 | 1,341 | ||||||
HSBC Bank PLC | ||||||||
4.750%, 01/19/2021 (D) | 1,760 | 1,902 | ||||||
HSBC Holdings PLC | ||||||||
6.800%, 06/01/2038 | 180 | 212 | ||||||
4.000%, 03/30/2022 | 685 | 697 | ||||||
HSBC USA | ||||||||
2.625%, 09/24/2018 | 870 | 882 | ||||||
2.375%, 02/13/2015 | 690 | 705 | ||||||
Hyundai Capital America (D) | ||||||||
2.125%, 10/02/2017 | 270 | 269 | ||||||
1.875%, 08/09/2016 | 505 | 507 | ||||||
ILFC E-Capital Trust II | ||||||||
6.250%, 12/21/2065 (C) (D) | 400 | 364 | ||||||
ING Bank | ||||||||
5.800%, 09/25/2023 (D) | 1,385 | 1,399 | ||||||
ING US | ||||||||
5.500%, 07/15/2022 | 175 | 188 | ||||||
2.900%, 02/15/2018 | 150 | 151 | ||||||
Inter-American Development Bank MTN | ||||||||
3.875%, 10/28/2041 | 512 | 473 | ||||||
International Lease Finance (D) | ||||||||
7.125%, 09/01/2018 | 1,080 | 1,207 | ||||||
6.500%, 09/01/2014 | 2,530 | 2,625 | ||||||
Intesa Sanpaolo MTN | ||||||||
3.625%, 08/12/2015 (D) | 500 | 508 | ||||||
3.125%, 01/15/2016 (E) | 390 | 389 | ||||||
John Deere Capital MTN | ||||||||
2.250%, 04/17/2019 | 370 | 372 | ||||||
1.700%, 01/15/2020 | 160 | 151 | ||||||
JPMorgan Chase | ||||||||
6.000%, 01/15/2018 | 135 | 155 | ||||||
4.500%, 01/24/2022 (E) | 180 | 188 | ||||||
4.400%, 07/22/2020 | 210 | 222 | ||||||
4.350%, 08/15/2021 | 215 | 223 | ||||||
4.250%, 10/15/2020 (E) | 330 | 346 | ||||||
3.450%, 03/01/2016 | 2,785 | 2,932 | ||||||
3.375%, 05/01/2023 | 1,120 | 1,016 | ||||||
3.200%, 01/25/2023 (E) | 290 | 271 | ||||||
| SEI Institutional Managed Trust / Annual Report / September 30, 2013 | 93 |
SCHEDULE OF INVESTMENTS
Core Fixed Income Fund (Continued)
September 30, 2013
| Description | Face Amount ($ Thousands) | Market Value ($ Thousands) | ||||||
1.100%, 10/15/2015 | $ | 1,670 | $ | 1,673 | ||||
JPMorgan Chase Bank | ||||||||
6.000%, 07/05/2017 | 2,250 | 2,552 | ||||||
6.000%, 10/01/2017 | 2,240 | 2,563 | ||||||
0.584%, 06/13/2016 (C) | 1,300 | 1,285 | ||||||
JPMorgan Chase Capital XIII | ||||||||
1.198%, 09/30/2034 (C) | 1,750 | 1,365 | ||||||
JPMorgan Chase Capital XXIII | ||||||||
1.264%, 05/15/2047 (C) | 1,900 | 1,396 | ||||||
Landwirtschaftliche Rentenbank | ||||||||
1.375%, 10/23/2019 | 530 | 509 | ||||||
Lazard Group LLC | ||||||||
7.125%, 05/15/2015 | 812 | 879 | ||||||
6.850%, 06/15/2017 | 1,132 | 1,283 | ||||||
Liberty Mutual Group (D) | ||||||||
6.500%, 05/01/2042 | 316 | 341 | ||||||
4.250%, 06/15/2023 | 275 | 268 | ||||||
M&T Bank | ||||||||
6.875%, 12/29/2049 (D) | 1,740 | 1,763 | ||||||
Markel | ||||||||
5.000%, 03/30/2043 | 220 | 205 | ||||||
4.900%, 07/01/2022 | 335 | 352 | ||||||
3.625%, 03/30/2023 | 250 | 238 | ||||||
Massachusetts Mutual Life Insurance | ||||||||
8.875%, 06/01/2039 (D) | 680 | 985 | ||||||
Merrill Lynch | ||||||||
8.950%, 05/18/2017 (C) | 1,790 | 2,014 | ||||||
8.680%, 05/02/2017 (C) | 3,160 | 3,527 | ||||||
6.050%, 05/16/2016 | 350 | 385 | ||||||
5.700%, 05/02/2017 | 1,300 | 1,435 | ||||||
MetLife | ||||||||
6.750%, 06/01/2016 | 375 | 430 | ||||||
6.400%, 12/15/2036 | 220 | 222 | ||||||
4.750%, 02/08/2021 | 540 | 590 | ||||||
4.368%, 09/15/2023 (E) | 590 | 617 | ||||||
MetLife Capital Trust IV | ||||||||
7.875%, 12/15/2037 (D) | 800 | 900 | ||||||
Metropolitan Life Global Funding I | ||||||||
5.125%, 06/10/2014 (D) | 1,600 | 1,651 | ||||||
2.500%, 09/29/2015 (D) | 1,090 | 1,126 | ||||||
Morgan Stanley MTN | ||||||||
7.300%, 05/13/2019 | 545 | 652 | ||||||
6.625%, 04/01/2018 | 1,640 | 1,904 | ||||||
6.000%, 04/28/2015 | 630 | 676 | ||||||
5.500%, 07/28/2021 (E) | 451 | 493 | ||||||
5.375%, 10/15/2015 | 595 | 640 | ||||||
4.750%, 03/22/2017 | 140 | 151 | ||||||
0.716%, 10/18/2016 (C) | 5,965 | 5,867 | ||||||
Murray Street Investment Trust I | ||||||||
4.647%, 03/09/2017 (E) (G) | 1,966 | 2,097 | ||||||
National Australia Bank Ltd. | ||||||||
1.600%, 08/07/2015 | 450 | 457 | ||||||
| Description | Face Amount ($ Thousands) | Market Value ($ Thousands) | ||||||
National Rural Utilities Cooperative Finance | ||||||||
2.350%, 06/15/2020 | $ | 395 | $ | 384 | ||||
Nationstar Mortgage | ||||||||
6.500%, 07/01/2021 | 140 | 134 | ||||||
Nationwide Mutual Insurance | ||||||||
5.810%, 12/15/2024 (C) (D) | 2,975 | 3,020 | ||||||
New York Life Insurance | ||||||||
6.750%, 11/15/2039 (D) | 415 | 514 | ||||||
Nordea Bank MTN (D) | ||||||||
4.875%, 05/13/2021 | 1,460 | 1,515 | ||||||
3.700%, 11/13/2014 | 440 | 455 | ||||||
Northwestern Mutual Life Insurance | ||||||||
6.063%, 03/30/2040 (D) | 690 | 792 | ||||||
PNC Bank | ||||||||
3.800%, 07/25/2023 | 390 | 382 | ||||||
Pricoa Global Funding I | ||||||||
5.450%, 06/11/2014 (D) | 3,400 | 3,514 | ||||||
ProLogis‡ | ||||||||
4.250%, 08/15/2023 | 505 | 502 | ||||||
Prudential Financial MTN | ||||||||
2.300%, 08/15/2018 | 400 | 403 | ||||||
Prudential Holdings LLC | ||||||||
8.695%, 12/18/2023 (D) | 1,300 | 1,634 | ||||||
Reinsurance Group of America MTN | ||||||||
4.700%, 09/15/2023 | 435 | 444 | ||||||
Royal Bank of Canada | ||||||||
2.000%, 10/01/2018 | 990 | 994 | ||||||
Royal Bank of Scotland Group PLC | ||||||||
7.648%, 08/31/2049 (C) | 100 | 102 | ||||||
7.640%, 09/29/2017 (C) (E) | 300 | 285 | ||||||
6.400%, 10/21/2019 (E) | 280 | 320 | ||||||
6.100%, 06/10/2023 (E) | 840 | 847 | ||||||
5.000%, 10/01/2014 | 490 | 502 | ||||||
4.700%, 07/03/2018 | 120 | 121 | ||||||
2.550%, 09/18/2015 | 200 | 204 | ||||||
Santander US Debt Unipersonal (D) | ||||||||
3.781%, 10/07/2015 | 100 | 102 | ||||||
3.724%, 01/20/2015 | 800 | 811 | ||||||
Simon Property Group‡ | ||||||||
5.750%, 12/01/2015 | 910 | 996 | ||||||
SL Green Realty‡ | ||||||||
7.750%, 03/15/2020 | 1,000 | 1,182 | ||||||
SLM MTN | ||||||||
5.625%, 08/01/2033 | 145 | 113 | ||||||
5.000%, 04/15/2015 | 120 | 125 | ||||||
3.875%, 09/10/2015 | 1,070 | 1,091 | ||||||
SpareBank 1 Boligkreditt | ||||||||
1.750%, 11/15/2019 (D) | 730 | 696 | ||||||
Stadshypotek | ||||||||
1.875%, 10/02/2019 (D) | 2,071 | 2,002 | ||||||
| 94 | SEI Institutional Managed Trust / Annual Report / September 30, 2013 |
| Description | Face Amount ($ Thousands) | Market Value ($ Thousands) | ||||||
Standard Chartered | ||||||||
5.200%, 01/26/2024 (D) (E) | $ | 830 | $ | 829 | ||||
State Street | ||||||||
4.956%, 03/15/2018 | 1,380 | 1,518 | ||||||
Sumitomo Mitsui Banking (D) | ||||||||
3.150%, 07/22/2015 | 570 | 591 | ||||||
3.100%, 01/14/2016 | 200 | 209 | ||||||
SunTrust Preferred Capital I | ||||||||
4.000%, 02/13/2012 (C) | 259 | 202 | ||||||
Svensk Exportkredit | ||||||||
1.750%, 10/20/2015 | 1,820 | 1,862 | ||||||
Swedbank Hypotek | ||||||||
1.375%, 03/28/2018 (D) (E) | — | — | ||||||
Teachers Insurance & Annuity Association of America | ||||||||
6.850%, 12/16/2039 (D) | 1,300 | 1,609 | ||||||
Temasek Financial I MTN | ||||||||
2.375%, 01/23/2023 (D) | 690 | 632 | ||||||
Toyota Motor Credit MTN | ||||||||
3.400%, 09/15/2021 | 810 | 816 | ||||||
1.250%, 10/05/2017 | 1,150 | 1,134 | ||||||
UBS MTN | ||||||||
2.250%, 01/28/2014 | 611 | 615 | ||||||
Ventas Realty L.P.‡ | ||||||||
4.000%, 04/30/2019 | 1,750 | 1,836 | ||||||
Vesey Street Investment Trust I | ||||||||
4.404%, 09/01/2016 (G) | 350 | 375 | ||||||
Wachovia | ||||||||
5.250%, 08/01/2014 | 2,570 | 2,669 | ||||||
Wachovia Bank | ||||||||
6.000%, 11/15/2017 | 250 | 288 | ||||||
Wachovia Capital Trust III | ||||||||
5.570%, 05/31/2016 (C) | 2,630 | 2,380 | ||||||
WEA Finance LLC (D) | ||||||||
7.125%, 04/15/2018 | 3,000 | 3,572 | ||||||
6.750%, 09/02/2019 | 1,230 | 1,463 | ||||||
Wells Fargo MTN | ||||||||
4.600%, 04/01/2021 (E) | 160 | 174 | ||||||
3.676%, 06/15/2016 (G) | 680 | 725 | ||||||
3.450%, 02/13/2023 (E) | 600 | 562 | ||||||
1.500%, 01/16/2018 | 420 | 413 | ||||||
Wells Fargo Capital X | ||||||||
5.950%, 12/15/2036 | 620 | 587 | ||||||
Woodbourne Capital Trust III | ||||||||
1.360%, 04/08/2049 (C) (D) | 500 | 250 | ||||||
Woodbourne Capital Trust IV | ||||||||
1.360%, 04/08/2049 (C) (D) | 275 | 137 | ||||||
WR Berkley | ||||||||
4.625%, 03/15/2022 | 296 | 306 | ||||||
|
| |||||||
| 258,030 | ||||||||
|
| |||||||
Health Care — 1.7% | ||||||||
AbbVie | ||||||||
2.900%, 11/06/2022 | 2,315 | 2,165 | ||||||
| Description | Face Amount ($ Thousands) | Market Value ($ Thousands) | ||||||
2.000%, 11/06/2018 | $ | 250 | $ | 245 | ||||
1.750%, 11/06/2017 | 1,220 | 1,210 | ||||||
Amgen | ||||||||
6.375%, 06/01/2037 | 140 | 158 | ||||||
5.650%, 06/15/2042 | 475 | 493 | ||||||
5.375%, 05/15/2043 (E) | 650 | 647 | ||||||
5.150%, 11/15/2041 | 985 | 956 | ||||||
Boston Scientific | ||||||||
4.125%, 10/01/2023 (E) | 580 | 577 | ||||||
2.650%, 10/01/2018 | 475 | 475 | ||||||
Celgene | ||||||||
5.250%, 08/15/2043 | 390 | 386 | ||||||
2.300%, 08/15/2018 | 380 | 380 | ||||||
Edwards Lifesciences | ||||||||
2.875%, 10/15/2018 | 425 | 423 | ||||||
Express Scripts Holding | ||||||||
3.500%, 11/15/2016 | 2,270 | 2,402 | ||||||
2.100%, 02/12/2015 | 795 | 808 | ||||||
Fresenius Medical Care US Finance | ||||||||
5.750%, 02/15/2021 (D) | 160 | 164 | ||||||
Fresenius Medical Care US Finance II | ||||||||
5.875%, 01/31/2022 (D) | 190 | 195 | ||||||
GlaxoSmithKline Capital | ||||||||
5.650%, 05/15/2018 | 810 | 943 | ||||||
GlaxoSmithKline Capital PLC | ||||||||
2.850%, 05/08/2022 | 760 | 729 | ||||||
HCA | ||||||||
7.500%, 11/15/2095 | 3,800 | 3,410 | ||||||
Humana | ||||||||
7.200%, 06/15/2018 | 1,150 | 1,378 | ||||||
3.150%, 12/01/2022 (E) | 200 | 186 | ||||||
Mallinckrodt International Finance | ||||||||
4.750%, 04/15/2023 (D) | 1,375 | 1,307 | ||||||
Medtronic | ||||||||
4.450%, 03/15/2020 | 730 | 800 | ||||||
Merck | ||||||||
2.800%, 05/18/2023 (E) | 455 | 430 | ||||||
1.300%, 05/18/2018 | 635 | 620 | ||||||
Perrigo | ||||||||
2.950%, 05/15/2023 | 345 | 334 | ||||||
Pfizer | ||||||||
3.000%, 06/15/2023 (E) | 365 | 350 | ||||||
Roche Holdings | ||||||||
6.000%, 03/01/2019 (D) | 665 | 790 | ||||||
St. Jude Medical | ||||||||
3.250%, 04/15/2023 | 660 | 627 | ||||||
Stryker | ||||||||
1.300%, 04/01/2018 | 925 | 902 | ||||||
Tenet Healthcare | ||||||||
6.000%, 10/01/2020 (D) | 600 | 613 | ||||||
Teva Pharmaceutical Finance IV | ||||||||
2.250%, 03/18/2020 (E) | 340 | 322 | ||||||
| SEI Institutional Managed Trust / Annual Report / September 30, 2013 | 95 |
SCHEDULE OF INVESTMENTS
Core Fixed Income Fund (Continued)
September 30, 2013
| Description | Face Amount ($ Thousands) | Market Value ($ Thousands) | ||||||
Thermo Fisher Scientific | ||||||||
3.600%, 08/15/2021 | $ | 350 | $ | 345 | ||||
3.200%, 03/01/2016 | 435 | 453 | ||||||
UnitedHealth Group | ||||||||
6.000%, 06/15/2017 | 51 | 59 | ||||||
5.800%, 03/15/2036 | 280 | 310 | ||||||
5.700%, 10/15/2040 | 510 | 565 | ||||||
3.875%, 10/15/2020 | 530 | 558 | ||||||
WellPoint | ||||||||
5.875%, 06/15/2017 | 2,185 | 2,483 | ||||||
5.100%, 01/15/2044 | 210 | 205 | ||||||
3.125%, 05/15/2022 | 690 | 655 | ||||||
1.250%, 09/10/2015 | 240 | 242 | ||||||
Wyeth LLC | ||||||||
5.950%, 04/01/2037 | 960 | 1,123 | ||||||
Zoetis | ||||||||
3.250%, 02/01/2023 (D) | 150 | 143 | ||||||
|
| |||||||
| 32,566 | ||||||||
|
| |||||||
Industrials — 1.4% | ||||||||
Aguila 3 | ||||||||
7.875%, 01/31/2018 (D) | 280 | 293 | ||||||
American Airlines Pass-Through Trust, Ser 2013-2, Cl A | ||||||||
4.950%, 01/15/2023 (D) | 2,750 | 2,764 | ||||||
BAE Systems | ||||||||
4.750%, 10/11/2021 (D) | 1,350 | 1,421 | ||||||
Boeing | ||||||||
4.875%, 02/15/2020 | 600 | 682 | ||||||
Cedar Brakes I LLC | ||||||||
8.500%, 02/15/2014 (D) | 197 | 200 | ||||||
Continental Airlines Pass-Through Trust, Ser 1999-2, Cl C-2 | ||||||||
7.256%, 03/15/2020 | 2,391 | 2,642 | ||||||
Continental Airlines Pass-Through Trust, Ser 2007-1, Cl A | ||||||||
5.983%, 04/19/2022 | 1,491 | 1,596 | ||||||
Continental Airlines Pass-Through Trust, Ser 2009-1 | ||||||||
9.000%, 07/08/2016 | 2,408 | 2,752 | ||||||
Delta Air Lines Pass-Through Trust, Ser 2007-1, Cl A | ||||||||
6.821%, 08/10/2022 | 1,278 | 1,422 | ||||||
Eaton (D) | ||||||||
4.150%, 11/02/2042 | 440 | 391 | ||||||
2.750%, 11/02/2022 | 1,420 | 1,323 | ||||||
1.500%, 11/02/2017 | 430 | 424 | ||||||
General Electric Capital | ||||||||
0.850%, 10/09/2015 | 460 | 461 | ||||||
Glencore Funding LLC | ||||||||
2.500%, 01/15/2019 (D) (E) | 400 | 375 | ||||||
JetBlue Airways Pass-Through Trust, Ser 2004-2, Cl G1 | ||||||||
0.639%, 08/15/2016 (C) | 1,917 | 1,829 | ||||||
| Description | Face Amount ($ Thousands) | Market Value ($ Thousands) | ||||||
Lockheed Martin | ||||||||
3.350%, 09/15/2021 | $ | 1,035 | $ | 1,034 | ||||
Northrop Grumman | ||||||||
4.750%, 06/01/2043 | 555 | 524 | ||||||
3.250%, 08/01/2023 | 3,240 | 3,062 | ||||||
Owens Corning | ||||||||
4.200%, 12/15/2022 | 350 | 341 | ||||||
Raytheon | ||||||||
3.125%, 10/15/2020 | 430 | 436 | ||||||
United Air Lines Pass-Through Trust, Ser 2009-2A | ||||||||
9.750%, 01/15/2017 | 158 | 179 | ||||||
United Technologies | ||||||||
4.500%, 06/01/2042 | 540 | 524 | ||||||
US Airways Pass-Through Trust, | ||||||||
4.625%, 06/03/2025 | 1,000 | 965 | ||||||
Waste Management | ||||||||
7.375%, 05/15/2029 | 330 | 403 | ||||||
|
| |||||||
| 26,043 | ||||||||
|
| |||||||
Information Technology — 0.4% | ||||||||
Activision Blizzard | ||||||||
5.625%, 09/15/2021 (D) | 300 | 300 | ||||||
Apple | ||||||||
2.400%, 05/03/2023 | 530 | 480 | ||||||
Baidu | ||||||||
3.250%, 08/06/2018 | 540 | 540 | ||||||
Intel | ||||||||
4.000%, 12/15/2032 | 390 | 358 | ||||||
International Business Machines | ||||||||
1.625%, 05/15/2020 | 2,075 | 1,949 | ||||||
National Semiconductor | ||||||||
6.600%, 06/15/2017 | 170 | 199 | ||||||
Oracle | ||||||||
3.625%, 07/15/2023 | 405 | 404 | ||||||
2.375%, 01/15/2019 (E) | 1,440 | 1,447 | ||||||
1.200%, 10/15/2017 | 1,050 | 1,031 | ||||||
TSMC Global Ltd. | ||||||||
1.625%, 04/03/2018 (D) | 875 | 843 | ||||||
|
| |||||||
| 7,551 | ||||||||
|
| |||||||
Materials — 1.5% | ||||||||
ArcelorMittal | ||||||||
4.500%, 02/25/2017 | 280 | 291 | ||||||
Ardagh Packaging Finance PLC | ||||||||
4.875%, 11/15/2022 (D) | 280 | 267 | ||||||
Ball | ||||||||
5.000%, 03/15/2022 | 870 | 844 | ||||||
4.000%, 11/15/2023 | 170 | 153 | ||||||
Barrick Gold (E) | ||||||||
4.100%, 05/01/2023 | 2,540 | 2,237 | ||||||
3.850%, 04/01/2022 | 270 | 239 | ||||||
| 96 | SEI Institutional Managed Trust / Annual Report / September 30, 2013 |
| Description | Face Amount ($ Thousands) | Market Value ($ Thousands) | ||||||
Barrick North America Finance LLC | ||||||||
4.400%, 05/30/2021 | $ | 1,350 | $ | 1,254 | ||||
BHP Billiton Finance USA Ltd. | ||||||||
5.000%, 09/30/2043 | 1,060 | 1,080 | ||||||
3.850%, 09/30/2023 | 1,510 | 1,521 | ||||||
3.250%, 11/21/2021 | 2,110 | 2,094 | ||||||
Celulosa Arauco y Constitucion | ||||||||
4.750%, 01/11/2022 | 520 | 505 | ||||||
Cliffs Natural Resources (E) | ||||||||
4.875%, 04/01/2021 | 120 | 113 | ||||||
4.800%, 10/01/2020 | 390 | 372 | ||||||
3.950%, 01/15/2018 | 930 | 934 | ||||||
CodelCo | ||||||||
4.750%, 10/15/2014 (D) | 470 | 487 | ||||||
Dow Chemical | ||||||||
3.000%, 11/15/2022 | 1,265 | 1,165 | ||||||
Eagle Spinco | ||||||||
4.625%, 02/15/2021 (D) | 160 | 154 | ||||||
Ecolab | ||||||||
4.350%, 12/08/2021 | 290 | 305 | ||||||
FMG Resources | ||||||||
6.375%, 02/01/2016 (D) (E) | 120 | 123 | ||||||
Freeport-McMoRan Copper & Gold | ||||||||
3.550%, 03/01/2022 | 1,000 | 920 | ||||||
3.100%, 03/15/2020 (D) | 560 | 527 | ||||||
2.375%, 03/15/2018 (D) | 170 | 164 | ||||||
LYB International Finance BV | ||||||||
5.250%, 07/15/2043 | 295 | 290 | ||||||
4.000%, 07/15/2023 | 425 | 421 | ||||||
LyondellBasell Industries | ||||||||
6.000%, 11/15/2021 (E) | 200 | 228 | ||||||
5.750%, 04/15/2024 | 200 | 224 | ||||||
Potash Corp of Saskatchewan | ||||||||
4.875%, 03/30/2020 (E) | 280 | 306 | ||||||
Rio Tinto Finance USA Ltd. | ||||||||
9.000%, 05/01/2019 | 740 | 960 | ||||||
6.500%, 07/15/2018 (E) | 1,000 | 1,179 | ||||||
3.750%, 09/20/2021 | 430 | 424 | ||||||
Rio Tinto Finance USA PLC | ||||||||
2.250%, 12/14/2018 | 675 | 666 | ||||||
Rock Tenn | ||||||||
4.000%, 03/01/2023 | 160 | 155 | ||||||
3.500%, 03/01/2020 | 320 | 316 | ||||||
Southern Copper | ||||||||
5.250%, 11/08/2042 (E) | 1,550 | 1,250 | ||||||
Vale | ||||||||
5.625%, 09/11/2042 (E) | 366 | 319 | ||||||
Vale Overseas Ltd. (E) | ||||||||
6.875%, 11/21/2036 | 1,510 | 1,531 | ||||||
4.375%, 01/11/2022 | 1,789 | 1,724 | ||||||
Xstrata Finance Canada Ltd. (D) | ||||||||
5.800%, 11/15/2016 | 160 | 175 | ||||||
2.450%, 10/25/2017 | 810 | 805 | ||||||
2.050%, 10/23/2015 | 1,328 | 1,332 | ||||||
|
| |||||||
| 28,054 | ||||||||
|
| |||||||
| Description | Face Amount ($ Thousands) | Market Value ($ Thousands) | ||||||
Telecommunication Services — 1.9% |
| |||||||
America Movil | ||||||||
5.625%, 11/15/2017 | $ | 440 | $ | 501 | ||||
5.000%, 03/30/2020 (E) | 750 | 806 | ||||||
3.125%, 07/16/2022 | 1,130 | 1,040 | ||||||
2.375%, 09/08/2016 (E) | 415 | 422 | ||||||
AT&T | ||||||||
6.500%, 09/01/2037 | 1,360 | 1,503 | ||||||
6.450%, 06/15/2034 | 625 | 688 | ||||||
5.550%, 08/15/2041 | 120 | 119 | ||||||
5.500%, 02/01/2018 | 920 | 1,043 | ||||||
4.450%, 05/15/2021 | 30 | 31 | ||||||
4.300%, 12/15/2042 (E) | 201 | 167 | ||||||
2.625%, 12/01/2022 (E) | 330 | 296 | ||||||
2.500%, 08/15/2015 | 1,470 | 1,514 | ||||||
1.600%, 02/15/2017 | 745 | 747 | ||||||
Cellco Partnership | ||||||||
8.500%, 11/15/2018 | 90 | 115 | ||||||
Deutsche Telekom International Finance | ||||||||
5.750%, 03/23/2016 | 1,380 | 1,525 | ||||||
2.250%, 03/06/2017 (D) | 905 | 918 | ||||||
Intelsat Jackson Holdings | ||||||||
7.500%, 04/01/2021 | 380 | 410 | ||||||
5.500%, 08/01/2023 (D) | 70 | 65 | ||||||
Rogers Communications | ||||||||
6.750%, 03/15/2015 | 1,015 | 1,101 | ||||||
5.450%, 10/01/2043 | 355 | 352 | ||||||
Softbank | ||||||||
4.500%, 04/15/2020 (D) | 580 | 557 | ||||||
Sprint | ||||||||
7.875%, 09/15/2023 (D) | 520 | 530 | ||||||
Sprint Capital | ||||||||
8.750%, 03/15/2032 (E) | 910 | 925 | ||||||
Telecom Italia Capital | ||||||||
7.175%, 06/18/2019 | 40 | 44 | ||||||
Telefonica Chile | ||||||||
3.875%, 10/12/2022 (D) | 445 | 395 | ||||||
Telefonica Emisiones SAU | ||||||||
6.221%, 07/03/2017 | 100 | 110 | ||||||
5.877%, 07/15/2019 | 90 | 98 | ||||||
5.462%, 02/16/2021 | 50 | 51 | ||||||
5.134%, 04/27/2020 (E) | 540 | 553 | ||||||
4.570%, 04/27/2023 (E) | 525 | 503 | ||||||
Verizon Communications | ||||||||
7.750%, 12/01/2030 | 835 | 1,027 | ||||||
6.550%, 09/15/2043 | 960 | 1,084 | ||||||
6.400%, 09/15/2033 | 4,411 | 4,898 | ||||||
6.350%, 04/01/2019 | 310 | 364 | ||||||
5.500%, 02/15/2018 (E) | 1,260 | 1,427 | ||||||
5.150%, 09/15/2023 (E) | 3,275 | 3,510 | ||||||
4.500%, 09/15/2020 | 1,390 | 1,478 | ||||||
3.850%, 11/01/2042 | 130 | 103 | ||||||
3.650%, 09/14/2018 | 988 | 1,041 | ||||||
| SEI Institutional Managed Trust / Annual Report / September 30, 2013 | 97 |
SCHEDULE OF INVESTMENTS
Core Fixed Income Fund (Continued)
September 30, 2013
| Description | Face Amount ($ Thousands) | Market Value ($ Thousands) | ||||||
2.500%, 09/15/2016 | $ | 1,325 | $ | 1,366 | ||||
Vodafone Group PLC | ||||||||
2.950%, 02/19/2023 | 1,015 | 933 | ||||||
1.500%, 02/19/2018 | 825 | 802 | ||||||
0.900%, 02/19/2016 | 1,194 | 1,192 | ||||||
|
| |||||||
| 36,354 | ||||||||
|
| |||||||
Utilities — 2.1% | ||||||||
AES | ||||||||
7.375%, 07/01/2021 | 40 | 44 | ||||||
4.875%, 05/15/2023 | 920 | 860 | ||||||
AGL Capital | ||||||||
4.400%, 06/01/2043 | 375 | 341 | ||||||
Ameren | ||||||||
8.875%, 05/15/2014 | 615 | 645 | ||||||
American Electric Power | ||||||||
1.650%, 12/15/2017 | 700 | 688 | ||||||
Calpine | ||||||||
7.500%, 02/15/2021 (D) | 774 | 822 | ||||||
Commonwealth Edison | ||||||||
4.600%, 08/15/2043 | 270 | 265 | ||||||
Dayton Power & Light | ||||||||
1.875%, 09/15/2016 (D) | 540 | 544 | ||||||
Dominion Resources | ||||||||
8.875%, 01/15/2019 | 610 | 789 | ||||||
1.950%, 08/15/2016 | 265 | 270 | ||||||
Duke Energy | ||||||||
1.625%, 08/15/2017 | 355 | 354 | ||||||
Duke Energy Florida | ||||||||
3.850%, 11/15/2042 | 500 | 435 | ||||||
Duke Energy Ohio | ||||||||
3.800%, 09/01/2023 | 285 | 291 | ||||||
Duke Energy Progress | ||||||||
4.100%, 05/15/2042 | 125 | 115 | ||||||
Electricite de France | ||||||||
4.600%, 01/27/2020 (D) | 230 | 251 | ||||||
Energy Future Holdings LLC | ||||||||
10.000%, 12/01/2020 (E) | 1,086 | 1,144 | ||||||
Exelon | ||||||||
5.625%, 06/15/2035 | 1,060 | 1,063 | ||||||
FirstEnergy | ||||||||
4.250%, 03/15/2023 (E) | 1,770 | 1,619 | ||||||
2.750%, 03/15/2018 | 280 | 272 | ||||||
FirstEnergy, Ser C | ||||||||
7.375%, 11/15/2031 | 2,245 | 2,268 | ||||||
Florida Gas Transmission LLC | ||||||||
3.875%, 07/15/2022 (D) | 1,700 | 1,692 | ||||||
KCP&L Greater Missouri Operations | ||||||||
8.270%, 11/15/2021 | 2,700 | 3,320 | ||||||
Metropolitan Edison | ||||||||
3.500%, 03/15/2023 (D) | 2,425 | 2,309 | ||||||
MidAmerican Energy | ||||||||
4.800%, 09/15/2043 | 415 | 421 | ||||||
2.400%, 03/15/2019 | 725 | 738 | ||||||
| Description | Face Amount ($ Thousands) | Market Value ($ Thousands) | ||||||
Midamerican Energy Holdings | ||||||||
6.500%, 09/15/2037 | $ | 1,160 | $ | 1,370 | ||||
Nisource Finance | ||||||||
6.800%, 01/15/2019 (E) | 2,261 | 2,665 | ||||||
Northern States Power | ||||||||
2.600%, 05/15/2023 | 105 | 98 | ||||||
Oncor Electric Delivery LLC | ||||||||
6.800%, 09/01/2018 | 1,075 | 1,288 | ||||||
4.550%, 12/01/2041 | 1,500 | 1,437 | ||||||
Pacific Gas & Electric | ||||||||
8.250%, 10/15/2018 | 280 | 358 | ||||||
5.800%, 03/01/2037 | 710 | 770 | ||||||
4.600%, 06/15/2043 | 245 | 228 | ||||||
4.450%, 04/15/2042 | 700 | 635 | ||||||
3.250%, 06/15/2023 | 370 | 353 | ||||||
PPL Capital Funding | ||||||||
4.700%, 06/01/2043 | 290 | 259 | ||||||
4.200%, 06/15/2022 | 255 | 254 | ||||||
3.400%, 06/01/2023 | 315 | 293 | ||||||
Progress Energy | ||||||||
3.150%, 04/01/2022 | 256 | 245 | ||||||
PSEG Power LLC | ||||||||
2.750%, 09/15/2016 | 320 | 333 | ||||||
Public Service of New Mexico | ||||||||
7.950%, 05/15/2018 | 1,265 | 1,523 | ||||||
PVNGS II Funding | ||||||||
8.000%, 12/30/2015 | 877 | 920 | ||||||
Southern | ||||||||
2.450%, 09/01/2018 | 525 | 530 | ||||||
Southern California Edison | ||||||||
4.650%, 10/01/2043 | 615 | 608 | ||||||
3.500%, 10/01/2023 | 880 | 879 | ||||||
Southern Power | ||||||||
5.250%, 07/15/2043 | 250 | 249 | ||||||
Southwestern Electric Power | ||||||||
3.550%, 02/15/2022 | 485 | 471 | ||||||
Texas-New Mexico Power | ||||||||
6.950%, 04/01/2043 (D) | 880 | 1,036 | ||||||
Virginia Electric and Power | ||||||||
4.650%, 08/15/2043 | 1,030 | 1,021 | ||||||
|
| |||||||
| 39,383 | ||||||||
|
| |||||||
Total Corporate Obligations | 569,960 | |||||||
|
| |||||||
ASSET-BACKED SECURITIES — 10.6% |
| |||||||
Automotive — 1.4% | ||||||||
Ally Auto Receivables Trust, Ser 2010-2, Cl A4 | ||||||||
2.090%, 05/15/2015 | 128 | 128 | ||||||
Ally Auto Receivables Trust, Ser 2010-4, Cl A4 | ||||||||
1.350%, 12/15/2015 | 940 | 944 | ||||||
| 98 | SEI Institutional Managed Trust / Annual Report / September 30, 2013 |
| Description | Face Amount ($ Thousands) | Market Value ($ Thousands) | ||||||
Ally Auto Receivables Trust, Ser 2010-5, Cl A4 | ||||||||
1.750%, 03/15/2016 | $ | 1,365 | $ | 1,373 | ||||
Ally Auto Receivables Trust, Ser 2011-1, Cl A4 | ||||||||
2.230%, 03/15/2016 | 1,712 | 1,728 | ||||||
Ally Auto Receivables Trust, Ser 2012-1, Cl A3 | ||||||||
0.930%, 02/16/2016 | 240 | 241 | ||||||
Ally Auto Receivables Trust, Ser 2012-2, Cl A3 | ||||||||
0.740%, 04/15/2016 | 964 | 965 | ||||||
Ally Auto Receivables Trust, Ser 2012-5, Cl A2 | ||||||||
0.450%, 07/15/2015 | 2,091 | 2,090 | ||||||
Ally Auto Receivables Trust, Ser 2013-1, Cl A3 | ||||||||
0.630%, 05/15/2017 | 961 | 956 | ||||||
Ally Auto Receivables Trust, Ser 2013-1, Cl A4 | ||||||||
0.840%, 02/15/2018 | 1,016 | 1,003 | ||||||
AmeriCredit Automobile Receivables Trust, Ser 2012-4, Cl A2 | ||||||||
0.490%, 04/08/2016 | 419 | 419 | ||||||
AmeriCredit Automobile Receivables Trust, Ser 2012-4, Cl A3 | ||||||||
0.670%, 06/08/2017 | 590 | 589 | ||||||
AmeriCredit Automobile Receivables Trust, Ser 2013-3, Cl A2 | ||||||||
0.680%, 10/11/2016 | 1,747 | 1,746 | ||||||
Avis Budget Rental Car Funding AESOP LLC, Ser 2010-5A, Cl A | ||||||||
3.150%, 03/20/2017 (D) | 140 | 146 | ||||||
Avis Budget Rental Car Funding AESOP LLC, Ser 2012-2A, Cl A | ||||||||
2.802%, 05/20/2018 (D) | 695 | 719 | ||||||
Avis Budget Rental Car Funding AESOP LLC, Ser 2012-3A, Cl A | ||||||||
2.100%, 03/20/2019 (D) | 600 | 599 | ||||||
Avis Budget Rental Car Funding AESOP LLC, Ser 2013-1A, Cl A | ||||||||
1.920%, 09/20/2019 (D) | 380 | 372 | ||||||
Avis Budget Rental Car Funding AESOP LLC, Ser 2013-2A, Cl A | ||||||||
2.970%, 02/20/2020 | 350 | 357 | ||||||
Bank of America Auto Trust, Ser 2010-2, Cl A4 | ||||||||
1.940%, 06/15/2017 | 140 | 140 | ||||||
Capital Auto Receivables Asset Trust, Ser 2013-1, Cl A3 | ||||||||
0.790%, 06/20/2017 | 1,500 | 1,495 | ||||||
| Description | Face Amount ($ Thousands) | Market Value ($ Thousands) | ||||||
Capital Auto Receivables Asset Trust, Ser 2013-2, Cl A2 | ||||||||
0.920%, 09/20/2016 | $ | 806 | $ | 807 | ||||
Capital Auto Receivables Asset Trust, Ser 2013-2, Cl A4 | ||||||||
1.560%, 07/20/2018 | 429 | 432 | ||||||
Capital Auto Receivables Asset Trust, Ser 2013-3, Cl A2 | ||||||||
1.040%, 11/21/2016 | 388 | 389 | ||||||
Capital Auto Receivables Asset Trust, Ser 2013-3, Cl A4 | ||||||||
1.680%, 04/20/2018 | 517 | 520 | ||||||
Ford Credit Auto Owner Trust, Ser 2012-B, Cl A2 | ||||||||
0.570%, 01/15/2015 | 82 | 82 | ||||||
Ford Credit Auto Owner Trust, Ser 2012-C, Cl A2 | ||||||||
0.470%, 04/15/2015 | 126 | 126 | ||||||
Ford Credit Auto Owner Trust, Ser 2013-B, Cl A2 | ||||||||
0.380%, 02/15/2016 | 450 | 450 | ||||||
Harley-Davidson Motorcycle Trust, Ser 2011-2, Cl A3 | ||||||||
1.110%, 09/15/2016 | 294 | 295 | ||||||
Hertz Vehicle Financing, Ser 2009-2A, Cl A2 | ||||||||
5.290%, 03/25/2016 (D) | 340 | 358 | ||||||
Hertz Vehicle Financing, Ser 2013-1A, Cl A2 | ||||||||
1.830%, 08/25/2019 (D) | 510 | 499 | ||||||
Honda Auto Receivables Owner Trust, Ser 2012-3, Cl A2 | ||||||||
0.460%, 12/15/2014 | 222 | 222 | ||||||
Mercedes-Benz Auto Receivables Trust, Ser 2011-1, Cl A3 | ||||||||
0.850%, 03/16/2015 | 237 | 238 | ||||||
MMCA Automobile Trust, | ||||||||
2.020%, 10/17/2016 (D) | 298 | 300 | ||||||
Nissan Auto Receivables Owner Trust, Ser 2011-A, Cl A3 | ||||||||
1.180%, 02/16/2015 | 128 | 129 | ||||||
Nissan Auto Receivables Owner Trust, Ser 2012-A, Cl A2 | ||||||||
0.540%, 10/15/2014 | 73 | 73 | ||||||
Nissan Auto Receivables Owner Trust, Ser 2012-B, Cl A2 | ||||||||
0.390%, 04/15/2015 | 172 | 172 | ||||||
Santander Drive Auto Receivables Trust, Ser 2011-2, Cl A3 | ||||||||
1.290%, 02/16/2015 | 11 | 11 | ||||||
Santander Drive Auto Receivables Trust, Ser 2012-3, Cl A2 | ||||||||
0.830%, 04/15/2015 | 78 | 78 | ||||||
| SEI Institutional Managed Trust / Annual Report / September 30, 2013 | 99 |
SCHEDULE OF INVESTMENTS
Core Fixed Income Fund (Continued)
September 30, 2013
| Description | Face Amount ($ Thousands) | Market Value ($ Thousands) | ||||||
Santander Drive Auto Receivables Trust, Ser 2012-5, Cl A2 | ||||||||
0.570%, 12/15/2015 | $ | 179 | $ | 179 | ||||
Santander Drive Auto Receivables Trust, Ser 2012-5, Cl A3 | ||||||||
0.830%, 12/15/2016 | 294 | 294 | ||||||
Santander Drive Auto Receivables Trust, Ser 2012-6, Cl A3 | ||||||||
0.620%, 07/15/2016 | 312 | 312 | ||||||
Santander Drive Auto Receivables Trust, Ser 2013-2, Cl A3 | ||||||||
0.700%, 09/15/2017 | 1,695 | 1,690 | ||||||
Santander Drive Auto Receivables Trust, Ser 2013-3, Cl A2 | ||||||||
0.550%, 09/15/2016 | 1,691 | 1,689 | ||||||
Toyota Auto Receivables Owner Trust, Ser 2012-A, Cl A2 | ||||||||
0.570%, 10/15/2014 | 128 | 128 | ||||||
Toyota Auto Receivables Owner Trust, Ser 2013-B, Cl A2 | ||||||||
0.480%, 02/15/2016 | 485 | 485 | ||||||
Volkswagen Auto Loan Enhanced Trust, Ser 2012-2, Cl A2 | ||||||||
0.330%, 07/20/2015 | 393 | 392 | ||||||
|
| |||||||
| 26,360 | ||||||||
|
| |||||||
Credit Cards — 0.7% | ||||||||
American Express Credit Account Secured Note Trust, Ser 2012-4, Cl A | ||||||||
0.422%, 05/15/2020 (C) | 1,847 | 1,842 | ||||||
American Express Issuance | ||||||||
0.462%, 02/15/2019 (C) | 1,112 | 1,106 | ||||||
American Express Issuance | ||||||||
0.680%, 08/15/2019 | 1,451 | 1,451 | ||||||
Capital One Multi-Asset Execution Trust, Ser 2007-A1, Cl A1 | ||||||||
0.232%, 11/15/2019 (C) | 2,451 | 2,429 | ||||||
Chase Issuance Trust, Ser 2007-A2, Cl A2 | ||||||||
0.232%, 04/15/2019 (C) | 1,176 | 1,166 | ||||||
Chase Issuance Trust, Ser 2013-A3, Cl A3 | ||||||||
0.462%, 04/15/2020 (C) | 195 | 194 | ||||||
Citibank Credit Card Issuance Trust, Ser 2013-A1, Cl A1 | ||||||||
0.280%, 04/24/2017 (C) | 563 | 562 | ||||||
Citibank Credit Card Issuance Trust, Ser 2013-A5, Cl A5 | ||||||||
1.320%, 09/07/2018 | 2,637 | 2,654 | ||||||
GE Capital Credit Card Master Note Trust, Ser 2011-1, Cl A | ||||||||
0.732%, 01/15/2017 (C) | 457 | 457 | ||||||
| Description | Face Amount ($ Thousands) | Market Value ($ Thousands) | ||||||
World Financial Network Credit Card Master Trust, | ||||||||
0.910%, 03/16/2020 | $ | 1,140 | $ | 1,131 | ||||
|
| |||||||
| 12,992 | ||||||||
|
| |||||||
Mortgage Related Securities — 1.7% |
| |||||||
AFC Home Equity Loan Trust, | ||||||||
0.459%, 04/25/2028 (C) | 18 | 16 | ||||||
AFC Home Equity Loan Trust, | ||||||||
0.419%, 03/25/2030 (C) | 2,522 | 1,492 | ||||||
Bear Stearns Asset-Backed Securities Trust, | ||||||||
8.010%, 08/25/2030 | 467 | 462 | ||||||
Bear Stearns Asset-Backed Securities Trust, | ||||||||
0.579%, 08/25/2043 (C) | 1,782 | 1,743 | ||||||
Centex Home Equity, Ser 2006-A, Cl AV4 | ||||||||
0.443%, 06/25/2036 (C) | 4,917 | 4,219 | ||||||
Citigroup Mortgage Loan Trust, | ||||||||
0.424%, 08/25/2036 (C) | 4,200 | 3,117 | ||||||
Conseco Finance, | ||||||||
6.690%, 11/15/2032 (C) | 231 | 232 | ||||||
Contimortgage Home Equity Trust, | ||||||||
5.351%, 03/15/2028 (C) | — | — | ||||||
EMC Mortgage Loan Trust, | ||||||||
0.643%, 05/25/2039 (C) (D) | 872 | 815 | ||||||
Home Loan Trust, | ||||||||
8.290%, 02/25/2025 | 345 | 340 | ||||||
HSBC Home Equity Loan Trust, | ||||||||
0.414%, 03/20/2036 (C) | 4,182 | 4,043 | ||||||
Master Asset-Backed Securities Trust, Ser 2005-WF1, Cl A2D | ||||||||
0.549%, 06/25/2035 (C) | 1,527 | 1,504 | ||||||
Master Asset-Backed Securities Trust, Ser 2007-HE1, Cl A4 | ||||||||
0.464%, 05/25/2037 (C) | 5,500 | 3,288 | ||||||
New Century Home Equity Loan Trust, Ser 2005-2, Cl M1 | ||||||||
0.614%, 06/25/2035 (C) | 3,800 | 3,663 | ||||||
New Century Home Equity Loan Trust, Ser 2005-3, Cl M2 | ||||||||
0.674%, 07/25/2035 (C) | 3,500 | 3,208 | ||||||
| 100 | SEI Institutional Managed Trust / Annual Report / September 30, 2013 |
| Description | Face Amount ($ Thousands) | Market Value ($ Thousands) | ||||||
RASC Trust, Ser 2005-AHL2, Cl A2 | ||||||||
0.444%, 10/25/2035 (C) | $ | 1,451 | $ | 1,445 | ||||
Soundview Home Equity Loan Trust, Ser 2006-EQ2, Cl A3 | ||||||||
0.344%, 01/25/2037 (C) | 6,188 | 3,612 | ||||||
|
| |||||||
| 33,199 | ||||||||
|
| |||||||
Other Asset-Backed Securities — 6.8% |
| |||||||
Academic Loan Funding Trust, | ||||||||
1.284%, 12/27/2044 (C) (D) | 2,100 | 2,102 | ||||||
ACS Pass-Through Trust, | ||||||||
0.495%, 06/14/2037 (C) (D) | 1,800 | 1,626 | ||||||
Ally Master Owner Trust, | ||||||||
2.150%, 01/15/2016 | 1,581 | 1,588 | ||||||
Ally Master Owner Trust, | ||||||||
1.810%, 05/15/2016 | 515 | 519 | ||||||
Ally Master Owner Trust, | ||||||||
0.982%, 09/15/2016 (C) | 528 | 530 | ||||||
Ally Master Owner Trust, | ||||||||
1.440%, 02/15/2017 | 800 | 807 | ||||||
Ally Master Owner Trust, | ||||||||
1.540%, 09/15/2019 | 975 | 967 | ||||||
Avalon IV Capital Ltd., | ||||||||
3.868%, 04/17/2023 (C) (D) | 675 | 676 | ||||||
Babcock & Brown Air Funding I Ltd., Ser 2007-1A, Cl G1 | ||||||||
0.619%, 11/14/2033 (C) (D) | 1,092 | 928 | ||||||
Brazos Higher Education Authority, | ||||||||
1.473%, 02/25/2035 (C) | 2,200 | 2,183 | ||||||
Brazos Higher Education Authority, | ||||||||
1.276%, 10/27/2036 (C) | 1,750 | 1,721 | ||||||
Carrington Mortgage Loan Trust, | ||||||||
0.579%, 09/25/2035 (C) | 1,628 | 1,600 | ||||||
CIT Education Loan Trust, | ||||||||
0.341%, 03/25/2042 (C) (D) | 1,814 | 1,659 | ||||||
Citicorp Residential Mortgage Trust, Ser 2007-1, Cl A5 | ||||||||
6.046%, 03/25/2037 | 1,970 | 1,784 | ||||||
CNH Equipment Trust, | ||||||||
0.630%, 01/17/2017 | 605 | 605 | ||||||
| Description | Face Amount ($ Thousands) | Market Value ($ Thousands) | ||||||
Conseco Finance Home Improvement Loan Trust, | ||||||||
8.130%, 08/15/2031 (C) | $ | 228 | $ | 229 | ||||
Conseco Financial, Ser 1993-4, Cl A5 | ||||||||
7.050%, 01/15/2019 | 227 | 235 | ||||||
Conseco Financial, | ||||||||
7.750%, 07/15/2027 | 120 | 121 | ||||||
Countrywide Asset-Backed Certificates, | ||||||||
0.779%, 06/25/2033 (C) | 38 | 36 | ||||||
Countrywide Asset-Backed Certificates, Ser 2005-4, Cl MV1 | ||||||||
0.639%, 10/25/2035 (C) | 949 | 948 | ||||||
Countrywide Asset-Backed Certificates, Ser 2007-13, Cl 2A2 | ||||||||
0.984%, 10/25/2047 (C) | 4,188 | 3,506 | ||||||
Countrywide Home Equity Loan Trust, Ser 2006-HW, Cl 2A1B | ||||||||
0.334%, 11/15/2036 (C) | 159 | 132 | ||||||
Credit-Based Asset Servicing and Securities, Ser 2006-CB3, Cl AV4 | ||||||||
0.450%, 03/25/2036 | 5,000 | 3,253 | ||||||
Cronos Containers Program, | ||||||||
4.210%, 05/18/2027 (D) | 910 | 923 | ||||||
Cronos Containers Program, | ||||||||
3.810%, 09/18/2027 (D) | 675 | 681 | ||||||
CWABS Revolving Home Equity Loan Trust, Ser 2004-K, Cl 2A | ||||||||
0.482%, 02/15/2034 (C) | 619 | 521 | ||||||
Detroit Edison Securitization Funding LLC, Ser 2001-1, Cl A6 | ||||||||
6.620%, 03/01/2016 | 1,390 | 1,469 | ||||||
Educational Funding of the South, | ||||||||
0.916%, 04/25/2035 (C) | 2,100 | 2,087 | ||||||
FFMLT Trust, | ||||||||
0.669%, 09/25/2035 (C) | 3,700 | 3,166 | ||||||
Ford Credit Floorplan Master Owner Trust, Ser 2011-1, Cl A1 | ||||||||
2.120%, 02/15/2016 | 765 | 769 | ||||||
Ford Credit Floorplan Master Owner Trust, Ser 2012-1, Cl A | ||||||||
0.652%, 01/15/2016 (C) | 279 | 279 | ||||||
Ford Credit Floorplan Master Owner Trust, Ser 2012-4, Cl A1 | ||||||||
0.740%, 09/15/2016 | 1,245 | 1,246 | ||||||
| SEI Institutional Managed Trust / Annual Report / September 30, 2013 | 101 |
SCHEDULE OF INVESTMENTS
Core Fixed Income Fund (Continued)
September 30, 2013
| Description | Face Amount ($ Thousands) | Market Value ($ Thousands) | ||||||
Ford Credit Floorplan Master Owner Trust, Ser 2013-5, Cl A1 | ||||||||
0.850%, 09/15/2018 | $ | 270 | $ | 271 | ||||
GE Seaco Finance, | ||||||||
0.430%, 11/17/2020 (C) (D) | 1,706 | 1,686 | ||||||
Green Tree, Ser 2008-MH1, Cl A2 | ||||||||
8.970%, 04/25/2038 (C) (D) | 1,837 | 2,010 | ||||||
Green Tree, Ser 2008-MH1, Cl A3 | ||||||||
8.970%, 04/25/2038 (C) (D) | 1,462 | 1,600 | ||||||
Greenpoint Manufactured Housing, Ser 1999-2, Cl A2 | ||||||||
2.949%, 03/18/2029 (C) | 575 | 494 | ||||||
Greenpoint Manufactured Housing, Ser 1999-3, Cl 1A7 | ||||||||
7.270%, 06/15/2029 | 1,204 | 1,214 | ||||||
Greenpoint Manufactured Housing, | ||||||||
3.584%, 06/19/2029 (C) | 325 | 272 | ||||||
Greenpoint Manufactured Housing, | ||||||||
3.684%, 02/20/2030 (C) | 375 | 312 | ||||||
Greenpoint Manufactured Housing, | ||||||||
3.693%, 02/20/2032 (C) | 400 | 356 | ||||||
Greenpoint Manufactured Housing, | ||||||||
3.692%, 03/13/2032 (C) | 575 | 502 | ||||||
GSAMP Trust, Ser 2003-SEA, Cl A1 | ||||||||
0.584%, 02/25/2033 (C) | 1,850 | 1,676 | ||||||
GSAMP Trust, | ||||||||
0.429%, 05/25/2046 (C) | 3,300 | 2,076 | ||||||
GSAMP Trust, Ser 2006-SEA1, Cl A | ||||||||
0.484%, 05/25/2036 (C) (D) | 267 | 261 | ||||||
HSI Asset Securitization Trust, | ||||||||
0.469%, 11/25/2035 (C) | 2,207 | 1,767 | ||||||
HSI Asset Securitization Trust, | ||||||||
0.359%, 02/25/2036 (C) | 754 | 687 | ||||||
Latitude CLO II, Ser 2006-2A, Cl A2 | ||||||||
0.584%, 12/15/2018 (C) (D) | 1,000 | 975 | ||||||
Lehman ABS Manufactured Housing Contract Trust, Ser 2001-B, Cl A4 | ||||||||
5.270%, 09/15/2018 | 1,209 | 1,273 | ||||||
Lehman XS Trust, Ser 2005-5N, Cl 1A1 | ||||||||
0.484%, 11/25/2035 (C) | 1,101 | 904 | ||||||
Mid-State Trust, | ||||||||
4.864%, 07/15/2038 | 2,804 | 2,993 | ||||||
| Description | Face Amount ($ Thousands) | Market Value ($ Thousands) | ||||||
Nelnet Student Loan Trust, | ||||||||
0.376%, 10/25/2033 (C) | $ | 1,709 | $ | 1,636 | ||||
Nelnet Student Loan Trust, | ||||||||
0.350%, 03/23/2037 (C) | 1,343 | 1,289 | ||||||
Nelnet Student Loan Trust, | ||||||||
0.352%, 11/23/2022 (C) | 1,478 | 1,474 | ||||||
Nelnet Student Loan Trust, | ||||||||
0.346%, 10/26/2026 (C) | 1,903 | 1,897 | ||||||
Nelnet Student Loan Trust, | ||||||||
0.272%, 11/27/2018 (C) | 357 | 356 | ||||||
Nelnet Student Loan Trust, | ||||||||
0.332%, 05/27/2025 (C) | 944 | 907 | ||||||
Nelnet Student Loan Trust, | ||||||||
0.601%, 03/25/2026 (C) (D) | 2,634 | 2,600 | ||||||
Nelnet Student Loan Trust, | ||||||||
0.979%, 04/25/2046 (C) (D) | 427 | 431 | ||||||
Neptune Finance CCS Ltd., | ||||||||
0.881%, 04/20/2020 (C) (D) | 1,725 | 1,721 | ||||||
North Carolina State Education Assistance Authority, | ||||||||
1.066%, 07/25/2025 (C) | 1,000 | 1,003 | ||||||
Octagon Investment Partners XI Ltd., Ser 2007-1A, Cl A1B | ||||||||
0.522%, 08/25/2021 (C) (D) | 1,700 | 1,649 | ||||||
OHA Credit Partners VII Ltd., | ||||||||
1.684%, 11/20/2023 (C) (D) | 1,750 | 1,750 | ||||||
Origen Manufactured Housing, | ||||||||
2.662%, 10/15/2037 (C) | 2,796 | 2,324 | ||||||
Park Place Securities Asset-Backed Pass-Through Certificates, | ||||||||
0.859%, 09/25/2034 (C) | 3,023 | 2,978 | ||||||
Residential Asset Mortgage Products Trust, | ||||||||
1.279%, 12/25/2033 (C) | 188 | 152 | ||||||
Residential Asset Mortgage Products Trust, | ||||||||
0.864%, 03/25/2033 (C) | 36 | 31 | ||||||
RSB Bondco LLC, Ser 2007-A, Cl A3 | ||||||||
5.820%, 06/28/2019 | 775 | 880 | ||||||
| 102 | SEI Institutional Managed Trust / Annual Report / September 30, 2013 |
| Description | Face Amount ($ Thousands) | Market Value ($ Thousands) | ||||||
Scholar Funding Trust, | ||||||||
1.164%, 10/28/2043 (C) (D) | $ | 1,384 | $ | 1,377 | ||||
SLC Student Loan Trust, | ||||||||
0.324%, 05/15/2029 (C) | 1,300 | 1,245 | ||||||
SLC Student Loan Trust, | �� | |||||||
0.664%, 05/15/2028 (C) | 348 | 346 | ||||||
SLM Private Education Loan Trust, | ||||||||
1.582%, 12/15/2023 (C) (D) | 997 | 1,001 | ||||||
SLM Private Education Loan Trust, | ||||||||
1.582%, 08/15/2025 (C) (D) | 1,385 | 1,396 | ||||||
SLM Private Education Loan Trust, | ||||||||
1.282%, 12/15/2021 (C) (D) | 924 | 927 | ||||||
SLM Private Education Loan Trust, | ||||||||
1.282%, 08/15/2023 (C) (D) | 686 | 689 | ||||||
SLM Private Education Loan Trust, | ||||||||
0.932%, 10/16/2023 (C) (D) | 1,298 | 1,294 | ||||||
SLM Private Education Loan Trust, | ||||||||
1.932%, 06/15/2045 (C) (D) | 1,227 | 1,247 | ||||||
SLM Private Education Loan Trust, | ||||||||
1.979%, 11/25/2043 (C) | 245 | 241 | ||||||
SLM Private Education Loan Trust, | ||||||||
0.782%, 08/15/2022 (C) (D) | 518 | 514 | ||||||
SLM Private Education Loan Trust, | ||||||||
0.832%, 07/15/2022 (C) (D) | 400 | 398 | ||||||
SLM Private Education Loan Trust, | ||||||||
1.850%, 06/17/2030 (D) | 1,830 | 1,769 | ||||||
SLM Student Loan Trust, | ||||||||
0.454%, 10/28/2028 (C) | 506 | 504 | ||||||
SLM Student Loan Trust, | ||||||||
0.544%, 12/15/2025 (C) (D) | 850 | 842 | ||||||
SLM Student Loan Trust, | ||||||||
0.766%, 04/25/2024 (C) (D) | 1,517 | 1,521 | ||||||
SLM Student Loan Trust, | ||||||||
0.366%, 04/25/2025 (C) | 123 | 122 | ||||||
SLM Student Loan Trust, | ||||||||
1.466%, 07/27/2026 (C) | 554 | 562 | ||||||
| Description | Face Amount ($ Thousands) | Market Value ($ Thousands) | ||||||
SLM Student Loan Trust, | ||||||||
0.366%, 01/25/2023 (C) | $ | 177 | $ | 177 | ||||
SLM Student Loan Trust, | ||||||||
0.436%, 01/25/2041 (C) | 1,900 | 1,650 | ||||||
SLM Student Loan Trust, | ||||||||
0.376%, 01/25/2027 (C) | 1,540 | 1,507 | ||||||
SLM Student Loan Trust, | ||||||||
0.336%, 04/25/2022 (C) | 305 | 304 | ||||||
SLM Student Loan Trust, | ||||||||
0.426%, 01/25/2041 (C) | 1,900 | 1,650 | ||||||
SLM Student Loan Trust, | ||||||||
0.436%, 07/25/2025 (C) | 391 | 338 | ||||||
SLM Student Loan Trust, | ||||||||
0.579%, 03/25/2025 (C) | 911 | 908 | ||||||
SLM Student Loan Trust, | ||||||||
1.129%, 09/25/2028 (C) | 1,910 | 1,933 | ||||||
SLM Student Loan Trust, | ||||||||
1.179%, 04/27/2043 (C) | 564 | 505 | ||||||
SLM Student Loan Trust, | ||||||||
1.679%, 06/25/2043 (C) | 281 | 265 | ||||||
SLM Student Loan Trust, | ||||||||
0.479%, 05/26/2020 (C) | 551 | 548 | ||||||
SLM Student Loan Trust, | ||||||||
1.679%, 09/25/2043 (C) | 291 | 278 | ||||||
SLM Student Loan Trust, | ||||||||
0.729%, 06/25/2027 (C) | 1,499 | 1,499 | ||||||
SLM Student Loan Trust, | ||||||||
0.627%, 10/26/2020 (C) | 403 | 402 | ||||||
SLM Student Loan Trust, | ||||||||
0.816%, 10/26/2026 (C) | 1,926 | 1,699 | ||||||
SLM Student Loan Trust, | ||||||||
1.030%, 02/15/2022 | 928 | 928 | ||||||
SLM Student Loan Trust, | ||||||||
3.130%, 10/15/2031 | 843 | 852 | ||||||
SMS Student Loan Trust, | ||||||||
0.464%, 04/28/2029 (C) | 406 | 405 | ||||||
| SEI Institutional Managed Trust / Annual Report / September 30, 2013 | 103 |
SCHEDULE OF INVESTMENTS
Core Fixed Income Fund (Continued)
September 30, 2013
| Description | Face Amount ($ Thousands) | Market Value ($ Thousands) | ||||||
Sound Point CLO Ltd., | ||||||||
3.576%, 10/20/2023 (C) (D) | $ | 750 | $ | 746 | ||||
Structured Asset Securities Mortgage Loan Trust, | ||||||||
0.434%, 11/25/2037 (C) | 1,679 | 1,624 | ||||||
SunTrust Student Loan Trust, | ||||||||
0.384%, 01/30/2023 (C) (D) | 1,834 | 1,815 | ||||||
Symphony CLO Ltd., | ||||||||
3.518%, 04/16/2022 (C) (D) | 750 | 750 | ||||||
TAL Advantage I, | ||||||||
0.370%, 04/20/2021 (C) (D) | 749 | 738 | ||||||
TAL Advantage I, | ||||||||
4.300%, 10/20/2025 (D) | 1,116 | 1,120 | ||||||
TAL Advantage I, | ||||||||
4.600%, 01/20/2026 (D) | 183 | 186 | ||||||
Textainer Marine Containers, | ||||||||
0.430%, 05/15/2020 (C) (D) | 754 | 746 | ||||||
Trinity Rail Leasing L.P., | ||||||||
5.900%, 05/14/2036 (D) | 1,103 | 1,222 | ||||||
Trip Rail Master Funding LLC, | ||||||||
4.370%, 07/15/2041 (D) | 1,630 | 1,723 | ||||||
Triton Container Finance LLC, | ||||||||
0.350%, 11/26/2021 (C) (D) | 1,393 | 1,367 | ||||||
Triton Container Finance LLC, | ||||||||
0.320%, 02/26/2019 (C) (D) | 549 | 544 | ||||||
Wells Fargo Home Equity Asset-Backed SecuritiesTrust, | ||||||||
0.434%, 07/25/2036 (C) | 4,000 | 3,581 | ||||||
|
| |||||||
| 131,308 | ||||||||
|
| |||||||
Total Asset-Backed Securities | 203,859 | |||||||
|
| |||||||
U.S. GOVERNMENT AGENCY OBLIGATIONS — 2.0% |
| |||||||
FHLB | ||||||||
5.500%, 07/15/2036 | 1,580 | 1,867 | ||||||
2.500%, 05/26/2015 (G) | 3,410 | 3,271 | ||||||
FHLMC | ||||||||
6.750%, 03/15/2031 | 1,170 | 1,586 | ||||||
1.350%, 04/29/2014 | 560 | 564 | ||||||
0.100%, 12/09/2013 (B) (I) | 730 | 730 | ||||||
| Description | Face Amount ($ Thousands) | Market Value ($ Thousands) | ||||||
FICO STRIPS | ||||||||
9.800%, 04/06/2018 | $ | 850 | $ | 1,157 | ||||
9.700%, 04/05/2019 | 1,050 | 1,466 | ||||||
8.600%, 09/26/2019 | 2,490 | 3,368 | ||||||
0.092%, 11/02/2018 (F) | 1,800 | 1,660 | ||||||
0.091%, 08/03/2018 (F) | 1,820 | 1,679 | ||||||
0.090%, 04/06/2018 (F) | 1,550 | 1,441 | ||||||
0.080%, 09/26/2019 (F) | 100 | 88 | ||||||
0.070%, 06/06/2019 (F) | 250 | 224 | ||||||
0.060%, 03/07/2019 (F) | 770 | 698 | ||||||
0.050%, 02/08/2018 (F) | 510 | 478 | ||||||
0.040%, 08/03/2018 (F) | 780 | 724 | ||||||
0.030%, 08/03/2018 (F) | 820 | 756 | ||||||
0.020%, 08/03/2018 (F) | 1,470 | 1,356 | ||||||
0.010%, 05/11/2018 (F) | 3,295 | 3,056 | ||||||
FNMA | ||||||||
6.250%, 05/15/2029 | 2,110 | 2,701 | ||||||
6.001%, 10/09/2019 (F) | 1,520 | 1,289 | ||||||
0.120%, 02/24/2014 | 570 | 570 | ||||||
Resolution Funding STRIPS | ||||||||
1.593%, 07/15/2020 (F) | 820 | 696 | ||||||
Tennessee Valley Authority | ||||||||
5.250%, 09/15/2039 | 880 | 959 | ||||||
4.625%, 09/15/2060 | 1,370 | 1,299 | ||||||
3.875%, 02/15/2021 | 1,510 | 1,622 | ||||||
1.750%, 10/15/2018 | 3,140 | 3,132 | ||||||
|
| |||||||
Total U.S. Government Agency Obligations |
| 38,437 | ||||||
|
| |||||||
SOVEREIGN DEBT — 1.7% |
| |||||||
Banco Nacional de Desenvolvimento Economico e Social | ||||||||
5.750%, 09/26/2023 (D) | 430 | 430 | ||||||
3.375%, 09/26/2016 (D) | 240 | 241 | ||||||
Brazil Notas do Tesouro Nacional Serie F | ||||||||
10.000%, 01/01/2021 | BRL | 7,250 | 3,013 | |||||
FMS Wertmanagement AoeR | ||||||||
1.000%, 11/21/2017 | 640 | 630 | ||||||
Japan Bank for International Cooperation | ||||||||
3.375%, 07/31/2023 | 675 | 677 | ||||||
1.750%, 07/31/2018 (E) | 1,185 | 1,181 | ||||||
Japan Finance Organization for Municipalities | ||||||||
4.000%, 01/13/2021 | 1,800 | 1,938 | ||||||
Kommunalbanken | ||||||||
1.125%, 05/23/2018 (D) | 3,420 | 3,327 | ||||||
Mexican Bonos | ||||||||
8.000%, 06/11/2020 | MXP | 32,070 | 2,773 | |||||
6.500%, 06/09/2022 | MXP | 73,089 | 5,749 | |||||
| 104 | SEI Institutional Managed Trust / Annual Report / September 30, 2013 |
| Description | Face Amount ($ Thousands) | Market Value ($ Thousands) | ||||||
Mexico Government International Bond MTN | ||||||||
5.750%, 10/12/2110 | $ | 1,512 | $ | 1,421 | ||||
4.750%, 03/08/2044 | 1,180 | 1,068 | ||||||
4.000%, 10/02/2023 | 126 | 125 | ||||||
Province of Ontario Canada | ||||||||
0.950%, 05/26/2015 | 900 | 907 | ||||||
Province of Quebec Canada | ||||||||
2.625%, 02/13/2023 | 685 | 637 | ||||||
Republic of Korea | ||||||||
3.875%, 09/11/2023 | 520 | 529 | ||||||
Russian Federal Bond -OFZ | ||||||||
7.000%, 01/25/2023 | RUB | 102,310 | 3,119 | |||||
Russian Foreign Bond - Eurobond | ||||||||
4.875%, 09/16/2023 (D) | 800 | 818 | ||||||
Slovakia Government International Bond | ||||||||
4.375%, 05/21/2022 (D) (E) | 1,545 | 1,594 | ||||||
Slovenia Government International Bond | ||||||||
5.850%, 05/10/2023 (D) | 310 | 295 | ||||||
5.500%, 10/26/2022 (D) | 403 | 375 | ||||||
4.750%, 05/10/2018 (D) (E) | 1,010 | 972 | ||||||
Spain Government International Bond MTN | ||||||||
4.000%, 03/06/2018 (D) | 500 | 508 | ||||||
United Mexican States MTN | ||||||||
6.050%, 01/11/2040 | 248 | 271 | ||||||
|
| |||||||
Total Sovereign Debt | 32,598 | |||||||
|
| |||||||
MUNICIPAL BONDS — 1.2% |
| |||||||
Arizona State University, | ||||||||
5.000%, 07/01/2043 | 90 | 93 | ||||||
Brazos, Higher Education Authority, Ser2006-2, RB | ||||||||
0.283%, 12/26/2024 (C) | 560 | 538 | ||||||
City of Houston, Ser A, GO | ||||||||
6.290%, 03/01/2032 | 1,850 | 2,087 | ||||||
City of New York, Ser J, GO Callable 08/01/23 @ 100 | ||||||||
5.000%, 08/01/2025 | 110 | 126 | ||||||
City of Richmond, Ser A, GO Callable 03/01/23 @ 100 | ||||||||
5.000%, 03/01/2027 | 90 | 101 | ||||||
5.000%, 03/01/2028 | 90 | 101 | ||||||
5.000%, 03/01/2029 | 100 | 111 | ||||||
City Public Service Board of San Antonio, RB | ||||||||
5.000%, 02/01/2043 | 320 | 332 | ||||||
| Description | Face Amount ($ Thousands) | Market Value ($ Thousands) | ||||||
County of Clark, Ser C, RB | ||||||||
6.820%, 07/01/2045 | $ | 510 | $ | 634 | ||||
Los Angeles, Community College District, GO | ||||||||
6.750%, 08/01/2049 | 490 | 606 | ||||||
New Jersey, Economic Development Authority, RB Callable 06/15/23 @ 100 | ||||||||
5.000%, 06/15/2046 | 120 | 123 | ||||||
New Jersey State, Turnpike Authority, Ser A, RB | ||||||||
5.000%, 01/01/2043 | 130 | 132 | ||||||
New Jersey State, Turnpike Authority, Ser C, RB | ||||||||
7.102%, 01/01/2041 | 620 | 783 | ||||||
New Jersey, Transportation Trust Fund Authority, Ser A, RB Callable 06/15/22 @ 100 | ||||||||
5.000%, 06/15/2042 | 210 | 213 | ||||||
New Jersey, Transportation Trust Fund Authority, Ser AA, RB Callable 06/15/22 @ 100 | ||||||||
5.000%, 06/15/2038 | 290 | 296 | ||||||
New York City, Water & Sewer System, Ser BB, RB | ||||||||
5.000%, 06/15/2047 | 90 | 93 | ||||||
New York City, Water & Sewer System, Ser EE, RB Callable 06/15/2023 @ 100 | ||||||||
5.000%, 06/15/2047 | 90 | 93 | ||||||
New York, Liberty Development, RB | ||||||||
5.000%, 12/15/2041 | 170 | 173 | ||||||
New York State, Dormitory Authority, Ser A, RB | ||||||||
5.000%, 12/15/2026 | 80 | 90 | ||||||
5.000%, 12/15/2027 | 210 | 235 | ||||||
New York State, Urban Development, Ser C, RB | ||||||||
5.000%, 03/15/2027 | 400 | 449 | ||||||
North Texas, Tollway Authority, Ser B, RB | ||||||||
6.718%, 01/01/2049 | 564 | 679 | ||||||
Northeast Ohio, Regional Sewer District, RB | ||||||||
5.000%, 11/15/2043 | 190 | 198 | ||||||
| SEI Institutional Managed Trust / Annual Report / September 30, 2013 | 105 |
SCHEDULE OF INVESTMENTS
Core Fixed Income Fund (Continued)
September 30, 2013
| Description | Face Amount ($ Thousands) | Market Value ($ Thousands) | ||||||
Ohio State, Turnpike | ||||||||
5.000%, 02/15/2048 | $ | 390 | $ | 394 | ||||
Ohio State, Turnpike Commission, Ser A, RB | ||||||||
5.000%, 02/15/2048 | 170 | 175 | ||||||
Ohio State University, Ser A, RB | ||||||||
4.800%, 06/01/2111 | 202 | 175 | ||||||
Pennsylvania, Turnpike Commission, Ser C, RB | ||||||||
5.000%, 12/01/2043 | 140 | 142 | ||||||
Port Authority of New York & New Jersey, RB | ||||||||
4.458%, 10/01/2062 | 660 | 558 | ||||||
Private Colleges & Universities Authority, Ser A, RB | ||||||||
5.000%, 10/01/2043 | 190 | 202 | ||||||
South Carolina, Student Loan, | ||||||||
0.381%, 12/01/2020 (C) | 1,850 | 1,829 | ||||||
State of California, GO | ||||||||
5.000%, 09/01/2025 | 250 | 283 | ||||||
State of California, GO | ||||||||
5.000%, 04/01/2042 | 240 | 245 | ||||||
State of California, GO | ||||||||
7.600%, 11/01/2040 | 450 | 593 | ||||||
7.300%, 10/01/2039 | 790 | 994 | ||||||
6.650%, 03/01/2022 | 610 | 729 | ||||||
6.200%, 03/01/2019 | 1,775 | 2,074 | ||||||
State of California, Ser B, GO | ||||||||
5.000%, 09/01/2023 | 350 | 408 | ||||||
State of Connecticut, Ser C, GO Callable 07/15/23 @ 100 | ||||||||
5.000%, 07/15/2024 | 120 | 140 | ||||||
State of Illinois, GO | ||||||||
5.877%, 03/01/2019 | 2,260 | 2,425 | ||||||
5.365%, 03/01/2017 | 315 | 341 | ||||||
5.100%, 06/01/2033 | 2,725 | 2,416 | ||||||
State of Texas, GO | ||||||||
5.517%, 04/01/2039 | 850 | 958 | ||||||
Utah, Transit Authority, RB | ||||||||
5.000%, 06/15/2042 | 340 | 347 | ||||||
|
| |||||||
Total Municipal Bonds | 23,714 | |||||||
|
| |||||||
LOAN PARTICIPATIONS — 1.2% |
| |||||||
Advanced Disposal Services | ||||||||
4.250%, 10/05/2019 | 310 | 310 | ||||||
| Description | Face Amount ($ Thousands) | Market Value ($ Thousands) | ||||||
AMR | ||||||||
4.750%, 06/21/2019 | $ | 650 | $ | 645 | ||||
Amscan Holdings | ||||||||
4.250%, 07/23/2019 | 460 | 458 | ||||||
Aramark, Term Loan | ||||||||
3.776%, 07/26/2016 | 133 | 133 | ||||||
Aramark, Term Loan B | ||||||||
3.698%, 07/26/2016 | 285 | 285 | ||||||
Brickman Group Holdings, Term Loan | ||||||||
3.259%, 10/14/2016 | 988 | 989 | ||||||
Charter Communications, | ||||||||
3.000%, 01/19/2021 | 700 | 692 | ||||||
Crown Castle, Term Loan, 1st Lien | ||||||||
3.250%, 01/31/2019 | 494 | 487 | ||||||
CSC Holdings, Term Loan B | ||||||||
2.682%, 04/17/2020 | 700 | 691 | ||||||
Del Monte Foods, Term Loan | ||||||||
4.000%, 03/08/2018 | 1,270 | 1,264 | ||||||
Dunkin’ Brands, Term Loan B-3 | ||||||||
3.750%, 02/14/2020 | 740 | 738 | ||||||
First Data, 1st Lien Term Loan | ||||||||
4.180%, 09/24/2018 | 1,000 | 989 | ||||||
First Data, Term Loan | ||||||||
4.184%, 03/24/2018 | 1,515 | 1,498 | ||||||
Fortescue Metals Group, | ||||||||
5.250%, 10/18/2017 | 1,290 | 1,293 | ||||||
Gardner Denver, Term Loan, 1st Lien | ||||||||
4.250%, 07/30/2020 | 520 | 514 | ||||||
H.J. Heinz | ||||||||
3.250%, 03/27/2019 | 150 | 150 | ||||||
H.J. Heinz, Term Loan B2 | ||||||||
3.500%, 06/07/2020 | 650 | 651 | ||||||
Hilton Hotels, Term Loan B, Cov-Lite 1st Lien | ||||||||
0.000%, 09/23/2020 (A) | 320 | 319 | ||||||
Intelsat Jackson Holdings, Term Loan B1 | ||||||||
4.250%, 04/02/2018 | 695 | 696 | ||||||
Las Vegas Sands, Term Loan B | ||||||||
2.690%, 05/23/2014 | 1,066 | 1,063 | ||||||
Michaels Stores, Term Loan, Tranche 1 | ||||||||
3.750%, 01/28/2020 | 479 | 478 | ||||||
Neiman Marcus Group, Term Loan | ||||||||
4.000%, 05/16/2018 | 608 | 607 | ||||||
NRG Energy, Term Loan | ||||||||
2.750%, 07/01/2018 | 650 | 645 | ||||||
Par Pharmaceutical | ||||||||
4.250%, 09/18/2019 | 660 | 657 | ||||||
| 106 | SEI Institutional Managed Trust / Annual Report / September 30, 2013 |
| Description | Face Amount ($ Thousands)/Shares | Market Value ($ Thousands) | ||||||
Phillip Van-Heusen, Term Loan B, Tranche 1 | ||||||||
3.250%, 02/13/2020 | $ | 290 | $ | 289 | ||||
Schaeffler AG, Term Loan C, 1st Lien | ||||||||
4.250%, 01/27/2017 | 400 | 401 | ||||||
Silver II Acquisition, Term Loan | ||||||||
4.000%, 12/13/2019 | 630 | 624 | ||||||
SunGard Data Systems, Term Loan E | ||||||||
4.000%, 03/08/2020 | 818 | 819 | ||||||
Supervalu, 1st Lien Term Loan B | ||||||||
5.000%, 03/21/2019 | 649 | 647 | ||||||
Telesat Canada, Term Loan B | ||||||||
3.500%, 03/28/2019 | 495 | 492 | ||||||
Univision Communications | ||||||||
4.500%, 03/01/2020 | 1,738 | 1,717 | ||||||
Virgin Media, Term Loan B | ||||||||
3.500%, 06/05/2020 | 740 | 735 | ||||||
Wendy’s / Arby’s Group | ||||||||
3.250%, 05/15/2019 | 711 | 708 | ||||||
Windstream, Term Loan B4 | ||||||||
3.500%, 01/23/2020 | 200 | 199 | ||||||
|
| |||||||
Total Loan Participations |
| 22,883 | ||||||
|
| |||||||
PREFERRED STOCK — 0.1% |
| |||||||
Citigroup Capital XIII | 24,750 | 680 | ||||||
|
| |||||||
Total Preferred Stock |
| 680 | ||||||
|
| |||||||
U.S. TREASURY OBLIGATIONS — 17.9% |
| |||||||
U.S. Treasury Bills (F) | ||||||||
0.078%, 11/14/2013 (E) | 3,500 | 3,500 | ||||||
0.030%, 12/05/2013 (I) | 447 | 447 | ||||||
U.S. Treasury Bonds | ||||||||
7.625%, 02/15/2025 | 2,950 | 4,357 | ||||||
4.375%, 05/15/2041 | 1,432 | 1,619 | ||||||
3.625%, 08/15/2043 (E) | 11,207 | 11,078 | ||||||
3.125%, 11/15/2041 | 20,240 | 18,251 | ||||||
3.125%, 02/15/2042 | 17,615 | 15,859 | ||||||
3.125%, 02/15/2043 | 1,524 | 1,365 | ||||||
3.000%, 05/15/2042 | 1,030 | 902 | ||||||
2.875%, 05/15/2043 (E) | 13,232 | 11,231 | ||||||
2.750%, 08/15/2042 (I) | 11,557 | 9,580 | ||||||
2.750%, 11/15/2042 (E) | 10,429 | 8,632 | ||||||
U.S. Treasury Inflation Protected Securities | ||||||||
2.125%, 02/15/2040 | 919 | 1,087 | ||||||
2.125%, 02/15/2041 | 5,360 | 6,349 | ||||||
2.000%, 07/15/2014 | 17,164 | 17,597 | ||||||
| Description | Face Amount ($ Thousands)/Shares | Market Value ($ Thousands) | ||||||
1.250%, 04/15/2014 | $ | 5,458 | $ | 5,502 | ||||
0.750%, 02/15/2042 | 1,303 | 1,115 | ||||||
0.500%, 04/15/2015 | 8,995 | 9,189 | ||||||
0.125%, 04/15/2016 | 10,969 | 11,257 | ||||||
0.125%, 04/15/2017 | 19,237 | 19,837 | ||||||
0.125%, 04/15/2018 | 9,590 | 9,879 | ||||||
U.S. Treasury Notes | ||||||||
3.500%, 02/15/2018 | 3,340 | 3,669 | ||||||
3.125%, 04/30/2017 | 8,471 | 9,141 | ||||||
2.750%, 10/31/2013 | 6,875 | 6,890 | ||||||
2.750%, 11/30/2016 | 1,756 | 1,867 | ||||||
2.500%, 08/15/2023 | 7,529 | 7,452 | ||||||
2.000%, 09/30/2020 | 1,255 | 1,254 | ||||||
2.000%, 02/15/2023 | 15,100 | 14,382 | ||||||
1.750%, 05/15/2023 (E) | 9,980 | 9,248 | ||||||
1.500%, 12/31/2013 | 4,495 | 4,509 | ||||||
1.500%, 08/31/2018 | 4,741 | 4,772 | ||||||
1.375%, 11/30/2015 | 1,966 | 2,008 | ||||||
1.375%, 06/30/2018 (E) | 12,825 | 12,858 | ||||||
1.375%, 07/31/2018 | 4,448 | 4,456 | ||||||
1.375%, 09/30/2018 | 27,982 | 27,962 | ||||||
1.000%, 03/31/2017 | 4,413 | 4,433 | ||||||
0.875%, 09/15/2016 | 5,645 | 5,686 | ||||||
0.625%, 08/15/2016 | 16,212 | 16,221 | ||||||
0.375%, 06/30/2015 | 8,095 | 8,109 | ||||||
0.375%, 08/31/2015 | 14,568 | 14,585 | ||||||
0.375%, 11/15/2015 | 100 | 100 | ||||||
0.250%, 07/31/2015 | 1,521 | 1,520 | ||||||
0.250%, 10/15/2015 | 10,302 | 10,283 | ||||||
U.S. Treasury STRIPS | ||||||||
2.638%, 11/15/2027 (F) | 5,135 | 3,204 | ||||||
|
| |||||||
Total U.S. Treasury Obligations (Cost $350,988) ($ Thousands) |
| 343,242 | ||||||
|
| |||||||
AFFILIATED PARTNERSHIP — 4.6% |
| |||||||
SEI Liquidity Fund, L.P. 0.070%**† (H) | 88,894,643 | 88,895 | ||||||
|
| |||||||
Total Affiliated Partnership |
| 88,895 | ||||||
|
| |||||||
CASH EQUIVALENT — 3.5% |
| |||||||
SEI Daily Income Trust, Prime Obligation Fund, Cl A 0.010%**† | 67,809,716 | 67,810 | ||||||
|
| |||||||
Total Cash Equivalent | 67,810 | |||||||
|
| |||||||
Total Investments — 113.0% |
| $ | 2,168,299 | |||||
|
| |||||||
| SEI Institutional Managed Trust / Annual Report / September 30, 2013 | 107 |
SCHEDULE OF INVESTMENTS
Core Fixed Income Fund (Concluded)
September 30, 2013
| Description | Contracts | Market Value ($ Thousands) | ||||||
PURCHASED SWAPTIONS — 0.1%*†† |
| |||||||
April 2018, 3-Month LIBOR Put, Expires: 03/15/2018, Strike Rate: 4.500% | 4,800,000 | $ | 506 | |||||
April 2018, 3-Month LIBOR Put, Expires: 04/09/2018, Strike Rate: 4.500% | 5,810,000 | 564 | ||||||
March 2018, 3-Month LIBOR Put, Expires: 03/15/2018, Strike Rate: 4.500% | 4,800,000 | 507 | ||||||
|
| |||||||
Total Purchased Swaption | $ | 1,577 | ||||||
|
| |||||||
WRITTEN OPTIONS — 0.0%*†† |
| |||||||
November 2020, U.S. CPI Consumers NSA Call, Expires: 11/21/2020, Strike Inflation: 0.000%, | (3,990,000 | ) | $ | (2 | ) | |||
October 2013, 3-Month LIBOR Put Expires: 10/10/2013, Strike Rate 3.500% | �� | (6,990,000 | ) | — | ||||
|
| |||||||
Total Written Options |
| $ | (2 | ) | ||||
|
| |||||||
A list of the open futures contracts held by the Fund at September 30, 2013, is as follows:
| Type of Contract | Number of Contracts Long (Short) | Expiration Date | Unrealized Appreciation (Depreciation) ($ Thousands) | |||||||||
90-Day Euro$ | 120 | Dec-2014 | $ | 23 | ||||||||
90-Day Euro$ | (120 | ) | Dec-2015 | (42 | ) | |||||||
U.S. 10-Year Treasury Note | (104 | ) | Dec-2013 | (200 | ) | |||||||
U.S. 2-Year Treasury Note | (351 | ) | Dec-2013 | (215 | ) | |||||||
U.S. 5-Year Treasury Note | 391 | Dec-2013 | 246 | |||||||||
U.S. Long Treasury Bond | (61 | ) | Dec-2013 | (210 | ) | |||||||
U.S. Ultra Long Treasury Bond | (17 | ) | Dec-2013 | (28 | ) | |||||||
|
| |||||||||||
| $ | (426 | ) | ||||||||||
|
| |||||||||||
For the year ended September 30, 2013, the total amount of all open futures contracts, as presented in the table above, are representative of the volume of activity for this derivative type during the year.
A list of the open forward foreign currency contracts held by the Fund at September 30, 2013, is as follows:
| Maturity Date | Currency to Deliver (Thousands) | Currency to Receive (Thousands) | Unrealized Depreciation ($ Thousands) | |||||||||||||||||
10/31/13 | PHP | 140,200 | USD | 3,212 | $ | (11 | ) | |||||||||||||
10/31/13 | USD | 3,238 | PHP | 140,200 | (16 | ) | ||||||||||||||
11/15/13 | AUD | 3,350 | USD | 3,068 | (65 | ) | ||||||||||||||
11/15/13 | EUR | 12,876 | USD | 17,094 | (335 | ) | ||||||||||||||
11/15/13 | JPY | 1,006,730 | USD | 10,238 | (25 | ) | ||||||||||||||
|
| |||||||||||||||||||
| $ | (452 | ) | ||||||||||||||||||
|
| |||||||||||||||||||
A list of the open forward foreign currency contracts held by the Fund at September 30, 2013, is as follows:
| Counterparty | Currency to Deliver ($ Thousands) | Currency to Receive ($ Thousands) | Unrealized Depreciation ($ Thousands) | |||||||||
Barclays Capital | $ | (3,501 | ) | $ | 3,492 | $ | (9 | ) | ||||
Citigroup | (27,676 | ) | 27,344 | (332 | ) | |||||||
JPMorgan Chase Bank | (6,110 | ) | 5,998 | (111 | ) | |||||||
|
| |||||||||||
| $ | (452 | ) | ||||||||||
|
| |||||||||||
For the year ended September 30, 2013, the total amount of all forward foreign currency contracts, as presented in the table above, are representative of the volume of activity for this derivative type during the year.
A list of outstanding OTC swap agreements held by the Fund at September 30, 2013, is as follows:
| Credit Default Swaps | ||||||||||||||||||
| Counterparty | Reference Entity/Obligation | Buy/Sell Protection | (Pays)/ Receives Rate | Termination Date | Notional Amount (Thousands) | Net Unrealized Appreciation ($ Thousands) | ||||||||||||
| Deutsche Bank | Metlife, Inc. | SELL | 1.00 | 06/20/18 | (1,590) | $ | 48 | |||||||||||
|
| |||||||||||||||||
| Interest Rate Swaps | ||||||||||||||
| Counterparty | Fund Pays | Fund Receives | Termination Date | Notional Amount (Thousands) | Net Unrealized Appreciation (Depreciation) ($ Thousands) | |||||||||
| Barclays Capital | 3.49% | 3-Month LIBOR | 03/15/46 | 3,370 | $ | 359 | ||||||||
| Barclays Capital | 2.42% | 3-Month LIBOR | 11/15/27 | 1,620 | 103 | |||||||||
| Barclays Capital | 2.48% | 3-Month LIBOR | 11/15/27 | 1,620 | 117 | |||||||||
| Barclays Capital | 3-Month LIBOR | 3.15% | 03/15/26 | 7,520 | (414 | ) | ||||||||
| Citigroup | 2.71% | 3-Month LIBOR | 08/15/42 | 3,245 | 568 | |||||||||
| Goldman Sachs | 3.13% | 3-Month LIBOR | 04/09/46 | 3,550 | 615 | |||||||||
| Goldman Sachs | 2.80% | 3-Month LIBOR | 04/09/46 | 7,870 | (675 | ) | ||||||||
|
| |||||||||||||
| $ | 673 | |||||||||||||
|
| |||||||||||||
| 108 | SEI Institutional Managed Trust / Annual Report / September 30, 2013 |
Percentages are based on a Net Assets of $1,918,751 ($ Thousands).
| * | Non-income producing security. |
| ** | The rate reported is the 7-day effective yield as of September 30, 2013. |
| † | Investment in Affiliated Security (See Note 6). |
| †† | For the year ended September 30, 2013, the total amount of open purchased swaptions and written options, as presented in the Schedule of Investments, are representative of the volume of activity for these derivative types during the year. |
| ‡ | Real Estate Investment Trust. |
| (1) | In U.S. Dollars unless otherwise indicated. |
| (A) | Unfunded bank loan. Interest rate not available. |
| (B) | Zero coupon security. The rate reported on the Schedule of Investments is the effective yield at time of purchase. |
| (C) | Variable Rate Security — The rate reported on the Schedule of Investments is the rate in effect as of September 30, 2013. The date reported on the Schedule of Investments is the final maturity date. |
| (D) | Securities sold within terms of a private placement memorandum, exempt from registration under Section 144A of the Securities Act of 1933, as amended, and may be sold only to dealers in that program or other “accredited investors.” These securities have been determined to be liquid under guidelines established by the Board of Trustees. |
| (E) | This security or a partial position of this security is on loan at September 30, 2013. The total value of securities on loan at September 30, 2013 was $86,200 ($ Thousands). |
| (F) | The rate reported on the Schedule of Investments is the effective yield at time of purchase. |
| (G) | Step Bonds — The rate reflected on the Schedule of Investments is the effective yield on September 30, 2013. The coupon on a step bond changes on a specified date. |
| (H) | This security was purchased with cash collateral held from securities on loan (see Note 10). The total value of such securities as of September 30, 2013 was $88,895 ($ Thousands). |
| (I) | Security, or portion thereof, has been pledged as collateral on open futures contracts. |
ABS — Asset-Backed Security
ARM — Adjustable Rate Mortgage
AUD — Australian Dollar
BRL — Brazilian Real
Cl — Class
CLO — Collateralized Loan Obligation
CMO — Collateralized Mortgage Obligation
EUR — Euro
FDIC — Federal Deposit Insurance Corporation
FHLB — Federal Home Loan Bank
FHLMC — Federal Home Loan Mortgage Corporation
FICO — Financing Corporation
FNMA — Federal National Mortgage Association
GNMA — Government National Mortgage Association
GO — General Obligation
GTD STD LNS — Guaranteed Student Loans
IO — Interest Only — face amount represents notional amount
JPY — Japanese Yen
LIBOR — London Inter Bank Offered Rate
LLC — Limited Liability Company
L.P. — Limited Partnership
Ltd. — Limited
MTN — Medium Term Note
MXP — Mexican Peso
NCUA — National Credit Union Administration
OTC— Over The Counter
PHP — Philippine Peso
PLC — Public Limited Company
PO — Principal Only
RB — Revenue Bond
RUB — Russian Ruble
Ser — Series
STRIPS — Separately Traded Registered Interest and Principal Securities
TBA — To Be Announced
USD — United States Dollar
The following is a list of the level of inputs used as of September 30, 2013, in valuing the Fund’s investments and other financial instruments carried at value ($ Thousands):
| Investments in Securities | Level 1 | Level 2 | Level 3 | Total | ||||||||||||
Mortgage-Backed Securities | $ | — | $ | 776,221 | $ | — | $ | 776,221 | ||||||||
Corporate Obligations | — | 569,960 | — | 569,960 | ||||||||||||
Asset-Backed Securities | — | 203,859 | — | 203,859 | ||||||||||||
U.S. Government Agency Obligations | — | 38,437 | — | 38,437 | ||||||||||||
Sovereign Debt | — | 32,598 | — | 32,598 | ||||||||||||
Municipal Bonds | — | 23,714 | — | 23,714 | ||||||||||||
Loan Participations | — | 22,883 | — | 22,883 | ||||||||||||
Preferred Stock | 680 | — | — | 680 | ||||||||||||
U.S. Treasury Obligations | — | 343,242 | — | 343,242 | ||||||||||||
Affiliated Partnership | — | 88,895 | — | 88,895 | ||||||||||||
Cash Equivalent | 67,810 | — | — | 67,810 | ||||||||||||
|
|
|
|
|
|
|
| |||||||||
Total Investments in Securities | $ | 68,490 | $ | 2,099,809 | $ | — | $ | 2,168,299 | ||||||||
|
|
|
|
|
|
|
| |||||||||
| Other Financial Instruments | Level 1 | Level 2 | Level 3 | Total | ||||||||||||
Purchased Swaptions | $ | — | $ | 1,577 | $ | — | $ | 1,577 | ||||||||
Written Options | — | (2 | ) | — | (2 | ) | ||||||||||
Futures Contracts* | ||||||||||||||||
Unrealized Appreciation | 269 | — | — | 269 | ||||||||||||
Unrealized Depreciation | (695 | ) | — | — | (695 | ) | ||||||||||
Forwards Contracts* | ||||||||||||||||
Unrealized Depreciation | — | (452 | ) | — | (452 | ) | ||||||||||
OTC Swaps | ||||||||||||||||
Credit Default Swaps* | ||||||||||||||||
Unrealized Appreciation | — | 48 | — | 48 | ||||||||||||
Interest Rate Swaps* | ||||||||||||||||
Unrealized Appreciation | — | 1,762 | — | 1,762 | ||||||||||||
Unrealized Depreciation | — | (1,089 | ) | — | (1,089 | ) | ||||||||||
|
|
|
|
|
|
|
| |||||||||
Total Other Financial Instruments | $ | (426 | ) | $ | 1,844 | $ | — | $ | 1,418 | |||||||
|
|
|
|
|
|
|
| |||||||||
| * | Futures contracts, forwards contracts and swaps are valued at the unrealized appreciation (depreciation) on the instrument. |
For the year ended September 30, 2013, there have been no transfers between Level 1 and Level 2 assets and liabilities.
For the year ended September 30, 2013, there have been no transfers between Level 2 and Level 3 assets and liabilities.
For more information on valuation inputs, see Note 2 — Significant Accounting Policies in Notes to Financial Statements.
Amounts designated as “—” are $0 or have been rounded to $0.
The accompanying notes are an integral part of the financial statements.
| SEI Institutional Managed Trust / Annual Report / September 30, 2013 | 109 |
SCHEDULE OF INVESTMENTS
U.S. Fixed Income Fund
September 30, 2013
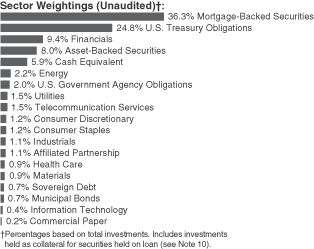
| Description | Face Amount ($ Thousands) | Market Value ($ Thousands) | ||||||
MORTGAGE-BACKED SECURITIES — 39.6% |
| |||||||
Agency Mortgage-Backed Obligations — 32.7% |
| |||||||
FHLMC | ||||||||
11.000%, 02/17/2021 | $ | 161 | $ | 164 | ||||
10.000%, 03/17/2026 to 10/01/2030 | 789 | 913 | ||||||
7.500%, 01/01/2032 to 09/01/2038 | 843 | 974 | ||||||
6.500%, 10/01/2031 to 09/01/2038 | 1,361 | 1,509 | ||||||
6.000%, 08/01/2015 to 09/01/2038 | 2,104 | 2,295 | ||||||
5.500%, 06/01/2020 to 01/01/2039 | 6,113 | 6,604 | ||||||
5.000%, 03/01/2034 to 04/01/2042 | 6,862 | 7,480 | ||||||
4.500%, 04/01/2035 to 11/01/2042 | 4,071 | 4,366 | ||||||
4.000%, 06/01/2033 to 07/01/2043 | 11,100 | 11,626 | ||||||
3.500%, 03/01/2033 to 08/01/2043 | 7,447 | 7,521 | ||||||
3.165%, 02/01/2042 | 537 | 548 | ||||||
3.000%, 07/01/2032 to 06/01/2043 | 2,189 | 2,136 | ||||||
2.856%, 05/01/2042 | 371 | 373 | ||||||
2.673%, 07/01/2042 | 555 | 555 | ||||||
2.642%, 09/01/2042 | 958 | 954 | ||||||
2.500%, 11/01/2027 to 05/01/2028 | 1,580 | 1,592 | ||||||
2.375%, 01/13/2022 | 1,500 | 1,460 | ||||||
1.250%, 10/02/2019 | 70 | 67 | ||||||
0.500%, 09/14/2015 | 1,870 | 1,871 | ||||||
0.100%, 12/18/2013 (G) | 140 | 140 | ||||||
0.084%, 01/27/2014 | 1,900 | 1,900 | ||||||
| Description | Face Amount ($ Thousands) | Market Value ($ Thousands) | ||||||
FHLMC ARM (C) | ||||||||
6.479%, 10/01/2037 | $ | 212 | $ | 231 | ||||
6.354%, 02/01/2037 | 76 | 81 | ||||||
6.012%, 04/01/2037 | 18 | 20 | ||||||
5.556%, 06/01/2037 | 134 | 143 | ||||||
5.074%, 11/01/2036 | 64 | 68 | ||||||
5.055%, 07/01/2036 | 113 | 122 | ||||||
4.989%, 01/01/2035 | 100 | 106 | ||||||
4.916%, 02/01/2036 | 333 | 354 | ||||||
3.363%, 03/01/2036 | 815 | 876 | ||||||
3.069%, 11/01/2036 | 50 | 53 | ||||||
3.054%, 03/01/2037 | 242 | 257 | ||||||
2.930%, 05/01/2037 | 481 | 512 | ||||||
2.902%, 04/01/2037 | 113 | 120 | ||||||
2.888%, 05/01/2037 | 360 | 386 | ||||||
2.751%, 05/01/2038 | 190 | 203 | ||||||
2.550%, 10/01/2037 | 59 | 63 | ||||||
2.240%, 07/01/2043 | 1,875 | 1,883 | ||||||
2.117%, 05/01/2037 | 290 | 306 | ||||||
2.050%, 04/01/2037 | 45 | 48 | ||||||
1.838%, 05/01/2043 | 2 | 2 | ||||||
FHLMC CMO, Ser 1591, Cl PV | ||||||||
6.250%, 10/15/2023 | 777 | 858 | ||||||
FHLMC CMO, Ser 2002-2399, Cl XG | ||||||||
6.500%, 01/15/2032 | 320 | 364 | ||||||
FHLMC CMO, Ser 2002-48, Cl 1A | ||||||||
5.931%, 07/25/2033 (C) | 7 | 8 | ||||||
FHLMC CMO, Ser 2003-57, Cl 1A3 | ||||||||
7.500%, 07/25/2043 | 72 | 84 | ||||||
FHLMC CMO, Ser 2004-59, Cl 1A3 | ||||||||
7.500%, 10/25/2043 | 100 | 121 | ||||||
FHLMC CMO, Ser 2004-60, Cl 1A3 | ||||||||
7.500%, 03/25/2044 | 105 | 127 | ||||||
FHLMC CMO, Ser 2005-2945, Cl SA | ||||||||
11.966%, 03/15/2020 (C) | 50 | 58 | ||||||
FHLMC CMO, | ||||||||
0.000%, 04/15/2020 | 123 | 122 | ||||||
FHLMC CMO, Ser 2005-2980, Cl QA | ||||||||
6.000%, 05/15/2035 | 183 | 204 | ||||||
FHLMC CMO, | ||||||||
0.000%, 04/15/2035 | 141 | 136 | ||||||
FHLMC CMO, | ||||||||
0.000%, 02/15/2036 | 158 | 155 | ||||||
FHLMC CMO, | ||||||||
0.000%, 05/15/2036 | 104 | 97 | ||||||
FHLMC CMO, Ser 2006-3200, Cl PO, PO | ||||||||
0.000%, 08/15/2036 | 143 | 136 | ||||||
FHLMC CMO, Ser 2006-R007, Cl ZA | ||||||||
6.000%, 05/15/2036 | 341 | 376 | ||||||
| 110 | SEI Institutional Managed Trust / Annual Report / September 30, 2013 |
| Description | Face Amount ($ Thousands) | Market Value ($ Thousands) | ||||||
FHLMC CMO, | ||||||||
0.000%, 05/15/2037 | $ | 30 | $ | 29 | ||||
FHLMC CMO, Ser 2007-3318, Cl DB | ||||||||
6.000%, 05/15/2027 | 334 | 369 | ||||||
FHLMC CMO, | ||||||||
5.818%, 11/15/2037 (C) | 117 | 15 | ||||||
FHLMC CMO, | ||||||||
5.868%, 05/15/2038 (C) | 141 | 21 | ||||||
FHLMC CMO, Ser 2008-3461, Cl LZ | ||||||||
6.000%, 06/15/2038 | 105 | 117 | ||||||
FHLMC CMO, | ||||||||
0.000%, 02/15/2037 | 145 | 133 | ||||||
FHLMC CMO, Ser 2009-3529, Cl AG | ||||||||
6.500%, 04/15/2039 | 82 | 90 | ||||||
FHLMC CMO, | ||||||||
0.000%, 05/15/2036 | 246 | 226 | ||||||
FHLMC CMO, | ||||||||
0.000%, 10/15/2039 | 155 | 145 | ||||||
FHLMC CMO, | ||||||||
0.000%, 01/15/2040 | 84 | 79 | ||||||
FHLMC CMO, Ser 2010-3664, Cl DA | ||||||||
4.000%, 11/15/2037 | 1,557 | 1,681 | ||||||
FHLMC CMO, Ser 2010-3704, Cl CT | ||||||||
7.000%, 12/15/2036 | 628 | 757 | ||||||
FHLMC CMO, | ||||||||
5.000%, 08/15/2040 | 317 | 53 | ||||||
FHLMC CMO, | ||||||||
4.000%, 03/15/2034 | 347 | 23 | ||||||
FHLMC CMO, | ||||||||
4.500%, 07/15/2037 | 525 | 55 | ||||||
FHLMC CMO, | ||||||||
4.000%, 08/15/2035 | 271 | 12 | ||||||
FHLMC CMO, | ||||||||
4.000%, 08/15/2037 | 461 | 55 | ||||||
FHLMC CMO, | ||||||||
4.000%, 10/15/2037 | 233 | 25 | ||||||
FHLMC CMO, | ||||||||
4.000%, 11/15/2029 | 388 | 44 | ||||||
FHLMC CMO, Ser 2011-3804, Cl FN | ||||||||
0.632%, 03/15/2039 (C) | 604 | 602 | ||||||
| Description | Face Amount ($ Thousands) | Market Value ($ Thousands) | ||||||
FHLMC CMO, Ser 2011-3819, Cl ZQ | ||||||||
6.000%, 04/15/2036 | $ | 1,003 | $ | 1,105 | ||||
FHLMC CMO, Ser 2011-3852, Cl QN | ||||||||
5.500%, 05/15/2041 (C) | 171 | 181 | ||||||
FHLMC CMO, Ser 2011-3876, Cl NB | ||||||||
5.000%, 08/15/2038 | 367 | 398 | ||||||
FHLMC CMO, Ser 2011-3925, Cl FL | ||||||||
0.632%, 01/15/2041 (C) | 834 | 836 | ||||||
FHLMC CMO, | ||||||||
5.768%, 10/15/2041 (C) | 1,060 | 201 | ||||||
FHLMC CMO, Ser 2011-3957, Cl B | ||||||||
4.000%, 11/15/2041 | 835 | 857 | ||||||
FHLMC CMO, Ser 2012-279, Cl F6 | ||||||||
0.632%, 09/15/2042 (C) | 477 | 475 | ||||||
FHLMC CMO, Ser 2012-281, Cl F1 | ||||||||
0.682%, 10/15/2042 (C) | 476 | 475 | ||||||
FHLMC CMO, | ||||||||
6.018%, 10/15/2042 (C) | 815 | 179 | ||||||
FHLMC CMO, Ser 2013-299, Cl 300 | ||||||||
3.000%, 01/15/2043 | 963 | 964 | ||||||
FHLMC CMO, | ||||||||
0.000%, 09/15/2043 | 597 | 428 | ||||||
FHLMC CMO, | ||||||||
6.068%, 09/15/2042 (C) | 685 | 138 | ||||||
FHLMC CMO, Ser 2013-4206, Cl CZ | ||||||||
3.000%, 05/15/2043 | 101 | 78 | ||||||
FHLMC CMO, Ser 2013-4210, Cl Z | ||||||||
3.000%, 05/15/2043 | 197 | 161 | ||||||
FHLMC CMO, Ser 2013-4219, Cl JA | ||||||||
3.500%, 08/15/2039 | 991 | 1,012 | ||||||
FHLMC CMO, Ser 2013-4226, Cl GZ | ||||||||
3.000%, 07/15/2043 | 100 | 78 | ||||||
FHLMC CMO, Ser 2033, Cl HC | ||||||||
6.500%, 02/15/2028 | 131 | 147 | ||||||
FHLMC CMO, Ser 2075, Cl D | ||||||||
6.500%, 08/15/2028 | 243 | 275 | ||||||
FHLMC CMO, Ser 239, Cl S30, IO | ||||||||
7.518%, 08/15/2036 (C) | 296 | 46 | ||||||
FHLMC CMO, Ser 2434, Cl ZA | ||||||||
6.500%, 04/15/2032 | 287 | 322 | ||||||
FHLMC CMO, Ser 2458, Cl ZM | ||||||||
6.500%, 06/15/2032 | 206 | 233 | ||||||
FHLMC CMO, Ser 2631, Cl SA | ||||||||
14.516%, 06/15/2033 (C) | 93 | 120 | ||||||
FHLMC CMO, Ser 2725, Cl SC | ||||||||
8.794%, 11/15/2033 (C) | 33 | 37 | ||||||
FHLMC CMO, Ser 2950, Cl JO, PO | ||||||||
0.000%, 03/15/2020 | 50 | 50 | ||||||
FHLMC CMO, Ser 3001, Cl HP | ||||||||
21.271%, 05/15/2035 (C) | 86 | 126 | ||||||
| SEI Institutional Managed Trust / Annual Report / September 30, 2013 | 111 |
SCHEDULE OF INVESTMENTS
U.S. Fixed Income Fund (Continued)
September 30, 2013
| Description | Face Amount ($ Thousands) | Market Value ($ Thousands) | ||||||
FHLMC CMO, Ser 3006, Cl QS | ||||||||
19.673%, 07/15/2035 (C) | $ | 211 | $ | 304 | ||||
FHLMC CMO, Ser 3012, Cl GK | ||||||||
23.930%, 06/15/2035 (C) | 119 | 199 | ||||||
FHLMC CMO, Ser 3217, Cl CX, IO | ||||||||
6.408%, 09/15/2036 (C) | 333 | 46 | ||||||
FHLMC CMO, Ser 3225, Cl EO, PO | ||||||||
0.000%, 10/15/2036 | 200 | 188 | ||||||
FHLMC CMO, Ser 3262, Cl SG, IO | ||||||||
6.218%, 01/15/2037 (C) | 319 | 40 | ||||||
FHLMC CMO, Ser 3342, Cl VG | ||||||||
6.000%, 11/15/2023 | 37 | 37 | ||||||
FHLMC CMO, Ser 3373, Cl TO, PO | ||||||||
0.000%, 04/15/2037 | 54 | 50 | ||||||
FHLMC CMO, Ser 3383, Cl SA, IO | ||||||||
6.268%, 11/15/2037 (C) | 324 | 48 | ||||||
FHLMC CMO, Ser 3422, Cl SE | ||||||||
16.994%, 02/15/2038 (C) | 40 | 55 | ||||||
FHLMC CMO, Ser 3515, Cl PI, IO | ||||||||
5.500%, 07/15/2037 | 94 | 8 | ||||||
FHLMC CMO, Ser 3607, Cl BO, PO | ||||||||
0.000%, 04/15/2036 | 57 | 53 | ||||||
FHLMC CMO, Ser 3611, Cl PO, PO | ||||||||
0.000%, 07/15/2034 | 74 | 69 | ||||||
FHLMC CMO, Ser 3626, Cl MA | ||||||||
5.000%, 02/15/2030 | 1,209 | 1,247 | ||||||
FHLMC CMO, Ser 3632, Cl BS | ||||||||
16.892%, 02/15/2040 (C) | 100 | 149 | ||||||
FHLMC CMO, Ser 3688, Cl NI, IO | ||||||||
5.000%, 04/15/2032 | 556 | 63 | ||||||
FHLMC CMO, Ser T-42, Cl A5 | ||||||||
7.500%, 02/25/2042 | 719 | 846 | ||||||
FHLMC CMO, Ser T-51, Cl 1A | ||||||||
6.500%, 09/25/2043 (C) | 180 | 207 | ||||||
FHLMC CMO, Ser T-54, Cl 2A | ||||||||
6.500%, 02/25/2043 | 118 | 141 | ||||||
FHLMC CMO, Ser T-54, Cl 3A | ||||||||
7.000%, 02/25/2043 | 378 | 451 | ||||||
FHLMC CMO, Ser T-57, Cl 1A2 | ||||||||
7.000%, 07/25/2043 | 484 | 575 | ||||||
FHLMC CMO, Ser T-58, Cl 4A | ||||||||
7.500%, 09/25/2043 | 551 | 660 | ||||||
FHLMC CMO, Ser T-60, Cl 1A2 | ||||||||
7.000%, 03/25/2044 | 189 | 224 | ||||||
FHLMC CMO, Ser T-76, Cl 2A | ||||||||
3.851%, 10/25/2037 (C) | 270 | 271 | ||||||
FHLMC-GNMA CMO, Ser 1993-21, Cl L | ||||||||
6.250%, 10/25/2023 | 283 | 317 | ||||||
FHLMC Multifamily Structured Pass Through Certificates CMO, Ser K021, Cl X1, IO | ||||||||
1.646%, 06/25/2022 (C) | 378 | 37 | ||||||
| Description | Face Amount ($ Thousands) | Market Value ($ Thousands) | ||||||
FHLMC Multifamily Structured Pass-Through Certificates, Ser 2009-K003, Cl AAB | ||||||||
4.768%, 05/25/2018 | $ | 342 | $ | 371 | ||||
FHLMC Multifamily Structured Pass-Through Certificates, Ser 2012-K020, Cl A2 | ||||||||
2.373%, 05/25/2022 | 905 | 853 | ||||||
FHLMC Multifamily Structured Pass-Through Certificates, Ser K006, Cl AX1, IO | ||||||||
1.208%, 01/25/2020 (C) | 1,537 | 80 | ||||||
FHLMC Multifamily Structured Pass-Through Certificates, Ser K008, Cl X1, IO | ||||||||
1.825%, 06/25/2020 (C) | 493 | 41 | ||||||
FHLMC Multifamily Structured Pass-Through Certificates, Ser K009, Cl X1, IO | ||||||||
1.664%, 08/25/2020 (C) | 511 | 39 | ||||||
FHLMC Multifamily Structured Pass-Through Certificates, Ser K017, Cl X1, IO | ||||||||
1.597%, 12/25/2021 (C) | 305 | 27 | ||||||
FHLMC Multifamily Structured Pass-Through Certificates, Ser K024, Cl X1, IO | ||||||||
1.025%, 09/25/2022 (C) | 339 | 21 | ||||||
FHLMC Multifamily Structured Pass-Through Certificates, Ser K702, Cl X1, IO | ||||||||
1.713%, 02/25/2018 (C) | 1,283 | 75 | ||||||
FNMA | ||||||||
7.500%, 10/01/2037 to 04/01/2039 | 581 | 652 | ||||||
7.000%, 04/01/2032 to 01/01/2039 | 382 | 443 | ||||||
6.500%, 05/01/2027 to 10/01/2038 | 1,488 | 1,686 | ||||||
6.000%, 10/01/2019 to 10/01/2040 | 7,084 | 7,804 | ||||||
5.500%, 02/01/2021 to 04/01/2040 | 7,338 | 8,031 | ||||||
5.000%, 01/01/2020 to 09/01/2041 | 21,731 | 23,755 | ||||||
4.640%, 01/01/2021 | 486 | 536 | ||||||
4.540%, 01/01/2020 | 476 | 526 | ||||||
4.530%, 12/01/2019 | 479 | 529 | ||||||
4.500%, 08/01/2021 to 12/01/2042 | 5,309 | 5,729 | ||||||
4.390%, 05/01/2021 | 250 | 272 | ||||||
4.380%, 01/01/2021 to 04/01/2021 | 1,466 | 1,598 | ||||||
4.369%, 02/01/2020 | 479 | 526 | ||||||
4.360%, 05/01/2021 | 1,000 | 1,088 | ||||||
| 112 | SEI Institutional Managed Trust / Annual Report / September 30, 2013 |
| Description | Face Amount ($ Thousands) | Market Value ($ Thousands) | ||||||
4.303%, 07/01/2021 | $ | 1,104 | $ | 1,197 | ||||
4.301%, 01/01/2021 | 290 | 317 | ||||||
4.300%, 04/01/2021 | 249 | 270 | ||||||
4.291%, 06/01/2021 | 489 | 531 | ||||||
4.250%, 04/01/2021 | 750 | 810 | ||||||
4.240%, 06/01/2021 | 997 | 1,077 | ||||||
4.130%, 08/01/2021 | 972 | 1,043 | ||||||
4.066%, 07/01/2020 | 394 | 426 | ||||||
4.060%, 07/01/2021 | 1,000 | 1,069 | ||||||
4.000%, 09/01/2033 to 08/01/2043 | 5,673 | 5,935 | ||||||
3.670%, 07/01/2023 | 1,000 | 1,026 | ||||||
3.632%, 12/01/2020 | 1,221 | 1,291 | ||||||
3.590%, 12/01/2020 | 478 | 501 | ||||||
3.505%, 09/01/2020 | 952 | 996 | ||||||
3.500%, 01/01/2026 to 08/01/2043 | 20,819 | 21,230 | ||||||
3.430%, 10/01/2020 | 960 | 998 | ||||||
3.290%, 10/01/2020 | 350 | 362 | ||||||
3.230%, 11/01/2020 | 345 | 355 | ||||||
3.027%, 03/01/2042 | 222 | 225 | ||||||
3.000%, 03/01/2027 to 06/01/2043 | 16,171 | 16,054 | ||||||
2.810%, 06/01/2023 | 1,000 | 968 | ||||||
2.770%, 05/01/2022 | 1,000 | 981 | ||||||
2.704%, 04/01/2023 | 1,453 | 1,396 | ||||||
2.680%, 07/01/2022 | 1,995 | 1,938 | ||||||
2.661%, 07/01/2042 | 627 | 625 | ||||||
2.629%, 09/01/2043 | 305 | 302 | ||||||
2.516%, 09/01/2043 | 609 | 615 | ||||||
2.510%, 06/01/2023 | 498 | 472 | ||||||
2.500%, 12/01/2022 to 10/01/2042 | 1,876 | 1,892 | ||||||
2.460%, 04/01/2023 | 933 | 882 | ||||||
2.420%, 06/01/2023 | 498 | 468 | ||||||
2.374%, 02/01/2043 | 142 | 143 | ||||||
2.306%, 09/01/2043 | 646 | 647 | ||||||
2.115%, 02/01/2043 | 149 | 149 | ||||||
2.110%, 01/12/2018 | 591 | 594 | ||||||
2.042%, 06/01/2043 | 385 | 381 | ||||||
2.019%, 05/01/2043 | 620 | 614 | ||||||
2.007%, 01/01/2043 | 136 | 135 | ||||||
1.710%, 08/01/2043 | 118 | 116 | ||||||
FNMA ARM (C) | ||||||||
6.200%, 08/01/2036 | 47 | 52 | ||||||
5.806%, 09/01/2037 | 97 | 104 | ||||||
5.320%, 01/01/2023 | 40 | 44 | ||||||
3.244%, 03/01/2036 | 218 | 232 | ||||||
3.185%, 11/01/2036 | 151 | 161 | ||||||
2.945%, 09/01/2036 | 67 | 70 | ||||||
2.935%, 12/01/2036 | 473 | 503 | ||||||
2.906%, 11/01/2036 | 128 | 138 | ||||||
2.813%, 12/01/2036 | 142 | 152 | ||||||
2.748%, 09/01/2037 | 4 | 4 | ||||||
| Description | Face Amount ($ Thousands) | Market Value ($ Thousands) | ||||||
2.681%, 07/01/2037 | $ | 146 | $ | 154 | ||||
2.591%, 07/01/2037 | 277 | 294 | ||||||
2.578%, 04/01/2036 to 04/01/2037 | 233 | 248 | ||||||
2.458%, 08/01/2043 | 85 | 83 | ||||||
2.423%, 11/01/2037 | 164 | 174 | ||||||
2.302%, 11/01/2037 | 288 | 305 | ||||||
2.036%, 07/01/2043 | 145 | 138 | ||||||
2.031%, 07/01/2043 | 325 | 310 | ||||||
1.713%, 07/01/2037 | 321 | 340 | ||||||
0.660%, 01/01/2023 | 494 | 494 | ||||||
0.555%, 01/01/2023 | 197 | 197 | ||||||
0.545%, 01/01/2023 | 493 | 493 | ||||||
0.535%, 01/01/2023 | 500 | 500 | ||||||
FNMA CMO STRIPS, | ||||||||
5.000%, 08/01/2035 | 488 | 86 | ||||||
FNMA CMO, Ser 1999-11, Cl Z | ||||||||
5.500%, 03/25/2029 | 164 | 180 | ||||||
FNMA CMO, Ser 2000-18, Cl EC, PO | ||||||||
0.000%, 10/25/2023 | 79 | 76 | ||||||
FNMA CMO, Ser 2001-79, Cl BA | ||||||||
7.000%, 03/25/2045 | 164 | 194 | ||||||
FNMA CMO, Ser 2002-33, Cl A2 | ||||||||
7.500%, 06/25/2032 | 78 | 93 | ||||||
FNMA CMO, Ser 2002-95, Cl DB | ||||||||
6.000%, 01/25/2033 | 314 | 357 | ||||||
FNMA CMO, Ser 2003-131, Cl SK | ||||||||
15.842%, 01/25/2034 (C) | 109 | 144 | ||||||
FNMA CMO, Ser 2003-23, Cl EQ | ||||||||
5.500%, 04/25/2023 | 1,000 | 1,115 | ||||||
FNMA CMO, Ser 2003-35, Cl EA, PO | ||||||||
0.000%, 05/25/2033 | 47 | 43 | ||||||
FNMA CMO, Ser 2004-46, Cl EP, PO | ||||||||
0.000%, 03/25/2034 | 117 | 113 | ||||||
FNMA CMO, Ser 2004-52, Cl PX, PO | ||||||||
0.000%, 09/25/2032 | 45 | 45 | ||||||
FNMA CMO, Ser 2004-61, Cl BO, PO | ||||||||
0.000%, 10/25/2032 | 37 | 37 | ||||||
FNMA CMO, Ser 2004-89, Cl SM | ||||||||
17.383%, 09/25/2024 (C) | 396 | 556 | ||||||
FNMA CMO, Ser 2005-106, Cl US | ||||||||
23.911%, 11/25/2035 (C) | 544 | 862 | ||||||
FNMA CMO, Ser 2005-117, Cl LC | ||||||||
5.500%, 11/25/2035 | 733 | 801 | ||||||
FNMA CMO, Ser 2005-5, Cl PA | ||||||||
5.000%, 01/25/2035 | 101 | 110 | ||||||
FNMA CMO, Ser 2005-72, Cl SB | ||||||||
16.428%, 08/25/2035 (C) | 108 | 134 | ||||||
FNMA CMO, Ser 2005-90, Cl ES | ||||||||
16.428%, 10/25/2035 (C) | 127 | 178 | ||||||
FNMA CMO, | ||||||||
6.471%, 12/25/2036 (C) | 110 | 18 | ||||||
| SEI Institutional Managed Trust / Annual Report / September 30, 2013 | 113 |
SCHEDULE OF INVESTMENTS
U.S. Fixed Income Fund (Continued)
September 30, 2013
| Description | Face Amount ($ Thousands) | Market Value ($ Thousands) | ||||||
FNMA CMO, Ser 2006-118, Cl A2 | ||||||||
0.258%, 12/25/2036 (C) | $ | 163 | $ | 160 | ||||
FNMA CMO, Ser 2006-15, Cl OP, PO | ||||||||
0.000%, 03/25/2036 | 94 | 88 | ||||||
FNMA CMO, Ser 2006-27, Cl OH, PO | ||||||||
0.000%, 04/25/2036 | 95 | 92 | ||||||
FNMA CMO, Ser 2006-59, Cl QO, PO | ||||||||
0.000%, 01/25/2033 | 47 | 47 | ||||||
FNMA CMO, Ser 2006-60, Cl DO, PO | ||||||||
0.000%, 04/25/2035 | 84 | 82 | ||||||
FNMA CMO, Ser 2006-63, Cl ZH | ||||||||
6.500%, 07/25/2036 | 548 | 619 | ||||||
FNMA CMO, Ser 2006-78, Cl BZ | ||||||||
6.500%, 08/25/2036 | 107 | 118 | ||||||
FNMA CMO, | ||||||||
6.271%, 10/25/2037 (C) | 286 | 38 | ||||||
FNMA CMO, Ser 2007-101, Cl A2 | ||||||||
0.429%, 06/27/2036 (C) | 127 | 125 | ||||||
FNMA CMO, | ||||||||
6.271%, 12/25/2037 (C) | 308 | 41 | ||||||
FNMA CMO, Ser 2007-114, Cl A6 | ||||||||
0.379%, 10/27/2037 (C) | 200 | 200 | ||||||
FNMA CMO, Ser 2007-116, Cl HI, IO | ||||||||
1.630%, 01/25/2038 (C) | 227 | 16 | ||||||
FNMA CMO, Ser 2007-29, Cl SG | ||||||||
22.070%, 04/25/2037 (C) | 48 | 71 | ||||||
FNMA CMO, Ser 2007-65, Cl KI, IO | ||||||||
6.441%, 07/25/2037 (C) | 198 | 24 | ||||||
FNMA CMO, Ser 2007-72, Cl EK, IO | ||||||||
6.221%, 07/25/2037 (C) | 271 | 35 | ||||||
FNMA CMO, Ser 2007-75, Cl EO, PO | ||||||||
0.000%, 01/25/2036 | 24 | 24 | ||||||
FNMA CMO, Ser 2007-77, Cl PD | ||||||||
6.000%, 10/25/2036 | 1,000 | 1,082 | ||||||
FNMA CMO, Ser 2007-85, Cl SG | ||||||||
15.803%, 09/25/2037 (C) | 74 | 96 | ||||||
FNMA CMO, Ser 2008-35, Cl IM, IO | ||||||||
0.642%, 10/25/2016 (C) | 308 | 3 | ||||||
FNMA CMO, Ser 2008-4, Cl SD, IO | ||||||||
5.821%, 02/25/2038 (C) | 592 | 73 | ||||||
FNMA CMO, Ser 2008-95, Cl BA | ||||||||
5.000%, 01/25/2024 | 250 | 277 | ||||||
FNMA CMO, Ser 2009-103, Cl MB | ||||||||
2.847%, 12/25/2039 (C) | 225 | 241 | ||||||
FNMA CMO, Ser 2009-52, Cl PI, IO | ||||||||
5.000%, 07/25/2039 | 221 | 38 | ||||||
FNMA CMO, Ser 2009-70, Cl CO, PO | ||||||||
0.000%, 01/25/2037 | 211 | 200 | ||||||
FNMA CMO, Ser 2009-84, Cl WS, IO | ||||||||
5.721%, 10/25/2039 (C) | 154 | 19 | ||||||
FNMA CMO, Ser 2009-86, Cl BO, PO | ||||||||
0.000%, 03/25/2037 | 1,548 | 1,499 | ||||||
| Description | Face Amount ($ Thousands) | Market Value ($ Thousands) | ||||||
FNMA CMO, Ser 2009-86, Cl IP, IO | ||||||||
5.500%, 10/25/2039 | $ | 100 | $ | 14 | ||||
FNMA CMO, Ser 2009-86, Cl OT, PO | ||||||||
0.000%, 10/25/2037 | 181 | 160 | ||||||
FNMA CMO, Ser 2009-86, Cl UI, IO | ||||||||
4.000%, 10/25/2014 | 433 | 14 | ||||||
FNMA CMO, Ser 2009-99, Cl SC, IO | ||||||||
6.001%, 12/25/2039 (C) | 188 | 20 | ||||||
FNMA CMO, Ser 2009-99, Cl WA | ||||||||
6.286%, 12/25/2039 (C) | 302 | 338 | ||||||
FNMA CMO, Ser 2010-1, Cl WA | ||||||||
6.184%, 02/25/2040 (C) | 119 | 130 | ||||||
FNMA CMO, Ser 2010-16, Cl WA | ||||||||
6.428%, 03/25/2040 (C) | 143 | 162 | ||||||
FNMA CMO, Ser 2010-23, Cl KS, IO | ||||||||
6.921%, 02/25/2040 (C) | 306 | 46 | ||||||
FNMA CMO, Ser 2010-35, Cl SB, IO | ||||||||
6.241%, 04/25/2040 (C) | 208 | 28 | ||||||
FNMA CMO, Ser 2010-39, Cl OT, PO | ||||||||
0.000%, 10/25/2035 | 84 | 78 | ||||||
FNMA CMO, Ser 2010-68, Cl SA, IO | ||||||||
4.821%, 07/25/2040 (C) | 1,042 | 106 | ||||||
FNMA CMO, Ser 2011-118, Cl MT | ||||||||
7.000%, 11/25/2041 | 668 | 778 | ||||||
FNMA CMO, Ser 2011-58, Cl AT | ||||||||
4.000%, 07/25/2041 | 445 | 468 | ||||||
FNMA CMO, Ser 2011-87, Cl SG, IO | ||||||||
6.371%, 04/25/2040 (C) | 745 | 159 | ||||||
FNMA CMO, Ser 2012-101, Cl AI, IO | ||||||||
3.000%, 06/25/2027 | 1,220 | 153 | ||||||
FNMA CMO, Ser 2012-108, Cl F | ||||||||
0.679%, 10/25/2042 (C) | 475 | 474 | ||||||
FNMA CMO, Ser 2012-112, Cl FD | ||||||||
0.679%, 10/25/2042 (C) | 481 | 480 | ||||||
FNMA CMO, Ser 2012-118, Cl CI | ||||||||
3.500%, 12/25/2039 | 1,240 | 226 | ||||||
FNMA CMO, Ser 2012-130, Cl DC | ||||||||
3.000%, 12/25/2042 | 2,310 | 2,212 | ||||||
FNMA CMO, | ||||||||
2.500%, 07/25/2042 | 776 | 758 | ||||||
FNMA CMO, Ser 2012-134, Cl LC | ||||||||
3.000%, 12/25/2042 | 211 | 208 | ||||||
FNMA CMO, Ser 2012-14, Cl FG | ||||||||
0.579%, 07/25/2040 (C) | 845 | 849 | ||||||
FNMA CMO, Ser 2012-93, Cl SM, IO | ||||||||
5.921%, 09/25/2042 (C) | 560 | 121 | ||||||
FNMA CMO, Ser 2012-M12, Cl 1A | ||||||||
2.935%, 08/25/2022 (C) | 1,195 | 1,178 | ||||||
FNMA CMO, Ser 2012-M15, Cl A | ||||||||
2.745%, 10/25/2022 (C) | 931 | 898 | ||||||
FNMA CMO, | ||||||||
0.000%, 10/25/2043 | 399 | 279 | ||||||
| 114 | SEI Institutional Managed Trust / Annual Report / September 30, 2013 |
| Description | Face Amount ($ Thousands) | Market Value ($ Thousands) | ||||||
FNMA CMO, Ser 2013-4, Cl AJ | ||||||||
3.500%, 02/25/2043 | $ | 961 | $ | 982 | ||||
FNMA CMO, Ser 2013-62, Cl SQ, IO | ||||||||
6.571%, 09/25/2032 (C) | 876 | 207 | ||||||
FNMA CMO, Ser 2013-67, Cl KZ | ||||||||
2.500%, 04/25/2043 | 201 | 144 | ||||||
FNMA Grantor Trust CMO, | ||||||||
7.000%, 12/25/2041 | 491 | 585 | ||||||
FNMA Grantor Trust CMO, | ||||||||
7.500%, 12/25/2041 | 286 | 334 | ||||||
FNMA Grantor Trust CMO, | ||||||||
6.500%, 11/25/2031 | 338 | 386 | ||||||
FNMA Grantor Trust CMO, | ||||||||
7.000%, 07/25/2042 | 368 | 434 | ||||||
FNMA Grantor Trust CMO, | ||||||||
7.000%, 02/25/2044 | 315 | 360 | ||||||
FNMA Interest CMO, | ||||||||
0.000%, 09/01/2024 | 112 | 108 | ||||||
FNMA, Ser M4, Cl A2 | ||||||||
3.726%, 06/25/2021 | 905 | 957 | ||||||
FNMA TBA | ||||||||
5.000%, 10/01/2038 | 3,300 | 3,578 | ||||||
4.500%, 10/15/2042 | 1,300 | 1,388 | ||||||
4.000%, 10/14/2039 to 10/25/2043 | 15,635 | 16,398 | ||||||
3.500%, 10/16/2027 to 10/25/2043 | 12,915 | 13,237 | ||||||
3.000%, 10/25/2026 to 10/25/2043 | 16,330 | 16,635 | ||||||
2.500%, 10/15/2027 to 10/01/2042 | 6,645 | 6,636 | ||||||
FNMA Whole Loan CMO, | ||||||||
7.921%, 06/25/2042 (C) | 436 | 104 | ||||||
FNMA Whole Loan CMO, | ||||||||
6.801%, 12/25/2042 (C) | 241 | 277 | ||||||
FNMA Whole Loan CMO, | ||||||||
4.550%, 06/25/2043 | 201 | 218 | ||||||
FNMA Whole Loan CMO, | ||||||||
5.750%, 08/25/2033 | 83 | 91 | ||||||
FNMA Whole Loan CMO, | ||||||||
7.000%, 10/25/2042 | 209 | 241 | ||||||
FNMA Whole Loan CMO, | ||||||||
7.000%, 12/25/2033 | 404 | 461 | ||||||
| Description | Face Amount ($ Thousands) | Market Value ($ Thousands) | ||||||
FNMA Whole Loan CMO, | ||||||||
7.000%, 02/25/2044 | $ | 486 | $ | 568 | ||||
FNMA Whole Loan CMO, | ||||||||
0.399%, 03/25/2045 (C) | 503 | 502 | ||||||
FNMA Whole Loan CMO, | ||||||||
7.500%, 12/25/2045 | 267 | 312 | ||||||
FNMA Whole Loan CMO, | ||||||||
0.399%, 02/25/2036 (C) | 215 | 212 | ||||||
FNMA Whole Loan CMO, | ||||||||
0.439%, 11/25/2046 (C) | 307 | 306 | ||||||
GNMA | ||||||||
7.500%, 10/15/2037 | 154 | 180 | ||||||
7.000%, 09/15/2031 | 77 | 91 | ||||||
6.500%, 12/15/2035 | 743 | 842 | ||||||
6.000%, 09/20/2038 to 01/15/2040 | 1,226 | 1,365 | ||||||
GNMA ARM (C) | ||||||||
1.625%, 02/20/2034 (D) | 479 | 499 | ||||||
0.886%, 09/20/2063 | 1,000 | 996 | ||||||
GNMA CMO, Ser 2001-61, Cl Z | ||||||||
6.500%, 12/20/2031 | 626 | 710 | ||||||
GNMA CMO, Ser 2003-79, Cl PV | ||||||||
5.500%, 10/20/2023 | 144 | 155 | ||||||
GNMA CMO, Ser 2003-97, Cl SA, IO | ||||||||
6.368%, 11/16/2033 (C) | 425 | 76 | ||||||
GNMA CMO, Ser 2004-11, Cl SX | ||||||||
16.979%, 02/20/2034 (C) | 37 | 51 | ||||||
GNMA CMO, Ser 2004-28, Cl SV | ||||||||
8.820%, 04/20/2034 (C) | 189 | 211 | ||||||
GNMA CMO, Ser 2004-71, Cl ST | ||||||||
7.000%, 09/20/2034 (C) | 101 | 108 | ||||||
GNMA CMO, | ||||||||
0.000%, 01/17/2033 | 16 | 16 | ||||||
GNMA CMO, Ser 2004-87, Cl SB | ||||||||
7.465%, 03/17/2033 (C) | 140 | 154 | ||||||
GNMA CMO, Ser 2005-28, Cl YO, PO | ||||||||
0.000%, 02/17/2033 | 275 | 260 | ||||||
GNMA CMO, Ser 2005-92, Cl PB | ||||||||
6.000%, 12/20/2035 | 400 | 464 | ||||||
GNMA CMO, | ||||||||
0.000%, 07/20/2036 | 47 | 43 | ||||||
GNMA CMO, Ser 2006-38, Cl SG, IO | ||||||||
6.470%, 09/20/2033 (C) | 193 | 12 | ||||||
GNMA CMO, Ser 2007-26, Cl SW, IO | ||||||||
6.020%, 05/20/2037 (C) | 431 | 57 | ||||||
GNMA CMO, Ser 2007-27, Cl SD, IO | ||||||||
6.020%, 05/20/2037 (C) | 273 | 35 | ||||||
| SEI Institutional Managed Trust / Annual Report / September 30, 2013 | 115 |
SCHEDULE OF INVESTMENTS
U.S. Fixed Income Fund (Continued)
September 30, 2013
| Description | Face Amount ($ Thousands) | Market Value ($ Thousands) | ||||||
GNMA CMO, Ser 2007-72, Cl US, IO | ||||||||
6.370%, 11/20/2037 (C) | $ | 167 | $ | 21 | ||||
GNMA CMO, Ser 2007-78, Cl SA, IO | ||||||||
6.346%, 12/16/2037 (C) | 1,756 | 303 | ||||||
GNMA CMO, Ser 2007-82, Cl SA, IO | ||||||||
6.350%, 12/20/2037 (C) | 231 | 30 | ||||||
GNMA CMO, Ser 2007-9, Cl CI, IO | ||||||||
6.020%, 03/20/2037 (C) | 390 | 54 | ||||||
GNMA CMO, Ser 2008-1, Cl PO, PO | ||||||||
0.000%, 01/20/2038 | 91 | 85 | ||||||
GNMA CMO, Ser 2008-10, Cl S, IO | ||||||||
5.650%, 02/20/2038 (C) | 362 | 48 | ||||||
GNMA CMO, | ||||||||
0.000%, 02/17/2033 | 62 | 59 | ||||||
GNMA CMO, Ser 2008-33, Cl XS, IO | ||||||||
7.516%, 04/16/2038 (C) | 173 | 29 | ||||||
GNMA CMO, Ser 2008-55, Cl SA, IO | ||||||||
6.020%, 06/20/2038 (C) | 391 | 52 | ||||||
GNMA CMO, | ||||||||
6.216%, 11/16/2039 (C) | 443 | 64 | ||||||
GNMA CMO, Ser 2009-14, Cl KI, IO | ||||||||
6.500%, 03/20/2039 | 225 | 46 | ||||||
GNMA CMO, Ser 2009-24, Cl DS, IO | ||||||||
6.120%, 03/20/2039 (C) | 437 | 47 | ||||||
GNMA CMO, Ser 2009-25, Cl SE, IO | ||||||||
7.420%, 09/20/2038 (C) | 278 | 44 | ||||||
GNMA CMO, Ser 2009-43, Cl SA, IO | ||||||||
5.770%, 06/20/2039 (C) | 290 | 34 | ||||||
GNMA CMO, Ser 2009-6, Cl SH, IO | ||||||||
5.860%, 02/20/2039 (C) | 248 | 29 | ||||||
GNMA CMO, Ser 2009-65, Cl IQ, IO | ||||||||
6.000%, 12/20/2038 | 128 | 21 | ||||||
GNMA CMO, Ser 2009-65, Cl TS, IO | ||||||||
6.220%, 12/20/2038 (C) | 510 | 60 | ||||||
GNMA CMO, Ser 2009-66, Cl XS, IO | ||||||||
6.616%, 07/16/2039 (C) | 2,888 | 439 | ||||||
GNMA CMO, Ser 2009-67, Cl SA, IO | ||||||||
5.866%, 08/16/2039 (C) | 200 | 26 | ||||||
GNMA CMO, Ser 2009-75, Cl MN | ||||||||
5.500%, 09/20/2039 | 500 | 560 | ||||||
GNMA CMO, | ||||||||
0.000%, 11/16/2037 | 301 | 272 | ||||||
GNMA CMO, Ser 2009-83, Cl TS, IO | ||||||||
5.920%, 08/20/2039 (C) | 359 | 45 | ||||||
GNMA CMO, | ||||||||
0.000%, 08/20/2035 | 125 | 108 | ||||||
GNMA CMO, | ||||||||
0.000%, 12/20/2040 | 402 | 336 | ||||||
| Description | Face Amount ($ Thousands) | Market Value ($ Thousands) | ||||||
GNMA CMO, Ser 2010-4, Cl NS, IO | ||||||||
6.206%, 01/16/2040 (C) | $ | 3,881 | $ | 621 | ||||
GNMA CMO, Ser 2010-47, Cl PX, IO | ||||||||
6.520%, 06/20/2037 (C) | 571 | 103 | ||||||
GNMA CMO, Ser 2010-H11, Cl FA | ||||||||
1.184%, 06/20/2060 (C) | 705 | 713 | ||||||
GNMA CMO, Ser 2011-H08, Cl FD | ||||||||
0.686%, 02/20/2061 (C) | 559 | 554 | ||||||
GNMA CMO, Ser 2012-H25, Cl FA | ||||||||
0.886%, 12/20/2061 (C) | 965 | 973 | ||||||
GNMA CMO, Ser 2013-H04, Cl BA | ||||||||
1.650%, 02/20/2063 | 501 | 489 | ||||||
GNMA TBA | ||||||||
4.500%, 11/22/2033 | 1,500 | 1,609 | ||||||
4.000%, 10/01/2039 to 12/01/2039 | 8,500 | 8,937 | ||||||
3.500%, 10/15/2041 | 5,700 | 5,860 | ||||||
3.000%, 10/01/2042 to 10/20/2043 | 5,855 | 5,779 | ||||||
NCUA Guaranteed Notes CMO, | ||||||||
2.900%, 10/29/2020 | 300 | 312 | ||||||
NCUA Guaranteed Notes CMO, | ||||||||
2.650%, 10/29/2020 | 409 | 422 | ||||||
|
| |||||||
| 334,326 | ||||||||
|
| |||||||
Non-Agency Mortgage-Backed Obligations — 6.9% |
| |||||||
AAM ACE Resecuritization Trust, | ||||||||
0.436%, 02/02/2037 (C) (E) | 98 | 96 | ||||||
American General Mortgage Loan Trust, Ser 2009-1, Cl A5 | ||||||||
5.750%, 09/25/2048 (C) (E) | — | — | ||||||
American General Mortgage Loan Trust, Ser 2009-1, Cl A7 | ||||||||
5.750%, 09/25/2048 (C) (E) | 300 | 307 | ||||||
American General Mortgage Loan Trust, Ser 2010-1A, Cl A1 | ||||||||
5.150%, 03/25/2058 (C) (E) | 56 | 57 | ||||||
American General Mortgage Loan Trust, Ser 2010-1A, Cl A3 | ||||||||
5.650%, 03/25/2058 (C) (E) | 190 | 197 | ||||||
American Home Mortgage Investment Trust, Ser 2004-4, Cl 4A | ||||||||
2.397%, 02/25/2045 (C) | 939 | 940 | ||||||
ASG Resecuritization Trust, | ||||||||
4.863%, 05/24/2036 (C) (E) | 84 | 86 | ||||||
ASG Resecuritization Trust, | ||||||||
4.863%, 05/24/2036 (C) (E) | 100 | 105 | ||||||
| 116 | SEI Institutional Managed Trust / Annual Report / September 30, 2013 |
| Description | Face Amount ($ Thousands) | Market Value ($ Thousands) | ||||||
ASG Resecuritization Trust, | ||||||||
2.298%, 03/26/2037 (C) (E) | $ | 567 | $ | 568 | ||||
ASG Resecuritization Trust, | ||||||||
0.411%, 10/28/2036 (C) (E) | 26 | 26 | ||||||
Banc of America Alternative Loan Trust, Ser 2003-11, Cl 1A1 | ||||||||
6.000%, 01/25/2034 | 124 | 130 | ||||||
Banc of America Alternative Loan Trust, Ser 2003-11, Cl 2A1 | ||||||||
6.000%, 01/25/2034 | 280 | 293 | ||||||
Banc of America Alternative Loan Trust, Ser 2003-7, Cl 2A4 | ||||||||
5.000%, 09/25/2018 | 87 | 88 | ||||||
Banc of America Alternative Loan Trust, Ser 2003-9, Cl 1CB2 | ||||||||
5.500%, 11/25/2033 | 80 | 82 | ||||||
Banc of America Alternative Loan Trust, Ser 2004-1, Cl 5A1 | ||||||||
5.500%, 02/25/2019 | 53 | 55 | ||||||
Banc of America Alternative Loan Trust, Ser 2004-8, Cl 3A1 | ||||||||
5.500%, 09/25/2019 | 83 | 87 | ||||||
Banc of America Commercial Mortgage Securities, Ser 2008-1, Cl A4 | ||||||||
6.395%, 02/10/2051 (C) | 220 | 252 | ||||||
Banc of America Commercial Mortgage Trust, Ser 2006-2, Cl AM | ||||||||
5.964%, 05/10/2045 (C) | 40 | 44 | ||||||
Banc of America Commercial Mortgage Trust, Ser 2006-5, Cl AM | ||||||||
5.448%, 09/10/2047 | 340 | 359 | ||||||
Banc of America Commercial Mortgage Trust, Ser 2006-6, Cl A4 | ||||||||
5.356%, 10/10/2045 | 309 | 336 | ||||||
Banc of America Funding Trust, | ||||||||
0.350%, 07/20/2036 (C) | 476 | 472 | ||||||
Banc of America Funding, | ||||||||
5.066%, 12/20/2034 (C) | 58 | 58 | ||||||
Banc of America Funding, | ||||||||
5.538%, 08/26/2035 (C) (E) | 106 | 109 | ||||||
Banc of America Funding, | ||||||||
5.500%, 10/26/2037 (E) | 140 | 143 | ||||||
Banc of America Funding, | ||||||||
3.000%, 10/26/2039 (E) | 220 | 219 | ||||||
| Description | Face Amount ($ Thousands) | Market Value ($ Thousands) | ||||||
Banc of America Merrill Lynch Commercial Mortgage Trust, | ||||||||
4.512%, 12/10/2042 | $ | 4 | $ | 4 | ||||
Banc of America Merrill Lynch Commercial Mortgage Trust, | ||||||||
4.857%, 07/10/2043 (C) | 365 | 383 | ||||||
Banc of America Merrill Lynch Commercial Mortgage, | ||||||||
4.727%, 07/10/2043 | 300 | 312 | ||||||
Banc of America Merrill Lynch Commercial Mortgage, | ||||||||
5.889%, 07/10/2044 (C) | 215 | 236 | ||||||
Banc of America Merrill Lynch Commercial Mortgage, | ||||||||
5.634%, 07/10/2046 | 225 | 247 | ||||||
Banc of America Mortgage Securities, Ser 2003-3, Cl 2A1 | ||||||||
0.729%, 05/25/2018 (C) | 57 | 55 | ||||||
Banc of America Mortgage Securities, Ser 2003-6, Cl 2A1 | ||||||||
0.629%, 08/25/2018 (C) | 20 | 20 | ||||||
Banc of America Mortgage Securities, Ser 2004-3, Cl 1A26 | ||||||||
5.500%, 04/25/2034 | 106 | 107 | ||||||
Banc of America Mortgage Securities, Ser 2004-3, Cl 3A1 | ||||||||
5.000%, 04/25/2019 | 34 | 35 | ||||||
Banc of America Mortgage Securities, Ser 2004-5, Cl 4A1 | ||||||||
4.750%, 06/25/2019 | 47 | 49 | ||||||
BB-UBS Trust, | ||||||||
3.430%, 11/05/2036 (E) | 200 | 187 | ||||||
BB-UBS Trust, Ser 2012-TFT, Cl A | ||||||||
2.892%, 06/05/2030 (E) | 150 | 142 | ||||||
BCAP LLC Trust, | ||||||||
5.750%, 06/26/2037 (E) | 81 | 81 | ||||||
BCAP LLC Trust, | ||||||||
5.500%, 04/26/2037 (C) (E) | 82 | 86 | ||||||
BCAP LLC Trust, | ||||||||
5.500%, 11/26/2034 (E) | 312 | 332 | ||||||
BCAP LLC Trust, | ||||||||
0.045%, 01/26/2036 (C) (E) | 135 | 139 | ||||||
| SEI Institutional Managed Trust / Annual Report / September 30, 2013 | 117 |
SCHEDULE OF INVESTMENTS
U.S. Fixed Income Fund (Continued)
September 30, 2013
| Description | Face Amount ($ Thousands) | Market Value ($ Thousands) | ||||||
BCAP LLC Trust, | ||||||||
5.303%, 04/26/2037 (C) (E) | $ | 231 | $ | 229 | ||||
BCAP LLC Trust, | ||||||||
5.500%, 11/26/2037 (C) (E) | 13 | 12 | ||||||
BCAP LLC Trust, | ||||||||
4.982%, 04/26/2035 (C) (E) | 39 | 39 | ||||||
BCAP LLC Trust, | ||||||||
2.278%, 07/26/2045 (C) (E) | 196 | 191 | ||||||
BCAP LLC Trust, | ||||||||
0.980%, 01/26/2036 (C) (E) | 59 | 58 | ||||||
BCAP LLC Trust, | ||||||||
0.858%, 02/26/2047 (C) (E) | 36 | 36 | ||||||
BCAP LLC Trust, | ||||||||
5.000%, 08/26/2037 (C) (E) | 164 | 162 | ||||||
BCAP LLC Trust, | ||||||||
0.334%, 05/28/2036 (C) (E) | 157 | 145 | ||||||
BCAP LLC Trust, Ser 2011-RR5, Cl 14A3 | ||||||||
2.704%, 07/26/2036 (C) (E) | 76 | 76 | ||||||
BCAP Trust, Ser 2011-RR10, Cl 2A1 | ||||||||
1.076%, 09/26/2037 (C) (E) | 374 | 337 | ||||||
BCAP Trust, Ser 2012-RR10, Cl 3A1 | ||||||||
0.380%, 05/26/2036 (C) (E) | 380 | 354 | ||||||
BCAP Trust, Ser 2012-RR2, Cl 1A1 | ||||||||
0.349%, 08/26/2036 (C) (E) | 298 | 288 | ||||||
Bear Stearns Adjustable Rate Mortgage Trust, | ||||||||
5.051%, 05/25/2034 (C) | 56 | 56 | ||||||
Bear Stearns Adjustable Rate Mortgage Trust, Ser 2005-5, Cl A1 | ||||||||
2.210%, 08/25/2035 (C) | 127 | 127 | ||||||
Bear Stearns ALT-A Trust, | ||||||||
0.879%, 01/25/2035 (C) | 393 | 366 | ||||||
Bear Stearns ALT-A Trust, | ||||||||
2.591%, 08/25/2034 (C) | 379 | 383 | ||||||
Bear Stearns Commercial Mortgage Securities Trust, | ||||||||
4.945%, 02/11/2041 | 11 | 11 | ||||||
Bear Stearns Commercial Mortgage Securities Trust, Ser 2005-T20, Cl A4A | ||||||||
5.293%, 10/12/2042 (C) | 795 | 851 | ||||||
| Description | Face Amount ($ Thousands) | Market Value ($ Thousands) | ||||||
Bear Stearns Commercial Mortgage Securities Trust, Ser 2007-PW16, Cl AM | ||||||||
5.898%, 06/11/2040 (C) | $ | 105 | $ | 118 | ||||
Bear Stearns Commercial Mortgage Securities Trust, Ser 2007-PW17, Cl AM | ||||||||
5.915%, 06/11/2050 (C) | 70 | 79 | ||||||
Bear Stearns Commercial Mortgage Securities Trust, Ser 2007-PW18, Cl AMA | ||||||||
6.087%, 06/11/2050 (C) | 410 | 450 | ||||||
Bear Stearns Commercial Mortgage Securities, | ||||||||
0.933%, 06/11/2041 (C) (E) | 2,270 | 24 | ||||||
Bear Stearns Commercial Mortgage Securities, Ser 2006-PW11, Cl A | ||||||||
5.611%, 03/11/2039 (C) | 100 | 108 | ||||||
Bear Stearns Commercial Mortgage Securities, Ser PW18, Cl AM | ||||||||
6.084%, 11/11/2017 (C) | 150 | 167 | ||||||
CD Commercial Mortgage Trust, | ||||||||
5.393%, 07/15/2044 (C) | 100 | 105 | ||||||
CD Mortgage Trust, | ||||||||
5.531%, 01/15/2046 (C) | 120 | 127 | ||||||
CFCRE Commercial Mortgage Trust, | ||||||||
4.961%, 04/15/2044 (C) (E) | 249 | 271 | ||||||
Chase Mortgage Finance, | ||||||||
2.719%, 02/25/2037 (C) | 88 | 88 | ||||||
Chase Mortgage Finance, | ||||||||
2.792%, 02/25/2037 (C) | 46 | 46 | ||||||
Chase Mortgage Finance, | ||||||||
2.793%, 07/25/2037 (C) | 110 | 109 | ||||||
Chase Mortgage Finance, | ||||||||
2.920%, 07/25/2037 (C) | 109 | 109 | ||||||
Citigroup Commercial Mortgage Trust, Ser 2005-C3, Cl A4 | ||||||||
4.860%, 05/15/2043 | 265 | 276 | ||||||
Citigroup Commercial Mortgage Trust, Ser 2005-C3, Cl AM | ||||||||
4.830%, 05/15/2043 (C) | 120 | 126 | ||||||
Citigroup Commercial Mortgage Trust, Ser 2013-GC11, Cl AAB | ||||||||
2.690%, 04/10/2046 | 96 | 93 | ||||||
Citigroup Mortgage Loan Trust, | ||||||||
5.500%, 05/25/2035 | 92 | 93 | ||||||
| 118 | SEI Institutional Managed Trust / Annual Report / September 30, 2013 |
| Description | Face Amount ($ Thousands) | Market Value ($ Thousands) | ||||||
Citigroup Mortgage Loan Trust, | ||||||||
2.912%, 11/25/2038 (C) (E) | $ | 174 | $ | 177 | ||||
Citigroup Mortgage Loan Trust, | ||||||||
2.618%, 02/25/2035 (C) (E) | 60 | 61 | ||||||
Citigroup Mortgage Loan Trust, | ||||||||
4.000%, 11/25/2036 (E) | 716 | 723 | ||||||
Citigroup Mortgage Loan Trust, | ||||||||
4.500%, 12/25/2036 (E) | 354 | 365 | ||||||
Citigroup Mortgage Loan Trust, | ||||||||
0.259%, 02/25/2047 (C) (E) | 9 | 9 | ||||||
Citigroup Mortgage Loan Trust, | ||||||||
0.391%, 02/25/2046 (C) (E) | 96 | 90 | ||||||
Citigroup Mortgage Loan Trust, | ||||||||
2.500%, 06/25/2051 (E) | 130 | 127 | ||||||
Citigroup/Deutsche Bank Commercial Mortgage Trust, Ser 2006-CD2, Cl X, IO | ||||||||
0.083%, 01/15/2046 (C) (E) | 13,858 | 20 | ||||||
Citigroup/Deutsche Bank Commercial Mortgage Trust, Ser 2007-CD4, Cl XC, IO | ||||||||
0.213%, 12/11/2049 (C) (E) | 11,449 | 108 | ||||||
COBALT CMBS Commercial Mortgage Trust, | ||||||||
5.484%, 04/15/2047 (C) | 100 | 111 | ||||||
COBALT CMBS Commercial Mortgage Trust, Ser 2007-C2, Cl AMFX | ||||||||
5.526%, 04/15/2047 (C) | 125 | 138 | ||||||
COMM Mortgage Trust, | ||||||||
4.205%, 07/10/2046 (E) | 369 | 391 | ||||||
COMM Mortgage Trust, | ||||||||
2.114%, 08/15/2045 (C) | 759 | 87 | ||||||
COMM Mortgage Trust, | ||||||||
3.069%, 12/10/2044 | 161 | 164 | ||||||
COMM Mortgage Trust, | ||||||||
3.288%, 12/10/2044 | 343 | 339 | ||||||
COMM Mortgage Trust, | ||||||||
4.210%, 08/10/2023 | 290 | 302 | ||||||
2.972%, 08/10/2018 | 50 | 52 | ||||||
| Description | Face Amount ($ Thousands) | Market Value ($ Thousands) | ||||||
COMM Mortgage Trust, | ||||||||
2.739%, 03/10/2046 | $ | 316 | $ | 311 | ||||
COMM Mortgage Trust, | ||||||||
1.344%, 07/10/2045 | 256 | 256 | ||||||
COMM Mortgage Trust, | ||||||||
4.380%, 07/10/2045 (C) | 399 | 416 | ||||||
COMM Mortgage Trust, | ||||||||
3.834%, 07/10/2045 | 327 | 341 | ||||||
Commercial Mortgage Pass-Through Certificates, Ser 2007-C9, Cl A4 | ||||||||
5.994%, 12/10/2049 (C) | 400 | 455 | ||||||
Commercial Mortgage Trust, Ser 2004-GG1, Cl A7 | ||||||||
5.317%, 06/10/2036 (C) (F) | 130 | 131 | ||||||
Commercial Mortgage Trust, | ||||||||
4.619%, 08/10/2042 | 122 | 123 | ||||||
Commercial Mortgage Trust, | ||||||||
5.224%, 04/10/2037 (C) | 1,113 | 1,183 | ||||||
Commercial Mortgage Pass-Through Certificates, Ser 2006-C5, Cl A3 | ||||||||
5.311%, 12/15/2039 | 1,058 | 1,155 | ||||||
Countrywide Home Loan Mortgage Pass-Through Trust, | ||||||||
5.000%, 10/25/2033 | 196 | 202 | ||||||
Countrywide Home Loan Mortgage Pass-Through Trust, | ||||||||
5.250%, 01/25/2034 | 284 | 293 | ||||||
Countrywide Home Loan Mortgage Pass-Through Trust, | ||||||||
9.542%, 08/25/2018 (C) | 20 | 21 | ||||||
Countrywide Home Loan Mortgage Pass-Through Trust, | ||||||||
4.500%, 06/25/2019 | 69 | 72 | ||||||
Credit Suisse First Boston Mortgage Securities, Ser 2003-27, Cl 5A3 | ||||||||
5.250%, 11/25/2033 | 205 | 208 | ||||||
Credit Suisse First Boston Mortgage Securities, Ser 2003-29, Cl 5A1 | ||||||||
7.000%, 12/25/2033 | 103 | 111 | ||||||
Credit Suisse First Boston Mortgage Securities, Ser 2003-29, Cl 8A1 | ||||||||
6.000%, 11/25/2018 | 111 | 115 | ||||||
Credit Suisse First Boston Mortgage Securities, Ser 2003-AR24, Cl 2A4 | ||||||||
2.598%, 10/25/2033 (C) | 895 | 842 | ||||||
| SEI Institutional Managed Trust / Annual Report / September 30, 2013 | 119 |
SCHEDULE OF INVESTMENTS
U.S. Fixed Income Fund (Continued)
September 30, 2013
| Description | Face Amount ($ Thousands) | Market Value ($ Thousands) | ||||||
Credit Suisse First Boston Mortgage Securities, Ser 2004-C5, Cl A4 | ||||||||
4.829%, 11/15/2037 | $ | 58 | $ | 60 | ||||
Credit Suisse First Boston Mortgage Securities, Ser 2005-C2, Cl A4 | ||||||||
4.832%, 04/15/2037 | 134 | 140 | ||||||
Credit Suisse First Boston Mortgage Securities, Ser 2005-C5, Cl A4 | ||||||||
5.100%, 08/15/2038 (C) | 229 | 242 | ||||||
Credit Suisse Mortgage Capital Certificates, Ser 2006-C2, Cl A3 | ||||||||
5.858%, 03/15/2039 (C) | 215 | 233 | ||||||
Credit Suisse Mortgage Capital Certificates, | ||||||||
2.631%, 09/26/2046 (C) (E) | 70 | 70 | ||||||
Credit Suisse Mortgage Capital Certificates, Ser 2010-16, Cl A3 | ||||||||
4.250%, 06/25/2050 (C) (E) | 100 | 99 | ||||||
Credit Suisse Mortgage Capital Certificates, Ser 2010-1R, Cl 26A1 | ||||||||
4.750%, 05/27/2037 (E) | 13 | 13 | ||||||
Credit Suisse Mortgage Capital Certificates, Ser 2011-16R, Cl 7A3 | ||||||||
3.500%, 12/27/2036 (C) (E) | 176 | 179 | ||||||
Credit Suisse Mortgage Capital Certificates, Ser 2011-6R, Cl 3A1 | ||||||||
2.736%, 07/28/2036 (C) (E) | 99 | 98 | ||||||
Credit Suisse Mortgage Capital Certificates, Ser 2011-7R, Cl A1 | ||||||||
1.434%, 08/28/2047 (C) (E) | 132 | 132 | ||||||
Credit Suisse Mortgage Capital Certificates, Ser 2011-9R, Cl A1 | ||||||||
2.184%, 03/27/2046 (C) (E) | 275 | 276 | ||||||
Credit Suisse Mortgage Capital Certificates, Ser 2012-11R, Cl A6 | ||||||||
1.186%, 06/28/2047 (C) (E) | 424 | 413 | ||||||
CW Capital Cobalt, | ||||||||
5.223%, 08/15/2048 | 215 | 233 | ||||||
DBRR Trust, Ser 2011-LC2, Cl A4A | ||||||||
4.537%, 07/12/2044 (C) (E) | 500 | 534 | ||||||
DBRR Trust, Ser 2012-EZ1, Cl A | ||||||||
0.946%, 09/25/2045 (E) | 540 | 540 | ||||||
DBRR Trust, Ser 2013-EZ2, Cl A | ||||||||
0.853%, 02/25/2045 (C) (E) | 724 | 721 | ||||||
DBRR Trust, Ser 2013-EZ3, Cl A | ||||||||
1.636%, 12/18/2049 (C) (E) | 257 | 257 | ||||||
DBUBS Mortgage Trust, | ||||||||
3.742%, 11/10/2046 (E) | 174 | 184 | ||||||
DBUBS Mortgage Trust, | ||||||||
5.002%, 11/10/2046 (E) | 360 | 399 | ||||||
| Description | Face Amount ($ Thousands) | Market Value ($ Thousands) | ||||||
DBUBS Mortgage Trust, | ||||||||
4.537%, 07/10/2044 (E) | $ | 401 | $ | 431 | ||||
Deutsche ALT-A Securities Alternate Loan Trust, Ser 2005-1, Cl 2A1 | ||||||||
5.663%, 02/25/2020 (C) | 70 | 72 | ||||||
Deutsche Mortgage Securities, | ||||||||
0.314%, 04/26/2037 (C) (E) | 28 | 27 | ||||||
Developers Diversified Realty, | ||||||||
3.807%, 10/14/2022 (E) | 318 | 326 | ||||||
Extended Stay America Trust, | ||||||||
2.958%, 12/05/2031 (E) | 140 | 137 | ||||||
FDIC Structured Sale Guaranteed Notes, Ser 2010-C1, Cl A | ||||||||
2.980%, 12/06/2020 (E) | 177 | 183 | ||||||
First Horizon Asset Securities, Ser 2003-8, Cl 2A1 | ||||||||
4.500%, 09/25/2018 | 52 | 54 | ||||||
GE Capital Assurance, | ||||||||
5.254%, 05/12/2035 (C) (E) | 288 | 300 | ||||||
GMAC Commercial Mortgage Securities, Ser 2003-C3, Cl A4 | ||||||||
5.023%, 04/10/2040 | 15 | 15 | ||||||
GMAC Commercial Mortgage Securities, Ser 2006-C1, Cl AM | ||||||||
5.290%, 11/10/2045 (C) | 380 | 404 | ||||||
GMAC Mortgage Loan Trust, | ||||||||
3.145%, 10/19/2033 (C) | 160 | 163 | ||||||
GMAC Mortgage Loan Trust, | ||||||||
5.000%, 10/25/2033 | 122 | 127 | ||||||
GMAC Mortgage Loan Trust, Ser 2003-J7, Cl A7 | ||||||||
5.000%, 11/25/2033 | 162 | 165 | ||||||
GMAC Mortgage Loan Trust, Ser 2004-J5, Cl A7 | ||||||||
6.500%, 01/25/2035 | 148 | 157 | ||||||
GMAC Mortgage Loan Trust, Ser 2004-J6, Cl 1A1 | ||||||||
5.000%, 01/25/2020 | 61 | 62 | ||||||
Greenwich Capital Commercial Funding, Ser 2007-GG11, Cl A4 | ||||||||
5.736%, 12/10/2049 | 40 | 45 | ||||||
GS Mortgage Securities II, | ||||||||
4.751%, 07/10/2039 | 358 | 374 | ||||||
GS Mortgage Securities II, | ||||||||
0.774%, 11/10/2039 (C) (E) | 2,709 | 40 | ||||||
| 120 | SEI Institutional Managed Trust / Annual Report / September 30, 2013 |
| Description | Face Amount ($ Thousands) | Market Value ($ Thousands) | ||||||
GS Mortgage Securities II, | ||||||||
2.706%, 12/10/2027 (E) | $ | 121 | $ | 119 | ||||
GS Mortgage Securities II, | ||||||||
2.943%, 02/10/2046 | 130 | 123 | ||||||
GS Mortgage Securities Trust, | ||||||||
3.707%, 08/10/2044 | 1,725 | 1,781 | ||||||
GS Mortgage Securities Trust, | ||||||||
4.176%, 07/10/2046 (C) | 150 | 155 | ||||||
GS Mortgage Securities Trust, | ||||||||
4.243%, 08/10/2046 | 30 | 31 | ||||||
GS Mortgage Securities Trust, Ser NYC5, Cl A | ||||||||
2.318%, 01/10/2030 (E) | 122 | 122 | ||||||
GS Mortgage Securities, | ||||||||
4.753%, 03/10/2044 (E) | 183 | 200 | ||||||
GSMPS Mortgage Loan Trust, | ||||||||
0.529%, 09/25/2035 (C) (E) | 167 | 138 | ||||||
GSR Mortgage Loan Trust, | ||||||||
3.020%, 10/25/2033 (C) | 228 | 230 | ||||||
GSR Mortgage Loan Trust, | ||||||||
6.000%, 09/25/2034 | 167 | 175 | ||||||
GSR Mortgage Loan Trust, | ||||||||
0.679%, 06/25/2035 (C) | 28 | 27 | ||||||
GSR Mortgage Loan Trust, | ||||||||
5.500%, 01/25/2037 | 38 | 37 | ||||||
Homestar Mortgage Acceptance, Ser 2004-5, Cl A1 | ||||||||
0.594%, 10/25/2034 (C) | 1,209 | 1,183 | ||||||
Homestar Mortgage Acceptance, Ser 2004-6, Cl M3 | ||||||||
1.279%, 01/25/2035 (C) | 520 | 462 | ||||||
Impac CMB Trust, | ||||||||
0.579%, 05/25/2037 (C) | 659 | 591 | ||||||
Impac Secured Assets CMN Owner Trust, Ser 2003-2, Cl A1 | ||||||||
5.500%, 08/25/2033 | 104 | 109 | ||||||
Impac Secured Assets CMN Owner Trust, Ser 2006-1, Cl 2A1 | ||||||||
0.529%, 05/25/2036 (C) | 96 | 94 | ||||||
Impac Secured Assets Trust, Ser 2006-2, Cl 2A1 | ||||||||
0.529%, 08/25/2036 (C) | 110 | 106 | ||||||
| Description | Face Amount ($ Thousands) | Market Value ($ Thousands) | ||||||
Impac Secured Assets Trust, Ser 2007-2, Cl 2A | ||||||||
0.429%, 04/25/2037 (C) | $ | 301 | $ | 274 | ||||
Impact Funding Affordable Multifamily Housing Mortgage Loan Trust, Ser 2010-1, Cl A1 | ||||||||
5.314%, 01/25/2051 (E) | 902 | 1,013 | ||||||
JPMBB Commercial Mortgage Securities Trust, | ||||||||
1.085%, 07/15/2045 | 228 | 226 | ||||||
JPMBB Commercial Mortgage Securities Trust, | ||||||||
3.019%, 08/15/2046 | 456 | 471 | ||||||
JPMBB Commercial Mortgage Securities Trust, | ||||||||
3.761%, 08/15/2046 (C) | 322 | 333 | ||||||
JPMorgan Chase Commercial Mortgage Securities Trust, Ser 2006-LDP9, Cl A2 | ||||||||
5.134%, 05/15/2047 | 59 | 60 | ||||||
JPMorgan Chase Commercial Mortgage Securities Trust, Ser 2007-CB20, Cl AM | ||||||||
6.078%, 02/12/2051 (C) | 180 | 203 | ||||||
JPMorgan Chase Commercial Mortgage Securities Trust, Ser 2007-LD11, Cl A4 | ||||||||
6.003%, 06/15/2049 (C) | 120 | 135 | ||||||
JPMorgan Chase Commercial Mortgage Securities Trust, Ser 2010-CNTR, Cl A1 | ||||||||
3.300%, 08/05/2032 (E) | 114 | 120 | ||||||
JPMorgan Chase Commercial Mortgage Securities Trust, Ser 2011-C4, Cl A4 | ||||||||
4.388%, 07/15/2046 (E) | 303 | 322 | ||||||
JPMorgan Chase Commercial Mortgage Securities Trust, Ser 2012-C8, Cl ASB | ||||||||
2.379%, 10/15/2045 | 219 | 212 | ||||||
JPMorgan Chase Commercial Mortgage Securities, | ||||||||
5.115%, 07/15/2041 | 615 | 628 | ||||||
JPMorgan Chase Commercial Mortgage Securities, | ||||||||
4.678%, 07/15/2042 | 61 | 62 | ||||||
JPMorgan Chase Commercial Mortgage Securities, | ||||||||
4.918%, 10/15/2042 (C) | 542 | 574 | ||||||
| SEI Institutional Managed Trust / Annual Report / September 30, 2013 | 121 |
SCHEDULE OF INVESTMENTS
U.S. Fixed Income Fund (Continued)
September 30, 2013
| Description | Face Amount ($ Thousands) | Market Value ($ Thousands) | ||||||
JPMorgan Chase Commercial Mortgage Securities, | ||||||||
5.481%, 12/12/2044 (C) | $ | 266 | $ | 286 | ||||
JPMorgan Chase Commercial Mortgage Securities, | ||||||||
0.434%, 06/12/2043 (C) | 12,138 | 73 | ||||||
JPMorgan Chase Commercial Mortgage Securities, | ||||||||
5.552%, 05/12/2045 | — | — | ||||||
JPMorgan Chase Commercial Mortgage Securities, | ||||||||
5.429%, 12/12/2043 | 753 | 822 | ||||||
JPMorgan Chase Commercial Mortgage Securities, | ||||||||
0.337%, 05/15/2047 (C) | 150 | 150 | ||||||
JPMorgan Chase Commercial Mortgage Securities, | ||||||||
5.716%, 02/15/2051 | 203 | 226 | ||||||
JPMorgan Chase Commercial Mortgage Securities, | ||||||||
4.070%, 11/15/2043 (E) | 223 | 234 | ||||||
JPMorgan Chase Commercial Mortgage Securities, | ||||||||
4.311%, 08/05/2032 (E) | 204 | 215 | ||||||
JPMorgan Chase Commercial Mortgage Securities, | ||||||||
1.303%, 01/15/2046 | 104 | 105 | ||||||
JPMorgan Chase Commercial Mortgage Securities, | ||||||||
2.665%, 01/15/2046 | 397 | 406 | ||||||
JPMorgan Chase Commercial Mortgage Securities, | ||||||||
3.414%, 01/15/2046 | 82 | 83 | ||||||
JPMorgan Chase Commercial Mortgage Securities, | ||||||||
2.554%, 04/15/2046 | 398 | 384 | ||||||
JPMorgan Chase Commercial Mortgage Securities, | ||||||||
5.399%, 05/15/2045 | 915 | 1,001 | ||||||
JPMorgan Mortgage Trust, | ||||||||
2.754%, 07/25/2034 (C) | 37 | 38 | ||||||
| Description | Face Amount ($ Thousands) | Market Value ($ Thousands) | ||||||
JPMorgan Mortgage Trust, | ||||||||
2.769%, 09/25/2034 (C) | $ | 44 | $ | 44 | ||||
JPMorgan Mortgage Trust, | ||||||||
2.735%, 08/25/2034 (C) | 339 | 333 | ||||||
JPMorgan Mortgage Trust, | ||||||||
2.849%, 11/25/2033 (C) | 176 | 178 | ||||||
JPMorgan Mortgage Trust, | ||||||||
2.769%, 08/25/2034 (C) | 179 | 177 | ||||||
JPMorgan Reremic, | ||||||||
1.865%, 08/26/2035 (C) (E) | 67 | 67 | ||||||
LB Commercial Conduit Mortgage Trust, Ser 2007-C3, Cl A3 | ||||||||
6.071%, 07/15/2044 (C) | 129 | 132 | ||||||
LB Commercial Mortgage Trust, | ||||||||
6.081%, 06/15/2017 (C) | 60 | 67 | ||||||
LB-UBS Commercial Mortgage Trust, Ser 2004-C7, Cl A5 | ||||||||
4.628%, 10/15/2029 | 8 | 8 | ||||||
LB-UBS Commercial Mortgage Trust, Ser 2004-C8, Cl A6 | ||||||||
4.799%, 12/15/2029 (C) | 43 | 44 | ||||||
LB-UBS Commercial Mortgage Trust, Ser 2006-C1, Cl A4 | ||||||||
5.156%, 02/15/2031 | 200 | 215 | ||||||
LB-UBS Commercial Mortgage Trust, Ser 2006-C1, Cl XCL, IO | ||||||||
0.532%, 02/15/2041 (C) (E) | 7,645 | 61 | ||||||
LB-UBS Commercial Mortgage Trust, Ser 2006-C4, Cl A4 | ||||||||
6.061%, 06/15/2038 (C) | 125 | 138 | ||||||
LB-UBS Commercial Mortgage Trust, Ser 2007-C7, Cl AM | ||||||||
6.425%, 09/15/2045 (C) | 40 | 45 | ||||||
Master Alternative Loans Trust, Ser 2003-9, Cl 2A1 | ||||||||
6.000%, 12/25/2033 | 98 | 104 | ||||||
Master Resecuritization Trust, Ser 2005, Cl PO, PO | ||||||||
0.000%, 05/28/2035 (E) | 51 | 41 | ||||||
MASTR Asset Securitization Trust, Ser 2003-11, Cl 9A6 | ||||||||
5.250%, 12/25/2033 | 225 | 234 | ||||||
MASTR Asset Securitization Trust, Ser 2003-2, Cl 1A1 | ||||||||
5.000%, 03/25/2018 | 22 | 23 | ||||||
MASTR Asset Securitization Trust, Ser 2003-3, Cl 3A18 | ||||||||
5.500%, 04/25/2033 | 62 | 64 | ||||||
| 122 | SEI Institutional Managed Trust / Annual Report / September 30, 2013 |
| Description | Face Amount ($ Thousands) | Market Value ($ Thousands) | ||||||
Merrill Lynch Commecial Mortgage, Ser 2006-4, Cl AM | ||||||||
5.204%, 12/12/2049 (C) | $ | 210 | $ | 229 | ||||
Merrill Lynch Mortgage Investors Trust, Ser 2004-A1, Cl 4A | ||||||||
5.103%, 02/25/2034 (C) | 314 | 317 | ||||||
Merrill Lynch Mortgage Investors, Ser 2003-A4, Cl 2A | ||||||||
2.665%, 07/25/2033 (C) | 40 | 41 | ||||||
Merrill Lynch Mortgage Trust, | ||||||||
4.949%, 07/12/2038 (C) | 127 | 131 | ||||||
Merrill Lynch Mortgage Trust, | ||||||||
5.047%, 07/12/2038 (C) | 165 | 175 | ||||||
Merrill Lynch Mortgage Trust, | ||||||||
5.549%, 01/12/2044 (C) | 120 | 129 | ||||||
Merrill Lynch/Countrywide Commercial Mortgage Trust, Ser 2006-4, Cl XC, IO | ||||||||
0.249%, 12/12/2049 (C) (E) | 2,947 | 35 | ||||||
MLCC Mortgage Investors, | ||||||||
0.873%, 04/25/2029 (C) | 88 | 84 | ||||||
MLCC Mortgage Investors, | ||||||||
0.644%, 04/25/2029 | 482 | 456 | ||||||
Morgan Stanley Bank of America Merrill Lynch Trust, | ||||||||
2.825%, 08/15/2045 | 234 | 231 | ||||||
Morgan Stanley Bank of America Merrill Lynch Trust, | ||||||||
2.506%, 11/15/2045 | 622 | 604 | ||||||
Morgan Stanley Bank of America Merrill Lynch Trust, | ||||||||
1.394%, 07/15/2046 | 497 | 499 | ||||||
Morgan Stanley Bank of America Merrill Lynch Trust, | ||||||||
3.912%, 07/15/2046 (C) | 62 | 65 | ||||||
Morgan Stanley Bank of America Merrill Lynch Trust, | ||||||||
3.085%, 08/15/2046 | 758 | 787 | ||||||
Morgan Stanley Bank of America Merrill Lynch Trust, | ||||||||
4.367%, 08/15/2046 (C) | 200 | 208 | ||||||
| Description | Face Amount ($ Thousands) | Market Value ($ Thousands) | ||||||
Morgan Stanley Bank of America Merrill Lynch Trust, | ||||||||
2.943%, 02/15/2046 | $ | 70 | $ | 66 | ||||
Morgan Stanley Bank of America Merrill Lynch Trust, | ||||||||
2.469%, 02/15/2046 | 176 | 169 | ||||||
Morgan Stanley Bank of America Merrill Lynch Trust, | ||||||||
3.446%, 02/15/2046 | 71 | 67 | ||||||
Morgan Stanley Bank of America Merrill Lynch Trust, | ||||||||
3.456%, 05/15/2046 | 80 | 76 | ||||||
Morgan Stanley Capital I Trust, | ||||||||
4.661%, 06/15/2044 (E) | 211 | 230 | ||||||
Morgan Stanley Capital I Trust, | ||||||||
0.250%, 07/27/2049 (E) | 130 | 107 | ||||||
Morgan Stanley Capital I, | ||||||||
4.970%, 04/14/2040 | 504 | 515 | ||||||
Morgan Stanley Capital I, | ||||||||
5.037%, 01/14/2042 | 19 | 19 | ||||||
Morgan Stanley Capital I, | ||||||||
5.355%, 11/14/2042 (C) | 10 | 10 | ||||||
Morgan Stanley Capital I, | ||||||||
4.890%, 06/12/2047 | 840 | 888 | ||||||
Morgan Stanley Capital I, | ||||||||
0.395%, 02/12/2044 (C) (E) | 7,666 | 37 | ||||||
Morgan Stanley Capital I, | ||||||||
5.816%, 06/11/2042 (C) | 100 | 113 | ||||||
Morgan Stanley Capital I, | ||||||||
3.224%, 07/15/2049 | 290 | 303 | ||||||
Morgan Stanley Capital I, | ||||||||
4.118%, 07/15/2049 | 170 | 178 | ||||||
Morgan Stanley Capital I, | ||||||||
2.000%, 07/27/2049 (E) | 546 | 550 | ||||||
Morgan Stanley Re-Remic Trust, Ser 2009-IO, Cl B, PO | ||||||||
0.000%, 07/17/2056 (E) | 134 | 130 | ||||||
Morgan Stanley Re-Remic Trust, Ser 2010-HQ4B, Cl A7A | ||||||||
4.970%, 04/16/2040 (E) | 204 | 208 | ||||||
| SEI Institutional Managed Trust / Annual Report / September 30, 2013 | 123 |
SCHEDULE OF INVESTMENTS
U.S. Fixed Income Fund (Continued)
September 30, 2013
| Description | Face Amount ($ Thousands) | Market Value ($ Thousands) | ||||||
Morgan Stanley Re-Remic Trust, Ser 2011-IO, Cl A | ||||||||
2.500%, 03/23/2051 (E) | $ | 207 | $ | 207 | ||||
Morgan Stanley, Ser 12, Cl AXA | ||||||||
1.000%, 03/27/2051 (E) | 144 | 143 | ||||||
Motel 6 Trust, Ser 2012-MTL6, Cl A2 | ||||||||
1.948%, 10/05/2025 (E) | 443 | 434 | ||||||
Normandy Mortgage Loan Trust, Ser 2013-NPL3 | ||||||||
4.949%, 09/16/2043 | 602 | 602 | ||||||
NorthStar Mortgage Trust, | ||||||||
1.384%, 08/25/2029 (C) (E) | 125 | 125 | ||||||
Prime Mortgage Trust, | ||||||||
6.000%, 02/25/2034 | 73 | 76 | ||||||
Prime Mortgage Trust, | ||||||||
0.000%, 02/25/2034 | 25 | 22 | ||||||
RBSSP Resecuritization Trust, Ser 2010-9, Cl 7A5 | ||||||||
4.000%, 05/26/2037 (C) (E) | 146 | 149 | ||||||
Residential Accredit Loans, | ||||||||
5.500%, 08/25/2033 | 249 | 256 | ||||||
Residential Accredit Loans, | ||||||||
5.000%, 09/25/2018 | 98 | 100 | ||||||
Residential Accredit Loans, Ser 2004-QA7, Cl A4 | ||||||||
5.500%, 05/25/2034 | 334 | 341 | ||||||
Residential Asset Mortgage Products, Ser 2004-SL1, Cl A8 | ||||||||
6.500%, 11/25/2031 | 431 | 444 | ||||||
Residential Asset Securitization Trust, Ser 2002-A13, Cl A4 | ||||||||
5.250%, 12/25/2017 | 39 | 40 | ||||||
Residential Asset Securitization Trust, Ser 2003-A5, Cl A1 | ||||||||
5.500%, 06/25/2033 | 82 | 86 | ||||||
Residential Asset Securitization Trust, Ser 2004-IP2, Cl 2A1 | ||||||||
2.646%, 12/25/2034 (C) | 656 | 657 | ||||||
Salomon Brothers Mortgage Securities VII, | ||||||||
3.079%, 09/25/2033 (C) | 108 | 109 | ||||||
Sequoia Mortgage Trust, | ||||||||
0.480%, 12/20/2034 (C) | 263 | 252 | ||||||
Sequoia Mortgage Trust, | ||||||||
3.750%, 02/25/2040 (C) | 13 | 13 | ||||||
| Description | Face Amount ($ Thousands) | Market Value ($ Thousands) | ||||||
Sequoia Mortgage Trust, | ||||||||
4.125%, 02/25/2041 (C) | $ | 18 | $ | 18 | ||||
Springleaf Mortgage Loan Trust, | ||||||||
4.050%, 01/25/2058 (C) (E) | 139 | 143 | ||||||
Springleaf Mortgage Loan Trust, | ||||||||
5.450%, 01/25/2058 (C) (E) | 300 | 314 | ||||||
Springleaf Mortgage Loan Trust, | ||||||||
2.220%, 10/25/2057 (C) (E) | 89 | 90 | ||||||
Springleaf Mortgage Loan Trust, | ||||||||
6.000%, 10/25/2057 (C) (E) | 100 | 103 | ||||||
Springleaf Mortgage Loan Trust, | ||||||||
1.570%, 12/25/2059 (C) (E) | 201 | 199 | ||||||
Springleaf Mortgage Loan Trust, | ||||||||
1.270%, 06/25/2058 (C) (E) | 225 | 222 | ||||||
Structured Adjustable Rate Mortgage Loan Trust, Ser 2004-5, Cl 2A | ||||||||
2.480%, 05/25/2034 (C) | 394 | 389 | ||||||
Structured Adjustable Rate Mortgage Loan Trust, Ser 2004-6, Cl 5A4 | ||||||||
4.885%, 06/25/2034 (C) | 87 | 87 | ||||||
Structured Asset Securities, | ||||||||
0.679%, 06/25/2033 (C) | 49 | 47 | ||||||
Structured Asset Securities, | ||||||||
2.425%, 07/25/2033 (C) | 218 | 217 | ||||||
Structured Asset Securities, | ||||||||
5.533%, 11/25/2033 (C) | 55 | 56 | ||||||
Structured Asset Securities, | ||||||||
5.500%, 10/25/2033 | 149 | 153 | ||||||
Structured Asset Securities, | ||||||||
4.319%, 12/25/2033 (C) | 71 | 71 | ||||||
Structured Asset Securities, | ||||||||
5.540%, 12/25/2033 | 239 | 246 | ||||||
UBS-BAMLL Trust, | ||||||||
3.663%, 06/10/2030 (E) | 145 | 140 | ||||||
UBS-Barclays Commercial Mortgage Trust, Ser 2012-C2, Cl A4 | ||||||||
3.525%, 05/10/2063 | 130 | 129 | ||||||
UBS-Barclays Commercial Mortgage Trust, Ser 2012-C2, Cl XA, IO | ||||||||
1.963%, 05/10/2063 (C) (E) | 767 | 72 | ||||||
| 124 | SEI Institutional Managed Trust / Annual Report / September 30, 2013 |
| Description | Face Amount ($ Thousands) | Market Value ($ Thousands) | ||||||
UBS-Barclays Commercial Mortgage Trust, Ser 2012-C3, Cl A3 | ||||||||
2.728%, 08/10/2049 | $ | 235 | $ | 232 | ||||
UBS-Barclays Commercial Mortgage Trust, Ser 2012-C4, Cl AS | ||||||||
3.317%, 12/10/2045 (E) | 75 | 71 | ||||||
UBS-Barclays Commercial Mortgage Trust, Ser 2013-C6, Cl ASB | ||||||||
2.788%, 04/10/2046 | 513 | 503 | ||||||
Vendee Mortgage Trust CMO, Ser 1993-1, Cl ZB | ||||||||
7.250%, 02/15/2023 | 664 | 776 | ||||||
Vericrest Opportunity Loan Trust, Ser 2012-NL3A, Cl A | ||||||||
2.734%, 11/25/2060 (C) (E) | 216 | 217 | ||||||
Vericrest Opportunity Loan Trust, Ser 2013-1A, Cl A | ||||||||
3.105%, 11/25/2050 (C) (E) | 151 | 151 | ||||||
VNO Mortgage Trust, Ser 2012-6AVE, Cl A | ||||||||
2.996%, 11/15/2030 (E) | 100 | 94 | ||||||
Wachovia Bank Commercial Mortgage Trust, | ||||||||
5.342%, 12/15/2043 | 170 | 188 | ||||||
Wachovia Bank Commercial Mortgage Trust, | ||||||||
5.383%, 12/15/2043 | 90 | 96 | ||||||
Wachovia Commercial Mortgage Securities Pass-Through Certificates, Ser 2003-C9, Cl A4 | ||||||||
5.012%, 12/15/2035 (C) | 149 | 149 | ||||||
WaMu Mortgage Pass-Through Certificates Trust, | ||||||||
0.469%, 10/25/2045 (C) | 1,026 | 937 | ||||||
WaMu Mortgage Pass-Through Certificates, Ser 2003-AR10, Cl A7 | ||||||||
2.501%, 10/25/2033 (C) | 183 | 186 | ||||||
WaMu Mortgage Pass-Through Certificates, Ser 2003-AR7, Cl A7 | ||||||||
2.319%, 08/25/2033 (C) | 102 | 102 | ||||||
WaMu Mortgage Pass-Through Certificates, Ser 2003-AR8, Cl A | ||||||||
2.448%, 08/25/2033 (C) | 48 | 49 | ||||||
WaMu Mortgage Pass-Through Certificates, Ser 2003-AR9, Cl 1A6 | ||||||||
2.428%, 09/25/2033 (C) | 162 | 164 | ||||||
WaMu Mortgage Pass-Through Certificates, | ||||||||
4.500%, 12/25/2018 | 46 | 48 | ||||||
| Description | Face Amount ($ Thousands) | Market Value ($ Thousands) | ||||||
WaMu Mortgage Pass-Through Certificates, Ser 2003-S4, Cl 2A10 | ||||||||
16.971%, 06/25/2033 (C) | $ | 26 | $ | 31 | ||||
WaMu Mortgage Pass-Through Certificates, Ser 2003-S9, Cl A8 | ||||||||
5.250%, 10/25/2033 | 394 | 408 | ||||||
WaMu Mortgage Pass-Through Certificates, Ser 2004-AR3, Cl A1 | ||||||||
2.457%, 06/25/2034 (C) | 73 | 74 | ||||||
WaMu Mortgage Pass-Through Certificates, Ser 2004-AR3, Cl A2 | ||||||||
2.457%, 06/25/2034 (C) | 110 | 111 | ||||||
WaMu Mortgage Pass-Through Certificates, Ser 2004-CB2, Cl 7A | ||||||||
5.500%, 08/25/2019 | 139 | 144 | ||||||
WaMu Mortgage Pass-Through Certificates, Ser 2004-RA4, Cl 3A | ||||||||
7.500%, 07/25/2034 | 357 | 373 | ||||||
WaMu Mortgage Pass-Through Certificates, Ser 2004-S2, Cl 2A4 | ||||||||
5.500%, 06/25/2034 | 220 | 229 | ||||||
Wells Fargo Commercial Mortgage Trust, Ser 120B, Cl A | ||||||||
2.800%, 03/18/2028 (C) (E) | 200 | 194 | ||||||
Wells Fargo Commercial Mortgage Trust, Ser 2013-LC12, Cl A4 | ||||||||
4.218%, 07/15/2046 (C) | 150 | 155 | ||||||
Wells Fargo Mortgage Loan Trust, Ser 2012-RR1, Cl A1 | ||||||||
2.847%, 08/27/2037 (C) (E) | 103 | 103 | ||||||
Wells Fargo Mortgage-Backed Securities Trust, | ||||||||
4.292%, 11/25/2033 (C) | 69 | 70 | ||||||
Wells Fargo Mortgage-Backed Securities Trust, Ser 2004-E, Cl A2 | ||||||||
4.500%, 05/25/2034 (C) | 27 | 27 | ||||||
Wells Fargo Mortgage-Backed Securities Trust, | ||||||||
2.623%, 12/25/2034 (C) | 167 | 169 | ||||||
Wells Fargo Mortgage-Backed Securities Trust, | ||||||||
2.623%, 12/25/2034 (C) | 167 | 169 | ||||||
Wells Fargo Mortgage-Backed Securities Trust, | ||||||||
2.853%, 12/25/2034 (C) | 81 | 82 | ||||||
Wells Fargo Mortgage-Backed Securities Trust, | ||||||||
2.617%, 06/25/2034 (C) | 313 | 318 | ||||||
| SEI Institutional Managed Trust / Annual Report / September 30, 2013 | 125 |
SCHEDULE OF INVESTMENTS
U.S. Fixed Income Fund (Continued)
September 30, 2013
| Description | Face Amount ($ Thousands) | Market Value ($ Thousands) | ||||||
Wells Fargo Mortgage-Backed Securities Trust, | ||||||||
2.765%, 07/25/2034 (C) | $ | 178 | $ | 179 | ||||
Wells Fargo Mortgage-Backed Securities Trust, | ||||||||
2.614%, 09/25/2034 (C) | 296 | 299 | ||||||
Wells Fargo Mortgage-Backed Securities Trust, | ||||||||
2.648%, 10/25/2034 (C) | 90 | 93 | ||||||
Wells Fargo Mortgage-Backed Securities Trust, | ||||||||
2.648%, 10/25/2034 (C) | 181 | 184 | ||||||
Wells Fargo Mortgage-Backed Securities Trust, | ||||||||
5.000%, 01/25/2020 | 39 | 40 | ||||||
Wells Fargo Mortgage-Backed Securities Trust, | ||||||||
2.703%, 06/25/2035 (C) | 167 | 169 | ||||||
WF-RBS Commercial Mortgage Trust, Ser 2011-C5, Cl A4 | ||||||||
3.667%, 11/15/2044 | 790 | 803 | ||||||
WF-RBS Commercial Mortgage Trust, Ser 2012-C7, Cl XA, IO | ||||||||
1.752%, 06/15/2045 (C) (E) | 393 | 39 | ||||||
WF-RBS Commercial Mortgage Trust, Ser C3, Cl A4 | ||||||||
4.375%, 03/15/2044 (E) | 125 | 133 | ||||||
|
| |||||||
| 70,320 | ||||||||
|
| |||||||
Total Mortgage-Backed Securities | 404,646 | |||||||
|
| |||||||
CORPORATE OBLIGATIONS — 22.3% |
| |||||||
Consumer Discretionary — 1.3% |
| |||||||
CBS | ||||||||
7.875%, 07/30/2030 | 90 | 109 | ||||||
5.750%, 04/15/2020 | 25 | 28 | ||||||
Comcast | ||||||||
7.050%, 03/15/2033 | 90 | 111 | ||||||
6.500%, 01/15/2017 | 1,280 | 1,486 | ||||||
Comcast Cable Communications Holdings | ||||||||
9.455%, 11/15/2022 | 200 | 282 | ||||||
Comcast Cable Holdings | ||||||||
10.125%, 04/15/2022 | 45 | 62 | ||||||
COX Communications | ||||||||
5.450%, 12/15/2014 | 22 | 23 | ||||||
| Description | Face Amount ($ Thousands) | Market Value ($ Thousands) | ||||||
Cox Enterprises | ||||||||
7.375%, 07/15/2027 (E) | $ | 50 | $ | 57 | ||||
Daimler Finance North America | ||||||||
2.625%, 09/15/2016 (E) | 150 | 155 | ||||||
Daimler Finance North America LLC | ||||||||
6.500%, 11/15/2013 | 80 | 81 | ||||||
2.375%, 08/01/2018 (E) | 790 | 791 | ||||||
1.875%, 09/15/2014 (E) | 328 | 332 | ||||||
1.875%, 01/11/2018 (E) | 247 | 245 | ||||||
1.450%, 08/01/2016 (E) | 500 | 502 | ||||||
1.300%, 07/31/2015 (E) | 490 | 492 | ||||||
DIRECTV Holdings | ||||||||
5.150%, 03/15/2042 | 25 | 21 | ||||||
4.600%, 02/15/2021 | 100 | 100 | ||||||
DIRECTV Holdings LLC | ||||||||
6.000%, 08/15/2040 | 515 | 489 | ||||||
3.800%, 03/15/2022 (F) | 215 | 201 | ||||||
Discovery Communications | ||||||||
4.950%, 05/15/2042 | 25 | 23 | ||||||
4.375%, 06/15/2021 | 53 | 55 | ||||||
ERAC USA Finance (E) | ||||||||
6.700%, 06/01/2034 | 71 | 80 | ||||||
2.750%, 03/15/2017 | 16 | 16 | ||||||
ERAC USA Finance LLC (E) | ||||||||
5.625%, 03/15/2042 | 245 | 249 | ||||||
3.300%, 10/15/2022 | 90 | 86 | ||||||
Gap | ||||||||
5.950%, 04/12/2021 (F) | 133 | 147 | ||||||
Historic TW | ||||||||
9.150%, 02/01/2023 | 200 | 265 | ||||||
Home Depot | ||||||||
3.750%, 02/15/2024 | 506 | 512 | ||||||
Johnson Controls | ||||||||
5.250%, 12/01/2041 | 120 | 118 | ||||||
4.250%, 03/01/2021 | 65 | 68 | ||||||
3.750%, 12/01/2021 | 69 | 69 | ||||||
Lowe’s MTN | ||||||||
7.110%, 05/15/2037 | 110 | 137 | ||||||
5.125%, 11/15/2041 | 11 | 11 | ||||||
LVMH Moet Hennessy Louis Vuitton | ||||||||
1.625%, 06/29/2017 (E) | 427 | 426 | ||||||
Macy’s Retail Holdings | ||||||||
7.450%, 07/15/2017 | 35 | 41 | ||||||
5.125%, 01/15/2042 | 14 | 13 | ||||||
McDonald’s MTN | ||||||||
5.350%, 03/01/2018 | 150 | 173 | ||||||
NBCUniversal Enterprise | ||||||||
1.974%, 04/15/2019 (E) | 560 | 546 | ||||||
NBCUniversal Media | ||||||||
5.950%, 04/01/2041 | 50 | 56 | ||||||
NBCUniversal Media LLC | ||||||||
4.450%, 01/15/2043 | 68 | 63 | ||||||
Newell Rubbermaid | ||||||||
4.700%, 08/15/2020 | 47 | 50 | ||||||
| 126 | SEI Institutional Managed Trust / Annual Report / September 30, 2013 |
| Description | Face Amount ($ Thousands) | Market Value ($ Thousands) | ||||||
News America | ||||||||
7.300%, 04/30/2028 | $ | 150 | $ | 175 | ||||
7.250%, 05/18/2018 | 50 | 61 | ||||||
6.650%, 11/15/2037 | 25 | 28 | ||||||
6.150%, 03/01/2037 | 465 | 506 | ||||||
6.150%, 02/15/2041 | 15 | 17 | ||||||
Pearson Funding Four PLC | ||||||||
3.750%, 05/08/2022 (E) | 220 | 213 | ||||||
Rogers Cable | ||||||||
8.750%, 05/01/2032 | 70 | 93 | ||||||
TCI Communications | ||||||||
8.750%, 08/01/2015 | 210 | 239 | ||||||
7.125%, 02/15/2028 | 200 | 253 | ||||||
Thomson Reuters | ||||||||
4.700%, 10/15/2019 | 75 | 82 | ||||||
3.950%, 09/30/2021 | 109 | 111 | ||||||
Time Warner | ||||||||
7.700%, 05/01/2032 | 210 | 264 | ||||||
7.625%, 04/15/2031 | 385 | 479 | ||||||
5.375%, 10/15/2041 | 12 | 12 | ||||||
Time Warner Cable | ||||||||
8.250%, 04/01/2019 | 200 | 232 | ||||||
7.300%, 07/01/2038 (F) | 110 | 109 | ||||||
6.750%, 07/01/2018 | 40 | 45 | ||||||
5.875%, 11/15/2040 | 210 | 179 | ||||||
5.500%, 09/01/2041 | 44 | 36 | ||||||
5.000%, 02/01/2020 | 320 | 324 | ||||||
4.000%, 09/01/2021 | 110 | 103 | ||||||
Viacom | ||||||||
5.850%, 09/01/2043 | 300 | 305 | ||||||
4.250%, 09/01/2023 | 550 | 547 | ||||||
3.875%, 12/15/2021 | 75 | 74 | ||||||
3.250%, 03/15/2023 | 22 | 20 | ||||||
2.500%, 09/01/2018 | 150 | 150 | ||||||
Walt Disney MTN | ||||||||
0.450%, 12/01/2015 | 21 | 21 | ||||||
|
| |||||||
| 13,449 | ||||||||
|
| |||||||
Consumer Staples — 1.3% | ||||||||
Altria Group | ||||||||
4.750%, 05/05/2021 | 230 | 244 | ||||||
2.850%, 08/09/2022 | 460 | 421 | ||||||
Anheuser-Busch InBev Finance | ||||||||
4.000%, 01/17/2043 | 430 | 387 | ||||||
Anheuser-Busch InBev Worldwide | ||||||||
7.750%, 01/15/2019 | 925 | 1,164 | ||||||
2.500%, 07/15/2022 | 420 | 389 | ||||||
1.375%, 07/15/2017 | 105 | 105 | ||||||
0.800%, 07/15/2015 | 110 | 110 | ||||||
Bunge Finance | ||||||||
8.500%, 06/15/2019 | 120 | 149 | ||||||
Coca-Cola | ||||||||
1.800%, 09/01/2016 | 60 | 62 | ||||||
| Description | Face Amount ($ Thousands) | Market Value ($ Thousands) | ||||||
ConAgra Foods | ||||||||
2.100%, 03/15/2018 | $ | 7 | $ | 7 | ||||
1.900%, 01/25/2018 | 250 | 247 | ||||||
1.300%, 01/25/2016 | 190 | 190 | ||||||
CVS Caremark | ||||||||
6.125%, 09/15/2039 | 40 | 46 | ||||||
2.750%, 12/01/2022 | 550 | 508 | ||||||
CVS Pass-Through Trust | ||||||||
5.926%, 01/10/2034 (E) | 93 | 101 | ||||||
Diageo Capital PLC | ||||||||
4.828%, 07/15/2020 | 90 | 101 | ||||||
1.125%, 04/29/2018 | 1,180 | 1,140 | ||||||
Diageo Investment | ||||||||
2.875%, 05/11/2022 | 580 | 558 | ||||||
Fomento Economico Mexicano | ||||||||
4.375%, 05/10/2043 | 184 | 151 | ||||||
Heineken | ||||||||
1.400%, 10/01/2017 (E) | 240 | 236 | ||||||
Japan Tobacco | ||||||||
2.100%, 07/23/2018 (E) | 225 | 225 | ||||||
Kellogg | ||||||||
3.125%, 05/17/2022 | 35 | 34 | ||||||
1.750%, 05/17/2017 | 115 | 115 | ||||||
Kimberly-Clark | ||||||||
2.400%, 03/01/2022 | 12 | 11 | ||||||
Kraft Foods Group | ||||||||
6.500%, 02/09/2040 | 205 | 241 | ||||||
6.125%, 08/23/2018 | 225 | 265 | ||||||
5.375%, 02/10/2020 | 31 | 35 | ||||||
5.000%, 06/04/2042 | 50 | 50 | ||||||
3.500%, 06/06/2022 | 945 | 933 | ||||||
Kroger | ||||||||
7.500%, 04/01/2031 | 90 | 111 | ||||||
5.400%, 07/15/2040 | 14 | 14 | ||||||
5.150%, 08/01/2043 | 80 | 78 | ||||||
3.850%, 08/01/2023 | 110 | 108 | ||||||
2.200%, 01/15/2017 | 40 | 41 | ||||||
Lorillard Tobacco | ||||||||
8.125%, 06/23/2019 | 240 | 291 | ||||||
Mondelez International | ||||||||
6.500%, 02/09/2040 | 450 | 528 | ||||||
5.375%, 02/10/2020 | 60 | 68 | ||||||
PepsiCo | ||||||||
7.900%, 11/01/2018 | 11 | 14 | ||||||
3.000%, 08/25/2021 | 31 | 31 | ||||||
2.750%, 03/05/2022 | 355 | 338 | ||||||
2.500%, 05/10/2016 | 35 | 36 | ||||||
2.250%, 01/07/2019 | 450 | 451 | ||||||
1.250%, 08/13/2017 | 72 | 71 | ||||||
0.700%, 08/13/2015 | 220 | 220 | ||||||
Pernod-Ricard (E) | ||||||||
5.750%, 04/07/2021 | 215 | 240 | ||||||
4.450%, 01/15/2022 | 370 | 380 | ||||||
4.250%, 07/15/2022 | 260 | 262 | ||||||
| SEI Institutional Managed Trust / Annual Report / September 30, 2013 | 127 |
SCHEDULE OF INVESTMENTS
U.S. Fixed Income Fund (Continued)
September 30, 2013
| Description | Face Amount ($ Thousands) | Market Value ($ Thousands) | ||||||
Philip Morris International | ||||||||
4.500%, 03/20/2042 | $ | 240 | $ | 225 | ||||
2.500%, 08/22/2022 | 400 | 368 | ||||||
Reynolds American | ||||||||
3.250%, 11/01/2022 | 280 | 258 | ||||||
SABMiller Holdings | ||||||||
3.750%, 01/15/2022 (E) | 245 | 247 | ||||||
Tyson Foods | ||||||||
4.500%, 06/15/2022 | 275 | 285 | ||||||
Wal-Mart Stores | ||||||||
5.625%, 04/15/2041 | 20 | 23 | ||||||
|
| |||||||
| 12,913 | ||||||||
|
| |||||||
Energy — 2.4% | ||||||||
Anadarko Finance, Ser B | ||||||||
7.500%, 05/01/2031 | 100 | 125 | ||||||
Anadarko Petroleum | ||||||||
7.625%, 03/15/2014 | 180 | 185 | ||||||
6.375%, 09/15/2017 | 40 | 47 | ||||||
5.950%, 09/15/2016 | 60 | 67 | ||||||
Apache | ||||||||
5.625%, 01/15/2017 | 250 | 282 | ||||||
3.250%, 04/15/2022 | 150 | 147 | ||||||
2.625%, 01/15/2023 | 19 | 17 | ||||||
Baker Hughes | ||||||||
7.500%, 11/15/2018 | 170 | 213 | ||||||
BG Energy Capital PLC | ||||||||
4.000%, 10/15/2021 (E) | 575 | 592 | ||||||
BP Capital Markets | ||||||||
3.994%, 09/26/2023 | 95 | 96 | ||||||
1.846%, 05/05/2017 (F) | 172 | 173 | ||||||
BP Capital Markets PLC | ||||||||
3.561%, 11/01/2021 | 100 | 99 | ||||||
3.245%, 05/06/2022 | 450 | 434 | ||||||
2.750%, 05/10/2023 | 110 | 100 | ||||||
Canadian Natural Resources | ||||||||
7.200%, 01/15/2032 | 50 | 60 | ||||||
6.450%, 06/30/2033 | 50 | 57 | ||||||
Canadian Oil Sands Ltd. (E) | ||||||||
6.000%, 04/01/2042 | 218 | 223 | ||||||
4.500%, 04/01/2022 | 163 | 164 | ||||||
Cenovus Energy | ||||||||
4.450%, 09/15/2042 | 19 | 17 | ||||||
3.000%, 08/15/2022 | 8 | 8 | ||||||
Chevron | ||||||||
3.191%, 06/24/2023 | 157 | 154 | ||||||
2.427%, 06/24/2020 | 14 | 14 | ||||||
1.718%, 06/24/2018 | 840 | 837 | ||||||
CNOOC Finance | ||||||||
1.750%, 05/09/2018 | 200 | 193 | ||||||
Conoco Funding | ||||||||
7.250%, 10/15/2031 | 130 | 172 | ||||||
ConocoPhillips | ||||||||
6.000%, 01/15/2020 | 100 | 118 | ||||||
| Description | Face Amount ($ Thousands) | Market Value ($ Thousands) | ||||||
DCP Midstream Operating | ||||||||
4.950%, 04/01/2022 | $ | 271 | $ | 270 | ||||
Devon Energy | ||||||||
6.300%, 01/15/2019 | 80 | 94 | ||||||
5.600%, 07/15/2041 | 370 | 378 | ||||||
4.750%, 05/15/2042 | 17 | 16 | ||||||
3.250%, 05/15/2022 | 327 | 313 | ||||||
Devon Financing LLC | ||||||||
7.875%, 09/30/2031 | 40 | 52 | ||||||
Ecopetrol | ||||||||
7.375%, 09/18/2043 | 230 | 249 | ||||||
4.250%, 09/18/2018 | 110 | 113 | ||||||
El Paso Pipeline Partners Operating LLC | ||||||||
4.100%, 11/15/2015 | 185 | 196 | ||||||
Encana | ||||||||
6.500%, 05/15/2019 | 100 | 118 | ||||||
6.500%, 02/01/2038 | 390 | 427 | ||||||
Energen | ||||||||
4.625%, 09/01/2021 | 280 | 277 | ||||||
Energy Transfer Partners | ||||||||
8.250%, 11/15/2029 (E) | 675 | 817 | ||||||
6.500%, 02/01/2042 | 109 | 115 | ||||||
5.950%, 10/01/2043 | 175 | 174 | ||||||
5.150%, 02/01/2043 | 70 | 63 | ||||||
ENI | ||||||||
5.700%, 10/01/2040 (E) | 300 | 285 | ||||||
Enterprise Products Operating | ||||||||
5.700%, 02/15/2042 | 60 | 63 | ||||||
Enterprise Products Operating LLC | ||||||||
4.850%, 03/15/2044 | 10 | 9 | ||||||
3.350%, 03/15/2023 | 710 | 672 | ||||||
Halliburton | ||||||||
6.150%, 09/15/2019 | 80 | 96 | ||||||
3.500%, 08/01/2023 | 225 | 223 | ||||||
2.000%, 08/01/2018 | 365 | 365 | ||||||
Hess | ||||||||
8.125%, 02/15/2019 | 260 | 324 | ||||||
5.600%, 02/15/2041 | 65 | 67 | ||||||
Husky Energy | ||||||||
7.250%, 12/15/2019 | 148 | 181 | ||||||
Kerr-McGee | ||||||||
6.950%, 07/01/2024 | 788 | 923 | ||||||
Kinder Morgan Energy Partners | ||||||||
5.000%, 03/01/2043 | 245 | 222 | ||||||
3.950%, 09/01/2022 | 210 | 206 | ||||||
Murphy Oil | ||||||||
3.700%, 12/01/2022 | 345 | 322 | ||||||
Noble Energy | ||||||||
4.150%, 12/15/2021 | 230 | 239 | ||||||
Noble Holding International | ||||||||
5.250%, 03/15/2042 | 40 | 36 | ||||||
3.950%, 03/15/2022 | 12 | 12 | ||||||
| 128 | SEI Institutional Managed Trust / Annual Report / September 30, 2013 |
| Description | Face Amount ($ Thousands) | Market Value ($ Thousands) | ||||||
Occidental Petroleum | ||||||||
2.700%, 02/15/2023 | $ | 519 | $ | 480 | ||||
1.750%, 02/15/2017 | 35 | 35 | ||||||
ONEOK Partners | ||||||||
6.200%, 09/15/2043 | 145 | 149 | ||||||
3.200%, 09/15/2018 | 200 | 204 | ||||||
2.000%, 10/01/2017 | 225 | 223 | ||||||
Pemex Project Funding Master Trust | ||||||||
6.625%, 06/15/2035 | 350 | 370 | ||||||
Petrobras Global Finance BV | ||||||||
4.375%, 05/20/2023 | 39 | 36 | ||||||
3.000%, 01/15/2019 | 610 | 574 | ||||||
2.000%, 05/20/2016 | 300 | 298 | ||||||
1.884%, 05/20/2016 (C) | 725 | 721 | ||||||
Petrobras International Finance | ||||||||
5.375%, 01/27/2021 | 1,170 | 1,175 | ||||||
Petro-Canada | ||||||||
6.800%, 05/15/2038 | 475 | 565 | ||||||
6.050%, 05/15/2018 | 115 | 134 | ||||||
Petroleos Mexicanos | ||||||||
5.500%, 06/27/2044 | 175 | 159 | ||||||
4.875%, 01/18/2024 | 130 | 130 | ||||||
3.500%, 01/30/2023 | 536 | 487 | ||||||
2.286%, 07/18/2018 (C) (F) | 130 | 134 | ||||||
Phillips 66 | ||||||||
5.875%, 05/01/2042 | 35 | 37 | ||||||
4.300%, 04/01/2022 | 26 | 27 | ||||||
2.950%, 05/01/2017 | 33 | 34 | ||||||
Plains Exploration & Production | ||||||||
6.875%, 02/15/2023 | 10 | 11 | ||||||
6.500%, 11/15/2020 | 50 | 54 | ||||||
Rowan | ||||||||
5.400%, 12/01/2042 | 144 | 130 | ||||||
Schlumberger Investment | ||||||||
3.300%, 09/14/2021 (E) | 47 | 47 | ||||||
Shell International Finance | ||||||||
4.375%, 03/25/2020 | 140 | 154 | ||||||
3.400%, 08/12/2023 | 465 | 460 | ||||||
Spectra Energy Capital | ||||||||
8.000%, 10/01/2019 | 200 | 243 | ||||||
5.650%, 03/01/2020 | 100 | 109 | ||||||
Spectra Energy Partners | ||||||||
5.950%, 09/25/2043 | 130 | 137 | ||||||
2.950%, 09/25/2018 | 155 | 158 | ||||||
Statoil | ||||||||
5.250%, 04/15/2019 | 140 | 161 | ||||||
4.250%, 11/23/2041 | 27 | 25 | ||||||
3.150%, 01/23/2022 | 33 | 33 | ||||||
3.125%, 08/17/2017 | 50 | 53 | ||||||
Suncor Energy | ||||||||
6.850%, 06/01/2039 | 50 | 61 | ||||||
Talisman Energy | ||||||||
7.750%, 06/01/2019 | 288 | 349 | ||||||
TC Pipelines | ||||||||
4.650%, 06/15/2021 | 185 | 188 | ||||||
| Description | Face Amount ($ Thousands) | Market Value ($ Thousands) | ||||||
Tennessee Gas Pipeline | ||||||||
8.000%, 02/01/2016 | $ | 1,000 | $ | 1,145 | ||||
Tosco | ||||||||
7.800%, 01/01/2027 | 65 | 87 | ||||||
Total Capital | ||||||||
4.250%, 12/15/2021 | 50 | 53 | ||||||
2.125%, 08/10/2018 | 100 | 101 | ||||||
Total Capital Canada Ltd. | ||||||||
1.450%, 01/15/2018 | 490 | 483 | ||||||
Total Capital International | ||||||||
3.700%, 01/15/2024 | 42 | 42 | ||||||
2.875%, 02/17/2022 | 37 | 36 | ||||||
1.550%, 06/28/2017 | 28 | 28 | ||||||
TransCanada Pipelines | ||||||||
7.125%, 01/15/2019 | 50 | 61 | ||||||
6.500%, 08/15/2018 | 175 | 209 | ||||||
Transocean | ||||||||
7.350%, 12/15/2041 | 9 | 10 | ||||||
6.500%, 11/15/2020 | 120 | 134 | ||||||
6.375%, 12/15/2021 | 391 | 435 | ||||||
5.050%, 12/15/2016 | 90 | 99 | ||||||
Union Pacific Resources Group | ||||||||
7.150%, 05/15/2028 | 52 | 62 | ||||||
Weatherford International Ltd. | ||||||||
5.950%, 04/15/2042 | 92 | 88 | ||||||
4.500%, 04/15/2022 | 185 | 183 | ||||||
Western Gas Partners | ||||||||
5.375%, 06/01/2021 | 105 | 112 | ||||||
4.000%, 07/01/2022 | 35 | 34 | ||||||
Williams | ||||||||
7.875%, 09/01/2021 | 366 | 436 | ||||||
|
| |||||||
| 24,694 | ||||||||
|
| |||||||
Financials — 10.2% | ||||||||
ABB Treasury Center USA | ||||||||
2.500%, 06/15/2016 (E) | 325 | 337 | ||||||
ACE INA Holdings | ||||||||
5.600%, 05/15/2015 | 100 | 108 | ||||||
Aflac | ||||||||
8.500%, 05/15/2019 | 25 | 32 | ||||||
6.450%, 08/15/2040 | 25 | 30 | ||||||
4.000%, 02/15/2022 | 52 | 53 | ||||||
African Development Bank | ||||||||
8.800%, 09/01/2019 | 100 | 134 | ||||||
AIG SunAmerica Global Financing X | ||||||||
6.900%, 03/15/2032 (E) | 30 | 37 | ||||||
Allstate | ||||||||
5.750%, 08/15/2053 (C) | 240 | 234 | ||||||
American Express | ||||||||
7.000%, 03/19/2018 | 170 | 205 | ||||||
American Express Credit MTN | ||||||||
2.800%, 09/19/2016 | 44 | 46 | ||||||
1.750%, 06/12/2015 | 619 | 630 | ||||||
| SEI Institutional Managed Trust / Annual Report / September 30, 2013 | 129 |
SCHEDULE OF INVESTMENTS
U.S. Fixed Income Fund (Continued)
September 30, 2013
| Description | Face Amount ($ Thousands) | Market Value ($ Thousands) | ||||||
American Honda Finance MTN (E) | ||||||||
3.875%, 09/21/2020 | $ | 495 | $ | 516 | ||||
1.000%, 08/11/2015 | 210 | 211 | ||||||
American International Group | ||||||||
8.250%, 08/15/2018 | 200 | 249 | ||||||
6.400%, 12/15/2020 | 170 | 200 | ||||||
5.850%, 01/16/2018 | 655 | 745 | ||||||
4.875%, 06/01/2022 (F) | 141 | 151 | ||||||
4.125%, 02/15/2024 | 346 | 346 | ||||||
American Tower‡ | ||||||||
5.050%, 09/01/2020 | 194 | 201 | ||||||
4.500%, 01/15/2018 (F) | 260 | 275 | ||||||
3.500%, 01/31/2023 (F) | 243 | 213 | ||||||
American Tower Trust I‡ | ||||||||
1.551%, 03/15/2018 (E) | 25 | 24 | ||||||
Ameriprise Financial | ||||||||
4.000%, 10/15/2023 | 130 | 132 | ||||||
Andina de Fomento | ||||||||
3.750%, 01/15/2016 | 90 | 94 | ||||||
ANZ National International MTN | ||||||||
3.125%, 08/10/2015 (E) | 100 | 104 | ||||||
AON | ||||||||
6.250%, 09/30/2040 | 19 | 22 | ||||||
3.500%, 09/30/2015 | 11 | 12 | ||||||
Associates Corp of North America | ||||||||
6.950%, 11/01/2018 | 128 | 152 | ||||||
Assurant | ||||||||
2.500%, 03/15/2018 | 280 | 275 | ||||||
AvalonBay Communities‡ | ||||||||
3.625%, 10/01/2020 | 95 | 96 | ||||||
Banco Santander Mexico Institucion de Banca Multiple Grupo Financiero Santand | ||||||||
4.125%, 11/09/2022 (E) (F) | 270 | 248 | ||||||
Bank of America | ||||||||
7.375%, 05/15/2014 | 400 | 416 | ||||||
6.500%, 08/01/2016 | 1,325 | 1,502 | ||||||
6.100%, 06/15/2017 | 2,600 | 2,913 | ||||||
6.000%, 09/01/2017 | 335 | 379 | ||||||
5.750%, 12/01/2017 | 70 | 79 | ||||||
5.700%, 01/24/2022 | 5 | 6 | ||||||
5.650%, 05/01/2018 | 1,540 | 1,738 | ||||||
5.625%, 07/01/2020 | 75 | 84 | ||||||
5.420%, 03/15/2017 | 200 | 219 | ||||||
5.000%, 05/13/2021 | 410 | 440 | ||||||
4.100%, 07/24/2023 (F) | 1,055 | 1,048 | ||||||
3.300%, 01/11/2023 | 300 | 281 | ||||||
2.000%, 01/11/2018 | 429 | 422 | ||||||
1.500%, 10/09/2015 | 909 | 914 | ||||||
Bank of Montreal MTN | ||||||||
2.375%, 01/25/2019 | 460 | 460 | ||||||
1.400%, 09/11/2017 (F) | 108 | 106 | ||||||
Bank of New York Mellon MTN | ||||||||
4.600%, 01/15/2020 | 40 | 44 | ||||||
| Description | Face Amount ($ Thousands) | Market Value ($ Thousands) | ||||||
3.550%, 09/23/2021 | $ | 34 | $ | 35 | ||||
2.950%, 06/18/2015 (F) | 125 | 130 | ||||||
2.400%, 01/17/2017 | 129 | 133 | ||||||
Bank of Tokyo-Mitsubishi UFJ (E) | ||||||||
4.100%, 09/09/2023 (F) | 200 | 203 | ||||||
3.850%, 01/22/2015 | 100 | 104 | ||||||
Barclays Bank | ||||||||
5.200%, 07/10/2014 | 150 | 155 | ||||||
5.000%, 09/22/2016 | 100 | 110 | ||||||
2.750%, 02/23/2015 | 110 | 113 | ||||||
BB&T | ||||||||
4.900%, 06/30/2017 | 200 | 220 | ||||||
3.950%, 04/29/2016 (F) | 160 | 171 | ||||||
BBVA US Senior SAU | ||||||||
4.664%, 10/09/2015 | 600 | 625 | ||||||
Bear Stearns | ||||||||
7.250%, 02/01/2018 | 1,500 | 1,797 | ||||||
Berkshire Hathaway | ||||||||
4.500%, 02/11/2043 | 90 | 84 | ||||||
3.750%, 08/15/2021 (F) | 500 | 520 | ||||||
3.400%, 01/31/2022 | 65 | 65 | ||||||
Berkshire Hathaway Finance | ||||||||
5.400%, 05/15/2018 (F) | 110 | 127 | ||||||
4.400%, 05/15/2042 | 41 | 38 | ||||||
BlackRock | ||||||||
6.250%, 09/15/2017 | 145 | 170 | ||||||
Blackstone Holdings Finance | ||||||||
5.875%, 03/15/2021 (E) | 295 | 330 | ||||||
BNP Paribas MTN | ||||||||
2.700%, 08/20/2018 | 835 | 845 | ||||||
2.375%, 09/14/2017 | 360 | 365 | ||||||
Boston Properties‡ | ||||||||
3.850%, 02/01/2023 | 40 | 39 | ||||||
3.800%, 02/01/2024 | 225 | 216 | ||||||
3.125%, 09/01/2023 | 150 | 137 | ||||||
Capital One Financial | ||||||||
7.375%, 05/23/2014 | 225 | 235 | ||||||
4.750%, 07/15/2021 | 50 | 53 | ||||||
3.500%, 06/15/2023 | 159 | 150 | ||||||
Caterpillar Financial Services MTN | ||||||||
7.150%, 02/15/2019 | 110 | 135 | ||||||
5.850%, 09/01/2017 | 140 | 161 | ||||||
Charles Schwab | ||||||||
3.225%, 09/01/2022 | 20 | 19 | ||||||
Citigroup | ||||||||
8.125%, 07/15/2039 (F) | 275 | 382 | ||||||
6.875%, 03/05/2038 | 250 | 309 | ||||||
6.375%, 08/12/2014 | 153 | 160 | ||||||
6.125%, 05/15/2018 | 160 | 185 | ||||||
6.010%, 01/15/2015 | 219 | 233 | ||||||
6.000%, 08/15/2017 | 620 | 709 | ||||||
5.875%, 01/30/2042 | 380 | 423 | ||||||
5.500%, 10/15/2014 | 115 | 121 | ||||||
5.500%, 02/15/2017 | 250 | 274 | ||||||
| 130 | SEI Institutional Managed Trust / Annual Report / September 30, 2013 |
| Description | Face Amount ($ Thousands) | Market Value ($ Thousands) | ||||||
5.500%, 09/13/2025 | $ | 269 | $ | 277 | ||||
5.375%, 08/09/2020 | 340 | 380 | ||||||
5.300%, 01/07/2016 | 220 | 239 | ||||||
4.500%, 01/14/2022 | 380 | 398 | ||||||
4.450%, 01/10/2017 | 570 | 617 | ||||||
4.050%, 07/30/2022 | 100 | 97 | ||||||
3.500%, 05/15/2023 | 250 | 226 | ||||||
2.650%, 03/02/2015 | 236 | 241 | ||||||
2.500%, 09/26/2018 | 870 | 865 | ||||||
1.700%, 07/25/2016 | 340 | 342 | ||||||
0.812%, 08/25/2036 (C) | 1,500 | 1,222 | ||||||
CME Group | ||||||||
5.750%, 02/15/2014 | 46 | 47 | ||||||
5.300%, 09/15/2043 | 295 | 304 | ||||||
CNA Financial | ||||||||
5.875%, 08/15/2020 | 72 | 83 | ||||||
Comerica | ||||||||
3.000%, 09/16/2015 | 35 | 36 | ||||||
CommonWealth‡ | ||||||||
6.650%, 01/15/2018 | 60 | 65 | ||||||
Commonwealth Bank of Australia NY | ||||||||
2.250%, 03/16/2017 (E) (F) | 250 | 257 | ||||||
1.250%, 09/18/2015 | 250 | 253 | ||||||
Cooperatieve Centrale Raiffeisen-Boerenleenbank | ||||||||
5.800%, 09/30/2110 (E) | 100 | 102 | ||||||
3.875%, 02/08/2022 | 285 | 285 | ||||||
3.375%, 01/19/2017 | 370 | 394 | ||||||
Credit Agricole | ||||||||
8.375%, 12/31/2049 (C) (E) | 170 | 186 | ||||||
2.625%, 10/03/2018 (E) | 530 | 529 | ||||||
Credit Suisse USA | ||||||||
5.125%, 08/15/2015 | 170 | 184 | ||||||
DDR‡ | ||||||||
4.625%, 07/15/2022 | 330 | 336 | ||||||
3.375%, 05/15/2023 | 335 | 305 | ||||||
Deutsche Bank MTN | ||||||||
3.875%, 08/18/2014 | 100 | 103 | ||||||
Discover Bank | ||||||||
4.200%, 08/08/2023 | 260 | 259 | ||||||
Discover Financial Services | ||||||||
6.450%, 06/12/2017 | 250 | 284 | ||||||
DnB Boligkreditt | ||||||||
2.100%, 10/14/2015 (E) (F) | 400 | 411 | ||||||
Equity One | ||||||||
3.750%, 11/15/2022‡ | 118 | 111 | ||||||
ERAC USA Finance | ||||||||
2.250%, 01/10/2014 (E) | 58 | 58 | ||||||
ERP Operating‡ | ||||||||
5.750%, 06/15/2017 | 125 | 141 | ||||||
4.625%, 12/15/2021 | 64 | 68 | ||||||
Farmers Exchange Capital (E) | ||||||||
7.200%, 07/15/2048 | 1,021 | 1,143 | ||||||
7.050%, 07/15/2028 | 80 | 96 | ||||||
| Description | Face Amount ($ Thousands) | Market Value ($ Thousands) | ||||||
FDIC Structured Sale Guaranteed Notes | ||||||||
1.450%, 10/25/2013 (E) (B) | $ | 250 | $ | 250 | ||||
Federal Realty Investment Trust‡ | ||||||||
3.000%, 08/01/2022 | 145 | 135 | ||||||
Ford Motor | ||||||||
4.750%, 01/15/2043 | 240 | 214 | ||||||
Ford Motor Credit LLC | ||||||||
5.875%, 08/02/2021 | 1,286 | 1,430 | ||||||
3.984%, 06/15/2016 | 200 | 211 | ||||||
2.750%, 05/15/2015 | 800 | 818 | ||||||
General Electric Capital MTN | ||||||||
6.875%, 01/10/2039 | 540 | 662 | ||||||
6.375%, 11/15/2067 (C) | 150 | 160 | ||||||
6.150%, 08/07/2037 | 885 | 1,003 | ||||||
6.000%, 08/07/2019 | 645 | 751 | ||||||
5.875%, 01/14/2038 | 795 | 878 | ||||||
5.625%, 09/15/2017 | 100 | 114 | ||||||
5.500%, 01/08/2020 | 180 | 204 | ||||||
5.400%, 02/15/2017 | 200 | 225 | ||||||
5.300%, 02/11/2021 | 470 | 511 | ||||||
4.625%, 01/07/2021 | 540 | 579 | ||||||
3.100%, 01/09/2023 | 405 | 379 | ||||||
2.300%, 04/27/2017 | 425 | 436 | ||||||
2.100%, 12/11/2019 | 30 | 30 | ||||||
1.625%, 07/02/2015 | 180 | 183 | ||||||
0.744%, 08/15/2036 (C) | 850 | 681 | ||||||
0.646%, 05/05/2026 (C) | 155 | 143 | ||||||
Goldman Sachs Group | ||||||||
7.500%, 02/15/2019 | 710 | 858 | ||||||
6.750%, 10/01/2037 | 122 | 127 | ||||||
6.250%, 09/01/2017 | 350 | 400 | ||||||
6.250%, 02/01/2041 | 515 | 577 | ||||||
6.150%, 04/01/2018 | 780 | 892 | ||||||
6.000%, 06/15/2020 | 880 | 999 | ||||||
5.750%, 01/24/2022 | 200 | 222 | ||||||
5.375%, 03/15/2020 (F) | 950 | 1,046 | ||||||
3.300%, 05/03/2015 | 55 | 57 | ||||||
2.900%, 07/19/2018 (F) | 629 | 633 | ||||||
2.375%, 01/22/2018 | 720 | 715 | ||||||
GTP Acquisition Partners I | ||||||||
4.347%, 06/15/2016 (E) | 144 | 152 | ||||||
Hartford Financial Services Group | ||||||||
5.125%, 04/15/2022 | 80 | 88 | ||||||
4.300%, 04/15/2043 | 200 | 176 | ||||||
HCP MTN‡ | ||||||||
6.300%, 09/15/2016 | 375 | 424 | ||||||
6.000%, 06/15/2014 | 500 | 518 | ||||||
5.650%, 12/15/2013 | 381 | 385 | ||||||
3.750%, 02/01/2019 | 788 | 816 | ||||||
2.625%, 02/01/2020 | 300 | 285 | ||||||
Health Care‡ | ||||||||
6.125%, 04/15/2020 | 1,475 | 1,675 | ||||||
Healthcare Realty Trust‡ | ||||||||
6.500%, 01/17/2017 | 1,400 | 1,571 | ||||||
| SEI Institutional Managed Trust / Annual Report / September 30, 2013 | 131 |
SCHEDULE OF INVESTMENTS
U.S. Fixed Income Fund (Continued)
September 30, 2013
| Description | Face Amount ($ Thousands) | Market Value ($ Thousands) | ||||||
HSBC Bank | ||||||||
4.125%, 08/12/2020 (E) | $ | 100 | $ | 105 | ||||
HSBC Bank USA NY | ||||||||
4.625%, 04/01/2014 | 175 | 178 | ||||||
HSBC Finance | ||||||||
6.676%, 01/15/2021 | 850 | 971 | ||||||
5.500%, 01/19/2016 | 140 | 153 | ||||||
HSBC Holdings PLC | ||||||||
4.875%, 01/14/2022 | 100 | 108 | ||||||
4.000%, 03/30/2022 | 376 | 383 | ||||||
HSBC USA | ||||||||
2.625%, 09/24/2018 | 455 | 461 | ||||||
2.375%, 02/13/2015 | 435 | 445 | ||||||
Hyundai Capital America (E) | ||||||||
2.125%, 10/02/2017 | 60 | 60 | ||||||
1.875%, 08/09/2016 | 260 | 261 | ||||||
ING Bank (E) | ||||||||
5.800%, 09/25/2023 | 470 | 475 | ||||||
3.750%, 03/07/2017 | 200 | 210 | ||||||
ING US | ||||||||
5.500%, 07/15/2022 | 90 | 97 | ||||||
Inter-American Development Bank MTN | ||||||||
3.875%, 10/28/2041 | 266 | 246 | ||||||
International Lease Finance (E) | ||||||||
7.125%, 09/01/2018 | 500 | 559 | ||||||
6.750%, 09/01/2016 (F) | 640 | 702 | ||||||
Intesa Sanpaolo | ||||||||
3.125%, 01/15/2016 | 250 | 250 | ||||||
Jackson National Life Global Funding | ||||||||
4.700%, 06/01/2018 (E) | 100 | 106 | ||||||
Jefferies Group | ||||||||
6.450%, 06/08/2027 | 160 | 163 | ||||||
6.250%, 01/15/2036 | 120 | 115 | ||||||
John Deere Capital MTN | ||||||||
5.750%, 09/10/2018 | 100 | 117 | ||||||
JPMorgan Chase | ||||||||
5.400%, 01/06/2042 | 25 | 26 | ||||||
4.650%, 06/01/2014 | 85 | 87 | ||||||
4.500%, 01/24/2022 | 660 | 688 | ||||||
3.450%, 03/01/2016 | 385 | 405 | ||||||
3.375%, 05/01/2023 | 300 | 272 | ||||||
3.200%, 01/25/2023 (F) | 250 | 234 | ||||||
3.150%, 07/05/2016 | 180 | 189 | ||||||
1.100%, 10/15/2015 | 390 | 391 | ||||||
JPMorgan Chase Bank | ||||||||
6.000%, 10/01/2017 | 2,522 | 2,886 | ||||||
JPMorgan Chase Capital XIII | ||||||||
1.198%, 09/30/2034 (C) | 500 | 390 | ||||||
KeyBank | ||||||||
5.800%, 07/01/2014 | 250 | 259 | ||||||
Landwirtschaftliche Rentenbank | ||||||||
1.375%, 10/23/2019 | 120 | 115 | ||||||
| Description | Face Amount ($ Thousands) | Market Value ($ Thousands) | ||||||
Lazard Group LLC | ||||||||
7.125%, 05/15/2015 | $ | 363 | $ | 393 | ||||
6.850%, 06/15/2017 | 574 | 651 | ||||||
Liberty Mutual Group (E) | ||||||||
6.500%, 05/01/2042 | 154 | 166 | ||||||
4.250%, 06/15/2023 | 140 | 137 | ||||||
Lincoln National | ||||||||
4.850%, 06/24/2021 | 10 | 11 | ||||||
Lloyds TSB Bank MTN | ||||||||
5.800%, 01/13/2020 (E) (F) | 310 | 353 | ||||||
Macquarie Bank | ||||||||
5.000%, 02/22/2017 (E) | 170 | 185 | ||||||
Macquarie Group | ||||||||
7.625%, 08/13/2019 (E) | 70 | 82 | ||||||
7.300%, 08/01/2014 (E) | 120 | 126 | ||||||
7.300%, 08/01/2014 | 1,475 | 1,549 | ||||||
6.250%, 01/14/2021 (E) | 96 | 104 | ||||||
6.000%, 01/14/2020 (E) | 50 | 54 | ||||||
Markel | ||||||||
5.000%, 03/30/2043 | 110 | 102 | ||||||
4.900%, 07/01/2022 | 160 | 168 | ||||||
3.625%, 03/30/2023 | 115 | 109 | ||||||
Massachusetts Mutual Life Insurance (E) | ||||||||
8.875%, 06/01/2039 | 335 | 485 | ||||||
5.375%, 12/01/2041 | 49 | 51 | ||||||
MassMutual Global Funding II | ||||||||
2.875%, 04/21/2014 (E) | 100 | 101 | ||||||
Merrill Lynch MTN | ||||||||
6.875%, 04/25/2018 | 100 | 118 | ||||||
6.400%, 08/28/2017 | 150 | 172 | ||||||
MetLife | ||||||||
6.750%, 06/01/2016 | 390 | 447 | ||||||
6.400%, 12/15/2036 | 945 | 954 | ||||||
5.700%, 06/15/2035 | 15 | 17 | ||||||
4.368%, 09/15/2023 (F) | 305 | 319 | ||||||
1.756%, 12/15/2017 | 210 | 208 | ||||||
Metropolitan Life Global Funding I (E) | ||||||||
5.125%, 06/10/2014 | 100 | 103 | ||||||
2.500%, 09/29/2015 | 520 | 537 | ||||||
1.700%, 06/29/2015 | 213 | 216 | ||||||
1.500%, 01/10/2018 | 100 | 98 | ||||||
Morgan Stanley MTN | ||||||||
7.300%, 05/13/2019 | 320 | 383 | ||||||
6.625%, 04/01/2018 (F) | 2,050 | 2,380 | ||||||
5.950%, 12/28/2017 | 200 | 226 | ||||||
5.750%, 01/25/2021 | 100 | 111 | ||||||
5.625%, 09/23/2019 (F) | 150 | 167 | ||||||
5.550%, 04/27/2017 | 100 | 111 | ||||||
5.500%, 07/28/2021 (F) | 197 | 215 | ||||||
5.450%, 01/09/2017 (F) | 470 | 518 | ||||||
5.375%, 10/15/2015 | 290 | 312 | ||||||
4.200%, 11/20/2014 | 156 | 161 | ||||||
| 132 | SEI Institutional Managed Trust / Annual Report / September 30, 2013 |
| Description | Face Amount ($ Thousands) | Market Value ($ Thousands) | ||||||
Murray Street Investment Trust I | ||||||||
0.000%, 03/09/2017 (D) | $ | 1,002 | $ | 1,069 | ||||
National Australia Bank (E) | ||||||||
3.750%, 03/02/2015 | 120 | 125 | ||||||
3.000%, 07/27/2016 | 180 | 189 | ||||||
National City | ||||||||
6.875%, 05/15/2019 | 50 | 60 | ||||||
National City Bank | ||||||||
0.628%, 06/07/2017 (C) | 600 | 590 | ||||||
National Rural Utilities Cooperative Finance | ||||||||
10.375%, 11/01/2018 | 60 | 82 | ||||||
2.350%, 06/15/2020 | 180 | 175 | ||||||
Nationwide Mutual Insurance (E) | ||||||||
9.375%, 08/15/2039 | 165 | 227 | ||||||
6.600%, 04/15/2034 | 35 | 35 | ||||||
5.810%, 12/15/2024 (C) | 760 | 771 | ||||||
New York Life Global Funding | ||||||||
3.000%, 05/04/2015 (E) | 50 | 52 | ||||||
New York Life Insurance | ||||||||
6.750%, 11/15/2039 (E) | 255 | 316 | ||||||
Nomura Holdings MTN | ||||||||
6.700%, 03/04/2020 | 54 | 62 | ||||||
5.000%, 03/04/2015 | 40 | 42 | ||||||
4.125%, 01/19/2016 | 60 | 63 | ||||||
Nordea Bank (E) | ||||||||
4.875%, 05/13/2021 | 250 | 259 | ||||||
1.625%, 05/15/2018 | 220 | 214 | ||||||
Northwestern Mutual Life Insurance | ||||||||
6.063%, 03/30/2040 (E) | 430 | 494 | ||||||
Oversea-Chinese Banking | ||||||||
1.625%, 03/13/2015 (E) | 200 | 202 | ||||||
PACCAR Financial MTN | ||||||||
1.600%, 03/15/2017 | 53 | 53 | ||||||
1.550%, 09/29/2014 | 35 | 35 | ||||||
Pacific Life Global Funding MTN | ||||||||
5.000%, 05/15/2017 (E) | 50 | 52 | ||||||
Pacific Life Insurance | ||||||||
9.250%, 06/15/2039 (E) | 80 | 108 | ||||||
Pipeline Funding | ||||||||
7.500%, 01/15/2030 (E) | 625 | 738 | ||||||
PNC Funding | ||||||||
5.125%, 02/08/2020 | 90 | 100 | ||||||
3.300%, 03/08/2022 | 76 | 74 | ||||||
2.700%, 09/19/2016 | 20 | 21 | ||||||
Post Apartment Homes | ||||||||
4.750%, 10/15/2017 | 700 | 757 | ||||||
Pricoa Global Funding I | ||||||||
1.600%, 05/29/2018 (E) | 150 | 146 | ||||||
Principal Life Income Funding Trusts MTN | ||||||||
5.100%, 04/15/2014 | 225 | 231 | ||||||
ProLogis‡ | ||||||||
6.875%, 03/15/2020 | 29 | 34 | ||||||
4.250%, 08/15/2023 | 270 | 269 | ||||||
| Description | Face Amount ($ Thousands) | Market Value ($ Thousands) | ||||||
Prudential Financial MTN | ||||||||
5.625%, 05/12/2041 | $ | 10 | $ | 11 | ||||
2.300%, 08/15/2018 | 200 | 202 | ||||||
Prudential Holdings LLC | ||||||||
8.695%, 12/18/2023 (E) | 600 | 754 | ||||||
Prudential Insurance of America | ||||||||
8.300%, 07/01/2025 (E) | 150 | 195 | ||||||
Rabobank Nederland | ||||||||
3.200%, 03/11/2015 (E) | 200 | 207 | ||||||
Reinsurance Group of America MTN | ||||||||
4.700%, 09/15/2023 | 230 | 235 | ||||||
Royal Bank of Canada | ||||||||
2.300%, 07/20/2016 | 120 | 124 | ||||||
2.000%, 10/01/2018 | 718 | 721 | ||||||
1.200%, 09/19/2017 | 140 | 138 | ||||||
Royal Bank of Scotland Group PLC | ||||||||
2.550%, 09/18/2015 | 330 | 337 | ||||||
Santander Holdings USA | ||||||||
3.450%, 08/27/2018 | 230 | 235 | ||||||
Santander US Debt Unipersonal | ||||||||
3.724%, 01/20/2015 (E) | 100 | 101 | ||||||
Simon Property Group‡ | ||||||||
10.350%, 04/01/2019 | 130 | 177 | ||||||
6.750%, 05/15/2014 | 50 | 51 | ||||||
5.650%, 02/01/2020 | 38 | 43 | ||||||
4.125%, 12/01/2021 | 27 | 28 | ||||||
2.150%, 09/15/2017 (F) | 125 | 127 | ||||||
SLM MTN | ||||||||
3.875%, 09/10/2015 | 390 | 398 | ||||||
SpareBank 1 Boligkreditt | ||||||||
1.750%, 11/15/2019 (E) | 350 | 334 | ||||||
Stadshypotek | ||||||||
1.875%, 10/02/2019 (E) | 639 | 618 | ||||||
Standard Chartered | ||||||||
5.200%, 01/26/2024 (E) (F) | 445 | 445 | ||||||
State Street | ||||||||
4.956%, 03/15/2018 | 300 | 330 | ||||||
3.100%, 05/15/2023 | 72 | 67 | ||||||
Swedbank Hypotek | ||||||||
1.375%, 03/28/2018 (E) (F) | — | — | ||||||
Teachers Insurance & Annuity Association of America | ||||||||
6.850%, 12/16/2039 (E) | 150 | 186 | ||||||
Toronto-Dominion Bank MTN | ||||||||
2.500%, 07/14/2016 | 72 | 75 | ||||||
Toyota Motor Credit MTN | ||||||||
3.400%, 09/15/2021 | 510 | 514 | ||||||
1.250%, 10/05/2017 | 250 | 246 | ||||||
Travelers Property Casualty | ||||||||
7.750%, 04/15/2026 | 100 | 132 | ||||||
UBS MTN | ||||||||
5.875%, 12/20/2017 | 120 | 139 | ||||||
5.750%, 04/25/2018 | 100 | 115 | ||||||
| SEI Institutional Managed Trust / Annual Report / September 30, 2013 | 133 |
SCHEDULE OF INVESTMENTS
U.S. Fixed Income Fund (Continued)
September 30, 2013
| Description | Face Amount ($ Thousands) | Market Value ($ Thousands) | ||||||
US Bancorp MTN | ||||||||
3.000%, 03/15/2022 | $ | 33 | $ | 32 | ||||
2.950%, 07/15/2022 | 25 | 24 | ||||||
2.450%, 07/27/2015 | 75 | 77 | ||||||
Wachovia Bank MTN | ||||||||
6.000%, 11/15/2017 | 590 | 680 | ||||||
0.584%, 03/15/2016 (C) | 400 | 397 | ||||||
Wachovia Capital Trust III | ||||||||
5.570%, 12/31/2049 (C) | 500 | 453 | ||||||
WEA Finance LLC (E) | ||||||||
6.750%, 09/02/2019 | 130 | 155 | ||||||
4.625%, 05/10/2021 | 10 | 11 | ||||||
Wells Fargo MTN | ||||||||
4.125%, 08/15/2023 | 1,030 | 1,009 | ||||||
3.500%, 03/08/2022 | 430 | 430 | ||||||
3.450%, 02/13/2023 | 290 | 271 | ||||||
Westpac Banking | ||||||||
4.875%, 11/19/2019 | 170 | 190 | ||||||
2.450%, 11/28/2016 (E) | 200 | 208 | ||||||
WR Berkley | ||||||||
4.625%, 03/15/2022 | 143 | 148 | ||||||
|
| |||||||
| 104,723 | ||||||||
|
| |||||||
Health Care — 1.0% |
| |||||||
AbbVie | ||||||||
2.900%, 11/06/2022 | 1,110 | �� | 1,038 | |||||
2.000%, 11/06/2018 | 125 | 123 | ||||||
1.750%, 11/06/2017 | 290 | 288 | ||||||
Actavis | ||||||||
3.250%, 10/01/2022 | 13 | 12 | ||||||
Amgen | ||||||||
6.375%, 06/01/2037 | 75 | 84 | ||||||
5.750%, 03/15/2040 | 62 | 64 | ||||||
5.650%, 06/15/2042 | 227 | 235 | ||||||
5.375%, 05/15/2043 (F) | 340 | 339 | ||||||
5.150%, 11/15/2041 | 830 | 806 | ||||||
4.500%, 03/15/2020 | 22 | 24 | ||||||
3.875%, 11/15/2021 | 100 | 101 | ||||||
3.450%, 10/01/2020 | 50 | 50 | ||||||
Boston Scientific | ||||||||
4.125%, 10/01/2023 | 295 | 293 | ||||||
2.650%, 10/01/2018 | 240 | 240 | ||||||
Celgene | ||||||||
5.250%, 08/15/2043 | 200 | 198 | ||||||
2.300%, 08/15/2018 | 195 | 195 | ||||||
1.900%, 08/15/2017 | 63 | 63 | ||||||
Edwards Lifesciences | ||||||||
2.875%, 10/15/2018 | 230 | 229 | ||||||
Express Scripts Holding | ||||||||
2.650%, 02/15/2017 | 405 | 418 | ||||||
2.100%, 02/12/2015 | 455 | 462 | ||||||
Gilead Sciences | ||||||||
5.650%, 12/01/2041 | 35 | 39 | ||||||
| Description | Face Amount ($ Thousands) | Market Value ($ Thousands) | ||||||
GlaxoSmithKline Capital | ||||||||
1.500%, 05/08/2017 | $ | 160 | $ | 161 | ||||
GlaxoSmithKline Capital PLC | ||||||||
2.850%, 05/08/2022 | 170 | 163 | ||||||
Humana | ||||||||
7.200%, 06/15/2018 | 159 | 190 | ||||||
3.150%, 12/01/2022 | 400 | 372 | ||||||
Medco Health Solutions | ||||||||
2.750%, 09/15/2015 | 35 | 36 | ||||||
Merck | ||||||||
2.800%, 05/18/2023 (F) | 235 | 222 | ||||||
2.400%, 09/15/2022 | 29 | 27 | ||||||
1.300%, 05/18/2018 | 321 | 313 | ||||||
Perrigo | ||||||||
2.950%, 05/15/2023 | 165 | 160 | ||||||
Pfizer | ||||||||
3.000%, 06/15/2023 | 190 | 182 | ||||||
Pharmacia | ||||||||
6.500%, 12/01/2018 | 120 | 146 | ||||||
Roche Holdings | ||||||||
6.000%, 03/01/2019 (E) | 136 | 162 | ||||||
St. Jude Medical | ||||||||
3.250%, 04/15/2023 | 340 | 323 | ||||||
Stryker | ||||||||
1.300%, 04/01/2018 | 505 | 493 | ||||||
Teva Pharmaceutical Finance BV | ||||||||
3.650%, 11/10/2021 | 190 | 189 | ||||||
Teva Pharmaceutical Finance IV | ||||||||
2.250%, 03/18/2020 | 170 | 161 | ||||||
UnitedHealth Group | ||||||||
3.875%, 10/15/2020 | 180 | 190 | ||||||
3.375%, 11/15/2021 | 75 | 75 | ||||||
2.875%, 03/15/2023 | 50 | 47 | ||||||
1.625%, 03/15/2019 | 160 | 154 | ||||||
WellPoint | ||||||||
5.100%, 01/15/2044 | 105 | 102 | ||||||
4.625%, 05/15/2042 | 41 | 38 | ||||||
3.125%, 05/15/2022 | 821 | 780 | ||||||
2.300%, 07/15/2018 | 65 | 65 | ||||||
1.250%, 09/10/2015 | 50 | 50 | ||||||
Wyeth LLC | ||||||||
5.950%, 04/01/2037 | 170 | 199 | ||||||
Zoetis (E) | ||||||||
4.700%, 02/01/2043 | 11 | 10 | ||||||
3.250%, 02/01/2023 | 190 | 181 | ||||||
|
| |||||||
| 10,492 | ||||||||
|
| |||||||
Industrials — 1.2% |
| |||||||
ABB Finance USA | ||||||||
4.375%, 05/08/2042 | 12 | 11 | ||||||
2.875%, 05/08/2022 | 23 | 22 | ||||||
1.625%, 05/08/2017 | 20 | 20 | ||||||
ADT | ||||||||
4.875%, 07/15/2042 | 22 | 16 | ||||||
3.500%, 07/15/2022 | 21 | 18 | ||||||
| 134 | SEI Institutional Managed Trust / Annual Report / September 30, 2013 |
| Description | Face Amount ($ Thousands) | Market Value ($ Thousands) | ||||||
Air Canada Pass-Through Trust, CI A | ||||||||
4.125%, 05/15/2025 (E) | $ | 28 | $ | 26 | ||||
American Airlines Pass-Through Trust, Ser 2011-1, CI A | ||||||||
5.250%, 01/31/2021 (F) | 16 | 17 | ||||||
American Airlines Pass-Through Trust, Ser 2013-2, Cl A | ||||||||
4.950%, 01/15/2023 (E) | 1,000 | 1,005 | ||||||
BAE Systems (E) | ||||||||
5.800%, 10/11/2041 | 20 | 21 | ||||||
4.750%, 10/11/2021 | 750 | 789 | ||||||
BAE Systems Holdings (E) | ||||||||
6.375%, 06/01/2019 | 100 | 115 | ||||||
5.200%, 08/15/2015 | 90 | 96 | ||||||
Boeing | ||||||||
4.875%, 02/15/2020 | 210 | 239 | ||||||
Burlington Northern Santa Fe | ||||||||
7.290%, 06/01/2036 | 90 | 112 | ||||||
5.750%, 03/15/2018 | 950 | 1,095 | ||||||
5.400%, 06/01/2041 | 50 | 52 | ||||||
4.700%, 10/01/2019 | 75 | 84 | ||||||
3.450%, 09/15/2021 | 16 | 16 | ||||||
Canadian National Railway | ||||||||
5.850%, 11/15/2017 | 50 | 58 | ||||||
Cargill | ||||||||
7.350%, 03/06/2019 (E) | 250 | 307 | ||||||
Caterpillar | ||||||||
0.950%, 06/26/2015 | 300 | 301 | ||||||
Continental Airlines Pass-Through Trust, Ser 1999-2, Cl C-2 | ||||||||
7.256%, 03/15/2020 | 236 | 261 | ||||||
Continental Airlines Pass-Through Trust, Ser 2000-1 | ||||||||
8.048%, 11/01/2020 | 350 | 397 | ||||||
Continental Airlines Pass-Through Trust, Ser 2009-2 | ||||||||
7.250%, 11/10/2019 | 170 | 192 | ||||||
Continental Airlines Pass-Through Trust, Ser A, Cl A | ||||||||
5.983%, 04/19/2022 | 719 | 770 | ||||||
CSX | ||||||||
6.250%, 03/15/2018 | 155 | 182 | ||||||
Danaher | ||||||||
3.900%, 06/23/2021 | 22 | 23 | ||||||
Deere | ||||||||
3.900%, 06/09/2042 | 153 | 135 | ||||||
2.600%, 06/08/2022 | 15 | 14 | ||||||
Delta Air Lines Pass-Through Trust, | ||||||||
6.821%, 08/10/2022 | 135 | 150 | ||||||
Delta Air Lines Pass-Through Trust, Ser 2010-1 | ||||||||
6.200%, 07/02/2018 (F) | 455 | 498 | ||||||
| Description | Face Amount ($ Thousands) | Market Value ($ Thousands) | ||||||
Delta Air Lines Pass-Through Trust, Ser 2010-2 | ||||||||
4.950%, 05/23/2019 (F) | $ | 41 | $ | 44 | ||||
Delta Air Lines Pass-Through Trust, Ser 2012-1 | ||||||||
4.750%, 05/07/2020 | 20 | 21 | ||||||
Eaton | ||||||||
7.625%, 04/01/2024 | 75 | 94 | ||||||
4.150%, 11/02/2042 (E) | 110 | 98 | ||||||
2.750%, 11/02/2022 (E) | 410 | 382 | ||||||
1.500%, 11/02/2017 (E) | 100 | 99 | ||||||
Fluor | ||||||||
3.375%, 09/15/2021 | 68 | 68 | ||||||
General Electric Capital | ||||||||
0.850%, 10/09/2015 | 110 | 110 | ||||||
Glencore Funding LLC | ||||||||
2.500%, 01/15/2019 (E) (F) | 200 | 187 | ||||||
JetBlue Airways Pass-Through Trust, | ||||||||
0.629%, 12/15/2013 (C) | 116 | 116 | ||||||
Koninklijke Philips Electronics | ||||||||
5.750%, 03/11/2018 | 24 | 28 | ||||||
3.750%, 03/15/2022 | 127 | 127 | ||||||
Lockheed Martin | ||||||||
4.070%, 12/15/2042 | 91 | 80 | ||||||
3.350%, 09/15/2021 | 650 | 649 | ||||||
2.125%, 09/15/2016 | 37 | 38 | ||||||
Norfolk Southern | ||||||||
6.000%, 05/23/2111 | 158 | 172 | ||||||
Northrop Grumman | ||||||||
4.750%, 06/01/2043 | 285 | 269 | ||||||
3.250%, 08/01/2023 | 1,765 | 1,668 | ||||||
Owens Corning | ||||||||
4.200%, 12/15/2022 | 167 | 163 | ||||||
Pitney Bowes MTN | ||||||||
5.600%, 03/15/2018 | 25 | 27 | ||||||
Republic Services | ||||||||
3.550%, 06/01/2022 | 29 | 28 | ||||||
Ryder System MTN | ||||||||
3.600%, 03/01/2016 | 35 | 37 | ||||||
2.500%, 03/01/2017 | 47 | 47 | ||||||
Union Pacific | ||||||||
4.300%, 06/15/2042 | 20 | 19 | ||||||
4.163%, 07/15/2022 (F) | 131 | 138 | ||||||
United Airlines Pass-Through Trust, Ser 2013-1 | ||||||||
4.300%, 02/15/2027 | 33 | 32 | ||||||
United Parcel Service of America | ||||||||
8.375%, 04/01/2020 | 50 | 65 | ||||||
United Technologies | ||||||||
8.875%, 11/15/2019 | 110 | 146 | ||||||
4.500%, 06/01/2042 | 117 | 114 | ||||||
Waste Management | ||||||||
4.750%, 06/30/2020 | 93 | 101 | ||||||
| SEI Institutional Managed Trust / Annual Report / September 30, 2013 | 135 |
SCHEDULE OF INVESTMENTS
U.S. Fixed Income Fund (Continued)
September 30, 2013
| Description | Face Amount ($ Thousands) | Market Value ($ Thousands) | ||||||
4.600%, 03/01/2021 | $ | 90 | $ | 96 | ||||
2.600%, 09/01/2016 | 180 | 186 | ||||||
|
| |||||||
| 12,491 | ||||||||
|
| |||||||
Information Technology — 0.5% |
| |||||||
Apple | ||||||||
2.400%, 05/03/2023 | 284 | 257 | ||||||
0.516%, 05/03/2018 (C) | 69 | 69 | ||||||
Arrow Electronics | ||||||||
6.875%, 06/01/2018 | 95 | 109 | ||||||
6.000%, 04/01/2020 | 45 | 49 | ||||||
3.375%, 11/01/2015 | 5 | 5 | ||||||
Baidu | ||||||||
3.250%, 08/06/2018 | 265 | 265 | ||||||
Cisco Systems | ||||||||
5.900%, 02/15/2039 | 150 | 174 | ||||||
5.500%, 01/15/2040 (F) | 100 | 111 | ||||||
eBay | ||||||||
4.000%, 07/15/2042 | 21 | 18 | ||||||
2.600%, 07/15/2022 | 19 | 18 | ||||||
Hewlett-Packard | ||||||||
6.000%, 09/15/2041 | 50 | 46 | ||||||
4.650%, 12/09/2021 | 39 | 38 | ||||||
4.375%, 09/15/2021 | 39 | 38 | ||||||
HP Enterprise Services | ||||||||
7.450%, 10/15/2029 (F) | 125 | 134 | ||||||
Intel | ||||||||
4.800%, 10/01/2041 | 65 | 62 | ||||||
4.000%, 12/15/2032 | 202 | 186 | ||||||
3.300%, 10/01/2021 | 70 | 70 | ||||||
International Business Machines | ||||||||
4.000%, 06/20/2042 (F) | 169 | 151 | ||||||
1.625%, 05/15/2020 | 1,196 | 1,124 | ||||||
Intuit | ||||||||
5.750%, 03/15/2017 | 75 | 84 | ||||||
Microsoft | ||||||||
4.500%, 10/01/2040 | 14 | 13 | ||||||
Oracle | ||||||||
6.125%, 07/08/2039 | 27 | 32 | ||||||
5.375%, 07/15/2040 | 17 | 18 | ||||||
3.625%, 07/15/2023 | 271 | 270 | ||||||
2.375%, 01/15/2019 | 791 | 795 | ||||||
1.200%, 10/15/2017 | 250 | 246 | ||||||
Texas Instruments | ||||||||
1.650%, 08/03/2019 | 55 | 53 | ||||||
TSMC Global Ltd. | ||||||||
1.625%, 04/03/2018 (E) | 460 | 443 | ||||||
Xerox | ||||||||
4.500%, 05/15/2021 | 13 | 13 | ||||||
2.950%, 03/15/2017 | 27 | 28 | ||||||
|
| |||||||
| 4,919 | ||||||||
|
| |||||||
| Description | Face Amount ($ Thousands) | Market Value ($ Thousands) | ||||||
Materials — 1.0% |
| |||||||
Barrick Gold | ||||||||
4.100%, 05/01/2023 (F) | $ | 835 | $ | 735 | ||||
3.850%, 04/01/2022 | 540 | 478 | ||||||
BHP Billiton Finance USA Ltd. | ||||||||
6.500%, 04/01/2019 | 125 | 149 | ||||||
5.000%, 09/30/2043 | 504 | 513 | ||||||
4.125%, 02/24/2042 | 40 | 36 | ||||||
3.850%, 09/30/2023 | 895 | 902 | ||||||
3.250%, 11/21/2021 | 360 | 357 | ||||||
2.050%, 09/30/2018 | 44 | 44 | ||||||
Celulosa Arauco y Constitucion | ||||||||
4.750%, 01/11/2022 | 170 | 165 | ||||||
Cliffs Natural Resources | ||||||||
4.875%, 04/01/2021 | 30 | 28 | ||||||
4.800%, 10/01/2020 | 100 | 95 | ||||||
3.950%, 01/15/2018 | 260 | 261 | ||||||
CRH America | ||||||||
6.000%, 09/30/2016 | 31 | 35 | ||||||
Dow Chemical | ||||||||
8.550%, 05/15/2019 | 47 | 60 | ||||||
5.250%, 11/15/2041 | 70 | 69 | ||||||
4.125%, 11/15/2021 | 61 | 62 | ||||||
3.000%, 11/15/2022 | 630 | 580 | ||||||
E.I. Du Pont de Nemours | ||||||||
5.600%, 12/15/2036 | 80 | 87 | ||||||
4.900%, 01/15/2041 | 25 | 25 | ||||||
1.950%, 01/15/2016 | 40 | 41 | ||||||
Ecolab | ||||||||
3.000%, 12/08/2016 | 220 | 231 | ||||||
1.450%, 12/08/2017 | 31 | 30 | ||||||
Freeport-McMoRan Copper & Gold | ||||||||
3.550%, 03/01/2022 | 250 | 230 | ||||||
3.100%, 03/15/2020 (E) | 160 | 151 | ||||||
2.375%, 03/15/2018 (E) | 50 | 48 | ||||||
2.150%, 03/01/2017 | 81 | 81 | ||||||
LYB International Finance BV | ||||||||
5.250%, 07/15/2043 | 155 | 152 | ||||||
4.000%, 07/15/2023 | 215 | 213 | ||||||
Mosaic | ||||||||
4.875%, 11/15/2041 | 30 | 28 | ||||||
3.750%, 11/15/2021 | 25 | 24 | ||||||
Nucor | ||||||||
4.000%, 08/01/2023 | 39 | 38 | ||||||
Potash Corp of Saskatchewan | ||||||||
6.500%, 05/15/2019 | 50 | 59 | ||||||
PPG Industries | ||||||||
9.000%, 05/01/2021 | 145 | 191 | ||||||
Praxair | ||||||||
5.200%, 03/15/2017 | 70 | 79 | ||||||
Rio Tinto Finance USA Ltd. | ||||||||
9.000%, 05/01/2019 | 30 | 39 | ||||||
8.950%, 05/01/2014 | 80 | 84 | ||||||
| 136 | SEI Institutional Managed Trust / Annual Report / September 30, 2013 |
| Description | Face Amount ($ Thousands) | Market Value ($ Thousands) | ||||||
6.500%, 07/15/2018 | $ | 270 | $ | 318 | ||||
3.750%, 09/20/2021 | 450 | 444 | ||||||
Rio Tinto Finance USA PLC | ||||||||
2.250%, 12/14/2018 | 385 | 380 | ||||||
Southern Copper | ||||||||
5.250%, 11/08/2042 | 370 | 298 | ||||||
Teck Resources Limited | ||||||||
6.250%, 07/15/2041 | 5 | 5 | ||||||
Union Carbide | ||||||||
7.750%, 10/01/2096 | 50 | 56 | ||||||
Vale | ||||||||
5.625%, 09/11/2042 (F) | 188 | 164 | ||||||
Vale Overseas Ltd. | ||||||||
6.875%, 11/21/2036 | 190 | 193 | ||||||
4.375%, 01/11/2022 | 885 | 853 | ||||||
Xstrata Finance Canada Ltd. | ||||||||
2.450%, 10/25/2017 (E) | 250 | 249 | ||||||
2.050%, 10/23/2015 (E) | 452 | 453 | ||||||
|
| |||||||
| 9,813 | ||||||||
|
| |||||||
Telecommunication Services — 1.7% |
| |||||||
America Movil | ||||||||
5.625%, 11/15/2017 | 400 | 455 | ||||||
3.125%, 07/16/2022 | 535 | 492 | ||||||
2.375%, 09/08/2016 (F) | 200 | 203 | ||||||
1.256%, 09/12/2016 (C) | 220 | 220 | ||||||
AT&T | ||||||||
6.300%, 01/15/2038 | 435 | 470 | ||||||
5.800%, 02/15/2019 | 210 | 242 | ||||||
5.550%, 08/15/2041 | 80 | 79 | ||||||
5.500%, 02/01/2018 | 100 | 113 | ||||||
5.350%, 09/01/2040 | 423 | 411 | ||||||
4.350%, 06/15/2045 | 117 | 97 | ||||||
4.300%, 12/15/2042 (F) | 250 | 208 | ||||||
3.875%, 08/15/2021 | 350 | 354 | ||||||
1.600%, 02/15/2017 | 415 | 416 | ||||||
0.875%, 02/13/2015 | 75 | 75 | ||||||
BellSouth Telecommunications | ||||||||
6.300%, 12/15/2015 | 81 | 86 | ||||||
British Telecommunications | ||||||||
5.950%, 01/15/2018 | 200 | 229 | ||||||
Cellco Partnership | ||||||||
8.500%, 11/15/2018 | 55 | 70 | ||||||
Centel Capital | ||||||||
9.000%, 10/15/2019 | 65 | 78 | ||||||
CenturyLink | ||||||||
7.650%, 03/15/2042 | 15 | 13 | ||||||
7.600%, 09/15/2039 | 60 | 54 | ||||||
6.450%, 06/15/2021 (F) | 120 | 119 | ||||||
Deutsche Telekom International Finance | ||||||||
5.750%, 03/23/2016 | 170 | 188 | ||||||
2.250%, 03/06/2017 (E) | 770 | 781 | ||||||
| Description | Face Amount ($ Thousands) | Market Value ($ Thousands) | ||||||
Deutsche Telekom International Finance BV | ||||||||
6.000%, 07/08/2019 | $ | 175 | $ | 205 | ||||
GTE | ||||||||
6.840%, 04/15/2018 | 150 | 175 | ||||||
Nippon Telegraph & Telephone | ||||||||
1.400%, 07/18/2017 | 65 | 65 | ||||||
Orange | ||||||||
8.750%, 03/01/2031 | 50 | 67 | ||||||
2.750%, 09/14/2016 | 35 | 36 | ||||||
Qwest | ||||||||
6.750%, 12/01/2021 | 156 | 168 | ||||||
Rogers Communications | ||||||||
5.450%, 10/01/2043 | 223 | 221 | ||||||
5.250%, 10/02/2043 | 33 | 33 | ||||||
4.000%, 10/02/2023 | 80 | 80 | ||||||
Telecom Italia Capital | ||||||||
6.999%, 06/04/2018 | 150 | 165 | ||||||
Telefonica Chile | ||||||||
3.875%, 10/12/2022 (E) | 210 | 186 | ||||||
Telefonica Emisiones SAU | ||||||||
6.221%, 07/03/2017 | 130 | 144 | ||||||
5.462%, 02/16/2021 | 23 | 24 | ||||||
5.134%, 04/27/2020 | 230 | 235 | ||||||
4.570%, 04/27/2023 | 335 | 321 | ||||||
Verizon Communications | ||||||||
7.750%, 12/01/2030 | 610 | 750 | ||||||
6.550%, 09/15/2043 | 475 | 536 | ||||||
6.400%, 09/15/2033 | 2,307 | 2,562 | ||||||
6.350%, 04/01/2019 | 120 | 141 | ||||||
5.500%, 02/15/2018 | 140 | 159 | ||||||
5.150%, 09/15/2023 (F) | 1,220 | 1,308 | ||||||
4.500%, 09/15/2020 | 704 | 749 | ||||||
3.850%, 11/01/2042 | 200 | 158 | ||||||
3.650%, 09/14/2018 | 514 | 542 | ||||||
2.500%, 09/15/2016 | 714 | 736 | ||||||
2.450%, 11/01/2022 | 140 | 124 | ||||||
Verizon Global Funding | ||||||||
5.850%, 09/15/2035 | 40 | 41 | ||||||
Vodafone Group | ||||||||
5.450%, 06/10/2019 | 75 | 85 | ||||||
1.625%, 03/20/2017 | 80 | 80 | ||||||
Vodafone Group PLC | ||||||||
2.950%, 02/19/2023 | 540 | 496 | ||||||
1.500%, 02/19/2018 | 420 | 408 | ||||||
0.900%, 02/19/2016 | 575 | 574 | ||||||
|
| |||||||
| 17,027 | ||||||||
|
| |||||||
Utilities — 1.7% |
| |||||||
AEP Texas Central Transition Funding | ||||||||
5.170%, 01/01/2018 | 575 | 642 | ||||||
5.090%, 07/01/2015 | 1,082 | 1,121 | ||||||
| SEI Institutional Managed Trust / Annual Report / September 30, 2013 | 137 |
SCHEDULE OF INVESTMENTS
U.S. Fixed Income Fund (Continued)
September 30, 2013
| Description | Face Amount ($ Thousands) | Market Value ($ Thousands) | ||||||
AGL Capital | ||||||||
6.375%, 07/15/2016 | $ | 50 | $ | 57 | ||||
5.250%, 08/15/2019 | 50 | 57 | ||||||
4.400%, 06/01/2043 | 195 | 178 | ||||||
Alabama Power | ||||||||
6.125%, 05/15/2038 | 18 | 21 | ||||||
5.875%, 12/01/2022 | 95 | 111 | ||||||
Ameren | ||||||||
8.875%, 05/15/2014 | 255 | 267 | ||||||
American Electric Power | ||||||||
1.650%, 12/15/2017 | 368 | 362 | ||||||
American Water Capital | ||||||||
6.085%, 10/15/2017 | 100 | 115 | ||||||
Appalachian Power | ||||||||
6.700%, 08/15/2037 | 100 | 117 | ||||||
5.950%, 05/15/2033 | 100 | 106 | ||||||
Arizona Public Service | ||||||||
5.050%, 09/01/2041 | 47 | 48 | ||||||
4.500%, 04/01/2042 | 15 | 14 | ||||||
Atmos Energy | ||||||||
4.950%, 10/15/2014 | 75 | 78 | ||||||
Boston Gas | ||||||||
4.487%, 02/15/2042 (E) | 35 | 33 | ||||||
Carolina Power & Light | ||||||||
5.300%, 01/15/2019 | 175 | 202 | ||||||
3.000%, 09/15/2021 | 194 | 193 | ||||||
2.800%, 05/15/2022 | 25 | 24 | ||||||
CenterPoint Energy | ||||||||
6.500%, 05/01/2018 | 50 | 59 | ||||||
CenterPoint Energy Resources | ||||||||
4.500%, 01/15/2021 | 81 | 88 | ||||||
Cleveland Electric Illuminating | ||||||||
7.880%, 11/01/2017 | 170 | 206 | ||||||
Commonwealth Edison | ||||||||
4.600%, 08/15/2043 | 140 | 138 | ||||||
Consolidated Edison of New York | ||||||||
5.700%, 06/15/2040 | 38 | 44 | ||||||
Consumers Energy | ||||||||
6.700%, 09/15/2019 | 100 | 124 | ||||||
Dayton Power & Light | ||||||||
1.875%, 09/15/2016 (E) | 280 | 282 | ||||||
Detroit Edison | ||||||||
2.650%, 06/15/2022 | 26 | 25 | ||||||
Dominion Resources | ||||||||
8.875%, 01/15/2019 | 340 | 440 | ||||||
6.400%, 06/15/2018 | 180 | 213 | ||||||
5.250%, 08/01/2033 | 90 | 97 | ||||||
1.950%, 08/15/2016 | 165 | 168 | ||||||
Duke Energy | ||||||||
3.550%, 09/15/2021 | 76 | 76 | ||||||
1.625%, 08/15/2017 | 175 | 174 | ||||||
Duke Energy Carolinas | ||||||||
4.300%, 06/15/2020 | 39 | 42 | ||||||
4.250%, 12/15/2041 | 28 | 26 | ||||||
| Description | Face Amount ($ Thousands) | Market Value ($ Thousands) | ||||||
Duke Energy Florida | ||||||||
3.850%, 11/15/2042 | $ | 665 | $ | 579 | ||||
Duke Energy Indiana | ||||||||
4.200%, 03/15/2042 | 30 | 28 | ||||||
3.750%, 07/15/2020 | 52 | 55 | ||||||
Duke Energy Ohio | ||||||||
3.800%, 09/01/2023 | 145 | 148 | ||||||
Duke Energy Progress | ||||||||
4.100%, 05/15/2042 | 85 | 78 | ||||||
Electricite de France | ||||||||
4.600%, 01/27/2020 (E) | 105 | 115 | ||||||
Enel Finance International | ||||||||
5.125%, 10/07/2019 (E) (F) | 100 | 104 | ||||||
Exelon Generation | ||||||||
6.200%, 10/01/2017 | 100 | 115 | ||||||
4.000%, 10/01/2020 | 120 | 120 | ||||||
FirstEnergy | ||||||||
4.250%, 03/15/2023 | 540 | 494 | ||||||
2.750%, 03/15/2018 | 70 | 68 | ||||||
FirstEnergy, Ser C | ||||||||
7.375%, 11/15/2031 | 480 | 485 | ||||||
Florida Power & Light | ||||||||
5.950%, 10/01/2033 | 35 | 42 | ||||||
5.125%, 06/01/2041 | 28 | 30 | ||||||
Jersey Central Power & Light | ||||||||
7.350%, 02/01/2019 | 100 | 120 | ||||||
John Sevier Combined Cycle Generation | ||||||||
4.626%, 01/15/2042 | 58 | 58 | ||||||
Kansas City Power & Light | ||||||||
5.300%, 10/01/2041 | 100 | 100 | ||||||
Massachusetts Electric | ||||||||
5.900%, 11/15/2039 (E) | 55 | 62 | ||||||
Metropolitan Edison | ||||||||
3.500%, 03/15/2023 (E) | 350 | 333 | ||||||
MidAmerican Energy | ||||||||
4.800%, 09/15/2043 | 215 | 218 | ||||||
2.400%, 03/15/2019 | 380 | 387 | ||||||
Midamerican Energy Holdings | ||||||||
6.500%, 09/15/2037 | 200 | 236 | ||||||
Nevada Power | ||||||||
7.125%, 03/15/2019 | 110 | 137 | ||||||
6.500%, 08/01/2018 | 40 | 48 | ||||||
5.450%, 05/15/2041 | 50 | 55 | ||||||
5.375%, 09/15/2040 | 12 | 13 | ||||||
Niagara Mohawk Power | ||||||||
4.881%, 08/15/2019 (E) | 80 | 89 | ||||||
Nisource Finance | ||||||||
5.800%, 02/01/2042 | 149 | 154 | ||||||
Northern States Power | ||||||||
6.250%, 06/01/2036 | 100 | 123 | ||||||
5.350%, 11/01/2039 | 19 | 21 | ||||||
2.600%, 05/15/2023 | 55 | 52 | ||||||
Oncor Electric Delivery LLC | ||||||||
6.800%, 09/01/2018 | 460 | 551 | ||||||
| 138 | SEI Institutional Managed Trust / Annual Report / September 30, 2013 |
| Description | Face Amount ($ Thousands) | Market Value ($ Thousands) | ||||||
Pacific Gas & Electric | ||||||||
8.250%, 10/15/2018 | $ | 180 | $ | 230 | ||||
5.800%, 03/01/2037 | 70 | 76 | ||||||
5.625%, 11/30/2017 | 525 | 603 | ||||||
5.400%, 01/15/2040 | 42 | 43 | ||||||
4.600%, 06/15/2043 | 125 | 117 | ||||||
4.500%, 12/15/2041 | 48 | 44 | ||||||
3.250%, 09/15/2021 | 12 | 12 | ||||||
3.250%, 06/15/2023 | 185 | 176 | ||||||
Pacificorp | ||||||||
6.250%, 10/15/2037 | 90 | 109 | ||||||
5.650%, 07/15/2018 | 175 | 204 | ||||||
PPL Capital Funding | ||||||||
4.700%, 06/01/2043 | 150 | 134 | ||||||
4.200%, 06/15/2022 | 120 | 119 | ||||||
3.400%, 06/01/2023 | 155 | 144 | ||||||
PPL Energy Supply | ||||||||
4.600%, 12/15/2021 | 55 | 54 | ||||||
Progress Energy | ||||||||
3.150%, 04/01/2022 | 408 | 390 | ||||||
PSEG Power | ||||||||
5.500%, 12/01/2015 | 100 | 109 | ||||||
5.320%, 09/15/2016 | 40 | 44 | ||||||
5.125%, 04/15/2020 | 45 | 50 | ||||||
4.150%, 09/15/2021 | 33 | 34 | ||||||
PSEG Power LLC | ||||||||
2.750%, 09/15/2016 | 200 | 208 | ||||||
Public Service Electric & Gas | ||||||||
5.375%, 11/01/2039 | 28 | 31 | ||||||
2.700%, 05/01/2015 | 45 | 47 | ||||||
Public Service of Oklahoma | ||||||||
5.150%, 12/01/2019 | 83 | 94 | ||||||
San Diego Gas & Electric | ||||||||
6.000%, 06/01/2026 | 60 | 74 | ||||||
3.950%, 11/15/2041 | 14 | 13 | ||||||
Sempra Energy | ||||||||
8.900%, 11/15/2013 | 180 | 182 | ||||||
6.000%, 10/15/2039 | 50 | 55 | ||||||
Southern | ||||||||
2.450%, 09/01/2018 | 268 | 271 | ||||||
1.950%, 09/01/2016 | 26 | 27 | ||||||
Southern California Edison | ||||||||
5.500%, 03/15/2040 | 50 | 56 | ||||||
4.650%, 10/01/2043 | 330 | 326 | ||||||
4.050%, 03/15/2042 | 5 | 5 | ||||||
3.900%, 12/01/2041 | 60 | 54 | ||||||
3.875%, 06/01/2021 | 22 | 23 | ||||||
3.500%, 10/01/2023 | 560 | 559 | ||||||
Southern Power | ||||||||
5.250%, 07/15/2043 | 130 | 130 | ||||||
5.150%, 09/15/2041 | 11 | 11 | ||||||
Southwestern Electric Power | ||||||||
3.550%, 02/15/2022 | 245 | 238 | ||||||
Southwestern Public Service | ||||||||
8.750%, 12/01/2018 | 90 | 116 | ||||||
| Description | Face Amount ($ Thousands) | Market Value ($ Thousands) | ||||||
Virginia Electric and Power | ||||||||
4.650%, 08/15/2043 | $ | 590 | $ | 585 | ||||
2.950%, 01/15/2022 | 330 | 325 | ||||||
Wisconsin Electric Power | ||||||||
2.950%, 09/15/2021 | 3 | 3 | ||||||
|
| |||||||
| 17,291 | ||||||||
|
| |||||||
Total Corporate Obligations (Cost $223,578) ($ Thousands) | 227,812 | |||||||
|
| |||||||
ASSET-BACKED SECURITIES — 8.7% |
| |||||||
Automotive — 1.6% |
| |||||||
Ally Auto Receivables Trust, Ser 2010-2, Cl A4 | ||||||||
2.090%, 05/15/2015 | 59 | 59 | ||||||
Ally Auto Receivables Trust, Ser 2010-3, Cl A4 | ||||||||
1.550%, 08/17/2015 | 65 | 65 | ||||||
Ally Auto Receivables Trust, Ser 2010-4, Cl A4 | ||||||||
1.350%, 12/15/2015 | 451 | 453 | ||||||
Ally Auto Receivables Trust, Ser 2010-5, Cl A4 | ||||||||
1.750%, 03/15/2016 | 899 | 905 | ||||||
Ally Auto Receivables Trust, Ser 2011-1, Cl A4 | ||||||||
2.230%, 03/15/2016 | 698 | 705 | ||||||
Ally Auto Receivables Trust, Ser 2012-1, Cl A3 | ||||||||
0.930%, 02/16/2016 | 114 | 114 | ||||||
Ally Auto Receivables Trust, Ser 2012-2, Cl A3 | ||||||||
0.740%, 04/15/2016 | 458 | 459 | ||||||
Ally Auto Receivables Trust, Ser 2012-5, Cl A2 | ||||||||
0.450%, 07/15/2015 | 677 | 677 | ||||||
Ally Auto Receivables Trust, Ser 2013-1, Cl A3 | ||||||||
0.630%, 05/15/2017 | 427 | 425 | ||||||
Ally Auto Receivables Trust, Ser 2013-1, Cl A4 | ||||||||
0.840%, 02/15/2018 | 451 | 445 | ||||||
American Credit Acceptance Receivables Trust, | ||||||||
3.040%, 10/15/2015 (E) | 26 | 27 | ||||||
American Credit Acceptance Receivables Trust, | ||||||||
1.640%, 11/15/2016 (E) | 58 | 58 | ||||||
American Credit Acceptance Receivables Trust, | ||||||||
1.450%, 04/16/2018 (E) | 189 | 189 | ||||||
| SEI Institutional Managed Trust / Annual Report / September 30, 2013 | 139 |
SCHEDULE OF INVESTMENTS
U.S. Fixed Income Fund (Continued)
September 30, 2013
| Description | Face Amount ($ Thousands) | Market Value ($ Thousands) | ||||||
AmeriCredit Automobile Receivables Trust | ||||||||
0.740%, 11/08/2016 | $ | 366 | $ | 366 | ||||
AmeriCredit Automobile Receivables Trust, Ser 2011-1, Cl A3 | ||||||||
1.390%, 09/08/2015 | 11 | 11 | ||||||
AmeriCredit Automobile Receivables Trust, Ser 2011-4, Cl A3 | ||||||||
1.170%, 05/09/2016 | 199 | 199 | ||||||
AmeriCredit Automobile Receivables Trust, Ser 2011-5, Cl A3 | ||||||||
1.550%, 07/08/2016 | 239 | 240 | ||||||
AmeriCredit Automobile Receivables Trust, Ser 2012-1, Cl A2 | ||||||||
0.910%, 10/08/2015 | 18 | 18 | ||||||
AmeriCredit Automobile Receivables Trust, Ser 2012-4, Cl A2 | ||||||||
0.490%, 04/08/2016 | 169 | 169 | ||||||
AmeriCredit Automobile Receivables Trust, Ser 2012-4, Cl A3 | ||||||||
0.670%, 06/08/2017 | 236 | 235 | ||||||
AmeriCredit Automobile Receivables Trust, Ser 2012-5, Cl A2 | ||||||||
0.510%, 01/08/2016 | 110 | 110 | ||||||
AmeriCredit Automobile Receivables Trust, Ser 2012-5, Cl A3 | ||||||||
0.620%, 06/08/2017 | 48 | 48 | ||||||
AmeriCredit Automobile Receivables Trust, Ser 2013-1, Cl A2 | ||||||||
0.490%, 06/08/2016 | 85 | 85 | ||||||
AmeriCredit Automobile Receivables Trust, Ser 2013-3, Cl A2 | ||||||||
0.680%, 10/11/2016 | 904 | 904 | ||||||
Avis Budget Rental Car Funding AESOP LLC, Ser 2013-2A, Cl A | ||||||||
2.970%, 02/20/2020 | 190 | 194 | ||||||
Bank of America Auto Trust, Ser 2010-2, Cl A4 | ||||||||
1.940%, 06/15/2017 | 76 | 77 | ||||||
California Republic Auto Receivables Trust, Ser 2012-1, Cl A | ||||||||
1.180%, 08/15/2017 (E) | 69 | 69 | ||||||
Capital Auto Receivables Asset Trust, Ser 2013-1, Cl A2 | ||||||||
0.620%, 07/20/2016 | 106 | 106 | ||||||
Capital Auto Receivables Asset Trust, Ser 2013-1, Cl A3 | ||||||||
0.790%, 06/20/2017 | 769 | 766 | ||||||
Capital Auto Receivables Asset Trust, Ser 2013-2, Cl A2 | ||||||||
0.920%, 09/20/2016 | 385 | 385 | ||||||
Capital Auto Receivables Asset Trust, Ser 2013-2, Cl A4 | ||||||||
1.560%, 07/20/2018 | 205 | 206 | ||||||
| Description | Face Amount ($ Thousands) | Market Value ($ Thousands) | ||||||
Capital Auto Receivables Asset Trust, Ser 2013-3, Cl A1B | ||||||||
0.610%, 11/20/2015 (C) | $ | 150 | $ | 150 | ||||
Capital Auto Receivables Asset Trust, Ser 2013-3, Cl A2 | ||||||||
1.040%, 11/21/2016 | 196 | 196 | ||||||
Capital Auto Receivables Asset Trust, Ser 2013-3, Cl A4 | ||||||||
1.680%, 04/20/2018 | 261 | 262 | ||||||
CFC, Ser 2013-1A, Cl A | ||||||||
1.650%, 07/17/2017 (E) | 118 | 118 | ||||||
CPS Auto Trust | ||||||||
1.620%, 08/15/2016 | 380 | 379 | ||||||
CPS Auto Trust, Ser 2011-C, Cl A | ||||||||
4.210%, 03/15/2019 (E) | 78 | 80 | ||||||
Exeter Auto Receivables Trust | ||||||||
1.490%, 11/15/2017 | 300 | 300 | ||||||
Fifth Third Auto Trust, Ser 2013-1 A3 | ||||||||
0.880%, 08/15/2016 | 105 | 105 | ||||||
First Investors Auto Owner Trust, Ser 2013-1A, Cl A2 | ||||||||
0.900%, 10/15/2018 (E) | 54 | 54 | ||||||
Ford Credit Auto Owner Trust, Ser 2012-B, Cl A2 | ||||||||
0.570%, 01/15/2015 | 36 | 36 | ||||||
Ford Credit Auto Owner Trust, Ser 2012-C, Cl A2 | ||||||||
0.470%, 04/15/2015 | 68 | 68 | ||||||
Ford Credit Auto Owner Trust, Ser 2013-B, Cl A2 | ||||||||
0.380%, 02/15/2016 | 245 | 245 | ||||||
Harley-Davidson Motorcycle Trust, Ser 2011-2, Cl A3 | ||||||||
1.110%, 09/15/2016 | 178 | 178 | ||||||
Hertz Vehicle Financing, Ser 2013-1A, Cl A2 | ||||||||
1.830%, 08/25/2019 (E) | 800 | 782 | ||||||
Honda Auto Receivables Owner Trust, Ser 2012-3, Cl A2 | ||||||||
0.460%, 12/15/2014 | 90 | 90 | ||||||
Honda Auto Receivables Owner Trust, Ser 2013-1, Cl A2 | ||||||||
0.350%, 06/22/2015 | 114 | 113 | ||||||
Huntington Auto Trust, Ser 2011-1A, Cl A4 | ||||||||
1.310%, 11/15/2016 (E) | 200 | 202 | ||||||
Hyundai Auto Receivables Trust, Ser 2010-B, Cl A4 | ||||||||
1.630%, 03/15/2017 | 90 | 91 | ||||||
Hyundai Auto Receivables Trust, Ser 2011-B, Cl A3 | ||||||||
1.040%, 09/15/2015 | 25 | 25 | ||||||
Hyundai Auto Receivables Trust, Ser 2011-B, Cl A4 | ||||||||
1.650%, 02/15/2017 | 71 | 72 | ||||||
| 140 | SEI Institutional Managed Trust / Annual Report / September 30, 2013 |
| Description | Face Amount ($ Thousands) | Market Value ($ Thousands) | ||||||
LAI Vehicle Lease Securitization Trust, Ser 2010-A, Cl A | ||||||||
2.550%, 09/15/2016 (E) | $ | 8 | $ | 8 | ||||
Mercedes-Benz Auto Receivables Trust, Ser 2011-1, Cl A3 | ||||||||
0.850%, 03/16/2015 | 126 | 126 | ||||||
MMCA Automobile Trust, Ser 2011-A, Cl A4 | ||||||||
2.020%, 10/17/2016 (E) | 134 | 134 | ||||||
MMCA Automobile Trust, Ser 2012-A, Cl A4 | ||||||||
1.890%, 08/15/2017 (E) | 200 | 201 | ||||||
Nissan Auto Lease Trust, Ser 2012-B, Cl A2A | ||||||||
0.450%, 06/15/2015 | 49 | 49 | ||||||
Nissan Auto Receivables Owner Trust, Ser 2010-A, Cl A4 | ||||||||
1.310%, 09/15/2016 | 65 | 65 | ||||||
Nissan Auto Receivables Owner Trust, Ser 2011-A, Cl A3 | ||||||||
1.180%, 02/16/2015 | 58 | 58 | ||||||
Nissan Auto Receivables Owner Trust, Ser 2012-A, Cl A2 | ||||||||
0.540%, 10/15/2014 | 34 | 34 | ||||||
Nissan Auto Receivables Owner Trust, Ser 2012-B, Cl A2 | ||||||||
0.390%, 04/15/2015 | 74 | 74 | ||||||
Nissan Auto Receivables Owner Trust, Ser 2013-A, Cl A2 | ||||||||
0.370%, 09/15/2015 | 47 | 47 | ||||||
Santander Drive Auto Receivables Trust, Ser 2010-A, Cl A4 | ||||||||
2.390%, 06/15/2017 (E) | 100 | 101 | ||||||
Santander Drive Auto Receivables Trust, Ser 2011-1, Cl B | ||||||||
2.350%, 11/16/2015 | 94 | 94 | ||||||
Santander Drive Auto Receivables Trust, Ser 2011-2, Cl A3 | ||||||||
1.290%, 02/16/2015 | 5 | 5 | ||||||
Santander Drive Auto Receivables Trust, Ser 2011-S2A, Cl B | ||||||||
2.060%, 06/15/2017 (E) | 13 | 13 | ||||||
Santander Drive Auto Receivables Trust, Ser 2011-S2A, Cl D | ||||||||
3.350%, 06/15/2017 (E) | 11 | 11 | ||||||
Santander Drive Auto Receivables Trust, Ser 2012-1, Cl A2 | ||||||||
1.250%, 04/15/2015 | 15 | 15 | ||||||
Santander Drive Auto Receivables Trust, Ser 2012-3, Cl A2 | ||||||||
0.830%, 04/15/2015 | 34 | 33 | ||||||
Santander Drive Auto Receivables Trust, Ser 2012-5, Cl A2 | ||||||||
0.570%, 12/15/2015 | 73 | 73 | ||||||
| Description | Face Amount ($ Thousands) | Market Value ($ Thousands) | ||||||
Santander Drive Auto Receivables Trust, Ser 2012-5, Cl A3 | ||||||||
0.830%, 12/15/2016 | $ | 119 | $ | 119 | ||||
Santander Drive Auto Receivables Trust, Ser 2012-6, Cl A3 | ||||||||
0.620%, 07/15/2016 | 129 | 129 | ||||||
Santander Drive Auto Receivables Trust, Ser 2013-1, Cl A2 | ||||||||
0.480%, 02/16/2016 | 107 | 107 | ||||||
Santander Drive Auto Receivables Trust, Ser 2013-2, Cl A3 | ||||||||
0.700%, 09/15/2017 | 785 | 783 | ||||||
Santander Drive Auto Receivables Trust, Ser 2013-3, Cl A2 | ||||||||
0.550%, 09/15/2016 | 861 | 860 | ||||||
SNAAC Auto Receivables Trust, Ser 2012-1A, Cl A | ||||||||
1.780%, 06/15/2016 (E) | 16 | 16 | ||||||
Toyota Auto Receivables Owner Trust, Ser 2011-A, Cl A4 | ||||||||
1.560%, 05/15/2015 | 125 | 126 | ||||||
Toyota Auto Receivables Owner Trust, Ser 2012-A, Cl A2 | ||||||||
0.570%, 10/15/2014 | 56 | 56 | ||||||
Toyota Auto Receivables Owner Trust, Ser 2013-B, Cl A2 | ||||||||
0.480%, 02/15/2016 | 305 | 305 | ||||||
Volkswagen Auto Loan Enhanced Trust, Ser 2012-2, Cl A2 | ||||||||
0.330%, 07/20/2015 | 177 | 176 | ||||||
World Omni Auto Receivables Trust, Ser 2012-B, Cl A2 | ||||||||
0.430%, 11/16/2015 | 62 | 62 | ||||||
|
| |||||||
| 16,195 | ||||||||
|
| |||||||
Credit Cards — 0.7% |
| |||||||
American Express Credit Account Secured Note Trust, | ||||||||
0.422%, 05/15/2020 (C) | 891 | 889 | ||||||
American Express Issuance Trust II, Ser 2013-1, Cl A | ||||||||
0.462%, 02/15/2019 (C) | 581 | 578 | ||||||
American Express Issuance Trust II, Ser 2013-2, Cl A | ||||||||
0.680%, 08/15/2019 | 762 | 762 | ||||||
Cabela’s Master Credit Card Trust, Ser 2012-1A, Cl A1 | ||||||||
1.630%, 02/18/2020 (E) | 200 | 202 | ||||||
Capital One Multi-Asset Execution Trust, Ser 2007-A1, Cl A1 | ||||||||
0.232%, 11/15/2019 (C) | 1,267 | 1,255 | ||||||
Chase Issuance Trust, | ||||||||
0.232%, 04/15/2019 (C) | 614 | 609 | ||||||
| SEI Institutional Managed Trust / Annual Report / September 30, 2013 | 141 |
SCHEDULE OF INVESTMENTS
U.S. Fixed Income Fund (Continued)
September 30, 2013
| Description | Face Amount ($ Thousands) | Market Value ($ Thousands) | ||||||
Chase Issuance Trust, | ||||||||
0.462%, 04/15/2020 (C) | $ | 100 | $ | 99 | ||||
Citibank Credit Card Issuance Trust, Ser 2013-A1, Cl A1 | ||||||||
0.280%, 04/24/2017 (C) | 301 | 300 | ||||||
Citibank Credit Card Issuance Trust, Ser 2013-A5, Cl A5 | ||||||||
1.320%, 09/07/2018 | 1,376 | 1,385 | ||||||
GE Capital Credit Card Master Note Trust, Ser 2011-1, Cl A | ||||||||
0.732%, 01/15/2017 (C) | 188 | 188 | ||||||
World Financial Network Credit Card Master Trust, Ser 2013-B, Cl A | ||||||||
0.910%, 03/16/2020 | 614 | 609 | ||||||
|
| |||||||
| 6,876 | ||||||||
|
| |||||||
Mortgage Related Securities — 1.6% |
| |||||||
ABFC Trust, Ser 2004-OPT4, Cl A2 | ||||||||
0.799%, 04/25/2034 (C) | 120 | 113 | ||||||
Aegis Asset-Backed Securities Trust, Ser 2003-3, Cl M1 | ||||||||
1.229%, 01/25/2034 (C) | 505 | 456 | ||||||
Aegis Asset-Backed Securities Trust, Ser 2004-5, Cl M1 | ||||||||
1.154%, 12/25/2034 (C) | 713 | 700 | ||||||
Aegis Asset-Backed Securities Trust, Ser 2004-6, Cl M1 | ||||||||
0.719%, 03/25/2035 (C) | 433 | 432 | ||||||
Ameriquest Mortgage Security Asset-Backed Pass-Through Certificates, Ser 2003-9, Cl AV1 | ||||||||
0.939%, 09/25/2033 (C) | 225 | 213 | ||||||
Argent Securities, Ser 2003-W5, Cl M1 | ||||||||
1.229%, 10/25/2033 (C) | 755 | 721 | ||||||
Asset-Backed Funding Certificates, Ser 2005-WMC1, Cl M1 | ||||||||
0.839%, 06/25/2035 (C) | 786 | 772 | ||||||
Asset-Backed Securities Home Equity, Ser 2005-HE6, Cl M1 | ||||||||
0.669%, 07/25/2035 (C) | 75 | 75 | ||||||
Bear Stearns ALT-A Trust, | ||||||||
0.819%, 07/25/2034 (C) | 258 | 247 | ||||||
Bear Stearns Asset-Backed Securities I Trust, | ||||||||
1.579%, 10/25/2034 (C) | 360 | 342 | ||||||
Bear Stearns Asset-Backed Securities Trust, | ||||||||
1.154%, 12/25/2034 (C) | 429 | 391 | ||||||
| Description | Face Amount ($ Thousands) | Market Value ($ Thousands) | ||||||
Bear Stearns Asset-Backed Securities Trust, | ||||||||
0.579%, 08/25/2043 (C) | $ | 717 | $ | 702 | ||||
Bear Stearns Asset-Backed Securities Trust, | ||||||||
0.545%, 08/25/2035 (C) | 817 | 805 | ||||||
Bear Stearns Asset-Backed Securities Trust, Ser 2006-1, Cl A | ||||||||
0.459%, 02/25/2036 (C) | 530 | 522 | ||||||
BNC Mortgage Loan Trust, | ||||||||
0.429%, 11/25/2037 (C) | 281 | 277 | ||||||
Citifinancial Mortgage Securities, Ser 2004-1, Cl AF4 | ||||||||
4.570%, 04/25/2034 | 370 | 385 | ||||||
Contimortgage Home Equity Trust, Ser 1997-1, Cl A9 | ||||||||
5.351%, 03/15/2028 (C) | — | — | ||||||
Contimortgage Home Equity Trust, Ser 1997-2, Cl A9 | ||||||||
7.090%, 04/15/2028 | — | — | ||||||
HSBC Home Equity Loan Trust, Ser 2005-2, Cl A1 | ||||||||
0.450%, 01/20/2035 (C) | 60 | 59 | ||||||
HSBC Home Equity Loan Trust, Ser 2005-2, Cl M2 | ||||||||
0.670%, 01/20/2035 (C) | 75 | 72 | ||||||
HSBC Home Equity Loan Trust, Ser 2006-1, Cl A1 | ||||||||
0.340%, 01/20/2036 (C) | 1,089 | 1,061 | ||||||
HSBC Home Equity Loan Trust, Ser 2006-2, Cl A1 | ||||||||
0.330%, 03/20/2036 (C) | 67 | 66 | ||||||
HSBC Home Equity Loan Trust, Ser 2007-1, Cl AS | ||||||||
0.380%, 03/20/2036 (C) | 73 | 71 | ||||||
HSBC Home Equity Loan Trust, Ser 2007-1, Cl M2 | ||||||||
0.660%, 03/20/2036 (C) | 2,000 | 1,666 | ||||||
HSBC Home Equity Loan Trust, Ser 2007-3, Cl APT | ||||||||
1.380%, 11/20/2036 (C) | 608 | 605 | ||||||
Lake Country Mortgage Loan Trust, | ||||||||
0.529%, 07/25/2034 (C) (E) | 81 | 80 | ||||||
Morgan Stanley ABS Capital I Trust, | ||||||||
0.599%, 09/25/2035 (C) | 822 | 801 | ||||||
Morgan Stanley ABS Capital I, | ||||||||
0.499%, 11/25/2035 (C) | 734 | 710 | ||||||
| 142 | SEI Institutional Managed Trust / Annual Report / September 30, 2013 |
| Description | Face Amount ($ Thousands) | Market Value ($ Thousands) | ||||||
Morgan Stanley Capital I, | ||||||||
4.054%, 07/15/2049 | $ | 100 | $ | 106 | ||||
New Century Home Equity Loan Trust, Ser 2003-A, Cl A | ||||||||
0.899%, 10/25/2033 (C) (E) | 190 | 174 | ||||||
New Century Home Equity Loan Trust, Ser 2005-3, Cl A2D | ||||||||
0.559%, 07/25/2035 (C) | 187 | 187 | ||||||
New Century Home Equity Loan Trust, Ser 2005-4, Cl A2C | ||||||||
0.549%, 09/25/2035 (C) | 1,450 | 1,423 | ||||||
NovaStar Mortgage Funding Trust, | ||||||||
1.829%, 03/25/2035 (C) | 520 | 507 | ||||||
Residential Asset Securities, | ||||||||
0.549%, 10/25/2035 (C) | 18 | 18 | ||||||
RMAT, Ser 2012-1A, Cl A1 | ||||||||
2.734%, 08/26/2052 (C) (E) | 74 | 74 | ||||||
Salomon Brothers Mortgage Securities VII, Ser 2003-UP1, Cl A | ||||||||
3.950%, 04/25/2032 (E) | 68 | 66 | ||||||
Saxon Asset Securities Trust, | ||||||||
4.795%, 06/25/2033 | 52 | 52 | ||||||
Springleaf Mortgage Loan Trust, | ||||||||
2.310%, 06/25/2058 (C) (E) | 103 | 99 | ||||||
Springleaf Mortgage Loan Trust, | ||||||||
1.780%, 12/25/2065 (C) (E) | 661 | 658 | ||||||
Springleaf Mortgage Loan Trust, | ||||||||
3.520%, 12/25/2065 (C) (E) | 125 | 120 | ||||||
Structured Asset Securities, | ||||||||
3.450%, 02/25/2032 | 68 | 68 | ||||||
Structured Asset Securities, | ||||||||
4.690%, 02/25/2035 | 187 | 186 | ||||||
Wells Fargo Home Equity Trust, | ||||||||
5.000%, 10/25/2034 (C) | 713 | 725 | ||||||
|
| |||||||
| 16,807 | ||||||||
|
| |||||||
Other Asset-Backed Securities — 4.8% |
| |||||||
Academic Loan Funding Trust, | ||||||||
0.979%, 12/27/2022 (C) (E) | 130 | 132 | ||||||
Access Group, Ser 2004-2, Cl A3 | ||||||||
0.456%, 10/25/2024 (C) | 400 | 360 | ||||||
| Description | Face Amount ($ Thousands) | Market Value ($ Thousands) | ||||||
Ally Master Owner Trust, | ||||||||
2.150%, 01/15/2016 | $ | 546 | $ | 548 | ||||
Ally Master Owner Trust, | ||||||||
1.810%, 05/15/2016 | 265 | 267 | ||||||
Ally Master Owner Trust, | ||||||||
0.982%, 09/15/2016 (C) | 242 | 243 | ||||||
Ally Master Owner Trust, | ||||||||
1.440%, 02/15/2017 | 625 | 630 | ||||||
Ally Master Owner Trust, | ||||||||
1.540%, 09/15/2019 | 495 | 491 | ||||||
Alm Loan Funding, | ||||||||
1.696%, 10/19/2024 (C) (E) | 450 | 451 | ||||||
Ascentium Equipment Receivables, | ||||||||
1.830%, 09/15/2019 (E) | 56 | 55 | ||||||
Brazos Higher Education Authority, | ||||||||
1.473%, 02/25/2035 (C) | 850 | 843 | ||||||
Brazos Higher Education Authority, | ||||||||
1.276%, 10/27/2036 (C) | 400 | 393 | ||||||
BXG Receivables Note Trust, Ser 2012-A, Cl A | ||||||||
2.660%, 12/02/2027 (E) | 65 | 64 | ||||||
Centerpoint Energy Transition Bond II, Ser 2005-A, Cl A3 | ||||||||
5.090%, 08/01/2015 | 395 | 401 | ||||||
Chase Funding Mortgage Loan Asset-Backed Certificates, | ||||||||
4.499%, 11/25/2034 | 60 | 61 | ||||||
Chase Funding Mortgage Loan Asset-Backed Certificates, | ||||||||
5.350%, 11/25/2034 | 125 | 130 | ||||||
CIT Education Loan Trust, | ||||||||
0.341%, 03/25/2042 (C) (E) | 731 | 669 | ||||||
CNH Equipment Trust, | ||||||||
0.630%, 01/17/2017 | 370 | 370 | ||||||
Concord Funding, Ser 2012-2, Cl A | ||||||||
3.145%, 01/15/2017 (E) | 200 | 200 | ||||||
Countrywide Asset-Backed Certificates, Ser 2004-6, Cl 1A1 | ||||||||
0.449%, 12/25/2034 (C) | 511 | 462 | ||||||
Countrywide Asset-Backed Certificates, Ser 2005-4, Cl MV1 | ||||||||
0.639%, 10/25/2035 (C) | 237 | 236 | ||||||
| SEI Institutional Managed Trust / Annual Report / September 30, 2013 | 143 |
SCHEDULE OF INVESTMENTS
U.S. Fixed Income Fund (Continued)
September 30, 2013
| Description | Face Amount ($ Thousands) | Market Value ($ Thousands) | ||||||
Countrywide Home Equity Loan Trust, Ser 2006-F, Cl 2A1A | ||||||||
0.322%, 07/15/2036 (C) | $ | 127 | $ | 110 | ||||
Cronos Containers Program, Ser 2012-1A, Cl A | ||||||||
4.210%, 05/18/2027 (E) | 260 | 264 | ||||||
Cronos Containers Program, Ser 2012-2A, Cl A | ||||||||
3.810%, 09/18/2027 (E) | 180 | 182 | ||||||
Educational Funding of the South, Ser 2011-1, Cl A2 | ||||||||
0.916%, 04/25/2035 (C) | 460 | 457 | ||||||
EFS Volunteer, Ser 2010-1, Cl A2 | ||||||||
1.116%, 10/25/2035 (C) (E) | 800 | 785 | ||||||
First Franklin Mortgage Loan Asset-Backed Certificates, | ||||||||
1.179%, 08/25/2034 (C) | 1,160 | 1,108 | ||||||
FNDUS | ||||||||
0.640%, 11/01/2023 | 1,000 | 1,001 | ||||||
Ford Credit Floorplan Master Owner Trust, Ser 2011-1, Cl A1 | ||||||||
2.120%, 02/15/2016 | 480 | 483 | ||||||
Ford Credit Floorplan Master Owner Trust, Ser 2012-1, Cl A | ||||||||
0.652%, 01/15/2016 (C) | 130 | 130 | ||||||
Ford Credit Floorplan Master Owner Trust, Ser 2012-4, Cl A1 | ||||||||
0.740%, 09/15/2016 | 625 | 625 | ||||||
Ford Credit Floorplan Master Owner Trust, Ser 2013-1, Cl A2 | ||||||||
0.562%, 01/15/2018 (C) | 112 | 112 | ||||||
Ford Credit Floorplan Master Owner Trust, Ser 2013-5, Cl A1 | ||||||||
0.850%, 09/15/2018 | 275 | 276 | ||||||
GE Seaco Finance, | ||||||||
0.430%, 11/17/2020 (C) (E) | 607 | 599 | ||||||
HLSS Servicer Advance Receivables Backed Notes, Ser 2012-T2, Cl A1 | ||||||||
1.340%, 10/15/2043 (E) | 186 | 186 | ||||||
HLSS Servicer Advance Receivables Backed Notes, Ser 2012-T2, Cl A2 | ||||||||
1.990%, 10/15/2045 (E) | 146 | 147 | ||||||
HLSS Servicer Advance Receivables Backed Notes, Ser 2013-T1, Cl A1 | ||||||||
0.898%, 01/15/2044 (E) | 193 | 193 | ||||||
HLSS Servicer Advance Receivables Backed Notes, Ser 2013-T1, Cl A2 | ||||||||
1.495%, 01/16/2046 (E) | 150 | 150 | ||||||
HLSS Servicer Advance Receivables Backed Notes, Ser 2013-T4 | ||||||||
1.183%, 08/15/2014 | 213 | 213 | ||||||
Impac Secured Asset | ||||||||
1.084%, 11/25/2034 | 720 | 601 | ||||||
| Description | Face Amount ($ Thousands) | Market Value ($ Thousands) | ||||||
ING Investment Management, | ||||||||
1.667%, 10/15/2023 (C) (E) | $ | 450 | $ | 450 | ||||
Kondaur Mortgage Asset Trust, Ser 2013-1A | ||||||||
4.458%, 08/25/2052 | 448 | 465 | ||||||
Lehman ABS Manufactured Housing Contract Trust, Ser 2001-B, Cl A4 | ||||||||
5.270%, 04/15/2040 | 440 | 464 | ||||||
Macquarie Equipment Funding Trust, Ser 2012-A, Cl A2 | ||||||||
0.610%, 04/20/2015 (E) | 187 | 187 | ||||||
Madison Avenue Manufactured Housing Contract, | ||||||||
2.429%, 03/25/2032 (C) | 213 | 213 | ||||||
Mid-State Trust, Ser 2003-11, Cl A1 | ||||||||
4.864%, 07/15/2038 | 914 | 976 | ||||||
Nationstar Agency Advance Funding Trust, Ser 2013-T1A, Cl AT1 | ||||||||
0.997%, 02/15/2045 (E) | 100 | 99 | ||||||
Nationstar Mortgage Advance Receivable Trust, | ||||||||
1.679%, 06/20/2046 (E) | 200 | 199 | ||||||
Nelnet Student Loan Trust, Ser 2005-1, Cl A5 | ||||||||
0.376%, 10/25/2033 (C) | 758 | 726 | ||||||
Nelnet Student Loan Trust, Ser 2005-2, Cl A5 | ||||||||
0.350%, 03/23/2037 (C) | 696 | 668 | ||||||
Nelnet Student Loan Trust, Ser 2006-1, Cl A4 | ||||||||
0.352%, 11/23/2022 (C) | 661 | 659 | ||||||
Nelnet Student Loan Trust, Ser 2006-2, Cl A4 | ||||||||
0.346%, 10/26/2026 (C) | 928 | 925 | ||||||
Nelnet Student Loan Trust, Ser 2007-1, Cl A1 | ||||||||
0.272%, 11/27/2018 (C) | 169 | 168 | ||||||
Nelnet Student Loan Trust, Ser 2007-1, Cl A3 | ||||||||
0.332%, 05/27/2025 (C) | 433 | 416 | ||||||
Nelnet Student Loan Trust, Ser 2007-2A, Cl A3L | ||||||||
0.601%, 03/25/2026 (C) (E) | 1,544 | �� | 1,524 | |||||
Nelnet Student Loan Trust, Ser 2010-4A, Cl A | ||||||||
0.979%, 04/25/2046 (C) (E) | 196 | 198 | ||||||
Neptune Finance CCS Ltd., Ser 2008-1A, Cl A | ||||||||
0.881%, 04/20/2020 (C) (E) | 444 | 442 | ||||||
Newcastle Investment Trust, Ser 2011-MH1, Cl A | ||||||||
2.450%, 12/10/2033 (E) | 20 | 20 | ||||||
| 144 | SEI Institutional Managed Trust / Annual Report / September 30, 2013 |
| Description | Face Amount ($ Thousands) | Market Value ($ Thousands) | ||||||
Nomura Asset Acceptance Alternative Loan Trust, | ||||||||
5.957%, 03/25/2047 | $ | 217 | $ | 218 | ||||
Nomura Asset Acceptance Alternative Loan Trust, | ||||||||
6.138%, 03/25/2047 | 179 | 180 | ||||||
North Carolina State Education Assistance Authority, | ||||||||
1.066%, 07/25/2025 (C) | 450 | 452 | ||||||
NYMT Residential, Ser 2012-RP1A | ||||||||
4.250%, 12/25/2017 (C) (E) | 150 | 150 | ||||||
NYMT Residential, Ser 2013-RP3A | ||||||||
4.850%, 09/25/2018 | 328 | 328 | ||||||
OHA Credi Partners VII Ltd., Ser 2012-7A, Cl A | ||||||||
1.684%, 11/20/2023 (C) (E) | 450 | 450 | ||||||
Ores NPL | ||||||||
3.081%, 09/25/2025 | 240 | 240 | ||||||
Park Place Securities Asset-Backed Pass-Through Certificates, Ser 2004-MHQ1, Cl M2 | ||||||||
1.304%, 12/25/2034 (C) | 500 | 485 | ||||||
Park Place Securities, | ||||||||
1.116%, 10/25/2034 (C) | 233 | 229 | ||||||
Park Place Securities, | ||||||||
0.799%, 10/25/2034 (C) | 996 | 995 | ||||||
Residential Asset Mortgage Products, | ||||||||
4.030%, 01/25/2033 (C) | 165 | 171 | ||||||
Residential Asset Mortgage Products, | ||||||||
0.519%, 10/25/2035 (C) | 142 | 140 | ||||||
Residential Asset Mortgage Products, | ||||||||
0.519%, 05/25/2035 (C) | 405 | 399 | ||||||
Residential Asset Mortgage Products, | ||||||||
0.479%, 03/25/2036 (C) | 336 | 314 | ||||||
Residential Credit Solutions Trust, Ser 2011-1, Cl A1 | ||||||||
6.000%, 03/25/2041 (E) | 115 | 114 | ||||||
RSB Bondco LLC, Ser 2007-A, Cl A3 | ||||||||
5.820%, 06/28/2019 | 405 | 460 | ||||||
Scholar Funding Trust, | ||||||||
1.164%, 10/28/2043 (C) (E) | 426 | 424 | ||||||
SLC Student Loan Trust, | ||||||||
0.324%, 05/15/2029 (C) | 698 | 668 | ||||||
| Description | Face Amount ($ Thousands) | Market Value ($ Thousands) | ||||||
SLC Student Loan Trust, | ||||||||
0.664%, 05/15/2028 (C) | $ | 156 | $ | 155 | ||||
SLM Private Education Loan Trust, Ser 2011-C, Cl A1 | ||||||||
1.582%, 12/15/2023 (C) (E) | 735 | 739 | ||||||
SLM Private Education Loan Trust, Ser 2012-A, Cl A1 | ||||||||
1.582%, 08/15/2025 (C) (E) | 763 | 769 | ||||||
SLM Private Education Loan Trust, Ser 2012-B, Cl A1 | ||||||||
1.282%, 12/15/2021 (C) (E) | 472 | 474 | ||||||
SLM Private Education Loan Trust, Ser 2012-C, Cl A1 | ||||||||
1.282%, 08/15/2023 (C) (E) | 374 | 376 | ||||||
SLM Private Education Loan Trust, | ||||||||
0.932%, 10/16/2023 (C) (E) | 104 | 103 | ||||||
SLM Private Education Loan Trust, | ||||||||
1.932%, 06/15/2045 (C) (E) | 655 | 666 | ||||||
SLM Private Education Loan Trust, | ||||||||
1.979%, 11/25/2043 (C) | 180 | 177 | ||||||
SLM Private Education Loan Trust, | ||||||||
0.782%, 08/15/2022 (C) (E) | 346 | 344 | ||||||
SLM Private Education Loan Trust, | ||||||||
0.832%, 07/15/2022 (C) (E) | 208 | 207 | ||||||
SLM Private Education Loan Trust, | ||||||||
1.850%, 06/17/2030 (E) | 1,009 | 975 | ||||||
SLM Student Loan Trust, | ||||||||
0.454%, 10/28/2028 (C) | 221 | 220 | ||||||
SLM Student Loan Trust, | ||||||||
0.544%, 12/15/2025 (C) (E) | 350 | 347 | ||||||
SLM Student Loan Trust, | ||||||||
0.766%, 04/25/2024 (C) (E) | 814 | 816 | ||||||
SLM Student Loan Trust, | ||||||||
1.466%, 07/27/2026 (C) | 266 | 270 | ||||||
SLM Student Loan Trust, | ||||||||
0.366%, 01/25/2023 (C) | 79 | 79 | ||||||
SLM Student Loan Trust, | ||||||||
0.436%, 01/25/2041 (C) | 540 | 469 | ||||||
SLM Student Loan Trust, | ||||||||
0.336%, 04/25/2022 (C) | 97 | 96 | ||||||
| SEI Institutional Managed Trust / Annual Report / September 30, 2013 | 145 |
SCHEDULE OF INVESTMENTS
U.S. Fixed Income Fund (Continued)
September 30, 2013
| Description | Face Amount ($ Thousands) | Market Value ($ Thousands) | ||||||
SLM Student Loan Trust, | ||||||||
0.426%, 01/25/2041 (C) | $ | 540 | $ | 469 | ||||
SLM Student Loan Trust, | ||||||||
0.436%, 07/25/2025 (C) | 178 | 154 | ||||||
SLM Student Loan Trust, | ||||||||
1.916%, 07/25/2022 (C) | 1,300 | 1,357 | ||||||
SLM Student Loan Trust, | ||||||||
1.566%, 01/25/2018 (C) | 237 | 239 | ||||||
SLM Student Loan Trust, | ||||||||
0.579%, 03/25/2025 (C) | 401 | 399 | ||||||
SLM Student Loan Trust, | ||||||||
0.934%, 05/26/2026 (C) | 200 | 200 | ||||||
SLM Student Loan Trust, | ||||||||
1.179%, 04/27/2043 (C) | 249 | 223 | ||||||
SLM Student Loan Trust, | ||||||||
1.679%, 06/25/2043 (C) | 128 | 121 | ||||||
SLM Student Loan Trust, | ||||||||
0.479%, 05/26/2020 (C) | 287 | 285 | ||||||
SLM Student Loan Trust, | ||||||||
1.679%, 09/25/2043 (C) | 136 | 130 | ||||||
SLM Student Loan Trust, | ||||||||
0.729%, 06/25/2027 (C) | 447 | 447 | ||||||
SLM Student Loan Trust, | ||||||||
0.627%, 10/26/2020 (C) | 216 | 216 | ||||||
SLM Student Loan Trust, | ||||||||
0.816%, 10/26/2026 (C) | 888 | 784 | ||||||
SLM Student Loan Trust, | ||||||||
1.030%, 02/15/2022 | 489 | 489 | ||||||
SLM Student Loan Trust, | ||||||||
3.130%, 10/15/2031 | 445 | 450 | ||||||
SMS Student Loan Trust, | ||||||||
0.464%, 04/28/2029 (C) | 295 | 294 | ||||||
Springleaf Funding Trust, | ||||||||
2.580%, 09/15/2021 (E) | 600 | 597 | ||||||
Springleaf Funding Trust, | ||||||||
3.920%, 01/16/2023 (E) | 250 | 246 | ||||||
| Description | Face Amount ($ Thousands) | Market Value ($ Thousands) | ||||||
Stanwich Mortgage Loan Trust, | ||||||||
2.981%, 09/15/2042 (E) | $ | 119 | $ | 119 | ||||
Stanwich Mortgage Loan Trust, | ||||||||
2.981%, 10/18/2042 (E) | 192 | 192 | ||||||
Stanwich Mortgage Loan Trust, | ||||||||
2.981%, 02/16/2043 (E) | 249 | 250 | ||||||
Stanwich Mortgage Loan Trust, | ||||||||
3.228%, 04/16/2059 (E) | 237 | 235 | ||||||
Structured Asset Investment Loan Trust, Ser 2005-5, Cl A9 | ||||||||
0.584%, 06/25/2035 (C) | 20 | 20 | ||||||
Structured Asset Securities, | ||||||||
0.479%, 05/25/2035 (C) | 260 | 256 | ||||||
Structured Asset Securities, | ||||||||
0.409%, 07/25/2035 (C) | 320 | 318 | ||||||
Structured Asset Securities, | ||||||||
0.329%, 07/25/2036 (C) | 781 | 762 | ||||||
TAL Advantage I, Ser 2006-1A, Cl N | ||||||||
0.370%, 04/20/2021 (C) (E) | 271 | 267 | ||||||
TAL Advantage I, Ser 2010-2A, Cl A | ||||||||
4.300%, 10/20/2025 (E) | 393 | 395 | ||||||
TAL Advantage I, Ser 2011-1A, Cl A | ||||||||
4.600%, 01/20/2026 (E) | 183 | 186 | ||||||
Textainer Marine Containers, Ser 2005-1A, Cl A | ||||||||
0.430%, 05/15/2020 (C) (E) | 167 | 165 | ||||||
Trafigura Securitisation Finance, | ||||||||
2.582%, 10/15/2015 (C) (E) | 137 | 139 | ||||||
Trinity Rail Leasing, | ||||||||
5.270%, 08/14/2027 (E) | 277 | 300 | ||||||
Trip Rail Master Funding LLC, | ||||||||
4.370%, 07/15/2041 (E) | 641 | 677 | ||||||
Triton Container Finance LLC, Ser 2006-1A, Cl N | ||||||||
0.350%, 11/26/2021 (C) (E) | 475 | 466 | ||||||
VOLT, Ser 2012-RLF1, Cl A | ||||||||
3.475%, 12/25/2017 (E) | 104 | 104 | ||||||
VOLT, Ser 2012-RP3A, Cl A | ||||||||
3.475%, 11/27/2017 (E) | 18 | 18 | ||||||
|
| |||||||
| 49,095 | ||||||||
|
| |||||||
Total Asset-Backed Securities | 88,973 | |||||||
|
| |||||||
| 146 | SEI Institutional Managed Trust / Annual Report / September 30, 2013 |
| Description | Face Amount ($ Thousands) | Market Value ($ Thousands) | ||||||
U.S. GOVERNMENT AGENCY OBLIGATIONS — 2.1% |
| |||||||
FHLB | ||||||||
5.500%, 07/15/2036 | $ | 300 | $ | 354 | ||||
2.500%, 05/26/2015 (D) | 950 | 911 | ||||||
0.095%, 11/20/2013 | 1,990 | 1,990 | ||||||
FHLMC | ||||||||
0.110%, 01/21/2014 | 1,100 | 1,100 | ||||||
0.100%, 12/09/2013 | 120 | 120 | ||||||
FICO STRIPS, PO | ||||||||
9.800%, 11/30/2017 | 875 | 1,174 | ||||||
9.700%, 04/05/2019 | 320 | 447 | ||||||
8.600%, 09/26/2019 | 845 | 1,143 | ||||||
3.208%, 12/06/2017 (B) | 660 | 619 | ||||||
2.000%, 10/06/2017 | 360 | 339 | ||||||
0.000%, 05/11/2018 to 09/26/2019 (B) | 2,225 | 2,029 | ||||||
FNMA | ||||||||
5.375%, 06/12/2017 | 50 | 58 | ||||||
3.460%, 06/01/2017 (B) | 600 | 571 | ||||||
2.027%, 10/09/2019 (B) | 1,000 | 848 | ||||||
0.500%, 01/29/2016 | 1,825 | 1,822 | ||||||
0.120%, 02/24/2014 (G) | 270 | 270 | ||||||
0.100%, 12/04/2013 | 2,565 | 2,565 | ||||||
0.095%, 01/15/2014 | 980 | 980 | ||||||
0.070%, 10/01/2013 | 1,005 | 1,005 | ||||||
Resolution Funding STRIPS | ||||||||
2.245%, 07/15/2020 (B) | 1,840 | 1,562 | ||||||
1.805%, 10/15/2019 (B) | 200 | 177 | ||||||
Tennessee Valley Authority | ||||||||
5.880%, 04/01/2036 | 250 | 299 | ||||||
5.250%, 09/15/2039 | 390 | 425 | ||||||
4.625%, 09/15/2060 | 60 | 57 | ||||||
1.750%, 10/15/2018 | 1,053 | 1,051 | ||||||
|
| |||||||
Total U.S. Government Agency Obligations (Cost $21,864) ($ Thousands) |
| 21,916 | ||||||
|
| |||||||
SOVEREIGN DEBT — 0.8% | ||||||||
Banco Nacional de Desenvolvimento | ||||||||
5.750%, 09/26/2023 (E) | 225 | 225 | ||||||
FMS Wertmanagement AoeR | ||||||||
1.000%, 11/21/2017 | 200 | 197 | ||||||
Israel Government AID Bond | ||||||||
2.400%, 11/15/2019 | 500 | 438 | ||||||
2.311%, 03/15/2019 | 1,000 | 901 | ||||||
Japan Bank for International Cooperation | ||||||||
3.375%, 07/31/2023 | 330 | 331 | ||||||
1.750%, 07/31/2018 (F) | 580 | 578 | ||||||
Kommunalbanken | ||||||||
1.125%, 05/23/2018 (E) | 940 | 915 | ||||||
Mexico Government International Bond | ||||||||
5.750%, 10/12/2110 | 772 | 726 | ||||||
| Description | Face Amount ($ Thousands) | Market Value ($ Thousands) | ||||||
4.750%, 03/08/2044 | $ | 60 | $ | 54 | ||||
4.000%, 10/02/2023 | 212 | 211 | ||||||
Province of Quebec Canada | ||||||||
6.350%, 01/30/2026 | 70 | 87 | ||||||
2.625%, 02/13/2023 | 970 | 902 | ||||||
Republic of Korea | ||||||||
3.875%, 09/11/2023 | 270 | 275 | ||||||
Russian Foreign Bond - Eurobond | ||||||||
4.875%, 09/16/2023 (E) | 400 | 409 | ||||||
Slovakia Government International Bond | ||||||||
4.375%, 05/21/2022 (E) | 705 | 727 | ||||||
Slovenia Government International Bond (E) | ||||||||
5.850%, 05/10/2023 | 200 | 190 | ||||||
5.500%, 10/26/2022 | 200 | 186 | ||||||
4.750%, 05/10/2018 (F) | 460 | 443 | ||||||
Spain Government International Bond MTN | ||||||||
4.000%, 03/06/2018 (E) | 500 | 508 | ||||||
United Mexican States MTN | ||||||||
6.050%, 01/11/2040 | 100 | 109 | ||||||
|
| |||||||
Total Sovereign Debt | 8,412 | |||||||
|
| |||||||
MUNICIPAL BONDS — 0.8% | ||||||||
American Municipal Power, RB | ||||||||
7.499%, 02/15/2050 | 80 | 96 | ||||||
Arizona State University, Ser A, RB Callable 07/01/2022 @ 100 | ||||||||
5.000%, 07/01/2043 | 30 | 31 | ||||||
City of Houston, Ser A, GO | ||||||||
6.290%, 03/01/2032 | 475 | 536 | ||||||
City of Los Angeles, Department of Airports, RB | ||||||||
6.582%, 05/15/2039 | 25 | 29 | ||||||
City of New York, Ser J, GO | ||||||||
5.000%, 08/01/2025 | 40 | 46 | ||||||
City of Richmond, Ser A, GO | ||||||||
5.000%, 03/01/2027 | 30 | 34 | ||||||
5.000%, 03/01/2028 | 30 | 33 | ||||||
5.000%, 03/01/2029 | 30 | 33 | ||||||
City of San Antonio, Public Service Board, RB | ||||||||
5.000%, 02/01/2043 | 100 | 104 | ||||||
County of Clark, Ser C, RB | ||||||||
6.820%, 07/01/2045 | 260 | 323 | ||||||
Los Angeles, Community College District, GO | ||||||||
6.750%, 08/01/2049 | 255 | 315 | ||||||
| SEI Institutional Managed Trust / Annual Report / September 30, 2013 | 147 |
SCHEDULE OF INVESTMENTS
U.S. Fixed Income Fund (Continued)
September 30, 2013
| Description | Face Amount ($ Thousands) | Market Value ($ Thousands) | ||||||
New Jersey, Economic Development Authority, RB | ||||||||
5.000%, 06/15/2046 | $ | 40 | $ | 41 | ||||
New Jersey State, Turnpike Authority, Ser A, RB | ||||||||
5.000%, 01/01/2043 | 40 | 41 | ||||||
New Jersey State, Turnpike Authority, Ser C, RB | ||||||||
7.102%, 01/01/2041 | 314 | 397 | ||||||
New Jersey, Transportation Trust Fund Authority, Ser A, RB | ||||||||
5.000%, 06/15/2042 | 60 | 61 | ||||||
New Jersey, Transportation Trust Fund Authority, Ser AA, RB | ||||||||
5.000%, 06/15/2038 | 100 | 102 | ||||||
New York City, Water & Sewer System, Ser BB, RB | ||||||||
5.000%, 06/15/2047 | 30 | 31 | ||||||
New York City, Water & Sewer System, Ser EE, RB | ||||||||
5.000%, 06/15/2047 | 30 | 31 | ||||||
New York, Liberty Development, RB Callable 12/15/2021 @ 100 | ||||||||
5.000%, 12/15/2041 | 50 | 51 | ||||||
New York State, Dormitory Authority, Ser A, RB | ||||||||
5.000%, 12/15/2026 | 30 | 34 | ||||||
5.000%, 12/15/2027 | 70 | 78 | ||||||
New York State, Urban Development, Ser C, RB | ||||||||
5.000%, 03/15/2027 | 130 | 146 | ||||||
North Texas, Tollway Authority, Ser B, RB | ||||||||
6.718%, 01/01/2049 | 291 | 350 | ||||||
Northeast Ohio, Regional Sewer District, RB | ||||||||
5.000%, 11/15/2043 | 60 | 62 | ||||||
Ohio State, Turnpike Commission, RB Callable 02/15/2023 @ 100 | ||||||||
5.000%, 02/15/2048 | 120 | 121 | ||||||
Ohio State, Turnpike Commission, Ser A, RB | ||||||||
5.000%, 02/15/2048 | 50 | 51 | ||||||
Ohio State University, Ser A, RB | ||||||||
4.800%, 06/01/2111 | 261 | 226 | ||||||
| Description | Face Amount ($ Thousands) | Market Value ($ Thousands) | ||||||
Pennsylvania, Turnpike Commission, Ser C, RB | ||||||||
5.000%, 12/01/2043 | $ | 50 | $ | 51 | ||||
Port Authority of New York & New Jersey, RB | ||||||||
5.647%, 11/01/2040 | 105 | 114 | ||||||
4.458%, 10/01/2062 | 340 | 287 | ||||||
Private Colleges & Universities Authority, Ser A, RB | ||||||||
5.000%, 10/01/2043 | 60 | 64 | ||||||
State of California, GO | ||||||||
5.000%, 09/01/2025 | 80 | 90 | ||||||
5.000%, 04/01/2042 | 80 | 82 | ||||||
State of California, GO | ||||||||
7.600%, 11/01/2040 | 220 | 290 | ||||||
7.300%, 10/01/2039 | 220 | 277 | ||||||
6.650%, 03/01/2022 | 500 | 598 | ||||||
6.200%, 03/01/2019 | 300 | 351 | ||||||
State of California, Ser B, GO | ||||||||
5.000%, 09/01/2023 | 110 | 128 | ||||||
State of Connecticut, Ser C, GO | ||||||||
5.000%, 07/15/2024 | 40 | 47 | ||||||
State of Illinois, GO | ||||||||
5.877%, 03/01/2019 | 120 | 129 | ||||||
5.665%, 03/01/2018 | 375 | 409 | ||||||
5.365%, 03/01/2017 | 150 | 162 | ||||||
5.100%, 06/01/2033 | 1,010 | 895 | ||||||
4.950%, 06/01/2023 | 275 | 273 | ||||||
State of Texas, GO | ||||||||
5.517%, 04/01/2039 | 250 | 282 | ||||||
Utah State, Transit Authority, RB | ||||||||
5.000%, 06/15/2042 | 110 | 112 | ||||||
|
| |||||||
Total Municipal Bonds | 8,044 | |||||||
|
| |||||||
U.S. TREASURY OBLIGATIONS — 27.0% |
| |||||||
U.S. Treasury Bills (B) | ||||||||
0.078%, 11/14/2013 | 700 | 700 | ||||||
0.037%, 12/05/2013 (G) | 60 | 60 | ||||||
U.S. Treasury Bonds | ||||||||
7.625%, 02/15/2025 | 1,485 | 2,193 | ||||||
6.375%, 08/15/2027 | 50 | 69 | ||||||
6.125%, 08/15/2029 | 50 | 68 | ||||||
5.000%, 05/15/2037 | 465 | 575 | ||||||
4.750%, 02/15/2037 | 100 | 120 | ||||||
4.500%, 05/15/2038 | 200 | 231 | ||||||
4.375%, 02/15/2038 | 250 | 283 | ||||||
3.625%, 08/15/2043 | 4,897 | 4,840 | ||||||
3.125%, 11/15/2041 to 02/15/2043 (G) | 20,490 | 18,467 | ||||||
| 148 | SEI Institutional Managed Trust / Annual Report / September 30, 2013 |
| Description | Face Amount ($ Thousands) | Market Value ($ Thousands) | ||||||
3.000%, 05/15/2042 | $ | 1,210 | $ | 1,060 | ||||
2.875%, 05/15/2043 | 7,639 | 6,484 | ||||||
2.750%, 08/15/2042 to 11/15/2042 | 18,193 | 15,072 | ||||||
2.625%, 11/15/2020 | 100 | 104 | ||||||
U.S. Treasury Inflation Protected Securities | ||||||||
2.500%, 01/15/2029 | 109 | 134 | ||||||
2.125%, 02/15/2040 to 02/15/2041 | 1,667 | 1,975 | ||||||
2.000%, 07/15/2014 | 3,718 | 3,812 | ||||||
1.250%, 04/15/2014 | 971 | 979 | ||||||
0.750%, 02/15/2042 | 217 | 186 | ||||||
0.500%, 04/15/2015 | 2,571 | 2,626 | ||||||
0.125%, 04/15/2016 to 04/15/2018 | 8,857 | 9,115 | ||||||
U.S. Treasury Notes | ||||||||
4.500%, 05/15/2017 | 1,000 | 1,128 | ||||||
3.625%, 02/15/2021 | 400 | 443 | ||||||
3.500%, 02/15/2018 to 05/15/2020 | 1,300 | 1,431 | ||||||
3.125%, 04/30/2017 to 05/15/2021 | 5,492 | 5,913 | ||||||
2.750%, 10/31/2013 | 4,480 | 4,490 | ||||||
2.625%, 08/15/2020 | 400 | 417 | ||||||
2.500%, 08/15/2023 | 7,831 | 7,751 | ||||||
2.125%, 08/15/2021 | 1,400 | 1,389 | ||||||
2.000%, 11/30/2013 to 02/15/2023 | 28,540 | 27,775 | ||||||
1.875%, 02/28/2014 to 06/30/2020 | 4,750 | 4,734 | ||||||
1.750%, 05/15/2023 | 4,700 | 4,355 | ||||||
1.500%, 12/31/2013 | 5,065 | 5,075 | ||||||
1.500%, 08/31/2018 | 2,820 | 2,839 | ||||||
1.375%, 11/30/2015 to 09/30/2018 | 38,198 | 38,290 | ||||||
1.000%, 03/31/2017 to 11/30/2019 | 6,902 | 6,893 | ||||||
0.875%, 09/15/2016 | 3,154 | 3,177 | ||||||
0.750%, 10/31/2017 to 03/31/2018 | 21,740 | 21,416 | ||||||
0.625%, 08/15/2016 to 04/30/2018 | 7,828 | 7,734 | ||||||
0.375%, 06/30/2015 to 08/31/2015 | 16,566 | 16,588 | ||||||
0.250%, 05/15/2015 to 10/15/2015 | 15,494 | 15,478 | ||||||
U.S. Treasury STRIPS | ||||||||
6.292%, 05/15/2024 (B) | 200 | 146 | ||||||
4.978%, 11/15/2027 (B) | 1,520 | 948 | ||||||
4.917%, 05/15/2026 (B) | 100 | 66 | ||||||
4.789%, 08/15/2027 (B) | 700 | 438 | ||||||
4.750%, 05/15/2027 (B) | 515 | 326 | ||||||
4.591%, 05/15/2036 (B) | 100 | 42 | ||||||
| Description | Face Amount ($ Thousands)/Shares | Market Value ($ Thousands) | ||||||
4.589%, 08/15/2030 (B) | $ | 325 | $ | 177 | ||||
4.587%, 02/15/2024 (B) | 75 | 56 | ||||||
4.576%, 05/15/2034 (B) | 175 | 80 | ||||||
4.555%, 05/15/2029 (B) | 100 | 58 | ||||||
4.536%, 02/15/2034 (B) | 250 | 116 | ||||||
4.509%, 02/15/2028 (B) | 653 | 399 | ||||||
4.453%, 08/15/2033 (B) | 300 | 143 | ||||||
4.445%, 05/15/2028 (B) | 700 | 423 | ||||||
4.422%, 11/15/2030 (B) | 950 | 511 | ||||||
4.390%, 05/15/2033 (B) | 425 | 204 | ||||||
4.371%, 02/15/2030 (B) | 1,000 | 557 | ||||||
4.287%, 02/15/2017 (B) | 3,660 | 3,557 | ||||||
4.269%, 11/15/2024 (B) | 150 | 107 | ||||||
4.264%, 11/15/2026 (B) | 1,100 | 713 | ||||||
4.231%, 11/15/2029 (B) | 400 | 225 | ||||||
4.221%, 05/15/2030 (B) | 200 | 110 | ||||||
4.062%, 11/15/2031 (B) | 150 | 77 | ||||||
4.050%, 05/15/2019 (B) | 875 | 797 | ||||||
4.044%, 11/15/2033 (B) | 750 | 352 | ||||||
4.029%, 08/15/2019 (B) | 1,350 | 1,219 | ||||||
3.964%, 11/15/2032 (B) | 250 | 123 | ||||||
3.888%, 02/15/2027 (B) | 1,350 | 865 | ||||||
3.816%, 02/15/2033 | 100 | 49 | ||||||
3.812%, 02/15/2031 | 400 | 213 | ||||||
3.720%, 05/15/2031 (B) | 185 | 97 | ||||||
3.718%, 11/15/2017 (B) | 650 | 620 | ||||||
3.704%, 08/15/2018 (B) | 400 | 374 | ||||||
3.667%, 08/15/2031 | 100 | 52 | ||||||
3.602%, 02/15/2029 (B) | 350 | 204 | ||||||
3.560%, 08/15/2020 (B) | 3,550 | 3,086 | ||||||
3.301%, 11/15/2016 (B) | 200 | 195 | ||||||
3.268%, 02/15/2032 (B) | 450 | 229 | ||||||
3.135%, 05/15/2018 (B) | 250 | 235 | ||||||
3.087%, 02/15/2018 (B) | 925 | 876 | ||||||
3.069%, 05/15/2020 (B) | 4,274 | 3,750 | ||||||
2.890%, 08/15/2026 (B) | 47 | 31 | ||||||
2.875%, 05/15/2035 | 100 | 44 | ||||||
2.778%, 11/15/2034 | 200 | 90 | ||||||
2.727%, 02/15/2035 (B) | 100 | 44 | ||||||
2.721%, 02/15/2015 (B) | 100 | 100 | ||||||
2.704%, 08/15/2021 (B) | 250 | 208 | ||||||
2.372%, 02/15/2021 (B) | 2,250 | 1,914 | ||||||
2.088%, 11/15/2021 (B) | 950 | 780 | ||||||
1.862%, 05/15/2021 (B) | 2,550 | 2,144 | ||||||
1.800%, 02/15/2022 (B) | 200 | 162 | ||||||
1.474%, 02/15/2020 (B) | 1,700 | 1,507 | ||||||
|
| |||||||
Total U.S. Treasury Obligations | 276,308 | |||||||
|
| |||||||
AFFILIATED PARTNERSHIP — 1.2% |
| |||||||
SEI Liquidity Fund, L.P. 0.070%**† (A) | 12,248,394 | 12,248 | ||||||
|
| |||||||
Total Affiliated Partnership | 12,248 | |||||||
|
| |||||||
| SEI Institutional Managed Trust / Annual Report / September 30, 2013 | 149 |
SCHEDULE OF INVESTMENTS
U.S. Fixed Income Fund (Concluded)
September 30, 2013
| Description | Shares/Face Amount ($ Thousands)/Contracts | Market Value ($ Thousands) | ||||||
CASH EQUIVALENT — 6.4% |
| |||||||
SEI Daily Income Trust, Prime Obligation Fund, Cl A 0.010%**† | 65,314,647 | $ | 65,315 | |||||
|
| |||||||
Total Cash Equivalent | 65,315 | |||||||
|
| |||||||
COMMERCIAL PAPER — 0.2% |
| |||||||
RBS Holdings USA | ||||||||
0.361%, 01/22/2014 (E) | $ | 1,820 | 1,818 | |||||
|
| |||||||
Total Commercial Paper (Cost $1,818) ($ Thousands) | 1,818 | |||||||
|
| |||||||
Total Investments — 109.1% |
| $ | 1,115,492 | |||||
|
| |||||||
WRITTEN OPTION*‡‡ — 0.0% |
| |||||||
November 2020 U.S. CPI Urban Consumers NSA Call, Expires 11/23/20, Strike Inflation 0.00% | (1,490,000 | ) | (1 | ) | ||||
|
| |||||||
Total Written Option |
| (1 | ) | |||||
|
| |||||||
A list of the open futures contracts held by the Fund at September 30, 2013, is as follows:
| Type of Contract | Number of Contracts Long (Short) | Expiration Date | Unrealized Appreciation (Depreciation) ($ Thousands) | |||||||||
90-Day Euro$ | 30 | Dec-2014 | 6 | |||||||||
90-Day Euro$ | (30 | ) | Dec-2015 | (10 | ) | |||||||
U.S. 10-Year Treasury Note | 13 | Dec-2013 | 29 | |||||||||
U.S. 10-Year Treasury Note | (100 | ) | Dec-2013 | (178 | ) | |||||||
U.S. 2-Year Treasury Note | (55 | ) | Dec-2013 | (31 | ) | |||||||
U.S. 5-Year Treasury Note | (224 | ) | Dec-2013 | (380 | ) | |||||||
U.S. Long Treasury Bond | (39 | ) | Dec-2013 | (124 | ) | |||||||
U.S. Long Treasury Bond | 51 | Dec-2013 | 119 | |||||||||
U.S. Ultra Long Treasury Bond | (52 | ) | Dec-2013 | (171 | ) | |||||||
U.S. Ultra Long Treasury Bond | 5 | Dec-2013 | 22 | |||||||||
|
| |||||||||||
| $ | (718 | ) | ||||||||||
|
| |||||||||||
For the year ended September 30, 2013, the total amount of all open futures contracts, as presented in the table above, are representative of the volume of activity for this derivative type during the year.
A list of the outstanding OTC swap agreements held by the Fund at September 30, 2013, is as follows
| Interest Rate Swaps | ||||||||||||||
| Counterparty | Fund Pays | Fund Receives | Termination Date | Notional Amount (Thousands) | Net Unrealized Appreciation ($ Thousands) | |||||||||
| Barclays Bank PLC | 2.48% | 3-Month LIBOR | 11/15/27 | 415 | $ | 27 | ||||||||
| Barclays Bank PLC | 2.42% | 3-Month LIBOR | 11/15/27 | 420 | 30 | |||||||||
| Citigroup | 2.71% | 3-Month LIBOR | 08/15/42 | 830 | 145 | |||||||||
|
| |||||||||||||
| $ | 202 | |||||||||||||
|
| |||||||||||||
For the year ended September 30, 2013, the total amount of open swap agreements, as presented in the table above, are representative of the volume of activity for this derivative type during the year.
Percentages are based on a Net Assets of $1,022,233 ($ Thousands).
| * | Non-Income producing security. |
| ** | The rate reported is the seven day effective yield as of September 30, 2013. |
| † | Investment in Affiliated Security (see Note 6). |
| ‡ | Real Estate Investment Trust. |
| ‡‡ | For the year ended September 30, 2013, the total amount of all open written options, as presented in the Schedule of Investments, are representative of the volume of activity for these derivative types during the year. |
| (A) | This security was purchased with cash collateral held from securities on loan (see Note 10). The total value of such securities as of September 30, 2013 was $12,248 ($ Thousands). |
| (B) | The rate reported is the effective yield at time of purchase. |
| (C) | Variable Rate Security — The rate reported on the Schedule of Investments is the rate in effect as of September 30, 2013. The date reported on the Schedule of Investments is the final maturity date. |
| (D) | Step Bonds — The rate reflected on the Schedule of Investments is the effective yield on September 30, 2013. The coupon on a step bond changes on a specified date. |
| (E) | Securities sold within terms of a private placement memorandum, exempt from registration under Section 144A of the Securities Act of 1933, as amended, and may be sold only to dealers in that program or other “accredited investors.” These |
| securities have been determined to be liquid under guidelines established by the Board of Trustees. |
| (F) | This security or a partial position of this security is on loan at September 30, 2013 (see Note 10). The total value of securities on loan at September 30, 2013 was $11,898 ($ Thousands). |
| (G) | Security, or portion thereof, has been pledged as collateral on open futures contracts. |
ABS — Asset-Backed Security
AID — Agency for International Development
ARM — Adjustable Rate Mortgage
Cl — Class
CMBS — Commercial Mortgage Backed Security
CMO — Collateralized Mortgage Obligation
CPI — Consumer Price Index
FDIC — Federal Deposit Insurance Corporation
FHLB — Federal Home Loan Bank
FHLMC — Federal Home Loan Mortgage Corporation
FICO — Financing Corporation
FNMA — Federal National Mortgage Association
GNMA — Government National Mortgage Association
GO — General Obligation
| 150 | SEI Institutional Managed Trust / Annual Report / September 30, 2013 |
IO — Interest Only — face amount represents notional amount
Ltd — Limited
LIBOR — London Inter-Bank Offer Rate
LLC — Limited Liability Company
L.P.— limited Partnership
MTN — Medium Term Note
NCUA — National Credit Union Administration
NSA — Not Seasonally Adjusted
OTC — Over The Counter
PLC — Public Limited Company
PO — Principal Only
RB — Revenue Bond
Re-REMIC — Resecuritization of Real Estate Mortgage Investment Conduit
Ser — Series
STRIPS — Separately Traded Registered Interest and Principal Securities
TBA — To Be Announced
The following is a list of the level of inputs used as of September 30, 2013, in valuing the Fund’s investments and other financial instruments carried at value ($ Thousands):
| Investments in Securities | Level 1 | Level 2 | Level 3 | Total | ||||||||||||
Mortgage-Backed Securities | $ | — | $ | 404,646 | $ | — | $ | 404,646 | ||||||||
Corporate Obligations | — | 227,812 | — | 227,812 | ||||||||||||
Asset-Backed Securities | — | 88,973 | — | 88,973 | ||||||||||||
U.S. Government Agency Obligations | — | 21,916 | — | 21,916 | ||||||||||||
Sovereign Debt | — | 8,412 | — | 8,412 | ||||||||||||
Municipal Bonds | — | 8,044 | — | 8,044 | ||||||||||||
U.S. Treasury Obligations | — | 276,308 | — | 276,308 | ||||||||||||
Affiliated Partnership | — | 12,248 | — | 12,248 | ||||||||||||
Cash Equivalent | 65,315 | — | — | 65,315 | ||||||||||||
Commercial Paper | — | 1,818 | — | 1,818 | ||||||||||||
|
|
|
|
|
|
|
| |||||||||
Total Investments in Securities | $ | 65,315 | $ | 1,050,177 | $ | — | $ | 1,115,492 | ||||||||
|
|
|
|
|
|
|
| |||||||||
| Other Financial Instruments | Level 1 | Level 2 | Level 3 | Total | ||||||||||||
Futures Contracts* | ||||||||||||||||
Unrealized Appreciation | $ | 176 | $ | — | $ | — | $ | 176 | ||||||||
Unrealized Depreciation | (894 | ) | — | — | (894 | ) | ||||||||||
OTC Swaps | ||||||||||||||||
Interest Rate Swaps* | ||||||||||||||||
Unrealized Appreciation | — | 202 | — | 202 | ||||||||||||
Written Option | — | (1 | ) | — | (1 | ) | ||||||||||
|
|
|
|
|
|
|
| |||||||||
Total Other Financial Instruments | $ | (718 | ) | $ | 201 | $ | — | $ | (517 | ) | ||||||
|
|
|
|
|
|
|
| |||||||||
| * | Futures contracts and swaps contracts are valued at the unrealized appreciation (depreciation) of the instrument. |
For the year ended September 30, 2013, there were no transfers between Level 1 and Level 2 assets and liabilities.
For the year ended September 30, 2013, there were no transfers between Level 2 and Level 3 assets and liabilities.
For more information on valuation inputs, see Note 2 — Significant Accounting Policies in Notes to Financial Statements.
Amounts designated as “—” are $O or have been rounded to $O.
The accompanying notes area an integral part of the financial statement.
| SEI Institutional Managed Trust / Annual Report / September 30, 2013 | 151 |
Schedule of Investments
High Yield Bond Fund
September 30, 2013
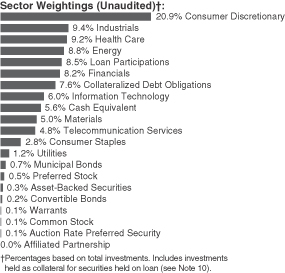
| Description | Face Amount ($ Thousands) | Market Value ($ Thousands) | ||||||
CORPORATE OBLIGATIONS — 72.7% |
| |||||||
Consumer Discretionary — 18.4% |
| |||||||
Academy | ||||||||
9.250%, 08/01/2019 (A) | $ | 655 | $ | 730 | ||||
Adelphia Communications | ||||||||
10.250%, 06/15/2011 | 150 | 1 | ||||||
0.000%, 01/15/2009 | 225 | 2 | ||||||
Adelphia Communications | ||||||||
0.000%, 02/15/2004 | 25 | — | ||||||
Affinia Group | ||||||||
7.750%, 05/01/2021 (A) | 285 | 292 | ||||||
Affinion Group | ||||||||
11.500%, 10/15/2015 | 525 | 457 | ||||||
Affinity Gaming | ||||||||
9.000%, 05/15/2018 | 1,675 | 1,809 | ||||||
Allegion US Holding | ||||||||
5.750%, 10/01/2021 (A) | 3,631 | 3,631 | ||||||
Allison Transmission | ||||||||
7.125%, 05/15/2019 (A) | 4,095 | 4,351 | ||||||
AMC Entertainment | ||||||||
9.750%, 12/01/2020 | 715 | 815 | ||||||
8.750%, 06/01/2019 | 520 | 559 | ||||||
AMC Networks | ||||||||
4.750%, 12/15/2022 | 745 | 697 | ||||||
American Achievement | ||||||||
10.875%, 04/15/2016 (A) | 2,360 | 2,434 | ||||||
American Axle & Manufacturing | ||||||||
6.250%, 03/15/2021 | 265 | 273 | ||||||
American Axle & Manufacturing Holdings | ||||||||
7.750%, 11/15/2019 | 595 | 663 | ||||||
| Description | Face Amount ($ Thousands) | Market Value ($ Thousands) | ||||||
AmeriGas Finance | ||||||||
7.000%, 05/20/2022 | $ | 7,922 | $ | 8,239 | ||||
Ameristar Casinos | ||||||||
7.500%, 04/15/2021 | 5,000 | 5,437 | ||||||
Armored Autogroup | ||||||||
9.250%, 11/01/2018 | 700 | 632 | ||||||
Ashtead Capital | ||||||||
6.500%, 07/15/2022 (A) | 3,110 | 3,289 | ||||||
Autonation | ||||||||
6.750%, 04/15/2018 | 1,400 | 1,584 | ||||||
Aventine (Escrow Security) PIK | ||||||||
0.000%, 10/15/2049 (B) (F) (G) (J) | 2,750 | 1 | ||||||
Avis Budget Car Rental | ||||||||
8.250%, 01/15/2019 | 1,900 | 2,061 | ||||||
Baker & Taylor Acquisitions | ||||||||
15.000%, 04/01/2017 (A) | 930 | 739 | ||||||
BC Mountain | ||||||||
7.000%, 02/01/2021 (A) | 530 | 526 | ||||||
Belo | ||||||||
7.750%, 06/01/2027 | 1,675 | 1,775 | ||||||
Block Communications | ||||||||
7.250%, 02/01/2020 (A) | 655 | 688 | ||||||
Bon-Ton Department Stores | ||||||||
8.000%, 06/15/2021 | 1,430 | 1,337 | ||||||
Brookfield Residential Properties | ||||||||
6.125%, 07/01/2022 (A) | 425 | 416 | ||||||
Burlington Coat Factory Warehouse | ||||||||
10.000%, 02/15/2019 | 6,985 | 7,771 | ||||||
Burlington Holdings | ||||||||
9.000%, 02/15/2018 (A) | 1,320 | 1,356 | ||||||
Cablevision Systems | ||||||||
8.625%, 09/15/2017 | 285 | 327 | ||||||
7.750%, 04/15/2018 | 1,192 | 1,335 | ||||||
Caesars Entertainment Operating | ||||||||
9.000%, 02/15/2020 | 2,825 | 2,648 | ||||||
8.500%, 02/15/2020 | 1,865 | 1,716 | ||||||
Carmike Cinemas | ||||||||
7.375%, 05/15/2019 | 750 | 808 | ||||||
CCO Holdings | ||||||||
7.375%, 06/01/2020 | 965 | 1,042 | ||||||
7.000%, 01/15/2019 | 1,385 | 1,466 | ||||||
5.250%, 03/15/2021 (A) | 620 | 595 | ||||||
5.125%, 02/15/2023 | 3,000 | 2,752 | ||||||
CCO Holdings LLC | ||||||||
5.250%, 09/30/2022 | 1,500 | 1,387 | ||||||
CDR DB Sub | ||||||||
7.750%, 10/15/2020 (A) | 1,600 | 1,600 | ||||||
Cedar Fair | ||||||||
5.250%, 03/15/2021 (A) | 500 | 477 | ||||||
Cequel Communications Holdings I | ||||||||
6.375%, 09/15/2020 (A) | 3,605 | 3,677 | ||||||
| 152 | SEI Institutional Managed Trust / Annual Report / September 30, 2013 |
| Description | Face Amount ($ Thousands) | Market Value ($ Thousands) | ||||||
Chassix | ||||||||
9.250%, 08/01/2018 (A) | $ | 725 | $ | 767 | ||||
Checkers Drive-In Restaurants | ||||||||
11.000%, 12/01/2017 (A) | 575 | 621 | ||||||
Chester Downs & Marina | ||||||||
9.250%, 02/01/2020 (A) | 4,130 | 4,161 | ||||||
Choctaw Resort Development Enterprise | ||||||||
7.250%, 11/15/2019 (A) | 963 | 949 | ||||||
Chrysler Group | ||||||||
8.250%, 06/15/2021 | 4,340 | 4,861 | ||||||
8.000%, 06/15/2019 | 820 | 906 | ||||||
Chukchansi Economic Development Authority | ||||||||
9.750%, 05/30/2020 (A) (B) | 1,658 | 945 | ||||||
Cinemark USA | ||||||||
7.375%, 06/15/2021 | 565 | 610 | ||||||
5.125%, 12/15/2022 | 1,390 | 1,303 | ||||||
4.875%, 06/01/2023 | 500 | 460 | ||||||
Claire’s Stores | ||||||||
9.000%, 03/15/2019 (A) | 1,590 | 1,761 | ||||||
8.875%, 03/15/2019 | 760 | 813 | ||||||
7.750%, 06/01/2020 (A) | 155 | 152 | ||||||
Clear Channel Communications | ||||||||
9.000%, 12/15/2019 | 529 | 518 | ||||||
9.000%, 03/01/2021 | 1,030 | 997 | ||||||
Clear Channel Worldwide Holdings | ||||||||
7.625%, 03/15/2020 | 2,895 | 2,989 | ||||||
7.625%, 03/15/2020 | 225 | 231 | ||||||
6.500%, 11/15/2022 | 4,275 | 4,360 | ||||||
6.500%, 11/15/2022 | 895 | 908 | ||||||
Cogeco Cable | ||||||||
4.875%, 05/01/2020 (A) | 1,050 | 1,003 | ||||||
Columbus International | ||||||||
11.500%, 11/20/2014 (A) | 950 | 1,021 | ||||||
Continental Rubber of America | ||||||||
4.500%, 09/15/2019 (A) | 845 | 881 | ||||||
Cooper-Standard Holding | ||||||||
7.375%, 04/01/2018 (A) | 1,355 | 1,362 | ||||||
CSC Holdings | ||||||||
8.625%, 02/15/2019 | 2,340 | 2,714 | ||||||
6.750%, 11/15/2021 | 2,225 | 2,381 | ||||||
CST Brands | ||||||||
5.000%, 05/01/2023 (A) | 350 | 330 | ||||||
Dana Holding | ||||||||
6.750%, 02/15/2021 | 1,108 | 1,177 | ||||||
6.500%, 02/15/2019 | 450 | 478 | ||||||
6.000%, 09/15/2023 | 155 | 154 | ||||||
5.375%, 09/15/2021 | 655 | 644 | ||||||
Dave & Buster’s | ||||||||
11.000%, 06/01/2018 | 2,665 | 2,945 | ||||||
Dave & Buster’s Parent | ||||||||
11.786%, 02/15/2016 (A) | 8,130 | 6,545 | ||||||
| Description | Face Amount ($ Thousands) | Market Value ($ Thousands) | ||||||
DCP | ||||||||
10.750%, 08/15/2015 (A) | $ | 2,220 | $ | 2,298 | ||||
Diamond Resorts | ||||||||
12.000%, 08/15/2018 | 3,000 | 3,330 | ||||||
DISH DBS | ||||||||
7.875%, 09/01/2019 | 2,740 | 3,124 | ||||||
6.750%, 06/01/2021 | 1,365 | 1,435 | ||||||
5.875%, 07/15/2022 | 3,200 | 3,152 | ||||||
5.125%, 05/01/2020 | 485 | 480 | ||||||
5.000%, 03/15/2023 | 2,015 | 1,869 | ||||||
DreamWorks Animation SKG | ||||||||
6.875%, 08/15/2020 (A) | 1,065 | 1,105 | ||||||
Easton-Bell Sports | ||||||||
9.750%, 12/01/2016 | 615 | 652 | ||||||
Eldorado Resorts | ||||||||
8.625%, 06/15/2019 (A) | 4,615 | 4,777 | ||||||
Empire Today | ||||||||
11.375%, 02/01/2017 (A) | 2,105 | 1,708 | ||||||
Expo Event Transco | ||||||||
9.000%, 06/15/2021 (A) | 700 | 696 | ||||||
Ferrellgas | ||||||||
6.500%, 05/01/2021 | 2,825 | 2,818 | ||||||
FGI Operating | ||||||||
7.875%, 05/01/2020 (A) | 695 | 723 | ||||||
Fontainebleau Las Vegas Holdings | ||||||||
10.250%, 06/15/2015 (A) (B) | 3,125 | 2 | ||||||
General Motors | ||||||||
4.875%, 10/02/2023 (A) | 2,260 | 2,204 | ||||||
Gestamp Funding Luxembourg | ||||||||
5.625%, 05/31/2020 (A) | 2,720 | 2,706 | ||||||
Gibson Brands | ||||||||
8.875%, 08/01/2018 (A) | 350 | 355 | ||||||
Goodyear Tire & Rubber | ||||||||
8.750%, 08/15/2020 | 390 | 448 | ||||||
8.250%, 08/15/2020 | 530 | 592 | ||||||
6.500%, 03/01/2021 | 2,700 | 2,747 | ||||||
Graton Economic Development Authority | ||||||||
9.625%, 09/01/2019 (A) | 3,700 | 4,070 | ||||||
GRD Holdings III | ||||||||
10.750%, 06/01/2019 (A) | 3,465 | 3,673 | ||||||
Greektown Superholdings | ||||||||
13.000%, 07/01/2015 | 1,840 | 1,918 | ||||||
13.000%, 07/01/2015 | 2,740 | 2,856 | ||||||
Gymboree | ||||||||
9.125%, 12/01/2018 | 830 | 811 | ||||||
Hanesbrands | ||||||||
6.375%, 12/15/2020 | 1,410 | 1,519 | ||||||
Harrah’s Operating | ||||||||
11.250%, 06/01/2017 | 530 | 538 | ||||||
10.000%, 12/15/2018 | 698 | 366 | ||||||
Hertz | ||||||||
7.500%, 10/15/2018 | 1,260 | 1,358 | ||||||
5.875%, 10/15/2020 | 620 | 639 | ||||||
| SEI Institutional Managed Trust / Annual Report / September 30, 2013 | 153 |
SCHEDULE OF INVESTMENTS
High Yield Bond Fund (Continued)
September 30, 2013
| Description | Face Amount ($ Thousands) | Market Value ($ Thousands) | ||||||
Hillman Group | ||||||||
10.875%, 06/01/2018 | $ | 2,925 | $ | 3,159 | ||||
Hilton Worldwide Finance LLC | ||||||||
5.625%, 10/15/2021 (A) | 520 | 523 | ||||||
Icahn Enterprises | ||||||||
6.000%, 08/01/2020 (A) | 2,850 | 2,850 | ||||||
International Automotive Components Group SL | ||||||||
9.125%, 06/01/2018 (A) | 1,650 | 1,700 | ||||||
inVentiv Health (A) | ||||||||
11.000%, 08/15/2018 | 370 | 297 | ||||||
10.750%, 08/15/2018 | 555 | 445 | ||||||
9.000%, 01/15/2018 | 750 | 754 | ||||||
Isle of Capri Casinos | ||||||||
5.875%, 03/15/2021 | 975 | 914 | ||||||
J Crew Group | ||||||||
8.125%, 03/01/2019 | 995 | 1,048 | ||||||
Jaguar Land Rover | ||||||||
8.125%, 05/15/2021 (A) | 670 | 745 | ||||||
Jaguar Land Rover Automotive | ||||||||
5.625%, 02/01/2023 (A) | 310 | 303 | ||||||
Jarden | ||||||||
7.500%, 01/15/2020 | 575 | 623 | ||||||
6.125%, 11/15/2022 | 500 | 518 | ||||||
JC Penney | ||||||||
6.375%, 10/15/2036 | 630 | 439 | ||||||
5.750%, 02/15/2018 | 855 | 671 | ||||||
Knowledge Learning | ||||||||
7.750%, 02/01/2015 (A) | 1,000 | 970 | ||||||
L Brands | ||||||||
6.625%, 04/01/2021 | 1,265 | 1,368 | ||||||
5.625%, 02/15/2022 | 1,175 | 1,204 | ||||||
Landry’s | ||||||||
9.375%, 05/01/2020 (A) | 1,640 | 1,730 | ||||||
Laureate Education | ||||||||
9.250%, 09/01/2019 (A) | 4,000 | 4,320 | ||||||
Libbey Glass | ||||||||
6.875%, 05/15/2020 | 599 | 638 | ||||||
Liberty Media LLC | ||||||||
8.250%, 02/01/2030 | 4,035 | 4,237 | ||||||
Live Nation Entertainment | ||||||||
7.000%, 09/01/2020 (A) | 2,550 | 2,662 | ||||||
LKQ | ||||||||
4.750%, 05/15/2023 (A) | 1,485 | 1,377 | ||||||
M/I Homes | ||||||||
8.625%, 11/15/2018 | 1,310 | 1,408 | ||||||
Marina District Finance | ||||||||
9.875%, 08/15/2018 | 1,265 | 1,373 | ||||||
McClatchy | ||||||||
9.000%, 12/15/2022 | 2,370 | 2,500 | ||||||
McGraw-Hill Global Education Holdings | ||||||||
9.750%, 04/01/2021 (A) | 370 | 392 | ||||||
MDC Partners | ||||||||
6.750%, 04/01/2020 (A) | 5,085 | 5,149 | ||||||
| Description | Face Amount ($ Thousands) | Market Value ($ Thousands) | ||||||
MGM Resorts International | ||||||||
11.375%, 03/01/2018 | $ | 1,390 | $ | 1,769 | ||||
8.625%, 02/01/2019 | 2,575 | 2,961 | ||||||
7.750%, 03/15/2022 | 470 | 509 | ||||||
6.750%, 10/01/2020 | 2,810 | 2,951 | ||||||
6.625%, 12/15/2021 | 700 | 725 | ||||||
Michaels FinCo Holdings | ||||||||
7.500%, 08/01/2018 (A) | 4,025 | 4,075 | ||||||
Michaels Stores | ||||||||
11.375%, 11/01/2016 | 280 | 287 | ||||||
7.750%, 11/01/2018 | 1,360 | 1,462 | ||||||
Midcontinent Communications & | ||||||||
6.250%, 08/01/2021 (A) | 400 | 402 | ||||||
Millennium (Escrow Security) | ||||||||
7.625%, 11/15/2026 (B) | 175 | — | ||||||
MISA Investments | ||||||||
8.625%, 08/15/2018 (A) | 970 | 977 | ||||||
Mohegan Tribal Gaming Authority | ||||||||
9.750%, 09/01/2021 (A) | 2,105 | 2,200 | ||||||
MTR Gaming Group | ||||||||
11.500%, 08/01/2019 | 5,545 | 6,086 | ||||||
Murphy Oil USA | ||||||||
6.000%, 08/15/2023 (A) | 1,025 | 1,020 | ||||||
Nara Cable Funding (A) | ||||||||
8.875%, 12/01/2018 | 1,130 | 1,192 | ||||||
8.875%, 12/01/2018 | 440 | 460 | ||||||
New Academy Finance PIK | ||||||||
8.000%, 06/15/2018 (A) | 1,100 | 1,128 | ||||||
New Look Bondco I | ||||||||
8.375%, 05/14/2018 (A) | 1,155 | 1,158 | ||||||
Nexstar Broadcasting | ||||||||
6.875%, 11/15/2020 (A) | 4,150 | 4,223 | ||||||
Norcraft | ||||||||
10.500%, 12/15/2015 | 865 | 894 | ||||||
Ono Finance II | ||||||||
10.875%, 07/15/2019 (A) | 690 | 735 | ||||||
Paris Las Vegas Holding | ||||||||
8.000%, 10/01/2020 (A) | 815 | 815 | ||||||
Party City Holdings | ||||||||
8.875%, 08/01/2020 (A) | 2,785 | 2,994 | ||||||
PC Nextco Holdings | ||||||||
8.750%, 08/15/2019 (A) | 320 | 320 | ||||||
Petco Animal Supplies | ||||||||
9.250%, 12/01/2018 (A) | 830 | 890 | ||||||
Pinnacle Entertainment | ||||||||
7.750%, 04/01/2022 | 595 | 626 | ||||||
Playa Resorts Holding BV | ||||||||
8.000%, 08/15/2020 (A) | 2,960 | 3,123 | ||||||
PNK Finance | ||||||||
6.375%, 08/01/2021 (A) | 835 | 852 | ||||||
Quebecor Media | ||||||||
5.750%, 01/15/2023 | 760 | 716 | ||||||
| 154 | SEI Institutional Managed Trust / Annual Report / September 30, 2013 |
| Description | Face Amount ($ Thousands) | Market Value ($ Thousands) | ||||||
Quebecor Media (Escrow Security) (B) | ||||||||
0.000%, 11/15/2013 (C) | $ | 1,725 | $ | 17 | ||||
0.000%, 03/15/2016 | 1,915 | 19 | ||||||
Quiksilver | ||||||||
7.875%, 08/01/2018 (A) | 1,310 | 1,366 | ||||||
Radio Systems | ||||||||
8.375%, 11/01/2019 (A) | 705 | 763 | ||||||
RCN Telecom Services | ||||||||
8.500%, 08/15/2020 (A) | 735 | 724 | ||||||
Reynolds Group Issuer | ||||||||
9.875%, 08/15/2019 | 7,995 | 8,675 | ||||||
9.000%, 04/15/2019 | 3,636 | 3,818 | ||||||
8.250%, 02/15/2021 | 1,085 | 1,093 | ||||||
6.875%, 02/15/2021 | 2,000 | 2,135 | ||||||
5.750%, 10/15/2020 | 4,145 | 4,161 | ||||||
Roadhouse Financing | ||||||||
10.750%, 10/15/2017 | 4,270 | 3,918 | ||||||
RSC Equipment Rental | ||||||||
8.250%, 02/01/2021 | 3,169 | 3,518 | ||||||
RSI Home Products | ||||||||
6.875%, 03/01/2018 (A) | 200 | 207 | ||||||
Sally Holdings | ||||||||
6.875%, 11/15/2019 | 1,193 | 1,306 | ||||||
5.750%, 06/01/2022 | 700 | 702 | ||||||
Schaeffler Finance BV (A) | ||||||||
8.500%, 02/15/2019 | 235 | 262 | ||||||
4.750%, 05/15/2021 | 670 | 650 | ||||||
Seminole Hard Rock Entertainment | ||||||||
5.875%, 05/15/2021 (A) | 250 | 240 | ||||||
Seneca Gaming | ||||||||
8.250%, 12/01/2018 (A) | 3,905 | 4,193 | ||||||
Serta Simmons Holdings | ||||||||
8.125%, 10/01/2020 (A) | 2,605 | 2,742 | ||||||
Service International | ||||||||
7.625%, 10/01/2018 | 375 | 425 | ||||||
7.500%, 04/01/2027 | 625 | 663 | ||||||
7.000%, 05/15/2019 | 550 | 586 | ||||||
5.375%, 01/15/2022 (A) | 795 | 758 | ||||||
Seven Seas Cruises S de RL | ||||||||
9.125%, 05/15/2019 | 1,375 | 1,499 | ||||||
Shingle Springs Tribal Gaming Authority | ||||||||
9.750%, 09/01/2021 (A) | 2,025 | 2,066 | ||||||
Sinclair Television Group | ||||||||
8.375%, 10/15/2018 | 275 | 301 | ||||||
6.125%, 10/01/2022 | 360 | 357 | ||||||
5.375%, 04/01/2021 | 3,705 | 3,520 | ||||||
Sirius XM Radio (A) | ||||||||
5.875%, 10/01/2020 | 1,000 | 1,009 | ||||||
5.750%, 08/01/2021 | 550 | 547 | ||||||
4.625%, 05/15/2023 | 2,700 | 2,464 | ||||||
4.250%, 05/15/2020 | 4,753 | 4,444 | ||||||
| Description | Face Amount ($ Thousands) | Market Value ($ Thousands) | ||||||
Sitel | ||||||||
11.000%, 08/01/2017 (A) | $ | 2,385 | $ | 2,546 | ||||
Six Flags Entertainment | ||||||||
5.250%, 01/15/2021 (A) | 3,200 | 3,048 | ||||||
Spectrum Brands | ||||||||
6.750%, 03/15/2020 | 400 | 425 | ||||||
Spectrum Brands Escrow (A) | ||||||||
6.625%, 11/15/2022 | 1,385 | 1,437 | ||||||
6.375%, 11/15/2020 | 515 | 537 | ||||||
Spencer Spirit Holdings | ||||||||
9.000%, 05/01/2018 (A) | 1,065 | 1,038 | ||||||
Stanadyne Holdings | ||||||||
12.000%, 02/15/2015 (D) | 1,700 | 952 | ||||||
Stanadyne Holdings, Ser 1 | ||||||||
10.000%, 08/15/2014 | 1,915 | 1,829 | ||||||
Suburban Propane Partners | ||||||||
7.500%, 10/01/2018 | 1,525 | 1,632 | ||||||
Tempur Sealy International | ||||||||
6.875%, 12/15/2020 | 1,470 | 1,536 | ||||||
Toys R Us | ||||||||
10.375%, 08/15/2017 | 2,015 | 1,939 | ||||||
Travelport LLC | ||||||||
11.875%, 09/01/2016 | 495 | 488 | ||||||
TRW Automotive | ||||||||
4.500%, 03/01/2021 (A) | 1,900 | 1,910 | ||||||
UCI International | ||||||||
8.625%, 02/15/2019 | 1,110 | 1,132 | ||||||
United Rentals North America | ||||||||
9.250%, 12/15/2019 | 420 | 470 | ||||||
8.375%, 09/15/2020 | 400 | 443 | ||||||
7.625%, 04/15/2022 | 325 | 353 | ||||||
7.375%, 05/15/2020 | 525 | 566 | ||||||
Unitymedia Hessen (A) | ||||||||
7.500%, 03/15/2019 | 1,500 | 1,620 | ||||||
5.500%, 01/15/2023 | 4,770 | 4,520 | ||||||
Univision Communications (A) | ||||||||
8.500%, 05/15/2021 | 2,805 | 3,071 | ||||||
7.875%, 11/01/2020 | 2,350 | 2,570 | ||||||
6.875%, 05/15/2019 | 250 | 268 | ||||||
5.125%, 05/15/2023 | 1,550 | 1,484 | ||||||
Vail Resorts | ||||||||
6.500%, 05/01/2019 | 1,190 | 1,261 | ||||||
Videotron | ||||||||
5.000%, 07/15/2022 | 2,275 | 2,161 | ||||||
Viking Cruises | ||||||||
8.500%, 10/15/2022 (A) | 160 | 177 | ||||||
Visant | ||||||||
10.000%, 10/01/2017 | 635 | 591 | ||||||
Visteon | ||||||||
6.750%, 04/15/2019 | 886 | 941 | ||||||
William Carter | ||||||||
5.250%, 08/15/2021 (A) | 145 | 145 | ||||||
WMG Acquisition | ||||||||
6.000%, 01/15/2021 (A) | 1,051 | 1,090 | ||||||
| SEI Institutional Managed Trust / Annual Report / September 30, 2013 | 155 |
SCHEDULE OF INVESTMENTS
High Yield Bond Fund (Continued)
September 30, 2013
| Description | Face Amount ($ Thousands) | Market Value ($ Thousands) | ||||||
Wok Acquisition | ||||||||
10.250%, 06/30/2020 (A) | $ | 2,930 | $ | 3,186 | ||||
Wolverine World Wide | ||||||||
6.125%, 10/15/2020 | 105 | 109 | ||||||
Woodside Homes | ||||||||
6.750%, 12/15/2021 (A) | 650 | 650 | ||||||
|
| |||||||
| 372,451 | ||||||||
|
| |||||||
Consumer Staples — 3.3% |
| |||||||
Albea Beauty Holdings | ||||||||
8.375%, 11/01/2019 (A) | 705 | 733 | ||||||
ARAMARK | ||||||||
5.750%, 03/15/2020 (A) | 4,435 | 4,479 | ||||||
B&G Foods | ||||||||
4.625%, 06/01/2021 | 1,460 | 1,394 | ||||||
BI-LO | ||||||||
8.625%, 09/15/2018 (A) | 945 | 959 | ||||||
Bumble Bee Holdco SCA PIK | ||||||||
9.625%, 03/15/2018 (A) | 2,250 | 2,340 | ||||||
Bumble Bee Holdings | ||||||||
9.000%, 12/15/2017 (A) | 2,471 | 2,675 | ||||||
Central Garden and Pet | ||||||||
8.250%, 03/01/2018 | 5,625 | 5,555 | ||||||
Chiquita Brands International | ||||||||
7.875%, 02/01/2021 (A) | 535 | 568 | ||||||
Constellation Brands | ||||||||
4.250%, 05/01/2023 | 1,230 | 1,129 | ||||||
3.750%, 05/01/2021 | 510 | 471 | ||||||
Cott Beverages | ||||||||
8.125%, 09/01/2018 | 950 | 1,028 | ||||||
Crestview DS Merger Sub II | ||||||||
10.000%, 09/01/2021 (A) | 1,071 | 1,103 | ||||||
Del Monte | ||||||||
7.625%, 02/15/2019 | 5,225 | 5,421 | ||||||
Elizabeth Arden | ||||||||
7.375%, 03/15/2021 | 200 | 214 | ||||||
ESAL | ||||||||
6.250%, 02/05/2023 (A) | 400 | 353 | ||||||
Fleming | ||||||||
10.125%, 04/01/2008 (B) | 1,043 | — | ||||||
Harbinger Group | ||||||||
7.875%, 07/15/2019 (A) | 4,150 | 4,295 | ||||||
Hawk Acquisition Sub | ||||||||
4.250%, 10/15/2020 (A) | 1,405 | 1,340 | ||||||
JBS USA (A) | ||||||||
8.250%, 02/01/2020 | 1,115 | 1,174 | ||||||
7.250%, 06/01/2021 | 700 | 696 | ||||||
KeHE Distributors | ||||||||
7.625%, 08/15/2021 (A) | 1,700 | 1,726 | ||||||
Land O’ Lakes | ||||||||
6.000%, 11/15/2022 (A) | 283 | 289 | ||||||
Michael Foods Holding PIK | ||||||||
8.500%, 07/15/2018 (A) | 1,000 | 1,038 | ||||||
| Description | Face Amount ($ Thousands) | Market Value ($ Thousands) | ||||||
New Albertsons | ||||||||
8.000%, 05/01/2031 | $ | 4,820 | $ | 3,964 | ||||
7.750%, 06/15/2026 | 160 | 130 | ||||||
7.450%, 08/01/2029 | 200 | 160 | ||||||
Pantry | ||||||||
8.375%, 08/01/2020 | 1,325 | 1,398 | ||||||
Pilgrim’s Pride | ||||||||
7.875%, 12/15/2018 | 935 | 1,017 | ||||||
Pinnacle Operating | ||||||||
9.000%, 11/15/2020 (A) | 145 | 148 | ||||||
Post Holdings | ||||||||
7.375%, 02/15/2022 | 1,325 | 1,393 | ||||||
7.375%, 02/15/2022 (A) | 70 | 74 | ||||||
Rite Aid | ||||||||
9.250%, 03/15/2020 | 4,445 | 5,045 | ||||||
7.700%, 02/15/2027 | 2,345 | 2,404 | ||||||
6.750%, 06/15/2021 (A) | 1,090 | 1,132 | ||||||
Smithfield Foods | ||||||||
6.625%, 08/15/2022 | 450 | 464 | ||||||
Sun Merger Sub | ||||||||
5.250%, 08/01/2018 (A) | 900 | 923 | ||||||
Supervalu | ||||||||
6.750%, 06/01/2021 (A) | 4,500 | 4,275 | ||||||
US Foods | ||||||||
8.500%, 06/30/2019 | 2,505 | 2,640 | ||||||
Vector Group | ||||||||
7.750%, 02/15/2021 | 2,595 | 2,686 | ||||||
|
| |||||||
| 66,833 | ||||||||
|
| |||||||
Energy — 9.8% | ||||||||
Access Midstream Partners | ||||||||
6.125%, 07/15/2022 | 225 | 231 | ||||||
4.875%, 05/15/2023 | 560 | 526 | ||||||
Antero Resources Finance | ||||||||
6.000%, 12/01/2020 | 1,480 | 1,495 | ||||||
Arch Coal | ||||||||
8.750%, 08/01/2016 | 220 | 220 | ||||||
7.250%, 06/15/2021 | 880 | 664 | ||||||
7.000%, 06/15/2019 | 450 | 349 | ||||||
Atlas Energy Holdings Operating | ||||||||
7.750%, 01/15/2021 (A) | 600 | 558 | ||||||
Atlas Pipeline Escrow | ||||||||
6.625%, 10/01/2020 (A) | 1,779 | 1,815 | ||||||
Atlas Pipeline Partners (A) | ||||||||
6.625%, 10/01/2020 | 545 | 556 | ||||||
5.875%, 08/01/2023 | 750 | 705 | ||||||
Atlas Resource Escrow | ||||||||
9.250%, 08/15/2021 (A) | 900 | 909 | ||||||
Atwood Oceanics | ||||||||
6.500%, 02/01/2020 | 350 | 367 | ||||||
Berry Petroleum | ||||||||
6.375%, 09/15/2022 | 330 | 332 | ||||||
Bill Barrett | ||||||||
7.625%, 10/01/2019 | 2,200 | 2,244 | ||||||
7.000%, 10/15/2022 | 1,500 | 1,451 | ||||||
| 156 | SEI Institutional Managed Trust / Annual Report / September 30, 2013 |
| Description | Face Amount ($ Thousands) | Market Value ($ Thousands) | ||||||
Bluewater Holding BV | ||||||||
3.268%, 07/17/2014 (E) | $ | 1,200 | $ | 1,191 | ||||
BreitBurn Energy Partners | ||||||||
8.625%, 10/15/2020 | 950 | 1,002 | ||||||
7.875%, 04/15/2022 (A) | 4,565 | 4,554 | ||||||
Calumet Specialty Products Partners | ||||||||
9.375%, 05/01/2019 | 2,115 | 2,321 | ||||||
Carrizo Oil & Gas | ||||||||
7.500%, 09/15/2020 | 375 | 397 | ||||||
Chaparral Energy | ||||||||
8.250%, 09/01/2021 | 1,830 | 1,931 | ||||||
Chesapeake Energy | ||||||||
6.625%, 08/15/2020 | 2,530 | 2,720 | ||||||
5.750%, 03/15/2023 | 1,020 | 1,023 | ||||||
3.250%, 03/15/2016 | 165 | 166 | ||||||
Chesapeake Midstream Partners | ||||||||
5.875%, 04/15/2021 | 305 | 313 | ||||||
Comstock Resources | ||||||||
7.750%, 04/01/2019 | 1,325 | 1,371 | ||||||
Consol Energy | ||||||||
8.000%, 04/01/2017 | 650 | 691 | ||||||
Continental Resources | ||||||||
5.000%, 09/15/2022 | 810 | 815 | ||||||
4.500%, 04/15/2023 | 500 | 491 | ||||||
Crestwood Midstream Partners | ||||||||
7.750%, 04/01/2019 | 3,825 | 4,016 | ||||||
Crosstex Energy | ||||||||
8.875%, 02/15/2018 | 1,595 | 1,695 | ||||||
7.125%, 06/01/2022 | 1,150 | 1,184 | ||||||
Denbury Resources | ||||||||
8.250%, 02/15/2020 | 1,000 | 1,097 | ||||||
Dresser-Rand Group | ||||||||
6.500%, 05/01/2021 | 1,850 | 1,961 | ||||||
Drill Rigs Holdings | ||||||||
6.500%, 10/01/2017 (A) | 1,385 | 1,430 | ||||||
Eagle Rock Energy Partners | ||||||||
8.375%, 06/01/2019 | 6,405 | 6,405 | ||||||
El Paso | ||||||||
7.750%, 01/15/2032 | 320 | 327 | ||||||
7.250%, 06/01/2018 | 310 | 348 | ||||||
7.000%, 06/15/2017 | 40 | 45 | ||||||
Endeavor Energy Resources | ||||||||
7.000%, 08/15/2021 (A) | 3,200 | 3,168 | ||||||
Energy XXI Gulf Coast | ||||||||
7.500%, 12/15/2021 (A) | 2,055 | 2,029 | ||||||
EP Energy | ||||||||
9.375%, 05/01/2020 | 1,050 | 1,181 | ||||||
7.750%, 09/01/2022 | 735 | 797 | ||||||
6.875%, 05/01/2019 | 645 | 689 | ||||||
EV Energy Partners | ||||||||
8.000%, 04/15/2019 | 1,310 | 1,310 | ||||||
Exterran Holdings | ||||||||
7.250%, 12/01/2018 | 3,650 | 3,864 | ||||||
| Description | Face Amount ($ Thousands) | Market Value ($ Thousands) | ||||||
Exterran Partners | ||||||||
6.000%, 04/01/2021 (A) | $ | 1,940 | $ | 1,882 | ||||
Foresight Energy | ||||||||
7.875%, 08/15/2021 (A) | 1,385 | 1,385 | ||||||
Forest Oil | ||||||||
7.500%, 09/15/2020 | 8,440 | 8,398 | ||||||
7.250%, 06/15/2019 | 635 | 633 | ||||||
Genesis Energy | ||||||||
5.750%, 02/15/2021 | 1,585 | 1,553 | ||||||
Gibson Energy | ||||||||
6.750%, 07/15/2021 (A) | 3,100 | 3,201 | ||||||
Halcon Resources | ||||||||
9.250%, 02/15/2022 (A) | 265 | 276 | ||||||
8.875%, 05/15/2021 | 11,527 | 11,815 | ||||||
Hercules Offshore (A) | ||||||||
8.750%, 07/15/2021 | 355 | 376 | ||||||
7.500%, 10/01/2021 | 675 | 675 | ||||||
Hiland Partners | ||||||||
7.250%, 10/01/2020 (A) | 1,919 | 2,001 | ||||||
Inergy Midstream | ||||||||
6.000%, 12/15/2020 (A) | 3,200 | 3,176 | ||||||
IronGate Energy Services | ||||||||
11.000%, 07/01/2018 (A) | 400 | 396 | ||||||
James River Coal | ||||||||
7.875%, 04/01/2019 | 385 | 121 | ||||||
Key Energy Services | ||||||||
6.750%, 03/01/2021 | 1,515 | 1,500 | ||||||
Kodiak Oil & Gas | ||||||||
8.125%, 12/01/2019 | 2,235 | 2,442 | ||||||
5.500%, 01/15/2021 (A) | 15 | 15 | ||||||
5.500%, 02/01/2022 (A) | 110 | 107 | ||||||
Laredo Petroleum | ||||||||
9.500%, 02/15/2019 | 1,646 | 1,827 | ||||||
7.375%, 05/01/2022 | 765 | 811 | ||||||
Legacy Reserves (A) | ||||||||
8.000%, 12/01/2020 | 2,040 | 2,060 | ||||||
6.625%, 12/01/2021 | 1,460 | 1,365 | ||||||
Linn Energy | ||||||||
8.625%, 04/15/2020 | 285 | 295 | ||||||
7.750%, 02/01/2021 | 1,820 | 1,829 | ||||||
6.750%, 05/15/2019 | 4,295 | 4,048 | ||||||
6.500%, 05/15/2019 | 40 | 38 | ||||||
MarkWest Energy Partners | ||||||||
5.500%, 02/15/2023 | 730 | 732 | ||||||
MEG Energy (A) | ||||||||
7.000%, 03/31/2024 | 325 | 327 | ||||||
6.500%, 03/15/2021 | 616 | 621 | ||||||
6.375%, 01/30/2023 | 4,180 | 4,096 | ||||||
Memorial Production Partners | ||||||||
7.625%, 05/01/2021 | 485 | 469 | ||||||
Midstates Petroleum (A) | ||||||||
10.750%, 10/01/2020 | 2,963 | 3,111 | ||||||
9.250%, 06/01/2021 | 2,305 | 2,276 | ||||||
Milagro Oil & Gas | ||||||||
10.500%, 05/15/2016 | 1,700 | 1,284 | ||||||
| SEI Institutional Managed Trust / Annual Report / September 30, 2013 | 157 |
SCHEDULE OF INVESTMENTS
High Yield Bond Fund (Continued)
September 30, 2013
| Description | Face Amount ($ Thousands) | Market Value ($ Thousands) | ||||||
Millennium Offshore Services Superholdings | ||||||||
9.500%, 02/15/2018 (A) | $ | 925 | $ | 955 | ||||
Newfield Exploration | ||||||||
6.875%, 02/01/2020 | 625 | 656 | ||||||
Northern Oil and Gas | ||||||||
8.000%, 06/01/2020 | 1,695 | 1,699 | ||||||
NuStar Logistics | ||||||||
6.750%, 02/01/2021 | 1,000 | 1,018 | ||||||
Oasis Petroleum | ||||||||
6.875%, 03/15/2022 (A) | 2,045 | 2,157 | ||||||
Ocean Rig UDW | ||||||||
9.500%, 04/27/2016 (A) | 2,600 | 2,756 | ||||||
Offshore Group Investments | ||||||||
7.125%, 04/01/2023 | 660 | 644 | ||||||
Pacific Drilling | ||||||||
5.375%, 06/01/2020 (A) | 900 | 878 | ||||||
Parker Drilling | ||||||||
9.125%, 04/01/2018 | 1,720 | 1,840 | ||||||
7.500%, 08/01/2020 (A) | 3,710 | 3,710 | ||||||
PDC Energy | ||||||||
7.750%, 10/15/2022 | 2,425 | 2,571 | ||||||
Peabody Energy | ||||||||
6.250%, 11/15/2021 | 1,725 | 1,673 | ||||||
6.000%, 11/15/2018 | 840 | 838 | ||||||
Penn Virginia Resource Partners | ||||||||
8.375%, 06/01/2020 | 2,980 | 3,099 | ||||||
8.250%, 04/15/2018 | 1,000 | 1,038 | ||||||
6.500%, 05/15/2021 (A) | 100 | 94 | ||||||
Pioneer Drilling | ||||||||
9.875%, 03/15/2018 | 915 | 988 | ||||||
Plains Exploration & Production | ||||||||
6.875%, 02/15/2023 | 800 | 858 | ||||||
6.500%, 11/15/2020 | 1,480 | 1,588 | ||||||
QR Energy | ||||||||
9.250%, 08/01/2020 | 665 | 682 | ||||||
Range Resources | ||||||||
5.000%, 08/15/2022 | 2,910 | 2,815 | ||||||
5.000%, 03/15/2023 | 3,595 | 3,451 | ||||||
Regency Energy Partners | ||||||||
5.500%, 04/15/2023 | 510 | 490 | ||||||
4.500%, 11/01/2023 (A) | 300 | 272 | ||||||
RKI Exploration & Production | ||||||||
8.500%, 08/01/2021 (A) | 480 | 482 | ||||||
Rockies Express Pipeline (A) | ||||||||
6.000%, 01/15/2019 | 1,975 | 1,738 | ||||||
5.625%, 04/15/2020 | 725 | 613 | ||||||
Rosetta Resources | ||||||||
5.625%, 05/01/2021 | 1,415 | 1,344 | ||||||
Sabine Pass Liquefaction (A) | ||||||||
5.625%, 02/01/2021 | 3,665 | 3,587 | ||||||
5.625%, 04/15/2023 | 5,665 | 5,431 | ||||||
Samson Investment | ||||||||
10.000%, 02/15/2020 (A) | 1,475 | 1,564 | ||||||
| Description | Face Amount ($ Thousands) | Market Value ($ Thousands) | ||||||
SandRidge Energy | ||||||||
8.125%, 10/15/2022 | $ | 2,369 | $ | 2,393 | ||||
7.500%, 03/15/2021 | 3,686 | 3,723 | ||||||
7.500%, 02/15/2023 | 5,675 | 5,618 | ||||||
Sea Trucks Group | ||||||||
9.000%, 03/26/2018 (A) | 2,050 | 1,881 | ||||||
Summit Midstream Holdings | ||||||||
7.500%, 07/01/2021 (A) | 1,175 | 1,213 | ||||||
Tesoro Logistics | ||||||||
6.125%, 10/15/2021 | 1,230 | 1,236 | ||||||
5.875%, 10/01/2020 | 650 | 648 | ||||||
Trinidad Drilling | ||||||||
7.875%, 01/15/2019 (A) | 250 | 264 | ||||||
Vanguard Natural Resources | ||||||||
7.875%, 04/01/2020 | 790 | 800 | ||||||
Western Refining | ||||||||
6.250%, 04/01/2021 | 250 | 245 | ||||||
Whiting Petroleum | ||||||||
5.750%, 03/15/2021 | 1,395 | 1,433 | ||||||
WPX Energy | ||||||||
6.000%, 01/15/2022 | 245 | 248 | ||||||
|
| |||||||
| 199,326 | ||||||||
|
| |||||||
Financials — 6.6% | ||||||||
Ally Financial | ||||||||
8.000%, 11/01/2031 | 1,090 | 1,226 | ||||||
6.250%, 12/01/2017 | 3,525 | 3,769 | ||||||
5.500%, 02/15/2017 | 1,795 | 1,884 | ||||||
4.750%, 09/10/2018 | 1,750 | 1,742 | ||||||
2.946%, 07/18/2016 (E) | 445 | 448 | ||||||
American Equity Investment Life Holding | ||||||||
6.625%, 07/15/2021 | 1,125 | 1,164 | ||||||
American International Group | ||||||||
8.175%, 05/15/2058 (E) | 2,105 | 2,464 | ||||||
A-S -Issuer Subsidiary | ||||||||
7.875%, 12/15/2020 (A) | 2,170 | 2,213 | ||||||
Bank of America (E) | ||||||||
8.000%, 12/29/2049 | 1,675 | 1,822 | ||||||
5.200%, 12/29/2049 | 1,000 | 875 | ||||||
Barclays Bank | ||||||||
7.625%, 11/21/2022 | 1,310 | 1,299 | ||||||
CEVA Group | ||||||||
11.625%, 10/01/2016 (A) | 2,535 | 2,611 | ||||||
CIT Group | ||||||||
6.625%, 04/01/2018 (A) | 250 | 275 | ||||||
5.500%, 02/15/2019 (A) | 2,410 | 2,530 | ||||||
5.250%, 03/15/2018 | 1,360 | 1,425 | ||||||
4.250%, 08/15/2017 | 615 | 627 | ||||||
City National Bank | ||||||||
9.000%, 08/12/2019 | 3,384 | 3,984 | ||||||
Corrections Corp of America‡ | ||||||||
4.125%, 04/01/2020 | 810 | 767 | ||||||
Credit Acceptance | ||||||||
9.125%, 02/01/2017 | 2,000 | 2,120 | ||||||
| 158 | SEI Institutional Managed Trust / Annual Report / September 30, 2013 |
| Description | Face Amount ($ Thousands) | Market Value ($ Thousands) | ||||||
Credit Suisse | ||||||||
6.500%, 08/08/2023 (A) | $ | 1,370 | $ | 1,385 | ||||
Denali Borrower | ||||||||
5.625%, 10/15/2020 (A) | 1,055 | 1,025 | ||||||
E*TRADE Financial | ||||||||
6.375%, 11/15/2019 | 1,380 | 1,470 | ||||||
Fidelity & Guaranty Life Holdings | ||||||||
6.375%, 04/01/2021 (A) | 950 | 964 | ||||||
Fifth Third Bancorp | ||||||||
5.100%, 12/31/2049 (E) | 665 | 579 | ||||||
General Motors Financial (A) | ||||||||
4.250%, 05/15/2023 | 305 | 279 | ||||||
3.250%, 05/15/2018 | 170 | 165 | ||||||
2.750%, 05/15/2016 | 305 | 304 | ||||||
Geo Group ‡ (A) | ||||||||
5.875%, 01/15/2022 | 625 | 617 | ||||||
5.125%, 04/01/2023 | 1,220 | 1,116 | ||||||
HBOS Capital Funding | ||||||||
6.071%, 06/30/2049 (A) (E) | 3,100 | 3,034 | ||||||
Hockey Merger Sub 2 | ||||||||
7.875%, 10/01/2021 (A) | 4,320 | 4,325 | ||||||
Hub International | ||||||||
8.125%, 10/15/2018 (A) | 2,835 | 3,165 | ||||||
Icahn Enterprises | ||||||||
8.000%, 01/15/2018 | 3,000 | 3,142 | ||||||
7.750%, 01/15/2016 | 1,500 | 1,549 | ||||||
Interactive Data | ||||||||
10.250%, 08/01/2018 | 930 | 1,030 | ||||||
International Lease Finance | ||||||||
2.204%, 06/15/2016 (E) | 730 | 726 | ||||||
Jefferies Finance | ||||||||
7.375%, 04/01/2020 (A) | 765 | 757 | ||||||
Jefferies LoanCore | ||||||||
6.875%, 06/01/2020 (A) | 875 | 858 | ||||||
JPMorgan Chase | ||||||||
6.000%, 12/29/2049 (E) | 1,060 | 994 | ||||||
KCG Holdings | ||||||||
8.250%, 06/15/2018 (A) | 1,665 | 1,640 | ||||||
Kennedy-Wilson | ||||||||
8.750%, 04/01/2019 | 3,515 | 3,796 | ||||||
Lancashire Holdings | ||||||||
5.700%, 10/01/2022 (A) | 1,040 | 945 | ||||||
Liberty Mutual Group | ||||||||
7.000%, 03/15/2037 (A) (E) | 1,365 | 1,385 | ||||||
Lloyds Banking Group | ||||||||
6.267%, 11/14/2016 (A) (E) | 1,265 | 1,148 | ||||||
Marlin Water Trust II | ||||||||
6.310%, 07/15/2003 (A) (B) | 4,200 | — | ||||||
Mattamy Group | ||||||||
6.500%, 11/15/2020 (A) | 1,380 | 1,356 | ||||||
MPH Intermediate Holding 2 | ||||||||
8.375%, 08/01/2018 (A) | 675 | 691 | ||||||
National Life Insurance | ||||||||
10.500%, 09/15/2039 (A) | 990 | 1,391 | ||||||
| Description | Face Amount ($ Thousands) | Market Value ($ Thousands) | ||||||
Nationstar Mortgage | ||||||||
9.625%, 05/01/2019 | $ | 4,230 | $ | 4,706 | ||||
6.500%, 08/01/2018 | 5,245 | 5,271 | ||||||
6.500%, 07/01/2021 | 4,525 | 4,333 | ||||||
6.500%, 06/01/2022 | 1,120 | 1,061 | ||||||
NSG Holdings | ||||||||
7.750%, 12/15/2025 (A) | 2,000 | 2,100 | ||||||
Nuveen Investments (A) | ||||||||
9.500%, 10/15/2020 | 6,290 | 6,148 | ||||||
9.125%, 10/15/2017 | 2,220 | 2,181 | ||||||
Onex USI Acquisition | ||||||||
7.750%, 01/15/2021 (A) | 3,630 | 3,630 | ||||||
Oxford Finance | ||||||||
7.250%, 01/15/2018 (A) | 1,025 | 1,053 | ||||||
Peninsula Gaming | ||||||||
8.375%, 02/15/2018 (A) | 3,250 | 3,510 | ||||||
PHH | ||||||||
7.375%, 09/01/2019 | 710 | 746 | ||||||
6.375%, 08/15/2021 | 3,475 | 3,362 | ||||||
PNC Preferred Funding Trust II | ||||||||
1.477%, 03/29/2049 (A) (E) | 5,870 | 5,019 | ||||||
Realogy (A) | ||||||||
7.875%, 02/15/2019 | 1,035 | 1,131 | ||||||
7.625%, 01/15/2020 | 530 | 591 | ||||||
RHP Hotel Properties‡ | ||||||||
5.000%, 04/15/2021 (A) | 1,318 | 1,236 | ||||||
Rivers Pittsburgh Borrower | ||||||||
9.500%, 06/15/2019 (A) | 554 | 604 | ||||||
Snoqualmie Entertainment Authority (A) | ||||||||
9.125%, 02/01/2015 | 810 | 810 | ||||||
4.147%, 02/01/2014 (E) | 450 | 446 | ||||||
Springleaf Finance | ||||||||
6.000%, 06/01/2020 (A) | 900 | 864 | ||||||
TransUnion Holding | ||||||||
9.625%, 06/15/2018 | 625 | 677 | ||||||
8.125%, 06/15/2018 | 813 | 862 | ||||||
UPCB Finance III | ||||||||
6.625%, 07/01/2020 (A) | 650 | 689 | ||||||
USB Realty | ||||||||
1.415%, 12/29/2049 (A) (E) | 5,800 | 4,930 | ||||||
Wilton Re Finance | ||||||||
5.875%, 03/30/2033 (A) (E) | 1,900 | 1,905 | ||||||
XL Capital | ||||||||
6.500%, 12/31/2049 (E) | 2,210 | 2,116 | ||||||
|
| |||||||
| 133,062 | ||||||||
|
| |||||||
Health Care — 6.1% | ||||||||
Acadia Healthcare | ||||||||
12.875%, 11/01/2018 | 1,250 | 1,506 | ||||||
6.125%, 03/15/2021 (A) | 1,000 | 1,010 | ||||||
Accellent | ||||||||
10.000%, 11/01/2017 | 905 | 833 | ||||||
8.375%, 02/01/2017 | 855 | 890 | ||||||
| SEI Institutional Managed Trust / Annual Report / September 30, 2013 | 159 |
SCHEDULE OF INVESTMENTS
High Yield Bond Fund (Continued)
September 30, 2013
| Description | Face Amount ($ Thousands) | Market Value ($ Thousands) | ||||||
Alere | ||||||||
6.500%, 06/15/2020 (A) | $ | 1,025 | $ | 1,016 | ||||
Amsurg | ||||||||
5.625%, 11/30/2020 | 1,795 | 1,795 | ||||||
Apria Healthcare Group | ||||||||
12.375%, 11/01/2014 | 1,466 | 1,475 | ||||||
Aurora Diagnostics Holdings | ||||||||
10.750%, 01/15/2018 | 5,185 | 3,189 | ||||||
Biomet | ||||||||
6.500%, 08/01/2020 | 4,411 | 4,554 | ||||||
6.500%, 10/01/2020 | 2,030 | 2,058 | ||||||
CHS | ||||||||
8.000%, 11/15/2019 | 1,075 | 1,127 | ||||||
7.125%, 07/15/2020 | 4,305 | 4,348 | ||||||
DaVita | ||||||||
6.625%, 11/01/2020 | 4,311 | 4,580 | ||||||
6.375%, 11/01/2018 | 235 | 247 | ||||||
5.750%, 08/15/2022 | 825 | 816 | ||||||
DJO Finance | ||||||||
9.875%, 04/15/2018 | 2,080 | 2,205 | ||||||
8.750%, 03/15/2018 | 480 | 522 | ||||||
7.750%, 04/15/2018 | 2,780 | 2,752 | ||||||
Fresenius Medical Care US Finance II | ||||||||
5.625%, 07/31/2019 (A) | 2,145 | 2,236 | ||||||
HCA | ||||||||
7.875%, 02/15/2020 | 3,735 | 4,027 | ||||||
7.500%, 02/15/2022 | 4,910 | 5,389 | ||||||
6.500%, 02/15/2020 | 910 | 986 | ||||||
5.875%, 03/15/2022 | 2,050 | 2,106 | ||||||
HCA Holdings | ||||||||
7.750%, 05/15/2021 | 2,435 | 2,590 | ||||||
6.250%, 02/15/2021 | 560 | 569 | ||||||
Health Management Associates | ||||||||
7.375%, 01/15/2020 | 1,450 | 1,589 | ||||||
Healthcare Technology Intermediate | ||||||||
7.375%, 09/01/2018 (A) | 1,585 | 1,619 | ||||||
Healthsouth | ||||||||
8.125%, 02/15/2020 | 680 | 740 | ||||||
7.750%, 09/15/2022 | 540 | 579 | ||||||
Hologic | ||||||||
6.250%, 08/01/2020 | 2,785 | 2,900 | ||||||
Hospira | ||||||||
5.800%, 08/12/2023 | 145 | 147 | ||||||
5.200%, 08/12/2020 | 145 | 147 | ||||||
Immucor | ||||||||
11.125%, 08/15/2019 | 5,465 | 6,011 | ||||||
IMS Health | ||||||||
6.000%, 11/01/2020 (A) | 785 | 802 | ||||||
INC Research | ||||||||
11.500%, 07/15/2019 (A) | 2,805 | 3,015 | ||||||
Kindred Healthcare | ||||||||
8.250%, 06/01/2019 | 3,085 | 3,286 | ||||||
| Description | Face Amount ($ Thousands) | Market Value ($ Thousands) | ||||||
Kinetic Concepts | ||||||||
10.500%, 11/01/2018 | $ | 2,280 | $ | 2,517 | ||||
Lantheus Medical Imaging | ||||||||
9.750%, 05/15/2017 | 1,385 | 1,240 | ||||||
Monitronics International | ||||||||
9.125%, 04/01/2020 | 3,975 | 4,164 | ||||||
Multiplan | ||||||||
9.875%, 09/01/2018 (A) | 560 | 619 | ||||||
Physio-Control International | ||||||||
9.875%, 01/15/2019 (A) | 333 | 373 | ||||||
Radiation Therapy Services | ||||||||
9.875%, 04/15/2017 | 985 | 704 | ||||||
8.875%, 01/15/2017 | 610 | 610 | ||||||
Radnet Management | ||||||||
10.375%, 04/01/2018 | 975 | 1,031 | ||||||
Sky Growth Acquisition | ||||||||
7.375%, 10/15/2020 (A) | 1,255 | 1,297 | ||||||
Symbion PIK | ||||||||
11.000%, 08/23/2015 | 424 | 423 | ||||||
Tenet Healthcare | ||||||||
8.125%, 04/01/2022 (A) | 7,225 | 7,541 | ||||||
8.000%, 08/01/2020 | 2,160 | 2,290 | ||||||
6.750%, 02/01/2020 | 480 | 479 | ||||||
6.000%, 10/01/2020 (A) | 2,170 | 2,219 | ||||||
4.750%, 06/01/2020 | 1,125 | 1,083 | ||||||
4.500%, 04/01/2021 | 1,000 | 937 | ||||||
Trinseo Materials Operating SCA | ||||||||
8.750%, 02/01/2019 (A) | 5,015 | 4,977 | ||||||
Truven Health Analytics | ||||||||
10.625%, 06/01/2020 | 495 | 540 | ||||||
United Surgical Partners International | ||||||||
9.000%, 04/01/2020 | 1,350 | 1,482 | ||||||
Valeant Pharmaceuticals International (A) | ||||||||
7.250%, 07/15/2022 | 1,033 | 1,100 | ||||||
7.000%, 10/01/2020 | 1,627 | 1,725 | ||||||
6.750%, 08/15/2021 | 645 | 671 | ||||||
Vanguard Health Holding II | ||||||||
7.750%, 02/01/2019 | 2,000 | 2,145 | ||||||
VPI Escrow | ||||||||
6.375%, 10/15/2020 (A) | 720 | 749 | ||||||
VPII Escrow (A) | ||||||||
7.500%, 07/15/2021 | 5,335 | 5,748 | ||||||
6.750%, 08/15/2018 | 2,425 | 2,595 | ||||||
|
| |||||||
| 122,920 | ||||||||
|
| |||||||
Industrials — 8.4% | ||||||||
ACCO Brands | ||||||||
6.750%, 04/30/2020 | 965 | 966 | ||||||
Actuant | ||||||||
5.625%, 06/15/2022 | 3,000 | 3,000 | ||||||
ADS Waste Holdings | ||||||||
8.250%, 10/01/2020 (A) | 550 | 580 | ||||||
| 160 | SEI Institutional Managed Trust / Annual Report / September 30, 2013 |
| Description | Face Amount ($ Thousands) | Market Value ($ Thousands) | ||||||
ADT | ||||||||
6.250%, 10/15/2021 (A) | $ | 1,465 | $ | 1,487 | ||||
3.500%, 07/15/2022 | 250 | 211 | ||||||
Air Medical Group Holdings | ||||||||
9.250%, 11/01/2018 | 3,405 | 3,660 | ||||||
Aircastle | ||||||||
7.625%, 04/15/2020 | 830 | 917 | ||||||
6.750%, 04/15/2017 | 285 | 305 | ||||||
Aleris International | ||||||||
10.000%, 12/15/2016 (B) | 1,800 | — | ||||||
Aleris International PIK | ||||||||
9.000%, 12/15/2014 (B) | 725 | — | ||||||
Algeco Scotsman Global Finance (A) | ||||||||
10.750%, 10/15/2019 | 2,840 | 2,854 | ||||||
8.500%, 10/15/2018 | 1,275 | 1,348 | ||||||
Alion Science & Technology PIK | ||||||||
12.000%, 11/01/2014 | 2,099 | 2,120 | ||||||
Alphabet Holding PIK | ||||||||
7.750%, 11/01/2017 | 3,200 | 3,288 | ||||||
American Builders & Contractors Supply | ||||||||
5.625%, 04/15/2021 (A) | 1,340 | 1,318 | ||||||
Amsted Industries | ||||||||
8.125%, 03/15/2018 (A) | 320 | 339 | ||||||
Anixter | ||||||||
5.625%, 05/01/2019 | 455 | 469 | ||||||
APX Group | ||||||||
8.750%, 12/01/2020 (A) | 3,695 | 3,630 | ||||||
ArvinMeritor | ||||||||
10.625%, 03/15/2018 | 255 | 275 | ||||||
Atkore International | ||||||||
9.875%, 01/01/2018 | 2,680 | 2,894 | ||||||
Avis Budget Car Rental | ||||||||
5.500%, 04/01/2023 | 2,283 | 2,112 | ||||||
4.875%, 11/15/2017 | 55 | 56 | ||||||
BE Aerospace | ||||||||
6.875%, 10/01/2020 | 840 | 918 | ||||||
Belden | ||||||||
5.500%, 09/01/2022 (A) | 1,135 | 1,095 | ||||||
Boart Longyear Management Pty (A) | ||||||||
10.000%, 10/01/2018 | 1,063 | 1,074 | ||||||
7.000%, 04/01/2021 | 3,590 | 2,657 | ||||||
Bombardier (A) | ||||||||
6.125%, 01/15/2023 | 1,340 | 1,340 | ||||||
5.750%, 03/15/2022 | 825 | 819 | ||||||
Brickman Group Holdings | ||||||||
9.125%, 11/01/2018 (A) | 69 | 74 | ||||||
Builders FirstSource | ||||||||
7.625%, 06/01/2021 (A) | 1,448 | 1,448 | ||||||
Building Materials Corp of America (A) | ||||||||
6.875%, 08/15/2018 | 1,550 | 1,657 | ||||||
6.750%, 05/01/2021 | 620 | 667 | ||||||
| Description | Face Amount ($ Thousands) | Market Value ($ Thousands) | ||||||
Case New Holland | ||||||||
7.875%, 12/01/2017 | $ | 390 | $ | 453 | ||||
CDW | ||||||||
8.500%, 04/01/2019 | 1,715 | 1,895 | ||||||
Cemex Espana Luxembourg | ||||||||
9.250%, 05/12/2020 (A) | 1,115 | 1,199 | ||||||
Ceridian (A) | ||||||||
11.000%, 03/15/2021 | 300 | 347 | ||||||
8.875%, 07/15/2019 | 1,600 | 1,832 | ||||||
CEVA Group | ||||||||
8.375%, 12/01/2017 (A) | 1,210 | 1,219 | ||||||
CHC Helicopter | ||||||||
9.375%, 06/01/2021 | 1,965 | 1,955 | ||||||
Clean Harbors | ||||||||
5.250%, 08/01/2020 | 3,705 | 3,668 | ||||||
CNH Capital | ||||||||
3.625%, 04/15/2018 | 815 | 811 | ||||||
Continental Airlines | ||||||||
7.339%, 04/19/2014 | 217 | 220 | ||||||
Continental Airlines Pass-Through Trust, Ser 2009-2, Cl B | ||||||||
9.250%, 05/10/2017 | 167 | 183 | ||||||
CPG Merger Sub | ||||||||
8.000%, 10/01/2021 (A) | 2,975 | 3,020 | ||||||
DAE Aviation Holdings | ||||||||
11.250%, 08/01/2015 (A) | 1,500 | 1,500 | ||||||
Delta Air Lines Pass-Through Trust, Ser 2011-1, Cl B | �� | |||||||
7.125%, 10/15/2014 | 1,800 | 1,827 | ||||||
DigitalGlobe | ||||||||
5.250%, 02/01/2021 (A) | 1,930 | 1,843 | ||||||
Emergency Medical Services | ||||||||
8.125%, 06/01/2019 | 1,989 | 2,148 | ||||||
Esterline Technologies | ||||||||
7.000%, 08/01/2020 | 300 | 321 | ||||||
Gardner Denver | ||||||||
6.875%, 08/15/2021 (A) | 325 | 321 | ||||||
GenCorp | ||||||||
7.125%, 03/15/2021 (A) | 1,130 | 1,184 | ||||||
General Cable | ||||||||
5.750%, 10/01/2022 (A) | 865 | 828 | ||||||
Gibraltar Industries | ||||||||
6.250%, 02/01/2021 | 787 | 795 | ||||||
Global A&T Electronics | ||||||||
10.000%, 02/01/2019 (A) | 200 | 170 | ||||||
Great Lakes Dredge & Dock | ||||||||
7.375%, 02/01/2019 | 1,087 | 1,079 | ||||||
Griffon | ||||||||
7.125%, 04/01/2018 | 570 | 604 | ||||||
H&E Equipment Services | ||||||||
7.000%, 09/01/2022 | 2,005 | 2,135 | ||||||
HD Supply | ||||||||
11.500%, 07/15/2020 | 1,465 | 1,747 | ||||||
11.000%, 04/15/2020 | 510 | 611 | ||||||
8.125%, 04/15/2019 | 1,130 | 1,254 | ||||||
7.500%, 07/15/2020 (A) | 2,375 | 2,461 | ||||||
| SEI Institutional Managed Trust / Annual Report / September 30, 2013 | 161 |
SCHEDULE OF INVESTMENTS
High Yield Bond Fund (Continued)
September 30, 2013
| Description | Face Amount ($ Thousands) | Market Value ($ Thousands) | ||||||
Intcomex | ||||||||
13.250%, 12/15/2014 | $ | 4,613 | $ | 4,475 | ||||
Interline Brands | ||||||||
7.500%, 11/15/2018 | 690 | 731 | ||||||
Interline Brands PIK | ||||||||
10.000%, 11/15/2018 | 280 | 306 | ||||||
International Lease Finance | ||||||||
8.750%, 03/15/2017 | 2,280 | 2,616 | ||||||
6.250%, 05/15/2019 | 1,030 | 1,082 | ||||||
5.875%, 04/01/2019 | 2,040 | 2,124 | ||||||
Iron Mountain | ||||||||
7.750%, 10/01/2019 | 1,250 | 1,373 | ||||||
6.000%, 08/15/2023 | 715 | 710 | ||||||
Jack Cooper Holdings | ||||||||
9.250%, 06/01/2020 (A) | 465 | 498 | ||||||
Liberty Tire Recycling | ||||||||
11.000%, 10/01/2016 (A) | 2,789 | 2,838 | ||||||
Manitowoc | ||||||||
8.500%, 11/01/2020 | 910 | 1,012 | ||||||
Marquette Transportation | ||||||||
10.875%, 01/15/2017 | 1,292 | 1,363 | ||||||
Masonite International | ||||||||
8.250%, 04/15/2021 (A) | 1,200 | 1,317 | ||||||
Meritor | ||||||||
6.750%, 06/15/2021 | 1,015 | 1,005 | ||||||
Milacron | ||||||||
7.750%, 02/15/2021 (A) | 1,375 | 1,420 | ||||||
Mueller Water Products | ||||||||
8.750%, 09/01/2020 | 468 | 515 | ||||||
Navistar International | ||||||||
8.250%, 11/01/2021 | 1,110 | 1,124 | ||||||
Nielsen Finance | ||||||||
4.500%, 10/01/2020 | 1,290 | 1,242 | ||||||
Nielsen Luxembourg SARL | ||||||||
5.500%, 10/01/2021 (A) | 2,995 | 3,010 | ||||||
Niska Gas Storage US | ||||||||
8.875%, 03/15/2018 | 2,920 | 3,022 | ||||||
Nortek | ||||||||
8.500%, 04/15/2021 | 2,940 | 3,197 | ||||||
Oshkosh | ||||||||
8.500%, 03/01/2020 | 2,413 | 2,660 | ||||||
Ply Gem Industries | ||||||||
8.250%, 02/15/2018 | 157 | 168 | ||||||
Polymer Group | ||||||||
7.750%, 02/01/2019 | 945 | 1,010 | ||||||
Polypore International | ||||||||
7.500%, 11/15/2017 | 640 | 678 | ||||||
Quality Distribution | ||||||||
9.875%, 11/01/2018 | 3,600 | 3,915 | ||||||
RR Donnelley & Sons | ||||||||
7.000%, 02/15/2022 | 140 | �� | 141 | |||||
Sabine Pass LNG L.P. | ||||||||
7.500%, 11/30/2016 (A) | 1,540 | 1,621 | ||||||
7.500%, 11/30/2016 | 9,610 | 10,571 | ||||||
| Description | Face Amount ($ Thousands) | Market Value ($ Thousands) | ||||||
Seminole Indian Tribe of Florida | ||||||||
7.750%, 10/01/2017 (A) | $ | 250 | $ | 265 | ||||
6.535%, 10/01/2020 (A) | 500 | 535 | ||||||
ServiceMaster | ||||||||
8.000%, 02/15/2020 | 2,365 | 2,341 | ||||||
7.450%, 08/15/2027 | 740 | 592 | ||||||
7.250%, 03/01/2038 | 1,515 | 1,174 | ||||||
7.100%, 03/01/2018 | 1,000 | 963 | ||||||
7.000%, 08/15/2020 | 2,830 | 2,674 | ||||||
Silver II Borrower | ||||||||
7.750%, 12/15/2020 (A) | 1,315 | 1,351 | ||||||
Swift Services Holdings | ||||||||
10.000%, 11/15/2018 | 1,325 | 1,471 | ||||||
Syncreon Global Ireland | ||||||||
9.500%, 05/01/2018 (A) | 3,112 | 3,377 | ||||||
Tempel Steel | ||||||||
12.000%, 08/15/2016 (A) | 860 | 821 | ||||||
Terex | ||||||||
6.500%, 04/01/2020 | 615 | 646 | ||||||
6.000%, 05/15/2021 | 2,785 | 2,816 | ||||||
Tervita | ||||||||
8.000%, 11/15/2018 (A) | 705 | 708 | ||||||
Thermadyne Holdings | ||||||||
9.000%, 12/15/2017 | 2,045 | 2,204 | ||||||
Titan International | ||||||||
7.875%, 10/01/2017 (A) | 515 | 548 | ||||||
TRAC Intermodal | ||||||||
11.000%, 08/15/2019 | 1,745 | 1,954 | ||||||
TransDigm | ||||||||
7.500%, 07/15/2021 (A) | 1,095 | 1,177 | ||||||
7.500%, 07/15/2021 | 300 | 323 | ||||||
5.500%, 10/15/2020 | 1,600 | 1,568 | ||||||
Triumph Group | ||||||||
4.875%, 04/01/2021 | 545 | 525 | ||||||
United Air Lines, Ser 95A1 | ||||||||
9.560%, 10/19/2018 | 435 | 141 | ||||||
9.020%, 04/19/2012 (B) (F) (G) (J) | 277 | 72 | ||||||
United Airlines Pass-Through Trust Ser 2013-1, Cl B | ||||||||
5.375%, 08/15/2021 | 1,500 | 1,478 | ||||||
USG | ||||||||
6.300%, 11/15/2016 | 1,485 | 1,570 | ||||||
Watco | ||||||||
6.375%, 04/01/2023 (A) | 2,260 | 2,237 | ||||||
|
| |||||||
| 170,483 | ||||||||
|
| |||||||
Information Technology — 7.3% |
| |||||||
313 Group | ||||||||
6.375%, 12/01/2019 (A) | 2,220 | 2,098 | ||||||
ACI Worldwide | ||||||||
6.375%, 08/15/2020 (A) | 2,740 | 2,788 | ||||||
Activision Blizzard (A) | ||||||||
6.125%, 09/15/2023 | 1,200 | 1,206 | ||||||
5.625%, 09/15/2021 | 7,485 | 7,494 | ||||||
| 162 | SEI Institutional Managed Trust / Annual Report / September 30, 2013 |
| Description | Face Amount ($ Thousands) | Market Value ($ Thousands) | ||||||
Advanced Micro Devices | ||||||||
7.500%, 08/15/2022 | $ | 4,210 | $ | 4,031 | ||||
Alcatel-Lucent USA | ||||||||
8.875%, 01/01/2020 (A) | 2,015 | 2,126 | ||||||
6.500%, 01/15/2028 | 1,170 | 977 | ||||||
Amkor Technology | ||||||||
7.375%, 05/01/2018 | 460 | 484 | ||||||
6.625%, 06/01/2021 | 196 | 191 | ||||||
6.375%, 10/01/2022 | 2,225 | 2,125 | ||||||
Aspect Software | ||||||||
10.625%, 05/15/2017 | 3,285 | 3,277 | ||||||
Audatex North America | ||||||||
6.750%, 06/15/2018 | 632 | 670 | ||||||
6.000%, 06/15/2021 (A) | 2,220 | 2,264 | ||||||
Avaya (A) | ||||||||
10.500%, 03/01/2021 | 113 | 91 | ||||||
7.000%, 04/01/2019 | 1,405 | 1,314 | ||||||
BMC Software Finance | ||||||||
8.125%, 07/15/2021 (A) | 4,915 | 5,099 | ||||||
Brocade Communications Systems | ||||||||
4.625%, 01/15/2023 (A) | 3,710 | 3,422 | ||||||
Carlson Wagonlit BV | ||||||||
6.875%, 06/15/2019 (A) | 955 | 965 | ||||||
CommScope | ||||||||
8.250%, 01/15/2019 (A) | 2,935 | 3,206 | ||||||
CommScope Holding PIK | ||||||||
6.625%, 06/01/2020 (A) | 1,810 | 1,801 | ||||||
Eagle Midco | ||||||||
9.000%, 06/15/2018 (A) | 1,785 | 1,794 | ||||||
Epicor Software | ||||||||
8.625%, 05/01/2019 | 2,780 | 2,968 | ||||||
Equinix | ||||||||
5.375%, 04/01/2023 | 938 | 886 | ||||||
4.875%, 04/01/2020 | 2,517 | 2,441 | ||||||
First Data | ||||||||
12.625%, 01/15/2021 | 1,604 | 1,764 | ||||||
11.750%, 08/15/2021 (A) | 645 | 622 | ||||||
11.250%, 03/31/2016 | 1,076 | 1,076 | ||||||
11.250%, 01/15/2021 (A) | 1,860 | 1,944 | ||||||
8.875%, 08/15/2020 (A) | 1,670 | 1,841 | ||||||
8.250%, 01/15/2021 (A) | 385 | 398 | ||||||
7.375%, 06/15/2019 (A) | 3,745 | 3,942 | ||||||
6.750%, 11/01/2020 (A) | 1,825 | 1,889 | ||||||
First Data PIK | ||||||||
8.750%, 01/15/2022 (A) | 7,125 | 7,428 | ||||||
Freescale Semiconductor | ||||||||
9.250%, 04/15/2018 (A) | 323 | 350 | ||||||
GXS Worldwide | ||||||||
9.750%, 06/15/2015 | 3,392 | 3,485 | ||||||
IAC | ||||||||
4.750%, 12/15/2022 | 1,955 | 1,799 | ||||||
iGate | ||||||||
9.000%, 05/01/2016 | 4,949 | 5,308 | ||||||
| Description | Face Amount ($ Thousands) | Market Value ($ Thousands) | ||||||
Infor US | ||||||||
11.500%, 07/15/2018 | $ | 455 | $ | 526 | ||||
9.375%, 04/01/2019 | 4,635 | 5,180 | ||||||
j2 Global | ||||||||
8.000%, 08/01/2020 | 1,925 | 2,069 | ||||||
Magnachip Semiconductor | ||||||||
6.625%, 07/15/2021 (A) | 725 | 716 | ||||||
Mantech International | ||||||||
7.250%, 04/15/2018 | 795 | 841 | ||||||
MEMC Electronic Materials | ||||||||
7.750%, 04/01/2019 | 885 | 916 | ||||||
NCR | ||||||||
5.000%, 07/15/2022 | 1,675 | 1,558 | ||||||
NeuStar | ||||||||
4.500%, 01/15/2023 | 1,195 | 1,073 | ||||||
Nuance Communications | ||||||||
5.375%, 08/15/2020 (A) | 2,250 | 2,126 | ||||||
NXP BV (A) | ||||||||
5.750%, 02/15/2021 | 2,730 | 2,771 | ||||||
5.750%, 03/15/2023 | 435 | 431 | ||||||
3.750%, 06/01/2018 | 265 | 258 | ||||||
Perstorp Holding | ||||||||
8.750%, 05/15/2017 (A) | 1,815 | 1,883 | ||||||
Sabre | ||||||||
8.500%, 05/15/2019 (A) | 4,195 | 4,536 | ||||||
Seagate HDD Cayman | ||||||||
4.750%, 06/01/2023 (A) | 735 | 707 | ||||||
Sensata Technologies BV (A) | ||||||||
6.500%, 05/15/2019 | 4,093 | 4,399 | ||||||
4.875%, 10/15/2023 | 2,600 | 2,418 | ||||||
Southern Graphics | ||||||||
8.375%, 10/15/2020 (A) | 175 | 181 | ||||||
SPCM | ||||||||
6.000%, 01/15/2022 (A) | 3,181 | 3,197 | ||||||
SSI Investments II | ||||||||
11.125%, 06/01/2018 | 1,055 | 1,160 | ||||||
STATS ChipPAC | ||||||||
4.500%, 03/20/2018 (A) | 2,206 | 2,156 | ||||||
Stratus Technologies Bermuda | ||||||||
12.000%, 03/29/2015 | 2,305 | 2,299 | ||||||
Stream Global Services | ||||||||
11.250%, 10/01/2014 | 2,980 | 2,999 | ||||||
SunGard Data Systems | ||||||||
7.625%, 11/15/2020 | 220 | 235 | ||||||
7.375%, 11/15/2018 | 740 | 784 | ||||||
6.625%, 11/01/2019 | 800 | 816 | ||||||
Taminco Global Chemical | ||||||||
9.750%, 03/31/2020 (A) | 2,815 | 3,181 | ||||||
Travelport PIK | ||||||||
13.875%, 03/01/2016 (A) | 463 | 481 | ||||||
VeriSign | ||||||||
4.625%, 05/01/2023 (A) | 900 | 846 | ||||||
Viasystems | ||||||||
7.875%, 05/01/2019 (A) | 3,285 | 3,490 | ||||||
| SEI Institutional Managed Trust / Annual Report / September 30, 2013 | 163 |
SCHEDULE OF INVESTMENTS
High Yield Bond Fund (Continued)
September 30, 2013
| Description | Face Amount ($ Thousands) | Market Value ($ Thousands) | ||||||
WEX | ||||||||
4.750%, 02/01/2023 (A) | $ | 2,825 | $ | 2,571 | ||||
Zayo Group | ||||||||
10.125%, 07/01/2020 | 3,090 | 3,546 | ||||||
8.125%, 01/01/2020 | 1,940 | 2,122 | ||||||
|
| |||||||
| 148,036 | ||||||||
|
| |||||||
Materials — 6.1% |
| |||||||
AK Steel | ||||||||
7.625%, 05/15/2020 | 720 | 605 | ||||||
APERAM (A) | ||||||||
7.750%, 04/01/2018 | 1,855 | 1,827 | ||||||
7.375%, 04/01/2016 | 2,035 | 2,035 | ||||||
ArcelorMittal | ||||||||
6.125%, 06/01/2018 | 3,110 | 3,297 | ||||||
6.000%, 03/01/2021 | 375 | 384 | ||||||
ARD Finance PIK | ||||||||
11.125%, 06/01/2018 (A) | 1,422 | 1,508 | ||||||
Ardagh Packaging Finance (A) | ||||||||
9.125%, 10/15/2020 | 2,260 | 2,396 | ||||||
7.000%, 11/15/2020 | 2,880 | 2,765 | ||||||
Ashland | ||||||||
4.750%, 08/15/2022 | 870 | 816 | ||||||
Ball | ||||||||
5.000%, 03/15/2022 | 1,150 | 1,115 | ||||||
Berry Plastics | ||||||||
9.750%, 01/15/2021 | 1,325 | 1,530 | ||||||
BOE Intermediate Holding | ||||||||
9.000%, 11/01/2017 (A) | 780 | 815 | ||||||
BOE Merger PIK | ||||||||
9.500%, 11/01/2017 (A) | 1,645 | 1,711 | ||||||
BWAY Holding | ||||||||
10.000%, 06/15/2018 | 895 | 976 | ||||||
Celanese US Holdings | ||||||||
4.625%, 11/15/2022 | 4,055 | 3,883 | ||||||
Cemex | ||||||||
7.250%, 01/15/2021 (A) | 3,010 | 3,002 | ||||||
Commercial Metals | ||||||||
4.875%, 05/15/2023 | 1,225 | 1,102 | ||||||
Consolidated Container | ||||||||
10.125%, 07/15/2020 (A) | 1,285 | 1,375 | ||||||
Cornerstone Chemical | ||||||||
9.375%, 03/15/2018 (A) | 2,625 | 2,750 | ||||||
Edgen Murray | ||||||||
8.750%, 11/01/2020 (A) | 2,850 | 2,893 | ||||||
Eldorado | ||||||||
6.125%, 12/15/2020 (A) | 1,125 | 1,086 | ||||||
Essar Steel Algoma | ||||||||
9.375%, 03/15/2015 (A) | 720 | 680 | ||||||
Ferro | ||||||||
7.875%, 08/15/2018 | 1,475 | 1,549 | ||||||
FMG Resources August 2006 Pty (A) | ||||||||
8.250%, 11/01/2019 | 1,035 | 1,115 | ||||||
6.875%, 02/01/2018 | 2,160 | 2,257 | ||||||
6.875%, 04/01/2022 | 2,843 | 2,843 | ||||||
| Description | Face Amount ($ Thousands) | Market Value ($ Thousands) | ||||||
Graphic Packaging International | ||||||||
4.750%, 04/15/2021 | $ | 1,154 | $ | 1,119 | ||||
Headwaters | ||||||||
7.625%, 04/01/2019 | 725 | 761 | ||||||
Hecla Mining | ||||||||
6.875%, 05/01/2021 (A) | 2,690 | 2,542 | ||||||
Hexion US Finance | ||||||||
9.000%, 11/15/2020 | 1,345 | 1,315 | ||||||
8.875%, 02/01/2018 | 2,200 | 2,277 | ||||||
6.625%, 04/15/2020 | 1,290 | 1,290 | ||||||
Huntsman International | ||||||||
8.625%, 03/15/2020 | 435 | 478 | ||||||
8.625%, 03/15/2021 | 1,135 | 1,260 | ||||||
4.875%, 11/15/2020 | 490 | 464 | ||||||
IAMGOLD | ||||||||
6.750%, 10/01/2020 (A) | 4,295 | 3,747 | ||||||
Ineos Finance (A) | ||||||||
8.375%, 02/15/2019 | 1,180 | 1,301 | ||||||
7.500%, 05/01/2020 | 1,070 | 1,148 | ||||||
Ineos Group Holdings | ||||||||
6.125%, 08/15/2018 (A) | 1,425 | 1,386 | ||||||
Inmet Mining | ||||||||
8.750%, 06/01/2020 (A) | 1,280 | 1,370 | ||||||
JMC Steel Group | ||||||||
8.250%, 03/15/2018 (A) | 1,500 | 1,466 | ||||||
KGHM International | ||||||||
7.750%, 06/15/2019 (A) | 2,690 | 2,777 | ||||||
Kinove German Bondco | ||||||||
9.625%, 06/15/2018 (A) | 1,357 | 1,499 | ||||||
LSB Industries | ||||||||
7.750%, 08/01/2019 (A) | 1,570 | 1,629 | ||||||
Midwest Vanadium Pty | ||||||||
11.500%, 02/15/2018 (A) | 1,100 | 908 | ||||||
Mirabela Nickel | ||||||||
8.750%, 04/15/2018 (A) | 2,420 | 944 | ||||||
Momentive Performance Materials PIK | ||||||||
11.000%, | 2,222 | 1,852 | ||||||
New (A) | ||||||||
7.000%, 04/15/2020 | 600 | 618 | ||||||
6.250%, 11/15/2022 | 2,290 | 2,227 | ||||||
Nexeo Solutions | ||||||||
8.375%, 03/01/2018 | 750 | 746 | ||||||
Noranda Aluminum Acquisition | ||||||||
11.000%, 06/01/2019 (A) | 1,390 | 1,244 | ||||||
Novelis | ||||||||
8.750%, 12/15/2020 | 190 | 209 | ||||||
8.375%, 12/15/2017 | 1,455 | 1,560 | ||||||
Packaging Dynamics | ||||||||
8.750%, 02/01/2016 (A) | 1,379 | 1,427 | ||||||
Plastipak Holdings | ||||||||
6.500%, 10/01/2021 (A) | 1,115 | 1,126 | ||||||
PolyOne | ||||||||
7.375%, 09/15/2020 | 910 | 1,001 | ||||||
| 164 | SEI Institutional Managed Trust / Annual Report / September 30, 2013 |
| Description | Face Amount ($ Thousands) | Market Value ($ Thousands) | ||||||
Pretium Packaging | ||||||||
11.500%, 04/01/2016 | $ | 1,375 | $ | 1,475 | ||||
Rain CII Carbon (A) | ||||||||
8.250%, 01/15/2021 | 200 | 201 | ||||||
8.000%, 12/01/2018 | 310 | 312 | ||||||
Reichhold Industries PIK | ||||||||
9.000%, 05/08/2017 (A) | 1,310 | 1,009 | ||||||
Rentech Nitrogen Partners | ||||||||
6.500%, 04/15/2021 (A) | 405 | 397 | ||||||
Rockwood Specialties Group | ||||||||
4.625%, 10/15/2020 | 2,160 | 2,171 | ||||||
Ryerson | ||||||||
11.250%, 10/15/2018 | 2,305 | 2,380 | ||||||
9.000%, 10/15/2017 | 1,110 | 1,149 | ||||||
Sappi Papier Holding (A) | ||||||||
8.375%, 06/15/2019 | 1,150 | 1,202 | ||||||
7.750%, 07/15/2017 | 300 | 312 | ||||||
6.625%, 04/15/2021 | 200 | 186 | ||||||
Scotts Miracle-Gro | ||||||||
7.250%, 01/15/2018 | 35 | 37 | ||||||
6.625%, 12/15/2020 | 790 | 839 | ||||||
Sealed Air (A) | ||||||||
8.375%, 09/15/2021 | 975 | 1,104 | ||||||
8.125%, 09/15/2019 | 1,650 | 1,840 | ||||||
Smurfit Kappa Acquisitions | ||||||||
4.875%, 09/15/2018 (A) | 1,400 | 1,400 | ||||||
St. Barbara | ||||||||
8.875%, 04/15/2018 (A) | 800 | 698 | ||||||
Steel Dynamics | ||||||||
6.375%, 08/15/2022 | 680 | 704 | ||||||
6.125%, 08/15/2019 | 680 | 709 | ||||||
Tekni-Plex | ||||||||
9.750%, 06/01/2019 (A) | 478 | 538 | ||||||
TPC Group | ||||||||
8.750%, 12/15/2020 (A) | 6,010 | 6,145 | ||||||
Unifrax I | ||||||||
7.500%, 02/15/2019 (A) | 600 | 600 | ||||||
US Coatings Acquisition | ||||||||
7.375%, 05/01/2021 (A) | 1,035 | 1,082 | ||||||
Vulcan Materials | ||||||||
7.500%, 06/15/2021 | 530 | 591 | ||||||
7.000%, 06/15/2018 | 450 | 507 | ||||||
Walter Energy (A) | ||||||||
9.875%, 12/15/2020 | 5,005 | 4,354 | ||||||
9.500%, 10/15/2019 | 1,510 | 1,563 | ||||||
8.500%, 04/15/2021 | 2,745 | 2,292 | ||||||
|
| |||||||
| 123,803 | ||||||||
|
| |||||||
Telecommunication Services — 5.2% |
| |||||||
CenturyLink | ||||||||
5.800%, 03/15/2022 | 2,345 | 2,204 | ||||||
5.625%, 04/01/2020 | 2,080 | 2,031 | ||||||
Cincinnati Bell | ||||||||
8.750%, 03/15/2018 | 3,170 | 3,348 | ||||||
| Description | Face Amount ($ Thousands) | Market Value ($ Thousands) | ||||||
Clearwire Communications | ||||||||
12.000%, 12/01/2015 (A) | $ | 2,040 | $ | 2,134 | ||||
8.250%, 12/01/2040 (A) | 1,032 | 1,143 | ||||||
Cogent Communications Group | ||||||||
8.375%, 02/15/2018 (A) | 775 | 845 | ||||||
Crown Castle International | ||||||||
5.250%, 01/15/2023 | 865 | 796 | ||||||
Digicel Group (A) | ||||||||
8.250%, 09/01/2017 | 2,714 | 2,812 | ||||||
8.250%, 09/30/2020 | 2,810 | 2,908 | ||||||
Eileme 2 | ||||||||
11.625%, 01/31/2020 (A) | 595 | 690 | ||||||
GCI | ||||||||
8.625%, 11/15/2019 | 745 | 780 | ||||||
6.750%, 06/01/2021 | 525 | 496 | ||||||
Hughes Satellite Systems | ||||||||
7.625%, 06/15/2021 | 3,255 | 3,507 | ||||||
6.500%, 06/15/2019 | 690 | 730 | ||||||
Intelsat Jackson Holdings | ||||||||
7.500%, 04/01/2021 | 535 | 578 | ||||||
7.250%, 10/15/2020 | 2,880 | 3,074 | ||||||
6.625%, 12/15/2022 (A) | 830 | 824 | ||||||
Intelsat Luxembourg (A) | ||||||||
8.125%, 06/01/2023 | 3,545 | 3,740 | ||||||
7.750%, 06/01/2021 | 2,375 | 2,458 | ||||||
Level 3 Communications | ||||||||
11.875%, 02/01/2019 | 1,020 | 1,173 | ||||||
8.875%, 06/01/2019 | 1,025 | 1,097 | ||||||
Level 3 Financing | ||||||||
9.375%, 04/01/2019 | 2,185 | 2,409 | ||||||
8.625%, 07/15/2020 | 710 | 776 | ||||||
8.125%, 07/01/2019 | 845 | 904 | ||||||
7.000%, 06/01/2020 | 920 | 927 | ||||||
Lucent Technologies | ||||||||
6.450%, 03/15/2029 | 3,805 | 3,215 | ||||||
Lynx I | ||||||||
5.375%, 04/15/2021 (A) | 1,985 | 1,935 | ||||||
Lynx II | ||||||||
6.375%, 04/15/2023 (A) | 1,565 | 1,557 | ||||||
MetroPCS Wireless | ||||||||
7.875%, 09/01/2018 | 265 | 287 | ||||||
6.625%, 04/01/2023 (A) | 850 | 852 | ||||||
6.250%, 04/01/2021 (A) | 1,110 | 1,116 | ||||||
NII International Telecom SCA | ||||||||
7.875%, 08/15/2019 (A) | 325 | 295 | ||||||
Sable International Finance (A) | ||||||||
8.750%, 02/01/2020 | 68 | 75 | ||||||
7.750%, 02/15/2017 | 1,688 | 1,781 | ||||||
Satelites Mexicanos | ||||||||
9.500%, 05/15/2017 | 705 | 769 | ||||||
SBA Telecommunications | ||||||||
8.250%, 08/15/2019 | 113 | 122 | ||||||
5.750%, 07/15/2020 | 135 | 134 | ||||||
Softbank | ||||||||
4.500%, 04/15/2020 (A) | 1,351 | 1,298 | ||||||
| SEI Institutional Managed Trust / Annual Report / September 30, 2013 | 165 |
SCHEDULE OF INVESTMENTS
High Yield Bond Fund (Continued)
September 30, 2013
| Description | Face Amount ($ Thousands) | Market Value ($ Thousands) | ||||||
Sprint (A) | ||||||||
7.875%, 09/15/2023 | $ | 10,270 | $ | 10,475 | ||||
7.250%, 09/15/2021 | 1,975 | 1,995 | ||||||
Sprint Capital | ||||||||
8.750%, 03/15/2032 | 5,135 | 5,219 | ||||||
6.900%, 05/01/2019 | 4,525 | 4,649 | ||||||
Sprint Nextel | ||||||||
9.000%, 11/15/2018 (A) | 2,155 | 2,527 | ||||||
6.000%, 11/15/2022 | 30 | 28 | ||||||
tw telecom holdings | ||||||||
5.375%, 10/01/2022 | 1,435 | 1,370 | ||||||
5.375%, 10/01/2022 (A) | 435 | 415 | ||||||
UPCB Finance V | ||||||||
7.250%, 11/15/2021 (A) | 3,355 | 3,657 | ||||||
UPCB Finance VI | ||||||||
6.875%, 01/15/2022 (A) | 2,412 | 2,557 | ||||||
West | ||||||||
8.625%, 10/01/2018 | 2,755 | 2,996 | ||||||
Wind Acquisition Finance (A) | ||||||||
11.750%, 07/15/2017 | 1,285 | 1,365 | ||||||
7.250%, 02/15/2018 | 310 | 321 | ||||||
7.250%, 02/15/2018 | 2,740 | 2,836 | ||||||
6.500%, 04/30/2020 | 1,189 | 1,219 | ||||||
Windstream | ||||||||
7.750%, 10/15/2020 | 500 | 516 | ||||||
7.750%, 10/01/2021 (A) | 1,170 | 1,208 | ||||||
7.750%, 10/01/2021 | 1,165 | 1,203 | ||||||
7.500%, 06/01/2022 | 745 | 743 | ||||||
7.500%, 04/01/2023 | 1,220 | 1,205 | ||||||
6.375%, 08/01/2023 | 2,445 | 2,237 | ||||||
|
| |||||||
| 104,561 | ||||||||
|
| |||||||
Utilities — 1.5% |
| |||||||
AES | ||||||||
8.000%, 06/01/2020 | 430 | 490 | ||||||
7.375%, 07/01/2021 | 3,175 | 3,493 | ||||||
4.875%, 05/15/2023 | 895 | 837 | ||||||
Calpine (A) | ||||||||
7.875%, 07/31/2020 | 1,464 | 1,577 | ||||||
7.875%, 01/15/2023 | 198 | 208 | ||||||
7.500%, 02/15/2021 | 951 | 1,010 | ||||||
Elwood Energy | ||||||||
8.159%, 07/05/2026 | 676 | 710 | ||||||
Enel | ||||||||
8.750%, 09/24/2073 (A) (E) | 495 | 505 | ||||||
Energy Future Intermediate Holding | ||||||||
10.000%, 12/01/2020 (A) | 3,765 | 3,953 | ||||||
GenOn Energy | ||||||||
9.875%, 10/15/2020 | 1,285 | 1,417 | ||||||
Homer City Generation | ||||||||
8.137%, 10/01/2019 | 2,410 | 2,482 | ||||||
LBC Tank Terminals Holding Netherlands BV | ||||||||
6.875%, 05/15/2023 (A) | 1,900 | 1,910 | ||||||
| Description | Face Amount ($ Thousands) | Market Value ($ Thousands) | ||||||
Mirant Americas Generation LLC | ||||||||
8.500%, 10/01/2021 | $ | 1,308 | $ | 1,387 | ||||
NRG Energy | ||||||||
8.250%, 09/01/2020 | 240 | 263 | ||||||
7.875%, 05/15/2021 | 6,560 | 7,019 | ||||||
7.625%, 01/15/2018 | 600 | 665 | ||||||
6.625%, 03/15/2023 | 2,127 | 2,084 | ||||||
Southern Energy (B) | ||||||||
0.000%, 07/15/2004 | 450 | 5 | ||||||
|
| |||||||
| 30,015 | ||||||||
|
| |||||||
Total Corporate Obligations | 1,471,490 | |||||||
|
| |||||||
LOAN PARTICIPATIONS — 9.7% |
| |||||||
Academy Sports Limited, Term Loan | ||||||||
4.500%, 08/03/2018 | 553 | 555 | ||||||
Activision Blizzard, 7-Year Unfunded Bridge Loan | ||||||||
0.000%, 10/18/2013 (K) | 1,900 | — | ||||||
Activision Blizzard, 8-Year Unfunded Bridge Loan | ||||||||
0.000%, 10/18/2013 (K) | 1,900 | — | ||||||
Activision Blizzard, 10-Year Unfunded Bridge Loan | ||||||||
0.000%, 10/18/2013 (K) | 950 | — | ||||||
Air Medical Group Holdings, Term Loan, 1st Lien | ||||||||
7.625%, 05/21/2018 | 2,810 | 2,768 | ||||||
Alcatel Lucent, Term Loan | ||||||||
5.750%, 01/29/2019 | 1,495 | 1,505 | ||||||
Alinta, 1st Lien Term Loan | ||||||||
6.375%, 08/13/2019 | 2,560 | 2,452 | ||||||
Alinta, Delayed Term Loan Unfunded | ||||||||
0.500%, 08/13/2018 | 167 | (7 | ) | |||||
Allegion U.S. Holding, 1st Lien Term Loan | ||||||||
0.000%, 12/25/2020 (H) | 455 | 455 | ||||||
American Renal Holdings, Term Loan | ||||||||
8.500%, 02/20/2020 | 1,750 | 1,724 | ||||||
Applied Systems, Term Loan, 2nd Lien | ||||||||
8.250%, 06/08/2017 | 884 | 888 | ||||||
Apria Helathcare Group, Term Loan | ||||||||
6.750%, 04/06/2020 | 1,496 | 1,506 | ||||||
Arctic Glacier Income Fund, Term Loan | ||||||||
6.000%, 05/10/2019 | 1,096 | 1,093 | ||||||
Aspect Software | ||||||||
7.000%, 05/07/2016 | 988 | 987 | ||||||
| 166 | SEI Institutional Managed Trust / Annual Report / September 30, 2013 |
| Description | Face Amount ($ Thousands) | Market Value ($ Thousands) | ||||||
Associated Partners, 1st Lien Term Loan | ||||||||
6.682%, 12/21/2015 | $ | 2,250 | $ | 2,250 | ||||
Associated Partners, Term Loan | ||||||||
6.682%, 12/21/2015 | 2,250 | 2,250 | ||||||
Astoria Generating, Term Loan Cov-Lite | ||||||||
8.500%, 10/26/2017 | 727 | 744 | ||||||
8.500%, 10/26/2017 | 4,743 | 4,850 | ||||||
Asurion, Term Loan | ||||||||
11.000%, 09/02/2019 | 1,600 | 1,668 | ||||||
Atlas Energy, Term Loan B | ||||||||
6.500%, 07/31/2019 | 700 | 707 | ||||||
Avaya, Extended Term Loan B-5 | ||||||||
8.000%, 03/31/2018 | 845 | 799 | ||||||
Bally Technologies, 1st Lien Term Loan B | ||||||||
0.000%, 08/21/2020 (H) | 2,348 | 2,345 | ||||||
Berling Packaging LLC, 2nd Lien Term Loan | ||||||||
8.750%, 04/02/2020 | 375 | 376 | ||||||
BioScrip, 1st Lien Delayed Draw Term Loan | ||||||||
6.500%, 07/31/2020 | 1,125 | 1,130 | ||||||
BioScrip, 1st Lien Term Loan B | ||||||||
6.500%, 07/31/2020 | 1,875 | 1,885 | ||||||
Bowie Resources, 1st Lien Term Loan | ||||||||
6.750%, 08/16/2020 | 2,080 | 2,090 | ||||||
Carestream Health, 1st Lien Term Loan | ||||||||
5.000%, 06/07/2019 | 1,975 | 1,981 | ||||||
Carestream Health, 2nd Lien Term Loan | ||||||||
9.500%, 12/05/2019 | 2,075 | 2,056 | ||||||
Catalent Pharma Solutions, Term Loan | ||||||||
6.500%, 12/31/2017 | 400 | 399 | ||||||
Cengage Learning Acquisitions, Term Loan B | ||||||||
7.750%, 07/05/2017 (B) | 160 | 117 | ||||||
Centaur, 1st Lien Term Loan | ||||||||
5.250%, 02/20/2019 | 682 | 683 | ||||||
Ceridian, 1st Lien Term Loan B | ||||||||
4.429%, 05/09/2017 | 998 | 997 | ||||||
CKX, Term Loan B | ||||||||
9.000%, 06/21/2017 | 421 | 379 | ||||||
Clear Channel Communications, 1st Lien Term Loan B | ||||||||
3.829%, 01/29/2016 | 2,810 | 2,644 | ||||||
Clear Channel Communications, 1st Lien Term Loan D | ||||||||
6.932%, 01/22/2019 | 3,329 | 3,084 | ||||||
Cleveland Unlimited, Term Loan | ||||||||
15.000%, 07/25/2016 (G) | 541 | 541 | ||||||
| Description | Face Amount ($ Thousands) | Market Value ($ Thousands) | ||||||
Cleveland Unlimited, Term Loan A (G) | ||||||||
15.208%, 01/25/2016 | $ | 228 | $ | 228 | ||||
15.000%, 01/25/2016 | 185 | 185 | ||||||
Cleveland Unlimited, Term Loan B (G) | ||||||||
15.208%, 01/25/2016 | 92 | 92 | ||||||
15.000%, 07/25/2016 | 180 | 180 | ||||||
Cleveland Unlimited, Term Loan C | ||||||||
15.208%, 07/25/2016 (G) | 88 | 88 | ||||||
Community Health Systems, Bridge Loan | ||||||||
0.000%, 07/30/2014 (H) | 761 | 761 | ||||||
Community Health Systems, Unfunded Bridge Loan | ||||||||
0.000%, 07/30/2014 (H) (K) | 2,500 | — | ||||||
Community Health Systems, Unsecured Bridge Loan | ||||||||
0.000%, 07/30/2014 (H) | 819 | 819 | ||||||
Constellation Brands, Bridge Loan | ||||||||
0.000%, 12/30/2013 (K) | 1,250 | — | ||||||
Cooper Gay Swett & Crawford, 2nd Lien Term Loan | ||||||||
8.250%, 10/16/2020 | 400 | 394 | ||||||
CPG International | ||||||||
0.000%, 09/04/2014 (E) (H) | 1,320 | 1,320 | ||||||
CPG International, Unfunded and Unsecured Bridge Loan | ||||||||
0.000%, 12/20/2013 (H) (K) | 900 | — | ||||||
CPM Holdings | ||||||||
10.250%, 03/01/2018 | 900 | 902 | ||||||
Crestwood Holdings, 1st Lien Term Loan B | ||||||||
7.000%, 05/24/2019 | 1,509 | 1,536 | ||||||
CSM Bakery Supplies, 1st Lien Term Loan | ||||||||
4.750%, 05/22/2020 | 1,390 | 1,380 | ||||||
CTI Foods, 2nd Lien Term Loan | ||||||||
8.250%, 06/28/2021 | 1,190 | 1,181 | ||||||
DAE Aviation Holdings, Term Loan B1 | ||||||||
6.250%, 10/19/2018 | 1,499 | 1,504 | ||||||
Dex Media West LLC | ||||||||
8.000%, 10/24/2014 | 1,872 | 1,555 | ||||||
Digital Insight, 1st Lien | ||||||||
5.500%, 08/01/2019 | 900 | 900 | ||||||
Digital Insight, 2nd Lien | ||||||||
9.500%, 08/01/2019 | 490 | 490 | ||||||
Dole Food, Unfunded Bridge Loan | ||||||||
0.000%, 02/21/2014 (H) (K) | 2,200 | — | ||||||
Doncasters, Term Loan 2nd Lien | ||||||||
9.500%, 10/09/2020 | 350 | 348 | ||||||
Endurance International, 1st Lien Term Loan | ||||||||
6.250%, 11/09/2019 | 499 | 500 | ||||||
| SEI Institutional Managed Trust / Annual Report / September 30, 2013 | 167 |
SCHEDULE OF INVESTMENTS
High Yield Bond Fund (Continued)
September 30, 2013
| Description | Face Amount ($ Thousands) | Market Value ($ Thousands) | ||||||
Endurance International, 2nd Lien Term Loan | ||||||||
10.250%, 05/09/2020 | $ | 3,807 | $ | 3,817 | ||||
EZE Castel Software, LLC, 2nd Lien Term Loan | ||||||||
8.750%, 04/05/2021 | 400 | 405 | ||||||
Fender Musical Instruments, Term Loan 1st Lien | ||||||||
5.750%, 04/03/2019 | 385 | 386 | ||||||
First Advantage, 2nd Lien Term Loan (G) | ||||||||
9.250%, 08/28/2019 | 600 | 594 | ||||||
First Advantage, Term Loan B | ||||||||
6.250%, 02/28/2019 | 1 | 1 | ||||||
6.250%, 02/13/2019 | 498 | 496 | ||||||
Foresight Energy, 1st Lien Term Loan B | ||||||||
5.500%, 08/21/2020 | 2,000 | 1,983 | ||||||
Fortescue Metals Group, Term Loan Cov-Lite | ||||||||
5.250%, 10/12/2017 | 2,270 | 2,275 | ||||||
Foxwoods, 1st Lien Term Loan B | ||||||||
9.375%, 06/30/2020 | 3,512 | 3,451 | ||||||
Gardner Denver, Term Loan, 1st Lien | ||||||||
4.250%, 07/30/2020 | 725 | 717 | ||||||
GCA Services Group, 2nd Lien Term Loan Cov-Lite | ||||||||
9.250%, 10/11/2020 | 700 | 711 | ||||||
Getty Images, 1st Lien Term Loan B Cov-Lite | ||||||||
4.750%, 10/03/2019 | 950 | 850 | ||||||
Global Aviation Holdings | ||||||||
10.000%, 07/13/2017 (B) | 1,869 | 1,215 | ||||||
3.000%, 02/13/2018 | 602 | 30 | ||||||
GOGO LLC | ||||||||
11.250%, 06/21/2017 | 906 | 960 | ||||||
Gymboree, 1st Lien Term Loan Cov-Lite | ||||||||
5.000%, 02/23/2018 | 340 | 328 | ||||||
Harrah’s Entertainment, Extended Term Loan B-6 | ||||||||
5.434%, 01/28/2018 | 737 | 667 | ||||||
Harrah’s Las Vegas | ||||||||
3.683%, 02/13/2014 | 2,345 | 2,283 | ||||||
Harrah’s Operating | ||||||||
9.500%, 10/31/2016 | 2,888 | 2,877 | ||||||
Hemisphere Media Group, Term Loan | ||||||||
6.250%, 07/30/2020 | 713 | 711 | ||||||
Hilton Hotels, Term Loan B, Cov-Lite 1st Lien | ||||||||
0.000%, 09/23/2020 (H) | 4,820 | 4,811 | ||||||
Hostess Brands | ||||||||
6.750%, 04/09/2020 | 1,360 | 1,392 | ||||||
| Description | Face Amount ($ Thousands) | Market Value ($ Thousands) | ||||||
Hub International, 1st Lien Term Loan B | ||||||||
0.000%, 09/17/2020 (H) | $ | 2,000 | $ | 2,000 | ||||
Hudson’s Bay, Bridge Loan | ||||||||
0.000%, 07/29/2014 (H) | 1,315 | 1,315 | ||||||
Integra Telecom, 2nd Lien | ||||||||
9.750%, 02/19/2020 | 700 | 717 | ||||||
Integra Telecom, Term Loan B | ||||||||
5.250%, 02/22/2019 | 1,347 | 1,353 | ||||||
Intrawest ULC, 1st Lien Term Loan | ||||||||
7.000%, 12/04/2017 | 2,736 | 2,764 | ||||||
ION Trading Technologies, | ||||||||
8.250%, 05/21/2021 | 2,150 | 2,147 | ||||||
JBS USA, 1st Lien Term Loan B Cov-Lite | ||||||||
3.750%, 09/11/2020 | 660 | 652 | ||||||
JC Penney, Term Loan B, | ||||||||
6.000%, 05/21/2018 | 1,047 | 1,014 | ||||||
Knight Capital, 1st Lien Term Loan B | ||||||||
5.750%, 11/30/2017 | 300 | 299 | ||||||
LANDesk Software, 1st | ||||||||
5.250%, 08/09/2019 | 698 | 701 | ||||||
Lawson Software, Term Loan B2 | ||||||||
5.250%, 04/05/2018 | 460 | 462 | ||||||
Learning Care Group, Term Loan | ||||||||
6.000%, 05/08/2019 | 300 | 299 | ||||||
LHP Hospital Group, 1st Lien Term Loan | ||||||||
9.000%, 07/03/2018 | 370 | 363 | ||||||
Lions Gate Entertainment, 2nd Lien Term Loan | ||||||||
5.000%, 07/19/2020 | 2,500 | 2,488 | ||||||
Medical Card | ||||||||
12.000%, 09/17/2015 | 1,323 | 1,270 | ||||||
3.000%, 09/17/2015 | 23 | 23 | ||||||
MedQuist, Term Loan B | ||||||||
7.500%, 08/15/2019 | 4,860 | 4,714 | ||||||
Merge Healthcare, Term Loan B | ||||||||
6.000%, 04/23/2019 | 536 | 506 | ||||||
Metroflag, 2nd Lien (B) | ||||||||
14.000%, 01/06/2009 | 300 | — | ||||||
MISYS PLC, 2nd Lien | ||||||||
12.000%, 06/12/2019 | 1,250 | 1,433 | ||||||
Mitchell International, Unfunded Bridge Loan | ||||||||
0.000%, 01/06/2014 (K) | 300 | — | ||||||
Mohegan Tribal Gaming Authority, Term Loan | ||||||||
5.500%, 03/31/2015 | 2,078 | 2,078 | ||||||
| 168 | SEI Institutional Managed Trust / Annual Report / September 30, 2013 |
| Description | Face Amount ($ Thousands) | Market Value ($ Thousands) | ||||||
Mohegan Tribal Gaming Authority, Term Loan B | ||||||||
9.000%, 03/31/2016 | $ | 3,870 | $ | 3,957 | ||||
Moxie Liberty, 1st Lien Term Loan B1 | ||||||||
7.500%, 08/21/2020 | 3,385 | 3,419 | ||||||
NANA Development, Term Loan | ||||||||
8.000%, 03/15/2018 | 315 | 315 | ||||||
National Financial Partners, 1st Lien Term Loan B | ||||||||
5.250%, 07/01/2020 | 1,097 | 1,105 | ||||||
Navistar International | ||||||||
5.750%, 08/17/2017 | 1,995 | 2,018 | ||||||
Neiman Marcus, Unfunded and Unsecured Bridge Loan | ||||||||
0.000%, 03/11/2014 (H) (K) | 4,200 | — | ||||||
Nelson Education Limited, Term Loan B1 | ||||||||
2.776%, 07/05/2014 | 978 | 814 | ||||||
Novell | ||||||||
11.000%, 11/22/2018 | 710 | 697 | ||||||
Nuveen Investments, 2nd Lien Term Loan B | ||||||||
6.500%, 02/28/2019 | 935 | 927 | ||||||
Obsidian Natural Gas Trust | ||||||||
7.000%, 11/02/2015 | 1,121 | 1,121 | ||||||
Ocwen Financial | ||||||||
5.000%, 02/15/2018 | 419 | 423 | ||||||
One Call Medical, Cov-Lite | ||||||||
5.500%, 08/22/2019 | 2,233 | 2,239 | ||||||
Open Link Financial, Term Loan | ||||||||
7.750%, 10/30/2017 | 983 | 981 | ||||||
Oxbow Carbon & Minerals, 2nd Lien Cov-Lite | ||||||||
8.000%, 01/19/2020 | 1,250 | 1,275 | ||||||
P2ES Holdings | ||||||||
6.000%, 11/20/2018 | 14 | 14 | ||||||
P2ES Holdings, 1st Lien | ||||||||
6.000%, 11/20/2018 | 1,086 | 1,086 | ||||||
Pacific Drilling, 1st Lien Term Loan | ||||||||
4.500%, 05/18/2018 | 1,995 | 2,001 | ||||||
Panda Sherman Power, Term Loan | ||||||||
9.000%, 09/14/2018 | 1,650 | 1,666 | ||||||
Panda Temple Power, 1st Lien Term Loan B | ||||||||
7.250%, 04/03/2019 | 1,180 | 1,190 | ||||||
Panolam Industries International | ||||||||
7.250%, 08/23/2017 | 793 | 787 | ||||||
Patheon, Term Loan B | ||||||||
7.250%, 12/06/2018 | 718 | 722 | ||||||
Peabody Energy, 1st Lien Term Loan B Cov-Lite | ||||||||
0.000%, 09/24/2020 | 2,000 | 1,977 | ||||||
| Description | Face Amount ($ Thousands) | Market Value ($ Thousands) | ||||||
Performance Food Group, 2nd Lien Term Loan Cov-Lite | ||||||||
6.250%, 11/07/2019 | $ | 399 | $ | 394 | ||||
Pierre Foods, Term Loan, 2nd Lien | ||||||||
9.500%, 10/02/2017 | 4,000 | 4,055 | ||||||
Plato Learning | ||||||||
6.000%, 05/17/2018 | 385 | 386 | ||||||
Playpower, 2nd Lien Term Loan | ||||||||
7.500%, 06/30/2015 | 228 | 208 | ||||||
Ranpak, 2nd Lien Term Loan | ||||||||
8.500%, 04/10/2020 | 375 | 383 | ||||||
Reddy Ice, 2nd Lien Term Loan | ||||||||
10.750%, 11/01/2019 | 1,670 | 1,641 | ||||||
Rice Drilling B, 2nd Lien Term Loan | ||||||||
8.500%, 10/25/2018 | 1,858 | 1,862 | ||||||
Rite Aid, Term Loan 2nd Lien | ||||||||
5.750%, 07/07/2020 | 727 | 744 | ||||||
Royal Adhesives and Sealants, Term Loan | ||||||||
5.500%, 07/31/2018 | 1,500 | 1,511 | ||||||
Sabre Holdings | ||||||||
5.250%, 02/15/2019 | 1,915 | 1,913 | ||||||
Sears Holdings, 1st Lien Term Loan | ||||||||
0.000%, 06/30/2018 (H) | 2,200 | 2,182 | ||||||
Sirva Worldwide, Term Loan | ||||||||
7.500%, 03/27/2019 | 1,393 | 1,406 | ||||||
Smart & Final, Cov-Lite 2nd Lien | ||||||||
10.500%, 11/08/2020 | 1,037 | 1,048 | ||||||
Sophos Public | ||||||||
6.500%, 05/10/2019 | 1,403 | 1,398 | ||||||
Standard Aero, Term Loan B2 | ||||||||
6.250%, 10/19/2018 | 681 | 684 | ||||||
State Class Tankers, 1st Lien Term Loan B | ||||||||
6.750%, 06/20/2020 | 835 | 837 | ||||||
Steinway Musical Instruments, 1st Lien Term Loan | ||||||||
0.000%, 09/13/2019 (H) | 240 | 241 | ||||||
Steinway Musical Instruments, 2nd Lien Term Loan | ||||||||
9.250%, 09/18/2020 | 420 | 420 | ||||||
Supervalu, 1st Lien Term Loan B | ||||||||
5.000%, 03/21/2019 | 5,030 | 5,011 | ||||||
Sutherland Global, 1st Lien | ||||||||
7.250%, 03/06/2019 | 340 | 339 | ||||||
Sutherland SGS | ||||||||
7.250%, 03/06/2019 | 154 | 153 | ||||||
Targus Group International, Term Loan B | ||||||||
12.000%, 05/24/2016 | 379 | 333 | ||||||
| SEI Institutional Managed Trust / Annual Report / September 30, 2013 | 169 |
SCHEDULE OF INVESTMENTS
High Yield Bond Fund (Continued)
September 30, 2013
| Description | Face Amount ($ Thousands) | Market Value ($ Thousands) | ||||||
Texas Competitive Electric Holdings, Extending Term Loan | ||||||||
4.766%, 10/10/2017 | $ | 478 | $ | 322 | ||||
4.685%, 10/10/2017 | 1,182 | 795 | ||||||
3.682%, 10/10/2014 | 5,263 | 3,550 | ||||||
Texas Competitive Electric Holdings, Term Loan | ||||||||
3.766%, 10/10/2014 | 2,034 | 1,372 | ||||||
The Telex Group, 1st Lien Term Loan B | ||||||||
6.250%, 09/22/2017 | 98 | 98 | ||||||
TMS International, Bridge Loan | ||||||||
0.000%, 08/23/2014 (H) | 680 | 680 | ||||||
Toys R Us-Delaware | ||||||||
6.000%, 08/21/2019 | 2,860 | 2,808 | ||||||
Travelport, 1st Lien Unfunded | ||||||||
0.000%, 06/21/2018 | 1,000 | (1 | ) | |||||
Travelport, 2nd Lien | ||||||||
4.000%, 12/01/2016 | 1,080 | 1,084 | ||||||
Travelport, 2nd Lien Term Loan 1 | ||||||||
9.500%, 01/31/2016 | 538 | 553 | ||||||
Travelport, Term Loan | ||||||||
6.250%, 06/26/2019 | 1,990 | 2,011 | ||||||
True Religion Apparel, Term Loan | ||||||||
5.875%, 07/30/2019 | 1,500 | 1,411 | ||||||
US Shipping, 1st Lien Term Loan | ||||||||
9.000%, 04/11/2018 | 800 | 816 | ||||||
Vertafore | ||||||||
9.750%, 10/27/2017 | 560 | 568 | ||||||
Wall Street Systems, 2nd Lien Term Loan Cov-Lite | ||||||||
9.250%, 10/25/2020 | 2,000 | 2,013 | ||||||
Walter Investment Managment Company, Term Loan | ||||||||
5.750%, 11/15/2017 | 2,047 | 2,060 | ||||||
Wilton Brands, 1st Lien Term Loan | ||||||||
7.500%, 08/30/2018 | 1,498 | 1,468 | ||||||
|
| |||||||
Total Loan Participations | 197,313 | |||||||
|
| |||||||
COLLATERALIZED DEBT OBLIGATIONS — 9.3% |
| |||||||
Financials — 4.5% | ||||||||
Battalion CLO, Ser 2012-3A, Cl SUB | ||||||||
0.000%, 01/18/2025 (A) | 2,303 | 2,211 | ||||||
Battalion CLO, Ser 2013-4A | ||||||||
0.000%, 10/22/2025 | 5,640 | 4,991 | ||||||
Rockwall CDO, Ser 2006-1A, Cl A1LB | ||||||||
0.765%, 08/01/2021 (A) (E) | 20,459 | 19,027 | ||||||
Rockwall CDO, Ser 2006-1A, Cl A1LA | ||||||||
0.565%, 08/01/2021 (A) (E) | 2,080 | 2,007 | ||||||
| Description | Face Amount ($ Thousands) | Market Value ($ Thousands) | ||||||
Rockwall CDO, Ser 2007-1A, Cl A1LA | ||||||||
0.515%, 08/01/2024 (A) (E) | $ | 68,184 | $ | 62,559 | ||||
|
| |||||||
| 90,795 | ||||||||
|
| |||||||
Other Asset-Backed Securities — 4.8% |
| |||||||
AMMC CDO, Ser 2011-9A, Cl SUB | ||||||||
0.000%, 01/15/2022 (A) | 2,419 | 2,395 | ||||||
AMMC CDO, Ser 2012-10A, Cl A | ||||||||
0.000%, 04/11/2022 (A) | 2,934 | 2,758 | ||||||
AMMC CDO, Ser 2012-11A, Cl SUB | ||||||||
0.000%, 10/30/2023 (A) | 3,450 | 2,829 | ||||||
Bristol Bay Funding, | ||||||||
1.265%, 02/01/2016 (A) (E) | 862 | 845 | ||||||
Claris III | ||||||||
0.565%, 08/04/2021 | 6,969 | 6,481 | ||||||
Figueroa CLO, Ser 2013-1I | ||||||||
0.000%, 03/21/2024 | 18,856 | 18,307 | ||||||
Grayson CLO, Ser 2006-1A, Cl B | ||||||||
0.965%, 11/01/2021 (A) (E) | 5,563 | 4,784 | ||||||
Great Lakes CLO, Ser 2012-1A, Cl E | ||||||||
5.768%, 01/15/2023 (A) (E) | 2,811 | 2,593 | ||||||
0.000%, 01/15/2023 (A) | 2,457 | 2,482 | ||||||
ICE EM CLO, Ser 2007-1A, Cl A2 | ||||||||
0.996%, 08/15/2022 (A) (E) | 8,297 | 7,571 | ||||||
ICE EM CLO, Ser 2007-1A, Cl A3 | ||||||||
1.246%, 08/15/2022 (A) (E) | 2,438 | 2,194 | ||||||
KKR CLO Trust, Ser 2012-1A, Cl C | ||||||||
4.754%, 12/15/2024 (A) (E) | 2,941 | 2,950 | ||||||
KVK CLO, Ser 2012-2A, Cl SUB | ||||||||
0.000%, 02/10/2025 (A) | 2,471 | 2,199 | ||||||
KVK CLO, Ser 2013-1A, Cl SUB | ||||||||
0.000%, 04/14/2025 (A) | 2,695 | 2,479 | ||||||
Neuberger Berman CLO XIV, Ser 2013-14A | ||||||||
0.000%, 04/28/2025 (A) | 2,991 | 2,692 | ||||||
Neuberger Berman CLO, Ser 2012-12A, Cl SUB | ||||||||
0.000%, 07/25/2023 (A) | 3,580 | 2,882 | ||||||
Neuberger Berman CLO, Ser 2012-12A, Cl E | ||||||||
7.266%, 07/25/2023 (A) (E) | 676 | 676 | ||||||
Neuberger Berman CLO, Ser 2012-13A, Cl SUB | ||||||||
0.000%, 01/23/2024 (A) | 2,377 | 1,605 | ||||||
Newstar Trust, Ser 2007-1A, Cl A1 | ||||||||
0.501%, 09/30/2022 (A) (E) | 6,991 | 6,831 | ||||||
NXT Capital CLO, | ||||||||
7.766%, 07/20/2022 (A) (E) | 2,417 | 2,417 | ||||||
| 170 | SEI Institutional Managed Trust / Annual Report / September 30, 2013 |
| Description | Face Amount ($ Thousands)/Shares | Market Value ($ Thousands) | ||||||
OCP CLO, Ser 2012-2A, Cl SUB | ||||||||
0.000%, 11/22/2023 (A) | $ | 2,615 | $ | 2,262 | ||||
Red River CLO, Ser 2006-1A, Cl C | ||||||||
0.985%, 07/27/2018 (A) (E) | 5,456 | 4,910 | ||||||
Red River CLO, Ser 2006-1A, Cl D | ||||||||
1.915%, 07/27/2018 (A) (E) | 2,004 | 1,714 | ||||||
Valhalla CLO, Ser 2004-1A, Cl A2 | ||||||||
1.065%, 08/01/2016 (A) (E) | 1,909 | 1,820 | ||||||
Venture CDO, Ser 2012-10A, Cl SUB | ||||||||
0.000%, 07/20/2022 (A) | 1,819 | 1,692 | ||||||
Venture CDO, Ser 2012-11A, Cl SUB | ||||||||
0.000%, 11/14/2022 (A) | 4,181 | 3,282 | ||||||
Venture CDO, Ser 2013-12A, Cl SUB | ||||||||
0.000%, 02/28/2024 (A) | 2,693 | 2,612 | ||||||
Venture XIV CLO | ||||||||
0.000%, | 2,743 | 2,537 | ||||||
0.000%, | 105 | 1 | ||||||
|
| |||||||
| 98,800 | ||||||||
|
| |||||||
Total Collateralized Debt Obligations | 189,595 | |||||||
|
| |||||||
PREFERRED STOCK — 1.0% |
| |||||||
Ally Financial, 7.000% (A) (E) | 31,995 | 11,997 | ||||||
Aspen Insurance Holdings, 5.950% (E) | 86,000 | 2,041 | ||||||
Ceva Holdings, 0.000%* (G) | 1,214 | 1,001 | ||||||
Chesapeake Energy, 5.750% (A) | 700 | 772 | ||||||
Dana Holding, 0.000% (A) | 5,478 | 1,050 | ||||||
Intelsat, 5.750% | 7,150 | 437 | ||||||
Regions Financial, 6.380% | 131,800 | 2,973 | ||||||
SandRidge Energy, 7.000% | 8,700 | 868 | ||||||
|
| |||||||
Total Preferred Stock | 21,139 | |||||||
|
| |||||||
MUNICIPAL BONDS — 0.5% |
| |||||||
Buckeye Tobacco Settlement Financing Authority, Ser A-2, RB Callable 06/01/2017 @ 100 | ||||||||
5.875%, 06/01/2047 | 245 | 183 | ||||||
Golden State Tobacco Securitization, Ser A-1, RB Callable 06/01/2017 @ 100 | ||||||||
5.750%, 06/01/2047 | 2,000 | 1,531 | ||||||
New Jersey Tobacco Settlement Financing, Ser 1A, RB Callable 06/01/2017 @ 100 | ||||||||
5.000%, 06/01/2041 | 7,710 | 5,502 | ||||||
4.750%, 06/01/2034 | 4,235 | 3,092 | ||||||
|
| |||||||
Total Municipal Bonds | 10,308 | |||||||
|
| |||||||
| Description | Face Amount ($ Thousands)/Shares | Market Value ($ Thousands) | ||||||
CONVERTIBLE BONDS — 0.2% |
| |||||||
Equinix CV to 11.8599 | ||||||||
4.750%, 06/15/2016 | $ | 268 | $ | 603 | ||||
Liberty Media CV to 16.7764 | ||||||||
3.750%, 02/15/2030 | 4,102 | 2,425 | ||||||
Liberty Media CV to 22.94686 | ||||||||
4.000%, 11/15/2029 | 1,672 | 997 | ||||||
Mirant CV to 14.7167 | ||||||||
0.000%, 06/15/2021 (B) | 2,200 | — | ||||||
Vector Group CV to 48.8281 | ||||||||
14.345%, 06/15/2026 (E) | 373 | 425 | ||||||
|
| |||||||
Total Convertible Bonds | 4,450 | |||||||
|
| |||||||
COMMON STOCK — 0.2% |
| |||||||
Aventine* | 1,411 | 17 | ||||||
Ceva Holdings* (G) | 561 | 463 | ||||||
Core-Mark Holding, Cl A | 740 | 49 | ||||||
Dana Holding | 67,046 | 1,532 | ||||||
Delta Air Lines, Cl A | 2,568 | 61 | ||||||
Global Aviation, Cl A* | 97,655 | — | ||||||
HMH Holdings Delaware Inc* (G) | 35,072 | 1,052 | ||||||
Neenah Enterprises (F) | 17,244 | 112 | ||||||
Quad | 78 | 2 | ||||||
United Continental Holdings | 35 | 1 | ||||||
VSS AHC, Cl A* (F)(G)(J) | 27,106 | 163 | ||||||
|
| |||||||
Total Common Stock | 3,452 | |||||||
|
| |||||||
ASSET-BACKED SECURITIES — 0.0% |
| |||||||
Other Asset-Backed Securities — 0.0% |
| |||||||
Airplanes Pass-Through Trust, Ser 2001-1A, Cl A9 | ||||||||
0.732%, 03/15/2019 (E) | 1,117 | 425 | ||||||
|
| |||||||
Total Asset-Backed Securities | 425 | |||||||
|
| |||||||
Number of Warrants | ||||||||
WARRANTS — 0.0% | ||||||||
Alion Science & Technology, | 1,790 | — | ||||||
CUI Acquisition, Expires* (F) (G) (J) | 1 | 90 | ||||||
CUI Acquisition, Expires* (F) (G) (J) | 47,444 | 480 | ||||||
Medical Card Systems, Expires* | 14,662 | — | ||||||
|
| |||||||
Total Warrants (Cost $4,033) ($ Thousands) | 570 | |||||||
|
| |||||||
| SEI Institutional Managed Trust / Annual Report / September 30, 2013 | 171 |
SCHEDULE OF INVESTMENTS
High Yield Bond Fund (Continued)
September 30, 2013
| Description | Shares | Market Value ($ Thousands) | ||||||
AFFILIATED PARTNERSHIP — 0.0% |
| |||||||
SEI Liquidity Fund, L.P. | ||||||||
0.070%**† (I) | 6,082 | $ | 6 | |||||
|
| |||||||
Total Affiliated Partnership (Cost $6) ($ Thousands) | 6 | |||||||
|
| |||||||
| Description | Shares | Market Value ($ Thousands) | ||||||
CASH EQUIVALENT — 7.6% |
| |||||||
SEI Daily Income Trust, Prime Obligation Fund, Cl A | 153,385,255 | $ | 153,385 | |||||
|
| |||||||
Total Cash Equivalent | 153,385 | |||||||
|
| |||||||
Total Investments — 101.2% | $ | 2,052,133 | ||||||
|
| |||||||
A list of the outstanding centrally cleared swap agreements held by the Fund at September 30, 2013, is as follows:
| Credit Default Swaps | ||||||||||||||||||||
| Counterparty | Reference Entity/Obligation | Buy/Sell Protection | (Pays)/ Receives Rate | Termination Date | Notional Amount (Thousands) | Net Unrealized ($ Thousands) | ||||||||||||||
| JPMorgan Chase Bank | CDX.NA.HY. 21-V1 Index | BUY | 5.00 | 12/20/18 | 16,840 | $ | (12 | ) | ||||||||||||
|
| |||||||||||||||||||
| $ | (12 | ) | ||||||||||||||||||
|
| |||||||||||||||||||
Percentages are based on a Net Assets of $2,028,204 ($ Thousands)
| * | Non-income producing security. |
| ** | The rate reported is the 7-day effective yield as of September 30, 2013. |
| † | Investment in Affiliated Security (See Note 6). |
| ‡ | Real Estate Investment Trust. |
| (A) | Securities sold within terms of a private placement memorandum, exempt from registration under Section 144A of the Securities Act of 1933, as amended, and may be sold only to dealers in that program or other “accredited investors.” These securities have been determined to be liquid under guidelines established by the Board of Trustees. |
| (B) | Security in default on interest payments. |
| (C) | This security or a partial position of this security is on loan at September 30, 2013 (see Note 10). The total value of securities on loan at September 30, 2013 was $6 ($ Thousands). |
| (D) | Step Bonds—The rate reflected on the Schedule of Investments is the effective yield on September 30, 2013. The coupon on a step bond changes on a specified date. |
| (E) | Variable Rate Security—The rate reported on the Schedule of Investments is the rate in effect as of September 30, 2013. The date reported on the Schedule of Investments is the final maturity date. |
| (F) | Securities considered illiquid. The total value of such securities as of September 30, 2013 was $2,770 ($ Thousands) and represented 0.14% of Net Assets. |
| (G) | Security fair valued using methods determined in good faith by the Valuation Committee of the Board of Trustees. The total market value of such securities as of September 30, 2013 was $7,082 ($ Thousands) and represented 0.35% of Net Assets. |
| (H) | Unsettled bank loan. Interest rate not available. |
| (I) | This security was purchased with cash collateral held from securities on loan (see Note 10). The total value of such securities as of September 30, 2013 was $6 ($ Thousands) |
| (J) | Securities considered restricted. The total value of such securities as of September 30, 2013 was $2,658 ($ Thousands) and represented 0.13% of Net Assets. |
| (K) | Unfunded bank loan. Interest rate not available. |
| CDO | — Collateralized Debt Obligation |
| Cl | — Class |
| CLO | — Collateralized Loan Obligation |
| CV | — Convertible Security |
| LLC | — Limited Liability Company |
| L.P. | — Limited Partnership |
| PIK | — Payment-in-Kind |
| PLC | — Public Limited Company |
| RB | — Revenue Bond |
| Ser | — Series |
The following is a list of the level of inputs used as of September 30, 2013, in valuing the Fund’s investments and other financial instruments carried at value ($ Thousands):
| Investments in Securities | Level 1 | Level 2 | Level 3(1) | Total | ||||||||||||
Corporate Obligations | $ | — | $ | 1,469,380 | $ | 2,110 | $ | 1,471,490 | ||||||||
Loan Participations | — | 176,588 | 20,725 | 197,313 | ||||||||||||
Collateralized Debt Obligations | — | — | 189,595 | 189,595 | ||||||||||||
Preferred Stock | 1,586 | 18,552 | 1,001 | 21,139 | ||||||||||||
Municipal Bonds | — | 10,308 | — | 10,308 | ||||||||||||
Convertible Bonds | — | 4,450 | — | 4,450 | ||||||||||||
Common Stock | 1,662 | 1,052 | 738 | 3,452 | ||||||||||||
Asset-Backed Securities | — | 425 | — | 425 | ||||||||||||
Warrants | — | — | 570 | 570 | ||||||||||||
Affiliated Partnership | — | 6 | — | 6 | ||||||||||||
Cash Equivalent | 153,385 | — | — | 153,385 | ||||||||||||
|
|
|
|
|
|
|
| |||||||||
Total Investments in Securities | $ | 156,633 | $ | 1,680,761 | $ | 214,739 | $ | 2,052,133 | ||||||||
|
|
|
|
|
|
|
| |||||||||
| Other Financial Instruments | Level 1 | Level 2 | Level 3 | Total | ||||||||||||
Centrally Cleared Swaps | ||||||||||||||||
Credit Default Swaps* | ||||||||||||||||
Unrealized Depreciation | $ | — | $ | (12 | ) | $ | — | $ | (12 | ) | ||||||
|
|
|
|
|
|
|
| |||||||||
Total Other Financial Instruments | $ | — | $ | (12 | ) | $ | — | $ | (12 | ) | ||||||
|
|
|
|
|
|
|
| |||||||||
| * | Swaps are valued at the unrealized depreciation on the instrument. |
| 172 | SEI Institutional Managed Trust / Annual Report / September 30, 2013 |
The following is a reconciliation of the investments in which significant unobservable inputs (Level 3) were used in determining value ($ Thousands):
| Corporate Obligations | Loan Participations | Collateralized Debt Obligations | Preferred Stock | Common Stock | Asset-Backed Securities | Warrants | Auction Rate Preferred Securities | |||||||||||||||||||||||||
Beginning balance as of: October 1, 2012 | $ | 2,777 | $ | 14,574 | $ | 139,203 | $ | — | $ | 448 | $ | 3,435 | $ | 2,159 | $ | 1,127 | ||||||||||||||||
Accrued discounts/premiums | 32 | (2 | ) | 1,762 | — | — | (12 | ) | — | — | ||||||||||||||||||||||
Realized gain/(loss) | 12 | 40 | 3,306 | — | — | 372 | — | 132 | ||||||||||||||||||||||||
Change in unrealized appreciation/(depreciation) | 161 | (9 | ) | 14,606 | (91 | ) | (173 | ) | (54 | ) | (1,589 | ) | (109 | ) | ||||||||||||||||||
Purchases | 226 | 15,578 | 55,056 | 1,092 | 463 | — | — | — | ||||||||||||||||||||||||
Sales | (19 | ) | (20,916 | ) | (24,338 | ) | — | — | (3,741 | ) | — | (1,150 | ) | |||||||||||||||||||
Transfer into Level 3 | 141 | 13,922 | — | — | — | — | — | — | ||||||||||||||||||||||||
Transfer out of Level 3 | (1,220 | ) | (2,462 | ) | — | — | — | — | — | — | ||||||||||||||||||||||
|
|
|
|
|
|
|
|
|
|
|
|
|
|
|
| |||||||||||||||||
Ending balance as of: September 30, 2013 | $ | 2,110 | $ | 20,725 | $ | 189,595 | $ | 1,001 | $ | 738 | $ | — | $ | 570 | $ | — | ||||||||||||||||
|
|
|
|
|
|
|
|
|
|
|
|
|
|
|
| |||||||||||||||||
Change in unrealized gains/(losses) included in earnings related to securities still held at reporting date | $ | 161 | ($ | 3,795 | ) | $ | 12,399 | $ | — | $ | (173 | ) | $ | — | ($ | 1,679 | ) | $ | — | |||||||||||||
|
|
|
|
|
|
|
|
|
|
|
|
|
|
|
| |||||||||||||||||
| (1) | Of the $214,739 ($ Thousands) in Level 3 securities as of September 30, 2013, $6,031 ($ Thousands) or 0.30% of net assets are not valued via third party pricing vendors and broker quotes. If significant, the disclosure of the unobservable inputs and the interrelationships and sensitivity between these inputs are required for those Level 3 securities that are not valued by third party pricing vendors or broker quotes. |
For the year ended September 30, 2013, there have been no transfers between
Level 1 and Level 2 assets and liabilities.
For the year ended September 30, 2013, there were transfers between Level 2 and Level 3 assets and liabilities. The transfers were due to changes in the availability of observable inputs used to determine fair value.
For more information on valuation inputs, see Note 2 — Significant Accounting Policies in
Notes to Financial Statements.
Amounts designated as “—” are $0 or have been rounded to $0.
The accompanying notes are an integral part of the financial statements.
| SEI Institutional Managed Trust / Annual Report / September 30, 2013 | 173 |
SCHEDULE OF INVESTMENTS
Real Return Fund
September 30, 2013
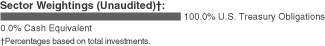
| Description | Face Amount ($ Thousands)/Shares | Market Value ($ Thousands) | ||||||
U.S. TREASURY OBLIGATIONS — 99.8% |
| |||||||
U.S. Treasury Inflation Protected Securities | ||||||||
2.625%, 07/15/2017 | $ | 14,803 | $ | 16,797 | ||||
2.500%, 07/15/2016 | 19,808 | 21,857 | ||||||
2.375%, 01/15/2017 | 17,284 | 19,170 | ||||||
2.000%, 01/15/2016 | 20,128 | 21,526 | ||||||
1.875%, 07/15/2015 | 20,537 | 21,683 | ||||||
1.625%, 01/15/2015 to 01/15/2018 | 39,218 | 41,549 | ||||||
1.375%, 07/15/2018 | 15,436 | 16,943 | ||||||
0.500%, 04/15/2015 | 23,054 | 23,552 | ||||||
0.125%, 04/15/2016 to 04/15/2018 | 121,517 | 125,068 | ||||||
|
| |||||||
Total U.S. Treasury Obligations (Cost $309,937) ($ Thousands) | 308,145 | |||||||
|
| |||||||
CASH EQUIVALENT — 0.0% |
| |||||||
SEI Daily Income Trust, Prime Obligation Fund, Cl A | ||||||||
0.010%*† | 125,017 | 125 | ||||||
|
| |||||||
Total Cash Equivalent (Cost $125) ($ Thousands) | 125 | |||||||
|
| |||||||
Total Investments — 99.8% (Cost $310,062) ($ Thousands) | $ | 308,270 | ||||||
|
| |||||||
Percentages are based on a Net Assets of $308,821 ($ Thousands)
| * | Rate shown is the 7-day effective yield as of September 30, 2013. |
| † | Investment in Affiliated Security (see Note 6) |
Cl — Class
The following is a list of the level of inputs used as of September 30, 2013, in valuing the Fund’s investments carried at value ($ Thousands):
| Investments in Securities | Level 1 | Level 2 | Level 3 | Total | ||||||||||||
U.S. Treasury Obligations | $ | — | $ | 308,145 | $ | — | $ | 308,145 | ||||||||
Cash Equivalent | 125 | — | — | 125 | ||||||||||||
|
|
|
|
|
|
|
| |||||||||
Total Investments in Securities | $ | 125 | $ | 308,145 | $ | — | $ | 308,270 | ||||||||
|
|
|
|
|
|
|
| |||||||||
For the year ended September 30, 2013, there have been no transfers between Level 1 and Level 2 assets and liabilities.
For the year ended September 30, 2013, there have been no transfers between Level 2 and Level 3 assets and liabilities.
For more information on valuation inputs, see Note 2 — Significant Accounting Policies in
Notes to Financial Statements.
Amounts designated as “—” are $0 or have been rounded to $0.
The accompanying notes are an integral part of the financial statements.
| 174 | SEI Institutional Managed Trust / Annual Report / September 30, 2013 |
SCHEDULE OF INVESTMENTS
Multi-Strategy Alternative Fund
September 30, 2013
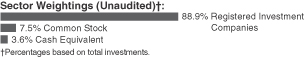
| Description | Shares | Market Value ($ Thousands) | ||||||
REGISTERED INVESTMENT COMPANIES — 88.0% |
| |||||||
AQR Diversified Arbitrage Fund, Cl I | 3,198,980 | $ | 35,957 | |||||
Avenue Credit Strategies, Cl I | 945,176 | 10,491 | ||||||
Blackrock Global Long/Short Credit Fund, Cl I | 2,988,034 | 31,823 | ||||||
Diamond Hill Long/Short Fund, Cl Y | 984,432 | 20,949 | ||||||
Driehaus Active Income Fund, Cl I | 4,412,863 | 47,173 | ||||||
Driehaus Select Credit Fund | 2,122,292 | 21,287 | ||||||
Eaton Vance Global Macro Absolute Return Fund, Cl I | 2,640,489 | 24,873 | ||||||
FPA Crescent Fund | 846,738 | 27,189 | ||||||
MainStay Marketfield Fund, Cl I | 2,028,414 | 36,552 | ||||||
Merger Fund | 3,509,737 | 56,788 | ||||||
Robeco Boston Partners Long/Short Research Fund, Cl I | 2,619,519 | 35,494 | ||||||
Wasatch Long/Short Fund | 1,700,739 | 26,906 | ||||||
|
| |||||||
Total Registered Investment Companies (Cost $368,411) ($ Thousands) | 375,482 | |||||||
|
| |||||||
COMMON STOCK — 7.5% |
| |||||||
Consumer Discretionary — 0.5% |
| |||||||
Dollar General* | 920 | 52 | ||||||
Groupon, Cl A* | 3,960 | 44 | ||||||
Harley-Davidson, Cl A | 3,550 | 228 | ||||||
Home Depot | 970 | 74 | ||||||
Las Vegas Sands | 970 | 64 | ||||||
Lennar, Cl A | 12,150 | 430 | ||||||
Michael Kors Holdings* | 720 | 54 | ||||||
Norwegian Cruise Line Holdings* | 4,640 | 143 | ||||||
priceline.com* | 55 | 56 | ||||||
Ralph Lauren, Cl A | 920 | 151 | ||||||
Ross Stores | 750 | 55 | ||||||
Shutterfly* | 710 | 40 | ||||||
Taylor Morrison Home, Cl A* | 17,598 | 399 | ||||||
Time Warner | 1,160 | 76 | ||||||
Vitamin Shoppe* | 4,790 | 209 | ||||||
Walt Disney | 2,110 | 136 | ||||||
|
| |||||||
| 2,211 | ||||||||
|
| |||||||
Consumer Staples — 0.1% |
| |||||||
Beam | 810 | 52 | ||||||
Church & Dwight | 2,700 | 162 | ||||||
Constellation Brands, Cl A* | 1,470 | 84 | ||||||
Hershey | 680 | 63 | ||||||
Prestige Brands Holdings, Cl A* | 4,170 | 126 | ||||||
Safeway | 1,650 | 53 | ||||||
|
| |||||||
| 540 | ||||||||
|
| |||||||
| Description | Shares | Market Value ($ Thousands) | ||||||
Energy — 0.1% |
| |||||||
Anadarko Petroleum, Cl A | 560 | $ | 52 | |||||
Cobalt International Energy* | 1,220 | 30 | ||||||
Concho Resources* | 490 | 53 | ||||||
EOG Resources | 380 | 64 | ||||||
Halliburton | 1,070 | 52 | ||||||
Lekoil, Cl CDI* | 257,370 | 178 | ||||||
PetroChina ADR | 380 | 42 | ||||||
Prothena* | 114 | 2 | ||||||
|
| |||||||
| 473 | ||||||||
|
| |||||||
Financials — 3.0% |
| |||||||
Affiliated Managers Group* | 3,115 | 569 | ||||||
AIA Group | 68,466 | 322 | ||||||
Allstate | 1,540 | 78 | ||||||
Aon | 6,390 | 476 | ||||||
Banco Santander Chile ADR | 16,800 | 442 | ||||||
Bank of the Ozarks | 6,540 | 314 | ||||||
Bryn Mawr Bank | 8,890 | 240 | ||||||
Citigroup | 13,010 | 631 | ||||||
Concentradora Fibra Hotelera Mexicana† | 151,010 | 249 | ||||||
Countrywide* | 54,212 | 461 | ||||||
Credicorp | 1,300 | 167 | ||||||
Credito Real* | 170,871 | 268 | ||||||
Direct Line Insurance Group | 143,460 | 495 | ||||||
Discover Financial Services | 7,730 | 391 | ||||||
East West Bancorp | 1,400 | 45 | ||||||
Education Realty Trust, Cl A† | 31,210 | 284 | ||||||
Erste Group Bank | 10,302 | 326 | ||||||
Fortegra Financial | 33,303 | 283 | ||||||
Heritage Oaks Bancorp* | 15,010 | 96 | ||||||
Hersha Hospitality Trust, Cl A† | 64,860 | 362 | ||||||
Infinity Property & Casualty | 5,350 | 345 | ||||||
Intact Financial, Cl Common Subscription Receipt | 7,850 | 472 | ||||||
IntercontinentalExchange* | 3,350 | 608 | ||||||
Metropolitan Bank & Trust | 232,013 | 442 | ||||||
Nelnet, Cl A | 12,440 | 478 | ||||||
Ocwen Financial* | 11,900 | 664 | ||||||
OFG Bancorp | 16,700 | 270 | ||||||
OmniAmerican Bancorp, Cl A* | 13,850 | 339 | ||||||
PacWest Bancorp | 9,428 | 324 | ||||||
Portfolio Recovery Associates* | 4,970 | 298 | ||||||
ProAssurance | 14,430 | 650 | ||||||
Safeguard Scientifics* | 5,180 | 81 | ||||||
Signature Bank, Cl B* | 3,110 | 285 | ||||||
Simon Property Group† | 2,130 | 316 | ||||||
Tetragon Financial Group | 1,692 | 17 | ||||||
Validus Holdings | 14,890 | 551 | ||||||
|
| |||||||
| 12,639 | ||||||||
|
| |||||||
Health Care — 2.7% |
| |||||||
AbbVie | 4,810 | 215 | ||||||
ACADIA Pharmaceuticals* | 9,360 | 257 | ||||||
| SEI Institutional Managed Trust / Annual Report / September 30, 2013 | 175 |
SCHEDULE OF INVESTMENTS
Multi-Strategy Alternative Fund (Continued)
September 30, 2013
| Description | Shares | Market Value ($ Thousands) | ||||||
Aegerion Pharmaceuticals, Cl A* | 1,570 | $ | 135 | |||||
Agios Pharmaceuticals* | 2,660 | 74 | ||||||
Align Technology* | 3,840 | 185 | ||||||
Allscripts Healthcare Solutions* | 8,810 | 131 | ||||||
AstraZeneca ADR | 10,150 | 527 | ||||||
AVEO Pharmaceuticals, Cl A* | 17,550 | 36 | ||||||
Biogen Idec* | 1,360 | 327 | ||||||
BioScrip* | 13,850 | 122 | ||||||
BioTelemetry* | 7,470 | 74 | ||||||
Bristol-Myers Squibb | 12,970 | 600 | ||||||
Cardinal Health | 6,610 | 345 | ||||||
Cerner* | 7,870 | 414 | ||||||
Cooper, Cl A | 610 | 79 | ||||||
Coronado Biosciences* | 3,830 | 27 | ||||||
Covidien | 5,130 | 313 | ||||||
Cubist Pharmaceuticals* | 8,480 | 539 | ||||||
Depomed* | 28,520 | 213 | ||||||
DexCom* | 4,990 | 141 | ||||||
Dr Reddy’s Laboratories ADR | 2,520 | 95 | ||||||
Dyax* | 12,690 | 87 | ||||||
Enanta Pharmaceuticals* | 1,150 | 26 | ||||||
Furiex Pharmaceuticals* | 3,930 | 173 | ||||||
Geron* | 23,650 | 79 | ||||||
Gilead Sciences* | 660 | 41 | ||||||
ICON* | 4,510 | 185 | ||||||
Impax Laboratories* | 12,340 | �� | 253 | |||||
Insmed* | 6,070 | 95 | ||||||
Intuitive Surgical* | 340 | 128 | ||||||
Mazor Robotics ADR* | 2,920 | 49 | ||||||
McKesson | 6,040 | 775 | ||||||
Neurocrine Biosciences* | 19,770 | 224 | ||||||
NPS Pharmaceuticals* | 10,810 | 344 | ||||||
Omnicare | 1,710 | 95 | ||||||
Pfizer | 33,900 | 973 | ||||||
Premier, Cl A* | 3,390 | 107 | ||||||
Receptos* | 2,190 | 57 | ||||||
Regeneron Pharmaceuticals* | 550 | 172 | ||||||
ResMed | 3,370 | 178 | ||||||
Roche Holding ADR | 9,130 | 616 | ||||||
Salix Pharmaceuticals* | 1,970 | 132 | ||||||
Shire ADR | 2,270 | 272 | ||||||
Swedish Orphan Biovitrum* | 14,640 | 146 | ||||||
Targacept* | 7,090 | 38 | ||||||
Universal Health Services, Cl B | 5,060 | 379 | ||||||
ViroPharma* | 10,880 | 428 | ||||||
Zimmer Holdings | 4,220 | 347 | ||||||
Zoetis, Cl A | 6,380 | 199 | ||||||
|
| |||||||
| 11,447 | ||||||||
|
| |||||||
Industrials — 0.4% |
| |||||||
Ametek | 1,390 | 64 | ||||||
CAI International* | 21,270 | 495 | ||||||
Cummins | 630 | 84 | ||||||
Eaton | 3,860 | 266 | ||||||
| Description | Shares | Market Value ($ Thousands) | ||||||
FTI Consulting | 1,200 | $ | 45 | |||||
Honeywell International | 860 | 71 | ||||||
Rockwell Automation | 580 | 62 | ||||||
Spirit Airlines* | 1,260 | 43 | ||||||
Terex* | 1,270 | 43 | ||||||
Towers Watson, Cl A | 3,430 | 367 | ||||||
|
| |||||||
| 1,540 | ||||||||
|
| |||||||
Information Technology — 0.6% |
| |||||||
Apple | 440 | 210 | ||||||
Avago Technologies, Cl A | 2,030 | 88 | ||||||
Cardtronics* | 8,580 | 318 | ||||||
Cavium* | 2,290 | 94 | ||||||
Cisco Systems | 2,180 | 51 | ||||||
Citrix Systems* | 740 | 52 | ||||||
eBay* | 2,340 | 131 | ||||||
Ellie Mae* | 8,720 | 279 | ||||||
Facebook, Cl A* | 1,680 | 84 | ||||||
Jabil Circuit | 3,460 | 75 | ||||||
JDS Uniphase* | 3,600 | 53 | ||||||
Linx | 9,693 | 162 | ||||||
NXP Semiconductor* | 2,610 | 97 | ||||||
Salesforce.com* | 2,770 | 144 | ||||||
ServiceNow* | 860 | 45 | ||||||
Skyworks Solutions* | 1,780 | 44 | ||||||
Take-Two Interactive Software, Cl A* | 4,280 | 78 | ||||||
TE Connectivity | 1,230 | 64 | ||||||
TIBCO Software, Cl E* | 6,320 | 162 | ||||||
Visa, Cl A | 2,170 | 415 | ||||||
Xilinx | 1,090 | 51 | ||||||
Yandex, Cl A* | 860 | 31 | ||||||
|
| |||||||
| 2,728 | ||||||||
|
| |||||||
Materials — 0.1% |
| |||||||
Eastman Chemical | 670 | 52 | ||||||
Louisiana-Pacific* | 9,550 | 168 | ||||||
|
| |||||||
| 220 | ||||||||
|
| |||||||
Telecommunication Services — 0.0% |
| |||||||
SBA Communications, Cl A* | 660 | 52 | ||||||
|
| |||||||
Total Common Stock | 31,850 | |||||||
|
| |||||||
CASH EQUIVALENT — 3.5% |
| |||||||
SEI Daily Income Trust, Prime Obligation Fund, Cl A | ||||||||
0.010%**†† | 15,186,300 | 15,186 | ||||||
|
| |||||||
Total Cash Equivalent | 15,186 | |||||||
|
| |||||||
Total Investments — 99.0% | 422,518 | |||||||
|
| |||||||
| 176 | SEI Institutional Managed Trust / Annual Report / September 30, 2013 |
| Description | Shares | Market Value ($ Thousands) | ||||||
COMMON STOCK SOLD SHORT — (4.3)% |
| |||||||
Consumer Discretionary — (0.5)% |
| |||||||
Bed Bath & Beyond* | (420 | ) | $ | (33 | ) | |||
Carnival | (840 | ) | (27 | ) | ||||
Coach | (760 | ) | (41 | ) | ||||
Delphi Automotive | (550 | ) | (32 | ) | ||||
Hasbro | (1,760 | ) | (83 | ) | ||||
International Game Technology | (1,510 | ) | (29 | ) | ||||
Kohl’s | (1,510 | ) | (78 | ) | ||||
Lowe’s | (1,130 | ) | (54 | ) | ||||
Macy’s | (720 | ) | (31 | ) | ||||
MDC Holdings | (12,640 | ) | (379 | ) | ||||
Nedbank Group | (19,080 | ) | (388 | ) | ||||
NVR* | (410 | ) | (377 | ) | ||||
Target, Cl A | (1,630 | ) | (104 | ) | ||||
Thomson Reuters | (8,640 | ) | (302 | ) | ||||
Twenty-First Century Fox | (4,170 | ) | (140 | ) | ||||
Under Armour, Cl A* | (1,480 | ) | (118 | ) | ||||
|
| |||||||
| (2,216 | ) | |||||||
|
| |||||||
Consumer Staples — (0.1)% |
| |||||||
Clorox | (1,480 | ) | (121 | ) | ||||
CVS Caremark | (2,190 | ) | (124 | ) | ||||
Dr Pepper Snapple Group | (930 | ) | (42 | ) | ||||
Kraft Foods | (1,070 | ) | (56 | ) | ||||
Molson Coors Brewing, Cl B | (1,650 | ) | (83 | ) | ||||
Procter & Gamble | (900 | ) | (68 | ) | ||||
|
| |||||||
| (494 | ) | |||||||
|
| |||||||
Energy — (0.1)% |
| |||||||
Apache | (1,630 | ) | (139 | ) | ||||
China Petroleum & Chemical ADR | (560 | ) | (44 | ) | ||||
Exxon Mobil | (470 | ) | (40 | ) | ||||
Marathon Petroleum | (640 | ) | (41 | ) | ||||
Ultra Petroleum* | (1,530 | ) | (32 | ) | ||||
|
| |||||||
| (296 | ) | |||||||
|
| |||||||
Financials — (2.0)% |
| |||||||
American Express | (4,370 | ) | (330 | ) | ||||
Amlin | (49,620 | ) | (326 | ) | ||||
Arch Capital Group* | (8,200 | ) | (444 | ) | ||||
Assurant | (7,010 | ) | (379 | ) | ||||
Banco Santander | (39,074 | ) | (319 | ) | ||||
BanColombia ADR | (11,290 | ) | (650 | ) | ||||
Banregio Grupo Financiero | (49,610 | ) | (281 | ) | ||||
CBRE Group, Cl A | (16,850 | ) | (390 | ) | ||||
Charles Schwab | (2,030 | ) | (43 | ) | ||||
Cincinnati Financial | (10,245 | ) | (483 | ) | ||||
Cohen & Steers | (8,850 | ) | (313 | ) | ||||
Comerica | (7,920 | ) | (311 | ) | ||||
DiamondRock Hospitality† | (32,140 | ) | (343 | ) | ||||
First Republic Bank | (6,510 | ) | (304 | ) | ||||
| Description | Shares | Market Value ($ Thousands) | ||||||
Health Care† | (6,880 | ) | $ | (429 | ) | |||
IBERIABANK | (8,100 | ) | (420 | ) | ||||
Janus Capital Group | (36,220 | ) | (308 | ) | ||||
Lazard, Cl A | (10,060 | ) | (362 | ) | ||||
Mexico Real Estate Management*† | (140,690 | ) | (239 | ) | ||||
National Health Investors† | (900 | ) | (51 | ) | ||||
OTP Bank | (16,170 | ) | (320 | ) | ||||
Progressive | (19,050 | ) | (519 | ) | ||||
RLI | (1,950 | ) | (170 | ) | ||||
T. Rowe Price Group | (6,470 | ) | (465 | ) | ||||
Ventas† | (1,290 | ) | (79 | ) | ||||
Zillow, Cl A* | (320 | ) | (27 | ) | ||||
|
| |||||||
| (8,305 | ) | |||||||
|
| |||||||
Health Care — (0.8)% |
| |||||||
AmerisourceBergen | (1,470 | ) | (90 | ) | ||||
Arena Pharmaceuticals* | (24,130 | ) | (127 | ) | ||||
Boston Scientific* | (7,120 | ) | (83 | ) | ||||
Eisai | (4,180 | ) | (170 | ) | ||||
Eli Lilly | (800 | ) | (40 | ) | ||||
Express Scripts Holding* | (2,650 | ) | (164 | ) | ||||
HealthSouth | (3,820 | ) | (132 | ) | ||||
HMS Holdings* | (2,470 | ) | (53 | ) | ||||
Hospira* | (1,700 | ) | (67 | ) | ||||
Immunogen* | (5,510 | ) | (94 | ) | ||||
Johnson & Johnson | (1,990 | ) | (172 | ) | ||||
Laboratory Corp of America Holdings* | (1,760 | ) | (174 | ) | ||||
LifePoint Hospitals* | (4,610 | ) | (215 | ) | ||||
Mallinckrodt* | (1,500 | ) | (66 | ) | ||||
Medtronic | (3,230 | ) | (172 | ) | ||||
Merck KGaA | (1,080 | ) | (169 | ) | ||||
Neogen, Cl B* | (1,420 | ) | (86 | ) | ||||
Optimer Pharmaceuticals* | (29,330 | ) | (369 | ) | ||||
Portola Pharmaceuticals* | (3,240 | ) | (87 | ) | ||||
Quest Diagnostics | (2,940 | ) | (182 | ) | ||||
Sirona Dental Systems, Cl A* | (5,510 | ) | (369 | ) | ||||
Stryker | (1,770 | ) | (120 | ) | ||||
Vocera Communications* | (3,150 | ) | (58 | ) | ||||
WellPoint | (3,490 | ) | (292 | ) | ||||
|
| |||||||
| (3,551 | ) | |||||||
|
| |||||||
Industrials — (0.2)% |
| |||||||
Armstrong World Industries* | (580 | ) | (32 | ) | ||||
Manitowoc | (1,570 | ) | (31 | ) | ||||
Parker Hannifin, Cl A | (1,980 | ) | (215 | ) | ||||
Southwest Airlines, Cl A | (10,320 | ) | (150 | ) | ||||
Stericycle, Cl A* | (1,490 | ) | (172 | ) | ||||
Textainer Group Holdings | (6,180 | ) | (234 | ) | ||||
TransDigm Group* | (300 | ) | (42 | ) | ||||
|
| |||||||
| (876 | ) | |||||||
|
| |||||||
Information Technology — (0.6)% |
| |||||||
Angie’s List* | (1,160 | ) | (26 | ) | ||||
Aruba Networks* | (1,250 | ) | (21 | ) | ||||
| SEI Institutional Managed Trust / Annual Report / September 30, 2013 | 177 |
SCHEDULE OF INVESTMENTS
Multi-Strategy Alternative Fund (Concluded)
September 30, 2013
| Description | Shares/Contracts | Market Value ($ Thousands) | ||||||
Bankrate* | (9,880 | ) | $ | (203 | ) | |||
Cognizant Technology Solutions, Cl A* | (4,240 | ) | (348 | ) | ||||
Concur Technologies* | (750 | ) | (83 | ) | ||||
Electronic Arts* | (6,490 | ) | (166 | ) | ||||
Factset Research Systems | (4,700 | ) | (513 | ) | ||||
Infosys ADR | (1,570 | ) | (75 | ) | ||||
Marketo* | (630 | ) | (20 | ) | ||||
MercadoLibre | (400 | ) | (54 | ) | ||||
NetApp | (730 | ) | (31 | ) | ||||
NetSuite* | (320 | ) | (34 | ) | ||||
Oracle, Cl B | (4,190 | ) | (139 | ) | ||||
Power Integrations | (770 | ) | (42 | ) | ||||
Rackspace Hosting* | (600 | ) | (32 | ) | ||||
Red Hat* | (1,800 | ) | (83 | ) | ||||
Tech Data* | (2,420 | ) | (121 | ) | ||||
Teradata* | (480 | ) | (27 | ) | ||||
Texas Instruments | (4,240 | ) | (171 | ) | ||||
Western Union | (21,390 | ) | (399 | ) | ||||
|
| |||||||
| (2,588 | ) | |||||||
|
| |||||||
Materials — 0.0% |
| |||||||
American Vanguard, Cl B | (6,370 | ) | (171 | ) | ||||
|
| |||||||
Total Common Stock Sold Short (Proceeds $(18,312)) ($ Thousands) | (18,497 | ) | ||||||
|
| |||||||
EXCHANGE TRADED FUNDS SOLD SHORT— -0.8% |
| |||||||
CurrencyShares Euro Trust | (1,900 | ) | (254 | ) | ||||
iShares NASDAQ Biotechnology Index Fund | (3,630 | ) | (761 | ) | ||||
iShares Russell 2000 Growth Index Fund | (670 | ) | (84 | ) | ||||
Market Vectors Biotech ETF | (6,100 | ) | (505 | ) | ||||
Market Vectors Pharmaceutical ETF | (10,800 | ) | (517 | ) | ||||
Market Vectors Semiconductor ETF | (1,310 | ) | (52 | ) | ||||
SPDR Health Care Select ETF | (22,450 | ) | (1,135 | ) | ||||
SPDR S&P 500 ETF Trust | (1,240 | ) | (209 | ) | ||||
|
| |||||||
| (3,517 | ) | |||||||
|
| |||||||
Total Exchange Traded Funds Sold Short (Proceeds ($3,193)) ($ Thousands) | (3,517 | ) | ||||||
|
| |||||||
Total Securities Sold Short | $ | (22,014 | ) | |||||
|
| |||||||
PURCHASED OPTIONS*@ — 0.0% |
| |||||||
HCA Holdings Call, Expires: | 62 | $ | 1 | |||||
Volcano Call, Expires: | 23 | 8 | ||||||
|
| |||||||
Total Purchased Options | $ | 9 | ||||||
|
| |||||||
Percentages are based on Net Assets of $426,733 ($ Thousands).
| * | Non-income producing security. |
| ** | Rate shown is the 7-day effective yield as of September 30, 2013. |
| † | Real Estate Investment Trust. |
| †† | Investment in Affiliated Security (see Note 6). |
| @ | For the year ended September 30, 2013, the total amount of all open purchased options, as presented in the Schedule of Investments, are representative of the volume of activity for these derivative types during the year. |
ADR — American Depositary Receipt
Cl — Class
ETF — Exchange Traded Fund
NASDAQ — National Association of Securities Dealers Automated Quotations
S&P — Standard & Poor’s
SPDR — Standard & Poor’s Depositary Receipt
The following is a list of the inputs used as of September 30, 2013, in valuing the Fund’s investments and other financial instruments carried at value ($ Thousands):
| Investments in Securities | Level 1 | Level 2 | Level 3 | Total | ||||||||||||
Registered Investment Companies | $ | 375,482 | $ | — | $ | — | $ | 375,482 | ||||||||
Common Stock | 31,850 | — | — | 31,850 | ||||||||||||
Cash Equivalent | 15,186 | — | — | 15,186 | ||||||||||||
|
|
|
|
|
|
|
| |||||||||
Total Investments in Securities | $ | 422,518 | $ | — | $ | — | $ | 422,518 | ||||||||
|
|
|
|
|
|
|
| |||||||||
| Other Financial Instruments | Level 1 | Level 2 | Level 3 | Total | ||||||||||||
Securities Sold Short | ||||||||||||||||
Common Stock | $ | (18,497 | ) | $ | — | $ | — | $ | (18,497 | ) | ||||||
Exchange Traded Funds | (3,517 | ) | — | — | (3,517 | ) | ||||||||||
Purchased Options | 9 | — | — | 9 | ||||||||||||
|
|
|
|
|
|
|
| |||||||||
Total Other Financial Instruments | $ | (22,005 | ) | $ | — | $ | — | $ | (22,005 | ) | ||||||
|
|
|
|
|
|
|
| |||||||||
For the year ended September 30, 2013, there have been no transfers between Level 1 and Level 2 assets and liabilities.
For the year ended September 30, 2013, there have been no transfers between Level 2 and Level 3 assets and liabilities.
For more information on valuation inputs, see Note 2 — Significant Accounting Policies in Notes to Financial Statements.
Amounts designated as “—” are $0 or have been rounded to $0.
The accompanying notes are an integral part of the financial statements.
| 178 | SEI Institutional Managed Trust / Annual Report / September 30, 2013 |
CONSOLIDATED SCHEDULE OF INVESTMENTS
Multi-Asset Accumulation Fund
September 30, 2013
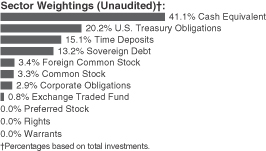
| Description | Face Amount (1) (Thousands) | Market Value ($ Thousands) | ||||||||||
SOVEREIGN DEBT — 12.7% |
| |||||||||||
Sovereign Debt — 12.7% |
| |||||||||||
Bundesrepublik Deutschland Bundesobligation Inflation Linked Bond | ||||||||||||
0.750%, 04/15/2018 | EUR | 329 | $ | 471 | ||||||||
Canada Government | ||||||||||||
2.375%, 09/10/2014 | 1,250 | 1,276 | ||||||||||
0.875%, 02/14/2017 | 1,200 | 1,199 | ||||||||||
Chile Government International Bond | ||||||||||||
3.875%, 08/05/2020 | 250 | 261 | ||||||||||
Deutsche Bundesrepublik Inflation Linked Bond | ||||||||||||
1.750%, 04/15/2020 | EUR | 24,355 | 37,285 | |||||||||
1.500%, 04/15/2016 | EUR | 31,721 | 45,358 | |||||||||
0.100%, 04/15/2023 | EUR | 1,040 | 1,402 | |||||||||
France Government Bond | ||||||||||||
1.100%, 07/25/2022 | EUR | 1,153 | 1,645 | |||||||||
France Government Bond OAT | ||||||||||||
2.250%, 07/25/2020 | EUR | 775 | 1,203 | |||||||||
1.800%, 07/25/2040 | EUR | 1,313 | 2,006 | |||||||||
1.600%, 07/25/2015 | EUR | 491 | 699 | |||||||||
1.300%, 07/25/2019 | EUR | 10,107 | 14,856 | |||||||||
1.100%, 07/25/2022 | EUR | 7,538 | 10,755 | |||||||||
0.250%, 07/25/2018 | EUR | 4,026 | 5,582 | |||||||||
French Treasury Note | ||||||||||||
2.350%, 09/15/2035 | EUR | 599 | 705 | |||||||||
2.100%, 07/25/2023 | EUR | 849 | 1,318 | |||||||||
1.850%, 07/25/2027 | EUR | 604 | 912 | |||||||||
0.450%, 07/25/2016 | EUR | 397 | 558 | |||||||||
Italy Buoni Poliennali Del Tesoro | ||||||||||||
2.600%, 09/15/2023 | EUR | 645 | 840 | |||||||||
2.350%, 09/15/2019 | EUR | 1,345 | 1,825 | |||||||||
2.150%, 09/15/2014 | EUR | 1,054 | 1,456 | |||||||||
2.100%, 09/15/2016 | EUR | 276 | 380 | |||||||||
Province of British Columbia | ||||||||||||
2.000%, 10/23/2022 | 750 | 686 | ||||||||||
Province of Ontario Canada | ||||||||||||
2.450%, 06/29/2022 | 250 | 234 | ||||||||||
0.950%, 05/26/2015 | 250 | 252 | ||||||||||
United Kingdom GILT Inflation Linked | ||||||||||||
2.500%, 04/16/2020 | GBP | 1,131 | 2,242 | |||||||||
| Description | Face Amount (1) (Thousands)/Shares | Market Value ($ Thousands) | ||||||||||
2.000%, 01/26/2035 | GBP | 910 | $ | 2,054 | ||||||||
1.875%, 11/22/2022 | GBP | 15,055 | 29,762 | |||||||||
1.250%, 11/22/2027 to 11/22/2055 | GBP | 3,558 | 7,408 | |||||||||
1.125%, 11/22/2037 | GBP | 462 | 942 | |||||||||
0.625%, 03/22/2040 to 11/22/2042 | GBP | 1,235 | 2,335 | |||||||||
0.375%, 03/22/2062 | GBP | 310 | 586 | |||||||||
0.125%, 03/22/2044 | GBP | 412 | 677 | |||||||||
|
| |||||||||||
Total Sovereign Debt (Cost $173,897) ($ Thousands) | 179,170 | |||||||||||
|
| |||||||||||
FOREIGN COMMON STOCK — 3.3% |
| |||||||||||
Australia — 0.2% |
| |||||||||||
AGL Energy | 7,537 | 109 | ||||||||||
ALS | 4,596 | 45 | ||||||||||
APA Group | 20,222 | 113 | ||||||||||
Asciano | 5,498 | 30 | ||||||||||
ASX | 950 | 31 | ||||||||||
Aurizon Holdings | 9,275 | 40 | ||||||||||
BHP Billiton | 1,444 | 48 | ||||||||||
Brambles | 3,731 | 32 | ||||||||||
Caltex Australia | 2,679 | 46 | ||||||||||
CFS Retail Property Trust Group† | 17,960 | 34 | ||||||||||
Coca-Cola Amatil | 6,171 | 71 | ||||||||||
Cochlear | 1,697 | 96 | ||||||||||
Crown | 4,311 | 63 | ||||||||||
CSL | 2,169 | 130 | ||||||||||
Echo Entertainment Group | 14,750 | 38 | ||||||||||
Harvey Norman Holdings | 22,915 | 68 | ||||||||||
Insurance Australia Group | 7,664 | 42 | ||||||||||
Metcash, Cl A | 17,072 | 51 | ||||||||||
Origin Energy | 6,909 | 91 | ||||||||||
Qantas Airways* | 27,446 | 38 | ||||||||||
Santos | 5,343 | 75 | ||||||||||
Sonic Healthcare | 6,780 | 103 | ||||||||||
SP AusNet | 122,879 | 138 | ||||||||||
Tabcorp Holdings | 16,759 | 51 | ||||||||||
Tatts Group | 26,867 | 78 | ||||||||||
Telstra, Cl B | 40,064 | 186 | ||||||||||
Toll Holdings | 6,200 | 34 | ||||||||||
Treasury Wine Estates | 13,243 | 54 | ||||||||||
Wesfarmers | 1,494 | 58 | ||||||||||
Westfield Group† | 3,250 | 33 | ||||||||||
Westfield Retail Trust† | 8,300 | 23 | ||||||||||
Whitehaven Coal | 28,062 | 53 | ||||||||||
Woodside Petroleum | 1,905 | 68 | ||||||||||
Woolworths | 3,001 | 98 | ||||||||||
WorleyParsons | 2,800 | 64 | ||||||||||
|
| |||||||||||
| 2,332 | ||||||||||||
|
| |||||||||||
| SEI Institutional Managed Trust / Annual Report / September 30, 2013 | 179 |
CONSOLIDATED SCHEDULE OF INVESTMENTS
Multi-Asset Accumulation Fund (Continued)
September 30, 2013
| Description | Shares | Market Value ($ Thousands) | ||||||
Austria — 0.0% |
| |||||||
Andritz | 1,380 | $ | 81 | |||||
Erste Group Bank | 1,116 | 35 | ||||||
OMV | 2,820 | 139 | ||||||
Telekom Austria | 21,023 | 176 | ||||||
Verbund | 6,518 | 148 | ||||||
Vienna Insurance Group Wiener Versicherung Gruppe | 974 | 50 | ||||||
Voestalpine | 1,556 | 75 | ||||||
|
| |||||||
| 704 | ||||||||
|
| |||||||
Belgium — 0.1% |
| |||||||
Ageas | 983 | 40 | ||||||
Anheuser-Busch InBev | 1,099 | 109 | ||||||
Belgacom | 7,806 | 208 | ||||||
Colruyt | 2,862 | 159 | ||||||
Delhaize Group | 1,344 | 85 | ||||||
KBC Groep | 675 | 33 | ||||||
Solvay | 545 | 82 | ||||||
Telenet Group Holding | 2,272 | 113 | ||||||
UCB, Cl A | 3,467 | 211 | ||||||
Umicore | 2,024 | 98 | ||||||
|
| |||||||
| 1,138 | ||||||||
|
| |||||||
Canada — 0.3% |
| |||||||
Agnico Eagle Mines | 1,067 | 28 | ||||||
Alimentation Couche Tard, Cl B | 1,403 | 88 | ||||||
Atco, Cl I | 3,268 | 142 | ||||||
Bank of Montreal | 535 | 36 | ||||||
Bank of Nova Scotia, Cl C | 668 | 38 | ||||||
Barrick Gold | 1,727 | 32 | ||||||
BCE | 3,420 | 147 | ||||||
Bell Aliant | 4,261 | 106 | ||||||
Blackberry* | 7,821 | 62 | ||||||
Bombardier, Cl B | 2,867 | 14 | ||||||
CAE | 5,499 | 60 | ||||||
Cameco | 1,287 | 23 | ||||||
Canadian National Railway | 534 | 54 | ||||||
Canadian Pacific Railway | 510 | 63 | ||||||
Canadian Tire, Cl A | 691 | 61 | ||||||
Canadian Utilities, Cl A | 4,940 | 170 | ||||||
Catamaran* | 3,742 | 172 | ||||||
CGI Group, Cl A* | 5,895 | 207 | ||||||
CI Financial | 1,596 | 48 | ||||||
Crescent Point Energy, Cl F | 1,225 | 47 | ||||||
Dollarama | 1,042 | 85 | ||||||
Empire, Cl A | 1,369 | 99 | ||||||
Enerplus | 2,352 | 39 | ||||||
Finning International | 1,508 | 35 | ||||||
Fortis, Cl Common Subscription Receipt | 5,621 | 171 | ||||||
Franco-Nevada | 1,000 | 46 | ||||||
George Weston | 1,379 | 109 | ||||||
Gildan Activewear | 1,192 | 55 | ||||||
| Description | Shares | Market Value ($ Thousands) | ||||||
H&R† | 636 | $ | 13 | |||||
Husky Energy | 1,708 | 49 | ||||||
Intact Financial, Cl Common Subscription Receipt | 860 | 52 | ||||||
Loblaw | 1,424 | 63 | ||||||
Magna International, Cl A | 748 | 62 | ||||||
Metro, Cl A | 831 | 52 | ||||||
National Bank of Canada | 509 | 42 | ||||||
Open Text | 2,266 | 170 | ||||||
Pengrowth Energy | 7,109 | 42 | ||||||
Potash Corp of Saskatchewan | 2,157 | 67 | ||||||
RioCan† | 1,451 | 34 | ||||||
Rogers Communications, Cl B | 1,908 | 82 | ||||||
Saputo | 1,119 | 53 | ||||||
Shaw Communications, Cl B | 4,071 | 95 | ||||||
Shoppers Drug Mart, Cl B | 995 | 57 | ||||||
Silver Wheaton, Cl H | 353 | 9 | ||||||
SNC-Lavalin Group | 961 | 40 | ||||||
Teck Resources, Cl B | 1,348 | 36 | ||||||
TELUS | 3,640 | 121 | ||||||
Thomson Reuters, Cl B | 1,875 | 66 | ||||||
Tim Hortons | 1,738 | 101 | ||||||
Toronto-Dominion Bank | 372 | 34 | ||||||
TransAlta | 10,581 | 138 | ||||||
Turquoise Hill Resources* | 6,748 | 30 | ||||||
Valeant Pharmaceuticals International* | 1,731 | 181 | ||||||
Vermilion Energy | 783 | 43 | ||||||
|
| |||||||
| 3,969 | ||||||||
|
| |||||||
China — 0.0% |
| |||||||
AAC Technologies Holdings | 31,269 | 142 | ||||||
Sands China | 7,200 | 45 | ||||||
Yangzijiang Shipbuilding Holdings | 63,108 | 55 | ||||||
|
| |||||||
| 242 | ||||||||
|
| |||||||
Denmark — 0.1% |
| |||||||
AP Moeller - Maersk, Cl A | 6 | 52 | ||||||
AP Moeller - Maersk, Cl B | 7 | 64 | ||||||
Carlsberg, Cl B | 863 | 89 | ||||||
Coloplast A/S, Cl B | 3,476 | 198 | ||||||
Danske Bank* | 2,438 | 53 | ||||||
Novo Nordisk, Cl B | 833 | 142 | ||||||
Novozymes, Cl B | 4,077 | 156 | ||||||
TDC | 16,097 | 136 | ||||||
Tryg | 1,050 | 97 | ||||||
William Demant Holding* | 1,463 | 135 | ||||||
|
| |||||||
| 1,122 | ||||||||
|
| |||||||
Finland — 0.1% |
| |||||||
Elisa | 5,193 | 124 | ||||||
Fortum | 7,714 | 174 | ||||||
Kesko, Cl B | 3,330 | 100 | ||||||
Kone, Cl B | 772 | 69 | ||||||
| 180 | SEI Institutional Managed Trust / Annual Report / September 30, 2013 |
| Description | Shares | Market Value ($ Thousands) | ||||||
Metso | 1,380 | $ | 54 | |||||
Neste Oil | 5,640 | 125 | ||||||
Nokia | 29,461 | 194 | ||||||
Nokian Renkaat | 1,678 | 85 | ||||||
Orion, Cl B | 8,268 | 208 | ||||||
Pohjola Bank, Cl A | 1,100 | 18 | ||||||
Sampo, Cl A | 1,991 | 86 | ||||||
Stora Enso, Cl R | 8,191 | 70 | ||||||
UPM-Kymmene, Cl V | 4,939 | 68 | ||||||
Wartsila OYJ Abp | 1,289 | 58 | ||||||
|
| |||||||
| 1,433 | ||||||||
|
| |||||||
France — 0.2% |
| |||||||
Accor | 875 | 37 | ||||||
Aeroports de Paris, Cl A | 373 | 39 | ||||||
Air Liquide | 611 | 85 | ||||||
ArcelorMittal | 4,854 | 67 | ||||||
Arkema | 601 | 67 | ||||||
AtoS | 855 | 67 | ||||||
Bureau Veritas | 900 | 28 | ||||||
Capital Gemini | 1,281 | 76 | ||||||
Carrefour | 1,886 | 65 | ||||||
Casino Guichard Perrachon | 507 | 52 | ||||||
Christian Dior, Cl B | 255 | 50 | ||||||
Cie Generale de Geophysique - Veritas* | 2,713 | 62 | ||||||
Cie Generale d’Optique Essilor International | 1,564 | 168 | ||||||
CNP Assurances | 1,903 | 34 | ||||||
Danone | 624 | 47 | ||||||
Dassault Systemes | 711 | 95 | ||||||
Electricite de France | 4,008 | 127 | ||||||
Eutelsat Communications | 168 | 5 | ||||||
Fonciere Des Regions† | 434 | 36 | ||||||
GDF Suez | 2,949 | 74 | ||||||
Groupe Eurotunnel | 4,624 | 42 | ||||||
ICADE† | 347 | 32 | ||||||
Iliad | 495 | 115 | ||||||
Klepierre† | 731 | 32 | ||||||
L’Oreal | 335 | 58 | ||||||
LVMH Moet Hennessy Louis Vuitton | 241 | 48 | ||||||
Orange | 10,929 | 137 | ||||||
Pernod-Ricard | 333 | 41 | ||||||
Remy Cointreau | 588 | 63 | ||||||
Renault | 429 | 34 | ||||||
Sanofi | 1,412 | 143 | ||||||
Schneider Electric | 577 | 49 | ||||||
SCOR | 357 | 12 | ||||||
Technip | 781 | 92 | ||||||
Thales, Cl A | 738 | 41 | ||||||
Total | 1,483 | 86 | ||||||
Unibail-Rodamco† | 139 | 34 | ||||||
Veolia Environnement | 5,498 | 94 | ||||||
Vinci | 1,013 | 59 | ||||||
| Description | Shares | Market Value ($ Thousands) | ||||||
Vivendi | 3,157 | $ | 73 | |||||
Wendel | 279 | 38 | ||||||
|
| |||||||
| 2,604 | ||||||||
|
| |||||||
Germany — 0.2% |
| |||||||
Allianz | 347 | 55 | ||||||
Bayer | 703 | 83 | ||||||
Beiersdorf | 629 | 56 | ||||||
Brenntag | 242 | 40 | ||||||
Celesio | 2,792 | 63 | ||||||
Continental | 286 | 48 | ||||||
Deutsche Bank | 542 | 25 | ||||||
Deutsche Boerse | 557 | 42 | ||||||
Deutsche Lufthansa | 3,528 | 69 | ||||||
Deutsche Telekom | 11,595 | 168 | ||||||
E.ON | 5,099 | 91 | ||||||
Fraport Frankfurt Airport Services Worldwide | 761 | 54 | ||||||
Fresenius Medical Care | 1,513 | 98 | ||||||
Hannover Rueckversicherung | 619 | 45 | ||||||
Henkel & KGaA | 793 | 70 | ||||||
Infineon Technologies | 9,810 | 98 | ||||||
Kabel Deutschland Holding | 650 | 83 | ||||||
LANXESS | 600 | 39 | ||||||
Linde | 210 | 41 | ||||||
MAN | 398 | 48 | ||||||
Merck KGaA | 517 | 81 | ||||||
Metro | 1,246 | 50 | ||||||
Muenchener Rueckversicherungs | 274 | 54 | ||||||
OSRAM Licht* | 641 | 30 | ||||||
RWE | 3,914 | 133 | ||||||
SAP | 1,462 | 108 | ||||||
Siemens | 424 | 51 | ||||||
Suedzucker | 2,511 | 74 | ||||||
Telefonica Deutschland Holding | 14,068 | 111 | ||||||
ThyssenKrupp | 1,832 | 44 | ||||||
United Internet | 4,008 | 152 | ||||||
Volkswagen | 135 | 31 | ||||||
|
| |||||||
| 2,235 | ||||||||
|
| |||||||
Greece — 0.0% |
| |||||||
Coca-Cola HBC | 1,128 | 34 | ||||||
Hellenic Telecommunications Organization | 6,173 | 64 | ||||||
OPAP | 7,063 | 79 | ||||||
|
| |||||||
| 177 | ||||||||
|
| |||||||
Hong Kong — 0.2% |
| |||||||
AIA Group | 5,800 | 27 | ||||||
ASM Pacific Technology | 11,600 | 118 | ||||||
Cathay Pacific Airways | 27,000 | 53 | ||||||
Cheung Kong Infrastructure Holdings | 44,438 | 308 | ||||||
CLP Holdings, Cl B | 51,000 | 415 | ||||||
| SEI Institutional Managed Trust / Annual Report / September 30, 2013 | 181 |
CONSOLIDATED SCHEDULE OF INVESTMENTS
Multi-Asset Accumulation Fund (Continued)
September 30, 2013
| Description | Shares | Market Value ($ Thousands) | ||||||
Genting Singapore | 45,000 | $ | 51 | |||||
HKT Trust | 111,920 | 105 | ||||||
Hong Kong & China Gas | 79,200 | 191 | ||||||
Hopewell Holdings | 16,500 | 55 | ||||||
Hopewell Hong Kong Properties* | 660 | — | ||||||
Hutchison Whampoa | 5,000 | 60 | ||||||
Kerry Properties | 13,000 | 55 | ||||||
Li & Fung | 44,000 | 64 | ||||||
Link† | 16,500 | 81 | ||||||
MGM China Holdings | 10,400 | 35 | ||||||
MTR | 13,000 | 52 | ||||||
NWS Holdings | 19,000 | 30 | ||||||
Orient Overseas International | 8,000 | 47 | ||||||
PCCW | 396,000 | 175 | ||||||
Power Assets Holdings | 43,102 | 386 | ||||||
Shangri-La Asia | 16,000 | 26 | ||||||
SJM Holdings | 12,000 | 34 | ||||||
Swire Pacific, Cl A | 4,000 | 48 | ||||||
Yue Yuen Industrial Holdings | 13,000 | 36 | ||||||
|
| |||||||
| 2,452 | ||||||||
|
| |||||||
Ireland — 0.1% |
| |||||||
Accenture, Cl A | 975 | 72 | ||||||
Bank of Ireland* | 212,075 | 60 | ||||||
Covidien | 1,548 | 94 | ||||||
CRH | 4,534 | 108 | ||||||
Eaton | 755 | 52 | ||||||
Elan* | 10,829 | 169 | ||||||
Ingersoll-Rand | 651 | 42 | ||||||
Kerry Group, Cl A | 3,404 | 207 | ||||||
Ryanair Holdings* | 2,980 | 148 | ||||||
Seagate Technology | 1,313 | 58 | ||||||
|
| |||||||
| 1,010 | ||||||||
|
| |||||||
Israel — 0.1% |
| |||||||
Bank Hapoalim* | 9,043 | 46 | ||||||
Bank Leumi Le-Israel* | 20,570 | 76 | ||||||
Bezeq The Israeli Telecommunication | 106,620 | 196 | ||||||
Delek Group | 450 | 147 | ||||||
Israel* | 261 | 138 | ||||||
Israel Chemicals | 12,621 | 106 | ||||||
Mizrahi Tefahot Bank | 6,105 | 67 | ||||||
NICE Systems | 6,805 | 280 | ||||||
Teva Pharmaceutical Industries | 6,374 | 240 | ||||||
|
| |||||||
| 1,296 | ||||||||
|
| |||||||
Italy — 0.1% |
| |||||||
Assicurazioni Generali | 2,134 | 43 | ||||||
Atlantia | 3,095 | 63 | ||||||
CNH Industrial* | 4,168 | 53 | ||||||
Enel | 19,926 | 76 | ||||||
Enel Green Power | 26,232 | 56 | ||||||
Eni | 3,019 | 69 | ||||||
Finmeccanica | 7,633 | 46 | ||||||
| Description | Shares | Market Value ($ Thousands) | ||||||
Luxottica Group | 1,251 | $ | 66 | |||||
Pirelli & C. | 3,530 | 46 | ||||||
Prysmian | 1,992 | 49 | ||||||
Saipem | 2,096 | 46 | ||||||
Snam Rete Gas | 25,202 | 128 | ||||||
Telecom Italia | 224,157 | 166 | ||||||
Tenaris | 2,393 | 56 | ||||||
Terna Rete Elettrica Nazionale | 28,255 | 128 | ||||||
|
| |||||||
| 1,091 | ||||||||
|
| |||||||
Japan — 0.6% |
| |||||||
ABC-Mart, Cl H | 1,300 | 64 | ||||||
Acom* | 7,800 | 29 | ||||||
Aeon, Cl H | 2,700 | 37 | ||||||
Air Water | 2,000 | 30 | ||||||
Ajinomoto | 6,000 | 79 | ||||||
Alfresa Holdings | 1,300 | 67 | ||||||
ANA Holdings | 20,000 | 44 | ||||||
Asahi Group Holdings | 1,900 | 50 | ||||||
Asahi Kasei | 4,000 | 30 | ||||||
Astellas Pharma | 1,000 | 51 | ||||||
Bank of Kyoto | 3,000 | 26 | ||||||
Bank of Yokohama | 4,000 | 23 | ||||||
Benesse, Cl A | 1,200 | 44 | ||||||
Bridgestone | 800 | 29 | ||||||
Calbee | 2,800 | 81 | ||||||
Central Japan Railway | 400 | 51 | ||||||
Chiba Bank, Cl B | 3,000 | 22 | ||||||
Chubu Electric Power | 7,600 | 104 | ||||||
Chugai Pharmaceutical | 2,500 | 51 | ||||||
Chugoku Bank | 4,000 | 56 | ||||||
Chugoku Electric Power | 8,300 | 132 | ||||||
Coca-Cola West | 2,500 | 50 | ||||||
Cosmo Oil | 62,000 | 116 | ||||||
Daicel | 3,000 | 27 | ||||||
Daiichi Sankyo | 3,000 | 54 | ||||||
Dainippon Sumitomo Pharma | 2,300 | 31 | ||||||
Daito Trust Construction | 200 | 20 | ||||||
Daiwa House Industry | 1,000 | 19 | ||||||
Daiwa Securities Group | 5,000 | 45 | ||||||
Dentsu | 700 | 27 | ||||||
East Japan Railway | 400 | 34 | ||||||
Eisai | 1,000 | 41 | ||||||
Electric Power Development | 4,200 | 137 | ||||||
FamilyMart, Cl H | 2,300 | 99 | ||||||
FUJIFILM Holdings | 400 | 10 | ||||||
Fukuoka Financial Group | 5,000 | 23 | ||||||
Hachijuni Bank | 5,000 | 31 | ||||||
Hakuhodo DY Holdings | 4,900 | 36 | ||||||
Hankyu Hanshin Holdings | 7,000 | 39 | ||||||
Hirose Electric | 200 | 31 | ||||||
Hisamitsu Pharmaceutical | 1,500 | 84 | ||||||
Hitachi Chemical | 839 | 14 | ||||||
Hitachi Metals | 2,000 | 25 | ||||||
| 182 | SEI Institutional Managed Trust / Annual Report / September 30, 2013 |
| Description | Shares | Market Value ($ Thousands) | ||||||
Hokkaido Electric Power | 6,700 | $ | 90 | |||||
Hokuriku Electric Power | 5,900 | 86 | ||||||
Idemitsu Kosan | 900 | 78 | ||||||
Inpex | 5,200 | 61 | ||||||
Isetan Mitsukoshi Holdings | 1,300 | 19 | ||||||
Itochu Techno-Solutions | 2,300 | 82 | ||||||
Iyo Bank | 6,000 | 63 | ||||||
J Front Retailing | 3,000 | 25 | ||||||
Japan Petroleum Exploration | 1,400 | 60 | ||||||
Japan Prime Realty Investment, Cl A† | 6 | 21 | ||||||
Japan Real Estate Investment† | 3 | 35 | ||||||
Japan Retail Fund Investment, Cl A† | 11 | 23 | ||||||
Japan Tobacco | 1,200 | 43 | ||||||
Joyo Bank | 8,000 | 43 | ||||||
JX Holdings | 13,100 | 68 | ||||||
Kamigumi | 3,000 | 25 | ||||||
Kaneka | 4,000 | 26 | ||||||
Kansai Electric Power | 6,200 | 80 | ||||||
Kansai Paint | 3,000 | 40 | ||||||
Kao | 1,500 | 47 | ||||||
KDDI | 3,200 | 164 | ||||||
Keikyu | 10,000 | 95 | ||||||
Keio | 4,000 | 29 | ||||||
Keyence | 100 | 38 | ||||||
Kikkoman | 2,000 | 37 | ||||||
Kinden | 3,000 | 32 | ||||||
Kintetsu | 15,000 | 56 | ||||||
Kirin Holdings | 3,000 | 44 | ||||||
Konami | 456 | 11 | ||||||
Kuraray | 2,000 | 24 | ||||||
Kyocera | 400 | 21 | ||||||
Kyushu Electric Power | 5,100 | 73 | ||||||
Lawson | 1,400 | 110 | ||||||
LIXIL Group | 800 | 16 | ||||||
M3 | 39 | 108 | ||||||
Maruichi Steel Tube | 1,300 | 32 | ||||||
McDonald’s Holdings Japan | 5,100 | 141 | ||||||
Medipal Holdings | 3,200 | 39 | ||||||
MEIJI Holdings | 1,500 | 82 | ||||||
Miraca Holdings | 1,800 | 80 | ||||||
Mitsubishi Chemical Holdings, Cl B | 5,000 | 23 | ||||||
Mitsubishi Motors* | 2,000 | 22 | ||||||
Mitsubishi Tanabe Pharma | 3,800 | 53 | ||||||
Mitsui Chemicals | 9,000 | 25 | ||||||
Murata Manufacturing | 500 | 38 | ||||||
NEC | 12,000 | 28 | ||||||
Nintendo | 200 | 23 | ||||||
Nippon Building Fund† | 2 | 25 | ||||||
Nippon Electric Glass | 4,000 | 21 | ||||||
Nippon Express | 5,000 | 25 | ||||||
Nippon Steel & Sumitomo Metal | 9,555 | 32 | ||||||
Nippon Telegraph & Telephone | 3,700 | 192 | ||||||
Nishi-Nippon City Bank | 8,000 | 22 | ||||||
Nisshin Seifun Group | 3,850 | 39 | ||||||
| Description | Shares | Market Value ($ Thousands) | ||||||
Nissin Food Products | 1,900 | $ | 78 | |||||
Nitori | 800 | 73 | ||||||
Nomura Research Institute | 1,800 | 62 | ||||||
NTT Data | 800 | 27 | ||||||
NTT DOCOMO | 14,300 | 232 | ||||||
Odakyu Electric Railway | 3,000 | 30 | ||||||
Oji Holdings | 10,000 | 47 | ||||||
Olympus | 2,300 | 70 | ||||||
Ono Pharmaceutical | 1,000 | 62 | ||||||
Oracle Japan | 1,300 | 48 | ||||||
Oriental Land | 1,000 | 165 | ||||||
Osaka Gas | 40,000 | 171 | ||||||
Otsuka | 400 | 51 | ||||||
Otsuka Holdings | 1,800 | 52 | ||||||
Resona Holdings | 7,800 | 40 | ||||||
Rinnai | 700 | 52 | ||||||
Rohm | 800 | 33 | ||||||
Sankyo | 1,100 | 54 | ||||||
Santen Pharmaceutical | 1,400 | 68 | ||||||
Sega Sammy Holdings | 900 | 26 | ||||||
Sekisui Chemical | 3,000 | 30 | ||||||
Sekisui House | 2,000 | 27 | ||||||
Seven & I Holdings | 1,400 | 51 | ||||||
Seven Bank | 11,800 | 39 | ||||||
Shikoku Electric Power | 6,500 | 110 | ||||||
Shimadzu | 4,000 | 38 | ||||||
Shimamura | 500 | 50 | ||||||
Shimizu | 6,000 | 30 | ||||||
Shin-Etsu Chemical, Cl A | 400 | 24 | ||||||
Shiseido | 3,100 | 56 | ||||||
Showa Denko | 23,000 | 31 | ||||||
Showa Shell Sekiyu | 10,700 | 120 | ||||||
Softbank | 1,600 | 111 | ||||||
Sumitomo | 1,400 | 19 | ||||||
Suruga Bank | 2,000 | 34 | ||||||
Suzuken | 1,900 | 63 | ||||||
Sysmex | 1,000 | 64 | ||||||
Taiyo Nippon Sanso | 4,000 | 27 | ||||||
Takeda Pharmaceutical | 900 | 43 | ||||||
Teijin | 10,000 | 23 | ||||||
Terumo | 400 | 20 | ||||||
Tobu Railway | 7,000 | 37 | ||||||
Toho | 1,600 | 33 | ||||||
Toho Gas | 59,063 | 309 | ||||||
Tohoku Electric Power | 6,400 | 79 | ||||||
Tokyo Electric Power | 8,200 | 51 | ||||||
Tokyo Gas | 40,000 | 219 | ||||||
Tokyu | 4,000 | 28 | ||||||
TonenGeneral Sekiyu | 37,000 | 342 | ||||||
Toray Industries | 4,000 | 26 | ||||||
TOTO | 2,000 | 28 | ||||||
Toyo Seikan Group Holdings | 1,900 | 37 | ||||||
Toyo Suisan Kaisha | 2,000 | 59 | ||||||
Toyota Industries | 700 | 30 | ||||||
| SEI Institutional Managed Trust / Annual Report / September 30, 2013 | 183 |
CONSOLIDATED SCHEDULE OF INVESTMENTS
Multi-Asset Accumulation Fund (Continued)
September 30, 2013
| Description | Shares | Market Value ($ Thousands) | ||||||
Toyota Motor | 500 | $ | 32 | |||||
Tsumura | 1,600 | 47 | ||||||
Ube Industries | 17,000 | 32 | ||||||
Unicharm | 1,500 | 87 | ||||||
USS | 2,700 | 39 | ||||||
West Japan Railway | 700 | 30 | ||||||
Yahoo Japan | 12,400 | 70 | ||||||
Yakult Honsha | 1,000 | 50 | ||||||
Yamaguchi Financial Group | 3,000 | 30 | ||||||
Yamato Holdings | 1,400 | 32 | ||||||
Yamato Kogyo | 600 | 22 | ||||||
Yamazaki Baking | 14,000 | 151 | ||||||
|
| |||||||
| 9,259 | ||||||||
|
| |||||||
Netherlands — 0.1% |
| |||||||
Aegon | 4,287 | 32 | ||||||
Akzo Nobel | 1,034 | 68 | ||||||
ASML Holding NV | 1,653 | 163 | ||||||
Corio† | 1,083 | 47 | ||||||
Delta Lloyd | 2,203 | 47 | ||||||
Fugro | 1,579 | 96 | ||||||
Gemalto | 1,917 | 206 | ||||||
Heineken | 867 | 61 | ||||||
ING Groep* | 2,732 | 31 | ||||||
Koninklijke Ahold | 4,613 | 80 | ||||||
Koninklijke DSM | 1,235 | 93 | ||||||
LyondellBasell Industries, Cl A | 2,407 | 177 | ||||||
QIAGEN* | 3,735 | 81 | ||||||
Reed Elsevier | 7,150 | 144 | ||||||
Royal KPN | 48,403 | 154 | ||||||
STMicroelectronics | 7,564 | 70 | ||||||
TNT Express NV | 3,349 | 31 | ||||||
Unilever | 2,163 | 84 | ||||||
Wolters Kluwer | 4,314 | 111 | ||||||
Ziggo NV | 2,791 | 113 | ||||||
|
| |||||||
| 1,889 | ||||||||
|
| |||||||
New Zealand — 0.1% |
| |||||||
Auckland International Airport | 55,944 | 155 | ||||||
Contact Energy* | 55,790 | 251 | ||||||
Fletcher Building | 17,849 | 141 | ||||||
Sky City Entertainment Group | 30,711 | 103 | ||||||
Telecom Corp of New Zealand | 99,640 | 193 | ||||||
|
| |||||||
| 843 | ||||||||
|
| |||||||
Norway — 0.0% |
| |||||||
Aker Solutions | 3,228 | 45 | ||||||
DNB, Cl A | 4,057 | 62 | ||||||
Gjensidige Forsikring | 3,894 | 59 | ||||||
Norsk Hydro | 19,704 | 82 | ||||||
Orkla | 10,965 | 80 | ||||||
Seadrill | 1,310 | 59 | ||||||
Statoil | 2,091 | 47 | ||||||
| Description | Shares | Market Value ($ Thousands) | ||||||
Subsea 7 | 2,038 | $ | 42 | |||||
Telenor | 4,097 | 94 | ||||||
Yara International | 2,094 | 86 | ||||||
|
| |||||||
| 656 | ||||||||
|
| |||||||
Panama — 0.0% |
| |||||||
Carnival | 1,100 | 36 | ||||||
|
| |||||||
Portugal — 0.0% |
| |||||||
Banco Espirito Santo | 50,830 | 54 | ||||||
EDP - Energias de Portugal | 46,145 | 169 | ||||||
Galp Energia SGPS | 6,993 | 116 | ||||||
Jeronimo Martins SGPS | 5,196 | 107 | ||||||
Portugal Telecom SGPS | 30,665 | 138 | ||||||
|
| |||||||
| 584 | ||||||||
|
| |||||||
Singapore — 0.1% |
| |||||||
CapitaLand | 16,000 | 39 | ||||||
CapitaMalls Asia | 23,000 | 36 | ||||||
DBS Group Holdings | 3,000 | 39 | ||||||
Global Logistic Properties | 17,000 | 39 | ||||||
Golden Agri-Resources | 212,000 | 88 | ||||||
Hutchison Port Holdings, Cl U | 59,000 | 46 | ||||||
Jardine Cycle & Carriage | 3,000 | 91 | ||||||
Keppel | 7,000 | 58 | ||||||
Keppel Land | 18,000 | 51 | ||||||
Olam International | 72,000 | 88 | ||||||
Oversea-Chinese Banking | 4,000 | 33 | ||||||
SembCorp Marine | 14,000 | 51 | ||||||
Singapore Press Holdings | 45,000 | 147 | ||||||
Singapore Telecommunications | 40,000 | 119 | ||||||
StarHub | 52,000 | 178 | ||||||
United Overseas Bank | 2,000 | 33 | ||||||
|
| |||||||
| 1,136 | ||||||||
|
| |||||||
Spain — 0.1% |
| |||||||
Abertis Infraestructuras | 3,168 | 62 | ||||||
Acciona | 1,009 | 57 | ||||||
Amadeus IT Holding, Cl A | 6,898 | 245 | ||||||
Distribuidora Internacional de Alimentacion | 15,138 | 131 | ||||||
Enagas | 2,650 | 65 | ||||||
Gas Natural SDG | 3,251 | 68 | ||||||
Grifols | 4,255 | 175 | ||||||
Iberdrola | 11,015 | 64 | ||||||
Inditex | 917 | 141 | ||||||
International Consolidated Airlines Group* | 7,033 | 38 | ||||||
Red Electrica, Cl B | 1,399 | 80 | ||||||
Repsol, Cl A | 5,486 | 136 | ||||||
Telefonica | 7,193 | 112 | ||||||
Zardoya Otis | 3,490 | 57 | ||||||
|
| |||||||
| 1,431 | ||||||||
|
| |||||||
| 184 | SEI Institutional Managed Trust / Annual Report / September 30, 2013 |
| Description | Shares | Market Value ($ Thousands) | ||||||
Sweden — 0.1% |
| |||||||
Atlas Copco, Cl A | 1,818 | $ | 53 | |||||
Atlas Copco, Cl B | 1,891 | 50 | ||||||
Boliden | 6,103 | 91 | ||||||
Elekta, Cl B | 8,720 | 140 | ||||||
Getinge, Cl B | 3,536 | 127 | ||||||
Hennes & Mauritz, Cl B | 1,697 | 74 | ||||||
Hexagon, Cl B | 2,948 | 89 | ||||||
Husqvarna, Cl B | 10,117 | 66 | ||||||
Industrivarden, Cl C | 2,237 | 41 | ||||||
Investment Kinnevik, Cl B | 1,565 | 54 | ||||||
Lundin Petroleum* | 5,644 | 122 | ||||||
Millicom International Cellular | 574 | 51 | ||||||
Nordea Bank | 3,377 | 41 | ||||||
Ratos, Cl B | 4,826 | 45 | ||||||
Skandinaviska Enskilda Banken, Cl A | 2,527 | 27 | ||||||
Svenska Cellulosa, Cl B | 2,836 | 71 | ||||||
Swedbank, Cl A | 2,347 | 54 | ||||||
Swedish Match | 2,237 | 79 | ||||||
Tele2, Cl B | 5,367 | 69 | ||||||
Telefonaktiebolaget LM Ericsson, Cl B | 11,415 | 152 | ||||||
TeliaSonera | 16,045 | 123 | ||||||
Volvo, Cl B | 2,403 | 36 | ||||||
|
| |||||||
| 1,655 | ||||||||
|
| |||||||
Switzerland — 0.2% |
| |||||||
ABB | 2,216 | 52 | ||||||
ACE | 744 | 70 | ||||||
Actelion* | 1,453 | 103 | ||||||
Adecco | 787 | 56 | ||||||
Aryzta | 892 | 60 | ||||||
Baloise Holding | 537 | 59 | ||||||
Barry Callebaut | 52 | 52 | ||||||
Cie Financiere Richemont | 680 | 68 | ||||||
EMS-Chemie Holding | 226 | 80 | ||||||
Givaudan | 59 | 86 | ||||||
Holcim | 803 | 60 | ||||||
Kuehne & Nagel International | 331 | 43 | ||||||
Lindt & Spruengli | 17 | 113 | ||||||
Lonza Group | 1,119 | 92 | ||||||
Nestle | 1,249 | 87 | ||||||
Noble | 2,036 | 77 | ||||||
Novartis | 1,376 | 106 | ||||||
Partners Group Holding | 160 | 39 | ||||||
Pentair | 964 | 63 | ||||||
Roche Holding | 431 | 116 | ||||||
Schindler Holding | 307 | 45 | ||||||
SGS, Cl B | 17 | 41 | ||||||
Sika | 28 | 82 | ||||||
Sonova Holding | 687 | 85 | ||||||
Swatch Group | 806 | 91 | ||||||
Swatch Group, Cl B | 139 | 89 | ||||||
Swiss Life Holding* | 52 | 10 | ||||||
| Description | Shares | Market Value ($ Thousands) | ||||||
Swisscom | 463 | $ | 222 | |||||
Syngenta | 167 | 68 | ||||||
TE Connectivity | 1,250 | 65 | ||||||
Transocean | 1,794 | 80 | ||||||
Tyco International | 2,113 | 74 | ||||||
|
| |||||||
| 2,434 | ||||||||
|
| |||||||
United Kingdom — 0.3% |
| |||||||
AMEC | 4,533 | 79 | ||||||
Anglo American | 1,410 | 35 | ||||||
Antofagasta | 4,282 | 57 | ||||||
Aon | 1,040 | 77 | ||||||
ARM Holdings | 16,396 | 262 | ||||||
Associated British Foods | 1,929 | 58 | ||||||
AstraZeneca | 2,421 | 126 | ||||||
BG Group | 4,346 | 83 | ||||||
BHP Billiton | 1,565 | 46 | ||||||
BP | 9,694 | 68 | ||||||
British American Tobacco | 862 | 46 | ||||||
British Sky Broadcasting Group | 2,333 | 33 | ||||||
BT Group, Cl A | 22,256 | 124 | ||||||
Bunzl | 1,394 | 30 | ||||||
Burberry Group | 1,376 | 36 | ||||||
Capita | 2,265 | 37 | ||||||
Centrica | 21,436 | 129 | ||||||
Compass Group | 2,787 | 39 | ||||||
Croda International | 1,447 | 62 | ||||||
Diageo | 1,208 | 38 | ||||||
Ensco, Cl A | 1,382 | 74 | ||||||
G4S | 5,689 | 23 | ||||||
GlaxoSmithKline | 5,929 | 150 | ||||||
IMI | 1,799 | 42 | ||||||
Imperial Tobacco Group | 919 | 34 | ||||||
Inmarsat | 11,267 | 129 | ||||||
InterContinental Hotels Group | 1,657 | 48 | ||||||
Intertek Group | 544 | 29 | ||||||
J Sainsbury | 7,007 | 44 | ||||||
Johnson Matthey | 1,033 | 47 | ||||||
Marks & Spencer Group | 4,422 | 35 | ||||||
National Grid | 10,422 | 123 | ||||||
Next, Cl A | 560 | 47 | ||||||
Pearson | 1,667 | 34 | ||||||
Petrofac | 2,796 | 64 | ||||||
Reckitt Benckiser Group | 1,075 | 79 | ||||||
Reed Elsevier | 3,034 | 41 | ||||||
Resolution | 5,557 | 29 | ||||||
Rowan, Cl A* | 2,081 | 76 | ||||||
Royal Dutch Shell, Cl A | 1,470 | 49 | ||||||
Royal Dutch Shell, Cl B | 1,430 | 49 | ||||||
SABMiller | 864 | 44 | ||||||
Sage Group | 42,310 | 226 | ||||||
Serco Group | 3,002 | 27 | ||||||
Severn Trent | 5,554 | 159 | ||||||
Shire | 3,969 | 159 | ||||||
| SEI Institutional Managed Trust / Annual Report / September 30, 2013 | 185 |
CONSOLIDATED SCHEDULE OF INVESTMENTS
Multi-Asset Accumulation Fund (Continued)
September 30, 2013
| Description | Shares | Market Value ($ Thousands) | ||||||
Smith & Nephew | 12,212 | $ | 152 | |||||
Smiths Group | 1,958 | 44 | ||||||
SSE | 4,666 | 111 | ||||||
Tesco | 5,643 | 33 | ||||||
Travis Perkins | 1,784 | 48 | ||||||
TUI Travel | 8,063 | 48 | ||||||
Tullow Oil | 3,090 | 51 | ||||||
Unilever | 1,003 | 40 | ||||||
United Utilities Group, Cl B | 13,136 | 147 | ||||||
Vedanta Resources | 1,769 | 31 | ||||||
Vodafone Group | 34,449 | 121 | ||||||
WM Morrison Supermarkets | 17,806 | 81 | ||||||
WPP | 2,771 | 57 | ||||||
|
| |||||||
| 4,290 | ||||||||
|
| |||||||
Total Foreign Common Stock | 46,018 | |||||||
|
| |||||||
COMMON STOCK — 3.2% |
| |||||||
Consumer Discretionary — 0.3% |
| |||||||
Abercrombie & Fitch, Cl A | 616 | 22 | ||||||
Amazon.com, Cl A | 210 | 66 | ||||||
Autonation* | 925 | 48 | ||||||
Autozone* | 115 | 49 | ||||||
Bed Bath & Beyond* | 871 | 67 | ||||||
Best Buy | 1,721 | 65 | ||||||
BorgWarner | 491 | 50 | ||||||
Cablevision Systems, Cl A | 2,692 | 45 | ||||||
CarMax* | 974 | 47 | ||||||
Chipotle Mexican Grill, Cl A* | 131 | 56 | ||||||
Coach | 821 | 45 | ||||||
Comcast, Cl A | 1,101 | 50 | ||||||
Darden Restaurants | 1,212 | 56 | ||||||
Delphi Automotive | 1,026 | 60 | ||||||
DIRECTV* | 748 | 45 | ||||||
Discovery Communications, Cl A* | 611 | 52 | ||||||
Dollar General* | 504 | 28 | ||||||
Dollar Tree* | 1,222 | 70 | ||||||
DR Horton | 2,237 | 44 | ||||||
Expedia | 660 | 34 | ||||||
Family Dollar Stores | 827 | 60 | ||||||
Ford Motor | 2,814 | 48 | ||||||
Fossil Group* | 286 | 33 | ||||||
GameStop, Cl A | 1,141 | 57 | ||||||
Gannett | 1,572 | 42 | ||||||
Gap | 1,346 | 54 | ||||||
Garmin | 1,579 | 71 | ||||||
Genuine Parts | 563 | 46 | ||||||
Goodyear Tire & Rubber | 1,413 | 32 | ||||||
H&R Block | 1,409 | 38 | ||||||
Harley-Davidson, Cl A | 750 | 48 | ||||||
Harman International Industries, Cl A | 580 | 38 | ||||||
Hasbro | 950 | 45 | ||||||
Home Depot | 660 | 50 | ||||||
| Description | Shares | Market Value ($ Thousands) | ||||||
International Game Technology | 1,882 | $ | 36 | |||||
J.C. Penney* | 1,950 | 17 | ||||||
Johnson Controls | 1,192 | 49 | ||||||
Kohl’s | 1,084 | 56 | ||||||
L Brands | 1,100 | 67 | ||||||
Leggett & Platt | 1,194 | 36 | ||||||
Lennar, Cl A | 590 | 21 | ||||||
Lowe’s | 1,189 | 57 | ||||||
Macy’s | 680 | 29 | ||||||
Marriott International, Cl A | 1,390 | 59 | ||||||
Mattel | 979 | 41 | ||||||
McDonald’s | 711 | 68 | ||||||
NetFlix* | 63 | 19 | ||||||
Newell Rubbermaid, Cl B | 1,797 | 49 | ||||||
News* | 3,347 | 54 | ||||||
Nike, Cl B | 721 | 52 | ||||||
Nordstrom | 882 | 50 | ||||||
Omnicom Group | 1,019 | 65 | ||||||
O’Reilly Automotive* | 451 | 58 | ||||||
priceline.com* | 63 | 64 | ||||||
PulteGroup | 1,493 | 25 | ||||||
Ralph Lauren, Cl A | 318 | 52 | ||||||
Ross Stores | 730 | 53 | ||||||
Scripps Networks Interactive, Cl A | 899 | 70 | ||||||
Snap-on | 540 | 54 | ||||||
Staples | 3,156 | 46 | ||||||
Starbucks | 728 | 56 | ||||||
Target, Cl A | 839 | 54 | ||||||
Tiffany | 538 | 41 | ||||||
Time Warner | 1,132 | 74 | ||||||
Time Warner Cable, Cl A | 381 | 42 | ||||||
TJX | 1,183 | 67 | ||||||
TripAdvisor | 637 | 48 | ||||||
Twenty-First Century Fox | 1,390 | 46 | ||||||
Urban Outfitters* | 1,312 | 48 | ||||||
VF | 223 | 45 | ||||||
Viacom, Cl B | 751 | 63 | ||||||
Walt Disney | 583 | 38 | ||||||
Washington Post, Cl B | 90 | 55 | ||||||
Whirlpool | 206 | 30 | ||||||
Wyndham Worldwide | 853 | 52 | ||||||
Wynn Resorts | 287 | 45 | ||||||
Yum! Brands | 892 | 64 | ||||||
|
| |||||||
| 3,776 | ||||||||
|
| |||||||
Consumer Staples — 0.4% |
| |||||||
Altria Group | 3,188 | 109 | ||||||
Archer-Daniels-Midland | 4,069 | 150 | ||||||
Avon Products | 5,745 | 118 | ||||||
Beam | 1,964 | 127 | ||||||
Brown-Forman, Cl B | 1,540 | 105 | ||||||
Campbell Soup | 4,159 | 169 | ||||||
Clorox | 2,680 | 219 | ||||||
Coca-Cola | 3,925 | 149 | ||||||
| 186 | SEI Institutional Managed Trust / Annual Report / September 30, 2013 |
| Description | Shares | Market Value ($ Thousands) | ||||||
Coca-Cola Enterprises | 3,533 | $ | 142 | |||||
Colgate-Palmolive | 2,381 | 141 | ||||||
ConAgra Foods | 4,444 | 135 | ||||||
Constellation Brands, Cl A* | 1,604 | 92 | ||||||
Costco Wholesale | 969 | 111 | ||||||
CVS Caremark | 2,373 | 135 | ||||||
Dr Pepper Snapple Group | 3,659 | 164 | ||||||
Estee Lauder, Cl A | 2,003 | 140 | ||||||
General Mills, Cl A | 3,438 | 165 | ||||||
Hershey | 1,843 | 171 | ||||||
Hormel Foods | 4,156 | 175 | ||||||
JM Smucker | 1,476 | 155 | ||||||
Kellogg | 2,374 | 139 | ||||||
Kimberly-Clark | 1,728 | 163 | ||||||
Kraft Foods | 3,022 | 158 | ||||||
Kroger | 3,477 | 140 | ||||||
Lorillard | 3,205 | 144 | ||||||
McCormick | 2,421 | 157 | ||||||
Mead Johnson Nutrition, Cl A | 3,034 | 225 | ||||||
Molson Coors Brewing, Cl B | 2,464 | 124 | ||||||
Monster Beverage* | 2,798 | 146 | ||||||
PepsiCo | 1,678 | 133 | ||||||
Philip Morris International | 1,529 | 132 | ||||||
Procter & Gamble | 2,259 | 171 | ||||||
Reynolds American | 3,768 | 184 | ||||||
Safeway | 3,655 | 117 | ||||||
SYSCO, Cl A | 5,912 | 188 | ||||||
Tyson Foods, Cl A | 5,020 | 142 | ||||||
Walgreen | 2,873 | 155 | ||||||
Wal-Mart Stores | 1,615 | 119 | ||||||
Whole Foods Market | 2,665 | 156 | ||||||
Wilmar International | 25,000 | 63 | ||||||
|
| |||||||
| 5,828 | ||||||||
|
| |||||||
Energy — 0.2% |
| |||||||
Anadarko Petroleum, Cl A | 913 | 85 | ||||||
Apache | 962 | 82 | ||||||
Baker Hughes | 1,842 | 90 | ||||||
Cabot Oil & Gas | 2,202 | 82 | ||||||
Cameron International* | 1,419 | 83 | ||||||
Chesapeake Energy | 2,877 | 74 | ||||||
Chevron | 824 | 100 | ||||||
ConocoPhillips | 1,874 | 130 | ||||||
Consol Energy | 2,205 | 74 | ||||||
Denbury Resources* | 4,420 | 81 | ||||||
Devon Energy | 1,312 | 76 | ||||||
Diamond Offshore Drilling | 1,277 | 80 | ||||||
EOG Resources | 554 | 94 | ||||||
EQT | 1,153 | 102 | ||||||
Exxon Mobil | 1,312 | 113 | ||||||
FMC Technologies* | 1,398 | 78 | ||||||
Halliburton | 643 | 31 | ||||||
Helmerich & Payne | 1,122 | 77 | ||||||
Hess | 1,139 | 88 | ||||||
| Description | Shares | Market Value ($ Thousands) | ||||||
Kinder Morgan | 2,406 | $ | 86 | |||||
Marathon Oil | 2,383 | 83 | ||||||
Marathon Petroleum | 1,088 | 70 | ||||||
Murphy Oil | 1,363 | 82 | ||||||
Nabors Industries | 3,968 | 64 | ||||||
National Oilwell Varco, Cl A | 979 | 76 | ||||||
Newfield Exploration* | 2,882 | 79 | ||||||
Noble Energy | 1,386 | 93 | ||||||
Occidental Petroleum | 1,154 | 108 | ||||||
Peabody Energy | 2,929 | 51 | ||||||
Phillips 66 | 1,589 | 92 | ||||||
Pioneer Natural Resources | 370 | 70 | ||||||
QEP Resources | 3,090 | 86 | ||||||
Range Resources | 995 | 75 | ||||||
Schlumberger, Cl A | 1,258 | 111 | ||||||
Southwestern Energy, Cl A* | 2,367 | 86 | ||||||
Spectra Energy | 3,735 | 128 | ||||||
Tesoro | 1,406 | 62 | ||||||
Valero Energy | 2,379 | 81 | ||||||
Williams | 3,163 | 115 | ||||||
WPX Energy | 4,116 | 79 | ||||||
|
| |||||||
| 3,397 | ||||||||
|
| |||||||
Financials — 0.2% |
| |||||||
Admiral Group | 999 | 20 | ||||||
Aflac | 669 | 41 | ||||||
Allstate | 963 | 49 | ||||||
American Express | 700 | 53 | ||||||
American International Group | 833 | 40 | ||||||
American Tower, Cl A† | 1,028 | 76 | ||||||
Ameriprise Financial | 614 | 56 | ||||||
Apartment Investment & Management, Cl A† | 1,239 | 35 | ||||||
Assurant | 976 | 53 | ||||||
AvalonBay Communities† | 370 | 47 | ||||||
BB&T | 1,475 | 50 | ||||||
Berkshire Hathaway, Cl B* | 465 | 53 | ||||||
BlackRock | 138 | 37 | ||||||
Boston Properties† | 488 | 52 | ||||||
Capital One Financial | 700 | 48 | ||||||
CBRE Group, Cl A* | 1,563 | 36 | ||||||
Charles Schwab | 2,369 | 50 | ||||||
Chubb | 727 | 65 | ||||||
Cincinnati Financial | 1,477 | 70 | ||||||
Citigroup | 379 | 18 | ||||||
CME Group | 580 | 43 | ||||||
Comerica | 1,055 | 42 | ||||||
Discover Financial Services | 1,159 | 59 | ||||||
E*Trade Financial* | 2,270 | 37 | ||||||
Equity Residential† | 941 | 51 | ||||||
Fifth Third Bancorp | 1,854 | 34 | ||||||
Franklin Resources | 783 | 40 | ||||||
Goldman Sachs Group | 268 | 42 | ||||||
Hartford Financial Services Group | 1,315 | 41 | ||||||
| SEI Institutional Managed Trust / Annual Report / September 30, 2013 | 187 |
CONSOLIDATED SCHEDULE OF INVESTMENTS
Multi-Asset Accumulation Fund (Continued)
September 30, 2013
| Description | Shares | Market Value ($ Thousands) | ||||||
HCP† | 1,029 | $ | 42 | |||||
Health Care† | 867 | 54 | ||||||
Host Hotels & Resorts† | 3,192 | 56 | ||||||
Hudson City Bancorp, Cl A | 4,255 | 38 | ||||||
Huntington Bancshares | 5,352 | 44 | ||||||
IntercontinentalExchange* | 270 | 49 | ||||||
Invesco | 1,179 | 38 | ||||||
KeyCorp | 3,605 | 41 | ||||||
Kimco Realty† | 2,593 | 52 | ||||||
Legg Mason | 1,384 | 46 | ||||||
Leucadia National | 1,306 | 35 | ||||||
Loews | 1,087 | 51 | ||||||
M&T Bank | 449 | 50 | ||||||
Macerich† | 698 | 39 | ||||||
Marsh & McLennan | 1,756 | 76 | ||||||
McGraw-Hill | 1,029 | 67 | ||||||
Moody’s | 673 | 47 | ||||||
Morgan Stanley | 1,399 | 38 | ||||||
NASDAQ OMX Group, Cl A | 1,585 | 51 | ||||||
Northern Trust | 820 | 45 | ||||||
NYSE Euronext | 1,326 | 56 | ||||||
People’s United Financial | 3,326 | 48 | ||||||
Plum Creek Timber† | 1,119 | 53 | ||||||
PNC Financial Services Group | 592 | 43 | ||||||
Principal Financial Group, Cl A | 684 | 29 | ||||||
Progressive | 2,974 | 81 | ||||||
ProLogis† | 1,289 | 49 | ||||||
Prudential Financial | 471 | 37 | ||||||
Public Storage† | 340 | 55 | ||||||
Regions Financial | 2,939 | 27 | ||||||
Simon Property Group† | 325 | 48 | ||||||
SLM | 2,108 | 52 | ||||||
State Street | 770 | 51 | ||||||
SunTrust Banks | 1,338 | 43 | ||||||
T. Rowe Price Group | 572 | 41 | ||||||
Torchmark, Cl A | 643 | 47 | ||||||
Travelers | 849 | 72 | ||||||
US Bancorp | 1,531 | 56 | ||||||
Ventas† | 761 | 47 | ||||||
Vornado Realty Trust† | 658 | 55 | ||||||
Wells Fargo | 1,097 | 45 | ||||||
Weyerhaeuser† | 1,863 | 53 | ||||||
XL Group, Cl A | 1,587 | 49 | ||||||
Zions Bancorporation | 1,284 | 35 | ||||||
|
| |||||||
| 3,469 | ||||||||
|
| |||||||
Health Care — 0.4% |
| |||||||
Abbott Laboratories | 3,250 | 108 | ||||||
AbbVie | 1,774 | 79 | ||||||
Actavis* | 632 | 91 | ||||||
Aetna, Cl A | 1,342 | 86 | ||||||
Agilent Technologies | 1,375 | 70 | ||||||
Alexion Pharmaceuticals* | 1,062 | 123 | ||||||
Allergan | 1,152 | 104 | ||||||
| Description | Shares | Market Value ($ Thousands) | ||||||
AmerisourceBergen | 1,216 | $ | 74 | |||||
Amgen, Cl A | 1,015 | 114 | ||||||
Baxter International | 1,413 | 93 | ||||||
Becton Dickinson | 1,001 | 100 | ||||||
Biogen Idec | 453 | 109 | ||||||
Boston Scientific* | 6,344 | 75 | ||||||
Bristol-Myers Squibb | 2,520 | 116 | ||||||
C.R. Bard | 1,009 | 116 | ||||||
Cardinal Health | 1,831 | 95 | ||||||
CareFusion* | 1,711 | 63 | ||||||
Celgene, Cl A* | 658 | 101 | ||||||
Cerner* | 2,136 | 112 | ||||||
Cigna | 820 | 63 | ||||||
DaVita HealthCare Partners* | 1,274 | 73 | ||||||
Dentsply International | 1,986 | 86 | ||||||
Edwards Lifesciences, Cl A* | 1,467 | 102 | ||||||
Eli Lilly | 2,348 | 118 | ||||||
Express Scripts Holding* | 1,303 | 81 | ||||||
Forest Laboratories, Cl A* | 2,358 | 101 | ||||||
Fresenius | 614 | 76 | ||||||
Gilead Sciences* | 1,324 | 83 | ||||||
Hospira* | 2,090 | 82 | ||||||
Humana | 710 | 66 | ||||||
Intuitive Surgical* | 186 | 70 | ||||||
Johnson & Johnson | 1,072 | 93 | ||||||
Laboratory Corp of America Holdings* | 954 | 95 | ||||||
Life Technologies* | 1,059 | 79 | ||||||
McKesson | 595 | 76 | ||||||
Medtronic | 1,811 | 96 | ||||||
Merck | 2,621 | 125 | ||||||
Mondelez International, Cl A | 5,619 | 177 | ||||||
Mylan* | 2,116 | 81 | ||||||
Patterson | 2,743 | 110 | ||||||
PerkinElmer | 1,796 | 68 | ||||||
Perrigo | 655 | 81 | ||||||
Pfizer | 4,762 | 137 | ||||||
Quest Diagnostics | 1,743 | 108 | ||||||
Ramsay Health Care | 3,903 | 132 | ||||||
Regeneron Pharmaceuticals* | 331 | 104 | ||||||
St. Jude Medical | 1,964 | 105 | ||||||
Stryker | 1,505 | 102 | ||||||
Tenet Healthcare* | 910 | 37 | ||||||
Thermo Fisher Scientific | 511 | 47 | ||||||
UnitedHealth Group | 1,115 | 80 | ||||||
Varian Medical Systems* | 1,374 | 103 | ||||||
Waters* | 930 | 99 | ||||||
WellPoint | 1,014 | 85 | ||||||
Zimmer Holdings | 1,217 | 100 | ||||||
Zoetis, Cl A | 1,650 | 51 | ||||||
|
| |||||||
| 5,201 | ||||||||
|
| |||||||
Industrials — 0.3% |
| |||||||
3M | 528 | 63 | ||||||
ADT, Cl A | 1,823 | 74 | ||||||
| 188 | SEI Institutional Managed Trust / Annual Report / September 30, 2013 |
| Description | Shares | Market Value ($ Thousands) | ||||||
Avery Dennison | 2,568 | $ | 112 | |||||
Boeing | 707 | 83 | ||||||
C.H. Robinson Worldwide | 1,277 | 76 | ||||||
Caterpillar, Cl A | 615 | 51 | ||||||
Cintas | 1,538 | 79 | ||||||
CSX | 2,876 | 74 | ||||||
Cummins | 374 | 50 | ||||||
Danaher, Cl A | 910 | 63 | ||||||
Deere | 725 | 59 | ||||||
Dover | 786 | 71 | ||||||
Dun & Bradstreet | 676 | 70 | ||||||
Emerson Electric | 1,127 | 73 | ||||||
Equifax | 1,030 | 61 | ||||||
Expeditors International of Washington | 1,894 | 84 | ||||||
Fastenal, Cl A | 1,456 | 73 | ||||||
FedEx | 744 | 85 | ||||||
Flowserve | 801 | 50 | ||||||
Fluor | 896 | 64 | ||||||
General Dynamics | 849 | 74 | ||||||
General Electric | 2,213 | 53 | ||||||
Honeywell International | 801 | 67 | ||||||
Illinois Tool Works | 945 | 72 | ||||||
Jacobs Engineering Group* | 1,059 | 62 | ||||||
Joy Global | 916 | 47 | ||||||
Kansas City Southern | 131 | 14 | ||||||
Koninklijke Vopak | 2,252 | 129 | ||||||
L-3 Communications Holdings | 643 | 61 | ||||||
Leidos Holdings* | 1,290 | 59 | ||||||
Lockheed Martin | 749 | 96 | ||||||
Masco | 888 | 19 | ||||||
Norfolk Southern | 909 | 70 | ||||||
Northrop Grumman | 759 | 72 | ||||||
PACCAR | 1,085 | 60 | ||||||
Pall | 857 | 66 | ||||||
Parker Hannifin, Cl A | 653 | 71 | ||||||
Pitney Bowes | 7,020 | 128 | ||||||
Precision Castparts | 310 | 70 | ||||||
Quanta Services* | 2,414 | 66 | ||||||
Raytheon | 853 | 66 | ||||||
Republic Services | 2,778 | 93 | ||||||
Robert Half International | 2,824 | 110 | ||||||
Rockwell Automation | 815 | 87 | ||||||
Rockwell Collins | 1,049 | 71 | ||||||
Roper Industries | 388 | 52 | ||||||
Ryder System | 976 | 58 | ||||||
Southwest Airlines, Cl A | 4,540 | 66 | ||||||
Stanley Black & Decker | 854 | 77 | ||||||
Stericycle, Cl A* | 907 | 105 | ||||||
Textron | 1,911 | 53 | ||||||
Transurban Group | 5,588 | 36 | ||||||
Union Pacific | 428 | 67 | ||||||
United Parcel Service, Cl B | 682 | 62 | ||||||
United Technologies | 672 | 72 | ||||||
Waste Management | 2,460 | 101 | ||||||
| Description | Shares | Market Value ($ Thousands) | ||||||
WW Grainger | 266 | $ | 70 | |||||
Xylem | 1,841 | 51 | ||||||
|
| |||||||
| 4,068 | ||||||||
|
| |||||||
Information Technology — 0.3% |
| |||||||
Adobe Systems* | 1,333 | 69 | ||||||
Advanced Micro Devices* | 8,007 | 30 | ||||||
Akamai Technologies* | 925 | 48 | ||||||
Altera | 1,450 | 54 | ||||||
Amphenol, Cl A | 610 | 47 | ||||||
Analog Devices | 1,415 | 67 | ||||||
Apple | 164 | 78 | ||||||
Applied Materials | 3,455 | 61 | ||||||
Autodesk, Cl A* | 1,679 | 69 | ||||||
Automatic Data Processing | 894 | 65 | ||||||
Broadcom, Cl A | 1,628 | 42 | ||||||
CA | 2,697 | 80 | ||||||
Cisco Systems | 2,297 | 54 | ||||||
Citrix Systems* | 761 | 54 | ||||||
Cognizant Technology Solutions, Cl A* | 730 | 60 | ||||||
Computer Sciences | 1,176 | 61 | ||||||
Computershare | 25,553 | 237 | ||||||
Corning, Cl B | 3,400 | 50 | ||||||
Dell | 5,156 | 71 | ||||||
eBay* | 1,313 | 73 | ||||||
Electronic Arts* | 1,687 | 43 | ||||||
EMC | 2,540 | 65 | ||||||
F5 Networks, Cl A* | 643 | 55 | ||||||
Fidelity National Information Services, Cl B | 1,370 | 63 | ||||||
First Solar* | 548 | 22 | ||||||
Fiserv, Cl A* | 610 | 62 | ||||||
Flir Systems | 1,587 | 50 | ||||||
Google, Cl A* | 67 | 59 | ||||||
Harris | 1,195 | 71 | ||||||
Hewlett-Packard | 2,741 | 57 | ||||||
Intel | 2,316 | 53 | ||||||
International Business Machines | 351 | 65 | ||||||
Intuit | 1,158 | 77 | ||||||
Iron Mountain | 2,432 | 66 | ||||||
Jabil Circuit | 2,109 | 46 | ||||||
JDS Uniphase* | 3,732 | 55 | ||||||
Juniper Networks* | 2,336 | 46 | ||||||
KLA-Tencor | 1,029 | 63 | ||||||
Lam Research* | 616 | 32 | ||||||
Linear Technology | 1,618 | 64 | ||||||
LSI Logic | 7,191 | 56 | ||||||
Mastercard, Cl A | 108 | 73 | ||||||
Microchip Technology | 1,617 | 65 | ||||||
Micron Technology* | 1,195 | 21 | ||||||
Microsoft | 2,162 | 72 | ||||||
Molex | 1,451 | 56 | ||||||
Motorola Solutions | 1,017 | 60 | ||||||
NetApp | 1,304 | 56 | ||||||
| SEI Institutional Managed Trust / Annual Report / September 30, 2013 | 189 |
CONSOLIDATED SCHEDULE OF INVESTMENTS
Multi-Asset Accumulation Fund (Continued)
September 30, 2013
| Description | Shares | Market Value ($ Thousands) | ||||||
Nvidia | 2,723 | $ | 42 | |||||
Oracle, Cl B | 2,124 | 71 | ||||||
Paychex | 2,240 | 91 | ||||||
Qualcomm | 1,313 | 89 | ||||||
Red Hat* | 1,136 | 52 | ||||||
Salesforce.com* | 1,084 | 56 | ||||||
SanDisk | 768 | 46 | ||||||
Science Applications International* | 737 | 25 | ||||||
Symantec, Cl A | 2,306 | 57 | ||||||
Teradata* | 1,297 | 72 | ||||||
Teradyne* | 3,211 | 53 | ||||||
Texas Instruments | 1,935 | 78 | ||||||
Total System Services | 2,623 | 77 | ||||||
VeriSign* | 1,285 | 65 | ||||||
Visa, Cl A | 345 | 66 | ||||||
Western Digital | 788 | 50 | ||||||
Western Union | 3,461 | 64 | ||||||
Xerox | 5,181 | 53 | ||||||
Xilinx | 1,139 | 53 | ||||||
Yahoo!* | 1,891 | 63 | ||||||
|
| |||||||
| 4,166 | ||||||||
|
| |||||||
Materials — 0.2% |
| |||||||
Air Products & Chemicals | 1,352 | 144 | ||||||
Airgas | 1,173 | 125 | ||||||
Alcoa | 7,387 | 60 | ||||||
Allegheny Technologies | 2,842 | 87 | ||||||
Ball | 2,359 | 106 | ||||||
Bemis | 2,664 | 104 | ||||||
CF Industries Holdings | 537 | 113 | ||||||
Cliffs Natural Resources | 2,673 | 55 | ||||||
Dow Chemical, Cl A | 1,634 | 63 | ||||||
E.I. Du Pont de Nemours | 1,080 | 63 | ||||||
Eastman Chemical | 672 | 52 | ||||||
Ecolab | 1,093 | 108 | ||||||
FMC | 1,894 | 136 | ||||||
Freeport-McMoRan Copper & Gold, Cl B | 2,651 | 88 | ||||||
International Flavors & Fragrances | 1,619 | 133 | ||||||
International Paper | 1,802 | 81 | ||||||
MeadWestvaco | 3,031 | 116 | ||||||
Monsanto | 1,214 | 127 | ||||||
Mosaic | 1,880 | 81 | ||||||
Newmont Mining | 5,029 | 141 | ||||||
Nucor | 1,935 | 95 | ||||||
Owens-Illinois* | 3,244 | 97 | ||||||
PPG Industries | 798 | 133 | ||||||
Praxair | 1,132 | 136 | ||||||
Sealed Air | 2,847 | 78 | ||||||
Sherwin-Williams, Cl A | 699 | 127 | ||||||
Sigma-Aldrich | 1,578 | 135 | ||||||
United States Steel | 2,734 | 56 | ||||||
Vulcan Materials | 1,670 | 87 | ||||||
|
| |||||||
| 2,927 | ||||||||
|
| |||||||
| Description | Shares/Face Amount ($ Thousands) | Market Value ($ Thousands) | ||||||
Telecommunication Services — 0.4% |
| |||||||
AT&T | 33,086 | $ | 1,119 | |||||
CenturyTel | 28,596 | 897 | ||||||
Crown Castle International* | 9,972 | 728 | ||||||
Frontier Communications | 192,064 | 801 | ||||||
Verizon Communications | 22,471 | 1,049 | ||||||
Windstream Holdings | 112,610 | 901 | ||||||
|
| |||||||
| 5,495 | ||||||||
|
| |||||||
Utilities — 0.5% | ||||||||
AES | 13,993 | 186 | ||||||
AGL Resources | 4,816 | 222 | ||||||
Ameren | 6,654 | 232 | ||||||
American Electric Power | 5,065 | 220 | ||||||
Centerpoint Energy | 9,208 | 221 | ||||||
CMS Energy | 7,648 | 201 | ||||||
Consolidated Edison | 4,025 | 222 | ||||||
Dominion Resources | 4,177 | 261 | ||||||
DTE Energy | 3,334 | 220 | ||||||
Duke Energy | 3,256 | 218 | ||||||
Edison International | 4,884 | 225 | ||||||
Entergy | 3,425 | 216 | ||||||
Exelon | 7,837 | 232 | ||||||
FirstEnergy | 5,848 | 213 | ||||||
Integrys Energy Group | 4,341 | 242 | ||||||
NextEra Energy | 2,828 | 227 | ||||||
NiSource | 7,504 | 232 | ||||||
Northeast Utilities | 5,485 | 226 | ||||||
NRG Energy | 5,680 | 155 | ||||||
Oneok | 4,248 | 226 | ||||||
Pepco Holdings | 12,514 | 231 | ||||||
PG&E | 4,955 | 203 | ||||||
Pinnacle West Capital | 4,136 | 226 | ||||||
PPL | 6,977 | 212 | ||||||
Public Service Enterprise Group | 8,298 | 273 | ||||||
SCANA | 4,434 | 204 | ||||||
Sempra Energy | 2,909 | 249 | ||||||
Southern | 6,328 | 261 | ||||||
TECO Energy | 14,261 | 236 | ||||||
Wisconsin Energy | 5,698 | 230 | ||||||
Xcel Energy | 7,505 | 207 | ||||||
|
| |||||||
| 6,929 | ||||||||
|
| |||||||
Total Common Stock | 45,256 | |||||||
|
| |||||||
CORPORATE OBLIGATIONS — 2.8% |
| |||||||
Consumer Discretionary — 0.0% |
| |||||||
Trustees of Dartmouth College | ||||||||
4.750%, 06/01/2019 | $ | 250 | 284 | |||||
University of Southern California | ||||||||
5.250%, 10/01/2111 | 100 | 112 | ||||||
| 190 | SEI Institutional Managed Trust / Annual Report / September 30, 2013 |
| Description | Face Amount ($ Thousands) | Market Value ($ Thousands) | ||||||
Yale University MTN | ||||||||
2.900%, 10/15/2014 | $ | 125 | $ | 128 | ||||
|
| |||||||
| 524 | ||||||||
|
| |||||||
Consumer Staples — 0.0% | ||||||||
Wal-Mart Stores | ||||||||
2.800%, 4/15/2016 | 300 | 315 | ||||||
|
| |||||||
Energy — 0.1% | ||||||||
Chevron | ||||||||
4.950%, 03/03/2019 | 150 | 172 | ||||||
Shell International Finance BV | ||||||||
3.250%, 09/22/2015 | 250 | 263 | ||||||
StatoilHydro | ||||||||
2.900%, 10/15/2014 | 250 | 256 | ||||||
Total Capital | ||||||||
3.000%, 06/24/2015 | 250 | 260 | ||||||
XTO Energy | ||||||||
6.750%, 08/01/2037 | 300 | 401 | ||||||
|
| |||||||
| 1,352 | ||||||||
|
| |||||||
Financials — 2.2% | ||||||||
African Development Bank | ||||||||
2.500%, 03/15/2016 | 250 | 262 | ||||||
1.250%, 09/02/2016 | 850 | 862 | ||||||
1.125%, 03/15/2017 | 200 | 201 | ||||||
0.875%, 03/15/2018 | 1,000 | 977 | ||||||
Andina de Fomento | ||||||||
4.375%, 06/15/2022 | 250 | 249 | ||||||
Asian Development Bank | ||||||||
2.750%, 05/21/2014 | 850 | 864 | ||||||
2.625%, 02/09/2015 | 1,000 | 1,031 | ||||||
1.125%, 03/15/2017 | 150 | 151 | ||||||
0.500%, 06/20/2016 | 1,000 | 997 | ||||||
Australia & New Zealand Banking Group NY MTN | ||||||||
1.875%, 10/06/2017 | 250 | 249 | ||||||
Bank of Montreal MTN | ||||||||
1.400%, 09/11/2017 | 200 | 197 | ||||||
Bank of New York Mellon | ||||||||
3.550%, 09/23/2021 | 200 | 205 | ||||||
Bank of Nova Scotia | ||||||||
3.400%, 01/22/2015 | 300 | 311 | ||||||
1.850%, 01/12/2015 | 500 | 509 | ||||||
Berkshire Hathaway Finance | ||||||||
5.400%, 05/15/2018 | 250 | 288 | ||||||
Canadian Imperial Bank of Commerce | ||||||||
2.350%, 12/11/2015 | 250 | 258 | ||||||
China Development Bank | ||||||||
5.000%, 10/15/2015 | 250 | 268 | ||||||
CME Group | ||||||||
5.750%, 02/15/2014 | 200 | 204 | ||||||
3.000%, 09/15/2022 | 100 | 95 | ||||||
| Description | Face Amount ($ Thousands) | Market Value ($ Thousands) | ||||||
Commonwealth Bank of Australia NY MTN | ||||||||
1.900%, 09/18/2017 | $ | 150 | $ | 151 | ||||
Cooperatieve Centrale Raiffeisen-Boerenleenbank | ||||||||
3.375%, 01/19/2017 | 250 | 266 | ||||||
Council of Europe MTN | ||||||||
1.500%, 02/22/2017 | 850 | 861 | ||||||
Development Bank of Japan | ||||||||
5.125%, 02/01/2017 | 200 | 226 | ||||||
European Bank for Reconstruction & Development | ||||||||
1.625%, 09/03/2015 | 300 | 307 | ||||||
1.500%, 03/16/2020 | 750 | 723 | ||||||
1.000%, 02/16/2017 | 600 | 600 | ||||||
0.750%, 09/01/2017 | 200 | 196 | ||||||
European Investment Bank | ||||||||
1.125%, 09/15/2017 | 850 | 843 | ||||||
1.000%, 12/15/2017 | 150 | 147 | ||||||
Export Development Canada | ||||||||
2.250%, 05/28/2015 | 250 | 258 | ||||||
1.500%, 05/15/2014 | 500 | 504 | ||||||
0.750%, 12/15/2017 | 750 | 734 | ||||||
0.500%, 09/15/2015 | 1,250 | 1,252 | ||||||
FMS Wertmanagement | ||||||||
1.000%, 11/21/2017 | 950 | 935 | ||||||
0.625%, 04/18/2016 | 750 | 749 | ||||||
HSBC Holdings | ||||||||
5.100%, 04/05/2021 | 250 | 275 | ||||||
Inter-American Development Bank | ||||||||
4.500%, 09/15/2014 | 250 | 260 | ||||||
3.875%, 09/17/2019 | 350 | 387 | ||||||
1.125%, 03/15/2017 | 300 | 302 | ||||||
International Bank for Reconstruction & Development | ||||||||
2.375%, 05/26/2015 | 250 | 258 | ||||||
2.125%, 03/15/2016 | 300 | 311 | ||||||
0.875%, 04/17/2017 | 450 | 449 | ||||||
0.500%, 11/26/2013 to 04/15/2016 | 2,000 | 1,997 | ||||||
International Finance | ||||||||
2.125%, 11/17/2017 | 750 | 775 | ||||||
1.125%, 11/23/2016 | 750 | 756 | ||||||
1.000%, 04/24/2017 | 300 | 300 | ||||||
KFW | ||||||||
3.500%, 03/10/2014 | 1,250 | 1,268 | ||||||
1.000%, 01/12/2015 | 1,000 | 1,009 | ||||||
0.875%, 09/05/2017 | 200 | 198 | ||||||
Korea Finance | ||||||||
4.625%, 11/16/2021 | 250 | 264 | ||||||
Landwirtschaftliche Rentenbank | ||||||||
1.875%, 09/17/2018 | 550 | 555 | ||||||
1.375%, 10/23/2019 | 500 | 480 | ||||||
0.875%, 09/12/2017 | 300 | 296 | ||||||
| SEI Institutional Managed Trust / Annual Report / September 30, 2013 | 191 |
CONSOLIDATED SCHEDULE OF INVESTMENTS
Multi-Asset Accumulation Fund (Continued)
September 30, 2013
| Description | Face Amount ($ Thousands) | Market Value ($ Thousands) | ||||||
National Australia Bank Ltd. | ||||||||
1.600%, 08/07/2015 | $ | 350 | $ | 356 | ||||
Nordic Investment Bank | ||||||||
2.625%, 10/06/2014 | 250 | 256 | ||||||
1.000%, 03/07/2017 | 750 | 752 | ||||||
0.500%, 04/14/2016 | 750 | 748 | ||||||
North American Development Bank | ||||||||
2.400%, 10/26/2022 | 200 | 180 | ||||||
Oesterreichische Kontrollbank MTN | ||||||||
1.125%, 07/06/2015 | 150 | 152 | ||||||
Royal Bank of Canada MTN | ||||||||
1.150%, 03/13/2015 | 250 | 252 | ||||||
Svensk Exportkredit | ||||||||
5.125%, 03/01/2017 | 150 | 170 | ||||||
Svenska Handelsbanken | ||||||||
2.875%, 04/04/2017 | 200 | 208 | ||||||
Toronto-Dominion Bank | ||||||||
2.375%, 10/19/2016 | 250 | 258 | ||||||
Toyota Motor Credit MTN | ||||||||
3.400%, 09/15/2021 | 150 | 151 | ||||||
3.200%, 06/17/2015 | 100 | 105 | ||||||
US Bancorp MTN | ||||||||
4.200%, 05/15/2014 | 500 | 512 | ||||||
Westpac Banking | ||||||||
4.875%, 11/19/2019 | 200 | 224 | ||||||
3.000%, 08/04/2015 | 250 | 260 | ||||||
|
| |||||||
| 31,654 | ||||||||
|
| |||||||
Health Care — 0.1% | ||||||||
Johns Hopkins University | ||||||||
5.250%, 07/01/2019 | 75 | 86 | ||||||
Johnson & Johnson | ||||||||
5.950%, 08/15/2037 | 300 | 364 | ||||||
Merck Sharp & Dohme | ||||||||
6.400%, 03/01/2028 | 50 | 62 | ||||||
Novartis Securities Investment | ||||||||
5.125%, 02/10/2019 | 150 | 172 | ||||||
Sanofi-Aventis | ||||||||
4.000%, 03/29/2021 | 150 | 159 | ||||||
|
| |||||||
| 843 | ||||||||
|
| |||||||
Industrials — 0.1% | ||||||||
3M MTN | ||||||||
5.700%, 03/15/2037 | 150 | 175 | ||||||
General Electric Capital | ||||||||
0.850%, 10/09/2015 | 500 | 501 | ||||||
|
| |||||||
| 676 | ||||||||
|
| |||||||
Information Technology — 0.3% | ||||||||
3.625%, 05/19/2021 | 150 | 157 | ||||||
International Business Machines | ||||||||
6.500%, 10/15/2013 | 350 | 351 | ||||||
| Description | Face Amount ($ Thousands)/Shares | Market Value ($ Thousands) | ||||||
Microsoft | ||||||||
2.500%, 02/08/2016 | $ | 350 | $ | 364 | ||||
1.625%, 09/25/2015 | 1,250 | 1,279 | ||||||
0.875%, 11/15/2017 | 1,500 | 1,474 | ||||||
|
| |||||||
| 3,625 | ||||||||
|
| |||||||
Telecommunication Services — 0.0% |
| |||||||
Nippon Telegraph & Telephone | ||||||||
1.400%, 07/18/2017 | 200 | 199 | ||||||
|
| |||||||
Utilities — 0.0% | ||||||||
Hydro Quebec | ||||||||
2.000%, 06/30/2016 | 250 | 258 | ||||||
1.375%, 06/19/2017 | 150 | 150 | ||||||
Southern California Gas | ||||||||
5.125%, 11/15/2040 | 150 | 165 | ||||||
|
| |||||||
| 573 | ||||||||
|
| |||||||
Total Corporate Obligations | 39,761 | |||||||
|
| |||||||
EXCHANGE TRADED FUND — 0.8% |
| |||||||
iShares iBoxx Investment Grade Corporate Bond Fund | 99,184 | 11,260 | ||||||
|
| |||||||
Total Exchange Traded Fund | 11,260 | |||||||
|
| |||||||
PREFERRED STOCK — 0.0% |
| |||||||
Consumer Discretionary — 0.0% |
| |||||||
Porsche Automobil Holding SE | 342 | 30 | ||||||
|
| |||||||
Consumer Staples — 0.0% | ||||||||
Henkel & KGaA | 596 | 62 | ||||||
|
| |||||||
Utilities — 0.0% | ||||||||
RWE | 2,420 | 79 | ||||||
|
| |||||||
Total Preferred Stock | 171 | |||||||
|
| |||||||
Number of | ||||||||
WARRANTS — 0.0% | ||||||||
Olam International | ||||||||
Expires 12/31/17* | 4,698 | — | ||||||
|
| |||||||
Total Warrants | — | |||||||
|
| |||||||
Number of | ||||||||
RIGHTS — 0.0% | ||||||||
Abertis Infraestructuras | ||||||||
Expires 10/08/2013* | 3,168 | 3 | ||||||
|
| |||||||
Total Rights | 3 | |||||||
|
| |||||||
| 192 | SEI Institutional Managed Trust / Annual Report / September 30, 2013 |
| Description | Shares/Face Amounts (1) | Market Value ($ Thousands) | ||||||
CASH EQUIVALENT — 39.4% |
| |||||||
SEI Daily Income Trust, Prime Obligation Fund, Cl A 0.010%**†† | 558,119,064 | $ | 558,119 | |||||
|
| |||||||
Total Cash Equivalent | 558,119 | |||||||
|
| |||||||
TIME DEPOSITS — 14.5% |
| |||||||
Brown Brothers Harriman | ||||||||
1.698%, 10/01/2013 | AUD | 9 | 8 | |||||
1.650%, 10/01/2013 | NZD | 8 | 7 | |||||
0.672%, 10/01/2013 | NOK | 7 | 1 | |||||
0.400%, 10/01/2013 | CAD | 10 | 10 | |||||
0.250%, 10/01/2013 | SEK | 15 | 2 | |||||
0.106%, 10/01/2013 | GBP | 131 | 212 | |||||
0.030%, 10/01/2013 | 204,272 | 204,272 | ||||||
0.019%, 10/01/2013 | EUR | 512 | 693 | |||||
0.005%, 10/01/2013 | HKD | 135 | 17 | |||||
0.005%, 10/01/2013 | JPY | 5,998 | 61 | |||||
0.005%, 10/01/2013 | SGD | 3 | 2 | |||||
0.001%, 10/01/2013 | CHF | 422 | 466 | |||||
|
| |||||||
Total Time Deposits (Cost $205,751) ($ Thousands) | 205,751 | |||||||
|
| |||||||
U.S. TREASURY OBLIGATIONS — 19.4% |
| |||||||
U.S. Treasury Notes | ||||||||
0.250%, 11/30/2013 (B) | 11,000 | 11,004 | ||||||
U.S. Treasury Inflation Protected Securities | ||||||||
3.625%, 04/15/2028 | 813 | 1,124 | ||||||
2.625%, 07/15/2017 | 20,738 | 23,532 | ||||||
2.500%, 07/15/2016 | 1,536 | 1,695 | ||||||
2.500%, 01/15/2029 | 605 | 744 | ||||||
2.375%, 01/15/2025 | 1,325 | 1,581 | ||||||
2.125%, 02/15/2041 | 817 | 968 | ||||||
2.000%, 07/15/2014 | 467 | 479 | ||||||
2.000%, 01/15/2026 | 1,395 | 1,609 | ||||||
1.875%, 07/15/2015 | 862 | 910 | ||||||
1.875%, 07/15/2019 | 661 | 749 | ||||||
1.750%, 01/15/2028 | 640 | 717 | ||||||
1.625%, 01/15/2015 | 535 | 552 | ||||||
1.625%, 01/15/2018 | 18,733 | 20,587 | ||||||
1.375%, 07/15/2018 | 17,511 | 19,221 | ||||||
1.375%, 01/15/2020 | 403 | 442 | ||||||
1.250%, 07/15/2020 | 593 | 649 | ||||||
1.125%, 01/15/2021 | 1,316 | 1,416 | ||||||
0.625%, 07/15/2021 | 1,741 | 1,812 | ||||||
0.500%, 04/15/2015 | 820 | 838 | ||||||
0.125%, 04/15/2016 | 872 | 895 | ||||||
0.125%, 04/15/2017 | 47,103 | 48,572 | ||||||
0.125%, 01/15/2022 | 47,785 | 47,184 | ||||||
0.125%, 07/15/2022 | 1,524 | 1,501 | ||||||
| Description | Face Amounts | Market Value ($ Thousands) | ||||||
U.S. Treasury Bills | ||||||||
0.064%, 12/12/2013 (A) | $ | 85,500 | $ | 85,497 | ||||
|
| |||||||
Total U.S. Treasury Obligations | 274,278 | |||||||
|
| |||||||
Total Investments — 96.1% | $ | 1,359,787 | ||||||
|
| |||||||
A list of the open futures contracts held by the Fund at September 30, 2013, is as follows:
| Type of Contract | Number of Contracts Long | Expiration Date | Unrealized Appreciation (Depreciation) ($ Thousands) | |||||||||
Amsterdam Index | 47 | Oct-2013 | $ | (94 | ) | |||||||
CAC40 10 Euro | 269 | Oct-2013 | (4 | ) | ||||||||
DAX Index | 34 | Dec-2013 | (28 | ) | ||||||||
DJ Euro Stoxx 50 Index | 805 | Dec-2013 | (78 | ) | ||||||||
FTSE 100 Index | 341 | Dec-2013 | (683 | ) | ||||||||
FTSE MIB Index | 56 | Dec-2013 | (54 | ) | ||||||||
FTSE/JSE TOP 40 Index | 326 | Dec-2013 | 92 | |||||||||
Hang Seng Index | 99 | Oct-2013 | (201 | ) | ||||||||
H-Shares Index | 343 | Oct-2013 | (646 | ) | ||||||||
IBEX 35 Plus Index | 64 | Oct-2013 | 156 | |||||||||
KOSPI 200 Index | 128 | Dec-2013 | 23 | |||||||||
MSCI EAFE Index E-MINI | 246 | Dec-2013 | 164 | |||||||||
MSCI Emerging Market Index E-MINI | 260 | Dec-2013 | (188 | ) | ||||||||
Russell 2000 Index E-MINI | 529 | Dec-2013 | 1,083 | |||||||||
S&P 500 Index E-MINI | 2,467 | Dec-2013 | (1,120 | ) | ||||||||
S&P Composite Index | 8 | Dec-2013 | (34 | ) | ||||||||
S&P Mid 400 Index E-MINI | 180 | Dec-2013 | 220 | |||||||||
S&P TSE 60 Index | 55 | Dec-2013 | (3 | ) | ||||||||
SGX S&P CNX NIFTY Index | 302 | Oct-2013 | (110 | ) | ||||||||
SPI 200 Index | 81 | Dec-2013 | (54 | ) | ||||||||
Taiwan Index | 338 | Oct-2013 | (168 | ) | ||||||||
Topix Index | 383 | Dec-2013 | 444 | |||||||||
Australian 10-Year Bond | 468 | Dec-2013 | 1,180 | |||||||||
Canadian 10-Year Bond | 531 | Dec-2013 | 802 | |||||||||
Euro-Bund | 1,072 | Dec-2013 | 2,742 | |||||||||
Euro-Buxl 30 Year Bond | 40 | Dec-2013 | 157 | |||||||||
Euro-BOBL | 8 | Dec-2013 | 19 | |||||||||
Euro-Schatz | 88 | Dec-2013 | 33 | |||||||||
Japanese 10-Year Bond | 89 | Dec-2013 | 948 | |||||||||
Long Gilt 10-Year Bond | 277 | Dec-2013 | 453 | |||||||||
Mini Japan 10-YR Bond | 322 | Dec-2013 | 408 | |||||||||
U.S. 10-Year Treasury Note | 2,079 | Dec-2013 | 3,452 | |||||||||
U.S. 2-Year Treasury Note | 252 | Dec-2013 | 143 | |||||||||
U.S. 5-Year Treasury Note | 234 | Dec-2013 | 290 | |||||||||
U.S. Long Treasury Bond | 111 | Dec-2013 | 254 | |||||||||
Brent Crude Penultimate | 14 | Oct-2013 | (78 | ) | ||||||||
Cocoa | 60 | Dec-2013 | 149 | |||||||||
Coffee ‘C’ | 111 | Dec-2013 | (371 | ) | ||||||||
Copper | 20 | Dec-2013 | (5 | ) | ||||||||
Corn | 69 | Dec-2013 | (259 | ) | ||||||||
Corn | 207 | Mar-2014 | (388 | ) | ||||||||
Cotton | 64 | Dec-2013 | 63 | |||||||||
Cotton | 40 | Mar-2014 | 95 | |||||||||
Crude Oil | 15 | Dec-2013 | (67 | ) | ||||||||
Feeder Cattle | 5 | Nov-2013 | 17 | |||||||||
Feeder Cattle | 33 | Oct-2013 | 76 | |||||||||
Gasoil | 14 | Dec-2013 | (7 | ) | ||||||||
Gasoline RBOB | 17 | Dec-2013 | (160 | ) | ||||||||
Gold | 126 | Dec-2013 | 222 | |||||||||
Heating Oil | 10 | Nov-2013 | — | |||||||||
Lead | 33 | Mar-2014 | (22 | ) | ||||||||
Lean Hogs | 290 | Dec-2013 | 512 | |||||||||
Lean Hogs | 86 | Feb-2014 | 75 | |||||||||
Live Cattle | 203 | Dec-2013 | 260 | |||||||||
LME Aluminum | 57 | Dec-2013 | 10 | |||||||||
LME Aluminum | 174 | Mar-2014 | 122 | |||||||||
| SEI Institutional Managed Trust / Annual Report / September 30, 2013 | 193 |
CONSOLIDATED SCHEDULE OF INVESTMENTS
Multi-Asset Accumulation Fund (Continued)
September 30, 2013
| Type of Contract | Number of Contracts Long | Expiration Date | Unrealized Appreciation (Depreciation) ($ Thousands) | |||||||||
LME Copper | 85 | Mar-2014 | $ | 254 | ||||||||
LME Nickel | 14 | Mar-2014 | 14 | |||||||||
LME Nickel | 20 | Nov-2013 | 21 | |||||||||
LME Zinc | 115 | Mar-2014 | 71 | |||||||||
LME Zinc | 41 | Nov-2013 | (5 | ) | ||||||||
Natural Gas | 75 | Dec-2013 | (83 | ) | ||||||||
Silver | 64 | Dec-2013 | (303 | ) | ||||||||
Soybean | 97 | Jan-2014 | (157 | ) | ||||||||
Soybean | 29 | Mar-2014 | (94 | ) | ||||||||
Soybean Meal | 46 | Dec-2013 | (61 | ) | ||||||||
Soybean Meal | 54 | Mar-2014 | (89 | ) | ||||||||
Soybean Oil | 144 | Dec-2013 | (378 | ) | ||||||||
Sugar No. 11 | 330 | Feb-2014 | 173 | |||||||||
Wheat | 91 | Mar-2014 | 148 | |||||||||
|
| |||||||||||
| $ | 9,353 | |||||||||||
|
| |||||||||||
For the year ended September 30, 2013, the total amount of all open futures contracts, as presented in the table above, are representative of the volume of activity for the derivative type during the year.
A list of the open forward foreign currency contracts held by the Fund at September 30, 2013, is as follows:
| Settlement Date | Currency to Deliver (Thousands) | Currency to Receive (Thousands) | Unrealized Appreciation (Depreciation) ($ Thousands) | |||||||||||||||||
10/30/13 | AUD | 2,900 | USD | 2,709 | $ | 4 | ||||||||||||||
10/30/13 | CAD | 4,100 | USD | 3,981 | (5 | ) | ||||||||||||||
10/30/13-12/18/13 | CHF | 2,267 | USD | 2,476 | (32 | ) | ||||||||||||||
10/30/13-12/18/13 | EUR | 167,067 | USD | 221,278 | (4,888 | ) | ||||||||||||||
10/30/13-12/18/13 | GBP | 33,418 | USD | 52,782 | (1,303 | ) | ||||||||||||||
10/30/13-12/18/13 | HKD | 22,632 | USD | 2,919 | — | |||||||||||||||
10/30/13-12/18/13 | JPY | 962,828 | USD | 9,757 | (59 | ) | ||||||||||||||
12/18/13 | BRL | 800 | USD | 333 | (21 | ) | ||||||||||||||
12/18/13 | ILS | 15,700 | USD | 4,346 | (101 | ) | ||||||||||||||
12/18/13 | MXN | 29,700 | USD | 2,204 | (39 | ) | ||||||||||||||
12/18/13 | RUB | 372,116 | USD | 11,062 | (268 | ) | ||||||||||||||
12/18/13 | SGD | 3,900 | USD | 3,069 | (41 | ) | ||||||||||||||
| Settlement Date | Currency to Deliver (Thousands) | Currency to Receive (Thousands) | Unrealized Appreciation (Depreciation) ($ Thousands) | |||||||||||||||||
12/18/13 | TRY | 1,700 | USD | 822 | $ | (6 | ) | |||||||||||||
12/18/13 | USD | 16,255 | BRL | 38,300 | 650 | |||||||||||||||
12/18/13 | USD | 15,792 | EUR | 11,679 | 19 | |||||||||||||||
12/18/13 | USD | 3,783 | GBP | 2,360 | 36 | |||||||||||||||
12/18/13 | USD | 214 | HKD | 1,662 | — | |||||||||||||||
12/18/13 | USD | 31,395 | ILS | 113,000 | 617 | |||||||||||||||
12/18/13 | USD | 21 | JPY | 2,100 | — | |||||||||||||||
12/18/13 | USD | 25,607 | KRW | 28,145,500 | 517 | |||||||||||||||
12/18/13 | USD | 32,999 | MXN | 440,800 | 278 | |||||||||||||||
12/18/13 | USD | 19,377 | SGD | 24,600 | 237 | |||||||||||||||
12/18/13 | USD | 8,051 | TRY | 16,800 | 139 | |||||||||||||||
12/18/13 | USD | 24,699 | TWD | 730,300 | 37 | |||||||||||||||
12/18/13 | USD | 10,601 | ZAR | 106,900 | (99 | ) | ||||||||||||||
12/18/13 | ZAR | 600 | USD | 58 | (1 | ) | ||||||||||||||
|
| |||||||||||||||||||
| $ | (4,329 | ) | ||||||||||||||||||
|
| |||||||||||||||||||
A list of the counterparties for the open forward foreign currency contracts held by the Fund at September 30, 2013, is as follows:
| Counterparty | Settlement Date | Currency to Deliver ($ Thousands) | Currency to Receive ($ Thousands) | Unrealized (Depreciation) ($ Thousands) | ||||||||||
JPMorgan Chase Bank | 10/30/13 | $ | (30,326 | ) | $ | 30,221 | $ | (105 | ) | |||||
Royal Bank of Scotland | 12/18/13 | (436,366 | ) | 432,677 | (3,689 | ) | ||||||||
State Street | 10/30/13 | (46,659 | ) | 46,124 | (535 | ) | ||||||||
|
| |||||||||||||
| $ | (4,329 | ) | ||||||||||||
|
| |||||||||||||
For the year ended September 30, 2013, the total amount of all open forward foreign currency contracts, as presented in the table above, are representative of the volume of activity for the derivative type during the year.
A list of open OTC swap agreements held by the Fund at September 30, 2013, is as follows:
| Total Return Swaps | ||||||||||||||||||||||||
| Counterparty | Reference Entity/Obligation | Fund Pays | Fund Receives | Termination Date | Currency | Notional Amount (Thousands) (1) | Net Unrealized Appreciation (Depreciation) ($ Thousands) | |||||||||||||||||
| BoA Merrill Lynch | Euro-Bund | Negative Price Return | Positve Price Return | 10/10/13 | EUR | 32,034 | $ | 727 | ||||||||||||||||
| JPMorgan Chase Bank | Bovaspa Index | Negative Price Return | Positve Price Return | 10/17/13 | BRL | 24,936 | 251 | |||||||||||||||||
| BoA Merrill Lynch | MSCI Taiwan Stock Index | Negative Price Return | Positve Price Return | 10/30/13 | 5,656 | (93 | ) | |||||||||||||||||
| BoA Merrill Lynch | Hang Seng China Enterprises Index | Negative Price Return | Positve Price Return | 10/31/13 | HKD | 28,938 | (120 | ) | ||||||||||||||||
| BoA Merrill Lynch | Russian Trading Systems Index | Negative Price Return | Positve Price Return | 12/16/13 | 11,722 | 256 | ||||||||||||||||||
| JPMorgan Chase Bank | Swiss Market Index | Negative Price Return | Positve Price Return | 12/20/13 | CHF | 14,276 | (44 | ) | ||||||||||||||||
| BoA Merrill Lynch | U.S. Treasury 10-Year Note | Negative Price Return | Positve Price Return | 12/20/13 | 195,526 | 3,187 | ||||||||||||||||||
| Barclays | Crude Oil | Negative Price Return | Positve Price Return | 11/23/13 | 38,620 | (1,656 | ) | |||||||||||||||||
| Barclays | Heating Oil | Negative Price Return | Positve Price Return | 11/30/13 | 9,969 | (565 | ) | |||||||||||||||||
| Barclays | Natural Gas | Negative Price Return | Positve Price Return | 11/30/13 | 5,743 | (194 | ) | |||||||||||||||||
| Barclays | Unleaded Gasoline RBOB | Negative Price Return | Positve Price Return | 11/30/13 | 8,333 | (511 | ) | |||||||||||||||||
| Barclays | Brent Crude Penultimate | Negative Price Return | Positve Price Return | 12/16/13 | 26,742 | (156 | ) | |||||||||||||||||
| Barclays | Lean Hogs | Negative Price Return | Positve Price Return | 12/17/13 | 3,985 | (36 | ) | |||||||||||||||||
| BoA Merrill Lynch | Soybean Meal | Negative Price Return | Positve Price Return | 12/17/13 | 892 | 91 | ||||||||||||||||||
| BoA Merrill Lynch | Soybean Oil | Negative Price Return | Positve Price Return | 12/24/13 | 1,578 | (69 | ) | |||||||||||||||||
| Barclays | Gasoil | Negative Price Return | Positve Price Return | 12/31/13 | 9,627 | (74 | ) | |||||||||||||||||
| BoA Merrill Lynch | Soybean | Negative Price Return | Positve Price Return | 01/16/14 | 1,092 | (28 | ) | |||||||||||||||||
| BoA Merrill Lynch | Corn | Negative Price Return | Positve Price Return | 03/16/14 | 3,409 | (265 | ) | |||||||||||||||||
| BoA Merrill Lynch | Wheat | Negative Price Return | Positve Price Return | 03/17/14 | 584 | 17 | ||||||||||||||||||
|
| |||||||||||||||||||||||
| $ | 718 | |||||||||||||||||||||||
|
| |||||||||||||||||||||||
| 194 | SEI Institutional Managed Trust / Annual Report / September 30, 2013 |
A list of open centrally cleared swap agreements held by the Fund at September 30, 2013, are as follows:
| Interest Rate Swaps | ||||||||||||||
Broker | Fund Pays | Fund Receives | Termination Date | Notional Amount ($ Thousands) | Net Unrealized Appreciation ($ Thousands) | |||||||||
| JPMorgan Chase Bank | 6-Month EURIBOR | 1.00% | 12/19/18 | $ | 8,625 | $ | 108 | |||||||
| JPMorgan Chase Bank | 1.25% | US 3-Month LIBOR | 12/19/18 | 46,115 | 511 | |||||||||
| JPMorgan Chase Bank | 6-Month EURIBOR | 0.50% | 12/16/15 | 25,725 | 59 | |||||||||
| JPMorgan Chase Bank | 0.50% | US 3-Month LIBOR | 12/16/15 | 164,735 | 297 | |||||||||
|
| |||||||||||||
| $ | 975 | |||||||||||||
|
| |||||||||||||
For the year ended September 30, 2013, the total amount of all open OTC and centrally cleared swap agreements, as presented in the tables above, are representative of the volume of activity for this derivative type during the year.
Percentages are based on Net Assets of $1,414,563 ($ Thousands).
| (1) | In U.S. Dollar unless otherwise indicated. |
| * | Non-income producing security. |
| ** | The rate reported is the 7-day effective yield as of September 30, 2013. |
| † | Real Estate Investment Trust. |
| †† | Investment in Affiliated Security (See Note 6). |
| (A) | The rate reported is the effective yield at the time of purchase. |
| (B) | Security, or portion thereof, has been pledged as collateral on open futures contracts. |
ADR — American Depositary Receipt
AUD — Australian Dollar
BRL — Brazilian Real
Cl — Class
CAD — Canadian Dollar
CHF — Swiss Franc
DAX — Deutsche Borse AG German Stock Index
DJ — Dow Jones
DKK — Denmark Krone
EUR — Euro
EURIBOR — Euro Interbank Offered Rate
FTSE — Financial Times and the London Stock Exchange
GBP — British Pound
HKD — Hong Kong Dollar
IBEX — Spanish Exchange Index
ILS — Israeli Shekel
JPY — Japanese Yen
JSE — Johannesburg Stock Exchange
KOSPI — Korea Composite Stock Price Index
KRW — Korean wan
LIBOR — London Interbank Offered Rate
LME — London Metal Exchange
Ltd. — Limited
MIB — Italian Stock Exchange
NOK — Norwegian Krone
NZD — New Zealand Dollar
OAT — Obligations Assimilables du Trésor
OTC — Over The Counter
MSCI — Morgan Stanley Capital International
MTN — Medium Term Note
MXN — Mexican Peso
RBOB — Reformulated Blendstock for Oxygenate Blending
RUB — Russian Ruble
SEK — Sweden Krona
S&P — Standard & Poor’s
SGD — Singapore Dollar
SGX — Singapore Exchange
SPI — Swiss Performance Index
TRY — Turkish New Lira
TSE — Tokyo Stock Exchange
TWD — Taiwanese Dollar
USD — U.S. Dollar
ZAR — South African Rand
The following is a list of the level of inputs used as of September 30, 2013, in valuing the Fund’s investments carried at value ($ Thousands):
| Investments in Securities | Level 1 | Level 2 | Level 3 | Total | ||||||||||||
Sovereign Debt | $ | — | $ | 179,170 | $ | — | $ | 179,170 | ||||||||
Foreign Common Stock | 44,474 | 1,544 | — | 46,018 | ||||||||||||
Common Stock | 45,256 | — | — | 45,256 | ||||||||||||
Corporate Obligations | — | 39,761 | — | 39,761 | ||||||||||||
Exchange Traded Fund | 11,260 | — | — | 11,260 | ||||||||||||
Preferred Stock | 171 | — | — | 171 | ||||||||||||
Warrants | — | — | — | — | ||||||||||||
Rights | 3 | — | — | 3 | ||||||||||||
Cash Equivalent | 558,119 | — | — | 558,119 | ||||||||||||
Time Deposits | — | 205,751 | — | 205,751 | ||||||||||||
U.S. Treasury Obligations | — | 274,278 | — | 274,278 | ||||||||||||
|
|
|
|
|
|
|
| |||||||||
Total Investments in Securities | $ | 659,283 | $ | 700,504 | $ | — | $ | 1,359,787 | ||||||||
|
|
|
|
|
|
|
| |||||||||
| Other Financial Instruments | Level 1 | Level 2 | Level 3 | Total | ||||||||||||
Futures Contracts * | ||||||||||||||||
Unrealized Appreciation | $ | 15,181 | $ | — | $ | — | $ | 15,181 | ||||||||
Unrealized Depreciation | (5,828 | ) | — | — | (5,828 | ) | ||||||||||
Forwards Contracts* | ||||||||||||||||
Unrealized Appreciation | — | 2,534 | — | 2,534 | ||||||||||||
Unrealized Depreciation | — | (6,863 | ) | — | (6,863 | ) | ||||||||||
Centrally Cleared Swaps | ||||||||||||||||
Interest Rate Swaps * | ||||||||||||||||
Unrealized Appreciation | — | 975 | — | 975 | ||||||||||||
OTC Swaps | ||||||||||||||||
Total Return Swaps * | ||||||||||||||||
Unrealized Appreciation | — | 4,529 | — | 4,529 | ||||||||||||
Unrealized Depreciation | — | (3,811 | ) | — | (3,811 | ) | ||||||||||
|
|
|
|
|
|
|
| |||||||||
Total Other Financial Instruments | $ | 9,353 | $ | (2,636 | ) | $ | — | $ | 6,717 | |||||||
|
|
|
|
|
|
|
| |||||||||
| * | Futures contracts, forwards contracts and swaps are valued at the unrealized appreciation (depreciation) on the instrument. |
For the year ended September 30, 2013, there were transfers between Level 1 and Level 2 assets and liabilities. The primary reason for changes in the classifications between Level 1 and Level 2 occurs when foreign equity securities are fair valued using other observable market-based inputs in place of the closing exchange price due to events occurring after the close of the exchange or market on which the investment is principally traded (See Note 2).
For the year ended September 30, 2013, there were no significant transfers between Level 2 and Level 3 assets and liabilities.
For more information on valuation inputs, see Note 2 — Significant Accounting Policies in Notes to Financial Statements.
Amounts designated as “—” are $0 or rounded to $0.
The accompanying notes are an integral part of the financial statements.
| SEI Institutional Managed Trust / Annual Report / September 30, 2013 | 195 |
SCHEDULE OF INVESTMENTS
Multi-Asset Income Fund
September 30, 2013
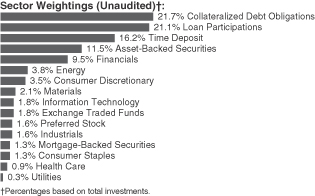
| Description | Face Amount ($ Thousands) | Market Value ($ Thousands) | ||||||
CORPORATE OBLIGATIONS — 25.9% |
| |||||||
Consumer Discretionary — 3.7% |
| |||||||
AmeriGas Finance | ||||||||
7.000%, 05/20/2022 | $ | 50 | $ | 52 | ||||
Armored Autogroup | ||||||||
9.250%, 11/01/2018 | 55 | 50 | ||||||
Caesars Entertainment Operating | ||||||||
9.000%, 02/15/2020 | 85 | 80 | ||||||
8.500%, 02/15/2020 | 395 | 363 | ||||||
Checkers Drive-In Restaurants | ||||||||
11.000%, 12/01/2017 (A) | 125 | 135 | ||||||
DreamWorks Animation SKG | ||||||||
6.875%, 08/15/2020 (A) | 100 | 104 | ||||||
GRD Holdings III | ||||||||
10.750%, 06/01/2019 (A) | 900 | 954 | ||||||
Laureate Education | ||||||||
9.250%, 09/01/2019 (A) (C) | 1,200 | 1,296 | ||||||
Live Nation Entertainment | ||||||||
7.000%, 09/01/2020 (A) | 110 | 115 | ||||||
MDC Partners | ||||||||
6.750%, 04/01/2020 (A) (C) | 1,750 | 1,772 | ||||||
Seminole Hard Rock Entertainment | ||||||||
5.875%, 05/15/2021 (A) | 100 | 96 | ||||||
Sitel | ||||||||
11.000%, 08/01/2017 (A) | 650 | 694 | ||||||
Stanadyne Holdings, Ser 1 | ||||||||
10.000%, 08/15/2014 | 250 | 239 | ||||||
Taylor Morrison Communities | ||||||||
7.750%, 04/15/2020 (A) | 142 | 155 | ||||||
Unitymedia Hessen | ||||||||
5.500%, 01/15/2023 (A) (C) | 1,500 | 1,421 | ||||||
WMG Acquisition | ||||||||
11.500%, 10/01/2018 | 620 | 714 | ||||||
Wok Acquisition | ||||||||
10.250%, 06/30/2020 (A) | 160 | 174 | ||||||
|
| |||||||
| 8,414 | ||||||||
|
| |||||||
| Description | Face Amount ($ Thousands) | Market Value ($ Thousands) | ||||||
Consumer Staples — 1.3% |
| |||||||
Bumble Bee Holdings | ||||||||
9.000%, 12/15/2017 (A) | $ | 389 | $ | 421 | ||||
Harbinger Group | ||||||||
7.875%, 07/15/2019 (A) | 700 | 724 | ||||||
KeHE Distributors | ||||||||
7.625%, 08/15/2021 (A) | 250 | 254 | ||||||
US Foods | ||||||||
8.500%, 06/30/2019 | 1,000 | 1,054 | ||||||
Vector Group | ||||||||
7.750%, 02/15/2021 | 600 | 621 | ||||||
|
| |||||||
| 3,074 | ||||||||
|
| |||||||
Energy — 4.0% |
| |||||||
Atlas Energy Holdings Operating | ||||||||
7.750%, 01/15/2021 (A) | 100 | 93 | ||||||
Atlas Pipeline Partners | ||||||||
5.875%, 08/01/2023 (A) | 1,500 | 1,410 | ||||||
4.750%, 11/15/2021 (A) | 400 | 361 | ||||||
Atlas Resource Escrow | ||||||||
9.250%, 08/15/2021 (A) | 150 | 151 | ||||||
BreitBurn Energy Partners | ||||||||
7.875%, 04/15/2022 | 800 | 798 | ||||||
Crestwood Midstream Partners | ||||||||
7.750%, 04/01/2019 | 810 | 850 | ||||||
Eagle Rock Energy Partners | ||||||||
8.375%, 06/01/2019 (C) | 1,020 | 1,020 | ||||||
Endeavor Energy Resources | ||||||||
7.000%, 08/15/2021 (A) | 400 | 396 | ||||||
Exterran Partners | ||||||||
6.000%, 04/01/2021 (A) | 250 | 242 | ||||||
Gibson Energy | ||||||||
6.750%, 07/15/2021 (A) | 450 | 465 | ||||||
Inergy Midstream | ||||||||
6.000%, 12/15/2020 (A) | 600 | 596 | ||||||
Legacy Reserves | ||||||||
8.000%, 12/01/2020 (A) | 500 | 505 | ||||||
6.625%, 12/01/2021 (A) | 250 | 234 | ||||||
Memorial Production Partners | ||||||||
7.625%, 05/01/2021 | 110 | 107 | ||||||
Pacific Drilling | ||||||||
5.375%, 06/01/2020 (A) | 250 | 244 | ||||||
Penn Virginia Resource Partners | ||||||||
8.375%, 06/01/2020 | 560 | 582 | ||||||
8.250%, 04/15/2018 | 200 | 208 | ||||||
SandRidge Energy | ||||||||
8.125%, 10/15/2022 | 300 | 303 | ||||||
7.500%, 03/15/2021 | 500 | 505 | ||||||
7.500%, 02/15/2023 | 200 | 198 | ||||||
|
| |||||||
| 9,268 | ||||||||
|
| |||||||
Financials — 10.0% |
| |||||||
Ally Financial | ||||||||
4.750%, 09/10/2018 | 500 | 498 | ||||||
| 196 | SEI Institutional Managed Trust / Annual Report / September 30, 2013 |
| Description | Face Amount ($ Thousands) | Market Value ($ Thousands) | ||||||
Bank of America | ||||||||
5.200%, 12/29/2049 (B) | $ | 2,500 | $ | 2,187 | ||||
Bank of New York Mellon | ||||||||
4.500%, 06/20/2023 (B) | 250 | 217 | ||||||
Citigroup | ||||||||
5.950%, 12/29/2049 (B) | 1,250 | 1,166 | ||||||
5.350%, 05/29/2049 (B) | 1,250 | 1,088 | ||||||
CyrusOne | ||||||||
6.375%, 11/15/2022 | 500 | 496 | ||||||
Emigrant Bancorp | ||||||||
6.250%, 06/15/2014 (A) | 200 | 199 | ||||||
EPR Properties‡ | ||||||||
5.750%, 08/15/2022 | 400 | 404 | ||||||
Fidelity & Guaranty Life Holdings | ||||||||
6.375%, 04/01/2021 (A) | 650 | 660 | ||||||
Fifth Third Bancorp | ||||||||
5.100%, 12/31/2049 (B) | 1,630 | 1,418 | ||||||
General Electric Capital | ||||||||
5.250%, 12/31/2049 (B) | 1,000 | 920 | ||||||
ING US | ||||||||
5.650%, 05/15/2053 (B) | 2,200 | 2,011 | ||||||
Itau Unibanco Holding | ||||||||
5.125%, 05/13/2023 (A) | 250 | 230 | ||||||
Jefferies LoanCore | ||||||||
6.875%, 06/01/2020 (A) | 300 | 294 | ||||||
JPMorgan Chase | ||||||||
5.150%, 04/05/2023 (B) | 2,000 | 1,750 | ||||||
KCG Holdings | ||||||||
8.250%, 06/15/2018 (A) | 490 | 483 | ||||||
Kennedy-Wilson | ||||||||
8.750%, 04/01/2019 | 1,445 | 1,561 | ||||||
Nationstar Mortgage | ||||||||
9.625%, 05/01/2019 | 101 | 112 | ||||||
7.875%, 10/01/2020 | 300 | 313 | ||||||
6.500%, 08/01/2018 | 700 | 704 | ||||||
6.500%, 07/01/2021 | 800 | 766 | ||||||
6.500%, 06/01/2022 (C) | 600 | 568 | ||||||
PNC Financial Services Group | ||||||||
4.850%, 05/29/2049 (B) | 300 | 258 | ||||||
Prudential Financial | ||||||||
5.625%, 06/15/2043 (B) (C) | 1,250 | 1,177 | ||||||
Schahin II Finance SPV | ||||||||
5.875%, 09/25/2022 (A) | 1,437 | 1,372 | ||||||
Susquehanna Bancshares | ||||||||
5.375%, 08/15/2022 | 800 | 786 | ||||||
Wilton Re Finance | ||||||||
5.875%, 03/30/2033 (A) (B) | 1,350 | 1,353 | ||||||
|
| |||||||
| 22,991 | ||||||||
|
| |||||||
Health Care — 0.9% |
| |||||||
Apria Healthcare Group | ||||||||
12.375%, 11/01/2014 | 425 | 428 | ||||||
Symbion | ||||||||
8.000%, 06/15/2016 | 600 | 633 | ||||||
| Description | Face Amount ($ Thousands) | Market Value ($ Thousands) | ||||||
VPII Escrow | ||||||||
6.750%, 08/15/2018 (A) | $ | 1,000 | $ | 1,070 | ||||
|
| |||||||
| 2,131 | ||||||||
|
| |||||||
Industrials — 1.6% |
| |||||||
ADT | ||||||||
6.250%, 10/15/2021 (A) | 300 | 305 | ||||||
CEVA Group | ||||||||
8.375%, 12/01/2017 (A) | 970 | 977 | ||||||
Coleman Cable | ||||||||
9.000%, 02/15/2018 | 60 | 64 | ||||||
CPG Merger Sub | ||||||||
8.000%, 10/01/2021 (A) | 250 | 254 | ||||||
Intcomex | ||||||||
13.250%, 12/15/2014 | 77 | 74 | ||||||
Marquette Transportation | ||||||||
10.875%, 01/15/2017 | 50 | 53 | ||||||
Princess Juliana International Airport Operating | ||||||||
5.500%, 12/20/2027 (A) (C) | 967 | 940 | ||||||
ServiceMaster | ||||||||
7.000%, 08/15/2020 | 550 | 520 | ||||||
Thermadyne Holdings | ||||||||
9.000%, 12/15/2017 | 500 | 539 | ||||||
|
| |||||||
| 3,726 | ||||||||
|
| |||||||
Information Technology — 1.9% |
| |||||||
Aspect Software | ||||||||
10.625%, 05/15/2017 | 945 | 943 | ||||||
Eagle Midco | ||||||||
9.000%, 06/15/2018 (A) | 600 | 603 | ||||||
Infor US | ||||||||
9.375%, 04/01/2019 | 300 | 335 | ||||||
Sabre | ||||||||
8.500%, 05/15/2019 (A) | 700 | 757 | ||||||
Southern Graphics | ||||||||
8.375%, 10/15/2020 (A) | 110 | 114 | ||||||
Stream Global Services | ||||||||
11.250%, 10/01/2014 | 985 | 991 | ||||||
Zayo Group | ||||||||
10.125%, 07/01/2020 | 600 | 688 | ||||||
|
| |||||||
| 4,431 | ||||||||
|
| |||||||
Materials — 2.2% |
| |||||||
AngloGold Ashanti Holdings | ||||||||
5.125%, 08/01/2022 | 200 | 168 | ||||||
APERAM | ||||||||
7.750%, 04/01/2018 (A) | 860 | 847 | ||||||
Barrick Gold (C) | ||||||||
4.100%, 05/01/2023 | 1,250 | 1,101 | ||||||
Eldorado | ||||||||
6.125%, 12/15/2020 (A) | 700 | 676 | ||||||
Hecla Mining | ||||||||
6.875%, 05/01/21 (A) | 470 | 444 | ||||||
| SEI Institutional Managed Trust / Annual Report / September 30, 2013 | 197 |
SCHEDULE OF INVESTMENTS
Multi-Asset Income Fund (Continued)
September 30, 2013
| Description | Face Amount ($ Thousands) | Market Value ($ Thousands) | ||||||
IAMGOLD | ||||||||
6.750%, 10/01/2020 (A) | $ | 45 | $ | 39 | ||||
Kaiser Aluminum | ||||||||
8.250%, 06/01/2020 | 225 | 251 | ||||||
KGHM International | ||||||||
7.750%, 06/15/2019 (A) | 100 | 103 | ||||||
Mirabela Nickel | ||||||||
8.750%, 04/15/2018 (A) | 261 | 102 | ||||||
TPC Group | ||||||||
8.750%, 12/15/2020 (A) | 1,050 | 1,074 | ||||||
Unifrax I | ||||||||
7.500%, 02/15/2019 (A) | 200 | 200 | ||||||
|
| |||||||
| 5,005 | ||||||||
|
| |||||||
Utilities — 0.3% |
| |||||||
LBC Tank Terminals Holding Netherlands BV | ||||||||
6.875%, 05/15/2023 (A) | 700 | 703 | ||||||
|
| |||||||
Total Corporate Obligations | 59,743 | |||||||
|
| |||||||
COLLATERALIZED DEBT OBLIGATIONS — 22.7% |
| |||||||
Financials — 2.6% |
| |||||||
Marathon CLO II, Ser 2005-2A, Cl C | ||||||||
2.053%, 12/20/2019 (A) (B) | 600 | 583 | ||||||
Marathon CLO II, Ser 2005-2A, Cl INC | ||||||||
0.000%, 12/20/2019 (A) (D) | 750 | 407 | ||||||
Rockwall CDO II, Ser 2007-1A, Cl A1LB | ||||||||
0.815%, 08/01/2024 (A) (B) | 3,200 | 2,727 | ||||||
Rockwall CDO, Ser 2006-1A, Cl A2L | ||||||||
0.915%, 08/01/2021 (A) (B) | 200 | 176 | ||||||
Rockwall CDO, Ser 2006-1A, Cl A1LB | ||||||||
0.765%, 08/01/2021 (A) (B) | 1,700 | 1,581 | ||||||
Whitehorse II | ||||||||
0.000%, 06/15/2017 (A) (B) (D) (H) | 1,100 | 594 | ||||||
|
| |||||||
| 6,068 | ||||||||
|
| |||||||
Other Asset-Backed Securities — 20.1% | ||||||||
ACA CLO, Ser 2007-1A, Cl C | ||||||||
1.218%, 06/15/2022 (A) (B) | 1,150 | 1,046 | ||||||
ACIS CLO, Ser 2013-1A, Cl D | ||||||||
4.766%, 04/18/2024 (A) (B) (D) | 800 | 772 | ||||||
ACIS CLO, Ser 2013-2A, Cl D | ||||||||
0.000%, 10/14/2022 (A) (D) (F) | 1,100 | 1,068 | ||||||
Ares XXV CLO, Ser 2012-3A, Cl SUB | ||||||||
0.000%, 01/17/2024 (A) (D) | 750 | 649 | ||||||
Ares XXVI CLO, Ser 2013-1A, Cl SUB | ||||||||
0.000%, 04/15/2025 (A) (D) | 1,500 | 1,231 | ||||||
Atlas Senior Loan Fund II, | ||||||||
0.000%, 01/30/2024 (A) (D) | 950 | 839 | ||||||
Battalion CLO II, Ser 2012-2A, Cl B | ||||||||
3.018%, 11/15/2019 (A) (B) | 500 | 488 | ||||||
Black Diamond CLO, Ser 2007-1A, Cl C | ||||||||
0.954%, 04/29/2019 (A) (B) | 1,100 | 1,047 | ||||||
| Description | Face Amount ($ Thousands) | Market Value ($ Thousands) | ||||||
BlackRock Senior Income, | ||||||||
0.000%, 09/15/2016 (A) | $ | 950 | $ | 57 | ||||
Callidus Debt Partners CLO Fund VI, | ||||||||
1.515%, 10/23/2021 (A) (B) | 500 | 463 | ||||||
Carlyle Global Market Strategies CLO, | ||||||||
0.000%, 10/14/2024 (A) (D) | 750 | 729 | ||||||
Cedarwoods CRE CDO, | ||||||||
0.449%, 07/25/2051 (D) | 3,519 | 2,833 | ||||||
Cerberus Offshore Levered I CLO, | ||||||||
6.182%, 11/30/2018 (A) (B) (D) | 300 | 302 | ||||||
Copper River CLO, Ser 2007-1A, Cl C | ||||||||
1.066%, 01/20/2021 (A) (B) | 500 | 449 | ||||||
Diversified Asset Securitization Holdings II, Ser 2000-1A, Cl A1L | ||||||||
0.744%, 09/15/2035 (A) (B) (D) | 407 | 391 | ||||||
Finn Square CLO, Ser 2012-1A, Cl SUB | ||||||||
0.000%, 12/24/2023 (A) (D) | 1,000 | 894 | ||||||
Garrison Funding CLO, | ||||||||
4.904%, 09/20/2033 (D) | 250 | 249 | ||||||
Gleneagles CLO, Ser 2005-1A, Cl B | ||||||||
0.815%, 11/01/2017 (A) (B) | 600 | 572 | ||||||
Global Leveraged Capital Credit Opportunity Fund, Ser 2006-1A, Cl C | ||||||||
1.266%, 12/20/2018 (A) (B) | 1,550 | 1,382 | ||||||
Gramercy Real Estate CDO, | ||||||||
0.544%, 08/15/2056 (A) (B) (D) | 3,819 | 2,995 | ||||||
Grayson CLO, Ser 2006-1A, Cl A2 | ||||||||
0.675%, 11/01/2021 (A) (B) (C) | 700 | 626 | ||||||
Great Lakes CLO, Ser 2012-1A, Cl SUB | ||||||||
0.000%, 01/15/2023 (A) | 1,000 | 1,010 | ||||||
GSC Partners CDO Fund, Ser 2004-5A | ||||||||
0.000%, 11/20/2016 (A) (B) (D) (H) | 1,800 | 775 | ||||||
GSC Partners CDO Fund, Ser 2004-5I | ||||||||
0.000%, 11/20/2016 (B) (D) (H) | 100 | 43 | ||||||
Halcyon Structured Asset Management Long Secured / Short Unsecured CLO, | ||||||||
2.565%, 08/07/2021 (A) (B) | 1,350 | 1,307 | ||||||
Highland Park CDO, Ser 2006-1A, Cl A1 | ||||||||
0.592%, 11/25/2051 (A) (B) (C) (D) | 2,537 | 2,129 | ||||||
Ivy Hill Middle Market Credit Fund CLO, Ser 2011-3A, Cl E | ||||||||
6.768%, 01/15/2022 (A) (B) | 250 | 251 | ||||||
Kingsland CLO III, Ser 2006-3A, Cl C1 | ||||||||
1.862%, 08/24/2021 (A) (B) | 1,100 | 998 | �� | |||||
KKR Financial CLO, Ser 2007-1A, Cl D | ||||||||
2.514%, 05/15/2021 (A) (B) | 2,600 | 2,493 | ||||||
Knightsbridge CLO, Ser 2007-1A, Cl C | ||||||||
3.019%, 01/11/2022 (A) (B) | 300 | 301 | ||||||
| 198 | SEI Institutional Managed Trust / Annual Report / September 30, 2013 |
| Description | Face Amount ($ Thousands) | Market Value ($ Thousands) | ||||||
Knightsbridge CLO, Ser 2007-1A, Cl D | ||||||||
5.269%, 01/11/2022 (A) (B) | $ | 300 | $ | 300 | ||||
Legg Mason Real Estate CDO I, | ||||||||
0.459%, 03/25/2038 (A) (B) (D) | 64 | 61 | ||||||
Liberty CLO, Ser 2005-1A, Cl A3 | ||||||||
0.765%, 11/01/2017 (A) (B) | 1,600 | 1,526 | ||||||
MKP CBO I, Ser 2004-3A, Cl A2 | ||||||||
0.916%, 05/08/2039 (A) (B) | 151 | 147 | ||||||
Newcastle CDO IX, Ser 2007-9A, Cl M5 | ||||||||
0.439%, 05/25/2052 (B) (C) (D) | 758 | 736 | ||||||
Newcastle CDO VII, Ser 2006-8A, Cl 1A | ||||||||
0.459%, 11/25/2052 (A) (B) (D) | 1,384 | 1,261 | ||||||
Newstar Trust CLO, Ser 2007-1A, Cl C | ||||||||
1.561%, 09/30/2022 (A) (B) | 500 | 466 | ||||||
Newstar Trust CLO, Ser 2012-2A, Cl D | ||||||||
6.516%, 01/20/2023 (A) (B) | 500 | 510 | ||||||
Newstar Trust CLO, Ser 2013-1A, Cl E | ||||||||
5.564%, 09/20/2023 (D) | 250 | 254 | ||||||
Newstar Trust CLO, Ser 2013-1A, Cl D | ||||||||
4.814%, 09/20/2023 (D) | 600 | 608 | ||||||
Northwoods Capital VII CDO, | ||||||||
3.766%, 10/22/2021 (A) (B) | 300 | 283 | ||||||
Northwoods Capital VII CLO, | ||||||||
1.816%, 10/22/2021 (A) (B) | 700 | 655 | ||||||
NStar CDO VIII, Ser 2006-8A, Cl A1 | ||||||||
0.502%, 02/01/2041 (D) | 2,450 | 2,226 | ||||||
Pacifica CDO V, Ser 2006-5A, Cl B2 | ||||||||
5.811%, 01/26/2020 (A) | 1,000 | 1,005 | ||||||
RAIT CRE CDO I, Ser 2006-1X, Cl A1B | ||||||||
0.514%, 11/20/2046 (B) | 2,692 | 2,206 | ||||||
Salus CLO, Ser 2012-1AN, Cl DN | ||||||||
7.002%, 03/05/2021 (D) | 250 | 250 | ||||||
South Coast Funding CDO, | ||||||||
0.627%, 08/06/2039 (A) (B) | 19 | 19 | ||||||
SRERS Funding CDO, Ser RS, Cl A1B1 | ||||||||
0.432%, 05/09/2046 (A) (B) (D) | 390 | 339 | ||||||
Summit Lake CLO, Ser 2005-1A, Cl C1A | ||||||||
0.000%, 02/24/2018 (A) (D) | 400 | 151 | ||||||
T2 Income Fund CLO, | ||||||||
1.768%, 07/15/2019 (A) (B) | 250 | 239 | ||||||
T2 Income Fund CLO, | ||||||||
3.018%, 07/15/2019 (A) (B) | 350 | 327 | ||||||
TCW Global Project Fund II, | ||||||||
1.618%, 06/15/2016 (A) (B) (D) | 850 | 804 | ||||||
TCW Global Project Fund III, | ||||||||
0.910%, 09/01/2017 (A) (B) (D) | 1,250 | 1,179 | ||||||
TCW Global Project Fund III, | ||||||||
1.110%, 09/01/2017 (A) (B) (D) | 500 | 440 | ||||||
| Description | Face Amount ($ Thousands) | Market Value ($ Thousands) | ||||||
Telos CLO, Ser 2013-3A, Cl D | ||||||||
4.518%, 01/17/2024 (A) (B) | $ | 800 | $ | 773 | ||||
West Coast Funding, | ||||||||
0.402%, 11/02/2041 (A) (B) (C) (D) | 1,163 | 1,109 | ||||||
|
| |||||||
| 46,263 | ||||||||
|
| |||||||
Total Collateralized Debt Obligations | 52,331 | |||||||
|
| |||||||
LOAN PARTICIPATIONS — 22.1% |
| |||||||
AABS | ||||||||
4.875%, 01/15/2038 (D) | 479 | 482 | ||||||
ACA Capital Holdings | ||||||||
5.500%, 08/22/2016 | 563 | 564 | ||||||
Activision Blizzard, 10-Year Unfunded Bridge Loan | ||||||||
0.000%, 10/18/2013 (E) | 200 | — | ||||||
Activision Blizzard, 7-Year Unfunded Bridge Loan | ||||||||
0.000%, 10/18/2013 (E) | 400 | — | ||||||
Activision Blizzard, 8-Year Unfunded Bridge Loan | ||||||||
0.000%, 10/18/2013 (E) | 400 | — | ||||||
Alcatel Lucent, Term Loan | ||||||||
5.750%, 01/29/2019 | 697 | 702 | ||||||
Applied Systems, Term Loan, 2nd Lien | ||||||||
8.250%, 06/08/2017 | 200 | 201 | ||||||
Apria Helathcare Group, Term Loan | ||||||||
6.750%, 04/06/2020 | 1,197 | 1,205 | ||||||
Arctic Glacier Income Fund, 1st Lien Term Loan | ||||||||
6.000%, 05/10/2019 | 1 | 1 | ||||||
Arctic Glacier Income Fund, Term Loan | ||||||||
6.000%, 05/10/2019 | 388 | 387 | ||||||
Aspect Software | ||||||||
7.000%, 05/07/2016 | 235 | 235 | ||||||
Associated Partners, 1st Lien Term Loan | ||||||||
6.682%, 12/21/2015 | 750 | 750 | ||||||
Associated Partners, Term Loan | ||||||||
6.682%, 12/21/2015 | 750 | 750 | ||||||
Astoria Generating, Term Loan Cov-Lite | ||||||||
8.500%, 10/26/2017 | 5 | 5 | ||||||
8.500%, 10/26/2017 | 570 | 583 | ||||||
Asurion | ||||||||
4.500%, 05/24/2019 | 498 | 492 | ||||||
Avaya, Extended Term Loan B-5 | ||||||||
8.000%, 03/31/2018 | 1,443 | 1,364 | ||||||
Avaya, Term Loan B3 | ||||||||
4.773%, 10/26/2017 | 249 | 222 | ||||||
Berling Packaging LLC, | ||||||||
8.750%, 04/02/2020 | 150 | 150 | ||||||
BioScrip, 1st Lien Delayed | ||||||||
6.500%, 07/31/2020 | 188 | 188 | ||||||
| SEI Institutional Managed Trust / Annual Report / September 30, 2013 | 199 |
SCHEDULE OF INVESTMENTS
Multi-Asset Income Fund (Continued)
September 30, 2013
| Description | Face Amount ($ Thousands) | Market Value ($ Thousands) | ||||||
BioScrip, 1st Lien Term Loan B | ||||||||
6.500%, 07/31/2020 | $ | 313 | $ | 314 | ||||
California Pizza Kitchen, Term Loan | ||||||||
5.250%, 03/29/2018 | 399 | 397 | ||||||
CAMP Systems International, 2nd Lien | ||||||||
0.000%, 11/30/2019 (F) | 100 | 102 | ||||||
Capital Automotive | ||||||||
6.000%, 04/30/2020 | 150 | 153 | ||||||
Catalent Pharma Solutions, Term Loan | ||||||||
6.500%, 12/31/2017 | 100 | 100 | ||||||
Cengage Learning Acquisitions, | ||||||||
7.750%, 07/05/2017 (G) | 230 | 168 | ||||||
Cengage Learning, 1st Lien | ||||||||
9.500%, 07/03/2014 | 119 | 87 | ||||||
Centaur, 1st Lien Term Loan | ||||||||
5.250%, 02/20/2019 | 249 | 250 | ||||||
Ceridian, 1st Lien Term Loan B | ||||||||
4.429%, 05/09/2017 | 739 | 738 | ||||||
Cetera Financial Group, 1st Lien | ||||||||
6.500%, 08/02/2019 | 100 | 99 | ||||||
CHG Healthcare | ||||||||
5.000%, 11/19/2019 | 740 | 745 | ||||||
Confie Seguros Holding II, 1st Lien | ||||||||
6.500%, 11/09/2018 | 298 | 297 | ||||||
Cooper Gay Swett & Crawford, 2nd Lien Term Loan | ||||||||
8.250%, 10/16/2020 | 100 | 99 | ||||||
Cooper Gay Swett & Crawford, | ||||||||
5.000%, 04/16/2020 | 150 | 149 | ||||||
CPG International, Unfunded and Unsecured Bridge Loan | ||||||||
0.000%, 12/20/2013 (E) (F) | 200 | — | ||||||
CPM Holdings | ||||||||
10.250%, 03/01/2018 | 200 | 200 | ||||||
6.250%, 08/29/2017 | 338 | 338 | ||||||
CSC Holdings, Term Loan B | ||||||||
2.682%, 04/17/2020 | 850 | 839 | ||||||
CTI Foods, 2nd Lien Term Loan | ||||||||
8.250%, 06/28/2021 | 400 | 397 | ||||||
Cunningham Lindsey, 1st Lien Cov-Lite | ||||||||
5.000%, 12/10/2019 | 199 | 198 | ||||||
DBP Holdings, Initial Term Loan | ||||||||
5.000%, 10/05/2019 | 547 | 547 | ||||||
Deltek Systems, 1st Lien Term Loan | ||||||||
5.000%, 10/10/2018 | 398 | 398 | ||||||
Deltek Systems, 2nd Lien Term Loan | ||||||||
10.000%, 10/04/2019 | 100 | 100 | ||||||
Digital Insight, 1st Lien | ||||||||
5.500%, 08/01/2019 | 500 | 500 | ||||||
Digital Insight, 2nd Lien | ||||||||
9.500%, 08/01/2019 | 500 | 500 | ||||||
| Description | Face Amount ($ Thousands) | Market Value ($ Thousands) | ||||||
DJO Finance | ||||||||
4.750%, 09/15/2017 | $ | 249 | $ | 249 | ||||
Dole Food, Unfunded Bridge Loan | ||||||||
0.000%, 02/21/2014 (E) (F) | 250 | — | ||||||
Doncasters, Term Loan, 2nd Lien | ||||||||
9.500%, 10/09/2020 | 250 | 249 | ||||||
DS Waters, 1st Lien Term Loan Cov-Lite | ||||||||
5.250%, 08/19/2020 | 100 | 101 | ||||||
Endurance International, 1st Lien | ||||||||
6.250%, 11/09/2019 | 548 | 549 | ||||||
Endurance International, 2nd Lien | ||||||||
10.250%, 05/09/2020 | 300 | 301 | ||||||
Entrust Ltd. Canada, Term Loan | ||||||||
6.250%, 10/31/2018 | 106 | 105 | ||||||
Entrust, U.S., 1st Lien Term Loan | ||||||||
6.250%, 10/31/2018 | 235 | 232 | ||||||
Equinox Fitness Club, Term Loan B | ||||||||
4.500%, 01/31/2020 (F) | 1 | 1 | ||||||
Excelitas Technologies, Term Loan B | ||||||||
5.000%, 11/29/2016 | 99 | 99 | ||||||
EZE Castel Software, LLC, 2nd Lien | ||||||||
8.750%, 04/05/2021 | 100 | 101 | ||||||
Fender Musical Instruments, | ||||||||
5.750%, 04/03/2019 | 289 | 289 | ||||||
Fibertech Networks, Term Loan B | ||||||||
5.750%, 11/30/2016 | 1 | 1 | ||||||
First Advantage, 2nd Lien Term Loan | ||||||||
10.500%, 02/13/2019 (D) | 150 | 149 | ||||||
First Advantage, Term Loan B | ||||||||
6.250%, 02/28/2019 | 2 | 2 | ||||||
6.250%, 02/13/2019 | 697 | 694 | ||||||
First Data | ||||||||
4.180%, 03/24/2017 | 500 | 495 | ||||||
First Data, Term Loan | ||||||||
4.184%, 03/24/2018 | 280 | 277 | ||||||
Fleetpride, 1st Lien | ||||||||
5.250%, 11/19/2019 | 547 | 527 | ||||||
Fleetpride, 2nd Lien | ||||||||
9.250%, 05/19/2020 | 310 | 286 | ||||||
GCA Services Group, 1st Lien | ||||||||
5.250%, 11/01/2019 | 100 | 100 | ||||||
GCA Services Group, 2nd Lien Term Loan Cov-Lite | ||||||||
9.250%, 10/11/2020 | 150 | 152 | ||||||
Go Daddy Operating LLC, Term Loan | ||||||||
4.250%, 12/16/2018 | 96 | 96 | ||||||
GOGO LLC | ||||||||
11.250%, 06/21/2017 | 379 | 402 | ||||||
Grocery Outlet, Term Loan Cov-Lite | ||||||||
0.000%, 12/17/2018 (F) | 1,493 | 1,495 | ||||||
| 200 | SEI Institutional Managed Trust / Annual Report / September 30, 2013 |
| Description | Face Amount ($ Thousands) | Market Value ($ Thousands) | ||||||
Guitar Center, Extended Term Loan | ||||||||
6.370%, 04/09/2017 | $ | 497 | $ | 486 | ||||
Harbourvest Partners LLC, 1st Lien | ||||||||
4.750%, 11/21/2017 | 770 | 774 | ||||||
Harrah’s Entertainment, Extended | ||||||||
5.434%, 01/28/2018 | 250 | 226 | ||||||
HDV Holdings, Term Loan | ||||||||
5.750%, 12/18/2018 | 150 | 149 | ||||||
Helm Financial, Term Loan | ||||||||
6.250%, 06/01/2017 | 148 | 148 | ||||||
Hemisphere Media Group, Term Loan | ||||||||
6.250%, 07/30/2020 | 100 | 100 | ||||||
Horseshoe Baltimore, Term Loan | ||||||||
8.250%, 04/26/2020 | 100 | 103 | ||||||
Hostess Brands | ||||||||
6.750%, 04/09/2020 | 100 | 102 | ||||||
Intrawest ULC, 1st Lien Term Loan | ||||||||
7.000%, 12/04/2017 | 1,492 | 1,507 | ||||||
ION Trading Technologies, 2nd Lien Term Loan Cov-Lite | ||||||||
8.250%, 05/21/2021 | 100 | 100 | ||||||
IPC Information Systems | ||||||||
7.750%, 07/31/2017 | 170 | 166 | ||||||
IPC Systems, 1st Lien | ||||||||
7.750%, 07/31/2017 | 199 | 194 | ||||||
Jacobs Entertainment, 1st Lien | ||||||||
6.250%, 10/29/2018 | 397 | 397 | ||||||
Keystone Automotive Operations, | ||||||||
7.000%, 08/08/2019 | 100 | 100 | ||||||
LANDesk Software, 1st Lien Term Loan | ||||||||
5.250%, 08/09/2019 | 450 | 452 | ||||||
Laureate Education | ||||||||
5.250%, 06/15/2018 | 178 | 178 | ||||||
Learning Care Group, Term Loan | ||||||||
6.000%, 05/08/2019 | 500 | 498 | ||||||
Lions Gate Entertainment, 2nd Lien | ||||||||
5.000%, 07/19/2020 | 1,500 | 1,493 | ||||||
Magic Newco, 1st Lien Term Loan B | ||||||||
5.000%, 12/12/2018 | 599 | 598 | ||||||
McJunkin Red Man, Term Loan | ||||||||
7.250%, 11/08/2019 | 2 | 2 | ||||||
6.000%, 11/08/2019 | 594 | 596 | ||||||
MedQuist, Term Loan B | ||||||||
7.500%, 08/15/2019 | 297 | 288 | ||||||
MEI Conlux Holdings, 1st Lien | ||||||||
5.000%, 08/02/2020 | 200 | 200 | ||||||
Merge Healthcare, Term Loan B | ||||||||
6.000%, 04/23/2019 | 500 | 473 | ||||||
Mirion Technologies, 1st Lien Term Loan | ||||||||
5.750%, 03/30/2018 | 19 | 19 | ||||||
| Description | Face Amount ($ Thousands) | Market Value ($ Thousands) | ||||||
MISYS PLC, 2nd Lien | ||||||||
12.000%, 06/12/2019 | $ | 350 | $ | 401 | ||||
Mitchell International, Unfunded Bridge Loan | ||||||||
0.000%, 01/06/2014 (E) | 100 | — | ||||||
Moxie Liberty, 1st Lien Term Loan B1 | ||||||||
7.500%, 08/21/2020 | 170 | 172 | ||||||
NAB Holdings LLC | ||||||||
7.000%, 04/24/2018 | 237 | 237 | ||||||
NANA Development, Term Loan | ||||||||
8.000%, 03/15/2018 | 238 | 238 | ||||||
Navistar International | ||||||||
5.750%, 08/17/2017 | 118 | 119 | ||||||
Neiman Marcus, Unfunded and Unsecured Bridge Loan | ||||||||
0.000%, 03/11/2014 (E) (F) | 550 | — | ||||||
Nuveen Investments | ||||||||
4.182%, 05/13/2017 | 250 | 247 | ||||||
Ocean Rig, 1st Lien Term Loan B2 Cov-Lite | ||||||||
5.500%, 09/02/2016 | 500 | 505 | ||||||
One Call Medical, Cov-Lite | ||||||||
5.500%, 08/22/2019 | 984 | 986 | ||||||
Oxbow Carbon & Minerals, | ||||||||
8.000%, 01/19/2020 | 100 | 102 | ||||||
P2ES Holdings | ||||||||
6.000%, 11/20/2018 | 16 | 16 | ||||||
P2ES Holdings, 1st Lien | ||||||||
6.000%, 11/20/2018 | 1,226 | 1,226 | ||||||
P2ES Holdings, 2nd Lien | ||||||||
10.000%, 05/20/2019 | 200 | 201 | ||||||
Panda Temple Power, 1st Lien | ||||||||
7.250%, 04/03/2019 | 350 | 353 | ||||||
Panolam Industries International | ||||||||
7.250%, 08/23/2017 | 220 | 219 | ||||||
Paradigm | ||||||||
4.750%, 07/30/2019 | 496 | 495 | ||||||
Performance Food Group, 2nd Lien | ||||||||
6.250%, 11/07/2019 | 600 | 592 | ||||||
Pierre Foods, Term Loan, 1st Lien | ||||||||
5.750%, 07/10/2017 | 498 | 500 | ||||||
Pierre Foods, Term Loan, 2nd Lien | ||||||||
9.500%, 10/02/2017 | 750 | 760 | ||||||
Plato Learning | ||||||||
6.000%, 05/17/2018 | 193 | 193 | ||||||
Ranpak, 2nd Lien Term Loan | ||||||||
8.500%, 04/10/2020 | 200 | 204 | ||||||
Reddy Ice, 1st Lien Term Loan | ||||||||
6.750%, 03/28/2019 | 348 | 347 | ||||||
Reddy Ice, 2nd Lien Term Loan | ||||||||
10.750%, 11/01/2019 | 225 | 221 | ||||||
| SEI Institutional Managed Trust / Annual Report / September 30, 2013 | 201 |
SCHEDULE OF INVESTMENTS
Multi-Asset Income Fund (Continued)
September 30, 2013
| Description | Face Amount ($ Thousands) | Market Value ($ Thousands) | ||||||
Reddy Ice, Term Loan | ||||||||
6.750%, 03/28/2019 | $ | 1 | $ | 1 | ||||
RGIS Services | ||||||||
5.500%, 10/18/2017 | 522 | 515 | ||||||
Rice Drilling B, 2nd Lien Term Loan | ||||||||
8.500%, 10/25/2018 | 225 | 225 | ||||||
Royal Adhesives and Sealants, | ||||||||
5.500%, 07/31/2018 | 200 | 202 | ||||||
Sabre Holdings | ||||||||
5.250%, 02/15/2019 | 494 | 493 | ||||||
Sears Holdings, 1st Lien Term Loan | ||||||||
0.000%, 06/30/2018 (F) | 500 | 496 | ||||||
Shelf Drilling | ||||||||
6.250%, 05/31/2018 | 149 | 149 | ||||||
Sirva Worldwide, Term Loan | ||||||||
7.500%, 03/27/2019 | 848 | 856 | ||||||
Smart & Final, Term Loan | ||||||||
4.500%, 11/15/2019 (F) | 1 | 1 | ||||||
Sophos Public | ||||||||
6.500%, 05/10/2019 | 10 | 10 | ||||||
Southern Graphic Systems, 1st Lien Cov-Lite | ||||||||
5.000%, 10/17/2019 | 448 | 448 | ||||||
Steinway Musical Instruments, 2nd Lien Term Loan | ||||||||
9.250%, 09/18/2020 | 100 | 100 | ||||||
Sumtotal Systems | ||||||||
7.250%, 11/16/2018 | 2 | 2 | ||||||
6.250%, 11/16/2018 | 3 | 3 | ||||||
Sumtotal Systems, Term Loan Cov-Lite | ||||||||
6.250%, 11/16/2018 | 889 | 885 | ||||||
Sutherland Global, 1st Lien | ||||||||
7.250%, 03/06/2019 | 204 | 203 | ||||||
Sutherland SGS | ||||||||
7.250%, 03/06/2019 | 92 | 92 | ||||||
The Harvard Drug Group, 1st Lien | ||||||||
0.000%, 08/14/2020 (F) | 259 | 259 | ||||||
ThermaSys AKA API Heat | ||||||||
6.250%, 01/30/2017 | 2 | 2 | ||||||
ThermaSys, Term Loan, 1st Lien | ||||||||
5.250%, 05/03/2019 | 373 | 371 | ||||||
Ti Automotive, Term Loan B | ||||||||
5.500%, 03/28/2019 | 349 | 352 | ||||||
Tomkins, 1st Lien Cov-Lite | ||||||||
5.000%, 11/09/2018 | 199 | 199 | ||||||
Topaz Power, 1st Lien Term Loan | ||||||||
5.250%, 02/26/2020 | 398 | 397 | ||||||
Totes Isotoner, 1st Lien Term Loan B | ||||||||
8.000%, 07/07/2017 | 1 | 1 | ||||||
7.250%, 07/07/2017 | 99 | 99 | ||||||
Transtar Industries, Term Loan, 1st Lien | ||||||||
5.500%, 10/09/2018 | 298 | 299 | ||||||
| Description | Face Amount ($ Thousands) | Market Value ($ Thousands) | ||||||
Transtar Industries, Term Loan, 2nd Lien | ||||||||
9.750%, 10/02/2019 | $ | 150 | $ | 152 | ||||
Travelport, Term Loan | ||||||||
6.250%, 06/26/2019 | 2,240 | 2,264 | ||||||
U.S. Infrastructure | ||||||||
4.750%, 07/24/2020 | 100 | 100 | ||||||
US Shipping, 1st Lien Term Loan | ||||||||
9.000%, 04/11/2018 | 400 | 408 | ||||||
Viking Aquisitions | ||||||||
6.000%, 11/05/2016 | 79 | 78 | ||||||
Wall Street Systems, 1st Lien | ||||||||
5.750%, 10/25/2019 | 547 | 549 | ||||||
Wall Street Systems, 2nd Lien Term Loan Cov-Lite | ||||||||
9.250%, 10/25/2020 | 150 | 151 | ||||||
|
| |||||||
Total Loan Participations | 50,993 | |||||||
|
| |||||||
ASSET-BACKED SECURITIES — 12.1% |
| |||||||
Other Asset-Backed Securities — 12.1% |
| |||||||
Accredited Mortgage Loan Trust, Ser 2007-1, Cl A3 | ||||||||
0.309%, 02/25/2037 (B) | 798 | 719 | ||||||
ACE Securities Home Equity Loan Trust, Ser 2006-ASP2, Cl A2D | ||||||||
0.459%, 03/25/2036 (B) | 1,750 | 1,366 | ||||||
Aerco, Ser 2000-2A, Cl A3 | ||||||||
0.642%, 07/15/2025 (B) (C) | 1,439 | 1,022 | ||||||
Airplanes Pass-Through Trust, | ||||||||
0.732%, 03/15/2019 (B) | 1,411 | 536 | ||||||
Argent Securities, Ser 2005-W3, Cl A2D | ||||||||
0.519%, 11/25/2035 (B) | 425 | 389 | ||||||
Asset-Backed Securities Home Equity, Ser 2004-HE8, Cl M1 | ||||||||
1.229%, 12/25/2034 (B) | 750 | 644 | ||||||
Babcock & Brown Air Funding I Ltd., Ser 2007-1A, Cl G1 | ||||||||
0.619%, 11/14/2033 (A) (B) | 839 | 713 | ||||||
Castle Trust, Ser 2003-1AW, Cl A1 | ||||||||
0.932%, 05/15/2027 (A) (B) | 16 | 15 | ||||||
CIT Mortgage Loan Trust, | ||||||||
1.629%, 10/25/2037 (A) (B) | 1,000 | 847 | ||||||
Citi Holdings Liquidating Unrated Performing Assets, Ser 2012-BIZ, Cl A | ||||||||
0.825%, 12/15/2049 (A) (D) | 540 | 432 | ||||||
Citigroup Commercial Mortgage Trust, Ser 2013-375P | ||||||||
3.634%, 05/10/2035 | 2,000 | 1,697 | ||||||
Citigroup Mortgage Loan Trust, Ser 2007-WFH2, Cl A4 | ||||||||
0.529%, 03/25/2037 (B) | 700 | 555 | ||||||
| 202 | SEI Institutional Managed Trust / Annual Report / September 30, 2013 |
| Description | Face Amount ($ Thousands) | Market Value ($ Thousands) | ||||||
COMM Mortgage Trust, Ser FL12, Cl F | ||||||||
0.522%, 12/15/2020 (A) (B) | $ | 718 | $ | 696 | ||||
COMM Mortgage Trust, Ser FL12, Cl E | ||||||||
0.472%, 12/15/2020 (A) (B) | 717 | 696 | ||||||
COMM Mortgage Trust, Ser FL12, Cl D | ||||||||
0.412%, 12/15/2020 (A) (B) | 978 | 955 | ||||||
Emerald Aviation Finance, | ||||||||
6.350%, 10/15/2038 (A) | 1,500 | 1,496 | ||||||
First Frankin Mortgage Loan Trust, Ser 2006-FF1, Cl 2A4 | ||||||||
0.519%, 01/25/2036 (B) | 500 | 422 | ||||||
Genesis Funding, Ser 2006-1A, Cl G1 | ||||||||
0.421%, 12/19/2032 (A) (B) | 536 | 475 | ||||||
GreenPoint Mortgage Funding Trust, Ser 2005-HE4, Cl M1 | ||||||||
0.884%, 07/25/2030 (B) | 2,900 | 2,538 | ||||||
GSAA Home Equity Trust, | ||||||||
0.429%, 09/25/2036 (B) | 691 | 384 | ||||||
GSAA Home Equity Trust, | ||||||||
0.449%, 07/25/2037 (B) | 668 | 556 | ||||||
Home Equity Asset Trust, Ser 2005-7, Cl M1 | ||||||||
0.629%, 01/25/2036 (B) | 600 | 474 | ||||||
Home Equity Asset Trust, | ||||||||
0.489%, 07/25/2036 (B) | 1,000 | 881 | ||||||
Lehman XS Trust, Ser 2005-7N, Cl 1A1A | ||||||||
0.449%, 12/25/2035 (B) | 817 | 698 | ||||||
Lehman XS Trust, Ser 2006-16N, Cl A4A | ||||||||
0.369%, 11/25/2046 (B) | 892 | 668 | ||||||
New Century Home Equity Loan Trust, Ser 2004-4, Cl M2 | ||||||||
0.974%, 02/25/2035 (B) | 1,140 | 1,027 | ||||||
New Century Home Equity Loan Trust, Ser 2005-1, Cl M2 | ||||||||
0.659%, 03/25/2035 (B) | 693 | 589 | ||||||
Nomura Resecuritization Trust, Ser 2012-1R, Cl A | ||||||||
0.624%, 08/27/2047 (A) (B) | 1,895 | 1,744 | ||||||
Raspro Trust, Ser 2005-1A, Cl G | ||||||||
0.652%, 03/23/2024 (A) (B) (D) | 56 | 51 | ||||||
Structured Asset Securities Mortgage Loan Trust, Ser 2006-OPT1, Cl A5 | ||||||||
0.439%, 04/25/2036 (B) | 1,700 | 1,412 | ||||||
Wachovia Asset Securitization Issuance II, Ser 2007-HE1, Cl A | ||||||||
0.319%, 07/25/2037 (A) (B) | 1,102 | 941 | ||||||
Wells Fargo Home Equity Trust, Ser 2006-3, Cl A2 | ||||||||
0.329%, 01/25/2037 (B) | 245 | 221 | ||||||
| Description | Face Amount ($ Thousands)/Shares | Market Value ($ Thousands) | ||||||
Willis Engine Securitization Trust II, Ser 2012-A, Cl A | ||||||||
5.500%, 09/15/2037 (A) (C) (D) | $ | 1,923 | $ | 1,915 | ||||
|
| |||||||
Total Asset-Backed Securities | 27,774 | |||||||
|
| |||||||
EXCHANGE TRADED FUNDS — 1.9% |
| |||||||
iShares MSCI Spain | 63,368 | 2,202 | ||||||
SPDR EURO STOXX 50 ETF | 56,100 | 2,153 | ||||||
|
| |||||||
Total Exchange Traded Funds | 4,355 | |||||||
|
| |||||||
PREFERRED STOCK — 1.7% | ||||||||
Aspen Insurance Holdings, 5.950% (B) | 80,000 | 1,899 | ||||||
Goldman Sachs Group, 5.500% (B) | 60,000 | 1,346 | ||||||
Morgan Stanley, 7.125% (B) | 24,000 | 605 | ||||||
|
| |||||||
Total Preferred Stock | 3,850 | |||||||
|
| |||||||
MORTGAGE-BACKED SECURITIES — 1.4% |
| |||||||
Agency Mortgage-Backed Obligations — 0.8% |
| |||||||
FHLMC CMO, Ser 2013-4204, Cl QZ | ||||||||
3.000%, 05/15/2043 | 717 | 602 | ||||||
FNMA CMO, Ser 2013-2, Cl LZ | ||||||||
3.000%, 02/25/2043 | 508 | 471 | ||||||
FNMA CMO, Ser 2013-52, Cl ZA | ||||||||
3.000%, 06/25/2043 | 365 | 314 | ||||||
FNMA CMO, Ser 2013-54, Cl KZ | ||||||||
3.000%, 06/25/2043 | 138 | 109 | ||||||
FNMA CMO, Ser 2013-54, Cl QZ | ||||||||
3.000%, 06/25/2033 | 343 | 319 | ||||||
|
| |||||||
| 1,815 | ||||||||
|
| |||||||
Non-Agency Mortgage-Backed Obligations — 0.6% |
| |||||||
Alliance Bancorp Trust, | ||||||||
0.419%, 07/25/2037 (B) | 633 | 400 | ||||||
Credit Suisse Mortgage Capital Certificates, Ser TF2A, Cl F | ||||||||
0.582%, 10/15/2021 (A) (B) | 250 | 242 | ||||||
GreenPoint Mortgage Funding Trust 2006-AR1, Ser 2006-AR1, Cl A1A | ||||||||
0.469%, 02/25/2036 (B) | 862 | 665 | ||||||
|
| |||||||
| 1,307 | ||||||||
|
| |||||||
Total Mortgage-Backed Securities | 3,122 | |||||||
|
| |||||||
| SEI Institutional Managed Trust / Annual Report / September 30, 2013 | 203 |
SCHEDULE OF INVESTMENTS
Multi-Asset Income Fund (Continued)
September 30, 2013
| Description | Face Amount ($ Thousands) | Market Value ($ Thousands) | ||||||
TIME DEPOSIT — 17.0% | ||||||||
Brown Brothers Harriman | ||||||||
0.030%, 10/01/2013 | $ | 39,140 | $ | 39,140 | ||||
|
| |||||||
Total Time Deposit (Cost $39,140) ($ Thousands) | 39,140 | |||||||
|
| |||||||
Total Investments — 104.8% | ||||||||
(Cost $242,389) ($ Thousands) | $ | 241,308 | ||||||
|
| |||||||
| Description | Contracts | Market Value ($ Thousands) | ||||||
PURCHASED OPTION*† — 0.0% | ||||||||
S&P 500 ETF Trust, Put, Expires 11/16/2013, Strike Price $1,450.00 | 384 | $ | 102 | |||||
|
| |||||||
Total Purchased Option | 102 | |||||||
|
| |||||||
WRITTEN OPTION*† — 0.0% | ||||||||
S&P 500 ETF Trust, Put, Expires 11/16/2013, Strike Price $1,300.00 | (384 | ) | (27 | ) | ||||
|
| |||||||
Total Written Option | $ | (27 | ) | |||||
|
| |||||||
A list of open centrally cleared swap agreements held by the Fund at September 30, 2013, is as follows:
| Interest Rate Swaps | ||||||||||||
| Broker | Fund Pays | Fund Receives | Termination Date | Notional Amount ($ Thousands) | Net Unrealized Depreciation ($ Thousands) | |||||||
| Bank of America | 2.70% | 3 Month LIBOR | 07/18/23 | 600 | $ | (4 | ) | |||||
| Bank of America | 1.56% | 3 Month LIBOR | 07/03/18 | 11,150 | (121 | ) | ||||||
|
| |||||||||||
| $ | (125 | ) | ||||||||||
|
| |||||||||||
For the year ended September 30, 2013, the total amount of all open centrally cleared swap agreements, as presented in the table above, is representative of the volume of activity for this derivative type during the year.
Percentages are based on a Net Assets of $230,356 ($ Thousands).
| * | Non-income producing security. |
| ‡ | Real Estate Investment Trust. |
| † | For the year ended September 30, 2013, the total amount of open purchased options and written options, as presented in the Schedule of Investments, are representative of the volume of activity for these derivative types during the year. |
| (A) | Securities sold within terms of a private placement memorandum, exempt from registration under Section 144A of the Securities Act of 1933, as amended, and may be sold only to dealers in that program or other “accredited investors.” These securities have been determined to be liquid under guidelines established by the board of Trustees. |
| (B) | Variable Rate Security — The rate reported on the Schedule of Investments is the rate in effects as of September 30, 2013. The date reported on the Schedule of Investments is the next reset date. |
| (C) | Security, or a portion thereof, has been pledged as collateral on open reverse repurchase agreements. |
| (D) | Security fair valued using methods determined in good faith by the Valuation Committee of the Board of Trustees. The total market value of such securities as of September 30, 2013 was $29,347 ($ Thousands) and represented 12.7% of Net Assets. |
| (E) | Unfunded bank loan. Interest rate not available. |
| (F) | Unsettled bank loan. Interest rate not available. |
| (G) | Security in default on interest payments. |
| (H) | Represents equity/residual tranche. |
| CBO | — Collateralized Bond Obligation |
CDO — Collateralized Debt Obligation
Cl — Class
CLO — Collateralized Loan Obligation
CMO — Collateralized Mortgage Obligation
ETF — Exchange Traded Fund
FHLMC — Federal Home Loan Mortgage Corporation
FNMA — Federal National Mortgage Association
LIBOR — London Interbank Offered Rate
LLC. — Limited Liability Company
Ltd. — Limited
MSCI — Morgan Stanley Capital International
PLC — Public Limited Company
Ser — Series
S&P — Standard & Poor’s
SPDR — Standard & Poor’s Depositary Receipt
SPV — Special Purpose Vehicle
The following is a list of the level of inputs used as of September 30, 2013, in valuing the Fund’s investments carried at value ($ Thousands):
| Investments in Securities | Level 1 | Level 2 | Level 3(1) | Total | ||||||||||||
Corporate Obligations | $ | — | $ | 59,743 | $ | — | $ | 59,743 | ||||||||
Collateralized Debt Obligations | — | 23,275 | 29,056 | 52,331 | ||||||||||||
Loan Participations | — | 49,990 | 1,003 | 50,993 | ||||||||||||
Asset-Backed Securities | — | 23,880 | 3,894 | 27,774 | ||||||||||||
Exchange Traded Funds | 4,355 | — | — | 4,355 | ||||||||||||
Preferred Stock | 1,346 | 2,504 | — | 3,850 | ||||||||||||
Mortgage-Backed Securities | — | 3,122 | — | 3,122 | ||||||||||||
Time Deposits | — | 39,140 | — | 39,140 | ||||||||||||
|
|
|
|
|
|
|
| |||||||||
Total Investments in Securities | $ | 5,701 | $ | 201,654 | $ | 33,953 | $ | 241,308 | ||||||||
|
|
|
|
|
|
|
| |||||||||
| Other Financial Instruments | Level 1 | Level 2 | Level 3 | Total | ||||||||||||
Purchased Option | 102 | — | — | 102 | ||||||||||||
Written Option | (27 | ) | — | — | (27 | ) | ||||||||||
Centrally Cleared Swaps | ||||||||||||||||
Interest Rate Swaps* | — | (125 | ) | — | (125 | ) | ||||||||||
Reverse Repurchase Agreement** | $ | (7,125 | ) | $ | — | $ | — | $ | (7,125 | ) | ||||||
|
|
|
|
|
|
|
| |||||||||
Total Other Financial Instruments | $ | (7,050 | ) | $ | (125 | ) | $ | — | $ | (7,175 | ) | |||||
|
|
|
|
|
|
|
| |||||||||
| * | Swaps are valued at the unrealized depreciation on the instrument. |
| ** | See Note 2 for more information on the reverse repurchase agreements. |
| (1) | Please see Note 2 for details on the unobservable inputs and the interrelationships and sensitivity between these inputs for those Level 3 securities that are not valued by third party pricing vendors or broker quotes. |
| 204 | SEI Institutional Managed Trust / Annual Report / September 30, 2013 |
SCHEDULE OF INVESTMENTS
Multi-Asset Income Fund (Concluded)
September 30, 2013
The following is a reconciliation of the investments in which significant unobservable inputs (Level 3) were used in determining fair value ($ Thousands):
| Loan Participations | Asset-Backed Securities | Collateralized Debt Obligations | ||||||||||
Beginning balance as of October 1, 2012 | $— | $2,689 | $14,433 | |||||||||
Accrued discounts/premiums | — | 3 | 95 | |||||||||
Realized gain/(loss) | — | 77 | 4,564 | |||||||||
Change in unrealized appreciation/(depreciation) | (6 | ) | 15 | (204 | ) | |||||||
Net purchases/sales | 636 | 1,110 | 11,988 | |||||||||
Net transfer in and/or out of Level 3 | 373 | — | (1,820 | ) | ||||||||
|
|
|
|
|
| |||||||
Ending balance as of September 30, 2013 | $1,003 | $3,894 | $29,056 | |||||||||
|
|
|
|
|
| |||||||
For the year ended September 30, 2013, there have been no transfers between Level 1 and Level 2 assets and liabilities.
For the year ended September 30, 2013, there have been no transfers between Level 2 and Level 3 assets and liabilities.
For more information on valuation inputs, see Note 2 — Significant Accounting Policies in Notes to Financial Statements.
Amounts designated as “—” are $0 or have been rounded to $0.
The accompanying notes are an integral part of the financial statements.
| SEI Institutional Managed Trust / Annual Report / September 30, 2013 | 205 |
CONSOLIDATED SCHEDULE OF INVESTMENTS
Multi-Asset Inflation Managed Fund
September 30, 2013
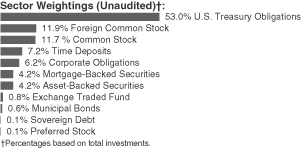
| Description | Shares | Market Value ($ Thousands) | ||||||
FOREIGN COMMON STOCK — 13.7% |
| |||||||
Australia — 0.7% | ||||||||
BHP Billiton | 144,610 | $ | 4,833 | |||||
Stockland† | 78,730 | 285 | ||||||
|
| |||||||
| 5,118 | ||||||||
|
| |||||||
Brazil — 1.4% | ||||||||
Duratex* | 127,400 | 753 | ||||||
Petroleo Brasileiro, ADR | 199,310 | 3,087 | ||||||
Petroleo Brasileiro, Cl A ADR | 100,220 | 1,677 | ||||||
Vale, Cl B ADR | 359,200 | 5,104 | ||||||
|
| |||||||
| 10,621 | ||||||||
|
| |||||||
Canada — 2.5% | ||||||||
Agrium | 17,369 | 1,463 | ||||||
Allied Properties, Cl A† | 23,490 | 742 | ||||||
Artis† | 43,290 | 598 | ||||||
Barrick Gold | 41,850 | 781 | ||||||
Brookfield Residential Properties* | 23,402 | 539 | ||||||
Chartwell Retirement Residences† | 33,690 | 331 | ||||||
Cominar† | 24,500 | 459 | ||||||
Dominion Diamond* | 53,150 | 648 | ||||||
Dundee, Cl A (Canada)† | 25,310 | 715 | ||||||
Goldcorp | 100,940 | 2,632 | ||||||
Granite† | 23,120 | 824 | ||||||
New Gold* | 57,870 | 346 | ||||||
North American Palladium* | 770,350 | 739 | ||||||
Potash Corp of Saskatchewan | 26,180 | 820 | ||||||
RioCan† | 36,320 | 859 | ||||||
Suncor Energy | 125,990 | 4,514 | ||||||
Teck Resources, Cl B | 89,000 | 2,397 | ||||||
|
| |||||||
| 19,407 | ||||||||
|
| |||||||
China — 0.5% | ||||||||
China Petroleum & Chemical, Cl H | 4,115,400 | 3,221 | ||||||
China Shenhua Energy, Cl H | 265,500 | 808 | ||||||
|
| |||||||
| 4,029 | ||||||||
|
| |||||||
France — 0.6% | ||||||||
Total | 83,980 | 4,876 | ||||||
|
| |||||||
Israel — 0.1% | ||||||||
Israel Chemicals | 102,410 | 864 | ||||||
|
| |||||||
| Description | Shares | Market Value ($ Thousands) | ||||||
Italy — 0.6% | ||||||||
Eni | 202,410 | $ | 4,644 | |||||
|
| |||||||
Japan — 0.3% | ||||||||
Dowa Holdings | 94,000 | 946 | ||||||
JFE Holdings | 61,800 | 1,602 | ||||||
|
| |||||||
| 2,548 | ||||||||
|
| |||||||
Luxembourg — 0.1% | ||||||||
MHP GDR | 43,370 | 687 | ||||||
|
| |||||||
Netherlands — 1.9% | ||||||||
Koninklijke DSM | 24,956 | 1,884 | ||||||
LyondellBasell Industries, Cl A | 28,890 | 2,116 | ||||||
Royal Dutch Shell, Cl A | 285,052 | 9,407 | ||||||
Ternium ADR | 35,750 | 859 | ||||||
|
| |||||||
| 14,266 | ||||||||
|
| |||||||
Norway — 0.5% | ||||||||
Aker Solutions | 80,670 | 1,133 | ||||||
DNO International* | 339,650 | 754 | ||||||
Odfjell Drilling* | 91,624 | 621 | ||||||
Statoil | 52,680 | 1,196 | ||||||
|
| |||||||
| 3,704 | ||||||||
|
| |||||||
Russia — 0.8% | ||||||||
Gazprom OAO ADR | 495,880 | 4,369 | ||||||
MMC Norilsk Nickel ADR | 133,890 | 1,932 | ||||||
|
| |||||||
| 6,301 | ||||||||
|
| |||||||
Singapore — 0.0% | ||||||||
UOL Group | 53,000 | 260 | ||||||
|
| |||||||
South Africa — 0.1% | ||||||||
Sappi* | 159,070 | 399 | ||||||
|
| |||||||
Sweden — 0.1% | ||||||||
Lundin Petroleum* | 45,110 | 973 | ||||||
|
| |||||||
Switzerland — 0.2% | ||||||||
Glencore Xstrata | 312,068 | 1,702 | ||||||
|
| |||||||
Thailand — 0.2% | ||||||||
PTT | 151,200 | 1,527 | ||||||
|
| |||||||
United Kingdom — 3.1% | ||||||||
BG Group | 299,390 | 5,723 | ||||||
BP | 771,850 | 5,414 | ||||||
Johnson Matthey | 18,820 | 856 | ||||||
Mondi | 69,400 | 1,172 | ||||||
Rio Tinto | 153,560 | 7,518 | ||||||
Royal Dutch Shell, Cl B | 82,110 | 2,838 | ||||||
|
| |||||||
| 23,521 | ||||||||
|
| |||||||
Total Foreign Common Stock |
| 105,447 | ||||||
|
| |||||||
| 206 | SEI Institutional Managed Trust / Annual Report / September 30, 2013 |
| Description | Shares | Market Value ($ Thousands) | ||||||
COMMON STOCK — 13.5% |
| |||||||
Consumer Discretionary — 0.1% | ||||||||
Murphy USA* | 4,067 | $ | 164 | |||||
Regal Entertainment Group, Cl A | 43,100 | 818 | ||||||
|
| |||||||
| 982 | ||||||||
|
| |||||||
Energy — 6.5% | ||||||||
Anadarko Petroleum, Cl A | 31,250 | 2,906 | ||||||
Cabot Oil & Gas | 20,160 | 752 | ||||||
Chevron | 84,570 | 10,275 | ||||||
Cimarex Energy | 13,390 | 1,291 | ||||||
Diamond Offshore Drilling | 17,500 | 1,091 | ||||||
EOG Resources | 14,910 | 2,524 | ||||||
Exxon Mobil | 172,350 | 14,829 | ||||||
Halliburton | 32,750 | 1,577 | ||||||
Helmerich & Payne | 12,610 | 869 | ||||||
Hess | 20,480 | 1,584 | ||||||
Murphy Oil | 16,270 | 981 | ||||||
Noble Energy | 26,380 | 1,768 | ||||||
Occidental Petroleum | 46,830 | 4,381 | ||||||
Schlumberger, Cl A | 28,600 | 2,527 | ||||||
Seadrill | 17,590 | 793 | ||||||
Valero Energy | 41,500 | 1,417 | ||||||
|
| |||||||
| 49,565 | ||||||||
|
| |||||||
Financials — 6.0% | ||||||||
Apartment Investment & Management, Cl A† | 14,650 | 409 | ||||||
Armada Hoffler Properties† | 32,754 | 325 | ||||||
Ashford Hospitality Trust† | 71,400 | 881 | ||||||
Associated Estates Realty† | 57,940 | 864 | ||||||
AvalonBay Communities† | 8,750 | 1,112 | ||||||
BioMed Realty Trust† | 20,220 | 376 | ||||||
Boston Properties† | 12,000 | 1,283 | ||||||
Brandywine Realty Trust† | 56,100 | 739 | ||||||
Chesapeake Lodging Trust† | 15,890 | 374 | ||||||
Cole Real Estate Investment† | 46,070 | 565 | ||||||
Corporate Office Properties Trust† | 5,680 | 131 | ||||||
Cousins Properties, Cl A† | 78,084 | 804 | ||||||
CubeSmart† | 28,300 | 505 | ||||||
CyrusOne† | 41,852 | 794 | ||||||
DDR† | 58,760 | 923 | ||||||
DiamondRock Hospitality† | 70,292 | 750 | ||||||
Digital Realty Trust, Cl A† | 12,740 | 677 | ||||||
EPR Properties, Cl A† | 4,740 | 231 | ||||||
Equity Residential† | 24,870 | 1,332 | ||||||
Extra Space Storage† | 27,440 | 1,255 | ||||||
Franklin Street Properties† | 4,900 | 62 | ||||||
General Growth Properties† | 57,560 | 1,110 | ||||||
HCP† | 35,040 | 1,435 | ||||||
Health Care† | 21,630 | 1,349 | ||||||
Home Properties† | 2,410 | 139 | ||||||
| Description | Shares/Face Amount ($ Thousands) | Market Value ($ Thousands) | ||||||
Host Hotels & Resorts† | 56,600 | $ | 1,000 | |||||
Inland Real Estate† | 38,150 | 390 | ||||||
Kimco Realty† | 29,510 | 596 | ||||||
Kite Realty Group Trust† | 97,729 | 580 | ||||||
LaSalle Hotel Properties† | 19,340 | 552 | ||||||
Lexington Realty Trust† | 65,570 | 736 | ||||||
LTC Properties† | 25,270 | 960 | ||||||
Medical Properties Trust† | 79,607 | 969 | ||||||
Mid-America Apartment Communities† | 16,850 | 1,053 | ||||||
National Retail Properties† | 12,020 | 382 | ||||||
Omega Healthcare Investors† | 38,940 | 1,163 | ||||||
Parkway Properties† | 50,583 | 899 | ||||||
Pebblebrook Hotel Trust† | 35,250 | 1,012 | ||||||
Pennsylvania† | 20,680 | 387 | ||||||
ProLogis† | 59,950 | 2,255 | ||||||
Public Storage† | 11,030 | 1,771 | ||||||
Ramco-Gershenson Properties† | 32,620 | 503 | ||||||
Realty Income† | 19,310 | 768 | ||||||
Rexford Industrial Realty*† | 38,854 | 525 | ||||||
RLJ Lodging Trust† | 40,998 | 963 | ||||||
Senior Housing Properties Trust† | 19,620 | 458 | ||||||
Simon Property Group† | 28,120 | 4,168 | ||||||
SL Green Realty† | 12,200 | 1,084 | ||||||
Sovran Self Storage† | 2,700 | 204 | ||||||
STAG Industrial† | 43,570 | 877 | ||||||
Strategic Hotels & Resorts*† | 17,290 | 150 | ||||||
Sun Communities† | 21,220 | 904 | ||||||
Ventas† | 23,250 | 1,430 | ||||||
Vornado Realty Trust† | 9,990 | 840 | ||||||
|
| |||||||
| 46,004 | ||||||||
|
| |||||||
Materials — 0.9% | ||||||||
Commercial Metals, Cl A | 98,160 | 1,664 | ||||||
Freeport-McMoRan Copper & Gold, Cl B | 70,720 | 2,339 | ||||||
Monsanto | 30,620 | 3,196 | ||||||
|
| |||||||
| 7,199 | ||||||||
|
| |||||||
Total Common Stock | 103,750 | |||||||
|
| |||||||
CORPORATE OBLIGATIONS — 7.1% |
| |||||||
Consumer Discretionary — 0.9% | ||||||||
Comcast | ||||||||
6.450%, 03/15/2037 | $ | 185 | 221 | |||||
Dana Holding | ||||||||
6.000%, 09/15/2023 | 148 | 147 | ||||||
DIRECTV Holdings LLC | ||||||||
3.800%, 03/15/2022 | 745 | 695 | ||||||
DISH DBS | ||||||||
5.000%, 03/15/2023 | 415 | 385 | ||||||
Dollar General | ||||||||
4.125%, 07/15/2017 | 94 | 100 | ||||||
| SEI Institutional Managed Trust / Annual Report / September 30, 2013 | 207 |
CONSOLIDATED SCHEDULE OF INVESTMENTS
Multi-Asset Inflation Managed Fund (Continued)
September 30, 2013
| Description | Face Amount ($ Thousands) | Market Value ($ Thousands) | ||||||
Ford Motor Credit | ||||||||
5.000%, 05/15/2018 | $ | 710 | $ | 778 | ||||
MCE Finance | ||||||||
5.000%, 02/15/2021 (A) | 405 | 389 | ||||||
NBCUniversal Media | ||||||||
4.375%, 04/01/2021 | 210 | 226 | ||||||
News America | ||||||||
6.150%, 02/15/2041 | 165 | 182 | ||||||
4.500%, 02/15/2021 | 260 | 276 | ||||||
4.000%, 10/01/2023 (A) | 185 | 185 | ||||||
3.000%, 09/15/2022 | 405 | 379 | ||||||
Omnicom Group | ||||||||
3.625%, 05/01/2022 | 167 | 160 | ||||||
Reed Elsevier Capital | ||||||||
8.625%, 01/15/2019 | 475 | 605 | ||||||
Sirius XM Radio | ||||||||
4.625%, 05/15/2023 (A) | 421 | 384 | ||||||
Time Warner | ||||||||
4.000%, 01/15/2022 | 355 | 359 | ||||||
3.400%, 06/15/2022 | 595 | 578 | ||||||
Time Warner Cable | ||||||||
4.000%, 09/01/2021 | 360 | 336 | ||||||
Wynn Las Vegas | ||||||||
5.375%, 03/15/2022 | 285 | 286 | ||||||
|
| |||||||
| 6,671 | ||||||||
|
| |||||||
Consumer Staples — 0.3% | ||||||||
Altria Group | ||||||||
4.750%, 05/05/2021 | 210 | 223 | ||||||
Delhaize Group | ||||||||
6.500%, 06/15/2017 | 320 | 363 | ||||||
Kroger | ||||||||
3.400%, 04/15/2022 | 638 | 621 | ||||||
Marfrig Overseas | ||||||||
9.500%, 05/04/2020 (A) | 375 | 348 | ||||||
Reynolds American | ||||||||
3.250%, 11/01/2022 | 330 | 303 | ||||||
Skandinaviska Enskilda Banken | ||||||||
5.471%, 03/29/2049 (A) (B) | 235 | 239 | ||||||
Tyson Foods | ||||||||
4.500%, 06/15/2022 | 311 | 323 | ||||||
|
| |||||||
| 2,420 | ||||||||
|
| |||||||
Energy — 1.4% | ||||||||
CNOOC Finance | ||||||||
3.000%, 05/09/2023 | 641 | 576 | ||||||
DCP Midstream | ||||||||
4.750%, 09/30/2021 (A) | 220 | 222 | ||||||
Denbury Resources | ||||||||
4.625%, 07/15/2023 | 418 | 383 | ||||||
Energy Transfer Partners | ||||||||
6.125%, 02/15/2017 | 200 | 226 | ||||||
5.200%, 02/01/2022 | 465 | 489 | ||||||
| Description | Face Amount ($ Thousands) | Market Value ($ Thousands) | ||||||
Enterprise Products Operating | ||||||||
5.200%, 09/01/2020 | $ | 340 | $ | 378 | ||||
Gazprom OAO Via Gaz Capital MTN | ||||||||
6.212%, 11/22/2016 | 340 | 372 | ||||||
KazMunayGas National | ||||||||
7.000%, 05/05/2020 (A) | 325 | 366 | ||||||
Kinder Morgan Energy Partners | ||||||||
3.950%, 09/01/2022 | 990 | 973 | ||||||
Korea National Oil | ||||||||
3.125%, 04/03/2017 (A) | 465 | 478 | ||||||
Marathon Petroleum | ||||||||
5.125%, 03/01/2021 | 196 | 212 | ||||||
MarkWest Energy Partners | ||||||||
4.500%, 07/15/2023 | 264 | 249 | ||||||
Nabors Industries | ||||||||
4.625%, 09/15/2021 | 360 | 362 | ||||||
Noble Energy | ||||||||
8.250%, 03/01/2019 | 153 | 191 | ||||||
4.150%, 12/15/2021 | 475 | 495 | ||||||
Petroleos Mexicanos | ||||||||
3.500%, 07/18/2018 (A) | 519 | 525 | ||||||
Petronas Capital | ||||||||
5.250%, 08/12/2019 | 330 | 365 | ||||||
Phillips 66 | ||||||||
4.300%, 04/01/2022 | 377 | 384 | ||||||
Regency Energy Partners | ||||||||
4.500%, 11/01/2023 (A) | 114 | 103 | ||||||
Spectra Energy Capital | ||||||||
6.200%, 04/15/2018 | 315 | 362 | ||||||
Transocean | ||||||||
6.500%, 11/15/2020 | 245 | 274 | ||||||
6.375%, 12/15/2021 | 3 | 3 | ||||||
3.800%, 10/15/2022 | 291 | 274 | ||||||
Valero Energy | ||||||||
6.125%, 02/01/2020 | 480 | 552 | ||||||
Weatherford International Ltd. | ||||||||
4.500%, 04/15/2022 | 460 | 455 | ||||||
Williams | ||||||||
3.700%, 01/15/2023 | 709 | 640 | ||||||
Williams Partners | ||||||||
4.000%, 11/15/2021 | 585 | 576 | ||||||
3.350%, 08/15/2022 | 185 | 171 | ||||||
|
| |||||||
| 10,656 | ||||||||
|
| |||||||
Financials — 2.3% | ||||||||
American International Group | ||||||||
6.400%, 12/15/2020 | 325 | 383 | ||||||
4.875%, 06/01/2022 | 520 | 558 | ||||||
American Tower† | ||||||||
4.700%, 03/15/2022 | 365 | 355 | ||||||
3.500%, 01/31/2023 | 485 | 426 | ||||||
Bank of America | ||||||||
5.200%, 12/29/2049 (B) | 657 | 575 | ||||||
| 208 | SEI Institutional Managed Trust / Annual Report / September 30, 2013 |
| Description | Face Amount ($ Thousands) | Market Value ($ Thousands) | ||||||
Barclays Bank | ||||||||
7.625%, 11/21/2022 | $ | 414 | $ | 410 | ||||
6.625%, 03/30/2022 | 390 | 605 | ||||||
BNP Paribas | ||||||||
5.186%, 06/29/2049 (A) (B) | 259 | 261 | ||||||
Citigroup | ||||||||
5.950%, 12/29/2049 (B) | 790 | 737 | ||||||
Cooperatieve Centrale Raiffeisen-Boerenleenbank | ||||||||
3.950%, 11/09/2022 | 357 | 342 | ||||||
Credit Suisse | ||||||||
6.500%, 08/08/2023 (A) | 649 | 657 | ||||||
Danske Bank MTN | ||||||||
5.684%, 12/31/2049 (B) | 309 | 497 | ||||||
Goldman Sachs Group | ||||||||
5.750%, 01/24/2022 | 165 | 183 | ||||||
5.250%, 07/27/2021 | 350 | 378 | ||||||
3.625%, 02/07/2016 | 225 | 237 | ||||||
Hartford Financial Services Group | ||||||||
5.125%, 04/15/2022 | 655 | 717 | ||||||
HBOS Capital Funding | ||||||||
6.071%, 06/30/2049 (A) (B) | 399 | 390 | ||||||
HCP† | ||||||||
5.375%, 02/01/2021 | 455 | 495 | ||||||
Health Care† | ||||||||
5.250%, 01/15/2022 | 695 | 743 | ||||||
Healthcare Realty Trust† | ||||||||
5.750%, 01/15/2021 | 285 | 309 | ||||||
Host Hotels & Resorts† | ||||||||
5.250%, 03/15/2022 | 190 | 197 | ||||||
ING Bank | ||||||||
2.000%, 09/25/2015 (A) | 665 | 674 | ||||||
IPIC GMTN | ||||||||
3.750%, 03/01/2017 (A) | 460 | 486 | ||||||
JPMorgan Chase | ||||||||
5.400%, 01/06/2042 | 175 | 184 | ||||||
5.150%, 04/05/2023 (B) | 284 | 248 | ||||||
LBG Capital No.2 | ||||||||
15.000%, 12/21/2019 | 430 | 851 | ||||||
Lincoln National | ||||||||
4.200%, 03/15/2022 | 355 | 363 | ||||||
MetLife | ||||||||
5.700%, 06/15/2035 | 80 | 89 | ||||||
Metropolitan Life Global Funding I | ||||||||
3.875%, 04/11/2022 (A) | 275 | 282 | ||||||
Morgan Stanley MTN | ||||||||
5.500%, 07/28/2021 | 585 | 640 | ||||||
Murray Street Investment Trust I | ||||||||
4.647%, 03/09/2017 (C) | 55 | 58 | ||||||
Nationwide Financial Services | ||||||||
5.375%, 03/25/2021 (A) | 470 | 503 | ||||||
Nomura Holdings MTN | ||||||||
2.000%, 09/13/2016 | 804 | 806 | ||||||
| Description | Face Amount ($ Thousands) | Market Value ($ Thousands) | ||||||
PNC Bank | ||||||||
3.800%, 07/25/2023 | $ | 960 | $ | 940 | ||||
Prudential Financial | ||||||||
5.625%, 06/15/2043 (B) | 365 | 344 | ||||||
Rabobank Capital Funding Trust III | ||||||||
5.254%, 10/21/2016 (A) (B) | 380 | 386 | ||||||
Royal Bank of Scotland MTN | ||||||||
9.500%, 03/16/2022 (B) | 124 | 143 | ||||||
SLM MTN | ||||||||
7.250%, 01/25/2022 | 315 | 320 | ||||||
Societe Generale | ||||||||
5.922%, 04/05/2017 (A) (B) | 115 | 117 | ||||||
4.196%, 01/26/2015 (B) | 204 | 274 | ||||||
Standard Chartered MTN | ||||||||
4.000%, 07/12/2022 (B) | 775 | 786 | ||||||
|
| |||||||
| 17,949 | ||||||||
|
| |||||||
Health Care — 0.1% |
| |||||||
Actavis | ||||||||
3.250%, 10/01/2022 | 239 | 224 | ||||||
HCA | ||||||||
4.750%, 05/01/2023 | 410 | 386 | ||||||
|
| |||||||
| 610 | ||||||||
|
| |||||||
Industrials — 0.2% |
| |||||||
BE Aerospace | ||||||||
5.250%, 04/01/2022 | 280 | 278 | ||||||
CSX | ||||||||
4.750%, 05/30/2042 | 470 | 449 | ||||||
Embraer | ||||||||
5.150%, 06/15/2022 | 149 | 145 | ||||||
Odebrecht Finance | ||||||||
5.125%, 06/26/2022 (A) | 315 | 305 | ||||||
Republic Services | ||||||||
5.250%, 11/15/2021 | 320 | 351 | ||||||
|
| |||||||
| 1,528 | ||||||||
|
| |||||||
Information Technology — 0.3% |
| |||||||
Baidu | ||||||||
3.250%, 08/06/2018 | 418 | 418 | ||||||
2.250%, 11/28/2017 | 248 | 244 | ||||||
Intel | ||||||||
4.800%, 10/01/2041 | 265 | 254 | ||||||
Motorola Solutions | ||||||||
3.500%, 03/01/2023 | 515 | 481 | ||||||
Oracle | ||||||||
3.875%, 07/15/2020 | 215 | 229 | ||||||
Telefonaktiebolaget LM Ericsson | ||||||||
4.125%, 05/15/2022 | 535 | 523 | ||||||
Total System Services | ||||||||
3.750%, 06/01/2023 | 263 | 243 | ||||||
2.375%, 06/01/2018 | 262 | 256 | ||||||
|
| |||||||
| 2,648 | ||||||||
|
| |||||||
| SEI Institutional Managed Trust / Annual Report / September 30, 2013 | 209 |
CONSOLIDATED SCHEDULE OF INVESTMENTS
Multi-Asset Inflation Managed Fund (Continued)
September 30, 2013
| Description | Face Amount ($ Thousands) | Market Value ($ Thousands) | ||||||
Materials — 0.6% |
| |||||||
AngloGold Ashanti Holdings | ||||||||
5.375%, 04/15/2020 | $ | 60 | $ | 54 | ||||
Ball | ||||||||
5.000%, 03/15/2022 | 280 | 272 | ||||||
Basell Finance BV | ||||||||
8.100%, 03/15/2027 (A) | 220 | 278 | ||||||
Cemex | ||||||||
7.250%, 01/15/2021 (A) | 395 | 394 | ||||||
Cia Minera Milpo SAA | ||||||||
4.625%, 03/28/2023 (A) | 428 | 385 | ||||||
Dow Chemical | ||||||||
4.375%, 11/15/2042 | 232 | 201 | ||||||
4.250%, 11/15/2020 | 210 | 219 | ||||||
4.125%, 11/15/2021 | 270 | 276 | ||||||
Eagle Spinco | ||||||||
4.625%, 02/15/2021 (A) | 66 | 63 | ||||||
Gerdau Trade | ||||||||
5.750%, 01/30/2021 (A) | 102 | 100 | ||||||
4.750%, 04/15/2023 (A) | 365 | 324 | ||||||
International Paper | ||||||||
7.950%, 06/15/2018 | 295 | 366 | ||||||
4.750%, 02/15/2022 | 490 | 516 | ||||||
Sealed Air | ||||||||
5.250%, 04/01/2023 (A) | 332 | 314 | ||||||
Sociedad Quimica y Minera de Chile | ||||||||
3.625%, 04/03/2023 (A) | 408 | 352 | ||||||
Vale | ||||||||
5.625%, 09/11/2042 | 645 | 563 | ||||||
|
| |||||||
| 4,677 | ||||||||
|
| |||||||
Telecommunication Services — 0.7% |
| |||||||
AT&T | ||||||||
5.550%, 08/15/2041 | 245 | 243 | ||||||
3.000%, 02/15/2022 | 465 | 436 | ||||||
Deutsche Telekom International Finance BV | ||||||||
4.875%, 03/06/2042 (A) | 500 | 471 | ||||||
MetroPCS Wireless | ||||||||
6.625%, 04/01/2023 (A) | 380 | 381 | ||||||
MTS International Funding | ||||||||
5.000%, 05/30/2023 (A) | 375 | 344 | ||||||
Rogers Communications | ||||||||
4.000%, 06/06/2022 | 60 | 58 | ||||||
Sprint | ||||||||
7.875%, 09/15/2023 (A) | 405 | 413 | ||||||
Telecom Italia Capital | ||||||||
7.175%, 06/18/2019 | 260 | 286 | ||||||
Telefonica Emisiones SAU | ||||||||
5.462%, 02/16/2021 | 200 | 205 | ||||||
Verizon Communications | ||||||||
7.350%, 04/01/2039 | 350 | 428 | ||||||
5.150%, 09/15/2023 | 1,013 | 1,086 | ||||||
2.500%, 09/15/2016 | 526 | 542 | ||||||
| Description | Face Amount ($ Thousands) | Market Value ($ Thousands) | ||||||
VimpelCom Holdings BV | ||||||||
5.200%, 02/13/2019 (A) | $ | 330 | $ | 328 | ||||
Virgin Media Finance | ||||||||
5.250%, 02/15/2022 | 200 | 173 | ||||||
|
| |||||||
| 5,394 | ||||||||
|
| |||||||
Utilities — 0.3% |
| |||||||
CMS Energy | ||||||||
5.050%, 03/15/2022 | 185 | 198 | ||||||
Constellation Energy Group | ||||||||
5.150%, 12/01/2020 | 70 | 76 | ||||||
Midamerican Energy Holdings | ||||||||
6.125%, 04/01/2036 | 390 | 437 | ||||||
ONEOK | ||||||||
4.250%, 02/01/2022 | 460 | 430 | ||||||
Pacific Gas & Electric | ||||||||
4.500%, 12/15/2041 | 185 | 169 | ||||||
Perusahaan Listrik Negara | ||||||||
5.500%, 11/22/2021 (A) | 440 | 420 | ||||||
Talent Yield Investments | ||||||||
4.500%, 04/25/2022 (A) | 495 | 493 | ||||||
|
| |||||||
| 2,223 | ||||||||
|
| |||||||
Total Corporate Obligations |
| 54,776 | ||||||
|
| |||||||
MORTGAGE-BACKED SECURITIES — 4.9% |
| |||||||
Agency Mortgage-Backed Obligations — 0.5% |
| |||||||
FNMA | ||||||||
3.500%, 07/01/2043 | 3,872 | 3,953 | ||||||
|
| |||||||
| 3,953 | ||||||||
|
| |||||||
Non-Agency Mortgage-Backed Obligations — 4.4% |
| |||||||
Banc of America Commercial Mortgage Trust, Ser 2006-5, Cl A1A | ||||||||
5.415%, 09/10/2047 | 1,241 | 1,362 | ||||||
Banc of America Commercial Mortgage Trust, Ser 2007-5, Cl AM | ||||||||
5.772%, 02/10/2051 (B) | 262 | 280 | ||||||
Citigroup Commercial Mortgage Trust, Ser 2006-C4, Cl A1A | ||||||||
5.939%, 03/15/2049 (B) | 510 | 557 | ||||||
COMM Mortgage Trust, | ||||||||
1.873%, 04/12/2035 (A) | 461 | 444 | ||||||
Commercial Mortgage Trust, | ||||||||
3.187%, 03/13/2035 | 915 | 874 | ||||||
Countrywide Home Loan Mortgage Pass-Through Trust, Ser 2007-HYB2, Cl 3A1 | ||||||||
2.859%, 02/25/2047 (A) (B) | 670 | 525 | ||||||
Credit Suisse Commercial Mortgage Trust, Ser 2006-C3, Cl AJ | ||||||||
5.795%, 06/15/2038 (B) | 330 | 334 | ||||||
| 210 | SEI Institutional Managed Trust / Annual Report / September 30, 2013 |
| Description | Face Amount ($ Thousands) | Market Value ($ Thousands) | ||||||
CW Capital Cobalt, Ser 2007-C3, Cl A4 | ||||||||
5.985%, 05/15/2046 (B) | $ | 566 | $ | 632 | ||||
Deutsche Alt-A Securities Mortgage Loan Trust, Ser 2006-AR4, Cl A2 | ||||||||
0.374%, 12/25/2036 (A) (B) | 842 | 479 | ||||||
Extended Stay America Trust, | ||||||||
0.882%, 12/05/2031 (A) (B) | 425 | 423 | ||||||
Extended Stay America Trust, | ||||||||
2.295%, 12/05/2031 (A) | 560 | 551 | ||||||
First Horizon Alternative Mortgage Securities Trust, Ser 2006-FA3, Cl A9 | ||||||||
6.000%, 07/25/2036 (A) | 555 | 470 | ||||||
Greenwich Capital Commercial Funding, Ser 2007-GG9, Cl A4 | ||||||||
5.444%, 03/10/2039 | 754 | 834 | ||||||
Greenwich Capital Commercial Funding, Ser 2007-GG9, Cl AM | ||||||||
5.475%, 03/10/2039 | 613 | 646 | ||||||
GS Mortgage Securities II, | ||||||||
2.059%, 04/10/2031 (A) | 804 | 797 | ||||||
GS Mortgage Securities II, | ||||||||
2.706%, 12/10/2027 (A) | 882 | 874 | ||||||
GS Mortgage Securities II, | ||||||||
1.003%, 11/08/2029 (A) (B) | 860 | 852 | ||||||
HomeBanc Mortgage Trust, | ||||||||
0.434%, 03/25/2035 (A) (B) | 454 | 371 | ||||||
IndyMac INDX Mortgage Loan Trust, Ser 2006-AR15, Cl A1 | ||||||||
0.299%, 07/25/2036 (A) (B) | 635 | 467 | ||||||
IndyMac INDX Mortgage Loan Trust, Ser 2006-AR27, Cl 2A2 | ||||||||
0.379%, 10/25/2036 (A) (B) | 667 | 549 | ||||||
JPMorgan Chase Commercial Mortgage Securities Trust, | ||||||||
4.838%, 07/15/2041 (A) (B) | 1,266 | 1,293 | ||||||
JPMorgan Chase Commercial Mortgage Securities Trust, | ||||||||
5.901%, 02/12/2049 (B) | 300 | 321 | ||||||
JPMorgan Chase Commercial Mortgage Securities Trust, | ||||||||
5.431%, 06/12/2047 (B) | 1,992 | 2,201 | ||||||
JPMorgan Chase Commercial Mortgage Securities Trust, | ||||||||
5.746%, 02/12/2051 (B) | 1,716 | 1,922 | ||||||
| Description | Face Amount ($ Thousands) | Market Value ($ Thousands) | ||||||
JPMorgan Chase Commercial Mortgage Securities Trust, Ser 2007-LD11, Cl A4 | ||||||||
6.003%, 06/15/2049 (B) | $ | 270 | $ | 303 | ||||
JPMorgan Chase Commercial Mortgage Securities Trust, Ser 2007-LD12, Cl A4 | ||||||||
5.882%, 02/15/2051 (B) | 930 | 1,045 | ||||||
JPMorgan Chase Commercial Mortgage Securities Trust, Ser 2007-LD12, Cl AM | ||||||||
6.000%, 02/15/2051 (B) | 254 | 277 | ||||||
JPMorgan Chase Commercial Mortgage Securities Trust, | ||||||||
5.439%, 01/15/2049 | 1,979 | 2,199 | ||||||
JPMorgan Chase Commercial Mortgage Securities Trust, Ser 2007-LDPX, Cl A3 | ||||||||
5.420%, 01/15/2049 | 925 | 1,022 | ||||||
LB-UBS Commercial Mortgage Trust, Ser 2007-C2, Cl A3 | ||||||||
5.430%, 02/15/2040 | 735 | 808 | ||||||
Merrill Lynch Mortgage Trust, | ||||||||
5.739%, 08/12/2043 (B) | 618 | 683 | ||||||
ML-CFC Commercial Mortgage Trust, Ser 2006-4, Cl A1A | ||||||||
5.166%, 12/12/2049 (B) | 2,315 | 2,535 | ||||||
ML-CFC Commercial Mortgage Trust, Ser 2007-9, Cl A4 | ||||||||
5.700%, 09/12/2049 | 1,220 | 1,365 | ||||||
Morgan Stanley Capital I Trust, Ser 2007-T27, Cl A1A | ||||||||
5.816%, 06/11/2042 (B) | 1,410 | 1,593 | ||||||
Motel 6 Trust, Ser 2012-MTL6, Cl A2 | ||||||||
1.948%, 10/05/2025 (A) | 590 | 579 | ||||||
UBS-Barclays Commercial Mortgage Trust, Ser 2012-C3, Cl A4 | ||||||||
3.091%, 08/10/2049 | 297 | 285 | ||||||
UBS-Barclays Commercial Mortgage Trust, Ser 2012-C4, Cl A5 | ||||||||
2.850%, 12/10/2045 | 596 | 556 | ||||||
Wachovia Bank Commercial Mortgage Trust, Ser 2006-C25, Cl A1A | ||||||||
5.726%, 05/15/2043 (B) | 1,598 | 1,741 | ||||||
WF-RBS Commercial Mortgage Trust, Ser 2013-C14, Cl A5 | ||||||||
3.337%, 06/15/2046 | 856 | 829 | ||||||
|
| |||||||
| 33,878 | ||||||||
|
| |||||||
Total Mortgage-Backed Securities | 37,831 | |||||||
|
| |||||||
ASSET-BACKED SECURITIES — 4.9% |
| |||||||
Automotive — 3.0% | ||||||||
Ally Auto Receivables Trust, Ser 2013-SN1, Cl A3 | ||||||||
0.720%, 05/20/2016 | 1,464 | 1,465 | ||||||
| SEI Institutional Managed Trust / Annual Report / September 30, 2013 | 211 |
CONSOLIDATED SCHEDULE OF INVESTMENTS
Multi-Asset Inflation Managed Fund (Continued)
September 30, 2013
| Description | Face Amount ($ Thousands) | Market Value ($ Thousands) | ||||||
AmeriCredit Automobile Receivables Trust, Ser 2012-3, Cl A3 | ||||||||
0.960%, 01/09/2017 | $ | 665 | $ | 666 | ||||
AmeriCredit Automobile Receivables Trust, Ser 2012-4, Cl A2 | ||||||||
0.490%, 04/08/2016 | 558 | 558 | ||||||
AmeriCredit Automobile Receivables Trust, Ser 2013-1, Cl A2 | ||||||||
0.490%, 06/08/2016 | 610 | 610 | ||||||
AmeriCredit Automobile Receivables Trust, Ser 2013-3, Cl A3 | ||||||||
0.920%, 04/09/2018 | 1,275 | 1,275 | ||||||
AmeriCredit Automobile Receivables Trust, Ser 2013-4, Cl A3 | ||||||||
0.960%, 04/09/2018 | 550 | 551 | ||||||
ARI Fleet Lease Trust, Ser 2013-A, Cl A2 | ||||||||
0.700%, 12/15/2015 (A) | 794 | 793 | ||||||
Avis Budget Rental Car Funding AESOP LLC, Ser 2012-2A, Cl A | ||||||||
2.802%, 05/20/2018 (A) | 1,540 | 1,592 | ||||||
Avis Budget Rental Car Funding AESOP LLC, Ser 2012-3A, Cl A | ||||||||
2.100%, 03/20/2019 (A) | 435 | 434 | ||||||
Avis Budget Rental Car Funding AESOP LLC, Ser 2013-2A, Cl A | ||||||||
2.970%, 02/20/2020 | 594 | 605 | ||||||
Bank of America Auto Trust, | ||||||||
1.030%, 12/15/2016 | 580 | 584 | ||||||
Capital Auto Receivables Asset Trust, Ser 2013-1, Cl A2 | ||||||||
0.620%, 07/20/2016 | 608 | 607 | ||||||
Capital Auto Receivables Asset Trust, Ser 2013-3, Cl A2 | ||||||||
1.040%, 11/21/2016 | 1,115 | 1,117 | ||||||
CFC, Ser 2013-1A, Cl A | ||||||||
1.650%, 07/17/2017 (A) | 603 | 603 | ||||||
Exeter Automobile Receivables Trust, Ser 2012-2A, Cl A | ||||||||
1.300%, 06/15/2017 (A) | 350 | 351 | ||||||
Exeter Automobile Receivables Trust, Ser 2013-1A, Cl A | ||||||||
1.290%, 10/16/2017 (A) | 423 | 422 | ||||||
Fifth Third Auto Trust, Ser 2013-A, Cl A3 | ||||||||
0.610%, 09/15/2017 | 716 | 714 | ||||||
Flagship Credit Auto Trust, | ||||||||
1.320%, 04/16/2018 (A) | 345 | 344 | ||||||
Ford Auto Securitization Trust, Ser 2013-R1A, Cl A2 | ||||||||
1.676%, 09/15/2016 (A) | 551 | 537 | ||||||
Ford Auto Securitization Trust, Ser 2013-R4A, Cl A1 | ||||||||
1.487%, 08/15/2015 | 645 | 627 | ||||||
| Description | Face Amount ($ Thousands) | Market Value ($ Thousands) | ||||||
Ford Credit Auto Owner Trust, Ser 2012-D, Cl B | ||||||||
1.010%, 05/15/2018 | $ | 240 | $ | 237 | ||||
Hertz Vehicle Financing, | ||||||||
1.120%, 08/25/2017 (A) | 2,230 | 2,215 | ||||||
Hyundai Auto Lease Securitization Trust, Ser 2013-A, Cl A3 | ||||||||
0.660%, 06/15/2016 (A) | 880 | 880 | ||||||
Hyundai Auto Receivables Trust, | ||||||||
1.950%, 10/15/2018 | 170 | 172 | ||||||
Mercedes-Benz Auto Lease Trust, | ||||||||
0.590%, 02/15/2016 | 623 | 623 | ||||||
Mercedes-Benz Master Owner Trust, Ser 2012-AA, Cl A | ||||||||
0.790%, 11/15/2017 (A) | 1,278 | 1,272 | ||||||
Navistar Financial Owner Trust, | ||||||||
0.850%, 03/18/2015 (A) | 241 | 241 | ||||||
Santander Drive Auto Receivables Trust, Ser 2012-6, Cl A2 | ||||||||
0.470%, 09/15/2015 | 415 | 415 | ||||||
Santander Drive Auto Receivables Trust, Ser 2013-3, Cl C | ||||||||
1.810%, 04/15/2019 | 920 | 902 | ||||||
Santander Drive Auto Receivables Trust, Ser 2013-4, Cl A3 | ||||||||
1.110%, 01/15/2016 | 1,035 | 1,037 | ||||||
SMART Trust, Ser 2012-4US, Cl A2A | ||||||||
0.670%, 06/14/2015 | 342 | 342 | ||||||
|
| |||||||
| 22,791 | ||||||||
|
| |||||||
Credit Cards — 0.8% |
| |||||||
American Express Credit Account Master Trust, Ser 2012-2, Cl A | ||||||||
0.680%, 03/15/2018 | 1,320 | 1,322 | ||||||
Cabela’s Master Credit Card Trust, | ||||||||
2.710%, 02/17/2026 (A) | 820 | 771 | ||||||
Chase Issuance Trust, | ||||||||
1.300%, 02/18/2020 | 735 | 723 | ||||||
Dryrock Issuance Trust, | ||||||||
0.640%, 08/15/2018 | 870 | 867 | ||||||
GE Capital Credit Card Master Note Trust, Ser 2012-1, Cl A | ||||||||
1.030%, 01/15/2018 | 1,000 | 1,003 | ||||||
GE Capital Credit Card Master Note Trust, Ser 2012-7, Cl A | ||||||||
1.760%, 09/15/2022 | 650 | 625 | ||||||
| 212 | SEI Institutional Managed Trust / Annual Report / September 30, 2013 |
| Description | Face Amount ($ Thousands)/Shares | Market Value ($ Thousands) | ||||||
World Financial Network Credit Card Master Trust, Ser 2012-B, Cl A | ||||||||
1.760%, 05/17/2021 | $ | 380 | $ | 380 | ||||
World Financial Network Credit Card Master Trust, Ser 2013-A, Cl A | ||||||||
1.610%, 12/15/2021 | 385 | 378 | ||||||
|
| |||||||
| 6,069 | ||||||||
|
| |||||||
Other Asset-Backed Securities — 1.1% |
| |||||||
Ally Master Owner Trust, | ||||||||
1.810%, 05/15/2016 | 1,200 | 1,209 | ||||||
BMW Floorplan Master Owner Trust, Ser 2012-1A, Cl A | ||||||||
0.582%, 09/15/2017 (A) (B) | 906 | 906 | ||||||
CIT Equipment Collateral, | ||||||||
1.100%, 08/22/2016 (A) | 270 | 271 | ||||||
CNH Equipment Trust, | ||||||||
0.630%, 01/17/2017 | 741 | 741 | ||||||
Ford Credit Floorplan Master Owner Trust, Ser 2010-3, Cl A2 | ||||||||
1.882%, 02/15/2017 (A) (B) | 1,390 | 1,416 | ||||||
Ford Credit Floorplan Master Owner Trust, Ser 2012-4, Cl A1 | ||||||||
0.740%, 09/15/2016 | 1,485 | 1,486 | ||||||
Ford Credit Floorplan Master Owner Trust, Ser 2013-1, Cl A2 | ||||||||
0.562%, 01/15/2018 (B) | 838 | 838 | ||||||
GE Dealer Floorplan Master Note Trust, Ser 2012-3, Cl A | ||||||||
0.670%, 06/20/2017 (B) | 1,075 | 1,077 | ||||||
GSAA Home Equity Trust, | ||||||||
0.454%, 03/25/2036 (B) | 799 | 517 | ||||||
|
| |||||||
| 8,461 | ||||||||
|
| |||||||
Total Asset-Backed Securities | 37,321 | |||||||
|
| |||||||
EXCHANGE TRADED FUND — 1.0% |
| |||||||
Market Vectors Gold Miners ETF | 293,940 | 7,366 | ||||||
|
| |||||||
Total Exchange Traded Fund | 7,366 | |||||||
|
| |||||||
MUNICIPAL BONDS — 0.7% | ||||||||
County of Broward, Airport System Revenue, Ser Q-1, RB | ||||||||
5.000%, 10/01/2042 | 970 | 976 | ||||||
Metropolitan Transportation Authority, Ser A, RB | ||||||||
5.000%, 11/15/2038 | 1,015 | 1,031 | ||||||
San Antonio, Electric and Gas Authority, RB | ||||||||
5.000%, 02/01/2043 | 960 | 996 | ||||||
| Description | Face Amount (1) ($ Thousands)/Shares | Market Value ($ Thousands) | ||||||
South Carolina State, Public Service Authority, Ser A, RB | ||||||||
5.750%, 12/01/2043 | $ | 960 | $ | 1,042 | ||||
University of Massachusetts, Building Authority, Ser 1, RB | ||||||||
5.000%, 11/01/2039 | 960 | 1,003 | ||||||
|
| |||||||
Total Municipal Bonds | 5,048 | |||||||
|
| |||||||
SOVEREIGN DEBT — 0.1% |
| |||||||
Indonesia Government International Bond MTN | ||||||||
3.375%, 04/15/2023 (A) | 519 | 442 | ||||||
Qatar Government International Bond | ||||||||
4.500%, 01/20/2022 (A) | 355 | 379 | ||||||
|
| |||||||
Total Sovereign Debt | 821 | |||||||
|
| |||||||
PREFERRED STOCK — 0.1% | ||||||||
Financials — 0.1% | ||||||||
Allstate, 5.100% (B) | 5,925 | 138 | ||||||
Morgan Stanley, 7.125% (B) | 30,000 | 756 | ||||||
|
| |||||||
| 894 | ||||||||
|
| |||||||
Total Preferred Stock | 894 | |||||||
|
| |||||||
TIME DEPOSITS — 8.4% |
| |||||||
Brown Brothers Harriman | ||||||||
3.951%, 10/01/2013 | ZAR | 228 | 23 | |||||
1.698%, 10/01/2013 | AUD | 513 | 480 | |||||
0.672%, 10/01/2013 | NOK | 1,390 | 231 | |||||
0.400%, 10/01/2013 | CAD | 66 | 64 | |||||
0.250%, 10/01/2013 | SEK | 80 | 12 | |||||
0.106%, 10/01/2013 | GBP | 369 | 597 | |||||
0.030%, 10/01/2013 | 61,774 | 61,774 | ||||||
0.019%, 10/01/2013 | EUR | 347 | 470 | |||||
0.005%, 10/01/2013 | HKD | 3,053 | 394 | |||||
0.005%, 10/01/2013 | JPY | 39,777 | 405 | |||||
0.005%, 10/01/2013 | SGD | 15 | 12 | |||||
|
| |||||||
Total Time Deposits |
| 64,462 | ||||||
|
| |||||||
U.S. TREASURY OBLIGATIONS — 61.5% |
| |||||||
U.S. Treasury Inflation Protected Securities | ||||||||
2.625%, 07/15/2017 | 35,717 | 40,528 | ||||||
2.500%, 07/15/2016 (D) | 50,732 | 55,980 | ||||||
2.375%, 01/15/2017 | 3,087 | 3,424 | ||||||
2.125%, 01/15/2019 | 7,056 | 8,008 | ||||||
2.000%, 07/15/2014 (D) | 33,088 | 33,923 | ||||||
| SEI Institutional Managed Trust / Annual Report / September 30, 2013 | 213 |
CONSOLIDATED SCHEDULE OF INVESTMENTS
Multi-Asset Inflation Managed Fund (Continued)
September 30, 2013
| Description | Face Amount ($ Thousands) | Market Value ($ Thousands) | ||||||
2.000%, 01/15/2016 (D) | $ | 32,030 | $ | 34,255 | ||||
1.875%, 07/15/2015 (D) | 50,520 | 53,338 | ||||||
1.625%, 01/15/2015 (D) | 3,750 | 3,875 | ||||||
1.625%, 01/15/2018 (D) | 18,231 | 20,036 | ||||||
1.375%, 07/15/2018 | 59,277 | 65,065 | ||||||
0.625%, 07/15/2021 | 3,819 | 3,975 | ||||||
0.500%, 04/15/2015 (D) | 11,566 | 11,816 | ||||||
0.125%, 04/15/2016 (D) (E) | 100,391 | 103,026 | ||||||
0.125%, 04/15/2017 | 15,237 | 15,712 | ||||||
0.125%, 04/15/2018 | 17,467 | 17,994 | ||||||
|
| |||||||
Total U.S. Treasury Obligations | 470,955 | |||||||
|
| |||||||
Total Investments — 115.9% | $ | 888,671 | ||||||
|
| |||||||
A list of the open futures contracts held by the Fund at September 30, 2013, is as follows:
| Type of Contract | Number of Contracts Long (Short) | Expiration Date | Unrealized Appreciation Depreciation ($ Thousands) | |||||||||
Brent Crude | 28 | Nov-2013 | $ | 30 | ||||||||
Cocoa | 112 | Dec-2013 | 116 | |||||||||
Coffee | (109 | ) | Nov-2013 | 295 | ||||||||
Coffee ‘C’ | 52 | Dec-2013 | (201 | ) | ||||||||
Corn | (27 | ) | Dec-2013 | 23 | ||||||||
Crude Oil | 15 | Nov-2013 | (37 | ) | ||||||||
Feeder Cattle | (38 | ) | Jan-2014 | (72 | ) | |||||||
Gasoil | (16 | ) | Dec-2013 | 29 | ||||||||
Gold | (73 | ) | Dec-2013 | 6 | ||||||||
Heating Oil | (26 | ) | Nov-2013 | 102 | ||||||||
Lean Hogs | 44 | Dec-2013 | 5 | |||||||||
Live Cattle | (28 | ) | Dec-2013 | (25 | ) | |||||||
LME Aluminum | (37 | ) | Nov-2013 | (39 | ) | |||||||
LME Copper | 5 | Nov-2013 | 2 | |||||||||
LME Nickel | 9 | Nov-2013 | (46 | ) | ||||||||
Natural Gas | 38 | Nov-2013 | (41 | ) | ||||||||
Platinum | 65 | Jan-2014 | (130 | ) | ||||||||
Soybean | 23 | Nov-2013 | 18 | |||||||||
Soybean Meal | 15 | Dec-2013 | 49 | |||||||||
Soybean Oil | (20 | ) | Dec-2013 | 22 | ||||||||
Sugar No. 11 | (39 | ) | Mar-2014 | (55 | ) | |||||||
U.S. 2-Year Treasury Note | (33 | ) | Dec-2013 | (19 | ) | |||||||
U.S. 5-Year Treasury Note | (202 | ) | Dec-2013 | (315 | ) | |||||||
U.S. 10-Year Treasury Note | (313 | ) | Dec-2013 | (864 | ) | |||||||
U.S. Long Treasury Bond | (43 | ) | Dec-2013 | (128 | ) | |||||||
|
| |||||||||||
| $ | (1,275 | ) | ||||||||||
|
| |||||||||||
For the year ended September 30, 2013, the total amount of all open futures contracts, as presented in the table above, are representative of the volume of activity for the derivative type during the year.
A list of the open forward foreign currency contracts held by the Fund at September 30, 2013, is as follows:
| Settlement Date | Currency to Deliver (Thousands) | Currency to Receive (Thousands) | Unrealized Appreciation (Depreciation) ($ Thousands) | |||||||||||||||||
10/11/13 | AUD | 12,116 | USD | 11,230 | $ | (89 | ) | |||||||||||||
10/2/13-11/4/13 | BRL | 81,006 | USD | 35,554 | (734 | ) | ||||||||||||||
10/11/13-10/17/13 | CAD | 23,433 | USD | 22,621 | (172 | ) | ||||||||||||||
10/11/13 | CNY | 26,422 | USD | 4,286 | (28 | ) | ||||||||||||||
10/11/13-11/8/13 | EUR | 29,256 | USD | 38,824 | (778 | ) | ||||||||||||||
10/11/13-11/8/13 | GBP | 16,271 | USD | 25,540 | (806 | ) | ||||||||||||||
10/11/13 | JPY | 1,725,601 | USD | 17,198 | (390 | ) | ||||||||||||||
10/11/13 | NOK | 26,764 | USD | 4,511 | 63 | |||||||||||||||
10/11/13 | RUB | 204,815 | USD | 6,161 | (151 | ) | ||||||||||||||
10/11/13 | SEK | 5,896 | USD | 898 | (20 | ) | ||||||||||||||
10/11/13 | SGD | 279 | USD | 220 | (2 | ) | ||||||||||||||
10/11/13 | THB | 72,493 | USD | 2,251 | (65 | ) | ||||||||||||||
10/11/13 | USD | 5,910 | AUD | 6,290 | (34 | ) | ||||||||||||||
10/2/13 | USD | 24,247 | BRL | 54,004 | 13 | |||||||||||||||
10/11/13 | USD | 2,438 | CAD | 2,514 | 8 | |||||||||||||||
10/11/13 | USD | 18,613 | CNY | 114,752 | 123 | |||||||||||||||
10/11/13 | USD | 177 | GBP | 112 | 4 | |||||||||||||||
|
| |||||||||||||||||||
| $ | (3,058 | ) | ||||||||||||||||||
|
| |||||||||||||||||||
A list of the counterparties for the open forward foreign currency contracts held by the Fund at September 30, 2013, is as follows:
| Counterparty | Currency to Deliver ($ Thousands) | Currency to Receive ($ Thousands) | Unrealized Appreciation (Depreciation) ($ Thousands) | |||||||||
Barclays | $ | (1,238 | ) | $ | 1,224 | $ | (14 | ) | ||||
Brown Brothers Harriman | (46,687 | ) | 45,907 | (780 | ) | |||||||
Citigroup | (22,927 | ) | 23,022 | 95 | ||||||||
Credit Suisse First Boston | (918 | ) | 898 | (20 | ) | |||||||
Deutsche Bank | (614 | ) | 601 | (13 | ) | |||||||
Goldman Sachs | (470 | ) | 461 | (9 | ) | |||||||
JPMorgan Chase Bank | (2,437 | ) | 2,445 | 8 | ||||||||
Royal Bank of Canada | (21,552 | ) | 21,396 | (156 | ) | |||||||
Royal Bank of Scotland | (91,513 | ) | 90,142 | (1,371 | ) | |||||||
Standard Chartered Bank | (24,461 | ) | 23,745 | (716 | ) | |||||||
UBS | (11,035 | ) | 10,953 | (82 | ) | |||||||
|
| |||||||||||
| $ | (3,058 | ) | ||||||||||
|
| |||||||||||
For the year ended September 30, 2013, the total amount of all open forward foreign currency contracts, as presented in the table above, are representative of the volume of activity for the derivative type during the year.
A list of open OTC swap agreements held by the Fund at September 30, 2013, are as follows:
| Credit Default Swaps | ||||||||||||||||||||
| Counterparty | Reference Entity/Obligation | Buy/Sell Protection | (Pays)/ Receives Rate | Termination Date | Notional Amount ($ Thousands) | Net Unrealized Appreciation (Depreciation) ($ Thousands) | ||||||||||||||
| Bank of America | CDX.NA.IG.19 V1-5Y Index | SELL | 1.00 | % | 12/20/17 | $ | (3,760 | ) | $ | 50 | ||||||||||
| Bank of America | SOCIETE GENERALE | SELL | 3.00 | % | 12/20/17 | (550 | ) | 27 | ||||||||||||
| Deutsche Bank | ANADARKO PETROLEUM Corp. | SELL | 1.00 | % | 09/20/17 | (500 | ) | 22 | ||||||||||||
|
| |||||||||||||||||||
| $ | 99 | |||||||||||||||||||
|
| |||||||||||||||||||
| 214 | SEI Institutional Managed Trust / Annual Report / September 30, 2013 |
| Interest Rate Swaps | ||||||||||||||
| Counterparty | Fund Pays | Fund Receives | Termination Date | Notional Amount ($ Thousands) | Net Unrealized Appreciation (Depreciation) ($ Thousands) | |||||||||
| JPMorgan Chase Bank | 2.83% | 3-Month US LIBOR | 04/12/42 | $ | 2,790 | $ | 394 | |||||||
|
| |||||||||||||
| $ | 394 | |||||||||||||
|
| |||||||||||||
| Total Return Swaps | ||||||||||||||||||
| Counterparty | Reference Entity/Obligation | Fund Pays | Fund Receives | Termination Date | Notional Amount ($ Thousands) | Net Unrealized Appreciation Depreciation ($ Thousands) | ||||||||||||
| Deutsche Bank | DJ-UBS COMMODITY EX-PRECIOUS METALS INDEX | 0.11% | Index Return | 12/16/13 | $ | (7,340 | ) | $ | (119 | ) | ||||||||
| Deutsche Bank | DJ-UBS COMMODITY INDEX 2-MONTH FORWARD | 0.14% | Index Return | 12/16/13 | (64,834 | ) | (650 | ) | ||||||||||
| Credit Suisse | DJ-UBS COMMODITY INDEX 2-MONTH FORWARD | 0.14% | Index Return | 12/16/13 | (76,143 | ) | (763 | ) | ||||||||||
| Deutsche Bank | DJ-UBS COMMODITY INDEX 2-MONTH FORWARD | 0.14% | Index Return | 12/16/13 | (4,334 | ) | (85 | ) | ||||||||||
| Deutsche Bank | DJ-UBS COMMODITY INDEX EX INDUSTRIAL METALS | 0.12% | Index Return | 12/16/13 | (7,373 | ) | (161 | ) | ||||||||||
| UBS Warburg | S&P 500 TOTAL RETURN INDEX | Index Return | 1-Month USD LIBOR Plus 45 Bps | 03/17/14 | 104,452 | 953 | ||||||||||||
| UBS Warburg | S&P 500 TOTAL RETURN INDEX | Index Return | 1-Month USD LIBOR Plus 30 Bps | 04/15/14 | 7,405 | 67 | ||||||||||||
| UBS Warburg | S&P 500 TOTAL RETURN INDEX | Index Return | 1-Month USD LIBOR Plus 30 Bps | 04/15/14 | 1,543 | 14 | ||||||||||||
| Goldman Sachs | S&P 500 TOTAL RETURN INDEX | Index Return | 1-Month USD LIBOR Plus 36 Bps | 09/15/14 | 2,166 | 19 | ||||||||||||
| Deutsche Bank | S&P 500 TOTAL RETURN INDEX | Index Return | 1-Month USD LIBOR Plus 30 Bps | 09/15/14 | 2,067 | 19 | ||||||||||||
|
| |||||||||||||||||
| $ | (706 | ) | ||||||||||||||||
|
| |||||||||||||||||
A list of open centrally cleared swap agreements held by the Fund at September 30, 2013, are as follows:
| Interest Rate Swaps | ||||||||||||||
| Broker | Fund Pays | Fund Receives | Termination Date | Notional Amount (Thousands) | Net Unrealized Appreciation (Depreciation) ($ Thousands) | |||||||||
| Morgan Stanley | 1.57% | 6M EURIBOR | 05/21/23 | 4,650 | $ | 236 | ||||||||
| Morgan Stanley | 3M US LIBOR | 2.02% | 05/21/23 | 5,330 | (289 | ) | ||||||||
|
| |||||||||||||
| $ | (53 | ) | ||||||||||||
|
| |||||||||||||
For the year ended September 30, 2013, the total amount of all open OTC and centrally cleared swap agreements, as presented in the tables above, are representative of the volume of activity for this derivative type during the year.
Percentages are based on Net Assets of $766,368 ($ Thousands).
| (1) | In U.S. Dollar unless otherwise indicated. |
| (A) | Variable Rate Security — The rate reported on the Schedule of Investments is the rate in effect as of September 30, 2013. |
| (B) | Securities sold within terms of a private placement memorandum, exempt from registration under Section 144A of the Securities Act of 1933, as amended, and may not be sold to dealers in that program or other “accredited investors.” These securities have been determined to be liquid under guidelines established by the Board of Trustees. |
| (C) | Step Bonds — The rate reflected on the Schedule of Investments is the effective yield on September 30, 2013. The coupon on a step bond changes on a specified date. |
| (D) | Security, or a portion thereof, has been pledged as collateral on open reverse repurchase agreements. |
| (E) | Security, or portion thereof, has been pledged as collateral on options. |
| † | Real Estate Investment Trust. |
| * | Non-income producing security. |
ADR — American Depositary Receipt
AUD — Australian Dollar
BRL — Brazilian Real
CAD — Canadian Dollar
Cl — Class
CNY — Chinese Yuan
DJ — Dow Jones
ETF — Exchange Traded Fund
EUR — Euro
EURIBOR — Euro Interbank Offered Rate
FNMA — Fannie Mae
GBP — British Pound
HKD — Hong Kong Dollar
JPY — Japanese Yen
LIBOR — London Interbank Offered Rate
LLC — Limited Liability Company
LME — London Metal Exchange
Ltd. — Limited
MTN — Medium Term Note
NOK — Norwegian Krone
OTC — Over The Counter
RB — Revenue Bond
RUB — Russian Ruble
S&P — Standard & Poor’s
Ser — Series
SEK — Sweden Krona
SGD — Singapore Dollar
THB — Thailand Baht
USD — United States Dollar
ZAR — South African Rand
The following is a list of the level of inputs used as of September 30, 2013, in valuing the Fund’s investments carried at value ($ Thousands):
| Investments in Securities | Level 1 | Level 2 | Level 3 | Total | ||||||||||||
Foreign Common Stock | $ | 105,447 | $ | — | $ | — | $ | 105,447 | ||||||||
Common Stock | 103,750 | — | — | 103,750 | ||||||||||||
Corporate Obligations | — | 54,776 | — | 54,776 | ||||||||||||
Mortgage-Backed Securities | — | 37,831 | — | 37,831 | ||||||||||||
Asset-Backed Securities | — | 37,321 | — | 37,321 | ||||||||||||
Preferred Stock | — | 894 | — | 894 | ||||||||||||
Sovereign Debt | — | 821 | — | 821 | ||||||||||||
Exchange Traded Fund | 7,366 | — | — | 7,366 | ||||||||||||
Municipal Bonds | — | 5,048 | — | 5,048 | ||||||||||||
Time Deposits | — | 64,462 | — | 64,462 | ||||||||||||
U.S. Treasury Obligations | — | 470,955 | — | 470,955 | ||||||||||||
|
|
|
|
|
|
|
| |||||||||
Total Investments in Securities | $ | 216,563 | $ | 672,108 | $ | — | $ | 888,671 | ||||||||
|
|
|
|
|
|
|
| |||||||||
| SEI Institutional Managed Trust / Annual Report / September 30, 2013 | 215 |
CONSOLIDATED SCHEDULE OF INVESTMENTS
Multi-Asset Inflation Managed Fund (Concluded)
September 30, 2013
| Other Financial Instruments | Level 1 | Level 2 | Level 3 | Total | ||||||||||||
Futures Contracts* | ||||||||||||||||
Unrealized Appreciation | $ | 697 | $ | — | $ | — | $ | 697 | ||||||||
Unrealized Depreciation | (1,972 | ) | — | — | (1,972 | ) | ||||||||||
Reverse Repurchase Agreements** | (123,804 | ) | — | — | (123,804 | ) | ||||||||||
Forwards* | ||||||||||||||||
Unrealized Appreciation | — | 103 | — | 103 | ||||||||||||
Unrealized Depreciation | — | (3,161 | ) | — | (3,161 | ) | ||||||||||
OTC Swaps | ||||||||||||||||
Credit Default Swaps* | ||||||||||||||||
Unrealized Appreciation | — | 99 | — | 99 | ||||||||||||
Total Return Swaps* | ||||||||||||||||
Unrealized Appreciation | — | 1,072 | — | 1,072 | ||||||||||||
Unrealized Depreciation | — | (1,778 | ) | — | (1,778 | ) | ||||||||||
Interest Rate Swaps* | ||||||||||||||||
Unrealized Appreciation | — | 394 | — | 394 | ||||||||||||
Centrally Cleared Swaps | ||||||||||||||||
Interest Rate Swaps* | ||||||||||||||||
Unrealized Appreciation | — | 236 | — | 236 | ||||||||||||
Unrealized Depreciation | — | (289 | ) | — | (289 | ) | ||||||||||
|
|
|
|
|
|
|
| |||||||||
Total Other Financial Instruments | $ | (125,079 | ) | $ | (3,324 | ) | $ | — | $ | (128,403 | ) | |||||
|
|
|
|
|
|
|
| |||||||||
| * | Futures contracts, forwards contracts and swaps are valued at the unrealized appreciation (depreciation) on the instrument. |
| ** | See Note 2 for more information on the reverse repurchase agreements. |
For the year ended September 30, 2013, there were transfers between Level 1 and Level 2 assets and liabilities. The primary reason for changes in the classifications between Level 1 and Level 2 occurs when foreign equity securities are fair valued using other observable market-based inputs in place of the closing exchange price due to events occurring after the close of the exchange or market on which the investment is principally traded (See Note 2).
For the year ended September 30, 2013, there have been no transfers between Level 2
and Level 3 assets and liabilities.
For more information on valuation inputs, see Note 2 — Significant Accounting Policies in
Notes to Financial Statements.
Amounts designated as “—” are $0 or have been rounded to $0.
The accompanying notes are an integral part of the financial statements.
| 216 | SEI Institutional Managed Trust / Annual Report / September 30, 2013 |
SCHEDULE OF INVESTMENTS
Multi-Asset Capital Stability Fund
September 30, 2013
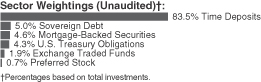
| Description | Face Amount (1) ($ Thousands) | Market Value ($ Thousands) | ||||||
SOVEREIGN DEBT — 5.1% |
| |||||||
Bundesobligation | ||||||||
0.250%, 04/13/2018 | EUR | 3,235 | $ | 4,296 | ||||
Bundesrepublik Deutschland | ||||||||
3.250%, 07/04/2042 | EUR | 660 | 1,014 | |||||
Canadian Government Bond | ||||||||
4.000%, 06/01/2041 | CAD | 995 | 1,133 | |||||
1.250%, 03/01/2018 | CAD | 4,670 | 4,439 | |||||
Japan Government Five Year Bond | ||||||||
0.400%, 03/20/2018 | JPY | 831,650 | 8,547 | |||||
United Kingdom Gilt | ||||||||
4.500%, 12/07/2042 | GBP | 605 | 1,164 | |||||
1.250%, 07/22/2018 | GBP | 2,660 | 4,251 | |||||
|
| |||||||
Total Sovereign Debt | 24,844 | |||||||
|
| |||||||
MORTGAGE-BACKED SECURITIES — 4.7% |
| |||||||
Agency Mortgage-Backed Obligations — 4.7% |
| |||||||
FHLMC | ||||||||
2.500%, 05/27/2016 | 6,024 | 6,313 | ||||||
FNMA | ||||||||
5.250%, 09/15/2016 | 5,508 | 6,235 | ||||||
FNMA TBA | ||||||||
3.500%, 10/01/2040 | 6,464 | 6,580 | ||||||
3.000%, 10/15/2042 | 3,875 | 3,786 | ||||||
|
| |||||||
Total Mortgage-Backed Securities | 22,914 | |||||||
|
| |||||||
U.S. TREASURY OBLIGATIONS — 4.4% |
| |||||||
U.S. Treasury Bonds | ||||||||
3.625%, 08/15/2043 | 1,785 | 1,764 | ||||||
U.S. Treasury Inflation Protected Securities | ||||||||
3.875%, 04/15/2029 | 274 | 393 | ||||||
3.625%, 04/15/2028 | 228 | 316 | ||||||
3.375%, 04/15/2032 | 78 | 109 | ||||||
2.625%, 07/15/2017 | 261 | 297 | ||||||
2.500%, 07/15/2016 to 01/15/2029 | 478 | 555 | ||||||
2.375%, 01/15/2017 to 01/15/2027 | 872 | 1,022 | ||||||
2.125%, 01/15/2019 to 02/15/2041 | 517 | 602 | ||||||
2.000%, 01/15/2016 | 633 | 701 | ||||||
1.875%, 07/15/2015 to 07/15/2019 | 499 | 544 | ||||||
| Description | Face Amount (1) ($ Thousands)/Shares | Market Value ($ Thousands) | ||||||
1.750%, 01/15/2028 | $ | 249 | $ | 279 | ||||
1.625%, 01/15/2015 to 01/15/2018 | 636 | 675 | ||||||
1.375%, 07/15/2018 to 01/15/2020 | 519 | 569 | ||||||
1.250%, 07/15/2020 | 458 | 501 | ||||||
1.125%, 01/15/2021 | 519 | 559 | ||||||
0.750%, 02/15/2042 | 278 | 238 | ||||||
0.625%, 07/15/2021 to 02/15/2043 | 747 | 733 | ||||||
0.500%, 04/15/2015 | 299 | 305 | ||||||
0.375%, 07/15/2023 | 396 | 394 | ||||||
0.125%, 04/15/2016 to 01/15/2023 | 3,651 | 3,666 | ||||||
U.S. Treasury Notes | ||||||||
1.000%, 05/31/2018 | 7,125 | 7,034 | ||||||
|
| |||||||
Total U.S. Treasury Obligations | 21,256 | |||||||
|
| |||||||
EXCHANGE TRADED FUNDS — 2.0% |
| |||||||
Hong Kong — 0.4% |
| |||||||
iShares FTSE A50 China Index ETF | 1,572,200 | 1,989 | ||||||
|
| |||||||
United States — 1.6% | ||||||||
Invesco Municipal Opportunity Trust | 147,730 | 1,740 | ||||||
iShares National AMT-Free Muni Bond ETF | 26,673 | 2,787 | ||||||
Market Vectors High Yield Municipal Index ETF | 92,981 | 2,718 | ||||||
WisdomTree Japan Hedged Equity Fund | 7,797 | 374 | ||||||
|
| |||||||
| 7,619 | ||||||||
|
| |||||||
Total Exchange Traded Funds (Cost $9,816) ($ Thousands) | 9,608 | |||||||
|
| |||||||
PREFERRED STOCK — 0.7% |
| |||||||
Hersha Hospitality Trust, 6.875%‡ | 49,075 | 1,135 | ||||||
Pebblebrook Hotel Trust, 6.500%‡ | 54,050 | 1,154 | ||||||
Sabra Health Care, 7.125%‡ | 43,875 | 1,042 | ||||||
|
| |||||||
Total Preferred Stock | 3,331 | |||||||
|
| |||||||
TIME DEPOSITS — 85.0% |
| |||||||
Brown Brothers Harriman | ||||||||
0.030%, 10/01/2013 | 411,371 | 411,371 | ||||||
0.019%, 10/01/2013 | EUR | — | — | |||||
0.005%, 10/01/2013 | JPY | 1,663 | 2,694 | |||||
|
| |||||||
Total Time Deposits (Cost $414,065) ($ Thousands) | 414,065 | |||||||
|
| |||||||
Total Investments — 101.9% (Cost $496,477) ($ Thousands) | $ | 496,018 | ||||||
|
| |||||||
| SEI Institutional Managed Trust / Annual Report / September 30, 2013 | 217 |
SCHEDULE OF INVESTMENTS
Multi-Asset Capital Stability Fund (Continued)
September 30, 2013
| Description | Contracts | Market Value ($ Thousands) | ||||||
PURCHASED OPTIONS*† — 0.1% |
| |||||||
October 2013, EUR/MXN Currency Put, Expires 10/04/2013, | 9,025,000 | $ | — | |||||
December 2013, Technology Select Sector Index, | 424 | 19 | ||||||
July 2014, BRL Currency Call, | 23,522,000 | 383 | ||||||
January 2014, Industrial Select Sector Index, Expires 01/18/2014, | 595 | 20 | ||||||
January 2014, SPDR S&P 500 Index, Expires 01/18/2014, | 182 | 50 | ||||||
|
| |||||||
Total Purchased Options |
| 472 | ||||||
|
| |||||||
WRITTEN OPTIONS — (0.1)% |
| |||||||
October 2013, EUR/MXN Currency Put, | (9,025,000 | ) | — | |||||
October 2013, EUR/MXN Currency Call, Expires 10/04/2013, | (9,025,000 | ) | (18 | ) | ||||
December 2013, Technology Select Sector Index, Expires 12/21/2013, | (424 | ) | (1 | ) | ||||
January 2014, SPDR S&P 500 Index, | (182 | ) | (11 | ) | ||||
July 2014, BRL Currency Put, | (23,522,000 | ) | (575 | ) | ||||
|
| |||||||
Total Written Options |
| $ | (605 | ) | ||||
|
| |||||||
A list of the open futures contracts held by the Fund at September 30, 2013, is as follows:
| Type of Contract | Number of Contracts Long | Expiration Date | Unrealized Appreciation (Depreciation) ($ Thousands) | |||||||||
DJ Euro Stoxx 50 Index | 51 | Dec-2013 | $ | 2 | ||||||||
Euro-Bobl | 14 | Dec-2013 | 13 | |||||||||
Euro-Buxl 30 Year Bond | 2 | Dec-2013 | 7 | |||||||||
Mini Japan 10-YR Bond | 21 | Dec-2013 | 13 | |||||||||
MSCI EAFE Index E-MINI | 233 | Dec-2013 | 93 | |||||||||
S&P 500 Index EMINI | 306 | Dec-2013 | (135 | ) | ||||||||
S&P TSE 60 Index | 16 | Dec-2013 | 3 | |||||||||
Topix Index | 11 | Dec-2013 | 41 | |||||||||
U.S. 5-Year Treasury Note | 182 | Dec-2013 | 222 | |||||||||
U.S. Ultra Long Treasury Bond | 40 | Dec-2013 | 138 | |||||||||
|
| |||||||||||
| $ | 397 | |||||||||||
|
| |||||||||||
For the year ended September 30, 2013, the total amount of all open futures contracts, as presented in the table above, are representative of the volume of activity for the derivative type during the year.
A list of the open forward foreign currency contracts held by the Fund at September 30, 2013, is as follows:
| Settlement Date | Currency to Deliver (Thousands) | Currency to Receive (Thousands) | Unrealized Appreciation (Depreciation) ($ Thousands) | |||||||||||||||||
10/11/13-12/17/13 | JPY | 850,505 | USD | 8,533 | $ | (136 | ) | |||||||||||||
10/17/13 | CAD | 9,151 | USD | 8,710 | (190 | ) | ||||||||||||||
10/17/13-12/17/13 | USD | 5,558 | CAD | 5,760 | 41 | |||||||||||||||
11/4/13-7/14/14 | USD | 12,320 | BRL | 30,060 | 677 | |||||||||||||||
11/8/13-12/17/13 | EUR | 5,314 | USD | 7,085 | (108 | ) | ||||||||||||||
11/8/13 | GBP | 3,333 | USD | 5,298 | (98 | ) | ||||||||||||||
12/17/13 | USD | 319 | CLP | 163,696 | 3 | |||||||||||||||
12/17/13 | USD | 120 | JPY | 11,860 | 1 | |||||||||||||||
12/17/13 | USD | 879 | MXN | 11,575 | (5 | ) | ||||||||||||||
12/17/13 | USD | 294 | SGD | 373 | 3 | |||||||||||||||
12/17/13 | USD | 539 | TRY | 1,107 | — | |||||||||||||||
12/17/13 | USD | 303 | ZAR | 3,068 | (1 | ) | ||||||||||||||
|
| |||||||||||||||||||
| $ | 187 | |||||||||||||||||||
|
| |||||||||||||||||||
A list of the counterparties for the open forward foreign currency contracts held by the Fund at September 30, 2013, is as follows:
| Counterparty | Currency to Deliver ($ Thousands) | Currency to Receive ($ Thousands) | Unrealized Appreciation (Depreciation) ($ Thousands) | |||||||||
Barclays | $ | (4,126 | ) | $ | 4,147 | $ | 21 | |||||
Brown Brothers Harriman | (4,081 | ) | 4,048 | (33 | ) | |||||||
Citigroup | (12,296 | ) | 12,938 | 642 | ||||||||
Deutsche Bank | (8,480 | ) | 8,347 | (133 | ) | |||||||
Goldman Sachs | (14,226 | ) | 13,939 | (287 | ) | |||||||
Royal Bank of Canada | (843 | ) | 849 | 6 | ||||||||
Royal Bank of Scotland | (5,585 | ) | 5,517 | (68 | ) | |||||||
Standard Chartered Bank | (853 | ) | 891 | 39 | ||||||||
|
| |||||||||||
| $ | 187 | |||||||||||
|
| |||||||||||
For the year ended September 30, 2013, the total amount of all open forward foreign currency contracts, as presented in the table above, are representative of the volume of activity for the derivative type during the year.
| 218 | SEI Institutional Managed Trust / Annual Report / September 30, 2013 |
A list of open OTC swap agreements held by the Fund at September 30, 2013, is as follows:
| Credit Default Swaps | ||||||||||||||||||||||||
| Counterparty | Reference Entity/Obligation | Buy/Sell Protection | (Pays)/ Receives Rate | Termination Date | Currency | Notional Amount (Thousands) (1) | Net Unrealized Appreciation (Depreciation) ($ Thousands) | |||||||||||||||||
| Bank of America | CDX.EM.19.V1-5Y Index | SELL | 5.00 | 06/20/18 | (1,120 | ) | $ | (7 | ) | |||||||||||||||
| Bank of America | CDX.EM.19.V1-5Y Index | SELL | 5.00 | 06/20/18 | (80 | ) | — | |||||||||||||||||
| Bank of America | CDX.EM.20.V1-5Y Index | SELL | 5.00 | 12/20/18 | (3,360 | ) | (30 | ) | ||||||||||||||||
| Bank of America | CDX.NA.IG.20.V1-5Y Index | SELL | 1.00 | 06/20/18 | (490 | ) | (1 | ) | ||||||||||||||||
| Bank of America | CDX.NA.IG.20.V1-5Y Index | SELL | 1.00 | 06/20/18 | (820 | ) | 2 | |||||||||||||||||
| Bank of America | CMBX.NA.BBB.6.V1 Index | SELL | 3.00 | 05/11/63 | (2,330 | ) | 2 | |||||||||||||||||
| Citibank | CDX.EM.19.V1-5Y Index | SELL | 5.00 | 06/20/18 | (4,690 | ) | (13 | ) | ||||||||||||||||
| Citibank | CDX.EM.19.V1-5Y Index | SELL | 5.00 | 06/20/18 | (470 | ) | 4 | |||||||||||||||||
| Citibank | CDX.NA.HY.20.V1-5Y Index | SELL | 5.00 | 06/20/18 | (2,130 | ) | 18 | |||||||||||||||||
| Citibank | CDX.NA.HY.20.V1-5Y Index | SELL | 5.00 | 06/20/18 | (170 | ) | 1 | |||||||||||||||||
| Citibank | CDX.NA.IG.20.V1-5Y Index | SELL | 1.00 | 06/20/18 | (3,380 | ) | 4 | |||||||||||||||||
| Citibank | iTRAXX-EUROPE 19.V1-5Y | SELL | 1.00 | 06/20/18 | EUR | (200 | ) | — | ||||||||||||||||
| Citibank | iTRAXX-EUROPE 19.V1-5Y Index | SELL | 1.00 | 06/20/18 | EUR | (100 | ) | 1 | ||||||||||||||||
| Citigroup | iTRAXX-EUROPE Crossover 19.V1-5Y | SELL | 5.00 | 06/20/18 | EUR | (200 | ) | 1 | ||||||||||||||||
| Deutsche Bank | CDX.NA.HY.20.V1-5Y Index | SELL | 5.00 | 06/20/18 | (310 | ) | 7 | |||||||||||||||||
| Deutsche Bank | iTRAXX-EUROPE Crossover 19.V1-5Y | SELL | 5.00 | 06/20/18 | EUR | (210 | ) | 6 | ||||||||||||||||
| Deutsche Bank | iTRAXX-EUROPE Crossover 19.V1-5Y | SELL | 5.00 | 06/20/18 | EUR | (400 | ) | 5 | ||||||||||||||||
| Deutsche Bank | iTRAXX-EUROPE 19.V1-5Y | SELL | 1.00 | 06/20/18 | EUR | (640 | ) | — | ||||||||||||||||
| Goldman Sachs | CDX.NA.IG.20.V1-5Y Index | SELL | 1.00 | 06/20/18 | (460 | ) | 2 | |||||||||||||||||
| JPMorgan Chase Bank | iTRAXX-EUROPE 19.V1-5Y | SELL | 1.00 | 06/20/18 | EUR | (400 | ) | 3 | ||||||||||||||||
| Morgan Stanley | CDX.NA.IG.20.V1-5Y Index | SELL | 1.00 | 06/20/18 | (1,100 | ) | 3 | |||||||||||||||||
| Morgan Stanley | PEOPLE’S REPUBLIC OF CHINA | SELL | 1.00 | 09/20/18 | (24,120 | ) | (51 | ) | ||||||||||||||||
| Morgan Stanley | REPUBLIC OF KOREA | BUY | 1.00 | 09/20/18 | 24,120 | (26 | ) | |||||||||||||||||
| Morgan Stanley Capital Services | CDX.NA.IG.20.V1-5Y Index | SELL | 1.00 | 06/20/18 | (740 | ) | — | |||||||||||||||||
|
| |||||||||||||||||||||||
| $ | (69 | ) | ||||||||||||||||||||||
|
| |||||||||||||||||||||||
| Interest Rate Swaps | ||||||||||||||||||
| Counterparty | Fund Pays | Fund Receives | Termination Date | Notional Amount (Thousands) (1) | Net Unrealized Appreciation (Depreciation) ($ Thousands) | |||||||||||||
| Citibank | 3 Month CANADIAN DOLLAR OFFERING RATE | 2.20% | 08/08/18 | CAD | 1,360 | $ | 4 | |||||||||||
| Morgan Stanley | BRAZIL INTERBANK DEPOSIT RATE | 9.69% | 01/02/15 | BRL | 36,468 | (106 | ) | |||||||||||
| Citibank | BRAZIL INTERBANK DEPOSIT RATE | 9.56% | 01/02/15 | BRL | 8,796 | (31 | ) | |||||||||||
| Morgan Stanley | BRAZIL INTERBANK DEPOSIT RATE | 10.02% | 01/02/15 | BRL | 5,255 | (7 | ) | |||||||||||
| Morgan Stanley | BRAZIL INTERBANK DEPOSIT RATE | 10.33% | 01/02/15 | BRL | 874 | — | ||||||||||||
| Morgan Stanley | BRAZIL INTERBANK DEPOSIT RATE | 10.34% | 01/02/15 | BRL | 873 | — | ||||||||||||
| Citibank | JIBAR 3 Month RATE | 5.57% | 05/07/14 | ZAR | 938,810 | (53 | ) | |||||||||||
| Goldman Sachs | 9.94% | BRAZIL INTERBANK DEPOSIT RATE | 07/01/14 | BRL | 27,796 | (3 | ) | |||||||||||
| JPMorgan Chase Bank | 6 Month GBP LIBOR | 1.54% | 08/08/18 | GBP | 820 | (8 | ) | |||||||||||
| Morgan Stanley | TIIE INDEX 28 DAY LUNAR RATE | 4.33% | 08/06/14 | MXN | 138,145 | 39 | ||||||||||||
|
| |||||||||||||||||
| $ | (165 | ) | ||||||||||||||||
|
| |||||||||||||||||
A list of open Centrally cleared swap agreements held by the Fund at September 30, 2013, is as follows:
| Credit Default Swaps | ||||||||||||||||||||||||
| Broker | Reference Entity/Obligation | Buy/Sell Protection | (Pays)/ Receives Rate | Termination Date | Currency | Notional Amount (Thousands) (1) | Net Unrealized Appreciation (Depreciation) ($Thousands) | |||||||||||||||||
| Morgan Stanley | CDX.NA.HY.20.V1-5Y Index | SELL | 5.00 | 06/20/18 | (1,520 | ) | $ | (5 | ) | |||||||||||||||
| Morgan Stanley | CDX.NA.IG.21.V1-5Y Index | SELL | 1.00 | 12/20/18 | (2,440 | ) | (3 | ) | ||||||||||||||||
| Morgan Stanley | iTRAXX-EUROPE Crossover 20.V1-5Y | SELL | 5.00 | 12/20/18 | EUR | (250 | ) | (3 | ) | |||||||||||||||
| Morgan Stanley | iTRAXX-EUROPE 20.V1-5Y | SELL | 1.00 | 12/20/18 | EUR | (400 | ) | (2 | ) | |||||||||||||||
|
| |||||||||||||||||||||||
| $ | (13 | ) | ||||||||||||||||||||||
|
| |||||||||||||||||||||||
| SEI Institutional Managed Trust / Annual Report / September 30, 2013 | 219 |
SCHEDULE OF INVESTMENTS
Multi-Asset Capital Stability Fund (Concluded)
September 30, 2013
| Interest Rate Swaps | ||||||||||||||||||
| Broker | Fund Pays | Fund Receives | Termination Date | Notional Amount Thousands | Net Unrealized Appreciation (Depreciation) ($Thousands) | |||||||||||||
| Morgan Stanley | 3 Month CANADIAN DOLLAR OFFERING RATE | 3.59% | 09/25/43 | CAD | 220 | $ | 2 | |||||||||||
| Morgan Stanley | 6 Month GBP LIBOR | 3.37% | 09/25/43 | GBP | 150 | 2 | ||||||||||||
| Morgan Stanley | 6 Month GBP LIBOR | 3.39% | 09/09/43 | GBP | 180 | 5 | ||||||||||||
| Morgan Stanley | 3 Month CANADIAN DOLLAR OFFERING RATE | 3.69% | 09/06/43 | CAD | 350 | 10 | ||||||||||||
| Morgan Stanley | 3 Month USD LIBOR | 3.00% | 09/19/23 | 7,370 | 164 | |||||||||||||
| Morgan Stanley | 3 Month CANADIAN DOLLAR OFFERING RATE | 2.28% | 09/25/18 | CAD | 1,120 | 2 | ||||||||||||
| Morgan Stanley | 6 Month GBP LIBOR | 1.73% | 09/25/18 | GBP | 640 | — | ||||||||||||
| Morgan Stanley | 1.78% | 3 Month USD LIBOR | 09/19/18 | 24,240 | (311 | ) | ||||||||||||
| Morgan Stanley | 3 Month USD LIBOR | 0.53% | 09/19/15 | 26,000 | 43 | |||||||||||||
|
| |||||||||||||||||
| $ | (83 | ) | ||||||||||||||||
|
| |||||||||||||||||
For the year ended September 30, 2013, the total amount of all open swap agreements, as presented in the tables above, are representative of the volume of activity for this derivative type during the year.
Percentages are based on Net Assets of $486,926 ($ Thousands).
| (1) | In U.S. Dollar unless otherwise indicated. |
| * | Non-income producing security. |
| ‡ | Real Estate Investment Trust. |
| † | For the year ended September 30, 2013, the total amount of all open purchased and written options, as presented in the Schedule of Investments, are representative of the volume of activity for these derivate types during the year. |
BRL — Brazilian Real
CAD — Canadian Dollar
CLP — Chilean Peso
EAFE — Europe, Australasia and Far East
ETF — Exchange Traded Fund
EUR — Euro
DJ — Dow Jones
FHLMC — Federal Home Loan Mortgage Corporation
FNMA — Federal National Mortgage Association
GBP — British Pound
FTSE — Financial Times and the London Stock Exchange
JIBAR — Johannesburg Interbank Agreed Rate
JPY — Japanese Yen
LIBOR — London Interbank Offered Rate
MSCI — Morgan Stanley Capital International
MXN — Mexican Peso
OTC — Over The Counter
PLC — Public Limited Company
S&P — Standard & Poor’s
SPDR — Standard & Poor’s Depositary Receipt
SGD — Singapore Dollar
TBA — To Be Announced
TIIE — Equilibrium Interbank Interest Rate
TRY — Turkish Lira
TSE — Tokyo Stock Exchange
USD — U.S. Dollar
ZAR — South African Rand
The following is a list of the level of inputs used as of September 30, 2013, in valuing the Fund’s investments carried at value ($ Thousands):
| Investments in Securities | Level 1 | Level 2 | Level 3 | Total | ||||||||||||
Time Deposits | $ | — | $ | 414,065 | $ | — | $ | 414,065 | ||||||||
Sovereign Debt | — | 24,844 | — | 24,844 | ||||||||||||
Mortgage-Backed Securities | — | 22,914 | — | 22,914 | ||||||||||||
U.S. Treasury Obligations | — | 21,256 | — | 21,256 | ||||||||||||
Exchange Traded Funds | 9,608 | — | — | 9,608 | ||||||||||||
Preferred Stock | — | 3,331 | — | 3,331 | ||||||||||||
|
|
|
|
|
|
|
| |||||||||
Total Investments in Securities | $ | 9,608 | $ | 486,410 | $ | — | $ | 496,018 | ||||||||
|
|
|
|
|
|
|
| |||||||||
| Other Financial Instruments | Level 1 | Level 2 | Level 3 | Total | ||||||||||||
Purchased Options | $ | — | $ | 472 | $ | — | $ | 472 | ||||||||
Written Options | — | (605 | ) | — | (605 | ) | ||||||||||
Futures* | ||||||||||||||||
Unrealized Appreciation | 532 | — | — | 532 | ||||||||||||
Unrealized Depreciation | (135 | ) | — | — | (135 | ) | ||||||||||
Forwards* | ||||||||||||||||
Unrealized Appreciation | — | 725 | — | 725 | ||||||||||||
Unrealized Depreciation | — | (538 | ) | — | (538 | ) | ||||||||||
OTC Swaps | ||||||||||||||||
Credit Default Swaps* | ||||||||||||||||
Unrealized Appreciation | — | 59 | — | 59 | ||||||||||||
Unrealized Depreciation | — | (128 | ) | — | (128 | ) | ||||||||||
Interest Rate Swaps* | ||||||||||||||||
Unrealized Appreciation | — | 43 | 43 | |||||||||||||
Unrealized Depreciation | — | (208 | ) | — | (208 | ) | ||||||||||
Centrally Cleared Swaps | ||||||||||||||||
Credit Default Swaps* | ||||||||||||||||
Unrealized Depreciation | — | (13 | ) | — | (13 | ) | ||||||||||
Interest Rate Swaps* | ||||||||||||||||
Unrealized Appreciation | �� | — | 228 | — | 228 | |||||||||||
Unrealized Depreciation | — | (311 | ) | — | (311 | ) | ||||||||||
|
|
|
|
|
|
|
| |||||||||
Total Other Financial Instruments | $ | 397 | $ | (276 | ) | $ | — | $ | 121 | |||||||
|
|
|
|
|
|
|
| |||||||||
| * | Futures contracts, Forwards and Swaps are valued at the unrealized appreciation (depreciation) on the instrument. |
For the year ended September 30, 2013, there have been no transfers between Level 1 and Level 2 assets and liabilities.
For the year ended September 30, 2013, there have been no transfers between Level 2 and Level 3 assets and liabilities.
For more information on valuation inputs, see Note 2 — Significant Accounting Policies in Notes to Financial Statements.
Amounts designated as “—” are $O or have been rounded to $O.
The accompanying notes are an integral part of the financial statements.
| 220 | SEI Institutional Managed Trust / Annual Report / September 30, 2013 |
This page intentionally left blank.
Statements of Assets and Liabilities ($ Thousands)
September 30, 2013
| Large Cap Fund | Large Cap Value Fund | Large Cap Growth Fund | ||||||||||
ASSETS: | ||||||||||||
Investments, at value† | $ | 2,016,142 | * | $ | 1,409,025 | * | $ | 1,405,248 | * | |||
Affiliated investments, at value†† | 173,545 | 93,443 | 168,878 | |||||||||
Cash | 24 | 28 | 13 | |||||||||
Receivable for investment securities sold | 4,262 | 2,164 | 679 | |||||||||
Receivable for fund shares sold | 1,770 | 981 | 1,061 | |||||||||
Dividends and interest receivable | 1,780 | 1,714 | 606 | |||||||||
Prepaid Expenses | 25 | 23 | 19 | |||||||||
Total Assets | 2,197,548 | 1,507,378 | 1,576,504 | |||||||||
LIABILITIES: | ||||||||||||
Payable upon return on securities loaned | 81,402 | 46,842 | 129,354 | |||||||||
Payable for investment securities purchased | 4,569 | 2,398 | 1,503 | |||||||||
Payable for fund shares redeemed | 2,568 | 2,621 | 2,907 | |||||||||
Payable for variation margin | 229 | 67 | 38 | |||||||||
Administration fees payable | 599 | 420 | 411 | |||||||||
Investment advisory fees payable | 592 | 374 | 420 | |||||||||
Shareholder servicing fees payable Class A | 320 | 256 | 209 | |||||||||
Shareholder servicing fees payable Class I | — | 2 | 2 | |||||||||
Chief Compliance Officer fees payable | 3 | 2 | 2 | |||||||||
Administrative servicing fees payable Class I | — | 2 | 1 | |||||||||
Accrued expense payable | 74 | 53 | 49 | |||||||||
Total Liabilites | 90,356 | 53,037 | 134,896 | |||||||||
Net Assets | $ | 2,107,192 | $ | 1,454,341 | $ | 1,441,608 | ||||||
†Cost of investments | 1,549,915 | 1,163,027 | 1,149,464 | |||||||||
††Cost of affiliated investments | 173,545 | 93,443 | 168,878 | |||||||||
*Includes market value of securities on loan | 79,181 | 45,465 | 126,277 | |||||||||
NET ASSETS: | ||||||||||||
Paid-in-Capital — (unlimited authorization — no par value) | 1,534,651 | 1,326,437 | 1,169,957 | |||||||||
Undistributed (distributions in excess of) net investment income | 3,016 | 3,890 | 263 | |||||||||
Accumulated net realized gain (loss) on investments, options, futures contracts, swap contracts, swaptions and foreign currency | 103,473 | (121,959 | ) | 15,622 | ||||||||
Net unrealized appreciation (depreciation) on investments, securities sold short, and affiliated investments | 466,227 | 245,998 | 255,784 | |||||||||
Net unrealized appreciation (depreciation) on futures contracts | (175 | ) | (25 | ) | (18 | ) | ||||||
Net unrealized depreciation on forward foreign currency contracts, foreign currencies and translation of other assets and liabilities denominated in foreign currencies | — | — | — | |||||||||
Net Assets | $ | 2,107,192 | $ | 1,454,341 | $ | 1,441,608 | ||||||
Net Asset Value, Offering and Redemption Price Per Share — Class A | $ 13.95 | $ 21.94 | $ 30.28 | |||||||||
| | ($2,107,192,052 ÷ 151,004,695 shares | ) | | ($1,444,929,040 ÷ 65,843,945 shares | ) | | ($1,433,284,459 ÷ 47,334,736 shares | ) | ||||
Net Asset Value, Offering and Redemption Price Per Share — Class E | N/A | N/A | N/A | |||||||||
Net Asset Value, Offering and Redemption Price Per Share — Class I | N/A | $ | 21.96 | $ | 29.93 | |||||||
| | ($9,411,932 ÷ 428,679 shares | ) | | ($8,323,819 ÷ 278,078 shares | ) | |||||||
Net Asset Value, Offering and Redemption Price Per Share — Class Y | N/A | N/A | N/A | |||||||||
Amounts designated as “—” are $0 or have been rounded to $0.
N/A — Not Applicable. Share class currently not offered.
The accompanying notes are an integral part of the financial statements.
| 222 | SEI Institutional Managed Trust / Annual Report / September 30, 2013 |
| Tax-Managed Large Cap Fund | S&P 500 Index Fund | Small Cap Fund | Small Cap Value Fund | Small Cap Growth Fund | Tax-Managed Small/Mid Cap Fund | Mid-Cap Fund | ||||||||||||||||||||
| $ | 2,297,100 | * | $ | 2,679,566 | * | $ | 390,707 | * | $ | 377,295 | * | $ | 342,626 | * | $ | 467,567 | * | $ | 103,459 | * | ||||||
| 235,594 | 214,833 | 92,728 | 86,826 | 90,749 | 71,311 | 13,525 | ||||||||||||||||||||
| 2,028 | 15 | 43 | 38 | 2 | 144 | 7 | ||||||||||||||||||||
| 1,802 | 33,513 | 1,769 | 837 | 2,926 | 2,576 | 725 | ||||||||||||||||||||
| 2,528 | 10,064 | 396 | 444 | 317 | 469 | 27 | ||||||||||||||||||||
| 2,125 | 3,248 | 300 | 518 | 96 | 352 | 119 | ||||||||||||||||||||
| 29 | 36 | 4 | 6 | 4 | 5 | 2 | ||||||||||||||||||||
| 2,541,206 | 2,941,275 | 485,947 | 465,964 | 436,720 | 542,424 | 117,864 | ||||||||||||||||||||
| 125,772 | 171,383 | 70,639 | 66,092 | 77,337 | 48,634 | 7,046 | ||||||||||||||||||||
| 3,606 | 1,180 | 3,758 | 2,026 | 1,950 | 6,915 | 975 | ||||||||||||||||||||
| 1,273 | 41,851 | 382 | 1,036 | 617 | 206 | 694 | ||||||||||||||||||||
| 362 | 385 | 3 | 3 | 3 | 8 | 9 | ||||||||||||||||||||
| 686 | 400 | 115 | 112 | 111 | 137 | 31 | ||||||||||||||||||||
| 672 | 68 | 194 | 200 | 172 | 205 | 44 | ||||||||||||||||||||
| 225 | 25 | 60 | 54 | 44 | 82 | 12 | ||||||||||||||||||||
| — | 1 | — | 1 | 1 | — | — | ||||||||||||||||||||
| 4 | 4 | 1 | 1 | 1 | 1 | — | ||||||||||||||||||||
| — | 2 | — | 1 | 1 | — | — | ||||||||||||||||||||
| 200 | 114 | 15 | 17 | 2 | 20 | 8 | ||||||||||||||||||||
| 132,800 | 215,413 | 75,167 | 69,543 | 80,239 | 56,208 | 8,819 | ||||||||||||||||||||
| $ | 2,408,406 | $ | 2,725,862 | $ | 410,780 | $ | 396,421 | $ | 356,481 | $ | 486,216 | $ | 109,045 | |||||||||||||
| 1,500,933 | 1,322,280 | 300,742 | 324,278 | 282,009 | 356,135 | 92,334 | ||||||||||||||||||||
| 235,594 | 214,833 | 92,728 | 86,826 | 90,749 | 71,311 | 13,525 | ||||||||||||||||||||
| 122,551 | 166,618 | 68,514 | 64,110 | 74,817 | 47,136 | 6,872 | ||||||||||||||||||||
| 1,920,309 | 1,311,631 | 300,703 | 349,610 | 430,216 | 355,700 | 99,268 | ||||||||||||||||||||
| 3,907 | 11,980 | (322 | ) | 366 | (1,357 | ) | (25 | ) | 38 | |||||||||||||||||
| (311,738 | ) | 45,189 | 20,209 | (6,688 | ) | (133,100 | ) | 18,941 | (1,433 | ) | |||||||||||||||
| 796,167 |
| 1,357,286 | 89,965 | 53,017 | 60,617 | 111,432 | 11,125 | ||||||||||||||||||
| (239 | ) | (224 | ) | 225 | 116 | 105 | 169 | 47 | ||||||||||||||||||
| — |
| — | — | — | — | (1 | ) | — | |||||||||||||||||
| $ | 2,408,406 | $ | 2,725,862 | $ | 410,780 | $ | 396,421 | $ | 356,481 | $ | 486,216 | $ | 109,045 | |||||||||||||
| $ | 16.81 | $ | 46.20 | $ | 13.32 | $ | 23.24 | $ | 24.63 | $ | 17.10 | $ | 24.64 | |||||||||||||
| | ($2,407,950,749 ÷ 143,270,886 shares | ) | | ($352,588,544 ÷ 7,631,857 shares | ) | | ($410,779,954 ÷ 30,837,911 shares | ) | | ($391,113,467 ÷ 16,826,866 shares | ) | | ($353,097,507 ÷ 14,338,934 shares | ) | | ($486,216,172 ÷ 28,441,242 shares | ) | | ($107,487,434 ÷ 4,361,916 shares | ) | ||||||
| N/A | $ 46.45 | N/A | N/A | N/A | N/A | N/A | ||||||||||||||||||||
| | ($2,365,696,219 ÷ 50,934,858 shares | ) | ||||||||||||||||||||||||
| N/A | $ 46.38 | N/A | $ 23.09 | $ 23.93 | N/A | $ 24.64 | ||||||||||||||||||||
| | ($7,576,870 ÷ 163,382 shares | ) | | ($5,307,581 ÷ 229,914 shares | ) | | ($3,383,717 ÷ 141,427 shares | ) | | ($1,557,782 ÷ 63,210 shares | ) | |||||||||||||||
| $ 17.31 | N/A | N/A | N/A | N/A | N/A | N/A | ||||||||||||||||||||
| | ($455,377 ÷ 26,309 shares | ) | ||||||||||||||||||||||||
| SEI Institutional Managed Trust / Annual Report / September 30, 2013 | 223 |
Statements of Assets and Liabilities ($ Thousands)
September 30, 2013
| U.S. Managed Volatility Fund | Global Managed Volatility Fund | Tax-Managed Managed Volatility Fund | ||||||||||
ASSETS: | ||||||||||||
Investments, at value† | $ | 816,625 | $ | 1,293,348 | $ | 584,472 | ||||||
Affiliated investments, at value†† | 35,767 | 64,403 | 36,686 | |||||||||
Repurchase agreement† | — | — | — | |||||||||
Cash | 100 | — | 64 | |||||||||
Foreign currency, at value††† | 21 | 57 | 20 | |||||||||
Cash collateral on futures | — | — | — | |||||||||
Cash collateral on swaps | — | — | — | |||||||||
Receivable for investment securities sold | — | — | — | |||||||||
Receivable for fund shares sold | �� | 586 | 44,561 | 579 | ||||||||
Dividends and interest receivable | 1,481 | 4,625 | 933 | |||||||||
Receivable for variation margin | — | — | — | |||||||||
OTC swap contracts, at value†††† | — | — | — | |||||||||
Options purchased, at value# | — | — | — | |||||||||
Swaptions purchased, at value‡ | — | — | — | |||||||||
Unrealized gain on forward foreign currency contracts | — | 186 | — | |||||||||
Unrealized gain on foreign spot currency contracts | — | — | — | |||||||||
Prepaid Expenses | 10 | 16 | 7 | |||||||||
Total Assets | 854,590 | 1,407,196 | 622,761 | |||||||||
LIABILITIES: | ||||||||||||
Payable upon return on securities loaned | — | — | — | |||||||||
Payable for securities sold short@ | — | — | — | |||||||||
Payable for investment securities purchased | — | — | — | |||||||||
Payable for fund shares redeemed | 1,364 | 1,752 | 576 | |||||||||
Dividends on securities sold short | — | — | — | |||||||||
Payable to custodian | — | — | — | |||||||||
Payable for variation margin | 165 | 480 | 141 | |||||||||
Administration fees payable | 244 | 390 | 177 | |||||||||
Investment advisory fees payable | 263 | 517 | 189 | |||||||||
Shareholder servicing fees payable Class A | 174 | 278 | 126 | |||||||||
Shareholder servicing fees payable Class I | — | — | — | |||||||||
Chief Compliance Officer fees payable | 1 | 2 | 1 | |||||||||
Trustees fees payable | — | — | — | |||||||||
Administrative servicing fees payable Class I | — | — | — | |||||||||
Income distribution payable | — | — | — | |||||||||
OTC swap contracts, at value†††† | — | — | — | |||||||||
Options written, at valuep | — | — | — | |||||||||
Unrealized loss on forward foreign currency contracts | — | 3,439 | — | |||||||||
Unrealized loss on foreign spot currency contracts | — | — | — | |||||||||
Accrued expense payable | 30 | 68 | 21 | |||||||||
Total Liabilities | 2,241 | 6,926 | 1,231 | |||||||||
Net Assets | $ | 852,349 | $ | 1,400,270 | $ | 621,530 | ||||||
†Cost of investments and repurchase agreements | 665,634 | 1,176,434 | 461,187 | |||||||||
††Cost of affiliated investments | 35,767 | 64,403 | 36,686 | |||||||||
†††Cost of foreign currency/(overdraft of foreign currency) | 20 | 50 | 19 | |||||||||
††††Premiums received/(paid) | — | — | — | |||||||||
# Cost of options purchased | — | — | — | |||||||||
p Premiums received | — | — | — | |||||||||
‡ Cost of swaptions purchased | — | — | — | |||||||||
@ Proceeds from securities sold short | — | — | — | |||||||||
* Includes market value of securities on loan | — | — | — | |||||||||
NET ASSETS: | ||||||||||||
Paid-in-Capital — (unlimited authorization — no par value) | 654,774 | 1,180,261 | 473,402 | |||||||||
Undistributed (distributions in excess of) net investment income | 3,414 | 54,890 | 2,358 | |||||||||
Accumulated net realized gain (loss) on investments, securities sold short, options, futures contracts, swap contracts, swaptions and foreign currency | 43,281 | 51,651 | 22,591 | |||||||||
Net unrealized appreciation (depreciation) on investments, securities sold short, and affiliated investments | 150,991 | 116,914 | 123,285 | |||||||||
Net unrealized depreciation on futures contracts | (112 | ) | (260 | ) | (107 | ) | ||||||
Net unrealized appreciation (depreciation) on swap contracts | — | — | — | |||||||||
Net unrealized appreciation (depreciation) on options | — | — | — | |||||||||
Net unrealized appreciation on swaptions | — | — | — | |||||||||
Net unrealized appreciation (depreciation) on forward foreign currency contracts, foreign currencies and translation of other assets and liabilities denominated in foreign currencies | 1 | (3,186 | ) | 1 | ||||||||
Net Assets | $ | 852,349 | $ | 1,400,270 | $ | 621,530 | ||||||
Net Asset Value, Offering and Redemption Price Per Share — Class A | $ 16.09 | $ 11.00 | $ 12.70 | |||||||||
| | ($851,118,724 ÷ 52,900,456 shares | ) | | ($1,399,315,536 ÷ 127,212,411 shares | ) | | ($621,530,046 ÷ 48,928,104 shares | ) | ||||
Net Asset Value, Offering and Redemption Price Per Share — Class I | $ 16.07 | $ 10.84 | N/A | |||||||||
| | ($1,230,112 ÷ 76,541 shares | ) | | ($954,160 ÷ 88,025 shares | ) | |||||||
Amounts designated as “—” are $0 or have been rounded to $0.
N/A — Not Applicable. Share class currently not offered.
The accompanying notes are an integral part of the financial statements.
| 224 | SEI Institutional Managed Trust / Annual Report / September 30, 2013 |
| Real Estate Fund | Enhanced Income Fund | Core Fixed Income Fund | U.S. Fixed Income Fund | High Yield Bond Fund | Real Return Fund | Multi-Strategy Alternative Fund | ||||||||||||||||||||
| $ | 202,432 | * | $ | 199,449 | $ | 2,011,594 | * | $ | 1,037,929 | * | $ | 1,898,742 | * | $ | 308,145 | $ | 407,332 | |||||||||
| 26,641 | 2,022 | 156,705 | 77,563 | 153,391 | 125 | 15,186 | ||||||||||||||||||||
| — | 1,000 | — | — | — | — | — | ||||||||||||||||||||
| — | 194 | — | — | — | — | 26,061 | ||||||||||||||||||||
| — | — | 796 | — | — | — | 2 | ||||||||||||||||||||
| — | | 100 | | — | — | — | — | — | ||||||||||||||||||
| — | — | — | — | 624 | — | — | ||||||||||||||||||||
| 718 | 1,138 | 260,272 | 117,158 | 13,360 | — | 3,648 | ||||||||||||||||||||
| 2,457 | 156 | 1,534 | 2,558 | 2,136 | 365 | 393 | ||||||||||||||||||||
| 565 | 569 | 11,447 | 4,787 | 31,679 | 744 | 48 | ||||||||||||||||||||
| — | — | 26 | 14 | — | — | — | ||||||||||||||||||||
| — | — | 1,765 | 202 | — | — | — | ||||||||||||||||||||
| — | — | — | — | — | — | 9 | ||||||||||||||||||||
| — | — | 1,577 | — | — | — | — | ||||||||||||||||||||
| — | — | — | — | — | — | — | ||||||||||||||||||||
| — | — | — | — | — | — | 1 | ||||||||||||||||||||
| 3 | 3 | 29 | 13 | 25 | 5 | 5 | ||||||||||||||||||||
| 232,816 | 204,631 | 2,445,745 | 1,240,224 | 2,099,957 | 309,384 | 452,685 | ||||||||||||||||||||
| 19,982 | — | 88,895 | 12,248 | 6 | — | — | ||||||||||||||||||||
| — | — | — | — | — | — | 22,014 | ||||||||||||||||||||
| 1,949 | 8,953 | 431,476 | 201,822 | 64,425 | — | 2,990 | ||||||||||||||||||||
| 2,242 | 379 | 3,226 | 1,489 | 2,442 | 438 | 686 | ||||||||||||||||||||
| — | — | — | — | — | — | 31 | ||||||||||||||||||||
| — | — | 24 | 13 | 1,980 | — | — | ||||||||||||||||||||
| — | 4 | 121 | 30 | 12 | — | — | ||||||||||||||||||||
| 60 | 25 | 441 | 232 | 561 | 75 | 109 | ||||||||||||||||||||
| 100 | 63 | 404 | 215 | 686 | 38 | 104 | ||||||||||||||||||||
| 24 | — | 31 | 55 | 72 | — | — | ||||||||||||||||||||
| — | — | 3 | — | 3 | — | — | ||||||||||||||||||||
| — | — | 3 | 1 | 3 | — | 1 | ||||||||||||||||||||
| — | — | — | — | — | — | — | ||||||||||||||||||||
| — | — | 3 | — | 3 | — | — | ||||||||||||||||||||
| — | — | 544 | 1,773 | 1,386 | — | — | ||||||||||||||||||||
| — | — | 1,089 | — | — | — | — | ||||||||||||||||||||
| — | — | 2 | 1 | — | — | — | ||||||||||||||||||||
| — | — | 452 | — | — | — | — | ||||||||||||||||||||
| — | — | — | — | — | — | 1 | ||||||||||||||||||||
| 18 | 18 | 280 | 112 | 174 | 12 | 16 | ||||||||||||||||||||
| 24,375 | 9,442 | 526,994 | 217,991 | 71,753 | 563 | 25,952 | ||||||||||||||||||||
| $ | 208,441 | $ | 195,189 | $ | 1,918,751 | $ | 1,022,233 | $ | 2,028,204 | $ | 308,821 | $ | 426,733 | |||||||||||||
| 171,850 | 203,609 | 1,990,379 | 1,025,796 | 1,868,541 | 309,937 | 397,106 | ||||||||||||||||||||
| 26,641 | 2,022 | 156,705 | 77,563 | 153,391 | 125 | 15,186 | ||||||||||||||||||||
| — | — | 778 | — | — | — | 2 | ||||||||||||||||||||
| — | — | (45 | ) | — | — | — | — | |||||||||||||||||||
| — | — | — | — | — | — | 11 | ||||||||||||||||||||
| — | — | (93 | ) | | (17 | ) | — | — | — | |||||||||||||||||
| — | — | 1,055 | — | — | — | — | ||||||||||||||||||||
| — | — | — | — | — | — | (21,505 | ) | |||||||||||||||||||
| 19,282 | — | 86,200 | 11,898 | 6 | — | — | ||||||||||||||||||||
| 197,339 | 321,013 | 1,948,511 | 1,021,374 | 2,089,507 | 312,067 | 430,335 | ||||||||||||||||||||
| 1,753 | 1,110 | (3,792 | ) | 108 | 9,349 | (170 | ) | 1,734 | ||||||||||||||||||
| (21,233 | ) | (123,651 | ) | (47,668 | ) | (10,882 | ) | (100,841 | ) | (1,284 | ) | (15,050 | ) | ||||||||||||
| 30,582 |
| (3,160 | ) | 21,215 | 12,133 | 30,201 | (1,792 | ) | 9,717 | ||||||||||||||||
| — | (123 | ) | (426 | ) | (718 | ) | — | — | — | |||||||||||||||||
| — | — | 721 | 202 | (12 | ) | — | — | |||||||||||||||||||
| — | — | 91 | 16 | — | — | (2 | ) | |||||||||||||||||||
| — | — | 522 | — | — | — | — | ||||||||||||||||||||
| — |
| — | (423 | ) | — | — | — | (1 | ) | ||||||||||||||||
| $ | 208,441 | $ | 195,189 | $ | 1,918,751 | $ | 1,022,233 | $ | 2,028,204 | $ | 308,821 | $ | 426,733 | |||||||||||||
| $ | 15.42 | $ | 7.61 | $ | 11.20 | $ | 10.15 | $ | 7.68 | $ | 10.19 | $ | 9.79 | |||||||||||||
| | ($207,875,720 ÷ 13,481,816 shares | ) | | ($194,820,985 ÷ 25,614,970 shares | ) | | ($1,904,623,261 ÷ 170,083,195 shares | ) | | ($1,022,232,939 ÷ 100,746,047 shares | ) | | ($1,989,355,058 ÷ 259,175,525 shares | ) | | ($308,821,342 ÷ 30,311,612 shares | ) | | ($426,733,045 ÷ 43,593,932 shares | ) | ||||||
| $ | 15.39 | $ | 7.59 | $ | 11.19 | N/A | $ | 7.49 | N/A | N/A | ||||||||||||||||
| | ($564,835 ÷ 36,710 shares | ) | | ($367,530 ÷ 48,429 shares | ) | | ($14,127,713 ÷ 1,262,287 shares | ) | | ($38,849,249 ÷ 5,187,524 shares | ) | |||||||||||||||
| SEI Institutional Managed Trust / Annual Report / September 30, 2013 | 225 |
Consolidated Statements of Assets and Liabilities/Statements of Assets and Liabilities ($ Thousands)
September 30, 2013
| Multi-Asset Accumulation Fund | ||||
ASSETS: | ||||
Investments, at value† | $ | 801,668 | ||
Affiliated investments, at value†† | 558,119 | |||
Cash | 13,451 | |||
Foreign currency, at value††† | — | |||
Cash collateral on futures | 56,576 | |||
Cash collateral on options | — | |||
Cash collateral on reverse repurchase agreements | — | |||
Cash collateral on swaps | 3,067 | |||
Receivable from custodian | 4,824 | |||
Receivable for investment securities sold | 174 | |||
Receivable for fund shares sold | 1,287 | |||
Dividends and interest receivable | 1,521 | |||
Receivable for variation margin | 2,224 | |||
OTC swap contracts, at value†††† | 4,529 | |||
Options purchased, at value# | — | |||
Foreign tax reclaim receivable | 76 | |||
Unrealized gain on forward foreign currency contracts | 2,534 | |||
Unrealized gain on foreign spot currency contracts | 33 | |||
Prepaid Expenses | 15 | |||
Total Assets | 1,450,098 | |||
LIABILITIES: | ||||
Payable for investment securities purchased | 9,781 | |||
Payable for fund shares redeemed | 1,928 | |||
Payable to custodian | — | |||
Payable for variation margin | 7,542 | |||
Administration fees payable | 399 | |||
Investment advisory fees payable | 691 | |||
Shareholder servicing fees payable Class (A) | 202 | |||
Chief Compliance Officer fees payable | 2 | |||
Income distribution payable | — | |||
OTC swap contracts, at value†††† | 3,811 | |||
Options written, at valuep | — | |||
Reverse repurchase agreements | — | |||
Overdraft of foreign currency, at value††† | 4,268 | |||
Unrealized loss on forward foreign currency contracts | 6,863 | |||
Unrealized loss on foreign spot currency contracts | — | |||
Accrued expense payable | 48 | |||
Total Liabilities | 35,535 | |||
Net Assets | $ | 1,414,563 | ||
†Cost of investments and repurchase agreements | 787,030 | |||
††Cost of affiliated investments | 558,119 | |||
†††Cost of foreign currency/(overdraft of foreign currency) | 526 | |||
††††Premiums received/(paid) | — | |||
# Cost of options purchased | — | |||
p Premiums received | — | |||
NET ASSETS: | ||||
Paid-in-Capital — (unlimited authorization — no par value) | 1,395,846 | |||
Undistributed (distributions in excess of) net investment income | 2,389 | |||
Accumulated net realized loss on investments, options, futures contracts, swap contracts, swaptions and foreign currency | (5,105 | ) | ||
Net unrealized appreciation (depreciation) on investments, and affiliated investments | 14,638 | |||
Net unrealized appreciation (depreciation) on futures contracts | 9,353 | |||
Net unrealized depreciation on swap contracts | 1,693 | |||
Net unrealized depreciation on options | — | |||
Net unrealized appreciation (depreciation) on forward foreign currency contracts, foreign currencies and translation of other assets and liabilities denominated in foreign currencies | (4,251 | ) | ||
Net Assets | $ | 1,414,563 | ||
Net Asset Value, Offering and Redemption Price Per Share — Class A | $ | 10.30 | ||
| | ($1,414,562,622 ÷ 137,363,692 shares | ) | ||
Amounts designated as “—” are $0 or have been rounded to $0.
The accompanying notes are an integral part of the financial statements.
| 226 | SEI Institutional Managed Trust / Annual Report / September 30, 2013 |
| Multi-Asset Income Fund | Multi-Asset Inflation Managed Fund | Multi-Asset Capital Stability Fund | ||||||||
| $ | 241,308 | $ | 888,671 | $ | 496,018 | |||||
| — | — | — | ||||||||
| 434 | 163 | 124 | ||||||||
| — | 121 | — | ||||||||
| — | 3,432 | 3,127 | ||||||||
| 384 | — | — | ||||||||
| 559 | — | — | ||||||||
| 181 | — | 149 | ||||||||
| — | — | — | ||||||||
| 4,798 | 2,233 | 183 | ||||||||
| 447 | 837 | 565 | ||||||||
| 2,246 | 2,740 | 231 | ||||||||
| 6 | 156 | 25 | ||||||||
| — | 1,588 | 1,379 | ||||||||
| 102 | — | 472 | ||||||||
| — | 47 | 3 | ||||||||
| — | 103 | 725 | ||||||||
| — | 2 | — | ||||||||
| 2 | 9 | 5 | ||||||||
| 250,467 | 900,102 | 503,006 | ||||||||
| 11,764 | 3,261 | 10,198 | ||||||||
| 309 | 890 | 628 | ||||||||
| 484 | 10 | — | ||||||||
| 94 | 237 | 436 | ||||||||
| 30 | 220 | 79 | ||||||||
| 108 | 256 | 159 | ||||||||
| — | 68 | — | ||||||||
| — | 1 | 1 | ||||||||
| 145 | — | — | ||||||||
| — | 1,778 | 744 | ||||||||
| 27 | — | 605 | ||||||||
| 7,125 | 123,804 | — | ||||||||
| — | — | 2,677 | ||||||||
| — | 3,161 | 538 | ||||||||
| — | — | — | ||||||||
| 25 | 48 | 15 | ||||||||
| 20,111 | 133,734 | 16,080 | ||||||||
| $ | 230,356 | $ | 766,368 | $ | 486,926 | |||||
| 242,389 | 889,081 | 496,477 | ||||||||
| — | — | — | ||||||||
| — | 109 | (2,677 | ) | |||||||
| — | 23 | 869 | ||||||||
| 231 | — | 969 | ||||||||
| (57 | ) | — | (629 | ) | ||||||
| 226,986 | 806,376 | 491,748 | ||||||||
| 1,117 | (15,131 | ) | (248 | ) | ||||||
| 3,558 |
| (19,886 | ) | (3,897 | ) | ||||
| (1,081 | ) | (410 | ) | (459 | ) | |||||
| — | (1,275 | ) | 397 | |||||||
| (125 | ) | (266 | ) | (330 | ) | |||||
| (99 | ) | — | (473 | ) | ||||||
| — |
| (3,040 | ) | 188 | |||||
| $ | 230,356 | $ | 766,368 | $ | 486,926 | |||||
| $ | 10.60 | $ | 9.42 | $ | 9.94 | |||||
| | ($230,356,210 ÷ 21,724,453 shares | ) | | ($766,368,180 ÷ 81,348,786 shares | ) | | ($486,925,959 ÷ 48,985,270 shares | ) | ||
| SEI Institutional Managed Trust / Annual Report / September 30, 2013 | 227 |
Statements of Operations ($ Thousands)
For the year ended September 30, 2013
| Large Cap Fund | Large Cap Value Fund | Large Cap Growth Fund | ||||||||||
Investment Income: | ||||||||||||
Dividends | $ | 32,440 | $ | 31,258 | $ | 15,915 | ||||||
Dividends from Affiliated Investments*† | 21 | 11 | 10 | |||||||||
Interest Income | 3 | 142 | 9 | |||||||||
Securities Lending Income — Net | 193 | 295 | 120 | |||||||||
Less: Foreign Taxes Witheld | (173 | ) | (37 | ) | (96 | ) | ||||||
Total Investment Income | 32,484 | 31,669 | 15,958 | |||||||||
Expenses: | ||||||||||||
Investment Advisory Fees | 6,914 | 4,859 | 5,441 | |||||||||
Administration Fees | 6,205 | 4,859 | 4,761 | |||||||||
Shareholder Servicing Fees Class (A) | 4,432 | 3,449 | 3,380 | |||||||||
Shareholder Servicing Fees Class (I) | — | 21 | 21 | |||||||||
Shareholder Servicing Fees Class (Y) | — | — | — | |||||||||
Administrative Servicing Fees Class (I) | — | 21 | 21 | |||||||||
Trustee Fees | 27 | 22 | 21 | |||||||||
Chief Compliance Officer Fees | 12 | 9 | 8 | |||||||||
Printing Fees | 116 | 86 | 84 | |||||||||
Professional Fees | 97 | 71 | 68 | |||||||||
Custodian/Wire Agent Fees | 118 | 94 | 91 | |||||||||
Registration Fees | 53 | 44 | 46 | |||||||||
Interest expense | — | — | — | |||||||||
Licensing Fees | — | — | — | |||||||||
Other Expenses | 21 | 20 | 19 | |||||||||
Total Expenses | 17,995 | 13,555 | 13,961 | |||||||||
Less: | ||||||||||||
Waiver of Investment Advisory Fees | (773 | ) | (511 | ) | (580 | ) | ||||||
Waiver of Shareholder Servicing Fees Class (A) | (1,262 | ) | (624 | ) | (1,162 | ) | ||||||
Waiver of Shareholder Servicing Fees Class (I) | — | (6 | ) | (10 | ) | |||||||
Waiver of Shareholder Servicing Fees Class (Y) | — | — | — | |||||||||
Waiver of Administration Fees | — | — | — | |||||||||
Fees Paid Indirectly | (154 | ) | (19 | ) | (63 | ) | ||||||
Net Expenses | 15,806 | 12,395 | 12,146 | |||||||||
Net Investment Income (Loss) | 16,678 | 19,274 | 3,812 | |||||||||
Net Realized and Unrealized Gain (Loss) on Investments: | ||||||||||||
Net Realized Gain (Loss) on: | ||||||||||||
Investments | 117,938 | 135,832 | 160,976 | |||||||||
Futures Contracts | 6,857 | 2,465 | 3,583 | |||||||||
Foreign Currency Transactions | (18 | ) | — | — | ||||||||
Net Change in Unrealized Appreciation (Depreciation) on: | ||||||||||||
Investments | 216,794 | 129,161 | 64,230 | |||||||||
Affiliated Investments | — | 5,163 | 3,659 | |||||||||
Futures Contracts | (120 | ) | (25 | ) | (18 | ) | ||||||
Net Increase in Net Assets from Operations | $ | 358,129 | $ | 291,870 | $ | 236,242 | ||||||
| * | See Note 6 in Notes to Financial Statements. |
| † | Portion of the income is from the investment of collateral in an affiliated security. |
Amounts designated as "—" are $0 or have been rounded to $0.
The accompanying notes are an integral part of the financial statements.
| 228 | SEI Institutional Managed Trust / Annual Report / September 30, 2013 |
| Tax-Managed Large Cap Fund | S&P 500 Index Fund | Small Cap Fund | Small Cap Value Fund | Small Cap Growth Fund | Tax-Managed Small/Mid Cap Fund | Mid-Cap Fund | ||||||||||||||||||||
| $ | 39,713 | $ | 63,744 | $ | 3,421 | $ | 7,416 | $ | 2,303 | $ | 5,192 | $ | 1,500 | |||||||||||||
| 15 | 15 | 3 | 4 | 2 | 3 | 1 | ||||||||||||||||||||
| 4 | 3 | 2 | 1 | 1 | 2 | — | ||||||||||||||||||||
| 294 | 293 | 355 | 292 | 935 | 378 | 42 | ||||||||||||||||||||
| (191 | ) | (53 | ) | (6 | ) | (18 | ) | (4 | ) | (4 | ) | (1 | ) | |||||||||||||
| 39,835 | 64,002 | 3,775 | 7,695 | 3,237 | 5,571 | 1,542 | ||||||||||||||||||||
| 8,418 | 858 | 2,064 | 2,530 | 2,030 | 2,569 | 401 | ||||||||||||||||||||
| 7,366 | 6,293 | 1,111 | 1,362 | 1,093 | 1,383 | 350 | ||||||||||||||||||||
| 5,259 | 801 | 794 | 962 | 774 | 988 | 247 | ||||||||||||||||||||
| — | 20 | — | 12 | 7 | — | 3 | ||||||||||||||||||||
| 1 | — | — | — | — | — | — | ||||||||||||||||||||
| — | 20 | — | 12 | 7 | — | 3 | ||||||||||||||||||||
| 32 | 45 | 5 | 6 | 5 | 6 | 2 | ||||||||||||||||||||
| 13 | 18 | 2 | 2 | 2 | 3 | 1 | ||||||||||||||||||||
| 134 | 180 | 21 | 24 | 20 | 26 | 6 | ||||||||||||||||||||
| 111 | 145 | 18 | 19 | 16 | 22 | 6 | ||||||||||||||||||||
| 143 | 192 | 21 | 27 | 21 | 27 | 7 | ||||||||||||||||||||
| 62 | 79 | 9 | 14 | 11 | 11 | 3 | ||||||||||||||||||||
| — | 2 | — | 1 | — | — | — | ||||||||||||||||||||
| — | 365 | — | — | — | — | — | ||||||||||||||||||||
| 31 | 42 | 10 | 10 | 7 | 16 | 3 | ||||||||||||||||||||
| 21,570 | 9,060 | 4,055 | 4,981 | 3,993 | 5,051 | 1,032 | ||||||||||||||||||||
| (1,145 | ) | — | (189 | ) | (116 | ) | (162 | ) | (510 | ) | — | |||||||||||||||
| (1,660 | ) | (224 | ) | (228 | ) | (381 | ) | (342 | ) | (119 | ) | (5 | ) | |||||||||||||
| — | (8 | ) | — | (6 | ) | (3 | ) | — | — | |||||||||||||||||
| (1 | ) | — | — | — | — | — | — | |||||||||||||||||||
| (2 | ) | (1,019 | ) | — | — | — | — | — | ||||||||||||||||||
| (3 | ) | (4 | ) | (14 | ) | (23 | ) | (7 | ) | (28 | ) | (1 | ) | |||||||||||||
| 18,759 | 7,805 | 3,624 | 4,455 | 3,479 | 4,394 | 1,026 | ||||||||||||||||||||
| 21,076 | 56,197 | 151 | 3,240 | (242 | ) | 1,177 | 516 | |||||||||||||||||||
| 52,844 | 54,526 | 22,316 | 44,837 | 39,455 | 27,478 | 15,948 | ||||||||||||||||||||
| 5,270 | 7,221 | 2,854 | 1,435 | 1,422 | 2,545 | 1,007 | ||||||||||||||||||||
| — | — | — | — | — | 4 | — | ||||||||||||||||||||
| 343,775 | 378,702 | 66,948 | 44,665 | 47,460 | 72,141 | 7,078 | ||||||||||||||||||||
| 4,313 | 3,816 | — | 3,821 | 3,037 | 238 | 334 | ||||||||||||||||||||
| (240 | ) | 1,016 | 305 | 155 | 147 | 273 | 90 | |||||||||||||||||||
| $ | 427,038 | $ | 501,478 | $ | 92,574 | $ | 98,153 | $ | 91,279 | $ | 103,856 | $ | 24,973 | |||||||||||||
| SEI Institutional Managed Trust / Annual Report / September 30, 2013 | 229 |
Statements of Operations ($ Thousands)
For the year ended September 30, 2013
| U.S. Managed Volatility Fund | Global Managed Volatility Fund | Tax-Managed Managed Volatility Fund | ||||||||||
Investment Income: | ||||||||||||
Dividends | $ | 20,968 | $ | 42,070 | $ | 15,224 | ||||||
Dividends from Affiliated Investments*† | 8 | 19 | 6 | |||||||||
Interest Income | 1 | 13 | 1 | |||||||||
Securities Lending Income — Net | — | — | — | |||||||||
Less: Foreign Taxes Witheld | (143 | ) | (2,033 | ) | (107 | ) | ||||||
Total Investment Income | 20,834 | 40,069 | 15,124 | |||||||||
Expenses: | ||||||||||||
Investment Advisory Fees | 4,864 | 8,143 | 3,436 | |||||||||
Administration Fees | 2,619 | 4,385 | 1,850 | |||||||||
Shareholder Servicing Fees Class (A) | 1,869 | 3,130 | 1,321 | |||||||||
Shareholder Servicing Fees Class (I) | 2 | 1 | — | |||||||||
Administrative Servicing Fees Class (I) | 2 | 1 | — | |||||||||
Trustee Fees | 11 | 19 | 8 | |||||||||
Chief Compliance Officer Fees | 5 | 9 | 3 | |||||||||
Printing Fees | 48 | 82 | 34 | |||||||||
Professional Fees | 41 | 69 | 29 | |||||||||
Custodian/Wire Agent Fees | 52 | 157 | 37 | |||||||||
Registration Fees | 21 | 27 | 13 | |||||||||
Overdraft Fees | — | 2 | — | |||||||||
Dividend expense | — | — | — | |||||||||
Interest expense | — | — | — | |||||||||
Fees for securities sold short | — | — | — | |||||||||
Other Expenses | 10 | 49 | 8 | |||||||||
Total Expenses | 9,544 | 16,074 | 6,739 | |||||||||
Less: | ||||||||||||
Waiver of Investment Advisory Fees | (2,048 | ) | (2,146 | ) | (1,446 | ) | ||||||
Waiver of Shareholder Servicing Fees Class (A) | — | — | — | |||||||||
Waiver of Shareholder Servicing Fees Class (I) | — | — | — | |||||||||
Waiver of Administration Fees | — | — | — | |||||||||
Fees Paid Indirectly | — | — | — | |||||||||
Net Expenses | 7,496 | 13,928 | 5,293 | |||||||||
Net Investment Income | 13,338 | 26,141 | 9,831 | |||||||||
Net Realized and Unrealized Gain (Loss) on Investments: | ||||||||||||
Net Realized Gain (Loss) on: | ||||||||||||
Investments | 44,934 | 61,569 | 23,032 | |||||||||
Secuitires Sold Short | — | — | — | |||||||||
Futures Contracts | 4,341 | 11,996 | 2,389 | |||||||||
Options | — | — | — | |||||||||
Swaptions | — | — | — | |||||||||
Swap Contracts | — | — | — | |||||||||
Foreign Currency Transactions | (87 | ) | 51,379 | (48 | ) | |||||||
Net Change in Unrealized Appreciation (Depreciation) on: | ||||||||||||
Investments | 62,988 | 30,535 | 52,726 | |||||||||
Secuitires Sold Short | — | — | — | |||||||||
Affiliated Investments | — | — | — | |||||||||
Futures Contracts | (50 | ) | 71 | (55 | ) | |||||||
Options | — | — | — | |||||||||
Swaptions | — | — | — | |||||||||
Swap Contracts | — | — | — | |||||||||
Foreign Currency and Translation of Other Assets and Liabilities Denominated in Foreign Currency | (4 | ) | (5,418 | ) | 1 | |||||||
Net Increase (Decrease) in Net Assets from Operations | $ | 125,460 | $ | 176,273 | $ | 87,876 | ||||||
| * | See Note 6 in Notes to Financial Statements. |
| † | Portion of the income is from the investment of collateral in an affiliated security. |
Amounts designated as "—" are $0 or have been rounded to $0.
The accompanying notes are an integral part of the financial statements.
| 230 | SEI Institutional Managed Trust / Annual Report / September 30, 2013 |
| Real Estate Fund | Enhanced Income Fund | Core Fixed Income Fund | U.S. Fixed Income Fund | High Yield Bond Fund | Real Return Fund | Multi-Strategy Alternative Fund | ||||||||||||||||||||
| $ | 4,330 | $ | 2 | $ | 50 | $ | — | $ | 529 | $ | — | $ | 5,486 | |||||||||||||
| 2 | — | 34 | 20 | 29 | 2 | 6 | ||||||||||||||||||||
| — | 4,768 | 68,667 | 24,388 | 132,340 | 2,824 | 7 | ||||||||||||||||||||
| 17 | — | 52 | 9 | — | — | — | ||||||||||||||||||||
| (3 | ) | (1 | ) | (1 | ) | (3 | ) | (22 | ) | — | (3 | ) | ||||||||||||||
| 4,346 | 4,769 | 68,802 | 24,414 | 132,876 | 2,826 | 5,496 | ||||||||||||||||||||
| 1,374 | �� | 712 | 5,837 | 2,665 | 9,219 | 668 | 5,696 | |||||||||||||||||||
| 740 | 623 | 5,943 | 2,713 | 6,619 | 1,062 | 1,329 | ||||||||||||||||||||
| 527 | 444 | 5,264 | 2,422 | 4,714 | 759 | 949 | ||||||||||||||||||||
| 2 | 1 | 42 | — | 14 | — | — | ||||||||||||||||||||
| 2 | 1 | 42 | — | 14 | — | — | ||||||||||||||||||||
| 3 | 3 | 33 | 15 | 29 | 5 | 6 | ||||||||||||||||||||
| 1 | 1 | 13 | 6 | 12 | 2 | 3 | ||||||||||||||||||||
| 13 | 12 | 128 | 61 | 117 | 19 | 24 | ||||||||||||||||||||
| 11 | 9 | 101 | 49 | 91 | 15 | 20 | ||||||||||||||||||||
| 15 | 12 | 145 | 64 | 128 | 20 | 26 | ||||||||||||||||||||
| 9 | 5 | 73 | 31 | 59 | 10 | 11 | ||||||||||||||||||||
| — | — | — | — | — | — | — | ||||||||||||||||||||
| — | — | — | — | — | — | 251 | ||||||||||||||||||||
| 1 | — | — | — | 3 | — | — | ||||||||||||||||||||
| — | — | — | — | — | — | 130 | ||||||||||||||||||||
| 3 | 40 | 497 | 320 | 202 | 6 | 7 | ||||||||||||||||||||
| 2,701 | 1,863 | 18,118 | 8,346 | 21,221 | 2,566 | 8,452 | ||||||||||||||||||||
| (134 | ) | (9 | ) | (389 | ) | (155 | ) | (1,105 | ) | (81 | ) | (4,599 | ) | |||||||||||||
| (142 | ) | (444 | ) | (3,406 | ) | (1,782 | ) | (3,231 | ) | (759 | ) | (949 | ) | |||||||||||||
| (1 | ) | (1 | ) | (32 | ) | — | (10 | ) | — | — | ||||||||||||||||
| — | (338 | ) | — | — | — | (356 | ) | (123 | ) | |||||||||||||||||
| (8 | ) | — | — | — | — | — | — | |||||||||||||||||||
| 2,416 | 1,071 | 14,291 | 6,409 | 16,875 | 1,370 | 2,781 | ||||||||||||||||||||
| 1,930 | 3,698 | 54,511 | 18,005 | 116,001 | 1,456 | 2,715 | ||||||||||||||||||||
| 30,569 | 236 | (4,501 | ) | (3,701 | ) | 47,671 | 1,328 | (1,431 | ) | |||||||||||||||||
| — | — | — | — | — | — | (5,033 | ) | |||||||||||||||||||
| — | 208 | 5,851 | 3,559 | — | 57 | — | ||||||||||||||||||||
| — | — | 407 | 114 | — | — | (19 | ) | |||||||||||||||||||
| — | — | 275 | — | — | — | — | ||||||||||||||||||||
| — | — | (3,019 | ) | (181 | ) | (3,325 | ) | — | — | |||||||||||||||||
| — | — | 1,116 | 342 | — | — | (20 | ) | |||||||||||||||||||
| (26,140 | ) | 7 | (84,935 | ) | (34,209 | ) | (28,408 | ) | (8,432 | ) | 13,129 | |||||||||||||||
| — | — | — | — | — | — | (418 | ) | |||||||||||||||||||
| 1,477 | — | 3,267 | — | — | — | — | ||||||||||||||||||||
| — | (99 | ) | (2 | ) | (513 | ) | — | — | — | |||||||||||||||||
| — | — | (196 | ) | (1 | ) | — | — | (3 | ) | |||||||||||||||||
| — | — | 522 | — | — | — | — | ||||||||||||||||||||
| — | — | 3,472 | 396 | 1,409 | — | — | ||||||||||||||||||||
| — |
| — | 710 | 50 | — | — | (1 | ) | |||||||||||||||||
| $ | 7,836 | $ | 4,050 | $ | (22,522 | ) | $ | (16,139 | ) | $ | 133,348 | $ | (5,591 | ) | $ | 8,919 | ||||||||||
| SEI Institutional Managed Trust / Annual Report / September 30, 2013 | 231 |
Consolidated Statements of Operations/Statements of Operations ($ Thousands)
For the year ended September 30, 2013
| Multi-Asset Accumulation Fund | ||||
Investment Income: | ||||
Dividends | $ | 2,970 | ||
Dividends from Affiliated Investments* | 60 | |||
Interest Income | 4,923 | |||
Less: Foreign Taxes Witheld | (176 | ) | ||
Total Investment Income | 7,777 | |||
Expenses: | ||||
Investment Advisory Fees | 9,006 | |||
Administration Fees | 4,203 | |||
Shareholder Servicing Fees Class (A) | 3,002 | |||
Trustee Fees | 18 | |||
Chief Compliance Officer Fees | 9 | |||
Printing Fees | 77 | |||
Professional Fees | 65 | |||
Custodian/Wire Agent Fees | 58 | |||
Registration Fees | 23 | |||
Interest expense | — | |||
Other Expenses | 17 | |||
Total Expenses | 16,478 | |||
Less: | ||||
Waiver of Investment Advisory Fees | (1,672 | ) | ||
Waiver of Shareholder Servicing Fees Class (A) | (737 | ) | ||
Waiver of Administration Fees | — | |||
Net Expenses | 14,069 | |||
Net Investment Income (Loss) | (6,292 | ) | ||
Net Realized and Unrealized Gain (Loss) on Investments: | ||||
Net Realized Gain (Loss) on: | ||||
Investments | (8,910 | ) | ||
Futures Contracts | 28,438 | |||
Options | — | |||
Swaptions | — | |||
Swap Contracts | (9,657 | ) | ||
Foreign Currency Transactions | (5,950 | ) | ||
Net Change in Unrealized Appreciation (Depreciation) on: | ||||
Investments | 4,204 | |||
Futures Contracts | 10,728 | |||
Options | — | |||
Swaptions | — | |||
Swap Contracts | 38 | |||
Foreign Currency and Translation of Other Assets and Liabilities Denominated in Foreign Currency | (5,468 | ) | ||
Net Increase (Decrease) in Net Assets from Operations | $ | 7,131 | ||
Amounts designated as "—" are $0 or have been rounded to $0.
| * | See Note 3 in Notes to Financial Statements. |
The accompanying notes are an integral part of the financial statements.
| 232 | SEI Institutional Managed Trust / Annual Report / September 30, 2013 |
| Multi-Asset Income Fund | Multi-Asset Inflation Managed Fund | Multi-Asset Capital Stability Fund | ||||||||
| $ | 139 | $ | 5,828 | $ | 191 | |||||
| — | — | — | ||||||||
| 11,379 | 4,788 | 1,572 | ||||||||
| — | (415 | ) | — | |||||||
| 11,518 | 10,201 | 1,763 | ||||||||
| 959 | 3,685 | 1,738 | ||||||||
| 559 | 2,345 | 1,520 | ||||||||
| 400 | 1,675 | 1,086 | ||||||||
| 2 | 10 | 7 | ||||||||
| 1 | 4 | 3 | ||||||||
| 11 | 44 | 28 | ||||||||
| 10 | 36 | 23 | ||||||||
| 8 | 29 | 14 | ||||||||
| 2 | — | — | ||||||||
| 292 | 196 | — | ||||||||
| 1 | 26 | 12 | ||||||||
| 2,245 | 8,050 | 4,431 | ||||||||
| (2 | ) | (784 | ) | — | ||||||
| (399 | ) | (1,023 | ) | (1,086 | ) | |||||
| (272 | ) | — | (645 | ) | ||||||
| 1,572 | 6,243 | 2,700 | ||||||||
| 9,946 | 3,958 | (937 | ) | |||||||
| 2,558 | (6,664 | ) | (6,728 | ) | ||||||
| — | 4,046 | 3,879 | ||||||||
| 176 | (1,324 | ) | (298 | ) | ||||||
| — | — | (72 | ) | |||||||
| 230 | (36,191 | ) | 1,086 | |||||||
| — | 4,341 | 917 | ||||||||
| (3,458 | ) | (6,789 | ) | (2,990 | ) | |||||
| — | (1,300 | ) | 1,252 | |||||||
| 222 | 136 | (473 | ) | |||||||
| — | — | (518 | ) | |||||||
| (125 | ) | (1,536 | ) | (855 | ) | |||||
| — | (2,440 | ) | (281 | ) | ||||||
| $ | 9,549 | $ | (43,763 | ) | $ | (6,018 | ) | |||
| SEI Institutional Managed Trust / Annual Report / September 30, 2013 | 233 |
Statements of Changes in Net Assets ($ Thousands)
For the years ended September 30,
| Large Cap Fund | Large Cap Value Fund | Large Cap Growth Fund | ||||||||||||||||||||||
2013 | 2012 | 2013 | 2012 | 2013 | 2012 | |||||||||||||||||||
Operations: | ||||||||||||||||||||||||
Net Investment Income (Loss) | $ | 16,678 | $ | 14,253 | $ | 19,274 | $ | 20,244 | $ | 3,812 | $ | 2,673 | ||||||||||||
Net Realized Gain (Loss) from Investments and Futures Contracts | 124,795 | 97,479 | 138,297 | 76,899 | 164,559 | 184,995 | ||||||||||||||||||
Net Realized Loss on Foreign Currency Transactions | (18 | ) | (4 | ) | — | — | — | — | ||||||||||||||||
Net Change in Unrealized Appreciation of Investments, Affiliated Investments and Futures Contracts | 216,674 | 322,662 | 134,299 | 243,993 | 67,871 | 171,228 | ||||||||||||||||||
Net Increase in Net Assets from Operations | 358,129 | 434,390 | 291,870 | 341,136 | 236,242 | 358,896 | ||||||||||||||||||
Dividends and Distributions From: | ||||||||||||||||||||||||
Net Investment Income: | ||||||||||||||||||||||||
Class A | (17,476 | ) | (13,802 | ) | (19,919 | ) | (20,439 | ) | (5,289 | ) | (1,505 | ) | ||||||||||||
Class E | — | — | — | — | — | — | ||||||||||||||||||
Class I | — | — | (99 | ) | (100 | ) | (17 | ) | — | |||||||||||||||
Class Y | — | — | — | — | — | — | ||||||||||||||||||
Net Capital Gains: | ||||||||||||||||||||||||
Class A | (76,749 | ) | (111,905 | ) | — | — | — | — | ||||||||||||||||
Total Dividends and Distributions | (94,225 | ) | (125,707 | ) | (20,018 | ) | (20,539 | ) | (5,306 | ) | (1,505 | ) | ||||||||||||
Capital Share Transactions(1): | ||||||||||||||||||||||||
Class A: | ||||||||||||||||||||||||
Proceeds from Shares Issued | 741,781 | 704,194 | 181,708 | 182,466 | 169,212 | 168,146 | ||||||||||||||||||
Reinvestment of Dividends and Distributions | 84,285 | 114,481 | 18,690 | 19,265 | 4,954 | 1,416 | ||||||||||||||||||
Cost of Shares Redeemed | (471,037 | ) | (1,161,041 | ) | (370,082 | ) | (373,280 | ) | (325,201 | ) | (448,713 | ) | ||||||||||||
Increase (Decrease) in Net Assets Derived from Class A Transactions | 355,029 | (342,366 | ) | (169,684 | ) | (171,549 | ) | (151,035 | ) | (279,151 | ) | |||||||||||||
Class E: | ||||||||||||||||||||||||
Proceeds from Shares Issued | — | — | — | — | — | — | ||||||||||||||||||
Reinvestment of Dividends and Distributions | — | — | — | — | — | — | ||||||||||||||||||
Cost of Shares Redeemed | — | — | — | — | — | — | ||||||||||||||||||
Increase (Decrease) in Net Assets Derived from Class E Transactions | — | — | — | — | — | — | ||||||||||||||||||
Class I: | ||||||||||||||||||||||||
Proceeds from Shares Issued | — | — | 2,529 | 1,577 | 1,930 | 2,090 | ||||||||||||||||||
Reinvestment of Dividends and Distributions | — | — | 82 | 84 | 13 | — | ||||||||||||||||||
Cost of Shares Redeemed | — | — | (2,511 | ) | (2,981 | ) | (3,559 | ) | (2,240 | ) | ||||||||||||||
Increase (Decrease) in Net Assets Derived from Class I Transactions | — | — | 100 | (1,320 | ) | (1,616 | ) | (150 | ) | |||||||||||||||
Class Y: | ||||||||||||||||||||||||
Proceeds from Shares Issued | — | — | — | — | — | — | ||||||||||||||||||
Reinvestment of Dividends and Distributions | — | — | — | — | — | — | ||||||||||||||||||
Cost of Shares Redeemed | — | — | — | — | — | — | ||||||||||||||||||
Decrease in Net Assets Derived from Class Y Transactions | — | — | — | — | — | — | ||||||||||||||||||
Increase (Decrease) in Net Assets Derived from Capital Share Transactions | 355,029 | (342,366 | ) | (169,584 | ) | (172,869 | ) | (152,651 | ) | (279,301 | ) | |||||||||||||
Net Increase (Decrease) in Net Assets | 618,933 | (33,683 | ) | 102,268 | 147,728 | 78,285 | 78,090 | |||||||||||||||||
Net Assets: | ||||||||||||||||||||||||
Beginning of Year | 1,488,259 | 1,521,942 | 1,352,073 | 1,204,345 | 1,363,323 | 1,285,233 | ||||||||||||||||||
End of Year | $ | 2,107,192 | $ | 1,488,259 | $ | 1,454,341 | $ | 1,352,073 | $ | 1,441,608 | $ | 1,363,323 | ||||||||||||
Undistributed (Distributions in Excess of) Net Investment Income/(Accumulated Net Investment Loss) Included in Net Assets at Year End | $ | 3,016 | $ | 3,705 | $ | 3,890 | $ | 4,571 | $ | 263 | $ | 1,660 | ||||||||||||
| (1) | See Note 7 in Notes to Financial Statements. |
| (2) | Includes subscriptions as a result of an in-kind transfer of securities (See Note 12). |
Amounts designated as “—” are $0 or have been rounded to $0.
The accompanying notes are an integral part of the financial statements.
| 234 | SEI Institutional Managed Trust / Annual Report / September 30, 2013 |
| Tax-Managed Large Cap Fund | S&P 500 Index Fund | Small Cap Fund | Small Cap Value Fund | Small Cap Growth Fund | ||||||||||||||||||||||||||||||||||
2013 | 2012 | 2013 | 2012 | 2013 | 2012 | 2013 | 2012 | 2013 | 2012 | |||||||||||||||||||||||||||||
| $ | 21,076 | $ | 16,925 | $ | 56,197 | $ | 37,430 | $ | 151 | $ | 200 | $ | 3,240 | $ | 2,679 | $ | (242 | ) | $ | (430 | ) | |||||||||||||||||
| 58,114 |
| (5,136 | ) | 61,747 | 28,195 | 25,170 | 11,427 | 46,272 | 36,139 | 40,877 | 22,731 | |||||||||||||||||||||||||||
| — | (24 | ) | — | — | — | (1 | ) | — | — | — | — | |||||||||||||||||||||||||||
| 347,848 |
| 427,192 |
| 383,534 | 405,151 | 67,253 | 49,228 | 48,641 | 66,102 | 50,644 | 59,395 | |||||||||||||||||||||||||||
| 427,038 | 438,957 | 501,478 | 470,776 | 92,574 | 60,854 | 98,153 | 104,920 | 91,279 | 81,696 | |||||||||||||||||||||||||||||
| (22,238 | ) | (15,517 | ) | (5,744 | ) | (27,545 | ) | (1,304 | ) | (294 | ) | (3,759 | ) | (3,816 | ) | (1,204 | ) | — | ||||||||||||||||||||
| — | — | (50,619 | ) | (4,552 | ) | — | — | — | — | — | — | |||||||||||||||||||||||||||
| — | — | (127 | ) | (113 | ) | — | — | (31 | ) | (29 | ) | (3 | ) | — | ||||||||||||||||||||||||
| (11 | ) | (10 | ) | — | — | — | — | — | — | — | — | |||||||||||||||||||||||||||
| — | — | — | — | (12,456 | ) | (33,642 | ) | — | — | — | — | |||||||||||||||||||||||||||
| (22,249 | ) | (15,527 | ) | (56,490 | ) | (32,210 | ) | (13,760 | ) | (33,936 | ) | (3,790 | ) | (3,845 | ) | (1,207 | ) | — | ||||||||||||||||||||
| 549,378 | 334,928 | 128,355 | 115,870 | 143,753 | 140,655 | 63,958 | 55,183 | 41,621 | 44,093 | |||||||||||||||||||||||||||||
| 20,023 | 14,056 | 5,353 | 4,261 | 11,833 | 30,099 | 3,470 | 3,532 | 1,115 | — | |||||||||||||||||||||||||||||
| (448,897 | ) | (385,106 | ) | (125,075 | ) | (146,918 | ) | (77,671 | ) | (147,530 | ) | (174,668 | ) | (130,832 | ) | (79,892 | ) | (96,286 | ) | |||||||||||||||||||
| 120,504 |
| (36,122 | ) | 8,633 | (26,787 | ) | 77,915 | 23,224 | (107,240 | ) | (72,117 | ) | (37,156 | ) | (52,193 | ) | ||||||||||||||||||||||
| — | — | 359,283 | 1,543,849 | (2) | — | — | — | — | — | — | ||||||||||||||||||||||||||||
| — | — | 49,551 | 26,787 | — | — | — | — | — | — | |||||||||||||||||||||||||||||
| — | — | (1,017,719 | ) | (556,755 | ) | — | — | — | — | — | — | |||||||||||||||||||||||||||
| — |
| — |
| (608,885 | ) | 1,013,881 | — | — | — | — | — | — | ||||||||||||||||||||||||||
| — | — | 2,060 | 2,136 | — | — | 1,786 | 1,449 | 1,255 | 902 | |||||||||||||||||||||||||||||
| — | — | 82 | 76 | — | — | 28 | 26 | 3 | — | |||||||||||||||||||||||||||||
| — | — | (4,262 | ) | (2,898 | ) | — | — | (1,990 | ) | (2,089 | ) | (1,315 | ) | (1,884 | ) | |||||||||||||||||||||||
| — |
| — |
| (2,120 | ) | (686 | ) | — | — | (176 | ) | (614 | ) | (57 | ) | (982 | ) | |||||||||||||||||||||
| 410 | 1 | — | — | — | — | — | — | — | — | |||||||||||||||||||||||||||||
| 11 | 9 | — | — | — | — | — | — | — | — | |||||||||||||||||||||||||||||
| (1,228 | ) | (94 | ) | — | — | — | — | — | — | — | — | |||||||||||||||||||||||||||
| (807 | ) |
| (84 | ) | — | — | — | — | — | — | — | — | ||||||||||||||||||||||||||
| 119,697 |
| (36,206 | ) | (602,372 | ) | 986,408 | 77,915 | 23,224 | (107,416 | ) | (72,731 | ) | (37,213 | ) | (53,175 | ) | ||||||||||||||||||||||
| 524,486 | 387,224 | (157,384 | ) | 1,424,974 | 156,729 | 50,142 | (13,053 | ) | 28,344 | 52,859 | 28,521 | |||||||||||||||||||||||||||
| 1,883,920 | 1,496,696 | 2,883,246 | 1,458,272 | 254,051 | 203,909 | 409,474 | 381,130 | 303,622 | 275,101 | |||||||||||||||||||||||||||||
| $ | 2,408,406 | $ | 1,883,920 | $ | 2,725,862 | $ | 2,883,246 | $ | 410,780 | $ | 254,051 | $ | 396,421 | $ | 409,474 | $ | 356,481 | $ | 303,622 | |||||||||||||||||||
| $ | 3,907 | $ | 4,900 |
| $ | 11,980 | $ | 11,914 | $ | (322 | ) | $ | 235 | $ | 366 | $ | 508 | $ | (1,357 | ) | $ | (213 | ) | |||||||||||||||
| SEI Institutional Managed Trust / Annual Report / September 30, 2013 | 235 |
Statements of Changes in Net Assets ($ Thousands) (Continued)
For the years ended September 30,
| Tax-Managed Small/Mid Cap Fund | ||||||||
2013 | 2012 | |||||||
Operations: | ||||||||
Net Investment Income | $ | 1,177 | $ | 753 | ||||
Net Realized Gain from Investments and Futures Contracts | 30,023 | 14,736 | ||||||
Net Realized Gain (Loss) on Foreign Currency Transactions | 4 | (4 | ) | |||||
Net Change in Unrealized Appreciation of Investments, Affiliated Investments and Futures Contracts | 72,652 | 56,633 | ||||||
Net Change in Unrealized Appreciation (Depreciation) on Foreign Currency and Translation of Other Assets and Liabilities Denominated in Foreign Currency | — | — | ||||||
Net Increase in Net Assets from Operations | 103,856 | 72,118 | ||||||
Dividends and Distributions From: | ||||||||
Net Investment Income: | ||||||||
Class A | (1,558 | ) | (1,060 | ) | ||||
Class I | — | — | ||||||
Net Capital Gains: | ||||||||
Class A | — | — | ||||||
Class I | — | — | ||||||
Total Dividends and Distributions | (1,558 | ) | (1,060 | ) | ||||
Capital Share Transactions(1): | ||||||||
Class A: | ||||||||
Proceeds from Shares Issued | 126,018 | 80,865 | ||||||
Reinvestment of Dividends and Distributions | 1,380 | 945 | ||||||
Cost of Shares Redeemed | (79,819 | ) | (71,826 | ) | ||||
Increase (Decrease) in Net Assets Derived from Class A Transactions | 47,579 | 9,984 | ||||||
Class I: | ||||||||
Proceeds from Shares Issued | — | — | ||||||
Reinvestment of Dividends and Distributions | — | — | ||||||
Cost of Shares Redeemed | — | — | ||||||
Increase (Decrease) in Net Assets Derived from Class I Transactions | — | — | ||||||
Increase (Decrease) in Net Assets Derived from Capital Share Transactions | 47,579 | 9,984 | ||||||
Net Increase in Net Assets | 149,877 | 81,042 | ||||||
Net Assets: | ||||||||
Beginning of Year | 336,339 | 255,297 | ||||||
End of Year | $ | 486,216 | $ | 336,339 | ||||
Undistributed (Distributions in Excess of) Net Investment Income Included in Net Assets at Year End | $ | (25 | ) | $ | 237 | |||
| (1) | See Note 7 in Notes to Financial Statements. |
Amounts designated as “—” are $0 or have been rounded to $0.
The accompanying notes are an integral part of the financial statements.
| 236 | SEI Institutional Managed Trust / Annual Report / September 30, 2013 |
| Mid-Cap Fund | U.S. Managed Volatility Fund | Global Managed Volatility Fund | ||||||||||||||||||||
2013 | 2012 | 2013 | 2012 | 2013 | 2012 | |||||||||||||||||
| $ | 516 | $ | 444 | $ | 13,338 | $ | 10,184 | $ | 26,141 | $ | 15,155 | |||||||||||
| 16,955 | 580 | 49,275 | 48,443 | 73,565 | 26,141 | |||||||||||||||||
| — | — | (87 | ) | (45 | ) | 51,379 | (9,022 | ) | ||||||||||||||
| 7,502 | 19,249 | 62,938 | 59,672 | 30,606 | 66,044 | |||||||||||||||||
| — | — | (4 | ) | 42 | (5,418 | ) | (2,695 | ) | ||||||||||||||
| 24,973 | 20,273 | 125,460 | 118,296 | 176,273 | 95,623 | |||||||||||||||||
| (621 | ) | (464 | ) | (13,076 | ) | (8,978 | ) | (26,158 | ) | — | ||||||||||||
| (5 | ) | (4 | ) | (11 | ) | (10 | ) | (6 | ) | — | ||||||||||||
| — | — | (5,613 | ) | — | — | — | ||||||||||||||||
| — | — | (5 | ) | — | — | — | ||||||||||||||||
| (626 | ) | (468 | ) | (18,705 | ) | (8,988 | ) | (26,164 | ) | — | ||||||||||||
| 65,909 | 40,346 | 325,032 | 364,739 | 684,976 | 512,151 | |||||||||||||||||
| 423 | 317 | 16,039 | 7,888 | 23,967 | — | |||||||||||||||||
| (67,988 | ) | (49,263 | ) | (231,892 | ) | (298,985 | ) | (387,846 | ) | (202,261 | ) | |||||||||||
| (1,656 | ) | (8,600 | ) | 109,179 | 73,642 | 321,097 | 309,890 | |||||||||||||||
| 860 | 548 | 741 | 2,347 | 728 | 423 | |||||||||||||||||
| 5 | 4 | 16 | 10 | 6 | — | |||||||||||||||||
| (718 | ) | (690 | ) | (349 | ) | (1,841 | ) | (131 | ) | (142 | ) | |||||||||||
| 147 | (138 | ) | 408 | 516 | 603 | 281 | ||||||||||||||||
| (1,509 | ) | (8,738 | ) | 109,587 | 74,158 | 321,700 | 310,171 | |||||||||||||||
| 22,838 | 11,067 | 216,342 | 183,466 | 471,809 | 405,794 | |||||||||||||||||
| 86,207 | 75,140 | 636,007 | 452,541 | 928,461 | 522,667 | |||||||||||||||||
| $ | 109,045 | $ | 86,207 | $ | 852,349 | $ | 636,007 | $ | 1,400,270 | $ | 928,461 | |||||||||||
| $ | 38 | $ | 117 | $ | 3,414 | $ | 3,007 | $ | 54,890 | $ | 711 | |||||||||||
| SEI Institutional Managed Trust / Annual Report / September 30, 2013 | 237 |
Statements of Changes in Net Assets ($ Thousands) (Continued)
For the years ended September 30,
| Tax-Managed Managed Volatility Fund | Real Estate Fund | Enhanced Income Fund | ||||||||||||||||||||||
2013 | 2012 | 2013 | 2012 | 2013 | 2012 | |||||||||||||||||||
Operations: | ||||||||||||||||||||||||
Net Investment Income | $ | 9,831 | $ | 6,214 | $ | 1,930 | $ | 1,014 | $ | 3,698 | $ | 3,741 | ||||||||||||
Net Realized Gain (Loss) from Investments, Securities Sold Short Affiliated Investments, Futures Contracts, Options, Swaptions and Swap Contracts | 25,421 | 11,912 | 30,569 | | 7,484 | | 444 | (170 | ) | |||||||||||||||
Net Realized Gain (Loss) on Foreign Currency Transactions | (48 | ) | (19 | ) | — | — | — | — | ||||||||||||||||
Net Change in Unrealized Appreciation (Depreciation) of Investments, Securities Sold Short, Affiliated Investments, Futures Contracts, Options, Swaptions and Swap Contracts | 52,671 | 49,655 | (24,663 | ) | 35,170 | (92 | ) | | 4,526 | | ||||||||||||||
Net Change in Unrealized Appreciation (Depreciation) on Foreign Currency and Translation of Other Assets and Liabilities Denominated in Foreign Currency | 1 | 18 | — | — | — | | — | | ||||||||||||||||
Net Increase in Net Assets from Operations | 87,876 | 67,780 | 7,836 | 43,668 | 4,050 | 8,097 | ||||||||||||||||||
Dividends and Distributions From: | ||||||||||||||||||||||||
Net Investment Income: | ||||||||||||||||||||||||
Class A | (9,506 | ) | (5,344 | ) | (2,449 | ) | (1,530 | ) | (3,329 | ) | (3,713 | ) | ||||||||||||
Class I | — | — | (6 | ) | (3 | ) | (5 | ) | (1 | ) | ||||||||||||||
Net Capital Gains: | ||||||||||||||||||||||||
Class A | (13,481 | ) | (11,698 | ) | — | — | — | — | ||||||||||||||||
Class I | — | — | — | — | — | — | ||||||||||||||||||
Total Dividends and Distributions | (22,987 | ) | (17,042 | ) | (2,455 | ) | (1,533 | ) | (3,334 | ) | (3,714 | ) | ||||||||||||
Capital Share Transactions(1): | ||||||||||||||||||||||||
Class A: | ||||||||||||||||||||||||
Proceeds from Shares Issued | 233,883 | 170,479 | 98,442 | 96,716 | 116,708 | 76,570 | ||||||||||||||||||
Reinvestment of Dividends and Distributions | 19,553 | 14,346 | 2,327 | 1,455 | 2,983 | 3,353 | ||||||||||||||||||
Cost of Shares Redeemed | (138,869 | ) | (72,897 | ) | (89,751 | ) | (91,256 | ) | (86,622 | ) | (82,204 | ) | ||||||||||||
Increase (Decrease) in Net Assets Derived from Class A | 114,567 | 111,928 | 11,018 | | 6,915 | | 33,069 | (2,281 | ) | |||||||||||||||
Class I: | ||||||||||||||||||||||||
Proceeds from Shares Issued | — | — | 463 | 358 | 477 | 50 | ||||||||||||||||||
Reinvestment of Dividends and Distributions | — | — | 6 | 3 | 5 | 1 | ||||||||||||||||||
Cost of Shares Redeemed | — | — | (517 | ) | (304 | ) | (184 | ) | (2 | ) | ||||||||||||||
Increase (Decrease) in Net Assets Derived from Class I | — | — | (48 | ) | 57 | 298 | | 49 | | |||||||||||||||
Increase (Decrease) in Net Assets Derived from Capital Share Transactions | 114,567 | 111,928 | 10,970 | | 6,972 | | 33,367 | (2,232 | ) | |||||||||||||||
Net Increase (Decrease) in Net Assets | 179,456 | 162,666 | 16,351 | 49,107 | 34,083 | 2,151 | ||||||||||||||||||
Net Assets: | ||||||||||||||||||||||||
Beginning of Year | 442,074 | 279,408 | 192,090 | 142,983 | 161,106 | 158,955 | ||||||||||||||||||
End of Year | $ | 621,530 | $ | 442,074 | $ | 208,441 | $ | 192,090 | $ | 195,189 | $ | 161,106 | ||||||||||||
Undistributed (Distributions in Excess of) Net Investment | $ | 2,358 | $ | 1,939 | $ | 1,753 | $ | 2,258 | $ | 1,110 | $ | 773 |
| |||||||||||
| (1) | See Note 7 in Notes to Financial Statements. |
Amounts designated as “—” are $0 or have been rounded to $0.
The accompanying notes are an integral part of the financial statements.
| 238 | SEI Institutional Managed Trust / Annual Report / September 30, 2013 |
| Core Fixed Income Fund | U.S. Fixed Income Fund | High Yield Bond Fund | Real Return Fund | Multi-Strategy Alternative Fund | ||||||||||||||||||||||||||||||||||
2013 | 2012 | 2013 | 2012 | 2013 | 2012 | 2013 | 2012 | 2013 | 2012 | |||||||||||||||||||||||||||||
| $ | 54,511 | $ | 63,021 | $ | 18,005 | $ | 21,882 | $ | 116,001 | $ | 121,432 | $ | 1,456 | $ | 1,686 | $ | 2,715 | $ | 2,121 | |||||||||||||||||||
| (987 | ) | | 39,479 | | (209 | ) | 34,207 | 44,346 | 21,132 | 1,385 | 7,613 | (6,483 | ) | (314 | ) | |||||||||||||||||||||||
| 1,116 | 2,704 | 342 | (2 | ) | — | — | — | — | (20 | ) | (3 | ) | ||||||||||||||||||||||||||
| (77,872 | ) | | 75,324 | | (34,327 | ) | 3,296 | (26,999 | ) | 130,328 | (8,432 | ) | 481 | 12,708 | 5,537 | |||||||||||||||||||||||
| 710 | (1,996 | ) | 50 | (50 | ) | — | — | — | — | (1 | ) | — | ||||||||||||||||||||||||||
| (22,522 | ) | 178,532 | (16,139 | ) | 59,333 | 133,348 | 272,892 | (5,591 | ) | 9,780 | 8,919 | 7,341 | ||||||||||||||||||||||||||
| (57,910 | ) | (67,158 | ) | (19,701 | ) | (23,830 | ) | (112,376 | ) | (115,755 | ) | (1,678 | ) | (4,468 | ) | (1,930 | ) | (5,784 | ) | |||||||||||||||||||
| (419 | ) | (444 | ) | — | — | (316 | ) | (652 | ) | — | — | — | — | |||||||||||||||||||||||||
| — | (16,527 | ) | (26,951 | ) | (26,190 | ) | — | (7,404 | ) | (6,613 | ) | (2,417 | ) | — | — | |||||||||||||||||||||||
| — | (114 | ) | — | — | — | (5 | ) | — | — | — | — | |||||||||||||||||||||||||||
| (58,329 | ) | (84,243 | ) | (46,652 | ) | (50,020 | ) | (112,692 | ) | (123,816 | ) | (8,291 | ) | (6,885 | ) | (1,930 | ) | (5,784 | ) | |||||||||||||||||||
| 424,683 | 524,263 | 410,499 | 551,984 | 1,159,582 | 1,212,958 | 133,450 | 161,434 | 175,525 | 154,901 | |||||||||||||||||||||||||||||
| 51,889 | 76,137 | 40,293 | 43,982 | 92,794 | 101,964 | 7,341 | 6,174 | 1,769 | 5,319 | |||||||||||||||||||||||||||||
| (664,520 | ) | (706,361 | ) | (264,218 | ) | (679,278 | ) | (1,036,189 | ) | (1,027,123 | ) | (101,734 | ) | (260,417 | ) | (92,464 | ) | (118,869 | ) | |||||||||||||||||||
| (187,948 | ) | (105,961 | ) | 186,574 | (83,312 | ) | 216,187 | 287,799 | 39,057 | (92,809 | ) | 84,830 | 41,351 | |||||||||||||||||||||||||
| 7,629 | 3,914 | — | — | 39,083 | 34,303 | — | — | — | — | |||||||||||||||||||||||||||||
| 326 | 415 | — | — | 271 | 557 | — | — | — | — | |||||||||||||||||||||||||||||
| (8,143 | ) | (5,755 | ) | — | — | (14,511 | ) | (22,290 | ) | — | — | — | — | |||||||||||||||||||||||||
| (188 | ) | (1,426 | ) | — | — | 24,843 | 12,570 | — | — | — | — | |||||||||||||||||||||||||||
| (188,136 | ) | (107,387 | ) | 186,574 | (83,312 | ) | 241,030 | 300,369 | 39,057 | (92,809 | ) | 84,830 | 41,351 | |||||||||||||||||||||||||
| (268,987 | ) | (13,098 | ) | 123,783 | (73,999 | ) | 261,686 | 449,445 | 25,175 | (89,914 | ) | 91,819 | 42,908 | |||||||||||||||||||||||||
| 2,187,738 | 2,200,836 | 898,450 | 972,449 | 1,766,518 | 1,317,073 | 283,646 | 373,560 | 334,914 | 292,006 | |||||||||||||||||||||||||||||
| $ | 1,918,751 | $ | 2,187,738 | $ | 1,022,233 | $ | 898,450 | $ | 2,028,204 | $ | 1,766,518 | $ | 308,821 | $ | 283,646 | $ | 426,733 | $ | 334,914 | |||||||||||||||||||
| $ | (3,792 | ) | $ | (3,474 | ) | $ | 108 | $ | 166 | $ | 9,349 | $ | 848 | $ | (170 | ) | $ | (6 | ) | $ | 1,734 | $ | 174 | |||||||||||||||
| SEI Institutional Managed Trust / Annual Report / September 30, 2013 | 239 |
Consolidated Statements of Changes in Net Assets/Statements of Changes in Net Assets ($ Thousands) (Concluded)
For the years or periods ended September 30,
| Multi-Asset Accumulation Fund (2) | ||||||||
2013 | 04/09/12 to | |||||||
Operations: | ||||||||
Net Investment Income (Loss) | $ | (6,292 | ) | $ | (1,823 | ) | ||
Net Realized Gain (Loss) from Investments, Futures Contracts, Written Options and Swap Contracts | 9,871 | 35,177 | ||||||
Net Realized Gain (Loss) on Foreign Currency Transactions | (5,950 | ) | 1,591 | |||||
Net Change in Unrealized Appreciation (Depreciation) of Investments, Futures Contracts, Written Options, Written Swaptions and Swap Contracts | 14,970 | 10,714 | ||||||
Net Change in Unrealized Appreciation (Depreciation) on Foreign Currency and Translation of Other Assets and Liabilities Denominated in Foreign Currency | (5,468 | ) | 1,217 | |||||
Net Increase (Decrease) in Net Assets from Operations | 7,131 | 46,876 | ||||||
Dividends and Distributions From: | ||||||||
Net Investment Income: | ||||||||
Class A | (641 | ) | (3,211 | ) | ||||
Net Capital Gains: | ||||||||
Class A | (31,438 | ) | — | |||||
Return of Capital: | ||||||||
Class A | — | — | ||||||
Total Dividends and Distributions | (32,079 | ) | (3,211 | ) | ||||
Capital Share Transactions(1): | ||||||||
Class A: | ||||||||
Proceeds from Shares Issued | 682,870 | 1,020,724 | ||||||
Reinvestment of Dividends and Distributions | 29,368 | 3,012 | ||||||
Cost of Shares Redeemed | (232,454 | ) | (107,674 | ) | ||||
Increase in Net Assets Derived from Class A Transactions | 479,784 | 916,062 | ||||||
Increase in Net Assets Derived from Capital Share Transactions | 479,784 | 916,062 | ||||||
Net Increase in Net Assets | 454,836 | 959,727 | ||||||
Net Assets: | ||||||||
Beginning of Year/Period | 959,727 | — | ||||||
End of Year/Period | $ | 1,414,563 | $ | 959,727 | ||||
Undistributed (Distributions in Excess of) Net Investment | $ | 2,389 | $ | (2,465 | ) | |||
| (1) | See Note 7 in Notes to Financial Statements. |
| (2) | Commenced operations on April 9, 2012. |
Amounts designated as “—” are $0 or have been rounded to $0.
The accompanying notes are an integral part of the financial statements.
| 240 | SEI Institutional Managed Trust / Annual Report / September 30, 2013 |
| Multi-Asset Income Fund (2) | Multi-Asset Inflation Managed Fund (2) | Multi-Asset Capital Stability Fund (2) | ||||||||||||||||||||
2013 | 04/09/12 to 09/30/12 | 2013 | 04/09/12 to | 2013 | 04/09/12 to | |||||||||||||||||
| $ | 9,946 | $ | 1,486 | $ | 3,958 | $ | 1,042 | $ | (937 | ) | $ | (419 | ) | |||||||||
| 2,964 | 274 | (40,133 | ) | 301 | (2,133 | ) | 2,963 | |||||||||||||||
| — | — | 4,341 | (124 | ) | 917 | (1,561 | ) | |||||||||||||||
| (3,361 | ) | | 2,056 | | (9,489 | ) | 7,538 | (3,584 | ) | 2,719 | ||||||||||||
| — | | — | | (2,440 | ) | (600 | ) | (281 | ) | 469 | ||||||||||||
| 9,549 | 3,816 | (43,763 | ) | 8,157 | (6,018 | ) | 4,171 | |||||||||||||||
| (7,937 | ) | (1,276 | ) | (2,639 | ) | (601 | ) | (315 | ) | (6 | ) | |||||||||||
| (782 | ) | — | (372 | ) | — | (2,654 | ) | — | ||||||||||||||
| — | — | — | (1,875 | ) | — | — | ||||||||||||||||
| (8,719 | ) | (1,276 | ) | (3,011 | ) | (2,476 | ) | (2,969 | ) | (6 | ) | |||||||||||
| 223,521 | 90,729 | 405,369 | 579,104 | 271,527 | 377,782 | |||||||||||||||||
| 6,814 | 1,118 | 2,701 | 2,311 | 2,552 | 5 | |||||||||||||||||
| (85,308 | ) | (9,888 | ) | (135,183 | ) | (46,841 | ) | (126,027 | ) | (34,091 | ) | |||||||||||
| 145,027 | 81,959 | 272,887 | 534,574 | 148,052 | 343,696 | |||||||||||||||||
| 145,027 | 81,959 | 272,887 | 534,574 | 148,052 | 343,696 | |||||||||||||||||
| 145,857 | 84,499 | 226,113 | 540,255 | 139,065 | 347,861 | |||||||||||||||||
| 84,499 | — | 540,255 | — | 347,861 | — | |||||||||||||||||
| $ | 230,356 | $ | 84,499 | $ | 766,368 | $ | 540,255 | $ | 486,926 | $ | 347,861 | |||||||||||
| $ | 1,117 | $ | 40 | | $ | (15,131 | ) | $ | (4,415 | ) | $ | (248 | ) | $ | (1,774 | ) | ||||||
| SEI Institutional Managed Trust / Annual Report / September 30, 2013 | 241 |
Statement of Cash Flows/Consolidated Statement of Cash Flows ($ Thousands)
For the year ended September 30, 2013
| Multi-Asset Income Fund | Multi-Asset Inflation Managed Fund | |||||||
Cash Flows from Operating Activities: | ||||||||
Net Increase (Decrease) in Net Assets from Operations | $ | 9,549 | $ | (43,763 | ) | |||
Adjustments to Reconcile Net Increase (Decrease) in Net Assets Resulting from Operations to Net Cash Used in Operating Activities: | ||||||||
Purchase of Investment Securities | (257,747 | ) | (1,021,132 | ) | ||||
Proceeds from Disposition of Investment Securities | 112,296 | 697,551 | ||||||
Purchased Options/Purchases to Cover Written Options | (3,052 | ) | (2,858 | ) | ||||
Proceeds from Sale of Options/Expired Options | 2,967 | 1,907 | ||||||
Amortization (Accretion) of Market Discount | (1,087 | ) | 5,255 | |||||
Net Realized (Gain) Loss on: | ||||||||
Investments | (2,558 | ) | 6,664 | |||||
Options | (176 | ) | 1,324 | |||||
Net Change in Unrealized (Appreciation) Depreciation on: | ||||||||
Investments | 3,458 | 6,789 | ||||||
Options | (222 | ) | (136 | ) | ||||
Changes in Assets: | ||||||||
Foreign currency, at value | — | 515 | ||||||
Cash collateral on futures | — | (1,331 | ) | |||||
Cash collateral on reverse repos | (559 | ) | — | |||||
Cash collateral on swaps | (181 | ) | — | |||||
Receivable for investment securities sold | (3,895 | ) | 294 | |||||
Dividends and interest receivable | (1,315 | ) | (933 | ) | ||||
Receivable for variation margin | (6 | ) | 166 | |||||
Swap contracts, at value | — | (144 | ) | |||||
Foreign tax reclaim receivable | — | (47 | ) | |||||
Unrealized loss on forward foreign currency contracts | — | 205 | ||||||
Unrealized gain on foreign spot currency contracts | — | (2 | ) | |||||
Prepaid expenses | (1 | ) | (4 | ) | ||||
Changes in Liabilities: | ||||||||
Payable for investment securities purchased | 8,505 | (6,333 | ) | |||||
Payable for variation margin | 94 | 211 | ||||||
Payable to custodian | 484 | 10 | ||||||
Administration fees payable | 8 | 68 | ||||||
Investment advisory fees payable | 69 | 66 | ||||||
Shareholder servicing fees payable Class (A) | — | 49 | ||||||
Swap contracts, at value | — | 1,569 | ||||||
Reverse repurchase agreements | (15,018 | ) | 59,427 | |||||
Unrealized gain on forward foreign currency contracts | — | 2,254 | ||||||
Unrealized loss on foreign spot currency contracts | — | (1 | ) | |||||
Accrued expense payable | (13 | ) | 9 | |||||
Net Cash Used in Operating Activities | (148,400 | ) | (292,351 | ) | ||||
Cash Flows from Financing Activities: | ||||||||
Dividends and Distributions | (8,719 | ) | (3,011 | ) | ||||
Proceeds from Shares Issued | 223,442 | 405,630 | ||||||
Reinvestment of Dividends and Distributions | 6,904 | 2,701 | ||||||
Cost of Shares Redeemed | (85,113 | ) | (134,676 | ) | ||||
Net Cash Provided by Financing Activities | 136,514 | 270,644 | ||||||
Net Change in Cash | (11,886 | ) | (21,707 | ) | ||||
Cash at beginning of year | 12,320 | 21,870 | ||||||
Cash at end of year | $ | 434 | $ | 163 | ||||
Supplemental Disclosure of Cash Flow Information: | ||||||||
Interest Paid | $ | 292 | $ | 196 | ||||
| Amounts | designated as “—” are $0 or have been rounded to $0. |
The accompanying notes are an integral part of the financial statements.
| 242 | SEI Institutional Managed Trust / Annual Report / September 30, 2013 |
For years or periods ended September 30, (unless otherwise indicated)
For a Share Outstanding Throughout the Periods
| Net Asset Value, Beginning of Period | Net Investment Income (1) | Net Realized and Unrealized Gains (Losses) on Securities(1) | Total from Operations | Dividends from Net Investment Income | Distributions from Realized Capital Gains | Total Dividends and Distributions | Net Asset Value, End of Period | Total Return† | Net Assets End of Period ($Thousands) | Ratio of Expenses to Average Net Assets | Ratio of Expenses to Average Net Assets (Excluding Fees Paid Indirectly) | Ratio of Expenses to Average Net Assets (Excluding Fees Paid Indirectly and Waivers) | Ratio of Net Investment Income (Loss) to Average Net Assets | Portfolio Turnover Rate† | ||||||||||||||||||||||||||||||||||||||||||||||
Large Cap Fund |
| |||||||||||||||||||||||||||||||||||||||||||||||||||||||||||
Class A | ||||||||||||||||||||||||||||||||||||||||||||||||||||||||||||
2013 | $ | 12.15 | $ | 0.12 | $ | 2.43 | $ | 2.55 | $ | (0.13 | ) | $ | (0.62 | ) | $ | (0.75 | ) | $ | 13.95 | 22.23 | % | $ | 2,107,192 | 0.89 | % | 0.89 | % | 1.01 | % | 0.94 | % | 49 | % | |||||||||||||||||||||||||||
2012 | 10.15 | 0.10 | 2.72 | 2.82 | (0.09 | ) | (0.73 | ) | (0.82 | ) | 12.15 | 29.04 | 1,488,259 | 0.89 | 0.89 | 1.02 | 0.89 | 50 | ||||||||||||||||||||||||||||||||||||||||||
2011 | 10.77 | 0.08 | (0.22 | ) | (0.14 | ) | (0.08 | ) | (0.40 | ) | (0.48 | ) | 10.15 | (1.71 | ) | 1,521,942 | 0.89 | 0.89 | 1.02 | 0.70 | 100 | |||||||||||||||||||||||||||||||||||||||
2010(9) | 10.00 | 0.10 | 0.80 | 0.90 | (0.08 | ) | (0.05 | ) | (0.13 | ) | 10.77 | 9.00 | 1,395,899 | 0.89 | 0.89 | 1.02 | 0.96 | 90 | ||||||||||||||||||||||||||||||||||||||||||
Large Cap Value Fund |
| |||||||||||||||||||||||||||||||||||||||||||||||||||||||||||
Class A | ||||||||||||||||||||||||||||||||||||||||||||||||||||||||||||
2013 | $ | 18.02 | $ | 0.28 | $ | 3.92 | $ | 4.20 | $ | (0.28 | ) | $ | — | $ | (0.28 | ) | $ | 21.94 | 23.55 | % | $ | 1,444,929 | 0.89 | % | 0.89 | % | 0.97 | % | 1.39 | % | 55 | % | ||||||||||||||||||||||||||||
2012 | 14.13 | 0.25 | 3.89 | 4.14 | (0.25 | ) | — | (0.25 | ) | 18.02 | 29.54 | 1,344,405 | 0.89 | 0.89 | 0.98 | 1.51 | 37 | |||||||||||||||||||||||||||||||||||||||||||
2011 | 14.75 | 0.22 | (0.61 | ) | (0.39 | ) | (0.23 | ) | — | (0.23 | ) | 14.13 | (2.89 | ) | 1,197,272 | 0.89 | 0.89 | 0.98 | 1.35 | 63 | ||||||||||||||||||||||||||||||||||||||||
2010 | 13.83 | 0.21 | 0.94 | 1.15 | (0.23 | ) | — | (0.23 | ) | 14.75 | 8.43 | 1,504,082 | 0.89 | 0.89 | 0.98 | 1.48 | 64 | |||||||||||||||||||||||||||||||||||||||||||
2009 | 15.79 | 0.30 | (1.92 | ) | (1.62 | ) | (0.34 | ) | — | (0.34 | ) | 13.83 | (9.88 | ) | 1,843,530 | 0.89 | 0.90 | 0.99 | 2.51 | 69 | ||||||||||||||||||||||||||||||||||||||||
Class I | ||||||||||||||||||||||||||||||||||||||||||||||||||||||||||||
2013 | $ | 18.02 | $ | 0.23 | $ | 3.95 | $ | 4.18 | $ | (0.24 | ) | $ | — | $ | (0.24 | ) | $ | 21.96 | 23.35 | % | $ | 9,412 | 1.11 | % | 1.11 | % | 1.22 | % | 1.16 | % | 55 | % | ||||||||||||||||||||||||||||
2012 | 14.13 | 0.21 | 3.89 | 4.10 | (0.21 | ) | — | (0.21 | ) | 18.02 | 29.20 | 7,668 | 1.11 | 1.11 | 1.23 | 1.28 | 37 | |||||||||||||||||||||||||||||||||||||||||||
2011 | 14.76 | 0.18 | (0.62 | ) | (0.44 | ) | (0.19 | ) | — | (0.19 | ) | 14.13 | (3.14 | ) | 7,073 | 1.11 | 1.11 | 1.23 | 1.13 | 63 | ||||||||||||||||||||||||||||||||||||||||
2010 | 13.83 | 0.18 | 0.95 | 1.13 | (0.20 | ) | — | (0.20 | ) | 14.76 | 8.23 | 10,358 | 1.11 | 1.11 | 1.24 | 1.25 | 64 | |||||||||||||||||||||||||||||||||||||||||||
2009 | 15.78 | 0.26 | (1.90 | ) | (1.64 | ) | (0.31 | ) | — | (0.31 | ) | 13.83 | (10.05 | ) | 11,433 | 1.11 | 1.12 | 1.24 | 2.19 | 69 | ||||||||||||||||||||||||||||||||||||||||
Large Cap Growth Fund |
| |||||||||||||||||||||||||||||||||||||||||||||||||||||||||||
Class A | ||||||||||||||||||||||||||||||||||||||||||||||||||||||||||||
2013 | $ | 25.57 | $ | 0.08 | $ | 4.73 | $ | 4.81 | $ | (0.10 | ) | $ | — | $ | (0.10 | ) | $ | 30.28 | 18.89 | % | $ | 1,433,284 | 0.89 | % | 0.89 | % | 1.02 | % | 0.28 | % | 69 | % | ||||||||||||||||||||||||||||
2012 | 19.77 | 0.05 | 5.78 | 5.83 | (0.03 | ) | — | (0.03 | ) | 25.57 | 29.47 | 1,354,774 | 0.89 | 0.90 | 1.03 | 0.19 | 88 | |||||||||||||||||||||||||||||||||||||||||||
2011 | 19.66 | 0.06 | 0.14 | 0.20 | (0.09 | ) | — | (0.09 | ) | 19.77 | 0.97 | 1,278,538 | 0.89 | 0.89 | 1.03 | 0.27 | 108 | |||||||||||||||||||||||||||||||||||||||||||
2010 | 17.62 | 0.12 | 2.04 | 2.16 | (0.12 | ) | — | (0.12 | ) | 19.66 | 12.29 | 1,602,130 | 0.89 | 0.89 | 1.03 | 0.63 | 83 | |||||||||||||||||||||||||||||||||||||||||||
2009 | 18.39 | 0.11 | (0.77 | ) | (0.66 | ) | (0.11 | ) | — | (0.11 | ) | 17.62 | (3.47 | ) | 2,034,096 | 0.89 | 0.90 | 1.04 | 0.74 | 96 | ||||||||||||||||||||||||||||||||||||||||
Class I | ||||||||||||||||||||||||||||||||||||||||||||||||||||||||||||
2013 | $ | 25.28 | $ | 0.02 | $ | 4.68 | $ | 4.70 | $ | (0.05 | ) | $ | — | $ | (0.05 | ) | $ | 29.93 | 18.62 | % | $ | 8,324 | 1.11 | % | 1.11 | % | 1.27 | % | 0.06 | % | 69 | % | ||||||||||||||||||||||||||||
2012 | 19.57 | — | * | 5.71 | 5.71 | — | — | — | 25.28 | 29.18 | % | 8,549 | 1.11 | 1.12 | 1.28 | (0.02 | ) | 88 | ||||||||||||||||||||||||||||||||||||||||||
2011 | 19.47 | 0.01 | 0.14 | 0.15 | (0.05 | ) | — | (0.05 | ) | 19.57 | 0.73 | 6,695 | 1.11 | 1.11 | 1.28 | 0.05 | 108 | |||||||||||||||||||||||||||||||||||||||||||
2010 | 17.44 | 0.08 | 2.02 | 2.10 | (0.07 | ) | — | (0.07 | ) | 19.47 | 12.06 | 7,953 | 1.11 | 1.11 | 1.28 | 0.41 | 83 | |||||||||||||||||||||||||||||||||||||||||||
2009 | 18.20 | 0.07 | (0.76 | ) | (0.69 | ) | (0.07 | ) | — | (0.07 | ) | 17.44 | (3.69 | ) | 9,153 | 1.11 | 1.12 | 1.29 | 0.51 | 96 | ||||||||||||||||||||||||||||||||||||||||
Tax-Managed Large Cap Fund |
| |||||||||||||||||||||||||||||||||||||||||||||||||||||||||||
Class A | ||||||||||||||||||||||||||||||||||||||||||||||||||||||||||||
2013 | $ | 13.88 | $ | 0.15 | $ | 2.94 | $ | 3.09 | $ | (0.16 | ) | $ | — | $ | (0.16 | ) | $ | 16.81 | 22.47 | % | $ | 2,407,951 | 0.89 | % | 0.89 | % | 1.02 | % | 1.00 | % | 42 | % | ||||||||||||||||||||||||||||
2012 | 10.80 | 0.12 | 3.07 | 3.19 | (0.11 | ) | — | (0.11 | ) | 13.88 | 29.70 | 1,882,834 | 0.89 | 0.89 | 1.03 | 0.96 | 53 | |||||||||||||||||||||||||||||||||||||||||||
2011 | 11.02 | 0.10 | (0.22 | ) | (0.12 | ) | (0.10 | ) | — | (0.10 | ) | 10.80 | (1.20 | ) | 1,495,783 | 0.89 | 0.89 | 1.03 | 0.78 | 72 | ||||||||||||||||||||||||||||||||||||||||
2010 | 10.19 | 0.10 | 0.84 | 0.94 | (0.11 | ) | — | (0.11 | ) | 11.02 | 9.26 | 1,534,797 | 0.89 | 0.89 | 1.04 | 0.95 | 58 | |||||||||||||||||||||||||||||||||||||||||||
2009 | 11.08 | 0.13 | (0.87 | ) | (0.74 | ) | (0.15 | ) | — | (0.15 | ) | 10.19 | (6.44 | ) | 1,596,020 | 0.89 | 0.90 | 1.04 | 1.54 | 67 | ||||||||||||||||||||||||||||||||||||||||
Class Y | ||||||||||||||||||||||||||||||||||||||||||||||||||||||||||||
2013 | $ | 14.26 | $ | 0.22 | $ | 3.00 | $ | 3.22 | $ | (0.17 | ) | $ | — | $ | (0.17 | ) | $ | 17.31 | 22.80 | % | $ | 455 | 0.56 | % | 0.56 | % | 0.72 | % | 1.42 | % | 42 | % | ||||||||||||||||||||||||||||
2012 | 11.07 | 0.17 | 3.14 | 3.31 | (0.12 | ) | — | (0.12 | ) | 14.26 | 30.03 | 1,086 | 0.56 | 0.56 | 0.73 | 1.29 | 53 | |||||||||||||||||||||||||||||||||||||||||||
2011 | 11.24 | 0.14 | (0.21 | ) | (0.07 | ) | (0.10 | ) | — | (0.10 | ) | 11.07 | (0.68 | ) | 913 | 0.56 | 0.56 | 0.73 | 1.14 | 72 | ||||||||||||||||||||||||||||||||||||||||
2010 | 10.37 | 0.01 | 0.97 | 0.98 | (0.11 | ) | — | (0.11 | ) | 11.24 | 9.54 | 2,980 | 0.56 | 0.56 | 0.74 | 1.28 | 58 | |||||||||||||||||||||||||||||||||||||||||||
2009 | 11.24 | 0.16 | (0.88 | ) | (0.72 | ) | (0.15 | ) | — | (0.15 | ) | 10.37 | (6.12 | ) | 3,094 | 0.56 | 0.57 | 0.74 | 1.85 | 67 | ||||||||||||||||||||||||||||||||||||||||
S&P 500 Index Fund |
| |||||||||||||||||||||||||||||||||||||||||||||||||||||||||||
Class A |
| |||||||||||||||||||||||||||||||||||||||||||||||||||||||||||
2013 | $ | 39.60 | $ | 0.76 | $ | 6.61 | $ | 7.37 | $ | (0.77 | ) | $ | — | $ | (0.77 | ) | $ | 46.20 | 18.87 | % | $ | 352,589 | 0.43 | % | 0.43 | % | 0.54 | % | 1.78 | % | 6 | % | ||||||||||||||||||||||||||||
2012 | 31.03 | 0.64 | 8.51 | 9.15 | (0.58 | ) | — | (0.58 | ) | 39.60 | 29.74 | 294,234 | 0.43 | 0.43 | 0.54 | 1.76 | 18 | |||||||||||||||||||||||||||||||||||||||||||
2011 | 31.30 | 0.55 | (0.26 | )(5) | 0.29 | (0.56 | ) | — | (0.56 | ) | 31.03 | 0.75 | 255,345 | 0.43 | 0.43 | 0.53 | 1.61 | 61 | ||||||||||||||||||||||||||||||||||||||||||
2010 | 29.01 | 0.56 | 2.29 | 2.85 | (0.56 | ) | — | (0.56 | ) | 31.30 | 9.93 | 325,796 | 0.43 | 0.43 | 0.54 | 1.85 | 20 | |||||||||||||||||||||||||||||||||||||||||||
2009 | 32.43 | 0.57 | (3.12 | ) | (2.55 | ) | (0.61 | ) | (0.26 | ) | (0.87 | ) | 29.01 | (7.33 | ) | 451,069 | 0.43 | 0.43 | 0.55 | 2.31 | 29 | |||||||||||||||||||||||||||||||||||||||
Class E |
| |||||||||||||||||||||||||||||||||||||||||||||||||||||||||||
2013 | $ | 39.79 | $ | 0.85 | $ | 6.65 | $ | 7.50 | $ | (0.84 | ) | $ | — | $ | (0.84 | ) | $ | 46.45 | 19.11 | % | $ | 2,365,696 | 0.25 | % | 0.25 | % | 0.29 | % | 1.99 | % | 6 | % | ||||||||||||||||||||||||||||
2012 | 31.17 | 0.71 | 8.54 | 9.25 | (0.63 | ) | — | (0.63 | ) | 39.79 | 29.97 | 2,580,512 | 0.25 | 0.25 | 0.29 | 1.92 | 18 | |||||||||||||||||||||||||||||||||||||||||||
2011 | 31.42 | 0.61 | (0.25 | )(5) | 0.36 | (0.61 | ) | — | (0.61 | ) | 31.17 | 0.96 | 1,195,729 | 0.25 | 0.25 | 0.29 | 1.76 | 61 | ||||||||||||||||||||||||||||||||||||||||||
2010 | 29.12 | 0.61 | 2.29 | 2.90 | (0.60 | ) | — | (0.60 | ) | 31.42 | 10.10 | 1,046,410 | 0.25 | 0.25 | 0.29 | 2.02 | 20 | |||||||||||||||||||||||||||||||||||||||||||
2009 | 32.54 | 0.61 | (3.12 | ) | (2.51 | ) | (0.65 | ) | (0.26 | ) | (0.91 | ) | 29.12 | (7.16 | ) | 855,876 | 0.25 | 0.25 | 0.30 | 2.44 | 29 | |||||||||||||||||||||||||||||||||||||||
| SEI Institutional Managed Trust / Annual Report / September 30, 2013 | 243 |
Financial Highlights (Continued)
For years or periods ended September 30, (unless otherwise indicated)
For a Share Outstanding Throughout the Periods
| Net Asset Value, Beginning of Period | Net Investment Income (Loss)(1) | Net Realized and Unrealized Gains (Losses) on Securities(1) | Total from Operations | Dividends from Net Investment Income | Distributions from Realized Capital Gains | Total Dividends, Distributions and Return of Capital | Net Asset Value, End of Period | Total Return† | Net Assets End of Period ($Thousands) | Ratio of Expenses to Average Net Assets | Ratio of Expenses to Average Net Assets (Excluding Fees Paid Indirectly) | Ratio of Expenses to Average Net Assets (Excluding Fees Paid Indirectly and Waivers) | Ratio of Net Investment Income (Loss) to Average Net Assets | Portfolio Turnover Rate† | ||||||||||||||||||||||||||||||||||||||||||||||
S&P 500 Index Fund (continued) |
| |||||||||||||||||||||||||||||||||||||||||||||||||||||||||||
Class I |
| |||||||||||||||||||||||||||||||||||||||||||||||||||||||||||
2013 | $ | 39.73 | $ | 0.67 | $ | 6.65 | $ | 7.32 | $ | (0.67 | ) | $ | — | $ | (0.67 | ) | $ | 46.38 | 18.60 | % | $ | 7,577 | 0.65 | % | 0.65 | % | 0.79 | % | 1.58 | % | 6 | % | ||||||||||||||||||||||||||||
2012 | 31.12 | 0.56 | 8.54 | 9.10 | (0.49 | ) | — | (0.49 | ) | 39.73 | 29.46 | 8,500 | 0.65 | 0.65 | 0.79 | 1.53 | 18 | |||||||||||||||||||||||||||||||||||||||||||
2011 | 31.37 | 0.47 | (0.25 | )(5) | 0.22 | (0.47 | ) | — | (0.47 | ) | 31.12 | 0.56 | 7,198 | 0.65 | 0.65 | 0.79 | 1.35 | 61 | ||||||||||||||||||||||||||||||||||||||||||
2010 | 29.07 | 0.49 | 2.29 | 2.78 | (0.48 | ) | — | (0.48 | ) | 31.37 | 9.66 | 8,341 | 0.65 | 0.65 | 0.79 | 1.63 | 20 | |||||||||||||||||||||||||||||||||||||||||||
2009 | 32.47 | 0.51 | (3.12 | ) | (2.61 | ) | (0.53 | ) | (0.26 | ) | (0.79 | ) | 29.07 | (7.53 | ) | 8,566 | 0.65 | 0.65 | 0.80 | 2.07 | 29 | |||||||||||||||||||||||||||||||||||||||
Small Cap Fund |
| |||||||||||||||||||||||||||||||||||||||||||||||||||||||||||
Class A |
| |||||||||||||||||||||||||||||||||||||||||||||||||||||||||||
2013 | $ | 10.62 | $ | 0.01 | $ | 3.25 | $ | 3.26 | $ | (0.05 | ) | $ | (0.51 | ) | $ | (0.56 | ) | $ | 13.32 | 32.40 | % | $ | 410,780 | 1.14 | % | 1.14 | % | 1.28 | % | 0.08 | % | 72 | % | |||||||||||||||||||||||||||
2012 | 9.51 | 0.01 | 2.67 | 2.68 | (0.01 | ) | (1.56 | ) | (1.57 | ) | 10.62 | 29.93 | 254,051 | 1.14 | 1.15 | 1.28 | 0.08 | 114 | ||||||||||||||||||||||||||||||||||||||||||
2011 | 11.14 | (0.01 | ) | (0.55 | ) | (0.56 | ) | (0.01 | ) | (1.06 | ) | (1.07 | ) | 9.51 | (6.54 | ) | 203,909 | 1.14 | 1.14 | 1.28 | (0.09 | ) | 123 | |||||||||||||||||||||||||||||||||||||
2010(9) | 10.00 | 0.01 | 1.15 | 1.16 | (0.01 | ) | (0.01 | ) | (0.02 | ) | 11.14 | 11.64 | 223,978 | 1.14 | 1.14 | 1.29 | 0.10 | 115 | ||||||||||||||||||||||||||||||||||||||||||
Small Cap Value Fund |
| |||||||||||||||||||||||||||||||||||||||||||||||||||||||||||
Class A |
| |||||||||||||||||||||||||||||||||||||||||||||||||||||||||||
2013 | $ | 18.23 | $ | 0.17 | $ | 5.03 | $ | 5.20 | $ | (0.19 | ) | $ | — | $ | (0.19 | ) | $ | 23.24 | 28.73 | % | $ | 391,113 | 1.14 | % | 1.14 | % | 1.28 | % | 0.84 | % | 51 | % | ||||||||||||||||||||||||||||
2012 | 14.26 | 0.11 | 4.02 | 4.13 | $ | (0.16 | ) | — | (0.16 | ) | 18.23 | 29.04 | % | 405,106 | 1.14 | 1.15 | 1.28 | 0.64 | 53 | |||||||||||||||||||||||||||||||||||||||||
2011 | 15.45 | 0.07 | (1.16 | ) | (1.09 | ) | (0.10 | ) | — | (0.10 | ) | 14.26 | (7.15 | ) | 377,222 | 1.14 | 1.14 | 1.28 | 0.41 | 70 | ||||||||||||||||||||||||||||||||||||||||
2010 | 13.66 | 0.07 | 1.82 | 1.89 | (0.10 | ) | — | (0.10 | ) | 15.45 | 13.93 | 535,938 | 1.14 | 1.15 | 1.29 | 0.46 | 69 | |||||||||||||||||||||||||||||||||||||||||||
2009 | 15.38 | 0.11 | (1.62 | ) | (1.51 | ) | (0.13 | ) | (0.08 | ) | (0.21 | ) | 13.66 | (9.31 | ) | 638,341 | 1.14 | 1.16 | 1.29 | 1.03 | 110 | |||||||||||||||||||||||||||||||||||||||
Class I |
| |||||||||||||||||||||||||||||||||||||||||||||||||||||||||||
2013 | $ | 18.10 | $ | 0.11 | $ | 5.02 | $ | 5.13 | $ | (0.14 | ) | $ | — | $ | (0.14 | ) | $ | 23.09 | 28.51 | % | $ | 5,308 | 1.36 | % | 1.36 | % | 1.53 | % | 0.55 | % | 51 | % | ||||||||||||||||||||||||||||
2012 | 14.15 | 0.07 | 3.99 | 4.06 | (0.11 | ) | — | (0.11 | ) | 18.10 | 28.78 | 4,368 | 1.36 | 1.37 | 1.53 | 0.42 | 53 | |||||||||||||||||||||||||||||||||||||||||||
2011 | 15.34 | 0.03 | (1.15 | ) | (1.12 | ) | (0.07 | ) | — | (0.07 | ) | 14.15 | (7.40 | ) | 3,908 | 1.36 | 1.36 | 1.53 | 0.20 | 70 | ||||||||||||||||||||||||||||||||||||||||
2010 | 13.56 | 0.04 | 1.81 | 1.85 | (0.07 | ) | — | (0.07 | ) | 15.34 | 13.73 | 6,933 | 1.36 | 1.37 | 1.54 | 0.25 | 69 | |||||||||||||||||||||||||||||||||||||||||||
2009 | 15.29 | 0.08 | (1.62 | ) | (1.54 | ) | (0.11 | ) | (0.08 | ) | (0.19 | ) | 13.56 | (9.59 | ) | 7,389 | 1.36 | 1.38 | 1.54 | 0.77 | 110 | |||||||||||||||||||||||||||||||||||||||
Small Cap Growth Fund |
| |||||||||||||||||||||||||||||||||||||||||||||||||||||||||||
Class A |
| |||||||||||||||||||||||||||||||||||||||||||||||||||||||||||
2013 | $ | 18.57 | $ | (0.02 | ) | $ | 6.16 | $ | 6.14 | $ | (0.08 | ) | $ | — | $ | (0.08 | ) | $ | 24.63 | 33.21 | % | $ | 353,097 | 1.11 | % | 1.11 | % | 1.28 | % | (0.08 | )% | 81 | % | |||||||||||||||||||||||||||
2012 | 14.20 | (0.02 | ) | 4.39 | 4.37 | — | — | — | 18.57 | 30.77 | 300,972 | 1.11 | 1.12 | 1.28 | (0.13 | ) | 110 | |||||||||||||||||||||||||||||||||||||||||||
2011 | 14.69 | (0.07 | ) | (0.42 | ) | (0.49 | ) | — | — | — | 14.20 | (3.34 | ) | 272,275 | 1.11 | 1.12 | 1.28 | (0.43 | ) | 125 | ||||||||||||||||||||||||||||||||||||||||
2010 | 12.96 | (0.03 | ) | 1.76 | 1.73 | — | (2) | — | — | 14.69 | 13.36 | 380,910 | 1.11 | 1.11 | 1.29 | (0.21 | ) | 99 | ||||||||||||||||||||||||||||||||||||||||||
2009 | 13.98 | 0.02 | (1.04 | ) | (1.02 | ) | — | * | — | — | 12.96 | (7.27 | ) | 478,405 | 1.11 | 1.12 | 1.29 | 0.17 | 163 | |||||||||||||||||||||||||||||||||||||||||
Class I |
| |||||||||||||||||||||||||||||||||||||||||||||||||||||||||||
2013 | $ | 18.04 | $ | (0.07 | ) | $ | 5.99 | $ | 5.92 | $ | (0.03 | ) | $ | — | $ | (0.03 | ) | $ | 23.93 | 32.86 | % | $ | 3,384 | 1.36 | % | 1.36 | % | 1.53 | % | (0.35 | )% | 81 | % | |||||||||||||||||||||||||||
2012 | 13.82 | (0.06 | ) | 4.28 | 4.22 | — | — | — | 18.04 | 30.54 | 2,650 | 1.36 | 1.37 | 1.53 | (0.38 | ) | 110 | |||||||||||||||||||||||||||||||||||||||||||
2011 | 14.34 | (0.12 | ) | (0.40 | ) | (0.52 | ) | — | — | — | 13.82 | (3.63 | ) | 2,826 | 1.36 | 1.37 | 1.53 | (0.69 | ) | 125 | ||||||||||||||||||||||||||||||||||||||||
2010 | 12.68 | (0.06 | ) | 1.72 | 1.66 | — | — | — | 14.34 | 13.09 | 3,703 | 1.36 | 1.36 | 1.54 | (0.45 | ) | 99 | |||||||||||||||||||||||||||||||||||||||||||
2009 | 13.71 | (0.02 | ) | (1.01 | ) | (1.03 | ) | — | — | — | 12.68 | (7.51 | ) | 3,975 | 1.36 | 1.37 | 1.55 | (0.17 | ) | 163 | ||||||||||||||||||||||||||||||||||||||||
Tax-Managed Small/Mid Cap Fund |
| |||||||||||||||||||||||||||||||||||||||||||||||||||||||||||
Class A |
| |||||||||||||||||||||||||||||||||||||||||||||||||||||||||||
2013 | $ | 13.26 | $ | 0.04 | $ | 3.86 | $ | 3.90 | $ | (0.06 | ) | $ | — | $ | (0.06 | ) | $ | 17.10 | 29.54 | % | $ | 486,216 | 1.11 | % | 1.11 | % | 1.28 | % | 0.30 | % | 67 | % | ||||||||||||||||||||||||||||
2012 | 10.39 | 0.03 | 2.88 | 2.91 | (0.04 | ) | — | (0.04 | ) | 13.26 | 28.09 | 336,339 | 1.11 | 1.12 | 1.28 | 0.24 | 67 | |||||||||||||||||||||||||||||||||||||||||||
2011 | 10.81 | 0.02 | (0.41 | ) | (0.39 | ) | (0.03 | ) | — | (0.03 | ) | 10.39 | (3.66 | ) | 255,297 | 1.11 | 1.12 | 1.29 | 0.17 | 105 | ||||||||||||||||||||||||||||||||||||||||
2010 | 9.42 | 0.03 | 1.39 | 1.42 | (0.03 | ) | — | (0.03 | ) | 10.81 | 15.05 | 300,343 | 1.11 | 1.13 | 1.29 | 0.30 | 75 | |||||||||||||||||||||||||||||||||||||||||||
2009 | 10.16 | 0.04 | (0.73 | ) | (0.69 | ) | (0.05 | ) | — | (0.05 | ) | 9.42 | (6.62 | ) | 262,464 | 1.11 | 1.15 | 1.30 | 0.50 | 136 | ||||||||||||||||||||||||||||||||||||||||
Mid-Cap Fund |
| |||||||||||||||||||||||||||||||||||||||||||||||||||||||||||
Class A |
| |||||||||||||||||||||||||||||||||||||||||||||||||||||||||||
2013 | $ | 19.30 | $ | 0.11 | $ | 5.37 | $ | 5.48 | $ | (0.14 | ) | $ | — | $ | (0.14 | ) | $ | 24.64 | 28.52 | % | $ | 107,487 | 1.02 | % | 1.02 | % | 1.03 | % | 0.52 | % | 108 | % | ||||||||||||||||||||||||||||
2012 | 14.99 | 0.09 | 4.32 | 4.41 | (0.10 | ) | — | (0.10 | ) | 19.30 | 29.50 | 85,119 | 1.02 | 1.02 | 1.04 | 0.53 | 81 | |||||||||||||||||||||||||||||||||||||||||||
2011 | 15.80 | 0.06 | (0.79 | ) | (0.73 | ) | (0.08 | ) | — | (0.08 | ) | 14.99 | (4.67 | ) | 74,200 | 1.02 | 1.04 | 1.06 | 0.36 | 151 | ||||||||||||||||||||||||||||||||||||||||
2010 | 13.92 | 0.08 | 1.88 | 1.96 | (0.08 | ) | — | (0.08 | ) | 15.80 | 14.13 | 124,569 | 1.02 | 1.04 | 1.04 | 0.51 | 185 | |||||||||||||||||||||||||||||||||||||||||||
2009 | 14.87 | 0.11 | (0.94 | ) | (0.83 | ) | (0.12 | ) | — | (0.12 | ) | 13.92 | (5.34 | ) | 119,872 | 1.02 | 1.02 | 1.04 | 0.95 | 143 | ||||||||||||||||||||||||||||||||||||||||
Class I |
| |||||||||||||||||||||||||||||||||||||||||||||||||||||||||||
2013 | $ | 19.30 | $ | 0.06 | $ | 5.37 | $ | 5.43 | $ | (0.09 | ) | $ | — | $ | (0.09 | ) | $ | 24.64 | 28.20 | % | $ | 1,558 | 1.26 | % | 1.26 | % | 1.28 | % | 0.27 | % | 108 | % | ||||||||||||||||||||||||||||
2012 | 14.99 | 0.05 | 4.32 | 4.37 | (0.06 | ) | — | (0.06 | ) | 19.30 | 29.21 | 1,088 | 1.26 | 1.26 | 1.29 | 0.28 | 81 | |||||||||||||||||||||||||||||||||||||||||||
2011 | 15.81 | 0.03 | (0.81 | ) | (0.78 | ) | (0.04 | ) | — | (0.04 | ) | 14.99 | (4.95 | ) | 940 | 1.26 | 1.28 | 1.31 | 0.18 | 151 | ||||||||||||||||||||||||||||||||||||||||
2010 | 13.92 | 0.04 | 1.89 | 1.93 | (0.04 | ) | — | (0.04 | ) | 15.81 | 13.91 | 623 | 1.26 | 1.28 | 1.29 | 0.30 | 185 | |||||||||||||||||||||||||||||||||||||||||||
2009 | 14.86 | 0.05 | (0.89 | ) | (0.84 | ) | (0.10 | ) | — | (0.10 | ) | 13.92 | (5.47 | ) | 274 | 1.26 | 1.26 | 1.30 | 0.48 | 143 | ||||||||||||||||||||||||||||||||||||||||
| 244 | SEI Institutional Managed Trust / Annual Report / September 30, 2013 |
| Net Asset Value, Beginning of Period | Net Investment Income (Loss)(1) | Net Realized and Unrealized Gains (Losses) on Securities(1) | Total from Operations | Dividends from Net Investment Income | Distributions from Realized Capital Gains | Total Dividends, Distributions and Return of Capital | Net Asset Value, End of Period | Total Return† | Net Assets End of Period ($Thousands) | Ratio of Expenses to Average Net Assets | Ratio of Expenses to Average Net Assets (Excluding Fees Paid Indirectly) | Ratio of Expenses to Average Net Assets (Excluding Fees Paid Indirectly and Waivers) | Ratio of Net Investment Income (Loss) to Average Net Assets | Portfolio Turnover Rate† | ||||||||||||||||||||||||||||||||||||||||||||||
U.S. Managed Volatility Fund |
| |||||||||||||||||||||||||||||||||||||||||||||||||||||||||||
Class A |
| |||||||||||||||||||||||||||||||||||||||||||||||||||||||||||
2013 | $ | 13.96 | $ | 0.27 | $ | 2.25 | $ | 2.52 | $ | (0.27 | ) | $ | (0.12 | ) | $ | (0.39 | ) | $ | 16.09 | 18.39 | % | $ | 851,119 | 1.00 | % | 1.00 | % | 1.27 | % | 1.78 | % | 39 | % | |||||||||||||||||||||||||||
2012 | 11.49 | 0.22 | 2.45 | 2.67 | (0.20 | ) | — | (0.20 | ) | 13.96 | 23.41 | 635,298 | 1.00 | 1.00 | 1.28 | 1.72 | 48 | |||||||||||||||||||||||||||||||||||||||||||
2011 | 10.81 | 0.16 | 0.67 | 0.83 | (0.15 | ) | — | (0.15 | ) | 11.49 | 7.63 | 452,489 | 1.00 | 1.00 | 1.28 | 1.33 | 71 | |||||||||||||||||||||||||||||||||||||||||||
2010 | 9.65 | 0.14 | 1.16 | 1.30 | (0.14 | ) | — | (0.14 | ) | 10.81 | 13.61 | 415,669 | 1.00 | 1.00 | 1.29 | 1.37 | 53 | |||||||||||||||||||||||||||||||||||||||||||
2009 | 11.25 | 0.13 | (1.59 | ) | (1.46 | ) | (0.14 | ) | — | (0.14 | ) | 9.65 | (12.88 | ) | 380,987 | 1.00 | 1.00 | 1.29 | 1.56 | 126 | ||||||||||||||||||||||||||||||||||||||||
Class I |
| |||||||||||||||||||||||||||||||||||||||||||||||||||||||||||
2013 | $ | 13.93 | $ | 0.23 | $ | 2.25 | $ | 2.48 | $ | (0.22 | ) | $ | (0.12 | ) | $ | (0.34 | ) | $ | 16.07 | 18.10 | % | $ | 1,230 | 1.25 | % | 1.25 | % | 1.52 | % | 1.52 | % | 39 | % | |||||||||||||||||||||||||||
2012 | 11.47 | 0.22 | 2.41 | 2.63 | (0.17 | ) | — | (0.17 | ) | 13.93 | 23.08 | 709 | 1.25 | 1.25 | 1.53 | 1.62 | 48 | |||||||||||||||||||||||||||||||||||||||||||
2011 | 10.79 | 0.14 | 0.66 | 0.80 | (0.12 | ) | — | (0.12 | ) | 11.47 | 7.39 | 52 | 1.25 | 1.25 | 1.53 | 1.14 | 71 | |||||||||||||||||||||||||||||||||||||||||||
2010 | 9.63 | 0.11 | 1.17 | 1.28 | (0.12 | ) | — | (0.12 | ) | 10.79 | 13.38 | 37 | 1.25 | 1.25 | 1.54 | 1.08 | 53 | |||||||||||||||||||||||||||||||||||||||||||
2009 | 11.24 | 0.12 | (1.61 | ) | (1.49 | ) | (0.12 | ) | — | (0.12 | ) | 9.63 | (13.17 | ) | 17 | 1.25 | 1.25 | 1.55 | 1.38 | 126 | ||||||||||||||||||||||||||||||||||||||||
Global Managed Volatility Fund |
| |||||||||||||||||||||||||||||||||||||||||||||||||||||||||||
Class A |
| |||||||||||||||||||||||||||||||||||||||||||||||||||||||||||
2013 | $ | 9.80 | $ | 0.23 | $ | 1.22 | $ | 1.45 | $ | (0.25 | ) | $ | — | $ | (0.25 | ) | $ | 11.00 | 15.12 | % | $ | 1,399,316 | 1.11 | % | 1.11 | % | 1.28 | % | 2.09 | % | 60 | % | ||||||||||||||||||||||||||||
2012 | 8.53 | 0.20 | 1.07 | 1.27 | — | — | — | 9.80 | 14.89 | 928,141 | 1.11 | 1.11 | 1.30 | 2.19 | 48 | |||||||||||||||||||||||||||||||||||||||||||||
2011 | 8.21 | 0.18 | 0.14 | 0.32 | — | — | — | 8.53 | 3.90 | 522,646 | 1.11 | 1.11 | 1.29 | 2.11 | 68 | |||||||||||||||||||||||||||||||||||||||||||||
2010 | 7.82 | 0.13 | 0.29 | 0.42 | (0.03 | )(2) | — | (0.03 | ) | 8.21 | 5.37 | 330,526 | 1.11 | 1.11 | 1.31 | 1.62 | 91 | |||||||||||||||||||||||||||||||||||||||||||
2009 | 9.07 | 0.12 | (1.37 | ) | (1.25 | ) | — | — | — | 7.82 | (13.78 | ) | 213,773 | 1.13 | (3) | 1.13 | (3) | 1.35 | 1.59 | 155 | ||||||||||||||||||||||||||||||||||||||||
Class I |
| |||||||||||||||||||||||||||||||||||||||||||||||||||||||||||
2013 | $ | 9.66 | $ | 0.20 | �� | $ | 1.21 | $ | 1.41 | $ | (0.23 | ) | $ | — | $ | (0.23 | ) | $ | 10.84 | 14.91 | % | $ | 954 | 1.36 | % | 1.36 | % | 1.54 | % | 1.85 | % | 60 | % | |||||||||||||||||||||||||||
2012 | 8.44 | 0.22 | 1.00 | 1.22 | — | — | — | 9.66 | 14.45 | 320 | 1.36 | 1.36 | 1.55 | 2.32 | 48 | |||||||||||||||||||||||||||||||||||||||||||||
2011 | 8.15 | 0.15 | 0.14 | 0.29 | — | — | — | 8.44 | 3.56 | 21 | 1.36 | 1.36 | 1.54 | 1.78 | 68 | |||||||||||||||||||||||||||||||||||||||||||||
2010 | 7.76 | 0.16 | 0.25 | 0.41 | (0.02 | )(2) | — | (0.02 | ) | 8.15 | 5.32 | 64 | 1.36 | 1.36 | 1.57 | 2.00 | 91 | |||||||||||||||||||||||||||||||||||||||||||
2009 | 9.02 | 0.11 | (1.37 | ) | (1.26 | ) | — | — | — | 7.76 | (13.97 | ) | 17 | 1.38 | (3) | 1.38 | (3) | 1.62 | 1.56 | 155 | ||||||||||||||||||||||||||||||||||||||||
Tax-Managed Managed Volatility Fund |
| |||||||||||||||||||||||||||||||||||||||||||||||||||||||||||
Class A |
| |||||||||||||||||||||||||||||||||||||||||||||||||||||||||||
2013 | $ | 11.28 | $ | 0.22 | $ | 1.75 | $ | 1.97 | $ | (0.22 | ) | $ | (0.33 | ) | $ | (0.55 | ) | $ | 12.70 | 18.24 | % | $ | 621,530 | 1.00 | % | 1.00 | % | 1.27 | % | 1.86 | % | 28 | % | |||||||||||||||||||||||||||
2012 | 9.77 | 0.18 | 1.87 | 2.05 | (0.16 | ) | (0.38 | ) | (0.54 | ) | 11.28 | 21.70 | 442,074 | 1.00 | 1.00 | 1.28 | 1.71 | 30 | ||||||||||||||||||||||||||||||||||||||||||
2011 | 9.24 | 0.14 | 0.52 | 0.66 | (0.13 | ) | — | (0.13 | ) | 9.77 | 7.13 | 279,408 | 1.00 | 1.00 | 1.28 | 1.41 | 63 | |||||||||||||||||||||||||||||||||||||||||||
2010 | 8.14 | 0.12 | 1.10 | 1.22 | (0.12 | ) | — | (0.12 | ) | 9.24 | 15.17 | 236,402 | 1.00 | 1.00 | 1.29 | 1.39 | 28 | |||||||||||||||||||||||||||||||||||||||||||
2009 | 9.02 | 0.12 | (0.88 | ) | (0.76 | ) | (0.12 | ) | — | (0.12 | ) | 8.14 | (8.28 | ) | 172,265 | 1.00 | 1.00 | 1.29 | 1.69 | 94 | ||||||||||||||||||||||||||||||||||||||||
Real Estate Fund |
| |||||||||||||||||||||||||||||||||||||||||||||||||||||||||||
Class A |
| |||||||||||||||||||||||||||||||||||||||||||||||||||||||||||
2013 | $ | 14.97 | $ | 0.14 | $ | 0.50 | $ | 0.64 | $ | (0.19 | ) | $ | — | $ | (0.19 | ) | $ | 15.42 | 4.30 | % | $ | 207,876 | 1.14 | % | 1.14 | % | 1.27 | % | 0.91 | % | 74 | % | ||||||||||||||||||||||||||||
2012 | 11.67 | 0.08 | 3.34 | 3.42 | (0.12 | ) | — | (0.12 | ) | 14.97 | 29.44 | 191,484 | 1.14 | 1.14 | 1.28 | 0.55 | 68 | |||||||||||||||||||||||||||||||||||||||||||
2011 | 11.58 | 0.04 | 0.25 | 0.29 | (0.20 | ) | — | (0.20 | ) | 11.67 | 2.41 | 142,538 | 1.14 | 1.14 | 1.28 | 0.33 | 83 | |||||||||||||||||||||||||||||||||||||||||||
2010 | 9.42 | 0.05 | 2.46 | 2.51 | (0.35 | )(10) | — | (0.35 | ) | 11.58 | 27.37 | 220,866 | 1.14 | 1.15 | 1.29 | 0.50 | 69 | |||||||||||||||||||||||||||||||||||||||||||
2009 | 13.73 | 0.16 | (4.18 | ) | (4.02 | ) | (0.29 | )(2) | — | (0.29 | ) | 9.42 | (28.69 | ) | 221,228 | 1.14 | 1.15 | 1.29 | 2.08 | 97 | ||||||||||||||||||||||||||||||||||||||||
Class I |
| |||||||||||||||||||||||||||||||||||||||||||||||||||||||||||
2013 | $ | 14.93 | $ | 0.10 | $ | 0.51 | $ | 0.61 | $ | (0.15 | ) | $ | — | $ | (0.15 | ) | $ | 15.39 | 4.09 | % | $ | 565 | 1.36 | % | 1.36 | % | 1.52 | % | 0.65 | % | 74 | % | ||||||||||||||||||||||||||||
2012 | 11.64 | 0.05 | 3.33 | 3.38 | (0.09 | ) | — | (0.09 | ) | 14.93 | 29.16 | 606 | 1.36 | 1.36 | 1.53 | 0.33 | 68 | |||||||||||||||||||||||||||||||||||||||||||
2011 | 11.57 | (0.01 | ) | 0.28 | 0.27 | (0.20 | ) | — | (0.20 | ) | 11.64 | 2.19 | 445 | 1.36 | 1.36 | 1.53 | (0.07 | ) | 83 | |||||||||||||||||||||||||||||||||||||||||
2010 | 9.41 | — | * | 2.49 | 2.49 | (0.33 | )(10) | — | (0.33 | ) | 11.57 | 27.12 | 306 | 1.36 | 1.37 | 1.54 | 0.00 | 69 | ||||||||||||||||||||||||||||||||||||||||||
2009 | 13.72 | 0.09 | (4.12 | ) | (4.03 | ) | (0.28 | )(2) | — | (0.28 | ) | 9.41 | (28.83 | ) | 132 | 1.36 | 1.37 | 1.55 | 1.26 | 97 | ||||||||||||||||||||||||||||||||||||||||
Enhanced Income Fund |
| |||||||||||||||||||||||||||||||||||||||||||||||||||||||||||
Class A |
| |||||||||||||||||||||||||||||||||||||||||||||||||||||||||||
2013 | $ | 7.57 | $ | 0.16 | $ | 0.03 | $ | 0.19 | $ | (0.15 | ) | $ | — | $ | (0.15 | ) | $ | 7.61 | 2.50 | % | $ | 194,821 | 0.60 | % | 0.60 | % | 1.05 | % | 2.08 | % | 170 | % | ||||||||||||||||||||||||||||
2012 | 7.36 | 0.18 | 0.20 | 0.38 | (0.17 | ) | — | (0.17 | ) | 7.57 | 5.30 | 161,037 | 0.60 | 0.60 | 1.05 | 2.41 | 198 | |||||||||||||||||||||||||||||||||||||||||||
2011 | 7.46 | 0.20 | (0.14 | ) | 0.06 | (0.16 | ) | — | (0.16 | ) | 7.36 | 0.83 | 158,936 | 0.60 | 0.60 | 1.05 | 2.61 | 174 | ||||||||||||||||||||||||||||||||||||||||||
2010 | 7.21 | 0.18 | 0.30 | 0.48 | (0.23 | ) | — | (0.23 | ) | 7.46 | 6.78 | 137,223 | 0.60 | 0.60 | 1.06 | 2.45 | 77 | |||||||||||||||||||||||||||||||||||||||||||
2009 | 8.21 | 0.29 | (1.09 | ) | (0.80 | ) | (0.20 | ) | — | (0.20 | ) | 7.21 | (9.56 | ) | 233,747 | 0.60 | 0.60 | 1.06 | 4.30 | 132 | ||||||||||||||||||||||||||||||||||||||||
Class I |
| |||||||||||||||||||||||||||||||||||||||||||||||||||||||||||
2013 | $ | 7.56 | $ | 0.14 | $ | 0.02 | $ | 0.16 | $ | (0.13 | ) | $ | — | $ | (0.13 | ) | $ | 7.59 | 2.17 | % | $ | 368 | 0.85 | % | 0.85 | % | 1.30 | % | 1.85 | % | 170 | % | ||||||||||||||||||||||||||||
2012 | 7.36 | 0.15 | 0.21 | 0.36 | (0.16 | ) | — | (0.16 | ) | 7.56 | 4.93 | 69 | 0.85 | 0.85 | 1.30 | 2.11 | 198 | |||||||||||||||||||||||||||||||||||||||||||
2011 | 7.45 | 0.18 | (0.12 | ) | 0.06 | (0.15 | ) | — | (0.15 | ) | 7.36 | 0.72 | 19 | 0.85 | 0.85 | 1.30 | 2.36 | 174 | ||||||||||||||||||||||||||||||||||||||||||
2010 | 7.20 | 0.16 | 0.29 | 0.45 | (0.20 | ) | — | (0.20 | ) | 7.45 | 6.35 | 16 | 0.85 | 0.85 | 1.33 | 2.21 | 77 | |||||||||||||||||||||||||||||||||||||||||||
2009 | 8.20 | 0.25 | (1.06 | ) | (0.81 | ) | (0.19 | ) | — | (0.19 | ) | 7.20 | (9.79 | ) | 45 | 0.85 | 0.85 | 1.31 | 3.73 | 132 | ||||||||||||||||||||||||||||||||||||||||
| SEI Institutional Managed Trust / Annual Report / September 30, 2013 | 245 |
Financial Highlights/Consolidated Financial Highlights
For the years or periods ended September 30, (unless otherwise indicated)
For a Share Outstanding Throughout the Periods
| Net Asset Value, Beginning of Period | Net Investment Income (Loss)(1) | Net Realized and Unrealized Gains (Losses) on Securities(1) | Total from Operations | Dividends from Net Investment Income | Distributions from Realized Capital Gains | Total Dividends, Distributions and Return of Capital | Net Asset Value, End of Period | Total Return† | Net Assets End of Period ($Thousands) | Ratio of Expenses to Average Net Assets | Ratio of Expenses to Average Net Assets (Excluding Fees Paid Indirectly) | Ratio of Expenses to Average Net Assets (Excluding Fees Paid Indirectly and Waivers) | Ratio of Net Investment Income (Loss) to Average Net Assets | Portfolio Turnover Rate† | ||||||||||||||||||||||||||||||||||||||||||||||
Core Fixed Income Fund |
| |||||||||||||||||||||||||||||||||||||||||||||||||||||||||||
Class A |
| |||||||||||||||||||||||||||||||||||||||||||||||||||||||||||
2013 | $ | 11.64 | $ | 0.30 | $ | (0.42 | ) | $ | (0.12 | ) | $ | (0.32 | ) | $ | — | $ | (0.32 | ) | $ | 11.20 | (1.09 | )% | $ | 1,904,623 | 0.67 | % | 0.67 | % | 0.85 | % | 2.57 | % | 342 | % | ||||||||||||||||||||||||||
2012 | 11.14 | 0.33 | 0.61 | 0.94 | (0.35 | ) | (0.09 | ) | (0.44 | ) | 11.64 | 8.67 | 2,172,794 | 0.67 | 0.67 | 0.85 | 2.93 | 349 | ||||||||||||||||||||||||||||||||||||||||||
2011 | 10.93 | 0.36 | 0.22 | 0.58 | (0.37 | ) | — | (0.37 | ) | 11.14 | 5.43 | 2,185,135 | 0.71 | (4) | 0.71 | (4) | 0.89 | (4) | 3.25 | 473 | ||||||||||||||||||||||||||||||||||||||||
2010 | 9.98 | 0.44 | 0.95 | 1.39 | (0.44 | ) | — | (0.44 | ) | 10.93 | 14.25 | 2,335,314 | 0.67 | 0.67 | 0.85 | 4.20 | 283 | |||||||||||||||||||||||||||||||||||||||||||
2009 | 9.37 | 0.50 | 0.62 | 1.12 | (0.51 | ) | — | (0.51 | ) | 9.98 | 12.55 | 2,450,746 | 0.67 | 0.67 | 0.86 | 5.42 | 329 | |||||||||||||||||||||||||||||||||||||||||||
Class I |
| |||||||||||||||||||||||||||||||||||||||||||||||||||||||||||
2013 | $ | 11.63 | $ | 0.27 | $ | (0.42 | ) | $ | (0.15 | ) | $ | (0.29 | ) | $ | — | $ | (0.29 | ) | $ | 11.19 | (1.31 | )% | $ | 14,128 | 0.89 | % | 0.89 | % | 1.10 | % | 2.34 | % | 342 | % | ||||||||||||||||||||||||||
2012 | 11.13 | 0.31 | 0.61 | 0.92 | (0.33 | ) | (0.09 | ) | (0.42 | ) | 11.63 | 8.44 | 14,944 | 0.89 | 0.89 | 1.10 | 2.71 | 349 | ||||||||||||||||||||||||||||||||||||||||||
2011 | 10.92 | 0.33 | 0.23 | 0.56 | (0.35 | ) | — | (0.35 | ) | 11.13 | 5.20 | 15,701 | 0.93 | (4) | 0.93 | (4) | 1.14 | (4) | 3.03 | 473 | ||||||||||||||||||||||||||||||||||||||||
2010 | 9.97 | 0.41 | 0.96 | 1.37 | (0.42 | ) | — | (0.42 | ) | 10.92 | 14.01 | 17,445 | 0.89 | 0.89 | 1.10 | 3.96 | 283 | |||||||||||||||||||||||||||||||||||||||||||
2009 | 9.36 | 0.48 | 0.62 | 1.10 | (0.49 | ) | — | (0.49 | ) | 9.97 | 12.32 | 13,658 | 0.89 | 0.89 | 1.11 | 5.21 | 329 | |||||||||||||||||||||||||||||||||||||||||||
U.S. Fixed Income Fund |
| |||||||||||||||||||||||||||||||||||||||||||||||||||||||||||
Class A |
| |||||||||||||||||||||||||||||||||||||||||||||||||||||||||||
2013 | $ | 10.84 | $ | 0.19 | $ | (0.36 | ) | $ | (0.17 | ) | $ | (0.21 | ) | $ | (0.31 | ) | $ | (0.52 | ) | $ | 10.15 | (1.61 | )% | $ | 1,022,233 | 0.66 | % | 0.66 | % | 0.86 | % | 1.85 | % | 319 | % | |||||||||||||||||||||||||
2012 | 10.70 | 0.25 | 0.44 | 0.69 | (0.27 | ) | (0.28 | ) | (0.55 | ) | 10.84 | 6.68 | 898,450 | 0.66 | 0.66 | 0.87 | 2.34 | 322 | ||||||||||||||||||||||||||||||||||||||||||
2011 | 10.81 | 0.30 | 0.26 | 0.56 | (0.32 | ) | (0.35 | ) | (0.67 | ) | 10.70 | 5.43 | 972,449 | 0.66 | 0.66 | 0.87 | 2.85 | 337 | ||||||||||||||||||||||||||||||||||||||||||
2010 | 10.28 | 0.33 | 0.60 | 0.93 | (0.36 | ) | (0.04 | ) | (0.40 | ) | 10.81 | 9.22 | 877,709 | 0.66 | 0.66 | 0.86 | 3.12 | 299 | ||||||||||||||||||||||||||||||||||||||||||
2009(7) | 10.00 | 0.08 | 0.27 | 0.35 | (0.07 | ) | — | (0.07 | ) | 10.28 | 3.55 | 677,723 | 0.66 | 0.66 | 0.87 | 3.23 | 51 | |||||||||||||||||||||||||||||||||||||||||||
High Yield Bond Fund |
| |||||||||||||||||||||||||||||||||||||||||||||||||||||||||||
Class A |
| |||||||||||||||||||||||||||||||||||||||||||||||||||||||||||
2013 | $ | 7.59 | $ | 0.48 | $ | 0.07 | $ | 0.55 | $ | (0.46 | ) | $ | — | $ | (0.46 | ) | $ | 7.68 | 7.39 | % | $ | 1,989,355 | 0.89 | % | 0.89 | % | 1.12 | % | 6.13 | % | 74 | % | ||||||||||||||||||||||||||||
2012 | 6.92 | 0.53 | 0.68 | 1.21 | (0.51 | ) | (0.03 | ) | (0.54 | ) | 7.59 | 18.04 | 1,752,357 | 0.89 | 0.89 | 1.12 | 7.23 | 65 | ||||||||||||||||||||||||||||||||||||||||||
2011 | 7.27 | 0.55 | (0.32 | ) | 0.23 | (0.54 | ) | (0.04 | ) | (0.58 | ) | 6.92 | 2.96 | 1,316,158 | 0.89 | 0.89 | 1.13 | 7.38 | 82 | |||||||||||||||||||||||||||||||||||||||||
2010 | 6.52 | 0.64 | 0.74 | 1.38 | (0.61 | ) | (0.02 | ) | (0.63 | ) | 7.27 | 21.98 | 1,503,070 | 0.89 | 0.89 | 1.13 | 9.22 | 113 | ||||||||||||||||||||||||||||||||||||||||||
2009 | 6.57 | 0.60 | (0.02 | ) | 0.58 | (0.56 | ) | (0.07 | ) | (0.63 | ) | 6.52 | 11.88 | 1,289,964 | 0.89 | 0.89 | 1.15 | 11.03 | 98 | |||||||||||||||||||||||||||||||||||||||||
Class I |
| |||||||||||||||||||||||||||||||||||||||||||||||||||||||||||
2013 | $ | 7.40 | $ | 0.45 | $ | 0.07 | $ | 0.52 | $ | (0.43 | ) | $ | — | $ | (0.43 | ) | $ | 7.49 | 7.19 | % | $ | 38,849 | 1.11 | % | 1.11 | % | 1.38 | % | 6.07 | % | 74 | % | ||||||||||||||||||||||||||||
2012 | 6.82 | 0.50 | 0.59 | 1.09 | (0.48 | ) | (0.03 | ) | (0.51 | ) | 7.40 | 16.54 | 14,161 | 1.11 | 1.11 | 1.38 | 6.91 | 65 | ||||||||||||||||||||||||||||||||||||||||||
2011 | 7.28 | 0.53 | (0.42 | ) | 0.11 | (0.53 | ) | (0.04 | ) | (0.57 | ) | 6.82 | 1.19 | 915 | 1.11 | 1.11 | 1.37 | 7.06 | 82 | |||||||||||||||||||||||||||||||||||||||||
2010 | 6.53 | 0.63 | 0.74 | 1.37 | (0.60 | ) | (0.02 | ) | (0.62 | ) | 7.28 | 21.76 | 1,846 | 1.11 | 1.11 | 1.40 | 8.96 | 113 | ||||||||||||||||||||||||||||||||||||||||||
2009 | 6.58 | 0.58 | (0.01 | ) | 0.57 | (0.55 | ) | (0.07 | ) | (0.62 | ) | 6.53 | 11.65 | 200 | 1.11 | 1.11 | 1.40 | 10.45 | 98 | |||||||||||||||||||||||||||||||||||||||||
Real Return Fund |
| |||||||||||||||||||||||||||||||||||||||||||||||||||||||||||
Class A |
| |||||||||||||||||||||||||||||||||||||||||||||||||||||||||||
2013 | $ | 10.67 | $ | 0.05 | $ | (0.23 | ) | $ | (0.18 | ) | $ | (0.06 | ) | $ | (0.24 | ) | $ | (0.30 | ) | $ | 10.19 | (1.72 | )% | $ | 308,821 | 0.45 | % | 0.45 | % | 0.84 | % | 0.48 | % | 72 | % | |||||||||||||||||||||||||
2012 | 10.60 | 0.05 | 0.23 | 0.28 | (0.14 | ) | (0.07 | ) | (0.21 | ) | 10.67 | 2.66 | 283,646 | 0.45 | 0.45 | 0.85 | 0.48 | 137 | ||||||||||||||||||||||||||||||||||||||||||
2011 | 10.51 | 0.33 | 0.13 | 0.46 | (0.27 | ) | (0.10 | ) | (0.37 | ) | 10.60 | 4.51 | 373,560 | 0.45 | 0.45 | 0.85 | 3.06 | 77 | ||||||||||||||||||||||||||||||||||||||||||
2010 | 10.19 | 0.12 | 0.40 | 0.52 | (0.19 | ) | (0.01 | ) | (0.20 | ) | 10.51 | 5.20 | 240,925 | 0.45 | 0.45 | 0.86 | 1.18 | 94 | ||||||||||||||||||||||||||||||||||||||||||
2009(7) | 10.00 | 0.10 | 0.09 | 0.19 | — | — | — | 10.19 | 1.90 | 83,568 | 0.45 | 0.45 | 0.88 | 4.11 | 23 | |||||||||||||||||||||||||||||||||||||||||||||
Multi-Strategy Alternative Fund |
| |||||||||||||||||||||||||||||||||||||||||||||||||||||||||||
Class A |
| |||||||||||||||||||||||||||||||||||||||||||||||||||||||||||
2013 | $ | 9.62 | $ | 0.07 | $ | 0.15 | $ | 0.22 | $ | (0.05 | ) | $ | — | $ | (0.05 | ) | $ | 9.79 | 2.33 | % | $ | 426,733 | 0.73 | %(16) | 0.73 | %(16) | 2.22 | %(16) | 0.71 | % | 139 | % | ||||||||||||||||||||||||||||
2012 | 9.57 | 0.07 | 0.17 | 0.24 | (0.19 | ) | — | (0.19 | ) | 9.62 | 2.50 | 334,914 | 0.65 | (11) | 0.65 | (11) | 2.15 | (11) | 0.68 | 44 | ||||||||||||||||||||||||||||||||||||||||
2011 | 9.93 | 0.20 | (0.41 | ) | (0.21 | ) | (0.15 | ) | — | (0.15 | ) | 9.57 | (2.16 | ) | 292,006 | 0.50 | 0.50 | 2.13 | 1.76 | 25 | ||||||||||||||||||||||||||||||||||||||||
2010(6) | 10.00 | (0.02 | ) | (0.05 | ) | (0.07 | ) | — | — | — | 9.93 | (0.70 | ) | 191,055 | 0.50 | 0.50 | 2.19 | (0.42 | ) | 49 | ||||||||||||||||||||||||||||||||||||||||
Multi-Asset Accumulation Fund |
| |||||||||||||||||||||||||||||||||||||||||||||||||||||||||||
Class A |
| |||||||||||||||||||||||||||||||||||||||||||||||||||||||||||
2013 | $ | 10.51 | $ | (0.05 | ) | $ | 0.17 | $ | 0.12 | $ | (0.01 | ) | $ | (0.32 | ) | $ | (0.33 | ) | $ | 10.30 | 1.12 | % | $ | 1,414,563 | 1.17 | % | 1.17 | % | 1.37 | % | (0.52 | )% | 104 | % | ||||||||||||||||||||||||||
2012(8) | 10.00 | (0.02 | ) | 0.57 | 0.55 | (0.04 | ) | — | (0.04 | ) | 10.51 | 5.51 | 959,727 | 1.17 | 1.17 | 1.39 | (0.46 | ) | 38 | |||||||||||||||||||||||||||||||||||||||||
Multi-Asset Income Fund |
| |||||||||||||||||||||||||||||||||||||||||||||||||||||||||||
Class A |
| |||||||||||||||||||||||||||||||||||||||||||||||||||||||||||
2013 | $ | 10.35 | $ | 0.67 | $ | 0.17 | †† | $ | 0.84 | $ | (0.52 | ) | $ | (0.07 | ) | $ | (0.59 | ) | $ | 10.60 | 8.24 | % | $ | 230,356 | 0.98 | %(17) | 0.98 | %(17) | 1.40 | %(17) | 6.22 | % | 89 | % | ||||||||||||||||||||||||||
2012(8) | 10.00 | 0.23 | 0.30 | �� | 0.53 | (0.18 | ) | — | (0.18 | ) | 10.35 | 5.37 | 84,499 | 0.89 | (12) | 0.89 | (12) | 1.36 | (12) | 4.88 | 25 | |||||||||||||||||||||||||||||||||||||||
Multi-Asset Inflation Managed Fund |
| |||||||||||||||||||||||||||||||||||||||||||||||||||||||||||
Class A |
| |||||||||||||||||||||||||||||||||||||||||||||||||||||||||||
2013 | $ | 10.10 | $ | 0.06 | $ | (0.69 | ) | $ | (0.63 | ) | $ | (0.04 | ) | $ | (0.01 | ) | $ | (0.05 | ) | $ | 9.42 | (6.27 | )% | $ | 766,368 | 0.93 | %(14) | 0.93 | %(14) | 1.20 | %(14) | 0.59 | % | 61 | % | |||||||||||||||||||||||||
2012(8) | 10.00 | 0.02 | 0.13 | 0.15 | (0.05 | )(13) | — | (0.05 | ) | 10.10 | 1.54 | 540,255 | 0.93 | (15) | 0.93 | (15) | 1.22 | (15) | 0.47 | 19 | ||||||||||||||||||||||||||||||||||||||||
| 246 | SEI Institutional Managed Trust / Annual Report / September 30, 2013 |
| Net Asset Value, Beginning of Period | Net Investment Income (Loss)(1) | Net Realized and Unrealized Gains (Losses) on Securities(1) | Total from Operations | Dividends from Net Investment Income | Distributions from Realized Capital Gains | Total Dividends, Distributions and Return of Capital | Net Asset Value, End of Period | Total Return† | Net Assets End of Period ($Thousands) | Ratio of Expenses to Average Net Assets | Ratio of Expenses to Average Net Assets (Excluding Fees Paid Indirectly) | Ratio of Expenses to Average Net Assets (Excluding Fees Paid Indirectly and Waivers) | Ratio of Net Investment Income (Loss) to Average Net Assets | Portfolio Turnover Rate† | ||||||||||||||||||||||||||||||||||||||||||||||
Multi-Asset Capital Stability Fund |
| |||||||||||||||||||||||||||||||||||||||||||||||||||||||||||
Class A |
| |||||||||||||||||||||||||||||||||||||||||||||||||||||||||||
2013 | $ | 10.14 | $ | (0.02 | ) | $ | (0.10 | ) | $ | (0.12 | ) | $ | (0.01 | ) | $ | (0.07 | ) | $ | (0.08 | ) | $ | 9.94 | (1.23 | )% | $ | 486,926 | 0.62 | % | 0.62 | % | 1.02 | % | (0.22 | )% | 410 | % | ||||||||||||||||||||||||
2012(8) | 10.00 | (0.01 | ) | 0.15 | 0.14 | — | * | — | — | * | 10.14 | 1.40 | 347,861 | 0.62 | 0.62 | 1.02 | (0.29 | ) | 180 | |||||||||||||||||||||||||||||||||||||||||
| † | Returns and turnover rates are for the period indicated and have not been annualized. |
| †† | The amount shown for a share outstanding throughout the period does not accord with the aggregate net gains on investments for the period because of the sales and repurchases of Fund shares in relation to fluctuating market value of the investments of the Fund. |
| * | Amount represents less than $0.01. |
| (1) | Per share net investment income and net realized and unrealized gains/(losses) calculated using average shares. |
| (2) | Includes return of capital of less than $0.01. |
| (3) | The expense ratios include overdraft fees. Had these fees been excluded the ratios would have been 1.11% and 1.36% for Class A and Class I, respectively. |
| (4) | The expense ratio includes interest expense. Had this expense been excluded the ratios would have been 0.67%, 0.67% and 0.85% for Class A and 0.89%, 0.89% and 1.10% for Class I, respectively. |
| (5) | The amount shown for the year ended September 30, 2011, for a share outstanding throughout the period does not accord with the aggregate net gains on investments for that period because of the sales and repurchase of Fund shares in relation to fluctuating market value of the investments of the Fund. |
| (6) | Commenced operations on March 31, 2010. All ratios for the period have been annualized. |
| (7) | Commenced operations on July 2, 2009. All ratios for the period have been annualized. |
| (8) | Commenced operations on April 9, 2012. All ratios for the period have been annualized. |
| (9) | Commenced operations on October 1, 2009. All ratios for the period have been annualized. |
| (10) | Includes return of capital of $0.10. |
| (11) | The expense ratio includes dividend expense. Had this expense been excluded the ratios would have been 0.63%, 0.63% and 2.13%. |
| (12) | The expense ratio includes interest expense. Had this expense been excluded the ratios would have been 0.76%, 0.76% and 1.23%. |
| (13) | Includes return of capital of $0.04. |
| (14) | The expense ratio includes interest expense. Had this expense been excluded the ratios would have been 0.90%, 0.90% and 1.17%. |
| (15) | The expense ratio includes interest expense. Had this expense been excluded the ratios would have been 0.90%, 0.90% and 1.19%. |
| (16) | The expense ratio includes dividend expense and other expenses outside of the cap. Had this expense been excluded the ratios would have been 0.60%, 0.60% and 2.09%. |
| (17) | The expense ratio included interest expense. Had this expense been excluded the ratios would have been 0.80%, 0.80% and 1.22% |
Amounts designated as “—” are $0 or have been rounded to $0.
The accompanying notes are an integral part of the financial statements.
| SEI Institutional Managed Trust / Annual Report / September 30, 2013 | 247 |
Notes to Financial Statements/Consolidated Notes to Financial Statements
September 30, 2013
1. ORGANIZATION
SEI Institutional Managed Trust (the “Trust”) is organized as a Massachusetts business trust under a Declaration of Trust dated October 20, 1986.
The Trust is registered under the Investment Company Act of 1940, as amended, as an open-end investment company with 25 funds: Large Cap, Large Cap Value, Large Cap Growth, Tax-Managed Large Cap, S&P 500 Index, Small Cap, Small Cap Value, Small Cap Growth, Tax-Managed Small/Mid Cap, Mid-Cap, U.S. Managed Volatility, Global Managed Volatility, Tax-Managed Managed Volatility, Real Estate, Enhanced Income, Core Fixed Income, U.S. Fixed Income, High Yield Bond, Real Return, Prime Obligation, Multi-Strategy Alternative, Multi-Asset Accumulation, Multi-Asset Income, Multi-Asset Inflation Managed and Multi-Asset Capital Stability Funds (each a “Fund,” collectively the “Funds”) each of which are diversified Funds, with the exception of the Real Estate, Multi-Asset Accumulation and Multi-Asset Inflation Managed Funds.
The Accumulation Commodity Strategy Subsidiary, Ltd. and Inflation Commodity Strategy Subsidiary, Ltd. are both wholly-owned subsidiaries of the Multi-Asset Accumulation and Multi-Asset Inflation Managed Funds, respectively, (each a “Subsidiary”, collectively the “Subsidiaries”). Each Subsidiary is organized under the laws of the Cayman Islands as an exempt limited company. Information regarding the Multi-Asset Accumulation and Multi-Asset Inflation Managed Funds and their respective subsidiaries have been consolidated in the Consolidated Schedule of Investments, Consolidated Statement of Assets and Liabilities, Consolidated Statement of Operations, Consolidated Statement of Changes in Net Assets and Consolidated Statement of Cash Flows.
The Trust is registered to offer: Class A shares of the Funds; Class E shares of the S&P 500 Fund; Class I shares of the Large Cap, Large Cap Value, Large Cap Growth, S&P 500 Index, Small Cap, Small Cap Value, Small Cap Growth, Mid-Cap, U.S. Managed Volatility, Global Managed Volatility, Real Estate, Enhanced Income, Core Fixed Income, U.S. Fixed Income, High Yield Bond and Real Return Funds; and Class Y shares of the Tax-Managed Large Cap Fund. The assets of each Fund are segregated, and a shareholder’s interest is limited to the Fund in which shares are held. The Funds’ prospectuses provide a description of each Fund’s investment objective and its principal strategies and risks.
As of September 30, 2013, the Prime Obligation Fund has not yet commenced operations.
2. SIGNIFICANT ACCOUNTING POLICIES
The following is a summary of the significant accounting policies followed by the Funds.
Use of Estimates — The preparation of financial statements, in conformity with U.S. generally accepted accounting principles (“U.S. GAAP”) requires management to make estimates and assumptions that affect the reported amounts of assets and liabilities and disclosure of contingent assets and liabilities as of the date of the financial statements and the reported amounts of increases and decreases
in net assets from operations during the reporting period. Actual results could differ from those estimates.
Security Valuation — Securities listed on a securities exchange, market or automated quotation system for which quotations are readily available (except for securities traded on NASDAQ) are valued at the last quoted sale price on the primary exchange or market (foreign or domestic) on which they are traded, or, if there is no such reported sale, at the most recent quoted bid price. For securities traded on NASDAQ, the NASDAQ Official Closing Price will be used. If available, debt securities are priced based upon valuations provided by independent, third-party pricing agents. Such values generally reflect the last reported sales price if the security is actively traded. The third-party pricing agents may also value debt securities at an evaluated bid price by employing methodologies that utilize actual market transactions, broker-supplied valuations, or other methodologies designed to identify the market value for such securities. Debt obligations with remaining maturities of sixty days or less may be valued at their amortized cost, which approximates market value. Prices for most securities held in the Funds are provided daily by recognized independent pricing agents. SEI Investments Management Corporation (“SIMC”) or a Sub-Adviser, as applicable, reasonably believes that prices provided by independent pricing agents are reliable. However, there can be no assurance that such pricing service’s prices will be reliable. SIMC or a Sub-Adviser, as applicable, continuously monitors the reliability of prices obtained from any pricing service and will notify the Funds’ administrator if it believes that a particular pricing service is no longer a reliable source of prices. The Funds’ administrator, in turn, will notify the Trust’s Fair Value Committee (the “Committee”) if it receives such notification from SIMC or a Sub-Adviser, as applicable, or if the Funds’ administrator reasonably believes that a particular pricing service is no longer a reliable source for prices. If a security price cannot be obtained from an independent, third-party pricing agent, the Funds seek to obtain a bid price from at least one independent broker.
Securities for which market prices are not “readily available” are determined to be unreliable or cannot be valued using methodologies described above are valued in accordance with Fair Value Procedures established by the Trust’s Board of Trustees. The Trust’s Fair Value Procedures are implemented through the Committee designated by the Trust’s Board of Trustees. The Committee is currently composed of two members of the Board of Trustees, as well as representatives from SIMC and its affiliates. The Committee provides regular reports to the Board concerning investments for which market prices are not readily available or may be unreliable. Some of the more common reasons that may necessitate that a security be valued using Fair Value Procedures include: the security’s trading has been halted or suspended; the security has been de-listed from a national exchange; the security’s primary trading market is temporarily closed at a time when, under normal conditions, it would be open; or the security’s primary pricing source is not able or willing to provide a price. When a security is valued in accordance with the Fair Value Procedures, the Committee will determine the value after taking into consideration relevant information reasonably available to the Committee. Examples of factors the Committee may consider are: (i) the facts giving rise to the need to fair value; (ii) the last trade price; (iii) the performance of
| 248 | SEI Institutional Managed Trust / Annual Report / September 30, 2013 |
the market or the issuer’s industry; (iv) the liquidity of the security; (v) the size of the holding in a Fund; or (vi) any other appropriate information. The determination of a security’s fair value price often involves the consideration of a number of subjective factors and is therefore subject to the unavoidable risk that the value assigned to a security may be higher or lower than the security’s value would be if a reliable market quotation for the security was readily available.
For securities that principally trade on a foreign market or exchange, a significant gap in time can exist between the time of a particular security’s last trade and the time at which a Fund calculates its net asset value. The closing prices of such securities may no longer reflect their market value at the time a Fund calculates net asset value if an event that could materially affect the value of those securities (a “Significant Event”) has occurred between the time of the security’s last close and the time that a Fund calculates net asset value. A Significant Event may relate to a single issuer or to an entire market sector. If the adviser or sub-adviser of a Fund becomes aware of a Significant Event that has occurred with respect to a security or group of securities after the closing of the exchange or market on which the security or securities principally trade, but before the time at which a Fund calculates net asset value, it may request that a Committee meeting be called. In addition, the Trust’s administrator monitors price movements among certain selected indices, securities and/or baskets of securities that may be an indicator that the closing prices received earlier from foreign exchanges or markets may not reflect market value at the time a Fund calculates net asset value. If price movements in a monitored index or security exceed levels established by the administrator, the administrator notifies the adviser or sub-adviser for any Fund holding the relevant securities that such limits have been exceeded. In such event, the adviser or sub-adviser makes the determination whether a Committee meeting should be called based on the information provided.
The Global Managed Volatility Fund also uses a third-party fair valuation vendor. The vendor provides a fair value for foreign securities held by the Fund based on certain factors and methodologies (involving, generally, tracking valuation correlations between the U.S. market and each non-U.S. security). Values from the fair value vendor are applied in the event that there is a movement in the U.S. market that exceeds a specific threshold that has been established by the Committee. The Committee has also established a “confidence interval” which is used to determine the level of historical correlation between the value of a specific foreign security and movements in the U.S. market before a particular security will be fair valued when the threshold is exceeded. In the event that the threshold established by the Committee is exceeded on a specific day, the Global Managed Volatility Fund will value the non-U.S. securities in its portfolio that exceed the applicable “confidence interval” based upon the adjusted prices provided by the fair valuation vendor.
Options and warrants for which the primary market is a national securities exchange are valued at the last sale price on the exchange on which they are traded, or, in the absence of any sale, at the closing
bid price. Options and warrants not traded on a national securities exchange are valued at the last quoted bid price.
The assets of the Multi-Strategy Alternative Fund consist primarily of investments in underlying registered investment companies, which are valued at their respective daily net assets in accordance with pricing procedures approved by their respective Boards.
In accordance with U.S. GAAP, fair value is defined as the price that a Fund would receive upon selling an investment in an orderly transaction to an independent buyer in the principal or most advantageous market of the investment. A three-tier hierarchy has been established to maximize the use of observable and minimize the use of unobservable inputs and to establish classification of fair value measurements for disclosure purposes. Inputs refer broadly to the assumptions that market participants would use in pricing an asset. Inputs may be observable or unobservable. Observable inputs are inputs that reflect the assumptions market participants would use in pricing the asset or liability based on market data obtained from sources independent of the reporting entity. Unobservable inputs are inputs that reflect the reporting entity’s own assumptions about the assumptions market participants would use in pricing the asset or liability based on the best information available in the circumstances.
The three-tier hierarchy of inputs is summarized in the three broad Levels listed below:
Level 1 — quoted prices in active markets for identical investments
Level 2 — other significant observable inputs (including quoted prices for similar investments, interest rates, prepayment speeds, credit risks, etc.)
Level 3 — significant unobservable inputs (including the Fund’s own assumptions in determining the fair value of investments)
Investments are classified within the level of the lowest significant input considered in determining fair value. Investments classified within Level 3 whose fair value measurement considers several inputs may include Level 1 or Level 2 inputs as components of the overall fair value measurement.
Debt securities are valued in accordance with the evaluated bid price supplied by the pricing service and generally categorized as Level 2 in the hierarchy. Other securities that are categorized as Level 2 in the hierarchy include, but are not limited to, preferred stocks, bank loans, warrants, swaps and forward contracts. The Fund may use a systematic fair valuation model provided by an independent pricing service to value foreign equity securities in order to adjust for stale pricing, which may occur between the close of certain foreign exchanges and the NYSE. These are generally categorized as Level 2 in the hierarchy.
When independent prices are unavailable or unreliable, debt securities and swaps may be valued utilizing pricing matrices which consider similar factors that would be used by independent pricing services. These are generally categorized as Level 2 in the hierarchy
| SEI Institutional Managed Trust / Annual Report / September 30, 2013 | 249 |
Notes to Financial Statements/Consolidated Notes to Financial Statements (Continued)
September 30, 2013
but may be Level 3 depending on the circumstances. For certain collateralized debt obligations, corporate obligations, mortgage backed securities, auction rate preferred securities and loan participations where observable inputs are limited, assumptions about market activity and risk are used and are categorized as Level 3 in the hierarchy.
The valuation techniques used by the Funds to measure fair value during the year ended September 30, 2013, maximized the use of observable inputs and minimized the use of unobservable inputs.
For the year ended September 30, 2013, there have been no significant changes to the Trust’s fair valuation methodologies.
The following table summarizes the quantitative inputs and assumptions used for items categorized as recurring Level 3 assets as of September 30, 2013. The disclosures below also include qualitative information on the sensitivity of the fair value measurements to changes in the significant unobservable inputs.
Multi-Asset Income Fund
| Assets | Fair Value (in Thousands) at | Valuation Technique(s) | Unobservable Input | Range (Weighted Average) | ||||||
| Collateralized Debt Obligations | $ | 16,236 | Option Adjusted Spread off the month end broker mark over the 3 month LIBOR | Indicative Quote | 359-2590 | |||||
| 8,257 | Option Adjusted Spread off the trade price over the 3 month LIBOR | Indicative Quote | 427-953 | |||||||
| 1,231 | Option Adjusted Spread off monthly model price | Indicative Quote | 1204 | |||||||
| 594 | Prior month-end broker mark | Indicative Quote | 0.54 | |||||||
|
| |||||||||
| Total Collateralized Debt Obligations | 26,318 | |||||||||
|
| |||||||||
| Asset-Backed Securities | 2,398 | Option Adjusted Spread off the month end broker mark over the 3 month LIBOR | Indicative Quote | 142-441 | ||||||
|
| |||||||||
| Total Asset-Backed | 2,398 | |||||||||
|
| |||||||||
| Loan Participations | 482 | Prior month-end broker mark | Indicative Quote | 100.5 | ||||||
| 149 | Cost | Trade Price | 99 | |||||||
|
| |||||||||
| Total Loan Participations | 631 | |||||||||
|
| |||||||||
The unobservable inputs used to determine fair value of reoccurring Level 3 assets may have similar or diverging impacts on valuation. Significant increases and decreases in these inputs in isolation and interrelationships between those inputs could result in significantly higher or lower fair value measurement.
Security Transactions and Investment Income — Security transactions are recorded on the trade date. Costs used in determining net realized capital gains and losses on the sale of securities are on the basis of specific identification. Dividend income is recognized on the ex-dividend date, and interest income is recognized using the accrual basis of accounting. Income from payment-in-kind securities is recorded daily based on the effective interest method of accrual.
Distributions received on securities that represent a return of capital or capital gain are recorded as a reduction of cost of investments and/or as a realized gain. The Trust estimates the components of distributions received that may be considered nontaxable distributions or capital gain distributions.
Amortization and accretion is calculated using the scientific interest method, which approximates the effective interest method over the holding period of the security, which is not materially different
from the effective interest method. Amortization of premiums and discounts is included in interest income.
Repurchase Agreements — Securities pledged as collateral for repurchase agreements are held by each Fund’s custodian bank until the repurchase date of the repurchase agreement. The Funds may also invest in tri-party repurchase agreements. Securities held as collateral for tri-party repurchase agreements are maintained by the broker’s custodian bank in a segregated account until the repurchase date of the repurchase agreement. Provisions of the repurchase agreements and the Trust’s policies require that the market value of the collateral, including accrued interest thereon, is sufficient in the event of default by the counterparty. If the counterparty defaults and the value of the collateral declines, or if the counterparty enters into an insolvency proceeding, realization of the collateral by the Funds may be delayed or limited.
| 250 | SEI Institutional Managed Trust / Annual Report / September 30, 2013 |
Reverse Repurchase Agreements — To the extent consistent with its Investment Objective and Strategies, a Fund may issue reverse repurchase agreements. A reverse repurchase agreement involves the sale of portfolio assets together with an agreement to repurchase the same assets later at a fixed price. The segregated assets may consist of cash, U.S. Government securities, or other liquid securities at least equal in value to the obligations under the reverse repurchase agreements. In the event the buyer of securities under a reverse repurchase agreement files for bankruptcy or becomes insolvent, a Fund’s use of the proceeds under the agreement may be restricted pending a determination by the other party, or its trustee or receiver, whether to enforce the obligation to repurchase the securities. Reverse repurchase agreements outstanding as of September 30, 2013 were as follows:
MULTI-ASSET INCOME FUND
| Principal Amount ($ Thousands) | Counterparty | Value ($ Thousands) | ||||||
| $(1,467) | Citi, 1.72% | $ | (1,467 | ) | ||||
| (1,027) | Credit Suisse, 0.53% | (1,027 | ) | |||||
| (899) | Bank of America, 1.93% | (899 | ) | |||||
| (773) | Citi, 2.61% | (773 | ) | |||||
| (744) | Bank of America, 1.93% | (744 | ) | |||||
| (681) | Nomura, 2.10% | (681 | ) | |||||
| (586) | Bank of America, 1.68% | (586 | ) | |||||
| (489) | Credit Suisse, 0.25% | (489 | ) | |||||
| (459) | Citi, 2.17% | (459 | ) | |||||
|
| |||||||
| $ | (7,125 | ) | ||||||
|
| |||||||
MULTI-ASSET INFLATION MANAGED FUND
| Principal Amount ($ Thousands) | Counterparty | Value ($ Thousands) | ||||||
| $(33,683) | JPMorgan Securities, 0.12% | $ | (33,683 | ) | ||||
| (21,440) | JPMorgan Securities, 0.12% | (21,440 | ) | |||||
| (16,772) | JPMorgan Securities, 0.10% | (16,772 | ) | |||||
| (12,759) | Bank of America, 0.12% | (12,759 | ) | |||||
| (10,341) | JPMorgan Securities, 0.10% | (10,341 | ) | |||||
| (9,098) | Bank of America, 0.13% | (9,098 | ) | |||||
| (5,187) | Bank of America, 0.08% | (5,187 | ) | |||||
| (5,135) | Bank of America, 0.11% | (5,135 | ) | |||||
| (4,128) | Bank of America, 0.07% | (4,128 | ) | |||||
| (3,051) | Bank of America, 0.07% | (3,051 | ) | |||||
| (2,210) | Bank of America, 0.09% | (2,210 | ) | |||||
|
| |||||||
| $ | (123,804 | ) | ||||||
|
| |||||||
Classes — Class-specific expenses are borne by that class of shares. Income, realized and unrealized gains/losses and non class-specific expenses are allocated to the respective class on the basis of relative daily net assets.
Expenses — Expenses that are directly related to a Fund are charged directly to that Fund. Other operating expenses of the Funds are prorated to the Funds on the basis of relative daily net assets.
Commodity-Linked Investments — To the extent consistent with its Investment Objective and Strategies, the Multi-Asset Accumulation Fund and the Multi-Asset Inflation Managed Fund may invest in commodity investments to provide exposure to the investment returns of the commodities markets. Commodity investments include notes with interest payments that are tied to an underlying commodity or
commodity index, ETFs or other exchange-traded products that are tied to the performance of a commodity or commodity index or other types of investment vehicles or instruments that provide returns that are tied to commodities or commodity indices. The Multi-Asset Accumulation and Multi-Asset Inflation Managed Funds may also invest in equity securities of issuers in commodity-related industries.
The Multi-Asset Accumulation and Multi-Asset Inflation Managed Funds may also seek to gain exposure to the commodity markets, in whole or in part, through investments in a wholly owned Subsidiary. The Subsidiary, unlike the Fund, may invest to a significant extent directly in commodities and in equity-linked securities and commodity-linked derivative instruments, including options, futures contracts, swaps, options on futures contracts and commodity-linked structured notes. The Subsidiary may also invest in other instruments in which the Fund is permitted to invest, either as investments or to serve as margin or collateral for its derivative positions. A Fund may invest up to 25% of its total assets in its Subsidiary.
In order for a Fund to qualify as a regulated investment company under Subchapter M of the Code, the Fund must derive at least 90% of its gross income each taxable year from qualifying income. The status of certain commodity-linked derivative instruments as qualifying income has been addressed in Revenue Ruling 2006-1 and Revenue Ruling 2006-31 which provide that income from certain commodity-linked derivative instruments in which the Fund invests will not be considered qualifying income. To the extent the Multi-Asset Accumulation and the Multi-Asset Inflation Managed Funds invests in such instruments directly, each Fund will seek to restrict its income from commodity-linked derivative instruments that do not generate qualifying income, such as commodity-linked swaps, to a maximum of 10% of its gross income (when combined with its other investments that produce non-qualifying income).
Foreign Currency Translation — The books and records of the Funds are maintained in U.S. dollars on the following basis:
(I) market value of investment securities, assets and liabilities at the current rate of exchange; and
(II) purchases and sales of investment securities, income and expenses at the relevant rates of exchange prevailing on the respective dates of such transactions.
The Funds do not isolate that portion of gains and losses on investments in equity securities that is due to changes in the foreign exchange rates from that which is due to changes in market prices of equity securities.
The Funds report certain foreign-currency-related transactions as components of realized gains for financial reporting purposes, whereas such components are treated as ordinary income for Federal income tax purposes.
Forward Foreign Currency Contracts — To the extent consistent with its Investment Objective and Strategies, a Fund may enter into forward
| SEI Institutional Managed Trust / Annual Report / September 30, 2013 | 251 |
Notes to Financial Statements/Consolidated Notes to Financial Statements (Continued)
September 30, 2013
foreign currency contracts as hedges against either specific transactions, fund positions or anticipated fund positions. A Fund may also engage in currency transactions to enhance that Fund’s returns. All commitments are “marked-to-market” daily at the applicable foreign exchange rate, and any resulting unrealized gains or losses are recorded currently. The Funds realize gains and losses at the time forward contracts are extinguished. Unrealized gains or losses on outstanding positions in forward foreign currency contracts held at the close of the period are recognized as ordinary income or loss for Federal income tax purposes. The Funds could be exposed to risk if the counterparties to the contracts are unable to meet the terms of the contract and from unanticipated movements in the value of a foreign currency relative to the U.S. dollar. Finally, the risk exists that losses could exceed amounts disclosed on the Statements of Assets and Liabilities or Consolidated Statements of Assets and Liabilities. Refer to each Fund’s Schedule of Investments, Summary Schedule of Investments or Consolidated Schedule of Investments for details regarding open forward foreign currency contracts as of September 30, 2013, if applicable.
Futures Contracts — To the extent consistent with its Investment Objective and Strategies, a Fund may use futures contracts for tactical hedging purposes as well as to enhance the Fund’s returns. In addition, fixed income funds will utilize futures contracts to help manage duration and yield curve exposure. Initial margin deposits of cash or securities are made upon entering into futures contracts. The contracts are marked to market daily and the resulting changes in value are accounted for as unrealized gains and losses. Variation margin payments are paid or received, depending upon whether unrealized gains or losses are incurred. When the contract is closed, the Funds record a realized gain or loss equal to the difference between the proceeds from (or cost of) the closing transaction and the amount invested in the contract.
Risks of entering into futures contracts include the possibility that there will be an imperfect price correlation between the futures and the underlying securities. Second, it is possible that a lack of liquidity for futures contracts could exist in the secondary market, resulting in an inability to close a position prior to its maturity date. Third, the futures contract involves the risk that the Fund could lose more than the original margin deposit required to initiate a futures transaction.
Finally, the risk exists that losses could exceed amounts disclosed on the Statements of Assets and Liabilities or Consolidated Statements of Assets and Liabilities. Refer to each Fund’s Schedule of Investments, Summary Schedule of Investments or Consolidated Schedule of Investments for details regarding open futures contracts as of September 30, 2013, if applicable.
Options/Swaptions Writing/Purchasing — To the extent consistent with its Investment Objective and Strategies, a Fund may invest in financial options/swaptions contracts for the purpose of hedging its existing fund securities or to enhance the Fund’s returns. When a Fund writes or purchases an option/swaption, an amount equal to the
premium received or paid by the Fund is recorded as a liability or an asset and is subsequently adjusted to the current market value of the option/swaption written or purchased. Premiums received or paid from writing or purchasing options/swaptions which expire unexercised are treated by the Fund on the expiration date as realized gains or losses. The difference between the premium and the amount paid or received on effecting a closing purchase or sale transaction, including brokerage commissions, is also treated as a realized gain or loss. If an option/swaption is exercised, the premium paid or received is added to the cost of the purchase or proceeds from the sale in determining whether the Fund has realized a gain or a loss on investment transactions.
The risk in writing a call option/swaption is that the Funds give up the opportunity for profit if the market price of the security increases. The risk in writing a put option/swaption is that the Funds may incur a loss if the market price of the security decreases and the option/swaption is exercised. The risk in purchasing an option/swaption is that the Funds pay a premium whether or not the option/swaption is exercised. The Funds also have the additional risk of being unable to enter into a closing transaction at an acceptable price if a liquid secondary market does not exist. Option/swaption contracts also involve the risk that they may not work as intended due to unanticipated developments in market conditions or other causes.
Finally, the risk exists that losses on written options could exceed amounts disclosed on the Statements of Assets and Liabilities. Refer to each Fund’s Schedule of Investments, Summary Schedule of Investments or Consolidated Schedule of Investments for details regarding open option/swaption contracts as of September 30, 2013, if applicable.
Securities Sold Short — To the extent consistent with its Investment Objective and Strategies, a Fund may engage in short sales. Short sales are transactions under which a Fund sells a security it does not own. To complete such a transaction, the Fund must borrow the security to make delivery to the buyer. A Fund then is obligated to replace the security borrowed by purchasing the security at the market price at the time of the replacement. The price at such time may be more or less than the price at which the security was sold by a Fund. Until the security is replaced, a Fund is required to pay the lender amounts equal to any dividends or interest that accrue during the period of the loan. Dividends and interest are shown as an expense for financial reporting purposes. To borrow the security, a Fund also may be required to pay a premium, which would decrease proceeds of the security sold. The proceeds of the short sale are retained by the broker, to the extent necessary to meet margin requirements, until the short position is closed out. A gain, limited to the price at which a Fund sold the security short, or a loss, unlimited in size, will be recognized upon the close of a short sale.
Until a Fund closes its short position or replaces the borrowed security, a Fund will: (a) maintain a segregated account containing cash or liquid securities at such a level that (i) the amount deposited in the
| 252 | SEI Institutional Managed Trust / Annual Report / September 30, 2013 |
account plus the amount deposited with the broker as collateral will equal the current value of the security sold short; and (ii) the amount deposited in the segregated account plus the amount deposited with the broker as collateral will not be less than the market value of the security at the time the security was sold short, or (b) otherwise cover the Fund’s short positions. Refer to each Fund’s Schedule of Investments, Summary Schedule of Investments or Consolidated Schedule of Investments for details regarding securities sold short as of September 30, 2013, if applicable.
Swap Agreements — To the extent consistent with its Investment Objective and Strategies, a Fund may invest in swap contracts as an efficient means to synthetically obtain exposure to securities or baskets of securities and to manage a Fund’s interest rate duration and yield curve exposure. Swap contracts may also be used to mitigate a Fund’s overall level of risk and/or a Fund’s risk to particular types of securities, currencies or market segments. Interest rate swaps may further be used to manage a Fund’s yield spread sensitivity. A Fund may buy credit default swaps in an attempt to manage credit risk where a Fund has credit exposure to an issuer, and a Fund may sell credit default swaps to more efficiently gain credit exposure to a security or basket of securities. A swap agreement is a two-party contract under which an agreement is made to exchange returns from predetermined investments or instruments, including a particular interest rate, foreign currency, or “basket” of securities representing a particular index. Swap agreements are privately negotiated in the over-the-counter market (“OTC swaps”) or may be executed in a multilateral or other trade facility platform, such as a registered commodities exchange (“Centrally Cleared swaps”). Interest rate swaps involve the exchange by a Fund with another party of their respective commitments to pay or receive interest (e.g., an exchange of floating rate payments for fixed rate payments) with respect to a notional amount of principal. Credit-default swaps involve periodic payments by a Fund or counterparty based on a specified rate multiplied by a notional amount assigned to an underlying debt instrument or group of debt instruments in exchange for the assumption of credit risk on the same instruments. In the event of a credit event, usually in the form of a credit rating downgrade, the party receiving periodic payments (i.e. floating rate payer) must pay the other party (i.e. fixed rate payer) an amount equal to the recovery rate used to settle the contracts. The recovery rate is a function of how many credit default swap investors wish to deliver the security or receive the security. The recovery rate is determined through an auction process. Total return swaps allow an investor to benefit from the cash flow without ever actually owning the underlying security. The receiver must pay any decline in value to the payer at the end of the total return swap. However, the investor does not need to make a payment if there is no decline in price. Payments can be made on various indices, bonds (i.e. mortgage backed securities, bank debt and corporate), loans or commodities. The value of a total return swap is equal to the change in value of the underlying asset versus the accrued income payment based on LIBOR or some other form of indices on the notional amount. Interest rate swaps involve the exchange by a Fund with another party of their respective
commitments to pay or receive interest (e.g., an exchange of floating rate payments for fixed rate payments) with respect to a notional amount of principal to manage a Fund’s exposure to interest rates. Payments received or made are recorded as realized gains or loss. A Fund could be exposed to credit or market risk due to unfavorable changes in the fluctuation of interest rates or if the counterparty defaults on its obligation to perform. Risk of loss may exceed amounts recognized on the statement of assets and liabilities. Interest rate swap contracts outstanding at period end, if any, are listed after a Fund’s portfolio. In connection with swap agreements securities may be set aside as collateral by a Fund’s custodian.
Swaps are marked-to-market daily based upon quotations from market makers and the resulting changes in market values, if any, are recorded as an unrealized gain or loss in the Statement of Operations or Consolidated Statement of Operations. Net payments of interest are recorded as realized gains or losses. Daily changes in valuation of Centrally Cleared swaps, if any, are recorded as a receivable or payable for the change in value as appropriate (“variation margin”) on the Statements of Assets and Liabilities.
Entering into swap agreements involves, to varying degrees, elements of credit and market risk in excess of the amounts recognized on the Statement of Assets and Liabilities or Consolidated Statement of Assets and Liabilities. Such risks involve the possibility that there will be no liquid market for these agreements, that the counterparty to the agreement may default on its obligation to perform and that there may be unfavorable changes in the fluctuation of interest rates. Risks also arise from potential losses from adverse market movements.
This risk is mitigated by having a master netting arrangement between a Fund and the counterparty and by having the counterparty post collateral to cover a Fund’s exposure to the counterparty. See Note 3 for further details. Refer to each Fund’s Schedule of Investments, Summary Schedule of Investments or Consolidated Schedule of Investments. for details regarding open swap agreements as of September 30, 2013, if applicable.
Delayed Delivery Transactions — To the extent consistent with its Investment Objective and Strategies, a Fund may purchase or sell securities on a when-issued or delayed delivery basis. These transactions involve a commitment by the Fund to purchase or sell securities for a predetermined price or yield, with payment and delivery taking place beyond the customary settlement period. When delayed delivery purchases are outstanding, the Fund will set aside liquid assets in an amount sufficient to meet the purchase price. When purchasing a security on a delayed delivery basis, the Fund assumes the rights and risks of ownership of the security, including the risk of price and yield fluctuations, and takes such fluctuations into account when determining its net asset value. The Fund may dispose of or renegotiate a delayed delivery transaction after it is entered into, and may sell when-issued securities before they are delivered, which may result in a capital gain or loss. When the Fund has sold a security on a delayed delivery basis, the Fund does not participate in future gains and losses with respect to the security.
| SEI Institutional Managed Trust / Annual Report / September 30, 2013 | 253 |
Notes to Financial Statements/Consolidated Notes to Financial Statements (Continued)
September 30, 2013
Collateralized Debt Obligations — To the extent consistent with its Investment Objective and Strategies, a Fund may invest in collateralized debt obligations (“CDOs”), which include collateralized loan obligations (“CLOs”) and other similarly structured securities. CLOs are a type of asset-backed securities. A CLO is a trust typically collateralized by a pool of loans, which may include, among others, domestic and foreign senior secured loans, senior unsecured loans, and subordinate corporate loans, including loans that may be rated below investment grade or equivalent unrated loans. CDOs may charge management fees and administrative expenses.
For CDOs, the cash flows from the trust are split into two or more portions, called tranches, varying in risk and yield. The riskiest portion is the “equity” tranche which bears the bulk of defaults from the bonds or loans in the trust and serves to protect the other, more senior tranches from default in all but the most severe circumstances. Since it is partially protected from defaults, a senior tranche from a CDO trust typically has a higher rating and lower yield than its underlying securities, and can be rated investment grade. Despite the protection from the equity tranche, CDO tranches can experience substantial losses due to actual defaults, increased sensitivity to defaults due to collateral default and disappearance of protecting tranches, market anticipation of defaults, as well as aversion to CDO securities as a class.
The risks of an investment in a CDO depend largely on its Class and its collateral securities. Normally, CLOs and other CDOs are privately offered and sold, and thus, are not registered under the securities laws. As a result, investments in CDOs may be characterized by the Funds as illiquid securities; however, an active dealer market may
exist for CDOs, allowing a CDO to qualify for Rule 144A transactions. In addition to the normal risks associated with fixed income securities (e.g., interest rate risk and default risk), CDOs carry additional risks including, but not limited to: (i) the possibility that distributions from collateral securities will not be adequate to make interest or other payments; (ii) the quality of the collateral may decline in value or default; (iii) the Funds may invest in CDOs that are subordinate to other classes; and (iv) the complex structure of the security may not be fully understood at the time of investment and may produce disputes with the issuer or unexpected investment results.
Illiquid Securities — A security is considered illiquid if it cannot be sold or disposed of in the ordinary course of business within seven days or less for its approximate carrying value on the books of a Fund. Valuations of illiquid securities may differ significantly from the values that would have been used had an active market value for these securities existed.
Restricted Securities — At September 30, 2013, the following Funds owned private placement investments that were purchased through private offerings or acquired through initial public offerings and cannot be sold without prior registration under the Securities Act of 1933 or pursuant to an exemption therefrom. In addition, the Funds have generally agreed to further restrictions on the disposition of certain holdings as set forth in various agreements entered into in connection with the purchase of these investments. These investments are valued at fair value as determined in accordance with the procedures approved by the Board of Trustees. The acquisition dates of these investments, the enforceable right to acquire these securities, along with their cost and values at September 30, 2013, were as follows:
| Number of Shares/ Face Amount ($ Thousands) | Acquisition Date | Right to Acquire Date | Cost ($ Thousands) | Market Value ($ Thousands) | % of Net Assets | |||||||||||||||||||
| Small Cap Fund | ||||||||||||||||||||||||
Titanium Asset Management PIPE | 6,111 | 10/6/09 | 10/6/09 | $ | 24 | $ | 5 | 0.00 | % | |||||||||||||||
|
|
|
|
|
| |||||||||||||||||||
| Small Cap Growth Fund | ||||||||||||||||||||||||
Titanium Asset Management PIPE | 140,900 | 6/14/07 | 04/20/07 | $ | 845 | $ | 111 | 0.03 | % | |||||||||||||||
Value Creation | 145,600 | 08/10/06 | 08/10/06 | 1,491 | 74 | 0.02 | ||||||||||||||||||
|
|
|
|
|
| |||||||||||||||||||
| $ | 2,336 | $ | 185 | 0.05 | % | |||||||||||||||||||
|
|
|
|
|
| |||||||||||||||||||
| Enhanced Income | ||||||||||||||||||||||||
JHT Holding, 2nd Lien | 51,704 | 12/16/08 | 12/16/08 | $ | 52 | $ | 17 | 0.01 | % | |||||||||||||||
|
|
|
|
|
| |||||||||||||||||||
| High Yield Bond Fund | ||||||||||||||||||||||||
Aventine (Escrow Security) | $ | 2,750 | 04/21/10 | 04/21/10 | $ | — | $ | 1 | 0.00 | % | ||||||||||||||
CUI Acquisition Warrants | 47,444 | 09/06/11 | 09/06/11 | 4,033 | 480 | 0.02 | ||||||||||||||||||
CUI Acquisition Warrants, Cl J | 1 | 09/06/11 | 09/06/11 | — | 90 | 0.01 | ||||||||||||||||||
Momentive Performance Materials PIK | 2,222 | 12/07/40 | 12/07/10 | 2,098 | 1,852 | 0.09 | ||||||||||||||||||
United Air Lines | 277 | 10/30/06 | 10/30/06 | 193 | 72 | 0.00 | ||||||||||||||||||
VSS AHC, Cl A | 27,106 | 10/08/09 | 10/08/09 | 485 | 163 | 0.01 | ||||||||||||||||||
|
|
|
|
|
| |||||||||||||||||||
| $ | 6,809 | $ | 2,658 | 0.13 | ||||||||||||||||||||
|
|
|
|
|
| |||||||||||||||||||
CI — Class
PIK — Payment-In-Kind
PIPE — Private Investment In Public Entity
| 254 | SEI Institutional Managed Trust / Annual Report / September 30, 2013 |
Dividends and Distributions to Shareholders — Dividends from net investment income are declared and paid to shareholders quarterly for the Large Cap, Large Cap Value, Large Cap Growth, Tax-Managed Large Cap, S&P 500 Index, Small Cap, Small Cap Value, Small Cap Growth, Tax-Managed Small/Mid Cap, Mid-Cap, U.S. Managed Volatility, Tax-Managed Managed Volatility, Real Estate, Enhanced Income, Real Return, Multi-Strategy Alternative, Multi-Asset Accumulation and Multi-Asset Inflation Managed Funds; are declared and paid annually for the Global Managed Volatility Fund; are declared daily and paid monthly for the Core Fixed Income, U.S. Fixed Income, High Yield Bond, the Multi-Asset Income and Multi-Asset Capital Stability Funds. Any net realized capital gains on sales of securities are distributed to shareholders at least annually. Dividends and distributions are recorded on the ex-dividend date.
Investments in Real Estate Investment Trust — With respect to the Real Estate Fund, dividend income is recorded based on the income included in distributions received from the Real Estate Investment Trust (“REIT”) investments using published REIT reclassifications including some management estimates when actual amounts are not available. Distributions received in excess of this estimated amount are recorded as a reduction of the cost of investments or reclassified to capital gains. The actual amounts of income, return of capital, and capital gains are only determined by each REIT after its fiscal year-end, and may differ from the estimated amounts.
Investment in Subsidiary — Each of the Multi-Asset Accumulation and Multi-Asset Inflation Managed Funds may invest in its own Subsidiary. By investing in a Subsidiary, each Fund is indirectly exposed to the risks associated with such Subsidiary’s investments. The commodity-related instruments held by a Subsidiary are generally similar to those that are permitted to be held by the applicable Fund and are subject to the same risks that apply to similar investments if held directly by the Fund. A Subsidiary, however, is not registered under the 1940 Act and will not be subject to all of the investor protections of the 1940 Act. Thus, the Multi-Asset Accumulation and Multi-Asset Inflation Managed Funds, as investors in their respective Subsidiary, will not have all of the protections offered to investors in registered investment companies.
However, each Fund wholly owns and controls its respective Subsidiary, and the Funds and the Subsidiaries are all managed by SIMC, making it unlikely that a Subsidiary will take action contrary to the interests of the applicable Fund or its shareholders. While a Subsidiary has its own Board of Directors (“Board”) that is responsible for overseeing the operations of such Subsidiary, the respective Fund’s Board has oversight responsibility for the investment activities of the Fund, including its investment in the respective Subsidiary, and the Fund’s role as the sole shareholder of such Subsidiary. It is not currently expected that shares of any Subsidiary will be sold or offered to investors other than the respective Fund.
Changes in the laws of the United States and/or the Cayman Islands or governmental interpretation of such laws, under which the Funds
and the Subsidiaries, respectively, are organized, could result in the inability of a Fund and/or its respective Subsidiary to operate as intended and could negatively affect the Funds and their shareholders. For example, Cayman Islands law does not currently impose any income, corporate or capital gains tax, estate duty, inheritance tax, gift tax or withholding tax on the Subsidiaries. If Cayman Islands law changes such that the Subsidiaries must pay Cayman Islands governmental authority taxes, Fund shareholders would likely suffer decreased investment return.
Redemption Fees — The Funds charge a redemption fee based on a redemption, or a series of redemptions from a single identifiable source that in the aggregate exceed a specified dollar threshold within any thirty day period, as presented below:
| Dollar Threshold ($Thousands) | Redemption Fee | |||||||
Large Cap Fund | $ | 50,000 | 0.50 | % | ||||
Large Cap Value Fund | 50,000 | 0.50 | ||||||
Large Cap Growth Fund | 50,000 | 0.50 | ||||||
Tax-Managed Large Cap Fund | 50,000 | 0.50 | ||||||
S&P 500 Index Fund | 50,000 | 0.15 | ||||||
Small Cap Fund | 25,000 | 1.00 | ||||||
Small Cap Value Fund | 25,000 | 1.00 | ||||||
Small Cap Growth Fund | 25,000 | 1.00 | ||||||
Tax-Managed Small/Mid Cap Fund | 25,000 | 1.00 | ||||||
Mid-Cap Fund | 10,000 | 0.75 | ||||||
U.S. Managed Volatility Fund | 25,000 | 0.50 | ||||||
Global Managed Volatility Fund | 25,000 | 0.75 | ||||||
Tax-Managed Managed Volatility Fund | 25,000 | 0.50 | ||||||
Real Estate Fund | 10,000 | 1.00 | ||||||
Enhanced Income Fund | 10,000 | 0.75 | ||||||
Core Fixed Income Fund | 50,000 | 0.60 | ||||||
U.S. Fixed Income Fund | 50,000 | 0.60 | ||||||
High Yield Bond Fund | 25,000 | 1.00 | ||||||
Real Return Fund | 10,000 | 0.25 | ||||||
Multi-Strategy Alternative Fund | 25,000 | 0.25 | ||||||
Multi-Asset Accumulation Fund | 25,000 | 0.75 | ||||||
Multi-Asset Income Fund | 25,000 | 0.50 | ||||||
Multi-Asset Inflation Managed Fund | 25,000 | 0.75 | ||||||
Multi-Asset Capital Stability Fund | 10,000 | 0.25 | ||||||
For the year ended September 30, 2013, the Funds did not charge any redemption fees. Such fees, if any, are retained by the Funds for the benefit of the remaining shareholders.
3. CREDIT DERIVATIVES
A Fund may use credit default swaps to reduce risk where a Fund has exposure to the issuer, or to take an active long or short position with respect to the likelihood of an event of default. The reference obligation of the swap can be a single issuer, a “basket” of issuers, or an index. The underlying referenced assets are corporate debt, sovereign debt and asset backed securities.
The buyer of a credit default swap is generally obligated to pay the seller a periodic stream of payments over the term of the contract in return for a contingent payment upon the occurrence of a credit event with respect to an underlying reference obligation. Generally, a credit event for corporate or sovereign reference obligations means bankruptcy, failure to pay, obligation acceleration, repudiation/moratorium or restructuring. For credit default swaps on asset-backed securities, a
| SEI Institutional Managed Trust / Annual Report / September 30, 2013 | 255 |
Notes to Financial Statements/Consolidated Notes to Financial Statements (Continued)
September 30, 2013
credit event may be triggered by events such as failure to pay principal, maturity extension, rating downgrade or write-down.
If a Fund is a seller of protection, and a credit event occurs, as defined under the terms of that particular swap agreement, a Fund will generally either (i) pay to the buyer an amount equal to the notional amount of the swap and take delivery of the referenced obligation, other deliverable obligations, or underlying securities comprising a referenced index or (ii) pay a net settlement amount in the form of cash or securities equal to the notional amount of the swap less the recovery value of the referenced obligation or underlying securities comprising a referenced index.
If a Fund is a buyer of protection and a credit event occurs, as defined under the terms of that particular swap agreement, a Fund will either (i) receive from the seller of protection an amount equal to the notional amount of the swap and deliver the referenced obligation, other deliverable obligations or underlying securities comprising the
referenced index or (ii) receive a net settlement amount in the form of cash or securities equal to the notional amount of the swap less the recovery value of the referenced obligation or underlying securities comprising the referenced index. Recovery values are assumed by market makers considering either industry standard recovery rates or entity specific factors and considerations until a credit event occurs. If a credit event has occurred, the recovery value is determined by a facilitated auction whereby a minimum number of allowable broker bids, together with a specified valuation method, are used to calculate the settlement value.
Certain Funds are party to International Swap Dealers Association, Inc. Master Agreements (“ISDA Master Agreements”). These agreements are with select counterparties and they govern transactions, including certain over-the counter derivative and foreign exchange contracts, entered into by the Funds and the counterparty.
As of September 30, 2013, the High Yield Bond Fund and Multi-Asset Capital Stability Fund are the buyers (“receiving protection”) on a total notional amount of $16.8 million and $24.1 million, respectively. As of September 30, 2013, the Core Fixed Income Fund, Multi-Asset Inflation Managed Fund and Multi-Asset Capital Stability Fund are the sellers (“providing protection”) on a total notional amount of $1.6 million, $5.1 million and $53.5 million respectively. The notional amounts of the swaps are not recorded in the financial statements. The notional amounts approximate the maximum potential amount of future payments that the Fund could be required to make if the Fund was the seller of protection and a credit event was to occur. Those credit default swaps (“CDS”) for which the Fund is providing protection at the balance sheet date are summarized as follows:
| CORE FIXED INCOME FUND WRITTEN CREDIT DERIVATIVE CONTRACTS | SINGLE NAME CDS | CDS ON AN INDEX | ||||||||||||||||||
| REFERENCE ASSET | CORP US$ | SOVEREIGN US$ | ABS US$ | CORP US$ | Total | |||||||||||||||
Fair value of written credit derivatives | $ | 3,475 | — | — | — | $ | 3,475 | |||||||||||||
Maximum potential amount of future payments | $ | 1,590,000 | — | — | — | $ | 1,590,000 | |||||||||||||
Recourse provisions with third parties to recover any amounts paid under the credit derivative (including any purchased credit protection)1 | — | — | — | — | — | |||||||||||||||
Collateral held that the Fund can obtain upon occurrence of triggering event | — | — | — | — | — | |||||||||||||||
| MULTI-ASSET INFLATION MANAGED FUND WRITTEN CREDIT DERIVATIVE CONTRACTS | SINGLE NAME CDS | CDS ON AN INDEX | ||||||||||||||||||
| REFERENCE ASSET | CORP US$ | SOVEREIGN US$ | ABS US$ | CORP US$ | Total | |||||||||||||||
Fair value of written credit derivatives | $ | 7,661 | $ | 55,530 | — | $ | 58,560 | $ | 121,751 | |||||||||||
Maximum potential amount of future payments | $ | 500,000 | $ | 744,511 | — | $ | 3,760,000 | $ | 5,004,511 | |||||||||||
Recourse provisions with third parties to recover any amounts paid under the credit derivative (including any purchased credit protection)1 | — | — | — | — | — | |||||||||||||||
Collateral held that the Fund can obtain upon occurrence of triggering event | — | — | — | — | — | |||||||||||||||
| MULTI-ASSET CAPITAL STABILITY FUND WRITTEN CREDIT DERIVATIVE CONTRACTS | SINGLE NAME CDS | CDS ON AN INDEX | ||||||||||||||||||
| REFERENCE ASSET | CORP US$ | SOVEREIGN US$ | ABS US$ | CORP US$ | Total | |||||||||||||||
Fair value of written credit derivatives | — | $ | 188,383 | $ | (224,270 | ) | $ | 1,272,388 | $ | 1,236,501 | ||||||||||
Maximum potential amount of future payments | — | $ | 24,120,000 | $ | 2,330,000 | $ | 27,070,237 | $ | 53,520,237 | |||||||||||
Recourse provisions with third parties to recover any amounts paid under the credit derivative (including any purchased credit protection)1 | — | — | — | — | — | |||||||||||||||
Collateral held that the Fund can obtain upon occurrence of triggering event | — | — | — | — | — | |||||||||||||||
| 1 | Potential recoveries would include purchased credit derivatives to the extent they offset written credit derivatives which have an identical underlying, or a netting arrangement or credit support annex with the counterparty. There may be other potential recoveries from recourse provisions where agreements cover multiple derivative arrangements but those amounts have not been included. |
| 256 | SEI Institutional Managed Trust / Annual Report / September 30, 2013 |
| MAXIMUM POTENTIAL AMOUNT OF FUTURE PAYMENTS BY CONTRACT TERM | ||||||||||||||||||||||||
| CORE FIXED INCOME FUND | 0-6 MONTHS | 6-12 MONTHS | 1-5 YEARS | 5-10 YEARS | > 10 YEARS | Total | ||||||||||||||||||
Current credit spread* on underlying (in basis points) | ||||||||||||||||||||||||
0-400 | — | — | — | $ | 1,590,000 | — | $ | 1,590,000 | ||||||||||||||||
> than 400 | — | — | — | — | — | — | ||||||||||||||||||
Total | — | — | — | $ | 1,590,000 | — | $ | 1,590,000 | ||||||||||||||||
| MAXIMUM POTENTIAL AMOUNT OF FUTURE PAYMENTS BY CONTRACT TERM | ||||||||||||||||||||||||
| MULTI-ASSET INFLATION MANAGED FUND | 0-6 MONTHS | 6-12 MONTHS | 1-5 YEARS | 5-10 YEARS | > 10 YEARS | Total | ||||||||||||||||||
Current credit spread* on underlying (in basis points) | ||||||||||||||||||||||||
0-200 | — | — | $ | 5,004,511 | — | — | $ | 5,004,511 | ||||||||||||||||
> than 200 | — | — | — | — | — | — | ||||||||||||||||||
Total | — | — | $ | 5,004,511 | — | — | $ | 5,004,511 | ||||||||||||||||
| MAXIMUM POTENTIAL AMOUNT OF FUTURE PAYMENTS BY CONTRACT TERM | ||||||||||||||||||||||||
| MULTI-ASSET CAPITAL STABILITY FUND | 0-6 MONTHS | 6-12 MONTHS | 1-5 YEARS | 5-10 YEARS | > 10 YEARS | Total | ||||||||||||||||||
Current credit spread* on underlying (in basis points) | ||||||||||||||||||||||||
0-200 | — | — | $ | 36,282,194 | $ | 2,778,414 | — | $ | 39,060,608 | |||||||||||||||
201-400 | — | — | 8,228,167 | 3,901,462 | $ | 2,330,000 | 14,459,629 | |||||||||||||||||
> than 400 | — | — | — | — | — | — | ||||||||||||||||||
Total | — | — | $ | 44,510,361 | $ | 6,679,876 | $ | 2,330,000 | $ | 53,520,237 | ||||||||||||||
| * | The credit spread on the underlying asset is generally indicative of the current status of the underlying risk of the Fund having to perform. The spread also reflects the cost of buying/selling protection and may include upfront payments required to be made to enter into a contract. Higher credit spreads with a shorter contract term is indicative of a higher likelihood of performance by the Fund. |
The credit spread disclosed above for each reference obligation where the Fund is the seller of protection is a representation of the current payment/performance risk of the swap.
4. DERIVATIVE TRANSACTIONS
The following tables include only Funds that had exposure to more than one type of risk on derivatives held throughout the year. For Funds that held derivatives throughout the year with only one type of risk exposure, additional information can be found on the Summary Schedule of Investments, Schedule of Investments or Consolidated Schedule of Investments and the Statement of Operations or Consolidated Statement of Operations.
The fair value of derivative instruments as of September 30, 2013 was as follows:
| Asset Derivatives | Liability Derivatives | |||||||||||
| For the year ended September 30, 2013 ($ Thousands) | For the year ended September 30, 2013 ($ Thousands) | |||||||||||
| Statement of Assets and Liabilities/Consolidated Statements of Assets and Liabilities Location | Fair Value | Statement of Assets and Liabilities/Consolidated Statements | Fair Value | |||||||||
Derivatives not accounted for as hedging instruments: | ||||||||||||
| Global Managed Volatility Fund | ||||||||||||
Equity contracts | Net Assets — Unrealized appreciation on futures contracts | $ | 55 | * | Net Assets — Unrealized depreciation on futures contracts | $ | 315 | * | ||||
Foreign exchange contracts | Unrealized gain on forward foreign currency contracts | 186 | Unrealized loss on forward foreign currency contracts | 3,439 | ||||||||
|
|
|
| |||||||||
Total Derivatives not accounted for as hedging instruments | $ | 241 | $ | 3,754 | ||||||||
|
|
|
| |||||||||
| Core Fixed Income Fund | ||||||||||||
Interest rate contracts | Net Assets — Unrealized appreciation on futures contracts | $ | 269 | * | Net Assets — Unrealized depreciation on futures contracts | $ | 695 | * | ||||
Net Assets — Unrealized appreciation on swap contracts | 1,762 | † | Net Assets — Unrealized depreciation on swap contracts | 1,089 | † | |||||||
Options purchased, at value | — | Options written, at value | 2 | |||||||||
Swaptions purchased, at value | 1,577 | Swaptions written, at value | — | |||||||||
Foreign exchange contracts | Unrealized gain on forward foreign currency contracts | — | Unrealized loss on forward foreign currency contracts | 452 | ||||||||
Credit contracts | Net Assets — Unrealized appreciation on swap contracts | 48 | † | Net Assets — Unrealized depreciation on swap contracts | — | |||||||
|
|
|
| |||||||||
Total Derivatives not accounted for as hedging instruments | $ | 3,656 | $ | 2,238 | ||||||||
|
|
|
| |||||||||
| SEI Institutional Managed Trust / Annual Report / September 30, 2013 | 257 |
Notes to Financial Statements/Consolidated Notes to Financial Statements (Continued)
September 30, 2013
| Asset Derivatives | Liability Derivatives | |||||||||||
| For the year ended September 30, 2013 ($ Thousands) | For the year ended September 30, 2013 ($ Thousands) | |||||||||||
| Statement of Assets and Liabilities/Consolidated Statements of Assets and Liabilities Location | Fair Value | Statement of Assets and Liabilities/Consolidated Statements | Fair Value | |||||||||
| U.S. Fixed Income Fund | ||||||||||||
Interest rate contracts | Net Assets — Unrealized appreciation on futures contracts | $ | 176 | * | Net Assets — Unrealized depreciation on futures contracts | $ | 894 | * | ||||
Net Assets — Unrealized appreciation on swap contracts | 202 | Net Assets — Unrealized depreciation on swap contracts | — | † | ||||||||
Options purchased, at value | — | Options written, at value | 1 | |||||||||
|
|
|
| |||||||||
Total Derivatives not accounted for as hedging instruments | $ | 378 | $ | 895 | ||||||||
|
|
|
| |||||||||
| Multi-Asset Accumulation Fund | ||||||||||||
Interest rate contracts | Net Assets — Unrealized appreciation on futures contracts | $ | 10,881 | * | Net Assets — Unrealized depreciation on futures contracts | $ | — | * | ||||
Net Assets — Unrealized appreciation on swap contracts | 4,889 | † | Net Assets — Unrealized depreciation on swap contracts | — | ||||||||
Equity contracts | Net Assets — Unrealized appreciation on futures contracts | 2,182 | * | Net Assets — Unrealized depreciation on futures contracts | 3,465 | * | ||||||
Net Assets — Unrealized appreciation on swaps contracts | 507 | † | Net Assets — Unrealized depreciation on swap contracts | 257 | † | |||||||
Foreign exchange contracts | Unrealized gain on forward foreign currency contracts | 2,534 | Unrealized loss on forward foreign currency contracts | 6,863 | ||||||||
Commodity contracts | Net Assets — Unrealized appreciation on futures contracts | 2,282 | * | Net Assets — Unrealized depreciation on futures contracts | 2,527 | * | ||||||
Net Assets — Unrealized appreciation on swaps contracts | 108 | † | Net Assets — Unrealized depreciation on swap contracts | 3,554 | † | |||||||
|
|
|
| |||||||||
Total Derivatives not accounted for as hedging instruments | $ | 23,383 | $ | 16,666 | ||||||||
|
|
|
| |||||||||
| Multi-Asset Income Fund | ||||||||||||
Interest rate contracts | Net Assets — Unrealized appreciation on swap contracts | $ | — | Net Assets — Unrealized depreciation on swap contracts | $ | 125 | ||||||
Equity contracts | Options purchased, at value | 102 | Options written, at value | 27 | ||||||||
|
|
|
| |||||||||
Total Derivatives not accounted for as hedging instruments | $ | 102 | $ | 152 | ||||||||
|
|
|
| |||||||||
| Multi-Asset Inflation Managed Fund | ||||||||||||
Interest rate contracts | Net Assets — Unrealized appreciation on futures contracts | — | Net Assets — Unrealized depreciation on futures contracts | 1,326 | * | |||||||
Net Assets — Unrealized appreciation on swap contracts | 630 | Net Assets — Unrealized depreciation on swap contracts | 289 | |||||||||
Equity contracts | Net Assets — Unrealized appreciation on swaps contracts | 1,171 | † | Net Assets — Unrealized depreciation on swap contracts | 1,778 | † | ||||||
Options purchased, at value | — | Options written, at value | — | |||||||||
Foreign exchange contracts | Unrealized gain on forward foreign currency contracts | 211 | Unrealized loss on forward foreign currency contracts | 3,269 | ||||||||
Commodity contracts | Net Assets — Unrealized appreciation on futures contracts | 697 | * | Net Assets — Unrealized depreciation on futures contracts | 646 | * | ||||||
Net Assets — Unrealized appreciation on swaps contracts | — | † | Net Assets — Unrealized depreciation on swap contracts | — | † | |||||||
Credit contracts | Net Assets — Unrealized appreciation on swap contracts | — | † | Net Assets — Unrealized depreciation on swap contracts | — | † | ||||||
|
|
|
| |||||||||
Total Derivatives not accounted for as hedging instruments | 2,709 | 7,308 | ||||||||||
|
|
|
| |||||||||
| 258 | SEI Institutional Managed Trust / Annual Report / September 30, 2013 |
| Asset Derivatives | Liability Derivatives | |||||||||||
| For the year ended September 30, 2013 ($ Thousands) | For the year ended September 30, 2013 ($ Thousands) | |||||||||||
| Statement of Assets and Liabilities/Consolidated Statements of Assets and Liabilities Location | Fair Value | Statement of Assets and Liabilities/Consolidated Statements | Fair Value | |||||||||
| Multi-Asset Capital Stability Fund | ||||||||||||
Interest rate contracts | Net Assets — Unrealized appreciation on futures contracts | $ | 393 | * | Net Assets — Unrealized depreciation on futures contracts | — | ||||||
Net Assets — Unrealized appreciation on swap contracts | 271 | † | Net Assets — Unrealized depreciation on swap contracts | $ | 519 | † | ||||||
Options purchased, at value | 472 | Options written, at value | 605 | |||||||||
Equity contracts | Net Assets — Unrealized appreciation on futures contracts | 139 | * | Net Assets — Unrealized depreciation on futures contracts | 135 | * | ||||||
Foreign exchange contracts | Unrealized gain on forward foreign currency contracts | 725 | Unrealized loss on forward foreign currency contracts | 538 | ||||||||
Credit contracts | Net Assets — Unrealized appreciation on swap contracts | 59 | † | Net Assets — Unrealized depreciation on swap contracts | 141 | † | ||||||
|
|
|
| |||||||||
Total Derivatives not accounted for as hedging instruments | $ | 2,059 | $ | 1,938 | ||||||||
|
|
|
| |||||||||
| * | Includes cumulative appreciation/depreciation of futures contracts as reported in the Summary Schedules of Investments, Schedules of Investments on Consolidated Schedule of Investments. Only current day’s variation margin is reported within the Statements of Assets & Liabilities or Consolidated Statements of Assets and Liabilities. |
| † | Includes cumulative appreciation/depreciation of swap contracts as reported in the Schedules of Investments or Consolidated Schedule of Investments. Market Value is reported within the Statements of Assets & Liabilities or Consolidated Statements of Assets and Liabilities for swap contracts that have paid premiums. |
The effect of derivative instruments on the Statement of Operations for the year ended September 30, 2013.
Amount of Realized Gain or (Loss) on Derivatives Recognized in Income ($ Thousands):
| Derivatives Not Accounted for as Hedging Instruments | Swaptions | Options | Futures | Forward Currency Contracts | Swaps | Total | ||||||||||||||||||
Global Managed Volatility Fund | ||||||||||||||||||||||||
Equity contracts | $ | — | $ | — | $ | 11,996 | $ | — | $ | — | $ | 11,996 | ||||||||||||
Foreign exchange contracts | — | — | — | 52,179 | — | 52,179 | ||||||||||||||||||
Total | $ | — | $ | — | $ | 11,996 | $ | 52,179 | $ | — | $ | 64,175 | ||||||||||||
Core Fixed Income Fund | ||||||||||||||||||||||||
Interest rate contracts | $ | 275 | $ | 361 | $ | 5,851 | $ | — | $ | (302 | ) | $ | 6,185 | |||||||||||
Foreign exchange contracts | — | — | — | 1,257 | — | 1,257 | ||||||||||||||||||
Credit contracts | — | 46 | — | — | (2,717 | ) | (2,671 | ) | ||||||||||||||||
Total | $ | 275 | $ | 407 | $ | 5,851 | $ | 1,257 | $ | (3,019 | ) | $ | 4,771 | |||||||||||
U.S. Fixed Income Fund | ||||||||||||||||||||||||
Interest rate contracts | $ | — | $ | 114 | $ | 3,559 | $ | — | $ | (180 | ) | $ | 3,493 | |||||||||||
Foreign exchange contracts | — | — | — | 342 | — | 342 | ||||||||||||||||||
Credit contracts | — | — | — | — | (1 | ) | (1 | ) | ||||||||||||||||
Total | $ | — | $ | 114 | $ | 3,559 | $ | 342 | $ | (181 | ) | $ | 3,834 | |||||||||||
Multi-Asset Accumulation Fund | ||||||||||||||||||||||||
Interest rate contracts | $ | — | $ | — | $ | (30,550 | ) | $ | — | $ | (10,800 | ) | $ | (41,350 | ) | |||||||||
Equity contracts | — | — | 75,466 | — | 752 | 76,218 | ||||||||||||||||||
Foreign exchange contracts | — | — | — | (16,535 | ) | — | (16,535 | ) | ||||||||||||||||
Commodity contracts | — | — | (16,478 | ) | — | 391 | (16,087 | ) | ||||||||||||||||
Total | $ | — | $ | — | $ | 28,438 | $ | (16,535 | ) | $ | (9,657 | ) | $ | 2,246 | ||||||||||
Multi-Asset Income Fund | ||||||||||||||||||||||||
Interest rate contracts | $ | — | $ | — | $ | — | $ | — | $ | 230 | $ | 230 | ||||||||||||
Equity contracts | — | 176 | — | — | — | 176 | ||||||||||||||||||
Commodity contracts | — | — | — | — | — | — | ||||||||||||||||||
Total | $ | — | $ | 176 | $ | — | $ | — | $ | 230 | $ | 406 | ||||||||||||
Multi-Asset Inflation Managed Fund | ||||||||||||||||||||||||
Interest rate contracts | $ | — | $ | — | $ | 2,640 | $ | — | $ | (62 | ) | $ | 2,578 | |||||||||||
Equity contracts | — | (1,337 | ) | — | — | (19,066 | ) | (20,403 | ) | |||||||||||||||
Foreign exchange contracts | — | — | — | 2,636 | — | 2,636 | ||||||||||||||||||
Commodity contracts | — | 13 | 1,406 | — | (17,151 | ) | (15,732 | ) | ||||||||||||||||
Credit contracts | — | — | — | — | 88 | 88 | ||||||||||||||||||
Total | $ | — | $ | (1,324 | ) | $ | 4,046 | $ | 2,636 | $ | (36,191 | ) | $ | (30,833 | ) | |||||||||
| SEI Institutional Managed Trust / Annual Report / September 30, 2013 | 259 |
Notes to Financial Statements/Consolidated Notes to Financial Statements (Continued)
September 30, 2013
| Derivatives Not Accounted for as Hedging Instruments | Swaptions | Options | Futures | Forward Currency Contracts | Swaps | Total | ||||||||||||||||||
Multi-Asset Capital Stability Fund | ||||||||||||||||||||||||
Interest rate contracts | $ | (72 | ) | $ | — | $ | (2,835 | ) | $ | — | $ | (820 | ) | $ | (3,727 | ) | ||||||||
Equity contracts | — | (322 | ) | 6,714 | — | 1,906 | 8,298 | |||||||||||||||||
Foreign exchange contracts | — | 24 | — | 4,568 | — | 4,592 | ||||||||||||||||||
Total | $ | (72 | ) | $ | (298 | ) | $ | 3,879 | $ | 4,568 | $ | 1,086 | $ | 9,163 | ||||||||||
Change in Unrealized Appreciation or (Depreciation) on Derivatives Recognized in Income ($ Thousands):
| Derivatives Not Accounted for as Hedging Instruments | Swaptions | Options | Futures | Forward Currency Contracts | Swaps | Total | ||||||||||||||||||
| Global Managed Volatility Fund | ||||||||||||||||||||||||
Equity contracts | $ | — | $ | — | $ | 71 | $ | — | $ | — | $ | 71 | ||||||||||||
Foreign exchange contracts | — | — | — | (5,496 | ) | — | (5,496 | ) | ||||||||||||||||
Total | $ | — | $ | — | $ | 71 | $ | (5,496 | ) | $ | — | $ | (5,425 | ) | ||||||||||
| Core Fixed Income Fund | ||||||||||||||||||||||||
Interest rate contracts | $ | 522 | $ | (196 | ) | $ | (2 | ) | $ | — | $ | 925 | $ | 1,249 | ||||||||||
Foreign exchange contracts | — | — | — | 704 | — | 704 | ||||||||||||||||||
Credit contracts | — | — | — | — | 2,547 | 2,547 | ||||||||||||||||||
Total | $ | 522 | $ | (196 | ) | $ | (2 | ) | $ | 704 | $ | 3,472 | $ | 4,500 | ||||||||||
| U.S. Fixed Income Fund | ||||||||||||||||||||||||
Interest rate contracts | $ | — | $ | (1 | ) | $ | (513 | ) | $ | — | $ | 248 | $ | (266 | ) | |||||||||
Foreign exchange contracts | — | — | — | 50 | — | 50 | ||||||||||||||||||
Credit contracts | — | — | — | — | 148 | 148 | ||||||||||||||||||
Total | $ | — | $ | (1 | ) | $ | (513 | ) | $ | 50 | $ | 396 | $ | (68 | ) | |||||||||
| Multi-Asset Accumulation Fund | ||||||||||||||||||||||||
Interest rate contracts | $ | — | $ | — | $ | 9,454 | $ | — | $ | 2,930 | $ | 12,384 | ||||||||||||
Equity contracts | — | — | 4,294 | — | 872 | 5,166 | ||||||||||||||||||
Foreign exchange contracts | — | — | — | (5,529 | ) | — | (5,529 | ) | ||||||||||||||||
Commodity contracts | — | — | (3,020 | ) | — | (3,840 | ) | (6,860 | ) | |||||||||||||||
Total | $ | — | $ | — | $ | 10,728 | $ | (5,529 | ) | $ | (38 | ) | $ | 5,161 | ||||||||||
| Multi-Asset Income Fund | ||||||||||||||||||||||||
Interest rate contracts | $ | — | $ | (65 | ) | $ | — | $ | — | $ | (125 | ) | $ | (190 | ) | |||||||||
Equity contracts | — | 287 | — | — | — | 287 | ||||||||||||||||||
Total | $ | — | $ | 222 | $ | — | $ | — | $ | (125 | ) | $ | 97 | |||||||||||
| Multi-Asset Inflation Managed Fund | ||||||||||||||||||||||||
Interest rate contracts | $ | — | $ | — | $ | (1,177 | ) | $ | — | $ | 515 | $ | (662 | ) | ||||||||||
Equity contracts | — | 177 | — | — | (322 | ) | (145 | ) | ||||||||||||||||
Foreign exchange contracts | — | — | — | (2,459 | ) | — | (2,459 | ) | ||||||||||||||||
Commodity contracts | — | (41 | ) | (123 | ) | — | (1,822 | ) | (1,986 | ) | ||||||||||||||
Credit contracts | — | — | — | — | 93 | 93 | ||||||||||||||||||
Total | $ | — | $ | 136 | $ | (1,300 | ) | $ | (2,459 | ) | $ | (1,536 | ) | $ | (5,159 | ) | ||||||||
| Multi-Asset Capital Stability Fund | ||||||||||||||||||||||||
Interest rate contracts | $ | (518 | ) | $ | (453 | ) | $ | 227 | $ | — | $ | (248 | ) | $ | (992 | ) | ||||||||
Equity contracts | — | (20 | ) | 1,025 | — | — | 1,005 | |||||||||||||||||
Foreign exchange contracts | — | — | — | (652 | ) | — | (652 | ) | ||||||||||||||||
Credit contracts | — | — | — | — | (607 | ) | (607 | ) | ||||||||||||||||
Total | $ | (518 | ) | $ | (473 | ) | $ | 1,252 | $ | (652 | ) | $ | (855 | ) | $ | (1,246 | ) | |||||||
| 260 | SEI Institutional Managed Trust / Annual Report / September 30, 2013 |
The ISDA Master Agreements maintain provisions for general obligations, representations, agreements, collateral, and events of default or termination. The occurrence of a specified event of termination may give a counterparty the right to terminate all of its contracts and affect settlement of all outstanding transactions under the applicable ISDA Master Agreement.
Written Options transactions entered into during the year ended September 30, 2013 are summarized as follows:
| Core Fixed Income Fund | ||||||||
| Number of Contracts | Premium ($ Thousands) | |||||||
| Balance at beginning of period | 3,990,809 | $ | 364 | |||||
| Written | 13,902,091 | 916 | ||||||
| Expired | (6,911,360 | ) | (573 | ) | ||||
| Closing Buys | (1,540 | ) | (614 | ) | ||||
| Balance at end of period | 10,980,000 | $ | 93 | |||||
| U.S.Fixed Income Fund | ||||||||
| Number of Contracts | Premium ($ Thousands) | |||||||
| Balance at beginning of period | 1,490,030 | $ | 34 | |||||
| Written | 531 | 209 | ||||||
| Expired | (171 | ) | (68 | ) | ||||
| Closing Buys | (390 | ) | (158 | ) | ||||
| Balance at end of period | 1,490,000 | $ | 17 | |||||
| Multi-Asset Income Fund | ||||||||
| Number of Contracts | Premium ($ Thousands) | |||||||
| Balance at beginning of period | 3,121 | $ | 460 | |||||
| Written | 3,510 | 830 | ||||||
| Expired | (395 | ) | (51 | ) | ||||
| Closing Buys | (5,852 | ) | (1,182 | ) | ||||
| Balance at end of period | 384 | $ | 57 | |||||
| Multi-Asset Inflation Managed Fund | ||||||||
| Number of Contracts | Premium ($ Thousands) | |||||||
| Balance at beginning of period | 1,183 | $ | 403 | |||||
| Written | 460 | 314 | ||||||
| Expired | (1,108 | ) | (103 | ) | ||||
| Closing Buys | (535 | ) | (614 | ) | ||||
| Balance at end of period | — | $ | — | |||||
| Multi-Asset Capital Stability Fund | ||||||||
| Number of Contracts | Premium ($ Thousands) | |||||||
| Balance at beginning of period | — | $ | — | |||||
| Written | 123,484,273 | 1,071 | ||||||
| Expired | (37,860,352 | ) | (160 | ) | ||||
| Closing Buys | (44,051,315 | ) | (282 | ) | ||||
| Balance at end of period | 41,572,606 | $ | 629 | |||||
Written Swaptions transactions entered into during the year ended September 30, 2013 are summarized as follows:
| Multi-Asset Capital Stability Fund | ||||||||
| Notional Amount ($ Thousands) | Premium ($ Thousands) | |||||||
| Balance at beginning of period | $ | 151,500 | $ | 525 | ||||
| Written | — | — | ||||||
| Expired | — | — | ||||||
| Closing Buys | (151,500 | ) | (525 | ) | ||||
| Balance at end of period | $ | — | $ | — | ||||
At September 30, 2013 the Funds had cash and/or securities at least equal to the value of written options/written swaptions.
5. BASIS FOR CONSOLIDATION FOR THE MULTI-ASSET ACCUMULATION FUND AND MULTI-ASSET INFLATION MANAGED FUND
The consolidated Schedules of Investments, Statements of Assets and Liabilities, Statements of Operations, Statements of Changes in Net Assets, Statement of Cash Flows, and the Financial Highlights of the Multi-Asset Accumulation Fund and Multi-Asset Inflation Managed Fund include the accounts of their respective Subsidiaries. All inter-company accounts and transactions have been eliminated in consolidation for the Funds. Each of the Subsidiaries has a fiscal year end of September 30th for financial statement consolidation purposes and a nonconforming tax year end of August 31.
The Subsidiaries are classified as controlled foreign corporations under the Internal Revenue Code of 1986 (“IRC”). Each Subsidiary’s taxable income is included in the calculation of the relevant Fund’s taxable income. Net losses of the Subsidiaries are not deductible by the Funds either in the current period or carried forward to future periods.
The Multi-Asset Accumulation Fund and Multi-Asset Inflation Managed Fund may each invest up to 25% of their total assets in its respective Subsidiary.
A summary of the Funds’ investments in the Subsidiaries are as follows:
| INCEPTION DATE OF SUBSIDIARY | SUBSIDIARY NET SEPTEMBER 30, ($ THOUSANDS) | % OF TOTAL NET ASSETS AT | ||||||||
Accumulation Commodity Strategy Subsidiary, Ltd | April 9, 2012 | $ | 210,364 | 14.9 | % | |||||
Inflation Commodity Strategy Subsidiary, Ltd. | April 9, 2012 | 117,371 | 15.3 | % | ||||||
| SEI Institutional Managed Trust / Annual Report / September 30, 2013 | 261 |
Notes to Financial Statements/Consolidated Notes to Financial Statements (Continued)
September 30, 2013
6. INVESTMENT ADVISORY, ADMINISTRATION AND DISTRIBUTION AGREEMENTS, INVESTMENT SUB-ADVISORY AGREEMENTS AND OTHER TRANSACTIONS WITH AFFILIATES
Investment Advisory, Administration and Distribution Agreements — SIMC serves as investment adviser (the “Adviser”) to each Fund. In connection with serving as Adviser, SIMC is entitled to a fee, which is calculated daily and paid monthly, based on the average daily net assets of each Fund.
SEI Investments Global Funds Services (the “Administrator”) provides administrative and transfer agency services to the Funds for annual fees, based on the average daily net assets of each Fund.
SEI Investments Distribution Co. (the “Distributor”), a wholly owned subsidiary of SEI Investments Company (“SEI”) serves as each Fund’s Distributor. The Trust has adopted plans under which firms, including the Distributor, that provide shareholder and administrative services may receive compensation therefrom. Such plans provide fees payable to the Distributor, calculated as a percentage of the average daily net assets attributable to each particular class of each respective fund. Under both the Shareholder Servicing Plan and Administrative Service Plan, the Distributor may retain as profit any difference between the fee it receives and the amount it pays to third parties. During the year ended September 30, 2013, the Distributor voluntarily
waived a portion of its fee for all of the Funds except the U.S. Managed Volatility, Global Managed Volatility and Tax-Managed Managed Volatility Funds.
For the year ended September 30, 2013, the Distributor retained 100% of the shareholder servicing fees, less the shareholder servicing fee waiver, and 100% of the administration servicing fees.
The Adviser, Administrator and/or Distributor have voluntarily agreed to waive a portion of their fees in order to keep total direct operating expenses (exclusive of interest from borrowings, brokerage commissions, taxes, Trustee fees, prime broker fees, interest and dividend expenses related to short sales and extraordinary expenses not incurred in the ordinary course of the Funds’ business) at a specified level. The waivers by the Funds’ Adviser, Administrator and/or Distributor are limited to the Funds’ direct operating expenses and, therefore, do not apply to indirect expenses incurred by the Funds, such as acquired fund fees and expenses. The waivers are voluntarily and the Funds’ Adviser, Administrator and/or Distributor may discontinue all or part of any of these waivers at any time. In addition, some Funds may participate in a commission recapture program where the Funds’ trades may be executed through the Funds’ distributor, and a portion of the commissions paid on those trades are then used to pay the Funds’ expenses.
The following is a summary of annual fees payable to the Adviser, Administrator and Distributor and the voluntary expense limitations for each fund:
| Advisory Fee | Administration Fee | Shareholder Servicing Fee | Administrative Servicing Fee | Voluntary Expense Limitation | ||||||||||||||||
Large Cap Fund |
| |||||||||||||||||||
Class A | 0.3900 | % | 0.35 | % | 0.25 | % | — | 0.89 | % | |||||||||||
Large Cap Value Fund |
| |||||||||||||||||||
Class A | 0.3500 | % | 0.35 | % | 0.25 | % | — | 0.89 | % | |||||||||||
Class I | 0.3500 | % | 0.35 | % | 0.25 | % | 0.25 | % | 1.11 | % | ||||||||||
Large Cap Growth Fund |
| |||||||||||||||||||
Class A | 0.4000 | % | 0.35 | % | 0.25 | % | — | 0.89 | % | |||||||||||
Class I | 0.4000 | % | 0.35 | % | 0.25 | % | 0.25 | % | 1.11 | % | ||||||||||
Tax-Managed Large Cap Fund |
| |||||||||||||||||||
Class A | 0.4000 | % | 0.35 | % | 0.25 | % | — | 0.89 | % | |||||||||||
Class Y | 0.4000 | % | 0.15 | % | 0.15 | % | — | 0.56 | % | |||||||||||
S&P 500 Index Fund |
| |||||||||||||||||||
Class A | 0.0300 | % | 0.22 | % | 0.25 | % | — | 0.43 | % | |||||||||||
Class E | 0.0300 | % | 0.22 | % | — | — | 0.25 | % | ||||||||||||
Class I | 0.0300 | % | 0.22 | % | 0.25 | % | 0.25 | % | 0.65 | % | ||||||||||
Small Cap Fund |
| |||||||||||||||||||
Class A | 0.6500 | % | 0.35 | % | 0.25 | % | — | 1.14 | % | |||||||||||
Small Cap Value Fund |
| |||||||||||||||||||
Class A | 0.6500 | % | 0.35 | % | 0.25 | % | — | 1.14 | % | |||||||||||
Class I | 0.6500 | % | 0.35 | % | 0.25 | % | 0.25 | % | 1.36 | % | ||||||||||
Small Cap Growth Fund |
| |||||||||||||||||||
Class A | 0.6500 | % | 0.35 | % | 0.25 | % | — | 1.11 | % | |||||||||||
Class I | 0.6500 | % | 0.35 | % | 0.25 | % | 0.25 | % | 1.36 | % | ||||||||||
Tax-Managed Small/Mid Cap Fund |
| |||||||||||||||||||
Class A | 0.6500 | % | 0.35 | % | 0.25 | % | — | 1.11 | % | |||||||||||
| 262 | SEI Institutional Managed Trust / Annual Report / September 30, 2013 |
| Advisory Fee | Administration Fee | Shareholder Servicing Fee | Administrative Servicing Fee | Voluntary Expense Limitation | ||||||||||||||||
Mid-Cap Fund |
| |||||||||||||||||||
Class A | 0.4000 | % | 0.35 | % | 0.25 | % | — | 1.02 | % | |||||||||||
Class I | 0.4000 | % | 0.35 | % | 0.25 | % | 0.25 | % | 1.26 | % | ||||||||||
U.S. Managed Volatility Fund |
| |||||||||||||||||||
Class A | 0.6500 | % | 0.35 | % | 0.25 | % | — | 1.00 | % | |||||||||||
Class I | 0.6500 | % | 0.35 | % | 0.25 | % | 0.25 | % | 1.25 | % | ||||||||||
Global Managed Volatility Fund |
| |||||||||||||||||||
Class A | 0.6500 | % | 0.35 | % | 0.25 | % | — | 1.11 | % | |||||||||||
Class I | 0.6500 | % | 0.35 | % | 0.25 | % | 0.25 | % | 1.36 | % | ||||||||||
Tax-Managed Managed Volatility Fund |
| |||||||||||||||||||
Class A | 0.6500 | % | 0.35 | % | 0.25 | % | — | 1.00 | % | |||||||||||
Real Estate Fund |
| |||||||||||||||||||
Class A | 0.6500 | % | 0.35 | % | 0.25 | % | — | 1.14 | % | |||||||||||
Class I | 0.6500 | % | 0.35 | % | 0.25 | % | 0.25 | % | 1.36 | % | ||||||||||
Enhanced Income Fund |
| |||||||||||||||||||
Class A | 0.4000 | % | 0.35 | % | 0.25 | % | — | 0.60 | % | |||||||||||
Class I | 0.4000 | % | 0.35 | % | 0.25 | % | 0.25 | % | 0.85 | % | ||||||||||
Core Fixed Income Fund |
| |||||||||||||||||||
Class A | 0.2750 | % | 0.28 | % | 0.25 | % | — | 0.67 | % | |||||||||||
Class I | 0.2750 | % | 0.28 | % | 0.25 | % | 0.25 | % | 0.89 | % | ||||||||||
U.S. Fixed Income |
| |||||||||||||||||||
Class A | 0.2750 | % | 0.28 | % | 0.25 | % | — | 0.66 | % | |||||||||||
High Yield Bond Fund |
| |||||||||||||||||||
Class A | 0.4875 | % | 0.35 | % | 0.25 | % | — | 0.89 | % | |||||||||||
Class I | 0.4875 | % | 0.35 | % | 0.25 | % | 0.25 | % | 1.11 | % | ||||||||||
Real Return |
| |||||||||||||||||||
Class A | 0.2200 | % | 0.35 | % | 0.25 | % | — | 0.45 | % | |||||||||||
Multi-Strategy Alternative Fund |
| |||||||||||||||||||
Class A | 1.5000 | % | 0.35 | % | 0.25 | % | — | 0.63 | % | |||||||||||
Multi-Asset Accumulation Fund |
| |||||||||||||||||||
Class A | 0.7500 | % | 0.35 | % | 0.25 | % | — | 1.17 | % | |||||||||||
Multi-Asset Income Fund |
| |||||||||||||||||||
Class A | 0.6000 | % | 0.35 | % | 0.25 | % | — | 0.80 | % | |||||||||||
Multi-Asset Inflation Managed Fund |
| |||||||||||||||||||
Class A | 0.5500 | % | 0.35 | % | 0.25 | % | — | 0.90 | % | |||||||||||
Multi-Asset Capital Stability Fund |
| |||||||||||||||||||
Class A | 0.4000 | % | 0.35 | % | 0.25 | % | — | 0.62 | % | |||||||||||
As of September 30, 2013 , SIMC has entered into investment sub-advisory agreements with the following parties:
| Investment Sub-Adviser |
Large Cap Fund |
AQR Capital Management, LLC |
AJO, L.P. |
Brown Advisory LLC |
Delaware Investments Fund Advisers |
LSV Asset Management |
Waddell + Reed Investment Management Company |
WestEnd Advisors, LLC |
Large Cap Value Fund |
AJO, L.P. |
Lazard Asset Management LLC |
LSV Asset Management |
Tocqueville Asset Management LP |
| Investment Sub-Adviser |
Large Cap Growth Fund |
Brown Advisory LLC |
Delaware Investments Fund Advisers |
INTECH Investment Management, LLC |
Tax-Managed Large Cap Fund |
AQR Capital Management, LLC |
AJO, L.P. |
Brown Advisory LLC |
Delaware Investments Fund Advisers |
LSV Asset Management |
Parametric Portfolio Associates LLC |
Waddell + Reed Investment Management Company |
WestEnd Advisors, LLC |
S&P 500 Index Fund |
SSgA Funds Management, Inc. |
| SEI Institutional Managed Trust / Annual Report / September 30, 2013 | 263 |
Notes to Financial Statements/Consolidated Notes to Financial Statements (Continued)
September 30, 2013
| Investment Sub-Adviser |
Small Cap Fund |
AllianceBernstein, L.P. |
AQR Capital Management, LLC |
Fiduciary Management Associates, LLC |
Integrity Asset Management, LLC |
J.P. Morgan Investment Management Inc. |
Robeco Investment Management, Inc. |
Timberline Asset Management LLC |
William Blair + Company LLC |
Small Cap Value Fund |
Artisan Partners, Limited Partnership |
Fiduciary Management Associates, LLC |
Lee Munder Capital Group LLC |
LSV Asset Management |
Martingale Asset Management, L.P. |
Robeco Investment Management, Inc. |
Security Capital Research + Management |
William Blair + Company, LLC |
Small Cap Growth Fund |
AllianceBernstein, L.P. |
AQR Capital Management, LLC |
Janus Capital Management, LLC |
J.P. Morgan Investment Management Inc. |
Timberline Asset Management LLC |
Tax-Managed Small/Mid Cap Fund |
AllianceBernstein, L.P. |
J.P. Morgan Investment Management Inc. |
Lee Munder Capital Group, LLC |
LSV Asset Management |
Parametric Portfolio Associates LLC |
Wellington Management Company, LLP |
William Blair + Company, LLC |
Mid-Cap Fund |
J.P. Morgan Investment Management Inc. |
Lee Munder Capital Group, LLC |
Quantitative Management Associates LLC |
U.S. Managed Volatility Fund |
Analytic Investors, LLC |
AJO, L.P. |
LSV Asset Management |
Global Managed Volatility Fund |
Acadian Asset Management LLC |
Analytic Investors, LLC |
Tax-Managed Managed Volatility Fund |
Analytic Investors LLC |
AJO, L.P. |
LSV Asset Management |
Parametric Portfolio Associates LLC |
Real Estate Fund |
Center Square Investment Management (formerly, Urdang Capital Management Inc.) |
Security Capital Research and Management, Inc. |
| Investment Sub-Adviser |
Enhanced Income Fund |
Ares Management LLC |
Wellington Management Company, LLP |
Core Fixed Income Fund |
Jennison Associates LLC |
Metropolitan West Asset Management LLC |
Wells Capital Management, Inc. |
Western Asset Management Company |
Western Asset Management Company Limited |
U.S. Fixed Income Fund |
Jennison Associates LLC |
J.P. Morgan Investment Management, Inc. |
Metropolitan West Asset Management LLC |
Wells Capital Management, Inc. |
Western Asset Management Company |
Western Asset Management Company Limited |
High Yield Bond Fund |
Ares Management LLC |
Brigade Capital Management, LLC |
Delaware Investments Fund Advisers |
Guggenheim Partners Investment Management, LLC |
J.P. Morgan Investment Management, Inc. |
Multi-Strategy Alternative Fund |
Turner Investments, LP |
Multi-Asset Accumulation Fund |
AQR Capital Management, LLC |
PanAgora Asset Management Inc. |
Multi-Asset Income Fund |
Guggenheim Partners Investment Management, LLC |
Multi-Asset Inflation Managed Fund |
AllianceBernstein, L.P. |
Multi-Asset Capital Stability Fund |
AllianceBernstein, L.P. |
Under the investment sub-advisory agreements, each sub-adviser receives an annual fee paid by SIMC.
Other — The Distribution Agreement between the Distributor and the Trust provides that the Distributor may receive compensation on fund transactions effected for the Trust in accordance with the rules of the Securities and Exchange Commission (“SEC”). Accordingly, it is expected that fund transactions may result in brokerage commissions being paid to the Distributor. SEC rules require that such commissions not exceed usual and customary commissions.
| 264 | SEI Institutional Managed Trust / Annual Report / September 30, 2013 |
Such commissions for the year ended September 30, 2013 were as follows ($ Thousands):
| Large Cap Fund | $ | 257 | ||
| Large Cap Value Fund | 24 | |||
| Large Cap Growth Fund | 80 | |||
| S&P 500 Index Fund | 8 | |||
| Small Cap Fund | 18 | |||
| Small Cap Value Fund | 26 | |||
| Small Cap Growth Fund | 10 | |||
| Tax-Managed Small/Mid Cap Fund | 49 | |||
| Mid-Cap Fund | 1 | |||
| Real Estate Fund | 14 | �� | ||
|
| |||
| $ | 487 | |||
|
|
Payments to Affiliates — Certain officers and/or trustees of the Trust are also officers and/or Directors of the Administrator, Adviser and/or Distributor. The Trust pays each unaffiliated Trustee an annual fee for attendance at quarterly, interim and committee meetings. Compensation of officers and affiliated Trustees of the Trust is paid by the Administrator or Distributor.
A portion of the services provided by the Chief Compliance Officer (“CCO”) and his staff, whom are employees of the Administrator, are paid for by the Trust as incurred. The services include regulatory oversight of the Trust’s Adviser, sub-advisers and service providers as required by SEC regulations. The CCO’s services have been approved by and are reviewed annually by the Board.
LSV Asset Management (a partially owned subsidiary of SIMC) serves as the sub-adviser to the Large Cap, Large Cap Value, Tax-Managed Large Cap, Small Cap Value, Tax-Managed Small/Mid Cap, U.S. Managed Volatility and Tax-Managed Managed Volatility Funds. For this service LSV Asset Management is entitled to receive a fee from SIMC. Such fees for the year ended September 30, 2013 were as follows ($ Thousands):
| Large Cap Fund | $ | 379 | ||
| Large Cap Value Fund | 447 | |||
| Tax-Managed Large Cap Fund | 430 | |||
| Small Cap Value Fund | 358 | |||
| Tax-Managed Small/Mid Cap Fund | 195 | |||
| U.S. Managed Volatility Fund | 792 | |||
| Tax-Managed Managed Volatility Fund | 575 | |||
|
| |||
| $ | 3,176 | |||
|
|
Fees Paid Indirectly — The Funds may direct certain fund trades to the Distributor who pays a portion of the Funds’ expenses. Accordingly, the expenses reduced, which were used to pay third party expenses, and the effect on the Funds’ expense ratio, as a percentage of the Funds’ average daily net assets for the year ended September 30, 2013, can be found on the Statement of Operations and Financial Highlights, respectively.
Investment in Affiliated Security — The Funds may invest excess cash in the SEI Daily Income Trust Prime Obligation Fund, an affiliated money market fund. Additionally, the Funds may invest the cash collateral from the securities lending program in the SEI Liquidity Fund, L.P.
Interfund Lending — The SEC has granted an exemption that permits the Trust to participate in an interfund lending program (“the Program”) with existing or future investment companies registered under the 1940 Act that are advised by SIMC (the “SEI Funds”). The Program allows the SEI Funds to lend money to and borrow money from each other for temporary or emergency purposes. Participation in the Program is voluntary for both borrowing and lending funds.
Interfund loans may be made only when the rate of interest to be charged is more favorable to the lending fund than an investment in overnight repurchase agreements (“Repo Rate”), and more favorable to the borrowing fund than the rate of interest that would be charged by a bank for short-term borrowings (“Bank Loan Rate”). The Bank Loan Rate will be determined using a formula annually reviewed by the SEI Funds’ Board of Trustees. The interest rate imposed on interfund loans is the average of the Repo Rate and the Bank Loan Rate.
During the year ended September 30, 2013 , the Trust borrowed funds from the SEI Liquid Asset Trust, Prime Obligation Fund. The amount borrowed, interest paid on the borrowing and the corresponding interest rate were as follows ($ Thousands):
| Borrowing Date | Maturity Date | Amount Borrowed | Interest Paid | Interest Rate | ||||||||||||||||
S&P 500 Index | 02/21/13 | 02/22/13 | $ | 47,000 | $ | — | 0.36 | % | ||||||||||||
S&P 500 Index | 03/05/13 | 03/06/13 | 48,000 | 2 | 0.36 | |||||||||||||||
Small Cap Value Fund | 02/13/13 | 02/14/13 | 35,000 | 1 | 0.35 | |||||||||||||||
Mid Cap Fund | 06/17/13 | 06/18/13 | 5,850 | — | 0.33 | |||||||||||||||
Real Estate Fund | 07/03/13 | 07/04/13 | 6,300 | — | 0.31 | |||||||||||||||
Real Estate Fund | 07/10/13 | 07/11/13 | 5,400 | — | 0.32 | |||||||||||||||
High Yield Bond Fund | 11/20/12 | 11/21/12 | 26,452 | — | 0.57 | |||||||||||||||
High Yield Bond Fund | 11/21/12 | 11/22/12 | 12,282 | — | 0.37 | |||||||||||||||
High Yield Bond Fund | 11/23/12 | 11/26/12 | 7,158 | — | 0.37 | |||||||||||||||
High Yield Bond Fund | 06/04/13 | 06/05/13 | 26,934 | — | 0.29 | |||||||||||||||
High Yield Bond Fund | 06/05/13 | 06/06/13 | 45,000 | — | 0.32 | |||||||||||||||
High Yield Bond Fund | 06/06/13 | 06/07/13 | 45,000 | — | 0.30 | |||||||||||||||
High Yield Bond Fund | 06/07/13 | 06/10/13 | 38,663 | — | 0.32 | |||||||||||||||
High Yield Bond Fund | 06/10/13 | 06/11/13 | 40,875 | 1 | 0.21 | |||||||||||||||
High Yield Bond Fund | 06/11/13 | 06/12/13 | 28,823 | — | 0.20 | |||||||||||||||
High Yield Bond Fund | 06/12/13 | 06/13/13 | 16,222 | — | 0.32 | |||||||||||||||
High Yield Bond Fund | 06/13/13 | 06/14/13 | 6,629 | — | 0.27 | |||||||||||||||
High Yield Bond Fund | 06/14/13 | 06/17/13 | 5,083 | — | 0.32 | |||||||||||||||
High Yield Bond Fund | 06/27/13 | 06/28/13 | 25,287 | — | 0.27 | |||||||||||||||
Multi-Asset Income Fund | 06/11/13 | 06/12/13 | 11,860 | 1 | 0.32 | |||||||||||||||
Multi-Asset Income Fund | 06/13/13 | 06/14/13 | 11,860 | — | 0.32 | |||||||||||||||
Amounts designated as “—” are $0 or have been rounded to $0.
| SEI Institutional Managed Trust / Annual Report / September 30, 2013 | 265 |
Notes to Financial Statements/Consolidated Notes to Financial Statements (Continued)
September 30, 2013
7. CAPITAL SHARE TRANSACTIONS
Capital Share Transactions for the Funds were as follows (Thousands):
For the years or period ended September 30, 2013
| Large Cap Fund | Large Cap Value Fund | Large Cap Growth Fund | Tax-Managed Large Cap Fund | S&P 500 Index Fund | ||||||||||||||||||||||||||||||||||||
2013 | 2012 | 2013 | 2012 | 2013 | 2012 | 2013 | 2012 | 2013 | 2012 | |||||||||||||||||||||||||||||||
Class A: | ||||||||||||||||||||||||||||||||||||||||
Shares Issued | 58,079 | 62,172 | 9,070 | 11,183 | 6,231 | 7,259 | 36,203 | 26,227 | 3,033 | 3,283 | ||||||||||||||||||||||||||||||
Shares Issued in Lieu of Cash Distributions | 7,221 | 10,721 | 969 | 1,199 | 190 | 60 | 1,380 | 1,134 | 129 | 122 | ||||||||||||||||||||||||||||||
Shares Redeemed | (36,808 | ) | (100,390 | ) | (18,816 | ) | (22,504 | ) | (12,071 | ) | (19,009 | ) | (29,980 | ) | (30,133 | ) | (2,961 | ) | (4,203 | ) | ||||||||||||||||||||
Total Class A Transactions | 28,492 | (27,497 | ) | (8,777 | ) | (10,122 | ) | (5,650 | ) | (11,690 | ) | 7,603 | (2,772 | ) | 201 | (798 | ) | |||||||||||||||||||||||
Class E: | ||||||||||||||||||||||||||||||||||||||||
Shares Issued | — | — | — | — | — | — | — | — | 8,463 | 41,251 | (1) | |||||||||||||||||||||||||||||
Shares Issued in Lieu of Cash Distributions | — | — | — | — | — | — | — | — | 1,201 | 754 | ||||||||||||||||||||||||||||||
Shares Redeemed | — | — | — | — | — | — | — | — | (23,580 | ) | (15,513 | ) | ||||||||||||||||||||||||||||
Total Class E Transactions | — | — | — | — | — | — | — | — | (13,916 | ) | 26,492 | |||||||||||||||||||||||||||||
Class I: | ||||||||||||||||||||||||||||||||||||||||
Shares Issued | — | — | 123 | 95 | 70 | 90 | 29 | — | 48 | 58 | ||||||||||||||||||||||||||||||
Shares Issued in Lieu of Cash Distributions | — | — | 4 | 5 | — | — | 1 | — | 2 | 2 | ||||||||||||||||||||||||||||||
Shares Redeemed | — | — | (124 | ) | (175 | ) | (130 | ) | (94 | ) | (80 | ) | — | (101 | ) | (78 | ) | |||||||||||||||||||||||
Total Class I Transactions | — | — | 3 | (75 | ) | (60 | ) | (4 | ) | (50 | ) | — | (51 | ) | (18 | ) | ||||||||||||||||||||||||
Class Y: | ||||||||||||||||||||||||||||||||||||||||
Shares Issued | — | — | — | — | — | — | — | — | — | — | ||||||||||||||||||||||||||||||
Shares Issued in Lieu of Cash Distributions | — | — | — | — | — | — | — | 1 | — | — | ||||||||||||||||||||||||||||||
Shares Redeemed | — | — | — | — | — | — | — | (8 | ) | — | — | |||||||||||||||||||||||||||||
Total Class Y Transactions | — | — | — | — | — | — | — | (7 | ) | — | — | |||||||||||||||||||||||||||||
Increase (Decrease) in Share Transactions | 28,492 | (27,497 | ) | (8,774 | ) | (10,197 | ) | (5,710 | ) | (11,694 | ) | 7,553 | (2,779 | ) | (13,766 | ) | 25,676 | |||||||||||||||||||||||
Small Cap | Small Cap | Small Cap | Tax-Managed | Mid-Cap | ||||||||||||||||||||||||||||||||||||
2013 | 2012 | 2013 | 2012 | 2013 | 2012 | 2013 | 2012 | 2013 | 2012 | |||||||||||||||||||||||||||||||
Class A: | ||||||||||||||||||||||||||||||||||||||||
Shares Issued | 12,519 | 13,738 | 3,116 | 3,211 | 2,035 | 2,571 | 8,489 | 6,528 | 2,970 | 2,223 | ||||||||||||||||||||||||||||||
Shares Issued in Lieu of Cash Distributions | 1,176 | 3,129 | 180 | 213 | 61 | — | 101 | 81 | 20 | 18 | ||||||||||||||||||||||||||||||
Shares Redeemed | (6,785 | ) | (14,389 | ) | (8,691 | ) | (7,662 | ) | (3,961 | ) | (5,546 | ) | (5,515 | ) | (5,817 | ) | (3,038 | ) | (2,780 | ) | ||||||||||||||||||||
Total Class A Transactions | 6,910 | 2,478 | (5,395 | ) | (4,238 | ) | (1,865 | ) | (2,975 | ) | 3,075 | 792 | (48 | ) | (539 | ) | ||||||||||||||||||||||||
Class I: | ||||||||||||||||||||||||||||||||||||||||
Shares Issued | — | — | 86 | 85 | 61 | 56 | — | — | 40 | 30 | ||||||||||||||||||||||||||||||
Shares Issued in Lieu of Cash Distributions | — | — | 2 | 2 | — | — | — | — | — | — | ||||||||||||||||||||||||||||||
Shares Redeemed | — | — | (99 | ) | (122 | ) | (67 | ) | (113 | ) | — | — | (33 | ) | (37 | ) | ||||||||||||||||||||||||
Total Class I Transactions | — | — | (11 | ) | (35 | ) | (6 | ) | (57 | ) | — | — | 7 | (7 | ) | |||||||||||||||||||||||||
Increase (Decrease) in Share Transactions | 6,910 | 2,478 | (5,406 | ) | (4,273 | ) | (1,871 | ) | (3,032 | ) | 3,075 | 792 | (41 | ) | (546 | ) | ||||||||||||||||||||||||
| 266 | SEI Institutional Managed Trust / Annual Report / September 30, 2013 |
| U.S. Managed Volatility Fund | Global Managed Volatility Fund | Tax-Managed Managed Volatility Fund | Real Estate Fund | Enhanced Income Fund | ||||||||||||||||||||||||||||||||||||
2013 | 2012 | 2013 | 2012 | 2013 | 2012 | 2013 | 2012 | 2013 | 2012 | |||||||||||||||||||||||||||||||
Class A: | ||||||||||||||||||||||||||||||||||||||||
Shares Issued | 21,727 | 28,302 | 66,254 | 55,533 | 19,656 | 16,046 | 6,276 | 6,828 | 15,366 | 10,282 | ||||||||||||||||||||||||||||||
Shares Issued in Lieu of Cash Distributions | 1,119 | 619 | 2,476 | — | 1,750 | 1,401 | 154 | 106 | 394 | 455 | ||||||||||||||||||||||||||||||
Shares Redeemed | (15,468 | ) | (22,790 | ) | (36,256 | ) | (22,060 | ) | (11,665 | ) | (6,869 | ) | (5,737 | ) | (6,360 | ) | (11,407 | ) | (11,057 | ) | ||||||||||||||||||||
Total Class A Transactions | 7,378 | 6,131 | 32,474 | 33,473 | 9,741 | 10,578 | 693 | 574 | 4,353 | (320 | ) | |||||||||||||||||||||||||||||
Class I: | ||||||||||||||||||||||||||||||||||||||||
Shares Issued | 50 | 180 | 67 | 46 | — | — | 29 | 26 | 64 | 6 | ||||||||||||||||||||||||||||||
Shares Issued in Lieu of Cash Distributions | 1 | 1 | 1 | — | — | — | — | — | 1 | — | ||||||||||||||||||||||||||||||
Shares Redeemed | (25 | ) | (135 | ) | (13 | ) | (15 | ) | — | — | (33 | ) | (23 | ) | (26 | ) | — | |||||||||||||||||||||||
Total Class I Transactions | 26 | 46 | 55 | 31 | — | — | (4 | ) | 3 | 39 | 6 | |||||||||||||||||||||||||||||
Increase (Decrease) in Share Transactions | 7,404 | 6,177 | 32,529 | 33,504 | 9,741 | 10,578 | 689 | 577 | 4,392 | (314 | ) | |||||||||||||||||||||||||||||
| Core Fixed Income Fund | U.S. Fixed Income Fund | High Yield Bond Fund | Real Return Fund | Multi-Strategy Alternative Fund | ||||||||||||||||||||||||||||||||||||
2013 | 2012 | 2013 | 2012 | 2013 | 2012 | 2013 | 2012 | 2013 | 2012 | |||||||||||||||||||||||||||||||
Class A: | ||||||||||||||||||||||||||||||||||||||||
Shares Issued | 36,858 | 46,620 | 39,382 | 51,929 | 150,061 | 167,236 | 12,838 | 15,146 | 18,147 | 16,164 | ||||||||||||||||||||||||||||||
Shares Issued in Lieu of Cash Distributions | 4,525 | 6,771 | 3,843 | 4,181 | 11,987 | 13,916 | 702 | 583 | 185 | 565 | ||||||||||||||||||||||||||||||
Shares Redeemed | (58,028 | ) | (62,860 | ) | (25,391 | ) | (64,094 | ) | (133,750 | ) | (140,594 | ) | (9,815 | ) | (24,391 | ) | (9,567 | ) | (12,406 | ) | ||||||||||||||||||||
Total Class A Transactions | (16,645 | ) | (9,469 | ) | 17,834 | (7,984 | ) | 28,298 | 40,558 | 3,725 | (8,662 | ) | 8,765 | 4,323 | ||||||||||||||||||||||||||
Class I: | ||||||||||||||||||||||||||||||||||||||||
Shares Issued | 659 | 347 | — | — | 5,199 | 4,859 | — | — | — | — | ||||||||||||||||||||||||||||||
Shares Issued in Lieu of Cash Distributions | 28 | 37 | — | — | 36 | 77 | — | — | — | — | ||||||||||||||||||||||||||||||
Shares Redeemed | (710 | ) | (510 | ) | — | — | (1,961 | ) | (3,156 | ) | — | — | — | — | ||||||||||||||||||||||||||
Total Class I Transactions | (23 | ) | (126 | ) | — | — | 3,274 | 1,780 | — | — | — | — | ||||||||||||||||||||||||||||
Increase (Decrease) in Share Transactions | (16,668 | ) | (9,595 | ) | 17,834 | (7,984 | ) | 31,572 | 42,338 | 3,725 | (8,662 | ) | 8,765 | 4,323 | ||||||||||||||||||||||||||
| Multi-Asset Accumulation Fund(2) | Multi-Asset Income Fund(2) | Multi-Asset Inflation Managed Fund(2) | Multi-Asset Capital Stability Fund(2) | |||||||||||||||||||||||||||||
2013 | 2012 | 2013 | 2012 | 2013 | 2012 | 2013 | 2012 | |||||||||||||||||||||||||
Class A: | ||||||||||||||||||||||||||||||||
Shares Issued | 65,577 | 101,691 | 20,859 | 9,035 | 41,546 | 57,992 | 26,979 | 37,711 | ||||||||||||||||||||||||
Shares Issued in Lieu of Cash Distributions | 2,832 | 298 | 638 | 110 | 270 | 233 | 253 | 1 | ||||||||||||||||||||||||
Shares Redeemed | (22,396 | ) | (10,638 | ) | (7,937 | ) | (981 | ) | (13,977 | ) | (4,715 | ) | (12,565 | ) | (3,393 | ) | ||||||||||||||||
Total Class A Transactions | 46,013 | 91,351 | 13,560 | 8,164 | 27,839 | 53,510 | 14,667 | 34,319 | ||||||||||||||||||||||||
Increase in Share Transactions | 46,013 | 91,351 | 13,560 | 8,164 | 27,839 | 53,510 | 14,667 | 34,319 | ||||||||||||||||||||||||
| (1) | Includes subscriptions as a result of in-kind transfers of securities (See Note 12). |
| (2) | Commenced operations on April 9, 2012. |
Amounts designated as “—” are zero or have been rounded to zero.
| SEI Institutional Managed Trust / Annual Report / September 30, 2013 | 267 |
Notes to Financial Statements/Consolidated Notes to Financial Statements (Continued)
September 30, 2013
8. INVESTMENT TRANSACTIONS
The cost of security purchases and proceeds from the sale of securities, other than temporary cash investments and futures, during the year ended September 30, 2013 , were as follows:
| U.S. Gov’t ($ Thousands) | Other ($ Thousands) | Total ($ Thousands) | ||||||||||
Large Cap Fund | ||||||||||||
Purchases | $ | — | $ | 1,086,189 | $ | 1,086,189 | ||||||
Sales | — | 821,781 | 821,781 | |||||||||
Large Cap Value Fund | ||||||||||||
Purchases | — | 739,911 | 739,911 | |||||||||
Sales | — | 924,682 | 924,682 | |||||||||
Large Cap Growth Fund | ||||||||||||
Purchases | — | 914,339 | 914,339 | |||||||||
Sales | — | 1,063,884 | 1,063,884 | |||||||||
Tax-Managed Large Cap Fund | ||||||||||||
Purchases | — | 905,705 | 905,705 | |||||||||
Sales | — | 857,124 | 857,124 | |||||||||
S&P 500 Index Fund | ||||||||||||
Purchases | — | 165,338 | 165,338 | |||||||||
Sales | — | 730,581 | 730,581 | |||||||||
Small Cap Fund | ||||||||||||
Purchases | — | 274,789 | 274,789 | |||||||||
Sales | — | 214,205 | 214,205 | |||||||||
Small Cap Value Fund | ||||||||||||
Purchases | — | 188,812 | 188,812 | |||||||||
Sales | — | 305,199 | 305,199 | |||||||||
Small Cap Growth Fund | ||||||||||||
Purchases | — | 244,273 | 244,273 | |||||||||
Sales | — | 290,849 | 290,849 | |||||||||
Tax-Managed Small/Mid Cap Fund | ||||||||||||
Purchases | — | 293,476 | 293,476 | |||||||||
Sales | — | 249,569 | 249,569 | |||||||||
Mid-Cap Fund | ||||||||||||
Purchases | — | 102,072 | 102,072 | |||||||||
Sales | — | 105,169 | 105,169 | |||||||||
U.S. Managed Volatility Fund | ||||||||||||
Purchases | — | 373,343 | 373,343 | |||||||||
Sales | — | 276,554 | 276,554 | |||||||||
Global Managed Volatility Fund | ||||||||||||
Purchases | — | 1,058,089 | 1,058,089 | |||||||||
Sales | — | 689,622 | 689,622 | |||||||||
Tax-Managed Managed Volatility | ||||||||||||
Purchases | — | 227,268 | 227,268 | |||||||||
Sales | — | 142,034 | 142,034 | |||||||||
Real Estate Fund | ||||||||||||
Purchases | — | 165,548 | 165,548 | |||||||||
Sales | — | 148,725 | 148,725 | |||||||||
Enhanced Income Fund | ||||||||||||
Purchases | 113,552 | 60,974 | 174,526 | |||||||||
Sales | 126,940 | 41,478 | 168,418 | |||||||||
Core Fixed Income Fund | ||||||||||||
Purchases | 6,153,306 | 678,462 | 6,831,768 | |||||||||
Sales | 6,203,778 | 728,409 | 6,932,187 | |||||||||
U.S Fixed Income Fund | ||||||||||||
Purchases | 2,777,303 | 308,777 | 3,086,080 | |||||||||
Sales | 2,641,820 | 288,166 | 2,929,986 | |||||||||
High Yield Bond Fund | ||||||||||||
Purchases | — | 1,243,554 | 1,243,554 | |||||||||
Sales | — | 1,128,040 | 1,128,040 | |||||||||
Real Return Fund | ||||||||||||
Purchases | 250,453 | — | 250,453 | |||||||||
Sales | 214,067 | — | 214,067 | |||||||||
Multi-Strategy Alternative Fund | ||||||||||||
Purchases | — | 665,059 | 665,059 | |||||||||
Sales | — | 491,500 | 491,500 | |||||||||
| U.S. Gov’t ($ Thousands) | Other ($ Thousands) | Total ($ Thousands) | ||||||||||
Multi-Asset Accumulation Fund | ||||||||||||
Purchases | $ | 303,926 | $ | 308,049 | $ | 611,975 | ||||||
Sales | 296,438 | 312,065 | 608,503 | |||||||||
Multi-Asset Income Fund | ||||||||||||
Purchases | 5,646 | 102,278 | 107,924 | |||||||||
Sales | 1,448 | 65,316 | 66,764 | |||||||||
Multi-Asset Inflation Managed Fund | ||||||||||||
Purchases | 470,235 | 262,149 | 732,384 | |||||||||
Sales | 284,549 | 143,505 | 428,054 | |||||||||
Multi-Asset Capital Stability Fund | ||||||||||||
Purchases | 520,055 | 187,169 | 707,224 | |||||||||
Sales | 615,935 | 224,790 | 840,725 | |||||||||
9. FEDERAL TAX INFORMATION
It is each Fund’s intention to continue to qualify as a regulated investment company under Subchapter M of The Internal Revenue Code and distribute all of its taxable income (including net capital gains). Accordingly, no provision for Federal income taxes is required.
The Multi-Asset Accumulation and Multi-Asset Inflation Managed Funds have each requested private letter rulings from the Internal Revenue Service (“IRS”) concluding that the income generated from their investment in their respective Subsidiaries, each of which invests in commodity-linked derivatives, will be “qualifying income” for regulated investment company (“RIC”) qualification purposes, regardless of whether actual distributions are made to the Funds by the respective Subsidiary.
In July 2011, the IRS suspended the issuance of private letter rulings regarding the investment by RICs into controlled foreign corporations which principally invest in commodities, such as the Subsidiaries, indicating that it was reconsidering its policies surrounding the issuance of these rulings. The IRS subsequently stated that it intends to issue public guidance regarding the use of controlled foreign corporations by RICs to indirectly invest in commodities. It is unclear whether this guidance will continue to permit or somehow restrict the distributions from controlled foreign corporations to be treated as “qualifying income” for purposes of the RIC qualification rules. As a result, there can be no assurance that the IRS will grant the private letter ruling requested by the Funds. The IRS, however, has informally indicated that any guidance regarding the treatment of distributions from controlled foreign corporations will be prospective in application and provide for transition periods for affected RICs. While the private letter ruling request is pending with the IRS, the Multi-Asset Accumulation and Multi-Asset Inflation Managed Funds have secured an opinion of counsel based on customary representations that actual distributions made to the Funds should be treated as “qualifying income.” If the IRS does issue public guidance that results in an adverse determination relating to the treatment of income and gain to the Funds from controlled foreign corporations such as the Subsidiaries, the Funds would likely need to significantly change their investment strategies, which could adversely affect such Funds.
| 268 | SEI Institutional Managed Trust / Annual Report / September 30, 2013 |
The Real Estate Fund has a tax year that ends on December 31. The following tax disclosures are representative as of September 30, 2013, except for the permanent reclassification and tax character of distributions, which are as of December 31, 2012. Accordingly, the disclosures are for informational use by shareholders and are subject to change attributable to activity through the end of the tax year-ending December 31, 2013.
Dividends from net investment income and distributions from net realized capital gains are determined in accordance with U.S. Federal income tax regulations, which may differ from those amounts determined under U.S. GAAP. These book/tax differences are either temporary or permanent in nature. To the extent these differences are permanent, they are charged or credited to paid-in capital, undistributed net investment income or accumulated net realized gain, as appropriate, in the period that the differences arise.
| Paid-in- Capital ($ Thousands) | Undistributed Net Investment Income/(Loss) ($ Thousands) | Accumulated Realized Gain/(loss) ($ Thousands) | ||||||||||
Large Cap Fund | $ | — | $ | 109 | $ | (109 | ) | |||||
Large Cap Value Fund | 3 | 63 | (66 | ) | ||||||||
Large Cap Growth Fund | — | 97 | (97 | ) | ||||||||
Tax-Managed Large Cap Fund | — | 180 | (180 | ) | ||||||||
S&P 500 Index Fund | — | 359 | (359 | ) | ||||||||
Small Cap Fund | — | 596 | (596 | ) | ||||||||
Small Cap Value Fund | — | 408 | (408 | ) | ||||||||
Small Cap Growth Fund | (241 | ) | 305 | (64 | ) | |||||||
Tax-Managed Small/Mid Cap Fund | — | 119 | (119 | ) | ||||||||
Mid-Cap Fund | — | 31 | (31 | ) | ||||||||
U.S. Managed Volatility | — | 156 | (156 | ) | ||||||||
Global Managed Volatility Fund | — | 54,202 | (54,202 | ) | ||||||||
Tax-Managed Managed Volatility Fund | — | 94 | (94 | ) | ||||||||
Real Estate Fund | — | 20 | (20 | ) | ||||||||
Enhanced Income Fund | — | (27 | ) | 27 | ||||||||
Core Fixed Income Fund | — | 3,500 | (3,500 | ) | ||||||||
U.S. Fixed Income Fund | — | 1,638 | (1,638 | ) | ||||||||
High Yield Bond Fund | — | 5,192 | (5,192 | ) | ||||||||
Real Return Fund | — | 58 | (58 | ) | ||||||||
Multi-Strategy Alternative Fund | (1 | ) | 775 | (774 | ) | |||||||
Multi-Asset Accumulation Fund | — | 11,787 | (11,787 | ) | ||||||||
Multi-Asset Income Fund | — | (932 | ) | 932 | ||||||||
Multi-Asset Inflation Managed Fund | 790 | (12,035 | ) | 11,245 | ||||||||
Multi-Asset Capital Stability Fund | — | 2,778 | (2,778 | ) | ||||||||
The tax character of dividends and distributions paid during the fiscal years or periods ended September 30, 2013 and September 30, 2012 (unless otherwise indicated) was as follows:
| Ordinary Income ($ Thousands) | Long-Term Capital Gain ($ Thousands) | Return of Capital ($ Thousands) | Total ($ Thousands) | |||||||||||||||||
Large Cap Fund | 2013 | $ | 34,159 | $ | 60,066 | $ | — | $ | 94,225 | |||||||||||
| 2012 | 35,557 | 90,150 | — | 125,707 | ||||||||||||||||
Large Cap Value Fund | 2013 | 20,018 | — | — | 20,018 | |||||||||||||||
| 2012 | 20,539 | — | — | 20,539 | ||||||||||||||||
Large Cap Growth Fund | 2013 | 5,306 | — | — | 5,306 | |||||||||||||||
| 2012 | 1,505 | — | — | 1,505 | ||||||||||||||||
Tax-Managed Large Cap Fund | 2013 | 22,249 | — | — | 22,249 | |||||||||||||||
| 2012 | 15,527 | — | — | 15,527 | ||||||||||||||||
S&P 500 Index Fund | 2013 | 56,490 | — | — | 56,490 | |||||||||||||||
| 2012 | 32,210 | — | — | 32,210 | ||||||||||||||||
Small Cap Fund | 2013 | 1,273 | 12,487 | — | 13,760 | |||||||||||||||
| 2012 | 9,269 | 24,667 | — | 33,936 | ||||||||||||||||
Small Cap Value Fund | 2013 | 3,790 | — | — | 3,790 | |||||||||||||||
| 2012 | 3,845 | — | — | 3,845 | ||||||||||||||||
Small Cap Growth Fund | 2013 | 1,207 | — | — | 1,207 | |||||||||||||||
| 2012 | — | — | — | — | ||||||||||||||||
Tax-Managed Small/Mid Cap Fund | 2013 | 1,558 | — | — | 1,558 | |||||||||||||||
| 2012 | 1,060 | — | — | 1,060 | ||||||||||||||||
Mid-Cap Fund | 2013 | 626 | — | — | 626 | |||||||||||||||
| 2012 | 468 | — | — | 468 | ||||||||||||||||
U.S. Managed Volatility Fund | 2013 | 13,192 | 5,513 | — | 18,705 | |||||||||||||||
| 2012 | 8,988 | — | — | 8,988 | ||||||||||||||||
Global Managed Volatility Fund | 2013 | 26,164 | — | — | 26,164 | |||||||||||||||
| 2012 | — | — | — | — | ||||||||||||||||
Tax- Managed Managed Volatility Fund | 2013 | 11,340 | 11,647 | — | 22,987 | |||||||||||||||
| 2012 | 5,630 | 11,412 | — | 17,042 | ||||||||||||||||
Real Estate Fund | 2013 | 2,455 | — | — | 2,455 | |||||||||||||||
| 2012 | 1,533 | — | — | 1,533 | ||||||||||||||||
| SEI Institutional Managed Trust / Annual Report / September 30, 2013 | 269 |
Notes to Financial Statements/Consolidated Notes to Financial Statements (Continued)
September 30, 2013
| Ordinary Income ($ Thousands) | Long-Term Capital Gain ($ Thousands) | Return of Capital ($ Thousands) | Total ($ Thousands) | |||||||||||||||||
Enhanced Income Fund | 2013 | $ | 3,334 | $ | — | $ | — | $ | 3,334 | |||||||||||
| 2012 | 3,714 | — | — | 3,714 | ||||||||||||||||
Core Fixed Income Fund | 2013 | 58,329 | — | — | 58,329 | |||||||||||||||
| 2012 | 84,243 | — | — | 84,243 | ||||||||||||||||
U.S. Fixed Income Fund | 2013 | 43,328 | 3,324 | — | 46,652 | |||||||||||||||
| 2012 | 43,325 | 6,695 | — | 50,020 | ||||||||||||||||
High Yield Bond Fund | 2013 | 112,692 | — | — | 112,692 | |||||||||||||||
| 2012 | 123,816 | — | — | 123,816 | ||||||||||||||||
Real Return Fund | 2013 | 8,291 | — | — | 8,291 | |||||||||||||||
| 2012 | 6,814 | 71 | — | 6,885 | ||||||||||||||||
Multi-Strategy Alternative Fund | 2013 | 1,930 | — | — | 1,930 | |||||||||||||||
| 2012 | 5,784 | — | — | 5,784 | ||||||||||||||||
Multi-Asset Accumulation Fund | 2013 | 24,477 | 7,602 | — | 32,079 | |||||||||||||||
| 2012 | 3,211 | — | — | 3,211 | ||||||||||||||||
Multi-Asset Income Fund | 2013 | 8,719 | — | — | 8,719 | |||||||||||||||
| 2012 | 1,276 | — | — | 1,276 | ||||||||||||||||
Multi-Asset Inflation Managed Fund | 2013 | 2,918 | 93 | — | 3,011 | |||||||||||||||
| 2012 | 588 | 13 | 1,875 | 2,476 | ||||||||||||||||
Multi-Asset Capital Stability Fund | 2013 | 1,266 | 1,703 | — | 2,969 | |||||||||||||||
| 2012 | 6 | — | — | 6 | ||||||||||||||||
As of September 30, 2013, the components of Distributable Earnings/(Accumulated Losses) were as follows:
| Undistributed Ordinary Income ($ Thousands) | Undistributed Long-Term Capital Gain ($ Thousands) | Capital Loss Carryforwards ($ Thousands) | Post October Losses ($ Thousands) | Late-Year Loss Deferral ($ Thousands) | Unrealized Appreciation (Depreciation) ($ Thousands) | Other Temporary Differences ($ Thousands) | Total Distrib Earnings | |||||||||||||||||||||||||
Large Cap Fund | $ | 32,989 | $ | 86,937 | $ | — | $ | — | $ | — | $ | 452,441 | $ | 174 | $ | 572,541 | ||||||||||||||||
Large Cap Value Fund | 3,822 | — | (107,386 | ) | — | — | 231,444 | 24 | 127,904 | |||||||||||||||||||||||
Large Cap Growth Fund | 251 | 21,125 | — | — | — | 250,258 | 17 | 271,651 | ||||||||||||||||||||||||
Tax-Managed Large Cap Fund | 3,905 | — | (274,046 | ) | — | — | 757,999 | 239 | 488,097 | |||||||||||||||||||||||
S&P 500 Index Fund | 11,964 | 54,410 | — | — | — | 1,347,629 | 228 | 1,414,231 | ||||||||||||||||||||||||
Small Cap Fund | 7,281 | 16,966 | — | — | — | 86,055 | (225 | ) | 110,077 | |||||||||||||||||||||||
Small Cap Value Fund | 1,018 | — | (3,012 | ) | — | — | 48,951 | (146 | ) | 46,811 | ||||||||||||||||||||||
Small Cap Growth Fund | — | — | (131,103 | ) | — | (1,303 | ) | 58,829 | (158 | ) | (73,735 | ) | ||||||||||||||||||||
Tax-Managed Small/Mid Cap Fund | 2,548 | 18,933 | — | — | — | 109,204 | (169 | ) | 130,516 | |||||||||||||||||||||||
Mid-Cap Fund | 38 | — | (952 | ) | — | — | 10,738 | (47 | ) | 9,777 | ||||||||||||||||||||||
U.S. Managed Volatility Fund | 12,506 | 36,088 | — | �� | — | — | 148,868 | 113 | 197,575 | |||||||||||||||||||||||
Global Managed Volatility Fund | 63,300 | 45,947 | — | — | — | 107,326 | 3,436 | 220,009 | ||||||||||||||||||||||||
Tax-Managed Managed Volatility Fund | 6,191 | 19,510 | — | — | — | 122,321 | 106 | 148,128 | ||||||||||||||||||||||||
Real Estate Fund | 1,716 | — | (12,717 | ) | — | — | 22,065 | 38 | 11,102 | |||||||||||||||||||||||
Enhanced Income Fund | 1,111 | — | (123,775 | ) | — | — | (3,282 | ) | 122 | (125,824 | ) | |||||||||||||||||||||
Core Fixed Income Fund | 840 | — | (27,550 | ) | (15,285 | ) | — | 17,219 | (4,984 | ) | (29,760 | ) | ||||||||||||||||||||
U.S. Fixed Income Fund | 1,866 | — | — | (7,068 | ) | — | 10,110 | (4,049 | ) | 859 | ||||||||||||||||||||||
High Yield Bond Fund | 18,520 | — | (90,106 | ) | — | — | 19,444 | (9,161 | ) | (61,303 | ) | |||||||||||||||||||||
Real Return Fund | 189 | 1,056 | — | (952 | ) | — | (2,123 | ) | (1,416 | ) | (3,246 | ) | ||||||||||||||||||||
Multi-Strategy Alternative Fund | 1,765 | — | (8,814 | ) | (4,680 | ) | — | 8,131 | (4 | ) | (3,602 | ) | ||||||||||||||||||||
Multi-Asset Accumulation Fund | 4,919 | 19,558 | — | — | — | (1,749 | ) | (4,011 | ) | 18,717 | ||||||||||||||||||||||
Multi-Asset Income Fund | 4,736 | 1,019 | — | — | — | (1,815 | ) | (570 | ) | 3,370 | ||||||||||||||||||||||
Multi-Asset Inflation Managed Fund | — | — | — | (6,821 | ) | (12,827 | ) | (24,392 | ) | 4,032 | (40,008 | ) | ||||||||||||||||||||
Multi-Asset Capital Stability Fund | — | 2,176 | — | (5,221 | ) | — | (1,237 | ) | (540 | ) | (4,822 | ) | ||||||||||||||||||||
Post October losses represent losses realized on investment transactions from November 1, 2012 through September 30, 2013 that, in accordance with Federal income tax regulations, the Funds may defer and treat as having arisen in the following fiscal year. Deferred Late-Year Losses
| 270 | SEI Institutional Managed Trust / Annual Report / September 30, 2013 |
represent ordinary losses realized on investment transactions from January 1, 2013 through September 30, 2013 and specified losses realized on investment transactions from October 1, 2012 through September 30, 2013, that, in accordance with Federal income tax regulations, the Fund defers and treats as having arisen in the following fiscal year.
For Federal income tax purposes, capital loss carryforwards may be carried forward and applied against future capital gains as follows:
| Expires 2019 ($ Thousands) | Expires 2018 ($ Thousands) | Expires 2017 ($ Thousands) | Expires 2016 ($ Thousands) | Expires 2015 ($ Thousands) | Expires 2014 ($ Thousands) | Expires 2013 ($ Thousands) | Total Capital Loss Carryforwards ($ Thousands) | |||||||||||||||||||||||||
Large Cap Value Fund | $ | — | $ | 107,386 | $ | — | $ | — | $ | — | $ | — | $ | — | $ | 107,386 | ||||||||||||||||
Tax-Managed Large Cap Fund | — | 264,576 | 9,470 | — | — | — | — | 274,046 | ||||||||||||||||||||||||
Small Cap Value Fund | — | 3,012 | — | — | — | — | — | 3,012 | ||||||||||||||||||||||||
Small Cap Growth Fund | — | 131,103 | — | — | — | — | — | 131,103 | ||||||||||||||||||||||||
Mid-Cap Fund | — | 952 | — | — | — | — | — | 952 | ||||||||||||||||||||||||
Real Estate Fund | — | — | 12,717 | — | — | — | — | 12,717 | ||||||||||||||||||||||||
Enhanced Income Fund | 26,775 | 61,656 | 31,835 | 3,427 | 83 | — | — | 123,776 | ||||||||||||||||||||||||
High Yield Bond Fund | — | 17,345 | 63,877 | 3,037 | 5,847 | — | — | 90,106 | ||||||||||||||||||||||||
Multi-Strategy Alternative Fund | 1,945 | — | — | — | — | — | — | 1,945 | ||||||||||||||||||||||||
Under the recently enacted Regulated Investment Company Modernization Act of 2010, Funds will be permitted to carry forward capital losses incurred in taxable years beginning after December 22, 2010 for an unlimited period. However, any losses incurred during those future taxable years will be required to be utilized prior to the losses incurred in pre-enactment taxable years. As a result of this ordering rule, pre-enactment capital loss carryforwards may be more likely to expire unused. Additionally, post-enactment capital losses that are carried forward will retain their character as either short-term or long-term capital losses rather than being considered all short-term as under previous law. Losses carried forward under these new provisions are as follows:
| Short-Term Loss | Long-Term Loss | Total* | ||||||||||
Core Fixed Income Fund | $ | — | $ | 27,550 | $ | 27,550 | ||||||
Multi-Strategy Alternative Fund | 2,510 | 4,359 | 6,869 | |||||||||
| * | This table should be used in conjunction with the capital loss carryforwards table. |
During the fiscal year ended September 30, 2013, the following Funds utilized capital loss carryforward to offset capital gains and/or had expired capital loss carryforwards:
| Utilized Capital Loss Carryforwards ($ Thousands) | ||||
Large Cap Value Fund | $ | 131,032 | ||
Large Cap Growth Fund | 140,636 | |||
Tax-Managed Large Cap Fund | 37,794 | |||
S&P 500 Index Fund | 7,873 | |||
Small Cap Value Fund | 44,946 | |||
Small Cap Growth Fund | 41,126 | |||
Tax-Managed Small/Mid Cap Fund | 8,815 | |||
Mid-Cap Fund | 15,951 | |||
Global Managed Volatility Fund | 17,504 | |||
Enhanced Income Fund | 42 | |||
Core Fixed Income Fund | 14,695 | |||
High Yield Bond Fund | 47,231 | |||
For Federal income tax purposes, the cost of securities owned at September 30, 2013, and the net realized gains or losses on securities sold for the period, were different from amounts reported for financial reporting purposes primarily due to investments in partnerships that captures losses from other securities, and wash sales which cannot be used for Federal income tax purposes in the current year and have been deferred for use in future years. The Federal tax cost and aggregate gross unrealized appreciation and depreciation on investments held by the Funds at September 30, 2013 , were as follows:
| Federal Tax Cost ($ Thousands) | Appreciated Securities ($ Thousands) | Depreciated Securities ($ Thousands) | Net Unrealized Appreciation (Depreciation) ($ Thousands) | |||||||||||||
Large Cap Fund | $ | 1,737,071 | $ | 484,312 | $ | (31,696 | ) | $ | 452,616 | |||||||
Large Cap Value Fund | 1,270,999 | 306,123 | (74,654 | ) | 231,469 | |||||||||||
Large Cap Growth Fund | 1,323,850 | 273,850 | (23,574 | ) | 250,276 | |||||||||||
Tax-Managed Large Cap Fund | 1,774,456 | 798,891 | (40,653 | ) | 758,238 | |||||||||||
S&P 500 Index Fund | 1,546,546 | 1,371,433 | (23,580 | ) | 1,347,853 | |||||||||||
Small Cap Fund | 397,605 | 97,330 | (11,500 | ) | 85,830 | |||||||||||
Small Cap Value Fund | 415,286 | 72,942 | (24,107 | ) | 48,835 | |||||||||||
Small Cap Growth Fund | 374,651 | 75,812 | (17,088 | ) | 58,724 | |||||||||||
Tax-Managed Small/Mid Cap Fund | 429,842 | 123,275 | (14,239 | ) | 109,036 | |||||||||||
Mid-Cap Fund | 106,245 | 13,848 | (3,109 | ) | 10,739 | |||||||||||
U.S. Managed Volatility Fund | 703,412 | 160,710 | (11,730 | ) | 148,980 | |||||||||||
Global Managed Volatility Fund | 1,246,979 | 137,158 | (26,386 | ) | 110,772 | |||||||||||
Tax-Managed Managed Volatility Fund | 498,730 | 128,664 | (6,236 | ) | 122,428 | |||||||||||
Real Estate Fund | 207,008 | 36,319 | (14,254 | ) | 22,065 | |||||||||||
Enhanced Income Fund | 205,631 | 1,041 | (4,201 | ) | (3,160 | ) | ||||||||||
Core Fixed Income Fund | 2,151,660 | 80,952 | (64,313 | ) | 16,639 | |||||||||||
| SEI Institutional Managed Trust / Annual Report / September 30, 2013 | 271 |
Notes to Financial Statements/Consolidated Notes to Financial Statements (Continued)
September 30, 2013
| Federal Tax Cost ($ Thousands) | Appreciated Securities ($ Thousands) | Depreciated Securities ($ Thousands) | Net Unrealized Appreciation (Depreciation) ($ Thousands) | |||||||||||||
U.S. Fixed Income Fund | $ | 1,104,882 | $ | 29,369 | $ | (18,759 | ) | $ | 10,610 | |||||||
High Yield Bond Fund | 2,032,677 | 76,459 | (57,003 | ) | 19,456 | |||||||||||
Real Return Fund | 310,393 | 1,416 | (3,539 | ) | (2,123 | ) | ||||||||||
Multi-Strategy Alternative Fund | 413,875 | 14,899 | (6,256 | ) | 8,643 | |||||||||||
Multi-Asset Accumulation Fund | 1,350,843 | 20,136 | (11,192 | ) | 8,944 | |||||||||||
Multi-Asset Income Fund | 242,936 | 4,318 | (5,946 | ) | (1,628 | ) | ||||||||||
Multi-Asset Inflation Managed Fund | 892,824 | 15,248 | (19,401 | ) | (4,153 | ) | ||||||||||
Multi-Asset Capital Stability Fund | 497,009 | 912 | (1,903 | ) | (991 | ) | ||||||||||
Management has analyzed the Funds’ tax positions taken on federal income tax returns for all open tax years and has concluded that as of September 30, 2013, no provision for income tax would be required in the Funds’ financial statements. The Funds’ federal and state income and federal excise tax returns for tax years for which the applicable statutes of limitations have not expired are subject to examination by the Internal Revenue Service and state departments of revenue.
10. SECURITIES LENDING
Each Fund may lend portfolio securities to brokers, dealers and other financial organizations that meet capital and other credit requirements or other criteria established by the Trust’s Board of Trustees. These loans may not exceed 33 1/3% of the total asset value of the Fund (including the loan collateral). No Fund will lend portfolio securities to its Adviser, sub-adviser or their affiliates unless it has applied for and received specific authority to do so from the SEC. Loans of portfolio securities will be fully collateralized by cash. Collateral will be maintained in an amount equal to at least 100% of the current market value of the loaned securities by marking to market daily, although the borrower will be required to deliver collateral between 102% and 105% of the market value of borrowed securities for domestic and foreign securities, respectively. However, due to market fluctuations during the day, the value of securities loaned on a particular day may, during the course of the day, exceed the value of collateral. On each business day, the amount of collateral is adjusted based on the prior day’s market fluctuations and the current day’s lending activity. Income from lending activity is determined by the amount of interest earned on collateral, less any amounts payable to the borrowers of the securities and the lending agent. Lending securities involves certain risks, including the risk that the Fund may be delayed or prevented from recovering the collateral if the borrower fails to return the securities.
Cash collateral received in connection with securities lending is invested in short-term investments by the lending agent. These investments may include the SEI Liquidity Fund L.P., and the Fund bears all of the gains and losses on such investment. There is no guarantee that these investments will not lose value.
11. CONCENTRATIONS/RISKS
In the normal course of business, the Trust enters into contracts that provide general indemnifications by the Trust to the counterparty to the contract. The Trust’s maximum exposure under these arrangements is dependent on future claims that may be made against the Trust and, therefore, cannot be estimated; however, Management believes that, based on experience, the risk of loss from such claims is considered remote.
In the normal course of business, the Multi-Strategy Alternative Fund invests substantially in underlying funds that are comprised of fixed income and equity securities in specific industries and that may engage in short selling activities, writing option contracts, and equity swaps, and therefore, the Fund may be affected by events in these industries. The Fund’s Prospectus provides a description of concentration and risk associated with the different investments in the underlying affiliated investment companies.
In the normal course of business, the Multi-Asset Funds’ invest in securities of foreign issuers in various countries. These investments may involve certain considerations and risks not typically associated with investments in the United States, as a result of, among other factors, the possibility of future political and economic developments and the level of governmental supervision and regulation of securities markets in the respective countries. The Funds’ Prospectus provides a description of concentration of risk associated with the different investments.
The market values of the Core Fixed Income, U.S. Fixed Income, High Yield Bond and Multi-Asset Funds’ investments will change in response to interest rate changes and other factors. During periods of falling interest rates, the values of fixed income securities generally rise. Conversely, during periods of rising interest rates, the values of such securities generally decline. Changes by recognized rating agencies in the ratings of any fixed income security and in the ability of an issuer to make payments of interest and principal may also affect the value of these investments.
The foregoing is not intended to be a complete discussion of all risks associated with the investment strategies of the Funds. Please refer to each Fund’s current prospectus for a comprehensive discussion of the risks associated with investing in the Fund.
12. IN-KIND TRANSFER OF SECURITIES
During the year ended September 30, 2012, the S&P 500 Index Fund issued shares of beneficial interest in exchange for securities. The securities were transferred at their current value on the date of the transaction.
| Transaction Date | Shares Issued | Value | ||||||||
| 09/28/12 | 1,755,134 | $ | 69,836,796 | |||||||
| 272 | SEI Institutional Managed Trust / Annual Report / September 30, 2013 |
13. RECENT ACCOUNTING PRONOUNCEMENTS
In December 2011, the FASB issued a further update to the guidance “Balance Sheet – Disclosures about Offsetting Assets and Liabilities”. The amendments to this standard require an entity to disclose information about offsetting and related arrangements to enable users of its financial statements to understand the effect of those arrangements on its financial position. The amended guidance is effective for interim and annual reporting periods beginning after January 1, 2013. Management does not expect the adoption to have a significant impact on the financial statements. In January 2013, the FASB issued ASU 2013-01, Balance Sheet (Topic 210): Clarifying the Scope of Disclosures about Offsetting Assets and Liabilities (ASU 2013-01). This update clarifies that the scope of ASU 2011-11 and 2013-01 are effective for interim and annual periods beginning on or after January 1, 2013. The adoption of the additional disclosure requirements are reflected in the Trust’s financial statements.
In June 2013, the Financial Accounting Standards Board issued an update (“ASU 2013-08”) to ASC Topic 946, Financial Services – Investment Companies (“Topic 946”). ASU 2013-08 amends the guidance in Topic 946 for determining whether an entity qualifies as an investment company and requires certain additional disclosures. ASU 2013-08 is effective for interim and annual reporting periods in fiscal years that begin after December 15, 2013. Management is currently evaluating the impact, if any, of ASU 2013-08 on the Fund’s financial statements.
14. SUBSEQUENT EVENTS
Management has evaluated the need for disclosures and/or adjustments resulting from subsequent events. Based on this evaluation, no disclosures and/or adjustments were required to the financial statements.
| SEI Institutional Managed Trust / Annual Report / September 30, 2013 | 273 |
Report of Independent Registered Public Accounting Firm
The Board of Trustees and Shareholders
SEI Institutional Managed Trust:
We have audited the accompanying statements of assets and liabilities of SEI Institutional Managed Trust (the Trust), comprised of the Large Cap Fund, Large Cap Value Fund, Large Cap Growth Fund, Tax-Managed Large Cap Fund, S&P 500 Index Fund, Small Cap Fund, Small Cap Value Fund, Small Cap Growth Fund, Tax-Managed Small/Mid Cap Fund, Mid-Cap Fund, U.S. Managed Volatility Fund, Global Managed Volatility Fund, Tax-Managed Managed Volatility Fund, Real Estate Fund, Enhanced Income Fund, Core Fixed Income Fund, U.S. Fixed Income Fund, High Yield Bond Fund, Real Return Fund, Multi-Strategy Alternative Fund, Multi-Asset Income Fund and the Multi-Asset Capital Stability Fund (twenty-two of the twenty-four funds comprising the Trust), including the schedules of investments and summary schedules of investments, as of September 30, 2013, and the related statements of operations for the year then ended, the statements of changes in net assets for each of the years or periods in the two-year period then ended, the statement of cash flows for the year then ended for the Multi-Asset Income Fund, and the financial highlights for each of the years or periods in the five-year period then ended. We have also audited the accompanying consolidated statements of assets and liabilities of the Multi-Asset Accumulation Fund and the Multi-Asset Inflation Managed Fund (two of the twenty-four funds comprising the Trust), including the consolidated schedules of investments, as of September 30, 2013, and the related consolidated statements of operations for the year then ended, the consolidated statements of changes in net assets for each of the years or periods in the two-year period then ended, the consolidated statement of cash flows for the year then ended for the Multi-Asset Inflation Managed Fund, and the consolidated financial highlights for each of the years or periods in the two-year period then ended. These financial statements and consolidated financial statements and financial highlights and consolidated financial highlights are the responsibility of the Trust’s management. Our responsibility is to express an opinion on these financial statements and consolidated financial statements and financial highlights and consolidated financial highlights based on our audits.
We conducted our audits in accordance with the standards of the Public Company Accounting Oversight Board (United States). Those standards require that we plan and perform the audit to obtain reasonable assurance about whether the financial statements and consolidated financial statements and financial highlights and consolidated financial highlights are free of material misstatement. An audit includes examining, on a test basis, evidence supporting the amounts and disclosures in the financial statements. Our procedures included confirmation of securities owned as of September 30, 2013, by correspondence with the custodians and brokers or other appropriate auditing procedures. An audit also includes assessing the accounting principles used and significant estimates made by management, as well as evaluating the overall financial statement presentation. We believe that our audits provide a reasonable basis for our opinion.
In our opinion, the financial statements and consolidated financial statements and financial highlights and consolidated financial highlights referred to above present fairly, in all material respects, the financial position of each of the funds comprising SEI Institutional Managed Trust as of September 30, 2013, the results of their operations, the changes in their net assets, their cash flows, and the financial highlights for the years or periods described in the first paragraph, in conformity with U.S. generally accepted accounting principles.

Philadelphia, Pennsylvania
November 27, 2013
| 274 | SEI Institutional Managed Trust / Annual Report / September 30, 2013 |
TRUSTEES AND OFFICERS OF THE TRUST (Unaudited)
The following chart lists Trustees and Officers as of September 30, 2013.
Set forth below are the names, addresses, ages, position with the Trust, Term of Office and Length of Time Served, the principal occupations for the last five years, number of portfolios in fund complex overseen by trustee, and other directorships outside the fund complex of each of the persons currently serving as Trustees and Officers of the Trust. The Trust’s Statement of Additional Information (“SAI”) includes additional information about the Trustees and Officers. The SAI may be obtained without charge by calling 1-800-342-5734.
| Name Address, and Age | Position(s) Held with Trusts | Term of Office and Length of Time Served1 | Principal Occupation(s) During Past Five Years | Number of Portfolios in Fund Complex Overseen by Trustee2 | Other Directorships Held by Trustee | |||||
| INTERESTED TRUSTEES | ||||||||||
Robert A. Nesher One Freedom Valley Drive Oaks, PA 19456 67 yrs. old | Chairman of the Board of Trustees* | since 1982 | Currently performs various services on behalf of SEI for which Mr. Nesher is compensated. | 99 | Trustee of The Advisors’ Inner Circle Fund, The Advisors’ Inner Circle Fund II, Bishop Street Funds, Director of SEI Global Master Fund, plc, SEI Global Assets Fund, plc, SEI Global Investments Fund, plc, SEI Investments Global, Limited, SEI Investments — Global Fund Services, Limited, SEI Investments (Europe), Limited, SEI Global Nominee Ltd., SEI Structured Credit Fund, L.P. | |||||
William M. Doran One Freedom Valley Drive Oaks, PA 19456 73 yrs. old | Trustee* | since 1982 | Self-employed consultant since 2003. Partner, Morgan, Lewis & Bockius LLP (law firm) from 1976 to 2003, counsel to the Trust, SEI, SIMC, the Administrator and the Distributor. Secretary of SEI since 1978. | 99 | Trustee of The Advisors’ Inner Circle Fund, The Advisors’ Inner Circle Fund II, Bishop Street Funds, Director of SEI since 1974. Director of the Distributor since 2003. Director of SEI Investments — Global Fund Services, Limited, SEI Investments Global, Limited, SEI Investments (Europe), Limited, SEI Investments (Asia), SEI Global Nominee Ltd., Limited and SEI Asset Korea Co., Ltd. | |||||
| TRUSTEES | ||||||||||
George J. Sullivan, Jr. One Freedom Valley Drive Oaks, PA 19456 70 yrs. old | Trustee | since 1996 | Retired since January 2012. Self- Employed Consultant, Newfound Consultants Inc. since April 1997- December 2011. | 99 | Trustee of The Advisors’ Inner Circle Fund, The Advisors’ Inner Circle Fund II, Bishop Street Funds, State Street Navigator Securities Lending Trust, and SEI Structured Credit Fund, L.P., member of the independent review committee for SEI’s Canadian-registered mutual funds. | |||||
| * | Messrs. Nesher and Doran are Trustees who may be deemed as “interested” persons of the Trust as that term is defined in the 1940 Act by virtue of their affiliation with SIMC and the Trust’s Distributor. |
| 1 | There is no stated term of office for the Trustees of the Trust. However, a Trustee must retire from the Board by the end of the calendar year in which the Trustee turns 75 provided that, although there shall be a presumption that each Trustee attaining such age shall retire, the Board may, if it deems doing so to be consistent with the best interest of the Trust, and with the consent of any Trustee that is eligible for retirement, by unanimous vote, extend the term of such Trustee for successive periods of one year. |
| 2 | The Fund Complex includes the following Trusts: SEI Asset Allocation Trust, SEI Daily Income Trust, SEI Institutional Investments Trust, Adviser Managed Trust, SEI Institutional International Trust, SEI Institutional Managed Trust, SEI Liquid Asset Trust, SEI Tax Exempt Trust and New Covenant Funds. |
| SEI Institutional Managed Trust / Annual Report / September 30, 2013 | 275 |
TRUSTEES AND OFFICERS OF THE TRUST (Unaudited) (Continued)
Name Address, and Age | Position(s) Held with Trusts | Term of Office and Length of Time Served1 | Principal Occupation(s) During Past Five Years | Number of by Trustee2 | Other Directorships Held by Trustee | |||||
| TRUSTEES (continued) | ||||||||||
Nina Lesavoy One Freedom Valley Drive Oaks, PA 19456 56 yrs. old | Trustee | since 2003 | Founder and Managing Director, Avec Capital since 2008. Managing Director, Cue Capital from March 2002-March 2008. | 99 | Director of SEI Structured Credit Fund, L.P. | |||||
James M. Williams Valley Drive Oaks, PA 19456 65 yrs. old | Trustee | since 2004 | Vice President and Chief Investment Officer, J. Paul Getty Trust, Non-Profit Foundation for Visual Arts, since December 2002. | 99 | Trustee/Director of Ariel Mutual Funds, and SEI Strucured Credit Fund, L.P. | |||||
Mitchell A. Johnson One Freedom Valley Drive Oaks, PA 19456 71 yrs. old | Trustee | Since 2007 | Private Investor since 1994. | 99 | Trustee of the Advisors’ Inner Circle Fund, The Advisors’ Inner Circle Fund II, and Bishop Street Funds | |||||
Hubert L. Harris, Jr. One Freedom Valley Drive Oaks, PA 19456 70 yrs. old | Trustee | since 2008 | Retired since December 2005. Chief Executive Officer and Chair of the Board of Directors, AMVESCAP Retirement, Inc., 1997-December 2005. Chief Executive Officer, INVESCO North America, September 2003-December 2005. | 99 | Director of Colonial BancGroup, Inc. and St. Joseph’s Translational Research Institute; Chair of the Board of Trustees, Georgia Tech Foundation, Inc. (nonprofit corporation); Board of Councilors of the Carter Center. | |||||
| OFFICERS | ||||||||||
Robert A. Nesher One Freedom Valley Drive Oaks, PA 19456 67 yrs. old | President and CEO | since 2005 | Currently performs various services on behalf of SEI for which Mr. Nesher is compensated. | N/A | N/A | |||||
Peter A. Rodriguez One Freedom Valley Drive Oaks, PA 19456 51 yrs. old | Controller and Chief Financial Officer | since 2011 | Director, Fund Accounting, SEI Investments Global Funds Services (March 2011, September 2002 to March 2005 and 1997-2002); Director, Mutual Fund Trading, SEI Private Trust Company (May 2009 to February 2011); Director, Asset Data Services, Global Wealth Services (June 2006 to April 2009); Director, Portfolio Accounting, SEI Investments Global Funds Services (March 2005 to June 2006) | N/A | N/A | |||||
Russell Emery One Freedom Valley Drive Oaks, PA 19456 50 yrs. old | Chief Compliance Officer | since 2006 | Chief Compliance Officer of SEI Institutional Managed Trust, SEI Asset Allocation Trust, SEI Daily Income Trust, SEI Institutional International Trust, SEI Liquid Asset Trust, SEI Tax Exempt Trust, SEI Institutional Investments Trust, The Advisors’ Inner Circle Fund, The Advisors’ Inner Circle Fund II, and Bishop Street Funds, since March 2006. Chief Compliance Officer of SEI Structured Credit Fund, LP and SEI Alpha Strategy Portfolios, LP since June 2007. Chief Compliance Officer of Adviser Managed Trust since December 2010. Chief Compliance Officer of New Covenant Funds since February 2012. | N/A | N/A | |||||
| 276 | SEI Institutional Managed Trust / Annual Report / September 30, 2013 |
Name Address, and Age | Position(s) Held with Trusts | Term of Office and Length of Time Served1 | Principal Occupation(s) During Past Five Years | Number of by Trustee2 | Other Directorships Held by Trustee | |||||
| OFFICERS (continued) | ||||||||||
Timothy D. Barto One Freedom Valley Drive Oaks, PA 19456 45 yrs. old | Vice President and Secretary | since 2002 | General Counsel, Vice President and Secretary of SIMC and the Administrator since 2004. Vice President and Assistant Secretary of SEI since 2001. Vice President of SIMC and the Administrator since 1999. | N/A | N/A | |||||
Aaron Buser One Freedom Valley Drive Oaks, PA 19456 43 yrs. old | Vice President and Assistant Secretary | since 2008 | Vice President and Assistant Secretary of SIMC since 2007. Associate at Stark & Stark (2004-2007). | N/A | N/A | |||||
David F. McCann One Freedom Valley Drive Oaks, PA 19456 37 yrs. old | Vice President and Assistant Secretary | since 2009 | Vice President and Assistant Secretary of SIMC since 2008. Attorney, Drinker Biddle & Reath, LLP (law firm), May 2005-October 2008. Attorney, Pepper Hamilton, LLP (law firm), September 2001-May 2005. | N/A | N/A | |||||
Stephen G. MacRae One Freedom Valley Drive Oaks, PA 19456 45 yrs. old | Vice President | since 2012 | Director of Global Investment Product Management, January 2004 to present. | N/A | N/A | |||||
Edward McCusker One Freedom Valley Drive Oaks, PA 19456 29 yrs. old | Anti-Money Laundering Compliance Officer and Privacy Officer | since 2013 | Compliance Manager of SEI Investments Company, May 2011-April 2013. Project Manager and AML Operations Lead of SEI Private Trust Company, September 2010-May 2011. Private Banking Client Service Professional of SEI Private Banking and Trust September 2008-September 2010. | N/A | N/A | |||||
| 1 | There is no stated term of office for the Trustees of the Trust. However, a Trustee must retire from the Board by the end of the calendar year in which the Trustee turns 75 provided that, although there shall be a presumption that each Trustee attaining such age shall retire, the Board may, if it deems doing so to be consistent with the best interest of the Trust, and with the consent of any Trustee that is eligible for retirement, by unanimous vote, extend the term of such Trustee for successive periods of one year. |
| 2 | The Fund Complex includes the following Trusts: SEI Asset Allocation Trust, SEI Daily Income Trust, SEI Institutional Investments Trust, Adviser Managed Trust, SEI Institutional International Trust, SEI Institutional Managed Trust, SEI Liquid Asset Trust and New Covenant Funds. |
| SEI Institutional Managed Trust / Annual Report / September 30, 2013 | 277 |
Disclosure of Fund Expenses (Unaudited)
All mutual funds have operating expenses. As a shareholder of a mutual fund, your investment is affected by these ongoing costs, which include (among others) costs for portfolio management, administrative services, and shareholder reports like this one. It is important for you to understand the impact of these costs on your investment returns.
Operating expenses such as these are deducted from the mutual fund’s gross income and directly reduce your final investment return. These expenses are expressed as a percentage of the mutual fund’s average net assets; this percentage is known as the mutual fund’s expense ratio.
The following examples use the expense ratio and are intended to help you understand the ongoing costs (in dollars) of investing in your Fund and to compare these costs with those of other mutual funds. The examples are based on an investment of $1,000 made at the beginning of the period shown and held for the entire period.
The table on the next page illustrates your Fund’s costs in two ways:
• Actual Fund return. This section helps you to estimate the actual expenses after fee waivers that your Fund incurred over the period. The “Expenses Paid During Period” column shows the actual dollar expense cost incurred by a $1,000 investment in the Fund, and the “Ending Account Value” number is derived from deducting that expense cost from the Fund’s gross investment return.
You can use this information, together with the actual amount you invested in your Fund, to estimate the expenses you paid over that period. Simply divide your actual starting account value by $1,000 to arrive at a ratio (for example, an $8,600 account value divided by $1,000 = 8.6), then multiply that ratio by the number shown for your Fund under “Expenses Paid During Period.”
• Hypothetical 5% return. This section helps you compare your Fund’s costs with those of other mutual funds. It assumes that your Fund had an annual 5% return before expenses during the year, but that the expense ratio (Column 3) is unchanged. This example is useful in making comparisons because the Securities and Exchange Commission requires all mutual funds to make this 5% calculation. You can assess your Fund’s comparative cost by comparing the hypothetical result for your Fund in the “Expense Paid During Period” column with those that appear in the same charts in the shareholder reports for other mutual funds.
NOTE: Because the return is set at 5% for comparison purposes — NOT your Fund’s actual return — the account values shown do not apply to your specific investment.
| Beginning Account Value 4/1/13 | Ending Account Value 9/30/13 | Annualized Expense Ratios | Expense Paid During Period* | |||||||||||||
Large Cap Fund |
| |||||||||||||||
Actual Fund Return |
| |||||||||||||||
Class A Shares | $ | 1,000.00 | $ | 1,094.90 | 0.89 | % | $ | 4.67 | ||||||||
Hypothetical 5% Return |
| |||||||||||||||
Class A Shares | $ | 1,000.00 | $ | 1,020.61 | 0.89 | % | $ | 4.51 | ||||||||
Large Cap Value Fund |
| |||||||||||||||
Actual Fund Return |
| |||||||||||||||
Class A Shares | $ | 1,000.00 | $ | 1,092.20 | 0.89 | % | $ | 4.67 | ||||||||
Class I Shares | 1,000.00 | 1,091.50 | 1.11 | 5.82 | ||||||||||||
Hypothetical 5% Return |
| |||||||||||||||
Class A Shares | $ | 1,000.00 | $ | 1,020.61 | 0.89 | % | $ | 4.51 | ||||||||
Class I Shares | 1,000.00 | 1,019.50 | 1.11 | 5.62 | ||||||||||||
Large Cap Growth Fund |
| |||||||||||||||
Actual Fund Return |
| |||||||||||||||
Class A Shares | $ | 1,000.00 | $ | 1,100.20 | 0.89 | % | $ | 4.69 | ||||||||
Class I Shares | 1,000.00 | 1,099.20 | 1.11 | 5.84 | ||||||||||||
Hypothetical 5% Return |
| |||||||||||||||
Class A Shares | $ | 1,000.00 | $ | 1,020.61 | 0.89 | % | $ | 4.51 | ||||||||
Class I Shares | 1,000.00 | 1,019.50 | 1.11 | 5.62 | ||||||||||||
| Beginning Account Value 4/1/13 | Ending Account Value 9/30/13 | Annualized Expense Ratios | Expense Paid During Period* | |||||||||||||
Tax-Managed Large Cap Fund |
| |||||||||||||||
Actual Fund Return |
| |||||||||||||||
Class A Shares | $ | 1,000.00 | $ | 1,095.50 | 0.89 | % | $ | 4.68 | ||||||||
Class Y Shares | 1,000.00 | 1,097.00 | 0.56 | 2.94 | ||||||||||||
Hypothetical 5% Return |
| |||||||||||||||
Class A Shares | $ | 1,000.00 | $ | 1,020.61 | 0.89 | % | $ | 4.51 | ||||||||
Class Y Shares | 1,000.00 | 1,022.26 | 0.56 | 2.84 | ||||||||||||
S&P 500 Index Fund |
| |||||||||||||||
Actual Fund Return |
| |||||||||||||||
Class A Shares | $ | 1,000.00 | $ | 1,080.80 | 0.43 | % | $ | 2.24 | ||||||||
Class E Shares | 1,000.00 | 1,081.80 | 0.25 | 1.30 | ||||||||||||
Class I Shares | 1,000.00 | 1,079.50 | 0.65 | 3.39 | ||||||||||||
Hypothetical 5% Return |
| |||||||||||||||
Class A Shares | $ | 1,000.00 | $ | 1,022.91 | 0.43 | % | $ | 2.18 | ||||||||
Class E Shares | 1,000.00 | 1,023.82 | 0.25 | 1.27 | ||||||||||||
Class I Shares | 1,000.00 | 1,021.81 | 0.65 | 3.29 | ||||||||||||
| 278 | SEI Institutional Managed Trust / Annual Report / September 30, 2013 |
| Beginning Account Value 4/1/13 | Ending Account Value 9/30/13 | Annualized Expense Ratios | Expense Paid During Period* | |||||||||||||
Small Cap Fund |
| |||||||||||||||
Actual Fund Return |
| |||||||||||||||
Class A Shares | $ | 1,000.00 | $ | 1,158.30 | 1.14 | % | $ | 6.17 | ||||||||
Hypothetical 5% Return |
| |||||||||||||||
Class A Shares | $ | 1,000.00 | $ | 1,019.35 | 1.14 | % | $ | 5.77 | ||||||||
Small Cap Value Fund |
| |||||||||||||||
Actual Fund Return |
| |||||||||||||||
Class A Shares | $ | 1,000.00 | $ | 1,109.40 | 1.14 | % | $ | 6.04 | ||||||||
Class I Shares | 1,000.00 | 1,108.50 | 1.36 | 7.20 | ||||||||||||
Hypothetical 5% Return |
| |||||||||||||||
Class A Shares | $ | 1,000.00 | $ | 1,019.35 | 1.14 | % | $ | 5.78 | ||||||||
Class I Shares | 1,000.00 | 1,018.24 | 1.36 | 6.89 | ||||||||||||
Small Cap Growth Fund |
| |||||||||||||||
Actual Fund Return |
| |||||||||||||||
Class A Shares | $ | 1,000.00 | $ | 1,191.00 | 1.11 | % | $ | 6.10 | ||||||||
Class I Shares | 1,000.00 | 1,189.40 | 1.36 | 7.48 | ||||||||||||
Hypothetical 5% Return |
| |||||||||||||||
Class A Shares | $ | 1,000.00 | $ | 1,019.50 | 1.11 | % | $ | 5.63 | ||||||||
Class I Shares | 1,000.00 | 1,018.24 | 1.36 | 6.89 | ||||||||||||
Tax-Managed Small/Mid Cap Fund |
| |||||||||||||||
Actual Fund Return |
| |||||||||||||||
Class A Shares | $ | 1,000.00 | $ | 1,132.20 | 1.11 | % | $ | 5.94 | ||||||||
Hypothetical 5% Return |
| |||||||||||||||
Class A Shares | $ | 1,000.00 | $ | 1,019.50 | 1.11 | % | $ | 5.63 | ||||||||
Mid-Cap Fund |
| |||||||||||||||
Actual Fund Return |
| |||||||||||||||
Class A Shares | $ | 1,000.00 | $ | 1,114.50 | 1.02 | % | $ | 5.42 | ||||||||
Class I Shares | 1,000.00 | 1,112.70 | 1.26 | 6.70 | ||||||||||||
Hypothetical 5% Return |
| |||||||||||||||
Class A Shares | $ | 1,000.00 | $ | 1,019.94 | 1.02 | % | $ | 5.18 | ||||||||
Class I Shares | 1,000.00 | 1,018.73 | 1.26 | 6.40 | ||||||||||||
U.S. Managed Volatility Fund |
| |||||||||||||||
Actual Fund Return |
| |||||||||||||||
Class A Shares | $ | 1,000.00 | $ | 1,047.00 | 1.00 | % | $ | 5.13 | ||||||||
Class I Shares | 1,000.00 | 1,045.70 | 1.25 | 6.41 | ||||||||||||
Hypothetical 5% Return |
| |||||||||||||||
Class A Shares | $ | 1,000.00 | $ | 1,020.05 | 1.00 | % | $ | 5.06 | ||||||||
Class I Shares | 1,000.00 | 1,018.80 | 1.25 | 6.33 | ||||||||||||
Global Managed Volatility Fund |
| |||||||||||||||
Actual Fund Return |
| |||||||||||||||
Class A Shares | $ | 1,000.00 | $ | 1,000.90 | 1.11 | % | $ | 5.57 | ||||||||
Class I Shares | 1,000.00 | 1,000.00 | 1.36 | 6.82 | ||||||||||||
Hypothetical 5% Return |
| |||||||||||||||
Class A Shares | $ | 1,000.00 | $ | 1,019.50 | 1.11 | % | $ | 5.62 | ||||||||
Class I Shares | 1,000.00 | 1,018.25 | 1.36 | 6.88 | ||||||||||||
Tax-Managed Managed Volatility Fund |
| |||||||||||||||
Actual Fund Return |
| |||||||||||||||
Class A Shares | $ | 1,000.00 | $ | 1,050.70 | 1.00 | % | $ | 5.14 | ||||||||
Hypothetical 5% Return |
| |||||||||||||||
Class A Shares | $ | 1,000.00 | $ | 1,020.05 | 1.00 | % | $ | 5.06 | ||||||||
Real Estate Fund |
| |||||||||||||||
Actual Fund Return |
| |||||||||||||||
Class A Shares | $ | 1,000.00 | $ | 960.70 | 1.14 | % | $ | 5.60 | ||||||||
Class I Shares | 1,000.00 | 959.50 | 1.36 | 6.68 | ||||||||||||
Hypothetical 5% Return |
| |||||||||||||||
Class A Shares | $ | 1,000.00 | $ | 1,019.35 | 1.14 | % | $ | 5.77 | ||||||||
Class I Shares | 1,000.00 | 1,018.25 | 1.36 | 6.88 | ||||||||||||
Enhanced Income Fund |
| |||||||||||||||
Actual Fund Return |
| |||||||||||||||
Class A Shares | $ | 1,000.00 | $ | 1,006.30 | 0.60 | % | $ | 3.03 | ||||||||
Class I Shares | 1,000.00 | 1,004.30 | 0.85 | 4.28 | ||||||||||||
Hypothetical 5% Return |
| |||||||||||||||
Class A Shares | $ | 1,000.00 | $ | 1,022.05 | 0.60 | % | $ | 3.05 | ||||||||
Class I Shares | 1,000.00 | 1,020.80 | 0.85 | 4.31 | ||||||||||||
| Beginning Account Value 4/1/13 | Ending Account Value 9/30/13 | Annualized Expense Ratios | Expense Paid During Period* | |||||||||||||
Core Fixed Income Fund |
| |||||||||||||||
Actual Fund Return |
| |||||||||||||||
Class A Shares | $ | 1,000.00 | $ | 981.30 | 0.67 | % | $ | 3.33 | ||||||||
Class I Shares | 1,000.00 | 979.40 | 0.89 | 4.42 | ||||||||||||
Hypothetical 5% Return |
| |||||||||||||||
Class A Shares | $ | 1,000.00 | $ | 1,021.71 | 0.67 | % | $ | 3.40 | ||||||||
Class I Shares | 1,000.00 | 1,020.61 | 0.89 | 4.51 | ||||||||||||
U.S. Fixed Income Fund |
| |||||||||||||||
Actual Fund Return |
| |||||||||||||||
Class A Shares | $ | 1,000.00 | $ | 980.30 | 0.66 | % | $ | 3.28 | ||||||||
Hypothetical 5% Return |
| |||||||||||||||
Class A Shares | $ | 1,000.00 | $ | 1,021.76 | 0.66 | % | $ | 3.35 | ||||||||
High Yield Bond Fund |
| |||||||||||||||
Actual Fund Return |
| |||||||||||||||
Class A Shares | $ | 1,000.00 | $ | 1,006.70 | 0.89 | % | $ | 4.48 | ||||||||
Class I Shares | 1,000.00 | 1,006.40 | 1.11 | 5.58 | ||||||||||||
Hypothetical 5% Return |
| |||||||||||||||
Class A Shares | $ | 1,000.00 | $ | 1,020.61 | 0.89 | % | $ | 4.51 | ||||||||
Class I Shares | 1,000.00 | 1,019.40 | 1.11 | 5.62 | ||||||||||||
Real Return Fund |
| |||||||||||||||
Actual Fund Return |
| |||||||||||||||
Class A Shares | $ | 1,000.00 | $ | 977.00 | 0.45 | % | $ | 2.23 | ||||||||
Hypothetical 5% Return |
| |||||||||||||||
Class A Shares | $ | 1,000.00 | $ | 1,022.81 | 0.45 | % | $ | 2.28 | ||||||||
Multi-Strategy Alternative Fund |
| |||||||||||||||
Actual Fund Return |
| |||||||||||||||
Class A Shares | $ | 1,000.00 | $ | 1,009.30 | 0.67 | % | $ | 3.37 | ||||||||
Hypothetical 5% Return |
| |||||||||||||||
Class A Shares | $ | 1,000.00 | $ | 1,021.71 | 0.67 | % | $ | 3.40 | ||||||||
Multi-Asset Accumulation Fund |
| |||||||||||||||
Actual Fund Return |
| |||||||||||||||
Class A Shares | $ | 1,000.00 | $ | 952.80 | 1.23 | % | $ | 6.01 | ||||||||
Hypothetical 5% Return |
| |||||||||||||||
Class A Shares | $ | 1,000.00 | $ | 1,018.91 | 1.23 | % | $ | 6.22 | ||||||||
Multi-Asset Income Fund |
| |||||||||||||||
Actual Fund Return |
| |||||||||||||||
Class A Shares | $ | 1,000.00 | $ | 1,000.00 | 0.98 | % | $ | 4.90 | ||||||||
Hypothetical 5% Return |
| |||||||||||||||
Class A Shares | $ | 1,000.00 | $ | 1,020.17 | 0.98 | % | $ | 4.95 | ||||||||
Multi-Asset Inflation Managed Fund |
| |||||||||||||||
Actual Fund Return |
| |||||||||||||||
Class A Shares | $ | 1,000.00 | $ | 954.40 | 0.93 | % | $ | 4.56 | ||||||||
Hypothetical 5% Return |
| |||||||||||||||
Class A Shares | $ | 1,000.00 | $ | 1,020.41 | 0.93 | % | $ | 4.71 | ||||||||
Multi-Asset Capital Stability Fund |
| |||||||||||||||
Actual Fund Return |
| |||||||||||||||
Class A Shares | $ | 1,000.00 | $ | 982.20 | 0.62 | % | $ | 3.08 | ||||||||
Hypothetical 5% Return |
| |||||||||||||||
Class A Shares | $ | 1,000.00 | $ | 1,021.96 | 0.62 | % | $ | 3.14 | ||||||||
| * | Expenses are equal to the Fund’s annualized expense ratio multiplied by the average account value over the period, multiplied by 183/365 (to reflect the period since inception). |
| SEI Institutional Managed Trust / Annual Report / September 30, 2013 | 279 |
Board of Trustee Considerations in Approving the Advisory and Sub-Advisory Agreements (Unaudited)
SEI Institutional Managed Trust (the “Trust”) and SEI Investments Management Corporation (“SIMC”) have entered into an investment advisory agreement (the “Advisory Agreement”). Pursuant to the Advisory Agreement, SIMC oversees the investment advisory services provided to the series of the Trust (the “Funds”) and may manage the cash portion of the Funds’ assets. Pursuant to separate sub-advisory agreements (the “Sub-Advisory Agreements” and, together with the Advisory Agreement, the “Investment Advisory Agreements”) with SIMC, and under the supervision of SIMC and the Trust’s Board of Trustees (the “Board”), the sub-advisers (each, a “Sub-Adviser” and collectively, the “Sub-Advisers”) are responsible for the day-to-day investment management of all or a discrete portion of the assets of the Funds. The Sub-Advisers are also responsible for managing their employees who provide services to these Funds. The Sub-Advisers are selected based primarily upon the research and recommendations of SIMC, which evaluates quantitatively and qualitatively the Sub-Advisers’ skills and investment results in managing assets for specific asset classes, investment styles and strategies.
The Investment Company Act of 1940, as amended (the “1940 Act”) requires that the initial approval of, as well as the continuation of, the Funds’ Investment Advisory Agreements must be specifically approved: (i) by the vote of the Board or by a vote of the shareholders of the Funds; and (ii) by the vote of a majority of the Trustees who are not parties to the Investment Advisory Agreements or “interested persons” of any party (the “Independent Trustees”), cast in person at a meeting called for the purpose of voting on such approval(s). In connection with their consideration of such approval(s), the Funds’ Trustees must request and evaluate, and SIMC and the Sub-Advisers are required to furnish, such information as may be reasonably necessary to evaluate the terms of the Investment Advisory Agreements. In addition, the Securities and Exchange Commission takes the position that, as part of their fiduciary duties with respect to a mutual fund’s fees, mutual fund boards are required to evaluate the material factors applicable to a decision to approve an Investment Advisory Agreement.
Consistent with these responsibilities, the Trust’s Board calls and holds meetings each year that are dedicated to considering whether to renew the Investment Advisory Agreements between the Trust and SIMC and SIMC and the Sub-Advisers with respect to the Funds of the Trust. In preparation for these meetings, the Board requests and reviews a wide variety of materials provided by SIMC and the Sub-Advisers, including information about SIMC’s and the Sub-Advisers’ affiliates, personnel and operations. The Board also receives extensive data from third parties. This information is provided in addition to the detailed information about the Funds that the Board reviews during the course of each year, including information that relates to Fund operations and Fund performance. The Trustees also receive a memorandum from Fund counsel and independent counsel to the Independent Trustees regarding the responsibilities of Trustees in connection with their consideration of whether to approve the Trust’s Investment Advisory Agreements. Finally, the Independent Trustees receive advice from independent counsel to the Independent Trustees, meet in executive sessions outside the presence of Fund management and participate in question and answer sessions with representatives of SIMC and the Sub-Advisers.
Specifically, during the course of the Trust’s fiscal year, the Board requested and received written materials from SIMC and the Sub-Advisers regarding: (i) the quality of SIMC’s and the Sub-Advisers’ investment management and other services; (ii) SIMC’s and the Sub-Advisers’ investment management personnel; (iii) SIMC’s and the Sub-Advisers’ operations and financial condition; (iv) SIMC’s and the Sub-Advisers’ brokerage practices (including any soft dollar arrangements) and investment strategies; (v) the level of the advisory fees that SIMC charges the Funds and the level of the sub-advisory fees that SIMC pays the Sub-Advisers compared with the fees each charge to comparable mutual funds; (vi) the Funds’ overall fees and operating expenses compared with similar mutual funds; (vii) the level of SIMC’s and the Sub-Advisers’ profitability from their Fund-related operations; (viii) SIMC’s and the Sub-Advisers’ compliance systems; (ix) SIMC’s and the Sub-Advisers’ policies on and compliance procedures for personal securities transactions; (x) SIMC’s and the Sub-Advisers’ reputation, expertise and resources in domestic and/or international financial markets; and (xi) the Funds’ performance compared with similar mutual funds.
| 280 | SEI Institutional Managed Trust / Annual Report / September 30, 2013 |
At the June 19-20, 2013 and September 10-11, 2013, meetings of the Board of Trustees, the Trustees, including a majority of the Independent Trustees, approved the Investment Advisory Agreements and approved the selection of SIMC and the Sub-Advisers to act in their respective capacities for the Funds. The Board’s approval was based on its consideration and evaluation of a variety of specific factors discussed at the meeting and at prior meetings, including:
| • | the nature, extent and quality of the services provided to the Funds under the Investment Advisory Agreements, including the resources of SIMC and the Sub-Advisers and their affiliates dedicated to the Funds; |
| • | the Funds’ investment performance and how it compared to that of other comparable mutual funds; |
| • | the Funds’ expenses under each Investment Advisory Agreement and how those expenses compared to those of other comparable mutual funds; |
| • | the profitability of SIMC and the Sub-Advisers and their affiliates with respect to the Funds, including both direct and indirect benefits accruing to SIMC and the Sub-Advisers and their affiliates; and |
| • | the extent to which economies of scale would be realized as the Funds grow and whether fee levels in the Investment Advisory Agreements reflect those economies of scale for the benefit of Fund investors. |
Nature, Extent and Quality of Services. The Board considered the nature, extent and quality of the services provided by SIMC and the Sub-Advisers to the Funds and the resources of SIMC and the Sub-Advisers and their affiliates dedicated to the Funds. In this regard, the Trustees evaluated, among other things, SIMC’s and each Sub-Adviser’s personnel, experience, track record and compliance program. The Trustees found the level of SIMC’s and each Sub-Adviser’s professional staff and culture of compliance satisfactory. Following evaluation, the Board concluded that, within the context of its full deliberations, the nature, extent and quality of services provided by SIMC and the Sub-Advisers to the Funds and the resources of SIMC and the Sub-Advisers and their affiliates dedicated to the Funds supported renewal of the Investment Advisory Agreements.
Fund Performance. The Board of Trustees considered Fund performance in determining whether to renew the Investment Advisory Agreements. Specifically, the Trustees considered the Funds’ performance relative to their peer groups and appropriate indices/benchmarks in light of total return, yield and market trends. As part of this review, the Trustees considered the composition of each peer group and selection criteria. In evaluating performance, the Trustees considered both market risk and shareholder risk expectations for the Funds. The Trustees found Fund performance satisfactory, and, where performance was below the benchmark, the Trustees were satisfied that appropriate steps were being taken. Following evaluation, the Board concluded that, within the context of its full deliberations, the performance of the Funds supported renewal of the Investment Advisory Agreements.
Fund Expenses. With respect to the Funds’ expenses under the Investment Advisory Agreements, the Trustees considered the rate of compensation called for by the Investment Advisory Agreements and the Funds’ net operating expense ratio in comparison to those of other comparable mutual funds. The Trustees also considered information about average expense ratios of comparable mutual funds in the Funds’ respective peer groups. The Trustees further considered the fact that the comparative fee analysis either showed that the various fees were below average or that there was a reasonable basis for the fee level. Finally, the Trustees considered the effects of SIMC’s voluntary waiver of management and other fees to prevent total Fund expenses from exceeding a specified cap and concluded that SIMC, through waivers, has maintained the Funds’ net operating expenses at competitive levels. Following evaluation, the Board concluded that, within the context of its full deliberations, the expenses of the Funds are reasonable and supported renewal of the Investment Advisory Agreements.
Profitability. With regard to profitability, the Trustees considered all compensation flowing to SIMC and the Sub-Advisers and their affiliates, directly or indirectly. The Trustees considered whether the varied levels of compensation and profitability under the Investment Advisory Agreements and other service agreements were reasonable and justified in light of the quality of all services rendered to the Funds by SIMC and the Sub-Advisers and their affiliates. The Trustees found that profitability was reasonable.
| SEI Institutional Managed Trust / Annual Report / September 30, 2013 | 281 |
Board of Trustee Considerations in Approving the Advisory and Sub-Advisory Agreements (Unaudited) (Concluded)
When considering the profitability of the Sub-Advisers, the Board took into account the fact that the Sub-Advisers are compensated by SIMC and not by the Funds directly, and such compensation with respect to any Sub-Adviser reflects an arms-length negotiation between the Sub-Adviser and SIMC. Based on this evaluation, the Board concluded that, within the context of its full deliberations, the profitability of each of SIMC and the Sub-Advisers is reasonable and supported renewal of the Investment Advisory Agreements.
Economies of Scale. The Trustees considered the existence of any economies of scale and whether those were passed along to the Funds’ shareholders through a graduated investment advisory fee schedule or other means, including any fee waivers by SIMC and its affiliates. Based on this evaluation, the Board concluded that, within the context of its full deliberations, the Funds obtain reasonable benefit from economies of scale.
Based on the Trustees’ deliberation and their evaluation of the information described above, the Board, including all of the Independent Trustees, unanimously approved the continuation of the Investment Advisory Agreements and concluded that the compensation under the Investment Advisory Agreements is fair and reasonable in light of such services and expenses and such other matters as the Trustees considered to be relevant in the exercise of their reasonable judgment. In the course of their deliberations, the Trustees did not identify any particular information that was all-important or controlling.
| 282 | SEI Institutional Managed Trust / Annual Report / September 30, 2013 |
Notice to Shareholders (Unaudited)
For shareholders who do not have a September 30, 2013, taxable year end, this notice is for informational purposes only. For shareholders with a September 30, 2013, taxable year end, please consult your tax adviser as to the pertinence of this notice.
For the fiscal year ended September 30, 2013, the Funds are designating long term and qualifying dividend income with regard to distributions paid during the year as follows:
| (A) Return of Capital | (B) Long Term Capital Gains Distributions (Tax Basis) | (C) Ordinary Income Distributions (Tax Basis) | Total Distributions (Tax Basis) | (D) Dividends Qualifying for Corporate Dividends Rec. Deduction (1) | ||||||||||||||||
| Large Cap Fund | 0 | % | 64 | % | 36 | % | 100 | % | 73 | % | ||||||||||
| Large Cap Value Fund | 0 | % | 0 | % | 100 | % | 100 | % | 100 | % | ||||||||||
| Large Cap Growth Fund | 0 | % | 0 | % | 100 | % | 100 | % | 100 | % | ||||||||||
| Tax-Managed Large Cap Fund | 0 | % | 0 | % | 100 | % | 100 | % | 100 | % | ||||||||||
| S&P 500 Index Fund | 0 | % | 0 | % | 100 | % | 100 | % | 98 | % | ||||||||||
| Small Cap Fund | 0 | % | 91 | % | 9 | % | 100 | % | 49 | % | ||||||||||
| Small Cap Value Fund | 0 | % | 0 | % | 100 | % | 100 | % | 100 | % | ||||||||||
| Small Cap Growth Fund | 0 | % | 0 | % | 100 | % | 100 | % | 100 | % | ||||||||||
| Tax-Managed Small/Mid Cap Fund | 0 | % | 0 | % | 100 | % | 100 | % | 100 | % | ||||||||||
| Mid-Cap Fund | 0 | % | 0 | % | 100 | % | 100 | % | 100 | % | ||||||||||
| U.S. Managed Volatility Fund | 0 | % | 29 | % | 71 | % | 100 | % | 88 | % | ||||||||||
| Global Managed Volatility Fund(7) | 0 | % | 0 | % | 100 | % | 100 | % | 25 | % | ||||||||||
| Tax-Managed Managed Volatility Fund | 0 | % | 51 | % | 49 | % | 100 | % | 100 | % | ||||||||||
| Real Estate Fund(6) | 0 | % | 0 | % | 100 | % | 100 | % | 0 | % | ||||||||||
| Enhanced Income Fund | 0 | % | 0 | % | 100 | % | 100 | % | 0 | % | ||||||||||
| Core Fixed Income Fund | 0 | % | 0 | % | 100 | % | 100 | % | 0 | % | ||||||||||
| U.S. Fixed Income Fund | 0 | % | 7 | % | 93 | % | 100 | % | 0 | % | ||||||||||
| High Yield Bond Fund | 0 | % | 0 | % | 100 | % | 100 | % | 0 | % | ||||||||||
| Real Return Fund | 0 | % | 0 | % | 100 | % | 100 | % | 0 | % | ||||||||||
| Multi-Strategy Alternative Fund | 0 | % | 0 | % | 100 | % | 100 | % | 8 | % | ||||||||||
| Multi-Asset Accumulation Fund | 0 | % | 24 | % | 76 | % | 100 | % | 1 | % | ||||||||||
| Multi-Asset Income Fund | 0 | % | 0 | % | 100 | % | 100 | % | 0 | % | ||||||||||
| Multi-Asset Inflation Managed Fund | 0 | % | 3 | % | 97 | % | 100 | % | 49 | % | ||||||||||
| Multi-Asset Capital Stability Fund | 0 | % | 57 | % | 43 | % | 100 | % | 0 | % | ||||||||||
| (E) Qualifying Dividend Income (15% Tax Rate for QDI) (2) | (F) U.S. Government Interest (3) | Interest Related Dividends (4) | Short-Term Capital Gain Dividends (5) | |||||||||||||
| Large Cap Fund | 73 | % | 0 | % | 0 | % | 100 | % | ||||||||
| Large Cap Value Fund | 100 | % | 0 | % | 0 | % | 0 | % | ||||||||
| Large Cap Growth Fund | 100 | % | 0 | % | 0 | % | 0 | % | ||||||||
| Tax-Managed Large Cap Fund | 100 | % | 0 | % | 0 | % | 0 | % | ||||||||
| S&P 500 Index Fund | 98 | % | 0 | % | 0 | % | 0 | % | ||||||||
| Small Cap Fund | 48 | % | 0 | % | 8 | % | 100 | % | ||||||||
| Small Cap Value Fund | 100 | % | 0 | % | 0 | % | 0 | % | ||||||||
| Small Cap Growth Fund | 100 | % | 0 | % | 0 | % | 0 | % | ||||||||
| Tax-Managed Small/Mid Cap Fund | 100 | % | 0 | % | 0 | % | 0 | % | ||||||||
| Mid-Cap Fund | 100 | % | 1 | % | 1 | % | 0 | % | ||||||||
| U.S. Managed Volatility Fund | 90 | % | 1 | % | 1 | % | 100 | % | ||||||||
| Global Managed Volatility Fund(7) | 63 | % | 0 | % | 1 | % | 0 | % | ||||||||
| Tax-Managed Managed Volatility Fund | 100 | % | 0 | % | 0 | % | 100 | % | ||||||||
| Real Estate Fund(6) | 0 | % | 0 | % | 0 | % | 0 | % | ||||||||
| Enhanced Income Fund | 0 | % | 0 | % | 100 | % | 0 | % | ||||||||
| Core Fixed Income Fund | 0 | % | 8 | % | 93 | % | 0 | % | ||||||||
| U.S. Fixed Income Fund | 0 | % | 6 | % | 71 | % | 100 | % | ||||||||
| High Yield Bond Fund | 0 | % | 0 | % | 95 | % | 0 | % | ||||||||
| Real Return Fund | 0 | % | 20 | % | 1 | % | 100 | % | ||||||||
| Multi-Strategy Alternative Fund | 28 | % | 0 | % | 0 | % | 0 | % | ||||||||
| Multi-Asset Accumulation Fund | 2 | % | 0 | % | 1 | % | 100 | % | ||||||||
| Multi-Asset Income Fund | 0 | % | 0 | % | 65 | % | 100 | % | ||||||||
| Multi-Asset Inflation Managed Fund | 100 | % | 15 | % | 52 | % | 100 | % | ||||||||
| Multi-Asset Capital Stability Fund | 0 | % | 0 | % | 15 | % | 100 | % | ||||||||
| (1) | Qualifying dividends represent dividends which qualify for the corporate dividends received deduction and is reflected as a percentage of ordinary income distributions (the total of short term capital gain and net investment income distributions). |
| (2) | The percentage in this column represents the amount of “Qualifying Dividend Income” and is reflected as a percentage of ordinary income distributions (the total of short term capital gain and net investment income distributions). |
| (3) | “U.S. Government Interest” represents the amount of interest that was derived from direct U.S. Government obligations and distributed during the fiscal year. This amount is reflected as a percentage of total ordinary income distributions (the total of short term capital gain and net investment income distributions). Generally, interest from direct U.S. Government obligations is exempt from state income tax. However, for shareholders who are residents of California, Connecticut and New York, the statutory threshold requirements were not satisfied to permit exemption of these amounts from state income. |
| SEI Institutional Managed Trust / Annual Report / September 30, 2013 | 283 |
Notice to Shareholders (Unaudited) (Concluded)
| (4) | The percentage in this column represents the amount of “Interest Related Dividends” and is reflected as a percentage of net investment income distributions that is exempt from U.S. withholding tax when paid to foreign investors. |
| (5) | The percentage in this column represents the amount of “Short-Term Capital Gain Dividends” and is reflected as a percentage of short-term capital gain distributions that is exempt from U.S. withholding tax when paid to foreign investors. |
| (6) | Information reflects Fund activity based on Fund’s December 31, 2012 tax reporting year. |
| (7) | The Fund intends to pass through a foreign tax credit to shareholders for fiscal year ended 2013, the total amount of foreign source income is $24,788,880. The total amount of foreign tax credit is $2,062,938. Your allocable share of the foreign tax credit will be reported on Form 1099 DIV. |
Items (A) and (B) are based on the percentages of each Fund’s total distribution.
Items (C) and (D) are based on the percentage of ordinary income distributions of each Fund.
Item (E) is based on the percentage of gross income of each Fund.
Please consult your tax adviser for proper treatment of this information. This notification should be kept with your permanent tax records.
| 284 | SEI Institutional Managed Trust / Annual Report / September 30, 2013 |
SEI INSTITUTIONAL MANAGED TRUST ANNUAL REPORT SEPTEMBER 30, 2013
Robert A. Nesher, Chairman
Trustees
William M. Doran
George J. Sullivan, Jr.
Nina Lesavoy
James M. Williams
Mitchell A. Johnson
Hubert L. Harris, Jr.
Officers
Robert A. Nesher
President and Chief Executive Officer
Peter A. Rodriguez
Controller and Chief Financial Officer
Russell Emery
Chief Compliance Officer
Timothy D. Barto
Vice President, Secretary
Aaron Buser
Vice President, Assistant Secretary
David F. McCann
Vice President, Assistant Secretary
Stephen G. MacRae
Vice President
Edward McCusker
Anti-Money Laundering Compliance Officer
Privacy Officer
Investment Adviser
SEI Investments Management Corporation
Administrator
SEI Investments Global Funds Services
Distributor
SEI Investments Distribution Co.
Legal Counsel
Morgan, Lewis & Bockius LLP
Independent Registered Public Accounting Firm
KPMG LLP
This report and the financial statements contained herein are submitted for the general information of the shareholders of the Trust and must be preceded or accompanied by a current prospectus. Shares of the Funds are not deposits or obligations of, or guaranteed or endorsed by, any bank. The shares are not federally insured by the Federal Deposit Insurance Corporation (FDIC), the Federal Reserve Board, or any other government agency. Investment in the shares involves risk, including the possible loss of principal.
For more information call
1 800 DIAL SEI
(1 800 342 5734)

SEI-F-087 (9/13)
Item 2. Code of Ethics.
The Registrant has adopted a code of ethics that applies to the Registrant’s principal executive officer, principal financial officer, comptroller or principal accounting officer, and any person who performs a similar function.
Item 3. Audit Committee Financial Expert.
(a) (1) The Registrant’s Board of Trustees has determined that the Registrant has at least two audit committee financial experts serving on the audit committee.
(a) (2) The audit committee financial experts are George J. Sullivan, Jr. and Hubert L. Harris, Jr. Messrs. Sullivan and Harris are independent as defined in Form N-CSR Item 3 (a) (2)
Item 4. Principal Accountant Fees and Services.
Fees billed by KPMG LLP (“KPMG”) related to the Registrant.
KPMG billed the Registrant aggregate fees for services rendered to the Registrant for the fiscal years 2013 and 2012 as follows:
| Fiscal 2013 | Fiscal 2012 | |||||||||||||||||||||||
| All fees and services to the Registrant that were pre- approved | All fees and services to service affiliates that were pre- approved | All other fees and services to service affiliates that did not require pre-approval | All fees and services to the Registrant that were pre- approved | All fees and services to service affiliates that were pre- approved | All other fees and services to service affiliates that did not require pre-approval | |||||||||||||||||||
(a) Audit Fees (1) | $ | 691,000 | $ | 0 | N/A | $ | 628,750 | $ | 0 | N/A | ||||||||||||||
(b) Audit-Related Fees (3) | $ | 0 | $ | 0 | $ | 0 | $ | 20,000 | $ | 0 | $ | 0 | ||||||||||||
(c) Tax Fees (4) | $ | 0 | $ | 28,000 | $ | 0 | $ | 0 | $ | 5,000 | $ | 0 | ||||||||||||
(d) All Other Fees (2) | $ | 0 | $ | 237,000 | $ | 0 | $ | 0 | $ | 236,000 | $ | 0 | ||||||||||||
Notes:
| (1) | Audit fees include amounts related to the audit of the Registrant’s annual financial statements and services normally provided by the accountant in connection with statutory and regulatory filings. |
| (2) | See Item 4(g) for a description of the services comprising the fees disclosed in this category. |
| (3) | Audit-related fees include amounts related to attestation reporting over compliance with an exemptive order under the federal securities laws. |
| (4) | Tax fees include amounts related to tax compliance and consulting services for various service affiliates of the Registrant. |
(e)(1) The Registrant’s Audit Committee has adopted and the Board of Trustees has ratified an Audit and Non-Audit Services Pre-Approval Policy (the “Policy”), which sets forth the procedures and the conditions pursuant to which services proposed to be performed by the independent auditor of the Registrant may be pre-approved.
The Policy provides that all requests or applications for proposed services to be provided by the independent auditor must be submitted to the Registrant’s Chief Financial Officer (“CFO”) and must include a detailed description of the services proposed to be rendered. The CFO will determine whether such services: (1) require specific pre-approval; (2) are included within the list of services that have received the general pre-approval of the Audit Committee pursuant to the Policy; or (3) have been previously pre-approved in connection with the independent auditor’s annual engagement letter for the applicable year or otherwise. In any instance where services require pre-approval, the Audit Committee will consider whether such services are consistent with SEC’s rules and whether the provision of such services would impair the auditor’s independence.
Requests or applications to provide services that require specific pre-approval by the Audit Committee will be submitted to the Audit Committee by the CFO. The Audit Committee will be informed by the CFO on a quarterly basis of all services rendered by the independent auditor. The Audit Committee has delegated specific pre-approval authority to either the Audit Committee Chair or financial experts, provided that the estimated fee for any such proposed pre-approved service does not exceed $100,000 and any pre-approval decisions are reported to the Audit Committee at its next regularly scheduled meeting.
Services that have received the general pre-approval of the Audit Committee are identified and described in the Policy. In addition, the Policy sets forth a maximum fee per engagement with respect to each identified service that has received general pre-approval.
All services to be provided by the independent auditor shall be provided pursuant to a signed written engagement letter with the Registrant, the investment advisor or applicable control affiliate (except that matters as to which an engagement letter would be impractical because of timing issues or because the matter is small may not be the subject of an engagement letter) that sets forth both the services to be provided by the independent auditor and the total fees to be paid to the independent auditor for those services.
In addition, the Audit Committee has determined to take additional measures on an annual basis to meet its responsibility to oversee the work of the independent auditor and to assure the auditor’s independence from the Registrant, such as reviewing a formal written statement from the independent auditor delineating all relationships between the independent auditor and the Registrant, and discussing with the independent auditor its methods and procedures for ensuring independence.
(e)(2) Percentage of fees billed applicable to non-audit services pursuant to waiver of pre-approval requirement were as follows:
| Fiscal 2013 | Fiscal 2012 | |||||||
Audit-Related Fees | 0 | % | 0 | % | ||||
Tax Fees | 0 | % | 0 | % | ||||
All Other Fees | 0 | % | 0 | % | ||||
(f) Not Applicable.
(g)(1) The aggregate non-audit fees and services billed by KPMG for the fiscal years 2013 and 2012 were $237,000 and $236,000, respectively. Non-audit fees consist of SSAE No. 16 review of fund accounting and administration operations, attestation report in accordance with Rule 17 Ad-13, and agreed upon procedures report over certain internal controls related to compliance with federal securities laws and regulations.
(h) During the past fiscal year, Registrant’s principal accountant provided certain non-audit services to Registrant’s investment adviser or to entities controlling, controlled by, or under common control with Registrant’s investment adviser that provide ongoing services to Registrant that were not subject to pre-approval pursuant to paragraph (c)(7)(ii) of Rule 2-01 of Regulation S-X. The Audit Committee of Registrant’s Board of Trustees reviewed and considered these non-audit services provided by Registrant’s principal accountant to Registrant’s affiliates, including whether the provision of these non-audit services is compatible with maintaining the principal accountant’s independence.
Item 5. Audit Committee of Listed Registrants.
Not applicable.
Item 6. Schedule of Investments
The Schedules of Investments in securities of unaffiliated issuers as of the close of the reporting period for the Large Cap Fund, Large Cap Value Fund, Large Cap Growth Fund, Tax-Managed Large Cap Fund, S&P 500 Index Fund, Small Cap Fund, Small Cap Value Fund, Small Cap Growth Fund, Tax-Managed Small/Mid Cap Fund, Mid-Cap Fund, U.S. Managed Volatility Fund, Global Managed Volatility Fund and Tax-Managed Managed Volatility Fund are listed below. The Schedule of Investments in securities of unaffiliated issuers as of the close of the reporting period for the Real Estate Fund, Enhanced Income Fund, Core Fixed Income Fund, U.S. Fixed Income Fund, High Yield Bond Fund, Real Return Fund Multi-Strategy Alternative Fund, Multi-Asset Accumulation Fund, Multi-Asset Income Fund, Multi-Asset Inflation Managed Fund and Multi-Asset Capital Stability Fund is included as part of the report to shareholders filed under Item 1 of this form.
Schedule of Investments
Large Cap Fund
September 30, 2013
| Market Value | ||||||||
Description | Shares | ($ Thousands) | ||||||
COMMON STOCK — 95.3% | ||||||||
Consumer Discretionary — 12.7% | ||||||||
Abercrombie & Fitch, Cl A (A) | 38,600 | $ | 1,365 | |||||
Apollo Group, Cl A * (A) | 33,500 | 697 | ||||||
Autoliv | 17,400 | 1,520 | ||||||
Best Buy | 184,900 | 6,934 | ||||||
Big Lots * | 19,300 | 716 | ||||||
CBS, Cl B | 145,060 | 8,001 | ||||||
Chipotle Mexican Grill, Cl A * (A) | 11,700 | 5,015 | ||||||
Coach | 206,478 | 11,259 | ||||||
Comcast, Cl A | 134,330 | 6,065 | ||||||
CST Brands (A) | 7,255 | 216 | ||||||
Dillard’s, Cl A | 47,800 | 3,743 | ||||||
DIRECTV * | 69,800 | 4,171 | ||||||
Ford Motor | 338,600 | 5,712 | ||||||
Fossil Group * | 39,910 | 4,639 | ||||||
GameStop, Cl A (A) | 177,600 | 8,818 | ||||||
Gannett | 175,100 | 4,691 | ||||||
Gap | 64,300 | 2,590 | ||||||
Goodyear Tire & Rubber | 44,400 | 997 | ||||||
Harley-Davidson, Cl A (A) | 148,764 | 9,557 | ||||||
Harman International Industries, Cl A | 55,190 | 3,655 | ||||||
Home Depot | 76,600 | 5,810 | ||||||
International Game Technology | 131,900 | 2,497 | ||||||
Kohl’s | 43,200 | 2,235 | ||||||
L Brands (A) | 161,025 | 9,839 | ||||||
Lear | 97,500 | 6,978 | ||||||
Liberty Media—Interactive, Cl A * | 508,275 | 11,929 | ||||||
Macy’s | 37,500 | 1,623 | ||||||
Magna International, Cl A (A) | 39,400 | 3,253 | ||||||
Murphy USA * | 9,200 | 372 | ||||||
Nike, Cl B | 262,578 | 19,074 | ||||||
Nordstrom | 196,083 | 11,020 | ||||||
Panera Bread, Cl A * | 19,700 | 3,123 | ||||||
priceline.com * | 12,250 | 12,384 | ||||||
Ralph Lauren, Cl A | 34,010 | 5,603 | ||||||
Sally Beauty Holdings * | 139,350 | 3,645 | ||||||
Signet Jewelers | 50,900 | 3,647 | ||||||
Starbucks | 106,483 | 8,196 | ||||||
Target, Cl A | 216,409 | 13,846 | ||||||
Time Warner Cable, Cl A | 90,260 | 10,073 | ||||||
TRW Automotive Holdings * | 30,600 | 2,182 | ||||||
Tupperware Brands | 3,800 | 328 | ||||||
Twenty-First Century Fox | 394,930 | 13,204 | ||||||
Walt Disney | 170,405 | 10,989 | ||||||
Whirlpool | 71,400 | 10,456 | ||||||
Wyndham Worldwide | 22,500 | 1,372 | ||||||
Yum! Brands | 52,360 | 3,738 | ||||||
|
| |||||||
| 267,777 | ||||||||
|
| |||||||
Consumer Staples — 9.4% | ||||||||
Altria Group | 22,500 | 773 | ||||||
Anheuser-Busch InBev ADR | 100,342 | 9,954 | ||||||
Archer-Daniels-Midland | 139,100 | 5,124 | ||||||
Avon Products | 50,700 | 1,044 | ||||||
Bunge | 13,800 | 1,048 | ||||||
Coca-Cola | 53,600 | 2,030 | ||||||
Coca-Cola Enterprises | 36,100 | 1,452 | ||||||
Constellation Brands, Cl A * | 8,300 | 476 | ||||||
| Market Value | ||||||||
Description | Shares | ($ Thousands) | ||||||
Costco Wholesale | 188,547 | $ | 21,706 | |||||
CVS Caremark | 324,190 | 18,398 | ||||||
Dr Pepper Snapple Group | 2,600 | 117 | ||||||
Energizer Holdings | 22,200 | 2,023 | ||||||
Estee Lauder, Cl A | 245,556 | 17,164 | ||||||
Green Mountain Coffee Roasters * (A) | 18,900 | 1,424 | ||||||
Hershey | 49,700 | 4,597 | ||||||
Ingredion | 28,100 | 1,859 | ||||||
Kimberly-Clark | 27,100 | 2,553 | ||||||
Kroger | 235,700 | 9,508 | ||||||
Lorillard | 63,700 | 2,853 | ||||||
Mead Johnson Nutrition, Cl A | 146,432 | 10,874 | ||||||
Mondelez International, Cl A | 356,626 | 11,205 | ||||||
Nu Skin Enterprises, Cl A | 39,800 | 3,811 | ||||||
PepsiCo | 21,400 | 1,701 | ||||||
Philip Morris International | 105,270 | 9,115 | ||||||
Procter & Gamble | 78,100 | 5,904 | ||||||
Reynolds American | 13,200 | 644 | ||||||
Safeway (A) | 118,200 | 3,781 | ||||||
Tyson Foods, Cl A | 363,600 | 10,283 | ||||||
Walgreen | 265,175 | 14,266 | ||||||
Wal-Mart Stores | 51,000 | 3,772 | ||||||
Whole Foods Market | 306,788 | 17,947 | ||||||
|
| |||||||
| 197,406 | ||||||||
|
| |||||||
Energy — 9.8% | ||||||||
Apache | 45,500 | 3,874 | ||||||
Chevron | 256,400 | 31,153 | ||||||
ConocoPhillips | 179,900 | 12,505 | ||||||
Core Laboratories (A) | 36,348 | 6,150 | ||||||
CVR Energy | 9,000 | 347 | ||||||
Diamond Offshore Drilling (A) | 68,500 | 4,269 | ||||||
EOG Resources | 109,025 | 18,456 | ||||||
Exxon Mobil | 353,900 | 30,449 | ||||||
FMC Technologies * | 113,410 | 6,285 | ||||||
Halliburton | 100,386 | 4,834 | ||||||
Helmerich & Payne (A) | 31,100 | 2,144 | ||||||
Hess | 77,400 | 5,986 | ||||||
Kinder Morgan | 332,853 | 11,840 | ||||||
Marathon Oil | 270,500 | 9,435 | ||||||
Marathon Petroleum | 104,700 | 6,734 | ||||||
Murphy Oil | 103,900 | 6,267 | ||||||
Nabors Industries | 54,300 | 872 | ||||||
National Oilwell Varco, Cl A | 71,220 | 5,563 | ||||||
Noble Energy (A) | 97,480 | 6,532 | ||||||
Occidental Petroleum | 104,330 | 9,759 | ||||||
Patterson-UTI Energy | 11,300 | 242 | ||||||
Phillips 66 | 174,610 | 10,096 | ||||||
Schlumberger, Cl A | 87,661 | 7,746 | ||||||
SM Energy | 20,500 | 1,582 | ||||||
Superior Energy Services * | 9,700 | 243 | ||||||
Valero Energy | 65,300 | 2,230 | ||||||
|
| |||||||
| 205,593 | ||||||||
|
| |||||||
Financials — 15.5% | ||||||||
ACE | 35,500 | 3,321 | ||||||
Aflac | 43,900 | 2,721 | ||||||
Allied World Assurance Holdings | 49,000 | 4,870 | ||||||
Allstate | 177,300 | 8,963 | ||||||
American Capital Agency, Cl A † | 7,300 | 165 | ||||||
American Financial Group | 87,647 | 4,738 | ||||||
American International Group | 397,620 | 19,336 | ||||||
| 1 | SEI Institutional Managed Trust / Annual Report / September 30, 2013 |
Schedule of Investments
Large Cap Fund
September 30, 2013
| Market Value | ||||||||
Description | Shares | ($ Thousands) | ||||||
American Tower, Cl A † | 8,800 | $ | 652 | |||||
Ameriprise Financial | 48,800 | 4,445 | ||||||
Annaly Capital Management † | 60,600 | 702 | ||||||
Associated Banc-Corp | 4,700 | 73 | ||||||
Assurant | 149,000 | 8,061 | ||||||
AvalonBay Communities † | 1,900 | 241 | ||||||
Axis Capital Holdings | 38,600 | 1,672 | ||||||
Bank of America | 827,180 | 11,415 | ||||||
Bank of New York Mellon | 55,300 | 1,670 | ||||||
Berkshire Hathaway, Cl B * | 23,600 | 2,679 | ||||||
Boston Properties † | 2,200 | 235 | ||||||
Brandywine Realty Trust † | 67,500 | 890 | ||||||
Capital One Financial | 116,460 | 8,005 | ||||||
CBL & Associates Properties † | 35,800 | 684 | ||||||
CBOE Holdings | 60,000 | 2,714 | ||||||
Charles Schwab | 314,064 | 6,639 | ||||||
Chubb | 71,600 | 6,391 | ||||||
Citigroup | 429,660 | 20,843 | ||||||
CME Group | 88,625 | 6,548 | ||||||
CNA Financial | 25,700 | 981 | ||||||
CommonWealth † | 17,600 | 386 | ||||||
Discover Financial Services | 216,500 | 10,942 | ||||||
Endurance Specialty Holdings | 20,000 | 1,074 | ||||||
Equity Lifestyle Properties † | 31,200 | 1,066 | ||||||
Equity Residential † | 8,300 | 445 | ||||||
Everest Re Group | 59,200 | 8,608 | ||||||
Fifth Third Bancorp | 420,500 | 7,586 | ||||||
General Growth Properties † | 13,700 | 264 | ||||||
Goldman Sachs Group | 70,400 | 11,138 | ||||||
Hartford Financial Services Group | 115,600 | 3,597 | ||||||
HCP † | 10,500 | 430 | ||||||
Health Care † | 6,600 | 412 | ||||||
Hospitality Properties Trust † | 29,600 | 838 | ||||||
Host Hotels & Resorts † | 10,200 | 180 | ||||||
Huntington Bancshares | 807,500 | 6,670 | ||||||
IntercontinentalExchange * (A) | 51,000 | 9,252 | ||||||
JPMorgan Chase | 580,980 | 30,031 | ||||||
KeyCorp | 732,200 | 8,347 | ||||||
Kimco Realty † | 5,800 | 117 | ||||||
Lincoln National | 122,900 | 5,161 | ||||||
MetLife | 42,000 | 1,972 | ||||||
MFA Financial † | 94,700 | 705 | ||||||
Morgan Stanley | 34,500 | 930 | ||||||
PartnerRe | 46,200 | 4,229 | ||||||
PNC Financial Services Group | 113,200 | 8,201 | ||||||
Popular * | 31,470 | 826 | ||||||
Progressive | 324,650 | 8,840 | ||||||
ProLogis † | 11,500 | 433 | ||||||
Protective Life | 37,300 | 1,587 | ||||||
Prudential Financial | 35,400 | 2,761 | ||||||
Public Storage † | 3,300 | 530 | ||||||
Realty Income † | 4,500 | 179 | ||||||
Regions Financial | 369,800 | 3,424 | ||||||
Reinsurance Group of America, Cl A | 49,200 | 3,296 | ||||||
RenaissanceRe Holdings | 14,600 | 1,322 | ||||||
Senior Housing Properties Trust † | 28,600 | 667 | ||||||
Simon Property Group † | 7,200 | 1,067 | ||||||
SLM | 258,100 | 6,427 | ||||||
State Street | 43,900 | 2,886 | ||||||
| Market Value | ||||||||
Description | Shares | ($ Thousands) | ||||||
Torchmark, Cl A (A) | 13,700 | $ | 991 | |||||
Travelers | 117,500 | 9,961 | ||||||
Unum Group | 164,100 | 4,995 | ||||||
US Bancorp | 45,700 | 1,672 | ||||||
Validus Holdings | 45,100 | 1,668 | ||||||
Ventas † | 3,851 | 237 | ||||||
Vornado Realty Trust † | 2,800 | 235 | ||||||
Wells Fargo | 506,300 | 20,920 | ||||||
Weyerhaeuser † | 8,000 | 229 | ||||||
|
| |||||||
| 327,388 | ||||||||
|
| |||||||
Health Care — 13.5% | ||||||||
Abbott Laboratories | 94,400 | 3,133 | ||||||
AbbVie | 88,700 | 3,968 | ||||||
Aetna, Cl A | 146,400 | 9,373 | ||||||
Alexion Pharmaceuticals * | 39,730 | 4,615 | ||||||
Allergan | 112,750 | 10,198 | ||||||
AmerisourceBergen | 70,400 | 4,301 | ||||||
Amgen, Cl A | 167,313 | 18,729 | ||||||
Baxter International | 18,600 | 1,222 | ||||||
Biogen Idec * | 73,699 | 17,744 | ||||||
Bristol-Myers Squibb | 155,290 | 7,187 | ||||||
Cardinal Health | 51,800 | 2,701 | ||||||
Celgene, Cl A * | 169,728 | 26,126 | ||||||
Cigna | 61,500 | 4,727 | ||||||
Covance * | 57,595 | 4,980 | ||||||
DaVita HealthCare Partners * | 93,664 | 5,330 | ||||||
Eli Lilly | 61,400 | 3,090 | ||||||
Endo Pharmaceuticals Holdings * | 18,600 | 845 | ||||||
Express Scripts Holding * | 310,939 | 19,210 | ||||||
Gilead Sciences * | 90,870 | 5,710 | ||||||
HCA Holdings | 26,000 | 1,112 | ||||||
Humana | 95,900 | 8,950 | ||||||
Idexx Laboratories * (A) | 45,564 | 4,540 | ||||||
Intuitive Surgical * | 18,141 | 6,826 | ||||||
Johnson & Johnson | 195,094 | 16,913 | ||||||
Leidos Holdings (A) | 26,750 | 1,218 | ||||||
McKesson | 36,500 | 4,683 | ||||||
Medtronic | 41,200 | 2,194 | ||||||
Merck | 114,000 | 5,428 | ||||||
Myriad Genetics * (A) | 31,800 | 747 | ||||||
Novo Nordisk ADR | 42,125 | 7,128 | ||||||
Omnicare (A) | 122,900 | 6,821 | ||||||
Perrigo (A) | 43,050 | 5,311 | ||||||
Pfizer | 707,787 | 20,321 | ||||||
Pharmacyclics * | 9,900 | 1,371 | ||||||
Questcor Pharmaceuticals (A) | 15,100 | 876 | ||||||
Shire | 54,910 | 6,583 | ||||||
St. Jude Medical | 89,900 | 4,822 | ||||||
United Therapeutics | 78,200 | 6,166 | ||||||
UnitedHealth Group | 56,060 | 4,014 | ||||||
Warner Chilcott, Cl A | 3,500 | 80 | ||||||
WellPoint | 151,100 | 12,633 | ||||||
Zimmer Holdings | 36,300 | 2,982 | ||||||
|
| |||||||
| 284,908 | ||||||||
|
| |||||||
Industrials — 8.4% | ||||||||
Aecom Technology * | 47,600 | 1,488 | ||||||
AGCO | 69,100 | 4,175 | ||||||
Alaska Air Group | 24,400 | 1,528 | ||||||
Alliant Techsystems | 57,949 | 5,653 | ||||||
Canadian Pacific Railway | 66,670 | 8,221 | ||||||
| 2 | SEI Institutional Managed Trust / Annual Report / September 30, 2013 |
Schedule of Investments
Large Cap Fund
September 30, 2013
| Market Value | ||||||||
Description | Shares | ($ Thousands) | ||||||
Caterpillar, Cl A | 22,600 | $ | 1,884 | |||||
Copa Holdings, Cl A | 9,500 | 1,317 | ||||||
Cummins | 80,770 | 10,732 | ||||||
Danaher, Cl A | 100,901 | 6,995 | ||||||
Deere | 31,400 | 2,556 | ||||||
Delta Air Lines, Cl A | 253,600 | 5,982 | ||||||
Engility Holdings * | 4,883 | 155 | ||||||
Exelis | 246,700 | 3,876 | ||||||
FedEx | 9,600 | 1,095 | ||||||
Fluor | 122,118 | 8,666 | ||||||
General Dynamics | 25,900 | 2,267 | ||||||
General Electric | 206,700 | 4,938 | ||||||
Huntington Ingalls Industries, Cl A | 44,200 | 2,979 | ||||||
Kansas City Southern | 47,650 | 5,211 | ||||||
KBR | 46,600 | 1,521 | ||||||
L-3 Communications Holdings | 110,800 | 10,470 | ||||||
Lockheed Martin | 33,900 | 4,324 | ||||||
Norfolk Southern | 22,600 | 1,748 | ||||||
Northrop Grumman | 137,600 | 13,108 | ||||||
Oshkosh Truck * | 65,400 | 3,203 | ||||||
Pall (A) | 115,160 | 8,872 | ||||||
Parker Hannifin, Cl A | 15,700 | 1,707 | ||||||
Pentair | 147,350 | 9,569 | ||||||
Raytheon | 115,400 | 8,894 | ||||||
Roper Industries | 45,738 | 6,077 | ||||||
RR Donnelley & Sons (A) | 78,200 | 1,236 | ||||||
Southwest Airlines, Cl A | 103,700 | 1,510 | ||||||
Stericycle, Cl A * | 55,986 | 6,461 | ||||||
Timken | 40,900 | 2,470 | ||||||
Union Pacific | 66,720 | 10,364 | ||||||
United Continental Holdings * | 38,400 | 1,179 | ||||||
United Technologies | 4,700 | 507 | ||||||
URS | 51,300 | 2,757 | ||||||
US Airways Group * (A) | 63,900 | 1,212 | ||||||
Waste Management | 26,000 | 1,072 | ||||||
|
| |||||||
| 177,979 | ||||||||
|
| |||||||
Information Technology — 19.9% | ||||||||
Accenture, Cl A | 82,931 | 6,107 | ||||||
Activision Blizzard | 14,700 | 245 | ||||||
Adobe Systems * | 496,827 | 25,805 | ||||||
Altera | 83,430 | 3,100 | ||||||
Amdocs | 164,100 | 6,013 | ||||||
Amphenol, Cl A | 65,261 | 5,050 | ||||||
Ansys * | 45,883 | 3,970 | ||||||
AOL | 58,400 | 2,019 | ||||||
Apple | 52,032 | 24,806 | ||||||
Applied Materials | 507,720 | 8,906 | ||||||
Arrow Electronics, Cl A * | 6,300 | 306 | ||||||
Avnet | 62,900 | 2,624 | ||||||
Brocade Communications Systems * | 13,400 | 108 | ||||||
CA | 157,400 | 4,670 | ||||||
Cisco Systems | 682,750 | 15,990 | ||||||
Citrix Systems * | 61,285 | 4,327 | ||||||
Cognizant Technology Solutions, Cl A * | 42,259 | 3,470 | ||||||
Computer Sciences | 24,400 | 1,263 | ||||||
CoreLogic * | 75,200 | 2,034 | ||||||
Corning, Cl B | 209,800 | 3,061 | ||||||
| Market Value | ||||||||
Description | Shares | ($ Thousands) | ||||||
eBay * | 160,675 | $ | 8,964 | |||||
EMC | 423,971 | 10,837 | ||||||
F5 Networks, Cl A * | 29,960 | 2,569 | ||||||
Facebook, Cl A * | 125,280 | 6,294 | ||||||
Fidelity National Information Services, Cl B | 47,000 | 2,183 | ||||||
Fiserv, Cl A * | 12,600 | 1,273 | ||||||
Flextronics International * | 208,400 | 1,894 | ||||||
Genpact * | 222,508 | 4,201 | ||||||
Google, Cl A * | 21,753 | 19,054 | ||||||
Harris | 37,800 | 2,242 | ||||||
Hewlett-Packard | 93,000 | 1,951 | ||||||
IAC | 5,500 | 301 | ||||||
Ingram Micro, Cl A * | 286,700 | 6,608 | ||||||
Intel | 171,500 | 3,931 | ||||||
International Business Machines | 59,388 | 10,998 | ||||||
Intuit | 130,225 | 8,635 | ||||||
Lender Processing Services | 7,400 | 246 | ||||||
Lexmark International, Cl A (A) | 13,900 | 459 | ||||||
LinkedIn, Cl A * | 6,120 | 1,506 | ||||||
Marvell Technology Group | 388,900 | 4,472 | ||||||
Mastercard, Cl A | 36,265 | 24,398 | ||||||
Microsoft | 444,075 | 14,792 | ||||||
National Instruments | 119,729 | 3,703 | ||||||
NetApp | 120,996 | 5,157 | ||||||
Nokia ADR * | 492,140 | 3,204 | ||||||
Oracle, Cl B | 486,713 | 16,144 | ||||||
Qualcomm | 482,440 | 32,497 | ||||||
Rovi * | 12,000 | 230 | ||||||
Salesforce.com * (A) | 105,411 | 5,472 | ||||||
SanDisk | 77,200 | 4,594 | ||||||
Science Applications International * | 15,286 | 516 | ||||||
Seagate Technology | 90,600 | 3,963 | ||||||
Symantec, Cl A | 98,900 | 2,448 | ||||||
TE Connectivity | 37,400 | 1,937 | ||||||
Tech Data * | 20,300 | 1,013 | ||||||
Teradata * | 251,755 | 13,957 | ||||||
Texas Instruments | 173,410 | 6,983 | ||||||
VeriFone Holdings * | 98,175 | 2,244 | ||||||
VeriSign * (A) | 125,675 | 6,396 | ||||||
Visa, Cl A | 133,437 | 25,500 | ||||||
Western Digital | 177,300 | 11,241 | ||||||
Xerox | 545,200 | 5,610 | ||||||
Yahoo! * | 138,100 | 4,579 | ||||||
|
| |||||||
| 419,070 | ||||||||
|
| |||||||
Materials — 2.9% | ||||||||
Cabot | 27,000 | 1,153 | ||||||
CF Industries Holdings | 26,000 | 5,482 | ||||||
Dow Chemical, Cl A | 192,440 | 7,390 | ||||||
Eastman Chemical | 23,100 | 1,800 | ||||||
Ecolab | 62,862 | 6,208 | ||||||
Freeport-McMoRan Copper & Gold, Cl B | 62,100 | 2,054 | ||||||
Huntsman | 144,500 | 2,978 | ||||||
LyondellBasell Industries, Cl A | 152,110 | 11,139 | ||||||
Monsanto | 55,390 | 5,781 | ||||||
Packaging Corp of America | 47,000 | 2,683 | ||||||
PPG Industries | 1,005 | 168 | ||||||
| 3 | SEI Institutional Managed Trust / Annual Report / September 30, 2013 |
Schedule of Investments
Large Cap Fund
September 30, 2013
Shares/Face Amount | Market Value | |||||||
Description | ($ Thousands) | ($ Thousands) | ||||||
Reliance Steel & Aluminum | 9,900 | $ | 725 | |||||
Rock Tenn, Cl A | 39,600 | 4,011 | ||||||
Steel Dynamics | 48,200 | 806 | ||||||
Syngenta ADR | 75,675 | 6,152 | ||||||
Westlake Chemical | 14,900 | 1,559 | ||||||
|
| |||||||
| 60,089 | ||||||||
|
| |||||||
Telecommunication Services — 1.6% |
| |||||||
AT&T | 61,400 | 2,076 | ||||||
Crown Castle International * | 348,190 | 25,428 | ||||||
Frontier Communications (A) | 209,300 | 873 | ||||||
Verizon Communications | 91,400 | 4,265 | ||||||
|
| |||||||
| 32,642 | ||||||||
|
| |||||||
Utilities — 1.6% | ||||||||
AES | 358,800 | 4,768 | ||||||
Ameren | 32,300 | 1,126 | ||||||
American Electric Power | 159,900 | 6,932 | ||||||
DTE Energy | 24,800 | 1,636 | ||||||
Duke Energy | 9,500 | 634 | ||||||
Edison International | 153,900 | 7,089 | ||||||
Entergy | 96,800 | 6,117 | ||||||
Exelon (A) | 32,000 | 948 | ||||||
NV Energy | 55,300 | 1,306 | ||||||
Public Service Enterprise Group | 127,300 | 4,192 | ||||||
|
| |||||||
| 34,748 | ||||||||
|
| |||||||
Total Common Stock | 2,007,600 | |||||||
|
| |||||||
Number of Warrants | ||||||||
WARRANTS — 0.0% | ||||||||
Kinder Morgan Expires 2017 * | 98,496 | 489 | ||||||
|
| |||||||
Total Warrants | 489 | |||||||
|
| |||||||
AFFILIATED PARTNERSHIP — 3.9% |
| |||||||
SEI Liquidity Fund, L.P. | 81,401,719 | 81,402 | ||||||
|
| |||||||
Total Affiliated Partnership | 81,402 | |||||||
|
| |||||||
CASH EQUIVALENTS — 4.5% | ||||||||
Investors Cash Trust—Treasury Portfolio—DWS US Treasury Money Fund, 0.010% | 3,036,378 | 3,036 | ||||||
SEI Daily Income Trust, Prime Obligation Fund, Cl A | 92,142,522 | 92,143 | ||||||
|
| |||||||
Total Cash Equivalents | 95,179 | |||||||
|
| |||||||
U.S. TREASURY OBLIGATIONS (C) (D) — 0.2% |
| |||||||
U.S. Treasury Bills | ||||||||
0.070%, 02/06/14 | $ | 1,976 | 1,976 | |||||
0.040%, 01/09/14 | 3,041 | 3,041 | ||||||
|
| |||||||
Total U.S. Treasury Obligations | 5,017 | |||||||
|
| |||||||
Total Investments — 103.9% | $ | 2,189,687 | ||||||
|
| |||||||
A list of the open futures contracts held by the Fund at September 30, 2013, are as follows:
Type of Contract | Number of Contracts Long | Expiration Date | Unrealized (Depreciation) ($ Thousands) | |||||||||
S&P 500 Index EMINI | 418 | Dec-2013 | $ | (175 | ) | |||||||
|
| |||||||||||
For the year ended September 30, 2013, the total amount of all open futures contracts, as presented in the table above, are representative of the volume of activity for this derivative type during the year.
Percentages are based on Net Assets of $2,107,192 ($Thousands).
| * | Non-income producing security. |
| ** | Rate shown is the 7-day effective yield as of September 30, 2013. |
| † | Real Estate Investment Trust. |
| †† | Investment in Affiliated Security. |
| (A) | This security or a partial position of this security is on loan at September 30, 2013. The total market value of securities on loan at September 30, 2013 was $79,181 ($ Thousands). |
| (B) | This security was purchased with cash collateral held from securities on loan . The total market value of such securities as of September 30, 2013 was $81,402 ($ Thousands). |
| (C) | Security, or portion thereof, has been pledged as collateral on open futures contracts. |
| (D) | The rate reported is the effective yield at the time of purchase. |
ADR — American Depositary Receipt
Cl — Class
L.P. — Limited Partnership
S&P — Standard & Poor’s
| 4 | SEI Institutional Managed Trust / Annual Report / September 30, 2013 |
Schedule of Investments
Large Cap Fund
September 30, 2013
The following is a list of the level of inputs used as of September 30, 2013, in valuing the Fund’s investments and other financial instruments carried at value ($ Thousands):
| Investments in Securities | Level 1 | Level 2 | Level 3 | Total | ||||||||||||
Common Stock | $ | 2,007,600 | $ | — | $ | — | $ | 2,007,600 | ||||||||
Warrant | 489 | — | — | 489 | ||||||||||||
U.S. Treasury Obligations | — | 5,017 | — | 5,017 | ||||||||||||
Cash Equivalents | 95,179 | — | — | 95,179 | ||||||||||||
Affiliated Partnership | — | 81,402 | — | 81,402 | ||||||||||||
|
|
|
|
|
|
|
| |||||||||
Total Investments in Securities | $ | 2,103,268 | $ | 86,419 | $ | — | $ | 2,189,687 | ||||||||
|
|
|
|
|
|
|
| |||||||||
Other Financial Instruments | Level 1 | Level 2 | Level 3 | Total | ||||||||||||
Futures Contracts * | ||||||||||||||||
Unrealized Appreciation | $ | — | $ | — | $ | — | $ | — | ||||||||
Unrealized Depreciation | (175 | ) | — | — | (175 | ) | ||||||||||
|
|
|
|
|
|
|
| |||||||||
Total Other Financial Instruments | $ | (175 | ) | $ | — | $ | — | $ | (175 | ) | ||||||
|
|
|
|
|
|
|
| |||||||||
| * | Futures contracts are valued at the unrealized depreciation on the instrument. |
For the year ended September 30, 2013, there were no transfers between Level 1 and Level 2 assets and liabilities.
For the year ended September 30, 2013, there were no transfers between Level 2 and Level 3 assets and liabilities.
Amounts designated as “—” are $0 or have been rounded to $0.
| 5 | SEI Institutional Managed Trust / Annual Report / September 30, 2013 |
Schedule of Investments
Large Cap Value Fund
September 30, 2013
Description | Shares | Market Value ($ Thousands) | ||||||
COMMON STOCK — 96.7% | ||||||||
Consumer Discretionary — 7.7% | ||||||||
American Eagle Outfitters | 188,900 | $ | 2,643 | |||||
Ascena Retail Group * | 186,000 | 3,707 | ||||||
Autoliv (A) | 33,900 | 2,963 | ||||||
Autozone * | 7,025 | 2,970 | ||||||
Best Buy | 189,500 | 7,106 | ||||||
Comcast, Cl A | 113,850 | 4,938 | ||||||
CST Brands (A) | 9,911 | 295 | ||||||
Dillard’s, Cl A | 24,100 | 1,887 | ||||||
DIRECTV * | 67,300 | 4,021 | ||||||
Foot Locker, Cl A | 70,100 | 2,379 | ||||||
Ford Motor | 307,600 | 5,189 | ||||||
GameStop, Cl A (A) | 158,600 | 7,875 | ||||||
Gannett | 108,900 | 2,918 | ||||||
Gap | 72,900 | 2,936 | ||||||
General Motors * | 98,100 | 3,529 | ||||||
Goodyear Tire & Rubber | 59,000 | 1,325 | ||||||
Hasbro (A) | 55,800 | 2,630 | ||||||
Kohl’s | 66,600 | 3,447 | ||||||
Lear | 137,600 | 9,848 | ||||||
Macy’s | 177,800 | 7,693 | ||||||
Magna International, Cl A | 55,600 | 4,590 | ||||||
McDonald’s | 23,400 | 2,251 | ||||||
Murphy USA * | 8,450 | 341 | ||||||
Staples | 200,865 | 2,943 | ||||||
Target, Cl A | 31,100 | 1,990 | ||||||
Time Warner Cable, Cl A | 22,000 | 2,455 | ||||||
Viacom, Cl B | 94,500 | 7,898 | ||||||
Whirlpool | 61,700 | 9,035 | ||||||
|
| |||||||
| 111,802 | ||||||||
|
| |||||||
Consumer Staples — 6.3% | ||||||||
Altria Group | 62,600 | 2,150 | ||||||
Archer-Daniels-Midland | 65,300 | 2,405 | ||||||
Avon Products | 106,200 | 2,188 | ||||||
Campbell Soup (A) | 42,120 | 1,715 | ||||||
CVS Caremark | 197,500 | 11,208 | ||||||
Dr Pepper Snapple Group (A) | 58,100 | 2,604 | ||||||
Green Mountain Coffee Roasters * (A) | 18,500 | 1,393 | ||||||
Hershey | 63,100 | 5,837 | ||||||
Hillshire Brands | 32,200 | 990 | ||||||
Ingredion | 41,000 | 2,713 | ||||||
Kroger | 262,800 | 10,601 | ||||||
Lorillard | 37,600 | 1,684 | ||||||
Molson Coors Brewing, Cl B | 131,800 | 6,607 | ||||||
Nu Skin Enterprises, Cl A | 60,400 | 5,782 | ||||||
PepsiCo | 77,710 | 6,178 | ||||||
Procter & Gamble | 26,800 | 2,026 | ||||||
Safeway (A) | 118,000 | 3,775 | ||||||
SUPERVALU * (A) | 111,437 | 917 | ||||||
SYSCO, Cl A (A) | 115,600 | 3,680 | ||||||
Tyson Foods, Cl A | 215,700 | 6,100 | ||||||
Walgreen | 47,800 | 2,572 | ||||||
Wal-Mart Stores | 114,250 | 8,450 | ||||||
|
| |||||||
| 91,575 | ||||||||
|
| |||||||
Energy — 14.2% | ||||||||
Anadarko Petroleum, Cl A | 26,900 | 2,501 | ||||||
Apache | 67,225 | 5,723 | ||||||
Baker Hughes | 71,625 | 3,517 | ||||||
Description | Shares | Market Value ($ Thousands) | ||||||
Cameco | 74,800 | $ | 1,352 | |||||
Chevron | 336,800 | 40,921 | ||||||
ConocoPhillips | 247,500 | 17,204 | ||||||
Consol Energy | 107,700 | 3,624 | ||||||
CVR Energy | 10,200 | 393 | ||||||
Diamond Offshore Drilling (A) | 91,100 | 5,677 | ||||||
EOG Resources | 16,600 | 2,810 | ||||||
EQT | 26,900 | 2,387 | ||||||
Exxon Mobil | 497,295 | 42,787 | ||||||
Halliburton | 196,201 | 9,447 | ||||||
Helmerich & Payne (A) | 34,400 | 2,372 | ||||||
Hess | 72,300 | 5,592 | ||||||
Marathon Oil | 451,380 | 15,744 | ||||||
Marathon Petroleum | 111,110 | 7,147 | ||||||
Murphy Oil | 166,410 | 10,038 | ||||||
Nabors Industries | 98,000 | 1,574 | ||||||
National Oilwell Varco, Cl A | 39,800 | 3,109 | ||||||
Occidental Petroleum | 115,770 | 10,829 | ||||||
Phillips 66 | 55,800 | 3,226 | ||||||
Schlumberger, Cl A | 44,915 | 3,969 | ||||||
Tesoro | 40,700 | 1,790 | ||||||
Valero Energy | 89,200 | 3,046 | ||||||
|
| |||||||
| 206,779 | ||||||||
|
| |||||||
Financials — 25.0% | ||||||||
ACE | 30,300 | 2,835 | ||||||
Aflac | 121,255 | 7,517 | ||||||
Allied World Assurance Holdings | 43,400 | 4,313 | ||||||
Allstate | 301,700 | 15,251 | ||||||
American Express | 64,650 | 4,882 | ||||||
American Financial Group | 70,400 | 3,806 | ||||||
American International Group | 196,600 | 9,561 | ||||||
Ameriprise Financial | 51,800 | 4,718 | ||||||
Assurant | 150,100 | 8,120 | ||||||
AvalonBay Communities † | 21,100 | 2,682 | ||||||
Axis Capital Holdings | 63,200 | 2,737 | ||||||
Bank of America | 967,400 | 13,350 | ||||||
Bank of New York Mellon | 52,600 | 1,588 | ||||||
Capital One Financial | 33,000 | 2,268 | ||||||
CBL & Associates Properties † | 83,500 | 1,595 | ||||||
CBOE Holdings | 97,400 | 4,406 | ||||||
CBRE Group, Cl A * | 170,695 | 3,948 | ||||||
Chubb | 99,300 | 8,863 | ||||||
Citigroup | 409,960 | 19,887 | ||||||
Discover Financial Services | 203,400 | 10,280 | ||||||
Endurance Specialty Holdings | 39,000 | 2,095 | ||||||
Everest Re Group | 114,515 | 16,652 | ||||||
Fifth Third Bancorp | 662,200 | 11,946 | ||||||
Goldman Sachs Group | 85,000 | 13,448 | ||||||
Hartford Financial Services Group | 219,600 | 6,834 | ||||||
Hospitality Properties Trust † | 58,400 | 1,653 | ||||||
Huntington Bancshares | 1,025,300 | 8,469 | ||||||
Invesco | 100,500 | 3,206 | ||||||
JPMorgan Chase | 744,500 | 38,483 | ||||||
KeyCorp | 751,100 | 8,562 | ||||||
Lazard, Cl A | 95,849 | 3,452 | ||||||
Lincoln National | 130,900 | 5,496 | ||||||
McGraw-Hill | 42,525 | 2,789 | ||||||
MetLife | 238,600 | 11,202 | ||||||
MSCI, Cl A * | 68,460 | 2,756 | ||||||
| 1 | SEI Institutional Managed Trust / Annual Report / September 30, 2013 |
Schedule of Investments
Large Cap Value Fund
September 30, 2013
| Market Value | ||||||||
Description | Shares | ($ Thousands) | ||||||
PartnerRe | 19,900 | $ | 1,822 | |||||
PNC Financial Services Group | 141,100 | 10,223 | ||||||
Protective Life (A) | 71,200 | 3,029 | ||||||
Prudential Financial | 54,100 | 4,219 | ||||||
Regions Financial | 939,700 | 8,702 | ||||||
RenaissanceRe Holdings | 23,900 | 2,164 | ||||||
SLM | 263,800 | 6,569 | ||||||
State Street | 46,200 | 3,038 | ||||||
Tanger Factory Outlet Centers † | 72,600 | 2,370 | ||||||
Travelers | 120,100 | 10,181 | ||||||
Unum Group | 155,100 | 4,721 | ||||||
US Bancorp | 48,000 | 1,756 | ||||||
Wells Fargo | 724,100 | 29,920 | ||||||
Weyerhaeuser † | 99,160 | 2,839 | ||||||
Willis Group Holdings | 69,300 | 3,003 | ||||||
|
| |||||||
| 364,206 | ||||||||
|
| |||||||
Health Care — 13.4% | ||||||||
Abbott Laboratories | 28,700 | 952 | ||||||
AbbVie | 28,700 | 1,284 | ||||||
Aetna, Cl A | 161,800 | 10,359 | ||||||
Agilent Technologies | 49,305 | 2,527 | ||||||
Allergan | 28,150 | 2,546 | ||||||
AmerisourceBergen | 103,600 | 6,330 | ||||||
Amgen, Cl A | 109,040 | 12,206 | ||||||
Baxter International | 66,500 | 4,368 | ||||||
Biogen Idec * | 27,100 | 6,524 | ||||||
Cardinal Health | 69,900 | 3,645 | ||||||
CareFusion * | 59,800 | 2,206 | ||||||
Celgene, Cl A * | 35,300 | 5,434 | ||||||
Cigna | 124,400 | 9,561 | ||||||
Covidien | 56,000 | 3,413 | ||||||
Endo Pharmaceuticals Holdings * | 33,500 | 1,522 | ||||||
Express Scripts Holding * | 37,300 | 2,305 | ||||||
Forest Laboratories, Cl A * | 85,330 | 3,651 | ||||||
Hologic * | 80,235 | 1,657 | ||||||
Humana | 95,900 | 8,950 | ||||||
Johnson & Johnson | 152,795 | 13,246 | ||||||
McKesson | 84,700 | 10,867 | ||||||
Merck | 171,600 | 8,170 | ||||||
Omnicare (A) | 112,600 | 6,249 | ||||||
Pfizer | 927,300 | 26,623 | ||||||
Questcor Pharmaceuticals (A) | 12,100 | 702 | ||||||
St. Jude Medical | 117,185 | 6,286 | ||||||
Teleflex | 33,690 | 2,772 | ||||||
United Therapeutics * | 92,400 | 7,286 | ||||||
UnitedHealth Group | 26,700 | 1,912 | ||||||
Warner Chilcott, Cl A | 145,600 | 3,327 | ||||||
WellPoint | 142,000 | 11,873 | ||||||
Zimmer Holdings | 67,700 | 5,561 | ||||||
|
| |||||||
| 194,314 | ||||||||
|
| |||||||
Industrials — 10.7% | ||||||||
Aecom Technology * | 55,300 | 1,729 | ||||||
AGCO | 64,500 | 3,897 | ||||||
Alliant Techsystems | 62,500 | 6,098 | ||||||
Boeing | 21,800 | 2,562 | ||||||
Caterpillar, Cl A | 78,600 | 6,553 | ||||||
Deere | 38,700 | 3,150 | ||||||
Delta Air Lines, Cl A (A) | 340,600 | 8,035 | ||||||
Diana Shipping * (A) | 198,936 | 2,401 | ||||||
Eaton | 47,700 | 3,284 | ||||||
| Market Value | ||||||||
Description | Shares | ($ Thousands) | ||||||
Emerson Electric | 52,450 | $ | 3,394 | |||||
Engility Holdings * | 9,516 | 302 | ||||||
Exelis | 435,500 | 6,842 | ||||||
Fluor | 15,800 | 1,121 | ||||||
General Dynamics | 24,800 | 2,170 | ||||||
General Electric | 514,075 | 12,281 | ||||||
GrafTech International * (A) | 330,810 | 2,795 | ||||||
Honeywell International | 33,300 | 2,765 | ||||||
Huntington Ingalls Industries, Cl A | 39,900 | 2,689 | ||||||
Illinois Tool Works | 38,050 | 2,902 | ||||||
Ingersoll-Rand | 42,190 | 2,740 | ||||||
ITT | 107,165 | 3,853 | ||||||
Joy Global (A) | 58,800 | 3,001 | ||||||
KBR | 30,400 | 992 | ||||||
L-3 Communications Holdings | 116,800 | 11,038 | ||||||
Lockheed Martin | 42,500 | 5,421 | ||||||
Norfolk Southern | 23,800 | 1,841 | ||||||
Northrop Grumman | 157,030 | 14,959 | ||||||
Oshkosh Truck * | 141,600 | 6,935 | ||||||
Raytheon | 190,300 | 14,666 | ||||||
Rockwell Collins | 48,180 | 3,269 | ||||||
RR Donnelley & Sons (A) | 144,100 | 2,277 | ||||||
SPX | 30,200 | 2,556 | ||||||
Union Pacific | 32,000 | 4,971 | ||||||
United Rentals * | 43,300 | 2,524 | ||||||
|
| |||||||
| 156,013 | ||||||||
|
| |||||||
Information Technology — 10.6% | ||||||||
Amdocs | 211,200 | 7,738 | ||||||
Apple | 16,300 | 7,771 | ||||||
Automatic Data Processing | 46,030 | 3,332 | ||||||
Avnet | 75,300 | 3,141 | ||||||
CA | 235,300 | 6,981 | ||||||
Check Point Software Technologies * (A) | 96,070 | 5,434 | ||||||
Cisco Systems | 800,000 | 18,736 | ||||||
Corning, Cl B | 175,400 | 2,559 | ||||||
EMC | 214,085 | 5,472 | ||||||
Flextronics International * | 163,900 | 1,490 | ||||||
Harris | 35,200 | 2,088 | ||||||
Hewlett-Packard | 222,600 | 4,670 | ||||||
Ingram Micro, Cl A * | 333,500 | 7,687 | ||||||
Intel | 161,300 | 3,697 | ||||||
International Business Machines | 12,400 | 2,296 | ||||||
LSI Logic | 653,290 | 5,109 | ||||||
Marvell Technology Group | 507,800 | 5,840 | ||||||
Microsoft | 315,560 | 10,511 | ||||||
Oracle, Cl B | 328,600 | 10,900 | ||||||
Riverbed Technology * (A) | 179,800 | 2,623 | ||||||
SanDisk | 87,000 | 5,178 | ||||||
Seagate Technology | 122,200 | 5,345 | ||||||
Symantec, Cl A | 93,000 | 2,302 | ||||||
TE Connectivity | 46,300 | 2,397 | ||||||
Tech Data * | 33,500 | 1,672 | ||||||
Teradyne * (A) | 141,200 | 2,332 | ||||||
Vishay Intertechnology * (A) | 103,400 | 1,333 | ||||||
Western Digital | 157,400 | 9,979 | ||||||
Xerox | 477,745 | 4,916 | ||||||
|
| |||||||
| 153,529 | ||||||||
|
| |||||||
| 2 | SEI Institutional Managed Trust / Annual Report / September 30, 2013 |
Schedule of Investments
Large Cap Value Fund
September 30 , 2013
Shares/Face Amount | Market Value | |||||||
Description | ($ Thousands) | ($ Thousands) | ||||||
Materials — 4.4% | ||||||||
Agrium | 16,200 | $ | 1,361 | |||||
CF Industries Holdings | 24,100 | 5,081 | ||||||
Crown Holdings * | 132,800 | 5,615 | ||||||
Domtar (A) | 15,100 | 1,199 | ||||||
E.I. Du Pont de Nemours | 96,800 | 5,669 | ||||||
Eastman Chemical | 92,200 | 7,183 | ||||||
Freeport-McMoRan Copper & Gold, Cl B | 143,700 | 4,754 | ||||||
Goldcorp | 96,550 | 2,511 | ||||||
Huntsman | 135,000 | 2,782 | ||||||
LyondellBasell Industries, Cl A | 81,200 | 5,946 | ||||||
Mosaic | 71,700 | 3,085 | ||||||
Owens-Illinois * | 222,990 | 6,694 | ||||||
Packaging Corp of America | 74,300 | 4,242 | ||||||
Rock Tenn, Cl A | 26,600 | 2,694 | ||||||
Sealed Air | 84,286 | 2,291 | ||||||
WR Grace * | 37,940 | 3,316 | ||||||
|
| |||||||
| 64,423 | ||||||||
|
| |||||||
Telecommunication Services — 1.2% |
| |||||||
AT&T | 347,300 | 11,746 | ||||||
Verizon Communications | 124,700 | 5,818 | ||||||
|
| |||||||
| 17,564 | ||||||||
|
| |||||||
Utilities — 3.2% | ||||||||
AES | 504,100 | 6,699 | ||||||
Ameren | 52,200 | 1,819 | ||||||
American Electric Power | 289,900 | 12,567 | ||||||
Duke Energy | 33,000 | 2,204 | ||||||
Edison International | 134,600 | 6,200 | ||||||
Entergy | 91,900 | 5,807 | ||||||
NV Energy | 133,800 | 3,159 | ||||||
Public Service Enterprise Group | 141,100 | 4,646 | ||||||
Westar Energy, Cl A | 101,300 | 3,105 | ||||||
|
| |||||||
| 46,206 | ||||||||
|
| |||||||
Total Common Stock | 1,406,411 | |||||||
|
| |||||||
AFFILIATED PARTNERSHIP — 3.2% |
| |||||||
SEI Liquidity Fund, L.P. | 46,842,265 | 46,842 | ||||||
|
| |||||||
Total Affiliated Partnership | 46,842 | |||||||
|
| |||||||
CASH EQUIVALENT — 3.2% |
| |||||||
SEI Daily Income Trust, Prime Obligation Fund, Cl A | 46,601,208 | 46,601 | ||||||
|
| |||||||
Total Cash Equivalent | 46,601 | |||||||
|
| |||||||
U.S. TREASURY OBLIGATIONS (C) (D) — 0.2% |
| |||||||
U.S. Treasury Bills | ||||||||
0.073%, 02/06/14 | $ | 2,380 | 2,380 | |||||
0.040%, 01/09/14 | 234 | 234 | ||||||
|
| |||||||
Total U.S. Treasury Obligations |
| 2,614 | ||||||
|
| |||||||
Total Investments — 103.3% | $ | 1,502,468 | ||||||
|
| |||||||
A list of the open futures contracts held by the Fund at September 30, 2013, are as follows:
| Unrealized | ||||||||||||
| Number of | Appreciation | |||||||||||
| Type of | Contracts | Expiration | (Depreciation) | |||||||||
Contract | Long | Date | ($ Thousands) | |||||||||
Russell 2000 Index E-MINI | 10 | Dec-2013 | $ | 19 | ||||||||
S&P 500 Index EMINI | 116 | Dec-2013 | (44 | ) | ||||||||
|
| |||||||||||
| $ | (25 | ) | ||||||||||
|
| |||||||||||
For the year ended September 30, 2013, the total amount of all open futures contracts, as presented in the table above, are representative of the volume of activity for this derivative type during the year.
Percentages are based on Net Assets of $1,454,341 ($Thousands).
| * | Non-income producing security. |
| ** | Rate shown is the 7-day effective yield as of September 30, 2013. |
| † | Real Estate Investment Trust. |
| †† | Investment in Affiliated Security. |
| (A) | This security or a partial position of this security is on loan at September 30, 2013. The total market value of securities on loan at September 30, 2013 was $45,465 ($ Thousands). |
| (B) | This security was purchased with cash collateral received from securities lending. The total market value of such securities as of September 30, 2013 was $ 46,842 ($ Thousands). |
| (C) | The rate reported is the effective yield at the time of purchase. |
| (D) | Security, or portion thereof, has been pledged as collateral on open futures contracts. |
ADR — American Depositary Receipt
Cl — Class
L.P. — Limited Partnership
The following is a list of the level of inputs used as of September 30, 2013, in valuing the Fund’s investments carried at value ($ Thousands):
| Investments in Securities | Level 1 | Level 2 | Level 3 | Total | ||||||||||||
Common Stock | $ | 1,406,411 | $ | — | $ | — | $ | 1,406,411 | ||||||||
U.S. Treasury Obligations | — | 2,614 | — | 2,614 | ||||||||||||
Affiliated Partnership | — | 46,842 | — | 46,842 | ||||||||||||
Cash Equivalent | 46,601 | — | — | 46,601 | ||||||||||||
|
|
|
|
|
|
|
| |||||||||
Total Investments in Securities | $ | 1,453,012 | $ | 49,456 | $ | — | $ | 1,502,468 | ||||||||
|
|
|
|
|
|
|
| |||||||||
Other Financial Instruments | Level 1 | Level 2 | Level 3 | Total | ||||||||||||
Futures Contracts * | ||||||||||||||||
Unrealized Appreciation | $ | 19 | $ | — | $ | — | $ | 19 | ||||||||
Unrealized Depreciation | (44 | ) | — | — | (44 | ) | ||||||||||
|
|
|
|
|
|
|
| |||||||||
Total Other Financial Instruments | $ | (25 | ) | $ | — | $ | — | $ | (25 | ) | ||||||
|
|
|
|
|
|
|
| |||||||||
For the year ended September 30, 2013, there were no transfers between Level 1 and Level 2 assets and liabilities.
For the year ended September 30, 2013, there were no transfers between Level 2 and Level 3 assets and liabilities.
Amounts designated as “—” are $0 or have been rounded to $0.
| 3 | SEI Institutional Managed Trust / Annual Report / September 30, 2013 |
Schedule of Investments
Large Cap Growth Fund
September 30, 2013
Description | Shares | Market Value ($ Thousands) | ||||||
COMMON STOCK — 97.0% ‡ | ||||||||
Consumer Discretionary — 16.3% | ||||||||
AMC Networks, Cl A * | 31,300 | $ | 2,143 | |||||
Best Buy (A) | 21,400 | 802 | ||||||
Brinker International | 10,900 | 442 | ||||||
Burger King Worldwide | 42,000 | 820 | ||||||
Carter’s (A) | 25,500 | 1,935 | ||||||
CBS, Cl B | 4,200 | 232 | ||||||
Charter Communications, Cl A * | 900 | 121 | ||||||
Chipotle Mexican Grill, Cl A * | 500 | 214 | ||||||
Comcast, Cl A | 185,900 | 8,393 | ||||||
Delphi Automotive | 82,000 | 4,791 | ||||||
Discovery Communications, Cl A * (A) | 117,100 | 9,886 | ||||||
DISH Network, Cl A | 25,500 | 1,148 | ||||||
Domino’s Pizza | 20,200 | 1,373 | ||||||
Dunkin’ Brands Group (A) | 48,100 | 2,177 | ||||||
Ford Motor | 13,000 | 219 | ||||||
Fossil Group * | 87,179 | 10,134 | ||||||
Gentex | 14,900 | 381 | ||||||
GNC Holdings, Cl A | 10,600 | 579 | ||||||
Groupon, Cl A * (A) | 102,100 | 1,145 | ||||||
H&R Block | 125,800 | 3,354 | ||||||
Hanesbrands | 35,600 | 2,218 | ||||||
Hasbro (A) | 10,300 | 485 | ||||||
Home Depot | 200,600 | 15,216 | ||||||
International Game Technology | 32,300 | 612 | ||||||
Interpublic Group | 44,900 | 771 | ||||||
Jarden * | 24,600 | 1,191 | ||||||
L Brands | 272,650 | 16,659 | ||||||
Lamar Advertising, Cl A * | 3,000 | 141 | ||||||
Lear | 3,300 | 236 | ||||||
Liberty Global, Cl A * | 147,709 | 11,721 | ||||||
Liberty Media—Interactive, Cl A * | 858,310 | 20,144 | ||||||
Liberty Ventures, Ser A * | 16,100 | 1,420 | ||||||
Lions Gate Entertainment * (A) | 34,600 | 1,213 | ||||||
LKQ * | 6,200 | 198 | ||||||
Lowe’s | 36,800 | 1,752 | ||||||
Macy’s | 5,600 | 242 | ||||||
Madison Square Garden, Cl A * | 30,900 | 1,794 | ||||||
Mattel | 8,900 | 373 | ||||||
McDonald’s | 8,200 | 789 | ||||||
NetFlix * (A) | 16,000 | 4,947 | ||||||
Newell Rubbermaid, Cl B | 41,200 | 1,133 | ||||||
News * | 158,325 | 2,543 | ||||||
Nike, Cl B | 160,925 | 11,690 | ||||||
NVR * | 700 | 643 | ||||||
Omnicom Group (A) | 20,500 | 1,300 | ||||||
priceline.com * | 20,750 | 20,977 | ||||||
Sally Beauty Holdings * | 270,350 | 7,072 | ||||||
Six Flags Entertainment | 29,900 | 1,010 | ||||||
Starbucks | 232,939 | 17,929 | ||||||
Starz—Liberty Capital * | 52,300 | 1,471 | ||||||
Target, Cl A | 1,900 | 122 | ||||||
Tempur-Pedic International * | 10,800 | 475 | ||||||
Tesla Motors * (A) | 11,300 | 2,186 | ||||||
Description | Shares | Market Value ($ Thousands) | ||||||
Time Warner Cable, Cl A | 107,100 | $ | 11,952 | |||||
TripAdvisor * (A) | 45,200 | 3,428 | ||||||
Tupperware Brands | 31,600 | 2,729 | ||||||
Twenty-First Century Fox | 215,300 | 7,213 | ||||||
VF | 1,800 | 358 | ||||||
Viacom, Cl B | 8,800 | 735 | ||||||
Visteon * | 1,900 | 144 | ||||||
Walt Disney | 108,600 | 7,004 | ||||||
|
| |||||||
| 234,525 | ||||||||
|
| |||||||
Consumer Staples — 8.8% | ||||||||
Altria Group | 2,697 | 93 | ||||||
Archer-Daniels-Midland | 5,700 | 210 | ||||||
Brown-Forman, Cl B | 4,800 | 327 | ||||||
Campbell Soup (A) | 57,900 | 2,357 | ||||||
Church & Dwight | 36,000 | 2,162 | ||||||
Clorox (A) | 17,200 | 1,405 | ||||||
Coca-Cola Enterprises | 6,800 | 274 | ||||||
ConAgra Foods | 39,100 | 1,186 | ||||||
Constellation Brands, Cl A * | 5,400 | 310 | ||||||
Costco Wholesale | 101,321 | 11,664 | ||||||
CVS Caremark | 20,500 | 1,163 | ||||||
Estee Lauder, Cl A | 188,208 | 13,156 | ||||||
Flowers Foods | 73,600 | 1,578 | ||||||
General Mills, Cl A | 47,900 | 2,295 | ||||||
Green Mountain Coffee Roasters * (A) | 75,300 | 5,672 | ||||||
Hershey | 34,900 | 3,228 | ||||||
Hillshire Brands | 50,500 | 1,553 | ||||||
Hormel Foods | 64,100 | 2,700 | ||||||
JM Smucker | 4,200 | 441 | ||||||
Kellogg | 100,900 | 5,926 | ||||||
Kimberly-Clark | 57,600 | 5,427 | ||||||
Kraft Foods | 600 | 32 | ||||||
Kroger | 86,300 | 3,481 | ||||||
McCormick (A) | 76,000 | 4,917 | ||||||
Mead Johnson Nutrition, Cl A | 187,979 | 13,959 | ||||||
PepsiCo | 11,300 | 898 | ||||||
Philip Morris International | 16,397 | 1,420 | ||||||
Reynolds American | 2,800 | 136 | ||||||
Safeway (A) | 7,800 | 250 | ||||||
Walgreen | 456,700 | 24,571 | ||||||
Whole Foods Market | 241,524 | 14,129 | ||||||
|
| |||||||
| 126,920 | ||||||||
|
| |||||||
Energy — 7.6% | ||||||||
Cabot Oil & Gas | 206,300 | 7,699 | ||||||
Cheniere Energy * | 103,900 | 3,547 | ||||||
Core Laboratories (A) | 79,362 | 13,429 | ||||||
EOG Resources | 184,000 | 31,148 | ||||||
EQT | 12,300 | 1,091 | ||||||
FMC Technologies * | 249,060 | 13,803 | ||||||
Gulfport Energy * | 1,900 | 122 | ||||||
Kinder Morgan | 564,469 | 20,078 | ||||||
Noble Energy | 8,100 | 543 | ||||||
Pioneer Natural Resources | 3,300 | 623 | ||||||
Schlumberger, Cl A | 192,511 | 17,010 | ||||||
|
| |||||||
| 109,093 | ||||||||
|
| |||||||
Financials — 6.6% | ||||||||
Affiliated Managers Group * | 1,200 | 219 | ||||||
| 1 | SEI Institutional Managed Trust / Annual Report / September 30, 2013 |
Schedule of Investments
Large Cap Growth Fund
September 30, 2013
Description | Shares | Market Value ($ Thousands) | ||||||
Allied World Assurance Holdings | 5,300 | $ | 527 | |||||
American Express | 34,300 | 2,590 | ||||||
American Financial Group | 4,200 | 227 | ||||||
Ameriprise Financial | 4,300 | 392 | ||||||
Apartment Investment & Management, Cl A † | 27,000 | 754 | ||||||
Arch Capital Group * (A) | 4,400 | 238 | ||||||
Arthur J. Gallagher | 10,600 | 463 | ||||||
Axis Capital Holdings | 16,400 | 710 | ||||||
BlackRock | 27,500 | 7,442 | ||||||
CBOE Holdings | 38,900 | 1,760 | ||||||
CBRE Group, Cl A * | 8,700 | 201 | ||||||
Charles Schwab | 771,715 | 16,314 | ||||||
CME Group | 150,350 | 11,108 | ||||||
Corrections Corp of America † | 3,300 | 114 | ||||||
Eaton Vance | 42,100 | 1,635 | ||||||
Endurance Specialty Holdings | 5,200 | 279 | ||||||
Equity Lifestyle Properties † | 30,200 | 1,032 | ||||||
Erie Indemnity, Cl A | 1,400 | 102 | ||||||
Extra Space Storage † | 4,900 | 224 | ||||||
Franklin Resources | 4,800 | 243 | ||||||
Hanover Insurance Group, Cl A | 4,400 | 243 | ||||||
IntercontinentalExchange * (A) | 88,625 | 16,078 | ||||||
Lazard, Cl A | 8,600 | 310 | ||||||
Leucadia National | 20,100 | 548 | ||||||
LPL Financial Holdings | 9,800 | 375 | ||||||
McGraw-Hill | 21,800 | 1,430 | ||||||
Moody’s | 82,700 | 5,816 | ||||||
Omega Healthcare Investors † (A) | 57,500 | 1,718 | ||||||
Plum Creek Timber † (A) | 12,800 | 599 | ||||||
Progressive | 565,261 | 15,392 | ||||||
Prudential Financial | 3,100 | 242 | ||||||
Rayonier † | 47,400 | 2,638 | ||||||
Senior Housing Properties Trust † | 4,000 | 93 | ||||||
Spirit Realty Capital † | 12,200 | 112 | ||||||
Travelers | 17,600 | 1,492 | ||||||
Validus Holdings | 3,200 | 118 | ||||||
Ventas † | 2,600 | 160 | ||||||
Waddell & Reed Financial, Cl A | 36,700 | 1,889 | ||||||
Weyerhaeuser † | 2,400 | 69 | ||||||
|
| |||||||
| 95,896 | ||||||||
|
| |||||||
Health Care — 15.0% | ||||||||
AbbVie | 69,500 | 3,109 | ||||||
Actavis * | 31,500 | 4,536 | ||||||
Aetna, Cl A | 55,700 | 3,566 | ||||||
Allergan | 204,350 | 18,483 | ||||||
AmerisourceBergen | 90,900 | 5,554 | ||||||
Amgen, Cl A | 114,800 | 12,851 | ||||||
Baxter International | 59,800 | 3,928 | ||||||
Becton Dickinson (A) | 23,700 | 2,370 | ||||||
Biogen Idec * | 7,600 | 1,830 | ||||||
Bristol-Myers Squibb | 72,100 | 3,337 | ||||||
Celgene, Cl A * | 196,350 | 30,224 | ||||||
Cigna | 8,500 | 653 | ||||||
Community Health Systems | 2,100 | 87 | ||||||
Description | Shares | Market Value ($ Thousands) | ||||||
Cooper, Cl A | 3,700 | $ | 480 | |||||
Covance * | 154,634 | 13,370 | ||||||
DaVita HealthCare Partners * | 267,060 | 15,196 | ||||||
Eli Lilly | 32,800 | 1,651 | ||||||
Endo Pharmaceuticals Holdings * | 4,900 | 223 | ||||||
Express Scripts Holding * | 279,582 | 17,273 | ||||||
Gilead Sciences * | 82,100 | 5,159 | ||||||
HCA Holdings | 6,700 | 286 | ||||||
Health Management Associates, Cl A * | 157,200 | 2,012 | ||||||
Idexx Laboratories * (A) | 100,062 | 9,971 | ||||||
Illumina * (A) | 28,100 | 2,271 | ||||||
Intuitive Surgical * | 39,607 | 14,903 | ||||||
Jazz Pharmaceuticals * | 800 | 74 | ||||||
Johnson & Johnson | 24,900 | 2,159 | ||||||
Laboratory Corp of America Holdings * (A) | 9,900 | 982 | ||||||
Life Technologies * | 57,100 | 4,273 | ||||||
Mettler Toledo International * (A) | 5,000 | 1,200 | ||||||
Mylan * (A) | 99,900 | 3,813 | ||||||
Novo Nordisk ADR | 71,307 | 12,066 | ||||||
Perrigo (A) | 72,975 | 9,004 | ||||||
Regeneron Pharmaceuticals * | 400 | 125 | ||||||
ResMed (A) | 29,800 | 1,574 | ||||||
Salix Pharmaceuticals * | 17,800 | 1,190 | ||||||
Sirona Dental Systems, Cl A * | 10,100 | 676 | ||||||
St. Jude Medical | 5,400 | 290 | ||||||
Stryker | 4,200 | 284 | ||||||
Tenet Healthcare * | 44,500 | 1,833 | ||||||
United Therapeutics * | 13,100 | 1,033 | ||||||
Universal Health Services, Cl B | 21,300 | 1,597 | ||||||
Warner Chilcott, Cl A | 20,200 | 461 | ||||||
Zimmer Holdings | 400 | 33 | ||||||
Zoetis, Cl A | 4,500 | 140 | ||||||
|
| |||||||
| 216,130 | ||||||||
| �� |
|
| ||||||
Industrials — 7.3% | ||||||||
3M | 8,300 | 991 | ||||||
Aecom Technology * | 3,400 | 106 | ||||||
Alaska Air Group | 19,300 | 1,209 | ||||||
Avis Budget Group * | 47,000 | 1,355 | ||||||
BE Aerospace * | 49,700 | 3,669 | ||||||
Boeing | 8,000 | 940 | ||||||
Chicago Bridge & Iron | 50,600 | 3,429 | ||||||
Colfax * | 24,800 | 1,401 | ||||||
Copa Holdings, Cl A | 18,000 | 2,496 | ||||||
Crane, Cl A | 16,300 | 1,005 | ||||||
Danaher, Cl A | 221,588 | 15,361 | ||||||
Deere | 3,000 | 244 | ||||||
Delta Air Lines, Cl A (A) | 204,200 | 4,817 | ||||||
Dover | 9,500 | 853 | ||||||
Dun & Bradstreet (A) | 6,800 | 706 | ||||||
Emerson Electric | 1,000 | 64 | ||||||
Equifax (A) | 5,000 | 299 | ||||||
Flowserve | 39,300 | 2,452 | ||||||
Fluor | 253,843 | 18,013 | ||||||
Hertz Global Holdings * | 117,000 | 2,593 | ||||||
Hexcel, Cl A * | 4,300 | 167 | ||||||
| 2 | SEI Institutional Managed Trust / Annual Report / September 30, 2013 |
Schedule of Investments
Large Cap Growth Fund
September 30, 2013
Description | Shares | Market Value ($ Thousands) | ||||||
Huntington Ingalls Industries, Cl A | 5,700 | $ | 384 | |||||
IDEX | 1,600 | 104 | ||||||
Ingersoll-Rand | 30,500 | 1,981 | ||||||
ITT | 22,900 | 823 | ||||||
Kansas City Southern | 25,700 | 2,810 | ||||||
Kirby * | 16,200 | 1,402 | ||||||
Lennox International | 6,300 | 474 | ||||||
Lincoln Electric Holdings | 3,100 | 207 | ||||||
Lockheed Martin | 2,800 | 357 | ||||||
Masco | 3,300 | 70 | ||||||
Nielsen Holdings | 12,800 | 467 | ||||||
Norfolk Southern | 2,500 | 193 | ||||||
Robert Half International | 10,800 | 422 | ||||||
Rockwell Automation | 6,300 | 674 | ||||||
Rockwell Collins (A) | 11,200 | 760 | ||||||
Roper Industries | 100,444 | 13,346 | ||||||
RR Donnelley & Sons (A) | 21,900 | 346 | ||||||
Southwest Airlines, Cl A | 44,300 | 645 | ||||||
Stericycle, Cl A * | 124,851 | 14,408 | ||||||
TransDigm Group * | 6,800 | 943 | ||||||
Triumph Group | 2,600 | 183 | ||||||
Union Pacific | 700 | 109 | ||||||
United Continental Holdings * | 15,400 | 473 | ||||||
United Parcel Service, Cl B | 1,100 | 101 | ||||||
United Rentals * (A) | 2,400 | 140 | ||||||
United Technologies | 800 | 86 | ||||||
Wabtec | 10,000 | 629 | ||||||
Waste Connections | 3,800 | 173 | ||||||
Waste Management | 16,100 | 664 | ||||||
WW Grainger | 900 | 235 | ||||||
|
| |||||||
| 105,779 | ||||||||
|
| |||||||
Information Technology — 29.9% | ||||||||
Accenture, Cl A | 153,687 | 11,318 | ||||||
Adobe Systems * | 477,050 | 24,778 | ||||||
Advanced Micro Devices * | 50,300 | 191 | ||||||
Alliance Data Systems * (A) | 1,300 | 275 | ||||||
Amphenol, Cl A | 146,120 | 11,307 | ||||||
Ansys * | 100,420 | 8,688 | ||||||
Apple | 81,878 | 39,035 | ||||||
Applied Materials | 187,700 | 3,292 | ||||||
Autodesk, Cl A * | 1,500 | 62 | ||||||
Automatic Data Processing | 7,100 | 514 | ||||||
Citrix Systems * | 134,587 | 9,503 | ||||||
Cognizant Technology Solutions, Cl A * | 92,806 | 7,621 | ||||||
Cree * | 40,300 | 2,426 | ||||||
DST Systems | 1,700 | 128 | ||||||
eBay * | 272,600 | 15,208 | ||||||
Electronic Arts * | 93,200 | 2,381 | ||||||
Fidelity National Information Services, Cl B | 11,300 | 525 | ||||||
FleetCor Technologies * | 30,800 | 3,393 | ||||||
Gartner * | 3,200 | 192 | ||||||
Genpact * | 496,549 | 9,375 | ||||||
Google, Cl A * | 52,030 | 45,574 | ||||||
Intel | 5,800 | 133 | ||||||
International Business Machines | 2,274 | 421 | ||||||
Intuit | 220,500 | 14,621 | ||||||
Description | Shares | Market Value ($ Thousands) | ||||||
Jack Henry & Associates | 4,600 | $ | 237 | |||||
LinkedIn, Cl A * | 10,900 | 2,682 | ||||||
Mastercard, Cl A | 40,450 | 27,214 | ||||||
Microsoft | 596,533 | 19,871 | ||||||
Motorola Solutions | 11,400 | 677 | ||||||
National Instruments | 262,936 | 8,133 | ||||||
NetApp (A) | 264,124 | 11,257 | ||||||
ON Semiconductor * | 79,300 | 579 | ||||||
Oracle, Cl B | 5,300 | 176 | ||||||
Pandora Media * (A) | 27,400 | 689 | ||||||
Qualcomm | 595,908 | 40,140 | ||||||
Salesforce.com * (A) | 231,492 | 12,017 | ||||||
SanDisk | 25,100 | 1,494 | ||||||
Solera Holdings | 18,700 | 989 | ||||||
Splunk * | 20,200 | 1,213 | ||||||
Symantec, Cl A | 33,500 | 829 | ||||||
Teradata * | 209,000 | 11,587 | ||||||
Vantiv, Cl A * | 34,300 | 958 | ||||||
VeriFone Holdings * | 165,675 | 3,787 | ||||||
VeriSign * (A) | 212,750 | 10,827 | ||||||
Visa, Cl A (A) | 337,269 | 64,452 | ||||||
Workday, Cl A * | 1,300 | 105 | ||||||
|
| |||||||
| 430,874 | ||||||||
|
| |||||||
Materials — 2.9% | ||||||||
Airgas | 1,000 | 106 | ||||||
Avery Dennison | 2,400 | 104 | ||||||
Bemis | 25,900 | 1,010 | ||||||
E.I. Du Pont de Nemours | 11,800 | 691 | ||||||
Eagle Materials | 2,100 | 152 | ||||||
Eastman Chemical | 4,900 | 382 | ||||||
Ecolab | 138,050 | 13,634 | ||||||
International Flavors & Fragrances | 14,700 | 1,210 | ||||||
International Paper | 3,400 | 152 | ||||||
LyondellBasell Industries, Cl A | 2,000 | 146 | ||||||
Monsanto | 11,700 | 1,221 | ||||||
Owens-Illinois * | 35,300 | 1,060 | ||||||
Packaging Corp of America | 45,900 | 2,620 | ||||||
PPG Industries | 7,900 | 1,320 | ||||||
Rock Tenn, Cl A | 3,000 | 304 | ||||||
Rockwood Holdings | 1,100 | 74 | ||||||
Sealed Air | 13,000 | 354 | ||||||
Sherwin-Williams, Cl A | 30,800 | 5,611 | ||||||
Silgan Holdings | 3,300 | 155 | ||||||
Syngenta ADR | 128,471 | 10,445 | ||||||
WR Grace * | 5,700 | 498 | ||||||
|
| |||||||
| 41,249 | ||||||||
|
| |||||||
Telecommunication Services — 2.3% | ||||||||
Crown Castle International * | 404,375 | 29,531 | ||||||
SBA Communications, Cl A * (A) | 47,500 | 3,822 | ||||||
Sprint * | 15,600 | 97 | ||||||
Verizon Communications | 11,200 | 523 | ||||||
|
| |||||||
| 33,973 | ||||||||
|
| |||||||
Utilities — 0.3% | ||||||||
Aqua America | 76,400 | 1,890 | ||||||
Calpine * | 10,200 | 198 | ||||||
ITC Holdings | 18,700 | 1,755 | ||||||
| 3 | SEI Institutional Managed Trust / Annual Report / September 30, 2013 |
Schedule of Investments
Large Cap Growth Fund
September 30, 2013
Description | Shares/ Face Amount ($ Thousands) | Market Value ($ Thousands) | ||||||
Questar | 15,200 | $ | 342 | |||||
|
| |||||||
| 4,185 | ||||||||
|
| |||||||
Total Common Stock | 1,398,624 | |||||||
|
| |||||||
WARRANTS — 0.0% | ||||||||
Kinder Morgan Expires 2017 * | 171,592 | 852 | ||||||
|
| |||||||
Total Warrants | 852 | |||||||
|
| |||||||
AFFILIATED PARTNERSHIP — 9.0% |
| |||||||
SEI Liquidity Fund, L.P. | 129,353,530 | 129,354 | ||||||
|
| |||||||
Total Affiliated Partnership | 129,354 | |||||||
|
| |||||||
CASH EQUIVALENTS — 3.1% | ||||||||
Investors Cash Trust—Treasury Portfolio—DWS US Treasury Money Fund 0.010% | 4,706,969 | 4,707 | ||||||
SEI Daily Income Trust, Prime Obligation Fund, Cl A 0.010%**† | 39,523,759 | 39,524 | ||||||
|
| |||||||
Total Cash Equivalents | 44,231 | |||||||
|
| |||||||
U.S. TREASURY OBLIGATIONS (C) (D) — 0.1% |
| |||||||
U.S. Treasury Bills | ||||||||
0.088%, 02/06/14 | $ | 728 | 728 | |||||
0.040%, 01/09/14 | 337 | 337 | ||||||
|
| |||||||
Total U.S. Treasury Obligations | 1,065 | |||||||
|
| |||||||
Total Investments — 109.2% | $ | 1,574,126 | ||||||
|
| |||||||
A list of the open futures contracts held by the Fund at September 30, 2013, are as follows:
Type of Contract | Number of Contracts Long | Expiration Date | Unrealized Appreciation (Depreciation) ($ Thousands) | |||||||||
Russell 2000 Index E-MINI | 5 | Dec-2013 | $ | 10 | ||||||||
S&P 500 Index EMINI | 70 | Dec-2013 | (28 | ) | ||||||||
|
| |||||||||||
| $ | (18 | ) | ||||||||||
|
| |||||||||||
For the year ended September 30, 2013, the total amount of all open futures contracts, as presented in the table above, are representative of the volume of activity for this derivative type during the year.
Percentages are based on Net Assets of $1,441,608 ($Thousands).
| ‡ | Narrow Industries are utilized for compliance purposes, whereas broad sectors are utilized for reporting. |
| * | Non-income producing security. |
| ** | Rate shown is the 7-day effective yield as of September 30, 2013. |
| † | Real Estate Investment Trust. |
| †† | Investment in Affiliated Security. |
| (A) | This security or a partial position of this security is on loan at September 30, 2013. The total market value of securities on loan at September 30, 2013 was $126,277 ($ Thousands) |
| (B) | This security was purchased with cash collateral held from securities on loan. The total market value of such securities as of September 30, 2013 was $129,354 ($Thousands). |
| (C) | The rate reported is the effective yield at the time of purchase. |
| (D) | Security, or portion thereof, has been pledged as collateral on open futures contracts. |
| ADR | — American Depositary Receipt |
| Cl | — Class |
L.P. — Limited Partnership
S&P — Standard and Poor’s
The following is a list of the level of inputs used as of September 30, 2013, in valuing the Fund’s investments and other financial instruments carried at value ($ Thousands):
| Investments in Securities | Level 1 | Level 2 | Level 3 | Total | ||||||||||||
Common Stock | $ | 1,398,624 | $ | — | $ | — | $ | 1,398,624 | ||||||||
Warrant | 852 | — | — | 852 | ||||||||||||
U.S. Treasury Obligations | — | 1,065 | — | 1,065 | ||||||||||||
Affiliated Partnership | — | 129,354 | — | 129,354 | ||||||||||||
Cash Equivalents | 44,231 | — | — | 44,231 | ||||||||||||
|
|
|
|
|
|
|
| |||||||||
Total Investments in Securities | $ | 1,443,707 | $ | 130,419 | $ | — | $ | 1,574,126 | ||||||||
|
|
|
|
|
|
|
| |||||||||
Other Financial Instruments | Level 1 | Level 2 | Level 3 | Total | ||||||||||||
Futures Contracts * | ||||||||||||||||
Unrealized Appreciation | $ | 10 | $ | — | $ | — | $ | 10 | ||||||||
Unrealized Depreciation | (28 | ) | — | — | (28 | ) | ||||||||||
|
|
|
|
|
|
|
| |||||||||
Total Other Financial Instruments | $ | (18 | ) | $ | — | $ | — | $ | (18 | ) | ||||||
|
|
|
|
|
|
|
| |||||||||
| * | Futures contracts are valued at the unrealized depreciation on the instrument. |
For the year ended September 30, 2013, there were no transfers between Level 1 and Level 2 assets and liabilities.
For the year ended September 30, 2013, there were no transfers between Level 2 and Level 3 assets and liabilities.
Amounts designated as “—” are $0 or have been rounded to $0.
| 4 | SEI Institutional Managed Trust / Annual Report / September 30, 2013 |
Schedule of Investments
Tax—Managed Large Cap Fund
September 30, 2013
Description | Shares | Market Value ($ Thousands) | ||||||
COMMON STOCK — 95.3% | ||||||||
Consumer Discretionary — 12.6% | ||||||||
Amazon.com, Cl A * | 5,145 | $ | 1,608 | |||||
Autoliv (A) | 22,650 | 1,979 | ||||||
Bed Bath & Beyond * | 21,011 | 1,625 | ||||||
Best Buy (A) | 170,869 | 6,408 | ||||||
Big Lots * | 10,863 | 403 | ||||||
CarMax * | 1,883 | 91 | ||||||
CBS, Cl B | 208,745 | 11,514 | ||||||
Charter Communications, Cl A * | 18,086 | 2,437 | ||||||
Chipotle Mexican Grill, Cl A * (A) | 13,788 | 5,911 | ||||||
Coach | 174,084 | 9,493 | ||||||
Comcast, Cl A | 123,195 | 5,562 | ||||||
CST Brands (A) | 26,846 | 800 | ||||||
Darden Restaurants (A) | 3,127 | 145 | ||||||
Dillard’s, Cl A | 25,714 | 2,013 | ||||||
DIRECTV * | 58,230 | 3,479 | ||||||
Discovery Communications, Cl A * (A) | 26,104 | 2,204 | ||||||
DISH Network, Cl A | 17,303 | 779 | ||||||
DR Horton (A) | 6,500 | 126 | ||||||
Family Dollar Stores | 701 | 50 | ||||||
Foot Locker, Cl A | 30,000 | 1,018 | ||||||
Ford Motor | 331,726 | 5,596 | ||||||
Fossil Group * | 45,038 | 5,235 | ||||||
GameStop, Cl A (A) | 179,661 | 8,920 | ||||||
Gannett | 176,643 | 4,732 | ||||||
Gap | 100,419 | 4,045 | ||||||
General Motors * | 4,749 | 171 | ||||||
Genuine Parts | 2,400 | 194 | ||||||
Gildan Activewear, Cl A | 38,829 | 1,803 | ||||||
H&R Block | 52,113 | 1,389 | ||||||
Harley-Davidson, Cl A (A) | 184,226 | 11,835 | ||||||
Harman International Industries, Cl A | 57,636 | 3,817 | ||||||
Hasbro (A) | 9,640 | 454 | ||||||
Home Depot | 119,248 | 9,045 | ||||||
International Game Technology | 28,909 | 547 | ||||||
Interpublic Group | 2,743 | 47 | ||||||
Johnson Controls | 4,300 | 179 | ||||||
Kohl’s | 37,965 | 1,965 | ||||||
L Brands | 163,412 | 9,985 | ||||||
Las Vegas Sands | 4,119 | 274 | ||||||
Lear | 115,549 | 8,270 | ||||||
Liberty Global, Cl A * | 3,095 | 246 | ||||||
Liberty Media—Interactive, Cl A * | 460,446 | 10,807 | ||||||
LKQ * | 13,165 | 420 | ||||||
Lowe’s | 45,020 | 2,143 | ||||||
Macy’s | 86,900 | 3,760 | ||||||
Magna International, Cl A | 36,582 | 3,020 | ||||||
Marriott International, Cl A | 11 | — | ||||||
Mattel | 6,987 | 292 | ||||||
McDonald’s | 6,294 | 606 | ||||||
MGM Mirage * (A) | 33,662 | 688 | ||||||
Murphy USA * | 24,225 | 978 | ||||||
Newell Rubbermaid, Cl B | 63,977 | 1,759 | ||||||
News * (A) | 107,436 | 1,747 | ||||||
Description | Shares | Market Value ($ Thousands) | ||||||
Nike, Cl B | 293,208 | $ | 21,299 | |||||
Nordstrom | 154,750 | 8,697 | ||||||
Omnicom Group (A) | 3,479 | 221 | ||||||
Panera Bread, Cl A * | 11,864 | 1,881 | ||||||
PetSmart | 1,608 | 123 | ||||||
Polaris Industries (A) | 600 | 78 | ||||||
priceline.com * | 13,299 | 13,445 | ||||||
Ralph Lauren, Cl A | 27,814 | 4,582 | ||||||
Royal Caribbean Cruises | 3,900 | 149 | ||||||
Sally Beauty Holdings * | 109,955 | 2,876 | ||||||
Sears Holdings * (A) | 900 | 54 | ||||||
Signet Jewelers | 40,637 | 2,912 | ||||||
Sirius XM Radio (A) | 19,560 | 76 | ||||||
Staples (A) | 4,274 | 63 | ||||||
Starbucks | 139,397 | 10,729 | ||||||
Starwood Hotels & Resorts Worldwide | 4,743 | 315 | ||||||
Target, Cl A | 238,820 | 15,280 | ||||||
Tempur-Pedic International * | 21,091 | 927 | ||||||
Time Warner | 41,985 | 2,763 | ||||||
Time Warner Cable, Cl A | 69,379 | 7,743 | ||||||
TJX | 4,954 | 279 | ||||||
Tupperware Brands | 5,517 | 477 | ||||||
Twenty-First Century Fox | 437,712 | 14,639 | ||||||
Under Armour, Cl A * (A) | 36,265 | 2,881 | ||||||
Urban Outfitters * | 763 | 28 | ||||||
VF (A) | 1,187 | 236 | ||||||
Walt Disney | 184,974 | 11,929 | ||||||
Washington Post, Cl B | 809 | 495 | ||||||
Whirlpool | 71,496 | 10,470 | ||||||
Wyndham Worldwide | 55,235 | 3,368 | ||||||
Yum! Brands | 35,366 | 2,525 | ||||||
|
| |||||||
| 304,154 | ||||||||
|
| |||||||
Consumer Staples — 9.3% | ||||||||
Altria Group | 89,960 | 3,090 | ||||||
Anheuser-Busch InBev ADR | 93,762 | 9,301 | ||||||
Archer-Daniels-Midland | 146,608 | 5,401 | ||||||
Beam | 8,611 | 557 | ||||||
Bunge | 22,852 | 1,735 | ||||||
Church & Dwight | 11,874 | 713 | ||||||
Clorox | 832 | 68 | ||||||
Coca-Cola | 97,088 | 3,678 | ||||||
Coca-Cola Enterprises | 20,024 | 805 | ||||||
Colgate-Palmolive | 6,566 | 389 | ||||||
ConAgra Foods | 76,205 | 2,312 | ||||||
Constellation Brands, Cl A * | 10,975 | 630 | ||||||
Costco Wholesale | 208,096 | 23,956 | ||||||
CVS Caremark | 329,617 | 18,706 | ||||||
Dean Foods * (A) | 34,824 | 672 | ||||||
Dr Pepper Snapple Group | 25,908 | 1,161 | ||||||
Estee Lauder, Cl A | 260,678 | 18,221 | ||||||
Green Mountain Coffee Roasters * (A) | 11,520 | 868 | ||||||
Herbalife (A) | 10,600 | 740 | ||||||
Hershey | 47,876 | 4,429 | ||||||
Ingredion | 22,400 | 1,482 | ||||||
JM Smucker | 7,014 | 737 | ||||||
Kellogg | 11,489 | 675 | ||||||
Kimberly-Clark | 41,873 | 3,945 | ||||||
Kraft Foods | 13,143 | 689 | ||||||
Kroger | 267,391 | 10,787 | ||||||
| 1 | SEI Institutional Managed Trust / Annual Report / September 30, 2013 |
Schedule of Investments
Tax—Managed Large Cap Fund
September 30, 2013
Description | Shares | Market Value ($ Thousands) | ||||||
Lorillard | 11,375 | $ | 510 | |||||
Mead Johnson Nutrition, Cl A | 167,228 | 12,418 | ||||||
Mondelez International, Cl A | 325,538 | 10,228 | ||||||
Nu Skin Enterprises, Cl A | 35,000 | 3,351 | ||||||
PepsiCo | 41,419 | 3,293 | ||||||
Philip Morris International | 110,799 | 9,594 | ||||||
Procter & Gamble | 139,289 | 10,529 | ||||||
Reynolds American | 47,973 | 2,340 | ||||||
Safeway (A) | 107,954 | 3,453 | ||||||
SYSCO, Cl A (A) | 6,029 | 192 | ||||||
Tyson Foods, Cl A | 381,578 | 10,791 | ||||||
Walgreen | 281,641 | 15,152 | ||||||
Wal-Mart Stores | 80,508 | 5,954 | ||||||
WhiteWave Foods, Cl A * (A) | 17,791 | 355 | ||||||
Whole Foods Market | 327,550 | 19,162 | ||||||
|
| |||||||
| 223,069 | ||||||||
|
| |||||||
Energy — 9.7% | ||||||||
Anadarko Petroleum, Cl A | 3,563 | 331 | ||||||
Apache | 49,223 | 4,191 | ||||||
Cameron International * | 5,018 | 293 | ||||||
Chesapeake Energy (A) | 4,174 | 108 | ||||||
Chevron | 277,584 | 33,727 | ||||||
Cimarex Energy | 5,845 | 564 | ||||||
Concho Resources * | 900 | 98 | ||||||
ConocoPhillips | 257,902 | 17,927 | ||||||
Core Laboratories (A) | 53,712 | 9,089 | ||||||
Devon Energy | 6,790 | 392 | ||||||
Diamond Offshore Drilling (A) | 68,000 | 4,238 | ||||||
Energen | 750 | 57 | ||||||
EOG Resources | 105,210 | 17,810 | ||||||
EQT | 2,100 | 186 | ||||||
Exxon Mobil | 435,386 | 37,461 | ||||||
FMC Technologies * (A) | 145,690 | 8,074 | ||||||
Halliburton (A) | 110,013 | 5,297 | ||||||
Helmerich & Payne (A) | 18,000 | 1,241 | ||||||
Hess | 96,213 | 7,441 | ||||||
HollyFrontier | 43,776 | 1,843 | ||||||
Kinder Morgan | 302,468 | 10,759 | ||||||
Marathon Oil | 260,868 | 9,099 | ||||||
Marathon Petroleum | 168,109 | 10,813 | ||||||
Murphy Oil | 96,903 | 5,845 | ||||||
Nabors Industries | 33,146 | 532 | ||||||
National Oilwell Varco, Cl A (A) | 96,765 | 7,558 | ||||||
Noble Energy | 92,668 | 6,210 | ||||||
Occidental Petroleum | 40,144 | 3,755 | ||||||
Phillips 66 | 184,820 | 10,686 | ||||||
Pioneer Natural Resources | 2,401 | 453 | ||||||
Schlumberger, Cl A | 108,211 | 9,562 | ||||||
SM Energy | 1,000 | 77 | ||||||
Spectra Energy | 6,373 | 218 | ||||||
Superior Energy Services * | 31,248 | 782 | ||||||
Tesoro | 20,299 | 893 | ||||||
Valero Energy | 174,730 | 5,967 | ||||||
Williams | 5,410 | 197 | ||||||
|
| |||||||
| 233,774 | ||||||||
|
| |||||||
Financials — 15.6% | ||||||||
ACE | 32,344 | 3,026 | ||||||
Aflac | 68,072 | 4,220 | ||||||
Allied World Assurance Holdings | 37,344 | 3,712 | ||||||
Allstate | 172,676 | 8,729 | ||||||
Description | Shares | Market Value ($ Thousands) | ||||||
American Capital * | 129,457 | $ | 1,780 | |||||
American Capital Agency, Cl A † (A) | 63,888 | 1,442 | ||||||
American Express | 6,330 | 478 | ||||||
American Financial Group | 39,790 | 2,151 | ||||||
American International Group | 338,405 | 16,457 | ||||||
American Tower, Cl A † | 2,495 | 185 | ||||||
Ameriprise Financial | 82,444 | 7,509 | ||||||
Arch Capital Group * (A) | 6,051 | 327 | ||||||
Associated Banc-Corp | 21,133 | 327 | ||||||
Assurant | 132,522 | 7,169 | ||||||
AvalonBay Communities † | 1,788 | 227 | ||||||
Axis Capital Holdings | 113,203 | 4,903 | ||||||
Bank of America | 784,949 | 10,832 | ||||||
Bank of New York Mellon | 51,336 | 1,550 | ||||||
BB&T | 51,249 | 1,730 | ||||||
Berkshire Hathaway, Cl B * | 43,666 | 4,956 | ||||||
BlackRock | 2,401 | 650 | ||||||
Boston Properties † | 4,827 | 516 | ||||||
Brandywine Realty Trust † (A) | 101,137 | 1,333 | ||||||
Capital One Financial | 166,405 | 11,439 | ||||||
CBL & Associates Properties † | 43,851 | 838 | ||||||
CBOE Holdings | 47,460 | 2,146 | ||||||
CBRE Group, Cl A * | 2,800 | 65 | ||||||
Charles Schwab | 458,204 | 9,686 | ||||||
Chubb | 76,800 | 6,855 | ||||||
Citigroup | 516,494 | 25,055 | ||||||
CME Group | 87,815 | 6,488 | ||||||
Cullen/Frost Bankers (A) | 15,682 | 1,106 | ||||||
DDR † (A) | 57,863 | 909 | ||||||
Digital Realty Trust, Cl A † (A) | 1,300 | 69 | ||||||
Discover Financial Services | 241,586 | 12,210 | ||||||
Equity Residential † | 4,687 | 251 | ||||||
Everest Re Group | 65,839 | 9,574 | ||||||
Fidelity National Financial, Cl A (A) | 5,399 | 144 | ||||||
Fifth Third Bancorp | 491,034 | 8,858 | ||||||
Franklin Resources | 4,467 | 226 | ||||||
Fulton Financial | 25,026 | 292 | ||||||
Genworth Financial, Cl A * | 83,086 | 1,063 | ||||||
Goldman Sachs Group | 71,669 | 11,339 | ||||||
Hartford Financial Services Group | 101,910 | 3,171 | ||||||
HCP † | 10,920 | 447 | ||||||
Health Care † | 5,009 | 313 | ||||||
Hospitality Properties Trust † | 55,114 | 1,560 | ||||||
Host Hotels & Resorts † | 15,849 | 280 | ||||||
Huntington Bancshares | 616,445 | 5,092 | ||||||
ING US | 39,187 | 1,145 | ||||||
IntercontinentalExchange * (A) | 50,225 | 9,112 | ||||||
JPMorgan Chase | 730,992 | 37,785 | ||||||
KeyCorp | 997,856 | 11,376 | ||||||
Kimco Realty † | 15,742 | 318 | ||||||
Lincoln National | 188,571 | 7,918 | ||||||
Loews | 41,908 | 1,959 | ||||||
Macerich † | 5,647 | 319 | ||||||
MetLife | 56,878 | 2,670 | ||||||
Morgan Stanley | 24,877 | 670 | ||||||
PartnerRe | 55,947 | 5,121 | ||||||
People’s United Financial (A) | 23,725 | 341 | ||||||
PNC Financial Services Group | 123,049 | 8,915 | ||||||
Popular | 44,819 | 1,176 | ||||||
| 2 | SEI Institutional Managed Trust / Annual Report / September 30, 2013 |
Schedule of Investments
Tax—Managed Large Cap Fund
September 30, 2013
Description | Shares | Market Value ($ Thousands) | ||||||
Progressive | 324,035 | $ | 8,823 | |||||
ProLogis † | 14,709 | 553 | ||||||
Protective Life (A) | 103,767 | 4,415 | ||||||
Prudential Financial | 44,724 | 3,488 | ||||||
Public Storage † | 4,106 | 659 | ||||||
Raymond James Financial | 4,992 | 208 | ||||||
Regions Financial | 507,300 | 4,698 | ||||||
Reinsurance Group of America, Cl A | 56,545 | 3,788 | ||||||
RenaissanceRe Holdings | 16,714 | 1,513 | ||||||
RLJ Lodging Trust † | 38,000 | 893 | ||||||
Simon Property Group † | 10,072 | 1,493 | ||||||
SLM | 198,532 | 4,943 | ||||||
State Street | 40,538 | 2,665 | ||||||
SunTrust Banks | 16,281 | 528 | ||||||
Torchmark, Cl A (A) | 11,690 | 846 | ||||||
Travelers | 127,328 | 10,794 | ||||||
Unum Group | 110,928 | 3,377 | ||||||
US Bancorp | 65,779 | 2,406 | ||||||
Validus Holdings | 28,272 | 1,045 | ||||||
Ventas † | 7,372 | 453 | ||||||
Vornado Realty Trust † | 5,334 | 448 | ||||||
Wells Fargo | 599,477 | 24,770 | ||||||
Weyerhaeuser † | 17,503 | 501 | ||||||
|
| |||||||
| 375,817 | ||||||||
|
| |||||||
Health Care — 13.0% | ||||||||
Abbott Laboratories | 99,343 | 3,297 | ||||||
AbbVie | 87,679 | 3,922 | ||||||
Aetna, Cl A | 56,625 | 3,625 | ||||||
Agilent Technologies | 5,250 | 269 | ||||||
Alexion Pharmaceuticals * | 45,693 | 5,308 | ||||||
Allergan | 123,287 | 11,151 | ||||||
AmerisourceBergen | 88,988 | 5,437 | ||||||
Amgen, Cl A | 222,697 | 24,929 | ||||||
Baxter International | 36,801 | 2,417 | ||||||
Becton Dickinson (A) | 2,360 | 236 | ||||||
Biogen Idec * | 88,036 | 21,195 | ||||||
Bristol-Myers Squibb | 96,083 | 4,447 | ||||||
Cardinal Health | 73,112 | 3,813 | ||||||
Celgene, Cl A * | 177,007 | 27,247 | ||||||
Cerner * | 4,400 | 231 | ||||||
Cigna | 67,984 | 5,225 | ||||||
Community Health Systems | 39,000 | 1,619 | ||||||
Covance * | 92,947 | 8,036 | ||||||
Covidien | 15,456 | 942 | ||||||
DaVita HealthCare Partners * | 91,254 | 5,192 | ||||||
Edwards Lifesciences, Cl A * | 1,400 | 98 | ||||||
Eli Lilly | 51,961 | 2,615 | ||||||
Endo Pharmaceuticals Holdings * | 29,070 | 1,321 | ||||||
Express Scripts Holding * | 317,708 | 19,628 | ||||||
Gilead Sciences * | 120,443 | 7,568 | ||||||
HCA Holdings | 96,574 | 4,129 | ||||||
Health Net, Cl A * | 11,102 | 352 | ||||||
Henry Schein * | 1,000 | 104 | ||||||
Hill-Rom Holdings | 14,983 | 537 | ||||||
Humana | 101,522 | 9,475 | ||||||
Idexx Laboratories * (A) | 61,178 | 6,096 | ||||||
Intuitive Surgical * | 17,124 | 6,443 | ||||||
Johnson & Johnson | 225,980 | 19,590 | ||||||
Leidos Holdings * (A) | 27,826 | 1,267 | ||||||
Description | Shares | Market Value ($ Thousands) | ||||||
Life Technologies * | 3,691 | $ | 276 | |||||
Mallinckrodt * | 1,932 | 85 | ||||||
McKesson | 31,594 | 4,054 | ||||||
Medtronic | 60,275 | 3,210 | ||||||
Merck | 172,135 | 8,195 | ||||||
Novo Nordisk ADR (A) | 39,474 | 6,680 | ||||||
Omnicare (A) | 126,572 | 7,025 | ||||||
Patterson | 2,100 | 84 | ||||||
Perrigo (A) | 39,865 | 4,919 | ||||||
Pfizer | 870,203 | 24,984 | ||||||
Shire | 56,337 | 6,754 | ||||||
St. Jude Medical | 25,000 | 1,341 | ||||||
United Therapeutics * | 71,499 | 5,638 | ||||||
UnitedHealth Group | 57,748 | 4,135 | ||||||
Warner Chilcott, Cl A | 223,911 | 5,117 | ||||||
Waters * | 1,600 | 170 | ||||||
WellPoint | 121,543 | 10,162 | ||||||
Zimmer Holdings | 37,448 | 3,076 | ||||||
|
| |||||||
| 313,666 | ||||||||
|
| |||||||
Industrials — 9.0% | ||||||||
ADT, Cl A | 1,662 | 68 | ||||||
Aecom Technology * | 11,743 | 367 | ||||||
AGCO | 84,302 | 5,094 | ||||||
Alaska Air Group (A) | 45,723 | 2,863 | ||||||
Alliant Techsystems | 52,536 | 5,125 | ||||||
Babcock & Wilcox | 37,080 | 1,250 | ||||||
Boeing | 12,550 | 1,475 | ||||||
C.H. Robinson Worldwide (A) | 2,502 | 149 | ||||||
Canadian Pacific Railway | 59,321 | 7,314 | ||||||
Carlisle | 1,500 | 105 | ||||||
Caterpillar, Cl A | 16,328 | 1,361 | ||||||
Chicago Bridge & Iron | 199 | 14 | ||||||
Copa Holdings, Cl A | 2,992 | 415 | ||||||
CSX | 10,047 | 259 | ||||||
Cummins | 78,995 | 10,496 | ||||||
Danaher, Cl A | 125,204 | 8,679 | ||||||
Deere | 34,544 | 2,812 | ||||||
Delta Air Lines, Cl A (A) | 291,255 | 6,871 | ||||||
Donaldson, Cl A | 3,800 | 145 | ||||||
Dover | 3,105 | 279 | ||||||
Eaton | 3,913 | 269 | ||||||
Emerson Electric | 4,998 | 323 | ||||||
Engility Holdings * | 13,582 | 431 | ||||||
Equifax | 2,500 | 150 | ||||||
Exelis | 100,000 | 1,571 | ||||||
Expeditors International of Washington | 1,343 | 59 | ||||||
Fastenal, Cl A | 5,744 | 289 | ||||||
FedEx | 38,230 | 4,363 | ||||||
Fluor | 136,909 | 9,715 | ||||||
Fortune Brands Home & Security | 1,837 | 77 | ||||||
General Cable (A) | 25,000 | 794 | ||||||
General Dynamics | 19,797 | 1,733 | ||||||
General Electric | 345,912 | 8,264 | ||||||
Hertz Global Holdings * | 4,200 | 93 | ||||||
Honeywell International | 4,905 | 407 | ||||||
Illinois Tool Works | 3,529 | 269 | ||||||
Ingersoll-Rand | 9,146 | 594 | ||||||
ITT | 12,586 | 452 | ||||||
Jacobs Engineering Group * | 17,906 | 1,042 | ||||||
| 3 | SEI Institutional Managed Trust / Annual Report / September 30, 2013 |
Schedule of Investments
Tax—Managed Large Cap Fund
September 30, 2013
Description | Shares | Market Value ($ Thousands) | ||||||
Kansas City Southern | 61,374 | $ | 6,712 | |||||
KBR | 46,215 | 1,508 | ||||||
L-3 Communications Holdings | 112,509 | 10,632 | ||||||
Lincoln Electric Holdings | 16,823 | 1,121 | ||||||
Lockheed Martin | 47,417 | 6,048 | ||||||
Manitowoc | 4,100 | 80 | ||||||
Manpowergroup | 18,167 | 1,321 | ||||||
Navistar International * (A) | 9,626 | 351 | ||||||
Norfolk Southern | 26,000 | 2,011 | ||||||
Northrop Grumman | 156,994 | 14,955 | ||||||
Oshkosh Truck * | 112,940 | 5,532 | ||||||
Pall (A) | 109,286 | 8,419 | ||||||
Parker Hannifin, Cl A | 18,236 | 1,983 | ||||||
Pentair | 171,938 | 11,166 | ||||||
Precision Castparts | 10,755 | 2,444 | ||||||
Quanta Services * | 1,386 | 38 | ||||||
Raytheon | 160,818 | 12,394 | ||||||
Republic Services | 2,031 | 68 | ||||||
Robert Half International | 2,900 | 113 | ||||||
Roper Industries | 62,497 | 8,304 | ||||||
RR Donnelley & Sons (A) | 93,388 | 1,475 | ||||||
Southwest Airlines, Cl A | 109,628 | 1,596 | ||||||
Stericycle, Cl A * | 73,247 | 8,453 | ||||||
Textron | 5,200 | 144 | ||||||
Timken | 41,246 | 2,491 | ||||||
Tyco International | 3,325 | 116 | ||||||
Union Pacific | 79,400 | 12,334 | ||||||
United Continental Holdings * | 43,870 | 1,347 | ||||||
United Parcel Service, Cl B | 4,585 | 419 | ||||||
United Rentals * (A) | 7,390 | 431 | ||||||
United Technologies | 17,341 | 1,870 | ||||||
URS | 44,835 | 2,410 | ||||||
Waste Management | 18,232 | 752 | ||||||
WW Grainger | 762 | 199 | ||||||
|
| |||||||
| 215,273 | ||||||||
|
| |||||||
Information Technology — 19.9% | ||||||||
Accenture, Cl A | 128,841 | 9,488 | ||||||
Activision Blizzard | 17,055 | 284 | ||||||
Adobe Systems * | 544,064 | 28,259 | ||||||
Alliance Data Systems * (A) | 1,100 | 233 | ||||||
Altera | 56,210 | 2,089 | ||||||
Amdocs | 119,042 | 4,362 | ||||||
Amphenol, Cl A | 97,621 | 7,554 | ||||||
Analog Devices | 42,023 | 1,977 | ||||||
Ansys * | 62,424 | 5,401 | ||||||
AOL | 45,058 | 1,558 | ||||||
Apple | 66,521 | 31,714 | ||||||
Applied Materials | 543,345 | 9,530 | ||||||
Atmel * | 156,217 | 1,162 | ||||||
Autodesk, Cl A * | 31,671 | 1,304 | ||||||
Avnet | 37,042 | 1,545 | ||||||
Brocade Communications Systems * | 180,808 | 1,455 | ||||||
CA | 169,197 | 5,020 | ||||||
Cisco Systems | 688,073 | 16,115 | ||||||
Citrix Systems * | 64,681 | 4,567 | ||||||
Cognizant Technology Solutions, Cl A * | 45,473 | 3,734 | ||||||
Computer Sciences | 28,981 | 1,500 | ||||||
CoreLogic * | 9,831 | 266 | ||||||
Description | Shares | Market Value ($ Thousands) | ||||||
Corning, Cl B | 174,210 | $ | 2,542 | |||||
Dell | 123,492 | 1,700 | ||||||
DST Systems | 11,635 | 877 | ||||||
eBay * | 142,934 | 7,974 | ||||||
Electronic Arts * | 58,203 | 1,487 | ||||||
EMC | 394,411 | 10,081 | ||||||
Equinix * | 800 | 147 | ||||||
F5 Networks, Cl A * | 30,000 | 2,573 | ||||||
Facebook, Cl A * | 163,102 | 8,194 | ||||||
Fidelity National Information Services, Cl B | 64,209 | 2,982 | ||||||
Fiserv, Cl A * | 21,023 | 2,124 | ||||||
Genpact * | 340,595 | 6,430 | ||||||
Global Payments | 8,847 | 452 | ||||||
Google, Cl A * | 26,677 | 23,367 | ||||||
Harris | 25,220 | 1,496 | ||||||
Hewlett-Packard | 144,831 | 3,039 | ||||||
Ingram Micro, Cl A * | 262,656 | 6,054 | ||||||
Intel | 258,431 | 5,923 | ||||||
International Business Machines | 62,681 | 11,607 | ||||||
Intuit | 156,005 | 10,345 | ||||||
Juniper Networks * | 10,346 | 205 | ||||||
Lam Research * | 5,300 | 272 | ||||||
Lender Processing Services | 79,517 | 2,646 | ||||||
Lexmark International, Cl A (A) | 23,673 | 781 | ||||||
LinkedIn, Cl A * | 6,500 | 1,599 | ||||||
Marvell Technology Group | 553,908 | 6,370 | ||||||
Mastercard, Cl A | 44,237 | 29,762 | ||||||
Microchip Technology (A) | 1,219 | 49 | ||||||
Microsoft | 557,909 | 18,584 | ||||||
National Instruments | 85,878 | 2,656 | ||||||
NetApp (A) | 137,076 | 5,842 | ||||||
Nokia ADR | 300,000 | 1,953 | ||||||
Oracle, Cl B | 472,588 | 15,676 | ||||||
Qualcomm | 534,150 | 35,980 | ||||||
Rackspace Hosting * | 1,378 | 73 | ||||||
Red Hat * | 1,214 | 56 | ||||||
Rovi * | 33,373 | 640 | ||||||
SAIC (A) | — | — | ||||||
Salesforce.com * (A) | 129,532 | 6,724 | ||||||
SanDisk | 85,771 | 5,104 | ||||||
Science Applications International * | 15,900 | 537 | ||||||
Seagate Technology | 94,758 | 4,145 | ||||||
Symantec, Cl A | 199,824 | 4,945 | ||||||
TE Connectivity | 36,055 | 1,867 | ||||||
Tech Data * | 35,149 | 1,755 | ||||||
Teradata * | 235,974 | 13,082 | ||||||
Texas Instruments | 194,318 | 7,825 | ||||||
Total System Services | 13,564 | 399 | ||||||
VeriFone Holdings * | 155,882 | 3,563 | ||||||
VeriSign * (A) | 141,384 | 7,195 | ||||||
Visa, Cl A (A) | 129,061 | 24,664 | ||||||
Vishay Intertechnology * (A) | 88,686 | 1,143 | ||||||
Western Digital | 230,097 | 14,588 | ||||||
Xerox | 526,275 | 5,415 | ||||||
Yahoo! * | 140,887 | 4,672 | ||||||
|
| |||||||
| 479,278 | ||||||||
|
| |||||||
Materials — 3.1% | ||||||||
Avery Dennison | 11,196 | 487 | ||||||
| 4 | SEI Institutional Managed Trust / Annual Report / September 30, 2013 |
Schedule of Investments
Tax—Managed Large Cap Fund
September 30, 2013
Description | Shares | Market Value ($ Thousands) | ||||||
Cabot | 18,468 | $ | 789 | |||||
CF Industries Holdings | 21,896 | 4,616 | ||||||
Commercial Metals, Cl A | 35,073 | 595 | ||||||
Domtar (A) | 14,000 | 1,112 | ||||||
Dow Chemical, Cl A | 296,499 | 11,386 | ||||||
E.I. Du Pont de Nemours | 5,201 | 305 | ||||||
Eastman Chemical | 34,295 | 2,672 | ||||||
Ecolab | 78,941 | 7,796 | ||||||
Freeport-McMoRan Copper & Gold, Cl B | 12,700 | 420 | ||||||
Huntsman | 130,787 | 2,695 | ||||||
International Paper | 20,461 | 916 | ||||||
LyondellBasell Industries, Cl A | 195,588 | 14,323 | ||||||
Martin Marietta Materials, Cl A | 550 | 54 | ||||||
Monsanto | 75,004 | 7,828 | ||||||
Newmont Mining | 4,000 | 112 | ||||||
Owens-Illinois * | 32,385 | 972 | ||||||
Packaging Corp of America | 25,000 | 1,427 | ||||||
PPG Industries | 3,000 | 501 | ||||||
Praxair | 2,548 | 306 | ||||||
Reliance Steel & Aluminum | 25,000 | 1,832 | ||||||
Rock Tenn, Cl A | 28,650 | 2,902 | ||||||
Sherwin-Williams, Cl A | 3,368 | 614 | ||||||
Sigma-Aldrich | 2,200 | 188 | ||||||
Steel Dynamics | 94,148 | 1,573 | ||||||
Syngenta ADR (A) | 84,000 | 6,829 | ||||||
United States Steel (A) | 12,086 | 249 | ||||||
Vulcan Materials | 1,097 | 57 | ||||||
Westlake Chemical | 12,337 | 1,291 | ||||||
|
| |||||||
| 74,847 | ||||||||
|
| |||||||
Telecommunication Services — 1.5% |
| |||||||
AT&T (A) | 152,969 | 5,174 | ||||||
CenturyTel (A) | 6,892 | 216 | ||||||
Crown Castle International * | 321,932 | 23,511 | ||||||
SBA Communications, Cl A * (A) | 19,500 | 1,569 | ||||||
Sprint * | 74,597 | 463 | ||||||
T-Mobile US | 1,671 | 43 | ||||||
Verizon Communications | 97,068 | 4,529 | ||||||
|
| |||||||
| 35,505 | ||||||||
|
| |||||||
Utilities — 1.6% | ||||||||
AES | 246,798 | 3,280 | ||||||
Ameren | 113,300 | 3,947 | ||||||
American Electric Power | 179,636 | 7,787 | ||||||
American Water Works | 5,896 | 243 | ||||||
Centerpoint Energy | 4,900 | 117 | ||||||
CMS Energy | 7,966 | 210 | ||||||
Consolidated Edison | 3,405 | 188 | ||||||
Dominion Resources | 5,292 | 331 | ||||||
DTE Energy | 10,523 | 694 | ||||||
Duke Energy | 17,375 | 1,160 | ||||||
Edison International | 75,548 | 3,480 | ||||||
Entergy | 93,049 | 5,880 | ||||||
Exelon | 11,287 | 335 | ||||||
Hawaiian Electric Industries | 3,200 | 80 | ||||||
MDU Resources Group | 2,200 | 62 | ||||||
National Fuel Gas (A) | 1,300 | 89 | ||||||
NextEra Energy | 4,538 | 364 | ||||||
NV Energy | 127,620 | 3,013 | ||||||
OGE Energy | 5,224 | 189 | ||||||
PG&E | 6,066 | 248 | ||||||
Description | Shares/Face Amount ($ Thousands) | Market Value ($ Thousands) | ||||||
PNM Resources | 43,000 | $ | 973 | |||||
Public Service Enterprise Group | 171,521 | 5,648 | ||||||
Sempra Energy | 1,517 | 130 | ||||||
UGI | 710 | 28 | ||||||
|
| |||||||
| 38,476 | ||||||||
|
| |||||||
Total Common Stock | 2,293,859 | |||||||
|
| |||||||
AFFILIATED PARTNERSHIP — 5.2% |
| |||||||
SEI Liquidity Fund, L.P. | 125,772,028 | 125,772 | ||||||
|
| |||||||
Total Affiliated Partnership | 125,772 | |||||||
|
| |||||||
CASH EQUIVALENT — 4.6% | ||||||||
SEI Daily Income Trust, Prime Obligation Fund, Cl A | 109,822,447 | 109,822 | ||||||
|
| |||||||
Total Cash Equivalent | 109,822 | |||||||
|
| |||||||
U.S. TREASURY OBLIGATION (C) (D) — 0.1% |
| |||||||
U.S. Treasury Bills | ||||||||
0.040%, 01/09/14 | $ | 3,241 | 3,241 | |||||
|
| |||||||
Total U.S. Treasury Obligation | 3,241 | |||||||
|
| |||||||
Total Investments — 105.2% | $ | 2,532,694 | ||||||
|
| |||||||
A list of the open futures contracts held by the Fund at September 30, 2013, are as follows:
Type of Contract | Number of Contracts Long | Expiration Date | Unrealized Appreciation (Depreciation) ($ Thousands) | |||||||||
S&P 500 Index EMINI | 588 | Dec-2013 | $ | (301 | ) | |||||||
S&P Midcap 400 EMINI | 60 | Dec-2013 | 62 | |||||||||
|
| |||||||||||
| $ | (239 | ) | ||||||||||
|
| |||||||||||
For the year ended September 30, 2013, the total amount of all open futures contracts, as presented in the table above, are representative of the volume of activity for this derivative type during the year.
Percentages are based on Net Assets of $2,408,406 ($Thousands).
| * | Non-income producing security. |
| ** | Rate shown is the 7-day effective yield as of September 30, 2013. |
| † | Real Estate Investment Trust. |
| †† | Investment in Affiliated Security. |
| (A) | This security or a partial position of this security is on loan at September 30, 2013. The total market value of securities on loan at September 30, 2013 was $122,551 ($ Thousands). |
| (B) | This security was purchased with cash collateral received from securities lending. The total market value of such securities as of September 30, 2013 was $125,772 ($ Thousands). |
| (C) | Security, or portion thereof has been pledged as collateral on open futures contracts. |
| (D) | The rate reported is the effective yield at the time of purchase. |
ADR — American Depositary Receipt
Cl — Class
| 5 | SEI Institutional Managed Trust / Annual Report / September 30, 2013 |
Schedule of Investments
Tax—Managed Large Cap Fund
September 30, 2013
L.P.—Limited Partnership
S&P—Standard & Poors
The following is a list of the level of inputs used as of September 30, 2013, in valuing the Fund’s investments and other financial instruments carried at value ($ Thousands):
| Investments in Securities | Level 1 | Level 2 | Level 3 | Total | ||||||||||||
Common Stock | $ | 2,293,859 | $ | — | $ | — | $ | 2,293,859 | ||||||||
U.S. Treasury Obligation | — | 3,241 | — | 3,241 | ||||||||||||
Affiliated Partnership | — | 125,772 | — | 125,772 | ||||||||||||
Cash Equivalent | 109,822 | — | — | 109,822 | ||||||||||||
|
|
|
|
|
|
|
| |||||||||
Total Investments in Securities | $ | 2,403,681 | $ | 129,013 | $ | — | $ | 2,532,694 | ||||||||
|
|
|
|
|
|
|
| |||||||||
Other Financial Instruments | Level 1 | Level 2 | Level 3 | Total | ||||||||||||
Futures Contracts * | ||||||||||||||||
Unrealized Appreciation | $ | 62 | $ | — | $ | — | $ | 62 | ||||||||
Unrealized Depreciation | (301 | ) | — | — | (301 | ) | ||||||||||
|
|
|
|
|
|
|
| |||||||||
Total Other Financial Instruments | $ | (239 | ) | $ | — | $ | — | $ | (239 | ) | ||||||
|
|
|
|
|
|
|
| |||||||||
| * | Futures contracts are valued at the unrealized appreciation (depreciation) on the instrument. |
For the year ended September 30, 2013, there were no transfers between Level 1 and Level 2 assets and liabilities.
For the year ended September 30, 2013, there were no transfers between Level 2 and Level 3 assets and liabilities.
Amounts designated as “—” are $0 or have been rounded to $0.
| 6 | SEI Institutional Managed Trust / Annual Report / September 30, 2013 |
Schedule of Investments
S & P 500 Index Fund
September 30, 2013
| Market Value | ||||||||
Description | Shares | ($ Thousands) | ||||||
COMMON STOCK — 98.2% | ||||||||
Consumer Discretionary — 12.2% | ||||||||
Abercrombie & Fitch, Cl A | 14,400 | $ | 509 | |||||
Amazon.com, Cl A * | 66,200 | 20,697 | ||||||
Autonation * | 11,726 | 612 | ||||||
Autozone * | 6,394 | 2,703 | ||||||
Bed Bath & Beyond * | 38,933 | 3,012 | ||||||
Best Buy (A) | 48,841 | 1,832 | ||||||
BorgWarner (A) | 20,500 | 2,078 | ||||||
Cablevision Systems, Cl A | 39,800 | 670 | ||||||
CarMax * (A) | 40,400 | 1,958 | ||||||
Carnival | 78,384 | 2,559 | ||||||
CBS, Cl B | 100,701 | 5,555 | ||||||
Chipotle Mexican Grill, Cl A * | 5,500 | 2,358 | ||||||
Coach | 50,910 | 2,776 | ||||||
Comcast, Cl A | 468,022 | 21,131 | ||||||
Darden Restaurants (A) | 23,313 | 1,079 | ||||||
Delphi Automotive | 50,500 | 2,950 | ||||||
DIRECTV * | 91,400 | 5,461 | ||||||
Discovery Communications, Cl A * (A) | 41,300 | 3,487 | ||||||
Dollar General * | 53,300 | 3,009 | ||||||
Dollar Tree * (A) | 39,900 | 2,281 | ||||||
DR Horton (A) | 51,549 | 1,002 | ||||||
Expedia (A) | 17,150 | 888 | ||||||
Family Dollar Stores | 17,522 | 1,262 | ||||||
Ford Motor | 705,080 | 11,895 | ||||||
Fossil Group * | 9,100 | 1,058 | ||||||
GameStop, Cl A (A) | 20,900 | 1,038 | ||||||
Gannett | 41,047 | 1,100 | ||||||
Gap | 49,331 | 1,987 | ||||||
Garmin (A) | 20,100 | 908 | ||||||
General Motors * | 168,400 | 6,057 | ||||||
Genuine Parts | 28,036 | 2,268 | ||||||
Goodyear Tire & Rubber | 45,193 | 1,015 | ||||||
H&R Block | 49,004 | 1,306 | ||||||
Harley-Davidson, Cl A (A) | 39,908 | 2,564 | ||||||
Harman International Industries, Cl A | 12,500 | 828 | ||||||
Hasbro (A) | 20,891 | 985 | ||||||
Home Depot | 256,396 | 19,448 | ||||||
International Game Technology | 47,056 | 891 | ||||||
Interpublic Group | 75,501 | 1,297 | ||||||
J.C. Penney * (A) | 35,780 | 316 | ||||||
Johnson Controls | 122,457 | 5,082 | ||||||
Kohl’s | 36,647 | 1,896 | ||||||
L Brands | 43,527 | 2,660 | ||||||
Leggett & Platt (A) | 26,254 | 792 | ||||||
Lennar, Cl A (A) | 30,407 | 1,076 | ||||||
Lowe’s | 188,236 | 8,962 | ||||||
Macy’s | 67,364 | 2,915 | ||||||
Marriott International, Cl A | 41,252 | 1,735 | ||||||
Mattel | 61,618 | 2,579 | ||||||
McDonald’s | 178,870 | 17,209 | ||||||
NetFlix * | 10,100 | 3,123 | ||||||
Newell Rubbermaid, Cl B | 51,547 | 1,417 | ||||||
News * | 89,158 | 1,432 | ||||||
Nike, Cl B | 133,888 | 9,726 | ||||||
Nordstrom | 25,802 | 1,450 | ||||||
| Market Value | ||||||||
Description | Shares | ($ Thousands) | ||||||
Omnicom Group (A) | 46,004 | $ | 2,918 | |||||
O’Reilly Automotive * | 19,400 | 2,475 | ||||||
PetSmart | 18,600 | 1,418 | ||||||
priceline.com * | 9,180 | 9,280 | ||||||
PulteGroup | 62,782 | 1,036 | ||||||
PVH | 14,600 | 1,733 | ||||||
Ralph Lauren, Cl A | 10,900 | 1,795 | ||||||
Ross Stores | 38,768 | 2,822 | ||||||
Scripps Networks Interactive, Cl A | 19,900 | 1,554 | ||||||
Staples (A) | 119,214 | 1,746 | ||||||
Starbucks | 134,458 | 10,349 | ||||||
Starwood Hotels & Resorts Worldwide | 35,235 | 2,341 | ||||||
Target, Cl A | 112,919 | 7,225 | ||||||
Tiffany | 19,973 | 1,530 | ||||||
Time Warner | 164,612 | 10,833 | ||||||
Time Warner Cable, Cl A | 51,183 | 5,712 | ||||||
TJX | 128,034 | 7,220 | ||||||
TripAdvisor * (A) | 19,750 | 1,498 | ||||||
Twenty-First Century Fox | 355,433 | 11,907 | ||||||
Urban Outfitters * | 19,500 | 717 | ||||||
VF (A) | 15,714 | 3,128 | ||||||
Viacom, Cl B | 77,701 | 6,494 | ||||||
Walt Disney | 297,327 | 19,175 | ||||||
Washington Post, Cl B | 755 | 462 | ||||||
Whirlpool | 14,305 | 2,095 | ||||||
Wyndham Worldwide (A) | 23,802 | 1,451 | ||||||
Wynn Resorts | 14,400 | 2,275 | ||||||
Yum! Brands | 79,870 | 5,702 | ||||||
|
| |||||||
| 333,775 | ||||||||
|
| |||||||
Consumer Staples — 9.9% | ||||||||
Altria Group | 358,756 | 12,323 | ||||||
Archer-Daniels-Midland | 117,966 | 4,346 | ||||||
Avon Products | 77,651 | 1,600 | ||||||
Beam | 28,919 | 1,870 | ||||||
Brown-Forman, Cl B | 27,292 | 1,859 | ||||||
Campbell Soup (A) | 31,975 | 1,302 | ||||||
Clorox (A) | 23,642 | 1,932 | ||||||
Coca-Cola | 682,306 | 25,846 | ||||||
Coca-Cola Enterprises | 44,517 | 1,790 | ||||||
Colgate-Palmolive | 157,686 | 9,351 | ||||||
ConAgra Foods | 75,552 | 2,292 | ||||||
Constellation Brands, Cl A * | 28,000 | 1,607 | ||||||
Costco Wholesale | 78,118 | 8,993 | ||||||
CVS Caremark | 219,835 | 12,476 | ||||||
Dr Pepper Snapple Group (A) | 36,400 | 1,632 | ||||||
Estee Lauder, Cl A | 45,800 | 3,201 | ||||||
General Mills, Cl A | 114,882 | 5,505 | ||||||
Hershey | 26,712 | 2,471 | ||||||
Hormel Foods | 24,500 | 1,032 | ||||||
JM Smucker | 18,848 | 1,980 | ||||||
Kellogg | 45,967 | 2,699 | ||||||
Kimberly-Clark | 68,599 | 6,463 | ||||||
Kraft Foods | 106,599 | 5,590 | ||||||
Kroger | 92,759 | 3,742 | ||||||
Lorillard | 66,928 | 2,997 | ||||||
McCormick (A) | 23,661 | 1,531 | ||||||
Mead Johnson Nutrition, Cl A | 36,234 | 2,691 | ||||||
| 1 | SEI Institutional Managed Trust / Annual Report / September 30, 2013 |
Schedule of Investments
S & P 500 Index Fund
September 30, 2013
| Market Value | ||||||||
Description | Shares | ($ Thousands) | ||||||
Molson Coors Brewing, Cl B | 28,246 | $ | 1,416 | |||||
Mondelez International, Cl A | 318,698 | 10,014 | ||||||
Monster Beverage * | 24,600 | 1,285 | ||||||
PepsiCo | 275,985 | 21,941 | ||||||
Philip Morris International | 289,665 | 25,082 | ||||||
Procter & Gamble | 490,101 | 37,047 | ||||||
Reynolds American | 56,680 | 2,765 | ||||||
Safeway (A) | 43,746 | 1,399 | ||||||
SYSCO, Cl A (A) | 105,320 | 3,352 | ||||||
Tyson Foods, Cl A | 49,790 | 1,408 | ||||||
Walgreen | 155,544 | 8,368 | ||||||
Wal-Mart Stores | 291,344 | 21,548 | ||||||
Whole Foods Market | 66,700 | 3,902 | ||||||
|
| |||||||
| 268,648 | ||||||||
|
| |||||||
Energy — 10.3% | ||||||||
Anadarko Petroleum, Cl A | 89,980 | 8,367 | ||||||
Apache | 71,200 | 6,062 | ||||||
Baker Hughes | 79,249 | 3,891 | ||||||
Cabot Oil & Gas | 75,300 | 2,810 | ||||||
Cameron International * (A) | 44,000 | 2,568 | ||||||
Chesapeake Energy (A) | 90,700 | 2,347 | ||||||
Chevron | 345,778 | 42,012 | ||||||
ConocoPhillips | 218,843 | 15,212 | ||||||
Consol Energy | 41,000 | 1,380 | ||||||
Denbury Resources * | 66,700 | 1,228 | ||||||
Devon Energy | 68,113 | 3,934 | ||||||
Diamond Offshore Drilling (A) | 12,800 | 798 | ||||||
Ensco, Cl A | 42,200 | 2,268 | ||||||
EOG Resources | 48,744 | 8,251 | ||||||
EQT | 27,200 | 2,413 | ||||||
Exxon Mobil | 787,698 | 67,774 | ||||||
FMC Technologies * (A) | 42,700 | 2,366 | ||||||
Halliburton (A) | 151,333 | 7,287 | ||||||
Helmerich & Payne (A) | 19,100 | 1,317 | ||||||
Hess | 51,575 | 3,989 | ||||||
Kinder Morgan | 120,465 | 4,285 | ||||||
Marathon Oil | 126,956 | 4,428 | ||||||
Marathon Petroleum | 56,078 | 3,607 | ||||||
Murphy Oil | 31,463 | 1,898 | ||||||
Nabors Industries (A) | 47,078 | 756 | ||||||
National Oilwell Varco, Cl A | 76,468 | 5,973 | ||||||
Newfield Exploration * | 24,900 | 681 | ||||||
Noble | 45,500 | 1,719 | ||||||
Noble Energy | 64,300 | 4,309 | ||||||
Occidental Petroleum | 144,159 | 13,485 | ||||||
Peabody Energy (A) | 48,700 | 840 | ||||||
Phillips 66 | 109,371 | 6,324 | ||||||
Pioneer Natural Resources (A) | 24,900 | 4,701 | ||||||
QEP Resources | 32,500 | 900 | ||||||
Range Resources | 29,500 | 2,239 | ||||||
Rowan, Cl A * | 22,897 | 841 | ||||||
Schlumberger, Cl A | 236,843 | 20,927 | ||||||
Southwestern Energy, Cl A * | 62,900 | 2,288 | ||||||
Spectra Energy | 119,761 | 4,099 | ||||||
Tesoro | 24,200 | 1,064 | ||||||
Valero Energy | 97,008 | 3,313 | ||||||
Williams | 122,265 | 4,446 | ||||||
WPX Energy * (A) | 36,821 | 709 | ||||||
|
| |||||||
| 280,106 | ||||||||
|
| |||||||
| Market Value | ||||||||
Description | Shares | ($ Thousands) | ||||||
Financials — 15.9% | ||||||||
ACE | 60,900 | $ | 5,698 | |||||
Aflac | 83,208 | 5,158 | ||||||
Allstate | 82,959 | 4,194 | ||||||
American Express | 166,015 | 12,538 | ||||||
American International Group | 264,208 | 12,848 | ||||||
American Tower, Cl A † | 70,700 | 5,241 | ||||||
Ameriprise Financial | 35,384 | 3,223 | ||||||
Aon | 55,029 | 4,096 | ||||||
Apartment Investment & Management, Cl A † | 26,839 | 750 | ||||||
Assurant | 13,900 | 752 | ||||||
AvalonBay Communities † (A) | 21,808 | 2,772 | ||||||
Bank of America | 1,922,628 | 26,532 | ||||||
Bank of New York Mellon | 205,886 | 6,216 | ||||||
BB&T | 126,597 | 4,273 | ||||||
Berkshire Hathaway, Cl B * | 322,147 | 36,567 | ||||||
BlackRock | 22,557 | 6,105 | ||||||
Boston Properties † | 27,500 | 2,940 | ||||||
Capital One Financial | 104,762 | 7,201 | ||||||
CBRE Group, Cl A * | 50,200 | 1,161 | ||||||
Charles Schwab | 206,927 | 4,375 | ||||||
Chubb | 45,756 | 4,084 | ||||||
Cincinnati Financial | 26,379 | 1,244 | ||||||
Citigroup | 544,208 | 26,400 | ||||||
CME Group | 55,435 | 4,096 | ||||||
Comerica (A) | 33,083 | 1,301 | ||||||
Discover Financial Services | 86,530 | 4,373 | ||||||
E*Trade Financial * | 51,343 | 847 | ||||||
Equity Residential † | 58,140 | 3,114 | ||||||
Fifth Third Bancorp | 158,511 | 2,860 | ||||||
Franklin Resources | 72,745 | 3,677 | ||||||
Genworth Financial, Cl A * | 89,600 | 1,146 | ||||||
Goldman Sachs Group | 74,756 | 11,827 | ||||||
Hartford Financial Services Group | 82,086 | 2,555 | ||||||
HCP † | 81,400 | 3,333 | ||||||
Health Care † | 51,600 | 3,219 | ||||||
Host Hotels & Resorts † | 134,248 | 2,372 | ||||||
Hudson City Bancorp, Cl A | 87,500 | 792 | ||||||
Huntington Bancshares | 148,475 | 1,226 | ||||||
IntercontinentalExchange * (A) | 13,000 | 2,358 | ||||||
Invesco | 79,200 | 2,527 | ||||||
JPMorgan Chase | 673,657 | 34,821 | ||||||
KeyCorp | 163,083 | 1,859 | ||||||
Kimco Realty † | 73,300 | 1,479 | ||||||
Legg Mason (A) | 20,100 | 672 | ||||||
Leucadia National | 54,300 | 1,479 | ||||||
Lincoln National | 47,298 | 1,986 | ||||||
Loews | 54,749 | 2,559 | ||||||
M&T Bank (A) | 22,161 | 2,480 | ||||||
Macerich † | 25,000 | 1,411 | ||||||
Marsh & McLennan | 98,350 | 4,283 | ||||||
McGraw-Hill | 49,221 | 3,229 | ||||||
MetLife | 200,426 | 9,410 | ||||||
Moody’s | 34,708 | 2,441 | ||||||
Morgan Stanley | 247,761 | 6,677 | ||||||
NASDAQ OMX Group, Cl A | 20,700 | 664 | ||||||
Northern Trust | 39,205 | 2,132 | ||||||
NYSE Euronext | 43,700 | 1,835 | ||||||
| 2 | SEI Institutional Managed Trust / Annual Report / September 30, 2013 |
Schedule of Investments
S & P 500 Index Fund
September 30, 2013
| Market Value | ||||||||
Description | Shares | ($ Thousands) | ||||||
People’s United Financial (A) | 57,300 | $ | 824 | |||||
Plum Creek Timber † (A) | 29,135 | 1,364 | ||||||
PNC Financial Services Group | 95,075 | 6,888 | ||||||
Principal Financial Group, Cl A (A) | 49,548 | 2,122 | ||||||
Progressive | 98,968 | 2,695 | ||||||
ProLogis † | 89,800 | 3,378 | ||||||
Prudential Financial | 83,266 | 6,493 | ||||||
Public Storage † | 25,828 | 4,147 | ||||||
Regions Financial | 249,763 | 2,313 | ||||||
Simon Property Group † | 55,502 | 8,227 | ||||||
SLM | 78,043 | 1,943 | ||||||
State Street | 79,791 | 5,246 | ||||||
SunTrust Banks | 96,496 | 3,128 | ||||||
T. Rowe Price Group | 46,508 | 3,345 | ||||||
Torchmark, Cl A (A) | 16,357 | 1,183 | ||||||
Travelers | 66,852 | 5,667 | ||||||
Unum Group | 47,152 | 1,435 | ||||||
US Bancorp | 329,206 | 12,042 | ||||||
Ventas † | 52,432 | 3,225 | ||||||
Vornado Realty Trust † | 30,773 | 2,587 | ||||||
Wells Fargo | 864,763 | 35,732 | ||||||
Weyerhaeuser † | 105,140 | 3,010 | ||||||
XL Group, Cl A | 52,005 | 1,603 | ||||||
Zions Bancorporation (A) | 33,360 | 915 | ||||||
|
| |||||||
| 434,920 | ||||||||
|
| |||||||
Health Care — 12.8% | ||||||||
Abbott Laboratories | 278,146 | 9,232 | ||||||
AbbVie | 283,746 | 12,692 | ||||||
Actavis * | 31,371 | 4,517 | ||||||
Aetna, Cl A | 66,602 | 4,264 | ||||||
Agilent Technologies | 59,206 | 3,034 | ||||||
Alexion Pharmaceuticals * | 35,200 | 4,089 | ||||||
Allergan | 53,166 | 4,809 | ||||||
AmerisourceBergen | 41,292 | 2,523 | ||||||
Amgen, Cl A | 134,855 | 15,096 | ||||||
Baxter International | 97,138 | 6,381 | ||||||
Becton Dickinson | 34,762 | 3,477 | ||||||
Biogen Idec * | 42,500 | 10,232 | ||||||
Boston Scientific * | 240,312 | 2,821 | ||||||
Bristol-Myers Squibb | 294,675 | 13,638 | ||||||
C.R. Bard | 13,388 | 1,542 | ||||||
Cardinal Health | 60,755 | 3,168 | ||||||
CareFusion * | 38,377 | 1,416 | ||||||
Celgene, Cl A * | 73,600 | 11,329 | ||||||
Cerner * | 52,900 | 2,780 | ||||||
Cigna | 50,571 | 3,887 | ||||||
Covidien | 82,300 | 5,015 | ||||||
DaVita HealthCare Partners * | 30,400 | 1,730 | ||||||
Dentsply International (A) | 26,000 | 1,129 | ||||||
Edwards Lifesciences, Cl A * | 20,100 | 1,400 | ||||||
Eli Lilly | 177,430 | 8,930 | ||||||
Express Scripts Holding * | 145,661 | 8,999 | ||||||
Forest Laboratories, Cl A * | 42,163 | 1,804 | ||||||
Gilead Sciences * | 273,944 | 17,214 | ||||||
Hospira * (A) | 29,604 | 1,161 | ||||||
Humana | 27,997 | 2,613 | ||||||
Intuitive Surgical * | 7,120 | 2,679 | ||||||
Johnson & Johnson | 504,282 | 43,716 | ||||||
| Market Value | ||||||||
Description | Shares | ($ Thousands) | ||||||
Laboratory Corp of America Holdings * (A) | 16,363 | $ | 1,622 | |||||
Life Technologies * | 31,243 | 2,338 | ||||||
McKesson | 40,869 | 5,244 | ||||||
Medtronic | 178,517 | 9,506 | ||||||
Merck | 523,744 | 24,935 | ||||||
Mylan * (A) | 69,011 | 2,634 | ||||||
Patterson | 15,400 | 619 | ||||||
PerkinElmer | 20,640 | 779 | ||||||
Perrigo (A) | 16,000 | 1,974 | ||||||
Pfizer | 1,184,791 | 34,015 | ||||||
Quest Diagnostics (A) | 27,524 | 1,701 | ||||||
Regeneron Pharmaceuticals * | 13,900 | 4,349 | ||||||
St. Jude Medical | 51,356 | 2,755 | ||||||
Stryker | 52,142 | 3,524 | ||||||
Tenet Healthcare * | 18,219 | 750 | ||||||
Thermo Fisher Scientific (A) | 64,543 | 5,948 | ||||||
UnitedHealth Group | 181,947 | 13,029 | ||||||
Varian Medical Systems * (A) | 19,300 | 1,442 | ||||||
Vertex Pharmaceuticals * | 41,700 | 3,162 | ||||||
Waters * (A) | 15,397 | 1,635 | ||||||
WellPoint | 53,498 | 4,473 | ||||||
Zimmer Holdings | 30,455 | 2,502 | ||||||
Zoetis, Cl A | 89,446 | 2,784 | ||||||
|
| |||||||
| 349,037 | ||||||||
|
| |||||||
Industrials — 10.5% | ||||||||
3M | 116,182 | 13,873 | ||||||
ADT, Cl A | 36,250 | 1,474 | ||||||
Ametek | 43,700 | 2,011 | ||||||
Boeing | 124,232 | 14,597 | ||||||
C.H. Robinson Worldwide (A) | 28,500 | 1,697 | ||||||
Caterpillar, Cl A | 113,897 | 9,496 | ||||||
Cintas | 18,807 | 963 | ||||||
CSX | 182,350 | 4,694 | ||||||
Cummins | 31,140 | 4,138 | ||||||
Danaher, Cl A | 107,096 | 7,424 | ||||||
Deere | 68,502 | 5,575 | ||||||
Delta Air Lines, Cl A (A) | 153,000 | 3,609 | ||||||
Dover | 30,537 | 2,743 | ||||||
Dun & Bradstreet (A) | 7,200 | 748 | ||||||
Eaton | 84,810 | 5,838 | ||||||
Emerson Electric | 127,906 | 8,276 | ||||||
Equifax (A) | 21,725 | 1,300 | ||||||
Expeditors International of Washington | 36,900 | 1,626 | ||||||
Fastenal, Cl A (A) | 48,900 | 2,457 | ||||||
FedEx | 53,205 | 6,071 | ||||||
Flowserve | 25,200 | 1,572 | ||||||
Fluor | 29,244 | 2,075 | ||||||
General Dynamics | 59,526 | 5,210 | ||||||
General Electric | 1,822,474 | 43,539 | ||||||
Honeywell International | 140,455 | 11,663 | ||||||
Illinois Tool Works | 73,724 | 5,623 | ||||||
Ingersoll-Rand | 48,400 | 3,143 | ||||||
Iron Mountain | 30,375 | 821 | ||||||
Jacobs Engineering Group * | 23,500 | 1,367 | ||||||
Joy Global (A) | 19,200 | 980 | ||||||
Kansas City Southern | 19,900 | 2,176 | ||||||
L-3 Communications Holdings | 16,023 | 1,514 | ||||||
| 3 | SEI Institutional Managed Trust / Annual Report / September 30, 2013 |
Schedule of Investments
S & P 500 Index Fund
September 30, 2013
| Market Value | ||||||||
Description | Shares | ($ Thousands) | ||||||
Lockheed Martin | 47,994 | $ | 6,122 | |||||
Masco | 63,868 | 1,359 | ||||||
Nielsen Holdings (A) | 38,600 | 1,407 | ||||||
Norfolk Southern | 55,826 | 4,318 | ||||||
Northrop Grumman | 41,219 | 3,927 | ||||||
PACCAR | 63,391 | 3,528 | ||||||
Pall | 19,995 | 1,540 | ||||||
Parker Hannifin, Cl A | 26,671 | 2,900 | ||||||
Pentair | 35,666 | 2,316 | ||||||
Pitney Bowes (A) | 36,175 | 658 | ||||||
Precision Castparts | 26,000 | 5,908 | ||||||
Quanta Services * | 39,200 | 1,079 | ||||||
Raytheon | 57,668 | 4,445 | ||||||
Republic Services | 49,183 | 1,641 | ||||||
Robert Half International | 24,827 | 969 | ||||||
Rockwell Automation | 24,826 | 2,655 | ||||||
Rockwell Collins (A) | 24,378 | 1,654 | ||||||
Roper Industries | 17,800 | 2,365 | ||||||
Ryder System | 9,354 | 559 | ||||||
Snap-on | 10,453 | 1,040 | ||||||
Southwest Airlines, Cl A | 126,349 | 1,840 | ||||||
Stanley Black & Decker | 28,635 | 2,593 | ||||||
Stericycle, Cl A * | 15,500 | 1,788 | ||||||
Textron | 50,398 | 1,392 | ||||||
Tyco International | 82,700 | 2,893 | ||||||
Union Pacific | 82,994 | 12,892 | ||||||
United Parcel Service, Cl B | 129,011 | 11,788 | ||||||
United Technologies | 151,032 | 16,284 | ||||||
Waste Management | 78,028 | 3,218 | ||||||
WW Grainger | 10,765 | 2,818 | ||||||
Xylem | 33,500 | 936 | ||||||
|
| |||||||
| 287,125 | ||||||||
|
| |||||||
Information Technology — 17.6% | ||||||||
Accenture, Cl A | 115,400 | 8,498 | ||||||
Adobe Systems * | 83,636 | 4,344 | ||||||
Akamai Technologies * (A) | 31,900 | 1,649 | ||||||
Altera | 57,551 | 2,139 | ||||||
Amphenol, Cl A | 28,700 | 2,221 | ||||||
Analog Devices | 55,799 | 2,625 | ||||||
Apple | 162,631 | 77,534 | ||||||
Applied Materials | 215,250 | 3,775 | ||||||
Autodesk, Cl A * | 39,917 | 1,644 | ||||||
Automatic Data Processing | 86,450 | 6,257 | ||||||
Broadcom, Cl A | 95,136 | 2,475 | ||||||
CA | 59,527 | 1,766 | ||||||
Cisco Systems | 959,504 | 22,472 | ||||||
Citrix Systems * | 33,842 | 2,390 | ||||||
Cognizant Technology Solutions, Cl A * | 53,900 | 4,426 | ||||||
Computer Sciences | 26,433 | 1,368 | ||||||
Corning, Cl B | 261,378 | 3,813 | ||||||
Dell | 262,674 | 3,617 | ||||||
eBay * | 208,532 | 11,634 | ||||||
Electronic Arts * | 55,078 | 1,407 | ||||||
EMC | 372,440 | 9,520 | ||||||
F5 Networks, Cl A * | 14,300 | 1,226 | ||||||
Fidelity National Information Services, Cl B | 52,265 | 2,427 | ||||||
First Solar * (A) | 12,540 | 504 | ||||||
Fiserv, Cl A * | 23,280 | 2,353 | ||||||
Flir Systems | 25,600 | 804 | ||||||
| Market Value | ||||||||
Description | Shares | ($ Thousands) | ||||||
Google, Cl A * | 50,063 | $ | 43,850 | |||||
Harris | 19,100 | 1,133 | ||||||
Hewlett-Packard | 343,965 | 7,216 | ||||||
Intel | 891,615 | 20,436 | ||||||
International Business Machines | 184,237 | 34,117 | ||||||
Intuit | 50,886 | 3,374 | ||||||
Jabil Circuit | 33,879 | 734 | ||||||
JDS Uniphase * (A) | 42,556 | 626 | ||||||
Juniper Networks * | 90,900 | 1,805 | ||||||
KLA-Tencor | 29,671 | 1,805 | ||||||
Lam Research * | 29,217 | 1,496 | ||||||
Linear Technology (A) | 41,894 | 1,662 | ||||||
LSI Logic | 101,146 | 791 | ||||||
Mastercard, Cl A | 18,600 | 12,514 | ||||||
Microchip Technology (A) | 35,900 | 1,446 | ||||||
Micron Technology * (A) | 186,569 | 3,259 | ||||||
Microsoft | 1,356,593 | 45,188 | ||||||
Molex (A) | 24,560 | 946 | ||||||
Motorola Solutions | 42,329 | 2,513 | ||||||
NetApp | 60,876 | 2,595 | ||||||
Nvidia | 103,648 | 1,613 | ||||||
Oracle, Cl B | 638,088 | 21,165 | ||||||
Paychex (A) | 58,256 | 2,368 | ||||||
Qualcomm | 307,032 | 20,682 | ||||||
Red Hat * | 34,000 | 1,569 | ||||||
Salesforce.com * (A) | 97,900 | 5,082 | ||||||
SanDisk | 43,000 | 2,559 | ||||||
Seagate Technology | 55,600 | 2,432 | ||||||
Symantec, Cl A | 125,047 | 3,095 | ||||||
TE Connectivity | 74,000 | 3,832 | ||||||
Teradata * | 29,368 | 1,628 | ||||||
Teradyne * (A) | 35,107 | 580 | ||||||
Texas Instruments | 197,049 | 7,935 | ||||||
Total System Services | 29,580 | 870 | ||||||
VeriSign | 24,500 | 1,247 | ||||||
Visa, Cl A (A) | 92,372 | 17,652 | ||||||
Western Digital | 37,700 | 2,390 | ||||||
Western Union (A) | 100,112 | 1,868 | ||||||
Xerox | 209,906 | 2,160 | ||||||
Xilinx (A) | 47,409 | 2,222 | ||||||
Yahoo! * | 169,838 | 5,632 | ||||||
|
| |||||||
| 478,975 | ||||||||
|
| |||||||
Materials — 3.5% | ||||||||
Air Products & Chemicals | 37,526 | 3,999 | ||||||
Airgas | 11,800 | 1,251 | ||||||
Alcoa (A) | 191,435 | 1,554 | ||||||
Allegheny Technologies (A) | 19,359 | 591 | ||||||
Avery Dennison | 17,515 | 762 | ||||||
Ball | 25,982 | 1,166 | ||||||
Bemis (A) | 18,890 | 737 | ||||||
CF Industries Holdings | 10,290 | 2,169 | ||||||
Cliffs Natural Resources (A) | 27,411 | 562 | ||||||
Dow Chemical, Cl A | 216,575 | 8,317 | ||||||
E.I. Du Pont de Nemours | 165,235 | 9,676 | ||||||
Eastman Chemical | 27,916 | 2,175 | ||||||
Ecolab (A) | 48,030 | 4,743 | ||||||
FMC | 24,400 | 1,750 | ||||||
Freeport-McMoRan Copper & Gold, Cl B | 185,736 | 6,144 | ||||||
| 4 | SEI Institutional Managed Trust / Annual Report / September 30, 2013 |
Schedule of Investments
S & P 500 Index Fund
September 30, 2013
| Market Value | ||||||||
Description | Shares | ($ Thousands) | ||||||
International Flavors & Fragrances | 14,594 | $ | 1,201 | |||||
International Paper | 80,170 | 3,592 | ||||||
LyondellBasell Industries, Cl A | 80,200 | 5,873 | ||||||
MeadWestvaco | 32,115 | 1,232 | ||||||
Monsanto | 95,448 | 9,962 | ||||||
Mosaic | 61,000 | 2,624 | ||||||
Newmont Mining | 89,108 | 2,504 | ||||||
Nucor (A) | 56,982 | 2,793 | ||||||
Owens-Illinois * | 29,400 | 882 | ||||||
PPG Industries | 25,545 | 4,268 | ||||||
Praxair (A) | 52,799 | 6,347 | ||||||
Sealed Air | 36,028 | 980 | ||||||
Sherwin-Williams, Cl A | 15,416 | 2,809 | ||||||
Sigma-Aldrich (A) | 21,636 | 1,846 | ||||||
United States Steel (A) | 25,726 | 530 | ||||||
Vulcan Materials | 23,249 | 1,205 | ||||||
|
| |||||||
| 94,244 | ||||||||
|
| |||||||
Telecommunication Services — 2.4% | ||||||||
AT&T (A) | 950,440 | 32,144 | ||||||
CenturyTel (A) | 107,457 | 3,372 | ||||||
Crown Castle International * | 52,500 | 3,834 | ||||||
Frontier Communications (A) | 183,525 | 765 | ||||||
Verizon Communications | 512,148 | 23,897 | ||||||
Windstream Holdings (A) | 109,046 | 872 | ||||||
|
| |||||||
| 64,884 | ||||||||
|
| |||||||
Utilities — 3.1% | ||||||||
AES | 110,190 | 1,464 | ||||||
AGL Resources | 21,700 | 999 | ||||||
Ameren | 43,444 | 1,514 | ||||||
American Electric Power | 87,615 | 3,798 | ||||||
Centerpoint Energy | 76,968 | 1,845 | ||||||
CMS Energy | 47,592 | 1,253 | ||||||
Consolidated Edison | 52,433 | 2,891 | ||||||
Dominion Resources | 103,640 | 6,475 | ||||||
DTE Energy | 31,445 | 2,075 | ||||||
Duke Energy | 126,307 | 8,435 | ||||||
Edison International | 58,353 | 2,688 | ||||||
Entergy | 32,064 | 2,026 | ||||||
Exelon (A) | 153,246 | 4,542 | ||||||
FirstEnergy | 74,810 | 2,727 | ||||||
Integrys Energy Group | 14,534 | 812 | ||||||
NextEra Energy | 76,020 | 6,094 | ||||||
NiSource | 55,979 | 1,729 | ||||||
Northeast Utilities | 56,935 | 2,348 | ||||||
NRG Energy | 57,800 | 1,580 | ||||||
Oneok | 37,000 | 1,973 | ||||||
Pepco Holdings (A) | 45,400 | 838 | ||||||
PG&E | 80,229 | 3,283 | ||||||
Pinnacle West Capital | 19,949 | 1,092 | ||||||
PPL | 113,071 | 3,435 | ||||||
Public Service Enterprise Group | 90,530 | 2,981 | ||||||
SCANA | 25,300 | 1,165 | ||||||
Sempra Energy | 40,865 | 3,498 | ||||||
Southern | 156,435 | 6,442 | ||||||
TECO Energy (A) | 37,612 | 622 | ||||||
Wisconsin Energy | 41,100 | 1,660 | ||||||
Xcel Energy | 89,019 | 2,458 | ||||||
|
| |||||||
| $ | 84,742 | |||||||
|
| |||||||
| Shares/Face | ||||||||
| Amount | Market Value | |||||||
Description | ($ Thousands) | ($ Thousands) | ||||||
Total Common Stock | 2,676,456 | |||||||
|
| |||||||
AFFILIATED PARTNERSHIP — 6.3% |
| |||||||
SEI Liquidity Fund, L.P. 0.070%**†(B) | 171,382,829 | 171,383 | ||||||
|
| |||||||
Total Affiliated Partnership | 171,383 | |||||||
|
| |||||||
CASH EQUIVALENT — 1.6% | ||||||||
SEI Daily Income Trust, Prime Obligation Fund, Cl A 0.010%**† | 43,449,539 | 43,450 | ||||||
|
| |||||||
Total Cash Equivalent | 43,450 | |||||||
|
| |||||||
U.S. TREASURY OBLIGATION (C) (D) — 0.1% |
| |||||||
U.S. Treasury Bills |
| |||||||
0.010%, 12/12/13 | $ | 3,110 | 3,110 | |||||
|
| |||||||
Total U.S. Treasury Obligation | 3,110 | |||||||
|
| |||||||
Total Investments — 106.2% | $ | 2,894,399 | ||||||
|
| |||||||
A list of the open futures contracts held by the Fund at September 30, 2013, are as follows:
| Number of | Unrealized | |||||||||||
| Type of | Contracts | Expiration | (Depreciation) | |||||||||
Contract | Long | Date | ($ Thousands) | |||||||||
S&P 500 Index EMINI | 636 | Dec-2013 | $ | (224 | ) | |||||||
|
| |||||||||||
For the year ended September 30, 2013, the total amount of all open futures contracts as presented in the table above, are representative of the volume of activity for this derivative type during the year.
Percentages are based on Net Assets of $2,725,862 ($Thousands).
| * | Non-income producing security. |
| ** | Rate shown is the 7-day effective yield as of September 30, 2013. |
| † | Real Estate Investment Trust. |
| †† | Investment in Affiliated Security. |
| (A) | This security or a partial position of this security is on loan at September 30, 2013. The total market value of securities on loan at September 30, 2013 was $166,618 ($ Thousands). |
| (B) | This security was purchased with cash collateral held from securities on loan. The total market value of such securities as of September 30, 2013 was $171,383 ($ Thousands). |
| (C) | Security, or portion thereof, has been pledged as collateral on open futures contracts. |
| (D) | The rate reported is the effective yield at the time of purchase. |
Cl — Class
L.P. — Limited Partnership
S&P — Standard & Poor’s
| 5 | SEI Institutional Managed Trust / Annual Report / September 30, 2013 |
Schedule of Investments
S & P 500 Index Fund
September 30, 2013
The following is a list of the level of inputs used as of September 30, 2013, in valuing the Fund’s investments and other financial instruments carried at value ($ Thousands):
| Investments in Securities | Level 1 | Level 2 | Level 3 | Total | ||||||||||||
Common Stock | $ | 2,676,456 | $ | — | $ | — | $ | 2,676,456 | ||||||||
U.S. Treasury Obligation | — | 3,110 | — | 3,110 | ||||||||||||
Affiliated Partnership | — | 171,383 | — | 171,383 | ||||||||||||
Cash Equivalent | 43,450 | — | — | 43,450 | ||||||||||||
|
|
|
|
|
|
|
| |||||||||
Total Investments in Securities | $ | 2,719,906 | $ | 174,493 | $ | — | $ | 2,894,399 | ||||||||
|
|
|
|
|
|
|
| |||||||||
Other Financial Instruments | Level 1 | Level 2 | Level 3 | Total | ||||||||||||
Futures Contracts * | ||||||||||||||||
Unrealized Appreciation | $ | — | $ | — | $ | — | $ | — | ||||||||
Unrealized Depreciation | (224 | ) | — | — | (224 | ) | ||||||||||
|
|
|
|
|
|
|
| |||||||||
Total Other Financial Instruments | $ | (224 | ) | $ | — | $ | — | $ | (224 | ) | ||||||
|
|
|
|
|
|
|
| |||||||||
| * | Futures contracts are valued at the unrealized depreciation on the instrument. |
For the year ended September 30, 2013, there were no transfers between Level 1 and Level 2 assets and liabilities.
For the year ended September 30, 2013, there were no transfers between Level 2 and Level 3 assets and liabilities.
Amounts designated as “—” are $0 or have been rounded to $0.
| 6 | SEI Institutional Managed Trust / Annual Report / September 30, 2013 |
Schedule of Investments
Small Cap Fund
September 30, 2013
| Market Value | ||||||||
Description | Shares | ($ Thousands) | ||||||
COMMON STOCK — 93.9% | ||||||||
Consumer Discretionary — 13.2% | ||||||||
Aeropostale * | 12,200 | $ | 115 | |||||
AFC Enterprises, Ser 2011-9A * | 9,000 | 392 | ||||||
American Axle & Manufacturing Holdings * | 26,726 | 527 | ||||||
ANN | 13,630 | 494 | ||||||
Arctic Cat | 8,950 | 511 | ||||||
Asbury Automotive Group | 9,891 | 526 | ||||||
Beazer Homes USA, Cl A * (A) | 38,130 | 686 | ||||||
Belo, Cl A | 4,200 | 57 | ||||||
Big 5 Sporting Goods | 17,565 | 283 | ||||||
Big Lots * | 18,095 | 671 | ||||||
Biglari Holdings * | 540 | 223 | ||||||
BJ’s Restaurants (A) | 10,141 | 291 | ||||||
Blue Nile * | 9,542 | 391 | ||||||
Bob Evans Farms (A) | 11,530 | 660 | ||||||
Body Central | 23,808 | 145 | ||||||
Boyd Gaming * | 2,400 | 34 | ||||||
Bravo Brio Restaurant Group | 21,400 | 323 | ||||||
Bright Horizons Family Solutions * | 19,352 | 693 | ||||||
Brown Shoe | 26,591 | 624 | ||||||
Brunswick | 29,298 | 1,169 | ||||||
Cabela’s | 11,530 | 727 | ||||||
Capella Education | 11,479 | 649 | ||||||
Career Education | 52,600 | 145 | ||||||
Carmike Cinemas * | 5,300 | 117 | ||||||
Carriage Services | 400 | 8 | ||||||
Cato, Cl A | 7,694 | 215 | ||||||
CEC Entertainment | 7,286 | 334 | ||||||
Childrens Place Retail Stores * | 7,840 | 454 | ||||||
Conn’s * (A) | 22,333 | 1,118 | ||||||
Cooper Tire & Rubber | 6,200 | 191 | ||||||
Core-Mark Holding, Cl A | 10,189 | 677 | ||||||
Corinthian Colleges * (A) | 34,100 | 75 | ||||||
CST Brands | 3,200 | 95 | ||||||
Dana Holding | 21,795 | 498 | ||||||
Denny’s, Cl A | 28,273 | 173 | ||||||
Destination Maternity | 6,000 | 191 | ||||||
Destination XL Group * | 34,600 | 224 | ||||||
Dex Media * (A) | 12,536 | 102 | ||||||
Dick’s Sporting Goods | 6,970 | 372 | ||||||
Dorman Products (A) | 12,280 | 608 | ||||||
Drew Industries | 2,300 | 105 | ||||||
Entravision Communications, Cl A | 43,923 | 259 | ||||||
EW Scripps, Cl A * | 5,500 | 101 | ||||||
Express * | 23,640 | 558 | ||||||
Fiesta Restaurant Group * | 3,300 | 124 | ||||||
Five Below (A) | 26,395 | 1,155 | ||||||
Francesca’s Holdings * (A) | 24,182 | 451 | ||||||
Fred’s, Cl A | 12,400 | 194 | ||||||
Fuel Systems Solutions * | 2,700 | 53 | ||||||
GameStop, Cl A (A) | 14,356 | 713 | ||||||
Genesco * | 10,040 | 658 | ||||||
G-III Apparel Group * | 2,800 | 153 | ||||||
Grand Canyon Education * | 12,151 | 489 | ||||||
Gray Television * | 16,700 | 131 | ||||||
Haverty Furniture | 5,476 | 134 | ||||||
Helen of Troy | 6,300 | 279 | ||||||
| Market Value | ||||||||
Description | Shares | ($ Thousands) | ||||||
hhgregg, Cl A * (A) | 11,300 | $ | 202 | |||||
Hibbett Sports * (A) | 11,190 | 628 | ||||||
HomeAway * (A) | 53,174 | 1,489 | ||||||
Hovnanian Enterprises, Cl A * (A) | 24,656 | 129 | ||||||
Ignite Restaurant Group * | 4,800 | 75 | ||||||
Imax * (A) | 26,004 | 786 | ||||||
Isle of Capri Casinos | 21,277 | 161 | ||||||
Jack in the Box | 17,414 | 697 | ||||||
Jones Group | 6,200 | 93 | ||||||
K12 * | 6,200 | 191 | ||||||
Krispy Kreme Doughnuts | 35,729 | 691 | ||||||
La-Z-Boy, Cl Z | 40,593 | 922 | ||||||
Libbey | 33,600 | 799 | ||||||
Life Time Fitness * (A) | 16,950 | 872 | ||||||
Live Nation | 33,170 | 615 | ||||||
LKQ * | 23,134 | 737 | ||||||
Loral Space & Communications | 6,000 | 406 | ||||||
Lumber Liquidators Holdings * | 13,684 | 1,459 | ||||||
M/I Homes | 2,000 | 41 | ||||||
Marriott Vacations Worldwide | 11,330 | 499 | ||||||
Matthews International, Cl A (A) | 7,900 | 301 | ||||||
MDC Partners, Cl A | 26,300 | 736 | ||||||
Men’s Wearhouse | 11,554 | 393 | ||||||
Meredith (A) | 24,960 | 1,189 | ||||||
Meritage Homes | 17,108 | 735 | ||||||
Modine Manufacturing * | 42,587 | 623 | ||||||
Movado Group | 11,670 | 510 | ||||||
Multimedia Games Holding * | 11,200 | 387 | ||||||
NACCO Industries, Cl A | 2,000 | 111 | ||||||
National CineMedia | 27,866 | 526 | ||||||
New York Times, Cl A | 5,900 | 74 | ||||||
Nutrisystem (A) | 14,300 | 206 | ||||||
Office Depot (A) | 4,300 | 21 | ||||||
OfficeMax | 3,000 | 38 | ||||||
Orbitz Worldwide * | 35,134 | 338 | ||||||
Orient-Express Hotels, Cl A | 7,400 | 96 | ||||||
Overstock.com * | 5,100 | 151 | ||||||
Oxford Industries, Cl A (A) | 5,180 | 352 | ||||||
Papa John’s International, Cl A | 4,800 | 335 | ||||||
Penske Auto Group, Cl A | 6,300 | 269 | ||||||
Pep Boys-Manny Moe & Jack | 25,450 | 317 | ||||||
Perry Ellis International, Cl A | 4,400 | 83 | ||||||
PetMed Express (A) | 20,900 | 340 | ||||||
Pier 1 Imports | 30,950 | 604 | ||||||
Pool | 15,130 | 849 | ||||||
ReachLocal (A) | 42,867 | 511 | ||||||
Red Robin Gourmet Burgers | 13,937 | 991 | ||||||
Restoration Hardware Holdings * | 11,105 | 704 | ||||||
Ruth’s Chris Steak House | 9,309 | 110 | ||||||
Ryland Group (A) | 15,315 | 621 | ||||||
Scholastic, Cl B | 7,600 | 218 | ||||||
Scientific Games, Cl A | 25,200 | 408 | ||||||
Shoe Carnival | 14,957 | 404 | ||||||
Shutterfly | 29,128 | 1,628 | ||||||
Six Flags Entertainment | 18,591 | 628 | ||||||
Skechers U.S.A., Cl A * | 11,500 | 358 | ||||||
Smith & Wesson Holding * (A) | 16,100 | 177 | ||||||
Sonic * | 8,600 | 153 | ||||||
Sotheby’s | 7,329 | 360 | ||||||
Standard Motor Products | 8,500 | 273 | ||||||
Steiner Leisure | 2,800 | 164 | ||||||
| 1 | SEI Institutional Managed Trust / Annual Report / September 30, 2013 |
Schedule of Investments
Small Cap Fund
September 30, 2013
| Market Value | ||||||||
Description | Shares | ($ Thousands) | ||||||
Steven Madden | 5,010 | $ | 270 | |||||
Stewart Enterprises, Cl A (A) | 8,500 | 112 | ||||||
Stoneridge * | 17,201 | 186 | ||||||
TAL Education Group ADR | 29,250 | 424 | ||||||
Tenneco * | 6,910 | 349 | ||||||
TRI Pointe Homes * (A) | 14,596 | 214 | ||||||
Vail Resorts | 9,040 | 627 | ||||||
Vitamin Shoppe | 7,946 | 348 | ||||||
Wet Seal, Cl A | 86,900 | 342 | ||||||
Winnebago Industries | 2,800 | 73 | ||||||
Wolverine World Wide (A) | 11,022 | 642 | ||||||
Zagg * (A) | 21,408 | 96 | ||||||
Zumiez (A) | 18,203 | 501 | ||||||
|
| |||||||
| 54,313 | ||||||||
|
| |||||||
Consumer Staples — 2.6% | ||||||||
Andersons | 6,600 | 461 | ||||||
Annie’s * (A) | 12,257 | 602 | ||||||
Casey’s General Stores | 8,899 | 654 | ||||||
Chefs’ Warehouse Holdings * (A) | 20,891 | 483 | ||||||
Chiquita Brands International | 59,500 | 753 | ||||||
Darling International * | 27,445 | 581 | ||||||
Dole Food | 12,600 | 172 | ||||||
Fairway Group Holdings, Cl A * (A) | 4,852 | 124 | ||||||
Fresh Del Monte Produce | 17,200 | 510 | ||||||
Fresh Market * | 13,984 | 662 | ||||||
Hain Celestial Group | 4,727 | 365 | ||||||
J&J Snack Foods | 6,405 | 517 | ||||||
Lancaster Colony | 3,400 | 266 | ||||||
Medifast (A) | 11,233 | 302 | ||||||
Pilgrim’s Pride | 19,600 | 329 | ||||||
Post Holdings * | 1,100 | 44 | ||||||
Prestige Brands Holdings, Cl A * | 10,570 | �� | 319 | |||||
Rite Aid * | 74,000 | 352 | ||||||
Sanderson Farms (A) | 2,000 | 130 | ||||||
Snyders-Lance | 16,799 | 485 | ||||||
Spartan Stores | 19,603 | 432 | ||||||
Sprouts Farmers Market * | 1,856 | 82 | ||||||
Susser Holdings (A) | 6,144 | 327 | ||||||
TreeHouse Foods | 4,844 | 324 | ||||||
Universal (A) | 8,100 | 412 | ||||||
USANA Health Sciences | 6,500 | 564 | ||||||
WhiteWave Foods, Cl A | 12,612 | 252 | ||||||
|
| |||||||
| 10,504 | ||||||||
|
| |||||||
Energy — 5.8% | ||||||||
Alberta Oilsands * | 184,500 | 23 | ||||||
Alon USA Energy | 2,100 | 21 | ||||||
Approach Resources, Cl A (A) | 34,000 | 894 | ||||||
Bill Barrett (A) | 11,400 | 286 | ||||||
Bonanza Creek Energy | 7,445 | 359 | ||||||
Bristow Group (A) | 2,200 | 160 | ||||||
Carrizo Oil & Gas | 10,359 | 387 | ||||||
Cloud Peak Energy | 1,500 | 22 | ||||||
Comstock Resources | 15,300 | 243 | ||||||
Delek US Holdings | 13,160 | 278 | ||||||
Dril-Quip * | 12,078 | 1,386 | ||||||
Emerald Oil * | 26,804 | 193 | ||||||
Energy XXI Bermuda | 14,300 | 432 | ||||||
EPL Oil & Gas * | 13,900 | 516 | ||||||
Exterran Holdings | 10,095 | 278 | ||||||
Forum Energy Technologies * (A) | 51,093 | 1,380 | ||||||
| Market Value | ||||||||
Description | Shares | ($ Thousands) | ||||||
Geospace Technologies | 5,782 | $ | 487 | |||||
Green Plains Renewable Energy | 17,000 | 273 | ||||||
Gulfmark Offshore, Cl A (A) | 15,354 | 781 | ||||||
Gulfport Energy * | 6,258 | 403 | ||||||
Halcon Resources, Cl A * (A) | 97,614 | 432 | ||||||
Helix Energy Solutions Group * | 56,380 | 1,430 | ||||||
Hercules Offshore | 4,600 | 34 | ||||||
Hornbeck Offshore Service * | 6,385 | 367 | ||||||
Kodiak Oil & Gas | 68,159 | 822 | ||||||
Laredo Petroleum Holdings * (A) | 40,699 | 1,208 | ||||||
Matador Resources (A) | 30,320 | 495 | ||||||
Matrix Service * | 7,631 | 150 | ||||||
Mitcham Industries * | 1,300 | 20 | ||||||
Newfield Exploration | 6,300 | 172 | ||||||
Newpark Resources, Cl A * | 2,500 | 32 | ||||||
Nuverra Environmental Solutions * (A) | 184,200 | 422 | ||||||
Oasis Petroleum | 39,601 | 1,946 | ||||||
Ocean Rig UDW * | 18,276 | 333 | ||||||
Oceaneering International, Cl A | 1,149 | 93 | ||||||
Oil States International * | 3,537 | 366 | ||||||
Parker Drilling * | 32,100 | 183 | ||||||
PDC Energy, Cl A * (A) | 10,624 | 633 | ||||||
Pioneer Energy Services * | 72,605 | 545 | ||||||
Quicksilver Resources * (A) | 29,400 | 58 | ||||||
Renewable Energy Group * | 5,700 | 86 | ||||||
Rosetta Resources * | 28,262 | 1,539 | ||||||
Scorpio Tankers | 88,600 | 865 | ||||||
StealthGas (A) | 38,600 | 353 | ||||||
Stone Energy, Cl A * | 2,600 | 84 | ||||||
Synergy Resources * | 13,235 | 129 | ||||||
Tesco * | 24,800 | 411 | ||||||
TETRA Technologies * | 37,555 | 470 | ||||||
Triangle Petroleum * | 29,670 | 291 | ||||||
Vaalco Energy | 43,340 | 242 | ||||||
W&T Offshore (A) | 18,500 | 328 | ||||||
Western Refining (A) | 4,300 | 129 | ||||||
Willbros Group | 31,000 | 285 | ||||||
|
| |||||||
| 23,755 | ||||||||
|
| |||||||
Financials — 19.4% | ||||||||
Acadia Realty Trust † | 17,535 | 433 | ||||||
Affiliated Managers Group * | 1,840 | 336 | ||||||
Agree Realty † | 2,900 | 87 | ||||||
Altisource Residential † | 19,221 | 442 | ||||||
Ambac Financial Group * | 2,000 | 36 | ||||||
American Assets Trust † | 13,070 | 399 | ||||||
American Campus Communities † | 11,605 | 396 | ||||||
American Capital Mortgage Investment † | 14,200 | 281 | ||||||
American Equity Investment Life Holding (A) | 47,535 | 1,009 | ||||||
Amerisafe | 1,300 | 46 | ||||||
Amtrust Financial Services (A) | 42,021 | 1,641 | ||||||
Argo Group International Holdings | 11,660 | 500 | ||||||
Arlington Asset Investment, Cl A | 8,700 | 207 | ||||||
Ashford Hospitality Trust † | 9,800 | 121 | ||||||
Associated Estates Realty † (A) | 24,610 | 367 | ||||||
Banco Latinoamericano de Exportaciones, Cl E | 10,600 | 264 | ||||||
Bancorp | 12,265 | 217 | ||||||
| 2 | SEI Institutional Managed Trust / Annual Report / September 30, 2013 |
Schedule of Investments
Small Cap Fund
September 30, 2013
| Market Value | ||||||||
Description | Shares | ($ Thousands) | ||||||
Bancorpsouth, Cl A (A) | 80,913 | $ | 1,613 | |||||
Bank of the Ozarks (A) | 21,977 | 1,055 | ||||||
Banner | 40,753 | 1,555 | ||||||
BBCN Bancorp | 10,160 | 140 | ||||||
BlackRock Kelso Capital (A) | 25,100 | 238 | ||||||
Boston Private Financial Holdings | 47,318 | 525 | ||||||
Brandywine Realty Trust † | 31,280 | 412 | ||||||
Brookline Bancorp, Cl A | 3,800 | 36 | ||||||
Campus Crest Communities † | 56,400 | 609 | ||||||
Capital Bank Financial, Cl A * | 11,493 | 252 | ||||||
Capitol Federal Financial | 20,460 | 254 | ||||||
Cardinal Financial | 5,936 | 98 | ||||||
Cedar Shopping Centers † | 15,800 | 82 | ||||||
Central Pacific Financial | 69,545 | 1,231 | ||||||
Chatham Lodging Trust † | 4,200 | 75 | ||||||
Chesapeake Lodging Trust † | 14,300 | 337 | ||||||
City Holding (A) | 3,700 | 160 | ||||||
City National | 3,420 | 228 | ||||||
CNO Financial Group | 158,150 | 2,278 | ||||||
CoBiz Financial | 44,540 | 430 | ||||||
Cohen & Steers (A) | 11,200 | 395 | ||||||
Colonial Properties Trust † | 11,330 | 255 | ||||||
Columbia Banking System (A) | 13,720 | 339 | ||||||
Community Bank System (A) | 5,400 | 184 | ||||||
Coresite Realty † | 15,245 | 517 | ||||||
Cousins Properties, Cl A † | 10,000 | 103 | ||||||
Credit Acceptance, Cl A | 1,500 | 166 | ||||||
CubeSmart † | 42,425 | 757 | ||||||
Customers Bancorp * | 8,700 | 140 | ||||||
CVB Financial | 2,100 | 28 | ||||||
CYS Investments † | 38,400 | 312 | ||||||
DiamondRock Hospitality † | 94,417 | 1,007 | ||||||
Douglas Emmett † | 9,551 | 224 | ||||||
DuPont Fabros Technology † (A) | 16,910 | 436 | ||||||
Eagle Bancorp * | 18,303 | 518 | ||||||
East West Bancorp | 16,475 | 526 | ||||||
EastGroup Properties † | 20,249 | 1,199 | ||||||
Education Realty Trust, Cl A † | 42,952 | 391 | ||||||
Employers Holdings | 21,200 | 631 | ||||||
Endurance Specialty Holdings | 7,210 | 387 | ||||||
EPR Properties, Cl A † (A) | 1,400 | 68 | ||||||
Evercore Partners, Cl A | 6,790 | 334 | ||||||
FBR * | 21,275 | 570 | ||||||
FelCor Lodging Trust † | 33,700 | 208 | ||||||
Financial Engines (A) | 12,651 | 752 | ||||||
First American Financial | 22,045 | 537 | ||||||
First BanCorp Puerto Rico | 97,535 | 554 | ||||||
First Cash Financial Services * | 672 | 39 | ||||||
First Commonwealth Financial | 90,050 | 684 | ||||||
First Financial Bancorp (A) | 17,170 | 260 | ||||||
First Financial Holdings | 7,223 | 398 | ||||||
First Horizon National (A) | 61,527 | 676 | ||||||
First Industrial Realty Trust † | 5,400 | 88 | ||||||
First Interstate Bancsystem, Cl A | 5,748 | 139 | ||||||
First Midwest Bancorp | 24,500 | 370 | ||||||
First Potomac Realty Trust † | 13,575 | 171 | ||||||
Forest City Enterprises, Cl A * | 19,205 | 364 | ||||||
Forestar Group * | 10,280 | 221 | ||||||
Fulton Financial | 57,792 | 675 | ||||||
FXCM, Cl A | 25,901 | 512 | ||||||
| Market Value | ||||||||
Description | Shares | ($ Thousands) | ||||||
Geo Group † | 21,500 | $ | 715 | |||||
Glacier Bancorp, Cl A | 21,995 | 544 | ||||||
Glimcher Realty Trust † | 52,163 | 508 | ||||||
Government Properties Income Trust, Cl A † | 14,700 | 352 | ||||||
Great American Group | 18,900 | 3 | ||||||
Hanmi Financial | 6,290 | 104 | ||||||
Hanover Insurance Group, Cl A | 21,155 | 1,170 | ||||||
HCI Group (A) | 3,200 | 131 | ||||||
Healthcare Realty Trust † | 2,200 | 51 | ||||||
Hercules Technology Growth Capital, Cl A (A) | 6,300 | 96 | ||||||
HFF, Cl A | 900 | 23 | ||||||
Highwoods Properties † | 22,158 | 782 | ||||||
Home BancShares | 2,100 | 64 | ||||||
Home Loan Servicing Solutions | 17,500 | 385 | ||||||
HomeStreet | 5,000 | 97 | ||||||
Horace Mann Educators, Cl A | 22,800 | 647 | ||||||
Hudson Pacific Properties † | 1,000 | 19 | ||||||
IBERIABANK | 17,660 | 916 | ||||||
Infinity Property & Casualty | 4,100 | 265 | ||||||
Inland Real Estate † | 33,900 | 347 | ||||||
International Bancshares | 7,600 | 164 | ||||||
Investment Technology Group | 52,387 | 824 | ||||||
Investors Real Estate Trust † | 4,500 | 37 | ||||||
Janus Capital Group (A) | 37,585 | 320 | ||||||
Jones Lang LaSalle | 5,612 | 490 | ||||||
Kennedy-Wilson Holdings (A) | 35,500 | 659 | ||||||
Kite Realty Group Trust † | 63,205 | 375 | ||||||
LaSalle Hotel Properties † | 12,100 | 345 | ||||||
Lexington Realty Trust † (A) | 89,208 | 1,002 | ||||||
LTC Properties † | 5,100 | 194 | ||||||
Mack-Cali Realty † | 17,500 | 384 | ||||||
Maiden Holdings | 63,600 | 751 | ||||||
MarketAxess Holdings | 7,092 | 426 | ||||||
MB Financial | 900 | 25 | ||||||
Meadowbrook Insurance Group | 134,300 | 873 | ||||||
Medical Properties Trust † | 68,340 | 832 | ||||||
MGIC Investment | 53,995 | 393 | ||||||
Montpelier Re Holdings | 12,800 | 334 | ||||||
National Penn Bancshares | 52,342 | 526 | ||||||
NBT Bancorp | 11,400 | 262 | ||||||
Nelnet, Cl A | 24,800 | 953 | ||||||
New Mountain Finance | 1,900 | 27 | ||||||
Northfield Bancorp | 37,050 | 450 | ||||||
NorthStar Realty Finance † | 65,640 | 609 | ||||||
Northwest Bancshares | 7,200 | 95 | ||||||
Ocwen Financial * | 10,100 | 563 | ||||||
OFG Bancorp (A) | 31,520 | 510 | ||||||
Old National Bancorp, Cl A | 40,469 | 575 | ||||||
OmniAmerican Bancorp, Cl A * | 7,800 | 191 | ||||||
Oritani Financial | 11,100 | 183 | ||||||
PacWest Bancorp (A) | 24,550 | 844 | ||||||
Parkway Properties † | 22,465 | 399 | ||||||
Pebblebrook Hotel Trust † | 35,661 | 1,024 | ||||||
PennantPark Investment | 59,402 | 669 | ||||||
Pennsylvania † | 21,660 | 405 | ||||||
Pinnacle Financial Partners | 3,800 | 113 | ||||||
Piper Jaffray * | 6,600 | 226 | ||||||
Platinum Underwriters Holdings | 10,600 | 633 | ||||||
Post Properties † | 5,975 | 269 | ||||||
| 3 | SEI Institutional Managed Trust / Annual Report / September 30, 2013 |
Schedule of Investments
Small Cap Fund
September 30, 2013
| Market Value | ||||||||
Description | Shares | ($ Thousands) | ||||||
Potlatch † | 6,377 | $ | 253 | |||||
Primerica | 6,700 | 270 | ||||||
ProAssurance | 2,617 | 118 | ||||||
Prospect Capital (A) | 23,100 | 258 | ||||||
Prosperity Bancshares (A) | 9,275 | 574 | ||||||
Provident Financial Services | 13,700 | 222 | ||||||
PS Business Parks † | 1,900 | 142 | ||||||
Radian Group (A) | 84,275 | 1,174 | ||||||
RAIT Financial Trust † | 59,070 | 418 | ||||||
Ramco-Gershenson Properties † | 26,500 | 408 | ||||||
Retail Opportunity Investments † | 2,900 | 40 | ||||||
RLI (A) | 7,461 | 652 | ||||||
RLJ Lodging Trust † | 6,100 | 143 | ||||||
Rouse Properties † (A) | 3,300 | 68 | ||||||
Sabra Health Care † | 14,300 | 329 | ||||||
Safeguard Scientifics * | 28,716 | 451 | ||||||
Select Income REIT † | 1,900 | 49 | ||||||
Selective Insurance Group | 19,435 | 476 | ||||||
Signature Bank NY, Cl B | 11,120 | 1,018 | ||||||
Silver Bay Realty Trust † | 463 | 7 | ||||||
Solar Capital | 6,100 | 135 | ||||||
STAG Industrial † | 9,600 | 193 | ||||||
Starwood Property Trust † | 18,600 | 446 | ||||||
Stewart Information Services (A) | 25,163 | 805 | ||||||
Stifel Financial * (A) | 21,228 | 875 | ||||||
Summit Hotel Properties † | 1,800 | 17 | ||||||
Sun Communities † | 8,680 | 370 | ||||||
Sunstone Hotel Investors † | 48,734 | 621 | ||||||
Susquehanna Bancshares | 110,167 | 1,383 | ||||||
SVB Financial Group, Cl B | 7,116 | 615 | ||||||
Symetra Financial | 12,300 | 219 | ||||||
Synovus Financial | 166,256 | 549 | ||||||
TCP Capital | 5,300 | 86 | ||||||
Texas Capital Bancshares * | 6,794 | 312 | ||||||
THL Credit | 22,500 | 351 | ||||||
TICC Capital (A) | 36,300 | 354 | ||||||
Titanium Asset Management PIPE (B) (C) | 6,111 | 5 | ||||||
Two Harbors Investment † | 31,000 | 301 | ||||||
UMB Financial | 500 | 27 | ||||||
United Community Banks | 30,400 | 456 | ||||||
Validus Holdings | 7,900 | 292 | ||||||
ViewPoint Financial Group | 26,800 | 554 | ||||||
Virtus Investment Partners * | 3,165 | 515 | ||||||
Waddell & Reed Financial, Cl A | 7,566 | 390 | ||||||
Washington † | 5,400 | 136 | ||||||
Webster Financial | 14,240 | 364 | ||||||
Western Alliance Bancorp | 75,287 | 1,425 | ||||||
Wilshire Bancorp | 12,300 | 101 | ||||||
Winthrop Realty Trust † | 15,700 | 175 | ||||||
WisdomTree Investments | 7,400 | 86 | ||||||
WSFS Financial | 15,565 | 938 | ||||||
|
| |||||||
| 79,864 | ||||||||
|
| |||||||
Health Care — 12.4% | ||||||||
Acadia Healthcare, Cl A * | 55,895 | 2,204 | ||||||
ACADIA Pharmaceuticals * (A) | 13,208 | 363 | ||||||
Acceleron Pharma * | 7,978 | 177 | ||||||
Accuray * (A) | 138,600 | 1,024 | ||||||
Acorda Therapeutics | 9,960 | 341 | ||||||
Addus HomeCare * | 9,833 | 285 | ||||||
Aegerion Pharmaceuticals, Cl A (A) | 5,880 | 504 | ||||||
| Market Value | ||||||||
Description | Shares | ($ Thousands) | ||||||
Akorn * (A) | 51,955 | $ | 1,022 | |||||
Alere * | 18,400 | 563 | ||||||
Align Technology (A) | 15,730 | 757 | ||||||
AMAG Pharmaceuticals * | 15,510 | 333 | ||||||
Amedisys (A) | 14,500 | 250 | ||||||
AMN Healthcare Services * | 7,900 | 109 | ||||||
Amsurg | 17,674 | 702 | ||||||
Analogic | 5,980 | 494 | ||||||
Ariad Pharmaceuticals * | 8,740 | 161 | ||||||
Array BioPharma * | 19,000 | 118 | ||||||
ArthroCare | 4,000 | 142 | ||||||
athenahealth (A) | 6,154 | 668 | ||||||
Bruker BioSciences * | 18,850 | 389 | ||||||
Cadence Pharmaceuticals * | 17,823 | 112 | ||||||
Cambrex | 5,900 | 78 | ||||||
Cantel Medical | 5,250 | 167 | ||||||
Cardiovascular Systems * | 4,100 | 82 | ||||||
Celldex Therapeutics, Cl A (A) | 12,597 | 446 | ||||||
Centene * | 10,315 | 660 | ||||||
Cepheid (A) | 4,870 | 190 | ||||||
Charles River Laboratories International * | 13,795 | 638 | ||||||
Chemed (A) | 108 | 8 | ||||||
Chimerix * | 10,661 | 234 | ||||||
Clovis Oncology * | 2,976 | 181 | ||||||
Computer Programs & Systems | 2,200 | 129 | ||||||
Conmed | 18,185 | 618 | ||||||
Coronado Biosciences * (A) | 42,937 | 301 | ||||||
Cross Country Healthcare * | 16,500 | 100 | ||||||
Cubist Pharmaceuticals | 15,027 | 955 | ||||||
Depomed * | 15,500 | 116 | ||||||
DexCom * | 21,583 | 609 | ||||||
Emergent Biosolutions * | 23,800 | 453 | ||||||
Emeritus | 24,416 | 452 | ||||||
Endocyte * (A) | 20,200 | 269 | ||||||
Endologix | 20,948 | 338 | ||||||
Ensign Group | 6,300 | 259 | ||||||
Exact Sciences | 27,281 | 322 | ||||||
ExamWorks Group (A) | 27,708 | 720 | ||||||
Five Star Quality Care * | 25,484 | 132 | ||||||
Fluidigm (A) | 26,497 | 582 | ||||||
Furiex Pharmaceuticals * | 13,233 | 582 | ||||||
GenMark Diagnostics * | 24,100 | 293 | ||||||
Gentiva Health Services | 27,400 | 330 | ||||||
Greatbatch | 15,045 | 512 | ||||||
GTx * (A) | 12,400 | 25 | ||||||
Haemonetics * | 8,784 | 350 | ||||||
Halozyme Therapeutics (A) | 38,658 | 427 | ||||||
HealthSouth | 53,020 | 1,828 | ||||||
HeartWare International * (A) | 6,550 | 480 | ||||||
Hi-Tech Pharmacal | 2,500 | 108 | ||||||
HMS Holdings * (A) | 14,770 | 318 | ||||||
Hyperion Therapeutics * (A) | 7,019 | 183 | ||||||
ICON * | 18,349 | 751 | ||||||
ICU Medical | 8,829 | 600 | ||||||
Immunogen * (A) | 5,000 | 85 | ||||||
Impax Laboratories * | 7,900 | 162 | ||||||
Imris | 66,577 | 107 | ||||||
Insmed * (A) | 18,300 | 286 | ||||||
Insulet (A) | 20,345 | 737 | ||||||
Intercept Pharmaceuticals * | 3,600 | 249 | ||||||
Intrexon * | 7,300 | 173 | ||||||
Invacare | 16,600 | 287 | ||||||
| 4 | SEI Institutional Managed Trust / Annual Report / September 30, 2013 |
Schedule of Investments
Small Cap Fund
September 30, 2013
| Market Value | ||||||||
Description | Shares | ($ Thousands) | ||||||
IPC The Hospitalist (A) | 9,137 | $ | 466 | |||||
Ironwood Pharmaceuticals, Cl A * (A) | 32,291 | 383 | ||||||
Isis Pharmaceuticals | 13,504 | 507 | ||||||
Jazz Pharmaceuticals | 7,430 | 683 | ||||||
Keryx Biopharmaceuticals * (A) | 126,147 | 1,274 | ||||||
LHC Group | 6,700 | 157 | ||||||
Magellan Health Services * | 11,716 | 702 | ||||||
Masimo | 12,660 | 337 | ||||||
Medical Action Industries * | 17,600 | 117 | ||||||
MEDNAX | 10,388 | 1,043 | ||||||
MiMedx Group * (A) | 8,000 | 33 | ||||||
Molina Healthcare * | 12,180 | 434 | ||||||
Momenta Pharmaceuticals * | 24,170 | 348 | ||||||
Natus Medical * | 17,000 | 241 | ||||||
Nektar Therapeutics | 32,462 | 339 | ||||||
Neurocrine Biosciences * | 22,200 | 251 | ||||||
NewLink Genetics (A) | 17,569 | 330 | ||||||
Novadaq Technologies * (A) | 49,485 | 821 | ||||||
NPS Pharmaceuticals | 4,002 | 127 | ||||||
NuVasive * | 1,100 | 27 | ||||||
Orexigen Therapeutics * (A) | 42,126 | 259 | ||||||
Orthofix International | 6,100 | 127 | ||||||
Pacira Pharmaceuticals * | 17,770 | 854 | ||||||
Parexel International | 23,706 | 1,191 | ||||||
PDL BioPharma (A) | 46,383 | 370 | ||||||
Pharmacyclics * | 1,760 | 244 | ||||||
PharMerica | 14,100 | 187 | ||||||
Portola Pharmaceuticals * | 2,000 | 53 | ||||||
Pozen * (A) | 14,100 | 81 | ||||||
Premier, Cl A * | 2,116 | 67 | ||||||
Providence Service * | 7,192 | 206 | ||||||
Puma Biotechnology * | 14,971 | 803 | ||||||
Repligen * | 18,593 | 206 | ||||||
Repros Therapeutics * | 7,830 | 210 | ||||||
Rigel Pharmaceuticals * | 33,200 | 119 | ||||||
Sagent Pharmaceuticals * | 16,309 | 333 | ||||||
Santarus * | 23,600 | 533 | ||||||
Sciclone Pharmaceuticals * | 26,400 | 134 | ||||||
Select Medical Holdings | 15,300 | 123 | ||||||
Sirona Dental Systems, Cl A | 7,285 | 488 | ||||||
Spectranetics | 27,362 | 459 | ||||||
STERIS, Cl A | 600 | 26 | ||||||
SurModics * | 4,500 | 107 | ||||||
Symmetry Medical * | 55,800 | 455 | ||||||
Synageva BioPharma, Cl A (A) | 3,726 | 236 | ||||||
Syneron Medical | 34,110 | 294 | ||||||
Synta Pharmaceuticals * (A) | 29,091 | 184 | ||||||
Team Health Holdings | 23,901 | 907 | ||||||
TearLab * (A) | 16,861 | 187 | ||||||
TESARO * | 13,979 | 542 | ||||||
Threshold Pharmaceuticals, Cl A * (A) | 40,380 | 188 | ||||||
Tornier BV | 17,529 | 339 | ||||||
Triple-S Management, Cl B * | 5,600 | 103 | ||||||
Unilife (A) | 126,516 | 420 | ||||||
ViroPharma | 16,520 | 649 | ||||||
Vocera Communications | 14,440 | 268 | ||||||
WellCare Health Plans | 25,251 | 1,761 | ||||||
XenoPort | 12,600 | 72 | ||||||
|
| |||||||
| 51,035 | ||||||||
|
| |||||||
| Market Value | ||||||||
Description | Shares | ($ Thousands) | ||||||
Industrials — 17.4% | ||||||||
AAON Inc. | 2,700 | $ | 72 | |||||
AAR | 25,239 | 690 | ||||||
ACCO Brands * (A) | 39,400 | 262 | ||||||
Actuant, Cl A (A) | 74,156 | 2,880 | ||||||
Acuity Brands | 8,442 | 777 | ||||||
Advisory Board | 5,201 | 309 | ||||||
Aegean Marine Petroleum Network | 19,900 | 236 | ||||||
Air Transport Services Group * | 60,000 | 450 | ||||||
Aircastle | 21,100 | 367 | ||||||
Albany International, Cl A | 6,800 | 244 | ||||||
Altra Holdings | 4,800 | 129 | ||||||
American Science & Engineering, Cl A | 1,200 | 72 | ||||||
American Woodmark * | 3,000 | 104 | ||||||
Apogee Enterprises | 9,000 | 267 | ||||||
Arkansas Best | 3,600 | 92 | ||||||
Armstrong World Industries | 7,900 | 434 | ||||||
Astronics * | 9,443 | 470 | ||||||
Atlas Air Worldwide Holdings * | 700 | 32 | ||||||
Avis Budget Group * | 10,932 | 315 | ||||||
AZZ | 1,200 | 50 | ||||||
Barnes Group | 9,035 | 315 | ||||||
Barrett Business Services | 3,060 | 206 | ||||||
Beacon Roofing Supply (A) | 27,380 | 1,010 | ||||||
Belden | 13,480 | 864 | ||||||
Brink’s | 13,800 | 390 | ||||||
Carlisle | 18,463 | 1,298 | ||||||
Chart Industries * | 10,085 | 1,241 | ||||||
CIRCOR International | 17,180 | 1,068 | ||||||
Coleman Cable | 8,778 | 185 | ||||||
Con-way | 7,390 | 319 | ||||||
Corporate Executive Board | 11,875 | 862 | ||||||
Curtiss-Wright | 14,935 | 701 | ||||||
Deluxe | 11,118 | 463 | ||||||
Diana Shipping * (A) | 35,663 | 430 | ||||||
DigitalGlobe * | 29,327 | 927 | ||||||
DXP Enterprises | 4,981 | 393 | ||||||
Dycom Industries * | 60,015 | 1,680 | ||||||
EMCOR Group | 38,314 | 1,499 | ||||||
EnerNOC * | 9,900 | 148 | ||||||
EnerSys (A) | 15,740 | 954 | ||||||
Engility Holdings | 700 | 22 | ||||||
Erickson Air-Crane * (A) | 1,400 | 22 | ||||||
Esterline Technologies * | 15,990 | 1,278 | ||||||
Exponent | 4,200 | 301 | ||||||
Flow International (A) | 46,200 | 184 | ||||||
Fortune Brands Home & Security | 13,126 | 547 | ||||||
FTI Consulting (A) | 20,580 | 778 | ||||||
G&K Services | 18,480 | 1,116 | ||||||
Generac Holdings | 22,640 | 966 | ||||||
General Cable | 17,850 | 567 | ||||||
Genesee & Wyoming, Cl A * | 13,328 | 1,239 | ||||||
Gibraltar Industries * | 10,164 | 145 | ||||||
Global Power Equipment Group | 16,900 | 340 | ||||||
Graco | 9,160 | 678 | ||||||
GrafTech International (A) | 34,100 | 288 | ||||||
Great Lakes Dredge & Dock | 81,000 | 601 | ||||||
Greenbrier * | 17,450 | 432 | ||||||
H&E Equipment Services | 12,200 | 324 | ||||||
| 5 | SEI Institutional Managed Trust / Annual Report / September 30, 2013 |
Schedule of Investments
Small Cap Fund
September 30, 2013
| Market Value | ||||||||
Description | Shares | ($ Thousands) | ||||||
HEICO (A) | 9,350 | $ | 633 | |||||
Hexcel, Cl A * | 62,413 | 2,422 | ||||||
Hyster-Yale Materials Handling | 1,500 | 134 | ||||||
ICF International, Cl A | 12,100 | 428 | ||||||
IDEX | 11,920 | 778 | ||||||
Insperity, Cl A | 6,200 | 233 | ||||||
Interface, Cl A | 52,984 | 1,051 | ||||||
JetBlue Airways * (A) | 99,500 | 663 | ||||||
John Bean Technologies, Cl A | 11,000 | 274 | ||||||
Kadant | 11,537 | 388 | ||||||
KAR Auction Services | 8,900 | 251 | ||||||
Kelly Services, Cl A | 2,900 | 56 | ||||||
Keyw Holding, Cl A * (A) | 25,581 | 344 | ||||||
Kforce | 13,600 | 241 | ||||||
Kirby * | 15,472 | 1,339 | ||||||
Korn/Ferry International | 1,300 | 28 | ||||||
Layne Christensen | 500 | 10 | ||||||
Lincoln Electric Holdings | 10,490 | 699 | ||||||
Lindsay (A) | 7,172 | 585 | ||||||
Manitowoc | 13,530 | 265 | ||||||
Marten Transport | 29,335 | 503 | ||||||
MasTec (A) | 12,210 | 370 | ||||||
Meritor * | 11,100 | 87 | ||||||
Middleby * | 7,848 | 1,640 | ||||||
Mine Safety Appliances | 2,000 | 103 | ||||||
Mistras Group | 1,100 | 19 | ||||||
Mobile Mini * | 18,343 | 625 | ||||||
Moog, Cl A * | 11,333 | 665 | ||||||
MRC Global * | 8,800 | 236 | ||||||
MSC Industrial Direct, Cl A | 5,813 | 473 | ||||||
Mueller Water Products, Cl A | 28,000 | 224 | ||||||
MYR Group * | 34,900 | 848 | ||||||
National Presto Industries | 100 | 7 | ||||||
Navigant Consulting * | 9,100 | 141 | ||||||
Northwest Pipe * | 12,010 | 395 | ||||||
Old Dominion Freight Line, Cl A | 33,880 | 1,558 | ||||||
On Assignment | 10,600 | 350 | ||||||
Orbital Sciences * | 21,010 | 445 | ||||||
Orion Marine Group | 26,200 | 272 | ||||||
Performant Financial * | 800 | 9 | ||||||
PGT * | 27,069 | 268 | ||||||
Pike Electric | 14,289 | 162 | ||||||
Pitney Bowes (A) | 5,600 | 102 | ||||||
Ply Gem Holdings * | 15,979 | 223 | ||||||
PowerSecure International * | 9,300 | 149 | ||||||
Primoris Services | 45,850 | 1,168 | ||||||
Rand Logistics * | 16,500 | 81 | ||||||
RBC Bearings | 8,120 | 535 | ||||||
Resources Connection | 6,900 | 94 | ||||||
RPX | 5,300 | 93 | ||||||
Rush Enterprises, Cl A (A) | 18,957 | 503 | ||||||
Saia | 33,227 | 1,036 | ||||||
Simpson Manufacturing (A) | 14,715 | 479 | ||||||
Skywest | 2,200 | 32 | ||||||
Spirit Airlines | 19,606 | 672 | ||||||
Standex International (A) | 6,422 | 381 | ||||||
Steelcase, Cl A | 61,673 | 1,025 | ||||||
Swift Transportation, Cl A * | 75,736 | 1,529 | ||||||
Taser International | 32,200 | 480 | ||||||
Titan Machinery * (A) | 27,500 | 442 | ||||||
TMS International, Cl A | 22,400 | 391 | ||||||
Tredegar | 1,700 | 44 | ||||||
Trex | 13,034 | 646 | ||||||
| Market Value | ||||||||
Description | Shares | ($ Thousands) | ||||||
TrueBlue * | 73,763 | $ | 1,771 | |||||
Tutor Perini | 25,600 | 546 | ||||||
United Rentals (A) | 13,910 | 811 | ||||||
US Airways Group (A) | 2,800 | 53 | ||||||
US Ecology | 18,145 | 547 | ||||||
USG (A) | 22,152 | 633 | ||||||
Valmont Industries | 4,700 | 653 | ||||||
Viad | 3,200 | 80 | ||||||
Wabash National (A) | 54,515 | 636 | ||||||
WageWorks | 9,856 | 497 | ||||||
Watsco (A) | 9,678 | 912 | ||||||
Wesco Aircraft Holdings * | 25,366 | 531 | ||||||
Woodward | 6,470 | 264 | ||||||
|
| |||||||
| 71,294 | ||||||||
|
| |||||||
Information Technology — 18.1% | ||||||||
ACI Worldwide * | 6,390 | 345 | ||||||
Actuate | 15,200 | 112 | ||||||
Acxiom * | 20,430 | 580 | ||||||
Adtran | 18,936 | 504 | ||||||
Advanced Energy Industries * | 12,600 | 221 | ||||||
Applied Micro Circuits * | 5,800 | 75 | ||||||
Arris Group * | 31,028 | 529 | ||||||
Aruba Networks | 21,470 | 357 | ||||||
Aspen Technology * | 57,485 | 1,986 | ||||||
Atmel | 54,440 | 405 | ||||||
ATMI * | 2,800 | 74 | ||||||
Audience * | 1,000 | 11 | ||||||
AVG Technologies * | 12,308 | 295 | ||||||
Benchmark Electronics | 2,500 | 57 | ||||||
Blackhawk Network Holdings, Cl A * (A) | 3,300 | 79 | ||||||
Blucora (A) | 7,800 | 179 | ||||||
BroadSoft (A) | 24,875 | 896 | ||||||
Brooks Automation | 43,830 | 408 | ||||||
Cadence Design Systems (A) | 71,202 | 961 | ||||||
CalAmp * | 4,800 | 85 | ||||||
Calix * | 21,300 | 271 | ||||||
Cardtronics | 8,780 | 326 | ||||||
Cavium (A) * | 53,918 | 2,221 | ||||||
Ceva, Cl A * | 4,300 | 74 | ||||||
Checkpoint Systems * | 1,100 | 18 | ||||||
CIBER | 124,100 | 409 | ||||||
Ciena * (A) | 59,074 | 1,476 | ||||||
Cognex | 9,680 | 304 | ||||||
CommVault Systems * | 11,842 | 1,040 | ||||||
Computer Task Group | 17,400 | 281 | ||||||
comScore * | 8,300 | 240 | ||||||
Convergys | 2,500 | 47 | ||||||
Cornerstone OnDemand (A) | 18,347 | 944 | ||||||
CoStar Group (A) | 13,164 | 2,210 | ||||||
Cray | 3,900 | 94 | ||||||
CSG Systems International | 10,100 | 253 | ||||||
Cvent * | 4,434 | 156 | ||||||
Cyan * (A) | 23,617 | 237 | ||||||
Dealertrack Technologies | 54,254 | 2,324 | ||||||
Demandware (A) | 20,910 | 969 | ||||||
Digi International | 48,700 | 487 | ||||||
Digital River * | 6,900 | 123 | ||||||
Diodes | 6,500 | 159 | ||||||
EarthLink | 87,950 | 435 | ||||||
Electronics for Imaging | 8,960 | 284 | ||||||
Ellie Mae (A) | 32,257 | 1,033 | ||||||
| 6 | SEI Institutional Managed Trust / Annual Report / September 30, 2013 |
Schedule of Investments
Small Cap Fund
September 30, 2013
| Market Value | ||||||||
Description | Shares | ($ Thousands) | ||||||
Emulex | 22,300 | $ | 173 | |||||
Entegris * | 80,510 | 817 | ||||||
Envestnet | 42,311 | 1,312 | ||||||
EPAM Systems * | 10,690 | 369 | ||||||
Exar * | 50,900 | 683 | ||||||
ExlService Holdings | 900 | 26 | ||||||
Extreme Networks | 37,700 | 197 | ||||||
Fabrinet | 8,900 | 150 | ||||||
Fairchild Semiconductor International | 69,101 | 960 | ||||||
Finisar * | 4,200 | 95 | ||||||
FireEye * | 9,182 | 381 | ||||||
FleetMatics Group | 17,252 | 648 | ||||||
FormFactor * | 27,900 | 191 | ||||||
Forrester Research | 2,996 | 110 | ||||||
Fortinet | 12,280 | 249 | ||||||
Genpact | 21,240 | 401 | ||||||
Gigamon * | 6,160 | 238 | ||||||
Global Cash Access Holdings | 31,800 | 248 | ||||||
Guidewire Software, Cl Z | 39,131 | 1,843 | ||||||
Harmonic, Cl A * | 24,000 | 185 | ||||||
Himax Technologies ADR (A) | 81,848 | 819 | ||||||
Hittite Microwave, Cl A * | 15,091 | 986 | ||||||
Hutchinson Technology * (A) | 35,050 | 122 | ||||||
Immersion * | 16,695 | 220 | ||||||
Imperva * | 10,221 | 429 | ||||||
Infinera * (A) | 99,882 | 1,130 | ||||||
Infoblox * | 38,930 | 1,628 | ||||||
Inphi | 66,907 | 899 | ||||||
Insight Enterprises * | 12,000 | 227 | ||||||
Integrated Device Technology * | 107,335 | 1,011 | ||||||
Interactive Intelligence Group * | 11,528 | 732 | ||||||
Intersil, Cl A | 60,198 | 676 | ||||||
IntraLinks Holdings, Cl A | 31,790 | 280 | ||||||
InvenSense, Cl A * (A) | 18,020 | 318 | ||||||
Lattice Semiconductor * | 6,100 | 27 | ||||||
Limelight Networks * | 50,400 | 97 | ||||||
Littelfuse | 6,150 | 481 | ||||||
LogMeIn * | 14,340 | 445 | ||||||
Manhattan Associates | 6,680 | 638 | ||||||
MAXIMUS | 14,886 | 670 | ||||||
Maxwell Technologies * | 9,900 | 90 | ||||||
Mentor Graphics | 40,943 | 957 | ||||||
Methode Electronics | 2,700 | 76 | ||||||
Micrel | 4,400 | 40 | ||||||
Model N * (A) | 19,253 | 191 | ||||||
Monotype Imaging Holdings | 5,900 | 169 | ||||||
Move | 21,800 | 370 | ||||||
MTS Systems, Cl A | 800 | 51 | ||||||
Netscout Systems * | 900 | 23 | ||||||
NQ Mobile ADR * (A) | 19,956 | 435 | ||||||
OpenTable * (A) | 3,316 | 232 | ||||||
OSI Systems * | 16,533 | 1,231 | ||||||
Palo Alto Networks | 8,810 | 404 | ||||||
Pandora Media (A) | 24,590 | 618 | ||||||
Photronics * | 66,344 | 520 | ||||||
Plantronics | 4,300 | 198 | ||||||
Plexus * | 14,542 | 541 | ||||||
Power Integrations | 10,714 | 580 | ||||||
PRGX Global * | 62,100 | 389 | ||||||
Progress Software | 15,152 | 392 | ||||||
| Market Value | ||||||||
Description | Shares | ($ Thousands) | ||||||
Proofpoint * | 1,300 | $ | 42 | |||||
PROS Holdings * | 2,400 | 82 | ||||||
PTC * | 59,265 | 1,685 | ||||||
QLIK Technologies | 7,600 | 260 | ||||||
QLogic | 9,800 | 107 | ||||||
Quantum * (A) | 29,400 | 41 | ||||||
Rally Software Development * | 17,312 | 519 | ||||||
RDA Microelectronics ADR * | 13,100 | 200 | ||||||
Responsys | 50,109 | 827 | ||||||
Rosetta Stone * | 4,100 | 67 | ||||||
Ruckus Wireless | 27,296 | 459 | ||||||
Saba Software | 49,600 | 501 | ||||||
Sanmina * | 39,438 | 690 | ||||||
Sapient * | 1,200 | 19 | ||||||
Silicon Graphics International * | 11,445 | 186 | ||||||
Silicon Image * | 33,100 | 177 | ||||||
Silicon Laboratories | 6,540 | 279 | ||||||
Sonus Networks | 135,063 | 457 | ||||||
Spansion, Cl A * | 9,200 | 93 | ||||||
Splunk | 9,457 | 568 | ||||||
SPS Commerce | 11,673 | 781 | ||||||
SS&C Technologies Holdings * | 18,533 | 706 | ||||||
Stamps.com * | 7,455 | 342 | ||||||
Sykes Enterprises * | 6,400 | 115 | ||||||
Synaptics | 14,280 | 632 | ||||||
SYNNEX * | 6,921 | 425 | ||||||
Tableau Software, Cl A * | 6,113 | 436 | ||||||
TeleTech Holdings | 2,700 | 68 | ||||||
Tellabs, Cl A | 87,400 | 198 | ||||||
Teradyne (A) | 50,815 | 839 | ||||||
Textura * | 13,463 | 580 | ||||||
Tivo * | 7,400 | 92 | ||||||
Travelzoo | 700 | 19 | ||||||
Tremor Video * | 54,608 | 504 | ||||||
TriQuint Semiconductor (A) | 44,220 | 360 | ||||||
Trulia (A) | 28,084 | 1,321 | ||||||
Tyler Technologies | 2,400 | 210 | ||||||
Ubiquiti Networks | 1,200 | 40 | ||||||
Ultimate Software Group * | 8,754 | 1,290 | ||||||
Ultra Clean Holdings | 31,771 | 220 | ||||||
Ultratech * | 21,500 | 651 | ||||||
Unisys | 5,500 | 139 | ||||||
United Online | 51,800 | 413 | ||||||
Valueclick | 6,000 | 125 | ||||||
Veeco Instruments (A) | 12,816 | 477 | ||||||
Verint Systems * | 8,780 | 325 | ||||||
Virtusa | 2,100 | 61 | ||||||
Vishay Intertechnology (A) | 35,115 | 453 | ||||||
Vocus * | 7,815 | 73 | ||||||
Volterra Semiconductor | 5,300 | 122 | ||||||
WEX | 10,055 | 882 | ||||||
Yelp, Cl A | 12,222 | 809 | ||||||
|
| |||||||
| 74,159 | ||||||||
|
| |||||||
Materials — 3.1% | ||||||||
AEP Industries, Ser 2012-11A * | 500 | 37 | ||||||
Alpha Natural Resources * (A) | 22,100 | 132 | ||||||
AM Castle * | 6,300 | 101 | ||||||
Boise | 21,200 | 267 | ||||||
Century Aluminum | 13,315 | 107 | ||||||
Chemtura * | 19,615 | 451 | ||||||
Ferro | 19,100 | 174 | ||||||
| 7 | SEI Institutional Managed Trust / Annual Report / September 30, 2013 |
Schedule of Investments
Small Cap Fund
September 30, 2013
| Market Value | ||||||||
Description | Shares | ($ Thousands) | ||||||
Flotek Industries * | 11,430 | $ | 263 | |||||
FutureFuel | 5,700 | 102 | ||||||
Glatfelter | 1,700 | 46 | ||||||
Globe Specialty Metals | 21,600 | 333 | ||||||
GSE Holding (A) | 47,400 | 99 | ||||||
H.B. Fuller | 30,383 | 1,373 | ||||||
Haynes International | 1,800 | 82 | ||||||
Headwaters, Cl A * | 6,100 | 55 | ||||||
Innospec | 7,800 | 364 | ||||||
Kaiser Aluminum | 8,523 | 607 | ||||||
KapStone Paper and Packaging | 12,698 | 543 | ||||||
Koppers Holdings | 1,500 | 64 | ||||||
LSB Industries * | 15,100 | 506 | ||||||
Materion | 2,100 | 67 | ||||||
Minerals Technologies | 19,647 | 970 | ||||||
Noranda Aluminum Holding | 32,600 | 80 | ||||||
PolyOne | 84,478 | 2,594 | ||||||
Quaker Chemical | 7,971 | 582 | ||||||
RTI International Metals (A) | 22,623 | 725 | ||||||
Schulman A | 8,100 | 239 | ||||||
Sensient Technologies | 12,480 | 598 | ||||||
Shutterstock, Inc. | 1,884 | 137 | ||||||
Silgan Holdings | 8,504 | 400 | ||||||
SunCoke Energy * | 1,500 | 26 | ||||||
Worthington Industries | 19,390 | 668 | ||||||
|
| |||||||
| 12,792 | ||||||||
|
| |||||||
Telecommunication Services — 0.2% | ||||||||
8x8 Inc. * | 3,200 | 32 | ||||||
Boingo Wireless * (A) | 38,540 | 270 | ||||||
IDT, Cl B | 4,900 | 87 | ||||||
magicJack VocalTec * | 5,700 | 73 | ||||||
NTELOS Holdings | 3,300 | 62 | ||||||
Premiere Global Services * | 4,000 | 40 | ||||||
RingCentral, Cl A * | 6,470 | 117 | ||||||
Vonage Holdings | 30,200 | 95 | ||||||
|
| |||||||
| 776 | ||||||||
|
| |||||||
Utilities — 1.8% | ||||||||
ALLETE | 15,645 | 756 | ||||||
American States Water | 8,600 | 237 | ||||||
Cadiz * (A) | 40,300 | 206 | ||||||
Cleco | 9,475 | 425 | ||||||
El Paso Electric, Cl A | 12,947 | 433 | ||||||
Empire District Electric | 11,100 | 240 | ||||||
NorthWestern | 15,370 | 690 | ||||||
Otter Tail | 4,600 | 127 | ||||||
Piedmont Natural Gas (A) | 11,000 | 362 | ||||||
PNM Resources | 40,439 | 915 | ||||||
Portland General Electric | 4,900 | 138 | ||||||
South Jersey Industries, Cl A | 7,280 | 426 | ||||||
Southwest Gas | 8,829 | 441 | ||||||
UIL Holdings (A) | 28,005 | 1,041 | ||||||
Vectren | 11,891 | 397 | ||||||
WGL Holdings | 10,226 | 437 | ||||||
|
| |||||||
| 7,271 | ||||||||
|
| |||||||
Total Common Stock | 385,763 | |||||||
|
| |||||||
EXCHANGE TRADED FUNDS — 1.0% |
| |||||||
iShares Russell 2000 Growth Index Fund (A) | 13,560 | 1,706 | ||||||
|
| |||||||
Description | Shares/Face Amount ($ Thousands) | Market Value ($ Thousands) | ||||||
iShares Russell 2000 Value Index Fund (A) | 24,700 | $ | 2,264 | |||||
|
|
|
| |||||
Total Exchange Traded Funds | 3,970 | |||||||
|
| |||||||
| Number of | ||||||||
| Warrants | ||||||||
WARRANTS — 0.0% | ||||||||
Magnum Hunter Resources Expires 08/29/14 * | 12,911 | — | ||||||
|
| |||||||
Total Warrants | — | |||||||
|
| |||||||
| Number of | ||||||||
| Rights | ||||||||
RIGHTS — 0.0% | ||||||||
Allos Therapeutics | 45,500 | — | ||||||
|
| |||||||
Total Rights | — | |||||||
|
| |||||||
AFFILIATED PARTNERSHIP — 17.2% |
| |||||||
SEI Liquidity Fund, L.P. 0.100%**†† (D) | 70,638,797 | 70,639 | ||||||
|
| |||||||
Total Affiliated Partnership | 70,639 | |||||||
|
| |||||||
CASH EQUIVALENT — 5.4% | ||||||||
SEI Daily Income Trust, Prime Obligation Fund, Cl A 0.010%**†† | 22,089,403 | 22,089 | ||||||
|
| |||||||
Total Cash Equivalent | 22,089 | |||||||
|
| |||||||
U.S. TREASURY OBLIGATIONS (E) (F) — 0.2% | ||||||||
U.S. Treasury Bills | ||||||||
0.040%, 01/09/14 | $ | 766 | 766 | |||||
0.075%, 02/06/14 | 208 | 208 | ||||||
|
| |||||||
Total U.S. Treasury Obligations | 974 | |||||||
|
| |||||||
Total Investments — 117.7% | $ | 483,435 | ||||||
|
| |||||||
A list of the open futures contracts held by the Fund at September 30, 2013, is as follows:
| Unrealized | ||||||||||||
| Type of | Number Of | Expiration | Appreciation | |||||||||
Contract | Contracts | Date | ($ Thousands) | |||||||||
Russell 2000 Index E-MINI | 132 | Dec-2013 | $ | 225 | ||||||||
For the year ended September 30, 2013, the total amount of all open futures contracts, as presented in the table above, are representative of the volume of activity for this derivative type during the period.
Percentages are based on Net Assets of $410,780 ($Thousands).
| * | Non-income producing security. |
| ** | Rate shown is the 7-day effective yield as of September 30, 2013. |
| † | Real Estate Investment Trust. |
| †† | Investment in Affiliated Security. |
| 8 | SEI Institutional Managed Trust / Annual Report / September 30, 2013 |
Schedule of Investments
Small Cap Fund
September 30, 2013
| (A) | This Security or a partial position of this security is on loan at September 30, 2013. The total market value of securities on loan at September 30, 2013 was $68,514 ($ Thousands). |
| (B) | Securities considered illiquid and restricted. The total market value of such securities as of September 30, 2013 was $5 ($Thousands) and represented 0.00% of Net Assets. |
| (C) | Security fair valued using methods determined in good faith by the Valuation Committee of the Board of Trustees. The total market value of such securities as of September 30, 2013 was $5 ($ Thousands) and represented 0.00% of Net Assets. |
| (D) | This security was purchased with cash collateral held from securities on loan. The total market value of such securities as of September 30, 2013 was $70,639 ($ Thousands). |
| (E) | Security, or portion thereof, has been pledged as collateral on open futures contracts. |
| (F) | The rate reported is the effective yield at the time of purchase. |
ADR — American Depositary Receipt
Cl — Class
L.P. — Limited Partnership
PIPE — Private Investment in Public Entity
The following is a list of the level of inputs used as of September 30, 2013, in valuing the Fund’s investments and other financial instruments carried at value ($ Thousands):
| Investments in Securities | Level 1 | Level 2 | Level 3(1) | Total | ||||||||||||
Common Stock | $ | 385,758 | $ | — | $ | 5 | $ | 385,763 | ||||||||
Exchange Traded Funds | 3,970 | — | — | 3,970 | ||||||||||||
Right | — | — | — | — | ||||||||||||
Warrant | — | — | — | — | ||||||||||||
U.S. Treasury Obligations | — | 974 | — | 974 | ||||||||||||
Affiliated Partnership | — | 70,639 | — | 70,639 | ||||||||||||
Cash Equivalent | 22,089 | — | — | 22,089 | ||||||||||||
|
|
|
|
|
|
|
| |||||||||
Total Investments in Securities | $ | 411,817 | $ | 71,613 | $ | 5 | $ | 483,435 | ||||||||
|
|
|
|
|
|
|
| |||||||||
Other Financial Instruments | Level 1 | Level 2 | Level 3 | Total | ||||||||||||
Futures Contracts * | ||||||||||||||||
Unrealized Appreciation | $ | 225 | $ | — | $ | — | $ | 225 | ||||||||
|
|
|
|
|
|
|
| |||||||||
Total Other Financial Instruments | $ | 225 | $ | — | $ | — | $ | 225 | ||||||||
|
|
|
|
|
|
|
| |||||||||
| * | Futures contracts are valued at the unrealized appreciation on the instrument. |
| (1) | A reconciliation of Level 3 investments is presented when the Fund has a significant amount of Level 3 investments at the beginning and/or end of the period in relation to the net assets. |
For the year ended September 30, 2013, there were no transfers between Level 1 and Level 2 assets and liabilities.
For the year ended September 30, 2013, there were no transfers between Level 2 and Level 3 assets and liabilities.
Amounts designated as “—” are $0 or has been rounded to $0.
| 9 | SEI Institutional Managed Trust / Annual Report / September 30, 2013 |
Schedule of Investments
Small Cap Value Fund
September 30, 2013
| Market Value | ||||||||
Description | Shares | ($ Thousands) | ||||||
COMMON STOCK — 93.7% ‡ | ||||||||
Consumer Discretionary — 8.7% | ||||||||
Aeropostale * | 23,700 | $ | 223 | |||||
AFC Enterprises, Ser 2011-9A * | 5,540 | 241 | ||||||
American Eagle Outfitters | 32,607 | 456 | ||||||
ANN | 16,116 | 584 | ||||||
Arctic Cat | 8,353 | 477 | ||||||
Big 5 Sporting Goods | 14,100 | 227 | ||||||
Big Lots * | 36,479 | 1,353 | ||||||
Bravo Brio Restaurant Group | 17,200 | 260 | ||||||
Callaway Golf (A) | 44,402 | 316 | ||||||
Cato, Cl A | 12,400 | 347 | ||||||
CEC Entertainment | 14,600 | 669 | ||||||
Childrens Place Retail Stores * | 8,260 | 478 | ||||||
Columbia Sportswear (A) | 3,038 | 183 | ||||||
Core-Mark Holding, Cl A | 4,773 | 317 | ||||||
CSS Industries | 24,100 | 579 | ||||||
CST Brands (A) | 6,500 | 194 | ||||||
Dana Holding | 48,160 | 1,100 | ||||||
Destination XL Group * | 67,200 | 435 | ||||||
DreamWorks Animation SKG, Cl A (A) | 49,600 | 1,412 | ||||||
Ethan Allen Interiors (A) | 11,672 | 325 | ||||||
Express * | 15,054 | 355 | ||||||
Genesco * | 6,665 | 437 | ||||||
Ignite Restaurant Group * | 10,100 | 157 | ||||||
JAKKS Pacific (A) | 24,100 | 108 | ||||||
Jones Group | 12,800 | 192 | ||||||
JOS A Bank Clothiers * (A) | 16,700 | 734 | ||||||
Journal Communications, Cl A | 74,900 | 640 | ||||||
K12 * | 12,100 | 374 | ||||||
Krispy Kreme Doughnuts | 34,021 | 658 | ||||||
Libbey | 65,200 | 1,550 | ||||||
Life Time Fitness * (A) | 11,235 | 578 | ||||||
Matthews International, Cl A (A) | 42,506 | 1,618 | ||||||
MDC Partners, Cl A | 47,500 | 1,329 | ||||||
Men’s Wearhouse | 25,884 | 881 | ||||||
Meredith | 20,080 | 956 | ||||||
Meritage Homes | 3,040 | 131 | ||||||
Movado Group | 7,030 | 308 | ||||||
NACCO Industries, Cl A | 6,900 | 382 | ||||||
Outerwall * (A) | 24,700 | 1,235 | ||||||
Oxford Industries, Cl A (A) | 10,375 | 705 | ||||||
Pep Boys-Manny Moe & Jack | 29,025 | 362 | ||||||
Pier 1 Imports | 32,130 | 627 | ||||||
Pool | 5,460 | 306 | ||||||
Regis (A) | 42,493 | 624 | ||||||
Remy International, Inc. * | 9,700 | 196 | ||||||
Rent-A-Center (A) | 56,200 | 2,141 | ||||||
Scholastic, Cl B | 22,200 | 636 | ||||||
Scientific Games, Cl A | 18,656 | 302 | ||||||
Select Comfort * | 11,629 | 283 | ||||||
Skechers U.S.A., Cl A * | 18,600 | 579 | ||||||
Smith & Wesson Holding * (A) | 22,700 | 250 | ||||||
Stage Stores (A) | 21,300 | 409 | ||||||
Standard Motor Products | 17,300 | 557 | ||||||
Steven Madden | 4,480 | 241 | ||||||
Tenneco * | 6,180 | 312 | ||||||
Universal Electronics | 11,600 | 418 | ||||||
Vail Resorts | 9,350 | 649 | ||||||
Valassis Communications (A) | 15,400 | 445 | ||||||
| Market Value | ||||||||
Description | Shares | ($ Thousands) | ||||||
Vera Bradley (A) | 24,206 | $ | 498 | |||||
WMS Industries | 43,200 | 1,121 | ||||||
|
| |||||||
| 34,460 | ||||||||
|
| |||||||
Consumer Staples — 2.8% | ||||||||
Casey’s General Stores | 4,448 | 327 | ||||||
Central Garden and Pet, Cl A * | 12,983 | 89 | ||||||
Chiquita Brands International | 59,100 | 748 | ||||||
Cott | 43,800 | 337 | ||||||
Darling International * | 73,144 | 1,548 | ||||||
Dole Food | 25,300 | 344 | ||||||
Fresh Del Monte Produce | 19,500 | 579 | ||||||
Ingles Markets, Cl A | 28,600 | 822 | ||||||
Ingredion | 5,213 | 345 | ||||||
J&J Snack Foods | 5,595 | 452 | ||||||
Nash Finch | 10,700 | 283 | ||||||
Pantry | 21,052 | 233 | ||||||
Prestige Brands Holdings, Cl A * | 13,964 | 421 | ||||||
Roundy’s | 20,700 | 178 | ||||||
Snyders-Lance | 17,836 | 514 | ||||||
Spartan Stores | 42,755 | 943 | ||||||
Susser Holdings | 3,806 | 202 | ||||||
TreeHouse Foods | 5,525 | 369 | ||||||
Universal (A) | 27,900 | 1,421 | ||||||
USANA Health Sciences | 6,400 | 555 | ||||||
Weis Markets | 4,700 | 230 | ||||||
|
| |||||||
| 10,940 | ||||||||
|
| |||||||
Energy — 6.8% | ||||||||
Alon USA Energy (A) | 34,200 | 349 | ||||||
Approach Resources, Cl A (A) | 66,100 | 1,737 | ||||||
Bill Barrett (A) | 22,300 | 560 | ||||||
Bonanza Creek Energy | 7,465 | 360 | ||||||
C&J Energy Services * | 17,200 | 345 | ||||||
Cloud Peak Energy | 64,100 | 940 | ||||||
Comstock Resources | 54,400 | 866 | ||||||
Delek US Holdings | 16,600 | 350 | ||||||
EPL Oil & Gas * | 18,600 | 690 | ||||||
Era Group * | 7,721 | 210 | ||||||
Exterran Holdings | 11,515 | 318 | ||||||
Forum Energy Technologies * (A) | 8,710 | 235 | ||||||
Goodrich Petroleum | 12,303 | 299 | ||||||
Gulfmark Offshore, Cl A (A) | 40,982 | 2,086 | ||||||
Gulfport Energy * | 7,136 | 459 | ||||||
Halcon Resources, Cl A * (A) | 35,970 | 159 | ||||||
Helix Energy Solutions Group * | 33,120 | 840 | ||||||
Key Energy Services | 144,761 | 1,055 | ||||||
McDermott International * | 40,479 | 301 | ||||||
Newfield Exploration | 12,200 | 334 | ||||||
Newpark Resources, Cl A * (A) | 49,000 | 620 | ||||||
Nuverra Environmental Solutions * (A) | 358,000 | 820 | ||||||
Oasis Petroleum | 14,767 | 726 | ||||||
Parker Drilling * | 195,300 | 1,113 | ||||||
REX American Resources * | 9,900 | 304 | ||||||
Rosetta Resources * | 12,655 | 689 | ||||||
Scorpio Tankers (A) | 164,600 | 1,607 | ||||||
SEACOR Holdings, Cl A | 4,400 | 398 | ||||||
StealthGas | 74,900 | 685 | ||||||
Superior Energy Services | 15,900 | 398 | ||||||
Swift Energy, Cl A (A) | 22,401 | 256 | ||||||
Tesco * | 11,900 | 197 | ||||||
TETRA Technologies * | 42,835 | 537 | ||||||
| 1 | SEI Institutional Managed Trust / Annual Report / September 30, 2013 |
Schedule of Investments
Small Cap Value Fund
September 30, 2013
| Market Value | ||||||||
Description | Shares | ($ Thousands) | ||||||
TGC Industries | 26,435 | $ | 209 | |||||
Tidewater, Cl A | 19,600 | 1,162 | ||||||
Triangle Petroleum * | 37,500 | 368 | ||||||
Unit | 22,100 | 1,027 | ||||||
USEC * (A) | 5,392 | 57 | ||||||
W&T Offshore (A) | 50,400 | 893 | ||||||
Western Refining (A) | 21,900 | 658 | ||||||
World Fuel Services (A) | 46,855 | 1,748 | ||||||
|
| |||||||
| 26,965 | ||||||||
|
| |||||||
Financials — 33.9% | ||||||||
1st Source | 28,100 | 756 | ||||||
Acadia Realty Trust † | 20,000 | 494 | ||||||
Access National | 3,100 | 44 | ||||||
Agree Realty † | 8,280 | 250 | ||||||
Alexandria Real Estate Equities † | 4,550 | 291 | ||||||
Allied World Assurance Holdings | 5,300 | 527 | ||||||
American Assets Trust † | 14,910 | 455 | ||||||
American Campus Communities † | 13,235 | 452 | ||||||
American Capital Mortgage Investment † | 27,600 | 545 | ||||||
American Equity Investment Life Holding (A) | 86,600 | 1,838 | ||||||
American National Bankshares | 1,850 | 43 | ||||||
Ameris Bancorp (A) | 6,144 | 113 | ||||||
Amtrust Financial Services (A) | 7,630 | 298 | ||||||
Anworth Mortgage Asset † | 158,800 | 767 | ||||||
Apartment Investment & Management, Cl A † | 24,515 | 685 | ||||||
Ashford Hospitality Trust † | 46,300 | 571 | ||||||
Aspen Insurance Holdings | 9,700 | 352 | ||||||
Associated Estates Realty † (A) | 15,730 | 235 | ||||||
Astoria Financial | 800 | 10 | ||||||
AvalonBay Communities † (A) | 6,319 | 803 | ||||||
Bancfirst | 2,300 | 124 | ||||||
Banco Latinoamericano de Exportaciones, Cl E | 32,700 | 815 | ||||||
Bancorp | 4,750 | 84 | ||||||
Bancorpsouth, Cl A (A) | 86,800 | 1,731 | ||||||
Bank Mutual | 12,400 | 78 | ||||||
Bank of Kentucky Financial | 1,050 | 29 | ||||||
Bank of Marin Bancorp | 1,950 | 81 | ||||||
Bank of the Ozarks (A) | 14,965 | 718 | ||||||
BankFinancial | 3,450 | 31 | ||||||
BankUnited | 24,184 | 754 | ||||||
Banner | 22,255 | 849 | ||||||
Bar Harbor Bankshares | 550 | 20 | ||||||
BBCN Bancorp | 32,390 | 446 | ||||||
Beneficial Mutual Bancorp | 2,350 | 23 | ||||||
Berkshire Hills Bancorp | 26,900 | 675 | ||||||
BioMed Realty Trust † (A) | 26,650 | 495 | ||||||
BlackRock Kelso Capital (A) | 52,500 | 498 | ||||||
BNC Bancorp | 5,100 | 68 | ||||||
Boston Private Financial Holdings (A) | 75,889 | 842 | ||||||
Boston Properties † | 4,835 | 517 | ||||||
Brandywine Realty Trust † | 71,540 | 943 | ||||||
Bridge Capital Holdings * | 750 | 13 | ||||||
Bryn Mawr Bank (A) | 2,750 | 74 | ||||||
C&F Financial | 2,450 | 119 | ||||||
Camden National | 13,550 | 554 | ||||||
Campus Crest Communities † | 115,137 | 1,243 | ||||||
| Market Value | ||||||||
Description | Shares | ($ Thousands) | ||||||
Capital Bank Financial, Cl A * | 11,720 | $ | 257 | |||||
Capital City Bank Group (A) | 2,250 | 26 | ||||||
Capitol Federal Financial | 29,810 | 371 | ||||||
CapLease † | 6,600 | 56 | ||||||
Capstead Mortgage † | 27,400 | 323 | ||||||
Cardinal Financial | 11,567 | 191 | ||||||
Cathay General Bancorp | 19,500 | 456 | ||||||
CBL & Associates Properties † | 29,986 | 573 | ||||||
Center Bancorp, Cl A | 2,100 | 30 | ||||||
Centerstate Banks | 4,800 | 46 | ||||||
Central Pacific Financial | 78,650 | 1,392 | ||||||
Chemical Financial | 5,700 | 159 | ||||||
Chemung Financial | 300 | 10 | ||||||
Citizens & Northern | 2,050 | 41 | ||||||
City Holding (A) | 4,100 | 177 | ||||||
CNB Financial | 1,500 | 26 | ||||||
CNO Financial Group | 237,900 | 3,426 | ||||||
CoBiz Financial | 52,550 | 508 | ||||||
Colonial Properties Trust † | 16,338 | 367 | ||||||
Columbia Banking System (A) | 14,450 | 357 | ||||||
CommonWealth † | 18,100 | 397 | ||||||
Community Bank System (A) | 7,950 | 271 | ||||||
Community Trust Bancorp | 14,000 | 568 | ||||||
ConnectOne Bancorp * | 500 | 18 | ||||||
Coresite Realty † | 10,770 | 366 | ||||||
Customers Bancorp * | 16,900 | 272 | ||||||
CVB Financial | 13,150 | 178 | ||||||
CYS Investments † (A) | 146,600 | 1,192 | ||||||
DDR † (A) | 14,150 | 222 | ||||||
DiamondRock Hospitality † | 35,370 | 377 | ||||||
Dime Community Bancshares | 25,300 | 421 | ||||||
Douglas Emmett † | 13,600 | 319 | ||||||
Duke Realty † | 14,050 | 217 | ||||||
DuPont Fabros Technology † (A) | 34,010 | 876 | ||||||
Dynex Capital † | 49,200 | 432 | ||||||
Eagle Bancorp * | 44,452 | 1,258 | ||||||
East West Bancorp | 18,790 | 600 | ||||||
EastGroup Properties † | 9,140 | 541 | ||||||
Education Realty Trust, Cl A † | 85,216 | 775 | ||||||
Employers Holdings | 55,611 | 1,654 | ||||||
Endurance Specialty Holdings | 26,207 | 1,408 | ||||||
Enterprise Bancorp | 1,200 | 23 | ||||||
Enterprise Financial Services | 4,400 | 74 | ||||||
Equity One, Cl A † (A) | 20,080 | 439 | ||||||
Equity Residential † | 22,400 | 1,200 | ||||||
ESSA Bancorp | 2,900 | 30 | ||||||
Essex Property Trust † | 1,400 | 207 | ||||||
EverBank Financial, Cl A | 2,700 | 40 | ||||||
Evercore Partners, Cl A | 5,080 | 250 | ||||||
Extra Space Storage † | 3,200 | 146 | ||||||
Ezcorp, Cl A * | 11,400 | 192 | ||||||
Farmers Capital Bank * | 3,000 | 66 | ||||||
FBR * | 41,300 | 1,108 | ||||||
Federal Agricultural Mortgage, Cl C | 7,400 | 247 | ||||||
Federal Realty Investment Trust † | 1,600 | 162 | ||||||
Federated Investors, Cl B (A) | 13,245 | 360 | ||||||
FelCor Lodging Trust † | 65,400 | 403 | ||||||
Fidelity Southern | 6,656 | 102 | ||||||
Financial Institutions | 2,650 | 54 | ||||||
First Bancorp | 4,700 | 68 | ||||||
| 2 | SEI Institutional Managed Trust / Annual Report / September 30, 2013 |
Schedule of Investments
Small Cap Value Fund
September 30, 2013
| Market Value | ||||||||
Description | Shares | ($ Thousands) | ||||||
First BanCorp Puerto Rico | 34,200 | $ | 194 | |||||
First Busey | 12,900 | 67 | ||||||
First Community Bancshares (A) | 25,445 | 416 | ||||||
First Defiance Financial | 2,750 | 64 | ||||||
First Financial | 3,200 | 101 | ||||||
First Financial Bancorp (A) | 18,800 | 285 | ||||||
First Financial Holdings (A) | 6,566 | 362 | ||||||
First Horizon National (A) | 46,836 | 515 | ||||||
First Interstate Bancsystem, Cl A | 9,400 | 227 | ||||||
First Merchants | 25,500 | 442 | ||||||
First Midwest Bancorp | 103,121 | 1,558 | ||||||
First NBC Bank Holding * | 14,622 | 356 | ||||||
FirstMerit, Cl A | 17,655 | 383 | ||||||
Flagstar Bancorp * | 13,300 | 196 | ||||||
Flushing Financial | 53,925 | 995 | ||||||
FNB (Pennsylvania) | 24,650 | 299 | ||||||
Forest City Enterprises, Cl A * | 21,905 | 415 | ||||||
Forestar Group * | 11,725 | 252 | ||||||
Fulton Financial | 57,780 | 675 | ||||||
FXCM, Cl A | 34,225 | 676 | ||||||
General Growth Properties † | 34,082 | 657 | ||||||
Geo Group † | 34,200 | 1,137 | ||||||
Glacier Bancorp, Cl A (A) | 29,185 | 721 | ||||||
Glimcher Realty Trust † | 27,900 | 272 | ||||||
Government Properties Income Trust, Cl A † | 15,200 | 364 | ||||||
Great American Group | 41,600 | 6 | ||||||
Great Southern Bancorp | 2,900 | 82 | ||||||
Hancock Holding, Cl A | 39,043 | 1,225 | ||||||
Hanmi Financial | 14,900 | 247 | ||||||
Hanover Insurance Group, Cl A | 39,048 | 2,160 | ||||||
Hatteras Financial † | 69,800 | 1,306 | ||||||
HCP † | 22,962 | 940 | ||||||
Health Care † | 11,400 | 711 | ||||||
Heartland Financial USA | 2,650 | 74 | ||||||
Heritage Commerce | 3,050 | 23 | ||||||
Heritage Financial | 2,200 | 34 | ||||||
Heritage Oaks Bancorp | 2,550 | 16 | ||||||
Highwoods Properties † (A) | 24,415 | 862 | ||||||
Home Bancorp * | 1,200 | 22 | ||||||
Home BancShares | 11,700 | 355 | ||||||
Home Federal Bancorp | 3,050 | 38 | ||||||
Home Loan Servicing Solutions | 49,150 | 1,082 | ||||||
Horace Mann Educators, Cl A | 48,591 | 1,379 | ||||||
Horizon Bancorp | 2,675 | 62 | ||||||
Hospitality Properties Trust † | 12,900 | 365 | ||||||
Host Hotels & Resorts † | 37,306 | 659 | ||||||
Hudson Valley Holding | 4,366 | 82 | ||||||
IBERIABANK | 15,727 | 816 | ||||||
Infinity Property & Casualty | 8,740 | 565 | ||||||
Inland Real Estate † | 45,400 | 464 | ||||||
International Bancshares (A) | 29,455 | 637 | ||||||
Intervest Bancshares * | 5,950 | 47 | ||||||
Investors Bancorp, Cl A | 18,293 | 400 | ||||||
Janus Capital Group (A) | 68,300 | 581 | ||||||
Kennedy-Wilson Holdings | 69,000 | 1,281 | ||||||
Kilroy Realty † | 2,700 | 135 | ||||||
Kimco Realty † | 15,850 | 320 | ||||||
Lakeland Bancorp | 3,971 | 45 | ||||||
Lakeland Financial | 5,500 | 180 | ||||||
LaSalle Hotel Properties † | 13,800 | 394 | ||||||
| Market Value | ||||||||
Description | Shares | ($ Thousands) | ||||||
Lexington Realty Trust † (A) | 120,941 | $ | 1,358 | |||||
Macerich † | 12,211 | 689 | ||||||
Mack-Cali Realty † | 34,000 | 746 | ||||||
Maiden Holdings | 115,600 | 1,365 | ||||||
MainSource Financial Group | 56,700 | 861 | ||||||
MB Financial | 15,000 | 424 | ||||||
Meadowbrook Insurance Group | 260,700 | 1,694 | ||||||
Medical Properties Trust † | 29,620 | 361 | ||||||
Mercantile Bank | 1,600 | 35 | ||||||
Merchants Bancshares | 600 | 17 | ||||||
Meta Financial Group | 3,200 | 122 | ||||||
Metro Bancorp | 2,900 | 61 | ||||||
MetroCorp Bancshares | 850 | 12 | ||||||
MFA Financial † | 128,421 | 957 | ||||||
MGIC Investment | 7,950 | 58 | ||||||
Mid-America Apartment Communities † (A) | 7,522 | 470 | ||||||
Middleburg Financial | 1,650 | 32 | ||||||
MidWestOne Financial Group | 1,400 | 36 | ||||||
Montpelier Re Holdings | 23,800 | 620 | ||||||
NASB Financial * | 500 | 14 | ||||||
National Bank Holdings, Cl A | 650 | 13 | ||||||
National Bankshares, Cl A | 750 | 27 | ||||||
National Penn Bancshares | 41,475 | 417 | ||||||
NBT Bancorp | 200 | 5 | ||||||
Nelnet, Cl A | 47,400 | 1,823 | ||||||
NewBridge Bancorp * | 200 | 1 | ||||||
Northfield Bancorp | 71,987 | 874 | ||||||
Northrim BanCorp | 1,800 | 43 | ||||||
Northwest Bancshares | 20,425 | 270 | ||||||
OceanFirst Financial | 31,900 | 539 | ||||||
Ocwen Financial * | 19,600 | 1,093 | ||||||
OFG Bancorp (A) | 51,297 | 830 | ||||||
Old National Bancorp, Cl A | 112,314 | 1,595 | ||||||
OmniAmerican Bancorp, Cl A * | 15,200 | 372 | ||||||
Pacific Mercantile Bancorp * | 1,550 | 10 | ||||||
Pacific Premier Bancorp * | 6,550 | 88 | ||||||
PacWest Bancorp (A) | 37,006 | 1,272 | ||||||
Palmetto Bancshares * | 500 | 6 | ||||||
Peapack Gladstone Financial | 1,500 | 28 | ||||||
Pebblebrook Hotel Trust † | 21,229 | 610 | ||||||
Pennsylvania † | 20,800 | 389 | ||||||
PennyMac Financial Services, Cl A * | 1,950 | 37 | ||||||
PennyMac Mortgage Investment Trust † | 23,500 | 533 | ||||||
Peoples Bancorp | 2,650 | 55 | ||||||
PHH * | 21,700 | 515 | ||||||
PICO Holdings * | 28,900 | 626 | ||||||
Pinnacle Financial Partners | 6,900 | 206 | ||||||
Platinum Underwriters Holdings | 39,666 | 2,369 | ||||||
Popular | 24,200 | 635 | ||||||
Post Properties † | 6,815 | 307 | ||||||
Preferred Bank | 2,750 | 49 | ||||||
Primerica | 7,800 | 315 | ||||||
PrivateBancorp, Cl A | 17,650 | 378 | ||||||
ProAssurance | 13,536 | 610 | ||||||
ProLogis † | 33,244 | 1,251 | ||||||
Prosperity Bancshares (A) | 16,830 | 1,041 | ||||||
Protective Life | 14,200 | 604 | ||||||
Provident Financial Holdings | 5,950 | 99 | ||||||
Provident Financial Services | 18,300 | 297 | ||||||
| 3 | SEI Institutional Managed Trust / Annual Report / September 30, 2013 |
Schedule of Investments
Small Cap Value Fund
September 30, 2013
| Market Value | ||||||||
Description | Shares | ($ Thousands) | ||||||
Public Storage † | 5,857 | $ | 940 | |||||
Radian Group (A) | 49,490 | 689 | ||||||
RAIT Financial Trust † | 9,799 | 69 | ||||||
Regency Centers † | 5,881 | 284 | ||||||
Reinsurance Group of America, Cl A | 6,750 | 452 | ||||||
Renasant | 7,500 | 204 | ||||||
Republic Bancorp, Cl A (A) | 27,505 | 758 | ||||||
RLJ Lodging Trust † | 14,750 | 347 | ||||||
S&T Bancorp (A) | 8,300 | 201 | ||||||
Safeguard Scientifics * | 32,757 | 514 | ||||||
Sandy Spring Bancorp | 3,650 | 85 | ||||||
Selective Insurance Group | 22,165 | 543 | ||||||
Sierra Bancorp | 2,300 | 36 | ||||||
Simon Property Group † | 13,344 | 1,978 | ||||||
SL Green Realty † (A) | 3,392 | 301 | ||||||
Southside Bancshares (A) | 13,440 | 360 | ||||||
Southwest Bancorp * | 5,400 | 80 | ||||||
StanCorp Financial Group (A) | 7,800 | 429 | ||||||
Starwood Property Trust † | 27,000 | 647 | ||||||
State Bank Financial | 9,200 | 146 | ||||||
Sterling Financial | 2,450 | 70 | ||||||
Suffolk Bancorp * | 3,200 | 57 | ||||||
Sun Communities † | 7,760 | 331 | ||||||
Sunstone Hotel Investors † | 23,500 | 299 | ||||||
Susquehanna Bancshares | 128,740 | 1,616 | ||||||
SY Bancorp, Cl A | 2,600 | 74 | ||||||
Symetra Financial | 33,900 | 604 | ||||||
Taubman Centers † | 2,450 | 165 | ||||||
TCF Financial (A) | 32,255 | 461 | ||||||
Territorial Bancorp | 2,300 | 51 | ||||||
Texas Capital Bancshares * | 9,183 | 422 | ||||||
THL Credit | 28,500 | 445 | ||||||
Tompkins Financial | 3,650 | 169 | ||||||
TowneBank | 3,450 | 50 | ||||||
Tree.com | 900 | 24 | ||||||
Trico Bancshares | 5,300 | 121 | ||||||
Trustmark | 11,700 | 300 | ||||||
Two Harbors Investment † | 41,900 | 407 | ||||||
UDR † | 21,400 | 507 | ||||||
UMB Financial | 2,550 | 139 | ||||||
Umpqua Holdings (A) | 43,226 | 701 | ||||||
Union First Market Bankshares (A) | 30,795 | 720 | ||||||
United Bankshares (A) | 2,600 | 75 | ||||||
United Community Banks | 70,550 | 1,058 | ||||||
United Community Financial * | 3,750 | 15 | ||||||
Univest Corp of Pennsylvania | 2,800 | 53 | ||||||
Validus Holdings | 25,300 | 935 | ||||||
Ventas † | 11,019 | 678 | ||||||
ViewPoint Financial Group | 33,500 | 692 | ||||||
Virginia Commerce Bancorp | 2,150 | 33 | ||||||
Vornado Realty Trust † | 7,900 | 664 | ||||||
Washington Banking | 3,600 | 51 | ||||||
Washington Trust Bancorp | 2,850 | 90 | ||||||
Waterstone Financial | 2,900 | 29 | ||||||
Webster Financial | 28,990 | 740 | ||||||
Weingarten Realty Investors † (A) | 5,800 | 170 | ||||||
WesBanco | 8,250 | 245 | ||||||
West Bancorporation | 2,200 | 30 | ||||||
Westamerica Bancorporation | 1,100 | 55 | ||||||
Western Alliance Bancorp | 66,925 | 1,267 | ||||||
| Market Value | ||||||||
Description | Shares | ($ Thousands) | ||||||
Wilshire Bancorp | 57,450 | $ | 470 | |||||
Winthrop Realty Trust † | 56,900 | 634 | ||||||
Wintrust Financial (A) | 9,450 | 388 | ||||||
World Acceptance | 3,089 | 278 | ||||||
WSFS Financial | 27,610 | 1,664 | ||||||
Yadkin Financial * | 4,500 | 78 | ||||||
|
| |||||||
| 134,254 | ||||||||
|
| |||||||
Health Care — 4.8% | ||||||||
Accuray * (A) | 269,000 | 1,988 | ||||||
Akorn * (A) | 14,580 | 287 | ||||||
Alere * | 35,800 | 1,094 | ||||||
Amsurg | 20,880 | 829 | ||||||
Analogic | 3,290 | 272 | ||||||
Bio-Reference Labs (A) | 6,300 | 188 | ||||||
Cambrex | 6,300 | 83 | ||||||
Charles River Laboratories International * | 16,564 | 767 | ||||||
Conmed | 27,100 | 921 | ||||||
Cross Country Healthcare * | 33,800 | 205 | ||||||
Five Star Quality Care * | 25,900 | 134 | ||||||
Greatbatch | 36,410 | 1,239 | ||||||
HealthSouth | 23,922 | 825 | ||||||
Hill-Rom Holdings | 8,100 | 290 | ||||||
Hi-Tech Pharmacal | 7,400 | 319 | ||||||
ICON * | 8,776 | 359 | ||||||
Invacare | 23,400 | 404 | ||||||
Kindred Healthcare | 38,800 | 521 | ||||||
Landauer | 7,100 | 364 | ||||||
Magellan Health Services * | 12,550 | 752 | ||||||
Masimo | 11,310 | 301 | ||||||
Medical Action Industries * | 35,800 | 238 | ||||||
MEDNAX (A) | 8,795 | 883 | ||||||
Merit Medical Systems * | 32,600 | 395 | ||||||
Natus Medical * | 33,000 | 468 | ||||||
Orthofix International | 8,800 | 184 | ||||||
Owens & Minor (A) | 10,400 | 360 | ||||||
PDL BioPharma (A) | 48,900 | 390 | ||||||
PerkinElmer | 14,088 | 532 | ||||||
PharMerica | 35,300 | 468 | ||||||
Questcor Pharmaceuticals (A) | 12,600 | 731 | ||||||
Sciclone Pharmaceuticals * | 42,500 | �� | 215 | |||||
Select Medical Holdings | 48,950 | 395 | ||||||
Skilled Healthcare Group, Cl A * | 64,200 | 280 | ||||||
Symmetry Medical * | 94,800 | 774 | ||||||
Team Health Holdings | 7,980 | 303 | ||||||
Teleflex | 3,973 | 327 | ||||||
|
| |||||||
| 19,085 | ||||||||
|
| |||||||
Industrials — 17.4% | ||||||||
AAR | 14,000 | 383 | ||||||
ACCO Brands * (A) | 76,600 | 509 | ||||||
Actuant, Cl A (A) | 33,354 | 1,295 | ||||||
Aegean Marine Petroleum Network | 38,800 | 460 | ||||||
Air Transport Services Group * | 118,200 | 885 | ||||||
Aircastle | 56,200 | 978 | ||||||
Alamo Group | 8,928 | 437 | ||||||
Alaska Air Group | 8,900 | 557 | ||||||
Alliant Techsystems | 11,900 | 1,161 | ||||||
American Railcar Industries (A) | 9,800 | 384 | ||||||
Ampco-Pittsburgh | 21,328 | 382 | ||||||
Astec Industries | 15,400 | 554 | ||||||
| 4 | SEI Institutional Managed Trust / Annual Report / September 30, 2013 |
Schedule of Investments
Small Cap Value Fund
September 30, 2013
| Market Value | ||||||||
Description | Shares | ($ Thousands) | ||||||
Atlas Air Worldwide Holdings * | 17,200 | $ | 793 | |||||
AuRico Gold | 73,500 | 280 | ||||||
AZZ | 5,815 | 243 | ||||||
Barnes Group | 10,305 | 360 | ||||||
Beacon Roofing Supply (A) | 6,730 | 248 | ||||||
Belden | 22,464 | 1,439 | ||||||
Brink’s | 48,200 | 1,364 | ||||||
CDI | 1,646 | 25 | ||||||
Celadon Group | 14,292 | 267 | ||||||
Chart Industries * | 1,920 | 236 | ||||||
CIRCOR International | 14,510 | 902 | ||||||
Clean Harbors * | 10,866 | 638 | ||||||
Comfort Systems USA | 21,900 | 368 | ||||||
Consolidated Graphics * | 11,500 | 645 | ||||||
Con-way | 6,600 | 284 | ||||||
CRA International * | 15,100 | 281 | ||||||
Cubic | 12,700 | 682 | ||||||
Curtiss-Wright | 51,376 | 2,412 | ||||||
Deluxe (A) | 15,700 | 654 | ||||||
EMCOR Group | 66,188 | 2,590 | ||||||
Encore Wire | 11,600 | 457 | ||||||
EnerSys | 4,000 | 243 | ||||||
EnPro Industries (A) | 5,091 | 306 | ||||||
Esterline Technologies * | 4,270 | 341 | ||||||
Flow International | 89,700 | 358 | ||||||
FTI Consulting (A) | 76,383 | 2,887 | ||||||
G&K Services | 24,064 | 1,453 | ||||||
Generac Holdings | 12,045 | 514 | ||||||
General Cable | 10,699 | 340 | ||||||
Global Brass & Copper Holdings * | 18,000 | 316 | ||||||
Global Power Equipment Group | 33,000 | 664 | ||||||
GrafTech International (A) | 66,200 | 559 | ||||||
Granite Construction | 19,000 | 581 | ||||||
Great Lakes Dredge & Dock | 159,800 | 1,186 | ||||||
H&E Equipment Services | 9,740 | 259 | ||||||
Hawaiian Holdings (A) | 65,800 | 489 | ||||||
Hyster-Yale Materials Handling | 11,000 | 986 | ||||||
ICF International, Cl A | 17,400 | 616 | ||||||
Interface, Cl A | 38,169 | 757 | ||||||
JetBlue Airways * (A) | 193,200 | 1,287 | ||||||
John Bean Technologies, Cl A | 11,600 | 289 | ||||||
Kadant | 34,235 | 1,150 | ||||||
Kaman, Cl A | 12,400 | 469 | ||||||
KAR Auction Services | 39,141 | 1,104 | ||||||
Kaydon | 38,960 | 1,384 | ||||||
Kelly Services, Cl A | 13,700 | 267 | ||||||
LB Foster, Cl A | 5,700 | 261 | ||||||
Manitowoc | 12,110 | 237 | ||||||
MasTec (A) | 10,920 | 331 | ||||||
Miller Industries | 7,700 | 131 | ||||||
Moog, Cl A * | 12,929 | 758 | ||||||
MRC Global * | 17,200 | 461 | ||||||
Mueller Industries | 3,370 | 188 | ||||||
MYR Group * | 39,200 | 953 | ||||||
Navigant Consulting * | 8,600 | 133 | ||||||
NN, Cl A | 26,300 | 409 | ||||||
Northwest Pipe * | 13,700 | 451 | ||||||
On Assignment | 9,470 | 312 | ||||||
Orbital Sciences * | 48,660 | 1,031 | ||||||
Orion Marine Group (A) | 108,773 | 1,132 | ||||||
Pitney Bowes (A) | 11,400 | 207 | ||||||
Quad (A) | 20,500 | 623 | ||||||
| Market Value | ||||||||
Description | Shares | ($ Thousands) | ||||||
Quanex Building Products (A) | 9,548 | $ | 180 | |||||
Rand Logistics * | 32,000 | 156 | ||||||
Regal-Beloit | 7,435 | 505 | ||||||
Republic Airways Holdings * (A) | 21,500 | 256 | ||||||
Ryder System | 33,310 | 1,989 | ||||||
Safe Bulkers (A) | 31,000 | 211 | ||||||
Saia | 19,350 | 603 | ||||||
Simpson Manufacturing (A) | 16,780 | 546 | ||||||
Skywest | 40,400 | 587 | ||||||
Spirit Airlines | 6,000 | 206 | ||||||
Steelcase, Cl A | 40,900 | 680 | ||||||
TAL International Group (A) | 23,700 | 1,108 | ||||||
Team * | 9,232 | 367 | ||||||
Teledyne Technologies * | 4,301 | 365 | ||||||
Terex | 9,394 | 316 | ||||||
Tetra Tech * | 58,485 | 1,514 | ||||||
Textainer Group Holdings (A) | 4,600 | 174 | ||||||
Titan Machinery * (A) | 53,200 | 855 | ||||||
TMS International, Cl A | 45,700 | 797 | ||||||
Towers Watson, Cl A | 12,151 | 1,300 | ||||||
Trimas | 12,161 | 453 | ||||||
Triumph Group | 9,196 | 646 | ||||||
TrueBlue * | 20,000 | 480 | ||||||
Tutor Perini | 90,300 | 1,925 | ||||||
United Stationers | 6,500 | 283 | ||||||
VSE | 13,900 | 653 | ||||||
Wabash National (A) | 38,000 | 443 | ||||||
Watsco | 2,540 | 239 | ||||||
Watts Water Technologies, Cl A (A) | 7,303 | 412 | ||||||
WESCO International (A) | 3,992 | 306 | ||||||
Woodward | 22,994 | 939 | ||||||
|
| |||||||
| 69,070 | ||||||||
|
| |||||||
Information Technology — 11.7% | ||||||||
ACI Worldwide * | 5,710 | 309 | ||||||
Acxiom * | 23,305 | 662 | ||||||
Adtran (A) | 93,898 | 2,502 | ||||||
Advanced Energy Industries * | 19,300 | 338 | ||||||
Amkor Technology (A) | 99,500 | 427 | ||||||
Arrow Electronics, Cl A * | 24,100 | 1,170 | ||||||
Atmel | 62,090 | 462 | ||||||
Benchmark Electronics | 53,400 | 1,222 | ||||||
Black Box | 12,300 | 377 | ||||||
Blucora (A) | 11,300 | 260 | ||||||
BroadSoft | 6,710 | 242 | ||||||
CACI International, Cl A (A) | 16,589 | 1,146 | ||||||
Cadence Design Systems (A) | 43,140 | 582 | ||||||
Cardtronics | 7,860 | 292 | ||||||
CIBER | 240,900 | 795 | ||||||
Cognex | 8,630 | 271 | ||||||
Coherent | 5,361 | 330 | ||||||
Computer Task Group | 33,900 | 548 | ||||||
Comtech Telecommunications | 12,510 | 304 | ||||||
Convergys | 24,792 | 465 | ||||||
CSG Systems International | 34,100 | 854 | ||||||
Diebold | 36,691 | 1,077 | ||||||
Digi International | 94,500 | 946 | ||||||
Diodes | 12,700 | 311 | ||||||
EarthLink | 217,210 | 1,075 | ||||||
Electronics for Imaging | 8,020 | 254 | ||||||
| 5 | SEI Institutional Managed Trust / Annual Report / September 30, 2013 |
Schedule of Investments
Small Cap Value Fund
September 30, 2013
| Market Value | ||||||||
Description | Shares | ($ Thousands) | ||||||
Emulex | 36,013 | $ | 280 | |||||
Entegris * | 56,440 | 573 | ||||||
EPAM Systems * | 9,550 | 330 | ||||||
Exar * | 98,800 | 1,325 | ||||||
ExlService Holdings | 8,987 | 256 | ||||||
Fairchild Semiconductor International | 52,718 | 732 | ||||||
FARO Technologies * | 5,500 | 232 | ||||||
Genpact | 24,225 | 457 | ||||||
GT Advanced Technologies * (A) | 61,400 | 523 | ||||||
Imation | 30,500 | 125 | ||||||
Inphi | 27,439 | 369 | ||||||
Insight Enterprises * | 27,600 | 522 | ||||||
Integrated Device Technology * | 40,181 | 378 | ||||||
IntraLinks Holdings, Cl A | 36,255 | 319 | ||||||
InvenSense, Cl A * (A) | 16,110 | 284 | ||||||
Itron * | 6,400 | 274 | ||||||
Ixia | 23,161 | 363 | ||||||
Lexmark International, Cl A (A) | 14,800 | 488 | ||||||
Liquidity Services * (A) | 8,594 | 288 | ||||||
Manhattan Associates | 2,570 | 245 | ||||||
Mentor Graphics | 29,580 | 691 | ||||||
MicroStrategy, Cl A * | 9,900 | 1,027 | ||||||
MKS Instruments | 35,509 | 944 | ||||||
Multi-Fineline Electronix | 16,100 | 261 | ||||||
Nanometrics | 32,300 | 521 | ||||||
OSI Systems * | 4,110 | 306 | ||||||
Park Electrochemical | 19,300 | 553 | ||||||
Photronics * | 86,000 | 673 | ||||||
Plantronics | 8,500 | 391 | ||||||
PRGX Global * | 120,500 | 754 | ||||||
Progress Software | 45,650 | 1,181 | ||||||
PTC * | 39,722 | 1,129 | ||||||
Pulse Electronics * (A) | 3,630 | 14 | ||||||
QLogic | 69,900 | 765 | ||||||
RDA Microelectronics ADR * | 25,500 | 390 | ||||||
RF Micro Devices, Cl A | 109,722 | 619 | ||||||
Rudolph Technologies | 38,300 | 437 | ||||||
Saba Software | 102,700 | 1,037 | ||||||
Silicon Laboratories | 5,840 | 249 | ||||||
Sykes Enterprises * (A) | 61,394 | 1,100 | ||||||
Synaptics | 8,800 | 390 | ||||||
SYNNEX * | 10,600 | 651 | ||||||
Tech Data | 33,600 | 1,677 | ||||||
TeleCommunication Systems, Cl A | 102,300 | 252 | ||||||
TeleTech Holdings | 12,100 | 304 | ||||||
Tessco Technologies | 12,000 | 404 | ||||||
Ultra Clean Holdings | 36,236 | 250 | ||||||
Ultratech * | 83,500 | 2,530 | ||||||
United Online (A) | 88,200 | 704 | ||||||
Verint Systems * | 7,840 | 291 | ||||||
Zebra Technologies, Cl A | 9,586 | 436 | ||||||
|
| |||||||
| 46,515 | ||||||||
|
| |||||||
Materials — 4.4% | ||||||||
Allegheny Technologies | 11,762 | 359 | ||||||
American Vanguard, Cl B | 10,400 | 280 | ||||||
Boise | 66,700 | 840 | ||||||
Cabot | 7,500 | 320 | ||||||
Cytec Industries | 3,985 | 324 | ||||||
Flotek Industries * | 10,210 | 235 | ||||||
| Market Value | ||||||||
Description | Shares | ($ Thousands) | ||||||
Glatfelter | 21,200 | $ | 574 | |||||
Globe Specialty Metals | 42,100 | 649 | ||||||
Greif, Cl A | 8,352 | 410 | ||||||
GSE Holding | 96,800 | 201 | ||||||
H.B. Fuller | 49,550 | 2,239 | ||||||
Innophos Holdings | 9,160 | 484 | ||||||
Innospec | 7,300 | 341 | ||||||
Intrepid Potash (A) | 27,300 | 428 | ||||||
LSB Industries * | 29,200 | 979 | ||||||
Minerals Technologies | 22,455 | 1,109 | ||||||
Neenah Paper, Cl A | 17,900 | 704 | ||||||
Olin (A) | 28,800 | 664 | ||||||
Owens-Illinois | 14,152 | 425 | ||||||
PolyOne | 34,575 | 1,062 | ||||||
RTI International Metals (A) | 26,820 | 859 | ||||||
Schnitzer Steel Industries, Cl A | 34,300 | 945 | ||||||
Schweitzer-Mauduit International | 8,200 | 496 | ||||||
Scotts Miracle-Gro, Cl A (A) | 6,493 | 357 | ||||||
Sensient Technologies | 26,477 | 1,268 | ||||||
Silgan Holdings | 16,837 | 791 | ||||||
|
| |||||||
| 17,343 | ||||||||
|
| |||||||
Telecommunication Services — 0.6% |
| |||||||
Atlantic Telegraph-Network | 12,600 | 657 | ||||||
Inteliquent | 34,300 | 331 | ||||||
Iridium Communications (A) | 55,300 | 380 | ||||||
USA Mobility | 28,700 | 407 | ||||||
Vonage Holdings | 134,300 | 422 | ||||||
|
| |||||||
| 2,197 | ||||||||
|
| |||||||
Utilities — 2.6% | ||||||||
ALLETE | 16,185 | 782 | ||||||
Avista | 29,900 | 789 | ||||||
Cadiz * (A) | 78,200 | 400 | ||||||
Cleco | 18,723 | 839 | ||||||
Empire District Electric | 21,600 | 468 | ||||||
Great Plains Energy | 39,774 | 883 | ||||||
Idacorp, Cl A | 9,131 | 442 | ||||||
NorthWestern | 12,800 | 575 | ||||||
Piedmont Natural Gas (A) | 21,500 | 707 | ||||||
PNM Resources | 21,895 | 496 | ||||||
Portland General Electric | 62,801 | 1,773 | ||||||
Southwest Gas | 10,070 | 503 | ||||||
UIL Holdings (A) | 35,350 | 1,314 | ||||||
WGL Holdings | 11,660 | 498 | ||||||
|
| |||||||
| 10,469 | ||||||||
|
| |||||||
Total Common Stock | 371,298 | |||||||
|
| |||||||
EXCHANGE TRADED FUNDS — 1.3% | ||||||||
iShares Russell 2000 Index Fund | 10,790 | 1,150 | ||||||
iShares Russell 2000 Value Index Fund (A) | 44,900 | 4,115 | ||||||
|
| |||||||
| 5,265 | ||||||||
|
| |||||||
Total Exchange Traded Funds | 5,265 | |||||||
|
| |||||||
| 6 | SEI Institutional Managed Trust / Annual Report / September 30, 2013 |
Schedule of Investments
Small Cap Value Fund
September 30, 2013
Description | Shares/Face Amount ($ Thousands) | Market Value ($ Thousands) | ||||||
| Number of | ||||||||
| Warrants | ||||||||
WARRANTS — 0.0% | ||||||||
Magnum Hunter Resources | 12,327 | $ | — | |||||
|
| |||||||
Total Warrants | — | |||||||
|
| |||||||
AFFILIATED PARTNERSHIP — 16.7% |
| |||||||
SEI Liquidity Fund, L.P. | 66,092,083 | 66,092 | ||||||
|
| |||||||
Total Affiliated Partnership | 66,092 | |||||||
|
| |||||||
CASH EQUIVALENT — 5.2% | ||||||||
SEI Daily Income Trust, Prime | 20,733,946 | 20,734 | ||||||
|
| |||||||
Total Cash Equivalent | 20,734 | |||||||
|
| |||||||
U.S. TREASURY OBLIGATIONS (C) (D) — 0.2% |
| |||||||
U.S. Treasury Bills | ||||||||
0.040%, 01/09/14 | $ | 732 | 732 | |||||
|
| |||||||
Total U.S. Treasury Obligations | 732 | |||||||
|
| |||||||
Total Investments — 117.1% | $ | 464,121 | ||||||
|
| |||||||
A list of the open futures contracts held by the Fund at September 30, 2013, is as follows:
| Number of | Unrealized | |||||||||||
| Type of | Contracts | Expiration | Appreciation | |||||||||
Contract | Long | Date | ($ Thousands) | |||||||||
Russell 2000 Index E-MINI | 85 | Dec-2013 | $ | 116 | ||||||||
|
| |||||||||||
For the year ended September 30, 2013, the total amount of all open futures contracts, as presented in the table above, are representative of the volume of activity for this derivative type during the year.
Percentages are based on Net Assets of $396,421 ($Thousands).
| * | Non-income producing security. |
| ** | Rate shown is the 7-day effective yield as of September 30, 2013. |
| † | Real Estate Investment Trust. |
| †† | Investment in Affiliated Security. |
| ‡ | Narrow Industries are utilized for compliance purposes, whereas broad sectors are utilized for reporting. |
| (A) | This security or a partial position of this security is on loan at September 30, 2013. The total market value of securities on loan at September 30, 2013 was $66,110 ($ Thousands). |
| (B) | This security was purchased with cash collateral held from securities on loan. The total market value of such securities as of September 30, 2013 was $66,092 ($ Thousands). |
| (C) | Security, or portion thereof has been pledged as collateral on open futures contracts. |
| (D) | The rate reported is the effective yield at the time of purchase. |
ADR — American Depositary Receipt
Cl — Class
L.P. — Limited Partnership
The following is a list of the level of inputs used as of September 30, 2013, in valuing the Fund’s investments and other financial instruments carried at value ($ Thousands):
| Investments in Securities | Level 1 | Level 2 | Level 3 | Total | ||||||||||||
Common Stock | $ | 371,298 | $ | — | $ | — | $ | 371,298 | ||||||||
Exchange Traded Funds | 5,265 | — | — | 5,265 | ||||||||||||
Warrant | — | — | — | — | ||||||||||||
U.S. Treasury Obligations | — | 732 | — | 732 | ||||||||||||
Affiliated Partnership | — | 66,092 | — | 66,092 | ||||||||||||
Cash Equivalent | 20,734 | — | — | 20,734 | ||||||||||||
|
|
|
|
|
|
|
| |||||||||
Total Investments in Securities | $ | 397,297 | $ | 66,824 | $ | — | $ | 464,121 | ||||||||
|
|
|
|
|
|
|
| |||||||||
Other Financial Instruments | Level 1 | Level 2 | Level 3 | Total | ||||||||||||
Futures Contracts * | ||||||||||||||||
Unrealized Appreciation | $ | 116 | $ | — | $ | — | $ | 116 | ||||||||
|
|
|
|
|
|
|
| |||||||||
Total Other Financial Instruments | $ | 116 | $ | — | $ | — | $ | 116 | ||||||||
|
|
|
|
|
|
|
| |||||||||
| * | Futures contracts are value at the unrealized appreciation on the instrument. |
For the year ended September 30, 2013, there were no transfers between Level 1 and Level 2 assets and liabilities.
For the year ended September 30, 2013, there were no transfers between Level 2 and Level 3 assets and liabilities.
Amounts designated as “—” are $0 or have been rounded to $0
| 7 | SEI Institutional Managed Trust / Annual Report / September 30, 2013 |
Schedule of Investments
Small Cap Growth Fund
September 30, 2013
| Market Value | ||||||||
Description | Shares | ($ Thousands) | ||||||
COMMON STOCK — 95.7% | ||||||||
Consumer Discretionary — 15.5% | ||||||||
AFC Enterprises, Ser 2011-9A * | 6,200 | $ | 270 | |||||
America’s Car-Mart * | 2,000 | 90 | ||||||
ANN | 6,400 | 232 | ||||||
Arctic Cat | 23,935 | 1,366 | ||||||
Ascent Capital Group, Cl A | 6,265 | 505 | ||||||
Beazer Homes USA, Cl A * (A) | 18,540 | 334 | ||||||
Belo, Cl A | 16,300 | 223 | ||||||
Big 5 Sporting Goods | 47,400 | 762 | ||||||
Biglari Holdings * | 1,101 | 454 | ||||||
BJ’s Restaurants (A) | 4,937 | 142 | ||||||
Blue Nile * | 15,067 | 617 | ||||||
Body Central | 11,566 | 70 | ||||||
Bravo Brio Restaurant Group | 16,600 | 251 | ||||||
Bright Horizons Family Solutions * | 24,626 | 882 | ||||||
Brown Shoe | 25,900 | 608 | ||||||
Brunswick | 26,137 | 1,043 | ||||||
Cabela’s | 14,700 | 926 | ||||||
Capella Education | 24,342 | 1,377 | ||||||
Carmike Cinemas * | 4,600 | 102 | ||||||
Carriage Services | 15,800 | 307 | ||||||
Carter’s (A) | 23,615 | 1,792 | ||||||
Cato, Cl A | 12,106 | 339 | ||||||
Conn’s * (A) | 29,802 | 1,491 | ||||||
Cooper Tire & Rubber | 900 | 28 | ||||||
Core-Mark Holding, Cl A | 13,100 | 870 | ||||||
Cracker Barrel Old Country Store | 4,600 | 475 | ||||||
CROCS | 2,200 | 30 | ||||||
Denny’s, Cl A | 91,800 | 562 | ||||||
Destination Maternity | 8,100 | 258 | ||||||
Diamond Resorts International * | 12,460 | 234 | ||||||
Dick’s Sporting Goods | 9,225 | 492 | ||||||
DineEquity | 700 | 48 | ||||||
Dorman Products (A) | 5,951 | 295 | ||||||
Drew Industries | 2,900 | 132 | ||||||
Entravision Communications, Cl A | 64,600 | 381 | ||||||
Express * | 20,900 | 493 | ||||||
Fiesta Restaurant Group * | 1,100 | 41 | ||||||
Five Below (A) | 36,831 | 1,611 | ||||||
Francesca’s Holdings * | 37,588 | 701 | ||||||
GameStop, Cl A | 6,980 | 347 | ||||||
G-III Apparel Group * | 4,300 | 235 | ||||||
Gordmans Stores | 30,005 | 338 | ||||||
Grand Canyon Education * | 15,462 | 623 | ||||||
Haverty Furniture | 11,300 | 277 | ||||||
Hibbett Sports * (A) | 36,018 | 2,022 | ||||||
HomeAway * (A) | 58,592 | 1,641 | ||||||
Hovnanian Enterprises, Cl A * (A) | 16,100 | 84 | ||||||
HSN, Cl A | 2,400 | 129 | ||||||
Imax * (A) | 12,675 | 383 | ||||||
Jack in the Box | 16,046 | 642 | ||||||
Krispy Kreme Doughnuts | 5,600 | 108 | ||||||
La-Z-Boy, Cl Z | 34,446 | 782 | ||||||
Life Time Fitness * | 10,980 | 565 | ||||||
LKQ * | 29,494 | 940 | ||||||
Loral Space & Communications | 7,500 | 508 | ||||||
Lumber Liquidators Holdings * (A) | 18,768 | 2,002 | ||||||
| Market Value | ||||||||
Description | Shares | ($ Thousands) | ||||||
MDC Partners, Cl A | 5,600 | $ | 157 | |||||
Meritage Homes | 1,000 | 43 | ||||||
Monro Muffler (A) | 17,073 | 794 | ||||||
Movado Group | 11,300 | 494 | ||||||
Multimedia Games Holding * | 14,400 | 498 | ||||||
National CineMedia | 93,230 | 1,758 | ||||||
Nutrisystem (A) | 30,000 | 431 | ||||||
Orbitz Worldwide * | 81,600 | 786 | ||||||
Overstock.com * | 1,600 | 47 | ||||||
Papa John’s International, Cl A | 12,800 | 895 | ||||||
Penske Auto Group, Cl A | 9,780 | 418 | ||||||
PetMed Express (A) | 50,600 | 824 | ||||||
Pier 1 Imports | 12,900 | 252 | ||||||
Pinnacle Entertainment * | 3,000 | 75 | ||||||
Pool | 14,000 | 786 | ||||||
Quiksilver * | 48,534 | 341 | ||||||
ReachLocal (A) | 66,180 | 788 | ||||||
Red Robin Gourmet Burgers | 13,582 | 966 | ||||||
Restoration Hardware Holdings * | 14,159 | 897 | ||||||
Ruth’s Chris Steak House | 33,500 | 397 | ||||||
Scientific Games, Cl A | 39,803 | 644 | ||||||
Shutterfly | 25,702 | 1,436 | ||||||
Sinclair Broadcast Group, Cl A | 3,400 | 114 | ||||||
Six Flags Entertainment | 9,036 | 305 | ||||||
Skechers U.S.A., Cl A * | 17,830 | 555 | ||||||
Smith & Wesson Holding * (A) | 25,000 | 275 | ||||||
SodaStream International (A) | 14,416 | 900 | ||||||
Sonic * | 2,700 | 48 | ||||||
Sotheby’s | 11,305 | 555 | ||||||
Standard Motor Products | 17,300 | 556 | ||||||
Steiner Leisure | 3,800 | 222 | ||||||
Steven Madden | 900 | 48 | ||||||
Stoneridge * | 20,400 | 220 | ||||||
Sturm Ruger (A) | 900 | 56 | ||||||
TAL Education Group ADR | 14,222 | 206 | ||||||
Tenneco * | 11,400 | 576 | ||||||
Texas Roadhouse, Cl A | 12,200 | 321 | ||||||
TRI Pointe Homes * (A) | 22,335 | 328 | ||||||
Vitamin Shoppe | 3,862 | 169 | ||||||
Wet Seal, Cl A | 46,500 | 183 | ||||||
Winnebago Industries | 9,400 | 244 | ||||||
Wolverine World Wide (A) | 48,147 | 2,804 | ||||||
Zumiez (A) | 8,846 | 244 | ||||||
|
| |||||||
| 55,116 | ||||||||
|
| |||||||
Consumer Staples — 3.3% | ||||||||
Annie’s * (A) | 18,959 | 931 | ||||||
Casey’s General Stores | 17,355 | 1,276 | ||||||
Chefs’ Warehouse Holdings * | 26,581 | 614 | ||||||
Darling International * | 2,500 | 53 | ||||||
Fairway Group Holdings, Cl A * (A) | 7,640 | 195 | ||||||
Fresh Market * | 6,803 | 322 | ||||||
J&J Snack Foods | 5,300 | 428 | ||||||
Lancaster Colony | 8,103 | 634 | ||||||
Medifast (A) | 23,067 | 620 | ||||||
Pilgrim’s Pride | 88,100 | 1,479 | ||||||
Prestige Brands Holdings, Cl A * | 40,075 | 1,207 | ||||||
Rite Aid * | 290,500 | 1,383 | ||||||
Sanderson Farms (A) | 9,500 | 620 | ||||||
Snyders-Lance | 10,661 | 308 | ||||||
Sprouts Farmers Market * | 2,355 | 104 | ||||||
| SEI Institutional Managed Trust / Annual Report / September 30, 2013 | 1 |
Schedule of Investments
Small Cap Growth Fund
September 30, 2013
| Market Value | ||||||||
Description | Shares | ($ Thousands) | ||||||
SUPERVALU | 30,200 | $ | 249 | |||||
USANA Health Sciences | 8,500 | 738 | ||||||
WhiteWave Foods, Cl A (A) | 26,444 | 528 | ||||||
|
| |||||||
| 11,689 | ||||||||
|
| |||||||
Energy — 4.7% | ||||||||
Berry Petroleum, Cl A | 4,700 | 203 | ||||||
Bonanza Creek Energy | 3,200 | 154 | ||||||
Delek US Holdings | 24,382 | 514 | ||||||
Dresser-Rand Group * | 23,847 | 1,488 | ||||||
Dril-Quip * | 26,993 | 3,097 | ||||||
Emerald Oil * | 34,168 | 246 | ||||||
Endeavour International * (A) | 11,400 | 61 | ||||||
EPL Oil & Gas * | 11,700 | 434 | ||||||
Forum Energy Technologies * (A) | 30,977 | 837 | ||||||
Hornbeck Offshore Services * | 3,105 | 178 | ||||||
Kodiak Oil & Gas | 36,800 | 444 | ||||||
Laredo Petroleum Holdings * (A) | 57,643 | 1,711 | ||||||
Matador Resources (A) | 33,933 | 554 | ||||||
Matrix Service * | 6,900 | 135 | ||||||
Mitcham Industries * | 16,000 | 245 | ||||||
Newpark Resources, Cl A * | 4,600 | 58 | ||||||
Oasis Petroleum (A) | 34,585 | 1,699 | ||||||
Oceaneering International, Cl A | 1,479 | 120 | ||||||
Oil States International * | 4,519 | 468 | ||||||
Phillips 66 Partners * (A) | 11,560 | 356 | ||||||
Pioneer Energy Services * | 25,112 | 189 | ||||||
Quicksilver Resources * (A) | 30,500 | 60 | ||||||
Renewable Energy Group * | 20,800 | 315 | ||||||
Rosetta Resources * | 13,964 | 760 | ||||||
Targa Resources | 9,530 | 695 | ||||||
Triangle Petroleum * | 21,100 | 207 | ||||||
Vaalco Energy | 85,660 | 478 | ||||||
Western Refining (A) | 14,300 | 430 | ||||||
Willbros Group | 31,700 | 291 | ||||||
World Fuel Services (A) | 8,002 | 299 | ||||||
|
| |||||||
| 16,726 | ||||||||
|
| |||||||
Financials — 6.7% | ||||||||
Affiliated Managers Group * | 2,340 | 427 | ||||||
Alexander’s † (A) | 400 | 114 | ||||||
Altisource Residential † | 9,346 | 215 | ||||||
Amtrust Financial Services (A) | 23,009 | 899 | ||||||
Argo Group International Holdings | 10,700 | 459 | ||||||
Artisan Partners Asset Management, Cl A | 5,180 | 271 | ||||||
Bank of the Ozarks (A) | 11,461 | 550 | ||||||
Banner | 6,967 | 266 | ||||||
City National | 4,350 | 290 | ||||||
Cohen & Steers (A) | 17,456 | 616 | ||||||
Credit Acceptance, Cl A | 4,700 | 520 | ||||||
CubeSmart † | 23,280 | 415 | ||||||
Douglas Emmett † | 14,695 | 345 | ||||||
EastGroup Properties † | 16,519 | 978 | ||||||
Employers Holdings | 11,300 | 336 | ||||||
Financial Engines (A) | 27,079 | 1,610 | ||||||
First Cash Financial Services * | 1,028 | 59 | ||||||
First Financial Holdings | 3,510 | 194 | ||||||
Glimcher Realty Trust † | 62,910 | 613 | ||||||
HCI Group (A) | 5,800 | 237 | ||||||
HFF, Cl A | 13,600 | 341 | ||||||
| Market Value | ||||||||
Description | Shares | ($ Thousands) | ||||||
Highwoods Properties † | 18,820 | $ | 665 | |||||
IBERIABANK | 12,590 | 653 | ||||||
Jones Lang LaSalle | 6,564 | 573 | ||||||
LPL Financial Holdings | 18,535 | 710 | ||||||
Maiden Holdings | 33,600 | 397 | ||||||
MarketAxess Holdings | 16,541 | 993 | ||||||
MGIC Investment | 89,400 | 651 | ||||||
Montpelier Re Holdings | 11,700 | 304 | ||||||
MSCI, Cl A * | 17,915 | 721 | ||||||
National Health Investors † | 4,600 | 262 | ||||||
Pebblebrook Hotel Trust † | 8,247 | 237 | ||||||
PennantPark Investment | 62,783 | 707 | ||||||
Portfolio Recovery Associates | 6,400 | 384 | ||||||
Potlatch † | 9,623 | 382 | ||||||
PS Business Parks † | 4,400 | 328 | ||||||
Signature Bank NY, Cl B | 15,394 | 1,409 | ||||||
Sovran Self Storage † | 6,800 | 515 | ||||||
St. Joe * (A) | 22,815 | 447 | ||||||
Stifel Financial * (A) | 29,062 | 1,198 | ||||||
Sun Communities † | 8,700 | 371 | ||||||
SVB Financial Group, Cl B | 9,082 | 784 | ||||||
Titanium Asset Management PIPE (B) (F) | 140,900 | 111 | ||||||
Value Creation (B) (F) | 145,600 | 74 | ||||||
Virtus Investment Partners * | 3,100 | 504 | ||||||
WisdomTree Investments | 65,585 | 762 | ||||||
|
| |||||||
| 23,897 | ||||||||
|
| |||||||
Health Care — 19.1% | ||||||||
Acadia Healthcare, Cl A * (A) | 63,512 | 2,504 | ||||||
ACADIA Pharmaceuticals * (A) | 20,250 | 556 | ||||||
Acceleron Pharma * | 12,975 | 289 | ||||||
Achillion Pharmaceuticals | 47,489 | 143 | ||||||
Acorda Therapeutics | 24,345 | 835 | ||||||
Addus HomeCare * | 7,200 | 209 | ||||||
Aegerion Pharmaceuticals, Cl A (A) | 12,802 | 1,097 | ||||||
Affymax * (A) | 70,000 | 95 | ||||||
Akorn * (A) | 45,444 | 894 | ||||||
Align Technology | 26,760 | 1,288 | ||||||
Alnylam Pharmaceuticals * | 7,400 | 474 | ||||||
AMAG Pharmaceuticals * | 35,880 | 771 | ||||||
AMN Healthcare Services * | 23,100 | 318 | ||||||
Analogic | 3,700 | 306 | ||||||
Ariad Pharmaceuticals * | 23,618 | 435 | ||||||
Arqule | 43,900 | 102 | ||||||
Array BioPharma * | 17,900 | 111 | ||||||
ArthroCare | 5,900 | 210 | ||||||
athenahealth (A) | 12,241 | 1,329 | ||||||
Auxilium Pharmaceuticals | 7,600 | 139 | ||||||
AVEO Pharmaceuticals, Cl A * (A) | 83,300 | 172 | ||||||
BioScrip * | 15,000 | 132 | ||||||
Bruker BioSciences * | 29,320 | 606 | ||||||
Cadence Pharmaceuticals * | 30,700 | 194 | ||||||
Cambrex | 23,200 | 306 | ||||||
Cantel Medical | 9,900 | 315 | ||||||
Capital Senior Living * | 14,365 | 304 | ||||||
Cardiovascular Systems * | 7,800 | 156 | ||||||
Celldex Therapeutics, Cl A (A) | 21,237 | 752 | ||||||
Centene * | 10,803 | 691 | ||||||
Cepheid (A) | 6,205 | 242 | ||||||
Chimerix * | 16,290 | 358 | ||||||
| 2 | SEI Institutional Managed Trust / Annual Report / September 30, 2013 |
Schedule of Investments
Small Cap Growth Fund
September 30, 2013
| Market Value | ||||||||
Description | Shares | ($ Thousands) | ||||||
Clovis Oncology * | 3,797 | $ | 231 | |||||
Computer Programs & Systems | 7,800 | 456 | ||||||
Coronado Biosciences * (A) | 33,178 | 233 | ||||||
Cubist Pharmaceuticals | 20,657 | 1,313 | ||||||
Cyberonics * (A) | 2,300 | 117 | ||||||
Depomed * | 61,400 | 459 | ||||||
DexCom * | 10,485 | 296 | ||||||
Dynavax Technologies (A) | 76,100 | 91 | ||||||
Emergent Biosolutions * | 36,300 | 692 | ||||||
Emeritus | 37,698 | 698 | ||||||
Endocyte * (A) | 41,500 | 553 | ||||||
Endologix | 68,604 | 1,107 | ||||||
Ensign Group | 6,600 | 271 | ||||||
Exact Sciences (A) | 51,014 | 603 | ||||||
ExamWorks Group (A) | 53,377 | 1,387 | ||||||
Fluidigm | 41,284 | 906 | ||||||
Foundation Medicine * | 3,325 | 132 | ||||||
Furiex Pharmaceuticals * | 6,425 | 283 | ||||||
GenMark Diagnostics * | 37,520 | 456 | ||||||
Gentiva Health Services | 27,900 | 336 | ||||||
Haemonetics * | 4,263 | 170 | ||||||
Halozyme Therapeutics (A) | 65,379 | 722 | ||||||
HealthSouth | 12,037 | 415 | ||||||
Healthways | 9,900 | 183 | ||||||
HeartWare International * | 12,075 | 884 | ||||||
HMS Holdings * (A) | 14,227 | 306 | ||||||
Hyperion Therapeutics * (A) | 8,952 | 234 | ||||||
ICON * | 23,384 | 957 | ||||||
ICU Medical | 10,800 | 734 | ||||||
Immunogen * (A) | 18,000 | 306 | ||||||
Imris | 111,657 | 180 | ||||||
Incyte (A) | 13,283 | 507 | ||||||
Insmed * (A) | 28,270 | 441 | ||||||
Insulet (A) | 31,776 | 1,151 | ||||||
Intercept Pharmaceuticals * | 4,578 | 316 | ||||||
Intrexon * | 11,310 | 268 | ||||||
IPC The Hospitalist (A) | 11,642 | 594 | ||||||
Ironwood Pharmaceuticals, Cl A * (A) | 45,784 | 543 | ||||||
Isis Pharmaceuticals (A) | 28,725 | 1,078 | ||||||
Jazz Pharmaceuticals | 9,830 | 904 | ||||||
Keryx Biopharmaceuticals * (A) | 99,201 | 1,002 | ||||||
LHC Group | 5,100 | 120 | ||||||
Masimo | 38,051 | 1,014 | ||||||
MedAssets * | 8,300 | 211 | ||||||
Medidata Solutions * | 1,200 | 119 | ||||||
Medivation * | 8,420 | 505 | ||||||
MEDNAX | 6,736 | 676 | ||||||
Molina Healthcare * | 1,400 | 50 | ||||||
Momenta Pharmaceuticals * | 17,420 | 251 | ||||||
MWI Veterinary Supply * | 1,400 | 209 | ||||||
Nektar Therapeutics | 79,354 | 829 | ||||||
Neurocrine Biosciences * | 32,900 | 372 | ||||||
NewLink Genetics (A) | 8,539 | 160 | ||||||
Novadaq Technologies * (A) | 132,975 | 2,205 | ||||||
NPS Pharmaceuticals | 22,866 | 727 | ||||||
NuVasive * | 18,100 | 443 | ||||||
OraSure Technologies * | 15,200 | 91 | ||||||
Orexigen Therapeutics * (A) | 20,422 | 125 | ||||||
Orthofix International | 8,300 | 173 | ||||||
Pacira Pharmaceuticals * | 22,620 | 1,088 | ||||||
Parexel International | 23,679 | 1,189 | ||||||
| Market Value | ||||||||
Description | Shares | ($ Thousands) | ||||||
PDL BioPharma (A) | 100,900 | $ | 804 | |||||
Pharmacyclics * | 2,230 | 309 | ||||||
Portola Pharmaceuticals * | 2,800 | 75 | ||||||
Pozen * | 32,200 | 185 | ||||||
Premier, Cl A * | 2,789 | 88 | ||||||
Providence Service * | 25,300 | 726 | ||||||
Puma Biotechnology * (A) | 26,870 | 1,442 | ||||||
Questcor Pharmaceuticals (A) | 3,300 | 191 | ||||||
Quidel (A) | 38,658 | 1,098 | ||||||
Repligen * | 61,800 | 685 | ||||||
Repros Therapeutics * | 9,980 | 268 | ||||||
Rigel Pharmaceuticals * (A) | 21,300 | 76 | ||||||
Sagent Pharmaceuticals * | 25,152 | 513 | ||||||
Santarus * | 42,900 | 968 | ||||||
Sciclone Pharmaceuticals * | 97,400 | 494 | ||||||
Sirona Dental Systems, Cl A | 9,271 | 620 | ||||||
Spectranetics | 13,290 | 223 | ||||||
STERIS, Cl A | 2,900 | 125 | ||||||
SurModics * | 10,200 | 242 | ||||||
Synageva BioPharma, Cl A (A) | 14,127 | 894 | ||||||
Syneron Medical | 62,667 | 540 | ||||||
Synta Pharmaceuticals * (A) | 44,198 | 279 | ||||||
Team Health Holdings | 19,101 | 725 | ||||||
TearLab * (A) | 21,447 | 237 | ||||||
Techne, Cl A | 13,530 | 1,083 | ||||||
TESARO * | 25,329 | 981 | ||||||
Threshold Pharmaceuticals, Cl A * (A) | 61,840 | 288 | ||||||
Tornier BV | 26,999 | 522 | ||||||
Triple-S Management, Cl B * | 15,400 | 283 | ||||||
Unilife (A) | 196,862 | 654 | ||||||
ViroPharma | 12,656 | 497 | ||||||
Vocera Communications | 22,075 | 411 | ||||||
Volcano (A) | 15,420 | 369 | ||||||
WellCare Health Plans | 21,432 | 1,495 | ||||||
XenoPort | 56,700 | 322 | ||||||
|
| |||||||
| 68,117 | ||||||||
|
| |||||||
Industrials — 20.1% | ||||||||
AAON Inc. | 10,000 | 266 | ||||||
Actuant, Cl A (A) | 32,373 | 1,257 | ||||||
Acuity Brands (A) | 13,041 | 1,200 | ||||||
Advisory Board | 2,523 | 150 | ||||||
Aegion, Cl A * | 2,400 | 57 | ||||||
Aircastle | 5,800 | 101 | ||||||
Albany International, Cl A | 4,600 | 165 | ||||||
Allegiant Travel, Cl A | 1,600 | 169 | ||||||
Altra Holdings | 21,400 | 576 | ||||||
American Science & Engineering, Cl A | 5,100 | 307 | ||||||
American Woodmark * | 8,500 | 294 | ||||||
Apogee Enterprises | 1,800 | 53 | ||||||
Armstrong World Industries | 12,116 | 666 | ||||||
Astronics * | 10,800 | 537 | ||||||
Avis Budget Group * | 5,316 | 153 | ||||||
AZZ | 1,200 | 50 | ||||||
Barrett Business Services | 9,100 | 613 | ||||||
Beacon Roofing Supply (A) | 9,649 | 356 | ||||||
Brink’s | 3,500 | 99 | ||||||
Carlisle | 25,520 | 1,794 | ||||||
Chart Industries * | 10,105 | 1,243 | ||||||
CIRCOR International | 3,400 | 211 | ||||||
| SEI Institutional Managed Trust / Annual Report / September 30, 2013 | 3 |
Schedule of Investments
Small Cap Growth Fund
September 30, 2013
| Market Value | ||||||||
Description | Shares | ($ Thousands) | ||||||
Clean Harbors * | 6,170 | $ | 362 | |||||
Coleman Cable | 27,100 | 572 | ||||||
Corporate Executive Board | 13,941 | 1,012 | ||||||
Deluxe | 1,100 | 46 | ||||||
Diana Shipping * (A) | 17,340 | 209 | ||||||
DigitalGlobe * | 14,165 | 448 | ||||||
DXP Enterprises | 6,377 | 504 | ||||||
Dycom Industries * | 45,415 | 1,271 | ||||||
EnerNOC * | 10,300 | 154 | ||||||
EnerSys (A) | 4,400 | 267 | ||||||
Erickson Air-Crane * (A) | 4,000 | 62 | ||||||
Exponent | 7,800 | 560 | ||||||
Fortune Brands Home & Security | 20,311 | 846 | ||||||
G&K Services | 1,300 | 79 | ||||||
Generac Holdings | 29,213 | 1,246 | ||||||
Genesee & Wyoming, Cl A * | 12,703 | 1,181 | ||||||
Graco | 14,200 | 1,052 | ||||||
GrafTech International (A) | 138,766 | 1,172 | ||||||
Heico, Cl A | 39,005 | 1,956 | ||||||
HEICO (A) | 14,478 | 981 | ||||||
Heritage-Crystal Clean (A) | 46,065 | 830 | ||||||
Hexcel, Cl A * | 57,513 | 2,231 | ||||||
Hub Group, Cl A * | 32,445 | 1,273 | ||||||
Huron Consulting Group | 2,700 | 142 | ||||||
Hyster-Yale Materials Handling | 8,000 | 717 | ||||||
IDEX | 15,160 | 989 | ||||||
Insperity, Cl A | 21,400 | 805 | ||||||
Interface, Cl A | 39,800 | 790 | ||||||
John Bean Technologies, Cl A | 27,800 | 692 | ||||||
Kennametal | 19,075 | 870 | ||||||
Keyw Holding, Cl A * (A) | 32,613 | 439 | ||||||
Kforce | 40,200 | 711 | ||||||
Kirby * | 21,336 | 1,847 | ||||||
Landstar System | 16,824 | 942 | ||||||
Lincoln Electric Holdings | 13,370 | 891 | ||||||
Lindsay (A) | 3,791 | 310 | ||||||
Marten Transport | 45,239 | 776 | ||||||
Middleby * | 11,062 | 2,311 | ||||||
Mine Safety Appliances | 3,300 | 170 | ||||||
Mistras Group | 11,700 | 199 | ||||||
Mobile Mini * | 8,919 | 304 | ||||||
MSC Industrial Direct, Cl A | 9,025 | 734 | ||||||
Mueller Industries | 3,500 | 195 | ||||||
Mueller Water Products, Cl A | 56,200 | 449 | ||||||
MYR Group * | 19,800 | 481 | ||||||
Nordson | 15,441 | 1,137 | ||||||
Old Dominion Freight Line, Cl A | 43,727 | 2,011 | ||||||
PGT * | 73,500 | 728 | ||||||
Pike Electric | 12,200 | 138 | ||||||
Ply Gem Holdings * | 32,110 | 449 | ||||||
Polypore International * (A) | 24,305 | 996 | ||||||
PowerSecure International * | 32,000 | 514 | ||||||
Primoris Services | 18,852 | 480 | ||||||
RBC Bearings | 10,341 | 681 | ||||||
Republic Airways Holdings * | 22,700 | 270 | ||||||
Ritchie Bros. Auctioneers (A) | 42,560 | 859 | ||||||
RPX | 22,900 | 401 | ||||||
Rush Enterprises, Cl A | 29,986 | 795 | ||||||
Saia | 38,670 | 1,206 | ||||||
Spirit Airlines | 30,930 | 1,060 | ||||||
Standard Parking | 46,733 | 1,257 | ||||||
Standex International (A) | 4,200 | 249 | ||||||
| Market Value | ||||||||
Description | Shares | ($ Thousands) | ||||||
Steelcase, Cl A | 46,486 | $ | 773 | |||||
Stratasys (A) | 4,080 | 413 | ||||||
Swift Transportation, Cl A * | 45,882 | 926 | ||||||
Taser International | 52,300 | 780 | ||||||
Teledyne Technologies * | 400 | 34 | ||||||
Tennant | 9,255 | 574 | ||||||
Tredegar | 15,000 | 390 | ||||||
Trex | 18,877 | 935 | ||||||
TrueBlue * | 108,716 | 2,610 | ||||||
United Rentals (A) | 17,700 | 1,032 | ||||||
US Airways Group (A) | 9,600 | 182 | ||||||
US Ecology | 8,864 | 267 | ||||||
USG (A) | 10,771 | 308 | ||||||
Valmont Industries | 5,985 | 831 | ||||||
Wabtec | 19,583 | 1,231 | ||||||
WageWorks | 3,868 | 195 | ||||||
Watsco (A) | 10,517 | 991 | ||||||
WESCO International (A) | 18,373 | 1,406 | ||||||
|
| |||||||
| 71,504 | ||||||||
|
| |||||||
Information Technology — 24.3% | ||||||||
Actuate | 60,100 | 442 | ||||||
Advanced Energy Industries * | 18,500 | 324 | ||||||
Advent Software | 24,435 | 776 | ||||||
Anixter International * | 3,600 | 316 | ||||||
Aruba Networks | 56,661 | 943 | ||||||
Aspen Technology * | 58,535 | 2,022 | ||||||
ATMI * | 13,400 | 355 | ||||||
AVG Technologies * | 33,200 | 795 | ||||||
Blackbaud, Cl A | 50,808 | 1,984 | ||||||
Blucora (A) | 33,600 | 772 | ||||||
Broadridge Financial Solutions | 32,005 | 1,016 | ||||||
BroadSoft (A) | 27,523 | 992 | ||||||
Cadence Design Systems (A) | 108,089 | 1,459 | ||||||
CalAmp * | 4,500 | 79 | ||||||
Calix * | 42,600 | 542 | ||||||
Cavium (A) * | 53,815 | 2,217 | ||||||
Ceva, Cl A * | 10,200 | 176 | ||||||
ChannelAdvisor * | 6,895 | 253 | ||||||
Ciena * (A) | 41,090 | 1,026 | ||||||
Cirrus Logic (A) | 5,300 | 120 | ||||||
CommVault Systems * | 16,467 | 1,446 | ||||||
comScore * | 20,200 | 585 | ||||||
Cornerstone OnDemand (A) | 38,941 | 2,003 | ||||||
CoStar Group (A) | 18,725 | 3,144 | ||||||
CSG Systems International | 31,600 | 792 | ||||||
Cvent * | 5,643 | 199 | ||||||
Cyan * (A) | 36,270 | 365 | ||||||
Dealertrack Technologies | 61,304 | 2,626 | ||||||
Demandware | 31,767 | 1,472 | ||||||
DTS | 22,820 | 479 | ||||||
Electronics for Imaging | 1,600 | 51 | ||||||
Ellie Mae | 16,503 | 528 | ||||||
Envestnet | 58,678 | 1,819 | ||||||
Euronet Worldwide * | 24,180 | 962 | ||||||
EVERTEC Inc. | 5,400 | 120 | ||||||
ExlService Holdings | 5,400 | 154 | ||||||
FARO Technologies * | 3,900 | 165 | ||||||
FireEye * | 12,425 | 516 | ||||||
FleetMatics Group | 21,959 | 825 | ||||||
Forrester Research | 1,200 | 44 | ||||||
Fortinet | 18,878 | 382 | ||||||
| 4 | SEI Institutional Managed Trust / Annual Report / September 30, 2013 |
Schedule of Investments
Small Cap Growth Fund
September 30, 2013
| Market Value | ||||||||
Description | Shares | ($ Thousands) | ||||||
Gigamon * | 9,460 | $ | 366 | |||||
Global Cash Access Holdings | 52,900 | 413 | ||||||
Guidewire Software, Cl Z | 52,303 | 2,464 | ||||||
Himax Technologies ADR (A) | 39,795 | 398 | ||||||
Hittite Microwave, Cl A * | 14,588 | 953 | ||||||
Immersion * | 37,800 | 499 | ||||||
Imperva * | 15,776 | 663 | ||||||
Infinera * (A) | 140,570 | 1,590 | ||||||
Infoblox * | 30,947 | 1,294 | ||||||
Inphi | 66,731 | 896 | ||||||
Interactive Intelligence Group * | 5,603 | 356 | ||||||
International Rectifier * (A) | 21,668 | 537 | ||||||
IPG Photonics | 3,785 | 213 | ||||||
Ixia | 17,000 | 266 | ||||||
j2 Global (A) | 9,755 | 483 | ||||||
Littelfuse | 300 | 24 | ||||||
LivePerson * (A) | 13,313 | 126 | ||||||
LogMeIn * | 18,240 | 566 | ||||||
Manhattan Associates | 11,400 | 1,088 | ||||||
Marin Software * (A) | 8,220 | 103 | ||||||
MAXIMUS | 10,738 | 484 | ||||||
Measurement Specialties | 30,186 | 1,637 | ||||||
Methode Electronics | 7,400 | 207 | ||||||
Model N * (A) | 29,900 | 296 | ||||||
Monotype Imaging Holdings | 22,100 | 633 | ||||||
Move | 30,200 | 512 | ||||||
National Instruments | 15,685 | 485 | ||||||
Netscout Systems * | 14,400 | 368 | ||||||
NICE Systems ADR | 18,540 | 767 | ||||||
NQ Mobile ADR * (A) | 9,703 | 211 | ||||||
OmniVision Technologies | 5,300 | 81 | ||||||
OpenTable * (A) | 5,157 | 361 | ||||||
OSI Systems * | 6,391 | 476 | ||||||
Palo Alto Networks | 13,717 | 629 | ||||||
Pandora Media (A) | 31,290 | 786 | ||||||
Pegasystems | 3,900 | 155 | ||||||
PLX Technology * | 20,700 | 125 | ||||||
Power Integrations | 13,636 | 739 | ||||||
Proofpoint * | 1,600 | 51 | ||||||
PROS Holdings * | 10,000 | 342 | ||||||
PTC * | 35,300 | 1,004 | ||||||
QLIK Technologies | 11,780 | 403 | ||||||
Quantum * (A) | 69,000 | 95 | ||||||
Rally Software Development * | 35,145 | 1,053 | ||||||
RealD (A) | 43,350 | 303 | ||||||
RealPage * (A) | 69,456 | 1,609 | ||||||
Responsys | 31,946 | 527 | ||||||
RF Micro Devices, Cl A | 22,500 | 127 | ||||||
Rogers * | 3,200 | 190 | ||||||
Rosetta Stone * | 13,400 | 218 | ||||||
Ruckus Wireless (A) | 41,949 | 706 | ||||||
Sapient * | 17,200 | 268 | ||||||
Silicon Graphics International * | 3,200 | 52 | ||||||
Silicon Image * | 104,700 | 559 | ||||||
Solera Holdings | 5,995 | 317 | ||||||
Sonus Networks | 109,599 | 371 | ||||||
Sourcefire | 3,900 | 296 | ||||||
Splunk | 14,628 | 878 | ||||||
SPS Commerce | 5,669 | 379 | ||||||
SS&C Technologies Holdings * | 95,095 | 3,623 | ||||||
Stamps.com * | 17,600 | 808 | ||||||
| Market Value | ||||||||
Description | Shares | ($ Thousands) | ||||||
SunPower, Cl A (A) | 26,200 | $ | 686 | |||||
Synaptics | 18,210 | 806 | ||||||
Syntel | 3,800 | 304 | ||||||
Tableau Software, Cl A * | 8,603 | 613 | ||||||
Take-Two Interactive Software, Cl A * | 3,000 | 55 | ||||||
Teradyne (A) | 70,900 | 1,171 | ||||||
Textura * | 8,519 | 367 | ||||||
Tivo * | 7,900 | 98 | ||||||
Travelzoo | 19,400 | 515 | ||||||
Tremor Video * | 26,483 | 244 | ||||||
Trulia (A) | 40,199 | 1,891 | ||||||
Tyler Technologies | 13,638 | 1,193 | ||||||
Ultimate Software Group * | 8,895 | 1,311 | ||||||
Unisys | 24,000 | 605 | ||||||
Valueclick (A) | 28,700 | 598 | ||||||
Veeco Instruments | 16,311 | 607 | ||||||
Virtusa | 7,100 | 206 | ||||||
VistaPrint (A) | 21,272 | 1,202 | ||||||
Vocus * | 16,500 | 154 | ||||||
WebMD Health, Cl A | 10,394 | 297 | ||||||
WEX | 5,142 | 451 | ||||||
Yelp, Cl A | 17,343 | 1,148 | ||||||
Zillow, Cl A (A) | 2,855 | 241 | ||||||
|
| |||||||
| 86,478 | ||||||||
|
| |||||||
Materials — 1.8% | ||||||||
Berry Plastics Group * | 5,000 | 100 | ||||||
Chemtura * | 25,300 | 582 | ||||||
Clearwater Paper | 1,300 | 62 | ||||||
Flotek Industries * | 1,800 | 41 | ||||||
FutureFuel | 22,700 | 408 | ||||||
Graphic Packaging Holding * | 6,400 | 55 | ||||||
H.B. Fuller | 6,597 | 298 | ||||||
Haynes International | 3,600 | 163 | ||||||
Innospec | 18,400 | 859 | ||||||
Intrepid Potash (A) | 28,050 | 440 | ||||||
KapStone Paper and Packaging | 1,100 | 47 | ||||||
Koppers Holdings | 8,000 | 341 | ||||||
Materion | 2,300 | 74 | ||||||
Myers Industries | 21,700 | 436 | ||||||
Noranda Aluminum Holding | 62,100 | 153 | ||||||
PolyOne | 41,664 | 1,279 | ||||||
Sensient Technologies | 7,777 | 372 | ||||||
Shutterstock, Inc. | 2,354 | 171 | ||||||
Worthington Industries | 16,600 | 571 | ||||||
|
| |||||||
| 6,452 | ||||||||
|
| |||||||
Telecommunication Services — 0.3% | ||||||||
Boingo Wireless * | 70,845 | 496 | ||||||
magicJack VocalTec (A) | 12,200 | 157 | ||||||
Premiere Global Services * | 6,700 | 67 | ||||||
RingCentral, Cl A * | 18,254 | 329 | ||||||
|
| |||||||
| 1,049 | ||||||||
|
| |||||||
Utilities — 0.0% | ||||||||
American States Water | 5,800 | 160 | ||||||
|
| |||||||
Total Common Stock | 341,188 | |||||||
|
| |||||||
| SEI Institutional Managed Trust / Annual Report / September 30, 2013 | 5 |
Schedule of Investments
Small Cap Growth Fund
September 30, 2013
Description | Shares/Face Amount ($ Thousands) | Market Value ($ Thousands) | ||||||
EXCHANGE TRADED FUND — 0.2% |
| |||||||
iShares Russell 2000 Growth | 6,814 | $ | 857 | |||||
|
| |||||||
Total Exchange Traded Fund | 857 | |||||||
|
| |||||||
PREFERRED STOCK — 0.0% | ||||||||
Utiilities — 0.0% | ||||||||
Genie Energy Ltd * (A) | 9,400 | 75 | ||||||
|
| |||||||
Total Preferred Stock | 75 | |||||||
|
| |||||||
| Number of | ||||||||
| Warrants | ||||||||
WARRANTS — 0.0% | ||||||||
Magnum Hunter Resources | 11,920 | — | ||||||
|
| |||||||
Total Warrants | — | |||||||
|
| |||||||
AFFILIATED PARTNERSHIP — 21.7% |
| |||||||
SEI Liquidity Fund, L.P. | 77,336,763 | 77,337 | ||||||
|
| |||||||
Total Affiliated Partnership | 77,337 | |||||||
|
| |||||||
CASH EQUIVALENT — 3.8% | ||||||||
SEI Daily Income Trust, Prime | 13,411,755 | 13,412 | ||||||
|
| |||||||
Total Cash Equivalent | 13,412 | |||||||
|
| |||||||
U.S. TREASURY OBLIGATIONS (D) (E) — 0.2% |
| |||||||
U.S. Treasury Bills | ||||||||
0.040%, 01/09/14 | $ | 317 | 317 | |||||
0.075%, 02/06/14 | 189 | 189 | ||||||
|
| |||||||
Total U.S. Treasury Obligations | 506 | |||||||
|
| |||||||
Total Investments — 121.6% | $ | 433,375 | ||||||
|
| |||||||
A list of the open futures contracts held by the Fund at September 30, 2013, are as follows:
| Number of | Unrealized | |||||||||||
Type of Contract | Contracts Long | Expiration Date | Appreciation ($ Thousands) | |||||||||
Russell 2000 Index E-MINI | 86 | Dec-2013 | $ | 105 | ||||||||
|
| |||||||||||
For the year ended September 30, 2013, the total amount of all open futures contracts, as presented in the table above, are representative of the volume of activity for this derivative type during the year.
Percentages are based on Net Assets of $356,481 ($Thousands).
| * | Non-income producing security. |
| ** | Rate shown is the 7-day effective yield as of September 30, 2013. |
| † | Real Estate Investment Trust |
| †† | Investment in Affiliated Security. |
| (A) | This security or a partial position of this security is on loan at September 30, 2013. The total market value of securities on loan at September 30, 2013 was $74,817 ($ Thousands) |
| (B) | Securities considered illiquid and restricted. The total market value of such securities as of September 30, 2013 was $185 ($Thousands) and represented 0.05% of Net Assets. |
| (C) | This security was purchased with cash collateral held from securities on loan. The total market value of such securities as of September 30, 2013 was $77,337 ($Thousands). |
| (D) | Security or portion thereof, has been pledged as collateral on open futures contracts. |
| (E) | The rate reported is the effective yield at time of purchase. |
| (F) | Security fair valued using methods determined in good faith by the Valuation Committee of the Board of Trustees. The total market value of such securities as of September 30, 2013 was $185 ($Thousands) and represented 0.05% of Net Assets. |
ADR — American Depositary Receipt
Cl — Class
L.P. — Limited Partnership
PIPE — Private Investment in Public Entity
The following is a list of the level of inputs used as of September 30, 2013, in valuing the Fund’s investments carried at value ($ Thousands):
| Investments in Securities | Level 1 | Level 2 | Level 3(1) | Total | ||||||||||||
Common Stock | $ | 341,003 | $ | — | $ | 185 | $ | 341,188 | ||||||||
Exchange Traded Fund | 857 | — | — | 857 | ||||||||||||
Preferred Stock | — | 75 | — | 75 | ||||||||||||
Warrant | — | — | — | — | ||||||||||||
U.S. Treasury Obligations | — | 506 | — | 506 | ||||||||||||
Affiliated Partnership | — | 77,337 | — | 77,337 | ||||||||||||
Cash Equivalent | 13,412 | — | — | 13,412 | ||||||||||||
|
|
|
|
|
|
|
| |||||||||
Total Investments in Securities | $ | 355,272 | $ | 77,918 | $ | 185 | $ | 433,375 | ||||||||
|
|
|
|
|
|
|
| |||||||||
Other Financial Instruments | Level 1 | Level 2 | Level 3 | Total | ||||||||||||
Futures Contracts * | ||||||||||||||||
Unrealized Appreciation | $ | 105 | $ | — | $ | — | $ | 105 | ||||||||
|
|
|
|
|
|
|
| |||||||||
Total Other Financial Instruments | $ | 105 | $ | — | $ | — | $ | 105 | ||||||||
|
|
|
|
|
|
|
| |||||||||
| (1) | A reconciliation of Level 3 investments is presented when the Fund has a significant amount of Level 3 investments at the beginning and/or end of the period in relation to the net assets. |
| * | Futures contracts are valued at the unrealized depreciation on the instrument. |
For the year ended September 30, 2013, there were no transfers between Level 1 and Level 2 assets and liabilities.
For the year ended September 30, 2013, there were no significant transfers between Level 2 and Level 3 assets and liabilities.
Amounts designated as “—” are $0 or have been rounded to $0.
| 6 | SEI Institutional Managed Trust / Annual Report / September 30, 2013 |
Schedule of Investments
Tax—Managed Small / Mid Cap Fund
September 30, 2013
| Market Value | ||||||||
Description | Shares | ($ Thousands) | ||||||
COMMON STOCK — 95.8% | ||||||||
Consumer Discretionary — 14.4% | ||||||||
Aaron’s | 2,100 | $ | 58 | |||||
Abercrombie & Fitch, Cl A | 2,943 | 104 | ||||||
Aeropostale * | 2,250 | 21 | ||||||
AFC Enterprises, Ser 2011-9A * | 10,690 | 466 | ||||||
AMC Networks, Cl A * | 874 | 60 | ||||||
American Axle & Manufacturing Holdings * | 3,600 | 71 | ||||||
American Eagle Outfitters | 62,206 | 870 | ||||||
America’s Car-Mart * | 1,300 | 59 | ||||||
ANN | 16,228 | 588 | ||||||
Apollo Group, Cl A (A) | 1,025 | 21 | ||||||
Arctic Cat | 3,103 | 177 | ||||||
Asbury Automotive Group | 2,900 | 154 | ||||||
Ascena Retail Group | 3,400 | 68 | ||||||
Ascent Capital Group, Cl A | 1,500 | 121 | ||||||
Autoliv | 7,000 | 612 | ||||||
Autonation * | 1,905 | 99 | ||||||
Bally Technologies (A) | 3,100 | 223 | ||||||
Barnes & Noble * (A) | 2,584 | 33 | ||||||
Beazer Homes USA, Cl A * (A) | 532 | 10 | ||||||
Belo, Cl A | 1,450 | 20 | ||||||
Big 5 Sporting Goods | 25,900 | 417 | ||||||
Big Lots * | 28,435 | 1,055 | ||||||
Biglari Holdings * | 90 | 37 | ||||||
BJ’s Restaurants | 1,500 | 43 | ||||||
Bloomin’ Brands * | 37,086 | 876 | ||||||
Bob Evans Farms | 1,700 | 97 | ||||||
Body Central | 2,110 | 13 | ||||||
Boyd Gaming * (A) | 3,600 | 51 | ||||||
Bravo Brio Restaurant Group | 568 | 9 | ||||||
Bright Horizons Family Solutions * (A) | 24,609 | 882 | ||||||
Brinker International | 7,200 | 292 | ||||||
Brown Shoe | 2,700 | 63 | ||||||
Brunswick | 2,100 | 84 | ||||||
Buffalo Wild Wings | 5,490 | 611 | ||||||
Burger King Worldwide (A) | 506 | 10 | ||||||
Cabela’s | 16,560 | 1,044 | ||||||
Cablevision Systems, Cl A | 5,644 | 95 | ||||||
Caesars Entertainment * | 782 | 15 | ||||||
Callaway Golf (A) | 33,412 | 238 | ||||||
Capella Education | 9,827 | 556 | ||||||
Career Education | 2,696 | 7 | ||||||
Carrols Restaurant Group * | 1,575 | 10 | ||||||
Carter’s | 2,200 | 167 | ||||||
Cato, Cl A | 9,700 | 271 | ||||||
CEC Entertainment | 7,300 | 335 | ||||||
Cheesecake Factory | 1,400 | 62 | ||||||
Chico’s FAS | 5,500 | 92 | ||||||
Childrens Place Retail Stores * | 8,935 | 517 | ||||||
Chuy’s Holdings * | 260 | 9 | ||||||
Cinemark Holdings | 1,125 | 36 | ||||||
Citi Trends * | 653 | 11 | ||||||
Columbia Sportswear | 2,786 | 168 | ||||||
Conn’s * (A) | 22,385 | 1,120 | ||||||
Cooper Tire & Rubber | 2,300 | 71 | ||||||
Core-Mark Holding, Cl A | 5,166 | 343 | ||||||
Cracker Barrel Old Country Store | 600 | 62 | ||||||
CROCS | 900 | 12 | ||||||
| Market Value | ||||||||
Description | Shares | ($ Thousands) | ||||||
CSS Industries | 649 | $ | 16 | |||||
CST Brands | 319 | 10 | ||||||
Cumulus Media, Cl A * | 2,995 | 16 | ||||||
Dana Holding | 70,265 | 1,605 | ||||||
Darden Restaurants | 10,246 | 474 | ||||||
Deckers Outdoor * (A) | 290 | 19 | ||||||
DeVry | 1,000 | 31 | ||||||
Dick’s Sporting Goods | 10,847 | 579 | ||||||
Dillard’s, Cl A | 2,522 | 198 | ||||||
DineEquity | 800 | 55 | ||||||
Discovery Communications, Cl A * | 5,758 | 486 | ||||||
Dollar General | 8,756 | 494 | ||||||
Domino’s Pizza | 2,231 | 152 | ||||||
DR Horton | 6,100 | 118 | ||||||
DreamWorks Animation SKG, Cl A | 600 | 17 | ||||||
DSW, Cl A | 8,523 | 727 | ||||||
Dunkin’ Brands Group | 2,386 | 108 | ||||||
Entercom Communications | 1,583 | 14 | ||||||
Entravision Communications, Cl A | 1,746 | 10 | ||||||
Ethan Allen Interiors | 9,883 | 275 | ||||||
Express * | 12,388 | 292 | ||||||
Fiesta Restaurant Group * | 293 | 11 | ||||||
Fifth & Pacific * | 1,401 | 35 | ||||||
Five Below | 29,741 | 1,301 | ||||||
Foot Locker, Cl A | 3,237 | 110 | ||||||
Fossil Group * | 1,503 | 175 | ||||||
Francesca’s Holdings * | 17,269 | 322 | ||||||
GameStop, Cl A (A) | 23,046 | 1,144 | ||||||
Gannett | 18,864 | 505 | ||||||
Genesco * | 7,215 | 473 | ||||||
Gentex | 2,600 | 66 | ||||||
Gentherm * | 3,300 | 63 | ||||||
GNC Holdings, Cl A | 1,662 | 91 | ||||||
Goodyear Tire & Rubber | 24,900 | 559 | ||||||
Grand Canyon Education * | 15,699 | 632 | ||||||
Group 1 Automotive | 1,724 | 134 | ||||||
Groupon, Cl A * | 10,468 | 117 | ||||||
Guess?, Cl 3 | 1,400 | 42 | ||||||
Hanesbrands | 1,400 | 87 | ||||||
Harley-Davidson, Cl A | 29,961 | 1,925 | ||||||
Harman International Industries, Cl A | 8,600 | 570 | ||||||
Harte-Hanks | 35,212 | 311 | ||||||
Hasbro (A) | 7,887 | 371 | ||||||
Helen of Troy | 2,400 | 106 | ||||||
Hibbett Sports * (A) | 15,724 | 883 | ||||||
Hillenbrand | 2,500 | 68 | ||||||
HomeAway * (A) | 40,737 | 1,141 | ||||||
Hovnanian Enterprises, Cl A * (A) | 1,734 | 9 | ||||||
HSN, Cl A | 15,186 | 814 | ||||||
Iconix Brand Group | 1,300 | 43 | ||||||
Ignite Restaurant Group * | 530 | 8 | ||||||
Imax * (A) | 25,000 | 756 | ||||||
International Game Technology | 28,324 | 536 | ||||||
International Speedway, Cl A | 900 | 29 | ||||||
Interpublic Group | 32,406 | 557 | ||||||
iRobot (A) | 13,020 | 490 | ||||||
Isle of Capri Casinos | 3,300 | 25 | ||||||
ITT Educational Services * | 700 | 22 | ||||||
| 1 | SEI Institutional Managed Trust / Annual Report / September 30, 2013 |
Schedule of Investments
Tax—Managed Small / Mid Cap Fund
September 30, 2013
| Market Value | ||||||||
Description | Shares | ($ Thousands) | ||||||
J.C. Penney | 3,492 | $ | 31 | |||||
JAKKS Pacific (A) | 11,334 | 51 | ||||||
Jamba * (A) | 655 | 9 | ||||||
Jarden * | 3,150 | 152 | ||||||
John Wiley & Sons, Cl A | 900 | 43 | ||||||
Jones Group | 692 | 10 | ||||||
JOS A Bank Clothiers * (A) | 1,000 | 44 | ||||||
Journal Communications, Cl A | 24,200 | 207 | ||||||
K12 * | 1,000 | 31 | ||||||
KB Home | 6,755 | 122 | ||||||
Krispy Kreme Doughnuts | 37,956 | 734 | ||||||
Lamar Advertising, Cl A | 1,300 | 61 | ||||||
La-Z-Boy, Cl Z | 513 | 12 | ||||||
Lear | 15,285 | 1,094 | ||||||
Leggett & Platt | 2,000 | 60 | ||||||
Lennar, Cl A | 2,881 | 102 | ||||||
Libbey | 11,000 | 262 | ||||||
Liberty Ventures, Ser A * | 669 | 59 | ||||||
Life Time Fitness * (A) | 26,269 | 1,352 | ||||||
LifeLock * (A) | 846 | 13 | ||||||
Lions Gate Entertainment | 6,780 | 238 | ||||||
Lithia Motors, Cl A | 1,589 | 116 | ||||||
Live Nation | 5,200 | 96 | ||||||
LKQ * | 35,597 | 1,134 | ||||||
Loral Space & Communications | 800 | 54 | ||||||
Luby’s * | 2,388 | 17 | ||||||
Lululemon Athletica * | 5,704 | 417 | ||||||
Lumber Liquidators Holdings * (A) | 15,752 | 1,680 | ||||||
Madison Square Garden, Cl A | 9,153 | 532 | ||||||
Matthews International, Cl A | 8,863 | 338 | ||||||
MDC Holdings | 2,000 | 60 | ||||||
Men’s Wearhouse | 17,876 | 609 | ||||||
Meredith (A) | 13,240 | 630 | ||||||
Meritage Homes | 1,800 | 77 | ||||||
Michael Kors Holdings | 13,391 | 998 | ||||||
Modine Manufacturing * | 2,100 | 31 | ||||||
Mohawk Industries | 6,755 | 880 | ||||||
Monro Muffler | 1,600 | 74 | ||||||
Morgans Hotel Group * | 3,749 | 29 | ||||||
Morningstar, Cl A | 300 | 24 | ||||||
Multimedia Games Holding * | 351 | 12 | ||||||
NACCO Industries, Cl A | 400 | 22 | ||||||
National CineMedia | 41,167 | 776 | ||||||
NetFlix | 256 | 79 | ||||||
New York Times, Cl A | 13,305 | 167 | ||||||
Newell Rubbermaid, Cl B | 16,605 | 457 | ||||||
Nexstar Broadcasting Group, Cl A | 532 | 24 | ||||||
NVR | 100 | 92 | ||||||
Office Depot (A) | 11,200 | 54 | ||||||
OfficeMax | 6,223 | 80 | ||||||
O’Reilly Automotive | 7,792 | 994 | ||||||
Orient-Express Hotels, Cl A | 5,400 | 70 | ||||||
Outerwall * (A) | 1,200 | 60 | ||||||
Oxford Industries, Cl A | 5,723 | 389 | ||||||
Panera Bread, Cl A | 822 | 130 | ||||||
Penn National Gaming | 1,300 | 72 | ||||||
Penske Auto Group, Cl A | 1,800 | 77 | ||||||
Pep Boys-Manny Moe & Jack | 34,605 | 432 | ||||||
PetSmart | 5,870 | 448 | ||||||
Pier 1 Imports | 66,035 | 1,289 | ||||||
| Market Value | ||||||||
Description | Shares | ($ Thousands) | ||||||
Pinnacle Entertainment * | 527 | $ | 13 | |||||
Polaris Industries | 1,672 | 216 | ||||||
Pool | 2,100 | 118 | ||||||
PulteGroup | 7,423 | 122 | ||||||
PVH | 980 | 116 | ||||||
Red Robin Gourmet Burgers | 800 | 57 | ||||||
Regal Entertainment Group, Cl A (A) | 1,592 | 30 | ||||||
Regis | 16,831 | 247 | ||||||
Rent-A-Center | 10,200 | 389 | ||||||
Restoration Hardware Holdings * (A) | 14,395 | 912 | ||||||
Ross Stores | 11,145 | 811 | ||||||
Ruby Tuesday | 3,000 | 22 | ||||||
rue21 inc * | 695 | 28 | ||||||
Ruth’s Chris Steak House | 1,450 | 17 | ||||||
Ryland Group | 2,100 | 85 | ||||||
Saks * | 3,587 | 57 | ||||||
Sally Beauty Holdings | 18,792 | 492 | ||||||
Samsonite International | 174,850 | 488 | ||||||
Scholastic, Cl B (A) | 4,931 | 141 | ||||||
Scientific Games, Cl A | 14,037 | 227 | ||||||
Sears Holdings (A) | 659 | 39 | ||||||
Select Comfort * | 9,849 | 240 | ||||||
Service International | 6,700 | 125 | ||||||
SHFL Entertainment * | 485 | 11 | ||||||
Shutterfly | 20,355 | 1,138 | ||||||
Signet Jewelers | 10,371 | 743 | ||||||
Sinclair Broadcast Group, Cl A | 1,156 | 39 | ||||||
Six Flags Entertainment | 312 | 11 | ||||||
Skechers U.S.A., Cl A * | 30,397 | 946 | ||||||
Skullcandy | 1,773 | 11 | ||||||
Snap-on | 800 | 80 | ||||||
Sonic Automotive, Cl A | 477 | 11 | ||||||
Sotheby’s | 1,400 | 69 | ||||||
Stage Stores (A) | 17,500 | 336 | ||||||
Standard-Pacific | 62,499 | 494 | ||||||
Starz—Liberty Capital * | 1,976 | 56 | ||||||
Steven Madden | 10,725 | 577 | ||||||
Stewart Enterprises, Cl A | 2,900 | 38 | ||||||
Stoneridge * | 1,763 | 19 | ||||||
Strayer Education | 200 | 8 | ||||||
Taylor Morrison Home, Cl A * (A) | 31,946 | 724 | ||||||
Tempur Sealy International | 1,600 | 70 | ||||||
Tenneco * | 17,615 | 889 | ||||||
Tesla Motors * (A) | 3,050 | 590 | ||||||
Texas Roadhouse, Cl A | 401 | 11 | ||||||
Thor Industries | 700 | 40 | ||||||
Titan International | 849 | 13 | ||||||
Toll Brothers * | 2,924 | 95 | ||||||
TRW Automotive Holdings | 3,951 | 282 | ||||||
Tuesday Morning * | 15,002 | 229 | ||||||
Tupperware Brands | 1,200 | 104 | ||||||
Ulta Salon Cosmetics & Fragrance | 1,800 | 215 | ||||||
Under Armour, Cl A (A) | 6,653 | 529 | ||||||
Urban Outfitters | 18,006 | 662 | ||||||
Vail Resorts | 7,320 | 508 | ||||||
Valassis Communications (A) | 14,800 | 427 | ||||||
Vera Bradley (A) | 5,724 | 118 | ||||||
Visteon | 5,986 | 453 | ||||||
Vitamin Shoppe | 311 | 14 | ||||||
| 2 | SEI Institutional Managed Trust / Annual Report / September 30, 2013 |
Schedule of Investments
Tax—Managed Small / Mid Cap Fund
September 30, 2013
| Market Value | ||||||||
Description | Shares | ($ Thousands) | ||||||
WABCO Holdings | 1,500 | $ | 126 | |||||
Weight Watchers International (A) | 700 | 26 | ||||||
Wendy’s | 4,493 | 38 | ||||||
Whirlpool | 5,200 | 761 | ||||||
Williams-Sonoma | 12,208 | 686 | ||||||
Winnebago Industries | 1,852 | 48 | ||||||
WMS Industries | 2,250 | 58 | ||||||
Wolverine World Wide | 700 | 41 | ||||||
World Wrestling Entertainment, Cl A | 900 | 9 | ||||||
Wynn Resorts | 4,549 | 719 | ||||||
Zagg * (A) | 1,908 | 9 | ||||||
Zumiez | 336 | 9 | ||||||
|
| |||||||
| 70,132 | ||||||||
|
| |||||||
Consumer Staples — 3.3% | ||||||||
Avon Products | 22,733 | 468 | ||||||
B&G Foods, Cl A | 2,800 | 97 | ||||||
Boston Beer, Cl A (A) | 800 | 195 | ||||||
Cal-Maine Foods | 1,100 | 53 | ||||||
Casey’s General Stores | 14,591 | 1,072 | ||||||
Central Garden and Pet, Cl A * | 16,870 | 116 | ||||||
Chefs’ Warehouse Holdings * | 26,547 | 613 | ||||||
Chiquita Brands International | 1,191 | 15 | ||||||
Coca-Cola Enterprises | 8,949 | 360 | ||||||
Constellation Brands, Cl A * | 1,554 | 89 | ||||||
Darling International * | 73,771 | 1,561 | ||||||
Dean Foods * | 2,650 | 51 | ||||||
Diamond Foods (A) | 1,500 | 35 | ||||||
Elizabeth Arden * | 11,540 | 426 | ||||||
Energizer Holdings | 5,200 | 474 | ||||||
Fairway Group Holdings, Cl A * (A) | 432 | 11 | ||||||
Flowers Foods | 4,500 | 96 | ||||||
Fresh Del Monte Produce | 10,000 | 297 | ||||||
Fresh Market * | 1,223 | 58 | ||||||
Green Mountain Coffee Roasters * (A) | 739 | 56 | ||||||
Hain Celestial Group | 1,700 | 131 | ||||||
Harris Teeter Supermarkets | 322 | 16 | ||||||
Herbalife (A) | 3,072 | 214 | ||||||
Hillshire Brands | 1,020 | 31 | ||||||
Ingredion | 13,084 | 866 | ||||||
J&J Snack Foods | 7,355 | 594 | ||||||
JM Smucker | 3,242 | 341 | ||||||
Kroger | 13,503 | 545 | ||||||
Lancaster Colony | 1,200 | 94 | ||||||
Lifevantage * (A) | 4,366 | 11 | ||||||
Medifast | 931 | 25 | ||||||
Molson Coors Brewing, Cl B | 9,104 | 457 | ||||||
Nash Finch | 1,000 | 26 | ||||||
Nu Skin Enterprises, Cl A | 900 | 86 | ||||||
Omega Protein * | 23,400 | 238 | ||||||
Pantry | 16,661 | 185 | ||||||
Post Holdings * | 500 | 20 | ||||||
Prestige Brands Holdings, Cl A * | 4,687 | 141 | ||||||
Rite Aid * | 15,025 | 72 | ||||||
Roundy’s (A) | 1,360 | 12 | ||||||
Safeway (A) | 24,500 | 784 | ||||||
Sanderson Farms | 1,000 | 65 | ||||||
Snyders-Lance | 7,682 | 222 | ||||||
Spartan Stores (A) | 24,192 | 534 | ||||||
| Market Value | ||||||||
Description | Shares | ($ Thousands) | ||||||
Spectrum Brands Holdings | 13,108 | $ | 863 | |||||
Sprouts Farmers Market * | 2,348 | 104 | ||||||
STAR SCIENTIFIC INC * (A) | 5,319 | 10 | ||||||
SUPERVALU (A) | 22,038 | 181 | ||||||
Susser Holdings | 2,864 | 152 | ||||||
SYSCO, Cl A | 13,206 | 420 | ||||||
TreeHouse Foods | 5,958 | 398 | ||||||
Universal | 5,400 | 275 | ||||||
USANA Health Sciences (A) | 4,700 | 408 | ||||||
Vector Group | 3,524 | 57 | ||||||
WD-40 | 400 | 26 | ||||||
Weis Markets | 3,800 | 186 | ||||||
WhiteWave Foods, Cl A | 63,260 | 1,263 | ||||||
|
| |||||||
| 16,196 | ||||||||
|
| |||||||
Energy — 5.7% | ||||||||
Abraxas Petroleum * (A) | 5,943 | 15 | ||||||
Apco Oil and Gas International * | 615 | 9 | ||||||
Approach Resources, Cl A | 414 | 11 | ||||||
Atwood Oceanics, Cl A * | 1,100 | 60 | ||||||
Berry Petroleum, Cl A | 1,600 | 69 | ||||||
Bill Barrett (A) | 1,000 | 25 | ||||||
Bonanza Creek Energy | 8,443 | 407 | ||||||
BPZ Resources * (A) | 7,534 | 15 | ||||||
Bristow Group | 700 | 51 | ||||||
C&J Energy Services * | 510 | 10 | ||||||
Cabot Oil & Gas | 21,939 | 819 | ||||||
Cal Dive International (A) | 6,748 | 14 | ||||||
Callon Petroleum * | 2,924 | 16 | ||||||
CARBO Ceramics (A) | 140 | 14 | ||||||
Carrizo Oil & Gas | 1,700 | 63 | ||||||
Cheniere Energy * | 5,327 | 182 | ||||||
Clean Energy Fuels (A) | 2,390 | 31 | ||||||
Cloud Peak Energy | 596 | 9 | ||||||
Comstock Resources | 611 | 10 | ||||||
Concho Resources | 7,043 | 766 | ||||||
Contango Oil & Gas | 500 | 18 | ||||||
Crosstex Energy | 638 | 13 | ||||||
Dawson Geophysical * | 793 | 26 | ||||||
Delek US Holdings | 12,665 | 267 | ||||||
Denbury Resources * | 17,800 | 328 | ||||||
Diamondback Energy, Cl A | 12,797 | 546 | ||||||
Dresser-Rand Group * | 1,809 | 113 | ||||||
Dril-Quip * | 6,810 | 781 | ||||||
Emerald Oil * | 35,585 | 256 | ||||||
Endeavour International * (A) | 3,106 | 17 | ||||||
Energen | 2,800 | 214 | ||||||
Energy XXI Bermuda | 2,550 | 77 | ||||||
EPL Oil & Gas * | 10,945 | 406 | ||||||
EQT | 5,614 | 498 | ||||||
Era Group * | 500 | 14 | ||||||
EXCO Resources (A) | 1,800 | 12 | ||||||
Exterran Holdings | 13,970 | 385 | ||||||
Forest Oil * | 2,969 | 18 | ||||||
Forum Energy Technologies * (A) | 10,447 | 282 | ||||||
Frank’s International | 16,661 | 499 | ||||||
Frontline * (A) | 4,672 | 12 | ||||||
FX Energy * | 2,924 | 10 | ||||||
Gastar Exploration * | 3,746 | 15 | ||||||
Geospace Technologies | 128 | 11 | ||||||
Global Geophysical Services | 2,665 | 7 | ||||||
Golar LNG (A) | 3,200 | 121 | ||||||
| 3 | SEI Institutional Managed Trust / Annual Report / September 30, 2013 |
Schedule of Investments
Tax—Managed Small / Mid Cap Fund
September 30, 2013
| Market Value | ||||||||
Description | Shares | ($ Thousands) | ||||||
Goodrich Petroleum (A) | 10,658 | $ | 259 | |||||
Gulf Coast Ultra Deep Royalty Trust * | 6,785 | 15 | ||||||
Gulf Island Fabrication | 1,700 | 42 | ||||||
Gulfmark Offshore, Cl A | 12,997 | 661 | ||||||
Gulfport Energy * | 8,962 | 577 | ||||||
Halcon Resources, Cl A * (A) | 5,150 | 23 | ||||||
Helix Energy Solutions Group * | 25,950 | 658 | ||||||
Helmerich & Payne | 16,549 | 1,141 | ||||||
Hercules Offshore | 9,373 | 69 | ||||||
HollyFrontier | 2,812 | 118 | ||||||
Hornbeck Offshore Services * | 335 | 19 | ||||||
Key Energy Services | 32,342 | 236 | ||||||
KiOR, Cl A * (A) | 2,025 | 6 | ||||||
Kodiak Oil & Gas | 9,063 | 109 | ||||||
Kosmos Energy | 3,836 | 39 | ||||||
Laredo Petroleum Holdings * | 24,300 | 721 | ||||||
Magnum Hunter Resources (A) | 4,668 | 29 | ||||||
Matador Resources (A) | 34,684 | 566 | ||||||
McDermott International * | 71,048 | 528 | ||||||
Midstates Petroleum * | 1,751 | 9 | ||||||
Nabors Industries | 23,824 | 383 | ||||||
Natural Gas Services Group * | 1,469 | 39 | ||||||
Newfield Exploration | 19,479 | 533 | ||||||
Newpark Resources, Cl A * | 30,660 | 388 | ||||||
Nordic American Tankers, Cl US (A) | 1,392 | 11 | ||||||
Northern Oil And Gas * | 2,257 | 33 | ||||||
Nuverra Environmental Solutions * (A) | 5,527 | 13 | ||||||
Oasis Petroleum | 28,237 | 1,387 | ||||||
Oceaneering International, Cl A | 10,344 | 840 | ||||||
Oil States International * | 5,740 | 594 | ||||||
Painted Pony Petroleum * | 42,760 | 336 | ||||||
Panhandle Oil and Gas, Cl A | 600 | 17 | ||||||
Parker Drilling * | 47,556 | 271 | ||||||
Patterson-UTI Energy | 4,000 | 85 | ||||||
PDC Energy, Cl A * | 9,238 | 550 | ||||||
Peabody Energy | 6,595 | 114 | ||||||
PetroQuest Energy * | 3,851 | 15 | ||||||
Pioneer Natural Resources (A) | 3,134 | 592 | ||||||
QEP Resources | 3,537 | 98 | ||||||
Range Resources | 9,373 | 711 | ||||||
Rentech | 4,830 | 10 | ||||||
Resolute Energy * | 1,282 | 11 | ||||||
Rex Energy * | 27,553 | 614 | ||||||
RigNet, Cl A | 519 | 19 | ||||||
Rosetta Resources * | 20,735 | 1,129 | ||||||
Rowan, Cl A | 3,592 | 132 | ||||||
Sanchez Energy * | 442 | 12 | ||||||
SandRidge Energy, Cl A * (A) | 15,809 | 93 | ||||||
Scorpio Tankers | 1,366 | 13 | ||||||
SEACOR Holdings, Cl A | 500 | 45 | ||||||
SemGroup, Cl A | 8,215 | 468 | ||||||
SM Energy | 1,490 | 115 | ||||||
Solazyme * (A) | 910 | 10 | ||||||
Spectra Energy | 16,772 | 574 | ||||||
Stone Energy, Cl A * | 13,473 | 437 | ||||||
Superior Energy Services | 18,090 | 453 | ||||||
Swift Energy, Cl A (A) | 17,207 | 197 | ||||||
Tesoro | 14,233 | 626 | ||||||
| Market Value | ||||||||
Description | Shares | ($ Thousands) | ||||||
TETRA Technologies * | 47,327 | $ | 593 | |||||
Tidewater, Cl A | 525 | 31 | ||||||
Triangle Petroleum * | 1,490 | 15 | ||||||
Trican Well Service | 41,440 | 565 | ||||||
Ultra Petroleum (A) | 5,018 | 103 | ||||||
Unit | 271 | 13 | ||||||
Uranium Energy (A) | 8,280 | 19 | ||||||
USEC * (A) | 2,040 | 21 | ||||||
Vaalco Energy | 1,621 | 9 | ||||||
W&T Offshore (A) | 9,096 | 161 | ||||||
Warren Resources * | 4,000 | 12 | ||||||
Western Refining (A) | 22,062 | 663 | ||||||
Willbros Group | 1,500 | 14 | ||||||
World Fuel Services (A) | 5,004 | 187 | ||||||
WPX Energy | 4,168 | 80 | ||||||
|
| |||||||
| 27,821 | ||||||||
|
| |||||||
Financials — 17.4% | ||||||||
1st Source | 4,900 | 132 | ||||||
1st United Bancorp | 1,336 | 10 | ||||||
Acadia Realty Trust † | 23,145 | 571 | ||||||
Affiliated Managers Group * | 7,017 | 1,282 | ||||||
Alexander & Baldwin | 669 | 24 | ||||||
Alexander’s † | 100 | 29 | ||||||
Alexandria Real Estate Equities † | 9,076 | 579 | ||||||
Alleghany | 298 | 122 | ||||||
Allied World Assurance Holdings | 4,300 | 427 | ||||||
Allstate | 7,797 | 394 | ||||||
Altisource Residential † | 525 | 12 | ||||||
Ambac Financial Group * | 513 | 9 | ||||||
American Assets Trust † | 18,630 | 568 | ||||||
American Campus Communities † | 28,522 | 974 | ||||||
American Capital | 8,900 | 122 | ||||||
American Capital Mortgage Investment † | 1,725 | 34 | ||||||
American Equity Investment Life Holding | 4,000 | 85 | ||||||
American Financial Group | 13,800 | 746 | ||||||
American National Insurance | 2,700 | 265 | ||||||
American Realty Capital Properties † | 2,073 | 25 | ||||||
Ameriprise Financial | 5,844 | 532 | ||||||
Ameris Bancorp | 612 | 11 | ||||||
Amerisafe | 1,639 | 58 | ||||||
Ames National, Cl B | 463 | 10 | ||||||
AmREIT, Cl B | 533 | 9 | ||||||
Anworth Mortgage Asset † | 48,900 | 236 | ||||||
Apartment Investment & Management, Cl A † | 3,753 | 105 | ||||||
Apollo Commercial Real Estate Finance † | 2,950 | 45 | ||||||
Apollo Investment | 3,989 | 33 | ||||||
Apollo Residential Mortgage † | 979 | 14 | ||||||
Arch Capital Group | 3,336 | 181 | ||||||
Ares Capital | 16,991 | 294 | ||||||
Ares Commercial Real Estate † | 1,025 | 13 | ||||||
Argo Group International Holdings | 4,487 | 192 | ||||||
Armada Hoffler Properties † (A) | 879 | 9 | ||||||
Arthur J. Gallagher | 2,336 | 102 | ||||||
Artisan Partners Asset Management, Cl A (A) | 201 | 11 | ||||||
| 4 | SEI Institutional Managed Trust / Annual Report / September 30, 2013 |
Schedule of Investments
Tax—Managed Small / Mid Cap Fund
September 30, 2013
| Market Value | ||||||||
Description | Shares | ($ Thousands) | ||||||
Ashford Hospitality Trust † | 4,800 | $ | 59 | |||||
Aspen Insurance Holdings | 8,500 | 308 | ||||||
Associated Banc-Corp | 3,600 | 56 | ||||||
Associated Estates Realty † | 3,300 | 49 | ||||||
Assurant | 8,396 | 454 | ||||||
Assured Guaranty | 6,000 | 113 | ||||||
Axis Capital Holdings | 21,002 | 910 | ||||||
Banc of California | 742 | 10 | ||||||
Banco Latinoamericano de Exportaciones, Cl E | 21,159 | 527 | ||||||
Bancorp | 689 | 12 | ||||||
Bancorpsouth, Cl A | 583 | 12 | ||||||
Bank Mutual | 1,761 | 11 | ||||||
Bank of Hawaii (A) | 900 | 49 | ||||||
Bank of Marin Bancorp | 278 | 12 | ||||||
Bank of the Ozarks (A) | 13,235 | 635 | ||||||
BankUnited | 18,200 | 568 | ||||||
Banner | 16,180 | 617 | ||||||
BBCN Bancorp | 29,949 | 412 | ||||||
Berkshire Hills Bancorp | 12,000 | 301 | ||||||
BGC Partners, Cl A | 3,162 | 18 | ||||||
BioMed Realty Trust † | 2,290 | 43 | ||||||
BlackRock Kelso Capital | 2,400 | 23 | ||||||
Boston Private Financial Holdings | 77,228 | 857 | ||||||
Brandywine Realty Trust † | 28,525 | 376 | ||||||
BRE Properties, Cl A † | 1,000 | 51 | ||||||
Bridge Capital Holdings * | 649 | 11 | ||||||
Brookline Bancorp, Cl A | 1,200 | 11 | ||||||
Brown & Brown | 1,000 | 32 | ||||||
Calamos Asset Management, Cl A | 11,402 | 114 | ||||||
Camden Property Trust † | 2,005 | 123 | ||||||
CapitalSource | 2,762 | 33 | ||||||
CapLease † | 1,180 | 10 | ||||||
Capstead Mortgage † | 1,900 | 22 | ||||||
Cardinal Financial | 10,604 | 175 | ||||||
Cash America International | 219 | 10 | ||||||
Cathay General Bancorp | 2,100 | 49 | ||||||
CBL & Associates Properties † | 31,101 | 594 | ||||||
CBOE Holdings | 767 | 35 | ||||||
CBRE Group, Cl A | 26,736 | 618 | ||||||
Cedar Realty Trust † | 1,931 | 10 | ||||||
Center Bancorp, Cl A | 1,704 | 24 | ||||||
Chambers Street Properties † (A) | 4,475 | 39 | ||||||
Charter Financial | 994 | 11 | ||||||
Chatham Lodging Trust † | 669 | 12 | ||||||
Chemical Financial | 10,100 | 282 | ||||||
Chesapeake Lodging Trust † | 3,000 | 71 | ||||||
Chimera Investment † | 70,826 | 215 | ||||||
Citizens, Cl A * | 1,512 | 13 | ||||||
City National | 4,840 | 323 | ||||||
CNA Financial | 12,400 | 473 | ||||||
CNB Financial | 608 | 10 | ||||||
CNO Financial Group | 105,533 | 1,520 | ||||||
CoBiz Financial | 54,970 | 531 | ||||||
Cole Real Estate Investment † | 39,764 | 487 | ||||||
Colonial Properties Trust † | 4,500 | 101 | ||||||
Colony Financial † | 508 | 10 | ||||||
Commerce Bancshares | 1,683 | 74 | ||||||
CommonWealth † | 20,800 | 456 | ||||||
Community Trust Bancorp | 10,100 | 410 | ||||||
| Market Value | ||||||||
Description | Shares | ($ Thousands) | ||||||
Coresite Realty † | 11,655 | $ | 396 | |||||
Corporate Office Properties Trust † | 446 | 10 | ||||||
Corrections Corp of America † | 1,728 | 60 | ||||||
Cousins Properties, Cl A † | 14,402 | 148 | ||||||
Cowen Group, Cl A * | 3,345 | 12 | ||||||
Credit Acceptance, Cl A | 230 | 26 | ||||||
CubeSmart † | 3,500 | 62 | ||||||
CVB Financial | 14,812 | 200 | ||||||
CYS Investments † | 4,400 | 36 | ||||||
DCT Industrial Trust † | 9,100 | 65 | ||||||
DDR † (A) | 4,940 | 78 | ||||||
DFC Global | 2,400 | 26 | ||||||
DiamondRock Hospitality † | 2,855 | 30 | ||||||
Dime Community Bancshares | 15,500 | 258 | ||||||
Doral Financial * | 485 | 9 | ||||||
Douglas Emmett † | 1,822 | 43 | ||||||
Duke Realty † | 6,624 | 102 | ||||||
DuPont Fabros Technology † | 13,658 | 352 | ||||||
E*Trade Financial | 17,301 | 285 | ||||||
Eagle Bancorp * (A) | 35,057 | 992 | ||||||
East West Bancorp | 40,152 | 1,283 | ||||||
EastGroup Properties † | 11,990 | 710 | ||||||
Education Realty Trust, Cl A † | 89,372 | 813 | ||||||
eHealth * | 444 | 14 | ||||||
Ellington Residential Mortgage REIT † (A) | 569 | 9 | ||||||
Employers Holdings | 18,068 | 537 | ||||||
Encore Capital Group * | 303 | 14 | ||||||
Endurance Specialty Holdings | 18,849 | 1,013 | ||||||
Enstar Group | 400 | 55 | ||||||
EPR Properties, Cl A † | 1,000 | 49 | ||||||
Equity Lifestyle Properties † | 1,800 | 61 | ||||||
Equity One, Cl A † (A) | 16,210 | 354 | ||||||
Erie Indemnity, Cl A | 2,000 | 145 | ||||||
Essex Property Trust † | 690 | 102 | ||||||
Evercore Partners, Cl A | 700 | 34 | ||||||
Everest Re Group | 6,060 | 881 | ||||||
Excel Trust † | 2,400 | 29 | ||||||
Extra Space Storage † | 2,600 | 119 | ||||||
Ezcorp, Cl A * | 577 | 10 | ||||||
FBL Financial Group, Cl A | 2,500 | 112 | ||||||
Federal Agricultural Mortgage, Cl C | 381 | 13 | ||||||
Federal Realty Investment Trust † | 2,172 | 220 | ||||||
Federated Investors, Cl B (A) | 11,866 | 322 | ||||||
FelCor Lodging Trust † | 6,100 | 38 | ||||||
Fidelity National Financial, Cl A | 3,700 | 98 | ||||||
Fifth Street Finance | 11,008 | 113 | ||||||
Fifth Third Bancorp | 35,039 | 632 | ||||||
Financial Engines | 16,020 | 952 | ||||||
First American Financial | 3,200 | 78 | ||||||
First Busey | 2,233 | 12 | ||||||
First Cash Financial Services * | 1,400 | 81 | ||||||
First Commonwealth Financial | 2,982 | 23 | ||||||
First Financial Bancorp | 3,100 | 47 | ||||||
First Financial Bankshares, Cl A (A) | 900 | 53 | ||||||
First Financial Northwest | 979 | 10 | ||||||
First Horizon National | 45,680 | 502 | ||||||
First Industrial Realty Trust † | 4,500 | 73 | ||||||
| 5 | SEI Institutional Managed Trust / Annual Report / September 30, 2013 |
Schedule of Investments
Tax—Managed Small / Mid Cap Fund
September 30, 2013
| Market Value | ||||||||
Description | Shares | ($ Thousands) | ||||||
First Marblehead * | 6,370 | $ | 5 | |||||
First Midwest Bancorp | 35,569 | 537 | ||||||
First NBC Bank Holding * | 7,918 | 193 | ||||||
First Niagara Financial Group | 67,920 | 704 | ||||||
First Potomac Realty Trust † | 3,400 | 43 | ||||||
First Republic Bank | 2,614 | 122 | ||||||
FirstMerit, Cl A | 3,695 | 80 | ||||||
Flagstar Bancorp * | 15,400 | 227 | ||||||
Flushing Financial | 1,600 | 29 | ||||||
FNB (Pennsylvania) (A) | 11,200 | 136 | ||||||
Forest City Enterprises, Cl A * | 27,000 | 511 | ||||||
Forestar Group * | 12,685 | 273 | ||||||
Fox Chase Bancorp, Cl A | 613 | 11 | ||||||
Franklin Street Properties † | 5,100 | 65 | ||||||
Fulton Financial | 4,400 | 51 | ||||||
FXCM, Cl A | 25,674 | 507 | ||||||
GAMCO Investors, Cl A | 400 | 30 | ||||||
Genworth Financial, Cl A * | 10,545 | 135 | ||||||
Geo Group † | 2,419 | 81 | ||||||
Getty Realty † | 3,100 | 60 | ||||||
GFI Group | 4,000 | 16 | ||||||
Glacier Bancorp, Cl A | 27,882 | 689 | ||||||
Gladstone Capital | 1,198 | 10 | ||||||
Gladstone Commercial † | 1,220 | 22 | ||||||
Glimcher Realty Trust † | 5,600 | 55 | ||||||
Government Properties Income Trust, Cl A † | 2,000 | 48 | ||||||
Gramercy Property Trust * † | 6,858 | 28 | ||||||
Green Dot, Cl A * | 1,108 | 29 | ||||||
Greenlight Capital Re | 1,000 | 28 | ||||||
GSV Capital (A) | 1,797 | 27 | ||||||
Hampton Roads Bankshares * | 6,129 | 9 | ||||||
Hancock Holding, Cl A | 31,547 | 990 | ||||||
Hanmi Financial | 18,586 | 308 | ||||||
Hanover Insurance Group, Cl A | 23,986 | 1,327 | ||||||
Hartford Financial Services Group | 17,767 | 553 | ||||||
Hatteras Financial † | 1,900 | 36 | ||||||
HCC Insurance Holdings | 1,700 | 74 | ||||||
Healthcare Realty Trust † | 3,400 | 79 | ||||||
Healthcare Trust of America, Cl A † | 1,398 | 15 | ||||||
Hercules Technology Growth Capital, Cl A | 7,084 | 108 | ||||||
Heritage Commerce | 1,359 | 10 | ||||||
Hersha Hospitality Trust, Cl A † | 4,600 | 26 | ||||||
HFF, Cl A | 563 | 14 | ||||||
Highwoods Properties † | 11,210 | 396 | ||||||
Hilltop Holdings * | 610 | 11 | ||||||
Home Loan Servicing Solutions | 1,783 | 39 | ||||||
Home Properties † | 400 | 23 | ||||||
HomeTrust Bancshares * | 627 | 10 | ||||||
Horace Mann Educators, Cl A | 22,271 | 632 | ||||||
Hospitality Properties Trust † | 19,400 | 549 | ||||||
Host Hotels & Resorts † | 27,977 | 494 | ||||||
Howard Hughes * | 643 | 72 | ||||||
Hudson City Bancorp, Cl A | 15,642 | 142 | ||||||
Hudson Pacific Properties † | 1,170 | 23 | ||||||
Hudson Valley Holding | 589 | 11 | ||||||
Huntington Bancshares | 135,698 | 1,121 | ||||||
IBERIABANK | 19,075 | 989 | ||||||
| Market Value | ||||||||
Description | Shares | ($ Thousands) | ||||||
Independent Bank | 800 | $ | 29 | |||||
Infinity Property & Casualty | 6,577 | 425 | ||||||
Inland Real Estate † | 51,900 | 531 | ||||||
International Bancshares | 454 | 10 | ||||||
Invesco Mortgage Capital † | 2,400 | 37 | ||||||
Investment Technology Group | 715 | 11 | ||||||
Investors Bancorp, Cl A | 10,868 | 238 | ||||||
Investors Real Estate Trust † | 1,800 | 15 | ||||||
iStar Financial * † | 1,894 | 23 | ||||||
Janus Capital Group (A) | 35,200 | 300 | ||||||
JAVELIN Mortgage Investment † (A) | 739 | 9 | ||||||
Jones Lang LaSalle | 583 | 51 | ||||||
KCG Holdings, Cl A * | 1,412 | 12 | ||||||
Kemper, Cl A | 2,400 | 81 | ||||||
Kilroy Realty † | 1,275 | 64 | ||||||
Kite Realty Group Trust † | 2,276 | 13 | ||||||
LaSalle Hotel Properties † | 16,743 | 477 | ||||||
Legg Mason (A) | 2,550 | 85 | ||||||
Leucadia National | 2,622 | 71 | ||||||
Lexington Realty Trust † (A) | 75,069 | 843 | ||||||
Liberty Property Trust † | 1,700 | 61 | ||||||
LPL Financial Holdings | 655 | 25 | ||||||
LTC Properties † | 2,500 | 95 | ||||||
Mack-Cali Realty † | 1,500 | 33 | ||||||
Main Street Capital | 423 | 13 | ||||||
MainSource Financial Group | 1,220 | 18 | ||||||
Manning & Napier, Cl A | 843 | 14 | ||||||
Markel | 199 | 103 | ||||||
MarketAxess Holdings | 4,077 | 245 | ||||||
MB Financial | 2,400 | 68 | ||||||
MBIA | 5,600 | 57 | ||||||
MCG Capital | 7,700 | 39 | ||||||
Meadowbrook Insurance Group | 27,900 | 181 | ||||||
Medical Properties Trust † | 5,500 | 67 | ||||||
Mercury General | 500 | 24 | ||||||
MFA Financial † | 96,582 | 720 | ||||||
MGIC Investment | 7,929 | 58 | ||||||
Mid-America Apartment Communities † | 6,060 | 379 | ||||||
Monmouth Real Estate Investment, Cl A † | 1,055 | 10 | ||||||
Montpelier Re Holdings | 18,100 | 472 | ||||||
Moody’s | 12,521 | 880 | ||||||
Mortgage Investment Trust † | 569 | 9 | ||||||
MPG Office Trust * † | 3,215 | 10 | ||||||
MSCI, Cl A * | 2,800 | 113 | ||||||
NASDAQ OMX Group, Cl A | 1,149 | 37 | ||||||
National Bank Holdings, Cl A | 516 | 11 | ||||||
National Health Investors † | 800 | 46 | ||||||
National Penn Bancshares | 46,067 | 463 | ||||||
National Retail Properties † (A) | 1,600 | 51 | ||||||
National Western Life Insurance, Cl A | 200 | 40 | ||||||
Navigators Group | 800 | 46 | ||||||
NBT Bancorp | 800 | 18 | ||||||
Nelnet, Cl A | 932 | 36 | ||||||
New Residential Investment † | 3,586 | 24 | ||||||
New York Mortgage Trust † | 1,501 | 9 | ||||||
Northfield Bancorp | 1,122 | 14 | ||||||
NorthStar Realty Finance † | 3,462 | 32 | ||||||
Northwest Bancshares | 4,100 | 54 | ||||||
| 6 | SEI Institutional Managed Trust / Annual Report / September 30, 2013 |
Schedule of Investments
Tax—Managed Small / Mid Cap Fund
September 30, 2013
| Market Value | ||||||||
Description | Shares | ($ Thousands) | ||||||
Ocwen Financial * | 4,200 | $ | 234 | |||||
OFG Bancorp | 32,196 | 521 | ||||||
Old National Bancorp, Cl A | 51,286 | 728 | ||||||
Old Republic International | 4,000 | 62 | ||||||
Omega Healthcare Investors † (A) | 19,600 | 585 | ||||||
OmniAmerican Bancorp, Cl A * | 888 | 22 | ||||||
One Liberty Properties † | 140 | 3 | ||||||
Oppenheimer Holdings, Cl A | 660 | 12 | ||||||
Oritani Financial | 4,100 | 68 | ||||||
Pacific Continental | 884 | 12 | ||||||
PacWest Bancorp (A) | 33,580 | 1,154 | ||||||
Park National (A) | 300 | 24 | ||||||
Parkway Properties † | 613 | 11 | ||||||
PartnerRe | 12,209 | 1,118 | ||||||
Pebblebrook Hotel Trust † | 25,271 | 726 | ||||||
PennantPark Investment | 4,200 | 47 | ||||||
Pennsylvania † | 27,100 | 507 | ||||||
PennyMac Mortgage Investment Trust † | 15,076 | 342 | ||||||
Peoples Bancorp | 427 | 9 | ||||||
People’s United Financial | 9,000 | 129 | ||||||
PHH * | 1,000 | 24 | ||||||
Phoenix * | 230 | 9 | ||||||
Platinum Underwriters Holdings | 7,872 | 470 | ||||||
Popular | 13,850 | 363 | ||||||
Portfolio Recovery Associates | 1,200 | 72 | ||||||
Post Properties † | 8,570 | 386 | ||||||
Principal Financial Group, Cl A | 7,000 | 300 | ||||||
PrivateBancorp, Cl A | 8,400 | 180 | ||||||
ProAssurance | 14,767 | 665 | ||||||
ProLogis † | 9,597 | 361 | ||||||
Prospect Capital | 5,940 | 66 | ||||||
Prosperity Bancshares | 12,545 | 776 | ||||||
Protective Life | 1,100 | 47 | ||||||
Provident Financial Services | 11,461 | 186 | ||||||
PS Business Parks † | 800 | 60 | ||||||
Radian Group (A) | 45,363 | 632 | ||||||
RAIT Financial Trust † | 15,380 | 109 | ||||||
Ramco-Gershenson Properties † | 2,300 | 35 | ||||||
Raymond James Financial | 1,947 | 81 | ||||||
Rayonier † | 2,835 | 158 | ||||||
Realogy Holdings * | 2,451 | 106 | ||||||
Realty Income † (A) | 2,370 | 94 | ||||||
Redwood Trust † (A) | 1,200 | 24 | ||||||
Regency Centers † | 902 | 44 | ||||||
Regional Management * | 1,170 | 37 | ||||||
Regions Financial | 49,700 | 460 | ||||||
Reinsurance Group of America, Cl A | 13,722 | 919 | ||||||
RenaissanceRe Holdings | 1,520 | 138 | ||||||
Resource Capital † | 2,600 | 15 | ||||||
RLI | 800 | 70 | ||||||
RLJ Lodging Trust † | 1,749 | 41 | ||||||
Ryman Hospitality Properties † | 720 | 25 | ||||||
S&T Bancorp | 5,000 | 121 | ||||||
Sabra Health Care † | 2,365 | 54 | ||||||
Safeguard Scientifics * | 36,090 | 566 | ||||||
Selective Insurance Group | 23,985 | 588 | ||||||
Senior Housing Properties Trust † | 3,100 | 72 | ||||||
Signature Bank NY, Cl B | 14,570 | 1,333 | ||||||
Silver Bay Realty Trust † (A) | 239 | 4 | ||||||
Solar Capital | 7,827 | 174 | ||||||
| Market Value | ||||||||
Description | Shares | ($ Thousands) | ||||||
Southwest Bancorp * | 1,279 | $ | 19 | |||||
Sovran Self Storage † | 1,800 | 136 | ||||||
Spirit Realty Capital † | 8,088 | 74 | ||||||
StanCorp Financial Group | 11,800 | 649 | ||||||
Starwood Property Trust † | 2,300 | 55 | ||||||
State Bank Financial | 1,268 | 20 | ||||||
Stellus Capital Investment (A) | 700 | 10 | ||||||
Sterling Financial | 7,765 | 222 | ||||||
Stifel Financial * (A) | 18,635 | 768 | ||||||
Strategic Hotels & Resorts * † | 8,200 | 71 | ||||||
Summit Hotel Properties † | 1,225 | 11 | ||||||
Sun Communities † | 1,400 | 60 | ||||||
Sunstone Hotel Investors † | 5,100 | 65 | ||||||
SunTrust Banks | 17,321 | 562 | ||||||
Susquehanna Bancshares | 74,259 | 932 | ||||||
SVB Financial Group, Cl B | 9,803 | 847 | ||||||
Symetra Financial | 18,800 | 335 | ||||||
Synovus Financial | 21,700 | 72 | ||||||
Tanger Factory Outlet Centers † | 2,000 | 65 | ||||||
Taubman Centers † | 1,576 | 106 | ||||||
TCF Financial (A) | 51,322 | 733 | ||||||
TD Ameritrade Holding | 14,777 | 387 | ||||||
Terreno Realty † | 654 | 12 | ||||||
Texas Capital Bancshares * | 2,000 | 92 | ||||||
Tower Group International | 3,359 | 24 | ||||||
Trustmark | 900 | 23 | ||||||
Two Harbors Investment † | 57,700 | 560 | ||||||
UMH Properties † | 1,982 | 20 | ||||||
Umpqua Holdings (A) | 13,297 | 216 | ||||||
United Bankshares (A) | 4,300 | 125 | ||||||
United Community Banks | 805 | 12 | ||||||
United Fire Group | 4,000 | 122 | ||||||
Universal Health Realty Income Trust † | 296 | 12 | ||||||
Unum Group | 29,518 | 899 | ||||||
Validus Holdings | 11,942 | 442 | ||||||
Valley National Bancorp (A) | 6,730 | 67 | ||||||
ViewPoint Financial Group | 3,900 | 81 | ||||||
Virtus Investment Partners * | 2,337 | 380 | ||||||
Waddell & Reed Financial, Cl A | 1,215 | 63 | ||||||
Walter Investment Management | 1,164 | 46 | ||||||
Washington † | 2,400 | 61 | ||||||
Washington Federal | 1,500 | 31 | ||||||
Webster Financial | 7,700 | 197 | ||||||
Weingarten Realty Investors † | 2,140 | 63 | ||||||
WesBanco | 12,800 | 381 | ||||||
Westamerica Bancorporation (A) | 900 | 45 | ||||||
Western Alliance Bancorp | 35,258 | 667 | ||||||
Western Asset Mortgage Capital † (A) | 944 | 15 | ||||||
White Mountains Insurance Group | 100 | 57 | ||||||
Whitestone, Cl B † | 640 | 9 | ||||||
Willis Group Holdings | 11,615 | 503 | ||||||
Wilshire Bancorp | 1,754 | 14 | ||||||
Winthrop Realty Trust † | 870 | 10 | ||||||
Wintrust Financial | 600 | 25 | ||||||
WisdomTree Investments | 33,922 | 394 | ||||||
World Acceptance (A) | 800 | 72 | ||||||
WR Berkley | 286 | 12 | ||||||
WSFS Financial | 9,120 | 549 | ||||||
ZAIS Financial † (A) | 562 | 10 | ||||||
| 7 | SEI Institutional Managed Trust / Annual Report / September 30, 2013 |
Schedule of Investments
Tax—Managed Small / Mid Cap Fund
September 30, 2013
| Market Value | ||||||||
Description | Shares | ($ Thousands) | ||||||
Zions Bancorporation | 23,172 | $ | 635 | |||||
|
| |||||||
| 84,495 | ||||||||
|
| |||||||
Health Care — 11.5% | ||||||||
Abaxis | 1,600 | 67 | ||||||
ABIOMED * | 473 | 9 | ||||||
Acadia Healthcare, Cl A * (A) | 43,359 | 1,710 | ||||||
ACADIA Pharmaceuticals * (A) | 1,229 | 34 | ||||||
Accuray * | 4,734 | 35 | ||||||
Achillion Pharmaceuticals | 1,268 | 4 | ||||||
Acorda Therapeutics | 441 | 15 | ||||||
Actavis * | 4,859 | 700 | ||||||
Aegerion Pharmaceuticals, Cl A | 522 | 45 | ||||||
Aetna, Cl A | 1,554 | 99 | ||||||
Affymetrix, Cl A | 4,300 | 27 | ||||||
Agilent Technologies | 16,571 | 849 | ||||||
Air Methods | 1,800 | 77 | ||||||
Akorn * | 45,333 | 892 | ||||||
Alere * | 2,690 | 82 | ||||||
Alexion Pharmaceuticals * | 4,530 | 526 | ||||||
Algeta * | 11,072 | 427 | ||||||
Align Technology | 23,810 | 1,146 | ||||||
Alkermes | 4,000 | 134 | ||||||
Allscripts Healthcare Solutions * | 2,740 | 41 | ||||||
Alnylam Pharmaceuticals * | 2,841 | 182 | ||||||
AmerisourceBergen | 6,134 | 375 | ||||||
Amsurg | 11,452 | 455 | ||||||
Antares Pharma * (A) | 5,209 | 21 | ||||||
Arena Pharmaceuticals * (A) | 9,805 | 52 | ||||||
Ariad Pharmaceuticals * | 6,800 | 125 | ||||||
Arqule | 4,292 | 10 | ||||||
Array BioPharma * | 5,436 | 34 | ||||||
ArthroCare | 2,478 | 88 | ||||||
Astex Pharmaceuticals * | 1,777 | 15 | ||||||
athenahealth | 1,600 | 174 | ||||||
Auxilium Pharmaceuticals | 612 | 11 | ||||||
AVANIR Pharmaceuticals, Cl A * | 2,263 | 9 | ||||||
BioMarin Pharmaceuticals | 2,726 | 197 | ||||||
Bio-Reference Labs | 1,000 | 30 | ||||||
Brookdale Senior Living, Cl A * | 20,626 | 542 | ||||||
Bruker BioSciences * | 20,184 | 417 | ||||||
Capital Senior Living * | 200 | 4 | ||||||
CareFusion * | 13,842 | 511 | ||||||
Catamaran | 1,536 | 71 | ||||||
Celldex Therapeutics, Cl A (A) | 17,407 | 617 | ||||||
Centene * | 1,600 | 102 | ||||||
Cepheid (A) | 7,980 | 312 | ||||||
Cerus * | 5,403 | 36 | ||||||
Charles River Laboratories International * | 17,380 | 804 | ||||||
Chemed (A) | 800 | 57 | ||||||
Clovis Oncology * | 4,143 | 252 | ||||||
Community Health Systems | 11,237 | 466 | ||||||
Computer Programs & Systems | 800 | 47 | ||||||
Conmed | 16,275 | 553 | ||||||
Cooper, Cl A | 1,084 | 141 | ||||||
Coronado Biosciences * (A) | 19,910 | 140 | ||||||
Covance * | 11,966 | 1,035 | ||||||
Cubist Pharmaceuticals | 25,437 | 1,616 | ||||||
Curis * (A) | 3,125 | 14 | ||||||
Cytokinetics * | 916 | 7 | ||||||
Dendreon (A) | 2,784 | 8 | ||||||
| Market Value | ||||||||
Description | Shares | ($ Thousands) | ||||||
Dentsply International | 11,106 | $ | 482 | |||||
DexCom * | 27,297 | 771 | ||||||
Dyax * | 3,774 | 26 | ||||||
Emergent Biosolutions * | 1,200 | 23 | ||||||
Emeritus | 1,400 | 26 | ||||||
Endo Pharmaceuticals Holdings * | 11,142 | 506 | ||||||
Endocyte * (A) | 4,773 | 63 | ||||||
Endologix | 1,338 | 22 | ||||||
Envision Healthcare Holdings * | 31,300 | 815 | ||||||
Exact Sciences | 963 | 11 | ||||||
Exelixis (A) | 53,190 | 310 | ||||||
Gentiva Health Services | 700 | 8 | ||||||
Globus Medical, Cl A * | 581 | 10 | ||||||
Greatbatch | 29,050 | 989 | ||||||
Greenway Medical Technologies (A) | 1,121 | 23 | ||||||
Haemonetics * | 1,600 | 64 | ||||||
Halozyme Therapeutics (A) | 2,500 | 28 | ||||||
Hanger Orthopedic Group * | 1,546 | 52 | ||||||
Health Management Associates, Cl A | 5,100 | 65 | ||||||
Health Net, Cl A | 1,800 | 57 | ||||||
HealthSouth | 25,587 | 882 | ||||||
Healthways | 3,400 | 63 | ||||||
HeartWare International * | 15,521 | 1,136 | ||||||
Hill-Rom Holdings | 1,400 | 50 | ||||||
HMS Holdings * | 2,100 | 45 | ||||||
Hologic | 9,219 | 190 | ||||||
Horizon Pharma * (A) | 4,049 | 14 | ||||||
Humana | 12,651 | 1,181 | ||||||
Hyperion Therapeutics * | 19,131 | 500 | ||||||
ICON * | 23,320 | 954 | ||||||
Idexx Laboratories | 1,226 | 122 | ||||||
Illumina * | 9,124 | 737 | ||||||
Immunogen * (A) | 26,820 | 456 | ||||||
Immunomedics * | 1,942 | 12 | ||||||
Impax Laboratories * | 2,000 | 41 | ||||||
Incyte | 13,610 | 519 | ||||||
Insulet | 20,660 | 749 | ||||||
Intercept Pharmaceuticals * | 4,570 | 315 | ||||||
InterMune | 1,670 | 26 | ||||||
IPC The Hospitalist | 12,916 | 659 | ||||||
Ironwood Pharmaceuticals, Cl A * (A) | 23,052 | 273 | ||||||
Isis Pharmaceuticals | 15,700 | 589 | ||||||
Jazz Pharmaceuticals (A) | 10,806 | 994 | ||||||
Keryx Biopharmaceuticals * (A) | 1,450 | 15 | ||||||
Kindred Healthcare | 21,945 | 295 | ||||||
LHC Group | 500 | 12 | ||||||
LifePoint Hospitals | 6,700 | 312 | ||||||
Magellan Health Services * | 8,055 | 483 | ||||||
MAKO Surgical * (A) | 835 | 25 | ||||||
MannKind * (A) | 9,300 | 53 | ||||||
Masimo | 1,600 | 43 | ||||||
MedAssets * | 5,591 | 142 | ||||||
Medicines * | 15,249 | 511 | ||||||
Medidata Solutions * | 360 | 35 | ||||||
Medivation * | 1,438 | 86 | ||||||
MEDNAX | 21,433 | 2,152 | ||||||
Meridian Bioscience | 2,500 | 59 | ||||||
Merit Medical Systems * | 3,125 | 38 | ||||||
Merrimack Pharmaceuticals * (A) | 2,260 | 9 | ||||||
| 8 | SEI Institutional Managed Trust / Annual Report / September 30, 2013 |
Schedule of Investments
Tax—Managed Small / Mid Cap Fund
September 30, 2013
| Market Value | ||||||||
Description | Shares | ($ Thousands) | ||||||
Mettler Toledo International | 592 | $ | 142 | |||||
Momenta Pharmaceuticals * | 18,067 | 260 | ||||||
Myriad Genetics * | 2,200 | 52 | ||||||
Navidea Biopharmaceuticals (A) | 5,425 | 14 | ||||||
Nektar Therapeutics | 8,109 | 85 | ||||||
Neogen, Cl B | 900 | 55 | ||||||
NPS Pharmaceuticals | 34,231 | 1,089 | ||||||
NuVasive * | 1,300 | 32 | ||||||
NxStage Medical * | 707 | 9 | ||||||
Omeros * (A) | 1,972 | 19 | ||||||
Omnicare | 3,200 | 178 | ||||||
Omnicell | 1,300 | 31 | ||||||
Opko Health * (A) | 1,431 | 13 | ||||||
Optimer Pharmaceuticals | 767 | 10 | ||||||
OraSure Technologies * | 2,604 | 16 | ||||||
Orexigen Therapeutics * | 1,680 | 10 | ||||||
Orthofix International | 4,400 | 92 | ||||||
Owens & Minor (A) | 950 | 33 | ||||||
Pacific Biosciences of California | 5,998 | 33 | ||||||
Pacira Pharmaceuticals * (A) | 31,083 | 1,495 | ||||||
Parexel International | 19,700 | 989 | ||||||
Patterson | 13,184 | 530 | ||||||
PDL BioPharma | 31,100 | 248 | ||||||
PerkinElmer | 13,402 | 506 | ||||||
Pharmacyclics * | 3,521 | 487 | ||||||
PharMerica | 19,200 | 255 | ||||||
Premier, Cl A * | 13,693 | 434 | ||||||
Progenics Pharmaceuticals * | 2,272 | 11 | ||||||
Puma Biotechnology * | 5,991 | 321 | ||||||
QIAGEN | 8,077 | 173 | ||||||
Quest Diagnostics | 8,270 | 511 | ||||||
Questcor Pharmaceuticals | 6,945 | 403 | ||||||
Raptor Pharmaceutical * (A) | 977 | 15 | ||||||
Regeneron Pharmaceuticals * | 1,458 | 456 | ||||||
Repros Therapeutics * (A) | 9,960 | 267 | ||||||
ResMed (A) | 4,239 | 224 | ||||||
Rigel Pharmaceuticals * | 2,958 | 11 | ||||||
Rockwell Medical * (A) | 2,762 | 31 | ||||||
Salix Pharmaceuticals | 11,000 | 736 | ||||||
Sangamo Biosciences | 980 | 10 | ||||||
Santarus * | 509 | 11 | ||||||
Sarepta Therapeutics * (A) | 552 | 26 | ||||||
Sciclone Pharmaceuticals * | 41,200 | 209 | ||||||
Seattle Genetics * (A) | 15,580 | 683 | ||||||
Select Medical Holdings | 33,500 | 270 | ||||||
Sequenom * (A) | 9,761 | 26 | ||||||
Sirona Dental Systems, Cl A | 18,170 | 1,216 | ||||||
Spectrum Pharmaceuticals (A) | 1,441 | 12 | ||||||
Staar Surgical * | 978 | 13 | ||||||
STERIS, Cl A | 1,400 | 60 | ||||||
Symmetry Medical * | 1,500 | 12 | ||||||
Synageva BioPharma, Cl A | 4,726 | 299 | ||||||
Synergy Pharmaceuticals * | 2,164 | 10 | ||||||
Team Health Holdings | 35,068 | 1,330 | ||||||
TearLab * (A) | 21,429 | 237 | ||||||
Techne, Cl A | 900 | 72 | ||||||
Teleflex | 3,789 | 312 | ||||||
Tenet Healthcare * | 3,525 | 145 | ||||||
TESARO * (A) | 13,523 | 524 | ||||||
Theravance, Cl A | 1,400 | 57 | ||||||
Thoratec * | 1,500 | 56 | ||||||
| Market Value | ||||||||
Description | Shares | ($ Thousands) | ||||||
Tornier BV | 721 | $ | 14 | |||||
Unilife (A) | 3,311 | 11 | ||||||
United Therapeutics | 10,414 | 821 | ||||||
Universal Health Services, Cl B | 2,241 | 168 | ||||||
US Physical Therapy | 900 | 28 | ||||||
Valeant Pharmaceuticals International | 8,605 | 898 | ||||||
Vertex Pharmaceuticals | 7,573 | 574 | ||||||
ViroPharma | 2,500 | 98 | ||||||
Vivus (A) | 2,439 | 23 | ||||||
Vocera Communications | 732 | 14 | ||||||
Volcano | 2,000 | 48 | ||||||
Warner Chilcott, Cl A | 5,284 | 121 | ||||||
WellCare Health Plans | 19,943 | 1,391 | ||||||
West Pharmaceutical Services | 2,200 | 91 | ||||||
Wright Medical Group | 970 | 25 | ||||||
XenoPort | 2,066 | 12 | ||||||
XOMA | 6,744 | 30 | ||||||
|
| |||||||
| 55,810 | ||||||||
|
| |||||||
Industrials — 17.5% | ||||||||
3D Systems * (A) | 2,147 | 116 | ||||||
AAON Inc. | 3,375 | 90 | ||||||
AAR | 1,100 | 30 | ||||||
ABM Industries | 2,100 | 56 | ||||||
Acacia Research (A) | 1,500 | 35 | ||||||
ACCO Brands * | 1,991 | 13 | ||||||
Accuride | 3,007 | 15 | ||||||
Acorn Energy (A) | 1,163 | 7 | ||||||
Actuant, Cl A | 50,075 | 1,945 | ||||||
Acuity Brands | 15,488 | 1,425 | ||||||
Advisory Board | 2,000 | 119 | ||||||
Aecom Technology * | 1,800 | 56 | ||||||
Aerovironment | 1,600 | 37 | ||||||
AGCO | 16,397 | 991 | ||||||
Air Lease, Cl A | 19,936 | 551 | ||||||
Aircastle | 31,832 | 554 | ||||||
Alaska Air Group | 1,600 | 100 | ||||||
Albany International, Cl A | 1,900 | 68 | ||||||
Alliant Techsystems | 7,015 | 684 | ||||||
Altra Holdings | 34,013 | 915 | ||||||
Ampco-Pittsburgh | 8,000 | 143 | ||||||
AO Smith | 2,200 | 99 | ||||||
Apogee Enterprises | 20,550 | �� | 610 | |||||
Applied Industrial Technologies, Cl A | 16,301 | 840 | ||||||
ARC Document Solutions * | 2,532 | 12 | ||||||
Arkansas Best | 900 | 23 | ||||||
Armstrong World Industries | 19,979 | 1,098 | ||||||
Atlas Air Worldwide Holdings * | 800 | 37 | ||||||
Avery Dennison | 1,272 | 55 | ||||||
Avis Budget Group * | 20,807 | 600 | ||||||
Barnes Group | 12,250 | 428 | ||||||
BE Aerospace | 1,577 | 116 | ||||||
Beacon Roofing Supply | 5,422 | 200 | ||||||
Belden | 16,897 | 1,082 | ||||||
Blount International | 5,419 | 66 | ||||||
Brady, Cl A | 244 | 7 | ||||||
Briggs & Stratton (A) | 33,192 | 668 | ||||||
Brink’s | 3,100 | 88 | ||||||
Calgon Carbon | 5,791 | 110 | ||||||
Canadian Pacific Railway | 3,319 | 409 | ||||||
| 9 | SEI Institutional Managed Trust / Annual Report / September 30, 2013 |
Schedule of Investments
Tax—Managed Small / Mid Cap Fund
September 30, 2013
| Market Value | ||||||||
Description | Shares | ($ Thousands) | ||||||
Carlisle | 26,958 | $ | 1,895 | |||||
Casella Waste Systems, Cl A * | 2,536 | 15 | ||||||
Chart Industries * | 10,506 | 1,293 | ||||||
Chicago Bridge & Iron | 2,261 | 153 | ||||||
Cintas | 12,151 | 622 | ||||||
CIRCOR International | 10,985 | 683 | ||||||
Clarcor | 1,200 | 67 | ||||||
Clean Harbors * | 18,564 | 1,089 | ||||||
Colfax * | 5,231 | 295 | ||||||
Con-way | 19,621 | 846 | ||||||
Copa Holdings, Cl A | 2,016 | 280 | ||||||
Copart | 2,400 | 76 | ||||||
Corporate Executive Board | 1,100 | 80 | ||||||
Covanta Holding | 3,100 | 66 | ||||||
Crane, Cl A | 600 | 37 | ||||||
Curtiss-Wright | 26,497 | 1,244 | ||||||
Delta Air Lines, Cl A | 33,230 | 784 | ||||||
Deluxe | 11,400 | 475 | ||||||
DigitalGlobe * | 27,238 | 861 | ||||||
Donaldson, Cl A | 3,704 | 141 | ||||||
Dover | 6,100 | 548 | ||||||
Dun & Bradstreet | 388 | 40 | ||||||
Dycom Industries * | 37,610 | 1,053 | ||||||
Dynamic Materials | 986 | 23 | ||||||
EMCOR Group | 19,967 | 781 | ||||||
EnerNOC * | 1,300 | 19 | ||||||
Engility Holdings | 1,216 | 39 | ||||||
EnPro Industries | 5,521 | 332 | ||||||
Equifax | 2,212 | 132 | ||||||
ESCO Technologies | 3,936 | 131 | ||||||
Esterline Technologies * | 800 | 64 | ||||||
Exelis | 1,677 | 26 | ||||||
Federal Signal | 3,905 | 50 | ||||||
Flowserve | 11,463 | 715 | ||||||
Fluor | 17,461 | 1,239 | ||||||
Fortune Brands Home & Security | 17,594 | 732 | ||||||
Forward Air | 4,163 | 168 | ||||||
Franklin Electric | 5,956 | 235 | ||||||
FTI Consulting | 11,988 | 453 | ||||||
G&K Services | 22,348 | 1,350 | ||||||
GATX | 700 | 33 | ||||||
GenCorp | 3,047 | 49 | ||||||
Generac Holdings | 43,048 | 1,836 | ||||||
General Cable | 8,827 | 280 | ||||||
Genesee & Wyoming, Cl A * | 11,043 | 1,027 | ||||||
Gibraltar Industries * | 686 | 10 | ||||||
Gorman-Rupp | 1,562 | 63 | ||||||
Graco | 600 | 44 | ||||||
GrafTech International (A) | 2,200 | 19 | ||||||
Graham, Cl A | 528 | 19 | ||||||
Granite Construction | 5,570 | 170 | ||||||
Great Lakes Dredge & Dock | 3,253 | 24 | ||||||
Greenbrier * | 15,900 | 393 | ||||||
Harsco | 3,200 | 80 | ||||||
Hawaiian Holdings (A) | 41,000 | 305 | ||||||
HD Supply Holdings * | 54,911 | 1,206 | ||||||
Heartland Express | 2,631 | 37 | ||||||
HEICO | 1,761 | 119 | ||||||
Heidrick & Struggles International | 411 | 8 | ||||||
Herman Miller | 1,500 | 44 | ||||||
Hertz Global Holdings * | 29,064 | 644 | ||||||
| Market Value | ||||||||
Description | Shares | ($ Thousands) | ||||||
Hexcel, Cl A * | 29,460 | $ | 1,143 | |||||
Higher One Holdings * (A) | 781 | 6 | ||||||
HNI | 3,926 | 142 | ||||||
Hub Group, Cl A * | 1,400 | 55 | ||||||
Hubbell, Cl B | 1,284 | 134 | ||||||
Hyster-Yale Materials Handling | 1,266 | 114 | ||||||
IDEX | 16,310 | 1,064 | ||||||
II-VI | 2,000 | 38 | ||||||
Insteel Industries | 905 | 14 | ||||||
Interface, Cl A | 78,455 | 1,557 | ||||||
JB Hunt Transport Services | 10,796 | 787 | ||||||
JetBlue Airways * | 1,486 | 10 | ||||||
John Bean Technologies, Cl A | 8,177 | 203 | ||||||
Kadant | 25,677 | 862 | ||||||
Kaman, Cl A | 2,096 | 79 | ||||||
KAR Auction Services | 17,343 | 489 | ||||||
Kaydon | 8,116 | 288 | ||||||
KBR | 4,000 | 131 | ||||||
Kelly Services, Cl A | 1,200 | 23 | ||||||
Kennametal | 1,100 | 50 | ||||||
Keyw Holding, Cl A * (A) | 32,535 | 438 | ||||||
Kirby * | 20,577 | 1,781 | ||||||
Knoll, Cl B | 1,200 | 20 | ||||||
Kratos Defense & Security Solutions * | 1,570 | 13 | ||||||
L-3 Communications Holdings | 7,300 | 690 | ||||||
Landstar System | 1,100 | 62 | ||||||
Layne Christensen | 1,000 | 20 | ||||||
Leidos Holdings * (A) | 7,453 | 339 | ||||||
Lennox International | 2,400 | 181 | ||||||
Lincoln Electric Holdings | 15,186 | 1,012 | ||||||
Lydall | 7,291 | 125 | ||||||
Manitowoc | 2,585 | 51 | ||||||
Manpowergroup | 1,493 | 109 | ||||||
Marten Transport | 2,100 | 36 | ||||||
MasTec | 4,539 | 137 | ||||||
Mcgrath Rentcorp | 1,900 | 68 | ||||||
Middleby * | 5,440 | 1,136 | ||||||
Moog, Cl A * | 30,666 | 1,799 | ||||||
MRC Global * | 358 | 10 | ||||||
MSC Industrial Direct, Cl A | 8,352 | 680 | ||||||
Mueller Industries | 500 | 28 | ||||||
Mueller Water Products, Cl A | 6,176 | 49 | ||||||
National Presto Industries | 100 | 7 | ||||||
Navistar International * | 993 | 36 | ||||||
Nordson | 1,300 | 96 | ||||||
Northwest Pipe * | 14,820 | 487 | ||||||
Old Dominion Freight Line, Cl A | 21,039 | 968 | ||||||
On Assignment | 17,343 | 572 | ||||||
Orbital Sciences * | 9,117 | 193 | ||||||
Orion Marine Group | 18,042 | 188 | ||||||
Oshkosh Truck | 13,500 | 661 | ||||||
Owens Corning | 30,795 | 1,170 | ||||||
Pall | 13,368 | 1,030 | ||||||
Parker Hannifin, Cl A | 5,185 | 564 | ||||||
Pentair | 2,782 | 181 | ||||||
Performant Financial * | 11,980 | 131 | ||||||
Pitney Bowes (A) | 23,538 | 428 | ||||||
Polypore International * (A) | 10,501 | 430 | ||||||
Quad (A) | 12,000 | 364 | ||||||
Quanex Building Products | 1,800 | 34 | ||||||
Quanta Services * | 3,656 | 101 | ||||||
| 10 | SEI Institutional Managed Trust / Annual Report / September 30, 2013 |
Schedule of Investments
Tax—Managed Small / Mid Cap Fund
September 30, 2013
| Market Value | ||||||||
Description | Shares | ($ Thousands) | ||||||
RBC Bearings | 11,621 | $ | 766 | |||||
Regal-Beloit | 12,903 | 877 | ||||||
Republic Airways Holdings * | 28,200 | 336 | ||||||
Resources Connection | 2,600 | 35 | ||||||
Robert Half International | 2,370 | 93 | ||||||
RR Donnelley & Sons (A) | 39,066 | 617 | ||||||
Ryder System | 8,900 | 531 | ||||||
Saia | 9,900 | 309 | ||||||
Simpson Manufacturing | 19,760 | 644 | ||||||
Skywest | 11,800 | 171 | ||||||
SolarCity * (A) | 363 | 13 | ||||||
Spirit Aerosystems Holdings, Cl A * | 1,500 | 36 | ||||||
Spirit Airlines | 25,591 | 877 | ||||||
SPX | 600 | 51 | ||||||
Stanley Black & Decker | 6,461 | 585 | ||||||
Steelcase, Cl A | 25,800 | 429 | ||||||
Stericycle, Cl A * | 5,986 | 691 | ||||||
Stratasys (A) | 585 | 59 | ||||||
Swift Transportation, Cl A * | 636 | 13 | ||||||
TAL International Group (A) | 6,200 | 290 | ||||||
Team * | 6,947 | 276 | ||||||
Teledyne Technologies * | 13,100 | 1,113 | ||||||
Terex | 9,728 | 327 | ||||||
Tetra Tech * | 19,424 | 503 | ||||||
Textron | 7,400 | 204 | ||||||
Timken | 6,716 | 406 | ||||||
Toro | 1,400 | 76 | ||||||
Towers Watson, Cl A | 9,965 | 1,066 | ||||||
TransDigm Group | 1,533 | 213 | ||||||
TRC | 1,458 | 11 | ||||||
Trimas | 9,432 | 352 | ||||||
Trinity Industries | 16,839 | 764 | ||||||
Triumph Group | 7,500 | 527 | ||||||
TrueBlue * | 72,166 | 1,733 | ||||||
Tutor Perini | 3,700 | 79 | ||||||
Unifirst | 644 | 67 | ||||||
United Rentals | 19,987 | 1,165 | ||||||
United Stationers | 1,000 | 43 | ||||||
Universal Forest Products | 1,908 | 80 | ||||||
URS | 9,000 | 484 | ||||||
US Airways Group (A) | 3,969 | 75 | ||||||
USG | 1,100 | 31 | ||||||
UTI Worldwide | 2,500 | 38 | ||||||
Valmont Industries | 6,135 | 852 | ||||||
Vicor | 2,300 | 19 | ||||||
Wabash National | 2,806 | 33 | ||||||
Wabtec | 3,600 | 226 | ||||||
WageWorks | 18,756 | 946 | ||||||
Waste Connections | 1,800 | 82 | ||||||
Watsco | 600 | 57 | ||||||
Watts Water Technologies, Cl A | 5,373 | 303 | ||||||
Werner Enterprises | 1,900 | 44 | ||||||
WESCO International | 14,940 | 1,143 | ||||||
Woodward | 1,400 | 57 | ||||||
Xylem | 19,963 | 558 | ||||||
YRC Worldwide * (A) | 375 | 6 | ||||||
|
| |||||||
| 85,036 | ||||||||
|
| |||||||
Information Technology — 17.7% | ||||||||
Accelrys * | 1,224 | 12 | ||||||
ACI Worldwide * | 3,453 | 187 | ||||||
| Market Value | ||||||||
Description | Shares | ($ Thousands) | ||||||
Acxiom * | 42,207 | $ | 1,198 | |||||
Adtran (A) | 24,565 | 654 | ||||||
Advanced Energy Industries * | 13,600 | 238 | ||||||
Advanced Micro Devices | 12,970 | 49 | ||||||
Advent Software | 1,000 | 32 | ||||||
Alliance Data Systems * | 5,741 | 1,214 | ||||||
Amdocs | 15,300 | 561 | ||||||
Amphenol, Cl A | 10,134 | 784 | ||||||
ANADIGICS * | 4,717 | 9 | ||||||
Angie’s List * (A) | 40,107 | 902 | ||||||
Anixter International * | 500 | 44 | ||||||
Ansys | 2,600 | 225 | ||||||
AOL | 2,700 | 93 | ||||||
Applied Materials | 55,197 | 968 | ||||||
Applied Micro Circuits * | 370 | 5 | ||||||
Arris Group * | 7,200 | 123 | ||||||
Arrow Electronics, Cl A * | 1,900 | 92 | ||||||
Aruba Networks (A) | 17,158 | 285 | ||||||
ASML Holding, Cl G | 690 | 68 | ||||||
Aspen Technology * | 25,743 | 889 | ||||||
Atmel | 76,017 | 566 | ||||||
ATMI * | 800 | 21 | ||||||
Audience * | 895 | 10 | ||||||
Avago Technologies, Cl A | 19,600 | 845 | ||||||
Avnet | 8,652 | 361 | ||||||
Bankrate * (A) | 38,672 | 796 | ||||||
Bazaarvoice * | 1,196 | 11 | ||||||
Benchmark Electronics | 25,511 | 584 | ||||||
Black Box | 5,800 | 178 | ||||||
Blackbaud, Cl A | 1,000 | 39 | ||||||
Bottomline Technologies | 2,964 | 83 | ||||||
Brightcove * | 1,176 | 13 | ||||||
Broadridge Financial Solutions | 1,700 | 54 | ||||||
Brocade Communications Systems | 80,800 | 650 | ||||||
CACI International, Cl A | 2,848 | 197 | ||||||
Cadence Design Systems | 173,953 | 2,348 | ||||||
Calix * | 2,331 | 30 | ||||||
Callidus Software * | 1,561 | 14 | ||||||
Cavium * | 23,710 | 977 | ||||||
Checkpoint Systems * | 1,100 | 18 | ||||||
Ciena * (A) | 42,625 | 1,065 | ||||||
Cognex | 2,800 | 88 | ||||||
Coherent | 4,934 | 303 | ||||||
CommVault Systems * | 1,400 | 123 | ||||||
Computer Sciences | 5,000 | 259 | ||||||
comScore * | 429 | 12 | ||||||
Comtech Telecommunications | 8,619 | 210 | ||||||
Concur Technologies * (A) | 7,546 | 834 | ||||||
Constant Contact | 16,438 | 389 | ||||||
Convergys | 35,357 | 663 | ||||||
CoreLogic | 16,277 | 440 | ||||||
Cornerstone OnDemand | 20,216 | 1,040 | ||||||
CoStar Group | 16,043 | 2,694 | ||||||
Cray | 1,586 | 38 | ||||||
Cree | 2,453 | 148 | ||||||
CSG Systems International | 16,700 | 418 | ||||||
Cvent * | 5,627 | 198 | ||||||
Cypress Semiconductor (A) | 3,500 | 33 | ||||||
Dealertrack Technologies | 51,268 | 2,196 | ||||||
Demand Media | 6,260 | 40 | ||||||
Demandware | 22,408 | 1,038 | ||||||
| 11 | SEI Institutional Managed Trust / Annual Report / September 30, 2013 |
Schedule of Investments
Tax—Managed Small / Mid Cap Fund
September 30, 2013
| Market Value | ||||||||
Description | Shares | ($ Thousands) | ||||||
Diebold | 16,976 | $ | 499 | |||||
Digital River * | 538 | 10 | ||||||
Diodes | 1,800 | 44 | ||||||
DST Systems | 600 | 45 | ||||||
DTS | 502 | 10 | ||||||
EarthLink | 89,059 | 441 | ||||||
Ebix | 896 | 9 | ||||||
Echo Global Logistics | 1,761 | 37 | ||||||
EchoStar, Cl A * | 2,900 | 127 | ||||||
Electronics for Imaging | 1,300 | 41 | ||||||
Emulex | 31,411 | 244 | ||||||
Entegris * | 6,300 | 64 | ||||||
Entropic Communications * | 2,332 | 10 | ||||||
Envestnet | 420 | 13 | ||||||
EPAM Systems * | 372 | 13 | ||||||
Euronet Worldwide * | 1,400 | 56 | ||||||
ExlService Holdings | 6,761 | 193 | ||||||
F5 Networks, Cl A * | 5,583 | 479 | ||||||
Factset Research Systems (A) | 800 | 87 | ||||||
Fair Isaac | 800 | 44 | ||||||
Fairchild Semiconductor International | 27,463 | 381 | ||||||
FARO Technologies * | 1,300 | 55 | ||||||
FEI | 1,500 | 132 | ||||||
Fidelity National Information Services, Cl B | 13,012 | 604 | ||||||
Finisar * | 1,589 | 36 | ||||||
FireEye * | 8,603 | 357 | ||||||
First Solar * (A) | 1,132 | 46 | ||||||
FleetCor Technologies | 9,576 | 1,055 | ||||||
FleetMatics Group | 49,618 | 1,863 | ||||||
Flir Systems | 2,400 | 75 | ||||||
Forgame Holdings * | 2,300 | 15 | ||||||
FormFactor * | 1,169 | 8 | ||||||
Forrester Research | 1,400 | 51 | ||||||
Fusion-io | 1,729 | 23 | ||||||
Gartner * | 2,600 | 156 | ||||||
Genpact | 29,114 | 550 | ||||||
Global Cash Access Holdings | 2,457 | 19 | ||||||
Global Payments | 2,534 | 129 | ||||||
Glu Mobile (A) | 4,445 | 12 | ||||||
GT Advanced Technologies * | 2,771 | 24 | ||||||
Guidewire Software, Cl Z | 22,175 | 1,045 | ||||||
Harris | 11,700 | 694 | ||||||
Heartland Payment Systems (A) | 25,152 | 999 | ||||||
Hittite Microwave, Cl A * | 500 | 33 | ||||||
IAC | 21,184 | 1,158 | ||||||
Immersion * | 2,588 | 34 | ||||||
Imperva * | 3,026 | 127 | ||||||
Infinera * | 65,730 | 743 | ||||||
Infoblox * | 814 | 34 | ||||||
Informatica | 2,900 | 113 | ||||||
Ingram Micro, Cl A | 1,651 | 38 | ||||||
Inphi | 29,688 | 399 | ||||||
Insight Enterprises * | 9,500 | 180 | ||||||
Integrated Device Technology * | 50,575 | 476 | ||||||
Interactive Intelligence Group * | 194 | 12 | ||||||
InterDigital | 1,000 | 37 | ||||||
International Rectifier * | 1,600 | 40 | ||||||
Intersil, Cl A | 3,003 | 34 | ||||||
IntraLinks Holdings, Cl A | 39,230 | 345 | ||||||
InvenSense, Cl A * | 896 | 16 | ||||||
| Market Value | ||||||||
Description | Shares | ($ Thousands) | ||||||
IPG Photonics (A) | 900 | $ | 51 | |||||
Itron * | 422 | 18 | ||||||
Ixia | 18,005 | 282 | ||||||
j2 Global (A) | 1,700 | 84 | ||||||
Jabil Circuit | 24,100 | 522 | ||||||
JDS Uniphase | 4,525 | 66 | ||||||
Jive Software * | 986 | 12 | ||||||
Juniper Networks | 20,887 | 415 | ||||||
Kemet * | 2,428 | 10 | ||||||
KLA-Tencor | 10,591 | 644 | ||||||
KVH Industries * | 779 | 11 | ||||||
Lattice Semiconductor * | 135,851 | 606 | ||||||
Lender Processing Services | 1,114 | 37 | ||||||
Lexmark International, Cl A (A) | 7,099 | 234 | ||||||
Limelight Networks * | 1,566 | 3 | ||||||
LinkedIn, Cl A * | 2,896 | 713 | ||||||
Liquidity Services * (A) | 6,827 | 229 | ||||||
Littelfuse | 800 | 63 | ||||||
LivePerson * | 1,135 | 11 | ||||||
LogMeIn * | 18,630 | 578 | ||||||
LSI Logic | 14,595 | 114 | ||||||
Manhattan Associates | 2,570 | 245 | ||||||
Mantech International, Cl A | 900 | 26 | ||||||
Marketo * | 10,082 | 321 | ||||||
Marvell Technology Group | 25,200 | 290 | ||||||
MAXIMUS | 14,859 | 669 | ||||||
Measurement Specialties | 2,900 | 157 | ||||||
Mentor Graphics | 2,400 | 56 | ||||||
Mercury Systems * | 1,090 | 11 | ||||||
Methode Electronics | 2,700 | 76 | ||||||
Micrel | 7,000 | 64 | ||||||
Microchip Technology (A) | 13,385 | 539 | ||||||
Micros Systems | 1,138 | 57 | ||||||
Microsemi | 1,300 | 32 | ||||||
MicroStrategy, Cl A * | 118 | 12 | ||||||
Millennial Media * | 1,146 | 8 | ||||||
MKS Instruments | 10,993 | 292 | ||||||
Molex | 2,368 | 91 | ||||||
MoneyGram International | 2,123 | 42 | ||||||
Monolithic Power Systems | 2,213 | 67 | ||||||
Monotype Imaging Holdings | 454 | 13 | ||||||
MTS Systems, Cl A | 1,000 | 64 | ||||||
National Instruments | 1,606 | 50 | ||||||
NCR | 3,736 | 148 | ||||||
NetApp | 15,586 | 664 | ||||||
NETGEAR | 1,600 | 49 | ||||||
Netscout Systems * | 4,329 | 111 | ||||||
NetSuite * | 1,400 | 151 | ||||||
NeuStar, Cl A | 1,000 | 49 | ||||||
NIC | 4,100 | 95 | ||||||
Nuance Communications * | 5,900 | 110 | ||||||
NVE * | 200 | 10 | ||||||
OmniVision Technologies | 1,400 | 21 | ||||||
ON Semiconductor * | 11,300 | 83 | ||||||
OpenTable * | 2,967 | 208 | ||||||
OSI Systems * | 1,300 | 97 | ||||||
Palo Alto Networks | 8,832 | 405 | ||||||
Pandora Media (A) | 56,067 | 1,409 | ||||||
Parkervision * (A) | 2,293 | 8 | ||||||
Photronics * | 31,059 | 243 | ||||||
Plantronics | 1,100 | 51 | ||||||
Plexus * | 1,500 | 56 | ||||||
| 12 | SEI Institutional Managed Trust / Annual Report / September 30, 2013 |
Schedule of Investments
Tax—Managed Small / Mid Cap Fund
September 30, 2013
| Market Value | ||||||||
Description | Shares | ($ Thousands) | ||||||
PMC—Sierra * | 8,500 | $ | 56 | |||||
Polycom * | 8,000 | 87 | ||||||
Power Integrations | 16,297 | 883 | ||||||
Procera Networks * | 699 | 11 | ||||||
PROS Holdings * | 332 | 11 | ||||||
PTC * | 95,914 | 2,727 | ||||||
QLIK Technologies | 1,807 | 62 | ||||||
QLogic | 1,076 | 12 | ||||||
Quality Systems | 1,000 | 22 | ||||||
Quantum * | 8,799 | 12 | ||||||
Rackspace Hosting (A) | 2,588 | 137 | ||||||
Rambus | 1,900 | 18 | ||||||
RealD (A) | 2,286 | 16 | ||||||
RealNetworks | 2,800 | 24 | ||||||
RealPage * | 552 | 13 | ||||||
Red Hat | 9,462 | 437 | ||||||
Responsys | 1,557 | 26 | ||||||
RF Micro Devices, Cl A | 89,893 | 507 | ||||||
Riverbed Technology | 3,138 | 46 | ||||||
Rofin-Sinar Technologies * | 1,100 | 27 | ||||||
Rogers * | 10,877 | 647 | ||||||
Rovi | 724 | 14 | ||||||
Rubicon Technology * (A) | 404 | 5 | ||||||
Ruckus Wireless (A) | 851 | 14 | ||||||
SAIC (A) | — | — | ||||||
Sanmina * | 1,177 | 21 | ||||||
Sapient * | 2,100 | 33 | ||||||
Scansource * | 4,143 | 143 | ||||||
Science Applications International * | 4,259 | 144 | ||||||
Seagate Technology | 19,200 | 840 | ||||||
Semtech | 3,100 | 93 | ||||||
ServiceNow * (A) | 17,643 | 917 | ||||||
ServiceSource International * (A) | 39,691 | 479 | ||||||
Shutterstock (A) | 13,918 | 1,012 | ||||||
Silicon Graphics International * (A) | 2,400 | 39 | ||||||
Silicon Laboratories | 1,600 | 68 | ||||||
Skyworks Solutions | 4,477 | 111 | ||||||
SolarWinds | 3,400 | 119 | ||||||
Solera Holdings | 900 | 48 | ||||||
Sonus Networks | 21,550 | 73 | ||||||
Sourcefire | 531 | 40 | ||||||
Splunk | 15,447 | 927 | ||||||
SS&C Technologies Holdings * | 24,251 | 924 | ||||||
Stamps.com * | 12,475 | 573 | ||||||
SunEdison * | 67,503 | 538 | ||||||
SunPower, Cl A (A) | 821 | 22 | ||||||
Sykes Enterprises * | 13,834 | 248 | ||||||
Symantec, Cl A | 16,576 | 410 | ||||||
Synaptics (A) | 21,994 | 974 | ||||||
Synopsys | 22,055 | 831 | ||||||
Syntel | 1,400 | 112 | ||||||
Tableau Software, Cl A * | 3,924 | 280 | ||||||
Take-Two Interactive Software, Cl A * | 2,400 | 44 | ||||||
Tangoe (A) | 689 | 16 | ||||||
Tech Data | 12,100 | 604 | ||||||
TeleTech Holdings | 5,391 | 135 | ||||||
Tellabs, Cl A | 8,847 | 20 | ||||||
Teradyne | 38,439 | 635 | ||||||
Tessera Technologies | 4,036 | 78 | ||||||
| Market Value | ||||||||
Description | Shares | ($ Thousands) | ||||||
TIBCO Software, Cl E | 9,438 | $ | 242 | |||||
TiVo * | 2,000 | 25 | ||||||
Total System Services | 2,800 | 82 | ||||||
Trimble Navigation | 5,604 | 166 | ||||||
TriQuint Semiconductor | 4,100 | 33 | ||||||
Trulia (A) | 35,591 | 1,674 | ||||||
Tyler Technologies | 6,423 | 562 | ||||||
Ultimate Software Group * | 8,304 | 1,224 | ||||||
Ultra Clean Holdings | 39,209 | 271 | ||||||
Ultratech * | 15,395 | 466 | ||||||
Unisys | 670 | 17 | ||||||
United Online | 29,700 | 237 | ||||||
Universal Display | 119 | 4 | ||||||
Unwired Planet * | 5,749 | 10 | ||||||
Valueclick (A) | 3,600 | 75 | ||||||
Veeco Instruments | 18,097 | 674 | ||||||
VeriFone Holdings | 377 | 9 | ||||||
Verint Systems * | 21,844 | 810 | ||||||
Viasat (A) | 1,100 | 70 | ||||||
VirnetX Holding (A) | 645 | 13 | ||||||
Virtusa | 20,123 | 585 | ||||||
Vishay Intertechnology | 29,200 | 376 | ||||||
Vishay Precision Group | 192 | 3 | ||||||
VistaPrint (A) | 900 | 51 | ||||||
Vocus * | 973 | 9 | ||||||
Volterra Semiconductor | — | — | ||||||
Vringo * (A) | 3,344 | 10 | ||||||
Web.com Group | 50,238 | 1,625 | ||||||
WebMD Health, Cl A (A) | 1,121 | 32 | ||||||
Western Digital | 13,200 | 837 | ||||||
WEX | 9,292 | 815 | ||||||
WNS Holdings ADR * | 31,900 | 677 | ||||||
Workday, Cl A | 5,951 | 482 | ||||||
Xilinx | 15,307 | 717 | ||||||
Yelp, Cl A | 5,533 | 366 | ||||||
Zebra Technologies, Cl A | 8,114 | 370 | ||||||
Zillow, Cl A (A) | 537 | 45 | ||||||
Zix * | 2,433 | 12 | ||||||
Zynga, Cl A * | 14,512 | 53 | ||||||
|
| |||||||
| 86,217 | ||||||||
|
| |||||||
Materials — 4.9% | ||||||||
Advanced Emissions Solutions * | 258 | 11 | ||||||
Air Products & Chemicals | 3,736 | 398 | ||||||
Albemarle | 13,090 | 824 | ||||||
Allegheny Technologies (A) | 28,439 | 868 | ||||||
Alpha Natural Resources * | 4,329 | 26 | ||||||
AMCOL International | 1,500 | 49 | ||||||
American Vanguard, Cl B | 413 | 11 | ||||||
Aptargroup | 1,800 | 108 | ||||||
Ashland | 2,600 | 240 | ||||||
Axiall | 3,300 | 125 | ||||||
Balchem | 1,400 | 72 | ||||||
Ball | 4,789 | 215 | ||||||
Bemis | 1,700 | 66 | ||||||
Berry Plastics Group * | 454 | 9 | ||||||
Boise | 37,622 | 474 | ||||||
Cabot | 900 | 38 | ||||||
Carpenter Technology | 1,300 | 76 | ||||||
Century Aluminum | 5,100 | 41 | ||||||
Chemtura * | 1,310 | 30 | ||||||
| 13 | SEI Institutional Managed Trust / Annual Report / September 30, 2013 |
Schedule of Investments
Tax—Managed Small / Mid Cap Fund
September 30, 2013
| Market Value | ||||||||
Description | Shares | ($ Thousands) | ||||||
Clearwater Paper | 800 | $ | 38 | |||||
Cliffs Natural Resources (A) | 3,818 | 78 | ||||||
Coeur Mining | 3,300 | 40 | ||||||
Commercial Metals, Cl A | 720 | 12 | ||||||
Compass Minerals International, Cl A | 1,100 | 84 | ||||||
Crown Holdings | 4,800 | 203 | ||||||
Cytec Industries | 4,000 | 325 | ||||||
Domtar | 4,200 | 334 | ||||||
Eagle Materials | 700 | 51 | ||||||
Eastman Chemical | 4,248 | 331 | ||||||
Ecolab | 1 | — | ||||||
Ferro | 2,300 | 21 | ||||||
Flotek Industries * | 1,999 | 46 | ||||||
General Moly * | 5,264 | 9 | ||||||
Glatfelter | 1,700 | 46 | ||||||
Globe Specialty Metals | 5,200 | 80 | ||||||
Gold Resource (A) | 1,318 | 9 | ||||||
Graphic Packaging Holding * | 1,313 | 11 | ||||||
Greif, Cl A | 16,019 | 785 | ||||||
GSE Holding | 1,950 | 4 | ||||||
H.B. Fuller | 5,308 | 240 | ||||||
Handy & Harman | 715 | 17 | ||||||
Headwaters, Cl A * | 65,325 | 587 | ||||||
Horsehead Holding | 2,100 | 26 | ||||||
Huntsman | 28,000 | 577 | ||||||
Innophos Holdings | 7,993 | 422 | ||||||
Innospec | 250 | 12 | ||||||
International Flavors & Fragrances | 1,082 | 89 | ||||||
Intrepid Potash (A) | 1,177 | 18 | ||||||
Kaiser Aluminum | 2,571 | 183 | ||||||
KapStone Paper and Packaging | 32,324 | 1,383 | ||||||
Koppers Holdings | 480 | 21 | ||||||
Kraton Performance Polymers * | 491 | 10 | ||||||
Louisiana-Pacific | 2,589 | 46 | ||||||
Martin Marietta Materials, Cl A | 700 | 68 | ||||||
Materion | 595 | 19 | ||||||
Methanex | 11,446 | 587 | ||||||
Minerals Technologies | 12,803 | 632 | ||||||
Neenah Paper, Cl A | 6,713 | 264 | ||||||
Nucor | 7,430 | 364 | ||||||
Olin | 28,100 | 648 | ||||||
OM Group * | 2,200 | 74 | ||||||
Owens-Illinois | 26,118 | 784 | ||||||
Packaging Corp of America | 2,600 | 149 | ||||||
PolyOne | 71,320 | 2,190 | ||||||
PPG Industries | 3,068 | 513 | ||||||
Reliance Steel & Aluminum | 1,200 | 88 | ||||||
Resolute Forest Products * (A) | 925 | 12 | ||||||
Rock Tenn, Cl A | 1,324 | 134 | ||||||
Rockwood Holdings | 6,784 | 454 | ||||||
Royal Gold, Cl A | 1,700 | 83 | ||||||
RPM International | 3,100 | 112 | ||||||
RTI International Metals | 26,285 | 842 | ||||||
Schnitzer Steel Industries, Cl A | 400 | 11 | ||||||
Schulman A | 6,775 | 200 | ||||||
Schweitzer-Mauduit International | 11,197 | 678 | ||||||
Scotts Miracle-Gro, Cl A (A) | 13,913 | 766 | ||||||
Sealed Air | 3,733 | 102 | ||||||
Sensient Technologies | 19,517 | 935 | ||||||
Sherwin-Williams, Cl A | 4,873 | 888 | ||||||
| Market Value | ||||||||
Description | Shares | ($ Thousands) | ||||||
Silgan Holdings | 24,595 | $ | 1,156 | |||||
Sonoco Products | 1,400 | 55 | ||||||
Steel Dynamics | 13,947 | 233 | ||||||
Stillwater Mining * (A) | 2,600 | 29 | ||||||
SunCoke Energy * | 907 | 15 | ||||||
Tahoe Resources | 3,516 | 63 | ||||||
Texas Industries * (A) | 600 | 40 | ||||||
UFP Technologies | 13,800 | 314 | ||||||
United States Steel (A) | 2,814 | 58 | ||||||
Universal Stainless & Alloy * | 346 | 11 | ||||||
US Silica Holdings | 492 | 12 | ||||||
Valspar | 1,860 | 118 | ||||||
Westlake Chemical | 172 | 18 | ||||||
Worthington Industries | 309 | 11 | ||||||
WR Grace * | 1,400 | 122 | ||||||
Zep | 713 | 12 | ||||||
|
| |||||||
| 23,683 | ||||||||
|
| |||||||
Telecommunication Services — 0.4% | ||||||||
8x8 Inc. * | 1,214 | 12 | ||||||
Cincinnati Bell, Cl A * | 7,194 | 20 | ||||||
Cogent Communications Group | 1,395 | 45 | ||||||
Consolidated Communications Holdings | 1,600 | 28 | ||||||
Frontier Communications (A) | 7,286 | 30 | ||||||
inContact * | 1,263 | 10 | ||||||
Inteliquent | 18,500 | 179 | ||||||
Iridium Communications (A) | 38,100 | 262 | ||||||
Level 3 Communications | 4,006 | 107 | ||||||
Lumos Networks | 1,400 | 30 | ||||||
NTELOS Holdings | 1,400 | 26 | ||||||
Premiere Global Services * | 16,400 | 163 | ||||||
RingCentral, Cl A * | 8,208 | 148 | ||||||
SBA Communications, Cl A | 2,217 | 178 | ||||||
Shenandoah Telecommunications | 520 | 13 | ||||||
T-Mobile US | 3,365 | 87 | ||||||
Towerstream * (A) | 4,484 | 13 | ||||||
tw telecom, Cl A * | 5,300 | 158 | ||||||
USA Mobility | 15,500 | 220 | ||||||
Vonage Holdings | 87,900 | 276 | ||||||
Windstream Holdings (A) | 10,320 | 83 | ||||||
|
| |||||||
| 2,088 | ||||||||
|
| |||||||
Utilities — 2.9% | ||||||||
AGL Resources | 16,026 | 738 | ||||||
ALLETE | 12,355 | 597 | ||||||
Alliant Energy | 1,300 | 64 | ||||||
American States Water | 3,400 | 94 | ||||||
American Water Works | 3,741 | 154 | ||||||
Aqua America | 336 | 8 | ||||||
Atmos Energy | 2,500 | 106 | ||||||
Avista | 15,500 | 409 | ||||||
Black Hills, Cl A | 700 | 35 | ||||||
California Water Service Group, Cl A | 2,800 | 57 | ||||||
Chesapeake Utilities | 8,200 | 430 | ||||||
Cleco | 19,247 | 863 | ||||||
CMS Energy | 10,600 | 279 | ||||||
Dynegy * | 654 | 13 | ||||||
Edison International | 6,468 | 298 | ||||||
El Paso Electric, Cl A | 4,700 | 157 | ||||||
Empire District Electric (A) | 4,400 | 95 | ||||||
| 14 | SEI Institutional Managed Trust / Annual Report / September 30, 2013 |
Schedule of Investments
Tax—Managed Small / Mid Cap Fund
September 30, 2013
| Market Value | ||||||||
Description | Shares | ($ Thousands) | ||||||
Great Plains Energy | 56,958 | $ | 1,264 | |||||
Hawaiian Electric Industries | 4,800 | 121 | ||||||
Idacorp, Cl A | 8,271 | 400 | ||||||
Integrys Energy Group | 1,000 | 56 | ||||||
ITC Holdings | 1,478 | 139 | ||||||
Laclede Group (A) | 2,600 | 117 | ||||||
MDU Resources Group | 5,300 | 148 | ||||||
MGE Energy | 1,600 | 87 | ||||||
National Fuel Gas | 372 | 26 | ||||||
New Jersey Resources | 750 | 33 | ||||||
Northwest Natural Gas | 1,400 | 59 | ||||||
NorthWestern | 2,600 | 117 | ||||||
NRG Energy | 5,999 | 164 | ||||||
NV Energy | 3,400 | 80 | ||||||
OGE Energy | 1,800 | 65 | ||||||
Otter Tail | 1,800 | 50 | ||||||
Pepco Holdings | 2,200 | 41 | ||||||
Piedmont Natural Gas (A) | 1,800 | 59 | ||||||
Pinnacle West Capital | 1,100 | 60 | ||||||
PNM Resources | 25,390 | 575 | ||||||
Portland General Electric | 62,817 | 1,773 | ||||||
SCANA | 23,013 | 1,059 | ||||||
South Jersey Industries, Cl A | 88 | 5 | ||||||
Southwest Gas | 12,095 | 605 | ||||||
TECO Energy | 1,800 | 30 | ||||||
UGI | 20,300 | 794 | ||||||
UIL Holdings | 16,670 | 620 | ||||||
UNS Energy | 1,300 | 61 | ||||||
Vectren | 2,100 | 70 | ||||||
Westar Energy, Cl A | 1,900 | 58 | ||||||
WGL Holdings | 13,815 | 590 | ||||||
Xcel Energy | 18,351 | 507 | ||||||
|
| |||||||
| 14,230 | ||||||||
|
| |||||||
Total Common Stock | 465,708 | |||||||
|
| |||||||
EXCHANGE TRADED FUND — 0.2% |
| |||||||
iShares Russell 2000 Index Fund (A) | 8,119 | 866 | ||||||
|
| |||||||
Total Exchange Traded Fund | 866 | |||||||
|
| |||||||
| Number of Warrants | ||||||||
WARRANTS — 0.0% | ||||||||
Magnum Hunter Resources Expires 08/29/14 * | 6,042 | — | ||||||
Magnum Hunter Resources Expires 04/20/16 * | 467 | — | ||||||
|
| |||||||
Total Warrants | — | |||||||
|
| |||||||
| Number of Rights | ||||||||
RIGHTS — 0.0% | ||||||||
Endo Pharmaceuticals | 1,900 | — | ||||||
|
| |||||||
Total Rights | — | |||||||
|
| |||||||
| Shares/ | ||||||||
| Face Amount | Market Value | |||||||
Description | ($ Thousands) | ($ Thousands) | ||||||
AFFILIATED PARTNERSHIP — 10.0% |
| |||||||
SEI Liquidity Fund, L.P. 0.100%**†† (B) | 48,633,689 | $ | 48,634 | |||||
|
| |||||||
Total Affiliated Partnership | 48,634 | |||||||
|
| |||||||
CASH EQUIVALENT — 4.7% |
| |||||||
SEI Daily Income Trust, Prime Obligation Fund, Cl A | 22,677,227 | 22,677 | ||||||
|
| |||||||
Total Cash Equivalent | 22,677 | |||||||
|
| |||||||
U.S. TREASURY OBLIGATIONS (C) (D) — 0.2% |
| |||||||
U.S. Treasury Bills | ||||||||
0.040%, 01/09/14 | $ | 775 | 775 | |||||
0.075%, 02/06/14 | 164 | 164 | ||||||
0.071%, 07/24/14 | 54 | 54 | ||||||
|
| |||||||
Total U.S. Treasury Obligations | 993 | |||||||
|
| |||||||
Total Investments — 110.8% | $ | 538,878 | ||||||
|
| |||||||
A list of the open futures contracts held by the Fund at September 30, 2013, is as follows:
| Number Of | Unrealized | |||||||||||
| Type of | Contracts | Expiration | Appreciation | |||||||||
Contract | Long | Date | ($ Thousands) | |||||||||
Russell 2000 Index | 65 | Dec-2013 | $ | 116 | ||||||||
S&P Mid 400 Index | 47 | Dec-2013 | 53 | |||||||||
|
| |||||||||||
| $ | 169 | |||||||||||
|
| |||||||||||
For the year ended September 30, 2013, the total amount of all open futures contracts, as presented in the table above, are representative of the volume of activity for this derivative type during the year.
Percentages are based on Net Assets of $486,216 ($Thousands).
| * | Non-income producing security. |
| ** | Rate shown is the 7-day effective yield as of September 30, 2013. |
| † | Real Estate Investment Trust. |
| †† | Investment in Affiliated Security. |
| (A) | This security or a partial position of this security is on loan at September 30, 2013. The total market value of securities on loan at September 30, 2013 was $47,136 ($ Thousands) |
| (B) | This security was purchased with cash collateral held from securities on loan. The total market value of such securities as of September 30, 2013 was $48,634 ($Thousands). |
| (C) | The rate reported is the effective yield at the time of purchase. |
| (D) | Security, or portion thereof, has been pledged as collateral on open futures contracts. |
ADR — American Depositary Receipt
Cl — Class
L.P. — Limited Partnership
NASDAQ — National Association of Securities Dealers Automated Quotations
S&P — Standard and Poor’s
Ser — Series
| 15 | SEI Institutional Managed Trust / Annual Report / September 30, 2013 |
Schedule of Investments
Tax—Managed Small / Mid Cap Fund
September 30, 2013
The following is a list of the level of inputs used as of September 30, 2013, in valuing the Fund’s investments carried at value ($ Thousands):
| Investments in Securities | Level 1 | Level 2 | Level 3 | Total | ||||||||||||
Common Stock | $ | 465,708 | $ | — | $ | — | $ | 465,708 | ||||||||
Exchange Traded Fund | 866 | — | — | 866 | ||||||||||||
Right | — | — | — | — | ||||||||||||
Warrants | — | — | — | — | ||||||||||||
U.S. Treasury Obligations | — | 993 | — | 993 | ||||||||||||
Affiliated Partnership | — | 48,634 | — | 48,634 | ||||||||||||
Cash Equivalent | 22,677 | — | — | 22,677 | ||||||||||||
|
|
|
|
|
|
|
| |||||||||
Total Investments in Securities | $ | 489,251 | $ | 49,627 | $ | — | $ | 538,878 | ||||||||
|
|
|
|
|
|
|
| |||||||||
Other Financial Instruments | Level 1 | Level 2 | Level 3 | Total | ||||||||||||
Futures Contracts * | ||||||||||||||||
Unrealized Appreciation | $ | 169 | $ | — | $ | — | $ | 169 | ||||||||
|
|
|
|
|
|
|
| |||||||||
Total Other Financial Instruments | $ | 169 | $ | — | $ | — | $ | 169 | ||||||||
|
|
|
|
|
|
|
| |||||||||
| * | Futures contracts are valued at the unrealized appreciation on the instrument. |
For the year ended September 30, 2013, there were no transfers between Level 1 and Level 2 assets and liabilities.
For the year ended September 30, 2013, there were no transfers between Level 2 and Level 3 assets and liabilities.
Amounts designated as “—” are $0 or have been rounded to $0.
| 16 | SEI Institutional Managed Trust / Annual Report / September 30, 2013 |
Schedule of Investments
Mid—Cap Fund
September 30, 2013
| Market Value | ||||||||
Description | Shares | ($ Thousands) | ||||||
COMMON STOCK — 94.6% | ||||||||
Consumer Discretionary — 15.6% | ||||||||
Aaron’s | 1,000 | $ | 28 | |||||
AMC Networks, Cl A * | 3,000 | 205 | ||||||
American Eagle Outfitters | 29,384 | 411 | ||||||
BorgWarner | 800 | 81 | ||||||
Carter’s (A) | 2,700 | 205 | ||||||
Chico’s FAS | 3,400 | 57 | ||||||
Chipotle Mexican Grill, Cl A * | 720 | 309 | ||||||
Cinemark Holdings | 5,600 | 178 | ||||||
Coach | 2,300 | 125 | ||||||
Darden Restaurants (A) | 9,034 | 418 | ||||||
Dillard’s, Cl A | 2,200 | 172 | ||||||
Discovery Communications, Cl A * | 4,500 | 380 | ||||||
Dollar General * | 11,920 | 673 | ||||||
Dollar Tree * | 4,580 | 262 | ||||||
Foot Locker, Cl A | 5,800 | 197 | ||||||
Fossil Group * | 100 | 12 | ||||||
GameStop, Cl A (A) | 8,800 | 437 | ||||||
Gap | 5,900 | 238 | ||||||
Global Sources * | 1,500 | 11 | ||||||
H&R Block | 900 | 24 | ||||||
Harley-Davidson, Cl A | 23,968 | 1,540 | ||||||
Harte-Hanks | 1,900 | 17 | ||||||
Hasbro (A) | 6,956 | 328 | ||||||
Interpublic Group | 17,595 | 302 | ||||||
Jack in the Box * | 200 | 8 | ||||||
Kohl’s | 1,700 | 88 | ||||||
Liberty Media * | 1,800 | 265 | ||||||
Lululemon Athletica * (A) | 4,450 | 325 | ||||||
Macy’s | 6,200 | 268 | ||||||
Madison Square Garden, Cl A * | 5,700 | 331 | ||||||
Marriott Vacations Worldwide * | 300 | 13 | ||||||
Mattel | 2,600 | 109 | ||||||
Michael Kors Holdings * | 14,600 | 1,088 | ||||||
Mohawk Industries * | 4,200 | 547 | ||||||
Murphy USA * | 925 | 37 | ||||||
Newell Rubbermaid, Cl B | 14,645 | 403 | ||||||
O’Reilly Automotive * | 6,150 | 785 | ||||||
PetSmart | 8,277 | 631 | ||||||
Polaris Industries (A) | 1,000 | 129 | ||||||
Ralph Lauren, Cl A | 1,400 | 231 | ||||||
Ross Stores | 12,850 | 935 | ||||||
Sally Beauty Holdings * | 14,311 | 374 | ||||||
Scripps Networks Interactive, Cl A | 3,100 | 242 | ||||||
Service International | 9,900 | 184 | ||||||
Signet Jewelers | 5,800 | 415 | ||||||
Tesla Motors * (A) | 2,125 | 411 | ||||||
Under Armour, Cl A * (A) | 3,875 | 308 | ||||||
Urban Outfitters * | 15,600 | 574 | ||||||
VF (A) | 1,110 | 221 | ||||||
WABCO Holdings * | 300 | 25 | ||||||
Washington Post, Cl B | 160 | 98 | ||||||
Whirlpool | 1,880 | 275 | ||||||
Williams-Sonoma (A) | 7,700 | 433 | ||||||
Wyndham Worldwide | 1,000 | 61 | ||||||
Wynn Resorts | 3,525 | 557 | ||||||
|
| |||||||
| 16,981 | ||||||||
|
| |||||||
Consumer Staples — 5.0% | ||||||||
Avon Products | 28,300 | 583 | ||||||
| Market Value | ||||||||
Description | Shares | ($ Thousands) | ||||||
Bunge | 3,400 | $ | 258 | |||||
Coca-Cola Enterprises | 13,892 | 559 | ||||||
Darling International * | 22,655 | 480 | ||||||
Dr Pepper Snapple Group | 5,000 | 224 | ||||||
Hershey | 500 | 46 | ||||||
Ingredion | 10,096 | 668 | ||||||
JM Smucker | 5,058 | 531 | ||||||
Kroger | 20,309 | 819 | ||||||
Lorillard | 830 | 37 | ||||||
Molson Coors Brewing, Cl B | 8,029 | 402 | ||||||
Nu Skin Enterprises, Cl A | 2,200 | 211 | ||||||
SYSCO, Cl A (A) | 11,644 | 371 | ||||||
WhiteWave Foods, Cl A | 14,200 | 283 | ||||||
|
| |||||||
| 5,472 | ||||||||
|
| |||||||
Energy — 7.0% | ||||||||
Cabot Oil & Gas | 17,200 | 642 | ||||||
Concho Resources * | 5,580 | 607 | ||||||
Denbury Resources * | 7,400 | 136 | ||||||
Devon Energy | 1,500 | 87 | ||||||
Diamond Offshore Drilling (A) | 2,900 | 181 | ||||||
Dril-Quip * | 1,000 | 115 | ||||||
Ensco, Cl A | 3,000 | 161 | ||||||
EQT | 4,951 | 439 | ||||||
Frank’s International | 12,700 | 380 | ||||||
Hess | 1,800 | 139 | ||||||
HollyFrontier | 2,700 | 114 | ||||||
Marathon Petroleum | 3,200 | 206 | ||||||
McDermott International * | 29,664 | 221 | ||||||
Murphy Oil | 3,800 | 229 | ||||||
Nabors Industries | 13,719 | 220 | ||||||
Newfield Exploration * | 14,477 | 396 | ||||||
Noble Energy | 5,000 | 335 | ||||||
Oceaneering International, Cl A | 6,475 | 526 | ||||||
Pioneer Natural Resources | 2,763 | 522 | ||||||
Range Resources | 7,716 | 586 | ||||||
SM Energy | 1,700 | 131 | ||||||
Southwestern Energy, Cl A | 6,400 | 233 | ||||||
Spectra Energy | 14,791 | 506 | ||||||
Superior Energy Services * | 7,600 | 190 | ||||||
Tesoro | 4,300 | 189 | ||||||
Valero Energy | 5,000 | 171 | ||||||
|
| |||||||
| 7,662 | ||||||||
|
| |||||||
Financials — 15.5% | ||||||||
Affiliated Managers Group * | 2,840 | 519 | ||||||
Alexandria Real Estate Equities † | 6,738 | 430 | ||||||
Allstate | 6,875 | 348 | ||||||
American Campus Communities † | 11,641 | 398 | ||||||
American Capital Agency, Cl A † | 9,300 | 210 | ||||||
American Capital Mortgage Investment † | 6,400 | 126 | ||||||
American Financial Group | 3,500 | 189 | ||||||
Ameriprise Financial | 7,054 | 642 | ||||||
Annaly Capital Management † | 21,000 | 243 | ||||||
Assured Guaranty | 4,500 | 84 | ||||||
Axis Capital Holdings | 7,200 | 312 | ||||||
Brown & Brown | 2,300 | 74 | ||||||
Camden Property Trust † | 400 | 25 | ||||||
CBRE Group, Cl A * | 30,600 | 708 | ||||||
Cedar Shopping Centers † | 1,900 | 10 | ||||||
CIT Group * | 4,500 | 219 | ||||||
CNA Financial | 4,400 | 168 | ||||||
| 1 | SEI Institutional Managed Trust / Annual Report / September 30, 2013 |
Schedule of Investments
Mid—Cap Fund
September 30, 2013
| Market Value | ||||||||
Description | Shares | ($ Thousands) | ||||||
Cole Real Estate Investment † | 35,061 | $ | 430 | |||||
East West Bancorp | 13,500 | 431 | ||||||
Endurance Specialty Holdings | 7,741 | 416 | ||||||
Fifth Third Bancorp | 41,402 | 747 | ||||||
Franklin Street Properties † | 11,600 | 148 | ||||||
General Growth Properties † | 7,700 | 148 | ||||||
Hancock Holding, Cl A | 11,082 | 348 | ||||||
Hartford Financial Services Group | 15,669 | 488 | ||||||
HCC Insurance Holdings | 300 | 13 | ||||||
Healthcare Trust of America, Cl A † | 6,100 | 64 | ||||||
Hospitality Properties Trust † | 7,200 | 204 | ||||||
Host Hotels & Resorts † | 24,674 | 436 | ||||||
Howard Hughes * | 1,800 | 202 | ||||||
Huntington Bancshares | 27,900 | 230 | ||||||
ING US | 6,200 | 181 | ||||||
Invesco | 2,600 | 83 | ||||||
Invesco Mortgage Capital † | 2,200 | 34 | ||||||
JAVELIN Mortgage Investment † (A) | 1,600 | 19 | ||||||
Jones Lang LaSalle | 2,260 | 197 | ||||||
KeyCorp | 22,700 | 259 | ||||||
McGraw-Hill | 4,300 | 282 | ||||||
MFA Financial † | 6,100 | 45 | ||||||
Moody’s | 10,375 | 730 | ||||||
NASDAQ OMX Group, Cl A | 4,700 | 151 | ||||||
Nelnet, Cl A | 1,800 | 69 | ||||||
PartnerRe | 6,806 | 623 | ||||||
Progressive | 1,700 | 46 | ||||||
ProLogis † | 7,577 | 285 | ||||||
Regions Financial | 20,100 | 186 | ||||||
Reinsurance Group of America, Cl A | 7,006 | 469 | ||||||
Resource Capital † | 6,700 | 40 | ||||||
RLJ Lodging Trust † | 1,300 | 31 | ||||||
Signature Bank NY, Cl B | 4,400 | 403 | ||||||
SLM | 800 | 20 | ||||||
Starwood Property Trust † | 8,100 | 194 | ||||||
Summit Hotel Properties † | 700 | 6 | ||||||
SunTrust Banks | 16,276 | 528 | ||||||
T. Rowe Price Group | 3,300 | 237 | ||||||
Taubman Centers † | 1,700 | 114 | ||||||
TCF Financial (A) | 21,916 | 313 | ||||||
TD Ameritrade Holding | 12,900 | 338 | ||||||
Unum Group | 10,859 | 331 | ||||||
Ventas † | 4,500 | 277 | ||||||
Waddell & Reed Financial, Cl A | 4,100 | 211 | ||||||
Willis Group Holdings | 10,244 | 444 | ||||||
XL Group, Cl A | 7,400 | 228 | ||||||
Zions Bancorporation | 17,173 | 471 | ||||||
|
| |||||||
| 16,855 | ||||||||
|
| |||||||
Health Care — 11.8% | ||||||||
Actavis * | 3,775 | 544 | ||||||
Aetna, Cl A | 1,600 | 102 | ||||||
Agilent Technologies | 15,700 | 805 | ||||||
Alexion Pharmaceuticals * | 6,570 | 763 | ||||||
AmerisourceBergen | 5,410 | 331 | ||||||
Becton Dickinson | 700 | 70 | ||||||
Brookdale Senior Living, Cl A * | 14,900 | 392 | ||||||
Bruker BioSciences * | 18,300 | 378 | ||||||
| Market Value | ||||||||
Description | Shares | ($ Thousands) | ||||||
C.R. Bard | 1,800 | $ | 208 | |||||
CareFusion * | 12,908 | 476 | ||||||
Cerner * | 5,500 | 289 | ||||||
Charles River Laboratories International * | 7,752 | 358 | ||||||
Cigna | 4,400 | 338 | ||||||
Dentsply International | 9,794 | 425 | ||||||
Envision Healthcare Holdings * | 9,300 | 242 | ||||||
HCA Holdings * | 6,400 | 274 | ||||||
Humana | 8,500 | 793 | ||||||
Illumina * (A) | 7,100 | 574 | ||||||
Jazz Pharmaceuticals * | 2,800 | 257 | ||||||
MEDNAX * | 4,473 | 449 | ||||||
Mettler Toledo International * (A) | 990 | 238 | ||||||
Myriad Genetics * (A) | 5,300 | 125 | ||||||
Patterson | 10,654 | 428 | ||||||
Pharmacyclics * | 1,700 | 235 | ||||||
Premier, Cl A * | 8,500 | 270 | ||||||
Quest Diagnostics | 9,793 | 605 | ||||||
Regeneron Pharmaceuticals * | 1,150 | 360 | ||||||
Sirona Dental Systems, Cl A * | 9,350 | 626 | ||||||
St. Jude Medical | 2,200 | 118 | ||||||
Techne, Cl A | 700 | 56 | ||||||
United Therapeutics * | 1,000 | 79 | ||||||
Universal Health Services, Cl B | 3,200 | 240 | ||||||
Valeant Pharmaceuticals International | 6,500 | 678 | ||||||
Vertex Pharmaceuticals * | 5,900 | 447 | ||||||
Zimmer Holdings | 3,400 | 279 | ||||||
|
| |||||||
| 12,852 | ||||||||
|
| |||||||
Industrials — 15.8% | ||||||||
Acuity Brands | 5,850 | 538 | ||||||
Aecom Technology * | 6,000 | 188 | ||||||
AGCO | 4,000 | 242 | ||||||
Air Lease, Cl A | 14,100 | 390 | ||||||
Amerco | 510 | 94 | ||||||
Ametek | 2,000 | 92 | ||||||
AO Smith | 5,100 | 230 | ||||||
Armstrong World Industries * | 700 | 38 | ||||||
Babcock & Wilcox | 5,800 | 196 | ||||||
Canadian Pacific Railway | 2,575 | 318 | ||||||
Carlisle | 8,975 | 631 | ||||||
Cintas | 8,289 | 425 | ||||||
Clean Harbors * | 8,101 | 475 | ||||||
CNH Industrial * | 3,445 | 43 | ||||||
CSX | 1,400 | 36 | ||||||
Delta Air Lines, Cl A | 26,100 | 616 | ||||||
Dover | 8,080 | 726 | ||||||
Exelis | 6,600 | 104 | ||||||
Flowserve | 8,675 | 541 | ||||||
Fluor | 14,494 | 1,028 | ||||||
Fortune Brands Home & Security | 14,300 | 595 | ||||||
Generac Holdings * | 9,400 | 401 | ||||||
HD Supply Holdings * | 20,100 | 442 | ||||||
Hertz Global Holdings * | 19,500 | 432 | ||||||
IDEX | 200 | 13 | ||||||
JB Hunt Transport Services | 8,500 | 620 | ||||||
Kirby * | 5,650 | 489 | ||||||
L-3 Communications Holdings | 2,380 | 225 | ||||||
Lennox International | 900 | 68 | ||||||
Lincoln Electric Holdings | 3,500 | 233 | ||||||
| 2 | SEI Institutional Managed Trust / Annual Report / September 30, 2013 |
Schedule of Investments
Mid—Cap Fund
September 30, 2013
| Market Value | ||||||||
Description | Shares | ($ Thousands) | ||||||
Masco | 2,100 | $ | 45 | |||||
Matson | 6,500 | 170 | ||||||
MRC Global * | 6,400 | 171 | ||||||
MSC Industrial Direct, Cl A | 6,050 | 492 | ||||||
Norfolk Southern | 2,200 | 170 | ||||||
Northrop Grumman | 1,000 | 95 | ||||||
Oshkosh Truck * | 5,200 | 255 | ||||||
Pall | 10,200 | 786 | ||||||
Parker Hannifin, Cl A | 4,574 | 497 | ||||||
Quanta Services * | 7,700 | 212 | ||||||
Regal-Beloit | 5,914 | 402 | ||||||
Republic Services | 1,600 | 53 | ||||||
Rockwell Automation | 2,700 | 289 | ||||||
Rollins | 2,500 | 66 | ||||||
Spirit Aerosystems Holdings, Cl A * | 7,600 | 184 | ||||||
Stanley Black & Decker | 5,699 | 516 | ||||||
Stericycle, Cl A * | 4,700 | 542 | ||||||
Timken | 3,600 | 217 | ||||||
Towers Watson, Cl A | 5,254 | 562 | ||||||
Tyco International | 1,400 | 49 | ||||||
Valmont Industries | 1,340 | 186 | ||||||
Wabtec | 1,000 | 63 | ||||||
WW Grainger | 1,030 | 270 | ||||||
Xylem | 16,177 | 452 | ||||||
|
| |||||||
| 17,213 | ||||||||
|
| |||||||
Information Technology — 14.4% | ||||||||
Activision Blizzard | 14,400 | 240 | ||||||
Akamai Technologies * | 1,000 | 52 | ||||||
Alliance Data Systems * (A) | 3,850 | 814 | ||||||
Amdocs | 3,500 | 128 | ||||||
Amphenol, Cl A | 8,350 | 646 | ||||||
Analog Devices | 300 | 14 | ||||||
Ansys * | 2,500 | 216 | ||||||
Applied Materials | 49,700 | 872 | ||||||
Arrow Electronics, Cl A * | 4,200 | 204 | ||||||
Aruba Networks * | 12,300 | 205 | ||||||
Avago Technologies, Cl A | 15,700 | 677 | ||||||
Avnet | 5,900 | 246 | ||||||
Booz Allen Hamilton Holding, Cl A | 2,600 | 50 | ||||||
CA | 8,200 | 243 | ||||||
CoreLogic * | 17,600 | 476 | ||||||
Diebold | 7,291 | 214 | ||||||
DST Systems | 2,400 | 181 | ||||||
F5 Networks, Cl A * | 7,335 | 629 | ||||||
Fidelity National Information Services, Cl B | 11,476 | 533 | ||||||
Fiserv, Cl A * | 700 | 71 | ||||||
FleetCor Technologies * | 6,525 | 719 | ||||||
Harris | 3,300 | 196 | ||||||
IAC | 3,900 | 213 | ||||||
Ingram Micro, Cl A * | 8,500 | 196 | ||||||
Intuit | 3,100 | 206 | ||||||
Juniper Networks * | 18,421 | 366 | ||||||
KLA-Tencor | 5,050 | 307 | ||||||
LinkedIn, Cl A * | 2,270 | 559 | ||||||
LSI Logic | 26,900 | 210 | ||||||
Marvell Technology Group | 17,700 | 204 | ||||||
Maxim Integrated Products | 2,600 | 77 | ||||||
Microchip Technology (A) | 11,805 | 476 | ||||||
| Market Value | ||||||||
Description | Shares | ($ Thousands) | ||||||
NetApp | 12,200 | $ | 520 | |||||
ON Semiconductor * | 6,100 | 44 | ||||||
Palo Alto Networks * | 6,450 | 295 | ||||||
Polycom * | 1,500 | 16 | ||||||
Red Hat * | 8,950 | 413 | ||||||
Rovi * | 7,400 | 142 | ||||||
SanDisk | 3,700 | 220 | ||||||
ServiceNow * (A) | 4,700 | 244 | ||||||
Skyworks Solutions * | 4,700 | 117 | ||||||
Splunk * | 6,100 | 366 | ||||||
Symantec, Cl A | 25,719 | 637 | ||||||
Synopsys * | 22,276 | 840 | ||||||
Syntel * | 500 | 40 | ||||||
TE Connectivity | 600 | 31 | ||||||
Total System Services | 1,400 | 41 | ||||||
Western Digital | 3,900 | 248 | ||||||
Workday, Cl A | 4,675 | 378 | ||||||
Xerox | 3,700 | 38 | ||||||
Xilinx (A) | 12,050 | 565 | ||||||
Yahoo! * | 600 | 20 | ||||||
|
| |||||||
| 15,655 | ||||||||
|
| |||||||
Materials — 5.4% | ||||||||
Air Products & Chemicals | 3,294 | 351 | ||||||
Albemarle (A) | 7,575 | 477 | ||||||
Alcoa (A) | 7,000 | 57 | ||||||
Allegheny Technologies (A) | 14,991 | 457 | ||||||
CF Industries Holdings | 1,110 | 234 | ||||||
Eastman Chemical | 500 | 39 | ||||||
Greif, Cl A | 8,143 | 399 | ||||||
Huntsman | 3,100 | 64 | ||||||
International Flavors & Fragrances | 2,600 | 214 | ||||||
Nucor | 6,553 | 321 | ||||||
Owens-Illinois | 11,234 | 337 | ||||||
Packaging Corp of America | 3,300 | 189 | ||||||
PPG Industries | 2,975 | 497 | ||||||
Rock Tenn, Cl A | 1,800 | 182 | ||||||
Rockwood Holdings | 4,780 | 320 | ||||||
Scotts Miracle-Gro, Cl A (A) | 6,638 | 365 | ||||||
Sherwin-Williams, Cl A | 3,860 | 703 | ||||||
Silgan Holdings | 6,286 | 296 | ||||||
Valspar | 3,200 | 203 | ||||||
Westlake Chemical | 1,700 | 178 | ||||||
|
| |||||||
| 5,883 | ||||||||
|
| |||||||
Telecommunication Services — 0.2% | ||||||||
CenturyTel (A) | 4,400 | 138 | ||||||
Telephone & Data Systems | 3,100 | 92 | ||||||
|
| |||||||
| 230 | ||||||||
|
| |||||||
Utilities — 3.9% | ||||||||
AES | 18,000 | 239 | ||||||
AGL Resources | 10,732 | 494 | ||||||
Ameren | 4,900 | 170 | ||||||
American Water Works | 5,500 | 227 | ||||||
Atmos Energy | 3,100 | 132 | ||||||
DTE Energy | 3,700 | 244 | ||||||
Edison International | 9,504 | 438 | ||||||
Great Plains Energy | 22,956 | 510 | ||||||
Portland General Electric | 16,833 | 475 | ||||||
SCANA | 10,208 | 470 | ||||||
TECO Energy (A) | — | — | ||||||
| 3 | SEI Institutional Managed Trust / Annual Report / September 30, 2013 |
Schedule of Investments
Mid—Cap Fund
September 30, 2013
Description | Shares/Face Amount ($ Thousands) | Market Value ($ Thousands) | ||||||
UGI | 5,100 | $ | 200 | |||||
Xcel Energy | 25,380 | 701 | ||||||
|
| |||||||
| 4,300 | ||||||||
|
| |||||||
Total Common Stock | 103,103 | |||||||
|
| |||||||
AFFILIATED PARTNERSHIP — 6.5% |
| |||||||
SEI Liquidity Fund, L.P. | 7,046,466 | 7,046 | ||||||
|
| |||||||
Total Affiliated Partnership | 7,046 | |||||||
|
| |||||||
CASH EQUIVALENT — 5.9% |
| |||||||
SEI Daily Income Trust, Prime | 6,478,508 | 6,479 | ||||||
|
| |||||||
Total Cash Equivalent | 6,479 | |||||||
|
| |||||||
U.S. TREASURY OBLIGATION (C) (D) — 0.3% |
| |||||||
U.S. Treasury Bills | ||||||||
0.075%, 02/06/14 | $ | 356 | 356 | |||||
|
| |||||||
Total U.S. Treasury Obligation | 356 | |||||||
|
| |||||||
Total Investments — 107.3% | $ | 116,984 | ||||||
|
| |||||||
A list of the open futures contracts held by the Fund at September 30, 2013, is as follows:
| Number of | Unrealized | |||||||||||
Type of Contract | Contracts Long | Expiration Date | Appreciation ($ Thousands) | |||||||||
S&P Mid 400 Index E-MINI | 42 | Dec-2013 | $ | 47 | ||||||||
|
| |||||||||||
For the year ended September 30, 2013, the total amount of all open futures contracts, as presented in the table above, are representative of the volume of activity for this derivative type during the year.
Percentages are based on Net Assets of $109,045 ($Thousands).
| * | Non-income producing security. |
| ** | Rate shown is the 7-day effective yield as of September 30, 2013. |
| † | Real Estate Investment Trust. |
| †† | Investment in Affiliated Security. |
| (A) | This security or a partial position of this security is on loan at September 30, 2013. The total market value of securities on loan at September 30, 2012 was $6,872 ($ Thousands) |
| (B) | This security was purchased with cash collateral held from securities on loan. The total market value of such securities as of September 30, 2013 was $7,046 ($Thousands). |
| (C) | Security, or portion thereof, has been pledged as collateral on open futures contracts. |
| (D) | The rate reported is the effective yield at the time of purchase. |
Cl — Class
L.P. — Limited Partnership
S&P — Standard & Poor’s
The following is a list of the level of inputs used as of September 30, 2013, in valuing the Fund’s investments and other financial instruments carried at value ($ Thousands):
| Investments in Securities | Level 1 | Level 2 | Level 3 | Total | ||||||||||||
Common Stock | $ | 103,103 | $ | — | $ | — | $ | 103,103 | ||||||||
Affiliated Partnership | — | 7,046 | — | 7,046 | ||||||||||||
Cash Equivalent | 6,479 | — | — | 6,479 | ||||||||||||
U.S. Treasury Obligation | — | 356 | — | 356 | ||||||||||||
|
|
|
|
|
|
|
| |||||||||
Total Investments in Securities | $ | 109,582 | $ | 7,402 | $ | — | $ | 116,984 | ||||||||
|
|
|
|
|
|
|
| |||||||||
Other Financial Instruments | Level 1 | Level 2 | Level 3 | Total | ||||||||||||
Futures Contracts * | ||||||||||||||||
Unrealized Appreciation | $ | 47 | $ | — | $ | — | $ | 47 | ||||||||
|
|
|
|
|
|
|
| |||||||||
Total Other Financial Instruments | $ | 47 | $ | — | $ | — | $ | 47 | ||||||||
|
|
|
|
|
|
|
| |||||||||
| * | Futures contracts are valued at the unrealized appreciation on the instrument. |
For the year ended September 30, 2013, there were no transfers between Level 1 and Level 2 assets and liabilities.
For the year ended September 30, 2013, there were no transfers between Level 2 and Level 3 assets and liabilities.
Amounts designated as “—” are $ 0 or have been rounded to $0.
| 4 | SEI Institutional Managed Trust / Annual Report / September 30, 2013 |
Schedule of Investments
U. S. Managed Volatility Fund
September 30, 2013
| Market Value | ||||||||
Description | Shares | ($ Thousands) | ||||||
COMMON STOCK — 95.7% | ||||||||
Consumer Discretionary — 5.7% | ||||||||
Aaron’s | 62,000 | $ | 1,717 | |||||
Advance Auto Parts | 27,879 | 2,305 | ||||||
Bed Bath & Beyond * | 30,700 | 2,375 | ||||||
Best Buy | 53,700 | 2,014 | ||||||
Big Lots * | 28,000 | 1,039 | ||||||
Brinker International | 27,292 | 1,106 | ||||||
Canadian Tire, Cl A | 23,100 | 2,050 | ||||||
Cracker Barrel Old Country Store | 25,100 | 2,591 | ||||||
DIRECTV * | 86,000 | 5,139 | ||||||
GameStop, Cl A | 45,300 | 2,249 | ||||||
Genuine Parts | 7,800 | 631 | ||||||
H&R Block | 73,300 | 1,954 | ||||||
Kohl’s | 60,800 | 3,146 | ||||||
Panera Bread, Cl A * | 5,076 | 805 | ||||||
PetSmart | 23,169 | 1,767 | ||||||
Regal Entertainment Group, Cl A | 3,042 | 58 | ||||||
Scripps Networks Interactive, Cl A | 16,600 | 1,297 | ||||||
Six Flags Entertainment | 10,887 | 368 | ||||||
Target, Cl A | 167,867 | 10,740 | ||||||
Time Warner Cable, Cl A | 33,400 | 3,727 | ||||||
Washington Post, Cl B | 2,300 | 1,406 | ||||||
|
| |||||||
| 48,484 | ||||||||
|
| |||||||
Consumer Staples — 19.3% | ||||||||
Altria Group | 151,161 | 5,192 | ||||||
Archer-Daniels-Midland | 64,700 | 2,384 | ||||||
Bunge | 54,487 | 4,136 | ||||||
Cal-Maine Foods | 24,200 | 1,164 | ||||||
Campbell Soup | 73,801 | 3,004 | ||||||
Church & Dwight | 66,358 | 3,985 | ||||||
Clorox | 94,440 | 7,718 | ||||||
Coca-Cola Enterprises | 72,261 | 2,906 | ||||||
Colgate-Palmolive | 33,818 | 2,005 | ||||||
ConAgra Foods | 136,700 | 4,148 | ||||||
Costco Wholesale | 26,958 | 3,103 | ||||||
CVS Caremark | 95,700 | 5,431 | ||||||
Dr Pepper Snapple Group | 103,923 | 4,658 | ||||||
Energizer Holdings | 19,600 | 1,786 | ||||||
Flowers Foods | 107,600 | 2,307 | ||||||
General Mills, Cl A | 67,044 | 3,213 | ||||||
Harris Teeter Supermarkets | 12,100 | 595 | ||||||
Hershey | 89,548 | 8,283 | ||||||
Hormel Foods | 199,582 | 8,406 | ||||||
Ingredion | 25,300 | 1,674 | ||||||
JM Smucker | 22,000 | 2,311 | ||||||
Kellogg | 71,125 | 4,177 | ||||||
Kimberly-Clark | 46,784 | 4,408 | ||||||
Kroger | 168,500 | 6,797 | ||||||
Lorillard | 80,720 | 3,615 | ||||||
McCormick | 45,801 | 2,963 | ||||||
Metro, Cl A | 40,300 | 2,526 | ||||||
Molson Coors Brewing, Cl B | 83,600 | 4,191 | ||||||
PepsiCo | 74,322 | 5,908 | ||||||
Philip Morris International | 58,136 | 5,034 | ||||||
Reynolds American | 54,837 | 2,675 | ||||||
Safeway | 189,400 | 6,059 | ||||||
Sanderson Farms | 41,900 | 2,734 | ||||||
SYSCO, Cl A | 128,119 | 4,078 | ||||||
TreeHouse Foods * | 29,100 | 1,945 | ||||||
| Market Value | ||||||||
Description | Shares | ($ Thousands) | ||||||
Tyson Foods, Cl A | 311,002 | $ | 8,795 | |||||
Universal | 31,000 | 1,579 | ||||||
Walgreen | 115,700 | 6,225 | ||||||
Wal-Mart Stores | 170,047 | 12,577 | ||||||
|
| |||||||
| 164,695 | ||||||||
|
| |||||||
Energy — 2.8% | ||||||||
Chevron | 62,200 | 7,557 | ||||||
ConocoPhillips | 62,800 | 4,365 | ||||||
Core Laboratories | 9,200 | 1,557 | ||||||
Diamond Offshore Drilling | 14,200 | 885 | ||||||
Exxon Mobil | 107,600 | 9,258 | ||||||
World Fuel Services | 7,472 | 279 | ||||||
|
| |||||||
| 23,901 | ||||||||
|
| |||||||
Financials — 15.7% | ||||||||
Alleghany * | 7,095 | 2,906 | ||||||
Allied World Assurance Holdings | 70,424 | 6,999 | ||||||
Allstate | 54,500 | 2,755 | ||||||
American Capital Agency, Cl A † | 55,100 | 1,244 | ||||||
American Financial Group | 36,200 | 1,957 | ||||||
Arch Capital Group * | 54,268 | 2,938 | ||||||
Axis Capital Holdings | 79,680 | 3,451 | ||||||
BOK Financial | 33,300 | 2,109 | ||||||
CBOE Holdings | 47,900 | 2,167 | ||||||
Chubb | 52,400 | 4,677 | ||||||
Commerce Bancshares | 871 | 38 | ||||||
Endurance Specialty Holdings | 35,500 | 1,907 | ||||||
Equity Lifestyle Properties † | 63,800 | 2,180 | ||||||
Erie Indemnity, Cl A | 25,900 | 1,877 | ||||||
Everest Re Group | 93,684 | 13,623 | ||||||
First Citizens BancShares, Cl A | 1,035 | 213 | ||||||
First Niagara Financial Group | 213,400 | 2,213 | ||||||
Genworth MI Canada | 40,500 | 1,141 | ||||||
Hancock Holding, Cl A | 30,900 | 970 | ||||||
HCC Insurance Holdings | 95,100 | 4,167 | ||||||
Home Properties † | 39,617 | 2,288 | ||||||
Huntington Bancshares | 274,600 | 2,268 | ||||||
MFA Financial † | 267,640 | 1,994 | ||||||
National Bank of Canada | 48,400 | 4,006 | ||||||
PartnerRe | 143,755 | 13,159 | ||||||
PennyMac Mortgage Investment Trust † | 89,100 | 2,021 | ||||||
People’s United Financial | 43,974 | 632 | ||||||
Platinum Underwriters Holdings | 34,300 | 2,049 | ||||||
Primerica | 40,700 | 1,642 | ||||||
Prosperity Bancshares | 39,600 | 2,449 | ||||||
Public Storage † | 12,538 | 2,013 | ||||||
RenaissanceRe Holdings | 104,831 | 9,490 | ||||||
Signature Bank NY, Cl B * | 26,800 | 2,453 | ||||||
Silver Bay Realty Trust † | 7,187 | 112 | ||||||
SVB Financial Group, Cl B * | 27,300 | 2,358 | ||||||
TFS Financial | 202,400 | 2,423 | ||||||
Tower Group International | 53,817 | 377 | ||||||
Travelers | 65,600 | 5,561 | ||||||
Two Harbors Investment † | 182,800 | 1,775 | ||||||
US Bancorp | 165,047 | 6,037 | ||||||
Validus Holdings | 187,096 | 6,919 | ||||||
White Mountains Insurance Group | 3,500 | 1,987 | ||||||
|
| |||||||
| 133,545 | ||||||||
|
| |||||||
| 1 | SEI Institutional Managed Trust / Annual Report / September 30, 2013 |
Schedule of Investments
U. S. Managed Volatility Fund
September 30, 2013
| Market Value | ||||||||
Description | Shares | ($ Thousands) | ||||||
Health Care — 17.5% | ||||||||
Abbott Laboratories | 87,418 | $ | 2,901 | |||||
AbbVie | 94,500 | 4,227 | ||||||
Actavis * | 17,000 | 2,448 | ||||||
Aetna, Cl A | 57,900 | 3,707 | ||||||
AmerisourceBergen | 142,491 | 8,706 | ||||||
Amgen, Cl A | 71,400 | 7,992 | ||||||
AstraZeneca ADR | 56,700 | 2,944 | ||||||
Baxter International | 52,700 | 3,462 | ||||||
Becton Dickinson | 54,194 | 5,420 | ||||||
Cardinal Health | 169,131 | 8,820 | ||||||
CareFusion * | 63,300 | 2,336 | ||||||
Celgene, Cl A * | 7,700 | 1,185 | ||||||
Cigna | 28,500 | 2,190 | ||||||
Cooper, Cl A | 3,500 | 454 | ||||||
Covance * | 1,951 | 169 | ||||||
Cubist Pharmaceuticals * | 37,400 | 2,377 | ||||||
Eli Lilly | 82,585 | 4,157 | ||||||
Endo Pharmaceuticals Holdings * | 54,100 | 2,458 | ||||||
Humana | 42,500 | 3,967 | ||||||
Jazz Pharmaceuticals * | 8,600 | 791 | ||||||
Johnson & Johnson | 118,700 | 10,290 | ||||||
Laboratory Corp of America Holdings * | 29,903 | 2,965 | ||||||
Magellan Health Services * | 27,800 | 1,667 | ||||||
McKesson | 93,046 | 11,938 | ||||||
Medtronic | 52,100 | 2,774 | ||||||
Merck | 159,800 | 7,608 | ||||||
Myriad Genetics * | 3,215 | 76 | ||||||
Omnicare | 41,300 | 2,292 | ||||||
Patterson | 47,700 | 1,918 | ||||||
Perrigo | 8,300 | 1,024 | ||||||
Pfizer | 286,400 | 8,223 | ||||||
Quest Diagnostics | 18,500 | 1,143 | ||||||
St. Jude Medical | 58,600 | 3,143 | ||||||
Techne, Cl A | 77,520 | 6,206 | ||||||
United Therapeutics * | 55,800 | 4,400 | ||||||
UnitedHealth Group | 58,500 | 4,189 | ||||||
WellPoint | 54,700 | 4,573 | ||||||
Zimmer Holdings | 44,700 | 3,672 | ||||||
|
| |||||||
| 148,812 | ||||||||
|
| |||||||
Industrials — 6.3% | ||||||||
Alliant Techsystems | 45,300 | 4,420 | ||||||
Dun & Bradstreet | 17,600 | 1,828 | ||||||
FTI Consulting * | 32,000 | 1,209 | ||||||
General Dynamics | 24,100 | 2,109 | ||||||
L-3 Communications Holdings | 77,600 | 7,333 | ||||||
Landstar System | 33,500 | 1,875 | ||||||
Leidos Holdings * | 54,750 | 2,492 | ||||||
Lockheed Martin | 85,616 | 10,920 | ||||||
Northrop Grumman | 89,268 | 8,504 | ||||||
Old Dominion Freight Line, Cl A * | 51,000 | 2,346 | ||||||
Raytheon | 103,500 | 7,977 | ||||||
Rollins | 90,800 | 2,407 | ||||||
|
| |||||||
| 53,420 | ||||||||
|
| |||||||
Information Technology — 8.6% | ||||||||
Activision Blizzard | 134,400 | 2,240 | ||||||
Amdocs | 278,322 | 10,198 | ||||||
AOL | 33,106 | 1,145 | ||||||
Avnet | 59,000 | 2,461 | ||||||
| Market Value | ||||||||
Description | Shares | ($ Thousands) | ||||||
Booz Allen Hamilton Holding, Cl A | 7,269 | $ | 140 | |||||
Broadridge Financial Solutions | 90,345 | 2,869 | ||||||
CACI International, Cl A * | 20,600 | 1,424 | ||||||
Cisco Systems | 225,100 | 5,272 | ||||||
DST Systems | 7,016 | 529 | ||||||
Factset Research Systems | 12,234 | 1,335 | ||||||
Flextronics International * | 253,100 | 2,301 | ||||||
Flir Systems | 71,900 | 2,257 | ||||||
Global Payments | 49,400 | 2,523 | ||||||
Harris | 66,433 | 3,939 | ||||||
Ingram Micro, Cl A * | 102,600 | 2,365 | ||||||
Intel | 153,300 | 3,514 | ||||||
International Business Machines | 42,800 | 7,926 | ||||||
Jack Henry & Associates | 19,300 | 996 | ||||||
Microsoft | 196,700 | 6,552 | ||||||
NeuStar, Cl A * | 17,000 | 841 | ||||||
Oracle, Cl B | 69,800 | 2,315 | ||||||
Paychex | 25,003 | 1,016 | ||||||
Science Applications International * | 31,286 | 1,056 | ||||||
Synopsys * | 63,700 | 2,402 | ||||||
Tech Data * | 30,000 | 1,497 | ||||||
Total System Services | 74,400 | 2,189 | ||||||
Western Union | 84,787 | 1,582 | ||||||
Zebra Technologies, Cl A * | 15,800 | 719 | ||||||
|
| |||||||
| 73,603 | ||||||||
|
| |||||||
Materials — 0.9% | ||||||||
Aptargroup | 38,800 | 2,333 | ||||||
Ball | 33,400 | 1,499 | ||||||
Barrick Gold | 30,100 | 562 | ||||||
Compass Minerals International, Cl A | 5,524 | 421 | ||||||
Silgan Holdings | 45,200 | 2,124 | ||||||
Sonoco Products | 26,000 | 1,013 | ||||||
|
| |||||||
| 7,952 | ||||||||
|
| |||||||
Telecommunication Services — 4.9% |
| |||||||
AT&T | 343,531 | 11,618 | ||||||
BCE | 56,100 | 2,402 | ||||||
NTT DoCoMo ADR | 260,300 | 4,222 | ||||||
Rogers Communications, Cl B | 84,700 | 3,649 | ||||||
SBA Communications, Cl A * | 16,800 | 1,352 | ||||||
SK Telecom ADR | 191,000 | 4,336 | ||||||
TELUS | 62,000 | 2,059 | ||||||
Verizon Communications | 176,171 | 8,220 | ||||||
Vodafone Group ADR | 99,900 | 3,514 | ||||||
|
| |||||||
| 41,372 | ||||||||
|
| |||||||
Utilities — 14.0% | ||||||||
AGL Resources | 49,600 | 2,283 | ||||||
Alliant Energy | 42,100 | 2,086 | ||||||
Ameren | 71,700 | 2,498 | ||||||
American Electric Power | 130,309 | 5,649 | ||||||
American States Water | 62,800 | 1,731 | ||||||
American Water Works | 170,913 | 7,055 | ||||||
Atmos Energy | 94,500 | 4,025 | ||||||
Avista | 49,700 | 1,312 | ||||||
Cleco | 39,800 | 1,785 | ||||||
CMS Energy | 56,666 | 1,491 | ||||||
Consolidated Edison | 207,529 | 11,443 | ||||||
DTE Energy | 138,874 | 9,163 | ||||||
| 2 | SEI Institutional Managed Trust / Annual Report / September 30, 2013 |
Schedule of Investments
U. S. Managed Volatility Fund
September 30, 2013
| Shares/ | ||||||||
Description | Face Amount ($ Thousands) | Market Value ($ Thousands) | ||||||
Edison International | 258,411 | $ | 11,902 | |||||
Entergy | 39,200 | 2,477 | ||||||
Exelon | 150,400 | 4,458 | ||||||
Great Plains Energy | 42,000 | 932 | ||||||
Hawaiian Electric Industries | 25,213 | 633 | ||||||
Idacorp, Cl A | 35,100 | 1,699 | ||||||
Integrys Energy Group | 7,488 | 419 | ||||||
ITC Holdings | 6,046 | 568 | ||||||
NextEra Energy | 19,335 | 1,550 | ||||||
NV Energy | 85,100 | 2,009 | ||||||
PG&E | 118,300 | 4,841 | ||||||
Pinnacle West Capital | 33,375 | 1,827 | ||||||
Portland General Electric | 111,200 | 3,139 | ||||||
PPL | 166,600 | 5,061 | ||||||
Public Service Enterprise Group | 148,400 | 4,887 | ||||||
SCANA | 69,043 | 3,179 | ||||||
Southern | 100,131 | 4,123 | ||||||
UGI | 68,793 | 2,692 | ||||||
Vectren | 111,161 | 3,707 | ||||||
WGL Holdings | 35,800 | 1,529 | ||||||
Wisconsin Energy | 125,445 | 5,065 | ||||||
Xcel Energy | 80,838 | 2,232 | ||||||
|
| |||||||
| 119,450 | ||||||||
|
| |||||||
Total Common Stock | 815,234 | |||||||
|
| |||||||
CASH EQUIVALENT — 4.2% |
| |||||||
SEI Daily Income Trust, Prime | 35,766,679 | 35,767 | ||||||
|
| |||||||
Total Cash Equivalent | 35,767 | |||||||
|
| |||||||
U.S. TREASURY OBLIGATIONS (A) (B) — 0.2% |
| |||||||
U.S. Treasury Bills |
| |||||||
0.094%, 02/06/14 | $ | 366 | 366 | |||||
0.040%, 01/09/14 | 1,025 | 1,025 | ||||||
|
| |||||||
Total U.S. Treasury Obligations | 1,391 | |||||||
|
| |||||||
Total Investments — 100.0% | $ | 852,392 | ||||||
|
| |||||||
A list of the open futures contracts held by the Fund at September 30, 2013, is as follows:
| Number of | Unrealized | |||||||||||
Type of Contract | Contracts Long | Expiration Date | Depreciation ($ Thousands) | |||||||||
S&P 500 Index E-MINI | 277 | Dec-2013 | $ | (112 | ) | |||||||
|
| |||||||||||
For the year ended September 30, 2013, the total amount of all open futures contracts, as presented in the table above, are representative of the volume of activity for this derivative type during the year.
Percentages are based on Net Assets of $852,349 ($Thousands).
| * | Non-income producing security. |
| ** | Rate shown is the 7-day effective yield as of September 30, 2013. |
| † | Real Estate Investment Trust. |
| †† | Investment in Affiliated Security. |
| (A) | Security, or portion thereof has been pledged as collateral on open futures contracts. |
| (B) | The rate reported is the effective yield at the time of purchase. |
ADR — American Depositary Receipt
Cl — Class
S&P — Standard & Poor’s
The following is a list of the level of inputs used as of September 30, 2013, in valuing the Fund’s investments and other financial instruments carried at value ($ Thousands):
| Investments in Securities | Level 1 | Level 2 | Level 3 | Total | ||||||||||||
Common Stock | $ | 815,234 | $ | — | $ | — | $ | 815,234 | ||||||||
Cash Equivalent | 35,767 | — | — | 35,767 | ||||||||||||
U.S. Treasury Obligations | — | 1,391 | — | 1,391 | ||||||||||||
|
|
|
|
|
|
|
| |||||||||
Total Investments in Securities | $ | 851,001 | $ | 1,391 | $ | — | $ | 852,392 | ||||||||
|
|
|
|
|
|
|
| |||||||||
Other Financial Instruments | Level 1 | Level 2 | Level 3 | Total | ||||||||||||
Futures Contracts * | ||||||||||||||||
Unrealized Depreciation | $ | (112 | ) | $ | — | $ | — | $ | (112 | ) | ||||||
|
|
|
|
|
|
|
| |||||||||
Total Other Financial Instruments | $ | (112 | ) | $ | — | $ | — | $ | (112 | ) | ||||||
|
|
|
|
|
|
|
| |||||||||
| * | Futures contracts are valued at the unrealized depreciation on the instrument. |
For the year ended September 30, 2013, there were no transfers between Level 1 and Level 2 assets and liabilities.
For the year ended September 30, 2013, there were no transfers between Level 2 and Level 3 assets and liabilities.
Amounts designated as “—” are $0 or have been rounded to $0.
| 3 | SEI Institutional Managed Trust / Annual Report / September 30, 2013 |
Schedule of Investments
Global Managed Volatility Fund
September 30, 2013
| Market Value | ||||||||
Description | Shares | ($ Thousands) | ||||||
COMMON STOCK — 91.4% | ||||||||
Australia — 6.5% | ||||||||
AGL Energy | 126,241 | $ | 1,820 | |||||
Amcor | 260,481 | 2,548 | ||||||
CFS Retail Property Trust Group † | 1,078,442 | 2,017 | ||||||
Coca-Cola Amatil | 917,571 | 10,519 | ||||||
Computershare | 74,128 | 687 | ||||||
CSL | 192,070 | 11,494 | ||||||
GPT Group † | 718,368 | 2,338 | ||||||
Hansen Technologies | 41,039 | 39 | ||||||
Incitec Pivot | 301,104 | 757 | ||||||
Insurance Australia Group | 217,675 | 1,195 | ||||||
Metcash, Cl A | 2,037,098 | 6,095 | ||||||
Ramsay Health Care | 18,735 | 634 | ||||||
Sonic Healthcare | 199,393 | 3,019 | ||||||
SP AusNet, Cl Miscellaneous | 3,208,284 | 3,600 | ||||||
Sydney Airport | 974,523 | 3,581 | ||||||
Tabcorp Holdings | 812,641 | 2,492 | ||||||
Tatts Group | 2,199,095 | 6,375 | ||||||
Telstra, Cl B | 1,553,284 | 7,218 | ||||||
Transurban Group | 192,804 | 1,226 | ||||||
Treasury Wine Estates | 509,449 | 2,105 | ||||||
Wesfarmers | 47,840 | 1,840 | ||||||
Westfield Group † | 495,025 | 5,096 | ||||||
Westfield Retail Trust † | 1,241,252 | 3,447 | ||||||
Woolworths | 332,164 | 10,871 | ||||||
|
| |||||||
| 91,013 | ||||||||
|
| |||||||
Austria — 0.1% | ||||||||
Oesterreichische Post | 20,933 | 952 | ||||||
|
| |||||||
| 952 | ||||||||
|
| |||||||
Belgium — 0.3% | ||||||||
Belgacom | 127,879 | 3,402 | ||||||
Mobistar | 6,115 | 104 | ||||||
|
| |||||||
| 3,506 | ||||||||
|
| |||||||
Canada — 11.5% | ||||||||
Alimentation Couche Tard, Cl B | 31,000 | 1,937 | ||||||
Bank of Montreal | 142,000 | 9,498 | ||||||
BCE | 325,318 | 13,906 | ||||||
Bell Aliant | 294,369 | 7,346 | ||||||
Canadian Imperial Bank of Commerce | 142,100 | 11,344 | ||||||
Canadian National Railway | 17,400 | 1,767 | ||||||
Canadian Tire, Cl A | 93,800 | 8,325 | ||||||
Canadian Utilities, Cl A | 17,600 | 607 | ||||||
Cash Store Financial Services, Cl A | 5,200 | 9 | ||||||
CGI Group, Cl A * | 65,200 | 2,293 | ||||||
CI Financial | 4,300 | 130 | ||||||
Dollarama | 56,900 | 4,634 | ||||||
Emera | 72,400 | 2,098 | ||||||
Empire, Cl A | 51,800 | 3,748 | ||||||
EnerCare | 15,822 | 150 | ||||||
Fairfax Financial Holdings | 1,600 | 648 | ||||||
First Capital Realty | 65,900 | 1,085 | ||||||
Fortis, Cl Common Subscription Receipt | 202,400 | 6,161 | ||||||
George Weston | 63,300 | 4,989 | ||||||
H&R † | 125,700 | 2,591 | ||||||
Imperial Oil | 1,400 | 62 | ||||||
| Market Value | ||||||||
Description | Shares | ($ Thousands) | ||||||
Intact Financial, Cl Common Subscription Receipt | 73,100 | $ | 4,394 | |||||
K-Bro Linen | 4,265 | 136 | ||||||
Laurentian Bank of Canada | 3,600 | 157 | ||||||
Manitoba Telecom Services | 250,000 | 7,990 | ||||||
Metro, Cl A | 225,000 | 14,103 | ||||||
Morguard † | 28,100 | 447 | ||||||
National Bank of Canada | 146,800 | 12,149 | ||||||
North West | 42,892 | 983 | ||||||
Premium Brands Holdings | 4,500 | 84 | ||||||
RioCan † | 244,100 | 5,771 | ||||||
Rogers Communications, Cl B | 176,600 | 7,609 | ||||||
Rogers Sugar | 46,402 | 260 | ||||||
Saputo | 135,700 | 6,452 | ||||||
Shoppers Drug Mart, Cl B | 43,400 | 2,505 | ||||||
TELUS | 132,000 | 4,384 | ||||||
Tim Hortons | 117,100 | 6,806 | ||||||
TransCanada | 77,700 | 3,420 | ||||||
Valener | 33,226 | 509 | ||||||
|
| |||||||
| 161,487 | ||||||||
|
| |||||||
Cayman Islands — 0.0% | ||||||||
Fresh Del Monte Produce | 5,562 | 165 | ||||||
|
| |||||||
| 165 | ||||||||
|
| |||||||
Denmark — 2.5% | ||||||||
Coloplast A/S, Cl B | 195,722 | 11,151 | ||||||
GN Store Nord | 31,252 | 658 | ||||||
H Lundbeck, Cl H | 47,331 | 1,032 | ||||||
Novo Nordisk, Cl B | 33,534 | 5,697 | ||||||
Royal UNIBREW | 13,388 | 1,592 | ||||||
SimCorp | 16,400 | 552 | ||||||
TDC | 1,001,473 | 8,479 | ||||||
Topdanmark * | 224,179 | 5,778 | ||||||
|
| |||||||
| 34,939 | ||||||||
|
| |||||||
Finland — 0.1% | ||||||||
Olvi, Cl A | 1,700 | 59 | ||||||
Orion, Cl B | 58,269 | 1,469 | ||||||
|
| |||||||
| 1,528 | ||||||||
|
| |||||||
France — 0.2% | ||||||||
Boiron | 6,078 | 398 | ||||||
Bonduelle S.C.A. | 6,128 | 149 | ||||||
Medica | 13,305 | 332 | ||||||
Societe BIC | 15,768 | 1,835 | ||||||
Societe De’Edition De Canal + | 13,049 | 99 | ||||||
Tessi | 682 | 85 | ||||||
Vilmorin & Cie | 3,938 | 479 | ||||||
|
| |||||||
| 3,377 | ||||||||
|
| |||||||
Germany — 1.1% | ||||||||
Constantin Medien * | 14,561 | 33 | ||||||
Fielmann | 40,237 | 4,263 | ||||||
Fresenius | 62,528 | 7,772 | ||||||
Merck KGaA | 4,433 | 692 | ||||||
Suedzucker | 108,969 | 3,213 | ||||||
|
| |||||||
| 15,973 | ||||||||
|
| |||||||
Guernsey — 0.6% | ||||||||
Amdocs | 222,273 | 8,144 | ||||||
|
| |||||||
| 8,144 | ||||||||
|
| |||||||
| 1 | SEI Institutional Managed Trust / Annual Report / September 30, 2013 |
Schedule of Investments
Global Managed Volatility Fund
September 30, 2013
| Market Value | ||||||||
Description | Shares | ($ Thousands) | ||||||
Hong Kong — 2.4% | ||||||||
Cheung Kong Infrastructure Holdings | 591,000 | $ | 4,096 | |||||
CLP Holdings, Cl B | 1,384,000 | 11,270 | ||||||
Link † | 1,496,500 | 7,342 | ||||||
PCCW | 1,507,000 | 667 | ||||||
Power Assets Holdings | 983,000 | 8,797 | ||||||
Prosperity † | 586,000 | 181 | ||||||
Sunlight † | 590,000 | 231 | ||||||
Transport International Holdings, Cl B | 14,000 | 31 | ||||||
Yue Yuen Industrial Holdings | 434,000 | 1,212 | ||||||
|
| |||||||
| 33,827 | ||||||||
|
| |||||||
Ireland — 0.4% | ||||||||
ICON * | 31,233 | 1,278 | ||||||
Kerry Group, Cl A | 14,861 | 904 | ||||||
Ryanair Holdings | 468,879 | 4,006 | ||||||
|
| |||||||
| 6,188 | ||||||||
|
| |||||||
Israel — 1.2% | ||||||||
Azrieli Group | 63,154 | 2,004 | ||||||
Check Point Software Technologies * | 85,810 | 4,853 | ||||||
Formula Systems 1985 | 3,851 | 97 | ||||||
Given Imaging * | 22,493 | 433 | ||||||
Ituran Location and Control | 6,055 | 113 | ||||||
Osem Investments | 39,949 | 892 | ||||||
Strauss Group | 29,468 | 518 | ||||||
Teva Pharmaceutical Industries | 205,328 | 7,728 | ||||||
|
| |||||||
| 16,638 | ||||||||
|
| |||||||
Italy — 0.1% | ||||||||
CSP International Fashion Group | 1,207 | 2 | ||||||
Snam Rete Gas | 335,639 | 1,701 | ||||||
|
| |||||||
| 1,703 | ||||||||
|
| |||||||
Japan — 9.8% | ||||||||
ABC-Mart, Cl H | 5,400 | 263 | ||||||
Aeon, Cl H | 195,100 | 2,686 | ||||||
Ajis | 1,300 | 18 | ||||||
Alfresa Holdings | 52,500 | 2,707 | ||||||
Alpen | 19,900 | 413 | ||||||
Artnature | 3,900 | 81 | ||||||
Benesse, Cl A | 27,800 | 1,011 | ||||||
Can Do | 50,700 | 888 | ||||||
Coca-Cola West | 40,000 | 799 | ||||||
Doutor Nichires Holdings | 30,100 | 528 | ||||||
Duskin | 30,300 | 607 | ||||||
Dydo Drinco | 56,000 | 2,297 | ||||||
FamilyMart, Cl H | 117,600 | 5,088 | ||||||
Fancl | 240,200 | 2,925 | ||||||
Geo | 8,100 | 76 | ||||||
Hakuhodo DY Holdings | 280,500 | 2,087 | ||||||
Hiday Hidaka | 3,720 | 83 | ||||||
House Foods Group | 189,700 | 2,948 | ||||||
Ito En | 174,900 | 3,977 | ||||||
Itochu Techno-Solutions | 4,700 | 167 | ||||||
Itochu-Shokuhin | 3,900 | 130 | ||||||
J-Oil Mills | 56,000 | 179 | ||||||
Kao | 66,100 | 2,061 | ||||||
Kappa Create Holdings | 24,200 | 464 | ||||||
| Market Value | ||||||||
Description | Shares | ($ Thousands) | ||||||
Kasumi | 16,300 | $ | 103 | |||||
Kewpie | 499,700 | 7,939 | ||||||
KEY Coffee | 16,900 | 269 | ||||||
Kissei Pharmaceutical | 14,100 | 323 | ||||||
Kobayashi Pharmaceutical | 51,300 | 2,938 | ||||||
Kokuyo | 12,900 | 101 | ||||||
Kose | 180,200 | 5,216 | ||||||
Kura | 22,100 | 368 | ||||||
Kyokuyo | 64,000 | 185 | ||||||
Lawson | 52,700 | 4,130 | ||||||
Lion, Cl H | 1,153,400 | 7,029 | ||||||
Mandom | 33,200 | 1,161 | ||||||
Marudai Food | 82,000 | 266 | ||||||
Matsumotokiyoshi Holdings | 92,500 | 2,993 | ||||||
Matsuya Foods | 16,600 | 263 | ||||||
Maxvalu Tokai | 3,300 | 45 | ||||||
McDonald’s Holdings Japan | 283,400 | 7,821 | ||||||
Medipal Holdings | 67,300 | 831 | ||||||
Megmilk Snow Brand | 43,000 | 636 | ||||||
MEIJI Holdings | 10,000 | 547 | ||||||
Milbon | 4,300 | 176 | ||||||
Ministop | 76,300 | 1,190 | ||||||
Morinaga | 177,000 | 381 | ||||||
Morinaga Milk Industry | 285,025 | 901 | ||||||
MOS Food Services | 28,000 | 552 | ||||||
Namco Bandai Holdings | 107,700 | 2,014 | ||||||
Nihon Shokuhin Kako | 2,000 | 8 | ||||||
Nippon Flour Mills | 98,000 | 492 | ||||||
Nippon Telegraph & Telephone | 40,500 | 2,097 | ||||||
Nisshin Oillio Group | 134,000 | 466 | ||||||
Nissin Food Products | 16,100 | 661 | ||||||
Noevir Holdings | 38,800 | 664 | ||||||
NTT DOCOMO | 708,100 | 11,488 | ||||||
Ohsho Food Service | 21,000 | 703 | ||||||
Oracle Japan | 53,000 | 1,977 | ||||||
Oriental Land | 5,100 | 843 | ||||||
Osaka Gas | 571,000 | 2,432 | ||||||
Otsuka | 21,600 | 2,756 | ||||||
Otsuka Holdings | 377,800 | 10,958 | ||||||
Park24 | 70,300 | 1,250 | ||||||
Plenus | 8,900 | 171 | ||||||
Rock Field | 27,700 | 549 | ||||||
Royal Holdings | 45,100 | 718 | ||||||
Saizeriya | 10,900 | 146 | ||||||
Shimachu | 73,000 | 1,811 | ||||||
Shizuoka Gas | 30,000 | 204 | ||||||
Sogo Medical | 3,500 | 134 | ||||||
St. Marc Holdings | 10,200 | 516 | ||||||
Starbucks Coffee Japan | 58,400 | 702 | ||||||
Suzuken | 143,300 | 4,717 | ||||||
TKC | 8,200 | 142 | ||||||
Tokai | 9,200 | 247 | ||||||
USS | 37,800 | 547 | ||||||
Watami Food Services * | 9,600 | 162 | ||||||
Yamazaki Baking | 669,000 | 7,227 | ||||||
Yoshinoya Holdings | 155,400 | 1,821 | ||||||
|
| |||||||
| 137,470 | ||||||||
|
| |||||||
Netherlands — 0.1% | ||||||||
Koninklijke Vopak | 4,473 | 256 | ||||||
Royal Dutch Shell, Cl A | 51,173 | 1,689 | ||||||
|
| |||||||
| 1,945 | ||||||||
|
| |||||||
| 2 | SEI Institutional Managed Trust / Annual Report / September 30, 2013 |
Schedule of Investments
Global Managed Volatility Fund
September 30, 2013
| Market Value | ||||||||
Description | Shares | ($ Thousands) | ||||||
New Zealand — 1.0% | ||||||||
Argosy Property | 181,940 | $ | 142 | |||||
Auckland International Airport | 1,138,925 | 3,145 | ||||||
Chorus | 234,488 | 527 | ||||||
Contact Energy | 224,546 | 1,011 | ||||||
Fisher & Paykel Healthcare | 51,948 | 156 | ||||||
Infratil | 102,751 | 212 | ||||||
Port of Tauranga | 37,108 | 428 | ||||||
Restaurant Brands New Zealand | 21,157 | 50 | ||||||
Ryman Healthcare | 74,405 | 431 | ||||||
Sky City Entertainment Group | 299,882 | 1,002 | ||||||
Sky Network Television | 241,603 | 1,171 | ||||||
Summerset Group Holdings | 69,427 | 182 | ||||||
Telecom Corp of New Zealand | 2,751,194 | 5,328 | ||||||
Trade Me Group, Cl H | 46,016 | 175 | ||||||
|
| |||||||
| 13,960 | ||||||||
|
| |||||||
Norway — 2.5% | ||||||||
Orkla | 960,333 | 6,994 | ||||||
Statoil | 659,503 | 14,968 | ||||||
Telenor | 553,074 | 12,635 | ||||||
|
| |||||||
| 34,597 | ||||||||
|
| |||||||
Portugal — 0.5% | ||||||||
EDP—Energias de Portugal | 1,500,551 | 5,484 | ||||||
Portucel | 122,445 | 445 | ||||||
Semapa-Sociedade de Investimento e Gestao | 25,343 | 238 | ||||||
Sonaecom—SGPS | 212,068 | 590 | ||||||
|
| |||||||
| 6,757 | ||||||||
|
| |||||||
Singapore — 2.5% | ||||||||
Ascendas † | 752,000 | 1,367 | ||||||
CapitaCommercial Trust † | 1,981,000 | 2,289 | ||||||
CapitaMall Trust † | 781,000 | 1,220 | ||||||
ComfortDelGro | 306,000 | 480 | ||||||
First † | 140,000 | 125 | ||||||
Mapletree Industrial Trust † | 395,000 | 425 | ||||||
Metro Holdings | 73,539 | 50 | ||||||
MobileOne | 1,251,000 | 3,270 | ||||||
Sabana Shari’ah Compliant Industrial, Cl REIT † | 1,149,000 | 984 | ||||||
SATS | 278,000 | 722 | ||||||
Singapore Airlines | 183,000 | 1,523 | ||||||
Singapore Post | 2,180,000 | 2,198 | ||||||
Singapore Press Holdings | 951,000 | 3,115 | ||||||
Singapore Telecommunications | 2,449,000 | 7,280 | ||||||
StarHub | 2,770,000 | 9,471 | ||||||
Wilmar International | 285,000 | 720 | ||||||
|
| |||||||
| 35,239 | ||||||||
|
| |||||||
Spain — 0.0% | ||||||||
Ebro Foods | 7,663 | 173 | ||||||
Enagas | 9,726 | 239 | ||||||
|
| |||||||
| 412 | ||||||||
|
| |||||||
Sweden — 1.1% | ||||||||
Acando | 2,014 | 4 | ||||||
Axfood | 128,061 | 6,258 | ||||||
Industrial & Financial Systems, Cl B | 2,250 | 58 | ||||||
Millicom International Cellular | 4,333 | 383 | ||||||
| Market Value | ||||||||
Description | Shares | ($ Thousands) | ||||||
TeliaSonera | 1,162,718 | $ | 8,914 | |||||
|
| |||||||
| 15,617 | ||||||||
|
| |||||||
Switzerland — 3.7% | ||||||||
Allreal Holding, Cl A | 25,943 | 3,606 | ||||||
Aryzta | 23,146 | 1,547 | ||||||
Basler Kantonalbank, Cl H | 2,216 | 192 | ||||||
Bell | 46 | 114 | ||||||
Emmi | 1,224 | 365 | ||||||
Galenica | 6,445 | 5,460 | ||||||
Intershop Holdings | 392 | 142 | ||||||
Lindt & Spruengli | 8 | 380 | ||||||
Mobilezone Holding | 28,743 | 313 | ||||||
Mobimo Holding * | 7,815 | 1,634 | ||||||
Nestle | 103,382 | 7,231 | ||||||
Novartis | 104,858 | 8,059 | ||||||
Orior | 660 | 37 | ||||||
PSP Swiss Property | 95,057 | 8,252 | ||||||
Siegfried Holding | 5,821 | 943 | ||||||
Swiss Prime Site, Cl H | 65,779 | 5,089 | ||||||
Swisscom | 18,110 | 8,704 | ||||||
|
| |||||||
| 52,068 | ||||||||
|
| |||||||
United Kingdom — 12.3% | ||||||||
Admiral Group | 12,237 | 244 | ||||||
Associated British Foods | 279,126 | 8,480 | ||||||
AstraZeneca | 316,366 | 16,474 | ||||||
British American Tobacco | 139,620 | 7,408 | ||||||
British Sky Broadcasting Group | 285,606 | 4,024 | ||||||
Centrica | 1,819,047 | 10,891 | ||||||
Cranswick | 60,855 | 1,155 | ||||||
Dairy Crest Group | 18,916 | 140 | ||||||
Dignity PLC * | 8,671 | 204 | ||||||
Direct Line Insurance Group | 105,694 | 365 | ||||||
Genus | 12,272 | 285 | ||||||
GlaxoSmithKline | 442,067 | 11,150 | ||||||
Greggs | 477,871 | 3,278 | ||||||
Imperial Tobacco Group | 435,957 | 16,146 | ||||||
J Sainsbury | 1,954,659 | 12,392 | ||||||
JD Sports Fashion | 2,922 | 50 | ||||||
National Grid | 86,856 | 1,027 | ||||||
Next, Cl A | 136,540 | 11,410 | ||||||
Reckitt Benckiser Group | 102,525 | 7,505 | ||||||
Royal Dutch Shell, Cl A | 219,502 | 7,251 | ||||||
Sage Group | 11,841 | 63 | ||||||
Smith & Nephew | 696,396 | 8,695 | ||||||
SSE | 392,889 | 9,378 | ||||||
Synergy Health | 46,324 | 822 | ||||||
Tate & Lyle | 669,562 | 7,986 | ||||||
Unilever | 288,137 | 11,385 | ||||||
Vodafone Group | 119,037 | 416 | ||||||
WM Morrison Supermarkets | 2,887,513 | 13,093 | ||||||
|
| |||||||
| 171,717 | ||||||||
|
| |||||||
United States — 30.7% | ||||||||
ALLETE | 18,303 | 884 | ||||||
Altria Group | 170,256 | 5,848 | ||||||
American Electric Power | 180,979 | 7,845 | ||||||
American Water Works | 7,394 | 305 | ||||||
AmerisourceBergen | 218,449 | 13,347 | ||||||
Annaly Capital Management † | 248,433 | 2,877 | ||||||
AT&T | 329,962 | 11,159 | ||||||
Autozone * | 24,920 | 10,534 | ||||||
| 3 | SEI Institutional Managed Trust / Annual Report / September 30, 2013 |
Schedule of Investments
Global Managed Volatility Fund
September 30, 2013
| Market Value | ||||||||
Description | Shares | ($ Thousands) | ||||||
Baxter International | 56,362 | $ | 3,702 | |||||
Becton Dickinson | 80,901 | 8,092 | ||||||
Campbell Soup | 112,754 | 4,590 | ||||||
Capitol Federal Financial | 649,054 | 8,068 | ||||||
Cardinal Health | 8,970 | 468 | ||||||
CenturyTel | 242,664 | 7,615 | ||||||
Church & Dwight | 123,873 | 7,438 | ||||||
Cleco | 23,419 | 1,050 | ||||||
Clorox | 212,777 | 17,388 | ||||||
Colgate-Palmolive | 129,732 | 7,693 | ||||||
ConAgra Foods | 18,504 | 561 | ||||||
Consolidated Edison | 144,404 | 7,962 | ||||||
Constellium, Cl A * | 17,864 | 347 | ||||||
Costamare | 46,986 | 828 | ||||||
Dollar General * | 2,719 | 153 | ||||||
Dr Pepper Snapple Group | 105,069 | 4,709 | ||||||
DST Systems | 20,883 | 1,575 | ||||||
DTE Energy | 115,626 | 7,629 | ||||||
Edison International | 226,392 | 10,428 | ||||||
El Paso Electric, Cl A | 52,848 | 1,765 | ||||||
Eli Lilly | 17,204 | 866 | ||||||
Empire District Electric | 217,483 | 4,711 | ||||||
Entergy | 61,927 | 3,913 | ||||||
General Mills, Cl A | 404,921 | 19,404 | ||||||
Great Plains Energy | 166,208 | 3,690 | ||||||
Gyrodyne of America, Cl A † | 8,808 | 659 | ||||||
Hawaiian Electric Industries | 58,162 | 1,460 | ||||||
Henry Schein * | 49,156 | 5,098 | ||||||
Hershey | 144,703 | 13,385 | ||||||
Hormel Foods | 167,704 | 7,064 | ||||||
Idacorp, Cl A | 40,064 | 1,939 | ||||||
Jack Henry & Associates | 82,291 | 4,247 | ||||||
JM Smucker | 80,383 | 8,443 | ||||||
Johnson & Johnson | 200,967 | 17,422 | ||||||
Kellogg | 118,738 | 6,974 | ||||||
Kimberly-Clark | 209,645 | 19,753 | ||||||
Laboratory Corp of America Holdings * | 22,636 | 2,244 | ||||||
Liberty Media—Interactive, Cl A * | 16,493 | 387 | ||||||
McKesson | 56,606 | 7,263 | ||||||
Medcath | 43,046 | 59 | ||||||
Merck | 22,783 | 1,085 | ||||||
MGE Energy | 2,536 | 138 | ||||||
Oil-Dri Corp of America | 3,429 | 116 | ||||||
Orchids Paper Products | 11,199 | 310 | ||||||
Otter Tail | 36,228 | 1,000 | ||||||
Owens & Minor | 59,769 | 2,067 | ||||||
Patterson | 20,708 | 832 | ||||||
PDL BioPharma | 101,440 | 809 | ||||||
PepsiCo | 132,010 | 10,495 | ||||||
PetSmart | 86,518 | 6,598 | ||||||
Pfizer | 392,040 | 11,255 | ||||||
Pinnacle West Capital | 149,598 | 8,189 | ||||||
Portland General Electric | 264,427 | 7,465 | ||||||
PPL | 179,340 | 5,448 | ||||||
Procter & Gamble | 98,529 | 7,448 | ||||||
Reading International, Cl A * | 16,183 | 106 | ||||||
ResMed | 73,492 | 3,882 | ||||||
Retail Opportunity Investments † | 235,655 | 3,257 | ||||||
Rockville Financial | 42,561 | 553 | ||||||
| Shares/ | ||||||||
Description | Face Amount (Thousands)(1) | Market Value ($ Thousands) | ||||||
SCANA | 13,303 | $ | 613 | |||||
Seneca Foods, Cl A * | 6,087 | 183 | ||||||
Simplicity Bancorp | 5,945 | 93 | ||||||
Southern | 423,040 | 17,421 | ||||||
Target, Cl A | 89,335 | 5,716 | ||||||
Territorial Bancorp | 7,233 | 159 | ||||||
TJX | 15,139 | 854 | ||||||
UIL Holdings | 47,625 | 1,771 | ||||||
Unitil | 48,505 | 1,420 | ||||||
Universal | 62,389 | 3,178 | ||||||
UNS Energy | 160,201 | 7,468 | ||||||
Vector Group | 338,674 | 5,453 | ||||||
Vectren | 50,560 | 1,686 | ||||||
Wal-Mart Stores | 165,441 | 12,236 | ||||||
Weis Markets | 28,796 | 1,409 | ||||||
Westar Energy, Cl A | 253,626 | 7,774 | ||||||
Xcel Energy | 282,081 | 7,788 | ||||||
|
| |||||||
| 430,116 | ||||||||
|
| |||||||
Total Common Stock | 1,279,338 | |||||||
|
| |||||||
PREFERRED STOCK — 0.0% | ||||||||
United States — 0.0% | ||||||||
Wachovia Preferred Funding † | 5,113 | 133 | ||||||
Total Preferred Stock | 133 | |||||||
|
| |||||||
CASH EQUIVALENT — 4.6% | ||||||||
SEI Daily Income Trust, Prime | 64,403,470 | 64,403 | ||||||
|
| |||||||
Total Cash Equivalent | 64,403 | |||||||
|
| |||||||
TIME DEPOSITS — 0.8% | ||||||||
Brown Brothers Harriman | ||||||||
1.698%, 10/01/2013 AUD | 622 | 581 | ||||||
1.650%, 10/01/2013 NZD | 7 | 6 | ||||||
0.672%, 10/01/2013 NOK | 1 | — | ||||||
0.400%, 10/01/2013 CAD | 304 | 296 | ||||||
0.250%, 10/01/2013 SEK | 1 | — | ||||||
0.106%, 10/01/2013 GBP | 352 | 570 | ||||||
0.030%, 10/01/2013 | 8,598 | 8,598 | ||||||
0.019%, 10/01/2013 EUR | — | — | ||||||
0.005%, 10/01/2013 HKD | 5,863 | 756 | ||||||
0.005%, 10/01/2013 JPY | 1,432 | 15 | ||||||
0.005%, 10/01/2013 SGD | 150 | 119 | ||||||
0.001%, 10/01/2013 CHF | — | — | ||||||
|
| |||||||
Total Time Deposits | 10,941 | |||||||
|
| |||||||
| 4 | SEI Institutional Managed Trust / Annual Report / September 30, 2013 |
Schedule of Investments
Global Managed Volatility Fund
September 30, 2013
| Face Amount | Market Value | |||||||
Description | ($ Thousands) | ($ Thousands) | ||||||
U.S. TREASURY OBLIGATIONS (A) — 0.2% | ||||||||
U.S. Treasury Bills | $ | 76 | $ | 76 | ||||
0.071%, 7/24/2014 | ||||||||
0.054%, 2/6/2014(B) | 2,860 | 2,860 | ||||||
|
| |||||||
Total U.S. Treasury Obligations | 2,936 | |||||||
|
| |||||||
Total Investments — 97.0% | $ | 1,357,751 | ||||||
|
| |||||||
A list of the open futures contracts held by the Fund at September 30, 2013, is as follows:
| Unrealized | ||||||||||||
| Number of | Appreciation | |||||||||||
Type of Contract | Contracts Long | Expiration Date | (Depreciation) ($ Thousands) | |||||||||
DJ Euro Stoxx 50 Index | 262 | Dec-2013 | $ | (11 | ) | |||||||
FTSE 100 Index | 89 | Dec-2013 | (118 | ) | ||||||||
Hang Seng Index | 8 | Oct-2013 | (20 | ) | ||||||||
S&P 500 Index E-MINI | 498 | Dec-2013 | (146 | ) | ||||||||
SPI 200 Index | 20 | Dec-2013 | (20 | ) | ||||||||
Topix Index | 35 | Dec-2013 | 55 | |||||||||
|
| |||||||||||
| $ | (260 | ) | ||||||||||
|
| |||||||||||
For the year ended September 30, 2013, the total amount of all open futures contracts, as presented in the table above, are representative of the volume of activity for the derivative type during the year.
| Unrealized Appreciation (Depreciation) ($ Thousands) | ||||||||||||||||||||
Maturity Date | Currency to Deliver (Thousands) | Currency to Receive (Thousands) | ||||||||||||||||||
10/30/13 | AUD | 118,371 | USD | 110,601 | $ | 171 | ||||||||||||||
10/30/13 | CAD | 169,608 | USD | 164,620 | (299 | ) | ||||||||||||||
10/30/13 | CHF | 49,170 | USD | 53,970 | (435 | ) | ||||||||||||||
10/30/13 | DKK | 207,544 | USD | 37,594 | (92 | ) | ||||||||||||||
10/30/13 | EUR | 28,542 | USD | 38,554 | (81 | ) | ||||||||||||||
10/30/13 | GBP | 115,237 | USD | 185,106 | (1,442 | ) | ||||||||||||||
10/30/13 | HKD | 289,152 | USD | 37,290 | — | |||||||||||||||
10/30/13 | JPY | 15,563,959 | USD | 157,750 | (915 | ) | ||||||||||||||
10/30/13 | NOK | 210,122 | USD | 34,876 | (33 | ) | ||||||||||||||
10/30/13 | NZD | 14,717 | USD | 12,111 | (119 | ) | ||||||||||||||
10/30/13 | SEK | 101,396 | USD | 15,759 | (20 | ) | ||||||||||||||
10/30/13 | SGD | 45,427 | USD | 36,216 | (1 | ) | ||||||||||||||
10/30/13 | USD | 1,141 | AUD | 1,222 | (1 | ) | ||||||||||||||
10/30/13 | USD | 1,112 | CAD | 1,144 | 1 | |||||||||||||||
10/30/13 | USD | 615 | CHF | 557 | 2 | |||||||||||||||
10/30/13 | USD | 290 | DKK | 1,597 | — | |||||||||||||||
10/30/13 | USD | 290 | EUR | 214 | — | |||||||||||||||
10/30/13 | USD | 2,919 | GBP | 1,809 | 10 | |||||||||||||||
10/30/13 | USD | 214 | HKD | 1,661 | — | |||||||||||||||
10/30/13 | USD | 1,937 | JPY | 190,174 | 1 | |||||||||||||||
10/30/13 | USD | 366 | NOK | 2,196 | (1 | ) | ||||||||||||||
10/30/13 | USD | 208 | NZD | 251 | 1 | |||||||||||||||
10/30/13 | USD | 114 | SEK | 733 | — | |||||||||||||||
10/30/13 | USD | 209 | SGD | 262 | — | |||||||||||||||
|
| |||||||||||||||||||
| $ | (3,253 | ) | ||||||||||||||||||
|
| |||||||||||||||||||
A list of the counterparties for the outstanding forward foreign currency contracts held by the Fund at September 30, 2013, is as follows:
| Currency to | Currency to | Unrealized | ||||||||||
Counterparty | Deliver ($ Thousands) | Receive ($ Thousands) | Depreciation ($ Thousands) | |||||||||
Brown Brothers Harriman | ($897,127 | ) | $ | 893,874 | $ | (3,253 | ) | |||||
|
| |||||||||||
For the year ended September 30, 2013, the total amount of all open forward currency contracts, as presented in the table above, are representative of the volume of activity for the derivative type during the year.
Percentages are based on Net Assets of $1,400,270 ($Thousands).
| (1) | In U.S. Dollars unless otherwise indicated. |
| * | Non-income producing security. |
| ** | Rate shown is the 7-day effective yield as of September 30, 2013. |
| † | Real Estate Investment Trust. |
| †† | Investment in Affiliated Security. |
| (A) | The rate reported is the effective yield at the time of purchase. |
| (B) | Security, or portion thereof has been pledged as collateral on open futures contracts. |
AUD — Australia Dollar
CAD — Canadian Dollar
CHF — Swiss Franc
Cl — Class
DJ — Dow Jones
DKK — Denmark Krone
EUR — Euro
FTSE — Financial Times and the London Stock Exchange
GBP — British Pound
HKD — Hong Kong Dollar
JPY — Japanese Yen
NOK — Norwegian Krone
NZD — New Zealand Dollar
S&P — Standard & Poor’s
SEK — Sweden Krona
SGD — Singapore Dollar
SPI — Swiss Performance Index
USD — United States Dollar
The following is a list of the level of inputs used as of September 30, 2013, in valuing the Fund’s investments and other financial instruments carried at value ($ Thousands):
| Investments in Securities | Level 1 | Level 2 | Level 3 | Total | ||||||||||||
Common Stock | 1,279,338 | — | — | 1,279,338 | ||||||||||||
Preferred Stock | 133 | — | — | 133 | ||||||||||||
Cash Equivalent | 64,403 | — | — | 64,403 | ||||||||||||
Time Deposits | — | 10,941 | — | 10,941 | ||||||||||||
U.S. Treasury Obligations | — | 2,936 | — | 2,936 | ||||||||||||
|
|
|
|
|
|
|
| |||||||||
Total Investments in Securities | $ | 1,343,874 | $ | 13,877 | $ | — | $ | 1,357,751 | ||||||||
|
|
|
|
|
|
|
| |||||||||
Other Financial Instruments | Level 1 | Level 2 | Level 3 | Total | ||||||||||||
Futures Contracts * | ||||||||||||||||
Unrealized Appreciation | $ | 55 | $ | — | $ | — | $ | 55 | ||||||||
Unrealized Depreciation | (315 | ) | — | — | (315 | ) | ||||||||||
Forwards Contracts* | — | — | — | — | ||||||||||||
Unrealized Appreciation | — | 186 | — | 186 | ||||||||||||
Unrealized Depreciation | — | (3,439 | ) | — | (3,439 | ) | ||||||||||
|
|
|
|
|
|
|
| |||||||||
Total Other Financial Instruments | $ | (260 | ) | $ | (3,253 | ) | $ | — | $ | (3,513 | ) | |||||
|
|
|
|
|
|
|
| |||||||||
| * | Futures contracts and Forwards are valued at the unrealized appreciation (depreciation) on the instrument. |
For the year ended September 30, 2013, there were no transfers between Level 1 and Level 2 assets and liabilities.
For the year ended September 30, 2013, there were no transfers between Level 2 and Level 3 assets and liabilities.
Amounts designated as “—” are $ 0 or have been rounded to $ 0.
| 5 | SEI Institutional Managed Trust / Annual Report / September 30, 2013 |
Schedule of Investments
Tax - Managed Managed Volatility Fund
September 30 , 2013
| Market Value | ||||||||
Description | Shares | ($ Thousands) | ||||||
COMMON STOCK — 93.9% | ||||||||
Consumer Discretionary — 5.3% | ||||||||
Aaron’s | 41,200 | $ | 1,141 | |||||
Advance Auto Parts | 7,500 | 620 | ||||||
Big Lots * | 16,600 | 616 | ||||||
Canadian Tire, Cl A | 24,100 | 2,139 | ||||||
Cinemark Holdings | 27,000 | 857 | ||||||
Cogeco Cable | 10,500 | 495 | ||||||
Cracker Barrel Old Country Store | 11,300 | 1,166 | ||||||
DIRECTV * | 54,100 | 3,233 | ||||||
Dollar General * | 8,319 | 470 | ||||||
Genuine Parts | 4,800 | 388 | ||||||
H&R Block | 58,700 | 1,565 | ||||||
Hasbro | 37,800 | 1,782 | ||||||
Jarden * | 10,350 | 501 | ||||||
Kohl’s | 43,600 | 2,256 | ||||||
Madison Square Garden, Cl A * | 26,800 | 1,556 | ||||||
McDonald’s | 32,228 | 3,101 | ||||||
Regal Entertainment Group, Cl A | 52,000 | 987 | ||||||
Scripps Networks Interactive, Cl A | 13,900 | 1,086 | ||||||
Shaw Communications, Cl B | 67,700 | 1,573 | ||||||
Target, Cl A | 70,723 | 4,525 | ||||||
Time Warner Cable, Cl A | 18,400 | 2,053 | ||||||
Washington Post, Cl B | 1,500 | 917 | ||||||
|
| |||||||
| 33,027 | ||||||||
|
| |||||||
Consumer Staples — 20.2% | ||||||||
Altria Group | 117,388 | 4,032 | ||||||
Archer-Daniels-Midland | 38,400 | 1,415 | ||||||
Brown-Forman, Cl B | 41,287 | 2,813 | ||||||
Cal-Maine Foods | 34,300 | 1,650 | ||||||
Campbell Soup | 9,108 | 371 | ||||||
Church & Dwight | 87,004 | 5,225 | ||||||
Clorox | 36,583 | 2,989 | ||||||
Coca-Cola Enterprises | 49,400 | 1,985 | ||||||
Colgate-Palmolive | 68,913 | 4,086 | ||||||
ConAgra Foods | 102,922 | 3,123 | ||||||
Costco Wholesale | 44,096 | 5,076 | ||||||
CVS Caremark | 68,900 | 3,910 | ||||||
Dr Pepper Snapple Group | 35,300 | 1,582 | ||||||
Energizer Holdings | 16,200 | 1,477 | ||||||
Flowers Foods | 74,250 | 1,592 | ||||||
General Mills, Cl A | 88,908 | 4,260 | ||||||
Harris Teeter Supermarkets | 15,800 | 777 | ||||||
Hershey | 64,957 | 6,008 | ||||||
Hormel Foods | 138,034 | 5,814 | ||||||
JM Smucker | 40,285 | 4,231 | ||||||
Kellogg | 48,147 | 2,828 | ||||||
Kimberly-Clark | 47,039 | 4,432 | ||||||
Kroger | 138,516 | 5,588 | ||||||
Lorillard | 129,979 | 5,821 | ||||||
McCormick | 55,986 | 3,622 | ||||||
Metro, Cl A | 35,000 | 2,194 | ||||||
Molson Coors Brewing, Cl B | 35,200 | 1,765 | ||||||
PepsiCo | 41,557 | 3,304 | ||||||
Philip Morris International | 38,511 | 3,335 | ||||||
Procter & Gamble | 52,073 | 3,936 | ||||||
Reynolds American | 87,275 | 4,257 | ||||||
Safeway | 128,800 | 4,120 | ||||||
TreeHouse Foods * | 17,700 | 1,183 | ||||||
Tyson Foods, Cl A | 81,000 | 2,291 | ||||||
| Market Value | ||||||||
Description | Shares | ($ Thousands) | ||||||
Universal | 16,000 | $ | 815 | |||||
Walgreen | 74,500 | 4,008 | ||||||
Wal-Mart Stores | 129,082 | 9,547 | ||||||
|
| |||||||
| 125,462 | ||||||||
|
| |||||||
Energy — 3.3% | ||||||||
Chevron | 42,900 | 5,212 | ||||||
ConocoPhillips | 50,300 | 3,496 | ||||||
Core Laboratories | 3,300 | 559 | ||||||
Diamond Offshore Drilling | 22,100 | 1,377 | ||||||
Exxon Mobil | 87,000 | 7,486 | ||||||
Imperial Oil | 25,600 | 1,125 | ||||||
TransCanada | 34,200 | 1,503 | ||||||
|
| |||||||
| 20,758 | ||||||||
|
| |||||||
Financials — 17.8% | ||||||||
Alleghany * | 4,000 | 1,639 | ||||||
Allied World Assurance Holdings | 22,231 | 2,210 | ||||||
Allstate | 38,400 | 1,941 | ||||||
American Campus Communities † | 48,800 | 1,667 | ||||||
American Capital Agency, Cl A † | 38,300 | 865 | ||||||
American Financial Group | 41,500 | 2,243 | ||||||
Arch Capital Group * | 54,338 | 2,941 | ||||||
Axis Capital Holdings | 43,200 | 1,871 | ||||||
Canadian Imperial Bank of Commerce | 31,000 | 2,475 | ||||||
Capitol Federal Financial | 353,221 | 4,391 | ||||||
CBOE Holdings | 34,100 | 1,542 | ||||||
Chubb | 34,200 | 3,053 | ||||||
Cullen/Frost Bankers | 44,259 | 3,122 | ||||||
Endurance Specialty Holdings | 20,100 | 1,080 | ||||||
Equity Lifestyle Properties † | 45,400 | 1,551 | ||||||
Erie Indemnity, Cl A | 14,400 | 1,044 | ||||||
Essex Property Trust † | 4,200 | 620 | ||||||
Everest Re Group | 30,573 | 4,446 | ||||||
First Niagara Financial Group | 157,700 | 1,635 | ||||||
Genworth MI Canada | 23,900 | 674 | ||||||
Government Properties Income Trust, Cl A † | 55,900 | 1,338 | ||||||
Hancock Holding, Cl A | 20,100 | 631 | ||||||
Hanover Insurance Group, Cl A | 17,900 | 990 | ||||||
HCC Insurance Holdings | 95,000 | 4,163 | ||||||
Home Properties † | 43,825 | 2,531 | ||||||
Maiden Holdings | 62,300 | 736 | ||||||
MFA Financial † | 126,200 | 940 | ||||||
Mid-America Apartment Communities † | 37,744 | 2,359 | ||||||
National Bank of Canada | 35,700 | 2,955 | ||||||
National Retail Properties † | 34,456 | 1,096 | ||||||
PartnerRe | 72,979 | 6,680 | ||||||
PennyMac Mortgage Investment Trust † | 50,500 | 1,145 | ||||||
People’s United Financial | 253,013 | 3,638 | ||||||
Piedmont Office Realty Trust, Cl A † | 94,900 | 1,648 | ||||||
Platinum Underwriters Holdings | 22,400 | 1,338 | ||||||
Primerica | 33,600 | 1,355 | ||||||
ProAssurance | 11,919 | 537 | ||||||
Prosperity Bancshares | 29,500 | 1,824 | ||||||
Public Storage † | 7,041 | 1,131 | ||||||
Realty Income † | 25,400 | 1,010 | ||||||
RenaissanceRe Holdings | 94,358 | 8,542 | ||||||
Senior Housing Properties Trust † | 74,200 | 1,732 | ||||||
| 1 | SEI Institutional Managed Trust / Annual Report / September 30, 2013 |
Schedule of Investments
Tax - Managed Managed Volatility Fund
September 30, 2013
| Market Value | ||||||||
Description | Shares | ($ Thousands) | ||||||
Signature Bank NY, Cl B * | 18,500 | $ | 1,693 | |||||
Silver Bay Realty Trust † | 4,355 | 68 | ||||||
Tanger Factory Outlet Centers † | 126,106 | 4,117 | ||||||
TFS Financial * | 230,986 | 2,765 | ||||||
Tower Group International | 18,921 | 132 | ||||||
Travelers | 49,800 | 4,222 | ||||||
Two Harbors Investment † | 140,000 | 1,359 | ||||||
Validus Holdings | 96,100 | 3,554 | ||||||
White Mountains Insurance Group | 6,075 | 3,448 | ||||||
|
| |||||||
| 110,687 | ||||||||
|
| |||||||
Health Care — 14.6% | ||||||||
Abbott Laboratories | 85,760 | 2,846 | ||||||
AbbVie | 105,427 | 4,716 | ||||||
Actavis * | 12,200 | 1,757 | ||||||
Aetna, Cl A | 37,500 | 2,401 | ||||||
AmerisourceBergen | 76,437 | 4,670 | ||||||
Amgen, Cl A | 48,800 | 5,463 | ||||||
AstraZeneca ADR | 53,600 | 2,783 | ||||||
Baxter International | 30,200 | 1,984 | ||||||
Becton Dickinson | 22,400 | 2,241 | ||||||
Cardinal Health | 35,300 | 1,841 | ||||||
Celgene, Cl A * | 11,500 | 1,770 | ||||||
Cooper, Cl A | 2,400 | 311 | ||||||
Cubist Pharmaceuticals * | 26,600 | 1,690 | ||||||
Eli Lilly | 44,380 | 2,234 | ||||||
Greatbatch * | 21,800 | 742 | ||||||
Humana | 11,900 | 1,111 | ||||||
Johnson & Johnson | 135,163 | 11,717 | ||||||
Laboratory Corp of America Holdings * | 9,000 | 892 | ||||||
Magellan Health Services * | 13,600 | 815 | ||||||
McKesson | 31,900 | 4,093 | ||||||
Medtronic | 29,000 | 1,544 | ||||||
Merck | 96,500 | 4,594 | ||||||
Owens & Minor | 12,500 | 432 | ||||||
Patterson | 33,200 | 1,335 | ||||||
PDL BioPharma | 96,900 | 772 | ||||||
Perrigo | 31,664 | 3,907 | ||||||
Pfizer | 169,600 | 4,869 | ||||||
Quest Diagnostics | 51,700 | 3,195 | ||||||
St. Jude Medical | 24,200 | 1,298 | ||||||
Techne, Cl A | 43,892 | 3,514 | ||||||
United Therapeutics * | 26,300 | 2,074 | ||||||
UnitedHealth Group | 36,500 | 2,614 | ||||||
WellPoint | 18,100 | 1,513 | ||||||
Zimmer Holdings | 36,400 | 2,990 | ||||||
|
| |||||||
| 90,728 | ||||||||
|
| |||||||
Industrials — 7.3% | ||||||||
Alliant Techsystems | 44,200 | 4,312 | ||||||
C.H. Robinson Worldwide | 27,900 | 1,662 | ||||||
Copa Holdings, Cl A | 12,080 | 1,675 | ||||||
Dun & Bradstreet | 12,300 | 1,277 | ||||||
FTI Consulting * | 19,800 | 749 | ||||||
General Dynamics | 22,900 | 2,004 | ||||||
L-3 Communications Holdings | 57,100 | 5,396 | ||||||
Landstar System | 24,200 | 1,355 | ||||||
Leidos Holdings | 51,425 | 2,341 | ||||||
Lockheed Martin | 28,400 | 3,623 | ||||||
Northrop Grumman | 55,500 | 5,287 | ||||||
Old Dominion Freight Line, Cl A * | 38,200 | 1,757 | ||||||
| Market Value | ||||||||
Description | Shares | ($ Thousands) | ||||||
Raytheon | 70,000 | $ | 5,395 | |||||
Rollins | 66,700 | 1,768 | ||||||
Stericycle, Cl A * | 30,579 | 3,529 | ||||||
TransDigm Group * | 11,500 | 1,595 | ||||||
Verisk Analytics, Cl A * | 26,500 | 1,721 | ||||||
Watsco | 3,600 | 339 | ||||||
|
| |||||||
| 45,785 | ||||||||
|
| |||||||
Information Technology — 7.4% | ||||||||
Activision Blizzard | 95,600 | 1,594 | ||||||
Amdocs | 129,100 | 4,730 | ||||||
Automatic Data Processing | 42,846 | 3,101 | ||||||
Broadridge Financial Solutions | 57,900 | 1,838 | ||||||
CA | 48,400 | 1,436 | ||||||
CACI International, Cl A * | 11,100 | 767 | ||||||
Cisco Systems | 134,000 | 3,138 | ||||||
CSG Systems International | 37,600 | 942 | ||||||
Flir Systems | 51,100 | 1,604 | ||||||
Global Payments | 33,200 | 1,696 | ||||||
Google, Cl A * | 1,809 | 1,585 | ||||||
Harris | 36,800 | 2,182 | ||||||
IAC | 28,007 | 1,531 | ||||||
Ingram Micro, Cl A * | 73,000 | 1,683 | ||||||
Intel | 117,400 | 2,691 | ||||||
International Business Machines | 22,343 | 4,138 | ||||||
Jack Henry & Associates | 13,800 | 712 | ||||||
Microsoft | 111,500 | 3,714 | ||||||
NeuStar, Cl A * | 9,300 | 460 | ||||||
Oracle, Cl B | 60,400 | 2,004 | ||||||
Science Applications International | 29,386 | 992 | ||||||
Tech Data * | 22,200 | 1,108 | ||||||
Total System Services | 57,400 | 1,689 | ||||||
Visa, Cl A | 902 | 172 | ||||||
Zebra Technologies, Cl A * | 7,200 | 328 | ||||||
|
| |||||||
| 45,835 | ||||||||
|
| |||||||
Materials — 1.5% | ||||||||
Aptargroup | 28,500 | 1,714 | ||||||
Ball | 34,700 | 1,557 | ||||||
Barrick Gold | 24,900 | 465 | ||||||
Bemis | 42,300 | 1,650 | ||||||
Compass Minerals International, Cl A | 18,200 | 1,388 | ||||||
Greif, Cl A | 10,500 | 515 | ||||||
Silgan Holdings | 32,400 | 1,523 | ||||||
Sonoco Products | 14,500 | 564 | ||||||
|
| |||||||
| 9,376 | ||||||||
|
| |||||||
Telecommunication Services — 3.5% | ||||||||
AT&T | 118,000 | 3,991 | ||||||
BCE | 60,600 | 2,594 | ||||||
CenturyTel | 20,379 | 639 | ||||||
NTT DoCoMo ADR | 130,100 | 2,110 | ||||||
Rogers Communications, Cl B | 68,600 | 2,956 | ||||||
SBA Communications, Cl A * | 13,400 | 1,078 | ||||||
SK Telecom ADR | 129,800 | 2,946 | ||||||
Verizon Communications | 63,677 | 2,971 | ||||||
Vodafone Group ADR | 67,300 | 2,368 | ||||||
|
| |||||||
| 21,653 | ||||||||
|
| |||||||
Utilities — 12.9% | ||||||||
AGL Resources | 65,036 | 2,994 | ||||||
Alliant Energy | 31,900 | 1,580 | ||||||
| 2 | SEI Institutional Managed Trust / Annual Report / September 30, 2013 |
Schedule of Investments
Tax - Managed Managed Volatility Fund
September 30, 2013
Shares/ Face Amount | Market Value | |||||||
Description | ($ Thousands) | ($ Thousands) | ||||||
Ameren | 60,200 | $ | 2,097 | |||||
American Electric Power | 81,000 | 3,511 | ||||||
American States Water | 45,000 | 1,240 | ||||||
American Water Works | 30,000 | 1,239 | ||||||
Atmos Energy | 77,200 | 3,288 | ||||||
Avista | 50,300 | 1,328 | ||||||
Cleco | 24,700 | 1,108 | ||||||
Consolidated Edison | 118,423 | 6,530 | ||||||
Dominion Resources | 13,121 | 820 | ||||||
DTE Energy | 61,757 | 4,075 | ||||||
Duke Energy | 59,129 | 3,949 | ||||||
Edison International | 105,400 | 4,855 | ||||||
Entergy | 41,200 | 2,603 | ||||||
Great Plains Energy | 35,600 | 790 | ||||||
Hawaiian Electric Industries | 68,832 | 1,728 | ||||||
Idacorp, Cl A | 24,800 | 1,200 | ||||||
ITC Holdings | 25,114 | 2,357 | ||||||
Northeast Utilities | 88,387 | 3,646 | ||||||
OGE Energy | 66,619 | 2,404 | ||||||
PG&E | 93,200 | 3,814 | ||||||
Pinnacle West Capital | 30,700 | 1,680 | ||||||
Portland General Electric | 64,100 | 1,810 | ||||||
PPL | 53,000 | 1,610 | ||||||
Public Service Enterprise Group | 90,700 | 2,987 | ||||||
SCANA | 33,535 | 1,544 | ||||||
Southern | 71,825 | 2,958 | ||||||
UGI | 38,500 | 1,506 | ||||||
Vectren | 73,380 | 2,447 | ||||||
WGL Holdings | 21,500 | 918 | ||||||
Wisconsin Energy | 135,904 | 5,488 | ||||||
|
| |||||||
| 80,104 | ||||||||
|
| |||||||
Total Common Stock | 583,415 | |||||||
|
| |||||||
CASH EQUIVALENT — 5.9% | ||||||||
SEI Daily Income Trust, Prime | 36,686,335 | 36,686 | ||||||
|
| |||||||
Total Cash Equivalent | 36,686 | |||||||
|
| |||||||
U.S. TREASURY OBLIGATIONS (A) (B) — 0.2% | ||||||||
U.S. Treasury Bills | ||||||||
0.060%, 2/6/2014 | $ | 427 | 427 | |||||
0.040%, 1/9/2014 | 630 | 630 | ||||||
|
| |||||||
Total U.S. Treasury Obligations | 1,057 | |||||||
|
| |||||||
Total Investments — 99.9% | $ | 621,158 | ||||||
|
| |||||||
A list of the open futures contracts held by the Fund at September 30, 2013, are as follows:
| Number of | Unrealized | |||||||||||
| Type of | Contracts | Expiration | (Depreciation) | |||||||||
Contract | Long | Date | ($ Thousands) | |||||||||
S&P 500 Index EMINI | 235 | Dec-2013 | $ | (107 | ) | |||||||
|
| |||||||||||
For the year ended September 30, 2013, the total amount of all open futures contracts, as presented in the table above, are representative of the volume of activity for this derivative type during the year.
Percentages are based on Net Assets of $ 621,530 ($ Thousands).
| * | Non-income producing security. |
| ** | Rate shown is the 7-day effective yield as of September 30, 2013. |
| † | Real Estate Investment Trust. |
| †† | Investment in Affiliated Security. |
| (A) | Security, or portion thereof has been pledged as collateral on open futures contracts. |
| (B) | The rate reported is the effective yield at the time of purchase. |
ADR — American Depositary Receipt
Cl — Class
S&P — Standard & Poor’s
The following is a list of the level of inputs used as of September 30, 2013, in valuing the Fund’s investments and other financial instruments carried at value ($ Thousands):
| Investments in Securities | Level 1 | Level 2 | Level 3 | Total | ||||||||||||
Common Stock | $ | 583,415 | $ | — | $ | — | $ | 583,415 | ||||||||
U.S. Treasury Obligations | — | 1,057 | — | 1,057 | ||||||||||||
Cash Equivalent | 36,686 | — | — | 36,686 | ||||||||||||
|
|
|
|
|
|
|
| |||||||||
Total Investments in Securities | $ | 620,101 | $ | 1,057 | $ | — | $ | 621,158 | ||||||||
|
|
|
|
|
|
|
| |||||||||
Other Financial Instruments | Level 1 | Level 2 | Level 3 | Total | ||||||||||||
Futures Contracts * | ||||||||||||||||
Unrealized Appreciation | $ | — | $ | — | $ | — | $ | — | ||||||||
Unrealized Depreciation | (107 | ) | — | — | (107 | ) | ||||||||||
|
|
|
|
|
|
|
| |||||||||
Total Other Financial Instruments | $ | (107 | ) | $ | — | $ | — | $ | (107 | ) | ||||||
|
|
|
|
|
|
|
| |||||||||
| * | Futures contracts are valued at the unrealized depreciation on the instrument. |
For the year ended September 30, 2013, there were no transfers between Level 1 and Level 2 assets and liabilities.
For the year ended September 30, 2013, there were no transfers between Level 2 and Level 3 assets and liabilities.
Amounts designated as “—” are $0 or have been rounded to $0.
| 3 | SEI Institutional Managed Trust / Annual Report / September 30, 2013 |
Report of Independent Registered Public Accounting Firm
The Board of Trustees and Shareholders
SEI Institutional Managed Trust:
We have audited, in accordance with the standards of the Public Company Accounting Oversight Board (United States), the financial statements of SEI Institutional Managed Trust (the Trust), comprised of the Large Cap Fund, Large Cap Value Fund, Large Cap Growth Fund, Tax-Managed Large Cap Fund, S&P 500 Index Fund, Small Cap Fund, Small Cap Value Fund, Small Cap Growth Fund, Tax-Managed Small/Mid Cap Fund, Mid-Cap Fund, U.S. Managed Volatility Fund, Global Managed Volatility Fund, Tax-Managed Managed Volatility Fund, Real Estate Fund, Enhanced Income Fund, Core Fixed Income Fund, U.S. Fixed Income Fund, High Yield Bond Fund, Real Return Fund, Multi-Strategy Alternative Fund, Multi-Asset Income Fund and the Multi-Asset Capital Stability Fund (twenty-two of the twenty-four funds comprising the Trust), and the accompanying consolidated financial statements of the Multi-Asset Accumulation Fund and the Multi-Asset Inflation Managed Fund (two of the twenty-four funds comprising the Trust) as of and for the year ended September 30, 2013, and have issued our unqualified report thereon dated November 27, 2013 (which report, financial statements and consolidated financial statements are included in Item 1 of this Certified Shareholder Report on Form N-CSR). Our audits included an audit of the schedules of investments in securities and the consolidated schedules of investments in securities (collectively, the “Schedules”) of the funds comprising the Trust as of September 30, 2013 appearing in Item 6 of this Form N-CSR. These Schedules are the responsibility of the Trust’s management. Our responsibility is to express an opinion on these Schedules based on our audits.
In our opinion, the Schedules referred to above, when read in conjunction with the financial statements and consolidated financial statements of the funds comprising the Trust referred to above, present fairly, in all material respects, the information set forth therein.
Philadelphia, Pennsylvania
November 27, 2013
Item 7. Disclosure of Proxy Voting Policies and Procedures for Closed-End Management Investment Companies.
Not applicable.
Item 8. Portfolio Managers of Closed-End Management Investment Companies
Not applicable.
Item 9. Purchases of Equity Securities by Closed-End Management Company and Affiliated Purchasers.
Not applicable.
Item 10. Submission of Matters to a Vote of Security Holders.
The Registrant has a standing Governance Committee (the “Committee”) currently consisting of the Independent Trustees. The Committee is responsible for evaluating and recommending nominees for election to the Registrant’s Board of Trustees (the “Board”). Pursuant to the Committee’s Charter, adopted on June 18, 2004, as amended, the Committee will review all shareholder recommendations for nominations to fill vacancies on the Board if such recommendations are submitted in writing and addressed to the Committee at the Registrant’s office.
Item 11. Controls and Procedures.
(a) The Registrant’s principal executive and principal financial officers, or persons performing similar functions, have concluded that the Registrant’s disclosure controls and procedures (as defined in Rule 30a-3(c) under the Investment Company Act of 1940 (the “1940 Act”)) are effective, based on the evaluation of these controls and procedures required by Rule 30a-3(b) under the 1940 Act and Rules 13a-15(b) or 15d-15(b) under the Securities Exchange Act of 1934 as of a date within 90 days of the filing date of this report.
(b) There were no changes in the Registrant’s internal control over financial reporting (as defined in Rule 30a-3(d) under the 1940 Act) that occurred during the second fiscal quarter of the period covered by this report that have materially affected, or are reasonably likely to materially affect, the Registrants internal control over financial reporting.
Items 12. Exhibits.
(a)(1) Code of Ethics attached hereto.
(a)(2) A separate certification for the principal executive officer and the principal financial officer of the Registrant as required by Rule 30a-2(a) under the Investment Company Act of 1940, as amended (17 CFR 270.30a-2(a)), are filed herewith.
(b) Officer certifications as required by Rule 30a-2(b) under the Investment Company Act of 1940, as amended (17 CFR 270.30a-2(b)) also accompany this filing as exhibits.
SIGNATURES
Pursuant to the requirements of the Securities Exchange Act of 1934 and the Investment Company Act of 1940, the Registrant has duly caused this report to be signed on its behalf by the undersigned, thereunto duly authorized.
| SEI Institutional Managed Trust | ||||||
| By | /s/ Robert A. Nesher | |||||
| Robert A. Nesher | ||||||
| President & CEO | ||||||
Date: December 6, 2013
Pursuant to the requirements of the Securities Exchange Act of 1934 and the Investment Company Act of 1940, this report has been signed below by the following persons on behalf of the Registrant and in the capacities and on the dates indicated.
| By | /s/ Robert A. Nesher | |||||
| Robert A. Nesher | ||||||
| President & CEO |
Date: December 6, 2013
| By | /s/ Peter A. Rodriguez | |||||
| Peter A. Rodriguez | ||||||
| Controller & CFO |
Date: December 6, 2013