UNITED STATES
SECURITIES AND EXCHANGE COMMISSION
Washington, D.C. 20549
FORM N-CSRS
CERTIFIED SHAREHOLDER REPORT OF REGISTERED MANAGEMENT
INVESTMENT COMPANIES
Investment Company Act file number 811-04878
SEI Institutional Managed Trust
(Exact name of registrant as specified in charter)
SEI Investments
One Freedom Valley Drive
Oaks, PA 19456
(Address of principal executive offices)
Timothy D. Barto, Esq.
SEI Investments Co.
One Freedom Valley Drive
Oaks, PA 19456
(Name and address of agent for service)
Registrant’s telephone number, including area code: 1-610-676-1000
Date of fiscal year end: September 30, 2021
Date of reporting period: March 31, 2021
Item 1. Reports to Stockholders.

The Trust files its complete schedule of portfolio holdings with the Securities and Exchange Commission for the first and third quarters of each fiscal year as an exhibit to its reports on Form N-PORT. The Trust’s Form N-PORT reports are available on the Commission’s website at http://www.sec.gov.
A description of the policies and procedures that the Trust uses to determine how to vote proxies relating to portfolio securities, as well as information relating to how a Fund voted proxies relating to portfolio securities during the most recent 12-month period ended June 30, is available (i) without charge, upon request, by calling 1-800-DIAL-SEI; and (ii) on the Commission’s website at http://www.sec.gov.
SUMMARY SCHEDULE OF INVESTMENTS (Unaudited)
March 31, 2021
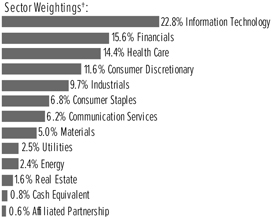
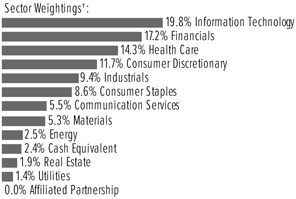
Large Cap Fund
†Percentages are based on total investments. Includes investments held as collateral for securities held on loan (see Note 10).
| Description | Percentage of Net Assets (%) | Shares | Market Value ($ Thousands) | |||||||||
COMMON STOCK — 99.2% |
| |||||||||||
Communication Services — 6.3% |
| |||||||||||
Alphabet Inc, Cl A * | 0.7 | % | 7,256 | $ | 14,966 | |||||||
Alphabet Inc, Cl C * | 1.0 | 10,346 | 21,402 | |||||||||
Comcast Corp, Cl A | 0.8 | 311,982 | 16,881 | |||||||||
Facebook Inc, Cl A * | 1.5 | 111,416 | 32,815 | |||||||||
Verizon Communications Inc | 0.9 | 348,594 | 20,271 | |||||||||
Other Securities | 1.4 | 30,984 | ||||||||||
| 137,319 | ||||||||||||
Consumer Discretionary — 11.6% |
| |||||||||||
Amazon.com Inc, Cl A * | 2.3 | 16,137 | 49,929 | |||||||||
General Motors Co | 0.7 | 275,790 | 15,847 | |||||||||
Lowe’s Cos Inc | 0.8 | 94,558 | 17,983 | |||||||||
Ross Stores Inc | 0.7 | 132,001 | 15,828 | |||||||||
Other Securities (A) | 7.1 | 154,856 | ||||||||||
| 254,443 | ||||||||||||
Consumer Staples — 6.9% |
| |||||||||||
Kroger Co/The | 0.9 | 523,188 | 18,829 | |||||||||
Philip Morris International Inc | 0.6 | 152,724 | 13,553 | |||||||||
Unilever PLC ADR | 0.9 | 358,044 | 19,990 | |||||||||
Other Securities | 4.5 | 98,024 | ||||||||||
| 150,396 | ||||||||||||
Energy — 2.4% |
| |||||||||||
Other Securities | 2.4 | 52,929 | ||||||||||
Financials — 15.7% |
| |||||||||||
Bank of America Corp | 1.5 | 833,093 | 32,232 | |||||||||
Berkshire Hathaway Inc, | 1.3 | 107,429 | 27,445 | |||||||||
Capital One Financial Corp | 1.1 | 185,240 | 23,568 | |||||||||
Charles Schwab Corp/The | 0.7 | 219,118 | 14,282 | |||||||||
Citigroup Inc | 0.8 | 226,874 | 16,505 | |||||||||
First Republic Bank/CA | 0.9 | 120,561 | 20,104 | |||||||||
Markel Corp * | 0.7 | 12,806 | 14,594 | |||||||||
S&P Global Inc | 0.6 | 36,924 | 13,029 | |||||||||
| Description | Percentage of Net Assets (%) | Shares | Market Value ($ Thousands) | |||||||||
COMMON STOCK (continued) |
| |||||||||||
US Bancorp | 0.8 | % | 323,806 | $ | 17,910 | |||||||
Other Securities ‡ | 7.3 | 164,323 | ||||||||||
| 343,992 | ||||||||||||
Health Care — 14.4% | ||||||||||||
Amgen Inc, Cl A | 0.9 | 75,930 | 18,892 | |||||||||
Becton Dickinson and Co | 0.7 | 63,430 | 15,423 | |||||||||
CVS Health Corp | 0.8 | 227,837 | 17,140 | |||||||||
Humana Inc | 0.6 | 31,106 | 13,041 | |||||||||
Johnson & Johnson | 1.7 | 233,252 | 38,335 | |||||||||
Medtronic PLC | 0.6 | 115,198 | 13,608 | |||||||||
Merck & Co Inc | 0.8 | 231,072 | 17,813 | |||||||||
Teleflex Inc | 0.7 | 37,086 | 15,408 | |||||||||
UnitedHealth Group Inc | 1.0 | 60,733 | 22,597 | |||||||||
Zimmer Biomet Holdings Inc | 0.7 | 97,355 | 15,585 | |||||||||
Other Securities (A) | 5.9 | 127,889 | ||||||||||
| 315,731 | ||||||||||||
Industrials — 9.7% | ||||||||||||
Honeywell International Inc | 1.3 | 132,550 | 28,773 | |||||||||
Stanley Black & Decker Inc | 0.8 | 85,552 | 17,082 | |||||||||
WW Grainger Inc | 0.6 | 33,540 | 13,447 | |||||||||
Other Securities | 7.0 | 153,802 | ||||||||||
| 213,104 | ||||||||||||
Information Technology — 23.0% |
| |||||||||||
Adobe Inc * | 1.4 | 62,259 | 29,596 | |||||||||
Apple Inc | 2.8 | 504,454 | 61,619 | |||||||||
Applied Materials Inc | 0.9 | 146,722 | 19,602 | |||||||||
Global Payments Inc | 1.0 | 103,225 | 20,808 | |||||||||
Intel Corp | 0.6 | 196,333 | 12,565 | |||||||||
Intuit Inc | 1.4 | 79,125 | 30,310 | |||||||||
KLA Corp | 0.7 | 43,998 | 14,537 | |||||||||
Microchip Technology Inc | 1.4 | 194,568 | 30,201 | |||||||||
Microsoft Corp | 2.6 | 242,452 | 57,163 | |||||||||
Motorola Solutions Inc | 0.6 | 67,599 | 12,712 | |||||||||
PayPal Holdings Inc * | 0.9 | 80,558 | 19,563 | |||||||||
QUALCOMM Inc | 0.9 | 143,364 | 19,009 | |||||||||
salesforce.com * | 0.8 | 86,371 | 18,299 | |||||||||
Visa Inc, Cl A | 1.3 | 139,382 | 29,511 | |||||||||
Other Securities | 5.7 | 127,102 | ||||||||||
| 502,597 | ||||||||||||
Materials — 5.1% | ||||||||||||
Air Products and Chemicals Inc | 1.1 | 83,457 | 23,480 | |||||||||
Other Securities (A) | 3.9 | 87,445 | ||||||||||
| 110,925 | ||||||||||||
Real Estate — 1.6% | ||||||||||||
Crown Castle International Corp ‡ | 0.6 | 74,706 | 12,859 | |||||||||
Other Securities ‡ | 1.0 | 22,591 | ||||||||||
| 35,450 | ||||||||||||
| SEI Institutional Managed Trust / Semi-Annual Report / March 31, 2021 | 1 |
SUMMARY SCHEDULE OF INVESTMENTS (Unaudited)
March 31, 2021
Large Cap Fund (Concluded)
| Description | Percentage of Net Assets (%) | Shares | Market Value ($ Thousands) | |||||||||
COMMON STOCK (continued) |
| |||||||||||
Utilities — 2.5% | ||||||||||||
NextEra Energy Inc | 0.8 | % | 242,617 | $ | 18,344 | |||||||
Other Securities | 1.7 | 36,659 | ||||||||||
| 55,003 | ||||||||||||
Total Common Stock |
| 2,171,889 | ||||||||||
AFFILIATED PARTNERSHIP — 0.6% |
| |||||||||||
SEI Liquidity Fund, L.P. |
| |||||||||||
0.020% **†(B) | 0.6 | 12,248,552 | 12,257 | |||||||||
Total Affiliated Partnership |
| 12,257 | ||||||||||
| Description | Percentage of Net Assets (%) | Shares | Market Value ($ Thousands) | |||||||||
CASH EQUIVALENT — 0.7% |
| |||||||||||
SEI Daily Income Trust, Government Fund, Cl F | ||||||||||||
0.010% **† | 0.7 | % | 16,343,657 | $ | 16,344 | |||||||
Total Cash Equivalent |
| 16,344 | ||||||||||
Total Investments in Securities — 100.5% |
| $ | 2,200,490 | |||||||||
A list of the open futures contracts held at March 31, 2021 is as follows:
Type of Contract | Number of Contracts Long | Expiration Date | Notional Amount (Thousands) | Value (Thousands) | Unrealized Appreciation (Thousands) | |||||||||||||||
S&P 500 Index E-MINI | 52 | Jun-2021 | $ | 10,088 | $ | 10,315 | $ | 227 | ||||||||||||
S&P Mid Cap 400 Index E-MINI | 3 | Jun-2021 | 753 | 782 | 29 | |||||||||||||||
| $ | 10,841 | $ | 11,097 | $ | 256 | |||||||||||||||
|
|
| ||||||||||||||||||
Percentages are based on a Net Assets of $2,188,929 |
($ Thousands). |
| * | Non-income producing security. |
| ** | The rate reported is the 7-day effective yield as of March 31, 2021. |
| † | Investment in Affiliated Security (see Note 6). |
| ‡ | Real Estate Investment Trust. |
| (A) | Certain securities or partial positions of certain securities are on loan at March 31, 2021 (see Note 10). The total market value of securities on loan at March 31, 2021 was $12,142 ($ Thousands). |
| (B) | This security was purchased with cash collateral held from securities on loan (see Note 10). The total market value of such securities as of March 31, 2021 was $12,257 ($ Thousands). |
ADR — American Depositary Receipt
Cl — Class
L.P. — Limited Partnership
PLC — Public Limited Company
S&P — Standard & Poor’s
The Summary Schedule of Investments does not reflect the complete portfolio holdings. It includes the Fund’s 50 largest holdings and each investment of any issuer that exceeds 1% of the Fund’s net assets. “Other Securities” represent all issues not required to be disclosed under the rules adopted by the U.S. Securities and Exchange Commission (“SEC”). In certain instances, securities for which footnotes listed above may otherwise apply are included in the Other Securities caption. The complete schedule of portfolio holdings is available (i) without charge, upon request, by calling (800) 342-5734; and (ii) on the SEC’s website at http://www.sec.gov.
The following is a list of the level of inputs used as of March 31, 2021, in valuing the Fund’s investments and other financial instruments carried at value ($ Thousands):
Investments in Securities | Level 1 ($) | Level 2 ($) | Level 3 ($) | Total ($) | ||||||||||||
Common Stock | 2,171,889 | – | – | 2,171,889 | ||||||||||||
Affiliated Partnership | – | 12,257 | – | 12,257 | ||||||||||||
Cash Equivalent | 16,344 | – | – | 16,344 | ||||||||||||
|
|
|
|
|
|
|
| |||||||||
Total Investments in Securities | 2,188,233 | 12,257 | – | 2,200,490 | ||||||||||||
|
|
|
|
|
|
|
| |||||||||
| Other Financial Instruments | Level 1 ($) | Level 2 ($) | Level 3 ($) | Total ($) | ||||||||||||
Futures Contracts* | ||||||||||||||||
Unrealized Appreciation | 256 | – | – | 256 | ||||||||||||
|
|
|
|
|
|
|
| |||||||||
Total Other Financial Instruments | 256 | – | – | 256 | ||||||||||||
|
|
|
|
|
|
|
| |||||||||
* Futures contracts are valued at the unrealized appreciation on the instrument.
For the period ended March 31, 2021, there were no transfers in or out of Level 3.
For more information on valuation inputs, see Note 2 — Significant Accounting Policies in Notes to Financial Statements.
2 | SEI Institutional Managed Trust / Semi-Annual Report / March 31, 2021 |
The following is a summary of the Fund’s transactions with affiliates for the period ended March 31, 2021 ($ Thousands):
Security Description | Value 9/30/2020 | Purchases | Proceeds Sales | Realized (Loss) | Change in Unrealized Appreciation (Depreciation) | Value 3/31/2021 | Shares | Income | Capital | |||||||||||||||
| SEI Liquidity Fund, L.P. | $ 14,838 | $ 63,598 | $ (66,179) | $ 1 | $ (1) | $ 12,257 | 12,248,552 | $ 119 | $ — | |||||||||||||||
SEI Daily Income Trust, Government Fund, Cl F | 15,549 | 291,087 | (290,292) | — | — | 16,344 | 16,343,657 | 1 | — | |||||||||||||||
|
|
|
|
|
|
|
|
|
|
| ||||||||||||||
| Totals | $ 30,387 | $ 354,685 | $ (356,471) | $ 1 | $ (1) | $ 28,601 | $ 120 | $ — | ||||||||||||||||
|
|
|
|
|
|
|
|
|
|
| ||||||||||||||
Amounts designated as “—” are either $0 or have been rounded to $0.
The accompanying notes are an integral part of the financial statements.
SEI Institutional Managed Trust / Semi-Annual Report / March 31, 2021 | 3 |
SUMMARY SCHEDULE OF INVESTMENTS (Unaudited)
March 31, 2021
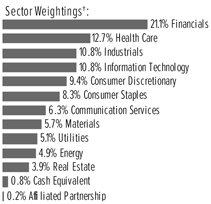
Large Cap Value Fund
†Percentages are based on total investments. Includes investments held as collateral for securities held on loan (see Note 10).
| Description | Percentage of Net Assets (%) | Shares | Market Value ($ Thousands) | |||||||||
COMMON STOCK — 99.1% |
| |||||||||||
Communication Services — 6.3% |
| |||||||||||
AT&T Inc | 2.1 | % | 1,031,235 | $ | 31,215 | |||||||
BCE Inc | 0.9 | 309,291 | 13,962 | |||||||||
Comcast Corp, Cl A | 0.7 | 189,923 | 10,277 | |||||||||
Verizon Communications Inc | 1.1 | 272,309 | 15,835 | |||||||||
Other Securities | 1.5 | 22,152 | ||||||||||
| 93,441 | ||||||||||||
Consumer Discretionary — 9.4% |
| |||||||||||
General Motors Co | 1.3 | 332,988 | 19,133 | |||||||||
Genuine Parts Co | 1.1 | 148,224 | 17,133 | |||||||||
Lowe’s Cos Inc | 0.8 | 64,249 | 12,219 | |||||||||
PulteGroup Inc | 0.8 | 218,605 | 11,464 | |||||||||
Target Corp, Cl A | 2.1 | 155,139 | 30,728 | |||||||||
Other Securities (A) | 3.3 | 48,382 | ||||||||||
| 139,059 | ||||||||||||
Consumer Staples — 8.3% |
| |||||||||||
Kimberly-Clark Corp | 0.8 | 86,011 | 11,960 | |||||||||
Kroger Co/The | 1.1 | 465,551 | 16,755 | |||||||||
Philip Morris International Inc | 1.1 | 184,254 | 16,351 | |||||||||
Tyson Foods Inc, Cl A | 0.7 | 147,236 | 10,940 | |||||||||
Unilever PLC ADR | 0.7 | 172,247 | 9,616 | |||||||||
Walgreens Boots Alliance Inc | 0.8 | 222,619 | 12,222 | |||||||||
Other Securities | 3.1 | 46,028 | ||||||||||
| 123,872 | ||||||||||||
Energy — 4.9% |
| |||||||||||
Chevron Corp | 1.4 | 193,503 | 20,277 | |||||||||
ConocoPhillips | 1.1 | 304,568 | 16,133 | |||||||||
Exxon Mobil Corp | 0.8 | 220,170 | 12,292 | |||||||||
Other Securities | 1.6 | 24,322 | ||||||||||
| 73,024 | ||||||||||||
Financials — 21.1% |
| |||||||||||
Bank of America Corp | 2.3 | 893,848 | 34,583 | |||||||||
Bank of New York Mellon Corp/ The | 0.6 | 201,580 | 9,533 | |||||||||
Berkshire Hathaway Inc, Cl B * | 0.8 | 47,122 | 12,038 | |||||||||
Chubb Ltd | 1.0 | 94,141 | 14,871 | |||||||||
| Description | Percentage of Net Assets (%) | Shares | Market Value ($ Thousands) | |||||||||
COMMON STOCK (continued) | ||||||||||||
Citigroup Inc | 2.6 | % | 538,848 | $ | 39,201 | |||||||
JPMorgan Chase & Co | 2.1 | 201,397 | 30,659 | |||||||||
Morgan Stanley | 1.6 | 308,898 | 23,989 | |||||||||
Truist Financial Corp | 0.8 | 211,571 | 12,339 | |||||||||
Wells Fargo & Co | 1.2 | 468,761 | 18,314 | |||||||||
Other Securities ‡(A) | 8.1 | 118,116 | ||||||||||
| 313,643 | ||||||||||||
Health Care — 12.7% | ||||||||||||
CVS Health Corp | 0.7 | 142,061 | 10,687 | |||||||||
Johnson & Johnson | 2.0 | 182,385 | 29,975 | |||||||||
Medtronic PLC | 1.0 | 131,252 | 15,505 | |||||||||
Merck & Co Inc | 1.3 | 251,611 | 19,397 | |||||||||
Novartis AG ADR | 0.9 | 152,220 | 13,012 | |||||||||
Pfizer Inc | 1.8 | 736,707 | 26,691 | |||||||||
Other Securities (A) | 5.0 | 73,057 | ||||||||||
| 188,324 | ||||||||||||
Industrials — 10.9% | ||||||||||||
3M Co | 0.8 | 61,376 | 11,826 | |||||||||
Cummins Inc | 0.9 | 48,600 | 12,593 | |||||||||
General Dynamics Corp | 0.9 | 72,384 | 13,142 | |||||||||
Johnson Controls International PLC | 1.7 | 410,921 | 24,520 | |||||||||
Raytheon Technologies Corp | 1.1 | 209,293 | 16,172 | |||||||||
Siemens AG ADR | 1.1 | 197,944 | 16,290 | |||||||||
Other Securities | 4.4 | 66,501 | ||||||||||
| 161,044 | ||||||||||||
Information Technology — 10.8% |
| |||||||||||
Broadcom Inc | 0.7 | 20,633 | 9,567 | |||||||||
Cisco Systems Inc/Delaware | 1.4 | 395,800 | 20,467 | |||||||||
HP Inc | 0.9 | 417,991 | 13,271 | |||||||||
Intel Corp | 2.4 | 547,523 | 35,041 | |||||||||
Other Securities | 5.4 | 82,209 | ||||||||||
| 160,555 | ||||||||||||
Materials — 5.7% |
| |||||||||||
Dow Inc | 0.7 | 153,907 | 9,841 | |||||||||
Eastman Chemical Co | 0.7 | 89,995 | 9,910 | |||||||||
Other Securities | 4.3 | 64,888 | ||||||||||
| 84,639 | ||||||||||||
Real Estate — 3.9% |
| |||||||||||
Healthpeak Properties Inc ‡ | 1.0 | 444,186 | 14,098 | |||||||||
Welltower Inc ‡ | 1.0 | 203,902 | 14,606 | |||||||||
Other Securities ‡ | 1.9 | 28,989 | ||||||||||
| 57,693 | ||||||||||||
Utilities — 5.1% |
| |||||||||||
Duke Energy Corp | 0.7 | 105,867 | 10,219 | |||||||||
Exelon Corp | 0.7 | 235,793 | 10,314 | |||||||||
NextEra Energy Inc | 1.4 | 282,830 | 21,385 | |||||||||
Other Securities | 2.3 | 33,828 | ||||||||||
| 75,746 | ||||||||||||
Total Common Stock |
| 1,471,040 | ||||||||||
4 | SEI Institutional Managed Trust / Semi-Annual Report / March 31, 2021 |
| Description | Percentage of Net Assets (%) | Shares | Market Value ($ Thousands) | |||||||||
AFFILIATED PARTNERSHIP — 0.2% |
| |||||||||||
SEI Liquidity Fund, L.P. | ||||||||||||
0.020% **†(B) | 0.2 | % | 3,609,859 | $ | 3,608 | |||||||
Total Affiliated Partnership |
| 3,608 | ||||||||||
| Description | Percentage of Net Assets (%) | Shares | Market Value ($ Thousands) | |||||||||
CASH EQUIVALENT — 0.8% | �� | |||||||||||
SEI Daily Income Trust, |
| |||||||||||
0.010% **† | 0.8 | % | 11,548,070 | $ | 11,548 | |||||||
Total Cash Equivalent |
| 11,548 | ||||||||||
Total Investments in Securities — 100.1% |
| $ | 1,486,196 | |||||||||
A list of the open futures contracts held at March 31, 2021 is as follows:
| Type of Contract | Number of Contracts Long | Expiration Date | Notional Amount (Thousands) | Value (Thousands) | Unrealized Appreciation (Depreciation) (Thousands) | |||||||||||||||
S&P 500 Index E-MINI | 17 | Jun-2021 | $ | 3,370 | $ | 3,372 | $ | 2 | ||||||||||||
S&P Mid Cap 400 Index E-MINI | 24 | Jun-2021 | 3,669 | 3,647 | (22) | |||||||||||||||
| $ | 7,039 | $ | 7,019 | $ | (20) | |||||||||||||||
Percentages are based on a Net Assets of $1,484,847 ($ Thousands). |
| * | Non-income producing security. |
| ** | The rate reported is the 7-day effective yield as of March 31, 2021. |
| ‡ | Real Estate Investment Trust. |
| † | Investment in Affiliated Security (see Note 6). |
| (A) | Certain securities or partial positions of certain securities are on loan at March 31, 2021 (see Note 10). The total market value of securities on loan at March 31, 2021, was $3,564 ($ Thousands). |
| (B) | This security was purchased with cash collateral held from securities on loan (see Note 10). The total market value of such securities as of March 31, 2021 was $3,608 ($ Thousands). |
ADR — American Depositary Receipt
Cl — Class
L.P. — Limited Partnership
Ltd — Limited
PLC — Public Limited Company
The Summary Schedule of Investments does not reflect the complete portfolio holdings. It includes the Fund’s 50 largest holdings and each investment of any issuer that exceeds 1% of the Fund’s net assets. “Other Securities” represent all issues not required to be disclosed under the rules adopted by the U.S. Securities and Exchange Commission (“SEC”). In certain instances, securities for which footnotes listed above may otherwise apply are included in the Other Securities caption. The complete schedule of portfolio holdings is available (i) without charge, upon request, by calling (800) 342-5734; and (ii) on the SEC’s website at http://www.sec.gov.
The following is a list of the level of inputs used as of March 31, 2021, in valuing the Fund’s investments and other financial instruments carried at value ($ Thousands):
| Investments in Securities | Level 1 ($) | Level 2 ($) | Level 3 ($) | Total ($) | ||||||||||
Common Stock | 1,471,040 | – | – | 1,471,040 | ||||||||||
Affiliated Partnership | – | 3,608 | – | 3,608 | ||||||||||
Cash Equivalent | 11,548 | – | – | 11,548 | ||||||||||
|
|
|
|
|
|
|
|
|
| |||||
Total Investments in Securities | 1,482,588 | 3,608 | – | 1,486,196 | ||||||||||
|
|
|
|
|
|
|
|
|
| |||||
| Other Financial Instruments | Level 1 ($) | Level 2 ($) | Level 3 ($) | Total ($) | ||||||||||
Futures Contracts* | ||||||||||||||
Unrealized Appreciation | 2 | – | – | 2 | ||||||||||
Unrealized Depreciation | (22) | – | – | (22) | ||||||||||
|
|
|
|
|
|
|
|
|
| |||||
Total Other Financial Instruments | (20) | – | – | (20) | ||||||||||
|
|
|
|
|
|
|
|
|
| |||||
* Futures contracts are valued at the unrealized appreciation/(depreciation) on the instrument.
For the period ended March 31, 2021, there were no transfers in or out of Level 3.
For more information on valuation inputs, see Note 2 — Significant Accounting Policies in Notes to Financial Statements.
SEI Institutional Managed Trust / Semi-Annual Report / March 31, 2021 | 5 |
SUMMARY SCHEDULE OF INVESTMENTS (Unaudited)
March 31, 2021
Large Cap Value Fund (Concluded)
The following is a summary of the Fund’s transactions with affiliates for the period ended March 31, 2021 ($Thousands):
| Security Description | Value 9/30/2020 | Purchases at Cost | Proceeds from Sales | Realized Gain (Loss) | Change in Unrealized Appreciation (Depreciation) | Value 3/31/2021 | Shares | Income | Capital Gains | |||||||||||||||
SEI Liquidity Fund, L.P. | $2,813 | $71,639 | $(70,842) | $(3) | $1 | $3,608 | 3,609,859 | $64 | $— | |||||||||||||||
SEI Daily Income Trust, Government Fund, Cl F | 13,611 | 156,481 | (158,544) | — | — | 11,548 | 11,548,070 | 1 | — | |||||||||||||||
|
|
|
|
|
|
|
|
|
|
| ||||||||||||||
| Totals | $16,424 | $228,120 | $(229,386) | $(3) | $1 | $15,156 | $65 | $— | ||||||||||||||||
|
|
|
|
|
|
|
|
|
|
| ||||||||||||||
Amounts designated as “—” are either $0 or have been rounded to $0.
The accompanying notes are an integral part of the financial statements.
6 | SEI Institutional Managed Trust / Semi-Annual Report / March 31, 2021 |
SUMMARY SCHEDULE OF INVESTMENTS (Unaudited)
March 31, 2021
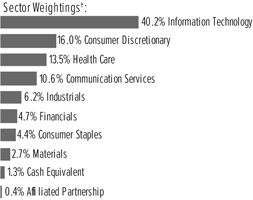
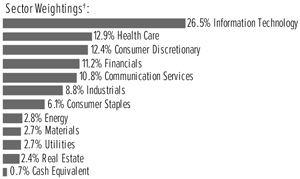
Large Cap Growth Fund
†Percentages are based on total investments. Includes investments held as collateral for securities held on loan (see Note 10).
| Description | Percentage of Net Assets (%) | Shares | Market Value ($ Thousands) | |||||||||
COMMON STOCK — 98.7% |
| |||||||||||
Communication Services — 10.6% |
| |||||||||||
Alphabet Inc, Cl A * | 2.2 | % | 17,794 | $ | 36,700 | |||||||
Alphabet Inc, Cl C * | 2.5 | 20,104 | 41,588 | |||||||||
Facebook Inc, Cl A * | 2.9 | 164,387 | 48,417 | |||||||||
Pinterest Inc, Cl A * | 0.9 | 215,363 | 15,943 | |||||||||
T-Mobile US Inc * | 0.8 | 112,916 | 14,147 | |||||||||
Other Securities | 1.3 | 20,982 | ||||||||||
| 177,777 | ||||||||||||
Consumer Discretionary — 16.0% |
| |||||||||||
Amazon.com Inc, Cl A * | 6.0 | 32,535 | 100,666 | |||||||||
AutoZone Inc * | 1.1 | 13,698 | 19,236 | |||||||||
Lennar Corp, Cl A | 0.7 | 111,324 | 11,269 | |||||||||
Lowe’s Cos Inc | 1.0 | 92,133 | 17,522 | |||||||||
NIKE Inc, Cl B | 1.0 | 120,711 | 16,041 | |||||||||
Starbucks Corp | 0.7 | 107,298 | 11,724 | |||||||||
Tesla Inc * | 0.8 | 21,380 | 14,280 | |||||||||
TJX Cos Inc/The | 0.8 | 201,293 | 13,316 | |||||||||
Other Securities | 3.9 | 64,457 | ||||||||||
| 268,511 | ||||||||||||
Consumer Staples — 4.4% |
| |||||||||||
Colgate-Palmolive Co | 0.7 | 149,613 | 11,794 | |||||||||
PepsiCo Inc | 1.2 | 141,079 | 19,956 | |||||||||
US Foods Holding Corp * | 0.8 | 359,174 | 13,692 | |||||||||
Other Securities | 1.7 | 27,872 | ||||||||||
| 73,314 | ||||||||||||
Financials — 4.8% |
| |||||||||||
CME Group Inc | 0.9 | 73,886 | 15,090 | |||||||||
Moody’s Corp | 1.1 | 62,893 | 18,780 | |||||||||
MSCI Inc, Cl A | 0.9 | 34,458 | 14,448 | |||||||||
S&P Global Inc | 0.7 | 34,598 | 12,209 | |||||||||
Other Securities | 1.2 | 19,318 | ||||||||||
| 79,845 | ||||||||||||
Health Care — 13.6% |
| |||||||||||
Align Technology Inc * | 0.9 | 28,573 | 15,473 | |||||||||
Becton Dickinson and Co | 0.8 | 54,004 | 13,131 | |||||||||
Catalent Inc * | 0.8 | 128,727 | 13,556 | |||||||||
| Description | Percentage of Net Assets (%) | Shares | Market Value ($ Thousands) | |||||||||
COMMON STOCK (continued) |
| |||||||||||
Danaher Corp, Cl A | 1.4 | % | 99,177 | $ | 22,323 | |||||||
Johnson & Johnson | 0.9 | 88,580 | 14,558 | |||||||||
Medtronic PLC | 0.7 | 97,677 | 11,539 | |||||||||
Mettler-Toledo International Inc * | 0.8 | 11,817 | 13,657 | |||||||||
Stryker Corp | 0.7 | 46,129 | 11,236 | |||||||||
UnitedHealth Group Inc | 2.6 | 117,712 | 43,797 | |||||||||
Other Securities (A) | 4.0 | 67,601 | ||||||||||
| 226,871 | ||||||||||||
Industrials — 6.2% | ||||||||||||
Carrier Global Corp | 0.8 | 325,100 | 13,726 | |||||||||
Middleby Corp/The * | 0.7 | 73,090 | 12,115 | |||||||||
TransDigm Group Inc * | 0.6 | 18,030 | 10,600 | |||||||||
Union Pacific Corp | 0.7 | 54,750 | 12,067 | |||||||||
Other Securities | 3.4 | 55,271 | ||||||||||
| 103,779 | ||||||||||||
Information Technology — 40.4% |
| |||||||||||
Adobe Inc * | 2.3 | 81,146 | 38,574 | |||||||||
Analog Devices Inc | 0.8 | 90,226 | 13,992 | |||||||||
Apple Inc | 7.1 | 978,177 | 119,484 | |||||||||
Applied Materials Inc | 2.7 | 341,024 | 45,561 | |||||||||
Broadcom Inc | 0.9 | 31,941 | 14,810 | |||||||||
Fiserv Inc, Cl A * | 0.7 | 95,993 | 11,427 | |||||||||
Intuit Inc | 1.2 | 51,247 | 19,631 | |||||||||
Mastercard Inc, Cl A | 2.0 | 93,573 | 33,317 | |||||||||
Microsoft Corp | 8.8 | 625,099 | 147,380 | |||||||||
NVIDIA Corp | 1.2 | 36,311 | 19,387 | |||||||||
NXP Semiconductors NV | 0.7 | 56,823 | 11,441 | |||||||||
Oracle Corp, Cl B | 0.9 | 206,020 | 14,456 | |||||||||
PayPal Holdings Inc * | 2.2 | 148,411 | 36,040 | |||||||||
QUALCOMM Inc | 0.7 | 85,084 | 11,281 | |||||||||
salesforce.com * | 1.0 | 80,307 | 17,015 | |||||||||
ServiceNow Inc * | 0.7 | 22,029 | 11,017 | |||||||||
Visa Inc, Cl A | 2.4 | 191,735 | 40,596 | |||||||||
Other Securities | 4.1 | 70,184 | ||||||||||
| 675,593 | ||||||||||||
Materials — 2.7% | ||||||||||||
Sherwin-Williams Co/The, Cl A | 1.3 | 30,486 | 22,499 | |||||||||
Other Securities | 1.4 | 22,360 | ||||||||||
| 44,859 | ||||||||||||
Total Common Stock |
| 1,650,549 | ||||||||||
AFFILIATED PARTNERSHIP — 0.4% |
| |||||||||||
SEI Liquidity Fund, L.P. |
| |||||||||||
0.020% **†(B) | 0.4 | 6,774,096 | 6,775 | |||||||||
Total Affiliated Partnership |
| 6,775 | ||||||||||
| SEI Institutional Managed Trust / Semi-Annual Report / March 31, 2021 | 7 |
SUMMARY SCHEDULE OF INVESTMENTS (Unaudited)
March 31, 2021
Large Cap Growth Fund (Concluded)
| Description | Percentage of Net Assets (%) | Shares | Market Value ($Thousands) | |||||||||
CASH EQUIVALENT — 1.3% |
| |||||||||||
SEI Daily Income Trust, | ||||||||||||
0.010% **† | 1.3 | % | $ | 22,100,043 | $ | 22,100 | ||||||
Total Cash Equivalent |
| 22,100 | ||||||||||
Total Investments in Securities — 100.4% |
| $ | 1,679,424 | |||||||||
A list of the open futures contracts held at March 31, 2021 is as follows:
Type of Contract | Number of Contracts Long | Expiration Date | Notional Amount (Thousands) | Value (Thousands) | Unrealized Appreciation (Thousands) | |||||||||||||||
S&P 500 Index E-MINI | 50 | Jun-2021 | $ | 16,907 | $ | 17,060 | $ | 153 | ||||||||||||
|
|
| ||||||||||||||||||
Percentages are based on Net Assets of $1,673,016 ($Thousands). |
| * | Non-income producing security. |
| ** | The rate reported is the 7-day effective yield as of March 31, 2021. |
| † | Investment in Affiliated Security (see Note 6). |
| (A) | Certain securities or partial positions of certain securities are on loan at March 31, 2021 (see Note 10). The total market value of securities on loan at March 31, 2021 was $6,907 ($Thousands). |
| (B) | This security was purchased with cash collateral held from securities on loan (see Note 10). The total market value of such securities as of March 31, 2021 was $6,775 ($Thousands). |
| Cl | — Class |
| L.P. | — Limited Partnership |
| PLC | — Public Limited Company |
| S&P | — Standard & Poor’s |
The Summary Schedule of Investments does not reflect the complete portfolio holdings. It includes the Fund’s 50 largest holdings and each investment of any issuer that exceeds 1% of the Fund’s net assets. “Other Securities” represent all issues not required to be disclosed under the rules adopted by the U.S. Securities and Exchange Commission (“SEC”). In certain instances, securities for which footnotes listed above may otherwise apply are included in the Other Securities caption. The complete schedule of portfolio holdings is available (i) without charge, upon request, by calling (800) 342-5734; and (ii) on the SEC’s website at http://www.sec.gov.
The following is a list of the level of inputs used as of March 31, 2021, in valuing the Fund’s investments and other financial instrument carried at value ($Thousands):
| Investments in Securities | Level 1 ($) | Level 2 ($) | Level 3 ($) | Total ($) | ||||||||||||
Common Stock | 1,650,549 | – | – | 1,650,549 | ||||||||||||
Affiliated Partnership | – | 6,775 | – | 6,775 | ||||||||||||
Cash Equivalent | 22,100 | – | – | 22,100 | ||||||||||||
|
|
|
|
|
|
|
| |||||||||
Total Investments in Securities | 1,672,649 | 6,775 | – | 1,679,424 | ||||||||||||
|
|
|
|
|
|
|
| |||||||||
| Other Financial Instruments | Level 1 ($) | Level 2 ($) | Level 3 ($) | Total ($) | ||||||||||||
Futures Contracts* | ||||||||||||||||
Unrealized Appreciation | 153 | – | – | 153 | ||||||||||||
|
|
|
|
|
|
|
| |||||||||
Total Other Financial Instruments | 153 | – | – | 153 | ||||||||||||
|
|
|
|
|
|
|
| |||||||||
* Futures contracts are valued at the unrealized appreciation on the instrument.
For the period ended March 31, 2021, there were no transfers in or out of Level 3.
For more information on valuation inputs, see Note 2 — Significant Accounting Policies in Notes to Financial Statements.
The following is a summary of the Fund’s transactions with affiliates for the period ended March 31, 2021 ($ Thousands):
Security Description | Value 9/30/2020 | Purchases | Proceeds Sales | Realized (Loss) | Change in Unrealized Appreciation (Depreciation) | Value 3/31/2021 | Shares | Income | Capital | |||||||||
| SEI Liquidity Fund, L.P. | $9,033 | $41,187 | $(43,448) | $1 | $2 | $6,775 | 6,774,096 | $4 | $— | |||||||||
SEI Daily Income Trust, Government Fund, Cl F | 15,424 | 140,368 | (133,692) | — | — | 22,100 | 22,100,043 | 1 | — | |||||||||
|
|
|
|
|
|
|
| |||||||||||
| Totals | $24,457 | $181,555 | $(177,140) | $1 | $2 | $28,875 | $5 | $— | ||||||||||
|
|
|
|
|
|
|
|
Amounts designated as “—” are either $0 or have been rounded to $0.
The accompanying notes are an integral part of the financial statements.
8 | SEI Institutional Managed Trust / Semi-Annual Report / March 31, 2021 |
SUMMARY SCHEDULE OF INVESTMENTS (Unaudited)
March 31, 2021
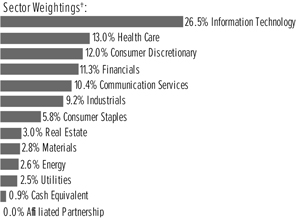
Large Cap Index Fund
†Percentages are based on total investments. Includes investments held as collateral for securities held on loan (see Note 10).
| Description | Percentage of Net Assets (%) | Shares |
Market Value | |||||||||
COMMON STOCK — 99.2% |
| |||||||||||
Communication Services — 10.4% |
| |||||||||||
Alphabet Inc, Cl A * | 1.6 | % | 7,220 | $ | 14,891 | |||||||
Alphabet Inc, Cl C * | 1.6 | 6,994 | 14,468 | |||||||||
AT&T Inc | 0.6 | 172,090 | 5,209 | |||||||||
Comcast Corp, Cl A | 0.7 | 109,467 | 5,923 | |||||||||
Facebook Inc, | 1.9 | 58,043 | 17,095 | |||||||||
Netflix Inc * | 0.6 | 10,235 | 5,339 | |||||||||
Verizon Communications Inc | 0.6 | 99,949 | 5,812 | |||||||||
Walt Disney Co/The | 0.9 | 43,632 | 8,051 | |||||||||
Other Securities | 1.9 | 18,423 | ||||||||||
|
|
| ||||||||||
| 95,211 | ||||||||||||
|
|
| ||||||||||
Consumer Discretionary — 12.0% |
| |||||||||||
Amazon.com Inc, Cl A * | 3.5 | 10,233 | 31,662 | |||||||||
Home Depot Inc/The | 0.9 | 25,982 | 7,931 | |||||||||
McDonald’s Corp | 0.5 | 17,942 | 4,022 | |||||||||
NIKE Inc, Cl B | 0.4 | 29,943 | 3,979 | |||||||||
Tesla Inc * | 1.4 | 18,475 | 12,340 | |||||||||
Other Securities | 5.3 | 49,818 | ||||||||||
|
|
| ||||||||||
| 109,752 | ||||||||||||
|
|
| ||||||||||
Consumer Staples — 5.8% |
| |||||||||||
Coca-Cola Co/The | 0.5 | 93,238 | 4,915 | |||||||||
Costco Wholesale Corp | 0.4 | 10,675 | 3,763 | |||||||||
PepsiCo Inc | 0.5 | 33,514 | 4,740 | |||||||||
Procter & Gamble Co/The | 0.9 | 58,808 | 7,964 | |||||||||
Walmart Inc | 0.5 | 33,664 | 4,573 | |||||||||
Other | 3.0 | 26,657 | ||||||||||
|
|
| ||||||||||
| 52,612 | ||||||||||||
|
|
| ||||||||||
Energy — 2.6% |
| |||||||||||
Chevron Corp | 0.5 | 46,503 | 4,873 | |||||||||
Exxon Mobil Corp | 0.6 | 102,066 | 5,698 | |||||||||
Other Securities | 1.5 | 13,179 | ||||||||||
|
|
| ||||||||||
| 23,750 | ||||||||||||
|
|
| ||||||||||
Financials — 11.3% |
| |||||||||||
Bank of America Corp | 0.8 | 186,741 | 7,225 | |||||||||
| Description | Percentage of Net Assets (%) | Shares |
Market Value | |||||||||
COMMON STOCK (continued) |
| |||||||||||
Berkshire Hathaway Inc, Cl B * | 1.3 | % | 45,472 | $ | 11,617 | |||||||
Citigroup Inc | 0.4 | 50,185 | 3,651 | |||||||||
JPMorgan Chase & Co | 1.2 | 73,100 | 11,128 | |||||||||
SEI Investments | 0.0 | 2,800 | 171 | |||||||||
Wells Fargo & Co | 0.4 | 91,491 | 3,574 | |||||||||
Other Securities ‡(B) | 7.2 | 65,917 | ||||||||||
|
|
| ||||||||||
| 103,283 | ||||||||||||
|
|
| ||||||||||
Health Care — 13.0% |
| |||||||||||
Abbott Laboratories | 0.6 | 41,740 | 5,002 | |||||||||
AbbVie Inc | 0.5 | 42,561 | 4,606 | |||||||||
Eli Lilly and Co | 0.4 | 20,353 | 3,802 | |||||||||
Johnson & Johnson | 1.1 | 63,675 | 10,465 | |||||||||
Medtronic PLC | 0.4 | 32,435 | 3,831 | |||||||||
Merck & Co Inc | 0.5 | 61,002 | 4,703 | |||||||||
Pfizer Inc | 0.5 | 134,350 | 4,867 | |||||||||
Thermo Fisher Scientific Inc | 0.5 | 9,531 | 4,350 | |||||||||
UnitedHealth Group Inc | 0.9 | 22,837 | 8,497 | |||||||||
Other Securities | 7.6 | 68,979 | ||||||||||
|
|
| ||||||||||
| 119,102 | ||||||||||||
|
|
| ||||||||||
Industrials — 9.2% |
| |||||||||||
Honeywell International Inc | 0.4 | 16,948 | 3,679 | |||||||||
Union Pacific Corp | 0.4 | 16,172 | 3,564 | |||||||||
Other Securities | 8.3 | 76,854 | ||||||||||
|
|
| ||||||||||
| 84,097 | ||||||||||||
|
|
| ||||||||||
Information Technology — 26.5% |
| |||||||||||
Accenture PLC, Cl A | 0.5 | 15,407 | 4,256 | |||||||||
Adobe Inc * | 0.6 | 11,665 | 5,545 | |||||||||
Apple Inc | 5.1 | 382,604 | 46,735 | |||||||||
Broadcom Inc | 0.5 | 9,531 | 4,419 | |||||||||
Cisco Systems Inc/Delaware | 0.6 | 102,482 | 5,299 | |||||||||
Intel Corp | 0.7 | 99,076 | 6,341 | |||||||||
Mastercard Inc, Cl A | 0.8 | 21,351 | 7,602 | |||||||||
Microsoft Corp | 4.7 | 180,900 | 42,651 | |||||||||
NVIDIA Corp | 0.8 | 14,224 | 7,595 | |||||||||
PayPal Holdings | 0.8 | 28,388 | 6,894 | |||||||||
QUALCOMM Inc | 0.4 | 27,214 | 3,608 | |||||||||
salesforce.com Inc * | 0.5 | 21,203 | 4,492 | |||||||||
Texas Instruments Inc | 0.5 | 22,173 | 4,190 | |||||||||
Visa Inc, Cl A | 1.0 | 40,765 | 8,631 | |||||||||
Other Securities | 9.1 | 84,227 | ||||||||||
|
|
| ||||||||||
| 242,485 | ||||||||||||
|
|
| ||||||||||
Materials — 2.8% | ||||||||||||
Other Securities | 2.9 | 25,491 | ||||||||||
|
|
| ||||||||||
Real Estate — 3.0% | ||||||||||||
Other Securities ‡ | 3.0 | 27,614 | ||||||||||
|
|
| ||||||||||
| SEI Institutional Managed Trust / Semi-Annual Report / March 31, 2021 | 9 |
SUMMARY SCHEDULE OF INVESTMENTS (Unaudited)
March 31, 2021
Large Cap Index Fund (Concluded)
| Description | Percentage of Net Assets (%) | Shares |
Market Value | |||||||||
COMMON STOCK (continued) |
| |||||||||||
Utilities — 2.6% |
| |||||||||||
NextEra Energy Inc | 0.4 | % | 47,235 | $ | 3,571 | |||||||
Other Securities | 2.1 | 19,571 | ||||||||||
|
|
| ||||||||||
| 23,142 | ||||||||||||
|
|
| ||||||||||
Total Common Stock |
| 906,539 | ||||||||||
|
|
| ||||||||||
AFFILIATED PARTNERSHIP — 0.0% |
| |||||||||||
SEI Liquidity Fund, L.P. | ||||||||||||
0.020% **†(C) | 0.0 | 72,526 | 73 | |||||||||
|
|
| ||||||||||
Total Affiliated Partnership |
| 73 | ||||||||||
|
|
| ||||||||||
| Description | Percentage of Net Assets (%) | Shares |
Market Value | |||||||||
CASH EQUIVALENT — 0.9% |
| |||||||||||
SEI Daily Income Trust, Government Fund, Cl F | ||||||||||||
0.010% **† | 0.9 | % | 8,589,418 | $ | 8,589 | |||||||
|
|
| ||||||||||
Total Cash Equivalent |
| 8,589 | ||||||||||
|
|
| ||||||||||
Total Investments in Securities — 100.1% |
| $ | 915,201 | |||||||||
|
|
| ||||||||||
A list of the open futures contracts held by the Fund at March 31, 2021 is as follows:
| ||||||||||||||||||||
Type of Contract | Number of Contracts Long | Expiration Date | Notional Amount (Thousands) | Value (Thousands) | Unrealized Appreciation/ (Depreciation) (Thousands) | |||||||||||||||
| ||||||||||||||||||||
500 Index E-MINI | 37 | Jun-2021 | $ | 7,247 | $ | 7,340 | $ | 93 | ||||||||||||
S&P Mid Cap 400 Index E-MINI | 2 | Jun-2021 | 526 | 521 | (5) | |||||||||||||||
|
|
| ||||||||||||||||||
| $ | 7,773 | $ | 7,861 | $ | 88 | |||||||||||||||
|
|
| ||||||||||||||||||
Percentages are based on a Net Assets of $914,257 ($ Thousands). |
| * | Non-income producing security. |
| ** | The rate reported is the 7-day effective yield as of March 31, 2021. |
| † | Investment in Affiliated Security (see Note 6). |
| ‡ | Real Estate Investment Trust. |
| (A) | Certain securities or partial positions of certain securities are on loan at March 31, 2021 (see Note 10). The total market value of securities on loan at March 31, 2021, was $69 ($ Thousands). |
| (B) | Security is a Master Limited Partnership. At March 31, 2021, such securities amounted to $109 ($ Thousands), or 0.0% of Net Assets (See Note 2). |
| (C) | This security was purchased with cash collateral held from securities on loan (see Note 10). The total market value of such securities as of March 31, 2021 was $73 ($ Thousands). |
Cl — Class
L.P. — Limited Partnership
PLC — Public Limited Company
S&P — Standard & Poor’s
The Summary Schedule of Investments does not reflect the complete portfolio holdings. It includes the Fund’s 50 largest holdings and each investment of any issuer that exceeds 1% of the Fund’s net assets.
“Other Securities” represent all issues not required to be disclosed under the rules adopted by the U.S. Securities and Exchange Commission (“SEC”). In certain instances, securities for which footnotes listed above may otherwise apply are included in the Other Securities caption. The complete schedule of portfolio holdings is available (i) without charge, upon request, by calling (800) 342-5734; and (ii) on the SEC’s website at http://www.sec.gov.
| 10 | SEI Institutional Managed Trust / Semi-Annual Report / March 31, 2021 |
The following is a list of the level of inputs used as of March 31, 2021, in valuing the Fund’s investments and other financial instruments carried at value ($ Thousands):
| Investments in Securities | Level 1 ($) | Level 2 ($) | Level 3 ($) | Total ($) | ||||||||||
Common Stock | 906,539 | – | – | 906,539 | ||||||||||
Affiliated Partnership | – | 73 | – | 73 | ||||||||||
Cash Equivalent | 8,589 | – | – | 8,589 | ||||||||||
|
|
|
|
|
|
|
|
|
| |||||
Total Investments in Securities | 915,128 | 73 | – | 915,201 | ||||||||||
|
|
|
|
|
|
|
|
|
| |||||
| Other Financial Instruments | Level 1 ($) | Level 2 ($) | Level 3 ($) | Total ($) | ||||||||||
Futures Contracts* | ||||||||||||||
Unrealized Appreciation | 93 | – | – | 93 | ||||||||||
Unrealized Depreciation | (5) | – | – | (5) | ||||||||||
|
|
|
|
|
|
|
|
|
| |||||
Total Other Financial Instruments | 88 | – | – | 88 | ||||||||||
|
|
|
|
|
|
|
|
|
| |||||
* Futures contracts are valued at the unrealized appreciation/(depreciation) on the instrument.
For the period ended March 31, 2021, there were no transfers in or out of Level 3.
For more information on valuation inputs, see Note 2 — Significant Accounting Policies in Notes to Financial Statements.
The following is a summary of the Fund’s transactions with affiliates for the period ended March 31, 2021 ($ Thousands):
| Security Description | Value 9/30/2020 | Purchases at Cost | Proceeds from Sales | Realized Gain/ (Loss) | Change in Unrealized Appreciation/ (Depreciation) | Value 3/31/2021 | Shares | Income | Capital Gains | |||||||||
| SEI Investment Co | $127 | $17 | $ — | $— | $27 | $171 | 2,800 | $1 | $— | |||||||||
| SEI Liquidity Fund, L.P. | 924 | 2,794 | (3,645) | — | — | 73 | 72,526 | 6 | — | |||||||||
SEI Daily Income Trust, Government Fund, Cl F | 14,553 | 90,322 | (96,286) | — | — | 8,589 | 8,589,418 | 1 | — | |||||||||
|
|
|
|
|
|
|
| |||||||||||
| Totals | $15,604 | $ 93,133 | $ (99,931) | $— | $27 | $8,833 | $8 | $— | ||||||||||
|
|
|
|
|
|
|
|
Amounts designated as “—” are either $0 or have been rounded to $0.
The accompanying notes are an integral part of the financial statements.
SEI Institutional Managed Trust / Semi-Annual Report / March 31, 2021 | 11 |
SUMMARY SCHEDULE OF INVESTMENTS (Unaudited)
March 31, 2021
Tax-Managed Large Cap Fund
†Percentages are based on total investments. Includes investments held as collateral for securities held on loan (see Note 10).
| Description | Percentage of Net Assets (%) | Shares | Market Value ($ Thousands) | |||||||||
COMMON STOCK — 99.6% |
| |||||||||||
Communication Services — 5.7% |
| |||||||||||
Alphabet Inc, | 1.2 | % | 26,214 | $ | 54,067 | |||||||
Alphabet Inc, | 1.1 | 22,848 | 47,264 | |||||||||
Facebook Inc, | 0.9 | % | 135,757 | 39,984 | ||||||||
Other Securities | 2.5 | 103,862 | ||||||||||
| 245,177 | ||||||||||||
Consumer Discretionary — 11.9% |
| |||||||||||
Amazon.com Inc, Cl A * | 1.3 | 18,448 | 57,080 | |||||||||
Dollar General Corp | 1.0 | 222,711 | 45,126 | |||||||||
Lowe’s Cos Inc | 1.4 | 328,236 | 62,424 | |||||||||
NIKE Inc, Cl B | 1.1 | 357,743 | 47,540 | |||||||||
Ross Stores Inc | 0.6 | 218,925 | 26,251 | |||||||||
Target Corp, Cl A | 0.8 | 185,748 | 36,791 | |||||||||
TJX Cos Inc/The | 0.6 | 374,562 | 24,777 | |||||||||
Other Securities | 5.1 | 220,154 | ||||||||||
| 520,143 | ||||||||||||
Consumer Staples — 8.8% |
| |||||||||||
Altria Group Inc | 0.7 | 561,690 | 28,736 | |||||||||
Kroger Co/The | 0.8 | 924,655 | 33,278 | |||||||||
PepsiCo Inc | 0.7 | 209,241 | 29,597 | |||||||||
Philip Morris International Inc | 1.0 | 469,703 | 41,682 | |||||||||
Procter & Gamble Co/The | 0.7 | 233,806 | 31,664 | |||||||||
Unilever PLC ADR | 0.9 | 731,480 | 40,839 | |||||||||
Other Securities | 4.0 | 175,229 | ||||||||||
| 381,025 | ||||||||||||
Energy — 2.5% | ||||||||||||
Chevron Corp | 0.6 | 264,554 | 27,723 | |||||||||
Other Securities | 1.9 | 82,721 | ||||||||||
| 110,444 | ||||||||||||
Financials — 17.5% | ||||||||||||
Bank of America Corp | 1.4 | 1,550,747 | 59,998 | |||||||||
Citigroup Inc | 0.6 | 379,987 | 27,644 | |||||||||
JPMorgan Chase & Co | 1.7 | 474,451 | 72,226 | |||||||||
Moody’s Corp | 1.8 | 263,689 | 78,740 | |||||||||
Morgan Stanley | 0.5 | 311,935 | 24,225 | |||||||||
| Description | Percentage of Net Assets (%) | Shares | Market Value ($ Thousands) | |||||||||
COMMON STOCK (continued) |
| |||||||||||
MSCI Inc, Cl A | 0.9 | % | 91,938 | $ | 38,548 | |||||||
US Bancorp | 0.7 | 573,724 | 31,733 | |||||||||
Other Securities ‡ | 9.9 | 428,186 | ||||||||||
| 761,300 | ||||||||||||
Health Care — 14.6% | ||||||||||||
Amgen Inc, Cl A | 0.8 | 145,948 | 36,313 | |||||||||
Becton Dickinson and Co | 0.6 | 113,758 | 27,660 | |||||||||
CVS Health Corp | 0.7 | 379,134 | 28,522 | |||||||||
Johnson & Johnson | 2.4 | 633,113 | 104,052 | |||||||||
Merck & Co Inc | 1.1 | 605,640 | 46,689 | |||||||||
Mettler-Toledo International Inc * | 0.8 | 28,371 | 32,788 | |||||||||
Pfizer Inc | 0.7 | 815,680 | 29,552 | |||||||||
UnitedHealth Group Inc | 1.4 | 167,008 | 62,139 | |||||||||
Other Securities (A) | 6.1 | 267,163 | ||||||||||
| 634,878 | ||||||||||||
Industrials — 9.6% | ||||||||||||
3M Co | 0.6 | 131,281 | 25,295 | |||||||||
Graco Inc | 0.9 | 542,313 | 38,840 | |||||||||
Johnson Controls International PLC | 0.7 | 494,338 | 29,497 | |||||||||
Siemens AG ADR | 0.6 | 311,780 | 25,658 | |||||||||
WW Grainger Inc | 0.6 | 64,211 | 25,744 | |||||||||
Other Securities | 6.2 | 269,317 | ||||||||||
| 414,351 | ||||||||||||
Information Technology — 20.2% |
| |||||||||||
Adobe Inc * | 1.5 | 132,912 | 63,182 | |||||||||
Apple Inc | 2.6 | 932,824 | 113,944 | |||||||||
Applied Materials Inc | 0.6 | 183,527 | 24,519 | |||||||||
Cisco Systems Inc/Delaware | 0.6 | 498,298 | 25,767 | |||||||||
Intel Corp | 0.9 | 571,741 | 36,591 | |||||||||
Intuit Inc | 1.4 | 156,005 | 59,759 | |||||||||
Mastercard Inc, Cl A | 1.4 | 175,853 | 62,612 | |||||||||
Microchip Technology Inc | 1.0 | 289,399 | 44,921 | |||||||||
Microsoft Corp | 2.6 | 486,353 | 114,667 | |||||||||
Oracle Corp, Cl B | 0.8 | 512,747 | 35,979 | |||||||||
Visa Inc, Cl A | 1.3 | 275,684 | 58,371 | |||||||||
Other Securities (A) | 5.5 | 237,043 | ||||||||||
| 877,355 | ||||||||||||
Materials — 5.4% | ||||||||||||
Linde PLC | 0.8 | 123,959 | 34,726 | |||||||||
Sherwin-Williams Co/The, Cl A | 1.1 | 66,555 | 49,118 | |||||||||
Other Securities | 3.5 | 152,455 | ||||||||||
| 236,299 | ||||||||||||
Real Estate — 2.0% | ||||||||||||
American Tower Corp, Cl A ‡ | 0.6 | 101,757 | 24,326 | |||||||||
Other Securities ‡ | 1.4 | 61,589 | ||||||||||
| 85,915 | ||||||||||||
12 | SEI Institutional Managed Trust / Semi-Annual Report / March 31, 2021 |
| Description | Percentage of Net Assets (%) | Shares | Market Value ($ Thousands) | |||||||||
COMMON STOCK (continued) |
| |||||||||||
Utilities — 1.4% | ||||||||||||
Other Securities | 1.4 | % | $ | 61,016 | ||||||||
Total Common Stock |
| 4,327,903 | ||||||||||
AFFILIATED PARTNERSHIP — 0.0% |
| |||||||||||
SEI Liquidity Fund, L.P. |
| |||||||||||
0.020% **†(B) | 0.0 | 1,154,929 | 1,157 | |||||||||
Total Affiliated Partnership |
| 1,157 | ||||||||||
| Description | Percentage of Net Assets (%) | Shares | Market Value ($ Thousands) | |||||||||
CASH EQUIVALENT — 2.4% |
| |||||||||||
SEI Daily Income Trust, Government Fund, Cl F | ||||||||||||
0.010% **† | 2.4 | % | 105,365,872 | $ | 105,366 | |||||||
Total Cash Equivalent |
| 105,366 | ||||||||||
Total Investments in Securities — 102.0% |
| $ | 4,434,426 | |||||||||
A list of the open futures contracts held by the Fund at March 31, 2021 is as follows:
Type of Contract | Number of Contracts Long/(Short) | Expiration Date | Notional Amount (Thousands) | Value (Thousands) | Unrealized Appreciation (Depreciation) (Thousands) | |||||||||||||||
| S&P 500 Index E-MINI | 39 | Jun-2021 | $ | 7,739 | $ | 7,736 | $ | (3) | ||||||||||||
| S&P Mid Cap 400 Index E-MINI | 2 | Jun-2021 | 522 | 521 | (1) | |||||||||||||||
|
| |||||||||||||||||||
| $ | 8,261 | $ | 8,257 | $ | (4) | |||||||||||||||
|
| |||||||||||||||||||
Percentages are based on a Net Assets of $4,348,154 ($ Thousands). |
| * | Non-income producing security. |
| ** | The rate reported is the 7-day effective yield as of March 31, 2021. |
| ‡ | Real Estate Investment Trust. |
| † | Investment in Affiliated Security (see Note 6). |
| (A) | Certain securities or partial positions of certain securities are on loan at March 31, 2021 (see Note 10). The total market value of securities on loan at March 31, 2021, was $1,141 ($ Thousands). |
| (B) | This security was purchased with cash collateral held from securities on loan (see Note 10). The total market value of such securities as of March 31, 2021 was $1,157 ($ Thousands). |
ADR — American Depositary Receipt
Cl — Class
L.P. — Limited Partnership
PLC — Public Limited Company
S&P — Standard & Poor’s
The Summary Schedule of Investments does not reflect the complete portfolio holdings. It includes the Fund’s 50 largest holdings and each investment of any issuer that exceeds 1% of the Fund’s net assets. “Other Securities” represent all issues not required to be disclosed under the rules adopted by the U.S. Securities and Exchange Commission (“SEC”). In certain instances, securities for which footnotes listed above may otherwise apply are included in the Other Securities caption. The complete schedule of portfolio holdings is available (i) without charge, upon request, by calling (800) 342-5734; and (ii) on the SEC’s website at http://www.sec.gov.
The following is a list of the level of inputs used as of March 31, 2021, in valuing the Fund’s investments carried and other financial instruments at value ($ Thousands):
| Investments in Securities | Level 1 ($) | Level 2 ($) | Level 3 ($) | Total ($) | ||||||||||||
Common Stock | 4,327,903 | – | – | 4,327,903 | ||||||||||||
Affiliated Partnership | – | 1,157 | – | 1,157 | ||||||||||||
Cash Equivalent | 105,366 | – | – | 105,366 | ||||||||||||
|
|
|
|
|
|
|
|
|
|
|
| |||||
Total Investments in Securities | 4,433,269 | 1,157 | – | 4,434,426 | ||||||||||||
|
|
|
|
|
|
|
|
|
|
|
| |||||
Other Financial Instruments | Level 1 ($) | Level 2 ($) | Level 3 ($) | Total ($) | ||||||||||||
Futures Contracts* | ||||||||||||||||
Unrealized Depreciation | (4) | – | – | (4) | ||||||||||||
|
|
|
|
|
|
|
|
|
|
|
| |||||
Total Other Financial Instruments | (4) | – | – | (4) | ||||||||||||
|
|
|
|
|
|
|
|
|
|
|
| |||||
* Futures contracts are valued at the unrealized depreciation on the instrument.
For the period ended March 31, 2021, there were no transfers in or out of Level 3.
For more information on valuation inputs, see Note 2 — Significant Accounting Policies in Notes to Financial Statements.
SEI Institutional Managed Trust / Semi-Annual Report / March 31, 2021 | 13 |
SUMMARY SCHEDULE OF INVESTMENTS (Unaudited)
March 31, 2021
Tax-Managed Large Cap Fund (Concluded)
The following is a summary of the Fund’s transactions with affiliates for the period ended March 31, 2021 ($ Thousands):
| Security Description | Value 9/30/2020 | Purchases at Cost | Proceeds from Sales | Realized Gain/ (Loss) | Change in Unrealized Appreciation/ (Depreciation) | Value 3/31/2021 | Shares | Income | Capital Gains | |||||||||
SEI Liquidity Fund, L.P. | $48,578 | $159,168 | $(206,600) | $ 8 | $ 3 | $ 1,157 | 1,154,929 | $ 45 | $ — | |||||||||
| SEI Daily Income Trust, Government Fund, Cl F | 21,668 | 317,706 | (234,008) | — | — | 105,366 | 105,365,872 | 1 | — | |||||||||
|
|
|
|
|
|
|
| |||||||||||
Totals | $70,246 | $476,874 | $(440,608) | $ 8 | $ 3 | $106,523 | $ 46 | $ — | ||||||||||
|
|
|
|
|
|
|
|
Amounts designated as “—” are either $0 or have been rounded to $0.
The accompanying notes are an integral part of the financial statements.
14 | SEI Institutional Managed Trust / Semi-Annual Report / March 31, 2021 |
SUMMARY SCHEDULE OF INVESTMENTS (Unaudited)
March 31, 2021
S&P 500 Index Fund
†Percentages are based on total investments.
| Description | Percentage of Net Assets (%) | Shares | Market Value ($ Thousands) | |||||||||
COMMON STOCK — 99.0% |
| |||||||||||
Communication Services — 10.8% |
| |||||||||||
Alphabet Inc, Cl A * | 1.8 | % | 8,351 | $ | 17,224 | |||||||
Alphabet Inc, Cl C * | 1.8 | 8,004 | 16,557 | |||||||||
AT&T Inc | 0.6 | 197,993 | 5,993 | |||||||||
Comcast Corp, Cl A | 0.7 | 126,896 | 6,866 | |||||||||
Facebook Inc, Cl A * | 2.1 | 66,813 | 19,678 | |||||||||
Netflix Inc * | 0.7 | 12,269 | 6,400 | |||||||||
Verizon Communications Inc | 0.7 | 114,896 | 6,681 | |||||||||
Walt Disney Co/The | 1.0 | 50,393 | 9,299 | |||||||||
Other Securities | 1.4 | 13,267 | ||||||||||
| 101,965 | ||||||||||||
Consumer Discretionary — 12.3% |
| |||||||||||
Amazon.com Inc, Cl A * | 3.9 | 11,885 | 36,773 | |||||||||
Home Depot Inc/The | 1.0 | 29,895 | 9,125 | |||||||||
McDonald’s Corp | 0.5 | 20,738 | 4,648 | |||||||||
NIKE Inc, Cl B | 0.5 | 35,323 | 4,694 | |||||||||
Tesla Inc * | 1.5 | 21,334 | 14,250 | |||||||||
Other Securities | 4.9 | 46,783 | ||||||||||
| 116,273 | ||||||||||||
Consumer Staples — 6.1% |
| |||||||||||
Coca-Cola Co/The | 0.6 | 107,649 | 5,674 | |||||||||
Costco Wholesale Corp | 0.5 | 12,336 | 4,348 | |||||||||
PepsiCo Inc | 0.6 | 38,259 | 5,412 | |||||||||
Procter & Gamble Co/The | 1.0 | 68,345 | 9,256 | |||||||||
Walmart Inc | 0.6 | 38,456 | 5,223 | |||||||||
Other Securities | 2.8 | 27,560 | ||||||||||
| 57,473 | ||||||||||||
Energy — 2.8% | ||||||||||||
Chevron Corp | 0.6 | 53,478 | 5,604 | |||||||||
Exxon Mobil Corp | 0.7 | 117,546 | 6,562 | |||||||||
Other Securities | 1.5 | 14,046 | ||||||||||
| 26,212 | ||||||||||||
Financials — 11.2% | ||||||||||||
Bank of America Corp | 0.9 | 210,945 | 8,161 | |||||||||
Berkshire Hathaway Inc, | 1.4 | 52,893 | 13,513 | |||||||||
Citigroup Inc | 0.4 | 57,951 | 4,216 | |||||||||
JPMorgan Chase & Co | 1.4 | 84,676 | 12,890 | |||||||||
| Description | Percentage of Net Assets (%) | Shares | Market Value ($ Thousands) | |||||||||
COMMON STOCK (continued) |
| |||||||||||
Wells Fargo & Co | 0.5 | % | 114,715 | $ | 4,482 | |||||||
Other Securities | 6.6 | 62,416 | ||||||||||
| 105,678 | ||||||||||||
Health Care — 12.9% | ||||||||||||
Abbott Laboratories | 0.6 | 49,199 | 5,896 | |||||||||
AbbVie Inc | 0.6 | 49,050 | 5,308 | |||||||||
Eli Lilly and Co | 0.4 | 22,108 | 4,130 | |||||||||
Johnson & Johnson | 1.3 | 73,025 | 12,002 | |||||||||
Medtronic PLC | 0.5 | 37,372 | 4,415 | |||||||||
Merck & Co Inc | 0.6 | 70,276 | 5,418 | |||||||||
Pfizer Inc | 0.6 | 154,856 | 5,610 | |||||||||
Thermo Fisher Scientific Inc | 0.5 | 10,969 | 5,006 | |||||||||
UnitedHealth Group Inc | 1.0 | 26,208 | 9,751 | |||||||||
Other Securities | 6.8 | 63,847 | ||||||||||
| 121,383 | ||||||||||||
Industrials — 8.8% | ||||||||||||
Honeywell International Inc | 0.5 | 19,277 | 4,184 | |||||||||
Union Pacific Corp | 0.4 | 18,574 | 4,094 | |||||||||
Other Securities | 7.9 | 74,180 | ||||||||||
| 82,458 | ||||||||||||
Information Technology — 26.4% |
| |||||||||||
Accenture PLC, Cl A | 0.5 | 17,581 | 4,857 | |||||||||
Adobe Inc * | 0.7 | 13,269 | 6,308 | |||||||||
Apple Inc | 5.7 | 438,162 | 53,522 | |||||||||
Broadcom Inc | 0.6 | 11,316 | 5,247 | |||||||||
Cisco Systems Inc/Delaware | 0.6 | 117,161 | 6,058 | |||||||||
Intel Corp | 0.8 | 112,797 | 7,219 | |||||||||
Mastercard Inc, Cl A | 0.9 | 24,346 | 8,668 | |||||||||
Microsoft Corp | 5.2 | 209,415 | 49,374 | |||||||||
NVIDIA Corp | 1.0 | 17,229 | 9,199 | |||||||||
PayPal Holdings Inc * | 0.8 | 32,492 | 7,890 | |||||||||
QUALCOMM Inc | 0.4 | 31,554 | 4,184 | |||||||||
salesforce.com Inc * | 0.6 | 25,521 | 5,407 | |||||||||
Texas Instruments Inc | 0.5 | 25,503 | 4,820 | |||||||||
Visa Inc, Cl A | 1.1 | 47,061 | 9,964 | |||||||||
Other Securities | 7.0 | 66,362 | ||||||||||
| 249,079 | ||||||||||||
Materials — 2.7% | ||||||||||||
Other Securities | 2.7 | 25,160 | ||||||||||
Real Estate — 2.4% | ||||||||||||
Other Securities ‡ | 2.4 | 22,929 | ||||||||||
Utilities — 2.6% | ||||||||||||
NextEra Energy Inc | 0.4 | 54,380 | 4,112 | |||||||||
Other Securities | 2.2 | 20,805 | ||||||||||
| 24,917 | ||||||||||||
Total Common Stock |
| 933,527 | ||||||||||
SEI Institutional Managed Trust / Semi-Annual Report / March 31, 2021 | 15 |
SUMMARY SCHEDULE OF INVESTMENTS (Unaudited)
March 31, 2021
S&P 500 Index Fund (Concluded)
| Description | Percentage of Net Assets (%) | Shares | Market Value ($ Thousands) | |||||||||
CASH EQUIVALENT — 0.7% |
| |||||||||||
SEI Daily Income Trust, Government Fund, Cl F | ||||||||||||
0.010% **† | 0.7 | % | 6,427,474 | $ | 6,427 | |||||||
Total Cash Equivalent |
| 6,427 | ||||||||||
Total Investments in Securities — 99.7% |
| $ | 939,954 | |||||||||
A list of the open futures contracts held by the Fund at March 31, 2021 is as follows:
Type of Contract | Number of Contracts Long | Expiration Date | Notional Amount (Thousands) | Value (Thousands) | Unrealized Appreciation (Thousands) | |||||||||||||||
S&P 500 Index E-MINI | 38 | Jun-2021 | $ | 7,498 | $ | 7,538 | $ | 40 | ||||||||||||
Percentages are based on a Net Assets of $942,319 ($ Thousands). |
| * | Non-income producing security. |
| ** | The rate reported is the 7-day effective yield as of March 31, 2021. |
| † | Investment in Affiliated Security (see Note 6). |
| ‡ | Real Estate Investment Trust. |
Cl — Class
PLC — Public Limited Company
S&P — Standard & Poor’s
The Summary Schedule of Investments does not reflect the complete portfolio holdings. It includes the Fund’s 50 largest holdings and each investment of any issuer that exceeds 1% of the Fund’s net assets.
“Other Securities” represent all issues not required to be disclosed under the rules adopted by the U.S. Securities and Exchange Commission (“SEC”). In certain instances, securities for which footnotes listed above may otherwise apply are included in the Other Securities caption. The complete schedule of portfolio holdings is available (i) without charge, upon request, by calling (800) 342-5734; and (ii) on the SEC’s website at http://www.sec.gov.
The following is a list of the level of inputs used as of March 31, 2021, in valuing the Fund’s investments and other financial instruments carried at value ($ Thousands):
| Investments in Securities | Level 1 ($) | Level 2 ($) | Level 3 ($) | Total ($) | ||||||||||||
Common Stock | 933,527 | – | – | 933,527 | ||||||||||||
Cash Equivalent | 6,427 | – | – | 6,427 | ||||||||||||
|
|
|
|
|
|
|
|
|
|
|
| |||||
Total Investments in Securities | 939,954 | – | – | 939,954 | ||||||||||||
|
|
|
|
|
|
|
|
|
|
|
| |||||
| Other Financial Instruments | Level 1 ($) | Level 2 ($) | Level 3 ($) | Total ($) | ||||||||||||
Futures Contracts* | ||||||||||||||||
Unrealized Appreciation | 40 | – | – | 40 | ||||||||||||
|
|
|
|
|
|
|
|
|
|
|
| |||||
Total Other Financial Instruments | 40 | – | – | 40 | ||||||||||||
|
|
|
|
|
|
|
|
|
|
|
| |||||
* Futures contracts are valued at the unrealized appreciation on the instrument.
For the period ended March 31, 2021, there were no transfers in or out of Level 3.
For more information on valuation inputs, see Note 2 — Significant Accounting Policies in Notes to Financial Statements.
The following is a summary of the Fund’s transactions with affiliates for the period ended March 31, 2021 ($ Thousands):
| Security Description | Value 9/30/2020 | Purchases at Cost | Proceeds from Sales | Realized Gain (Loss) | Change in Unrealized Appreciation (Depreciation) | Value 3/31/2021 | Shares | Income | Capital Gains | ||||||||||||||||||||||||||||||||||||
SEI Liquidity Fund, L.P. | $ 349 | $ 1,842 | $ (2,191) | $ — | $ — | $ — | — | $3 | $ — | ||||||||||||||||||||||||||||||||||||
SEI Daily Income Trust, Government Fund, Cl F | 12,428 | 45,940 | (51,941) | — | — | 6,427 | 6,427,474 | 1 | — | ||||||||||||||||||||||||||||||||||||
|
|
|
|
|
|
|
|
|
|
|
|
|
|
|
| ||||||||||||||||||||||||||||||
Totals | $12,777 | $47,782 | $(54,132) | $ — | $ — | $6,427 | $4 | $ — | |||||||||||||||||||||||||||||||||||||
|
|
|
|
|
|
|
|
|
|
|
|
|
|
|
| ||||||||||||||||||||||||||||||
Amounts designated as “—” are either $0 or have been rounded to $0.
The accompanying notes are an integral part of the financial statements.
16 | SEI Institutional Managed Trust / Semi-Annual Report / March 31, 2021 |
SUMMARY SCHEDULE OF INVESTMENTS (Unaudited)
March 31, 2021
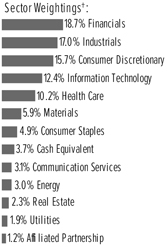
Small Cap Fund
†Percentages are based on total investments. Includes investments held as collateral for securities held on loan (see Note 10).
| Description | Percentage of Net Assets (%) | Shares | Market Value ($ Thousands) | |||||||||
COMMON STOCK — 96.1% |
| |||||||||||
Communication Services — 3.1% |
| |||||||||||
Cinemark Holdings Inc | 0.3 | % | 109,386 | $ | 2,233 | |||||||
Cogent Communications Holdings Inc | 0.3 | 33,336 | 2,292 | |||||||||
Lions Gate Entertainment Corp, Cl A * (A) | 0.6 | 272,867 | 4,079 | |||||||||
TEGNA Inc | 0.3 | 122,513 | 2,307 | |||||||||
Other Securities | 1.6 | 10,408 | ||||||||||
| 21,319 | ||||||||||||
Consumer Discretionary — 15.9% |
| |||||||||||
American Eagle Outfitters Inc | 0.4 | 104,368 | 3,052 | |||||||||
Brunswick Corp/DE | 0.4 | 28,098 | 2,680 | |||||||||
Modine Manufacturing Co * | 0.7 | 308,036 | 4,550 | |||||||||
Shutterstock Inc | 0.4 | 33,810 | 3,010 | |||||||||
Taylor Morrison Home Corp, Cl A * | 0.4 | 78,818 | 2,428 | |||||||||
Urban Outfitters Inc * | 0.4 | 79,389 | 2,952 | |||||||||
Other Securities (A) | 13.2 | 90,445 | ||||||||||
| 109,117 | ||||||||||||
Consumer Staples — 4.9% |
| |||||||||||
Pilgrim’s Pride Corp * | 0.5 | 155,282 | 3,694 | |||||||||
TreeHouse Foods Inc * | 0.3 | 40,874 | 2,135 | |||||||||
Other Securities | 4.1 | 27,945 | ||||||||||
| 33,774 | ||||||||||||
Energy — 3.0% | ||||||||||||
Cabot Oil & Gas Corp | 0.3 | 112,230 | 2,108 | |||||||||
Cimarex Energy Co | 0.5 | 60,973 | 3,621 | |||||||||
Delek US Holdings Inc | 0.6 | 193,244 | 4,209 | |||||||||
Diamondback Energy Inc, Cl A | 0.3 | 28,141 | 2,068 | |||||||||
Other Securities | 1.3 | 8,716 | ||||||||||
| 20,722 | ||||||||||||
| Description | Percentage of Net Assets (%) | Shares | Market Value ($ Thousands) | |||||||||
COMMON STOCK (continued) |
| |||||||||||
Financials — 18.9% |
| |||||||||||
American Equity Investment Life |
| |||||||||||
Holding Co | 0.4 | % | 88,923 | $ | 2,804 | |||||||
Bank OZK | 0.3 | 51,428 | 2,101 | |||||||||
BankUnited Inc | 1.2 | 183,162 | 8,050 | |||||||||
CNO Financial Group Inc | 0.7 | 207,866 | 5,049 | |||||||||
First Commonwealth Financial Corp | 0.4 | 188,987 | 2,716 | |||||||||
First Horizon Corp | 0.7 | 285,435 | 4,827 | |||||||||
First Midwest Bancorp Inc/IL | 0.4 | 111,360 | 2,440 | |||||||||
FNB Corp/PA | 1.0 | 524,247 | 6,658 | |||||||||
Home BancShares Inc/AR | 0.3 | 79,031 | 2,138 | |||||||||
PacWest Bancorp | 0.7 | 128,068 | 4,886 | |||||||||
Pinnacle Financial Partners Inc | 0.5 | 38,272 | 3,393 | |||||||||
Sterling Bancorp/DE | 0.4 | 103,926 | 2,392 | |||||||||
Umpqua Holdings Corp | 0.8 | 324,780 | 5,700 | |||||||||
Western Alliance Bancorp | 0.4 | 25,941 | 2,450 | |||||||||
Other Securities ‡ | 10.7 | 73,890 | ||||||||||
| 129,494 | ||||||||||||
Health Care — 10.3% | ||||||||||||
Ensign Group Inc/The | 0.6 | 43,286 | 4,062 | |||||||||
Pennant Group Inc/The * | 0.1 | 13,207 | 605 | |||||||||
Other Securities (A) | 9.6 | 65,941 | ||||||||||
| 70,608 | ||||||||||||
Industrials — 17.2% | ||||||||||||
ACCO Brands Corp | 0.6 | 521,799 | 4,404 | |||||||||
Altra Industrial Motion Corp | 0.3 | 37,870 | 2,095 | |||||||||
BWX Technologies Inc, Cl W | 0.4 | 44,679 | 2,946 | |||||||||
JetBlue Airways Corp * | 0.6 | 191,611 | 3,897 | |||||||||
Masonite International Corp * | 0.3 | 20,579 | 2,372 | |||||||||
Regal Beloit | 0.4 | 18,370 | 2,621 | |||||||||
Snap-on Inc | 0.3 | 9,060 | 2,090 | |||||||||
Standex International Corp | 0.3 | 22,100 | 2,112 | |||||||||
WESCO International Inc * | 0.6 | 45,087 | 3,901 | |||||||||
Other Securities | 13.4 | 91,550 | ||||||||||
| 117,988 | ||||||||||||
Information Technology — 12.6% |
| |||||||||||
Alliance Data Systems Corp | 0.5 | 33,369 | 3,740 | |||||||||
J2 Global Inc * | 0.6 | 31,467 | 3,772 | |||||||||
NCR Corp * | 0.4 | 74,140 | 2,813 | |||||||||
Rogers Corp * | 0.3 | 11,979 | 2,255 | |||||||||
Silicon Motion Technology Corp ADR | 0.4 | 46,397 | 2,756 | |||||||||
Super Micro Computer Inc * | 0.4 | 71,106 | 2,777 | |||||||||
Other Securities | 10.0 | 68,286 | ||||||||||
| 86,399 | ||||||||||||
Materials — 6.0% | ||||||||||||
Commercial Metals Co, Cl A | 0.9 | 204,819 | 6,317 | |||||||||
Domtar Corp | 0.3 | 63,503 | 2,346 | |||||||||
Reliance Steel & Aluminum Co | 0.3 | 13,781 | 2,099 | |||||||||
Other Securities (A) | 4.5 | 30,030 | ||||||||||
| 40,792 | ||||||||||||
SEI Institutional Managed Trust / Semi-Annual Report / March 31, 2021 | 17 |
SUMMARY SCHEDULE OF INVESTMENTS (Unaudited)
March 31, 2021
Small Cap Fund (Concluded)
| Description | Percentage of Net Assets (%) | Shares | Market Value ($ Thousands) | |||||||||
COMMON STOCK (continued) |
| |||||||||||
Real Estate — 2.3% |
| |||||||||||
Other Securities ‡ | 2.3 | % | $ | 16,029 | ||||||||
Utilities — 1.9% |
| |||||||||||
Portland General Electric Co | 0.4 | 63,870 | 3,032 | |||||||||
Other Securities | 1.5 | 10,148 | ||||||||||
| 13,180 | ||||||||||||
Total Common Stock |
| 659,422 | ||||||||||
| Description | Percentage of Net Assets (%) | Shares | Market Value ($ Thousands) | |||||||||
AFFILIATED PARTNERSHIP — 1.2% |
| |||||||||||
SEI Liquidity Fund, L.P. | ||||||||||||
0.020% **†(B) | 1.2 | % | 8,117,859 | $ | 8,119 | |||||||
Total Affiliated Partnership |
| 8,119 | ||||||||||
CASH EQUIVALENT — 3.8% |
| |||||||||||
SEI Daily Income Trust, Government Fund, Cl F | ||||||||||||
0.010% **† | 3.8 | 25,893,125 | 25,893 | |||||||||
Total Cash Equivalent |
| 25,893 | ||||||||||
Total Investments in Securities — 101.1% |
| $ | 693,434 | |||||||||
A list of the open futures contracts held at March 31, 2021 is as follows:
| Type of Contract | Number of Contracts Long | Expiration Date | Notional Amount (Thousands) | Value (Thousands) | Unrealized Appreciation (Thousands) | |||||||||||||||
Russell 2000 Index E-MINI | 41 | Jun-2021 | $ | 4,541 | $ | 4,556 | $ | 15 | ||||||||||||
|
| |||||||||||||||||||
Percentages are based on a Net Assets of $685,895 ($ Thousands). |
| * | Non-income producing security. |
| ** | The rate reported is the 7-day effective yield as of March 31, 2021. |
| † | Investment in Affiliated Security (see Note 6). |
| ‡ | Real Estate Investment Trust. |
| (A) | Certain securities or partial positions of certain securities are on loan at March 31, 2021 (see Note 10). The total market value of securities on loan at March 31, 2021, was $6,203 ($ Thousands). |
| (B) | This security was purchased with cash collateral held from securities on loan (see Note 10). The total market value of such securities as of March 31, 2021 was $8,119 ($ Thousands). |
ADR — American Depositary Receipt
Cl — Class
L.P. — Limited Partnership
The Summary Schedule of Investments does not reflect the complete portfolio holdings. It includes the Fund’s 50 largest holdings and each investment of any issuer that exceeds 1% of the Fund’s net assets. “Other Securities” represent all issues not required to be disclosed under the rules adopted by the U.S. Securities and Exchange Commission (“SEC”). In certain instances, securities for which footnotes listed above may otherwise apply are included in the Other Securities caption. The complete schedule of portfolio holdings is available (i) without charge, upon request, by calling (800) 342-5734; and (ii) on the SEC’s website at http://www.sec.gov.
The following is a list of the level of inputs used as of March 31, 2021, in valuing the Fund’s investments and other financial instruments carried at value ($ Thousands):
| Investments in Securities | Level 1 ($) | Level 2 ($) | Level 3 ($) | Total ($) | ||||||||||||
Common Stock | 659,422 | – | – | 659,422 | ||||||||||||
Affiliated Partnership | – | 8,119 | – | 8,119 | ||||||||||||
Cash Equivalent | 25,893 | – | – | 25,893 | ||||||||||||
|
|
|
|
|
|
|
|
|
|
|
| |||||
Total Investments in Securities | 685,315 | 8,119 | – | 693,434 | ||||||||||||
|
|
|
|
|
|
|
|
|
|
|
| |||||
| Other Financial Instruments | Level 1 ($) | Level 2 ($) | Level 3 ($) | Total ($) | ||||||||||||
Futures Contracts* | ||||||||||||||||
Unrealized Appreciation | 15 | – | – | 15 | ||||||||||||
|
|
|
|
|
|
|
|
|
|
|
| |||||
Total Other Financial Instruments | 15 | – | – | 15 | ||||||||||||
|
|
|
|
|
|
|
|
|
|
|
| |||||
* Futures contracts are valued at the unrealized depreciation on the instrument.
For the period ended March 31, 2021, there were no transfers in or out of Level 3.
For more information on valuation inputs, see Note 2 — Significant Accounting Policies in Notes to Financial Statements.
18 | SEI Institutional Managed Trust / Semi-Annual Report / March 31, 2021 |
The following is a summary of the Fund’s transactions with affiliates for the period ended March 31, 2021 ($ Thousands):
| Security Description | Value 9/30/2020 | Purchases at Cost | Proceeds from Sales | Realized Gain/ (Loss) | Change in Unrealized Appreciation/ (Depreciation) | Value 3/31/2021 | Shares | Income | Capital Gains | |||||||||
SEI Liquidity Fund, L.P. | $ 14,415 | $ 49,219 | $(55,515) | $1 | $(1) | $8,119 | 8,117,859 | $84 | $— | |||||||||
SEI Daily Income Trust, Government Fund, Cl F | 9,347 | 145,852 | (129,306) | — | — | 25,893 | 25,893,125 | 1 | — | |||||||||
|
|
|
|
|
|
|
| |||||||||||
| Totals | $ 23,762 | $195,071 | $(184,821) | $1 | $(1) | $34,012 | $ 85 | $— | ||||||||||
|
|
|
|
|
|
|
|
Amounts designated as “—” are either $0 or have been rounded to $0.
The accompanying notes are an integral part of the financial statements.
SEI Institutional Managed Trust / Semi-Annual Report / March 31, 2021 | 19 |
SUMMARY SCHEDULE OF INVESTMENTS (Unaudited)
March 31, 2021
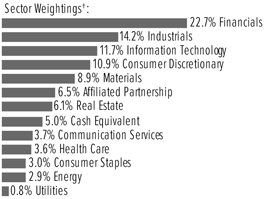
Small Cap Value Fund
†Percentages are based on total investments. Includes investments held as collateral for securities held on loan (see Note 10).
| Description | Percentage of Net Assets (%) | Shares | Market Value ($ Thousands) | |||||||||
COMMON STOCK — 94.5% |
| |||||||||||
Communication Services — 3.9% |
| |||||||||||
John Wiley & Sons Inc, Cl A | 0.6 | % | 44,260 | $ | 2,399 | |||||||
Lions Gate Entertainment Corp, Cl A * | 0.5 | 151,338 | 2,262 | |||||||||
Nexstar Media Group Inc, Cl A | 1.3 | 38,144 | 5,357 | |||||||||
Other Securities (A) | 1.5 | 6,679 | ||||||||||
| 16,697 | ||||||||||||
Consumer Discretionary — 11.7% |
| |||||||||||
Lithia Motors Inc, Cl A | 1.2 | 12,637 | 4,930 | |||||||||
Meritage Homes Corp * | 0.5 | 23,595 | 2,169 | |||||||||
Modine Manufacturing Co * | 0.6 | 185,572 | 2,741 | |||||||||
Other Securities (A) | 9.4 | 40,073 | ||||||||||
| 49,913 | ||||||||||||
Consumer Staples — 3.2% |
| |||||||||||
Hostess Brands Inc, Cl A * | 0.8 | 240,489 | 3,449 | |||||||||
Spectrum Brands Holdings Inc | 0.5 | 25,349 | 2,155 | |||||||||
Other Securities (A) | 1.9 | 8,311 | ||||||||||
| 13,915 | ||||||||||||
Energy — 3.1% |
| |||||||||||
Delek US Holdings Inc | 0.5 | 107,177 | 2,334 | |||||||||
Other Securities (A)(B) | 2.6 | 11,072 | ||||||||||
| 13,406 | ||||||||||||
Financials — 24.3% |
| |||||||||||
BankUnited Inc | 0.9 | 90,582 | 3,981 | |||||||||
BGC Partners Inc, Cl A | 0.7 | 616,304 | 2,977 | |||||||||
CIT Group Inc | 0.5 | 44,492 | 2,292 | |||||||||
CNO Financial Group Inc | 1.3 | 230,071 | 5,588 | |||||||||
Columbia Banking System Inc | 0.9 | 93,310 | 4,021 | |||||||||
First Commonwealth Financial Corp | 0.6 | 175,092 | 2,516 | |||||||||
First Horizon Corp | 0.8 | 202,315 | 3,421 | |||||||||
First Merchants Corp | 0.6 | 53,053 | 2,467 | |||||||||
FNB Corp/PA | 0.7 | 251,885 | 3,199 | |||||||||
OFG Bancorp | 0.7 | 123,495 | 2,793 | |||||||||
Pacific Premier Bancorp Inc | 0.6 | 60,330 | 2,621 | |||||||||
| Description | Percentage of Net Assets (%) | Shares | Market Value ($ Thousands) | |||||||||
COMMON STOCK (continued) |
| |||||||||||
PacWest Bancorp | 2.1 | % | 231,936 | $ | 8,848 | |||||||
Starwood Property Trust Inc ‡ | 1.2 | 200,873 | 4,970 | |||||||||
Umpqua Holdings Corp | 0.6 | 136,954 | 2,404 | |||||||||
Other Securities ‡(A) | 12.1 | 51,635 | ||||||||||
| 103,733 | ||||||||||||
Health Care — 3.8% | ||||||||||||
Syneos Health Inc, Cl A * | 0.9 | 51,324 | 3,893 | |||||||||
Other Securities (A) | 2.9 | 12,372 | ||||||||||
| 16,265 | ||||||||||||
Industrials — 15.2% | ||||||||||||
ACCO Brands Corp | 0.8 | 402,096 | 3,394 | |||||||||
Atkore Inc * | 0.9 | 51,243 | 3,684 | |||||||||
BWX Technologies Inc, Cl W | 0.9 | 59,303 | 3,910 | |||||||||
Colfax Corp * | 1.2 | 111,919 | 4,903 | |||||||||
JetBlue Airways Corp * | 0.7 | 144,973 | 2,949 | |||||||||
KAR Auction Services Inc | 0.7 | 192,901 | 2,894 | |||||||||
Teledyne Technologies Inc * | 0.6 | 6,001 | 2,482 | |||||||||
WESCO International Inc * | 0.7 | 34,998 | 3,028 | |||||||||
XPO Logistics Inc * | 0.7 | 23,824 | 2,937 | |||||||||
Other Securities (A) | 8.0 | 34,690 | ||||||||||
| 64,871 | ||||||||||||
Information Technology — 12.5% |
| |||||||||||
ACI Worldwide Inc * | 1.0 | 108,279 | 4,120 | |||||||||
Amkor Technology Inc | 0.5 | 93,950 | 2,227 | |||||||||
Euronet Worldwide Inc * | 0.5 | 16,683 | 2,307 | |||||||||
Insight Enterprises Inc * | 0.6 | 27,571 | 2,631 | |||||||||
J2 Global Inc * | 2.1 | 73,879 | 8,855 | |||||||||
NCR Corp *(A) | 0.6 | 64,079 | 2,432 | |||||||||
Sanmina Corp * | 0.5 | 51,733 | 2,141 | |||||||||
Silicon Motion Technology Corp ADR | 1.6 | 115,193 | 6,841 | |||||||||
Verint Systems Inc * | 0.7 | 67,863 | 3,087 | |||||||||
Other Securities (A) | 4.4 | 18,783 | ||||||||||
| 53,424 | ||||||||||||
Materials — 9.5% | ||||||||||||
Ashland Global Holdings Inc | 0.9 | 40,922 | 3,633 | |||||||||
Axalta Coating Systems Ltd * | 1.0 | 140,362 | 4,152 | |||||||||
Commercial Metals Co, | 0.9 | 130,327 | 4,019 | |||||||||
FMC Corp | 1.4 | 52,230 | 5,777 | |||||||||
Silgan Holdings Inc | 1.5 | 151,154 | 6,353 | |||||||||
Other Securities (A) | 3.8 | 16,539 | ||||||||||
| 40,473 | ||||||||||||
Real Estate — 6.5% | ||||||||||||
Gaming and Leisure Properties Inc ‡ | 1.0 | 98,262 | 4,169 | |||||||||
Howard Hughes Corp/The * | 0.7 | 32,837 | 3,124 | |||||||||
Medical Properties Trust Inc ‡ | 1.2 | 249,343 | 5,306 | |||||||||
Other Securities ‡(A) | 3.6 | 15,410 | ||||||||||
| 28,009 | ||||||||||||
| 20 | SEI Institutional Managed Trust / Semi-Annual Report / March 31, 2021 |
| Description | Percentage of Net Assets (%) | Shares | Market Value ($ Thousands) | |||||||||
COMMON STOCK (continued) |
| |||||||||||
Utilities — 0.8% | ||||||||||||
Other Securities (A) | 0.8 | % | $ | 3,542 | ||||||||
Total Common Stock |
| 404,248 | ||||||||||
AFFILIATED PARTNERSHIP — 6.9% |
| |||||||||||
SEI Liquidity Fund, L.P. |
| |||||||||||
0.020% **†(C) | 6.9 | 29,632,329 | 29,641 | |||||||||
Total Affiliated Partnership |
| 29,641 | ||||||||||
| Description | Percentage of Net Assets (%) | Shares | Market Value ($ Thousands) | |||||||||
CASH EQUIVALENT — 5.4% |
| |||||||||||
SEI Daily Income Trust, | ||||||||||||
0.010% **† | 5.4 | % | 22,914,301 | $ | 22,914 | |||||||
Total Cash Equivalent |
| 22,914 | ||||||||||
Total Investments in Securities — 106.8% |
| $ | 456,803 | |||||||||
A list of the open futures contracts held at March 31, 2021 is as follows:
Type of Contract | Number of Contracts Long | Expiration Date | Notional Amount (Thousands) | Value (Thousands) | Unrealized Appreciation (Thousands) | |||||||||||||||
Russell 2000 Index E-MINI | 54 | Jun-2021 | $ 5,991 | $ | 6,001 | $ | 10 | |||||||||||||
Percentages are based on Net Assets of $427,594 ($ Thousands). |
| * | Non-income producing security. |
| ** | The rate reported is the 7-day effective yield as of March 31, 2021. |
| ‡ | Real Estate Investment Trust. |
| † | Investment in Affiliated Security (see Note 6). |
| (A) | Certain securities or partial positions of certain securities are on loan at March 31, 2021 (See Note 10). The total market value of securities on loan at March 31, 2021 was $28,779 ($ Thousands). |
| (B) | Security is a Master Limited Partnership. At March 31, 2021, such securities amounted to $1,990 ($ Thousands), or 0.5% of the Net Assets of the Fund (See Note 2). |
| (C) | This security was purchased with cash collateral held from securities on loan (See Note 10). The total market value of such securities as of March 31, 2021 was $29,641 ($ Thousands). |
ADR — American Depositary Receipt
Cl — Class
L.P. — Limited Partnership
Ltd. — Limited
The Summary Schedule of Investments does not reflect the complete portfolio holdings. It includes the Fund’s 50 largest holdings and each investment of any issuer that exceeds 1% of the Fund’s net assets.
“Other Securities” represent all issues not required to be disclosed under the rules adopted by the U.S. Securities and Exchange Commission (“SEC”). In certain instances, securities for which footnotes listed above may otherwise apply are included in the Other Securities caption. The complete schedule of portfolio holdings is available (i) without charge, upon request, by calling (800) 342-5734; and (ii) on the SEC’s website at http://www.sec.gov.
The following is a list of the level of inputs used as of March 31, 2021, in valuing the Fund’s investments and other financial instruments carried at value ($ Thousands):
| Investments in Securities | Level 1 ($) | Level 2 ($) | Level 3 ($) | Total ($) | ||||||||||||
Common Stock | 404,248 | – | – | 404,248 | ||||||||||||
Affiliated Partnership | – | 29,641 | – | 29,641 | ||||||||||||
Cash Equivalent | 22,914 | – | – | 22,914 | ||||||||||||
|
|
|
|
|
|
|
| |||||||||
Total Investments in Securities | 427,162 | 29,641 | – | 456,803 | ||||||||||||
|
|
|
|
|
|
|
| |||||||||
| Other Financial Instruments | Level 1 ($) | Level 2 ($) | Level 3 ($) | Total ($) | ||||||||||||
Futures Contracts* | ||||||||||||||||
Unrealized Appreciation | 10 | – | – | 10 | ||||||||||||
|
|
|
|
|
|
|
| |||||||||
Total Other Financial Instruments | 10 | – | – | 10 | ||||||||||||
|
|
|
|
|
|
|
| |||||||||
* Futures contracts are valued at the unrealized appreciation on the instrument.
For the period ended March 31, 2021, there were no transfers in or out of Level 3.
For more information on valuation inputs, see Note 2 — Significant Accounting Policies in Notes to Financial Statements.
SEI Institutional Managed Trust / Semi-Annual Report / March 31, 2021 | 21 |
SUMMARY SCHEDULE OF INVESTMENTS (Unaudited)
March 31, 2021
Small Cap Value Fund (Concluded)
The following is a summary of the Fund’s transactions with affiliates for the period ended March 31, 2021 ($Thousands):
Security Description | Value 9/30/2020 | Purchases | Proceeds Sales | Realized (Loss) | Change in Unrealized Appreciation (Depreciation) | Value 3/31/2021 | Shares | Income | Capital | |||||||||
| SEI Liquidity Fund, L.P. | $ 7,690 | $ 68,828 | $(46,880) | $ 5 | $ (2) | $ 29,641 | 29,632,329 | $ 67 | $ — | |||||||||
SEI Daily Income Trust, Government Fund, Cl F | 13,795 | 48,172 | (39,053) | — | — | 22,914 | 22,914,301 | 1 | — | |||||||||
|
|
|
|
|
|
|
| |||||||||||
| Totals | $ 21,485 | $ 117,000 | $ (85,933) | $ 5 | $ (2) | $ 52,555 | $ 68 | $ — | ||||||||||
|
|
|
|
|
|
|
|
Amounts designated as “—” are either $0 or have been rounded to $0.
The accompanying notes are an integral part of the financial statements.
22 | SEI Institutional Managed Trust / Semi-Annual Report / March 31, 2021 |
SUMMARY SCHEDULE OF INVESTMENTS (Unaudited)
March 31, 2021
Small Cap Growth Fund
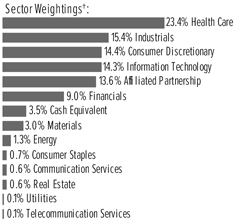
†Percentages are based on total investments. Includes investments held as collateral for securities held on loan (see Note 10).
| Description | Percentage of Net Assets (%) | Shares | Market Value ($ Thousands) | |||||||||
COMMON STOCK — 96.0% |
| |||||||||||
Communication Services — 0.7% |
| |||||||||||
TechTarget Inc * | 0.4 | % | 27,385 | $ | 1,902 | |||||||
Other Securities (A) | 0.3 | 1,381 | ||||||||||
| 3,283 | ||||||||||||
Consumer Discretionary — 16.6% |
| |||||||||||
Brinker International Inc * | 0.5 | 31,848 | 2,263 | |||||||||
Century Communities Inc * | 0.5 | 33,697 | 2,033 | |||||||||
Hanesbrands Inc | 0.4 | 100,771 | 1,982 | |||||||||
Rent-A-Center Inc/TX | 0.6 | 46,539 | 2,683 | |||||||||
Sally Beauty Holdings | 0.9 | 190,859 | 3,842 | |||||||||
Shutterstock Inc | 0.4 | 21,893 | 1,949 | |||||||||
Skechers USA Inc, Cl A * | 0.8 | 84,219 | 3,513 | |||||||||
Other Securities (A) | 12.5 | 55,637 | ||||||||||
| 73,902 | ||||||||||||
Consumer Staples — 0.8% |
| |||||||||||
Other Securities (A) | 0.8 | 3,429 | ||||||||||
Energy — 1.5% |
| |||||||||||
Other Securities (A) | 1.5 | 6,529 | ||||||||||
Financials — 10.4% |
| |||||||||||
Cowen Inc, Cl A | 0.5 | 63,689 | 2,239 | |||||||||
Investors Bancorp Inc | 0.5 | 143,634 | 2,110 | |||||||||
Jaws Acquisition, Cl A *(A) | 0.5 | 156,788 | 2,077 | |||||||||
Mr Cooper Group Inc * | 0.6 | 74,408 | 2,586 | |||||||||
Other Securities ‡(A)(B)(C) | 8.3 | 37,517 | ||||||||||
| 46,529 | ||||||||||||
Health Care — 27.2% |
| |||||||||||
AMN Healthcare Services Inc * | 0.6 | 34,719 | 2,559 | |||||||||
CareDx Inc *(A) | 0.5 | 35,867 | 2,442 | |||||||||
Enanta Pharmaceuticals | 0.5 | 43,885 | 2,164 | |||||||||
Ensign Group Inc/The | 0.7 | 31,608 | 2,966 | |||||||||
Halozyme Therapeutics | 0.7 | 71,432 | 2,978 | |||||||||
Medpace Holdings Inc * | 0.5 | 14,397 | 2,362 | |||||||||
| Description | Percentage of Net Assets (%) | Shares | Market Value ($ Thousands) | |||||||||
COMMON STOCK (continued) |
| |||||||||||
Merit Medical Systems Inc *(A) | 0.7 | % | 53,682 | $ | 3,214 | |||||||
Natera Inc * | 0.5 | 22,791 | 2,314 | |||||||||
Omnicell Inc * | 0.6 | 20,143 | 2,616 | |||||||||
Pennant Group Inc/The * | 0.2 | 17,625 | 807 | |||||||||
Prestige Consumer Healthcare Inc, Cl A * | 0.5 | 51,099 | 2,252 | |||||||||
Repligen Corp * | 0.5 | 11,198 | 2,177 | |||||||||
Select Medical Holdings | 0.7 | 87,557 | 2,986 | |||||||||
Syneos Health Inc, Cl A * | 0.8 | 45,820 | 3,475 | |||||||||
Tenet Healthcare Corp * | 0.7 | 60,091 | 3,125 | |||||||||
Veracyte Inc * | 0.7 | 54,594 | 2,934 | |||||||||
Other Securities (A) | 17.8 | 79,039 | ||||||||||
| 120,410 | ||||||||||||
Industrials — 17.8% |
| |||||||||||
ABM Industries Inc | 0.7 | 60,336 | 3,078 | |||||||||
Atkore Inc * | 0.5 | 27,873 | 2,004 | |||||||||
Clean Harbors Inc * | 0.5 | 28,427 | 2,390 | |||||||||
EMCOR Group Inc | 0.4 | 17,006 | 1,907 | |||||||||
Heritage-Crystal Clean Inc * | 0.8 | 128,377 | 3,483 | |||||||||
Hillenbrand Inc | 0.4 | 41,934 | 2,001 | |||||||||
John Bean Technologies Corp, Cl A | 0.5 | 15,514 | 2,069 | |||||||||
Matson Inc | 1.1 | 70,254 | 4,686 | |||||||||
Middleby Corp/The *(A) | 0.7 | 19,186 | 3,180 | |||||||||
Ritchie Bros Auctioneers Inc | 0.7 | 53,961 | 3,159 | |||||||||
Tennant Co (A) | 0.5 | 29,843 | 2,384 | |||||||||
TriNet Group Inc * | 0.6 | 34,630 | 2,700 | |||||||||
Triton International Ltd | 0.6 | 48,120 | 2,646 | |||||||||
Other Securities (A) | 9.8 | 43,483 | ||||||||||
| 79,170 | ||||||||||||
Information Technology — 16.6% |
| |||||||||||
2U Inc * | 0.6 | 73,156 | 2,797 | |||||||||
Digital Turbine Inc * | 0.5 | 27,584 | 2,217 | |||||||||
Echo Global Logistics Inc * | 0.4 | 60,296 | 1,894 | |||||||||
Pluralsight Inc, Cl A * | 0.5 | 97,335 | 2,174 | |||||||||
Sanmina Corp * | 0.4 | 47,065 | 1,948 | |||||||||
SVMK Inc * | 0.4 | 103,178 | 1,890 | |||||||||
TTEC Holdings Inc | 0.5 | 24,039 | 2,415 | |||||||||
Ultra Clean Holdings Inc * | 0.5 | 35,609 | 2,067 | |||||||||
Vishay Intertechnology Inc | 0.5 | 90,209 | 2,172 | |||||||||
Other Securities (A)(B) | 12.3 | 54,147 | ||||||||||
| 73,721 | ||||||||||||
Materials — 3.4% |
| |||||||||||
Louisiana-Pacific Corp | 0.7 | 57,054 | 3,164 | |||||||||
Other Securities (A) | 2.7 | 12,038 | ||||||||||
| 15,202 | ||||||||||||
Real Estate — 0.7% |
| |||||||||||
Other Securities ‡(A) | 0.7 | 3,268 | ||||||||||
Telecommunication Services — 0.1% |
| |||||||||||
Other Securities | 0.1 | 279 | ||||||||||
| SEI Institutional Managed Trust / Semi-Annual Report / March 31, 2021 | 23 |
SUMMARY SCHEDULE OF INVESTMENTS (Unaudited)
March 31, 2021
Small Cap Growth Fund (Concluded)
| Description | Percentage of Net Assets (%) | Shares | Market Value ($ Thousands) | |||||||||
COMMON STOCK (continued) |
| |||||||||||
Utilities — 0.2% | ||||||||||||
Other Securities | 0.2 | % | $ | 656 | ||||||||
Total Common Stock |
| 426,378 | ||||||||||
AFFILIATED PARTNERSHIP — 15.7% |
| |||||||||||
SEI Liquidity Fund, L.P. |
| |||||||||||
0.020% **†(D) | 15.7 | 69,787,629 | 69,802 | |||||||||
Total Affiliated Partnership |
| 69,802 | ||||||||||
| Description | Percentage of Net Assets (%) | Shares | Market Value ($ Thousands) | |||||||||
CASH EQUIVALENT — 4.0% |
| |||||||||||
SEI Daily Income Trust, | ||||||||||||
0.010% **† | 4.0 | % | 17,821,135 | $ | 17,821 | |||||||
Total Cash Equivalent |
| 17,821 | ||||||||||
Total Investments in Securities — 115.7% |
| $ | 514,001 | |||||||||
A list of the open futures contracts held by the Fund at March 31, 2021 is as follows:
Type of Contract | Number of Contracts Long/(Short) | Expiration Date | Notional Amount (Thousands) | Value (Thousands) | Unrealized Appreciation (Depreciation) (Thousands) | |||||||||||||||
Russell 2000 Index E-MINI | 62 | Jun-2021 | $ | 6,875 | $ | 6,890 | $ | 15 | ||||||||||||
| $ | 6,875 | $ | 6,890 | $ | 15 | |||||||||||||||
Percentages are based on a Net Assets of $444,444 ($ Thousands). |
| * | Non-income producing security. |
| ** | The rate reported is the 7-day effective yield as of March 31, 2021. |
| ‡ | Real Estate Investment Trust. |
| † | Investment in Affiliated Security (see Note 6). |
| (A) | Certain securities or partial positions of certain securities are on loan at March 31, 2021 (see Note 10). The total market value of securities on loan at March 31, 2021, was $69,599 ($ Thousands). |
| (B) | Level 3 security in accordance with fair value hierarchy. |
| (C) | Securities considered restricted. The total market value of such securities as of March 31, 2021 was $61 ($ Thousands) and represented 0.0% of Net Assets. |
| (D) | This security was purchased with cash collateral held from securities on loan (see Note 10). The total market value of such securities as of March 31, 2021 was $69,802 ($ Thousands). |
Cl — Class
The Summary Schedule of Investments does not reflect the complete portfolio holdings. It includes the Fund’s 50 largest holdings and each investment of any issuer that exceeds 1% of the Fund’s net assets. “Other Securities” represent all issues not required to be disclosed under the rules adopted by the U.S. Securities and Exchange Commission (“SEC”). In certain instances, securities for which footnotes listed above may otherwise apply are included in the Other Securities caption. The complete schedule of portfolio holdings is available (i) without charge, upon request, by calling (800) 342-5734; and (ii) on the SEC’s website at http://www.sec.gov.
The following is a list of the level of inputs used as of March 31, 2021, in valuing the Fund’s investments carried at value ($ Thousands):
| Investments in Securities | Level 1 ($) | Level 2 ($) | Level 3 ($)(1) | Total ($) | |||||||||||||
Common Stock | 426,312 | – | 66 | 426,378 | |||||||||||||
Affiliated Partnership | – | 69,802 | – | 69,802 | |||||||||||||
Cash Equivalent | 17,821 | – | – | 17,821 | |||||||||||||
|
|
|
|
|
|
|
|
|
| ||||||||
Total Investments in Securities | 444,133 | 69,802 | 66 | 514,001 | |||||||||||||
|
|
|
|
|
|
|
|
|
| ||||||||
| Other Financial Instruments | Level 1 ($) | Level 2 ($) | Level 3 ($) | Total ($) | ||||||||||
Futures Contracts* | ||||||||||||||
Unrealized Appreciation | 15 | – | – | 15 | ||||||||||
|
|
|
|
|
|
|
|
|
| |||||
Total Other Financial Instruments | 15 | – | – | 15 | ||||||||||
|
|
|
|
|
|
|
|
|
| |||||
* Futures contracts are valued at the unrealized appreciation on the instrument.
(1) A reconciliation of Level 3 investments is presented when the Fund has a significant amount of Level 3 investments at the beginning and/or end of the period in relation to the net assets. Management has concluded that Level 3 investments are not material in relation to net assets.
For the period ended March 31, 2021, there were no transfers in or out of Level 3.
For more information on valuation inputs, see Note 2 — Significant Accounting Policies in Notes to Financial Statements.
24 | SEI Institutional Managed Trust / Semi-Annual Report / March 31, 2021 |
The following is a summary of the Fund’s transactions with affiliates for the period ended March 31, 2021 ($ Thousands):
| Security Description | Value 9/30/2020 | Purchases at Cost | Proceeds from Sales | Realized Gain/ (Loss) | Change in Unrealized Appreciation/ (Depreciation) | Value 3/31/2021 | Shares | Income | Capital Gains | |||||||||
| SEI Liquidity Fund, L.P. | $ 14,256 | $ 116,878 | $(61,332) | $ 1 | $(1) | $69,802 | 69,787,629 | $ 188 | $— | |||||||||
SEI Daily Income Trust, Government Fund, Cl F | 5,613 | 64,752 | (52,544) | — | — | 17,821 | 17,821,135 | — | — | |||||||||
|
|
|
|
|
|
|
| |||||||||||
| Totals | $ 19,869 | $ 181,630 | $(113,876) | $ 1 | $(1) | $87,623 | $ 188 | $— | ||||||||||
|
|
|
|
|
|
|
|
Amounts designated as “—” are either $0 or have been rounded to $0.
The accompanying notes are an integral part of the financial statements.
SEI Institutional Managed Trust / Semi-Annual Report / March 31, 2021 | 25 |
SUMMARY SCHEDULE OF INVESTMENTS (Unaudited)
March 31, 2021
Tax-Managed Small/Mid Cap Fund
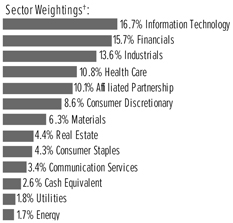
†Percentages are based on total investments. Includes investments held as collateral for securities held on loan (see Note 10).
| Description | Percentage of Net Assets (%) | Shares | Market Value ($ Thousands) | |||||||||
COMMON STOCK — 97.1% |
| |||||||||||
Communication Services — 3.8% |
| |||||||||||
Lions Gate Entertainment Corp, Cl A *(A) | 0.7 | % | 480,584 | $ | 7,185 | |||||||
Nexstar Media Group Inc, Cl A | 0.9 | 68,960 | 9,684 | |||||||||
Other Securities (A) | 2.2 | 21,538 | ||||||||||
| 38,407 | ||||||||||||
Consumer Discretionary — 9.6% |
| |||||||||||
American Eagle Outfitters Inc | 0.5 | 163,769 | 4,788 | |||||||||
Bloomin’ Brands Inc * | 0.6 | 205,848 | 5,568 | |||||||||
Etsy Inc * | 0.5 | 25,967 | 5,237 | |||||||||
Lithia Motors Inc, Cl A | 0.9 | 24,454 | 9,539 | |||||||||
Modine Manufacturing Co * | 0.8 | 571,716 | 8,444 | |||||||||
Pool Corp | 0.8 | 23,829 | 8,227 | |||||||||
Other Securities (A) | 5.5 | 56,217 | ||||||||||
| 98,020 | ||||||||||||
Consumer Staples — 4.8% |
| |||||||||||
Hostess Brands Inc, Cl A * | 0.7 | 468,657 | 6,721 | |||||||||
Medifast Inc | 0.5 | 25,737 | 5,452 | |||||||||
Other Securities (A) | 3.6 | 36,893 | ||||||||||
| 49,066 | ||||||||||||
Energy — 1.9% |
| |||||||||||
Cimarex Energy Co | 0.6 | 98,294 | 5,838 | |||||||||
Delek US Holdings Inc *(A) | 0.7 | 328,319 | 7,151 | |||||||||
Other Securities (B) | 0.6 | 6,660 | ||||||||||
| 19,649 | ||||||||||||
Financials — 17.5% |
| |||||||||||
Argo Group International | ||||||||||||
Holdings Ltd | 0.5 | 103,605 | 5,213 | |||||||||
BankUnited Inc | 0.6 | 127,615 | 5,609 | |||||||||
BGC Partners Inc, Cl A | 0.5 | 1,099,126 | 5,309 | |||||||||
CNO Financial Group Inc | 0.7 | 289,034 | 7,021 | |||||||||
Columbia Banking System Inc | 0.6 | 136,760 | 5,893 | |||||||||
First Commonwealth Financial Corp | 0.4 | 316,920 | 4,554 | |||||||||
| Description | Percentage of Net Assets (%) | Shares | Market Value ($ Thousands) | |||||||||
COMMON STOCK (continued) |
| |||||||||||
First Horizon Corp | 0.6 | % | 341,595 | $ | 5,776 | |||||||
FNB Corp/PA (A) | 0.6 | 494,669 | 6,282 | |||||||||
Pacific Premier Bancorp Inc | 0.5 | 114,780 | 4,986 | |||||||||
PacWest Bancorp | 1.4 | 386,880 | 14,759 | |||||||||
Starwood Property Trust Inc ‡ | 0.8 | 310,592 | 7,684 | |||||||||
Other Securities ‡(A) | 10.3 | 106,014 | ||||||||||
| 179,100 | ||||||||||||
Health Care — 11.9% |
| |||||||||||
Change Healthcare Inc * | 0.7 | 306,740 | 6,779 | |||||||||
Syneos Health Inc, Cl A * | 0.7 | 96,849 | 7,346 | |||||||||
Other Securities (A) | 10.5 | 108,148 | ||||||||||
| 122,273 | ||||||||||||
Industrials — 15.2% |
| |||||||||||
BWX Technologies Inc, Cl W | 0.5 | 84,376 | 5,564 | |||||||||
Colfax Corp *(A) | 0.7 | 167,422 | 7,335 | |||||||||
IAA Inc * | 0.5 | 85,739 | 4,728 | |||||||||
JetBlue Airways Corp * | 0.5 | 254,146 | 5,169 | |||||||||
KAR Auction Services Inc * | 0.4 | 300,328 | 4,505 | |||||||||
Teledyne Technologies Inc * | 0.8 | 18,991 | 7,856 | |||||||||
WESCO International Inc * | 0.8 | 94,612 | 8,187 | |||||||||
XPO Logistics Inc * | 0.9 | 78,605 | 9,692 | |||||||||
Other Securities (A) | 10.1 | 102,152 | ||||||||||
| 155,188 | ||||||||||||
Information Technology — 18.5% |
| |||||||||||
ACI Worldwide Inc * | 1.4 | 374,772 | 14,260 | |||||||||
J2 Global Inc *(A) | 2.5 | 211,316 | 25,328 | |||||||||
NCR Corp *(A) | 0.5 | 132,854 | 5,042 | |||||||||
ON Semiconductor Corp * | 0.4 | 108,955 | 4,534 | |||||||||
Semtech Corp * | 0.5 | 69,289 | 4,781 | |||||||||
Silicon Motion Technology Corp ADR | 1.3 | 221,337 | 13,145 | |||||||||
Super Micro Computer Inc * | 0.7 | 182,775 | 7,139 | |||||||||
Verint Systems Inc * | 0.5 | 112,718 | 5,128 | |||||||||
Other Securities (A) | 10.7 | 110,190 | ||||||||||
| 189,547 | ||||||||||||
Materials — 7.0% |
| |||||||||||
Ashland Global Holdings Inc | 0.5 | 55,852 | 4,958 | |||||||||
Axalta Coating Systems Ltd * | 0.5 | 164,272 | 4,859 | |||||||||
Commercial Metals Co, Cl A (A) | 0.8 | 270,710 | 8,349 | |||||||||
FMC Corp | 1.1 | 102,303 | 11,316 | |||||||||
Silgan Holdings Inc | 1.1 | 270,689 | 11,377 | |||||||||
Other Securities (A)(C) | 3.0 | 30,510 | ||||||||||
| 71,369 | ||||||||||||
Real Estate — 4.9% |
| |||||||||||
Gaming and Leisure Properties Inc ‡ | 0.7 | 167,435 | 7,104 | |||||||||
Howard Hughes Corp/The * | 0.5 | 51,451 | 4,895 | |||||||||
Medical Properties Trust Inc ‡ | 0.9 | 410,854 | 8,743 | |||||||||
Newmark Group Inc, Cl A | 0.4 | 450,766 | 4,510 | |||||||||
Other Securities ‡(A) | 2.4 | 24,482 | ||||||||||
| 49,734 | ||||||||||||
| 26 | SEI Institutional Managed Trust / Semi-Annual Report / March 31, 2021 |
| Description | Percentage of Net Assets (%) | Shares | Market Value ($ Thousands) | |||||||||
COMMON STOCK (continued) |
| |||||||||||
Utilities — 2.0% | ||||||||||||
Other Securities (A) | 2.0 | % | $ | 20,804 | ||||||||
Total Common Stock |
| 993,157 | ||||||||||
AFFILIATED PARTNERSHIP — 11.2% |
| |||||||||||
SEI Liquidity Fund, L.P. |
| |||||||||||
0.020% **†(D) | 11.2 | 114,322,771 | 114,352 | |||||||||
Total Affiliated Partnership |
| 114,352 | ||||||||||
CASH EQUIVALENT — 2.9% |
| |||||||||||
SEI Daily Income Trust, | ||||||||||||
0.010% **† | 2.9 | 30,072,280 | 30,072 | |||||||||
Total Cash Equivalent |
| 30,072 | ||||||||||
Total Investments in Securities — 111.2% |
| $ | 1,137,581 | |||||||||
A list of the open futures contracts held by the Fund at March 31, 2021 is as follows:
Type of Contract | Number of Contracts Long/(Short) | Expiration Date | Notional Amount (Thousands) | Value (Thousands) | Unrealized Appreciation (Depreciation) (Thousands) | |||||||||||||||
Russell 2000 Index E-MINI | 14 | Jun-2021 | $ | 1,552 | $ | 1,556 | $ | 4 | ||||||||||||
S&P Mid Cap 400 Index E-MINI | 4 | Jun-2021 | 1,049 | 1,042 | (7) | |||||||||||||||
| $ | 2,601 | $ | 2,598 | $ | (3) | |||||||||||||||
Percentages are based on a Net Assets of $1,023,126 |
($ Thousands). |
| * | Non-income producing security. |
| ** | The rate reported is the 7-day effective yield as of March 31, 2021. |
| ‡ | Real Estate Investment Trust. |
| † | Investment in Affiliated Security (see Note 6). |
| (A) | Certain securities or partial positions of certain securities are on loan at March 31, 2021 (see Note 10). The total market value of securities on loan at March 31, 2021, was $112,616 ($ Thousands). |
| (B) | Security is a Master Limited Partnership. At March 31, 2021, such securities amounted to $1,724 ($ Thousands), or 0.2% of Net Assets (See Note 2). |
| (C) | Level 3 security in accordance with fair value hierarchy. |
| (D) | This security was purchased with cash collateral held from securities on loan (see Note 10). The total market value of such securities as of March 31, 2021 was $114,352 ($ Thousands). |
ADR — American Depositary Receipt
Cl — Class
S&P— Standard & Poor’s
The Summary Schedule of Investments does not reflect the complete portfolio holdings. It includes the Fund’s 50 largest holdings and each investment of any issuer that exceeds 1% of the Fund’s net assets.
“Other Securities” represent all issues not required to be disclosed under the rules adopted by the U.S. Securities and Exchange Commission (“SEC”). In certain instances, securities for which footnotes listed above may otherwise apply are included in the Other Securities caption. The complete schedule of portfolio holdings is available (i) without charge, upon request, by calling (800) 342-5734; and (ii) on the SEC’s website at http://www.sec.gov.
The following is a list of the level of inputs used as of March 31, 2021, in valuing the Fund’s investments carried at value ($ Thousands):
| Investments in Securities | Level 1 ($) | Level 2 ($) | Level 3 ($)(1) | Total ($) | ||||||||||
Common Stock | 992,968 | – | 189 | 993,157 | ||||||||||
Affiliated Partnership | – | 114,352 | – | 114,352 | ||||||||||
Cash Equivalent | 30,072 | – | – | 30,072 | ||||||||||
|
|
|
|
|
|
|
|
|
| |||||
Total Investments in Securities | 1,023,040 | 114,352 | 189 | 1,137,581 | ||||||||||
|
|
|
|
|
|
|
|
|
| |||||
SEI Institutional Managed Trust / Semi-Annual Report / March 31, 2021 | 27 |
SUMMARY SCHEDULE OF INVESTMENTS (Unaudited)
March 31, 2021
Tax-Managed Small/Mid Cap Fund (Concluded)
| Other Financial Instruments | Level 1 ($) | Level 2 ($) | Level 3 ($) | Total ($) | ||||||||||
Futures Contracts* | ||||||||||||||
Unrealized Appreciation | 4 | – | – | 4 | ||||||||||
Unrealized Depreciation | (7) | – | – | (7) | ||||||||||
|
|
|
|
|
|
|
|
|
| |||||
Total Other Financial Instruments | (3) | – | – | (3) | ||||||||||
|
|
|
|
|
|
|
|
|
| |||||
* Futures contracts are valued at the unrealized appreciation on the instrument.
(1) A reconciliation of Level 3 investments is presented when the Fund has a significant amount of Level 3 investments at the beginning and/or end of the period in relation to the net assets. Management has concluded that Level 3 investments are not material in relation to net assets.
For the period ended March 31, 2021, there was a transfer between Level 1 and Level 3 assets and liabilities due to the unavailability of observable inputs to determine fair value.
For more information on valuation inputs, see Note 2 — Significant Accounting Policies in Notes to Financial Statements.
The following is a summary of the Fund’s transactions with affiliates for the period ended March 31, 2021 ($ Thousands):
| Security Description | Value 9/30/2020 | Purchases at Cost | Proceeds from Sales | Realized Gain/ (Loss) | Change in Unrealized Appreciation/ (Depreciation) | Value 3/31/2021 | Shares | Income | Capital Gains | |||||||||
| SEI Liquidity Fund, L.P. | $28,359 | $176,791 | $(90,805) | $10 | $(3) | $114,352 | 114,322,771 | $70 | $— | |||||||||
SEI Daily Income Trust, Government Fund, Cl F | 18,861 | 90,218 | (79,007) | — | — | 30,072 | 30,072,280 | 1 | — | |||||||||
|
|
|
|
|
|
|
| |||||||||||
| Totals | $47,220 | $267,009 | $(169,812) | $10 | $(3) | $144,424 | $71 | $— | ||||||||||
|
|
|
|
|
|
|
|
Amounts designated as “—” are either $0 or have been rounded to $0.
The accompanying notes are an integral part of the financial statements.
28 | SEI Institutional Managed Trust / Semi-Annual Report / March 31, 2021 |
SUMMARY SCHEDULE OF INVESTMENTS (Unaudited)
March 31, 2021
Mid-Cap Fund
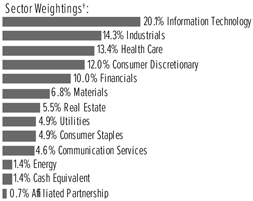
†Percentages are based on total investments. Includes investments held as collateral for securities held on loan (see Note 10).
| Description | Percentage of Net Assets (%) | Shares | Market Value ($ Thousands) | |||||||
COMMON STOCK — 98.2% |
| |||||||||
Communication Services — 4.7% |
| |||||||||
Lumen Technologies Inc | 0.8% | 49,500 | $ | 661 | ||||||
Other Securities (A) | 3.9 | 3,105 | ||||||||
| 3,766 | ||||||||||
Consumer Discretionary — 12.0% |
| |||||||||
Best Buy Co Inc | 0.8 | 5,700 | 654 | |||||||
Dollar Tree | 0.9 | 6,100 | 698 | |||||||
DR Horton Inc | 0.9 | 7,900 | 704 | |||||||
Ford Motor | 1.1 | 73,900 | 905 | |||||||
Lennar Corp, Cl A | 0.6 | 4,600 | 466 | |||||||
Lennar Corp, Cl B | 0.4 | 3,800 | 313 | |||||||
O’Reilly Automotive Inc * | 0.7 | 1,190 | 604 | |||||||
Other Securities | 6.5 | 5,295 | ||||||||
| 9,639 | ||||||||||
Consumer Staples — 4.9% |
| |||||||||
Archer-Daniels-Midland Co | 0.9 | 13,500 | 770 | |||||||
Kroger Co/The | 0.9 | 20,300 | 731 | |||||||
Tyson Foods Inc, Cl A | 0.8 | 9,100 | 676 | |||||||
Other Securities | 2.3 | 1,779 | ||||||||
| 3,956 | ||||||||||
Energy — 1.4% |
| |||||||||
Other Securities | 1.4 | 1,137 | ||||||||
Financials — 10.0% |
| |||||||||
Ameriprise Financial Inc | 1.0 | 3,400 | 790 | |||||||
Annaly Capital Management Inc ‡ | 0.8 | 69,500 | 598 | |||||||
Citizens Financial Group Inc | 0.7 | 13,400 | 592 | |||||||
Discover Financial Services | 1.0 | 8,000 | 760 | |||||||
KeyCorp | 0.7 | 29,400 | 587 | |||||||
Popular Inc | 0.7 | 8,000 | 562 | |||||||
Raymond James Financial Inc | 0.7 | 4,600 | 564 | |||||||
Synchrony Financial | 0.7 | 14,700 | 598 | |||||||
Other Securities | 3.7 | 3,039 | ||||||||
| 8,090 | ||||||||||
Health Care — 13.4% |
| |||||||||
Align Technology Inc * | 0.9 | 1,340 | 726 | |||||||
| Description | Percentage of Net Assets (%) | Shares | Market Value ($ Thousands) | |||||||
COMMON STOCK (continued) |
| |||||||||
AmerisourceBergen Corp, Cl A | 0.7% | 4,900 | $ | 579 | ||||||
Hologic Inc * | 0.8 | 8,300 | 617 | |||||||
IDEXX Laboratories | 0.8 | 1,340 | 656 | |||||||
IQVIA Holdings | 0.9 | 3,900 | 753 | |||||||
Mettler-Toledo International Inc * | 0.8 | 540 | 624 | |||||||
ResMed Inc | 0.8 | 3,200 | 621 | |||||||
Other Securities | 7.8 | 6,262 | ||||||||
| 10,838 | ||||||||||
Industrials — 14.3% |
| |||||||||
Acuity Brands Inc | 0.8 | 3,900 | 643 | |||||||
Cummins Inc | 1.0 | 3,100 | 803 | |||||||
Generac Holdings Inc * | 0.9 | 2,200 | 720 | |||||||
Masco Corp | 0.8 | 10,600 | 635 | |||||||
Old Dominion Freight Line Inc, Cl A | 0.7 | 2,500 | 601 | |||||||
Parker-Hannifin Corp, Cl A | 0.9 | 2,200 | 694 | |||||||
WW Grainger Inc | 0.7 | 1,490 | 597 | |||||||
Other Securities | 8.5 | 6,865 | ||||||||
| 11,558 | ||||||||||
Information Technology — 20.2% |
| |||||||||
Cadence Design Systems Inc * | 1.0 | 5,900 | 808 | |||||||
EPAM Systems | 0.8 | 1,600 | 635 | |||||||
HP Inc | 0.9 | 21,800 | 692 | |||||||
KLA Corp | 1.2 | 2,900 | 958 | |||||||
MKS Instruments Inc | 0.8 | 3,500 | 649 | |||||||
PTC Inc * | 0.8 | 4,800 | 661 | |||||||
Skyworks Solutions Inc | 0.8 | 3,600 | 661 | |||||||
SS&C Technologies Holdings Inc | 0.7 | 8,600 | 601 | |||||||
Synopsys Inc * | 0.9 | 2,800 | 694 | |||||||
Zebra Technologies Corp, Cl A * | 0.8 | 1,260 | 611 | |||||||
Other Securities | 11.5 | 9,313 | ||||||||
| 16,283 | ||||||||||
Materials — 6.9% |
| |||||||||
Corteva Inc | 1.1 | 18,100 | 844 | |||||||
Freeport-McMoRan Inc, Cl B | 1.0 | 25,200 | 830 | |||||||
PPG Industries Inc | 0.8 | 4,200 | 631 | |||||||
Steel Dynamics Inc | 0.7 | 11,200 | 569 | |||||||
Other Securities | 3.3 | 2,683 | ||||||||
| �� | 5,557 | |||||||||
Real Estate — 5.5% |
| |||||||||
Weyerhaeuser Co ‡ | 0.9 | 20,100 | 716 | |||||||
Other | 4.6 | 3,712 | ||||||||
| 4,428 | ||||||||||
Utilities — 4.9% |
| |||||||||
AES Corp/The | 0.8 | 25,400 | 681 | |||||||
MDU Resources Group Inc | 0.8 | 20,000 | 632 | |||||||
Public Service Enterprise Group Inc | 0.8 | 10,600 | 638 | |||||||
SEI Institutional Managed Trust / Semi-Annual Report / March 31, 2021 | 29 |
SUMMARY SCHEDULE OF INVESTMENTS (Unaudited)
March 31, 2021
Mid-Cap Fund (Concluded)
| Description | Percentage of Net Assets (%) | Shares | Market Value ($ Thousands) | |||||||
COMMON STOCK (continued) |
| |||||||||
UGI Corp | 0.7% | 14,000 | $ | 574 | ||||||
Other Securities | 1.8 | 1,463 | ||||||||
| 3,988 | ||||||||||
Total Common Stock |
| 79,240 | ||||||||
PREFERRED STOCK — 0.1% |
| |||||||||
Consumer Discretionary — 0.1% |
| |||||||||
Other Securities | 0.1 | 107 | ||||||||
Total Preferred Stock | 107 | |||||||||
| Description | Percentage of Net Assets (%) | Shares | Market Value ($ Thousands) | |||||||||
AFFILIATED PARTNERSHIP — 0.7% |
| |||||||||||
SEI Liquidity Fund, L.P. | ||||||||||||
0.020% **†(B) | 0.7 | % | 579,529 | $ | 580 | |||||||
Total Affiliated Partnership |
| 580 | ||||||||||
CASH EQUIVALENT — 1.4% |
| |||||||||||
SEI Daily Income Trust, Government Fund, Cl F | ||||||||||||
0.010% **† | 1.4 | 1,109,175 | 1,109 | |||||||||
Total Cash Equivalent |
| 1,109 | ||||||||||
Total Investments in Securities — 100.4% |
| $ | 81,036 | |||||||||
A list of the open futures contracts held by the Fund at March 31, 2021 is as follows:
| Type of Contract | Number of Contracts Long | Expiration Date | Notional Amount (Thousands) | Value (Thousands) | Unrealized (Thousands) | |||||||||||||||
S&P Mid Cap 400 Index E-MINI | 1 | Jun-2021 | $ | 256 | $ | 260 | $ | 4 | ||||||||||||
|
|
|
|
|
| |||||||||||||||
Percentages are based on a Net Assets of $80,715 ($ Thousands). |
| * | Non-income producing security. |
| ** | The rate reported is the 7-day effective yield as of March 31, 2021. |
| ‡ | Real Estate Investment Trust. |
| † | Investment in Affiliated Security (see Note 6). |
| (A) | Certain securities or partial positions of certain securities are on loan at March 31, 2021 (see Note 10). The total market value of securities on loan at March 31, 2021, was $564 ($ Thousands). |
| (B) | This security was purchased with cash collateral held from securities on loan (see Note 10). The total market value of such securities as of March 31, 2021 was $580 ($ Thousands). |
Cl — Class
L.P. — Limited Partnership
S&P— Standard & Poor’s
The Summary Schedule of Investments does not reflect the complete portfolio holdings. It includes the Fund’s 50 largest holdings and each investment of any issuer that exceeds 1% of the Fund’s net assets.
“Other Securities” represent all issues not required to be disclosed under the rules adopted by the U.S. Securities and Exchange Commission (“SEC”). In certain instances, securities for which footnotes listed above may otherwise apply are included in the Other Securities caption. The complete schedule of portfolio holdings is available (i) without charge, upon request, by calling (800) 342-5734; and (ii) on the SEC’s website at http://www.sec.gov.
The following is a list of the level of inputs used as of March 31, 2021, in valuing the Fund’s investments carried at value ($ Thousands):
| Investments in Securities | Level 1 ($) | Level 2 ($) | Level 3 ($) | Total ($) | ||||||||||||
Common Stock | 79,240 | – | – | 79,240 | ||||||||||||
Preferred Stock | 107 | – | – | 107 | ||||||||||||
Affiliated Partnership | – | 580 | – | 580 | ||||||||||||
Cash Equivalent | 1,109 | – | – | 1,109 | ||||||||||||
|
|
|
|
|
|
|
| |||||||||
Total Investments in Securities | 80,456 | 580 | – | 81,036 | ||||||||||||
|
|
|
|
|
|
|
| |||||||||
| Other Financial Instruments | Level 1 ($) | Level 2 ($) | Level 3 ($) | Total ($) | ||||||||||||
Futures Contracts* | ||||||||||||||||
Unrealized Appreciation | 4 | – | – | 4 | ||||||||||||
|
|
|
|
|
|
|
| |||||||||
Total Other Financial Instruments | 4 | – | – | 4 | ||||||||||||
|
|
|
|
|
|
|
| |||||||||
* Futures contracts are valued at the unrealized appreciation on the instrument.
For the period ended March 31, 2021, there were no transfers in or out of Level 3.
For more information on valuation inputs, see Note 2 — Significant Accounting Policies in Notes to Financial Statements.
30 | SEI Institutional Managed Trust / Semi-Annual Report / March 31, 2021 |
The following is a summary of the Fund’s transactions with affiliates for the period ended March 31, 2021 ($ Thousands):
| Security Description | Value 9/30/2020 | Purchases at Cost | Proceeds from Sales | Realized Gain/ (Loss) | Change in Unrealized Appreciation/ (Depreciation) | Value 3/31/2021 | Shares | Income | Capital Gains | |||||||||
SEI Liquidity Fund, L.P. | $ — | $ 1,710 | $ (1,130) | $ — | $ — | $ 580 | 579,529 | $ — | $ — | |||||||||
SEI Daily Income Trust, Government Fund, Cl F | 1,119 | 10,440 | (10,450) | — | — | 1,109 | 1,109,175 | — | — | |||||||||
|
|
|
|
|
|
|
| |||||||||||
Totals | $ 1,119 | $ 12,150 | $ (11,580) | $ — | $ — | $ 1,689 | $ — | $ — | ||||||||||
|
|
|
|
|
|
|
|
Amounts designated as “—” are either $0 or have been rounded to $0.
The accompanying notes are an integral part of the financial statements.
SEI Institutional Managed Trust / Semi-Annual Report / March 31, 2021 | 31 |
SUMMARY SCHEDULE OF INVESTMENTS (Unaudited)
March 31, 2021
U.S. Managed Volatility Fund
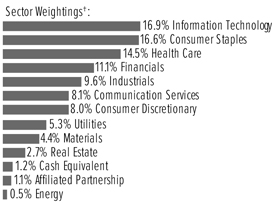
†Percentages are based on total investments. Includes investments held as collateral for securities held on loan (see Note 10).
| Description | Percentage of Net Assets (%) | Shares | Market Value ($ Thousands) | |||||||||
COMMON STOCK — 98.7% |
| |||||||||||
Communication Services — 8.1% |
| |||||||||||
AT&T Inc | 1.3 | % | 418,608 | $ | 12,671 | |||||||
Comcast Corp, Cl A | 1.3 | 240,900 | 13,035 | |||||||||
Omnicom Group Inc | 0.9 | 121,800 | 9,031 | |||||||||
Verizon Communications | 2.5 | 433,911 | 25,232 | |||||||||
Other Securities | 2.1 | 21,396 | ||||||||||
| 81,365 | ||||||||||||
Consumer Discretionary — 8.1% |
| |||||||||||
eBay Inc | 1.2 | 194,674 | 11,922 | |||||||||
Target Corp, Cl A | 2.0 | 98,529 | 19,516 | |||||||||
Toyota Motor Corp ADR (A) | 0.7 | 47,464 | 7,407 | |||||||||
Other Securities (A) | 4.2 | 41,757 | ||||||||||
| 80,602 | ||||||||||||
Consumer Staples — 16.8% |
| |||||||||||
Conagra Brands Inc | 1.1 | 287,811 | 10,822 | |||||||||
General Mills Inc | 1.0 | 169,734 | 10,408 | |||||||||
Hershey Co/The | 0.7 | 42,124 | 6,662 | |||||||||
J M Smucker Co/The | 1.6 | 121,998 | 15,436 | |||||||||
Kellogg Co | 0.9 | 148,945 | 9,428 | |||||||||
Kimberly-Clark Corp | 1.3 | 90,908 | 12,641 | |||||||||
Kraft Heinz Co/The | 0.9 | 219,400 | 8,776 | |||||||||
Kroger Co/The | 1.5 | 405,027 | 14,577 | |||||||||
Tyson Foods Inc, Cl A | 1.1 | 144,449 | 10,733 | |||||||||
Other Securities (A) | 6.7 | 68,183 | ||||||||||
| 167,666 | ||||||||||||
Energy — 0.6% |
| |||||||||||
Other Securities | 0.6 | 5,499 | ||||||||||
Financials — 11.2% |
| |||||||||||
Aflac Inc | 1.1 | 221,967 | 11,360 | |||||||||
Allstate Corp/The | 1.3 | 115,300 | 13,248 | |||||||||
Bank of New York Mellon Corp/ The | 0.9 | 198,000 | 9,363 | |||||||||
Berkshire Hathaway Inc, Cl B * | 2.1 | 80,117 | 20,467 | |||||||||
| Description | Percentage of Net Assets (%) | Shares | Market Value ($ Thousands) | |||||||||
COMMON STOCK (continued) |
| |||||||||||
US Bancorp | 0.7 | % | 125,400 | $ | 6,936 | |||||||
Other Securities ‡ | 5.1 | 50,403 | ||||||||||
| 111,777 | ||||||||||||
Health Care — 14.6% |
| |||||||||||
AbbVie Inc | 0.9 | 86,995 | 9,415 | |||||||||
Amgen Inc, Cl A | 1.1 | 42,500 | 10,574 | |||||||||
Bristol-Myers Squibb Co | 1.6 | 251,177 | 15,857 | |||||||||
CVS Health Corp | 1.0 | 126,626 | 9,526 | |||||||||
Gilead Sciences Inc | 0.9 | 141,500 | 9,145 | |||||||||
Johnson & Johnson | 2.1 | 127,718 | 20,991 | |||||||||
Merck & Co Inc | 2.4 | 315,164 | 24,296 | |||||||||
Pfizer Inc | 1.6 | 444,439 | 16,102 | |||||||||
Other Securities (A) | 3.0 | 30,286 | ||||||||||
| 146,192 | ||||||||||||
Industrials — 9.7% |
| |||||||||||
3M Co | 1.0 | 50,635 | 9,756 | |||||||||
Cummins Inc | 0.8 | 31,600 | 8,188 | |||||||||
Northrop Grumman Corp | 1.0 | 29,432 | 9,525 | |||||||||
Snap-on Inc | 1.0 | 44,000 | 10,152 | |||||||||
Other Securities (A) | 5.9 | 59,670 | ||||||||||
| 97,291 | ||||||||||||
Information Technology — 17.1% |
| |||||||||||
Amdocs Ltd | 2.1 | 300,704 | 21,094 | |||||||||
Cisco Systems Inc/Delaware | 1.9 | 359,046 | 18,566 | |||||||||
F5 Networks Inc, Cl A * | 1.4 | 67,564 | 14,095 | |||||||||
Intel Corp | 2.2 | 339,000 | 21,696 | |||||||||
International Business Machines Corp | 1.4 | 102,708 | 13,687 | |||||||||
J2 Global Inc * | 0.6 | 50,200 | 6,017 | |||||||||
Juniper Networks Inc | 0.7 | 284,966 | 7,218 | |||||||||
Oracle Corp, Cl B | 2.4 | 344,999 | 24,209 | |||||||||
Seagate Technology PLC | 0.9 | 116,500 | 8,941 | |||||||||
Western Union Co/The | 1.1 | 424,181 | 10,460 | |||||||||
Other Securities | 2.4 | 24,840 | ||||||||||
| 170,823 | ||||||||||||
Materials — 4.4% |
| |||||||||||
Linde PLC | 0.6 | 22,103 | 6,192 | |||||||||
Newmont Corp | 0.7 | 115,789 | 6,979 | |||||||||
Other Securities | 3.1 | 30,935 | ||||||||||
| 44,106 | ||||||||||||
Real Estate — 2.7% |
| |||||||||||
Other Securities ‡ | 2.7 | 27,314 | ||||||||||
Utilities — 5.4% |
| |||||||||||
DTE Energy Co | 0.6 | 46,699 | 6,218 | |||||||||
Entergy Corp | 0.9 | 85,500 | 8,505 | |||||||||
Evergy Inc | 1.2 | 204,537 | 12,176 | |||||||||
Exelon Corp | 0.7 | 163,000 | 7,130 | |||||||||
32 | SEI Institutional Managed Trust / Semi-Annual Report / March 31, 2021 |
| Description | Percentage of Net Assets (%) | Shares | Market Value ($ Thousands) | |||||||||
COMMON STOCK (continued) |
| |||||||||||
Portland General Electric Co | 0.6 | % | 134,094 | $ | 6,365 | |||||||
Other Securities (A) | 1.4 | 13,169 | ||||||||||
| 53,563 | ||||||||||||
Total Common Stock |
| 986,198 | ||||||||||
AFFILIATED PARTNERSHIP — 1.1% |
| |||||||||||
SEI Liquidity Fund, L.P. | ||||||||||||
0.020% **†(B) | 1.1 | 11,340,643 | 11,343 | |||||||||
Total Affiliated Partnership |
| 11,343 | ||||||||||
| Description | Percentage of Net Assets (%) | Shares | Market Value ($ Thousands) | |||||||||
CASH EQUIVALENT — 1.3% |
| |||||||||||
SEI Daily Income Trust, Government Fund, Cl F | ||||||||||||
0.010% **† | 1.3 | % | 12,632,496 | $ | 12,632 | |||||||
Total Cash Equivalent |
| 12,632 | ||||||||||
Total Investments in Securities — 101.1% |
| $ | 1,010,173 | |||||||||
A list of the open futures contracts held by the Fund at March 31, 2021, is as follows:
| Type of Contract | Number of Contracts Long) | Expiration Date | Notional Amount (Thousands) | Value (Thousands) | Unrealized Appreciation (Thousands) | |||||||||||||||
S&P 500 Index E-MINI | 33 | Jun-2021 | $ | 6,542 | $ | 6,546 | $ | 4 | ||||||||||||
|
| |||||||||||||||||||
| $ | 6,542 | $ | 6,546 | $ | 4 | |||||||||||||||
|
| |||||||||||||||||||
Percentages are based on a Net Assets of $998,797 ($ Thousands). |
| * | Non-income producing security. |
| ** | The rate reported is the 7-day effective yield as of March 31, 2021. |
| ‡ | Real Estate Investment Trust. |
| † | Investment in Affiliated Security (see Note 6). |
| (A) | Certain securities or partial positions of certain securities are on loan at March 31, 2021 (see Note 10). The total market value of securities on loan at March 31, 2021, was $11,216 ($ Thousands). |
| (B) | This security was purchased with cash collateral held from securities on loan (see Note 10). The total market value of such securities as of March 31, 2021 was $11,343 ($ Thousands). |
ADR — American Depositary Receipt
Cl — Class
PLC — Public Limited Company
The Summary Schedule of Investments does not reflect the complete portfolio holdings. It includes the Fund’s 50 largest holdings and each investment of any issuer that exceeds 1% of the Fund’s net assets. “Other Securities” represent all issues not required to be disclosed under the rules adopted by the U.S. Securities and Exchange Commission (“SEC”). In certain instances, securities for which footnotes listed above may otherwise apply are included in the Other Securities caption. The complete schedule of portfolio holdings is available (i) without charge, upon request, by calling (800) 342-5734; and (ii) on the SEC’s website at http://www.sec.gov.
The following is a list of the level of inputs used as of March 31, 2021, in valuing the Fund’s investments and other financial instruments carried at value ($ Thousands):
| Investments in Securities | Level 1 ($) | Level 2 ($) | Level 3 ($) | Total ($) | ||||||||||||
Common Stock | 986,198 | – | – | 986,198 | ||||||||||||
Affiliated Partnership | – | 11,343 | – | 11,343 | ||||||||||||
Cash Equivalent | 12,632 | – | – | 12,632 | ||||||||||||
|
|
|
|
|
|
|
| |||||||||
Total Investments in Securities | 998,830 | 11,343 | – | 1,010,173 | ||||||||||||
|
|
|
|
|
|
|
| |||||||||
| Other Financial Instruments | Level 1 ($) | Level 2 ($) | Level 3 ($) | Total ($) | ||||||||||||
Futures Contracts* | ||||||||||||||||
Unrealized Appreciation | 4 | – | – | 4 | ||||||||||||
|
|
|
|
|
|
|
| |||||||||
Total Other Financial Instruments | 4 | – | – | 4 | ||||||||||||
|
|
|
|
|
|
|
| |||||||||
* Futures Contracts are valued at the unrealized appreciation on the instrument.
For the period ended March 31, 2021, there were no transfers in or out of Level 3.
For more information on valuation inputs, see Note 2 — Significant Accounting Policies in Notes to Financial Statements.
The following is a summary of the Fund’s transactions with affiliates for the period ended March 31, 2021 ($ Thousands):
| Security Description | Value 9/30/2020 | Purchases at Cost | Proceeds from Sales | Realized Gain/ (Loss) | Change in Unrealized Appreciation/ (Depreciation) | Value 3/31/2021 | Shares | Income | Capital Gains | |||||||||
| SEI Liquidity Fund, L.P. | $ 13,094 | $ 39,459 | $ (41,209) | $ (1) | $ — | $ 11,343 | 11,340,643 | $ 36 | $ — | |||||||||
| SEI Daily Income Trust, Government Fund, Cl F | 31,666 | 834,157 | (853,191) | — | — | 12,632 | 12,632,496 | 1 | — | |||||||||
|
|
|
|
|
|
|
| |||||||||||
Totals | $ 44,760 | $ 873,616 | $ (894,400) | $ (1) | $ — | $ 23,975 | $ 37 | $ — | ||||||||||
|
|
|
|
|
|
|
|
Amounts designated as “—” are $0 or have been rounded to $0.
The accompanying notes are an integral part of the financial statements.
SEI Institutional Managed Trust / Semi-Annual Report / March 31, 2021 | 33 |
SUMMARY SCHEDULE OF INVESTMENTS (Unaudited)
March 31, 2021
Global Managed Volatility Fund
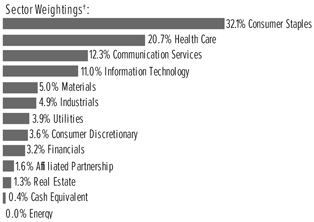
†Percentages are based on total investments. Includes investments held as collateral for securities held on loan (see Note 10).
| Description | Percentage of Net Assets (%) | Shares | Market Value ($ Thousands) | |||||||||
COMMON STOCK — 97.7% |
| |||||||||||
Australia — 2.0% |
| |||||||||||
Newcrest Mining Ltd | 0.8 | % | 461,027 | $ | 8,575 | |||||||
Other Securities | 1.2 | 11,844 | ||||||||||
| 20,419 | ||||||||||||
Austria — 0.0% |
| |||||||||||
Other Securities | 0.0 | 404 | ||||||||||
Belgium — 0.3% |
| |||||||||||
Other Securities | 0.3 | 3,277 | ||||||||||
Bermuda — 0.2% |
| |||||||||||
Other Securities | 0.2 | 2,302 | ||||||||||
Canada — 4.9% |
| |||||||||||
Alimentation Couche-Tard Inc, Cl B | 0.8 | 262,600 | 8,466 | |||||||||
George Weston Ltd | 0.9 | 104,821 | 9,281 | |||||||||
Loblaw Cos Ltd | 0.8 | 154,226 | 8,614 | |||||||||
Other Securities | 2.4 | 24,519 | ||||||||||
| 50,880 | ||||||||||||
Denmark — 1.0% |
| |||||||||||
Other Securities | 1.0 | 10,149 | ||||||||||
Finland — 0.3% |
| |||||||||||
Other Securities | 0.3 | 3,178 | ||||||||||
France — 1.2% |
| |||||||||||
Other Securities | 1.2 | 12,743 | ||||||||||
| Description | Percentage of Net Assets (%) | Shares | �� | Market Value ($ Thousands) | ||||||||
COMMON STOCK (continued) |
| |||||||||||
Germany — 0.6% |
| |||||||||||
Henkel AG & Co KGaA | 0.1 | % | 14,619 | $ | 1,451 | |||||||
Other Securities | 0.5 | 4,162 | ||||||||||
| 5,613 | ||||||||||||
Hong Kong — 1.8% |
| |||||||||||
CLP Holdings Ltd, Cl B | 0.8 | 869,156 | 8,441 | |||||||||
Other Securities | 1.0 | 10,197 | ||||||||||
| 18,638 | ||||||||||||
Israel — 0.4% |
| |||||||||||
Other Securities | 0.4 | 4,480 | ||||||||||
Italy — 0.4% |
| |||||||||||
Other Securities | 0.4 | 4,510 | ||||||||||
Japan — 10.2% |
| |||||||||||
KDDI Corp | 1.0 | 330,800 | 10,164 | |||||||||
Nippon Telegraph & Telephone Corp (A) | 1.0 | 397,200 | 10,216 | |||||||||
Okinawa Cellular Telephone Co | 0.0 | 3,500 | 161 | |||||||||
Oracle Corp Japan * | 0.1 | 13,600 | 1,329 | |||||||||
Softbank Corp | 1.5 | 1,147,600 | 14,940 | |||||||||
Other | 6.6 | 68,537 | ||||||||||
| 105,347 | ||||||||||||
Netherlands — 1.2% |
| |||||||||||
Koninklijke Ahold Delhaize NV | 1.2 | 444,731 | 12,414 | |||||||||
New Zealand — 0.5% |
| |||||||||||
Other | 0.5 | 5,252 | ||||||||||
Norway — 1.1% |
| |||||||||||
Orkla ASA | 0.8 | 806,339 | 7,920 | |||||||||
Other Securities | 0.3 | 3,574 | ||||||||||
| 11,494 | ||||||||||||
Portugal — 0.1% |
| |||||||||||
Other Securities | 0.1 | 1,194 | ||||||||||
Singapore — 0.4% |
| |||||||||||
Other Securities | 0.4 | 3,910 | ||||||||||
Spain — 0.5% |
| |||||||||||
Other | 0.5 | 4,655 | ||||||||||
Sweden — 1.8% |
| |||||||||||
Axfood AB (A) | 0.8 | 327,941 | 7,856 | |||||||||
34 | SEI Institutional Managed Trust / Semi-Annual Report / March 31, 2021 |
| Description | Percentage of Net Assets (%) | Shares | Market Value ($ Thousands) | |||||||||
COMMON STOCK (continued) |
| |||||||||||
Sweden (continued) |
| |||||||||||
ICA Gruppen AB | 0.8 | % | 176,368 | $ | 8,640 | |||||||
Other Securities | 0.2 | 2,267 | ||||||||||
| 18,763 | ||||||||||||
Switzerland — 4.9% |
| |||||||||||
Novartis AG | 0.9 | 102,623 | 8,807 | |||||||||
Roche Holding AG | 0.9 | 29,133 | 9,455 | |||||||||
Swisscom AG (A) | 1.0 | 18,237 | 9,824 | |||||||||
Other Securities | 2.1 | 22,518 | ||||||||||
| 50,604 | ||||||||||||
United Kingdom — 2.7% |
| |||||||||||
Other Securities | 2.7 | 27,449 | ||||||||||
United States — 61.2% |
| |||||||||||
Agilent Technologies Inc | 0.8 | 61,383 | 7,804 | |||||||||
Alphabet Inc, | 0.7 | 3,623 | 7,473 | |||||||||
Alphabet Inc, | 0.1 | 502 | 1,039 | |||||||||
Amgen Inc, Cl A | 0.8 | 32,320 | 8,042 | |||||||||
AT&T Inc | 1.2 | 411,885 | 12,468 | |||||||||
Casey’s General Stores Inc | 0.9 | 42,324 | 9,150 | |||||||||
Cerner Corp | 1.0 | 144,178 | 10,363 | |||||||||
Check Point Software Technologies Ltd * | 1.0 | 92,132 | 10,316 | |||||||||
Chemed Corp | 1.0 | 21,520 | 9,895 | |||||||||
Church & Dwight Co Inc | 1.0 | 123,087 | 10,752 | |||||||||
Cisco Systems Inc/Delaware | 1.1 | 221,897 | 11,474 | |||||||||
Clorox Co/The | 1.0 | 55,958 | 10,793 | |||||||||
Colgate-Palmolive Co | 1.2 | 151,468 | 11,940 | |||||||||
Costco Wholesale Corp | 1.4 | 39,816 | 14,034 | |||||||||
Dollar General Corp | 1.0 | 51,640 | 10,463 | |||||||||
F5 Networks Inc, Cl A * | 1.1 | 54,178 | 11,303 | |||||||||
General Mills Inc | 1.0 | 170,104 | 10,431 | |||||||||
Gilead Sciences Inc | 0.8 | 125,562 | 8,115 | |||||||||
Johnson & Johnson | 1.3 | 79,844 | 13,122 | |||||||||
Juniper Networks Inc | 0.9 | 366,962 | 9,295 | |||||||||
Kellogg Co | 0.8 | 128,137 | 8,111 | |||||||||
Kimberly-Clark Corp | 1.2 | 91,092 | 12,666 | |||||||||
Kroger Co/The | 1.1 | 317,561 | 11,429 | |||||||||
Merck & Co Inc | 0.9 | 115,941 | 8,938 | |||||||||
Mettler-Toledo International Inc * | 0.8 | 6,967 | 8,052 | |||||||||
Microsoft Corp | 0.9 | 39,057 | 9,209 | |||||||||
Oracle Corp, Cl B | 1.1 | 167,429 | 11,749 | |||||||||
Procter & Gamble Co/The | 0.8 | 61,172 | 8,285 | |||||||||
Reliance Steel & Aluminum Co | 0.9 | 57,596 | 8,771 | |||||||||
Royal Gold Inc, Cl A | 0.8 | 73,041 | 7,861 | |||||||||
Target Corp, Cl A | 1.2 | 61,414 | 12,164 | |||||||||
United Therapeutics Corp * | 0.8 | 48,976 | 8,192 | |||||||||
Verizon Communications Inc | 1.2 | 215,541 | 12,534 | |||||||||
Walmart Inc | 1.2 | 90,846 | 12,340 | |||||||||
| Description | Percentage of Net Assets (%) | Shares | Market Value ($ Thousands) | |||||||||
COMMON STOCK (continued) |
| |||||||||||
United States (continued) |
| |||||||||||
Waters Corp * | 1.0 | % | 35,833 | $ | 10,183 | |||||||
Other | 27.2 | 284,427 | ||||||||||
| 633,183 | ||||||||||||
Total Common Stock |
| 1,010,858 | ||||||||||
PREFERRED STOCK — 0.8% |
| |||||||||||
Germany — 0.8% |
| |||||||||||
Henkel AG & Co KGaA (B) | 0.8 | 73,963 | 8,333 | |||||||||
Total Preferred Stock |
| 8,333 | ||||||||||
AFFILIATED PARTNERSHIP — 1.6% |
| |||||||||||
SEI Liquidity Fund, L.P. | ||||||||||||
0.020% **†(C) | 1.6 | 16,384,413 | 16,389 | |||||||||
Total Affiliated Partnership |
| 16,389 | ||||||||||
CASH EQUIVALENT — 0.4% |
| |||||||||||
SEI Daily Income Trust, Government Fund, Cl F | ||||||||||||
0.010% **† | 0.4 | 3,749,889 | 3,750 | |||||||||
Total Cash Equivalent |
| 3,750 | ||||||||||
Total Investments in Securities — 100.5% |
| $ | 1,039,330 | |||||||||
SEI Institutional Managed Trust / Semi-Annual Report / March 31, 2021 | 35 |
SUMMARY SCHEDULE OF INVESTMENTS (Unaudited)
March 31, 2021
Global Managed Volatility Fund (Continued)
A list of the open futures contracts held by the Fund at March 31, 2021, is as follows:
| Type of Contract | Number of Contracts Long | Expiration Date | Notional Amount (Thousands) | Value (Thousands) | Unrealized (Thousands) | |||||||||||||||
Euro STOXX 50 | 6 | Jun-2021 | $ | 270 | $ | 272 | $ | 7 | ||||||||||||
FTSE 100 Index | 1 | Jun-2021 | 92 | 92 | – | |||||||||||||||
Hang Seng Index | 1 | May-2021 | 182 | 182 | 1 | |||||||||||||||
S&P 500 Index E-MINI^ | 10 | Jun-2021 | 1,963 | 1,984 | 20 | |||||||||||||||
SPI 200 Index | 1 | Jun-2021 | 129 | 129 | 1 | |||||||||||||||
TOPIX Index | 1 | Jun-2021 | 177 | 177 | 2 | |||||||||||||||
|
|
|
|
|
| |||||||||||||||
| $ | 2,813 | $ | 2,836 | $ | 31 | |||||||||||||||
|
|
|
|
|
| |||||||||||||||
A list of the open forward foreign currency contracts held by the Fund at March 31, 2021, is as follows:
| Counterparty | Settlement Date | Currency to Deliver (Thousands) | Currency to Receive (Thousands) | Unrealized Appreciation (Depreciation) (Thousands) | ||||||||||||||||||||
Brown Brothers Harriman | 04/13/21 | USD | 25 | SGD | 34 | $ | — | |||||||||||||||||
Brown Brothers Harriman | 04/13/21 | USD | 73 | SGD | 98 | — | ||||||||||||||||||
Brown Brothers Harriman | 04/13/21 | USD | 54 | DKK | 340 | — | ||||||||||||||||||
Brown Brothers Harriman | 04/13/21 | USD | 138 | DKK | 860 | (2 | ) | |||||||||||||||||
Brown Brothers Harriman | 04/13/21 | USD | 267 | SEK | 2,283 | (5 | ) | |||||||||||||||||
Brown Brothers Harriman | 04/13/21 | USD | 20 | AUD | 27 | — | ||||||||||||||||||
Brown Brothers Harriman | 04/13/21 | USD | 331 | AUD | 428 | (5 | ) | |||||||||||||||||
Brown Brothers Harriman | 04/13/21 | USD | 372 | HKD | 2,885 | (1 | ) | |||||||||||||||||
Brown Brothers Harriman | 04/13/21 | USD | 94 | GBP | 69 | — | ||||||||||||||||||
Brown Brothers Harriman | 04/13/21 | USD | 822 | GBP | 593 | (4 | ) | |||||||||||||||||
Brown Brothers Harriman | 04/13/21 | USD | 640 | NOK | 5,489 | 3 | ||||||||||||||||||
Brown Brothers Harriman | 04/13/21 | USD | 279 | NOK | 2,367 | (2 | ) | |||||||||||||||||
Brown Brothers Harriman | 04/13/21 | USD | 928 | EUR | 780 | (12 | ) | |||||||||||||||||
Brown Brothers Harriman | 04/13/21 | USD | 25 | NZD | 36 | — | ||||||||||||||||||
Brown Brothers Harriman | 04/13/21 | USD | 945 | NZD | 1,324 | (18 | ) | |||||||||||||||||
Brown Brothers Harriman | 04/13/21 | USD | 523 | CAD | 661 | 4 | ||||||||||||||||||
Brown Brothers Harriman | 04/13/21 | USD | 465 | CAD | 582 | (2 | ) | |||||||||||||||||
Brown Brothers Harriman | 04/13/21 | USD | 225 | CHF | 211 | — | ||||||||||||||||||
Brown Brothers Harriman | 04/13/21 | USD | 1,047 | CHF | 972 | (13 | ) | |||||||||||||||||
Brown Brothers Harriman | 04/13/21 | USD | 1,428 | JPY | 155,613 | (19 | ) | |||||||||||||||||
Brown Brothers Harriman | 04/13/21 | SGD | 2,785 | USD | 2,093 | 21 | ||||||||||||||||||
Brown Brothers Harriman | 04/13/21 | SGD | 698 | USD | 519 | (1 | ) | |||||||||||||||||
Brown Brothers Harriman | 04/13/21 | NZD | 6,814 | USD | 4,955 | 183 | ||||||||||||||||||
Brown Brothers Harriman | 04/13/21 | NZD | 98 | USD | 69 | — | ||||||||||||||||||
Brown Brothers Harriman | 04/13/21 | GBP | 8,451 | USD | 11,790 | 131 | ||||||||||||||||||
Brown Brothers Harriman | 04/13/21 | GBP | 232 | USD | 319 | — | ||||||||||||||||||
Brown Brothers Harriman | 04/13/21 | AUD | 13,193 | USD | 10,290 | 241 | ||||||||||||||||||
Brown Brothers Harriman | 04/13/21 | CAD | 465 | USD | 371 | 2 | ||||||||||||||||||
Brown Brothers Harriman | 04/13/21 | CAD | 22,821 | USD | 18,076 | (83 | ) | |||||||||||||||||
Brown Brothers Harriman | 04/13/21 | CHF | 26,133 | USD | 28,540 | 763 | ||||||||||||||||||
Brown Brothers Harriman | 04/13/21 | CHF | 41 | USD | 43 | — | ||||||||||||||||||
Brown Brothers Harriman | 04/13/21 | EUR | 28,665 | USD | 34,552 | 855 | ||||||||||||||||||
Brown Brothers Harriman | 04/13/21 | EUR | 37 | USD | 44 | — | ||||||||||||||||||
Brown Brothers Harriman | 04/13/21 | DKK | 44,587 | USD | 7,222 | 174 | ||||||||||||||||||
Brown Brothers Harriman | 04/13/21 | DKK | 57 | USD | 9 | — | ||||||||||||||||||
36 | SEI Institutional Managed Trust / Semi-Annual Report / March 31, 2021 |
| Counterparty | Settlement Date | Currency to Deliver (Thousands) | Currency to Receive (Thousands) | Unrealized Appreciation (Depreciation) (Thousands) | ||||||||||||||||||||
Brown Brothers Harriman | 04/13/21 | NOK | 63,571 | USD | 7,482 | $ | 34 | |||||||||||||||||
Brown Brothers Harriman | 04/13/21 | NOK | 1,900 | USD | 222 | (1) | ||||||||||||||||||
Brown Brothers Harriman | 04/13/21 | HKD | 81,680 | USD | 10,526 | 20 | ||||||||||||||||||
Brown Brothers Harriman | 04/13/21 | SEK | 87,239 | USD | 10,362 | 351 | ||||||||||||||||||
Brown Brothers Harriman | 04/13/21 | SEK | 257 | USD | 29 | — | ||||||||||||||||||
Brown Brothers Harriman | 04/13/21 | JPY | 6,688,277 | USD | 62,560 | 2,021 | ||||||||||||||||||
|
| |||||||||||||||||||||||
| $ | 4,635 | |||||||||||||||||||||||
|
| |||||||||||||||||||||||
Percentages are based on a Net Assets of $1,034,108 ($ Thousands). |
| * | Non-income producing security. |
| ** | The rate reported is the 7-day effective yield as of March 31, 2021. |
| ‡ | Real Estate Investment Trust. |
| † | Investment in Affiliated Security (see Note 6). |
| (A) | Certain securities or partial positions of certain securities are on loan at March 31, 2021 (see Note 10). The total market value of securities on loan at March 31, 2021, was $16,081 ($ Thousands). |
| (B) | There is currently no rate available. |
| (C) | This security was purchased with cash collateral held from securities on loan (see Note 10). The total market value of such securities as of March 31, 2021 was $16,389 ($ Thousands). |
AUD — Australian Dollar
CAD — Canadian Dollar
CHF — Swiss Franc
Cl — Class
DKK — Danish Krone
EUR — Euro
FTSE— Financial Times Stock Exchange
GBP — British Pound Sterling
HKD — Hong Kong Dollar
JPY — Japanese Yen
L.P. — Limited Partnership
Ltd. — Limited
NOK — Norwegian Krone
NZD — New Zealand Dollar
S&P— Standard & Poor’s
SGD — Singapore Dollar
SEK — Swedish Krona
SPI — Share Price Index
TOPIX- Tokyo Price Index
USD — U.S. Dollar
The Summary Schedule of Investments does not reflect the complete portfolio holdings. It includes the Fund’s 50 largest holdings and each investment of any issuer that exceeds 1% of the Fund’s net assets. “Other Securities” represent all issues not required to be disclosed under the rules adopted by the U.S. Securities and Exchange Commission (“SEC”). In certain instances, securities for which footnotes listed above may otherwise apply are included in the Other Securities caption. The complete schedule of portfolio holdings is available (i) without charge, upon request, by calling (800) 342-5734; and (ii) on the SEC’s website at http://www.sec.gov.
The following is a list of the level of inputs used as of March 31, 2021, in valuing the Fund’s investments and other financial instruments carried at value ($ Thousands):
| Investments in Securities | Level 1 ($) | Level 2 ($) | Level 3 ($) | Total ($) | ||||||||||||
Common Stock | 1,010,623 | 235 | – | 1,010,858 | ||||||||||||
Preferred Stock | 8,333 | – | – | 8,333 | ||||||||||||
Affiliated Partnership | – | 16,389 | – | 16,389 | ||||||||||||
Cash Equivalent | 3,750 | – | – | 3,750 | ||||||||||||
|
|
|
|
|
|
|
| |||||||||
Total Investments in Securities | 1,022,706 | 16,624 | – | 1,039,330 | ||||||||||||
|
|
|
|
|
|
|
| |||||||||
| Other Financial Instruments | Level 1 ($) | Level 2 ($) | Level 3 ($) | Total ($) | ||||||||||||
Futures Contracts* | ||||||||||||||||
Unrealized Appreciation | 31 | – | – | 31 | ||||||||||||
Forwards Contracts* | ||||||||||||||||
Unrealized Appreciation | – | 4,802 | – | 4,802 | ||||||||||||
Unrealized Depreciation | – | (167) | – | (167) | ||||||||||||
|
|
|
|
|
|
|
| |||||||||
Total Other Financial Instruments | 31 | 4,635 | – | 4,666 | ||||||||||||
|
|
|
|
|
|
|
| |||||||||
* Futures contracts and forwards contracts are valued at unrealized appreciation (depreciation) on the instrument.
For the period ended March 31, 2021, there were no transfers in or out of Level 3.
For more information on valuation inputs, see Note 2 — Significant Accounting Policies in Notes to Financial Statements.
SEI Institutional Managed Trust / Semi-Annual Report / March 31, 2021 | 37 |
SUMMARY SCHEDULE OF INVESTMENTS (Unaudited)
March 31, 2021
Global Managed Volatility Fund (Concluded)
The following is a summary of the Fund’s transactions with affiliates for the period ended March 31, 2021 ($ Thousands):
| Security Description | Value 9/30/2020 | Purchases at Cost | Proceeds from Sales | Realized Gain/ (Loss) | Change in Unrealized Appreciation/ (Depreciation) | Value 3/31/2021 | Shares | Income | Capital Gains | |||||||||
SEI Liquidity Fund, L.P. | $11,893 | $ 40,490 | $(35,993) | $(2) | $1 | $16,389 | 16,384,413 | $27 | $ — | |||||||||
SEI Daily Income Trust, Government Fund, Cl F | 15,236 | 92,339 | (103,825) | — | — | 3,750 | 3,749,889 | — | — | |||||||||
|
|
|
|
|
|
|
| |||||||||||
Totals | $27,129 | $132,829 | $(139,818) | $(2) | $1 | $20,139 | $27 | $ — | ||||||||||
|
|
|
|
|
|
|
|
Amounts designated as “—” are either $0 or have been rounded to $0.
The accompanying notes are an integral part of the financial statements.
38 | SEI Institutional Managed Trust / Semi-Annual Report / March 31, 2021 |
SUMMARY SCHEDULE OF INVESTMENTS (Unaudited)
March 31, 2021
Tax-Managed Managed Volatility Fund
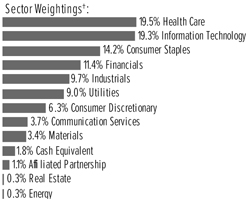
†Percentages are based on total investments. Includes investments held as collateral for securities held on loan (see Note 10).
| Description | Percentage of Net Assets (%) | Shares | Market Value ($ Thousands) | |||||||||
COMMON STOCK — 98.1% |
| |||||||||||
Communication Services — 3.7% |
| |||||||||||
Other Securities | 3.7 | % | $ | 36,761 | ||||||||
Consumer Discretionary — 6.4% |
| |||||||||||
AutoZone Inc * | 1.4 | 10,000 | 14,043 | |||||||||
eBay Inc | 0.9 | 140,400 | 8,598 | |||||||||
McDonald’s Corp | 0.6 | 26,822 | 6,012 | |||||||||
Target Corp, Cl A | 1.4 | 68,000 | 13,469 | |||||||||
Other Securities (A) | 2.1 | 20,266 | ||||||||||
| 62,388 | ||||||||||||
Consumer Staples — 14.3% |
| |||||||||||
Altria Group Inc | 0.8 | 145,146 | 7,426 | |||||||||
Costco Wholesale Corp | 0.8 | 21,538 | 7,592 | |||||||||
Kroger Co/The | 1.6 | 432,009 | 15,548 | |||||||||
McCormick & Co Inc/MD | 0.7 | 79,237 | 7,065 | |||||||||
PepsiCo Inc | 0.8 | 56,305 | 7,964 | |||||||||
Tyson Foods Inc, Cl A | 1.4 | 183,000 | 13,597 | |||||||||
Walmart Inc | 3.1 | 224,473 | 30,490 | |||||||||
Other Securities | 5.1 | 50,698 | ||||||||||
| 140,380 | ||||||||||||
Energy — 0.3% |
| |||||||||||
Other Securities | 0.3 | 2,665 | ||||||||||
Financials — 11.5% |
| |||||||||||
Allstate Corp/The | 0.8 | 65,446 | 7,520 | |||||||||
Berkshire Hathaway Inc, Cl B * | 1.7 | 64,800 | 16,555 | |||||||||
Everest Re Group Ltd | 1.0 | 39,096 | 9,689 | |||||||||
Progressive Corp/The | 1.1 | 115,800 | 11,072 | |||||||||
Travelers Cos Inc/The | 1.3 | 83,472 | 12,554 | |||||||||
Other Securities | 5.6 | 55,887 | ||||||||||
| 113,277 | ||||||||||||
Health Care — 19.7% |
| |||||||||||
Anthem Inc | 1.6 | 44,047 | 15,811 | |||||||||
Bristol-Myers Squibb Co | 0.9 | 140,025 | 8,840 | |||||||||
Eli Lilly and Co | 1.8 | 95,629 | 17,865 | |||||||||
Humana Inc | 1.3 | 30,097 | 12,618 | |||||||||
| Description | Percentage of Net Assets (%) | Shares | Market Value ($ Thousands) | |||||||||
COMMON STOCK (continued) |
| |||||||||||
Johnson & Johnson | 2.8 | % | 168,900 | $ | 27,759 | |||||||
Merck & Co Inc | 1.9 | 247,609 | 19,088 | |||||||||
Pfizer Inc | 2.2 | 597,905 | 21,662 | |||||||||
Quest Diagnostics Inc | 0.7 | 50,752 | 6,514 | |||||||||
UnitedHealth Group Inc | 1.4 | 35,650 | 13,264 | |||||||||
Other Securities (A) | 5.1 | 49,298 | ||||||||||
| 192,719 | ||||||||||||
Industrials — 9.8% |
| |||||||||||
Cummins Inc | 0.6 | 23,200 | 6,011 | |||||||||
Lockheed Martin Corp | 0.9 | 23,421 | 8,654 | |||||||||
Northrop Grumman Corp | 1.2 | 37,681 | 12,195 | |||||||||
Raytheon Technologies Corp | 1.1 | 135,100 | 10,439 | |||||||||
Republic Services Inc | 1.5 | 146,100 | 14,515 | |||||||||
Waste Management Inc | 1.6 | 124,467 | 16,059 | |||||||||
Other Securities | 2.9 | 28,233 | ||||||||||
| 96,106 | ||||||||||||
Information Technology — 19.5% |
| |||||||||||
Amdocs Ltd | 1.6 | 227,100 | 15,931 | |||||||||
Apple Inc | 3.8 | 303,048 | 37,018 | |||||||||
Cisco Systems Inc/Delaware | 1.6 | 306,400 | 15,844 | |||||||||
Citrix Systems Inc | 0.9 | 61,962 | 8,697 | |||||||||
Intel Corp | 2.0 | 307,300 | 19,667 | |||||||||
Microsoft Corp | 2.1 | 85,745 | 20,216 | |||||||||
Motorola Solutions Inc | 1.7 | 87,963 | 16,541 | |||||||||
Oracle Corp, Cl B | 1.3 | 176,000 | 12,350 | |||||||||
Synopsys Inc * | 1.0 | 41,600 | 10,308 | |||||||||
Other Securities | 3.5 | 34,373 | ||||||||||
| 190,945 | ||||||||||||
Materials — 3.5% |
| |||||||||||
Sealed Air Corp | 0.6 | 136,300 | 6,245 | |||||||||
Sonoco Products Co | 0.6 | 98,300 | 6,223 | |||||||||
Other Securities | 2.3 | 21,799 | ||||||||||
| 34,267 | ||||||||||||
Real Estate — 0.3% |
| |||||||||||
Other Securities ‡ | 0.3 | 3,037 | ||||||||||
Utilities — 9.1% |
| |||||||||||
Ameren Corp | 0.6 | 74,283 | 6,044 | |||||||||
American Electric Power Co Inc | 0.7 | 76,728 | 6,499 | |||||||||
Entergy Corp | 1.2 | 119,200 | 11,857 | |||||||||
Eversource Energy | 0.7 | 83,105 | 7,196 | |||||||||
Exelon Corp | 0.7 | 158,000 | 6,911 | |||||||||
NextEra Energy Inc | 0.9 | 116,564 | 8,813 | |||||||||
Public Service Enterprise Group Inc | 1.1 | 183,544 | 11,051 | |||||||||
WEC Energy Group Inc | 0.8 | 77,148 | 7,220 | |||||||||
Other Securities | 2.4 | 23,351 | ||||||||||
| 88,942 | ||||||||||||
Total Common Stock | 961,487 | |||||||||||
SEI Institutional Managed Trust / Semi-Annual Report / March 31, 2021 | 39 |
SUMMARY SCHEDULE OF INVESTMENTS (Unaudited)
March 31, 2021
Tax-Managed Managed Volatility Fund (Concluded)
| Description | Percentage of Net Assets (%) | Shares | Market Value ($ Thousands) | |||||||
AFFILIATED PARTNERSHIP — 1.1% |
| |||||||||
SEI Liquidity Fund, L.P. | ||||||||||
0.020% **†(B) | 1.1% | 10,518,498 | $ | 10,521 | ||||||
Total Affiliated Partnership |
| 10,521 | ||||||||
CASH EQUIVALENT — 1.8% |
| |||||||||
SEI Daily Income Trust, Government Fund, Cl F | ||||||||||
0.010% **† | 1.8 | 18,130,278 | 18,130 | |||||||
Total Cash Equivalent |
| 18,130 | ||||||||
Total Investments in Securities — 101.0% |
| $ | 990,138 | |||||||
A list of the open futures contracts held by the Fund at March 31, 2021, is as follows:
Type of Contract | Number of Contracts Long | Expiration Date | Notional Amount (Thousands) | Value (Thousands) | Unrealized Appreciation (Thousands) | |||||||||||||||
S&P 500 Index E-MINI | 50 | Jun-2021 | $ | 9,913 | $ | 9,919 | $ | 6 | ||||||||||||
| $ | 9,913 | $ | 9,919 | $ | 6 | |||||||||||||||
Percentages are based on a Net Assets of $980,316 ($ Thousands). |
| * | Non-income producing security. |
| ** | The rate reported is the 7-day effective yield as of March 31, 2021. |
| ‡ | Real Estate Investment Trust. |
| † | Investment in Affiliated Security (see Note 6). |
| (A) | Certain securities or partial positions of certain securities are on loan at March 31, 2021 (see Note 10). The total market value of securities on loan at March 31, 2021, was $10,374 ($ Thousands). |
| (B) | This security was purchased with cash collateral held from securities on loan (see Note 10). The total market value of such securities as of March 31, 2021 was $10,521 ($ Thousands). |
Cl — Class
L.P. — Limited Partnership
Ltd. — Limited
S&P— Standard & Poor’s
The Summary Schedule of Investments does not reflect the complete portfolio holdings. It includes the Fund’s 50 largest holdings and each investment of any issuer that exceeds 1% of the Fund’s net assets. “Other Securities” represent all issues not required to be disclosed under the rules adopted by the U.S. Securities and Exchange Commission (“SEC”). In certain instances, securities for which footnotes listed above may otherwise apply are included in the Other Securities caption. The complete schedule of portfolio holdings is available (i) without charge, upon request, by calling (800) 342-5734; and (ii) on the SEC’s website at http://www.sec.gov.
The following is a list of the level of inputs used as of March 31, 2021, in valuing the Fund’s investments and other financial instruments carried at value ($ Thousands):
| Investments in Securities | Level 1 ($) | Level 2 ($) | Level 3 ($) | Total ($) | ||||||||||||
Common Stock | 961,487 | – | – | 961,487 | ||||||||||||
Affiliated Partnership | – | 10,521 | – | 10,521 | ||||||||||||
Cash Equivalent | 18,130 | – | – | 18,130 | ||||||||||||
|
|
|
|
|
|
|
| |||||||||
Total Investments in Securities | 979,617 | 10,521 | – | 990,138 | ||||||||||||
|
|
|
|
|
|
|
| |||||||||
| Other Financial Instruments | Level 1 ($) | Level 2 ($) | Level 3 ($) | Total ($) | ||||||||||||
Futures Contracts* | ||||||||||||||||
Unrealized Appreciation | 6 | – | – | 6 | ||||||||||||
|
|
|
|
|
|
|
| |||||||||
Total Other Financial Instruments | 6 | – | – | 6 | ||||||||||||
|
|
|
|
|
|
|
| |||||||||
| * | Futures contracts are valued at unrealized appreciation on the instrument. |
For the period ended March 31, 2021, there were no transfers in or out of Level 3.
For more information on valuation inputs, see Note 2 — Significant Accounting Policies in Notes to Financial Statements.
40 | SEI Institutional Managed Trust / Semi-Annual Report / March 31, 2021 |
The following is a summary of the Fund’s transactions with affiliates for the period ended March 31, 2021 ($ Thousands):
| Security Description | Value 9/30/2020 | Purchases at Cost | Proceeds from Sales | Realized Gain/ (Loss) | Change in Unrealized Appreciation/ (Depreciation) | Value 3/31/2021 | Shares | Income | Capital Gains | ||||||||||||||||||||||||||||||||||||
SEI Liquidity Fund, L.P. | $3,411 | $16,662 | $(9,552) | $— | $— | $10,521 | 10,518,498 | $2 | $— | ||||||||||||||||||||||||||||||||||||
SEI Daily Income Trust, Government Fund, Cl F | 14,794 | 115,926 | (112,590) | — | — | 18,130 | 18,130,278 | 1 | — | ||||||||||||||||||||||||||||||||||||
|
|
|
|
|
|
|
|
|
|
|
|
|
|
|
| ||||||||||||||||||||||||||||||
Totals | $18,205 | $132,588 | $(122,142) | $— | $— | $28,651 | $3 | $— | |||||||||||||||||||||||||||||||||||||
|
|
|
|
|
|
|
|
|
|
|
|
|
|
|
| ||||||||||||||||||||||||||||||
Amounts designated as “—” are either $0 or have been rounded to $0.
The accompanying notes are an integral part of the financial statements.
SEI Institutional Managed Trust / Semi-Annual Report / March 31, 2021 | 41 |
SUMMARY SCHEDULE OF INVESTMENTS (Unaudited)
March 31, 2021
Tax-Managed International Managed Volatility Fund
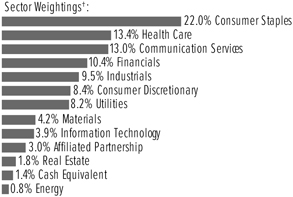
†Percentages are based on total investments. Includes investments held as collateral for securities held on loan (see Note 10).
| Description | Percentage of Net Assets (%) | Shares | Market Value ($ Thousands) | |||||||||
COMMON STOCK — 96.3% |
| |||||||||||
Australia — 4.2% | ||||||||||||
Other Securities ‡ | 4.2 | % | $ | 16,319 | ||||||||
Austria — 1.0% | ||||||||||||
Other Securities (A) | 1.0 | 4,086 | ||||||||||
Belgium — 1.6% | ||||||||||||
Etablissements Franz Colruyt | 1.0 | 62,755 | 3,751 | |||||||||
Other Securities | 0.6 | 2,567 | ||||||||||
| 6,318 | ||||||||||||
Canada — 2.3% | ||||||||||||
Canadian Tire Corp Ltd, Cl A | 0.6 | 16,691 | 2,368 | |||||||||
Other Securities (A) | 1.7 | 6,555 | ||||||||||
| 8,923 | ||||||||||||
Denmark — 2.4% | ||||||||||||
Other Securities | 2.4 | 9,508 | ||||||||||
Finland — 1.4% | ||||||||||||
Kesko Oyj, Cl B | 0.5 | 61,076 | 1,872 | |||||||||
Other Securities | 0.9 | 3,397 | ||||||||||
| 5,269 | ||||||||||||
France — 8.3% | ||||||||||||
Carrefour SA | 1.0 | 215,049 | 3,904 | |||||||||
Cie Generale des Etablissements | ||||||||||||
Michelin SCA | 0.7 | 17,959 | 2,694 | |||||||||
Orange SA | 1.2 | 385,969 | 4,765 | |||||||||
Sanofi | 1.7 | 66,653 | 6,600 | |||||||||
Other Securities | 3.7 | 14,196 | ||||||||||
| 32,159 | ||||||||||||
Germany — 5.9% | ||||||||||||
Deutsche Post AG | 0.6 | 39,181 | 2,152 | |||||||||
Deutsche Telekom AG | 1.0 | 184,690 | 3,727 | |||||||||
| Description | Percentage of Net Assets (%) | Shares | Market Value ($ Thousands) | |||||||||
COMMON STOCK (continued) |
| |||||||||||
Germany (continued) |
| |||||||||||
Henkel AG & Co KGaA | 0.2 | % | 8,576 | $ | 851 | |||||||
Merck KGaA | 1.1 | 24,835 | 4,256 | |||||||||
Uniper SE | 0.5 | 52,457 | 1,904 | |||||||||
Other Securities | 2.5 | 9,883 | ||||||||||
| 22,773 | ||||||||||||
Hong Kong — 4.4% |
| |||||||||||
CLP Holdings Ltd, Cl B | 0.6 | 240,500 | 2,336 | |||||||||
HKT Trust & HKT Ltd | 0.5 | 1,455,000 | 2,074 | |||||||||
VTech Holdings Ltd | 0.7 | 289,200 | 2,604 | |||||||||
Other Securities | 2.6 | 9,929 | ||||||||||
| 16,943 | ||||||||||||
Ireland — 0.3% | ||||||||||||
Other Securities | 0.3 | 1,303 | ||||||||||
Israel — 0.6% | ||||||||||||
Other Securities | 0.6 | 2,217 | ||||||||||
Italy — 2.1% | ||||||||||||
Enel SpA | 0.5 | 205,432 | 2,051 | |||||||||
Other Securities (A) | 1.6 | 6,179 | ||||||||||
| 8,230 | ||||||||||||
Japan — 27.4% | ||||||||||||
Astellas Pharma Inc | 0.5 | 135,200 | 2,082 | |||||||||
Canon Inc | 0.6 | 99,700 | 2,258 | |||||||||
Chugai Pharmaceutical Co Ltd | 0.0 | 2,600 | 106 | |||||||||
FUJIFILM Holdings Corp | 0.6 | 36,000 | 2,141 | |||||||||
ITOCHU Corp (A) | 1.0 | 124,300 | 4,035 | |||||||||
Itochu Enex Co Ltd | 0.2 | 68,900 | 681 | |||||||||
Japan Post Holdings Co Ltd | 0.5 | 220,100 | 1,965 | |||||||||
Kamigumi Co Ltd | 0.6 | 124,600 | 2,365 | |||||||||
KDDI Corp | 1.3 | 169,900 | 5,220 | |||||||||
Lawson Inc | 0.2 | 11,900 | 585 | |||||||||
Mitsubishi Shokuhin Co Ltd | 0.3 | 37,300 | 1,045 | |||||||||
Mizuho Financial Group Inc | 0.6 | 146,980 | 2,127 | |||||||||
Nippon Telegraph & Telephone Corp | 1.6 | 235,200 | 6,049 | |||||||||
Nitto Fuji Flour Milling Co Ltd | 0.1 | 4,000 | 276 | |||||||||
Okinawa Cellular Telephone Co | 0.0 | 3,100 | 143 | |||||||||
Seven & i Holdings Co Ltd | 0.6 | 59,100 | 2,387 | |||||||||
Softbank Corp | 0.5 | 162,500 | 2,115 | |||||||||
Teijin Ltd | 0.5 | 106,200 | 1,833 | |||||||||
Toyota Motor Corp | 0.6 | 29,000 | 2,261 | |||||||||
Other Securities ‡(A) | 17.1 | 66,788 | ||||||||||
| 106,462 | ||||||||||||
Netherlands — 2.9% |
| |||||||||||
Koninklijke Ahold Delhaize NV | 1.4 | 203,347 | 5,676 | |||||||||
42 | SEI Institutional Managed Trust / Semi-Annual Report / March 31, 2021 |
| Description | Percentage of Net Assets (%) | Shares | Market Value ($ Thousands) | |||||||||
COMMON STOCK (continued) |
| |||||||||||
Netherlands (continued) |
| |||||||||||
NN Group NV | 0.8 | % | 57,352 | $ | 2,810 | |||||||
Other Securities | 0.7 | 2,627 | ||||||||||
| 11,113 | ||||||||||||
New Zealand — 0.9% |
| |||||||||||
Other Securities ‡ | 0.9 | 3,579 | ||||||||||
Norway — 1.0% | ||||||||||||
Other Securities | 1.0 | 4,044 | ||||||||||
Portugal — 0.6% | ||||||||||||
Other Securities | 0.6 | 2,225 | ||||||||||
Singapore — 2.6% | ||||||||||||
DBS Group Holdings Ltd | 0.7 | 125,500 | 2,689 | |||||||||
Other Securities ‡ | 1.9 | 7,502 | ||||||||||
| 10,191 | ||||||||||||
Spain — 3.1% | ||||||||||||
Cia de Distribucion Integral Logista | ||||||||||||
Holdings | 0.4 | 81,284 | 1,614 | |||||||||
Endesa SA | 0.9 | 126,770 | 3,361 | |||||||||
Iberdrola SA | 0.9 | 274,135 | 3,539 | |||||||||
Other Securities | 0.9 | 3,439 | ||||||||||
| 11,953 | ||||||||||||
Sweden — 2.6% | ||||||||||||
ICA Gruppen AB | 0.7 | 52,686 | 2,581 | |||||||||
Other Securities (A) | 1.9 | 7,511 | ||||||||||
| 10,092 | ||||||||||||
Switzerland — 8.0% |
| |||||||||||
Berner Kantonalbank AG | 0.0 | 473 | 107 | |||||||||
BKW AG | 0.6 | 22,015 | 2,405 | |||||||||
Novartis AG | 0.7 | 32,351 | 2,776 | |||||||||
Roche Holding AG | 2.1 | 25,339 | 8,224 | |||||||||
Swiss Life Holding AG | 0.6 | 4,709 | 2,325 | |||||||||
Swisscom AG | 0.9 | 6,006 | 3,236 | |||||||||
Other Securities | 3.1 | 11,916 | ||||||||||
| 30,989 | ||||||||||||
United Kingdom — 11.8% |
| |||||||||||
BAE Systems PLC | 0.6 | 342,600 | 2,387 | |||||||||
British American Tobacco PLC | 0.5 | 52,707 | 2,017 | |||||||||
GlaxoSmithKline PLC | 1.2 | 256,871 | 4,565 | |||||||||
Imperial Brands PLC | 0.7 | 127,933 | 2,633 | |||||||||
J Sainsbury PLC | 0.5 | 596,752 | 1,997 | |||||||||
Kingfisher PLC | 0.7 | 610,073 | 2,679 | |||||||||
Tate & Lyle PLC | 0.9 | 333,398 | 3,529 | |||||||||
Tesco | 0.6 | 710,347 | 2,243 | |||||||||
| Description | Percentage of Net Assets (%) | Shares | Market Value ($ Thousands) | |||||||||
COMMON STOCK (continued) |
| |||||||||||
United Kingdom (continued) |
| |||||||||||
Wm Morrison Supermarkets PLC | 0.5 | % | 792,496 | $ | 1,995 | |||||||
Other Securities ‡ | 5.6 | 21,748 | ||||||||||
| 45,793 | ||||||||||||
United States — 0.9% |
| |||||||||||
Other Securities | 0.9 | 3,481 | ||||||||||
Total Common Stock |
| 373,970 | ||||||||||
PREFERRED STOCK — 0.7% |
| |||||||||||
Germany — 0.7% |
| |||||||||||
Henkel AG & Co KGaA (B) | 0.5 | 17,310 | 1,950 | |||||||||
Other Securities (B) | 0.2 | 920 | ||||||||||
Total Preferred Stock |
| 2,870 | ||||||||||
AFFILIATED PARTNERSHIP — 3.1% |
| |||||||||||
SEI Liquidity Fund, L.P. | ||||||||||||
0.020% **†(C) | 3.1 | 11,864,892 | 11,868 | |||||||||
Total Affiliated Partnership |
| 11,868 | ||||||||||
CASH EQUIVALENT — 1.5% |
| |||||||||||
SEI Daily Income Trust, | ||||||||||||
0.010% **† | 1.5 | 5,660,617 | 5,661 | |||||||||
Total Cash Equivalent |
| 5,661 | ||||||||||
Total Investments in Securities — 101.6% |
| $ | 394,369 | |||||||||
SEI Institutional Managed Trust / Semi-Annual Report / March 31, 2021 | 43 |
SUMMARY SCHEDULE OF INVESTMENTS (Unaudited)
March 31, 2021
Tax-Managed International Managed Volatility Fund (Concluded)
A list of the open futures contracts held by the Fund at March 31, 2021, is as follows:
| Type of Contract | Number of Contracts Long | Expiration Date | Notional Amount (Thousands) | Value (Thousands) | Unrealized Appreciation (Thousands) | |||||||||||||||
Euro STOXX 50 | 36 | Jun-2021 | $ | 1,621 | $ | 1,636 | $ | 36 | ||||||||||||
FTSE 100 Index | 5 | Jun-2021 | 463 | 461 | – | |||||||||||||||
Hang Seng Index | 3 | May-2021 | 545 | 546 | 2 | |||||||||||||||
SPI 200 Index | 3 | Jun-2021 | 388 | 386 | 3 | |||||||||||||||
TOPIX Index | 6 | Jun-2021 | 1,073 | 1,061 | 4 | |||||||||||||||
|
|
|
|
|
|
|
|
| ||||||||||||
| $ | 4,090 | $ | 4,090 | $ | 45 | |||||||||||||||
|
|
|
|
|
|
|
|
| ||||||||||||
Percentages are based on a Net Assets of $388,342 ($ Thousands). |
| ** | The rate reported is the 7-day effective yield as of March 31, 2021. |
| ‡ | Real Estate Investment Trust. |
| † | Investment in Affiliated Security (see Note 6). |
| (A) | Certain securities or partial positions of certain securities are on loan at March 31, 2021 (see Note 10). The total market value of securities on loan at March 31, 2021, was $11,208 ($ Thousands). |
| (B) | There is currently no rate available. |
| (C) | This security was purchased with cash collateral held from securities on loan (see Note 10). The total market value of such securities as of March 31, 2021 was $11,868 ($ Thousands). |
Cl — Class
FTSE— Financial Times and Stock Exchange
L.P. — Limited Partnership
PLC — Public Limited Company
SPI — Share Price Index
TOPIX — Tokyo Price Index
The Summary Schedule of Investments does not reflect the complete portfolio holdings. It includes the Fund’s 50 largest holdings and each investment of any issuer that exceeds 1% of the Fund’s net assets. “Other Securities” represent all issues not required to be disclosed under the rules adopted by the U.S. Securities and Exchange Commission (“SEC”). In certain instances, securities for which footnotes listed above may otherwise apply are included in the Other Securities caption. The complete schedule of portfolio holdings is available (i) without charge, upon request, by calling (800) 342-5734; and (ii) on the SEC’s website at http://www.sec.gov.
The following is a list of the level of inputs used as of March 31, 2021, in valuing the Fund’s investments and other financial instruments carried at value ($ Thousands):
| Investments in Securities | Level 1 ($) | Level 2 ($) | Level 3 ($) | Total ($) | ||||||||||||
Common Stock | 373,970 | — | — | 373,970 | ||||||||||||
Preferred Stock | 2,870 | — | — | 2,870 | ||||||||||||
Affiliated Partnership | — | 11,868 | — | 11,868 | ||||||||||||
Cash Equivalent | 5,661 | — | — | 5,661 | ||||||||||||
|
|
|
|
|
|
|
| |||||||||
Total Investments in Securities | 382,501 | 11,868 | — | 394,369 | ||||||||||||
|
|
|
|
|
|
|
| |||||||||
| Other Financial Instruments | Level 1 ($) | Level 2 ($) | Level 3 ($) | Total ($) | ||||||||||||
Futures Contracts* | ||||||||||||||||
Unrealized Appreciation | 45 | – | – | 45 | ||||||||||||
|
|
|
|
|
|
|
| |||||||||
Total Other Financial Instruments | 45 | – | – | 45 | ||||||||||||
|
|
|
|
|
|
|
| |||||||||
* Futures contracts are valued at unrealized appreciation on the instrument.
For the period ended March 31, 2021, there were no transfers in to or out of Level 3.
For more information on valuation inputs, see Note 2 — Significant Accounting Policies in Notes to Financial Statements.
The following is a summary of the Fund’s transactions with affiliates for the period ended March 31, 2021 ($ Thousands):
| Security Description | Value 9/30/2020 | Purchases at Cost | Proceeds from Sales | Realized Gain/ (Loss) | Change in Unrealized Appreciation/ (Depreciation) | Value 3/31/2021 | Shares | Income | Capital Gains | |||||||||
SEI Liquidity Fund, L.P. | $8,302 | $35,716 | $(32,151) | $(1) | $2 | $11,868 | 11,864,892 | $43 | $— | |||||||||
SEI Daily Income Trust, Government Fund, Cl F | 2,764 | 22,387 | (19,490) | — | — | 5,661 | 5,660,617 | — | — | |||||||||
|
|
|
|
|
|
|
| |||||||||||
Totals | $11,066 | $58,103 | $(51,641) | $(1) | $2 | $17,529 | $43 | $— | ||||||||||
|
|
|
|
|
|
|
|
Amounts designated as “—” are either $0 or have been rounded to $0.
The accompanying notes are an integral part of the financial statements.
44 | SEI Institutional Managed Trust / Semi-Annual Report / March 31, 2021 |
SUMMARY SCHEDULE OF INVESTMENTS (Unaudited)
March 31, 2021
Real Estate Fund
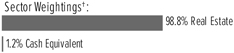
†Percentages are based on total investments.
| Description | Percentage of Net Assets (%) | Shares | Market Value ($ Thousands) | |||||||||
COMMON STOCK — 97.5% |
| |||||||||||
Real Estate — 97.5% |
| |||||||||||
Acadia Realty Trust ‡ | 1.1 | % | 59,660 | $ | 1,132 | |||||||
American Assets Trust Inc ‡ | 1.2 | 38,131 | 1,237 | |||||||||
American Campus Communities Inc ‡ | 2.8 | 65,733 | 2,838 | |||||||||
American Tower Corp, Cl A ‡ | 3.5 | 14,490 | 3,464 | |||||||||
Americold Realty Trust ‡ | 0.6 | 14,840 | 571 | |||||||||
Apple Hospitality Inc ‡ | 0.6 | 38,651 | 563 | |||||||||
AvalonBay Communities Inc ‡ | 3.9 | 21,588 | 3,983 | |||||||||
Brixmor Property Group Inc ‡ | 1.8 | 92,940 | 1,880 | |||||||||
Columbia Property Trust Inc ‡ | 0.9 | 54,641 | 934 | |||||||||
Cousins Properties Inc ‡ | 2.2 | 62,450 | 2,208 | |||||||||
CyrusOne Inc ‡ | 1.1 | 16,240 | 1,100 | |||||||||
Digital Realty Trust Inc, Cl A ‡ | 2.8 | 20,166 | 2,840 | |||||||||
Diversified Healthcare Trust ‡ | 0.3 | 68,660 | 328 | |||||||||
Douglas Emmett Inc ‡ | 1.4 | 46,859 | 1,471 | |||||||||
Duke Realty Corp ‡ | 2.3 | 55,750 | 2,338 | |||||||||
Empire State Realty Trust Inc, Cl A *‡ | 0.3 | 29,076 | 324 | |||||||||
Equinix Inc ‡ | 8.0 | 12,020 | 8,169 | |||||||||
Equity Residential ‡ | 2.8 | 40,530 | 2,903 | |||||||||
Essex Property Trust Inc ‡ | 2.9 | 10,956 | 2,978 | |||||||||
Extra Space Storage Inc ‡ | 2.4 | 18,100 | 2,399 | |||||||||
Federal Realty Investment Trust ‡ | 1.2 | 12,534 | 1,272 | |||||||||
First Industrial Realty Trust Inc ‡ | 1.8 | 39,010 | 1,786 | |||||||||
Healthpeak Properties Inc ‡ | 1.2 | 39,480 | 1,253 | |||||||||
Host Hotels & Resorts Inc *‡ | 2.6 | 155,683 | 2,623 | |||||||||
Invitation Homes Inc ‡ | 4.7 | 150,716 | 4,821 | |||||||||
JBG SMITH Properties ‡ | 1.6 | 52,124 | 1,657 | |||||||||
Kilroy Realty Corp ‡ | 1.3 | 20,420 | 1,340 | |||||||||
Life Storage Inc ‡ | 2.8 | 33,416 | 2,872 | |||||||||
Mid-America Apartment Communities Inc ‡ | 1.4 | 9,880 | 1,426 | |||||||||
Park Hotels & Resorts Inc *‡ | 0.1 | 8,680 | 187 | |||||||||
Prologis Inc ‡ | 8.2 | 79,070 | 8,381 | |||||||||
Public Storage ‡ | 2.0 | 8,149 | 2,011 | |||||||||
Regency Centers Corp ‡ | 1.6 | 28,970 | 1,643 | |||||||||
Retail Properties of America Inc, Cl A ‡ | 1.2 | 120,213 | 1,260 | |||||||||
Rexford Industrial Realty Inc ‡ | 1.1 | 21,210 | 1,069 | |||||||||
Ryman Hospitality Properties Inc *‡ | 1.0 | 13,530 | 1,049 | |||||||||
Sabra Health Care Inc ‡ | 1.2 | 72,213 | 1,254 | |||||||||
SBA Communications Corp, Cl A ‡ | 3.9 | 14,310 | 3,972 | |||||||||
Simon Property Group Inc ‡ | 1.9 | 16,760 | 1,907 | |||||||||
| Description | Percentage of Net Assets (%) | Shares | Market Value ($ Thousands) | |||||||||
COMMON STOCK (continued) |
| |||||||||||
SL Green Realty ‡ | 0.3 | % | 4,513 | $ | 316 | |||||||
Sun Communities Inc ‡ | 2.6 | 17,350 | 2,603 | |||||||||
UDR Inc ‡ | 2.4 | 55,838 | 2,449 | |||||||||
Ventas Inc ‡ | 1.9 | 35,351 | 1,886 | |||||||||
VEREIT Inc ‡ | 0.7 | 18,610 | 719 | |||||||||
Weingarten Realty | 0.5 | 18,966 | 510 | |||||||||
Welltower Inc ‡ | 5.4 | 76,509 | 5,480 | |||||||||
Total Common Stock |
| 99,406 | ||||||||||
CASH EQUIVALENT — 1.1% |
| |||||||||||
SEI Daily Income Trust, Government Fund, Cl F |
| |||||||||||
0.010% **† | 1.1 | 1,180,220 | 1,180 | |||||||||
Total Cash Equivalent |
| 1,180 | ||||||||||
|
| |||||||||||
Total Investments in Securities — 98.6% |
| $ | 100,586 | |||||||||
Percentages are based on a Net Assets of $101,980 ($ Thousands). |
| * | Non-income producing security. |
| ** | The rate reported is the 7-day effective yield as of March 31, 2021. |
| ‡ | Real Estate Investment Trust. |
| † | Investment in Affiliated Security (see Note 6). |
Cl — Class
As of March 31, 2021, all of the Fund’s investments were considered Level 1, in accordance with the authoritative guidance on fair value measurements and disclosure under U.S. GAAP.
For the period ended March 31, 2021, there were no transfers in or out of Level 3.
For more information on valuation inputs, see Note 2 – Significant Accounting Policies in Notes to Financial Statements.
| SEI Institutional Managed Trust / Semi-Annual Report / March 31, 2021 | 45 |
SUMMARY SCHEDULE OF INVESTMENTS (Unaudited)
March 31, 2021
Real Estate Fund (Concluded)
The following is a summary of the Fund’s transactions with affiliates for the period ended March 31, 2021 ($ Thousands):
| Security Description | Value 9/30/2020 | Purchases at Cost | Proceeds from Sales | Realized Gain/ (Loss) | Change in Unrealized Appreciation/ (Depreciation) | Value 3/31/2021 | Shares | Income | Capital Gains | |||||||||
SEI Daily Income Trust, Government Fund, Cl F | $ 1,153 | $13,962 | $ (13,935) | $ - | $ - | $ 1,180 | 1,180,220 | $ - | $ - | |||||||||
|
|
|
|
|
|
|
|
Amounts designated as “-” are either $0 or have been rounded to be $0.
The accompanying notes are an integral part of the financial statements.
46 | SEI Institutional Managed Trust / Semi-Annual Report / March 31, 2021 |
SCHEDULE OF INVESTMENTS (Unaudited)
March 31, 2021
Core Fixed Income Fund
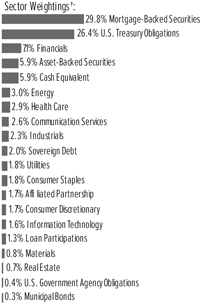
†Percentages are based on total investments. Includes investments held as collateral for securities held on loan (see Note 10).
| Description | Face Amount (Thousands) | Market Value ($ Thousands) | ||||||
MORTGAGE-BACKED SECURITIES — 34.3% |
| |||||||
Agency Mortgage-Backed Obligations — 23.2% |
| |||||||
FHLMC | ||||||||
7.500%, 05/01/2031 to 02/01/2038 | $ | 291 | $ | 330 | ||||
7.000%, 05/01/2024 to 03/01/2039 | 101 | 117 | ||||||
6.500%, 10/01/2031 to 09/01/2039 | 170 | 194 | ||||||
6.000%, 07/01/2021 to 09/01/2038 | 248 | 292 | ||||||
5.500%, 01/01/2024 to 08/01/2037 | 175 | 200 | ||||||
5.000%, 05/01/2033 to 03/01/2050 | 9,738 | 10,937 | ||||||
4.500%, 04/01/2035 to 05/01/2050 | 14,531 | 16,055 | ||||||
4.000%, 01/01/2035 to 03/01/2050 | 35,320 | 38,653 | ||||||
3.500%, 04/01/2033 to 12/01/2050 | 71,481 | 76,836 | ||||||
3.000%, 03/01/2031 to 04/01/2051 | 40,555 | 42,793 | ||||||
2.500%, 10/01/2031 to 03/01/2051 | 8,182 | 8,482 | ||||||
2.000%, 01/01/2036 to 04/30/2051 | 7,611 | 7,681 | ||||||
0.000%, 03/15/2031 to 07/15/2031 (A) | 1,750 | 1,429 | ||||||
FHLMC ARM | ||||||||
2.827%, VAR ICE LIBOR USD 12 Month+1.641%, 05/01/2049 | 728 | 760 | ||||||
FHLMC CMO, Ser 1997-1983, Cl Z | ||||||||
6.500%, 12/15/2023 | 106 | 112 | ||||||
FHLMC CMO, Ser 2001-2277, Cl B | ||||||||
7.500%, 01/15/2031 | 47 | 58 | ||||||
FHLMC CMO, Ser 2002-2399, Cl XG | ||||||||
6.500%, 01/15/2032 | 263 | 304 | ||||||
FHLMC CMO, Ser 2006-R007, Cl ZA | ||||||||
6.000%, 05/15/2036 | 711 | 838 | ||||||
FHLMC CMO, Ser 2007-3281, Cl AI, IO | ||||||||
6.324%, 02/15/2037 (B) | 54 | 11 | ||||||
| Description | Face Amount (Thousands) | Market Value ($ Thousands) | ||||||
MORTGAGE-BACKED SECURITIES (continued) |
| |||||||
FHLMC CMO, Ser 2007-3294, Cl CB | ||||||||
5.500%, 03/15/2037 | $ | 120 | $ | 139 | ||||
FHLMC CMO, Ser 2007-3316, Cl JO, PO | ||||||||
0.000%, 05/15/2037 (A) | 1 | 1 | ||||||
FHLMC CMO, Ser 2008-3451, Cl SB, IO | ||||||||
5.924%, 05/15/2038 (B) | 14 | 2 | ||||||
FHLMC CMO, Ser 2010-3621, Cl SB, IO | ||||||||
6.124%, 01/15/2040 (B) | 37 | 7 | ||||||
FHLMC CMO, Ser 2011-3947, Cl SG, IO | ||||||||
5.844%, 10/15/2041 (B) | 395 | 63 | ||||||
FHLMC CMO, Ser 2012-264, Cl 30 | ||||||||
3.000%, 07/15/2042 | 1,723 | 1,774 | ||||||
FHLMC CMO, Ser 2012-271, Cl 30 | ||||||||
3.000%, 08/15/2042 | 405 | 423 | ||||||
FHLMC CMO, Ser 2012-283, Cl IO, IO | ||||||||
3.500%, 10/15/2027 | 298 | 21 | ||||||
FHLMC CMO, Ser 2012-4054, Cl SA, IO | ||||||||
5.944%, 08/15/2039 (B) | 515 | 98 | ||||||
FHLMC CMO, Ser 2012-4146, Cl DI, IO | ||||||||
3.000%, 12/15/2031 | 465 | 33 | ||||||
FHLMC CMO, Ser 2013-4174, Cl SA, IO | ||||||||
6.094%, 05/15/2039 (B) | 68 | 3 | ||||||
FHLMC CMO, Ser 2013-4194, Cl BI, IO | ||||||||
3.500%, 04/15/2043 | 98 | 13 | ||||||
FHLMC CMO, Ser 2013-4203, Cl PS, IO | ||||||||
6.144%, 09/15/2042 (B) | 321 | 43 | ||||||
FHLMC CMO, Ser 2013-4205, Cl PA | ||||||||
1.750%, 05/15/2043 | 472 | 482 | ||||||
FHLMC CMO, Ser 2013-4210, Cl Z | ||||||||
3.000%, 05/15/2043 | 153 | 155 | ||||||
FHLMC CMO, Ser 2013-4239, Cl IO, IO | ||||||||
3.500%, 06/15/2027 | 215 | 13 | ||||||
FHLMC CMO, Ser 2014-328, Cl S4, IO | ||||||||
2.377%, 02/15/2038 (B) | 19 | 1 | ||||||
FHLMC CMO, Ser 2014-4335, Cl SW, IO | ||||||||
5.894%, 05/15/2044 (B) | 69 | 13 | ||||||
FHLMC CMO, Ser 2014-4415, Cl IO, IO | ||||||||
2.282%, 04/15/2041 (B) | 212 | 12 | ||||||
FHLMC CMO, Ser 2015-4426, Cl QC | ||||||||
1.750%, 07/15/2037 | 825 | 854 | ||||||
FHLMC CMO, Ser 2015-4479, Cl HA | ||||||||
3.750%, 05/15/2039 | 616 | 638 | ||||||
FHLMC CMO, Ser 2016-353, Cl S1, IO | ||||||||
5.894%, 12/15/2046 (B) | 453 | 93 | ||||||
FHLMC CMO, Ser 2016-4639, Cl HZ | ||||||||
3.250%, 04/15/2053 | 1,731 | 1,834 | ||||||
FHLMC CMO, Ser 2017-356, Cl 300 | ||||||||
3.000%, 09/15/2047 | 2,142 | 2,245 | ||||||
FHLMC CMO, Ser 2017-4705, Cl A | ||||||||
4.500%, 09/15/2042 | 287 | 296 | ||||||
FHLMC CMO, Ser 2017-4742, Cl PA | ||||||||
3.000%, 10/15/2047 | 2,288 | 2,396 | ||||||
SEI Institutional Managed Trust / Semi-Annual Report / March 31, 2021 | 47 |
SCHEDULE OF INVESTMENTS (Unaudited)
March 31, 2021
Core Fixed Income Fund (Continued)
| Description | Face Amount (Thousands) | Market Value ($ Thousands) | ||||||
MORTGAGE-BACKED SECURITIES (continued) |
| |||||||
FHLMC CMO, Ser 2018-4763, Cl CA | ||||||||
3.000%, 09/15/2038 | $ | 273 | $ | 293 | ||||
FHLMC CMO, Ser 2018-4767, Cl KA | ||||||||
3.000%, 03/15/2048 | 724 | 778 | ||||||
FHLMC CMO, Ser 2018-4813, Cl CJ | ||||||||
3.000%, 08/15/2048 | 441 | 457 | ||||||
FHLMC CMO, Ser 2018-4818, Cl CA | ||||||||
3.000%, 04/15/2048 | 980 | 1,023 | ||||||
FHLMC CMO, Ser 2018-4846, Cl PF | ||||||||
0.456%, VAR ICE LIBOR USD 1 Month+0.350%, 12/15/2048 | 167 | 169 | ||||||
FHLMC CMO, Ser 2018-4846, Cl PA | ||||||||
4.000%, 06/15/2047 | 239 | 248 | ||||||
FHLMC CMO, Ser 2019-4880, Cl DA | ||||||||
3.000%, 05/15/2050 | 1,062 | 1,132 | ||||||
FHLMC CMO, Ser 2020-4988, Cl AF | ||||||||
0.494%, VAR ICE LIBOR USD 1 Month+0.350%, 10/15/2037 | 70 | 71 | ||||||
FHLMC CMO, Ser 2020-4995, Cl IC, IO | ||||||||
4.500%, 07/25/2050 | 1,281 | 202 | ||||||
FHLMC CMO, Ser 2020-5010, Cl IK, IO | ||||||||
2.500%, 09/25/2050 | 368 | 54 | ||||||
FHLMC CMO, Ser 2020-5010, Cl JI, IO | ||||||||
2.500%, 09/25/2050 | 866 | 139 | ||||||
FHLMC CMO, Ser 2020-5012, Cl BI, IO | ||||||||
4.000%, 09/25/2050 | 5,514 | 730 | ||||||
FHLMC CMO, Ser 2020-5013, Cl IN, IO | ||||||||
2.500%, 09/25/2050 | 394 | 66 | ||||||
FHLMC CMO, Ser 2020-5018, Cl MI, IO | ||||||||
2.000%, 10/25/2050 | 591 | 76 | ||||||
FHLMC CMO, Ser 2020-5018, Cl IO, IO | ||||||||
3.500%, 10/25/2050 | 2,762 | 474 | ||||||
FHLMC CMO, Ser 2020-5018, Cl IH, IO | ||||||||
3.500%, 10/25/2050 | 1,593 | 267 | ||||||
FHLMC CMO, Ser 2020-5038, Cl IJ, IO | ||||||||
4.000%, 11/25/2050 | 4,297 | 725 | ||||||
FHLMC CMO, Ser 2020-5040, Cl IB, IO | ||||||||
2.500%, 11/25/2050 | 194 | 27 | ||||||
FHLMC CMO, Ser 2020-5040, Cl CI, IO | ||||||||
4.000%, 11/25/2050 | 4,608 | 649 | ||||||
FHLMC CMO, Ser 2020-5059, Cl IB, IO | ||||||||
2.500%, 01/25/2051 | 794 | 134 | ||||||
FHLMC CMO, Ser 2021-5070, Cl DI, IO | ||||||||
4.000%, 02/25/2051 | 4,139 | 645 | ||||||
FHLMC CMO, Ser 2021-5091, Cl AB | ||||||||
1.500%, 03/25/2051 | 2,271 | 2,277 | ||||||
FHLMC CMO, Ser 2021-5092, Cl DT | ||||||||
1.500%, 11/25/2049 | 2,289 | 2,309 | ||||||
FHLMC Multifamily Structured Pass Through Certificates, Ser K741, Cl X1, IO | ||||||||
0.658%, 12/25/2027 (B) | 3,000 | 104 | ||||||
| Description | Face Amount (Thousands) | Market Value ($ Thousands) | ||||||
MORTGAGE-BACKED SECURITIES (continued) |
| |||||||
FHLMC Multifamily Structured Pass-Through Certificates, Ser K016, Cl X1, IO | ||||||||
1.482%, 10/25/2021 (B) | $ | 238 | $ | – | ||||
FHLMC Multifamily Structured Pass-Through Certificates, Ser K032, Cl X1, IO | ||||||||
0.088%, 05/25/2023 (B) | 31,662 | 71 | ||||||
FHLMC Multifamily Structured Pass-Through Certificates, Ser K047, Cl A2 | ||||||||
3.329%, 05/25/2025 (B) | 280 | 306 | ||||||
FHLMC Multifamily Structured Pass-Through Certificates, Ser K064, Cl X1, IO | ||||||||
0.605%, 03/25/2027 (B) | 4,897 | 160 | ||||||
FHLMC Multifamily Structured Pass-Through Certificates, Ser K094, Cl X1, IO | ||||||||
0.880%, 06/25/2029 (B) | 1,997 | 128 | ||||||
FHLMC Multifamily Structured Pass-Through Certificates, Ser K094, Cl XAM, IO | ||||||||
1.148%, 06/25/2029 (B) | 4,850 | 421 | ||||||
FHLMC Multifamily Structured Pass-Through Certificates, Ser K095, Cl XAM, IO | ||||||||
1.238%, 06/25/2029 (B) | 700 | 66 | ||||||
FHLMC Multifamily Structured Pass-Through Certificates, Ser K723, Cl X1, IO | ||||||||
0.948%, 08/25/2023 (B) | 7,317 | 127 | ||||||
FHLMC Multifamily Structured Pass-Through Certificates, Ser K736, Cl X1, IO | ||||||||
1.312%, 07/25/2026 (B) | 1,039 | 61 | ||||||
FHLMC Multifamily Structured Pass-Through Certificates, Ser KC05, Cl X1, IO | ||||||||
1.203%, 06/25/2027 (B) | 1,566 | 84 | ||||||
FHLMC Multifamily Structured Pass-Through Certificates, Ser KLU1, Cl A4 | ||||||||
2.854%, 01/25/2031 | 600 | 628 | ||||||
FHLMC Multifamily Structured Pass-Through Certificates, Ser S8FX, Cl A2 | ||||||||
3.291%, 03/25/2027 | 320 | 347 | ||||||
FHLMC Multifamily Structured Pass-Through Certificates, Ser X3FX, Cl A2FX | ||||||||
3.000%, 06/25/2027 | 580 | 623 | ||||||
FHLMC Structured Pass-Through Certificates, Ser 2007-76, Cl 2A | ||||||||
1.718%, 10/25/2037 (B) | 96 | 97 | ||||||
FNMA | ||||||||
7.500%, 10/01/2037 to 04/01/2039 | 116 | 143 | ||||||
7.000%, 09/01/2026 to 02/01/2039 | 455 | 524 | ||||||
6.500%, 05/01/2027 to 05/01/2040 | 155 | 177 | ||||||
6.000%, 02/01/2023 to 07/01/2041 | 1,613 | 1,894 | ||||||
5.500%, 02/01/2035 to 09/01/2056 | 5,181 | 5,962 | ||||||
5.000%, 07/01/2033 to 03/01/2050 | 29,243 | 33,026 | ||||||
4.500%, 04/01/2025 to 01/01/2059 | 47,519 | 52,805 | ||||||
4.200%, 01/01/2029 | 775 | 873 | ||||||
4.000%, 09/01/2033 to 06/01/2057 | 47,608 | 52,067 | ||||||
3.820%, 07/01/2027 | 114 | 128 | ||||||
| 48 | SEI Institutional Managed Trust / Semi-Annual Report / March 31, 2021 |
| Description | Face Amount (Thousands) | Market Value ($ Thousands) | ||||||
MORTGAGE-BACKED SECURITIES (continued) |
| |||||||
3.790%, 12/01/2025 | $ | 1,465 | $ | 1,574 | ||||
3.734%, 02/01/2048 (B) | 255 | 279 | ||||||
3.500%, 07/01/2029 to 03/01/2057 | 45,639 | 48,892 | ||||||
3.160%, 05/01/2029 | 186 | 203 | ||||||
3.020%, 06/01/2024 to 05/01/2026 | 1,540 | 1,582 | ||||||
3.000%, 12/01/2031 to 07/01/2060 | 58,161 | 61,325 | ||||||
2.900%, 11/01/2029 | 500 | 542 | ||||||
2.820%, 07/01/2027 | 574 | 616 | ||||||
2.790%, 08/01/2029 | 1,200 | 1,281 | ||||||
2.500%, 06/01/2028 to 04/01/2051 | 37,914 | 39,325 | ||||||
2.455%, 04/01/2040 | 1,920 | 1,879 | ||||||
2.260%, 04/01/2030 | 687 | 712 | ||||||
2.000%, 01/01/2036 to 05/01/2051 | 24,906 | 25,080 | ||||||
1.950%, 04/01/2032 | 100 | 100 | ||||||
1.500%, 12/01/2035 | 195 | 196 | ||||||
FNMA ACES, Ser 2012-M14, Cl X2, IO | ||||||||
0.418%, 09/25/2022 (B) | 7,741 | 37 | ||||||
FNMA ACES, Ser 2014-M2, Cl A2 | ||||||||
3.513%, 12/25/2023 (B) | 1,273 | 1,350 | ||||||
FNMA ACES, Ser 2017-M7, Cl A2 | ||||||||
2.961%, 02/25/2027 (B) | 335 | 360 | ||||||
FNMA ARM | ||||||||
2.764%, VAR ICE LIBOR USD 12 Month+1.579%, 06/01/2045 | 525 | 547 | ||||||
2.683%, VAR ICE LIBOR USD 12 Month+1.586%, 01/01/2046 | 1,879 | 1,963 | ||||||
2.488%, VAR 12 Month Treas Avg+1.903%, 11/01/2035 | 72 | 76 | ||||||
2.393%, VAR 12 Month Treas Avg+1.875%, 10/01/2035 | 338 | 357 | ||||||
2.361%, VAR 12 Month Treas Avg+1.851%, 11/01/2035 | 353 | 372 | ||||||
2.325%, VAR 12 Month Treas Avg+1.808%, 10/01/2035 | 59 | 62 | ||||||
FNMA CMO, Ser 1999-11, Cl Z | ||||||||
5.500%, 03/25/2029 | 150 | 159 | ||||||
FNMA CMO, Ser 2005-117, Cl LC | ||||||||
5.500%, 11/25/2035 | 227 | 238 | ||||||
FNMA CMO, Ser 2005-29, Cl ZA | ||||||||
5.500%, 04/25/2035 | 170 | 193 | ||||||
FNMA CMO, Ser 2006-112, Cl ST, IO | ||||||||
6.591%, 11/25/2036 (B) | 427 | 69 | ||||||
FNMA CMO, Ser 2008-22, Cl SI, IO | ||||||||
6.321%, 03/25/2037 (B) | 214 | 3 | ||||||
FNMA CMO, Ser 2009-103, Cl MB | ||||||||
2.916%, 12/25/2039 (B) | 31 | 33 | ||||||
FNMA CMO, Ser 2009-86, Cl BO, PO | ||||||||
0.000%, 03/25/2037 (A) | 728 | 679 | ||||||
FNMA CMO, Ser 2011-59, Cl NZ | ||||||||
5.500%, 07/25/2041 | 1,323 | 1,482 | ||||||
FNMA CMO, Ser 2011-87, Cl SG, IO | ||||||||
6.441%, 04/25/2040 (B) | 140 | 15 | ||||||
| Description | Face Amount (Thousands) | Market Value ($ Thousands) | ||||||
MORTGAGE-BACKED SECURITIES (continued) |
| |||||||
FNMA CMO, Ser 2011-96, Cl SA, IO | ||||||||
6.441%, 10/25/2041 (B) | $ | 750 | $ | 148 | ||||
FNMA CMO, Ser 2012-101, Cl AI, IO | ||||||||
3.000%, 06/25/2027 | 202 | 9 | ||||||
FNMA CMO, Ser 2012-101, Cl BI, IO | ||||||||
4.000%, 09/25/2027 | 38 | 2 | ||||||
FNMA CMO, Ser 2012-118, Cl CI, IO | ||||||||
3.500%, 12/25/2039 | 113 | 3 | ||||||
FNMA CMO, Ser 2012-133, Cl CS, IO | ||||||||
6.041%, 12/25/2042 (B) | 215 | 47 | ||||||
FNMA CMO, Ser 2012-151, Cl NX | ||||||||
1.500%, 01/25/2043 | 597 | 611 | ||||||
FNMA CMO, Ser 2012-28, Cl B | ||||||||
6.500%, 06/25/2039 | 16 | 17 | ||||||
FNMA CMO, Ser 2012-35, Cl SC, IO | ||||||||
6.391%, 04/25/2042 (B) | 123 | 25 | ||||||
FNMA CMO, Ser 2012-46, Cl BA | ||||||||
6.000%, 05/25/2042 | 171 | 198 | ||||||
FNMA CMO, Ser 2012-70, Cl YS, IO | ||||||||
6.541%, 02/25/2041 (B) | 21 | 1 | ||||||
FNMA CMO, Ser 2012-74, Cl SA, IO | ||||||||
6.541%, 03/25/2042 (B) | 222 | 37 | ||||||
FNMA CMO, Ser 2012-74, Cl OA, PO | ||||||||
0.000%, 03/25/2042 (A) | 17 | 16 | ||||||
FNMA CMO, Ser 2012-75, Cl AO, PO | ||||||||
0.000%, 03/25/2042 (A) | 34 | 32 | ||||||
FNMA CMO, Ser 2013-11, Cl AP | ||||||||
1.500%, 01/25/2043 | 1,682 | 1,704 | ||||||
FNMA CMO, Ser 2013-111, Cl PL | ||||||||
2.000%, 12/25/2042 | 375 | 385 | ||||||
FNMA CMO, Ser 2013-124, Cl SB, IO | ||||||||
5.841%, 12/25/2043 (B) | 363 | 70 | ||||||
FNMA CMO, Ser 2013-126, Cl CS, IO | ||||||||
6.041%, 09/25/2041 (B) | 262 | 38 | ||||||
FNMA CMO, Ser 2013-30, Cl CA | ||||||||
1.500%, 04/25/2043 | 244 | 247 | ||||||
FNMA CMO, Ser 2013-35, Cl CL | ||||||||
3.000%, 02/25/2043 | 6,875 | 7,288 | ||||||
FNMA CMO, Ser 2013-43, Cl BP | ||||||||
1.750%, 05/25/2043 | 650 | 670 | ||||||
FNMA CMO, Ser 2013-54, Cl BS, IO | ||||||||
6.041%, 06/25/2043 (B) | 139 | 30 | ||||||
FNMA CMO, Ser 2013-73, Cl IB, IO | ||||||||
3.500%, 07/25/2028 | 60 | 4 | ||||||
FNMA CMO, Ser 2013-73, Cl IA, IO | ||||||||
3.000%, 09/25/2032 | 339 | 25 | ||||||
FNMA CMO, Ser 2013-9, Cl BC | ||||||||
6.500%, 07/25/2042 | 206 | 246 | ||||||
FNMA CMO, Ser 2013-9, Cl CB | ||||||||
5.500%, 04/25/2042 | 1,537 | 1,765 | ||||||
FNMA CMO, Ser 2013-9, Cl SA, IO | ||||||||
6.041%, 03/25/2042 (B) | 273 | 47 | ||||||
| SEI Institutional Managed Trust / Semi-Annual Report / March 31, 2021 | 49 |
SCHEDULE OF INVESTMENTS (Unaudited)
March 31, 2021
Core Fixed Income Fund (Continued)
| Description | Face Amount (Thousands) | Market Value ($ Thousands) | ||||||
MORTGAGE-BACKED SECURITIES (continued) |
| |||||||
FNMA CMO, Ser 2014-47, Cl AI, IO | ||||||||
2.212%, 08/25/2044 (B) | $ | 142 | $ | 9 | ||||
FNMA CMO, Ser 2014-73, Cl MA | ||||||||
2.500%, 11/25/2044 | 378 | 400 | ||||||
FNMA CMO, Ser 2015-55, Cl IO, IO | ||||||||
1.921%, 08/25/2055 (B) | 389 | 17 | ||||||
FNMA CMO, Ser 2015-56, Cl AS, IO | ||||||||
6.041%, 08/25/2045 (B) | 46 | 11 | ||||||
FNMA CMO, Ser 2015-84, Cl PA | ||||||||
1.700%, 08/25/2033 | 2,090 | 2,162 | ||||||
FNMA CMO, Ser 2016-37, Cl MJ | ||||||||
3.500%, 08/25/2043 | 250 | 260 | ||||||
FNMA CMO, Ser 2016-48, Cl MA | ||||||||
2.000%, 06/25/2038 | 2,140 | 2,229 | ||||||
FNMA CMO, Ser 2016-57, Cl PC | ||||||||
1.750%, 06/25/2046 | 4,068 | 4,217 | ||||||
FNMA CMO, Ser 2017-13, Cl PA | ||||||||
3.000%, 08/25/2046 | 853 | 903 | ||||||
FNMA CMO, Ser 2017-42, Cl H | ||||||||
3.000%, 11/25/2043 | 474 | 490 | ||||||
FNMA CMO, Ser 2017-76, Cl SB, IO | ||||||||
5.991%, 10/25/2057 (B) | 1,301 | 282 | ||||||
FNMA CMO, Ser 2017-85, Cl SC, IO | ||||||||
6.091%, 11/25/2047 (B) | 407 | 74 | ||||||
FNMA CMO, Ser 2018-14, Cl KC | ||||||||
3.000%, 03/25/2048 | 1,438 | 1,538 | ||||||
FNMA CMO, Ser 2018-15, Cl AB | ||||||||
3.000%, 03/25/2048 | 331 | 356 | ||||||
FNMA CMO, Ser 2018-43, Cl CT | ||||||||
3.000%, 06/25/2048 | 1,633 | 1,700 | ||||||
FNMA CMO, Ser 2018-54, Cl KA | ||||||||
3.500%, 01/25/2047 | 958 | 997 | ||||||
FNMA CMO, Ser 2018-8, Cl KL | ||||||||
2.500%, 03/25/2047 | 463 | 484 | ||||||
FNMA CMO, Ser 2019-25, Cl PA | ||||||||
3.000%, 05/25/2048 | 1,385 | 1,491 | ||||||
FNMA CMO, Ser 2019-35, Cl A | ||||||||
3.000%, 07/25/2049 | 600 | 636 | ||||||
FNMA CMO, Ser 2019-79, Cl FA | ||||||||
0.609%, VAR ICE LIBOR USD 1 Month+0.500%, 01/25/2050 | 2,303 | 2,331 | ||||||
FNMA CMO, Ser 2020-101, Cl IA, IO | ||||||||
3.500%, 01/25/2051 | 5,171 | 769 | ||||||
FNMA CMO, Ser 2020-25, Cl BI, IO | ||||||||
3.500%, 01/25/2047 | 1,127 | 155 | ||||||
FNMA CMO, Ser 2020-47, Cl GZ | ||||||||
2.000%, 07/25/2050 | 406 | 347 | ||||||
FNMA CMO, Ser 2020-48, Cl AB | ||||||||
2.000%, 07/25/2050 | 914 | 937 | ||||||
FNMA CMO, Ser 2020-48, Cl DA | ||||||||
2.000%, 07/25/2050 | 3,353 | 3,416 | ||||||
| Description | Face Amount (Thousands) | Market Value ($ Thousands) | ||||||
MORTGAGE-BACKED SECURITIES (continued) |
| |||||||
FNMA CMO, Ser 2020-56, Cl DI, IO | ||||||||
2.500%, 08/25/2050 | $ | 666 | $ | 110 | ||||
FNMA CMO, Ser 2020-57, Cl NI, IO | ||||||||
2.500%, 08/25/2050 | 387 | 61 | ||||||
FNMA CMO, Ser 2020-64, Cl IB, IO | ||||||||
4.000%, 09/25/2050 | 1,623 | 281 | ||||||
FNMA CMO, Ser 2020-65, Cl JI, IO | ||||||||
4.000%, 09/25/2050 | 3,157 | 596 | ||||||
FNMA CMO, Ser 2020-65, Cl EI, IO | ||||||||
4.000%, 09/25/2050 | 2,685 | 497 | ||||||
FNMA CMO, Ser 2020-65, Cl DI, IO | ||||||||
4.000%, 09/25/2050 | 1,839 | 309 | ||||||
FNMA CMO, Ser 2020-84, Cl ID, IO | ||||||||
3.500%, 12/25/2050 | 1,462 | 230 | ||||||
FNMA CMO, Ser 2020-99, Cl IA, IO | ||||||||
3.500%, 09/25/2049 | 860 | 158 | ||||||
FNMA CMO, Ser 2021-1, Cl IG, IO | ||||||||
2.500%, 02/25/2051 | 199 | 32 | ||||||
FNMA Interest CMO, Ser 2005-360, Cl 2, IO | ||||||||
5.000%, 08/25/2035 | 833 | 145 | ||||||
FNMA Interest CMO, Ser 2012-409, Cl C22, IO | ||||||||
4.500%, 11/25/2039 | 256 | 48 | ||||||
FNMA Interest CMO, Ser 2012-409, Cl C2, IO | ||||||||
3.000%, 04/25/2027 | 287 | 17 | ||||||
FNMA Interest CMO, Ser 2012-409, Cl C13, IO | ||||||||
3.500%, 11/25/2041 | 238 | 23 | ||||||
FNMA Interest CMO, Ser 2012-411, Cl A3 | ||||||||
3.000%, 08/25/2042 | 1,116 | 1,164 | ||||||
FNMA Interest CMO, Ser 2012-414, Cl A35 | ||||||||
3.500%, 10/25/2042 | 1,675 | 1,788 | ||||||
FNMA Interest CMO, Ser 2018-424, Cl C11, IO | ||||||||
3.500%, 02/25/2048 | 1,971 | 308 | ||||||
FNMA TBA | ||||||||
5.000%, 04/30/2037 | 2,970 | 3,290 | ||||||
4.500%, 04/14/2033 | 3,458 | 3,764 | ||||||
4.000%, 04/01/2039 | 5,541 | 5,946 | ||||||
3.500%, 04/01/2041 | 5,119 | 5,406 | ||||||
3.000%, 04/01/2043 | 4,852 | 5,054 | ||||||
2.500%, 04/25/2027 to 06/01/2043 | 130,580 | 133,725 | ||||||
2.000%, 05/15/2028 to 04/15/2036 | 85,312 | 87,387 | ||||||
FNMA, Ser 2014-M8, Cl X2, IO | ||||||||
0.289%, 06/25/2024 (B) | 5,523 | 76 | ||||||
FNMA, Ser M15, Cl 1A2 | ||||||||
3.700%, 01/25/2036 | 100 | 110 | ||||||
FNMA, Ser M27, Cl A2 | ||||||||
2.700%, 11/25/2040 | 300 | 311 | ||||||
FNMA, Ser M36, Cl X1, IO | ||||||||
1.468%, 09/25/2034 (B) | 598 | 64 | ||||||
50 | SEI Institutional Managed Trust / Semi-Annual Report / March 31, 2021 |
| Description | Face Amount (Thousands) | Market Value ($ Thousands) | ||||||
MORTGAGE-BACKED SECURITIES (continued) |
| |||||||
FNMA, Ser M4, Cl A2 | ||||||||
3.610%, 02/25/2031 | $ | 190 | $ | 215 | ||||
FNMA, Ser M5, Cl A2 | ||||||||
3.273%, 02/25/2029 | 230 | 254 | ||||||
FNMA, Ser M6, Cl A | ||||||||
2.500%, 10/25/2037 | 95 | 95 | ||||||
FNMA, Ser M8, Cl A2 | ||||||||
3.061%, 05/25/2027 (B) | 200 | 218 | ||||||
FREMF Mortgage Trust, Ser 2012-K20, Cl X2A, IO | ||||||||
0.200%, 05/25/2045 (C) | 11,024 | 19 | ||||||
FREMF Mortgage Trust, Ser 2019-KF58, Cl B | ||||||||
2.269%, VAR ICE LIBOR USD 1 Month+2.150%, 01/25/2026 (C) | 1,311 | 1,308 | ||||||
FRESB Mortgage Trust, Ser 2017-SB42, Cl A10F | ||||||||
2.960%, 10/25/2027 (B) | 203 | 210 | ||||||
GNMA | ||||||||
8.000%, 11/15/2029 to 09/15/2030 | 36 | 40 | ||||||
7.500%, 03/15/2029 to 10/15/2037 | 57 | 66 | ||||||
7.000%, 09/15/2031 | 20 | 24 | ||||||
6.500%, 07/15/2028 to 12/15/2035 | 1,080 | 1,239 | ||||||
6.000%, 12/15/2028 to 10/20/2040 | 1,911 | 2,236 | ||||||
5.508%, 07/20/2060 (B) | 1 | 1 | ||||||
5.000%, 12/20/2039 to 03/20/2049 | 13,401 | 14,826 | ||||||
4.700%, 09/20/2061 (B) | 355 | 367 | ||||||
4.500%, 04/20/2041 to 09/20/2049 | 14,395 | 15,769 | ||||||
4.240%, 01/20/2069 (B) | 26 | 27 | ||||||
4.000%, 06/20/2047 to 04/20/2050 | 24,103 | 26,102 | ||||||
3.715%, 04/20/2063 (B) | 113 | 117 | ||||||
3.500%, 03/20/2046 to 05/15/2050 | 19,628 | 20,927 | ||||||
3.000%, 02/20/2034 to 01/20/2050 | 14,071 | 14,858 | ||||||
2.500%, 12/20/2050 | 199 | 208 | ||||||
GNMA CMO, Ser 2007-17, Cl IB, IO | ||||||||
6.139%, 04/20/2037 (B) | 378 | 66 | ||||||
GNMA CMO, Ser 2007-51, Cl SG, IO | ||||||||
6.469%, 08/20/2037 (B) | 49 | 8 | ||||||
GNMA CMO, Ser 2007-78, Cl SA, IO | ||||||||
6.424%, 12/16/2037 (B) | 446 | 66 | ||||||
GNMA CMO, Ser 2009-66, Cl XS, IO | ||||||||
6.694%, 07/16/2039 (B) | 349 | 48 | ||||||
GNMA CMO, Ser 2010-4, Cl NS, IO | ||||||||
6.284%, 01/16/2040 (B) | 3,271 | 622 | ||||||
GNMA CMO, Ser 2010-85, Cl HS, IO | ||||||||
6.539%, 01/20/2040 (B) | 22 | 2 | ||||||
GNMA CMO, Ser 2010-H11, Cl FA | ||||||||
1.115%, VAR ICE LIBOR USD 1 Month+1.000%, 06/20/2060 | 378 | 385 | ||||||
GNMA CMO, Ser 2010-H27, Cl FA | ||||||||
0.500%, VAR ICE LIBOR USD 1 Month+0.380%, 12/20/2060 | 1,043 | 1,045 | ||||||
| Description | Face Amount (Thousands) | Market Value ($ Thousands) | ||||||
MORTGAGE-BACKED SECURITIES (continued) |
| |||||||
GNMA CMO, Ser 2010-H28, Cl FE | ||||||||
0.520%, VAR ICE LIBOR USD 1 Month+0.400%, 12/20/2060 | $ | 399 | $ | 400 | ||||
GNMA CMO, Ser 2011-H08, Cl FD | ||||||||
0.620%, VAR ICE LIBOR USD 1 Month+0.500%, 02/20/2061 | 197 | 198 | ||||||
GNMA CMO, Ser 2011-H08, Cl FG | ||||||||
0.600%, VAR ICE LIBOR USD 1 Month+0.480%, 03/20/2061 | 408 | 409 | ||||||
GNMA CMO, Ser 2011-H09, Cl AF | ||||||||
0.620%, VAR ICE LIBOR USD 1 Month+0.500%, 03/20/2061 | 310 | 311 | ||||||
GNMA CMO, Ser 2012-141, Cl WA | ||||||||
4.531%, 11/16/2041 (B) | 249 | 278 | ||||||
GNMA CMO, Ser 2012-34, Cl SA, IO | ||||||||
5.939%, 03/20/2042 (B) | 355 | 78 | ||||||
GNMA CMO, Ser 2012-43, Cl SN, IO | ||||||||
6.494%, 04/16/2042 (B) | 64 | 16 | ||||||
GNMA CMO, Ser 2012-66, Cl CI, IO | ||||||||
3.500%, 02/20/2038 | 110 | 2 | ||||||
GNMA CMO, Ser 2012-98, Cl SA, IO | ||||||||
5.994%, 08/16/2042 (B) | 164 | 37 | ||||||
GNMA CMO, Ser 2012-H25, Cl FA | ||||||||
0.820%, VAR ICE LIBOR USD 1 Month+0.700%, 12/20/2061 | 6 | 6 | ||||||
GNMA CMO, Ser 2012-H27, Cl AI, IO | ||||||||
1.741%, VAR ICE LIBOR USD 1 Month+0.000%, 10/20/2062 | 998 | 46 | ||||||
GNMA CMO, Ser 2013-53, Cl OI, IO | ||||||||
3.500%, 04/20/2043 | 164 | 17 | ||||||
GNMA CMO, Ser 2013-69, Cl AI, IO | ||||||||
3.500%, 05/20/2043 | 306 | 44 | ||||||
GNMA CMO, Ser 2014-5, Cl SP, IO | ||||||||
6.044%, 06/16/2043 (B) | 177 | 23 | ||||||
GNMA CMO, Ser 2014-H10, Cl TA | ||||||||
0.720%, VAR ICE LIBOR USD 1 Month+0.600%, 04/20/2064 | 502 | 507 | ||||||
GNMA CMO, Ser 2015-167, Cl OI, IO | ||||||||
4.000%, 04/16/2045 | 110 | 17 | ||||||
GNMA CMO, Ser 2015-H10, Cl FC | ||||||||
0.600%, VAR ICE LIBOR USD 1 Month+0.480%, 04/20/2065 | 340 | 342 | ||||||
GNMA CMO, Ser 2015-H18, Cl FA | ||||||||
0.570%, VAR ICE LIBOR USD 1 Month+0.450%, 06/20/2065 | 193 | 194 | ||||||
GNMA CMO, Ser 2015-H20, Cl FA | ||||||||
0.590%, VAR ICE LIBOR USD 1 Month+0.470%, 08/20/2065 | 239 | 240 | ||||||
GNMA CMO, Ser 2016-135, Cl SB, IO | ||||||||
5.994%, 10/16/2046 (B) | 245 | 70 | ||||||
GNMA CMO, Ser 2017-167, Cl BQ | ||||||||
2.500%, 08/20/2044 | 938 | 974 | ||||||
| SEI Institutional Managed Trust / Semi-Annual Report / March 31, 2021 | 51 |
SCHEDULE OF INVESTMENTS (Unaudited)
March 31, 2021
Core Fixed Income Fund (Continued)
| Description | Face Amount (Thousands) | Market Value ($ Thousands) | ||||||
MORTGAGE-BACKED SECURITIES (continued) |
| |||||||
GNMA CMO, Ser 2017-H15, Cl KI, IO | ||||||||
2.310%, VAR ICE LIBOR USD 12 Month+0.000%, 07/20/2067 | $ | 745 | $ | 78 | ||||
GNMA CMO, Ser 2017-H18, Cl BI, IO | ||||||||
1.691%, VAR ICE LIBOR USD 12 Month+0.000%, 09/20/2067 | 4,745 | 340 | ||||||
GNMA CMO, Ser 2017-H20, Cl IB, IO | ||||||||
2.066%, VAR ICE LIBOR USD 12 Month+0.000%, 10/20/2067 | 339 | 31 | ||||||
GNMA CMO, Ser 2017-H22, Cl IC, IO | ||||||||
2.636%, VAR ICE LIBOR USD 12 Month+0.000%, 11/20/2067 | 149 | 12 | ||||||
GNMA CMO, Ser 2018-11, Cl PC | ||||||||
2.750%, 12/20/2047 | 1,307 | 1,348 | ||||||
GNMA CMO, Ser 2018-H06, Cl PF | ||||||||
0.420%, VAR ICE LIBOR USD 1 Month+0.300%, 02/20/2068 | 455 | 455 | ||||||
GNMA CMO, Ser 2018-H07, Cl FD | ||||||||
0.420%, VAR ICE LIBOR USD 1 Month+0.300%, 05/20/2068 | 814 | 813 | ||||||
GNMA CMO, Ser 2019-123, Cl A | ||||||||
3.000%, 10/20/2049 | 146 | 150 | ||||||
GNMA CMO, Ser 2019-132, Cl NA | ||||||||
3.500%, 09/20/2049 | 1,022 | 1,078 | ||||||
GNMA CMO, Ser 2019-31, Cl JC | ||||||||
3.500%, 03/20/2049 | 592 | 633 | ||||||
GNMA CMO, Ser 2019-90, Cl AB | ||||||||
3.000%, 07/20/2049 | 629 | 653 | ||||||
GNMA CMO, Ser 2020-123, Cl IL, IO | ||||||||
2.500%, 08/20/2050 | 296 | 44 | ||||||
GNMA CMO, Ser 2020-123, Cl NI, IO | ||||||||
2.500%, 08/20/2050 | 788 | 116 | ||||||
GNMA CMO, Ser 2020-127, Cl IN, IO | ||||||||
2.500%, 08/20/2050 | 394 | 59 | ||||||
GNMA CMO, Ser 2020-129, Cl IE, IO | ||||||||
2.500%, 09/20/2050 | 295 | 43 | ||||||
GNMA CMO, Ser 2020-160, Cl VI, IO | ||||||||
2.500%, 10/20/2050 | 295 | 46 | ||||||
GNMA CMO, Ser 2020-160, Cl IH, IO | ||||||||
2.500%, 10/20/2050 | 198 | 30 | ||||||
GNMA CMO, Ser 2020-160, Cl YI, IO | ||||||||
2.500%, 10/20/2050 | 1,088 | 169 | ||||||
GNMA CMO, Ser 2020-181, Cl WI, IO | ||||||||
2.000%, 12/20/2050 | 2,570 | 302 | ||||||
GNMA CMO, Ser 2020-47, Cl NI, IO | ||||||||
3.500%, 04/20/2050 | 283 | 44 | ||||||
GNMA CMO, Ser 2020-47, Cl MI, IO | ||||||||
3.500%, 04/20/2050 | 754 | 116 | ||||||
GNMA CMO, Ser 2020-H09, Cl FL | ||||||||
1.261%, VAR ICE LIBOR USD 1 Month+1.150%, 05/20/2070 | 896 | 942 | ||||||
| Description | Face Amount (Thousands) | Market Value ($ Thousands) | ||||||
MORTGAGE-BACKED SECURITIES (continued) |
| |||||||
GNMA CMO, Ser 2020-H09, Cl NF | ||||||||
1.361%, VAR ICE LIBOR USD 1 Month+1.250%, 04/20/2070 | $ | 350 | $ | 361 | ||||
GNMA CMO, Ser 2020-H12, Cl F | ||||||||
0.611%, VAR ICE LIBOR USD 1 Month+0.500%, 07/20/2070 | 99 | 100 | ||||||
GNMA CMO, Ser 2020-H13, Cl FA | ||||||||
0.561%, VAR ICE LIBOR USD 1 Month+0.450%, 07/20/2070 | 791 | 799 | ||||||
GNMA CMO, Ser 2021-23, Cl MG | ||||||||
1.500%, 02/20/2051 | 2,194 | 2,215 | ||||||
GNMA CMO, Ser 2021-29, Cl TI, IO | ||||||||
2.500%, 02/20/2051 | 498 | 99 | ||||||
GNMA REMIC CMO, Ser 2014-117, Cl SJ, IO | ||||||||
5.489%, 08/20/2044 (B) | 187 | 34 | ||||||
GNMA TBA | ||||||||
3.000%, 05/01/2043 | 1,300 | 1,355 | ||||||
2.500%, 04/15/2048 | 8,300 | 8,558 | ||||||
2.000%, 04/15/2051 to 05/15/2051 | 43,675 | 44,009 | ||||||
GNMA, Ser 107, Cl AD | ||||||||
2.755%, 11/16/2047 (B) | 385 | 402 | ||||||
GNMA, Ser 2012-112, Cl IO, IO | ||||||||
0.174%, 02/16/2053 (B) | 616 | 5 | ||||||
GNMA, Ser 2012-152, Cl IO, IO | ||||||||
0.727%, 01/16/2054 (B) | 4,316 | 112 | ||||||
GNMA, Ser 2012-27, Cl IO, IO | ||||||||
0.888%, 04/16/2053 (B) | 1,228 | 24 | ||||||
GNMA, Ser 2013-96, Cl IO, IO | ||||||||
0.411%, 10/16/2054 (B) | 903 | 6 | ||||||
GNMA, Ser 2014-47, Cl IA, IO | ||||||||
0.129%, 02/16/2048 (B) | 125 | 2 | ||||||
GNMA, Ser 2014-50, Cl IO, IO | ||||||||
0.662%, 09/16/2055 (B) | 432 | 16 | ||||||
GNMA, Ser 2014-92, Cl IX, IO | ||||||||
0.219%, 05/16/2054 (B) | 3,280 | 36 | ||||||
GNMA, Ser 2015-5, Cl IK, IO | ||||||||
0.581%, 11/16/2054 (B) | 4,333 | 105 | ||||||
GNMA, Ser 2019-71, Cl PT | ||||||||
3.000%, 06/20/2049 | 946 | 982 | ||||||
GNMA, Ser 22, Cl IO, IO | ||||||||
0.997%, 05/16/2063 (B) | 1,097 | 99 | ||||||
GNMA, Ser 28, Cl AB | ||||||||
3.150%, 06/16/2060 | 370 | 382 | ||||||
GNMA, Ser 41, Cl IO, IO | ||||||||
0.699%, 07/16/2058 (B) | 1,439 | 68 | ||||||
|
| |||||||
| 1,036,706 | ||||||||
|
| |||||||
Non-Agency Mortgage-Backed Obligations — 11.1% |
| |||||||
Adjustable Rate Mortgage Trust, Ser 2004- 2, Cl 3A1 | ||||||||
2.446%, 02/25/2035 (B) | 85 | 85 | ||||||
52 | SEI Institutional Managed Trust / Semi-Annual Report / March 31, 2021 |
| Description | Face Amount (Thousands) | Market Value ($ Thousands) | ||||||
MORTGAGE-BACKED SECURITIES (continued) |
| |||||||
Adjustable Rate Mortgage Trust, Ser 2007- 1, Cl 5A31 | ||||||||
0.389%, VAR ICE LIBOR USD 1 Month+0.280%, 03/25/2037 | $ | 1,045 | $ | 1,017 | ||||
Alen Mortgage Trust, Ser ACEN, Cl A | ||||||||
1.256%, VAR ICE LIBOR USD 1 Month+1.150%, 04/15/2034 (C) | 885 | 885 | ||||||
Alternative Loan Trust, Ser 2006-18CB, Cl A6 | ||||||||
28.166%, 07/25/2036 (B) | 183 | 262 | ||||||
American Home Mortgage Investment Trust, Ser 2004-4, Cl 4A | ||||||||
2.201%, VAR ICE LIBOR USD 6 Month+2.000%, | 99 | 100 | ||||||
American Home Mortgage Investment Trust, Ser 2005-1, Cl 6A | ||||||||
2.204%, VAR ICE LIBOR USD 6 Month+2.000%, 06/25/2045 | 1,091 | 1,121 | ||||||
American Home Mortgage Investment Trust, Ser 2005-4, Cl 5A | ||||||||
1.951%, VAR ICE LIBOR USD 6 Month+1.750%, 11/25/2045 | 922 | 581 | ||||||
American Home Mortgage Investment Trust, Ser 2006-1, Cl 12A1 | ||||||||
0.509%, VAR ICE LIBOR USD 1 Month+0.400%, 03/25/2046 | 2,971 | 2,788 | ||||||
Angel Oak Mortgage Trust I, Ser 2019-2, Cl A1 | ||||||||
3.628%, 03/25/2049 (B)(C) | 240 | 244 | ||||||
Angel Oak Mortgage Trust, Ser 2020-2, Cl A1A | ||||||||
2.531%, 01/26/2065 (B)(C) | 837 | 853 | ||||||
Angel Oak Mortgage Trust, Ser 2020-5, Cl A1 | ||||||||
1.373%, 05/25/2065 (B)(C) | 324 | 325 | ||||||
AOA Mortgage Trust, Ser 2015-1177, Cl A | ||||||||
2.957%, 12/13/2029 (C) | 930 | 937 | ||||||
AREIT Trust, Ser CRE3, Cl A | ||||||||
1.126%, VAR ICE LIBOR USD 1 Month+1.020%, 09/14/2036 (C) | 4,769 | 4,770 | ||||||
Aventura Mall Trust, Ser AVM, Cl A | ||||||||
4.112%, 07/05/2040 (B)(C) | 420 | 464 | ||||||
BAMLL Commercial Mortgage Securities Trust, Ser 2018-PARK, Cl A | ||||||||
4.091%, 08/10/2038 (B)(C) | 1,790 | 2,013 | ||||||
BAMLL Commercial Mortgage Securities Trust, Ser JGDN, Cl A | ||||||||
2.856%, VAR ICE LIBOR USD 1 Month+2.750%, 11/15/2030 (C) | 2,020 | 2,064 | ||||||
BAMLL Re-REMIC Trust, Ser 2016-GG10, Cl AJA | ||||||||
5.829%, 08/10/2045 (B)(C) | 1,625 | 715 | ||||||
| Description | Face Amount (Thousands) | Market Value ($ Thousands) | ||||||
MORTGAGE-BACKED SECURITIES (continued) |
| |||||||
Banc of America Funding Trust, Ser 2004-C, Cl 1A1 | ||||||||
3.233%, 12/20/2034 (B) | $ | 8 | $ | 8 | ||||
Banc of America Funding Trust, Ser 2006-G, Cl 2A4 | ||||||||
0.691%, VAR ICE LIBOR USD 1 Month+0.580%, 07/20/2036 | 181 | 181 | ||||||
BBCMS Mortgage Trust, Ser C6, Cl A2 | ||||||||
2.690%, 02/15/2053 | 660 | 688 | ||||||
BBCMS Mortgage Trust, Ser C9, Cl A5 | ||||||||
2.299%, 02/15/2054 | 340 | 336 | ||||||
BBCMS Trust, Ser 2015-SRCH, Cl A1 | ||||||||
3.312%, 08/10/2035 (C) | 455 | 484 | ||||||
BBCMS Trust, Ser CBM, Cl A | ||||||||
1.106%, VAR ICE LIBOR USD 1 Month+1.000%, 07/15/2037 (C) | 375 | 375 | ||||||
BB-UBS Trust, Ser 2012-SHOW, Cl A | ||||||||
3.430%, 11/05/2036 (C) | 600 | 628 | ||||||
BCAP LLC Trust, Ser 2009-RR5, Cl 8A1 | ||||||||
5.500%, 11/26/2034 (B)(C) | 2 | 2 | ||||||
BCAP LLC Trust, Ser 2015-RR2, Cl 21A1 | ||||||||
0.518%, 03/28/2037 (B)(C) | 657 | 652 | ||||||
Bear Stearns Adjustable Rate Mortgage Trust, Ser 2004-2, Cl 14A | ||||||||
2.771%, 05/25/2034 (B) | 7 | 7 | ||||||
Bear Stearns ARM Trust, Ser 2003-7, Cl 9A | ||||||||
2.780%, 10/25/2033 (B) | 379 | 383 | ||||||
Bear Stearns Asset Backed Securities I Trust, Ser 2005-AC8, Cl A3, IO | ||||||||
7.541%, 11/25/2035 (B) | 2,776 | 795 | ||||||
Bear Stearns Asset-Backed Securities I Trust, Ser 2005-AC6, Cl 1A3 | ||||||||
5.500%, 09/25/2035 (B) | 796 | 805 | ||||||
Bear Stearns Commercial Mortgage Securities, Ser 2005-PWR8, Cl X1, IO | ||||||||
0.716%, 06/11/2041 (B)(C) | 1 | – | ||||||
Bear Stearns Mortgage Funding Trust, Ser 2007-AR3, Cl 1A1 | ||||||||
0.249%, VAR ICE LIBOR USD 1 Month+0.140%, 03/25/2037 | 3,306 | 3,126 | ||||||
Benchmark Mortgage Trust, Ser B20, Cl A5 | ||||||||
2.034%, 10/15/2053 | 930 | 901 | ||||||
Benchmark Mortgage Trust, Ser B24, Cl A5 | ||||||||
2.584%, 03/15/2054 | 1,560 | 1,578 | ||||||
BFLD, Ser 2019-DPLO, Cl A | ||||||||
1.196%, VAR ICE LIBOR USD 1 Month+1.090%, 10/15/2034 (C) | 845 | 844 | ||||||
Bunker Hill Loan Depositary Trust, Ser 2019-2, Cl A1 | ||||||||
2.879%, 07/25/2049 (C) | 674 | 690 | ||||||
Bunker Hill Loan Depositary Trust, Ser 2019-3, Cl A1 | ||||||||
2.724%, 11/25/2059 (C) | 765 | 782 | ||||||
| SEI Institutional Managed Trust / Semi-Annual Report / March 31, 2021 | 53 |
SCHEDULE OF INVESTMENTS (Unaudited)
March 31, 2021
Core Fixed Income Fund (Continued)
| Description | Face Amount (Thousands) | Market Value ($ Thousands) | ||||||
MORTGAGE-BACKED SECURITIES (continued) |
| |||||||
BWAY Mortgage Trust, Ser 1740, Cl A | ||||||||
2.917%, 01/10/2035 (C) | $ | 1,320 | $ | 1,340 | ||||
BX Commercial Mortgage Trust, Ser 2019- XL, Cl F | ||||||||
2.106%, VAR ICE LIBOR USD 1 Month+2.000%, 10/15/2036 (C) | 2,549 | 2,547 | ||||||
BX Commercial Mortgage Trust, Ser 2019- XL, Cl A | ||||||||
1.026%, VAR ICE LIBOR USD 1 Month+0.920%, 10/15/2036 (C) | 1,119 | 1,120 | ||||||
BX Commercial Mortgage Trust, Ser IND, Cl H | ||||||||
3.106%, VAR ICE LIBOR USD 1 Month+3.000%, 11/15/2035 (C) | 4,102 | 4,103 | ||||||
BX Trust, Ser 2019-OC11, Cl A | ||||||||
3.202%, 12/09/2041 (C) | 610 | 637 | ||||||
BX Trust, Ser MMP, Cl A | ||||||||
1.106%, VAR ICE LIBOR USD 1 Month+1.000%, 08/15/2036 (C) | 279 | 278 | ||||||
BX, Ser MFM1, Cl A | ||||||||
0.806%, VAR ICE LIBOR USD 1 Month+0.700%, 01/15/2034 (C) | 735 | 733 | ||||||
Cali Mortgage Trust, Ser 2019-101C, Cl A | ||||||||
3.957%, 03/10/2029 | 1,280 | 1,424 | ||||||
CAMB Commercial Mortgage Trust, Ser 2019-LIFE, Cl A | ||||||||
1.176%, VAR ICE LIBOR USD 1 Month+1.070%, 12/15/2037 (C) | 940 | 941 | ||||||
CD Commercial Mortgage Trust, Ser 2006- CD2, Cl X, IO | ||||||||
0.023%, 01/15/2046 (B)(C) | 54 | – | ||||||
CD Commercial Mortgage Trust, Ser 2017- CD3, Cl A4 | ||||||||
3.631%, 02/10/2050 | 310 | 340 | ||||||
CD Commercial Mortgage Trust, Ser 2017- CD5, Cl XA, IO | ||||||||
0.882%, 08/15/2050 (B) | 8,510 | 334 | ||||||
Century Plaza Towers, Ser 2019-CPT, Cl A | ||||||||
2.865%, 11/13/2039 (C) | 1,160 | 1,200 | ||||||
CFCRE Commercial Mortgage Trust, Ser 2017-C8, Cl A1 | ||||||||
1.965%, 06/15/2050 | 2 | 2 | ||||||
CFCRE Commercial Mortgage Trust, Ser 2017-C8, Cl A4 | ||||||||
3.572%, 06/15/2050 | 371 | 401 | ||||||
CFCRE Commercial Mortgage Trust, Ser 2017-C8, Cl ASB | ||||||||
3.367%, 06/15/2050 | 494 | 529 | ||||||
CFK Trust, Ser MF2, Cl E | ||||||||
3.458%, 03/15/2039 (B)(C) | 2,840 | 2,668 | ||||||
CFK Trust, Ser MF2, Cl F | ||||||||
3.458%, 03/15/2039 (B)(C) | 2,960 | 2,631 | ||||||
| Description | Face Amount (Thousands) | Market Value ($ Thousands) | ||||||
MORTGAGE-BACKED SECURITIES (continued) |
| |||||||
Chase Mortgage Finance, Ser 2007-A1, Cl 2A1 | ||||||||
3.175%, 02/25/2037 (B) | $ | 9 | $ | 10 | ||||
Chase Mortgage Finance, Ser 2007-A1, Cl 9A1 | ||||||||
2.919%, 02/25/2037 (B) | 6 | 7 | ||||||
Chase Mortgage Finance, Ser 2007-A2, Cl 1A1 | ||||||||
3.477%, 06/25/2035 (B) | 13 | 13 | ||||||
CHT Mortgage Trust, Ser 2017-CSMO, Cl A | ||||||||
1.036%, VAR ICE LIBOR USD 1 Month+0.930%, 11/15/2036 (C) | 490 | 490 | ||||||
CIM Trust, Ser 2018-INV1, Cl A4 | ||||||||
4.000%, 08/25/2048 (B)(C) | 180 | 184 | ||||||
Citigroup Commercial Mortgage Trust, Ser 2013-375P, Cl A | ||||||||
3.251%, 05/10/2035 (C) | 240 | 250 | ||||||
Citigroup Commercial Mortgage Trust, Ser 2019-GC41, Cl A5 | ||||||||
2.869%, 08/10/2056 | 2,680 | 2,791 | ||||||
Citigroup Global Markets Mortgage Securities VII, Ser 2003-HYB1, Cl A | ||||||||
2.595%, 09/25/2033 (B) | 7 | 8 | ||||||
Citigroup Mortgage Loan Trust, Ser 2017- RP2, Cl A1 | ||||||||
3.250%, 07/25/2067 (B)(C) | 2,288 | 2,305 | ||||||
COLT Funding LLC, Ser 2019-4, Cl A1 | ||||||||
2.579%, 11/25/2049 (B)(C) | 498 | 503 | ||||||
COLT Mortgage Loan Trust, Ser 2020-2, Cl A1 | ||||||||
1.853%, 03/25/2065 (B)(C) | 567 | 572 | ||||||
COMM Mortgage Trust, Ser 2012-LC4, Cl A4 | ||||||||
3.288%, 12/10/2044 | 72 | 73 | ||||||
COMM Mortgage Trust, Ser 2013-CR12, Cl B | ||||||||
4.762%, 10/10/2046 (B) | 120 | 127 | ||||||
COMM Mortgage Trust, Ser 2013-CR12, Cl AM | ||||||||
4.300%, 10/10/2046 | 130 | 138 | ||||||
COMM Mortgage Trust, Ser 2013-CR12, Cl C | ||||||||
5.067%, 10/10/2046 (B) | 70 | 70 | ||||||
COMM Mortgage Trust, Ser 2013-CR6, Cl B | ||||||||
3.397%, 03/10/2046 (C) | 299 | 306 | ||||||
COMM Mortgage Trust, Ser 2014-UBS2, Cl XA, IO | ||||||||
1.146%, 03/10/2047 (B) | 1,751 | 48 | ||||||
COMM Mortgage Trust, Ser 2014-UBS2, Cl A5 | ||||||||
3.961%, 03/10/2047 | 236 | 255 | ||||||
COMM Mortgage Trust, Ser 2014-UBS3, Cl AM | ||||||||
4.012%, 06/10/2047 | 285 | 307 | ||||||
54 | SEI Institutional Managed Trust / Semi-Annual Report / March 31, 2021 |
| Description | Face Amount (Thousands) | Market Value ($ Thousands) | ||||||
MORTGAGE-BACKED SECURITIES (continued) |
| |||||||
COMM Mortgage Trust, Ser 2015-LC19, Cl XA, IO | ||||||||
1.120%, 02/10/2048 (B) | $ | 5,751 | $ | 204 | ||||
COMM Mortgage Trust, Ser 2017-PANW, Cl A | ||||||||
3.244%, 10/10/2029 (C) | 410 | 426 | ||||||
COMM Mortgage Trust, Ser CBM, Cl A2 | ||||||||
2.896%, 02/10/2037 (C) | 1,230 | 1,250 | ||||||
COMM Mortgage Trust, Ser CR11, Cl A4 | ||||||||
4.258%, 08/10/2050 | 402 | 434 | ||||||
COMM Mortgage Trust, Ser CR26, Cl C | ||||||||
4.480%, 10/10/2048 (B) | 410 | 443 | ||||||
COMM Mortgage Trust, Ser CR6, Cl A4 | ||||||||
3.101%, 03/10/2046 | 1,420 | 1,462 | ||||||
COMM Mortgage Trust, Ser LC21, Cl A4 | ||||||||
3.708%, 07/10/2048 | 311 | 340 | ||||||
COMM Mortgage Trust, Ser LC23, Cl A3 | ||||||||
3.521%, 10/10/2048 | 378 | 404 | ||||||
COMM Mortgage Trust, Ser LC23, Cl ASB | ||||||||
3.598%, 10/10/2048 | 744 | 790 | ||||||
COMM Mortgage Trust, Ser LC6, Cl AM | ||||||||
3.282%, 01/10/2046 | 465 | 483 | ||||||
COMM Mortgage Trust, Ser UBS4, Cl A4 | ||||||||
3.420%, 08/10/2047 | 729 | 771 | ||||||
Commercial Mortgage Pass-Through | ||||||||
Certificates, Ser 2012-CR4, Cl AM | ||||||||
3.251%, 10/15/2045 | 590 | 596 | ||||||
Commercial Mortgage Pass-Through Certificates, Ser CR14, Cl B | ||||||||
4.619%, 02/10/2047 (B) | 850 | 922 | ||||||
Connecticut Avenue Securities Trust, Ser 2019-R02, Cl 1M2 | ||||||||
2.409%, VAR ICE LIBOR USD 1 Month+2.300%, 08/25/2031 (C) | 1,252 | 1,254 | ||||||
Connecticut Avenue Securities Trust, Ser 2019-R07, Cl 1M2 | ||||||||
2.209%, VAR ICE LIBOR USD 1 Month+2.100%, 10/25/2039 (C) | 1,699 | 1,700 | ||||||
Core Mortgage Trust, Ser 2019-CORE, Cl A | ||||||||
0.986%, VAR ICE LIBOR USD 1 Month+0.880%, 12/15/2031 (C) | 4,105 | 4,105 | ||||||
Credit Suisse Commercial Mortgage Trust, Ser 2006-C5, Cl AJ | ||||||||
5.373%, 12/15/2039 | 188 | 35 | ||||||
Credit Suisse First Boston Mortgage Securities, Ser 2003-27, Cl 5A3 | ||||||||
5.250%, 11/25/2033 | 7 | 7 | ||||||
Credit Suisse First Boston Mortgage Securities, Ser 2003-29, Cl 5A1 | ||||||||
7.000%, 12/25/2033 | 22 | 23 | ||||||
Credit Suisse First Boston Mortgage Securities, Ser 2003-AR24, Cl 2A4 | ||||||||
2.751%, 10/25/2033 (B) | 656 | 644 | ||||||
| Description | Face Amount (Thousands) | Market Value ($ Thousands) | ||||||
MORTGAGE-BACKED SECURITIES (continued) |
| |||||||
Credit Suisse Mortgage Trust, Ser 2019, Cl B | ||||||||
4.024%, 12/15/2021 | $ | 3,790 | $ | 3,754 | ||||
CSAIL Commercial Mortgage Trust, Ser 2015-C2, Cl A4 | ||||||||
3.504%, 06/15/2057 | 414 | 447 | ||||||
CSAIL Commercial Mortgage Trust, Ser 2015-C3, Cl A3 | ||||||||
3.447%, 08/15/2048 | 530 | 564 | ||||||
CSAIL Commercial Mortgage Trust, Ser 2015-C3, Cl A2 | ||||||||
3.033%, 08/15/2048 | 24 | 24 | ||||||
CSAIL Commercial Mortgage Trust, Ser 2015-C4, Cl A4 | ||||||||
3.808%, 11/15/2048 | 345 | 378 | ||||||
CSAIL Commercial Mortgage Trust, Ser C16, Cl A3 | ||||||||
3.329%, 06/15/2052 | 596 | 636 | ||||||
CSAIL Commercial Mortgage Trust, Ser C17, Cl A4 | ||||||||
2.763%, 09/15/2052 | 466 | 479 | ||||||
CSAIL Commercial Mortgage Trust, Ser C19, Cl AS | ||||||||
2.971%, 03/15/2053 | 580 | 601 | ||||||
CSAIL Commercial Mortgage Trust, Ser C19, Cl C | ||||||||
3.614%, 03/15/2053 (B) | 500 | 505 | ||||||
CSAIL Commercial Mortgage Trust, Ser C20, Cl A3 | ||||||||
2.805%, 03/15/2054 | 1,746 | 1,780 | ||||||
CSMC, Ser 2021-2R, Cl 1A1 | ||||||||
1.856%, VAR ICE LIBOR USD 1 Month+1.750%, 07/25/2047 (C) | 1,310 | 1,310 | ||||||
CSMC Trust, Ser 2014-USA, Cl E | ||||||||
4.373%, 09/15/2037 (C) | 290 | 240 | ||||||
CSMC Trust, Ser 2017-CHOP, Cl G | ||||||||
5.456%, VAR ICE LIBOR USD 1 Month+5.350%, 07/15/2032 (C) | 1,000 | 704 | ||||||
CSMC Trust, Ser 2017-PFHP, Cl A | ||||||||
1.056%, VAR ICE LIBOR USD 1 Month+0.950%, 12/15/2030 (C) | 1,190 | 1,182 | ||||||
CSMC Trust, Ser 2017-RPL1, Cl M2 | ||||||||
3.035%, 07/25/2057 (B)(C) | 1,760 | 1,516 | ||||||
CSMC Trust, Ser 2018-J1, Cl A2 | ||||||||
3.500%, 02/25/2048 (B)(C) | 3,929 | 3,988 | ||||||
CSMC Trust, Ser 2020-RPL4, Cl A1 | ||||||||
2.000%, 01/25/2060 (B)(C) | 956 | 981 | ||||||
CSMC, Ser 2014-11R, Cl 9A2 | ||||||||
0.258%, VAR ICE LIBOR USD 1 Month+0.140%, 10/27/2036 (C) | 2,433 | 2,116 | ||||||
CSMC, Ser 2014-7R, Cl 8A1 | ||||||||
3.176%, 07/27/2037 (B)(C) | 96 | 95 | ||||||
CSMC, Ser 2014-USA, Cl A2 | ||||||||
3.953%, 09/15/2037 (C) | 2,135 | 2,240 | ||||||
| SEI Institutional Managed Trust / Semi-Annual Report / March 31, 2021 | 55 |
SCHEDULE OF INVESTMENTS (Unaudited)
March 31, 2021
Core Fixed Income Fund (Continued)
Description | Face Amount (Thousands) | Market Value ($ Thousands) | ||||||
MORTGAGE-BACKED SECURITIES (continued) |
| |||||||
CSMC, Ser 2015-5R, Cl 1A1 | ||||||||
1.299%, 09/27/2046 (B)(C) | $ | 228 | $ | 229 | ||||
DBCCRE Mortgage Trust, Ser 2014-ARCP, Cl A | ||||||||
4.238%, 01/10/2034 (C) | 1,175 | 1,253 | ||||||
DBCCRE Mortgage Trust, Ser 2018-ARCP, Cl C | ||||||||
4.935%, 01/10/2034 (B)(C) | 315 | 332 | ||||||
DBUBS Mortgage Trust, Ser 2011-LC2A, Cl A4 | ||||||||
4.537%, 07/10/2044 (C) | 30 | 30 | ||||||
DC Office Trust, Ser 2019-MTC, Cl A | ||||||||
2.965%, 09/15/2045 (C) | 1,240 | 1,292 | ||||||
DSLA Mortgage Loan Trust, Ser 2004-AR2, Cl A2B | ||||||||
0.910%, VAR ICE LIBOR USD 1 Month+0.800%, 11/19/2044 | 447 | 418 | ||||||
EverBank Mortgage Loan Trust, Ser 2018-1, Cl A22 | ||||||||
3.500%, 02/25/2048 (B)(C) | 350 | 354 | ||||||
FHLMC Structured Agency Credit Risk Debt Notes, Ser 2016-DNA2, Cl M3 | ||||||||
4.759%, VAR ICE LIBOR USD 1 Month+4.650%, 10/25/2028 | 248 | 260 | ||||||
Flagstar Mortgage Trust, Ser 2018-2, Cl A4 | ||||||||
3.500%, 04/25/2048 (B)(C) | 1,055 | 1,062 | ||||||
FNMA Connecticut Avenue Securities, Ser 2014-C03, Cl 1M2 | ||||||||
3.109%, VAR ICE LIBOR USD 1 Month+3.000%, 07/25/2024 | 2,427 | 2,393 | ||||||
FNMA Connecticut Avenue Securities, Ser 2018-C05, Cl 1M2 | ||||||||
2.459%, VAR ICE LIBOR USD 1 Month+2.350%, 01/25/2031 | 2,171 | 2,171 | ||||||
FNMA Connecticut Avenue Securities, Ser 2018-C05, Cl 1B1 | ||||||||
4.359%, VAR ICE LIBOR USD 1 Month+4.250%, 01/25/2031 | 540 | 549 | ||||||
UMBS TBA | ||||||||
2.000%, 04/15/2051 to 06/11/2051 | 208,225 | 207,286 | ||||||
1.500%, 04/15/2036 to 05/15/2036 | 29,600 | 29,692 | ||||||
FWD Securitization Trust, Ser 2019-INV1, Cl A1 | ||||||||
2.810%, 06/25/2049 (B)(C) | 894 | 925 | ||||||
GCAT, Ser 2019-NQM1, Cl A1 | ||||||||
2.985%, 02/25/2059 (C) | 213 | 214 | ||||||
GNMA | ||||||||
4.500%, 08/20/2047 to 04/20/2048 | 1,027 | 1,121 | ||||||
3.500%, 09/20/2048 to 10/20/2050 | 865 | 917 | ||||||
3.000%, 07/20/2050 | 1,488 | 1,551 | ||||||
2.500%, 12/20/2050 to 03/20/2051 | 16,544 | 17,076 | ||||||
2.000%, 12/20/2050 to 03/20/2051 | 2,378 | 2,402 | ||||||
Description | Face Amount (Thousands) | Market Value ($ Thousands) | ||||||
MORTGAGE-BACKED SECURITIES (continued) |
| |||||||
GNMA TBA | ||||||||
2.500%, 06/01/2045 to 05/15/2046 | $ | 17,350 | $ | 17,847 | ||||
GS Mortgage Securities II, Ser 2010-C1, Cl A2 | ||||||||
4.592%, 08/10/2043 (C) | 228 | 228 | ||||||
GS Mortgage Securities II, Ser 2017-SLP, Cl C | ||||||||
3.924%, 10/10/2032 (C) | 1,310 | 1,320 | ||||||
GS Mortgage Securities II, Ser GC30, Cl B | ||||||||
4.030%, 05/10/2050 (B) | 480 | 510 | ||||||
GS Mortgage Securities II, Ser SRP5, Cl A | ||||||||
1.406%, VAR ICE LIBOR USD 1 Month+1.300%, 09/15/2031 (C) | 2,900 | 2,524 | ||||||
GS Mortgage Securities Trust, Ser 2006- GG8, Cl AJ | ||||||||
5.622%, 11/10/2039 | 183 | 61 | ||||||
GS Mortgage Securities Trust, Ser 2006- GG8, Cl X, IO | ||||||||
0.910%, 11/10/2039 (B)(C) | 233 | – | ||||||
GS Mortgage Securities Trust, Ser 2012- GC6, Cl A3 | ||||||||
3.482%, 01/10/2045 | 1,069 | 1,079 | ||||||
GS Mortgage Securities Trust, Ser 2013- GC16, Cl B | ||||||||
5.161%, 11/10/2046 (B) | 270 | 290 | ||||||
GS Mortgage Securities Trust, Ser 2014- GC18, Cl A4 | ||||||||
4.074%, 01/10/2047 | 977 | 1,053 | ||||||
GS Mortgage Securities Trust, Ser 2014- GC26, Cl B | ||||||||
4.215%, 11/10/2047 (B) | 680 | 696 | ||||||
GS Mortgage Securities Trust, Ser GSA2, Cl A4 | ||||||||
1.721%, 12/12/2053 | 820 | 773 | ||||||
GS Mortgage-Backed Securities Trust, Ser 2018-RPL1, Cl A1A | ||||||||
3.750%, 10/25/2057 (C) | 3,643 | 3,852 | ||||||
GSMPS Mortgage Loan Trust, Ser 1998-1, Cl A | ||||||||
8.000%, 09/19/2027 (B)(C) | 13 | 13 | ||||||
GSR Mortgage Loan Trust, Ser 2003-13, Cl 1A1 | ||||||||
2.823%, 10/25/2033 (B) | 155 | 164 | ||||||
GSR Mortgage Loan Trust, Ser 2004-8F, Cl 2A3 | ||||||||
6.000%, 09/25/2034 | 14 | 14 | ||||||
GSR Mortgage Loan Trust, Ser 2007-1F, Cl 2A4 | ||||||||
5.500%, 01/25/2037 | 4 | 4 | ||||||
HarborView Mortgage Loan, Ser 2004-3, Cl 1A | ||||||||
2.723%, 05/19/2034 (B) | 578 | 583 | ||||||
56 | SEI Institutional Managed Trust / Semi-Annual Report / March 31, 2021 |
| Description | Face Amount (Thousands) | Market Value ($ Thousands) | ||||||
MORTGAGE-BACKED SECURITIES (continued) |
| |||||||
Hudson Yards Mortgage Trust, Ser 2019- 30HY, Cl A | ||||||||
3.228%, 07/10/2039 (C) | $ | 1,225 | $ | 1,304 | ||||
Hudson Yards Mortgage Trust, Ser 2019- 55HY, Cl A | ||||||||
2.943%, 12/10/2041 (B)(C) | 1,240 | 1,293 | ||||||
Impac Secured Assets Trust, Ser 2006-2, Cl 2A1 | ||||||||
0.459%, VAR ICE LIBOR USD 1 Month+0.350%, 08/25/2036 | 4 | 4 | ||||||
Impact Funding, Ser 2010-1, Cl A1 | ||||||||
5.314%, 01/25/2051 (C) | 1,043 | 1,111 | ||||||
JPMBB Commercial Mortgage Securities Trust, Ser 2013-C17, Cl B | ||||||||
4.889%, 01/15/2047 (B) | 130 | 139 | ||||||
JPMBB Commercial Mortgage Securities Trust, Ser 2014-C21, Cl A5 | ||||||||
3.775%, 08/15/2047 | 358 | 386 | ||||||
JPMBB Commercial Mortgage Securities Trust, Ser 2014-C22, Cl C | ||||||||
4.554%, 09/15/2047 (B) | 120 | 114 | ||||||
JPMBB Commercial Mortgage Securities Trust, Ser 2014-C23, Cl A4 | ||||||||
3.670%, 09/15/2047 | 541 | 576 | ||||||
JPMBB Commercial Mortgage Securities Trust, Ser 2015-C28, Cl A3 | ||||||||
2.912%, 10/15/2048 | 1,792 | 1,857 | ||||||
JPMBB Commercial Mortgage Securities Trust, Ser C21, Cl AS | ||||||||
3.997%, 08/15/2047 | 415 | 449 | ||||||
JPMDB Commercial Mortgage Securities Trust, Ser COR6, Cl A4 | ||||||||
3.057%, 11/13/2052 | 366 | 386 | ||||||
JPMorgan Chase Commercial Mortgage Securities Trust, Ser 2006-CB15, Cl X1, IO | ||||||||
0.000%, 06/12/2043 (B) | 510 | – | ||||||
JPMorgan Chase Commercial Mortgage Securities Trust, Ser 2007-CB19, Cl AJ | ||||||||
5.897%, 02/12/2049 (B) | 46 | 22 | ||||||
JPMorgan Chase Commercial Mortgage Securities Trust, Ser 2007-LD12, Cl AJ | ||||||||
6.336%, 02/15/2051 (B) | 2 | 2 | ||||||
JPMorgan Chase Commercial Mortgage Securities Trust, Ser 2011-C5, Cl B | ||||||||
5.425%, 08/15/2046 (B)(C) | 296 | 298 | ||||||
JPMorgan Chase Commercial Mortgage Securities Trust, Ser 2014-C20, Cl C | ||||||||
5.376%, 07/15/2047 (B) | 380 | 390 | ||||||
JPMorgan Chase Commercial Mortgage Securities Trust, Ser 2018-BCON, Cl B | ||||||||
3.756%, 01/05/2031 (B)(C) | 1,305 | 1,328 | ||||||
| Description | Face Amount (Thousands) | Market Value ($ Thousands) | ||||||
MORTGAGE-BACKED SECURITIES (continued) |
| |||||||
JPMorgan Chase Commercial Mortgage Securities Trust, Ser 2019-OSB, Cl A | ||||||||
3.397%, 06/05/2039 (C) | $ | 1,500 | $ | 1,609 | ||||
JPMorgan Mortgage Trust, Ser 2006-A2, Cl 5A3 | ||||||||
2.534%, 11/25/2033 (B) | 19 | 20 | ||||||
JPMorgan Mortgage Trust, Ser 2006-A2, Cl 4A1 | ||||||||
3.053%, 08/25/2034 (B) | 40 | 42 | ||||||
JPMorgan Mortgage Trust, Ser 2015-5, Cl A9 | ||||||||
2.482%, 05/25/2045 (B)(C) | 75 | 78 | ||||||
JPMorgan Mortgage Trust, Ser 2018-4, Cl A1 | ||||||||
3.500%, 10/25/2048 (B)(C) | 306 | 311 | ||||||
JPMorgan Mortgage Trust, Ser 2018-5, Cl A1 | ||||||||
3.500%, 10/25/2048 (B)(C) | 834 | 850 | ||||||
KKR Industrial Portfolio Trust, Ser KDIP, Cl A | ||||||||
0.656%, VAR ICE LIBOR USD 1 Month+0.550%, 12/15/2037 (C) | 455 | 454 | ||||||
LB-UBS Commercial Mortgage Trust, Ser 2006-C1, Cl XCL, IO | ||||||||
0.374%, 02/15/2041 (B)(C) | 304 | – | ||||||
Lehman XS Trust, Ser 2007-16N, Cl 2A2 | ||||||||
0.959%, VAR ICE LIBOR USD 1 Month+0.850%, 09/25/2047 | 5,739 | 5,799 | ||||||
Master Resecuritization Trust, Ser 2005, Cl 3, PO | ||||||||
0.000%, 05/28/2035 (A)(C) | 3 | 3 | ||||||
MASTR Reperforming Loan Trust, Ser 2005- 1, Cl 1A1 | ||||||||
6.000%, 08/25/2034 (C) | 1,250 | 949 | ||||||
Mello Warehouse Securitization Trust, Ser 2020-1, Cl A | ||||||||
1.009%, VAR ICE LIBOR USD 1 Month+0.900%, 10/25/2053 (C) | 895 | 895 | ||||||
Mello Warehouse Securitization Trust, Ser 2020-2, Cl A | ||||||||
0.909%, VAR ICE LIBOR USD 1 Month+0.800%, 11/25/2053 (C) | 971 | 972 | ||||||
Mello Warehouse Securitization Trust, Ser 2021-1, Cl A | ||||||||
0.809%, VAR ICE LIBOR USD 1 Month+0.700%, 02/25/2055 (C) | 280 | 280 | ||||||
Merrill Lynch Mortgage Investors Trust, Ser 2003-A4, Cl 2A | ||||||||
2.874%, 07/25/2033 (B) | 9 | 9 | ||||||
Merrill Lynch Mortgage Investors Trust, Ser 2004-A1, Cl 4A | ||||||||
2.375%, 02/25/2034 (B) | 38 | 39 | ||||||
Mill City Mortgage Loan Trust, Ser 2021- NMR1, Cl A1 | ||||||||
1.125%, 11/25/2060 (B)(C) | 1,265 | 1,271 | ||||||
SEI Institutional Managed Trust / Semi-Annual Report / March 31, 2021 | 57 |
SCHEDULE OF INVESTMENTS (Unaudited)
March 31, 2021
Core Fixed Income Fund (Continued)
| Description | Face Amount (Thousands) | Market Value ($ Thousands) | ||||||
MORTGAGE-BACKED SECURITIES (continued) |
| |||||||
MKT Mortgage Trust, Ser 525M, Cl A | ||||||||
2.694%, 02/12/2040 (C) | $ | 1,750 | $ | 1,783 | ||||
ML-CFC Commercial Mortgage Trust, Ser 2006-4, Cl XC, IO | ||||||||
4.624%, 12/12/2049 (B)(C) | 2 | – | ||||||
ML-CFC Commercial Mortgage Trust, Ser 2007-5, Cl AJ | ||||||||
5.450%, 08/12/2048 (B) | 84 | 46 | ||||||
ML-CFC Commercial Mortgage Trust, Ser 2007-5, Cl AJFL | ||||||||
5.450%, 08/12/2048 (B)(C) | 11 | 6 | ||||||
ML-CFC Commercial Mortgage Trust, Ser 2007-9, Cl AJ | ||||||||
6.193%, 09/12/2049 (B) | 28 | 27 | ||||||
Morgan Stanley BAML Trust, Ser 2012-CKSV, Cl A2 | ||||||||
3.277%, 10/15/2030 (C) | 758 | 751 | ||||||
Morgan Stanley Bank of America Merrill Lynch Trust, Ser 2012-C6, Cl B | ||||||||
3.930%, 11/15/2045 | 390 | 401 | ||||||
Morgan Stanley Bank of America Merrill Lynch Trust, Ser 2013-C9, Cl AS | ||||||||
3.456%, 05/15/2046 | 80 | 83 | ||||||
Morgan Stanley Bank of America Merrill Lynch Trust, Ser 2015-C20, Cl A4 | ||||||||
3.249%, 02/15/2048 | 138 | 148 | ||||||
Morgan Stanley Bank of America Merrill Lynch Trust, Ser 2015-C25, Cl A5 | ||||||||
3.635%, 10/15/2048 | 250 | 273 | ||||||
Morgan Stanley Bank of America Merrill Lynch Trust, Ser C34, Cl B | ||||||||
4.111%, 11/15/2052 (B) | 1,030 | 1,106 | ||||||
Morgan Stanley Bank of America Merrill Lynch Trust, Ser C5, Cl A4 | ||||||||
3.176%, 08/15/2045 | 220 | 225 | ||||||
Morgan Stanley Capital I Trust, Ser 2006- IQ12, Cl AJ | ||||||||
5.399%, 12/15/2043 | 54 | 36 | ||||||
Morgan Stanley Capital I Trust, Ser 2007- HQ11, Cl X, IO | ||||||||
0.003%, 02/12/2044 (B)(C) | 23 | – | ||||||
Morgan Stanley Capital I Trust, Ser 2007- IQ16, Cl AJ | ||||||||
6.100%, 12/12/2049 (B) | 85 | 48 | ||||||
Morgan Stanley Capital I Trust, Ser 2007- T27, Cl AJ | ||||||||
6.015%, 06/11/2042 (B) | 1,365 | 1,413 | ||||||
Morgan Stanley Capital I Trust, Ser 2016- BNK2, Cl XA, IO | ||||||||
1.042%, 11/15/2049 (B) | 3,323 | 134 | ||||||
| Description | Face Amount (Thousands) | Market Value ($ Thousands) | ||||||
MORTGAGE-BACKED SECURITIES (continued) |
| |||||||
Morgan Stanley Capital I Trust, Ser 2017- ASHF, Cl A | ||||||||
0.956%, VAR ICE LIBOR USD 1 Month+0.850%, 11/15/2034 (C) | $ | 38 | $ | 37 | ||||
Morgan Stanley Capital I Trust, Ser 2019- BPR, Cl A | ||||||||
1.506%, VAR ICE LIBOR USD 1 Month+1.400%, 05/15/2036 (C) | 1,720 | 1,671 | ||||||
Morgan Stanley Capital I Trust, Ser HR8, Cl A3 | ||||||||
1.790%, 07/15/2053 | 600 | 572 | ||||||
MSCG Trust, Ser 2015-ALDR, Cl A2 | ||||||||
3.462%, 06/07/2035 (B)(C) | 490 | 478 | ||||||
Natixis Commercial Mortgage Securities Trust, Ser 2PAC, Cl A | ||||||||
2.966%, 12/15/2038 (C) | 1,260 | 1,306 | ||||||
New Residential Mortgage Loan Trust, Ser 2017-1A, Cl A1 | ||||||||
4.000%, 02/25/2057 (B)(C) | 881 | 944 | ||||||
New Residential Mortgage Loan Trust, Ser 2019-NQM4, Cl A1 | ||||||||
2.492%, 09/25/2059 (B)(C) | 503 | 511 | ||||||
Nomura Asset Acceptance Alternative Loan Trust, Ser 2007-1, Cl 1A3 | ||||||||
5.957%, 03/25/2047 | 78 | 80 | ||||||
OBX Trust, Ser 2019-EXP1, Cl 1A3 | ||||||||
4.000%, 01/25/2059 (B)(C) | 357 | 365 | ||||||
OBX Trust, Ser 2020-EXP1, Cl 2A1A | ||||||||
0.859%, VAR ICE LIBOR USD 1 Month+0.750%, 02/25/2060 (C) | 885 | 887 | ||||||
OBX Trust, Ser 2020-EXP3, Cl 2A1A | ||||||||
1.009%, VAR ICE LIBOR USD 1 Month+0.900%, 01/25/2060 (C) | 699 | 701 | ||||||
One Bryant Park Trust, Ser 2019-OBP, Cl A | ||||||||
2.516%, 09/15/2054 (C) | 1,570 | 1,584 | ||||||
PHH Alternative Mortgage Trust, Ser 2007- 3, Cl A3 | ||||||||
0.409%, VAR ICE LIBOR USD 1 Month+0.300%, 07/25/2037 | 5,688 | 5,633 | ||||||
Prime Mortgage Trust, Ser 2004-CL1, Cl 1, PO | ||||||||
0.000%, 02/25/2034 (A) | 4 | 3 | ||||||
Prime Mortgage Trust, Ser 2004-CL1, Cl 1A1 | ||||||||
6.000%, 02/25/2034 | 13 | 13 | ||||||
Prime Mortgage Trust, Ser 2006-DR1, Cl 2A1 | ||||||||
5.500%, 05/25/2035 (C) | 860 | 783 | ||||||
Radnor RE, Ser 2018-1, Cl M2 | ||||||||
2.809%, VAR ICE LIBOR USD 1 Month+2.700%, 03/25/2028 (C) | 7,270 | 7,327 | ||||||
RBSCF Trust, Ser 2013-GSP, Cl A | ||||||||
3.834%, 01/15/2032 (B)(C) | 445 | 470 | ||||||
58 | SEI Institutional Managed Trust / Semi-Annual Report / March 31, 2021 |
| Description | Face Amount (Thousands) | Market Value ($ Thousands) | ||||||
MORTGAGE-BACKED SECURITIES (continued) |
| |||||||
Residential Asset Securitization Trust, Ser 2004-IP2, Cl 2A1 | ||||||||
3.006%, 12/25/2034 (B) | $ | 230 | $ | 229 | ||||
Residential Mortgage Loan Trust, Ser 2019- 3, Cl A1 | ||||||||
2.633%, 09/25/2059 (B)(C) | 1,450 | 1,474 | ||||||
Rosslyn Portfolio Trust, Ser 2017-R17, Cl A | ||||||||
1.939%, VAR ICE LIBOR USD 1 Month+0.950%, 06/15/2033 (C) | 282 | 282 | ||||||
Seasoned Credit Risk Transfer Trust, Ser 2016-1, Cl M2 | ||||||||
3.750%, 09/25/2055 (B)(C) | 2,960 | 3,015 | ||||||
Seasoned Credit Risk Transfer Trust, Ser 2019-1, Cl M | ||||||||
4.750%, 07/25/2058 (B)(C) | 2,840 | 2,962 | ||||||
SFAVE Commercial Mortgage Securities Trust, Ser 2015-5AVE, Cl A2B | ||||||||
4.144%, 01/05/2043 (B)(C) | 75 | 72 | ||||||
SFAVE Commercial Mortgage Securities Trust, Ser 2015-5AVE, Cl A1 | ||||||||
3.872%, 01/05/2043 (B)(C) | 390 | 384 | ||||||
SG Residential Mortgage Trust, Ser 2019-3, Cl A1 | ||||||||
2.703%, 09/25/2059 (B)(C) | 437 | 443 | ||||||
Silverstone Master Issuer, Ser 2018-1A, Cl 1A | ||||||||
0.614%, VAR ICE LIBOR USD 3 Month+0.390%, 01/21/2070 (C) | 179 | 179 | ||||||
STACR Trust, Ser 2018-DNA3, Cl M2A | ||||||||
2.209%, VAR ICE LIBOR USD 1 Month+2.100%, 09/25/2048 (C) | 550 | 551 | ||||||
STAR Trust, Ser 2021-1, Cl A1 | ||||||||
1.219%, 05/25/2065 (B)(C) | 744 | 744 | ||||||
Starwood Mortgage Residential Trust, Ser 2019-INV1, Cl A1 | ||||||||
2.610%, 09/27/2049 (B)(C) | 509 | 516 | ||||||
Starwood Mortgage Residential Trust, Ser 2020-1, Cl A1 | ||||||||
2.275%, 02/25/2050 (B)(C) | 940 | 957 | ||||||
Starwood Mortgage Residential Trust, Ser 2020-3, Cl A1 | ||||||||
1.486%, 04/25/2065 (B)(C) | 686 | 693 | ||||||
Starwood Mortgage Residential Trust, Ser 2020-INV1, Cl A1 | ||||||||
1.027%, 11/25/2055 (B)(C) | 652 | 654 | ||||||
Structured Asset Mortgage Investments II Trust, Ser 2007-AR3, Cl 2A1 | ||||||||
0.299%, VAR ICE LIBOR USD 1 Month+0.190%, 09/25/2047 | 4,228 | 4,034 | ||||||
Structured Asset Securities Mortgage Pass-Through Certificates, Ser 2003- 24A, Cl 3A2 | ||||||||
2.511%, 07/25/2033 (B) | 39 | 40 | ||||||
| Description | Face Amount (Thousands) | Market Value ($ Thousands) | ||||||
MORTGAGE-BACKED SECURITIES (continued) |
| |||||||
Structured Asset Securities Mortgage Pass-Through Certificates, Ser 2003- 37A, Cl 2A | ||||||||
2.404%, 12/25/2033 (B) | $ | 15 | $ | 15 | ||||
UBS-Barclays Commercial Mortgage Trust, Ser 2012-C4, Cl D | ||||||||
4.470%, 12/10/2045 (B)(C) | 670 | 467 | ||||||
Verus Securitization Trust, Ser 2019-2, Cl A1 | ||||||||
3.211%, 05/25/2059 (B)(C) | 722 | 724 | ||||||
Verus Securitization Trust, Ser 2019-3, Cl A1 | ||||||||
2.784%, 07/25/2059 (C) | 998 | 1,017 | ||||||
Verus Securitization Trust, Ser 2019-4, Cl A1 | ||||||||
2.642%, 11/25/2059 (C) | 1,343 | 1,366 | ||||||
Verus Securitization Trust, Ser 2019-INV1, Cl A1 | ||||||||
3.402%, 12/25/2059 (B)(C) | 369 | 373 | ||||||
Verus Securitization Trust, Ser 2019-INV2, Cl A1 | ||||||||
2.913%, 07/25/2059 (B)(C) | 553 | 563 | ||||||
Verus Securitization Trust, Ser 2019-INV3, Cl A1 | ||||||||
2.692%, 11/25/2059 (B)(C) | 699 | 712 | ||||||
Verus Securitization Trust, Ser 2020-2, Cl A1 | ||||||||
2.226%, 05/25/2060 (B)(C) | 1,204 | 1,216 | ||||||
Verus Securitization Trust, Ser 2020-5, Cl A1 | ||||||||
1.218%, 05/25/2065 (C) | 258 | 259 | ||||||
Verus Securitization Trust, Ser 2021-1, Cl A1 | ||||||||
0.815%, 01/25/2066 (B)(C) | 803 | 800 | ||||||
Verus Securitization Trust, Ser 2021-R1, Cl A1 | ||||||||
0.820%, 10/25/2063 (B)(C) | 1,040 | 1,039 | ||||||
Visio Trust, Ser 2019-1, Cl A1 | ||||||||
3.572%, 06/25/2054 (B)(C) | 328 | 330 | ||||||
Visio Trust, Ser 2020-1R, Cl A1 | ||||||||
1.312%, 11/25/2055 (C) | 690 | 693 | ||||||
VNDO Mortgage Trust, Ser 2012-6AVE, Cl C | ||||||||
3.337%, 11/15/2030 (B)(C) | 987 | 1,018 | ||||||
VNO Mortgage Trust, Ser 2012-6AVE, Cl A | ||||||||
2.996%, 11/15/2030 (C) | 110 | 113 | ||||||
WaMu Mortgage Pass-Through Certificates, Ser 2003-AR10, Cl A7 | ||||||||
2.565%, 10/25/2033 (B) | 29 | 29 | ||||||
WaMu Mortgage Pass-Through Certificates, Ser 2003-AR7, Cl A7 | ||||||||
2.714%, 08/25/2033 (B) | 17 | 17 | ||||||
WaMu Mortgage Pass-Through Certificates, Ser 2003-AR9, Cl 1A6 | ||||||||
2.768%, 09/25/2033 (B) | 29 | 29 | ||||||
WaMu Mortgage Pass-Through Certificates, Ser 2003-S4, Cl 2A10 | ||||||||
17.164%, 06/25/2033 (B) | 5 | 6 | ||||||
SEI Institutional Managed Trust / Semi-Annual Report / March 31, 2021 | 59 |
SCHEDULE OF INVESTMENTS (Unaudited)
March 31, 2021
Core Fixed Income Fund (Continued)
| Description | Face Amount (Thousands) | Market Value ($ Thousands) | ||||||
MORTGAGE-BACKED SECURITIES (continued) |
| |||||||
WaMu Mortgage Pass-Through Certificates, Ser 2003-S9, Cl A8 | ||||||||
5.250%, 10/25/2033 | $ | 65 | $ | 66 | ||||
WaMu Mortgage Pass-Through Certificates, Ser 2004-AR3, Cl A2 | ||||||||
3.545%, 06/25/2034 (B) | 17 | 17 | ||||||
WaMu Mortgage Pass-Through Certificates, Ser 2004-RA4, Cl 3A | ||||||||
7.500%, 07/25/2034 | 70 | 76 | ||||||
WaMu Mortgage Pass-Through Certificates, Ser 2005-AR13, Cl A1A3 | ||||||||
1.669%, VAR ICE LIBOR USD 1 Month+1.560%, 10/25/2045 | 267 | 278 | ||||||
WaMu Mortgage Pass-Through Certificates, Ser 2005-AR15, Cl A1A1 | ||||||||
0.629%, VAR ICE LIBOR USD 1 Month+0.260%, 11/25/2045 | 4,897 | 4,818 | ||||||
WaMu Mortgage Pass-Through Certificates, Ser 2007-OA1, Cl A1A | ||||||||
0.959%, VAR 12 Month Treas Avg+0.700%, 02/25/2047 | 1,315 | 1,252 | ||||||
Washington Mutual Mortgage Pass-Through Certificates Trust, Ser 2007-OA2, Cl 2A | ||||||||
0.959%, VAR 12 Month Treas Avg+0.700%, 01/25/2047 | 847 | 749 | ||||||
Waterfall Commercial Mortgage Trust, Ser 2015-SBC5, Cl A | ||||||||
4.104%, 09/14/2022 (B)(C) | 267 | 272 | ||||||
Wells Fargo Commercial Mortgage Trust, Ser 2012-LC5, Cl C | ||||||||
4.693%, 10/15/2045 (B) | 780 | 800 | ||||||
Wells Fargo Commercial Mortgage Trust, Ser 2013-LC12, Cl B | ||||||||
4.274%, 07/15/2046 (B) | 20 | 20 | ||||||
Wells Fargo Commercial Mortgage Trust, Ser 2014-LC18, Cl A5 | ||||||||
3.405%, 12/15/2047 | 570 | 616 | ||||||
Wells Fargo Commercial Mortgage Trust, Ser 2016-C36, Cl XA, IO | ||||||||
1.304%, 11/15/2059 (B) | 5,205 | 262 | ||||||
Wells Fargo Mortgage Backed Securities Trust, Ser 2005-AR7, Cl B1 | ||||||||
4.073%, 05/25/2035 (B) | 1,996 | 1,809 | ||||||
Wells Fargo Mortgage-Backed Securities Trust, Ser 2015-5R, Cl 2A1 | ||||||||
2.656%, 03/26/2035 (B)(C) | 29 | 29 | ||||||
WFRBS Commercial Mortgage Trust, Ser 2012-C7, Cl XA, IO | ||||||||
1.302%, 06/15/2045 (B)(C) | 587 | 5 | ||||||
WFRBS Commercial Mortgage Trust, Ser 2013-C13, Cl XA, IO | ||||||||
1.184%, 05/15/2045 (B)(C) | 822 | 16 | ||||||
| Description | Face Amount (Thousands) | Market Value ($ Thousands) | ||||||
MORTGAGE-BACKED SECURITIES (continued) |
| |||||||
WFRBS Commercial Mortgage Trust, Ser 2014-C19, Cl B | ||||||||
4.723%, 03/15/2047 (B) | $ | 110 | $ | 119 | ||||
WFRBS Commercial Mortgage Trust, Ser 2014-C21, Cl B | ||||||||
4.213%, 08/15/2047 (B) | 300 | 320 | ||||||
WFRBS Commercial Mortgage Trust, Ser C25, Cl ASB | ||||||||
3.369%, 11/15/2047 | 403 | 422 | ||||||
|
|
| ||||||
| 497,591 | ||||||||
|
|
| ||||||
Total Mortgage-Backed Securities | 1,534,297 | |||||||
|
|
| ||||||
U.S. TREASURY OBLIGATIONS — 30.3% |
| |||||||
U.S. Treasury Bills | ||||||||
0.090%, 05/04/2021 (A) | 8,840 | 8,840 | ||||||
0.052%, 08/12/2021 (A) | 54,495 | 54,490 | ||||||
0.041%, 05/06/2021 (A) | 10,370 | 10,370 | ||||||
0.040%, 08/19/2021 (A) | 47,510 | 47,506 | ||||||
U.S. Treasury Bonds | ||||||||
2.500%, 02/15/2045 | 5,310 | 5,408 | ||||||
2.353%, 05/15/2049 (A) | 5,380 | 2,672 | ||||||
2.000%, 02/15/2050 | 4,840 | 4,413 | ||||||
1.875%, 02/15/2041 | 51,809 | 48,118 | ||||||
1.875%, 02/15/2051 | 83,012 | 73,362 | ||||||
1.625%, 11/15/2050 | 52,225 | 43,347 | ||||||
1.375%, 11/15/2040 | 35,701 | 30,284 | ||||||
1.375%, 08/15/2050 | 43,081 | 33,482 | ||||||
1.250%, 05/15/2050 | 44,345 | 33,352 | ||||||
1.125%, 05/15/2040 | 13,102 | 10,660 | ||||||
1.125%, 08/15/2040 | 27,330 | 22,154 | ||||||
U.S. Treasury Inflation Protected Securities | ||||||||
2.125%, 02/15/2040 | 2,009 | 2,869 | ||||||
2.125%, 02/15/2041 | 968 | 1,394 | ||||||
1.375%, 02/15/2044 | 2,683 | 3,487 | ||||||
0.750%, 02/15/2042 | 2,512 | 2,891 | ||||||
U.S. Treasury Notes | ||||||||
3.125%, 05/15/2021 | 4,551 | 4,568 | ||||||
2.000%, 02/15/2023 | 4,170 | 4,312 | ||||||
1.750%, 11/30/2021 | 937 | 947 | ||||||
1.750%, 02/28/2022 | 662 | 672 | ||||||
1.500%, 10/31/2024 | 6,153 | 6,361 | ||||||
1.500%, 11/30/2024 | 6,136 | 6,342 | ||||||
1.375%, 05/31/2021 | 18,578 | 18,618 | ||||||
1.375%, 01/31/2025 | 3,044 | 3,131 | ||||||
1.250%, 03/31/2028 | 91,220 | 90,208 | ||||||
1.125%, 02/29/2028 | 260 | 255 | ||||||
1.125%, 02/15/2031 | 64,263 | 60,668 | ||||||
0.875%, 11/15/2030 | 5,070 | 4,684 | ||||||
60 | SEI Institutional Managed Trust / Semi-Annual Report / March 31, 2021 |
| Description | Face Amount (Thousands) | Market Value ($ Thousands) | ||||||
U.S. TREASURY OBLIGATIONS (continued) |
| |||||||
0.750%, 03/31/2026 | $ | 142,503 | $ | 141,200 | ||||
0.750%, 01/31/2028 | 25,600 | 24,524 | ||||||
0.625%, 12/31/2027 | 8,410 | 8,002 | ||||||
0.625%, 05/15/2030 | 1,050 | 955 | ||||||
0.625%, 08/15/2030 | 250 | 226 | ||||||
0.500%, 02/28/2026 (D) | 90,395 | 88,580 | ||||||
0.500%, 06/30/2027 | 10,880 | 10,377 | ||||||
0.500%, 08/31/2027 | 8,552 | 8,124 | ||||||
0.500%, 10/31/2027 | 280 | 265 | ||||||
0.375%, 11/30/2025 | 8,179 | 7,996 | ||||||
0.375%, 12/31/2025 | 13,987 | 13,653 | ||||||
0.375%, 01/31/2026 | 310 | 302 | ||||||
0.250%, 11/15/2023 | 120 | 120 | ||||||
0.250%, 03/15/2024 | 55,435 | 55,283 | ||||||
0.250%, 05/31/2025 | 2,280 | 2,236 | ||||||
0.250%, 06/30/2025 | 360 | 353 | ||||||
0.250%, 09/30/2025 | 5,796 | 5,651 | ||||||
0.250%, 10/31/2025 | 11,195 | 10,896 | ||||||
0.125%, 05/31/2022 | 3,212 | 3,213 | ||||||
0.125%, 07/31/2022 | 40 | 40 | ||||||
0.125%, 09/30/2022 | 4,853 | 4,853 | ||||||
0.125%, 10/31/2022 | 11,250 | 11,249 | ||||||
0.125%, 12/31/2022 | 12,843 | 12,837 | ||||||
0.125%, 01/31/2023 | 66,410 | 66,371 | ||||||
0.125%, 02/28/2023 | 137,715 | 137,629 | ||||||
0.125%, 03/31/2023 | 69,769 | 69,720 | ||||||
0.125%, 08/15/2023 | 11,056 | 11,029 | ||||||
0.125%, 09/15/2023 | 2,094 | 2,088 | ||||||
0.125%, 10/15/2023 | 7,164 | 7,140 | ||||||
0.125%, 01/15/2024 | 12,645 | 12,580 | ||||||
|
|
| ||||||
Total U.S. Treasury Obligations | 1,357,357 | |||||||
|
|
| ||||||
CORPORATE OBLIGATIONS — 30.1% |
| |||||||
Communication Services — 3.0% |
| |||||||
Alphabet | ||||||||
2.050%, 08/15/2050 | 400 | 329 | ||||||
1.100%, 08/15/2030 | 240 | 220 | ||||||
0.800%, 08/15/2027 | 220 | 211 | ||||||
0.450%, 08/15/2025 | 110 | 108 | ||||||
Altice France | ||||||||
7.375%, 05/01/2026 (C) | 230 | 239 | ||||||
AT&T | ||||||||
6.500%, 09/01/2037 | 1,335 | 1,750 | ||||||
5.250%, 03/01/2037 | 2,420 | 2,914 | ||||||
5.150%, 03/15/2042 | 25 | 30 | ||||||
4.850%, 03/01/2039 | 750 | 869 | ||||||
4.750%, 05/15/2046 | 1,600 | 1,829 | ||||||
4.500%, 05/15/2035 | 75 | 85 | ||||||
4.350%, 03/01/2029 | 240 | 271 | ||||||
| Description | Face Amount (Thousands) | Market Value ($ Thousands) | ||||||
CORPORATE OBLIGATIONS (continued) |
| |||||||
4.350%, 06/15/2045 | $ | 350 | $ | 382 | ||||
3.800%, 02/15/2027 | 318 | 351 | ||||||
3.800%, 12/01/2057 (C) | 4,839 | 4,583 | ||||||
3.550%, 09/15/2055 (C) | 989 | 903 | ||||||
3.500%, 06/01/2041 | 336 | 331 | ||||||
3.500%, 09/15/2053 (C) | 5,418 | 4,983 | ||||||
3.100%, 02/01/2043 | 819 | 762 | ||||||
3.000%, 06/30/2022 | 958 | 985 | ||||||
2.550%, 12/01/2033 (C) | 850 | 806 | ||||||
2.300%, 06/01/2027 | 750 | 766 | ||||||
2.250%, 02/01/2032 | 869 | 826 | ||||||
1.700%, 03/25/2026 | 1,500 | 1,500 | ||||||
1.650%, 02/01/2028 | 2,005 | 1,939 | ||||||
CCO Holdings | ||||||||
4.500%, 08/15/2030 (C) | 50 | 51 | ||||||
4.500%, 05/01/2032 (C) | 1,220 | 1,235 | ||||||
Charter Communications Operating | ||||||||
6.834%, 10/23/2055 | 70 | 96 | ||||||
6.484%, 10/23/2045 | 110 | 143 | ||||||
6.384%, 10/23/2035 | 10 | 13 | ||||||
5.750%, 04/01/2048 | 777 | 945 | ||||||
5.375%, 04/01/2038 | 843 | 996 | ||||||
5.375%, 05/01/2047 | 141 | 163 | ||||||
4.908%, 07/23/2025 | 2,960 | 3,357 | ||||||
4.800%, 03/01/2050 | 1,818 | 1,945 | ||||||
4.464%, 07/23/2022 | 302 | 315 | ||||||
4.200%, 03/15/2028 | 1,263 | 1,393 | ||||||
3.900%, 06/01/2052 | 529 | 507 | ||||||
3.750%, 02/15/2028 | 85 | 92 | ||||||
3.500%, 06/01/2041 | 652 | 618 | ||||||
Comcast | ||||||||
7.050%, 03/15/2033 | 90 | 128 | ||||||
6.500%, 11/15/2035 | 480 | 678 | ||||||
4.700%, 10/15/2048 | 90 | 111 | ||||||
4.600%, 10/15/2038 | 773 | 931 | ||||||
4.400%, 08/15/2035 | 1,770 | 2,067 | ||||||
4.250%, 10/15/2030 | 560 | 643 | ||||||
4.200%, 08/15/2034 | 220 | 252 | ||||||
4.150%, 10/15/2028 | 2,603 | 2,978 | ||||||
4.000%, 03/01/2048 | 70 | 78 | ||||||
3.999%, 11/01/2049 | 199 | 223 | ||||||
3.969%, 11/01/2047 | 78 | 87 | ||||||
3.950%, 10/15/2025 | 314 | 350 | ||||||
3.750%, 04/01/2040 | 820 | 898 | ||||||
3.700%, 04/15/2024 | 580 | 633 | ||||||
3.450%, 02/01/2050 | 380 | 391 | ||||||
3.400%, 04/01/2030 | 1,915 | 2,072 | ||||||
3.400%, 07/15/2046 | 60 | 62 | ||||||
3.300%, 04/01/2027 | 190 | 207 | ||||||
3.250%, 11/01/2039 | 60 | 62 | ||||||
3.150%, 03/01/2026 | 390 | 423 | ||||||
3.100%, 04/01/2025 | 30 | 32 | ||||||
SEI Institutional Managed Trust / Semi-Annual Report / March 31, 2021 | 61 |
SCHEDULE OF INVESTMENTS (Unaudited)
March 31, 2021
Core Fixed Income Fund (Continued)
| Description | Face Amount (Thousands) | Market Value ($ Thousands) | ||||||
CORPORATE OBLIGATIONS (continued) |
| |||||||
1.950%, 01/15/2031 | $ | 450 | $ | 432 | ||||
1.500%, 02/15/2031 | 3,175 | 2,943 | ||||||
Comcast Cable Communications Holdings | ||||||||
9.455%, 11/15/2022 | 180 | 206 | ||||||
Comcast Cable Holdings | ||||||||
10.125%, 04/15/2022 (D) | 45 | 49 | ||||||
Corning | ||||||||
5.450%, 11/15/2079 | 775 | 960 | ||||||
DISH DBS | ||||||||
7.750%, 07/01/2026 | 130 | 143 | ||||||
5.875%, 11/15/2024 | 580 | 607 | ||||||
Electronic Arts | ||||||||
1.850%, 02/15/2031 | 540 | 509 | ||||||
Fox | ||||||||
5.476%, 01/25/2039 | 520 | 647 | ||||||
3.500%, 04/08/2030 | 535 | 569 | ||||||
Level 3 Financing | ||||||||
3.875%, 11/15/2029 (C) | 1,760 | 1,855 | ||||||
NBCUniversal Media | ||||||||
5.950%, 04/01/2041 | 305 | 428 | ||||||
NTT Finance | ||||||||
1.591%, 04/03/2028 (C) | 1,125 | 1,098 | ||||||
1.162%, 04/03/2026 (C) | 3,812 | 3,760 | ||||||
Sky | ||||||||
3.750%, 09/16/2024 (C) | 1,090 | 1,197 | ||||||
Sprint | ||||||||
7.875%, 09/15/2023 | 110 | 126 | ||||||
Sprint Capital | ||||||||
8.750%, 03/15/2032 | 490 | 725 | ||||||
Sprint Spectrum | ||||||||
5.152%, 03/20/2028 (C) | 2,567 | 2,926 | ||||||
4.738%, 03/20/2025 (C) | 3,850 | 4,122 | ||||||
3.360%, 09/20/2021 (C) | 1,059 | 1,067 | ||||||
Telefonica Emisiones | ||||||||
5.520%, 03/01/2049 | 248 | 302 | ||||||
5.213%, 03/08/2047 | 150 | 175 | ||||||
T-Mobile USA | ||||||||
6.000%, 03/01/2023 | 10 | 10 | ||||||
6.000%, 04/15/2024 | 10 | 10 | ||||||
4.375%, 04/15/2040 (C) | 1,730 | 1,922 | ||||||
3.875%, 04/15/2030 (C) | 3,445 | 3,754 | ||||||
3.750%, 04/15/2027 (C) | 2,115 | 2,312 | ||||||
3.500%, 04/15/2025 (C) | 3,019 | 3,259 | ||||||
3.500%, 04/15/2031 | 360 | 363 | ||||||
2.875%, 02/15/2031 | 240 | 232 | ||||||
2.625%, 02/15/2029 | 330 | 320 | ||||||
2.550%, 02/15/2031 (C) | 1,919 | 1,876 | ||||||
2.250%, 02/15/2026 | 100 | 101 | ||||||
2.050%, 02/15/2028 (C) | 2,141 | 2,103 | ||||||
1.500%, 02/15/2026 (C) | 1,421 | 1,407 | ||||||
Verizon Communications | ||||||||
5.500%, 03/16/2047 | 60 | 78 | ||||||
| Description | Face Amount (Thousands) | Market Value ($ Thousands) | ||||||
CORPORATE OBLIGATIONS (continued) |
| |||||||
5.250%, 03/16/2037 | $ | 805 | $ | 1,013 | ||||
4.862%, 08/21/2046 | 470 | 562 | ||||||
4.522%, 09/15/2048 | 686 | 793 | ||||||
4.500%, 08/10/2033 | 620 | 720 | ||||||
4.400%, 11/01/2034 | 2,277 | 2,600 | ||||||
4.329%, 09/21/2028 | 1,325 | 1,516 | ||||||
4.272%, 01/15/2036 | 78 | 88 | ||||||
4.125%, 08/15/2046 | 320 | 349 | ||||||
4.016%, 12/03/2029 | 714 | 798 | ||||||
4.000%, 03/22/2050 | 170 | 182 | ||||||
3.875%, 02/08/2029 | 210 | 233 | ||||||
3.850%, 11/01/2042 | 610 | 654 | ||||||
3.700%, 03/22/2061 | 1,298 | 1,276 | ||||||
3.550%, 03/22/2051 | 1,591 | 1,584 | ||||||
3.500%, 11/01/2024 | 120 | 130 | ||||||
3.400%, 03/22/2041 | 634 | 641 | ||||||
3.376%, 02/15/2025 | 508 | 551 | ||||||
3.150%, 03/22/2030 | 360 | 379 | ||||||
3.000%, 03/22/2027 | 140 | 150 | ||||||
2.875%, 11/20/2050 | 1,988 | 1,761 | ||||||
2.650%, 11/20/2040 | 2,772 | 2,527 | ||||||
2.625%, 08/15/2026 | 1,000 | 1,057 | ||||||
2.550%, 03/21/2031 | 5,045 | 5,032 | ||||||
2.100%, 03/22/2028 | 1,035 | 1,040 | ||||||
1.750%, 01/20/2031 | 410 | 382 | ||||||
1.450%, 03/20/2026 | 260 | 260 | ||||||
0.850%, 11/20/2025 | 130 | 127 | ||||||
ViacomCBS | ||||||||
6.875%, 04/30/2036 | 620 | 856 | ||||||
5.900%, 10/15/2040 | 455 | 574 | ||||||
5.850%, 09/01/2043 | 220 | 282 | ||||||
4.750%, 05/15/2025 | 1,035 | 1,170 | ||||||
4.600%, 01/15/2045 | 61 | 68 | ||||||
4.375%, 03/15/2043 | 92 | 99 | ||||||
4.200%, 05/19/2032 | 198 | 222 | ||||||
3.875%, 04/01/2024 | 130 | 140 | ||||||
3.700%, 08/15/2024 | 810 | 878 | ||||||
Vodafone Group | ||||||||
5.250%, 05/30/2048 | 1,810 | 2,256 | ||||||
4.875%, 06/19/2049 | 1,544 | 1,831 | ||||||
4.375%, 05/30/2028 | 670 | 769 | ||||||
4.250%, 09/17/2050 | 439 | 482 | ||||||
Walt Disney | ||||||||
6.650%, 11/15/2037 | 235 | 344 | ||||||
6.200%, 12/15/2034 | 65 | 90 | ||||||
4.700%, 03/23/2050 | 355 | 443 | ||||||
4.625%, 03/23/2040 | 765 | 924 | ||||||
3.600%, 01/13/2051 | 1,095 | 1,155 | ||||||
2.650%, 01/13/2031 | 170 | 173 | ||||||
|
|
| ||||||
| 134,901 | ||||||||
|
|
| ||||||
62 | SEI Institutional Managed Trust / Semi-Annual Report / March 31, 2021 |
| Description | Face Amount (Thousands) | Market Value ($ Thousands) | ||||||
CORPORATE OBLIGATIONS (continued) |
| |||||||
Consumer Discretionary — 1.9% |
| |||||||
Alibaba Group Holding | ||||||||
3.150%, 02/09/2051 | $ | 545 | $ | 505 | ||||
Amazon.com | ||||||||
4.950%, 12/05/2044 | 500 | 652 | ||||||
4.250%, 08/22/2057 | 110 | 131 | ||||||
4.050%, 08/22/2047 | 380 | 440 | ||||||
3.875%, 08/22/2037 | 910 | 1,037 | ||||||
3.150%, 08/22/2027 | 680 | 744 | ||||||
2.800%, 08/22/2024 | 245 | 262 | ||||||
2.700%, 06/03/2060 | 147 | 130 | ||||||
2.500%, 06/03/2050 | 604 | 538 | ||||||
1.500%, 06/03/2030 | 650 | 619 | ||||||
1.200%, 06/03/2027 | 672 | 658 | ||||||
0.800%, 06/03/2025 | 560 | 558 | ||||||
American Honda Finance MTN | ||||||||
1.000%, 09/10/2025 | 1,875 | 1,845 | ||||||
BMW US Capital | ||||||||
4.150%, 04/09/2030 (C) | 845 | 962 | ||||||
3.800%, 04/06/2023 (C) | 1,005 | 1,069 | ||||||
3.100%, 04/12/2021 (C) | 215 | 215 | ||||||
1.850%, 09/15/2021 (C) | 100 | 101 | ||||||
Burlington Northern Santa Fe | ||||||||
3.050%, 02/15/2051 | 315 | 304 | ||||||
Cox Communications | ||||||||
4.800%, 02/01/2035 (C) | 890 | 1,045 | ||||||
Daimler Finance North America | ||||||||
2.700%, 06/14/2024 (C) | 595 | 626 | ||||||
0.750%, 03/01/2024 (C) | 980 | 975 | ||||||
Dollar General | ||||||||
3.250%, 04/15/2023 | 50 | 53 | ||||||
Element Fleet Management | ||||||||
3.850%, 06/15/2025 (C) | 645 | 679 | ||||||
1.600%, 04/06/2024 | 228 | 228 | ||||||
Ford Motor | ||||||||
5.291%, 12/08/2046 | 99 | 104 | ||||||
Ford Motor Credit | ||||||||
5.875%, 08/02/2021 | 250 | 253 | ||||||
5.125%, 06/16/2025 | 200 | 216 | ||||||
4.271%, 01/09/2027 | 1,040 | 1,079 | ||||||
4.250%, 09/20/2022 | 1,000 | 1,031 | ||||||
4.125%, 08/17/2027 | 200 | 206 | ||||||
4.000%, 11/13/2030 | 270 | 268 | ||||||
3.815%, 11/02/2027 | 261 | 264 | ||||||
3.813%, 10/12/2021 | 190 | 192 | ||||||
3.810%, 01/09/2024 | 300 | 309 | ||||||
3.339%, 03/28/2022 | 1,730 | 1,749 | ||||||
2.900%, 02/16/2028 | 200 | 192 | ||||||
1.463%, VAR ICE LIBOR USD 3 Month+1.270%, 03/28/2022 | 1,100 | 1,093 | ||||||
1.104%, VAR ICE LIBOR USD 3 Month+0.880%, 10/12/2021 | 1,040 | 1,035 | ||||||
| Description | Face Amount (Thousands) | Market Value ($ Thousands) | ||||||
CORPORATE OBLIGATIONS (continued) |
| |||||||
1.048%, VAR ICE LIBOR USD 3 Month+0.810%, 04/05/2021 | $ | 1,625 | $ | 1,625 | ||||
General Motors | ||||||||
6.250%, 10/02/2043 | 260 | 333 | ||||||
6.125%, 10/01/2025 | 320 | 376 | ||||||
5.950%, 04/01/2049 | 80 | 101 | ||||||
5.400%, 10/02/2023 | 190 | 206 | ||||||
5.400%, 04/01/2048 | 406 | 478 | ||||||
5.150%, 04/01/2038 | 240 | 274 | ||||||
4.875%, 10/02/2023 | 1,995 | 2,184 | ||||||
General Motors Financial | ||||||||
4.375%, 09/25/2021 | 735 | 749 | ||||||
4.350%, 01/17/2027 | 110 | 122 | ||||||
4.250%, 05/15/2023 | 110 | 118 | ||||||
4.200%, 11/06/2021 | 1,435 | 1,466 | ||||||
4.150%, 06/19/2023 | 83 | 89 | ||||||
3.450%, 04/10/2022 | 415 | 425 | ||||||
3.200%, 07/06/2021 | 1,835 | 1,843 | ||||||
3.150%, 06/30/2022 | 870 | 894 | ||||||
1.700%, 08/18/2023 | 712 | 725 | ||||||
Hanesbrands | ||||||||
5.375%, 05/15/2025 (C) | 310 | 328 | ||||||
4.875%, 05/15/2026 (C) | 210 | 225 | ||||||
4.625%, 05/15/2024 (C) | 30 | 32 | ||||||
Hilton Domestic Operating | ||||||||
5.750%, 05/01/2028 (C) | 150 | 161 | ||||||
5.375%, 05/01/2025 (C) | 460 | 485 | ||||||
Home Depot | ||||||||
4.250%, 04/01/2046 | 48 | 56 | ||||||
3.900%, 12/06/2028 | 40 | 45 | ||||||
3.900%, 06/15/2047 | 60 | 67 | ||||||
3.750%, 02/15/2024 | 66 | 72 | ||||||
3.350%, 04/15/2050 | 1,025 | 1,060 | ||||||
3.300%, 04/15/2040 | 480 | 504 | ||||||
3.125%, 12/15/2049 | 1,220 | 1,195 | ||||||
2.950%, 06/15/2029 | 178 | 189 | ||||||
2.700%, 04/15/2030 | 1,801 | 1,867 | ||||||
2.500%, 04/15/2027 | 280 | 295 | ||||||
2.375%, 03/15/2051 | 402 | 344 | ||||||
Hyundai Capital America | ||||||||
2.375%, 10/15/2027 (C) | 490 | 491 | ||||||
1.800%, 10/15/2025 (C) | 823 | 822 | ||||||
1.250%, 09/18/2023 (C) | 490 | 494 | ||||||
Hyundai Capital America MTN | ||||||||
1.300%, 01/08/2026 (C) | 980 | 957 | ||||||
0.800%, 01/08/2024 (C) | 998 | 989 | ||||||
Las Vegas Sands | ||||||||
3.200%, 08/08/2024 | 890 | 928 | ||||||
2.900%, 06/25/2025 | 210 | 215 | ||||||
Leland Stanford Junior University | ||||||||
1.289%, 06/01/2027 | 66 | 66 | ||||||
SEI Institutional Managed Trust / Semi-Annual Report / March 31, 2021 | 63 |
SCHEDULE OF INVESTMENTS (Unaudited)
March 31, 2021
Core Fixed Income Fund (Continued)
| Description | Face Amount (Thousands) | Market Value ($ Thousands) | ||||||
CORPORATE OBLIGATIONS (continued) |
| |||||||
Lennar | ||||||||
5.000%, 06/15/2027 | $ | 20 | $ | 23 | ||||
4.750%, 11/29/2027 | 460 | 528 | ||||||
4.500%, 04/30/2024 | 170 | 185 | ||||||
Levi Strauss | ||||||||
5.000%, 05/01/2025 | 54 | 55 | ||||||
Lowe’s | ||||||||
5.000%, 04/15/2040 | 965 | 1,181 | ||||||
4.500%, 04/15/2030 | 200 | 231 | ||||||
3.500%, 04/01/2051 | 179 | 181 | ||||||
2.625%, 04/01/2031 | 814 | 816 | ||||||
Marriott International | ||||||||
5.750%, 05/01/2025 | 582 | 668 | ||||||
4.625%, 06/15/2030 | 125 | 140 | ||||||
2.850%, 04/15/2031 | 1,412 | 1,388 | ||||||
McDonald’s MTN | ||||||||
4.875%, 12/09/2045 | 260 | 314 | ||||||
4.450%, 03/01/2047 | 240 | 278 | ||||||
4.450%, 09/01/2048 | 72 | 84 | ||||||
4.200%, 04/01/2050 | 530 | 600 | ||||||
3.800%, 04/01/2028 | 665 | 736 | ||||||
3.700%, 01/30/2026 | 702 | 774 | ||||||
3.625%, 09/01/2049 | 180 | 187 | ||||||
3.600%, 07/01/2030 | 290 | 316 | ||||||
3.500%, 03/01/2027 | 510 | 559 | ||||||
3.500%, 07/01/2027 | 200 | 220 | ||||||
3.300%, 07/01/2025 | 320 | 346 | ||||||
1.450%, 09/01/2025 | 324 | 327 | ||||||
MDC Holdings | ||||||||
6.000%, 01/15/2043 | 150 | 189 | ||||||
Newell Brands | ||||||||
4.700%, 04/01/2026 | 110 | 122 | ||||||
4.350%, 04/01/2023 | 278 | 293 | ||||||
NIKE | ||||||||
3.375%, 03/27/2050 | 950 | 994 | ||||||
3.250%, 03/27/2040 | 210 | 220 | ||||||
2.850%, 03/27/2030 | 430 | 453 | ||||||
2.750%, 03/27/2027 | 410 | 437 | ||||||
2.400%, 03/27/2025 | 260 | 274 | ||||||
Nissan Motor | ||||||||
4.810%, 09/17/2030 (C) | 377 | 413 | ||||||
4.345%, 09/17/2027 (C) | 1,100 | 1,196 | ||||||
3.522%, 09/17/2025 (C) | 1,474 | 1,561 | ||||||
3.043%, 09/15/2023 (C) | 580 | 607 | ||||||
Nissan Motor Acceptance | ||||||||
2.750%, 03/09/2028 (C) | 492 | 488 | ||||||
Prime Security Services Borrower | ||||||||
5.750%, 04/15/2026 (C) | 320 | 345 | ||||||
QVC | ||||||||
4.850%, 04/01/2024 | 370 | 397 | ||||||
Sands China | ||||||||
5.400%, 08/08/2028 | 320 | 366 | ||||||
| Description | Face Amount (Thousands) | Market Value ($ Thousands) | ||||||
CORPORATE OBLIGATIONS (continued) |
| |||||||
5.125%, 08/08/2025 | $ | 380 | $ | 425 | ||||
4.600%, 08/08/2023 | 610 | 652 | ||||||
3.800%, 01/08/2026 | 420 | 446 | ||||||
Starbucks | ||||||||
3.500%, 11/15/2050 | 1,755 | 1,751 | ||||||
3.350%, 03/12/2050 | 441 | 428 | ||||||
1.300%, 05/07/2022 | 400 | 404 | ||||||
Target | ||||||||
2.250%, 04/15/2025 | 450 | 471 | ||||||
Time Warner Cable | ||||||||
7.300%, 07/01/2038 | 530 | 735 | ||||||
6.750%, 06/15/2039 | 10 | 13 | ||||||
6.550%, 05/01/2037 | 138 | 180 | ||||||
5.875%, 11/15/2040 | 1,405 | 1,741 | ||||||
5.500%, 09/01/2041 | 1,599 | 1,888 | ||||||
Time Warner Entertainment | ||||||||
8.375%, 07/15/2033 | 270 | 390 | ||||||
TJX | ||||||||
3.750%, 04/15/2027 | 1,875 | 2,087 | ||||||
3.500%, 04/15/2025 | 300 | 327 | ||||||
Toll Brothers Finance | ||||||||
4.375%, 04/15/2023 | 120 | 125 | ||||||
Toyota Motor | ||||||||
1.339%, 03/25/2026 | 1,261 | 1,258 | ||||||
0.681%, 03/25/2024 | 1,020 | 1,019 | ||||||
Toyota Motor Credit MTN | ||||||||
2.900%, 03/30/2023 | 775 | 813 | ||||||
VOC Escrow | ||||||||
5.000%, 02/15/2028 (C) | 380 | 375 | ||||||
Volkswagen Group of America Finance | ||||||||
2.900%, 05/13/2022 (C) | 1,455 | 1,493 | ||||||
1.250%, 11/24/2025 (C) | 1,345 | 1,325 | ||||||
0.875%, 11/22/2023 (C) | 1,055 | 1,059 | ||||||
Wynn Macau | ||||||||
5.625%, 08/26/2028 (C) | 500 | 523 | ||||||
5.125%, 12/15/2029 (C) | 200 | 205 | ||||||
Yale University | ||||||||
1.482%, 04/15/2030 | 482 | 459 | ||||||
0.873%, 04/15/2025 | 563 | 563 | ||||||
| 85,909 | ||||||||
Consumer Staples — 2.0% |
| |||||||
Alimentation Couche-Tard | ||||||||
3.800%, 01/25/2050 (C) | 25 | 25 | ||||||
3.550%, 07/26/2027 (C) | 650 | 705 | ||||||
Altria Group | ||||||||
6.200%, 02/14/2059 | 76 | 92 | ||||||
5.950%, 02/14/2049 | 490 | 609 | ||||||
5.800%, 02/14/2039 | 1,190 | 1,451 | ||||||
4.800%, 02/14/2029 | 361 | 415 | ||||||
4.750%, 05/05/2021 | 200 | 201 | ||||||
4.400%, 02/14/2026 | 514 | 579 | ||||||
64 | SEI Institutional Managed Trust / Semi-Annual Report / March 31, 2021 | |
| Description | Face Amount (Thousands) | Market Value ($ Thousands) | ||||||
CORPORATE OBLIGATIONS (continued) |
| |||||||
4.000%, 02/04/2061 | $ | 419 | $ | 386 | ||||
3.875%, 09/16/2046 | 893 | 864 | ||||||
3.400%, 02/04/2041 | 1,619 | 1,497 | ||||||
2.450%, 02/04/2032 | 2,806 | 2,667 | ||||||
2.350%, 05/06/2025 | 268 | 278 | ||||||
Anheuser-Busch | ||||||||
4.900%, 02/01/2046 | 6,561 | 7,771 | ||||||
4.700%, 02/01/2036 | 891 | 1,043 | ||||||
3.650%, 02/01/2026 | 1,135 | 1,247 | ||||||
Anheuser-Busch InBev Worldwide | ||||||||
5.550%, 01/23/2049 | 525 | 675 | ||||||
5.450%, 01/23/2039 | 1,035 | 1,291 | ||||||
4.750%, 01/23/2029 | 100 | 117 | ||||||
4.600%, 04/15/2048 | 1,666 | 1,905 | ||||||
4.500%, 06/01/2050 | 670 | 758 | ||||||
4.375%, 04/15/2038 | 936 | 1,062 | ||||||
4.350%, 06/01/2040 | 560 | 632 | ||||||
4.150%, 01/23/2025 | 664 | 738 | ||||||
4.000%, 04/13/2028 | 180 | 200 | ||||||
3.750%, 07/15/2042 | 518 | 531 | ||||||
3.500%, 06/01/2030 | 200 | 216 | ||||||
BAT Capital | ||||||||
5.282%, 04/02/2050 | 1,260 | 1,381 | ||||||
4.906%, 04/02/2030 | 173 | 197 | ||||||
4.700%, 04/02/2027 | 338 | 380 | ||||||
4.540%, 08/15/2047 | 3,053 | 3,066 | ||||||
4.390%, 08/15/2037 | 61 | 64 | ||||||
3.984%, 09/25/2050 | 460 | 431 | ||||||
3.734%, 09/25/2040 | 10 | 10 | ||||||
3.557%, 08/15/2027 | 2,329 | 2,475 | ||||||
3.222%, 08/15/2024 | 167 | 178 | ||||||
3.215%, 09/06/2026 | 1,300 | 1,372 | ||||||
2.726%, 03/25/2031 | 1,033 | 1,003 | ||||||
2.259%, 03/25/2028 | 372 | 366 | ||||||
BAT International Finance | ||||||||
1.668%, 03/25/2026 | 1,058 | 1,047 | ||||||
Bunge Finance | ||||||||
3.750%, 09/25/2027 | 589 | 646 | ||||||
3.250%, 08/15/2026 | 851 | 906 | ||||||
1.630%, 08/17/2025 | 838 | 838 | ||||||
Cargill | ||||||||
1.375%, 07/23/2023 (C) | 440 | 449 | ||||||
Coca-Cola | ||||||||
3.375%, 03/25/2027 | 380 | 419 | ||||||
2.950%, 03/25/2025 | 210 | 227 | ||||||
2.600%, 06/01/2050 | 190 | 171 | ||||||
2.500%, 06/01/2040 | 20 | 19 | ||||||
2.500%, 03/15/2051 | 545 | 474 | ||||||
1.450%, 06/01/2027 | 905 | 901 | ||||||
Constellation Brands | ||||||||
4.400%, 11/15/2025 | 415 | 468 | ||||||
| Description | Face Amount (Thousands) | Market Value ($ Thousands) | ||||||
CORPORATE OBLIGATIONS (continued) |
| |||||||
Consumers Energy | ||||||||
2.500%, 05/01/2060 | $ | 267 | $ | 221 | ||||
Costco Wholesale | ||||||||
3.000%, 05/18/2027 | 284 | 308 | ||||||
2.750%, 05/18/2024 | 183 | 196 | ||||||
1.600%, 04/20/2030 | 3,222 | 3,083 | ||||||
1.375%, 06/20/2027 | 780 | 777 | ||||||
Danone | ||||||||
2.947%, 11/02/2026 (C) | 470 | 501 | ||||||
2.589%, 11/02/2023 (C) | 1,370 | 1,430 | ||||||
2.077%, 11/02/2021 (C) | 230 | 232 | ||||||
Diageo Investment | ||||||||
2.875%, 05/11/2022 | 370 | 381 | ||||||
Estee Lauder | ||||||||
1.950%, 03/15/2031 | 945 | 915 | ||||||
Hershey | ||||||||
0.900%, 06/01/2025 | 130 | 129 | ||||||
Imperial Brands Finance | ||||||||
3.500%, 07/26/2026 (C) | 635 | 679 | ||||||
3.125%, 07/26/2024 (C) | 2,250 | 2,378 | ||||||
Keurig Dr Pepper | ||||||||
4.417%, 05/25/2025 | 280 | 314 | ||||||
Kraft Heinz Foods | ||||||||
7.125%, 08/01/2039 (C) | 10 | 14 | ||||||
6.875%, 01/26/2039 | 40 | 55 | ||||||
6.750%, 03/15/2032 | 10 | 13 | ||||||
5.500%, 06/01/2050 | 220 | 270 | ||||||
5.200%, 07/15/2045 | 360 | 415 | ||||||
5.000%, 06/04/2042 | 1,250 | 1,403 | ||||||
4.875%, 10/01/2049 | 2,370 | 2,651 | ||||||
4.625%, 10/01/2039 | 10 | 11 | ||||||
4.375%, 06/01/2046 | 160 | 167 | ||||||
4.250%, 03/01/2031 | 110 | 121 | ||||||
3.000%, 06/01/2026 | 380 | 401 | ||||||
Kroger | ||||||||
3.950%, 01/15/2050 | 120 | 129 | ||||||
Lamb Weston Holdings | ||||||||
4.875%, 05/15/2028 (C) | 90 | 97 | ||||||
4.625%, 11/01/2024 (C) | 70 | 73 | ||||||
Land O’ Lakes | ||||||||
6.000%, 11/15/2022 (C) | 1,020 | 1,087 | ||||||
Mars | ||||||||
3.200%, 04/01/2030 (C) | 210 | 224 | ||||||
2.700%, 04/01/2025 (C) | 370 | 391 | ||||||
2.375%, 07/16/2040 (C) | 300 | 274 | ||||||
Molson Coors Brewing | ||||||||
3.500%, 05/01/2022 | 100 | 103 | ||||||
Mondelez International | ||||||||
1.500%, 05/04/2025 | 660 | 667 | ||||||
Mondelez International Holdings | ||||||||
Netherlands BV | ||||||||
2.125%, 09/19/2022 (C) | 290 | 297 | ||||||
| SEI Institutional Managed Trust / Semi-Annual Report / March 31, 2021 | 65 |
SCHEDULE OF INVESTMENTS (Unaudited)
March 31, 2021
Core Fixed Income Fund (Continued)
| Description | Face Amount (Thousands) | Market Value ($ Thousands) | ||||||
CORPORATE OBLIGATIONS (continued) |
| |||||||
2.000%, 10/28/2021 (C) | $ | 2,420 | $ | 2,440 | ||||
Nestle Holdings | ||||||||
3.500%, 09/24/2025 (C) | 450 | 494 | ||||||
PepsiCo | ||||||||
4.250%, 10/22/2044 | 100 | 116 | ||||||
4.000%, 03/05/2042 | 160 | 180 | ||||||
3.875%, 03/19/2060 | 120 | 135 | ||||||
3.625%, 03/19/2050 | 80 | 88 | ||||||
3.100%, 07/17/2022 | 59 | 61 | ||||||
3.000%, 08/25/2021 | 31 | 31 | ||||||
2.875%, 10/15/2049 | 60 | 58 | ||||||
2.625%, 03/19/2027 | 50 | 53 | ||||||
2.250%, 03/19/2025 | 50 | 53 | ||||||
1.625%, 05/01/2030 | 440 | 420 | ||||||
0.750%, 05/01/2023 | 530 | 535 | ||||||
Philip Morris International | ||||||||
4.500%, 03/20/2042 | 130 | 148 | ||||||
2.900%, 11/15/2021 | 370 | 376 | ||||||
2.875%, 05/01/2024 | 1,170 | 1,242 | ||||||
2.500%, 08/22/2022 | 590 | 607 | ||||||
2.500%, 11/02/2022 | 680 | 702 | ||||||
2.100%, 05/01/2030 | 290 | 280 | ||||||
1.125%, 05/01/2023 | 280 | 284 | ||||||
Procter & Gamble | ||||||||
3.000%, 03/25/2030 | 1,425 | 1,533 | ||||||
2.800%, 03/25/2027 | 80 | 86 | ||||||
Reckitt Benckiser Treasury Services | ||||||||
2.750%, 06/26/2024 (C) | 1,860 | 1,967 | ||||||
Reynolds American | ||||||||
8.125%, 05/01/2040 | 570 | 801 | ||||||
7.250%, 06/15/2037 | 390 | 500 | ||||||
5.850%, 08/15/2045 | 3,140 | 3,692 | ||||||
Walgreens Boots Alliance | ||||||||
4.800%, 11/18/2044 | 1,100 | 1,207 | ||||||
3.450%, 06/01/2026 | 1,590 | 1,710 | ||||||
3.300%, 11/18/2021 | 912 | 922 | ||||||
Walmart | ||||||||
4.050%, 06/29/2048 | 8 | 9 | ||||||
3.950%, 06/28/2038 | 783 | 903 | ||||||
3.700%, 06/26/2028 | 1,381 | 1,551 | ||||||
3.550%, 06/26/2025 | 140 | 154 | ||||||
3.400%, 06/26/2023 | 393 | 419 | ||||||
3.300%, 04/22/2024 | 60 | 65 | ||||||
3.050%, 07/08/2026 | 296 | 321 | ||||||
|
|
| ||||||
| 89,993 | ||||||||
|
|
| ||||||
Energy — 3.4% | ||||||||
Aker BP | ||||||||
4.000%, 01/15/2031 (C) | 456 | 475 | ||||||
Apache | ||||||||
5.250%, 02/01/2042 | 50 | 49 | ||||||
5.100%, 09/01/2040 | 205 | 200 | ||||||
| Description | Face Amount (Thousands) | Market Value ($ Thousands) | ||||||
CORPORATE OBLIGATIONS (continued) |
| |||||||
4.750%, 04/15/2043 | $ | 390 | $ | 362 | ||||
4.375%, 10/15/2028 | 200 | 199 | ||||||
4.250%, 01/15/2044 | 890 | 795 | ||||||
3.250%, 04/15/2022 | 86 | 87 | ||||||
BG Energy Capital | ||||||||
4.000%, 10/15/2021 (C) | 1,485 | 1,513 | ||||||
BP Capital Markets | ||||||||
3.535%, 11/04/2024 | 100 | 109 | ||||||
3.506%, 03/17/2025 | 520 | 567 | ||||||
BP Capital Markets America | ||||||||
3.790%, 02/06/2024 | 100 | 108 | ||||||
3.633%, 04/06/2030 | 320 | 350 | ||||||
3.543%, 04/06/2027 | 790 | 864 | ||||||
3.410%, 02/11/2026 | 1,110 | 1,206 | ||||||
3.379%, 02/08/2061 | 267 | 247 | ||||||
3.245%, 05/06/2022 | 250 | 258 | ||||||
3.216%, 11/28/2023 | 420 | 448 | ||||||
3.194%, 04/06/2025 | 1,620 | 1,743 | ||||||
3.119%, 05/04/2026 | 230 | 247 | ||||||
3.000%, 02/24/2050 | 940 | 855 | ||||||
2.937%, 04/06/2023 | 50 | 52 | ||||||
2.772%, 11/10/2050 | 772 | 673 | ||||||
1.749%, 08/10/2030 | 643 | 607 | ||||||
Cameron LNG | ||||||||
3.302%, 01/15/2035 (C) | 660 | 677 | ||||||
2.902%, 07/15/2031 (C) | 140 | 141 | ||||||
Canadian Natural Resources | ||||||||
6.450%, 06/30/2033 | 50 | 63 | ||||||
Cheniere Energy | ||||||||
4.625%, 10/15/2028 (C) | 260 | 270 | ||||||
Chevron | ||||||||
3.191%, 06/24/2023 | 22 | 23 | ||||||
2.895%, 03/03/2024 | 560 | 597 | ||||||
2.355%, 12/05/2022 | 15 | 15 | ||||||
1.995%, 05/11/2027 | 635 | 649 | ||||||
1.554%, 05/11/2025 | 520 | 530 | ||||||
Chevron USA | ||||||||
5.250%, 11/15/2043 | 260 | 336 | ||||||
5.050%, 11/15/2044 | 29 | 37 | ||||||
4.950%, 08/15/2047 | 160 | 201 | ||||||
3.850%, 01/15/2028 | 200 | 223 | ||||||
3.250%, 10/15/2029 | 50 | 54 | ||||||
1.018%, 08/12/2027 | 710 | 683 | ||||||
Cimarex Energy | ||||||||
4.375%, 06/01/2024 | 210 | 228 | ||||||
4.375%, 03/15/2029 | 780 | 863 | ||||||
3.900%, 05/15/2027 | 970 | 1,055 | ||||||
Conoco Funding | ||||||||
7.250%, 10/15/2031 | 180 | 255 | ||||||
ConocoPhillips | ||||||||
5.900%, 10/15/2032 | 10 | 13 | ||||||
5.900%, 05/15/2038 | 420 | 564 | ||||||
66 | SEI Institutional Managed Trust / Semi-Annual Report / March 31, 2021 | |
| Description | Face Amount (Thousands) | Market Value ($ Thousands) | ||||||
CORPORATE OBLIGATIONS (continued) |
| |||||||
4.300%, 08/15/2028 (C) | $ | 850 | $ | 967 | ||||
4.150%, 11/15/2034 | 280 | 311 | ||||||
3.750%, 10/01/2027 (C) | 620 | 685 | ||||||
Continental Resources | ||||||||
4.500%, 04/15/2023 | 180 | 186 | ||||||
4.375%, 01/15/2028 | 520 | 549 | ||||||
3.800%, 06/01/2024 | 200 | 205 | ||||||
DCP Midstream Operating | ||||||||
6.450%, 11/03/2036 (C) | 110 | 123 | ||||||
Devon Energy | ||||||||
7.875%, 09/30/2031 | 660 | 884 | ||||||
5.850%, 12/15/2025 | 1,438 | 1,675 | ||||||
5.600%, 07/15/2041 | 744 | 856 | ||||||
5.000%, 06/15/2045 | 1,400 | 1,526 | ||||||
4.750%, 05/15/2042 | 353 | 374 | ||||||
Diamondback Energy | ||||||||
4.400%, 03/24/2051 | 658 | 670 | ||||||
3.500%, 12/01/2029 | 849 | 881 | ||||||
3.250%, 12/01/2026 | 1,005 | 1,054 | ||||||
0.900%, 03/24/2023 | 1,097 | 1,097 | ||||||
Ecopetrol | ||||||||
5.875%, 05/28/2045 | 1,236 | 1,319 | ||||||
4.125%, 01/16/2025 | 203 | 217 | ||||||
Enable Midstream Partners | ||||||||
4.950%, 05/15/2028 | 1,055 | 1,162 | ||||||
4.400%, 03/15/2027 | 623 | 673 | ||||||
4.150%, 09/15/2029 | 369 | 383 | ||||||
3.900%, 05/15/2024 | 87 | 93 | ||||||
Enbridge | ||||||||
2.500%, 01/15/2025 | 1,105 | 1,151 | ||||||
Energy Transfer | ||||||||
6.250%, 04/15/2049 | 130 | 152 | ||||||
Energy Transfer Operating | ||||||||
8.250%, 11/15/2029 | 1,490 | 1,967 | ||||||
6.750%, VAR US Treas Yield Curve Rate T Note Const Mat 5 Yr+5.134%(B)(E) | 360 | 344 | ||||||
6.500%, 02/01/2042 | 45 | 54 | ||||||
6.050%, 06/01/2041 | 146 | 166 | ||||||
6.000%, 06/15/2048 | 128 | 145 | ||||||
5.500%, 06/01/2027 | 118 | 136 | ||||||
5.300%, 04/15/2047 | 1,245 | 1,296 | ||||||
5.250%, 04/15/2029 | 1,417 | 1,612 | ||||||
5.150%, 03/15/2045 | 1,314 | 1,351 | ||||||
5.000%, 05/15/2050 | 800 | 823 | ||||||
4.950%, 06/15/2028 | 180 | 201 | ||||||
4.050%, 03/15/2025 | 1,515 | 1,636 | ||||||
3.750%, 05/15/2030 | 1,250 | 1,288 | ||||||
Energy Transfer Partners | ||||||||
4.500%, 11/01/2023 | 690 | 743 | ||||||
Eni | ||||||||
4.000%, 09/12/2023 (C) | 1,940 | 2,085 | ||||||
| Description | Face Amount (Thousands) | Market Value ($ Thousands) | ||||||
CORPORATE OBLIGATIONS (continued) |
| |||||||
Enterprise Products Operating | ||||||||
7.550%, 04/15/2038 | $ | 40 | $ | 59 | ||||
5.700%, 02/15/2042 | 40 | 51 | ||||||
4.850%, 03/15/2044 | 430 | 494 | ||||||
4.800%, 02/01/2049 | 60 | 69 | ||||||
4.200%, 01/31/2050 | 1,530 | 1,613 | ||||||
4.150%, 10/16/2028 | 1,605 | 1,807 | ||||||
3.950%, 01/31/2060 | 865 | 864 | ||||||
3.700%, 01/31/2051 | 270 | 265 | ||||||
3.125%, 07/31/2029 | 170 | 179 | ||||||
2.800%, 01/31/2030 | 540 | 557 | ||||||
EOG Resources | ||||||||
4.950%, 04/15/2050 | 450 | 547 | ||||||
4.375%, 04/15/2030 | 120 | 138 | ||||||
4.150%, 01/15/2026 | 340 | 382 | ||||||
3.900%, 04/01/2035 | 390 | 421 | ||||||
EQT | ||||||||
7.625%, 02/01/2025 | 30 | 35 | ||||||
3.900%, 10/01/2027 | 505 | 516 | ||||||
3.000%, 10/01/2022 (D) | 430 | 436 | ||||||
Equinor | ||||||||
3.250%, 11/18/2049 | 232 | 227 | ||||||
3.000%, 04/06/2027 | 1,355 | 1,450 | ||||||
2.875%, 04/06/2025 | 2,225 | 2,375 | ||||||
Exxon Mobil | ||||||||
4.327%, 03/19/2050 | 2,250 | 2,575 | ||||||
4.227%, 03/19/2040 | 800 | 901 | ||||||
4.114%, 03/01/2046 | 533 | 586 | ||||||
3.482%, 03/19/2030 | 460 | 499 | ||||||
3.452%, 04/15/2051 | 200 | 200 | ||||||
3.043%, 03/01/2026 | 660 | 712 | ||||||
2.992%, 03/19/2025 | 3,680 | 3,942 | ||||||
2.397%, 03/06/2022 | 100 | 102 | ||||||
1.571%, 04/15/2023 | 80 | 82 | ||||||
Galaxy Pipeline Assets Bidco | ||||||||
2.940%, 09/30/2040 (C) | 489 | 471 | ||||||
2.625%, 03/31/2036 (C) | 458 | 438 | ||||||
2.160%, 03/31/2034 (C) | 720 | 697 | ||||||
1.750%, 09/30/2027 (C) | 1,867 | 1,866 | ||||||
Halliburton | ||||||||
5.000%, 11/15/2045 | 80 | 89 | ||||||
4.850%, 11/15/2035 | 60 | 67 | ||||||
3.800%, 11/15/2025 | 45 | 49 | ||||||
3.500%, 08/01/2023 | 3 | 3 | ||||||
Hess | ||||||||
6.000%, 01/15/2040 | 2,330 | 2,781 | ||||||
HollyFrontier | ||||||||
2.625%, 10/01/2023 | 341 | 351 | ||||||
KazMunayGas National JSC | ||||||||
5.750%, 04/19/2047 (C) | 340 | 403 | ||||||
Kinder Morgan | ||||||||
5.550%, 06/01/2045 | 300 | 356 | ||||||
| SEI Institutional Managed Trust / Semi-Annual Report / March 31, 2021 | 67 |
SCHEDULE OF INVESTMENTS (Unaudited)
March 31, 2021
Core Fixed Income Fund (Continued)
| Description | Face Amount (Thousands) | Market Value ($ Thousands) | ||||||
CORPORATE OBLIGATIONS (continued) |
| |||||||
5.300%, 12/01/2034 | $ | 500 | $ | 590 | ||||
5.200%, 03/01/2048 | 690 | 786 | ||||||
5.050%, 02/15/2046 | 170 | 191 | ||||||
4.300%, 06/01/2025 | 510 | 569 | ||||||
4.300%, 03/01/2028 | 200 | 223 | ||||||
3.150%, 01/15/2023 | 193 | 201 | ||||||
Kinder Morgan Energy Partners | ||||||||
5.500%, 03/01/2044 | 415 | 483 | ||||||
5.400%, 09/01/2044 | 20 | 23 | ||||||
Marathon Oil | ||||||||
5.200%, 06/01/2045 | 322 | 350 | ||||||
MEG Energy | ||||||||
5.875%, 02/01/2029 (C) | 80 | 80 | ||||||
MPLX | ||||||||
5.500%, 02/15/2049 | 390 | 457 | ||||||
4.875%, 12/01/2024 | 320 | 359 | ||||||
4.800%, 02/15/2029 | 330 | 378 | ||||||
4.700%, 04/15/2048 | 430 | 463 | ||||||
4.500%, 04/15/2038 | 520 | 566 | ||||||
Northwest Pipeline | ||||||||
4.000%, 04/01/2027 | 219 | 245 | ||||||
Occidental Petroleum | ||||||||
7.875%, 09/15/2031 | 610 | 717 | ||||||
7.500%, 05/01/2031 | 870 | 1,012 | ||||||
6.950%, 07/01/2024 | 288 | 316 | ||||||
6.600%, 03/15/2046 | 360 | 382 | ||||||
6.450%, 09/15/2036 | 280 | 309 | ||||||
5.550%, 03/15/2026 | 110 | 117 | ||||||
4.625%, 06/15/2045 | 280 | 244 | ||||||
4.500%, 07/15/2044 | 525 | 446 | ||||||
4.400%, 04/15/2046 | 120 | 102 | ||||||
4.200%, 03/15/2048 | 170 | 137 | ||||||
4.100%, 02/15/2047 | 600 | 480 | ||||||
3.500%, 06/15/2025 | 45 | 45 | ||||||
3.400%, 04/15/2026 | 270 | 260 | ||||||
3.000%, 02/15/2027 | 300 | 282 | ||||||
2.900%, 08/15/2024 | 810 | 801 | ||||||
2.700%, 02/15/2023 | 63 | 63 | ||||||
Oleoducto Central | ||||||||
4.000%, 07/14/2027 (C) | 247 | 261 | ||||||
ONEOK | ||||||||
5.850%, 01/15/2026 | 81 | 95 | ||||||
4.950%, 07/13/2047 | 63 | 66 | ||||||
4.450%, 09/01/2049 | 252 | 248 | ||||||
4.350%, 03/15/2029 | 227 | 247 | ||||||
4.000%, 07/13/2027 | 134 | 145 | ||||||
3.400%, 09/01/2029 | 210 | 215 | ||||||
3.100%, 03/15/2030 | 537 | 540 | ||||||
ONEOK Partners | ||||||||
6.650%, 10/01/2036 | 339 | 426 | ||||||
Parsley Energy | ||||||||
4.125%, 02/15/2028 (C) | 60 | 64 | ||||||
| Description | Face Amount (Thousands) | Market Value ($ Thousands) | ||||||
CORPORATE OBLIGATIONS (continued) |
| |||||||
Pertamina Persero | ||||||||
6.000%, 05/03/2042 (C) | $ | 300 | $ | 353 | ||||
Petrobras Global Finance BV | ||||||||
7.375%, 01/17/2027 | 310 | 368 | ||||||
6.900%, 03/19/2049 | 1,870 | 2,048 | ||||||
6.850%, 06/05/2115 | 820 | 845 | ||||||
6.250%, 03/17/2024 | 1,394 | 1,545 | ||||||
5.750%, 02/01/2029 | 300 | 327 | ||||||
5.299%, 01/27/2025 | 1,278 | 1,412 | ||||||
Petroleos del Peru | ||||||||
5.625%, 06/19/2047 (C) | 454 | 477 | ||||||
Petroleos Mexicanos | ||||||||
7.690%, 01/23/2050 | 70 | 65 | ||||||
6.950%, 01/28/2060 | 780 | 673 | ||||||
6.625%, 06/15/2035 | 1,797 | 1,707 | ||||||
6.500%, 03/13/2027 | 135 | 141 | ||||||
6.375%, 01/23/2045 | 1,105 | 917 | ||||||
5.950%, 01/28/2031 | 620 | 595 | ||||||
5.625%, 01/23/2046 | 480 | 382 | ||||||
4.875%, 01/18/2024 | 32 | 33 | ||||||
2.460%, 12/15/2025 | 923 | 962 | ||||||
2.378%, 04/15/2025 | 457 | 473 | ||||||
Petroleos Mexicanos MTN | ||||||||
6.875%, 08/04/2026 | 120 | 129 | ||||||
6.750%, 09/21/2047 | 2,970 | 2,547 | ||||||
Phillips 66 | ||||||||
1.300%, 02/15/2026 | 405 | 400 | ||||||
Pioneer Natural Resources | ||||||||
2.150%, 01/15/2031 | 450 | 422 | ||||||
1.900%, 08/15/2030 | 844 | 784 | ||||||
1.125%, 01/15/2026 | 1,223 | 1,202 | ||||||
0.750%, 01/15/2024 | 658 | 656 | ||||||
Plains All American Pipeline | ||||||||
4.900%, 02/15/2045 | 137 | 134 | ||||||
4.650%, 10/15/2025 | 1,485 | 1,627 | ||||||
3.550%, 12/15/2029 | 613 | 611 | ||||||
2.850%, 01/31/2023 | 250 | 256 | ||||||
Range Resources | ||||||||
5.875%, 07/01/2022 | 4 | 4 | ||||||
5.000%, 03/15/2023 (D) | 322 | 327 | ||||||
4.875%, 05/15/2025 | 120 | 119 | ||||||
Rockies Express Pipeline | ||||||||
6.875%, 04/15/2040 (C) | 830 | 896 | ||||||
4.950%, 07/15/2029 (C) | 2,235 | 2,282 | ||||||
Ruby Pipeline | ||||||||
8.000%, 04/01/2022 (C)(D) | 1,100 | 903 | ||||||
Sabine Pass Liquefaction | ||||||||
5.750%, 05/15/2024 | 1,605 | 1,811 | ||||||
5.625%, 03/01/2025 | 1,200 | 1,372 | ||||||
5.000%, 03/15/2027 | 1,265 | 1,439 | ||||||
Saudi Arabian Oil | ||||||||
1.625%, 11/24/2025 (C) | 540 | 544 | ||||||
68 | SEI Institutional Managed Trust / Semi-Annual Report / March 31, 2021 | |
| Description | Face Amount (Thousands) | Market Value ($ Thousands) | ||||||
CORPORATE OBLIGATIONS (continued) |
| |||||||
1.250%, 11/24/2023 (C) | $ | 450 | $ | 453 | ||||
Schlumberger Finance Canada | ||||||||
2.650%, 11/20/2022 (C) | 329 | 340 | ||||||
1.400%, 09/17/2025 | 380 | 380 | ||||||
Schlumberger Holdings | ||||||||
3.900%, 05/17/2028 (C) | 475 | 517 | ||||||
Schlumberger Investment | ||||||||
3.650%, 12/01/2023 | 61 | 66 | ||||||
Shell International Finance BV | ||||||||
4.550%, 08/12/2043 | 280 | 331 | ||||||
4.375%, 05/11/2045 | 470 | 546 | ||||||
4.125%, 05/11/2035 | 1,566 | 1,780 | ||||||
3.250%, 04/06/2050 | 840 | 820 | ||||||
2.875%, 05/10/2026 | 900 | 960 | ||||||
2.750%, 04/06/2030 | 440 | 454 | ||||||
Sinopec Group Overseas Development | ||||||||
4.375%, 04/10/2024 (C) | 1,240 | 1,361 | ||||||
Southern Natural Gas | ||||||||
8.000%, 03/01/2032 | 170 | 232 | ||||||
Spectra Energy Partners | ||||||||
5.950%, 09/25/2043 | 30 | 37 | ||||||
3.500%, 03/15/2025 | 815 | 872 | ||||||
Sunoco Logistics Partners Operations | ||||||||
5.400%, 10/01/2047 | 643 | 687 | ||||||
5.350%, 05/15/2045 | 465 | 487 | ||||||
5.300%, 04/01/2044 | 640 | 672 | ||||||
4.000%, 10/01/2027 | 600 | 645 | ||||||
3.900%, 07/15/2026 | 750 | 807 | ||||||
Targa Resources Partners | ||||||||
5.500%, 03/01/2030 | 130 | 136 | ||||||
4.875%, 02/01/2031 (C) | 320 | 324 | ||||||
4.000%, 01/15/2032 (C) | 40 | 38 | ||||||
Tennessee Gas Pipeline | ||||||||
8.375%, 06/15/2032 | 1,140 | 1,595 | ||||||
2.900%, 03/01/2030 (C) | 1,510 | 1,502 | ||||||
Total Capital International | ||||||||
3.127%, 05/29/2050 | 492 | 462 | ||||||
TransCanada PipeLines | ||||||||
4.625%, 03/01/2034 | 860 | 965 | ||||||
Transcontinental Gas Pipe Line | ||||||||
7.850%, 02/01/2026 | 60 | 76 | ||||||
Valero Energy | ||||||||
1.200%, 03/15/2024 | 1,115 | 1,118 | ||||||
Western Midstream Operating | ||||||||
6.500%, 02/01/2050 | 210 | 227 | ||||||
5.500%, 08/15/2048 | 54 | 53 | ||||||
5.300%, 02/01/2030 | 1,190 | 1,290 | ||||||
5.300%, 03/01/2048 | 162 | 163 | ||||||
4.650%, 07/01/2026 | 40 | 42 | ||||||
4.500%, 03/01/2028 | 60 | 62 | ||||||
4.350%, 02/01/2025 | 390 | 404 | ||||||
4.000%, 07/01/2022 | 35 | 36 | ||||||
| Description | Face Amount (Thousands) | Market Value ($ Thousands) | ||||||
CORPORATE OBLIGATIONS (continued) |
| |||||||
2.325%, VAR ICE LIBOR USD 3 Month+1.850%, 01/13/2023 | $ | 130 | $ | 127 | ||||
Williams | ||||||||
7.875%, 09/01/2021 | 260 | 268 | ||||||
7.750%, 06/15/2031 (D) | 841 | 1,107 | ||||||
7.500%, 01/15/2031 | 100 | 132 | ||||||
5.750%, 06/24/2044 | 51 | 62 | ||||||
5.400%, 03/04/2044 | 84 | 97 | ||||||
3.750%, 06/15/2027 | 1,044 | 1,137 | ||||||
2.600%, 03/15/2031 | 1,343 | 1,309 | ||||||
WPX Energy | ||||||||
8.250%, 08/01/2023 | 50 | 57 | ||||||
5.875%, 06/15/2028 | 40 | 44 | ||||||
5.250%, 09/15/2024 | 1,910 | 2,118 | ||||||
5.250%, 10/15/2027 | 70 | 75 | ||||||
4.500%, 01/15/2030 | 304 | 327 | ||||||
|
|
| ||||||
| 153,758 | ||||||||
|
|
| ||||||
Financials — 8.1 | ||||||||
ABN AMRO Bank | ||||||||
4.750%, 07/28/2025 (C) | 360 | 403 | ||||||
Ally Financial | ||||||||
5.750%, 11/20/2025 | 1,127 | 1,281 | ||||||
1.450%, 10/02/2023 | 670 | 680 | ||||||
Ambac Assurance | ||||||||
5.100% (C)(E) | 8 | 12 | ||||||
Ambac LSNI | ||||||||
6.000%, VAR ICE LIBOR USD 3 Month+5.000%, 02/12/2023 (C) | 31 | 31 | ||||||
American Express | ||||||||
3.700%, 08/03/2023 | 381 | 408 | ||||||
3.400%, 02/27/2023 | 414 | 436 | ||||||
2.500%, 08/01/2022 | 1,410 | 1,448 | ||||||
American Express Credit MTN | ||||||||
0.884%, VAR ICE LIBOR USD 3 Month+0.700%, 03/03/2022 | 1,430 | 1,437 | ||||||
American International Group | ||||||||
6.250%, 05/01/2036 | 100 | 134 | ||||||
6.250%, VAR ICE LIBOR USD 3 Month+2.056%, 03/15/2037 | 1,220 | 1,318 | ||||||
4.750%, 04/01/2048 | 130 | 154 | ||||||
4.375%, 06/30/2050 | 419 | 477 | ||||||
4.200%, 04/01/2028 | 128 | 144 | ||||||
4.125%, 02/15/2024 | 107 | 117 | ||||||
3.900%, 04/01/2026 | 530 | 585 | ||||||
3.875%, 01/15/2035 | 30 | 33 | ||||||
3.400%, 06/30/2030 | 709 | 753 | ||||||
2.500%, 06/30/2025 | 260 | 273 | ||||||
Andrew W Mellon Foundation | ||||||||
0.947%, 08/01/2027 | 384 | 373 | ||||||
Antares Holdings | ||||||||
3.950%, 07/15/2026 (C) | 666 | 671 | ||||||
SEI Institutional Managed Trust / Semi-Annual Report / March 31, 2021 | 69 |
SCHEDULE OF INVESTMENTS (Unaudited)
March 31, 2021
Core Fixed Income Fund (Continued)
| Description | Face Amount (Thousands) | Market Value ($ Thousands) | ||||||
CORPORATE OBLIGATIONS (continued) |
| |||||||
Aon | ||||||||
6.250%, 09/30/2040 | $ | 19 | $ | 26 | ||||
3.500%, 06/14/2024 | 65 | 70 | ||||||
Apollo Management Holdings | ||||||||
5.000%, 03/15/2048 (C) | 795 | 908 | ||||||
4.400%, 05/27/2026 (C) | 530 | 598 | ||||||
Athene Global Funding | ||||||||
3.000%, 07/01/2022 (C) | 211 | 217 | ||||||
2.950%, 11/12/2026 (C) | 2,090 | 2,194 | ||||||
2.500%, 03/24/2028 (C) | 1,270 | 1,266 | ||||||
Athene Holding | ||||||||
4.125%, 01/12/2028 | 1,240 | 1,350 | ||||||
3.500%, 01/15/2031 | 238 | 244 | ||||||
Avolon Holdings Funding | ||||||||
5.125%, 10/01/2023 (C) | 120 | 128 | ||||||
3.950%, 07/01/2024 (C) | 715 | 747 | ||||||
2.875%, 02/15/2025 (C) | 975 | 971 | ||||||
AXA Equitable Holdings | ||||||||
3.900%, 04/20/2023 | 500 | 532 | ||||||
Banco Santander | ||||||||
3.848%, 04/12/2023 | 600 | 637 | ||||||
2.958%, 03/25/2031 | 400 | 397 | ||||||
2.749%, 12/03/2030 | 1,000 | 952 | ||||||
2.746%, 05/28/2025 | 1,400 | 1,462 | ||||||
1.849%, 03/25/2026 | 1,200 | 1,197 | ||||||
1.344%, VAR ICE LIBOR USD 3 Month+1.120%, 04/12/2023 | 400 | 406 | ||||||
Bank of America | ||||||||
3.419%, VAR ICE LIBOR USD 3 Month+1.040%, 12/20/2028 | 1,010 | 1,083 | ||||||
3.004%, VAR ICE LIBOR USD 3 Month+0.790%, 12/20/2023 | 2,539 | 2,641 | ||||||
2.592%, VAR United States Secured Overnight Financing Rate+2.150%, 04/29/2031 | 1,548 | 1,543 | ||||||
1.658%, VAR United States Secured Overnight Financing Rate+0.910%, 03/11/2027 | 4,373 | 4,377 | ||||||
Bank of America MTN | ||||||||
5.000%, 01/21/2044 | 830 | 1,019 | ||||||
4.450%, 03/03/2026 | 847 | 951 | ||||||
4.330%, VAR ICE LIBOR USD 3 Month+1.520%, 03/15/2050 | 805 | 923 | ||||||
4.271%, VAR ICE LIBOR USD 3 Month+1.310%, 07/23/2029 | 65 | 73 | ||||||
4.250%, 10/22/2026 | 80 | 90 | ||||||
4.244%, VAR ICE LIBOR USD 3 Month+1.814%, 04/24/2038 | 179 | 203 | ||||||
4.200%, 08/26/2024 | 1,530 | 1,687 | ||||||
4.125%, 01/22/2024 | 290 | 317 | ||||||
4.100%, 07/24/2023 | 340 | 367 | ||||||
4.083%, VAR ICE LIBOR USD 3 Month+3.150%, 03/20/2051 | 2,835 | 3,160 | ||||||
| Description | Face Amount (Thousands) | Market Value ($ Thousands) | ||||||
CORPORATE OBLIGATIONS (continued) |
| |||||||
4.000%, 04/01/2024 | $ | 1,309 | $ | 1,430 | ||||
4.000%, 01/22/2025 | 2,033 | 2,221 | ||||||
3.974%, VAR ICE LIBOR USD 3 Month+1.210%, 02/07/2030 | 1,900 | 2,099 | ||||||
3.864%, VAR ICE LIBOR USD 3 Month+0.940%, 07/23/2024 | 600 | 643 | ||||||
3.824%, VAR ICE LIBOR USD 3 Month+1.575%, 01/20/2028 | 524 | 575 | ||||||
3.593%, VAR ICE LIBOR USD 3 Month+1.370%, 07/21/2028 | 1,364 | 1,480 | ||||||
3.550%, VAR ICE LIBOR USD 3 Month+0.780%, 03/05/2024 | 860 | 907 | ||||||
3.500%, 04/19/2026 | 941 | 1,031 | ||||||
3.300%, 01/11/2023 | 1,200 | 1,261 | ||||||
3.194%, VAR ICE LIBOR USD 3 Month+1.180%, 07/23/2030 | 240 | 252 | ||||||
3.093%, VAR ICE LIBOR USD 3 Month+1.090%, 10/01/2025 | 2,145 | 2,289 | ||||||
2.884%, VAR ICE LIBOR USD 3 Month+1.190%, 10/22/2030 | 265 | 272 | ||||||
2.496%, VAR ICE LIBOR USD 3 Month+0.990%, 02/13/2031 | 886 | 877 | ||||||
2.456%, VAR ICE LIBOR USD 3 Month+0.870%, 10/22/2025 | 1,628 | 1,707 | ||||||
2.015%, VAR ICE LIBOR USD 3 Month+0.640%, 02/13/2026 | 162 | 166 | ||||||
1.922%, VAR United States Secured Overnight Financing Rate+1.370%, 10/24/2031 | 527 | 496 | ||||||
1.898%, VAR United States Secured Overnight Financing Rate+1.530%, 07/23/2031 | 970 | 910 | ||||||
1.319%, VAR United States Secured Overnight Financing Rate+1.150%, 06/19/2026 | 1,421 | 1,416 | ||||||
1.197%, VAR United States Secured Overnight Financing Rate+1.010%, 10/24/2026 | 2,404 | 2,370 | ||||||
Bank of Montreal MTN | ||||||||
1.850%, 05/01/2025 | 880 | 901 | ||||||
Bank of New York Mellon | ||||||||
3.550%, 09/23/2021 | 34 | 34 | ||||||
3.400%, 05/15/2024 | 530 | 574 | ||||||
Bank of New York Mellon MTN | ||||||||
3.442%, VAR ICE LIBOR USD 3 Month+1.069%, 02/07/2028 | 840 | 923 | ||||||
3.250%, 09/11/2024 | 100 | 109 | ||||||
1.600%, 04/24/2025 | 260 | 265 | ||||||
Bank of Nova Scotia | ||||||||
4.900%, VAR US Treas Yield Curve Rate T Note Const Mat 5 Yr+4.551%(B)(E) | 510 | 542 | ||||||
1.300%, 06/11/2025 | 480 | 480 | ||||||
70 | SEI Institutional Managed Trust / Semi-Annual Report / March 31, 2021 |
| Description | Face Amount (Thousands) | Market Value ($ Thousands) | ||||||
CORPORATE OBLIGATIONS (continued) |
| |||||||
Barclays | ||||||||
5.088%, VAR ICE LIBOR USD 3 Month+3.054%, 06/20/2030 | $ | 1,940 | $ | 2,196 | ||||
3.811%, VAR US Treas Yield Curve Rate T Note Const Mat 1 Yr+1.700%, 03/10/2042 | 708 | 692 | ||||||
3.564%, VAR US Treas Yield Curve Rate T Note Const Mat 5 Yr+2.900%, 09/23/2035 | 1,779 | 1,782 | ||||||
1.007%, VAR US Treas Yield Curve Rate T Note Const Mat 1 Yr+0.800%, 12/10/2024 | 1,269 | 1,269 | ||||||
Barclays MTN | ||||||||
4.972%, VAR ICE LIBOR USD 3 Month+1.902%, 05/16/2029 | 520 | 598 | ||||||
4.338%, VAR ICE LIBOR USD 3 Month+1.356%, 05/16/2024 | 700 | 750 | ||||||
Barclays Bank | ||||||||
1.700%, 05/12/2022 | 360 | 365 | ||||||
BBVA USA | ||||||||
3.875%, 04/10/2025 | 430 | 470 | ||||||
Berkshire Hathaway | ||||||||
3.750%, 08/15/2021 (D) | 450 | 456 | ||||||
Berkshire Hathaway Finance | ||||||||
4.250%, 01/15/2049 | 1,395 | 1,610 | ||||||
Blackstone Secured Lending Fund | ||||||||
3.625%, 01/15/2026 (C) | 670 | 693 | ||||||
BNP Paribas | ||||||||
4.705%, VAR ICE LIBOR USD 3 Month+2.235%, 01/10/2025 (C) | 930 | 1,020 | ||||||
4.625%, 03/13/2027 (C) | 200 | 224 | ||||||
4.400%, 08/14/2028 (C) | 1,447 | 1,645 | ||||||
3.375%, 01/09/2025 (C) | 290 | 311 | ||||||
2.219%, VAR United States Secured Overnight Financing Rate+2.074%, 06/09/2026 (C) | 600 | 615 | ||||||
1.323%, VAR United States Secured Overnight Financing Rate+1.004%, 01/13/2027 (C) | 1,155 | 1,129 | ||||||
BNP Paribas MTN | ||||||||
4.375%, VAR USD Swap Semi 30/360 5 Yr Curr+1.483%, 03/01/2033 (C) | 400 | 436 | ||||||
3.500%, 03/01/2023 (C) | 464 | 489 | ||||||
3.052%, VAR United States Secured Overnight Financing Rate+1.507%, 01/13/2031 (C) | 200 | 205 | ||||||
BPCE | ||||||||
5.150%, 07/21/2024 (C) | 410 | 459 | ||||||
Brighthouse Financial | ||||||||
4.700%, 06/22/2047 | 576 | 589 | ||||||
Canadian Imperial Bank of Commerce | ||||||||
0.950%, 06/23/2023 | 480 | 484 | ||||||
0.950%, 10/23/2025 | 895 | 877 | ||||||
| Description | Face Amount (Thousands) | Market Value ($ Thousands) | ||||||
CORPORATE OBLIGATIONS (continued) |
| |||||||
Charles Schwab | ||||||||
0.750%, 03/18/2024 | $ | 895 | $ | 900 | ||||
Chubb INA Holdings | ||||||||
3.350%, 05/03/2026 | 200 | 218 | ||||||
3.150%, 03/15/2025 | 74 | 80 | ||||||
2.875%, 11/03/2022 | 39 | 40 | ||||||
CI Financial | ||||||||
3.200%, 12/17/2030 | 1,255 | 1,248 | ||||||
Citadel | ||||||||
4.875%, 01/15/2027 (C) | 660 | 700 | ||||||
Citibank | ||||||||
0.782%, VAR ICE LIBOR USD 3 Month+0.600%, 05/20/2022 | 2,405 | 2,407 | ||||||
Citigroup | ||||||||
8.125%, 07/15/2039 | 1,064 | 1,743 | ||||||
6.675%, 09/13/2043 | 70 | 102 | ||||||
6.625%, 06/15/2032 | 100 | 132 | ||||||
6.300%, VAR ICE LIBOR USD 3 Month+3.423%(B)(E) | 300 | 319 | ||||||
5.950%, VAR ICE LIBOR USD 3 Month+3.905%(B)(E) | 930 | 1,002 | ||||||
5.950%, VAR ICE LIBOR USD 3 Month+4.068%(B)(E) | 360 | 378 | ||||||
5.500%, 09/13/2025 | 950 | 1,101 | ||||||
5.316%, VAR United States | 685 | 880 | ||||||
5.300%, 05/06/2044 | 225 | 284 | ||||||
4.750%, 05/18/2046 | 100 | 119 | ||||||
4.650%, 07/30/2045 | 903 | 1,076 | ||||||
4.650%, 07/23/2048 | 490 | 599 | ||||||
4.500%, 01/14/2022 | 380 | 392 | ||||||
4.450%, 09/29/2027 | 1,295 | 1,458 | ||||||
4.412%, VAR United States | 2,750 | 3,126 | ||||||
4.400%, 06/10/2025 | 1,080 | 1,200 | ||||||
4.300%, 11/20/2026 | 240 | 268 | ||||||
4.125%, 07/25/2028 | 210 | 233 | ||||||
4.075%, VAR ICE LIBOR USD 3 Month+1.192%, 04/23/2029 | 81 | 90 | ||||||
4.050%, 07/30/2022 | 70 | 73 | ||||||
3.980%, VAR ICE LIBOR USD 3 Month+1.338%, 03/20/2030 | 1,860 | 2,058 | ||||||
3.878%, VAR ICE LIBOR USD 3 Month+1.168%, 01/24/2039 | 59 | 64 | ||||||
3.700%, 01/12/2026 | 485 | 532 | ||||||
3.500%, 05/15/2023 | 630 | 666 | ||||||
3.400%, 05/01/2026 | 260 | 283 | ||||||
3.352%, VAR ICE LIBOR USD 3 Month+0.897%, 04/24/2025 | 990 | 1,058 | ||||||
3.300%, 04/27/2025 | 120 | 129 | ||||||
3.200%, 10/21/2026 | 360 | 387 | ||||||
| SEI Institutional Managed Trust / Semi-Annual Report / March 31, 2021 | 71 |
SCHEDULE OF INVESTMENTS (Unaudited)
March 31, 2021
Core Fixed Income Fund (Continued)
| Description | Face Amount (Thousands) | Market Value ($ Thousands) | ||||||
CORPORATE OBLIGATIONS (continued) |
| |||||||
3.142%, VAR ICE LIBOR USD 3 | $ | 935 | $ | 954 | ||||
3.106%, VAR United States | 350 | 374 | ||||||
2.572%, VAR United States | 310 | 309 | ||||||
1.678%, VAR United States | 500 | 510 | ||||||
CME Group | ||||||||
3.000%, 03/15/2025 | 51 | 54 | ||||||
Cooperatieve Rabobank UA | ||||||||
4.625%, 12/01/2023 | 1,630 | 1,785 | ||||||
4.375%, 08/04/2025 | 2,150 | 2,380 | ||||||
Cooperatieve Rabobank UA MTN | ||||||||
3.875%, 02/08/2022 | 30 | 31 | ||||||
Credit Agricole MTN | ||||||||
4.000%, VAR USD Swap Semi 30/360 | 250 | 268 | ||||||
1.907%, VAR United States | 400 | 405 | ||||||
Credit Suisse Group | ||||||||
4.282%, 01/09/2028 (C) | 230 | 253 | ||||||
4.207%, VAR ICE LIBOR USD 3 | 300 | 320 | ||||||
4.194%, VAR United States | 730 | 794 | ||||||
3.750%, 03/26/2025 | 250 | 269 | ||||||
2.593%, VAR United States | 760 | 788 | ||||||
2.193%, VAR United States | 3,934 | 3,996 | ||||||
1.305%, VAR United States | 1,268 | 1,228 | ||||||
Credit Suisse NY | ||||||||
2.950%, 04/09/2025 | 520 | 549 | ||||||
Danske Bank | ||||||||
5.375%, 01/12/2024 (C) | 650 | 725 | ||||||
5.000%, 01/12/2022 (C) | 990 | 1,023 | ||||||
3.875%, 09/12/2023 (C) | 200 | 214 | ||||||
3.244%, VAR ICE LIBOR USD 3 | 220 | 234 | ||||||
3.001%, VAR ICE LIBOR USD 3 | 1,994 | 2,014 | ||||||
1.226%, 06/22/2024 (C) | 200 | 202 | ||||||
| Description | Face Amount (Thousands) | Market Value ($ Thousands) | ||||||
CORPORATE OBLIGATIONS (continued) |
| |||||||
1.171%, VAR US Treas Yield Curve Rate T Note Const Mat 1 Yr+1.030%, | $ | 1,316 | $ | 1,323 | ||||
Danske Bank MTN | ||||||||
4.375%, 06/12/2028 (C) | 200 | 219 | ||||||
Deutsche Bank NY | ||||||||
3.729%, VAR United States | 400 | 389 | ||||||
2.129%, VAR United States | 1,696 | 1,699 | ||||||
Farmers Exchange Capital | ||||||||
7.200%, 07/15/2048 (C) | 1,021 | 1,347 | ||||||
7.050%, 07/15/2028 (C) | 1,000 | 1,197 | ||||||
Farmers Exchange Capital II | ||||||||
6.151%, VAR ICE LIBOR USD 3 | 1,650 | 2,084 | ||||||
Federal Realty Investment Trust | ||||||||
3.950%, 01/15/2024 | 436 | 472 | ||||||
Fifth Third Bank | ||||||||
3.950%, 07/28/2025 | 339 | 377 | ||||||
2.875%, 10/01/2021 | 730 | 738 | ||||||
FS KKR Capital | ||||||||
3.400%, 01/15/2026 | 1,599 | 1,585 | ||||||
Goldman Sachs Capital II | ||||||||
4.000%, VAR ICE LIBOR USD 3 | 10 | 9 | ||||||
Goldman Sachs Group | ||||||||
6.750%, 10/01/2037 | 30 | 42 | ||||||
6.250%, 02/01/2041 | 1,050 | 1,479 | ||||||
5.750%, 01/24/2022 | 110 | 115 | ||||||
5.250%, 07/27/2021 | 740 | 751 | ||||||
5.150%, 05/22/2045 | 820 | 1,023 | ||||||
4.750%, 10/21/2045 | 730 | 897 | ||||||
4.250%, 10/21/2025 | 1,120 | 1,250 | ||||||
4.223%, VAR ICE LIBOR USD 3 | 1,300 | 1,453 | ||||||
3.814%, VAR ICE LIBOR USD 3 | 480 | 526 | ||||||
3.800%, 03/15/2030 | 2,745 | 3,021 | ||||||
3.750%, 02/25/2026 | 560 | 614 | ||||||
3.691%, VAR ICE LIBOR USD 3 | 980 | 1,072 | ||||||
3.500%, 04/01/2025 | 540 | 585 | ||||||
3.500%, 11/16/2026 | 900 | 975 | ||||||
3.272%, VAR ICE LIBOR USD 3 | 2,700 | 2,896 | ||||||
3.200%, 02/23/2023 | 470 | 492 | ||||||
2.876%, VAR ICE LIBOR USD 3 | 788 | 798 | ||||||
0.523%, 03/08/2023 | 1,628 | 1,628 | ||||||
0.481%, 01/27/2023 | 4,959 | 4,952 | ||||||
72 | SEI Institutional Managed Trust / Semi-Annual Report / March 31, 2021 |
| Description | Face Amount (Thousands) | Market Value ($ Thousands) | ||||||
CORPORATE OBLIGATIONS (continued) |
| |||||||
Goldman Sachs Group MTN | ||||||||
4.800%, 07/08/2044 | $ | 120 | $ | 147 | ||||
4.000%, 03/03/2024 | 1,090 | 1,188 | ||||||
3.850%, 07/08/2024 | 330 | 359 | ||||||
2.905%, VAR ICE LIBOR USD 3 | 880 | 906 | ||||||
Golub Capital BDC | ||||||||
3.375%, 04/15/2024 | 1,396 | 1,444 | ||||||
2.500%, 08/24/2026 | 471 | 461 | ||||||
Guardian Life Global Funding | ||||||||
1.100%, 06/23/2025 (C) | 670 | 665 | ||||||
HSBC Bank | ||||||||
7.650%, 05/01/2025 | 500 | 605 | ||||||
HSBC Bank USA | ||||||||
7.000%, 01/15/2039 | 275 | 406 | ||||||
HSBC Holdings | ||||||||
4.600%, VAR US Treas Yield Curve Rate T Note Const Mat 5 | 905 | 893 | ||||||
4.583%, VAR ICE LIBOR USD 3 | 945 | 1,062 | ||||||
4.375%, 11/23/2026 | 345 | 384 | ||||||
4.300%, 03/08/2026 | 1,710 | 1,913 | ||||||
4.250%, 03/14/2024 | 510 | 554 | ||||||
4.250%, 08/18/2025 | 560 | 615 | ||||||
3.973%, VAR ICE LIBOR USD 3 | 860 | 933 | ||||||
2.633%, VAR United States | 835 | 873 | ||||||
2.099%, VAR United States | 200 | 203 | ||||||
2.013%, VAR United States | 3,230 | 3,172 | ||||||
1.645%, VAR United States | 1,091 | 1,091 | ||||||
1.589%, VAR United States | 2,507 | 2,466 | ||||||
ILFC E-Capital Trust II | ||||||||
4.220%, 12/21/2065 (C) | 400 | 332 | ||||||
ING Groep | ||||||||
2.727%, VAR United States | 450 | 449 | ||||||
Intesa Sanpaolo | ||||||||
3.375%, 01/12/2023 (C) | 440 | 458 | ||||||
3.125%, 07/14/2022 (C)(D) | 600 | 617 | ||||||
Intesa Sanpaolo MTN | ||||||||
5.017%, 06/26/2024 (C) | 2,320 | 2,532 | ||||||
| Description | Face Amount (Thousands) | Market Value ($ Thousands) | ||||||
CORPORATE OBLIGATIONS (continued) |
| |||||||
JPMorgan Chase | ||||||||
8.750%, 09/01/2030 | $ | 970 | $ | 1,431 | ||||
4.950%, 06/01/2045 | 430 | 534 | ||||||
4.452%, VAR ICE LIBOR USD 3 | 300 | 343 | ||||||
4.260%, VAR ICE LIBOR USD 3 | 84 | 96 | ||||||
4.250%, 10/01/2027 | 720 | 815 | ||||||
4.203%, VAR ICE LIBOR USD 3 | 800 | 904 | ||||||
4.032%, VAR ICE LIBOR USD 3 | 645 | 721 | ||||||
4.023%, VAR ICE LIBOR USD 3 | 2,805 | 3,043 | ||||||
3.900%, 07/15/2025 | 680 | 750 | ||||||
3.897%, VAR ICE LIBOR USD 3 | 115 | 126 | ||||||
3.882%, VAR ICE LIBOR USD 3 | 325 | 360 | ||||||
3.875%, 09/10/2024 | 1,140 | 1,250 | ||||||
3.625%, 05/13/2024 | 230 | 251 | ||||||
3.625%, 12/01/2027 | 230 | 250 | ||||||
3.207%, VAR ICE LIBOR USD 3 | 2,000 | 2,054 | ||||||
3.200%, 01/25/2023 | 100 | 105 | ||||||
3.200%, 06/15/2026 | 400 | 432 | ||||||
3.109%, VAR United States | 130 | 126 | ||||||
2.956%, VAR United States | 620 | 631 | ||||||
2.950%, 10/01/2026 | 377 | 403 | ||||||
2.739%, VAR United States | 165 | 167 | ||||||
2.522%, VAR United States | 450 | 447 | ||||||
2.301%, VAR United States Secured | 1,190 | 1,239 | ||||||
2.182%, VAR United States | 966 | 975 | ||||||
2.083%, VAR United States | 2,824 | 2,899 | ||||||
2.005%, VAR United States | 660 | 678 | ||||||
| SEI Institutional Managed Trust / Semi-Annual Report / March 31, 2021 | 73 |
SCHEDULE OF INVESTMENTS (Unaudited)
March 31, 2021
Core Fixed Income Fund (Continued)
| Description | Face Amount (Thousands) | Market Value ($ Thousands) | ||||||
CORPORATE OBLIGATIONS (continued) |
| |||||||
1.764%, VAR United States Secured Overnight Financing Rate+1.105%, 11/19/2031 | $ | 965 | $ | 899 | ||||
1.514%, VAR United States Secured Overnight Financing Rate+1.455%, 06/01/2024 | 1,340 | 1,367 | ||||||
1.045%, VAR United States Secured Overnight Financing Rate+0.800%, 11/19/2026 | 1,759 | 1,717 | ||||||
1.040%, VAR United States Secured Overnight Financing Rate+0.695%, 02/04/2027 | 3,155 | 3,076 | ||||||
0.760%, VAR ICE LIBOR USD 3 Month+0.550%, 02/01/2027 | 1,590 | 1,524 | ||||||
KKR Group Finance II | ||||||||
5.500%, 02/01/2043 (C) | 80 | 102 | ||||||
KKR Group Finance III | ||||||||
5.125%, 06/01/2044 (C) | 535 | 650 | ||||||
Lloyds Banking Group | ||||||||
4.375%, 03/22/2028 | 925 | 1,038 | ||||||
4.344%, 01/09/2048 | 200 | 217 | ||||||
4.050%, 08/16/2023 | 1,390 | 1,500 | ||||||
3.100%, 07/06/2021 | 490 | 493 | ||||||
2.907%, VAR ICE LIBOR USD 3 Month+0.810%, 11/07/2023 | 410 | 425 | ||||||
2.858%, VAR ICE LIBOR USD 3 Month+1.249%, 03/17/2023 | 855 | 873 | ||||||
1.627%, VAR US Treas Yield Curve Rate T Note Const Mat 1 Yr+0.850%, 05/11/2027 | 2,000 | 1,985 | ||||||
Macquarie Bank | ||||||||
3.624%, 06/03/2030 (C) | 425 | 434 | ||||||
Massachusetts Mutual Life Insurance | ||||||||
3.729%, 10/15/2070 (C) | 88 | 86 | ||||||
Mercury General | ||||||||
4.400%, 03/15/2027 | 935 | 1,054 | ||||||
MetLife | ||||||||
6.400%, 12/15/2036 | 420 | 526 | ||||||
5.700%, 06/15/2035 | 15 | 20 | ||||||
MetLife Capital Trust IV | ||||||||
7.875%, 12/15/2037 (C) | 800 | 1,112 | ||||||
Metropolitan Life Global Funding I | ||||||||
3.450%, 12/18/2026 (C) | 1,955 | 2,149 | ||||||
Mitsubishi UFJ Financial Group | ||||||||
2.998%, 02/22/2022 | 230 | 235 | ||||||
Morgan Stanley | ||||||||
3.625%, 01/20/2027 | 852 | 934 | ||||||
0.985%, VAR United States Secured Overnight Financing Rate+0.720%, 12/10/2026 | 1,605 | 1,566 | ||||||
Morgan Stanley MTN | ||||||||
4.431%, VAR ICE LIBOR USD 3 Month+1.628%, 01/23/2030 | 340 | 389 | ||||||
| Description | Face Amount (Thousands) | Market Value ($ Thousands) | ||||||
CORPORATE OBLIGATIONS (continued) |
| |||||||
4.000%, 07/23/2025 | $ | 1,124 | $ | 1,247 | ||||
3.971%, VAR ICE LIBOR USD 3 Month+1.455%, 07/22/2038 | 119 | 133 | ||||||
3.875%, 04/29/2024 | 1,685 | 1,840 | ||||||
3.772%, VAR ICE LIBOR USD 3 Month+1.140%, 01/24/2029 | 1,080 | 1,181 | ||||||
3.622%, VAR United States Secured Overnight Financing | ||||||||
Rate+3.120%, 04/01/2031 | 3,039 | 3,296 | ||||||
3.125%, 07/27/2026 | 190 | 205 | ||||||
2.750%, 05/19/2022 | 1 | 1 | ||||||
2.720%, VAR United States Secured Overnight Financing Rate+1.152%, 07/22/2025 | 980 | 1,034 | ||||||
2.699%, VAR United States Secured Overnight Financing Rate+1.143%, 01/22/2031 | 992 | 1,009 | ||||||
2.625%, 11/17/2021 | 1,066 | 1,082 | ||||||
2.188%, VAR United States Secured Overnight Financing Rate+1.990%, 04/28/2026 | 1,461 | 1,509 | ||||||
1.794%, VAR United States Secured Overnight Financing Rate+1.034%, 02/13/2032 | 1,933 | 1,796 | ||||||
0.864%, VAR United States Secured Overnight Financing Rate+0.745%, 10/21/2025 | 1,137 | 1,131 | ||||||
MUFG Bank | ||||||||
4.100%, 09/09/2023 (C) | 200 | 217 | ||||||
National Australia Bank MTN | ||||||||
2.332%, 08/21/2030 (C) | 925 | 873 | ||||||
National Securities Clearing | ||||||||
1.500%, 04/23/2025 (C) | 3,035 | 3,065 | ||||||
1.200%, 04/23/2023 (C) | 410 | 416 | ||||||
Nationwide Building Society | ||||||||
4.363%, VAR ICE LIBOR USD 3 | ||||||||
Month+1.392%, 08/01/2024 (C) | 800 | 864 | ||||||
3.766%, VAR ICE LIBOR USD 3 | ||||||||
Month+1.064%, 03/08/2024 (C) | 1,090 | 1,151 | ||||||
Nationwide Building Society MTN | ||||||||
3.622%, VAR ICE LIBOR USD 3 Month+1.181%, 04/26/2023 (C) | 830 | 856 | ||||||
Nationwide Mutual Insurance | ||||||||
4.350%, 04/30/2050 (C) | 488 | 511 | ||||||
2.474%, VAR ICE LIBOR USD 3 Month+2.290%, 12/15/2024 (C) | 3,735 | 3,731 | ||||||
Natwest Group | ||||||||
4.892%, VAR ICE LIBOR USD 3 Month+1.754%, 05/18/2029 | 200 | 228 | ||||||
4.519%, VAR ICE LIBOR USD 3 Month+1.550%, 06/25/2024 | 830 | 897 | ||||||
4.269%, VAR ICE LIBOR USD 3 Month+1.762%, 03/22/2025 | 220 | 240 | ||||||
74 | SEI Institutional Managed Trust / Semi-Annual Report / March 31, 2021 |
| Description | Face Amount (Thousands) | Market Value ($ Thousands) | ||||||
CORPORATE OBLIGATIONS (continued) |
| |||||||
3.875%, 09/12/2023 | $ | 720 | $ | 772 | ||||
New York Life Global Funding | ||||||||
2.875%, 04/10/2024 (C) | 1,045 | 1,114 | ||||||
0.950%, 06/24/2025 (C) | 340 | 337 | ||||||
New York Life Insurance | ||||||||
6.750%, 11/15/2039 (C) | 345 | 491 | ||||||
Nomura Holdings | ||||||||
2.648%, 01/16/2025 | 550 | 569 | ||||||
Nordea Bank Abp | ||||||||
4.875%, 05/13/2021 (C) | 250 | 251 | ||||||
Northwestern Mutual Global Funding MTN | ||||||||
0.800%, 01/14/2026 (C) | 750 | 733 | ||||||
Northwestern Mutual Life Insurance | ||||||||
3.625%, 09/30/2059 (C) | 1,212 | 1,217 | ||||||
Ohio National Financial Services | ||||||||
5.550%, 01/24/2030 (C) | 625 | 680 | ||||||
Owl Rock Capital | ||||||||
3.400%, 07/15/2026 | 1,836 | 1,859 | ||||||
Park Aerospace Holdings | ||||||||
5.500%, 02/15/2024 (C) | 500 | 544 | ||||||
5.250%, 08/15/2022 (C) | 270 | 283 | ||||||
4.500%, 03/15/2023 (C) | 2,070 | 2,162 | ||||||
Pipeline Funding | ||||||||
7.500%, 01/15/2030 (C) | 405 | 505 | ||||||
Principal Life Global Funding II | ||||||||
1.250%, 06/23/2025 (C) | 160 | 160 | ||||||
Private Export Funding | ||||||||
0.550%, 07/30/2024 (C) | 845 | 844 | ||||||
Prospect Capital | ||||||||
3.706%, 01/22/2026 | 680 | 671 | ||||||
Prudential Financial MTN | ||||||||
5.625%, 05/12/2041 | 10 | 13 | ||||||
Raymond James Financial | ||||||||
4.950%, 07/15/2046 | 180 | 220 | ||||||
Royal Bank of Canada MTN | ||||||||
3.200%, 04/30/2021 | 480 | 481 | ||||||
1.600%, 04/17/2023 | 760 | 778 | ||||||
1.150%, 06/10/2025 | 460 | 459 | ||||||
Santander Holdings USA | ||||||||
4.500%, 07/17/2025 | 153 | 169 | ||||||
4.400%, 07/13/2027 | 363 | 404 | ||||||
3.450%, 06/02/2025 | 1,995 | 2,136 | ||||||
3.400%, 01/18/2023 | 232 | 242 | ||||||
3.244%, 10/05/2026 | 724 | 764 | ||||||
Santander UK Group Holdings | ||||||||
4.796%, VAR ICE LIBOR USD 3 Month+1.570%, 11/15/2024 | 2,750 | 3,027 | ||||||
3.373%, VAR ICE LIBOR USD 3 Month+1.080%, 01/05/2024 | 760 | 794 | ||||||
1.532%, VAR US Treas Yield Curve Rate T Note Const Mat 1 Yr+1.250%, 08/21/2026 | 2,131 | 2,114 | ||||||
| Description | Face Amount (Thousands) | Market Value ($ Thousands) | ||||||
CORPORATE OBLIGATIONS (continued) |
| |||||||
1.089%, VAR United States Secured Overnight Financing Rate+0.787%, 03/15/2025 | $ | 2,475 | $ | 2,471 | ||||
SBL Holdings | ||||||||
5.000%, 02/18/2031 (C) | 970 | 979 | ||||||
Scentre Group Trust 1 | ||||||||
4.375%, 05/28/2030 (C) | 635 | 707 | ||||||
3.625%, 01/28/2026 (C) | 1,132 | 1,220 | ||||||
Societe Generale | ||||||||
3.625%, 03/01/2041 (C) | 1,196 | 1,148 | ||||||
Societe Generale MTN | ||||||||
3.653%, VAR US Treas Yield Curve Rate T Note Const Mat 5 Yr+3.000%, 07/08/2035 (C) | 677 | 675 | ||||||
2.625%, 01/22/2025 (C) | 735 | 762 | ||||||
Standard Chartered | ||||||||
1.456%, VAR US Treas Yield Curve Rate T Note Const Mat 1 Yr+1.000%, 01/14/2027 (C) | 673 | 657 | ||||||
0.991%, VAR US Treas Yield Curve Rate T Note Const Mat 1 Yr+0.780%, 01/12/2025 (C) | 810 | 805 | ||||||
State Street | ||||||||
3.300%, 12/16/2024 | 70 | 76 | ||||||
3.152%, VAR United States Secured Overnight Financing Rate+2.650%, 03/30/2031 | 710 | 752 | ||||||
Sumitomo Mitsui Financial Group | ||||||||
2.058%, 07/14/2021 | 340 | 342 | ||||||
Svensk Exportkredit MTN | ||||||||
0.750%, 04/06/2023 | 1,346 | 1,358 | ||||||
Svenska Handelsbanken MTN | ||||||||
3.350%, 05/24/2021 | 500 | 502 | ||||||
Swedbank | ||||||||
1.300%, 06/02/2023 (C) | 580 | 589 | ||||||
Teachers Insurance & Annuity Association of America | ||||||||
6.850%, 12/16/2039 (C) | 124 | 179 | ||||||
4.900%, 09/15/2044 (C) | 240 | 291 | ||||||
3.300%, 05/15/2050 (C) | 2,455 | 2,381 | ||||||
The Vanguard Group | ||||||||
3.050%, 08/22/2050 | 670 | 557 | ||||||
Toronto-Dominion Bank MTN | ||||||||
3.250%, 06/11/2021 | 590 | 593 | ||||||
1.150%, 06/12/2025 | 460 | 460 | ||||||
0.750%, 06/12/2023 | 910 | 917 | ||||||
Truist Financial MTN | ||||||||
2.200%, 03/16/2023 | 1,625 | 1,679 | ||||||
1.267%, VAR United States Secured Overnight Financing Rate+0.609%, 03/02/2027 | 187 | 185 | ||||||
Trust Fibra Uno | ||||||||
6.390%, 01/15/2050 (C) | 544 | 600 | ||||||
SEI Institutional Managed Trust / Semi-Annual Report / March 31, 2021 | 75 |
SCHEDULE OF INVESTMENTS (Unaudited)
March 31, 2021
Core Fixed Income Fund (Continued)
| Description | Face Amount (Thousands) | Market Value ($ Thousands) | ||||||
CORPORATE OBLIGATIONS (continued) |
| |||||||
5.250%, 01/30/2026 (C) | $ | 490 | $ | 542 | ||||
UBS |
| |||||||
1.750%, 04/21/2022 (C) | 850 | 862 | ||||||
UBS Group |
| |||||||
7.000%, VAR USD Swap Semi 30/360 5 Yr Curr+4.344%(B)(C)(E) | 1,640 | 1,801 | ||||||
4.253%, 03/23/2028 (C) | 350 | 395 | ||||||
4.125%, 09/24/2025 (C) | 200 | 222 | ||||||
3.491%, 05/23/2023 (C) | 1,650 | 1,703 | ||||||
2.859%, VAR ICE LIBOR USD 3 Month+0.954%, 08/15/2023 (C) | 200 | 206 | ||||||
2.650%, 02/01/2022 (C) | 385 | 392 | ||||||
UBS Group MTN |
| |||||||
2.095%, VAR US Treas Yield Curve Rate T Note Const Mat 1 Yr+1.000%, 02/11/2032 (C) | 1,266 | 1,197 | ||||||
UniCredit MTN |
| |||||||
6.572%, 01/14/2022 (C) | 1,350 | 1,407 | ||||||
US Bancorp |
| |||||||
2.400%, 07/30/2024 | 1,410 | 1,486 | ||||||
1.450%, 05/12/2025 | 1,020 | 1,034 | ||||||
US Bancorp MTN |
| |||||||
2.950%, 07/15/2022 | 25 | 26 | ||||||
USAA Capital |
| |||||||
1.500%, 05/01/2023 (C) | 150 | 153 | ||||||
Validus Holdings |
| |||||||
8.875%, 01/26/2040 | 905 | 1,403 | ||||||
WEA Finance |
| |||||||
4.750%, 09/17/2044 (C) | 230 | 233 | ||||||
3.750%, 09/17/2024 (C) | 990 | 1,048 | ||||||
Wells Fargo |
| |||||||
7.950%, 11/15/2029 | 495 | 659 | ||||||
5.375%, 11/02/2043 | 400 | 499 | ||||||
3.068%, VAR United States Secured Overnight Financing Rate+2.530%, 04/30/2041 | 925 | 905 | ||||||
3.000%, 10/23/2026 | 1,030 | 1,101 | ||||||
2.188%, VAR United States Secured Overnight Financing Rate+2.000%, 04/30/2026 | 2,760 | 2,847 | ||||||
Wells Fargo MTN |
| |||||||
5.013%, VAR United States Secured Overnight Financing Rate+4.502%, 04/04/2051 | 7,736 | 9,887 | ||||||
4.900%, 11/17/2045 | 909 | 1,079 | ||||||
4.750%, 12/07/2046 | 700 | 820 | ||||||
4.650%, 11/04/2044 | 261 | 300 | ||||||
4.600%, 04/01/2021 | 160 | 160 | ||||||
4.478%, VAR United States Secured Overnight Financing Rate+4.032%, 04/04/2031 | 2,630 | 3,017 | ||||||
4.400%, 06/14/2046 | 1,370 | 1,522 | ||||||
4.150%, 01/24/2029 | 1,010 | 1,138 | ||||||
| Description | Face Amount (Thousands) | Market Value ($ Thousands) | ||||||
CORPORATE OBLIGATIONS (continued) |
| |||||||
4.125%, 08/15/2023 | $ | 900 | $ | 973 | ||||
3.750%, 01/24/2024 | 250 | 270 | ||||||
3.500%, 03/08/2022 | 72 | 74 | ||||||
3.450%, 02/13/2023 | 660 | 695 | ||||||
3.196%, VAR ICE LIBOR USD 3 Month+1.170%, 06/17/2027 | 1,550 | 1,661 | ||||||
2.879%, VAR United States Secured Overnight Financing Rate+1.432%, 10/30/2030 | 2,285 | 2,352 | ||||||
2.406%, VAR United States Secured Overnight Financing Rate+1.087%, 10/30/2025 | 1,005 | 1,050 | ||||||
2.164%, VAR ICE LIBOR USD 3 Month+0.750%, 02/11/2026 | 1,310 | 1,350 | ||||||
Westpac Banking |
| |||||||
2.668%, VAR US Treas Yield Curve Rate T Note Const Mat 5 Yr+1.750%, 11/15/2035 |
| 1,567
|
|
| 1,487
|
| ||
|
|
| ||||||
| 362,806 | ||||||||
|
|
| ||||||
Health Care — 3.4% | ||||||||
Abbott Laboratories |
| |||||||
4.900%, 11/30/2046 | 470 | 610 | ||||||
4.750%, 11/30/2036 | 260 | 321 | ||||||
3.750%, 11/30/2026 | 463 | 519 | ||||||
AbbVie | ||||||||
5.000%, 12/15/2021 | 35 | 36 | ||||||
4.625%, 10/01/2042 | 38 | 44 | ||||||
4.550%, 03/15/2035 | 500 | 579 | ||||||
4.500%, 05/14/2035 | 715 | 835 | ||||||
4.450%, 05/14/2046 | 233 | 268 | ||||||
4.400%, 11/06/2042 | 1,079 | 1,245 | ||||||
4.300%, 05/14/2036 | 228 | 261 | ||||||
4.250%, 11/14/2028 | 335 | 382 | ||||||
4.250%, 11/21/2049 | 3,426 | 3,860 | ||||||
4.050%, 11/21/2039 | 940 | 1,049 | ||||||
3.800%, 03/15/2025 | 460 | 503 | ||||||
3.750%, 11/14/2023 | 186 | 200 | ||||||
3.600%, 05/14/2025 | 770 | 839 | ||||||
3.450%, 03/15/2022 | 370 | 379 | ||||||
3.200%, 11/06/2022 | 44 | 46 | ||||||
3.200%, 11/21/2029 | 6,063 | 6,445 | ||||||
2.950%, 11/21/2026 | 380 | 405 | ||||||
2.900%, 11/06/2022 | 10 | 10 | ||||||
2.600%, 11/21/2024 | 1,820 | 1,922 | ||||||
2.300%, 11/21/2022 | 2,912 | 2,996 | ||||||
Advocate Health & Hospitals | ||||||||
2.211%, 06/15/2030 | 1,615 | 1,601 | ||||||
Aetna | ||||||||
3.875%, 08/15/2047 | 339 | 354 | ||||||
2.800%, 06/15/2023 | 2,650 | 2,764 | ||||||
76 | SEI Institutional Managed Trust / Semi-Annual Report / March 31, 2021 |
| Description | Face Amount (Thousands) | Market Value ($ Thousands) | ||||||
CORPORATE OBLIGATIONS (continued) |
| |||||||
AmerisourceBergen | ||||||||
2.700%, 03/15/2031 | $ | 510 | $ | 508 | ||||
Amgen | ||||||||
5.150%, 11/15/2041 | 332 | 417 | ||||||
4.663%, 06/15/2051 | 269 | 325 | ||||||
4.400%, 05/01/2045 | 375 | 432 | ||||||
3.625%, 05/22/2024 | 130 | 140 | ||||||
3.150%, 02/21/2040 | 530 | 527 | ||||||
2.770%, 09/01/2053 (C) | 263 | 232 | ||||||
Anthem | ||||||||
4.625%, 05/15/2042 | 41 | 48 | ||||||
3.650%, 12/01/2027 | 220 | 243 | ||||||
3.500%, 08/15/2024 | 90 | 97 | ||||||
3.350%, 12/01/2024 | 1,425 | 1,541 | ||||||
3.125%, 05/15/2022 | 468 | 482 | ||||||
2.950%, 12/01/2022 | 661 | 687 | ||||||
2.250%, 05/15/2030 | 381 | 374 | ||||||
AstraZeneca | ||||||||
3.500%, 08/17/2023 | 315 | 336 | ||||||
Bausch Health | ||||||||
7.250%, 05/30/2029 (C) | 170 | 190 | ||||||
6.250%, 02/15/2029 (C) | 500 | 531 | ||||||
5.500%, 11/01/2025 (C) | 20 | 21 | ||||||
Baxalta | ||||||||
3.600%, 06/23/2022 | 546 | 564 | ||||||
Baxter International | ||||||||
3.950%, 04/01/2030 (C) | 425 | 478 | ||||||
BayCare Health System | ||||||||
3.831%, 11/15/2050 | 1,595 | 1,799 | ||||||
Bayer US Finance | ||||||||
3.375%, 10/08/2024 (C) | 800 | 862 | ||||||
Bayer US Finance II | ||||||||
4.875%, 06/25/2048 (C) | 1,795 | 2,134 | ||||||
4.700%, 07/15/2064 (C) | 210 | 231 | ||||||
4.625%, 06/25/2038 (C) | 420 | 481 | ||||||
4.375%, 12/15/2028 (C) | 3,535 | 3,989 | ||||||
4.250%, 12/15/2025 (C) | 2,345 | 2,609 | ||||||
Becton Dickinson | ||||||||
4.685%, 12/15/2044 | 301 | 358 | ||||||
3.734%, 12/15/2024 | 1,047 | 1,144 | ||||||
3.700%, 06/06/2027 | 121 | 133 | ||||||
3.363%, 06/06/2024 | 1,670 | 1,793 | ||||||
Biogen | ||||||||
3.625%, 09/15/2022 | 430 | 449 | ||||||
3.250%, 02/15/2051 (C) | 120 | 112 | ||||||
Bon Secours Mercy Health | ||||||||
3.464%, 06/01/2030 | 855 | 921 | ||||||
Bristol-Myers Squibb | ||||||||
5.000%, 08/15/2045 | 175 | 224 | ||||||
4.550%, 02/20/2048 | 166 | 202 | ||||||
4.350%, 11/15/2047 | 203 | 240 | ||||||
4.250%, 10/26/2049 | 37 | 43 | ||||||
| Description | Face Amount (Thousands) | Market Value ($ Thousands) | ||||||
CORPORATE OBLIGATIONS (continued) |
| |||||||
3.900%, 02/20/2028 | $ | 487 | $ | 547 | ||||
3.875%, 08/15/2025 | 217 | 241 | ||||||
3.550%, 08/15/2022 | 360 | 376 | ||||||
3.400%, 07/26/2029 | 812 | 887 | ||||||
3.200%, 06/15/2026 | 770 | 837 | ||||||
2.900%, 07/26/2024 | 1,149 | 1,228 | ||||||
2.750%, 02/15/2023 | 300 | 313 | ||||||
2.600%, 05/16/2022 | 550 | 564 | ||||||
2.550%, 11/13/2050 | 977 | 870 | ||||||
2.350%, 11/13/2040 | 252 | 229 | ||||||
2.250%, 08/15/2021 | 420 | 423 | ||||||
1.450%, 11/13/2030 | 674 | 629 | ||||||
0.750%, 11/13/2025 | 315 | 310 | ||||||
Centene | ||||||||
4.625%, 12/15/2029 | 230 | 249 | ||||||
3.375%, 02/15/2030 | 230 | 232 | ||||||
3.000%, 10/15/2030 | 3,043 | 3,038 | ||||||
Cigna | ||||||||
4.900%, 12/15/2048 | 1,310 | 1,600 | ||||||
4.800%, 08/15/2038 | 500 | 596 | ||||||
4.375%, 10/15/2028 | 730 | 831 | ||||||
4.125%, 11/15/2025 | 290 | 323 | ||||||
3.875%, 10/15/2047 | 763 | 811 | ||||||
3.750%, 07/15/2023 | 462 | 494 | ||||||
3.400%, 03/01/2027 | 380 | 412 | ||||||
3.400%, 03/15/2050 | 120 | 118 | ||||||
2.400%, 03/15/2030 | 165 | 164 | ||||||
1.250%, 03/15/2026 | 630 | 622 | ||||||
CommonSpirit Health | ||||||||
4.350%, 11/01/2042 | 480 | 528 | ||||||
4.187%, 10/01/2049 | 635 | 683 | ||||||
2.782%, 10/01/2030 | 640 | 647 | ||||||
CVS Health | ||||||||
5.125%, 07/20/2045 | 670 | 818 | ||||||
5.050%, 03/25/2048 | 5,195 | 6,358 | ||||||
4.780%, 03/25/2038 | 809 | 955 | ||||||
4.300%, 03/25/2028 | 2,932 | 3,329 | ||||||
4.250%, 04/01/2050 | 30 | 34 | ||||||
4.125%, 04/01/2040 | 160 | 176 | ||||||
3.875%, 07/20/2025 | 515 | 569 | ||||||
3.750%, 04/01/2030 | 400 | 434 | ||||||
3.700%, 03/09/2023 | 304 | 323 | ||||||
3.625%, 04/01/2027 | 890 | 973 | ||||||
3.000%, 08/15/2026 | 339 | 362 | ||||||
2.750%, 12/01/2022 | 510 | 527 | ||||||
2.700%, 08/21/2040 | 997 | 916 | ||||||
CVS Pass-Through Trust | ||||||||
5.926%, 01/10/2034 (C) | 71 | 82 | ||||||
Danaher | ||||||||
3.350%, 09/15/2025 | 315 | 344 | ||||||
2.600%, 10/01/2050 | 247 | 218 | ||||||
SEI Institutional Managed Trust / Semi-Annual Report / March 31, 2021 | 77 |
SCHEDULE OF INVESTMENTS (Unaudited)
March 31, 2021
Core Fixed Income Fund (Continued)
| Description | Face Amount (Thousands) | Market Value ($ Thousands) | ||||||
CORPORATE OBLIGATIONS (continued) |
| |||||||
DH Europe Finance II Sarl | ||||||||
2.600%, 11/15/2029 | $ | 640 | $ | 654 | ||||
2.200%, 11/15/2024 | 863 | 899 | ||||||
2.050%, 11/15/2022 | 502 | 515 | ||||||
Fresenius Medical Care US Finance II | ||||||||
5.875%, 01/31/2022 (C) | 170 | 177 | ||||||
Gilead Sciences | ||||||||
5.650%, 12/01/2041 | 35 | 46 | ||||||
4.750%, 03/01/2046 | 380 | 458 | ||||||
4.600%, 09/01/2035 | 500 | 588 | ||||||
4.500%, 02/01/2045 | 10 | 12 | ||||||
4.000%, 09/01/2036 | 281 | 308 | ||||||
3.700%, 04/01/2024 | 410 | 442 | ||||||
3.650%, 03/01/2026 | 460 | 506 | ||||||
3.250%, 09/01/2022 | 670 | 693 | ||||||
2.800%, 10/01/2050 | 549 | 486 | ||||||
2.600%, 10/01/2040 | 545 | 501 | ||||||
1.650%, 10/01/2030 | 511 | 479 | ||||||
1.200%, 10/01/2027 | 158 | 151 | ||||||
GlaxoSmithKline Capital | ||||||||
3.000%, 06/01/2024 | 310 | 331 | ||||||
2.850%, 05/08/2022 | 30 | 31 | ||||||
HCA | ||||||||
5.875%, 02/01/2029 | 410 | 478 | ||||||
5.625%, 09/01/2028 | 60 | 69 | ||||||
5.500%, 06/15/2047 | 60 | 74 | ||||||
5.375%, 02/01/2025 | 160 | 179 | ||||||
5.250%, 04/15/2025 | 820 | 936 | ||||||
5.250%, 06/15/2026 | 30 | 34 | ||||||
5.250%, 06/15/2049 | 2,150 | 2,623 | ||||||
5.125%, 06/15/2039 | 760 | 908 | ||||||
5.000%, 03/15/2024 | 1,390 | 1,546 | ||||||
4.500%, 02/15/2027 | 20 | 22 | ||||||
3.500%, 09/01/2030 | 520 | 526 | ||||||
Health Care Service A Mutual Legal Reserve | ||||||||
2.200%, 06/01/2030 (C) | 855 | 841 | ||||||
Humana | ||||||||
4.950%, 10/01/2044 | 60 | 72 | ||||||
4.800%, 03/15/2047 | 30 | 36 | ||||||
4.625%, 12/01/2042 | 170 | 197 | ||||||
4.500%, 04/01/2025 | 80 | 90 | ||||||
3.950%, 03/15/2027 | 70 | 78 | ||||||
3.850%, 10/01/2024 | 1,470 | 1,606 | ||||||
3.150%, 12/01/2022 | 560 | 580 | ||||||
Johnson & Johnson | ||||||||
3.700%, 03/01/2046 | 170 | 189 | ||||||
3.625%, 03/03/2037 | 260 | 293 | ||||||
3.500%, 01/15/2048 | 92 | 101 | ||||||
3.400%, 01/15/2038 | 173 | 188 | ||||||
2.625%, 01/15/2025 | 86 | 92 | ||||||
2.450%, 09/01/2060 | 935 | 825 | ||||||
0.950%, 09/01/2027 | 610 | 593 | ||||||
| Description | Face Amount (Thousands) | Market Value ($ Thousands) | ||||||
CORPORATE OBLIGATIONS (continued) |
| |||||||
0.550%, 09/01/2025 | $ | 300 | $ | 297 | ||||
Mass General Brigham | ||||||||
3.192%, 07/01/2049 | 115 | 114 | ||||||
Medtronic | ||||||||
4.625%, 03/15/2045 | 9 | 11 | ||||||
3.500%, 03/15/2025 | 241 | 264 | ||||||
Merck | ||||||||
3.700%, 02/10/2045 | 220 | 241 | ||||||
2.400%, 09/15/2022 | 29 | 30 | ||||||
1.450%, 06/24/2030 | 1,380 | 1,306 | ||||||
0.750%, 02/24/2026 | 530 | 522 | ||||||
New York and Presbyterian Hospital | ||||||||
3.563%, 08/01/2036 | 730 | 747 | ||||||
PerkinElmer | ||||||||
3.625%, 03/15/2051 | 473 | 486 | ||||||
Pfizer | ||||||||
4.000%, 12/15/2036 | 815 | 934 | ||||||
2.800%, 03/11/2022 | 302 | 309 | ||||||
2.625%, 04/01/2030 | 1,230 | 1,275 | ||||||
1.700%, 05/28/2030 | 420 | 405 | ||||||
0.800%, 05/28/2025 | 670 | 665 | ||||||
Regeneron Pharmaceuticals | ||||||||
2.800%, 09/15/2050 | 389 | 336 | ||||||
1.750%, 09/15/2030 | 1,844 | 1,704 | ||||||
Royalty Pharma | ||||||||
3.550%, 09/02/2050 (C) | 738 | 701 | ||||||
2.200%, 09/02/2030 (C) | 780 | 744 | ||||||
1.750%, 09/02/2027 (C) | 740 | 718 | ||||||
1.200%, 09/02/2025 (C) | 856 | 838 | ||||||
0.750%, 09/02/2023 (C) | 925 | 924 | ||||||
RWJ Barnabas Health | ||||||||
3.949%, 07/01/2046 | 1,030 | 1,109 | ||||||
Shire Acquisitions Investments Ireland DAC | ||||||||
2.875%, 09/23/2023 | 2,394 | 2,515 | ||||||
Smith & Nephew | ||||||||
2.032%, 10/14/2030 | 670 | 630 | ||||||
STERIS Irish FinCo UnLtd | ||||||||
3.750%, 03/15/2051 | 889 | 888 | ||||||
Stryker | ||||||||
2.900%, 06/15/2050 | 220 | 207 | ||||||
1.950%, 06/15/2030 | 722 | 696 | ||||||
1.150%, 06/15/2025 | 674 | 672 | ||||||
Takeda Pharmaceutical | ||||||||
5.000%, 11/26/2028 | 460 | 544 | ||||||
4.400%, 11/26/2023 | 2,174 | 2,376 | ||||||
3.175%, 07/09/2050 | 1,310 | 1,241 | ||||||
2.050%, 03/31/2030 | 1,236 | 1,190 | ||||||
Teva Pharmaceutical Finance BV | ||||||||
3.650%, 11/10/2021 | 430 | 433 | ||||||
2.950%, 12/18/2022 | 190 | 190 | ||||||
78 | SEI Institutional Managed Trust / Semi-Annual Report / March 31, 2021 |
| Description | Face Amount (Thousands) | Market Value ($ Thousands) | ||||||
CORPORATE OBLIGATIONS (continued) |
| |||||||
Teva Pharmaceutical Finance Netherlands III BV |
| |||||||
7.125%, 01/31/2025 | $ | 390 | $ | 431 | ||||
6.000%, 04/15/2024 | 200 | 213 | ||||||
3.150%, 10/01/2026 | 1,540 | 1,473 | ||||||
2.800%, 07/21/2023 | 630 | 628 | ||||||
2.200%, 07/21/2021 | 380 | 379 | ||||||
Thermo Fisher Scientific | ||||||||
4.497%, 03/25/2030 | 1,292 | 1,503 | ||||||
2.600%, 10/01/2029 | 441 | 452 | ||||||
UnitedHealth Group | ||||||||
5.800%, 03/15/2036 | 280 | 378 | ||||||
4.625%, 07/15/2035 | 523 | 636 | ||||||
4.450%, 12/15/2048 | 90 | 110 | ||||||
4.250%, 04/15/2047 | 450 | 526 | ||||||
4.250%, 06/15/2048 | 110 | 130 | ||||||
3.875%, 12/15/2028 | 170 | 192 | ||||||
3.875%, 08/15/2059 | 533 | 593 | ||||||
3.750%, 07/15/2025 | 270 | 299 | ||||||
3.750%, 10/15/2047 | 110 | 119 | ||||||
3.700%, 08/15/2049 | 150 | 163 | ||||||
3.500%, 06/15/2023 | 150 | 160 | ||||||
3.375%, 11/15/2021 | 75 | 76 | ||||||
3.350%, 07/15/2022 | 28 | 29 | ||||||
3.125%, 05/15/2060 | 50 | 49 | ||||||
2.900%, 05/15/2050 | 562 | 536 | ||||||
2.875%, 12/15/2021 | 290 | 295 | ||||||
2.875%, 03/15/2023 | 50 | 52 | ||||||
2.750%, 05/15/2040 | 727 | 710 | ||||||
2.375%, 10/15/2022 | 70 | 72 | ||||||
2.000%, 05/15/2030 | 730 | 716 | ||||||
1.250%, 01/15/2026 | 170 | 170 | ||||||
Utah Acquisition Sub | ||||||||
3.950%, 06/15/2026 | 1,390 | 1,530 | ||||||
Viatris | ||||||||
4.000%, 06/22/2050 (C) | 675 | 686 | ||||||
2.700%, 06/22/2030 (C) | 140 | 138 | ||||||
Wyeth | ||||||||
5.950%, 04/01/2037 |
| 470
|
|
| 653
|
| ||
| 150,402 | ||||||||
Industrials — 2.6% |
| |||||||
3M | ||||||||
3.700%, 04/15/2050 | 660 | 715 | ||||||
3.250%, 08/26/2049 | 220 | 223 | ||||||
3.050%, 04/15/2030 | 90 | 95 | ||||||
2.375%, 08/26/2029 | 390 | 397 | ||||||
Adani International Container Terminal Pvt | ||||||||
3.000%, 02/16/2031 (C) | 279 | 267 | ||||||
Adani Ports & Special Economic Zone | ||||||||
4.200%, 08/04/2027 (C) | 594 | 630 | ||||||
| Description | Face Amount (Thousands) | Market Value ($ Thousands) | ||||||
CORPORATE OBLIGATIONS (continued) |
| |||||||
AerCap Ireland Capital DAC |
| |||||||
5.000%, 10/01/2021 | $ | 1,100 | $ | 1,124 | ||||
4.875%, 01/16/2024 | 1,500 | 1,632 | ||||||
4.625%, 07/01/2022 | 210 | 220 | ||||||
3.950%, 02/01/2022 | 855 | 875 | ||||||
3.875%, 01/23/2028 | 345 | 361 | ||||||
3.650%, 07/21/2027 | 650 | 682 | ||||||
3.500%, 01/15/2025 | 638 | 669 | ||||||
3.150%, 02/15/2024 | 560 | 583 | ||||||
1.750%, 01/30/2026 | 1,007 | 978 | ||||||
Air Lease | ||||||||
3.625%, 04/01/2027 | 221 | 232 | ||||||
3.625%, 12/01/2027 | 216 | 227 | ||||||
3.500%, 01/15/2022 | 1,110 | 1,135 | ||||||
3.375%, 07/01/2025 | 310 | 327 | ||||||
3.250%, 03/01/2025 | 1,645 | 1,733 | ||||||
Air Lease MTN | ||||||||
2.300%, 02/01/2025 | 355 | 362 | ||||||
Avolon Holdings Funding | ||||||||
5.250%, 05/15/2024 (C) | 120 | 129 | ||||||
BAE Systems | ||||||||
4.750%, 10/11/2021 (C) | 2,100 | 2,146 | ||||||
Boeing | ||||||||
5.930%, 05/01/2060 | 20 | 26 | ||||||
5.805%, 05/01/2050 | 1,603 | 2,021 | ||||||
5.705%, 05/01/2040 | 600 | 733 | ||||||
5.150%, 05/01/2030 | 940 | 1,081 | ||||||
5.040%, 05/01/2027 | 160 | 182 | ||||||
4.875%, 05/01/2025 | 1,500 | 1,670 | ||||||
4.508%, 05/01/2023 | 1,050 | 1,125 | ||||||
3.750%, 02/01/2050 | 547 | 525 | ||||||
3.625%, 02/01/2031 | 680 | 711 | ||||||
3.625%, 03/01/2048 | 23 | 21 | ||||||
3.550%, 03/01/2038 | 196 | 189 | ||||||
3.250%, 02/01/2028 | 675 | 698 | ||||||
3.250%, 02/01/2035 | 1,210 | 1,161 | ||||||
3.200%, 03/01/2029 | 490 | 496 | ||||||
3.100%, 05/01/2026 | 160 | 167 | ||||||
2.800%, 03/01/2027 | 190 | 192 | ||||||
2.700%, 02/01/2027 | 540 | 548 | ||||||
2.196%, 02/04/2026 | 2,127 | 2,120 | ||||||
Burlington Northern Santa Fe | ||||||||
7.290%, 06/01/2036 | 90 | 134 | ||||||
5.400%, 06/01/2041 | 50 | 65 | ||||||
4.150%, 12/15/2048 | 150 | 171 | ||||||
4.050%, 06/15/2048 | 124 | 139 | ||||||
3.550%, 02/15/2050 | 158 | 165 | ||||||
3.450%, 09/15/2021 | 91 | 92 | ||||||
3.300%, 09/15/2051 | 619 | 619 | ||||||
Canadian Pacific Railway | ||||||||
6.125%, 09/15/2115 | 44 | 64 | ||||||
SEI Institutional Managed Trust / Semi-Annual Report / March 31, 2021 | 79 |
SCHEDULE OF INVESTMENTS (Unaudited)
March 31, 2021
Core Fixed Income Fund (Continued)
| Description | Face Amount (Thousands) | Market Value ($ Thousands) | ||||||
CORPORATE OBLIGATIONS (continued) |
| |||||||
Carrier Global | ||||||||
3.577%, 04/05/2050 | $ | 60 | $ | 59 | ||||
3.377%, 04/05/2040 | 190 | 188 | ||||||
Cintas No. 2 | ||||||||
3.700%, 04/01/2027 | 400 | 444 | ||||||
2.900%, 04/01/2022 | 400 | 409 | ||||||
Continental Airlines Pass-Through Trust, Ser 2007-1, Cl A | ||||||||
5.983%, 04/19/2022 | 1,307 | 1,334 | ||||||
CoStar Group | ||||||||
2.800%, 07/15/2030 (C) | 830 | 811 | ||||||
Crowley Conro | ||||||||
4.181%, 08/15/2043 | 455 | 524 | ||||||
CSX | ||||||||
4.300%, 03/01/2048 | 40 | 45 | ||||||
2.500%, 05/15/2051 | 183 | 154 | ||||||
DAE Funding | ||||||||
3.375%, 03/20/2028 (C) | 922 | 915 | ||||||
2.625%, 03/20/2025 (C) | 801 | 805 | ||||||
Deere | ||||||||
3.750%, 04/15/2050 | 530 | 594 | ||||||
3.100%, 04/15/2030 | 100 | 107 | ||||||
Delta Air Lines | ||||||||
7.375%, 01/15/2026 | 580 | 681 | ||||||
7.000%, 05/01/2025 (C) | 2,410 | 2,775 | ||||||
4.750%, 10/20/2028 (C) | 1,516 | 1,648 | ||||||
4.500%, 10/20/2025 (C) | 1,769 | 1,884 | ||||||
4.375%, 04/19/2028 | 153 | 160 | ||||||
3.800%, 04/19/2023 | 381 | 388 | ||||||
3.625%, 03/15/2022 | 330 | 334 | ||||||
3.400%, 04/19/2021 | 510 | 510 | ||||||
2.900%, 10/28/2024 | 60 | 60 | ||||||
Delta Air Lines Pass Through Trust, Ser 2020-1, Cl AA | ||||||||
2.000%, 06/10/2028 | 3,880 | 3,884 | ||||||
DP World MTN | ||||||||
5.625%, 09/25/2048 (C) | 990 | 1,160 | ||||||
Eaton | ||||||||
7.625%, 04/01/2024 | 75 | 87 | ||||||
4.150%, 11/02/2042 | 140 | 158 | ||||||
2.750%, 11/02/2022 | 900 | 934 | ||||||
Equifax | ||||||||
3.950%, 06/15/2023 | 1,612 | 1,725 | ||||||
2.600%, 12/15/2025 | 255 | 267 | ||||||
GE Capital Funding | ||||||||
4.400%, 05/15/2030 (C) | 1,805 | 2,042 | ||||||
3.450%, 05/15/2025 (C) | 381 | 412 | ||||||
GE Capital International Funding Unlimited Co | ||||||||
4.418%, 11/15/2035 | 4,436 | 5,084 | ||||||
General Dynamics | ||||||||
4.250%, 04/01/2040 | 880 | 1,033 | ||||||
| Description | Face Amount (Thousands) | Market Value ($ Thousands) | ||||||
CORPORATE OBLIGATIONS (continued) |
| |||||||
4.250%, 04/01/2050 | $ | 230 | $ | 274 | ||||
3.500%, 05/15/2025 | 60 | 66 | ||||||
3.250%, 04/01/2025 | 160 | 173 | ||||||
General Electric | ||||||||
4.350%, 05/01/2050 | 669 | 740 | ||||||
4.250%, 05/01/2040 | 2,157 | 2,378 | ||||||
3.625%, 05/01/2030 | 905 | 973 | ||||||
3.450%, 05/01/2027 | 723 | 785 | ||||||
General Electric MTN | ||||||||
6.875%, 01/10/2039 | 1,216 | 1,705 | ||||||
6.750%, 03/15/2032 | 1,335 | 1,790 | ||||||
6.150%, 08/07/2037 | 394 | 518 | ||||||
5.875%, 01/14/2038 | 3,330 | 4,304 | ||||||
0.674%, VAR ICE LIBOR USD 3 Month+0.480%, 08/15/2036 | 2,400 | 1,942 | ||||||
GFL Environmental | ||||||||
4.250%, 06/01/2025 (C) | 250 | 258 | ||||||
Honeywell International | ||||||||
1.950%, 06/01/2030 | 940 | 927 | ||||||
1.350%, 06/01/2025 | 310 | 314 | ||||||
Hutama Karya Persero MTN | ||||||||
3.750%, 05/11/2030 (C) | 386 | 404 | ||||||
IHS Markit | ||||||||
5.000%, 11/01/2022 (C) | 750 | 790 | ||||||
4.750%, 02/15/2025 (C) | 355 | 397 | ||||||
4.750%, 08/01/2028 | 1,215 | 1,403 | ||||||
3.625%, 05/01/2024 | 1,000 | 1,073 | ||||||
John Deere Capital MTN | ||||||||
1.200%, 04/06/2023 | 743 | 755 | ||||||
0.550%, 07/05/2022 | 965 | 968 | ||||||
L3Harris Technologies | ||||||||
5.054%, 04/27/2045 | 270 | 334 | ||||||
4.854%, 04/27/2035 | 80 | 97 | ||||||
Lockheed Martin | ||||||||
4.500%, 05/15/2036 | 90 | 109 | ||||||
4.070%, 12/15/2042 | 91 | 105 | ||||||
3.550%, 01/15/2026 | 1,190 | 1,312 | ||||||
3.100%, 01/15/2023 | 50 | 52 | ||||||
Mileage Plus Holdings LLC | ||||||||
6.500%, 06/20/2027 (C) | 510 | 558 | ||||||
Northrop Grumman | ||||||||
5.250%, 05/01/2050 | 350 | 452 | ||||||
5.150%, 05/01/2040 | 333 | 417 | ||||||
4.030%, 10/15/2047 | 948 | 1,049 | ||||||
3.250%, 08/01/2023 | 1,636 | 1,745 | ||||||
3.250%, 01/15/2028 | 1,642 | 1,760 | ||||||
2.930%, 01/15/2025 | 856 | 911 | ||||||
Otis Worldwide | ||||||||
3.112%, 02/15/2040 | 555 | 544 | ||||||
2.056%, 04/05/2025 | 220 | 226 | ||||||
Parker-Hannifin | ||||||||
2.700%, 06/14/2024 | 400 | 424 | ||||||
80 | SEI Institutional Managed Trust / Semi-Annual Report / March 31, 2021 |
| Description | Face Amount (Thousands) | Market Value ($ Thousands) | ||||||
CORPORATE OBLIGATIONS (continued) |
| |||||||
Raytheon Technologies |
| |||||||
4.625%, 11/16/2048 | $ | 51 | $ | 61 | ||||
4.500%, 06/01/2042 | 430 | 511 | ||||||
4.450%, 11/16/2038 | 484 | 560 | ||||||
4.150%, 05/15/2045 | 59 | 65 | ||||||
4.125%, 11/16/2028 | 280 | 315 | ||||||
3.950%, 08/16/2025 | 963 | 1,069 | ||||||
3.650%, 08/16/2023 | 65 | 70 | ||||||
3.150%, 12/15/2024 | 200 | 215 | ||||||
2.250%, 07/01/2030 | 420 | 413 | ||||||
Republic Services | ||||||||
3.950%, 05/15/2028 | 335 | 374 | ||||||
2.500%, 08/15/2024 | 635 | 668 | ||||||
1.450%, 02/15/2031 | 1,650 | 1,507 | ||||||
Roper Technologies | ||||||||
1.000%, 09/15/2025 | 420 | 413 | ||||||
Siemens Financieringsmaatschappij | ||||||||
1.200%, 03/11/2026 (C) | 1,770 | 1,749 | ||||||
0.650%, 03/11/2024 (C) | 650 | 650 | ||||||
Southwest Airlines | ||||||||
5.125%, 06/15/2027 | 1,975 | 2,269 | ||||||
4.750%, 05/04/2023 | 675 | 729 | ||||||
Spirit Loyalty Cayman | ||||||||
8.000%, 09/20/2025 (C) | 610 | 689 | ||||||
Teck Resources | ||||||||
6.125%, 10/01/2035 | 150 | 184 | ||||||
Union Pacific | ||||||||
3.950%, 09/10/2028 | 1,595 | 1,786 | ||||||
3.839%, 03/20/2060 | 1,030 | 1,078 | ||||||
3.750%, 07/15/2025 | 340 | 373 | ||||||
3.750%, 02/05/2070 | 330 | 336 | ||||||
3.250%, 02/05/2050 | 1,205 | 1,183 | ||||||
3.150%, 03/01/2024 | 267 | 286 | ||||||
2.973%, 09/16/2062 (C) | 481 | 427 | ||||||
2.950%, 03/01/2022 | 560 | 574 | ||||||
2.400%, 02/05/2030 | 618 | 619 | ||||||
2.150%, 02/05/2027 | 499 | 512 | ||||||
United Parcel Service | ||||||||
5.300%, 04/01/2050 | 480 | 649 | ||||||
5.200%, 04/01/2040 | 240 | 308 | ||||||
United Rentals North America | ||||||||
4.875%, 01/15/2028 | 150 | 158 | ||||||
3.875%, 11/15/2027 | 100 | 104 | ||||||
3.875%, 02/15/2031 | 820 | 826 | ||||||
US Airways Pass-Through Trust, Ser 2012-2, Cl A | ||||||||
4.625%, 06/03/2025 (D) | 526 | 496 | ||||||
Waste Management | ||||||||
4.150%, 07/15/2049 | 210 | 240 | ||||||
3.500%, 05/15/2024 | 370 | 400 | ||||||
|
|
| ||||||
| 118,370 | ||||||||
|
|
| ||||||
| Description | Face Amount (Thousands) | Market Value ($ Thousands) | ||||||
CORPORATE OBLIGATIONS (continued) |
| |||||||
Information Technology — 1.9% |
| |||||||
Apple | ||||||||
4.375%, 05/13/2045 | $ | 360 | $ | 431 | ||||
4.250%, 02/09/2047 | 390 | 463 | ||||||
3.850%, 05/04/2043 | 220 | 248 | ||||||
3.200%, 05/13/2025 | 64 | 69 | ||||||
3.200%, 05/11/2027 | 232 | 253 | ||||||
2.850%, 05/06/2021 | 113 | 113 | ||||||
2.800%, 02/08/2061 | 316 | 283 | ||||||
2.650%, 05/11/2050 | 777 | 704 | ||||||
2.650%, 02/08/2051 | 789 | 719 | ||||||
2.550%, 08/20/2060 | 738 | 632 | ||||||
2.450%, 08/04/2026 | 1,410 | 1,485 | ||||||
2.375%, 02/08/2041 | 316 | 293 | ||||||
2.150%, 02/09/2022 | 82 | 83 | ||||||
1.650%, 02/08/2031 | 1,609 | 1,535 | ||||||
1.550%, 08/04/2021 | 20 | 20 | ||||||
1.200%, 02/08/2028 | 789 | 759 | ||||||
1.125%, 05/11/2025 | 1,110 | 1,117 | ||||||
Avnet | ||||||||
3.750%, 12/01/2021 | 1,000 | 1,017 | ||||||
Broadcom | ||||||||
4.750%, 04/15/2029 | 565 | 635 | ||||||
4.700%, 04/15/2025 | 1,090 | 1,228 | ||||||
4.150%, 11/15/2030 | 1,604 | 1,733 | ||||||
3.875%, 01/15/2027 | 239 | 260 | ||||||
3.469%, 04/15/2034 | 648 | 652 | ||||||
3.419%, 04/15/2033 | 2,676 | 2,724 | ||||||
3.150%, 11/15/2025 | 1,442 | 1,536 | ||||||
2.450%, 02/15/2031 (C) | 550 | 520 | ||||||
Dell International | ||||||||
8.350%, 07/15/2046 (C) | 337 | 512 | ||||||
6.100%, 07/15/2027 (C) | 320 | 384 | ||||||
6.020%, 06/15/2026 (C) | 39 | 46 | ||||||
5.300%, 10/01/2029 (C) | 322 | 376 | ||||||
4.900%, 10/01/2026 (C) | 161 | 183 | ||||||
Fidelity National Information Services | ||||||||
2.250%, 03/01/2031 | 313 | 307 | ||||||
1.650%, 03/01/2028 | 627 | 612 | ||||||
1.150%, 03/01/2026 | 627 | 617 | ||||||
Flex | ||||||||
4.875%, 05/12/2030 | 385 | 436 | ||||||
Hewlett Packard Enterprise | ||||||||
4.650%, 10/01/2024 | 2,245 | 2,506 | ||||||
HP | ||||||||
2.200%, 06/17/2025 | 1,013 | 1,045 | ||||||
Intel | ||||||||
4.750%, 03/25/2050 | 2,840 | 3,557 | ||||||
4.600%, 03/25/2040 | 220 | 265 | ||||||
3.734%, 12/08/2047 | 48 | 52 | ||||||
3.700%, 07/29/2025 | 223 | 246 | ||||||
3.300%, 10/01/2021 | 35 | 36 | ||||||
SEI Institutional Managed Trust / Semi-Annual Report / March 31, 2021 | 81 |
SCHEDULE OF INVESTMENTS (Unaudited)
March 31, 2021
Core Fixed Income Fund (Continued)
| Description | Face Amount (Thousands) | Market Value ($ Thousands) | ||||||
CORPORATE OBLIGATIONS (continued) |
| |||||||
3.250%, 11/15/2049 | $ | 834 | $ | 826 | ||||
3.100%, 07/29/2022 | 35 | 36 | ||||||
3.100%, 02/15/2060 | 226 | 213 | ||||||
International Business Machines | ||||||||
3.000%, 05/15/2024 | 1,510 | 1,619 | ||||||
KLA | ||||||||
3.300%, 03/01/2050 | 428 | 410 | ||||||
Marvell Technology Group | ||||||||
4.200%, 06/22/2023 | 810 | 867 | ||||||
Mastercard | ||||||||
3.850%, 03/26/2050 | 80 | 90 | ||||||
3.375%, 04/01/2024 | 250 | 271 | ||||||
3.350%, 03/26/2030 | 635 | 695 | ||||||
Micron Technology | ||||||||
2.497%, 04/24/2023 | 1,105 | 1,145 | ||||||
Microsoft | ||||||||
4.100%, 02/06/2037 | 251 | 296 | ||||||
3.625%, 12/15/2023 | 89 | 96 | ||||||
3.500%, 02/12/2035 | 156 | 174 | ||||||
3.450%, 08/08/2036 | 565 | 625 | ||||||
3.300%, 02/06/2027 | 1,550 | 1,707 | ||||||
3.041%, 03/17/2062 | 199 | 194 | ||||||
2.921%, 03/17/2052 | 683 | 666 | ||||||
2.875%, 02/06/2024 | 1,010 | 1,077 | ||||||
2.700%, 02/12/2025 | 250 | 267 | ||||||
2.675%, 06/01/2060 | 233 | 213 | ||||||
2.525%, 06/01/2050 | 546 | 497 | ||||||
2.400%, 02/06/2022 | 600 | 610 | ||||||
2.400%, 08/08/2026 | 1,700 | 1,796 | ||||||
2.375%, 02/12/2022 | 20 | 20 | ||||||
2.375%, 05/01/2023 | 20 | 21 | ||||||
1.550%, 08/08/2021 | 400 | 401 | ||||||
NVIDIA | ||||||||
3.700%, 04/01/2060 | 310 | 332 | ||||||
3.500%, 04/01/2040 | 588 | 631 | ||||||
3.500%, 04/01/2050 | 2,093 | 2,206 | ||||||
2.850%, 04/01/2030 | 1,560 | 1,637 | ||||||
NXP BV | ||||||||
3.875%, 06/18/2026 (C) | 654 | 718 | ||||||
3.150%, 05/01/2027 (C) | 542 | 576 | ||||||
2.700%, 05/01/2025 (C) | 280 | 294 | ||||||
Oracle | ||||||||
4.100%, 03/25/2061 | 129 | 133 | ||||||
3.950%, 03/25/2051 | 2,352 | 2,412 | ||||||
3.900%, 05/15/2035 | 1,720 | 1,852 | ||||||
3.650%, 03/25/2041 | 646 | 652 | ||||||
3.600%, 04/01/2040 | 725 | 728 | ||||||
2.950%, 11/15/2024 | 539 | 575 | ||||||
2.950%, 04/01/2030 | 790 | 814 | ||||||
2.875%, 03/25/2031 | 3,391 | 3,454 | ||||||
2.800%, 04/01/2027 | 962 | 1,013 | ||||||
2.625%, 02/15/2023 | 416 | 432 | ||||||
| Description | Face Amount (Thousands) | Market Value ($ Thousands) | ||||||
CORPORATE OBLIGATIONS (continued) |
| |||||||
2.300%, 03/25/2028 | $ | 969 | $ | 980 | ||||
1.650%, 03/25/2026 | 2,069 | 2,084 | ||||||
PayPal Holdings | ||||||||
2.300%, 06/01/2030 | 2,845 | 2,816 | ||||||
1.650%, 06/01/2025 | 1,619 | 1,648 | ||||||
1.350%, 06/01/2023 | 390 | 397 | ||||||
Prosus | ||||||||
4.850%, 07/06/2027 (C) | 550 | 616 | ||||||
3.832%, 02/08/2051 (C) | 320 | 280 | ||||||
Prosus MTN | ||||||||
4.027%, 08/03/2050 (C) | 730 | 662 | ||||||
QUALCOMM | ||||||||
1.300%, 05/20/2028 | 961 | 920 | ||||||
salesforce.com | ||||||||
3.700%, 04/11/2028 | 670 | 748 | ||||||
3.250%, 04/11/2023 | 480 | 507 | ||||||
Tencent Holdings MTN | ||||||||
3.595%, 01/19/2028 (C) | 570 | 606 | ||||||
Texas Instruments | ||||||||
4.150%, 05/15/2048 | 300 | 356 | ||||||
1.750%, 05/04/2030 | 290 | 277 | ||||||
TSMC Global | ||||||||
1.375%, 09/28/2030 (C) | 1,925 | 1,783 | ||||||
Visa | ||||||||
4.300%, 12/14/2045 | 690 | 830 | ||||||
3.650%, 09/15/2047 | 235 | 259 | ||||||
3.150%, 12/14/2025 | 1,410 | 1,537 | ||||||
1.900%, 04/15/2027 | 565 | 578 | ||||||
Vontier | ||||||||
2.950%, 04/01/2031 (C) | 425 | 415 | ||||||
1.800%, 04/01/2026 (C) | 495 | 492 | ||||||
|
|
| ||||||
| 82,774 | ||||||||
|
|
| ||||||
Materials — 0.9% |
| |||||||
Air Liquide Finance | ||||||||
2.250%, 09/27/2023 (C) | 590 | 613 | ||||||
Amcor Finance USA | ||||||||
3.625%, 04/28/2026 | 2,425 | 2,647 | ||||||
Anglo American Capital | ||||||||
4.750%, 04/10/2027 (C) | 720 | 825 | ||||||
4.000%, 09/11/2027 (C) | 200 | 220 | ||||||
3.625%, 09/11/2024 (C) | 710 | 768 | ||||||
ArcelorMittal | ||||||||
7.250%, 10/15/2039 | 120 | 163 | ||||||
4.550%, 03/11/2026 | 330 | 366 | ||||||
3.600%, 07/16/2024 | 600 | 632 | ||||||
Barrick | ||||||||
5.250%, 04/01/2042 | 80 | 99 | ||||||
Barrick North America Finance | ||||||||
5.750%, 05/01/2043 | 290 | 379 | ||||||
5.700%, 05/30/2041 | 509 | 653 | ||||||
82 | SEI Institutional Managed Trust / Semi-Annual Report / March 31, 2021 |
| Description | Face Amount (Thousands) | Market Value ($ Thousands) | ||||||
CORPORATE OBLIGATIONS (continued) |
| |||||||
Berry Global | ||||||||
1.570%, 01/15/2026 (C) | $ | 2,135 | $ | 2,102 | ||||
BHP Billiton Finance USA | ||||||||
5.000%, 09/30/2043 | 410 | 529 | ||||||
4.125%, 02/24/2042 | 40 | 45 | ||||||
2.875%, 02/24/2022 | 50 | 51 | ||||||
Dow Chemical | ||||||||
5.250%, 11/15/2041 | 25 | 31 | ||||||
4.800%, 05/15/2049 | 360 | 429 | ||||||
4.375%, 11/15/2042 | 163 | 185 | ||||||
3.600%, 11/15/2050 | 347 | 349 | ||||||
2.100%, 11/15/2030 | 966 | 931 | ||||||
DuPont de Nemours | ||||||||
4.493%, 11/15/2025 | 1,775 | 2,005 | ||||||
Equate Petrochemical BV MTN | ||||||||
4.250%, 11/03/2026 (C) | 480 | 522 | ||||||
Freeport-McMoRan | ||||||||
5.450%, 03/15/2043 | 645 | 774 | ||||||
4.625%, 08/01/2030 | 180 | 196 | ||||||
4.550%, 11/14/2024 | 40 | 44 | ||||||
3.875%, 03/15/2023 | 20 | 21 | ||||||
Glencore Funding | ||||||||
4.125%, 05/30/2023 (C) | 200 | 214 | ||||||
4.125%, 03/12/2024 (C) | 1,340 | 1,451 | ||||||
4.000%, 03/27/2027 (C) | 1,200 | 1,323 | ||||||
3.875%, 10/27/2027 (C) | 220 | 241 | ||||||
3.000%, 10/27/2022 (C) | 30 | 31 | ||||||
Industrias Penoles | ||||||||
4.150%, 09/12/2029 (C) | 1,005 | 1,090 | ||||||
International Flavors & Fragrances | ||||||||
5.000%, 09/26/2048 | 1,505 | 1,846 | ||||||
LYB International Finance III | ||||||||
3.625%, 04/01/2051 | 762 | 749 | ||||||
3.375%, 10/01/2040 | 942 | 929 | ||||||
LyondellBasell Industries | ||||||||
5.750%, 04/15/2024 | 200 | 226 | ||||||
Nacional del Cobre de Chile | ||||||||
4.250%, 07/17/2042 (C) | 970 | 1,046 | ||||||
Newcrest Finance Pty | ||||||||
3.250%, 05/13/2030 (C) | 630 | 659 | ||||||
NewMarket | ||||||||
2.700%, 03/18/2031 | 1,478 | 1,441 | ||||||
Newmont | ||||||||
2.250%, 10/01/2030 | 1,985 | 1,932 | ||||||
Nucor | ||||||||
2.700%, 06/01/2030 | 353 | 360 | ||||||
Nutrition & Biosciences | ||||||||
1.230%, 10/01/2025 (C) | 1,835 | 1,803 | ||||||
OCP | ||||||||
4.500%, 10/22/2025 (C) | 400 | 423 | ||||||
Reliance Steel & Aluminum | ||||||||
2.150%, 08/15/2030 | 1,043 | 1,000 | ||||||
| Description | Face Amount (Thousands) | Market Value ($ Thousands) | ||||||
CORPORATE OBLIGATIONS (continued) |
| |||||||
Southern Copper | ||||||||
5.250%, 11/08/2042 (D) | $ | 2,220 | $ | 2,689 | ||||
Suzano Austria GmbH | ||||||||
3.750%, 01/15/2031 | 1,400 | 1,447 | ||||||
Teck Resources | ||||||||
6.250%, 07/15/2041 | 227 | 279 | ||||||
6.000%, 08/15/2040 | 30 | 36 | ||||||
5.200%, 03/01/2042 | 372 | 407 | ||||||
3.900%, 07/15/2030 | 284 | 297 | ||||||
Vale Overseas | ||||||||
6.875%, 11/21/2036 | 874 | 1,162 | ||||||
6.250%, 08/10/2026 | 32 | 38 | ||||||
Westlake Chemical | ||||||||
5.000%, 08/15/2046 | 8 | 9 | ||||||
4.375%, 11/15/2047 | 485 | 525 | ||||||
WestRock RKT | ||||||||
4.000%, 03/01/2023 | 70 | 74 | ||||||
|
|
| ||||||
| 39,306 | ||||||||
|
|
| ||||||
Real Estate — 0.8% |
| |||||||
Agree | ||||||||
2.900%, 10/01/2030 | 236 | 238 | ||||||
American Campus Communities Operating Partnership | ||||||||
3.750%, 04/15/2023 | 1,350 | 1,427 | ||||||
3.625%, 11/15/2027 | 745 | 813 | ||||||
3.300%, 07/15/2026 | 1,495 | 1,606 | ||||||
American Tower | ||||||||
2.700%, 04/15/2031 | 476 | 476 | ||||||
1.875%, 10/15/2030 | 1,430 | 1,337 | ||||||
1.600%, 04/15/2026 | 635 | 636 | ||||||
AvalonBay Communities MTN | ||||||||
4.350%, 04/15/2048 | 110 | 127 | ||||||
2.450%, 01/15/2031 | 1,155 | 1,150 | ||||||
Boston Properties | ||||||||
3.800%, 02/01/2024 | 1,250 | 1,346 | ||||||
3.400%, 06/21/2029 | 720 | 756 | ||||||
Brandywine Operating Partnership | ||||||||
3.950%, 11/15/2027 | 17 | 18 | ||||||
Brixmor Operating Partnership | ||||||||
2.250%, 04/01/2028 | 220 | 216 | ||||||
Camden Property Trust | ||||||||
2.800%, 05/15/2030 | 435 | 446 | ||||||
Crown Castle International | ||||||||
4.000%, 03/01/2027 | 158 | 175 | ||||||
2.900%, 04/01/2041 | 441 | 404 | ||||||
2.100%, 04/01/2031 | 1,746 | 1,642 | ||||||
1.050%, 07/15/2026 | 945 | 911 | ||||||
CyrusOne | ||||||||
2.900%, 11/15/2024 | 1,250 | 1,321 | ||||||
Equinix | ||||||||
2.950%, 09/15/2051 | 720 | 632 | ||||||
| SEI Institutional Managed Trust / Semi-Annual Report / March 31, 2021 | 83 |
SCHEDULE OF INVESTMENTS (Unaudited)
March 31, 2021
Core Fixed Income Fund (Continued)
| Description | Face Amount (Thousands) | Market Value ($ Thousands) | ||||||
CORPORATE OBLIGATIONS (continued) |
| |||||||
ERP Operating | ||||||||
4.625%, 12/15/2021 | $ | 64 | $ | 65 | ||||
Essex Portfolio | ||||||||
1.700%, 03/01/2028 | 627 | 603 | ||||||
GLP Capital | ||||||||
5.375%, 04/15/2026 | 2,615 | 2,934 | ||||||
5.300%, 01/15/2029 | 1,513 | 1,696 | ||||||
5.250%, 06/01/2025 | 565 | 633 | ||||||
4.000%, 01/15/2030 | 410 | 427 | ||||||
3.350%, 09/01/2024 | 125 | 132 | ||||||
Healthcare Realty Trust | ||||||||
3.875%, 05/01/2025 | 200 | 217 | ||||||
Life Storage | ||||||||
3.875%, 12/15/2027 | 915 | 1,013 | ||||||
Mid-America Apartments | ||||||||
4.300%, 10/15/2023 | 323 | 349 | ||||||
4.000%, 11/15/2025 | 386 | 428 | ||||||
3.950%, 03/15/2029 | 317 | 350 | ||||||
3.750%, 06/15/2024 | 740 | 801 | ||||||
3.600%, 06/01/2027 | 47 | 51 | ||||||
1.700%, 02/15/2031 | 297 | 273 | ||||||
Prologis | ||||||||
3.000%, 04/15/2050 | 115 | 110 | ||||||
Regency Centers | ||||||||
2.950%, 09/15/2029 | 685 | 696 | ||||||
Sabra Health Care | ||||||||
3.900%, 10/15/2029 | 715 | 729 | ||||||
Simon Property Group | ||||||||
3.800%, 07/15/2050 | 850 | 855 | ||||||
2.450%, 09/13/2029 | 1,020 | 1,009 | ||||||
2.000%, 09/13/2024 | 355 | 367 | ||||||
Spirit Realty | ||||||||
4.450%, 09/15/2026 | 40 | 44 | ||||||
4.000%, 07/15/2029 | 183 | 198 | ||||||
3.400%, 01/15/2030 | 379 | 393 | ||||||
3.200%, 02/15/2031 | 746 | 746 | ||||||
2.700%, 02/15/2032 | 251 | 238 | ||||||
2.100%, 03/15/2028 | 627 | 609 | ||||||
STORE Capital | ||||||||
4.625%, 03/15/2029 | 402 | 447 | ||||||
4.500%, 03/15/2028 | 1,190 | 1,309 | ||||||
2.750%, 11/18/2030 | 558 | 546 | ||||||
Ventas Realty | ||||||||
3.850%, 04/01/2027 | 500 | 552 | ||||||
VEREIT Operating Partnership | ||||||||
3.400%, 01/15/2028 | 334 | 352 | ||||||
2.850%, 12/15/2032 | 457 | 442 | ||||||
2.200%, 06/15/2028 | 339 | 332 | ||||||
Welltower | ||||||||
4.500%, 01/15/2024 | 102 | 111 | ||||||
| Description | Face Amount (Thousands) | Market Value ($ Thousands) | ||||||
CORPORATE OBLIGATIONS (continued) |
| |||||||
3.750%, 03/15/2023 | $ | 500 | $ | 528 | ||||
|
|
| ||||||
| 36,262 | ||||||||
|
|
| ||||||
Utilities — 2.1% |
| |||||||
AEP Texas | ||||||||
6.650%, 02/15/2033 | 500 | 662 | ||||||
AES | ||||||||
1.375%, 01/15/2026 (C) | 679 | 661 | ||||||
Alabama Power | ||||||||
3.700%, 12/01/2047 | 1,600 | 1,673 | ||||||
Ameren | ||||||||
1.750%, 03/15/2028 | 313 | 302 | ||||||
Berkshire Hathaway Energy | ||||||||
2.850%, 05/15/2051 | 1,060 | 947 | ||||||
Black Hills | ||||||||
3.875%, 10/15/2049 | 283 | 283 | ||||||
3.050%, 10/15/2029 | 386 | 398 | ||||||
Boston Gas | ||||||||
4.487%, 02/15/2042 (C) | 35 | 39 | ||||||
CenterPoint Energy | ||||||||
3.600%, 11/01/2021 | 595 | 606 | ||||||
Cleco Power | ||||||||
6.000%, 12/01/2040 | 700 | 888 | ||||||
Comision Federal de Electricidad | ||||||||
4.750%, 02/23/2027 (C) | 240 | 263 | ||||||
Consolidated Edison of New York | ||||||||
4.650%, 12/01/2048 | 1,500 | 1,769 | ||||||
4.450%, 03/15/2044 | 1,120 | 1,289 | ||||||
3.950%, 04/01/2050 | 130 | 140 | ||||||
3.350%, 04/01/2030 | 180 | 192 | ||||||
Dominion Energy | ||||||||
3.300%, 04/15/2041 | 254 | 249 | ||||||
3.071%, 08/15/2024 | 980 | 1,044 | ||||||
2.000%, 08/15/2021 | 444 | 446 | ||||||
1.450%, 04/15/2026 | 988 | 984 | ||||||
DTE Electric | ||||||||
2.950%, 03/01/2050 | 696 | 658 | ||||||
DTE Energy | ||||||||
3.800%, 03/15/2027 | 635 | 699 | ||||||
2.950%, 03/01/2030 | 421 | 428 | ||||||
2.529%, 10/01/2024 | 830 | 870 | ||||||
1.050%, 06/01/2025 | 2,137 | 2,108 | ||||||
Duke Energy | ||||||||
3.550%, 09/15/2021 | 76 | 76 | ||||||
3.150%, 08/15/2027 | 280 | 298 | ||||||
2.400%, 08/15/2022 | 340 | 348 | ||||||
1.800%, 09/01/2021 | 843 | 847 | ||||||
0.900%, 09/15/2025 | 705 | 689 | ||||||
Duke Energy Carolinas | ||||||||
4.250%, 12/15/2041 | 628 | 715 | ||||||
4.000%, 09/30/2042 | 1,000 | 1,101 | ||||||
2.550%, 04/15/2031 | 318 | 320 | ||||||
84 | SEI Institutional Managed Trust / Semi-Annual Report / March 31, 2021 |
| Description | Face Amount (Thousands) | Market Value ($ Thousands) | ||||||
CORPORATE OBLIGATIONS (continued) |
| |||||||
Duke Energy Florida | ||||||||
3.850%, 11/15/2042 | $ | 380 | $ | 407 | ||||
3.200%, 01/15/2027 | 1,080 | 1,167 | ||||||
Duke Energy Indiana | ||||||||
4.200%, 03/15/2042 | 30 | 33 | ||||||
2.750%, 04/01/2050 | 280 | 250 | ||||||
Duke Energy Progress | ||||||||
4.100%, 05/15/2042 | 425 | 476 | ||||||
2.800%, 05/15/2022 | 25 | 26 | ||||||
2.500%, 08/15/2050 | 473 | 402 | ||||||
Enel Finance International | ||||||||
4.625%, 09/14/2025 (C) | 1,310 | 1,483 | ||||||
Entergy | ||||||||
2.400%, 06/15/2031 | 254 | 245 | ||||||
1.900%, 06/15/2028 | 629 | 614 | ||||||
Entergy Arkansas | ||||||||
2.650%, 06/15/2051 | 1,216 | 1,072 | ||||||
Evergy | ||||||||
2.900%, 09/15/2029 | 418 | 426 | ||||||
2.450%, 09/15/2024 | 588 | 615 | ||||||
Evergy Kansas Central | ||||||||
3.450%, 04/15/2050 | 528 | 532 | ||||||
Evergy Metro | ||||||||
5.300%, 10/01/2041 | 100 | 124 | ||||||
Evergy Missouri West | ||||||||
8.270%, 11/15/2021 | 2,700 | 2,819 | ||||||
Eversource Energy | ||||||||
2.900%, 10/01/2024 | 1,610 | 1,717 | ||||||
2.550%, 03/15/2031 | 473 | 471 | ||||||
Exelon | ||||||||
5.625%, 06/15/2035 | 760 | 956 | ||||||
4.700%, 04/15/2050 | 528 | 631 | ||||||
3.950%, 06/15/2025 | 375 | 410 | ||||||
FirstEnergy | ||||||||
4.750%, 03/15/2023 | 340 | 358 | ||||||
4.400%, 07/15/2027 | 940 | 1,010 | ||||||
1.600%, 01/15/2026 | 180 | 175 | ||||||
FirstEnergy, Ser C | ||||||||
7.375%, 11/15/2031 | 3,685 | 4,928 | ||||||
FirstEnergy Transmission | ||||||||
5.450%, 07/15/2044 (C) | 35 | 40 | ||||||
Indiana Michigan Power | ||||||||
4.550%, 03/15/2046 | 325 | 381 | ||||||
Interstate Power & Light | ||||||||
3.500%, 09/30/2049 | 241 | 237 | ||||||
ITC Holdings | ||||||||
4.050%, 07/01/2023 | 1,152 | 1,230 | ||||||
2.700%, 11/15/2022 | 637 | 657 | ||||||
Jersey Central Power & Light | ||||||||
4.700%, 04/01/2024 (C) | 700 | 761 | ||||||
KeySpan Gas East | ||||||||
2.742%, 08/15/2026 (C) | 1,025 | 1,076 | ||||||
| Description | Face Amount (Thousands) | Market Value ($ Thousands) | ||||||
CORPORATE OBLIGATIONS (continued) |
| |||||||
Metropolitan Edison | ||||||||
4.300%, 01/15/2029 (C) | $ | 704 | $ | 776 | ||||
3.500%, 03/15/2023 (C) | 2,775 | 2,873 | ||||||
MidAmerican Energy | ||||||||
4.800%, 09/15/2043 | 830 | 1,011 | ||||||
Mid-Atlantic Interstate Transmission | ||||||||
4.100%, 05/15/2028 (C) | 162 | 175 | ||||||
Mississippi Power | ||||||||
4.250%, 03/15/2042 | 466 | 511 | ||||||
3.950%, 03/30/2028 | 777 | 856 | ||||||
NextEra Energy Capital Holdings | ||||||||
2.250%, 06/01/2030 | 515 | 504 | ||||||
0.650%, 03/01/2023 | 5,233 | 5,251 | ||||||
NiSource | ||||||||
5.800%, 02/01/2042 | 149 | 187 | ||||||
Northern States Power | ||||||||
3.200%, 04/01/2052 | 318 | 316 | ||||||
2.250%, 04/01/2031 | 476 | 475 | ||||||
Oncor Electric Delivery | ||||||||
4.550%, 12/01/2041 | 690 | 811 | ||||||
2.750%, 05/15/2030 | 1,065 | 1,109 | ||||||
Pacific Gas and Electric | ||||||||
4.950%, 07/01/2050 | 315 | 324 | ||||||
4.550%, 07/01/2030 | 227 | 247 | ||||||
4.500%, 07/01/2040 | 161 | 163 | ||||||
4.200%, 06/01/2041 | 271 | 269 | ||||||
3.950%, 12/01/2047 | 518 | 475 | ||||||
3.500%, 08/01/2050 | 130 | 113 | ||||||
3.300%, 12/01/2027 | 636 | 664 | ||||||
3.300%, 08/01/2040 | 84 | 76 | ||||||
3.150%, 01/01/2026 | 225 | 234 | ||||||
2.500%, 02/01/2031 | 2,463 | 2,324 | ||||||
2.100%, 08/01/2027 | 2,223 | 2,176 | ||||||
1.750%, 06/16/2022 | 2,555 | 2,559 | ||||||
PECO Energy | ||||||||
4.150%, 10/01/2044 | 1,140 | 1,282 | ||||||
Pennsylvania Electric | ||||||||
3.250%, 03/15/2028 (C) | 267 | 274 | ||||||
Perusahaan Perseroan Persero Perusahaan Listrik Negara MTN | ||||||||
6.150%, 05/21/2048 (C) | 500 | 608 | ||||||
Piedmont Natural Gas | ||||||||
2.500%, 03/15/2031 | 473 | 468 | ||||||
PPL Capital Funding | ||||||||
5.000%, 03/15/2044 | 257 | 306 | ||||||
4.125%, 04/15/2030 | 818 | 919 | ||||||
3.400%, 06/01/2023 | 91 | 96 | ||||||
3.100%, 05/15/2026 | 765 | 815 | ||||||
Progress Energy | ||||||||
3.150%, 04/01/2022 | 280 | 286 | ||||||
Public Service Electric and Gas MTN | ||||||||
3.700%, 05/01/2028 | 1,545 | 1,702 | ||||||
| SEI Institutional Managed Trust / Semi-Annual Report / March 31, 2021 | 85 |
SCHEDULE OF INVESTMENTS (Unaudited)
March 31, 2021
Core Fixed Income Fund (Continued)
| Description | Face Amount (Thousands) | Market Value ($ Thousands) | ||||||
CORPORATE OBLIGATIONS (continued) |
| |||||||
2.700%, 05/01/2050 | $ | 699 | $ | 642 | ||||
2.050%, 08/01/2050 | 129 | 103 | ||||||
Public Service of Colorado | ||||||||
1.875%, 06/15/2031 | 721 | 688 | ||||||
Public Service of New Hampshire | ||||||||
3.500%, 11/01/2023 | 515 | 550 | ||||||
Sempra Energy | ||||||||
2.900%, 02/01/2023 | 480 | 499 | ||||||
Southern | ||||||||
1.750%, 03/15/2028 | 470 | 456 | ||||||
Southern California Edison | ||||||||
4.650%, 10/01/2043 | 75 | 84 | ||||||
4.125%, 03/01/2048 | 778 | 811 | ||||||
4.050%, 03/15/2042 | 5 | 5 | ||||||
3.700%, 08/01/2025 | 99 | 108 | ||||||
Southern California Gas | ||||||||
2.550%, 02/01/2030 | 900 | 903 | ||||||
Southern Gas Capital | ||||||||
4.400%, 05/30/2047 | 500 | 551 | ||||||
1.750%, 01/15/2031 | 386 | 355 | ||||||
Southwestern Electric Power | ||||||||
1.650%, 03/15/2026 | 1,575 | 1,579 | ||||||
Southwestern Public Service | ||||||||
3.750%, 06/15/2049 | 955 | 1,009 | ||||||
Tampa Electric | ||||||||
3.450%, 03/15/2051 | 379 | 386 | ||||||
2.400%, 03/15/2031 | 474 | 471 | ||||||
Trans-Allegheny Interstate Line | ||||||||
3.850%, 06/01/2025 (C) | 222 | 238 | ||||||
Virginia Electric & Power | ||||||||
4.650%, 08/15/2043 | 585 | 700 | ||||||
2.450%, 12/15/2050 | 459 | 391 | ||||||
2.950%, 01/15/2022 | 330 | 334 | ||||||
Vistra Operations | ||||||||
4.300%, 07/15/2029 (C) | 1,590 | 1,679 | ||||||
WEC Energy Group | ||||||||
1.375%, 10/15/2027 | 457 | 441 | ||||||
0.800%, 03/15/2024 | 1,901 | 1,900 | ||||||
|
|
| ||||||
| 93,839 | ||||||||
|
|
| ||||||
Total Corporate Obligations (Cost $1,289,883) ($ Thousands) |
| 1,348,320 | ||||||
|
|
| ||||||
ASSET-BACKED SECURITIES — 6.8% |
| |||||||
Automotive — 0.9% | ||||||||
Ally Auto Receivables Trust, Ser 2018-1, Cl A3 | ||||||||
2.350%, 06/15/2022 | 7 | 7 | ||||||
| Description | Face Amount (Thousands) | Market Value ($ Thousands) | ||||||
ASSET-BACKED SECURITIES (continued) |
| |||||||
Ally Auto Receivables Trust, Ser 2019-4, Cl A3 | ||||||||
1.840%, 06/17/2024 | $ | 190 | $ | 192 | ||||
Americredit Automobile Receivables Trust, Ser 2018-1, Cl A3 | ||||||||
3.070%, 12/19/2022 | 172 | 172 | ||||||
AmeriCredit Automobile Receivables Trust, Ser 2020-1, Cl A2A | ||||||||
1.100%, 03/20/2023 | 92 | 92 | ||||||
AmeriCredit Automobile Receivables Trust, Ser 2020-2, Cl A2A | ||||||||
0.600%, 12/18/2023 | 1,144 | 1,145 | ||||||
AmeriCredit Automobile Receivables Trust, Ser 2020-3, Cl A2 | ||||||||
0.420%, 03/18/2024 | 1,101 | 1,102 | ||||||
AmeriCredit Automobile Receivables Trust, Ser 2020-3, Cl A3 | ||||||||
0.530%, 06/18/2025 | 905 | 907 | ||||||
Avis Budget Rental Car Funding AESOP, Ser 2017-1A, Cl A | ||||||||
3.070%, 09/20/2023 (C) | 333 | 344 | ||||||
Avis Budget Rental Car Funding AESOP, Ser 2019-3A, Cl A | ||||||||
2.360%, 03/20/2026 (C) | 665 | 692 | ||||||
Avis Budget Rental Car Funding AESOP, Ser 2020-1A, Cl A | ||||||||
2.330%, 08/20/2026 (C) | 1,120 | 1,163 | ||||||
Avis Budget Rental Car Funding AESOP, Ser 2020-2A, Cl A | ||||||||
2.020%, 02/20/2027 (C) | 2,800 | 2,856 | ||||||
Bank of The West Auto Trust, Ser 2019-1, Cl A2 | ||||||||
2.400%, 10/17/2022 (C) | 11 | 11 | ||||||
Chase Auto Credit Linked Notes, Ser 2020- 1, Cl B | ||||||||
0.991%, 01/25/2028 (C) | 619 | 621 | ||||||
Chase Auto Credit Linked Notes, Ser 2020- 2, Cl B | ||||||||
0.840%, 02/25/2028 (C) | 1,035 | 1,036 | ||||||
Chesapeake Funding II, Ser 2017-3A, Cl B | ||||||||
2.570%, 08/15/2029 (C) | 205 | 205 | ||||||
Chesapeake Funding II, Ser 2018-2A, Cl A1 | ||||||||
3.230%, 08/15/2030 (C) | 427 | 433 | ||||||
Chesapeake Funding II, Ser 2019-1A, Cl A1 | ||||||||
2.940%, 04/15/2031 (C) | 794 | 804 | ||||||
Chesapeake Funding II, Ser 2020-1A, Cl A1 | ||||||||
0.870%, 08/16/2032 (C) | 2,341 | 2,352 | ||||||
Chesapeake Funding II, Ser 2020-1A, Cl B | ||||||||
1.240%, 08/16/2032 (C) | 1,455 | 1,466 | ||||||
Drive Auto Receivables Trust, Ser 2019-3, Cl A3 | ||||||||
2.490%, 06/15/2023 | 20 | 20 | ||||||
86 | SEI Institutional Managed Trust / Semi-Annual Report / March 31, 2021 |
| Description | Face Amount (Thousands) | Market Value ($ Thousands) | ||||||
ASSET-BACKED SECURITIES (continued) |
| |||||||
Drive Auto Receivables Trust, Ser 2020-1, Cl A2 | ||||||||
1.990%, 12/15/2022 | $ | 8 | $ | 8 | ||||
Drive Auto Receivables Trust, Ser 2020-2, Cl A2A | ||||||||
0.850%, 07/17/2023 | 185 | 186 | ||||||
Enterprise Fleet Financing, Ser 2019-1, Cl A2 | ||||||||
2.980%, 10/20/2024 (C) | 277 | 281 | ||||||
Enterprise Fleet Funding, Ser 2021-1, Cl A3 | ||||||||
0.700%, 12/21/2026 (C) | 425 | 422 | ||||||
Exeter Automobile Receivables Trust, Ser 2020-2A, Cl A | ||||||||
1.130%, 08/15/2023 (C) | 750 | 752 | ||||||
Ford Credit Auto Owner Trust, Ser 2017-B, Cl A4 | ||||||||
1.870%, 09/15/2022 | 92 | 92 | ||||||
Ford Credit Auto Owner Trust, Ser 2018-1, Cl A | ||||||||
3.190%, 07/15/2031 (C) | 588 | 634 | ||||||
Ford Credit Auto Owner Trust, Ser 2018-2, Cl A | ||||||||
3.470%, 01/15/2030 (C) | 1,725 | 1,840 | ||||||
Ford Credit Auto Owner Trust, Ser 2018-A, Cl A3 | ||||||||
3.030%, 11/15/2022 | 65 | 65 | ||||||
Ford Credit Auto Owner Trust, Ser 2019-1, Cl A | ||||||||
3.520%, 07/15/2030 (C) | 2,077 | 2,237 | ||||||
GM Financial Consumer Automobile Receivables Trust, Ser 2020-1, Cl A2 | ||||||||
1.830%, 01/17/2023 | 90 | 90 | ||||||
Hertz Fleet Lease Funding, Ser 2019-1, Cl D | ||||||||
3.440%, 01/10/2033 (C) | 1,580 | 1,583 | ||||||
Hertz Vehicle Financing II, Ser 2016-2A, Cl B | ||||||||
3.940%, 03/25/2022 (C) | 1,340 | 1,338 | ||||||
Hyundai Auto Receivables Trust, Ser 2020- B, Cl A2 | ||||||||
0.380%, 03/15/2023 | 1,291 | 1,292 | ||||||
Santander Drive Auto Receivables Trust, Ser 2020-1, Cl A3 | ||||||||
2.030%, 02/15/2024 | 393 | 397 | ||||||
Santander Drive Auto Receivables Trust, Ser 2020-2, Cl A2A | ||||||||
0.620%, 05/15/2023 | 1,100 | 1,101 | ||||||
Santander Drive Auto Receivables Trust, Ser 2020-3, Cl A2 | ||||||||
0.460%, 09/15/2023 | 962 | 962 | ||||||
Santander Drive Auto Receivables Trust, Ser 2020-3, Cl A3 | ||||||||
0.520%, 07/15/2024 | 684 | 685 | ||||||
| Description | Face Amount (Thousands) | Market Value ($ Thousands) | ||||||
ASSET-BACKED SECURITIES (continued) |
| |||||||
Santander Drive Auto Receivables Trust, Ser 2020-4, Cl A2 | ||||||||
0.420%, 09/15/2023 | $ | 647 | $ | 648 | ||||
Santander Drive Auto Receivables Trust, Ser 2020-4, Cl A3 | ||||||||
0.480%, 07/15/2024 | 623 | 624 | ||||||
Santander Revolving Auto Loan Trust, Ser 2019-A, Cl A | ||||||||
2.510%, 01/26/2032 (C) | 935 | 980 | ||||||
Tesla Auto Lease Trust, Ser 2021-A, Cl A3 | ||||||||
0.560%, 03/20/2025 (C) | 372 | 372 | ||||||
Tidewater Auto Receivables Trust, Ser 2020-AA, Cl A2 | ||||||||
1.390%, 08/15/2024 (C) | 375 | 377 | ||||||
Toyota Auto Loan Extended Note Trust, Ser 2021-1A, Cl A | ||||||||
1.070%, 02/27/2034 (C) | 1,911 | 1,897 | ||||||
Toyota Auto Receivables Owner Trust, Ser 2019-D, Cl A2 | ||||||||
1.920%, 07/15/2022 | 65 | 66 | ||||||
Toyota Auto Receivables Owner Trust, Ser 2020-A, Cl A2 | ||||||||
1.670%, 11/15/2022 | 88 | 89 | ||||||
Westlake Automobile Receivables Trust, Ser 2021-1A, Cl A2A | ||||||||
0.390%, 10/15/2024 (C) | 1,050 | 1,050 | ||||||
Wheels SPV 2, Ser 2020-1A, Cl A2 | ||||||||
0.510%, 08/20/2029 (C) | 1,340 | 1,341 | ||||||
|
|
| ||||||
| 37,029 | ||||||||
|
|
| ||||||
Credit Cards — 0.2% | ||||||||
Capital One Multi-Asset Execution Trust, Ser 2016-A2, Cl A2 | ||||||||
0.736%, VAR ICE LIBOR USD 1 Month+0.630%, 02/15/2024 | 1,463 | 1,463 | ||||||
Capital One Multi-Asset Execution Trust, Ser 2016-A7, Cl A7 | ||||||||
0.616%, VAR ICE LIBOR USD 1 Month+0.510%, 09/16/2024 | 872 | 875 | ||||||
Capital One Multi-Asset Execution Trust, Ser 2017-A5, Cl A5 | ||||||||
0.686%, VAR ICE LIBOR USD 1 Month+0.580%, 07/15/2027 | 1,215 | 1,228 | ||||||
Citibank Credit Card Issuance Trust, Ser 2017-A5, Cl A5 | ||||||||
0.731%, VAR ICE LIBOR USD 1 Month+0.620%, 04/22/2026 | 1,250 | 1,265 | ||||||
Citibank Credit Card Issuance Trust, Ser 2017-A6, Cl A6 | ||||||||
0.876%, VAR ICE LIBOR USD 1 Month+0.770%, 05/14/2029 | 2,985 | 3,026 | ||||||
| SEI Institutional Managed Trust / Semi-Annual Report / March 31, 2021 | 87 |
SCHEDULE OF INVESTMENTS (Unaudited)
March 31, 2021
Core Fixed Income Fund (Continued)
| Description | Face Amount (Thousands) | Market Value ($ Thousands) | ||||||
ASSET-BACKED SECURITIES (continued) |
| |||||||
Discover Card Execution Note Trust, Ser 2017-A5, Cl A5 | ||||||||
0.706%, VAR ICE LIBOR USD 1 Month+0.600%, 12/15/2026 | $ | 940 | $ | 951 | ||||
Discover Card Execution Note Trust, Ser 2018-A2, Cl A2 | ||||||||
0.436%, VAR ICE LIBOR USD 1 Month+0.330%, 08/15/2025 | 1,200 | 1,205 | ||||||
|
|
| ||||||
| 10,013 | ||||||||
|
|
| ||||||
Financials — 0.0% | ||||||||
Sequoia Infrastructure Funding I Ltd. | ||||||||
1.595%, 04/15/2031 (C) | 815 | 815 | ||||||
|
|
| ||||||
Mortgage Related Securities — 0.3% |
| |||||||
Aegis Asset-Backed Securities Trust, Ser 2003-3, Cl M1 | ||||||||
1.159%, VAR ICE LIBOR USD 1 Month+1.050%, 01/25/2034 | 505 | 497 | ||||||
Aegis Asset-Backed Securities Trust, Ser 2005-5, Cl 2A | ||||||||
0.609%, VAR ICE LIBOR USD 1 Month+0.500%, 12/25/2035 | 230 | 230 | ||||||
Bear Stearns Asset-Backed Securities I Trust, Ser 2004-HE10, Cl M1 | ||||||||
1.084%, VAR ICE LIBOR USD 1 Month+0.975%, 12/25/2034 | 313 | 309 | ||||||
Bear Stearns Asset-Backed Securities I Trust, Ser 2004-HE6, Cl M1 | ||||||||
0.964%, VAR ICE LIBOR USD 1 Month+0.855%, 08/25/2034 | 2,599 | 2,567 | ||||||
Citifinancial Mortgage Securities, Ser 2004- 1, Cl AF4 | ||||||||
5.070%, 04/25/2034 | 210 | 219 | ||||||
Citigroup Mortgage Loan Trust, Ser 2006- HE2, Cl M1 | ||||||||
0.399%, VAR ICE LIBOR USD 1 Month+0.290%, 08/25/2036 | 4,091 | 4,064 | ||||||
Master Asset-Backed Securities Trust, Ser 2007-HE1, Cl A4 | ||||||||
0.389%, VAR ICE LIBOR USD 1 Month+0.280%, 05/25/2037 | 5,500 | 4,899 | ||||||
Morgan Stanley ABS Capital I Trust, Ser 2005-HE1, Cl M1 | ||||||||
0.784%, VAR ICE LIBOR USD 1 Month+0.675%, 12/25/2034 | 381 | 372 | ||||||
New Century Home Equity Loan Trust, Ser 2003-A, Cl A | ||||||||
0.829%, VAR ICE LIBOR USD 1 Month+0.720%, | 94 | 93 | ||||||
| Description | Face Amount (Thousands) | Market Value ($ Thousands) | ||||||
ASSET-BACKED SECURITIES (continued) |
| |||||||
Option One Mortgage Loan Trust, Ser 2005- 4, Cl M1 | ||||||||
0.769%, VAR ICE LIBOR USD 1 Month+0.660%, 11/25/2035 | $ | 94 | $ | 94 | ||||
Option One Mortgage Loan Trust, Ser 2006- 1, Cl 1A1 | ||||||||
0.549%, VAR ICE LIBOR USD 1 Month+0.440%, 01/25/2036 | 736 | 733 | ||||||
Structured Asset Securities Mortgage Pass-Through Certificates, Ser 2002- AL1, Cl A2 | ||||||||
3.450%, 02/25/2032 | 11 | 11 | ||||||
|
|
| ||||||
| 14,088 | ||||||||
|
|
| ||||||
Other Asset-Backed Securities — 5.4% |
| |||||||
Academic Loan Funding Trust, Ser 2012-1A, Cl A2 | ||||||||
1.209%, VAR ICE LIBOR USD 1 Month+1.100%, 12/27/2044 (C) | 1,373 | 1,390 | ||||||
American Tower Trust, Ser 2013-13, Cl 2A | ||||||||
3.070%, 03/15/2048 (C) | 340 | 344 | ||||||
Antares CLO, Ser 2020-1A, Cl A1 | ||||||||
2.113%, VAR ICE LIBOR USD 3 Month+1.900%, 10/23/2031 (C) | 1,400 | 1,407 | ||||||
Apidos CLO XXI, Ser 2018-21A, Cl A1R | ||||||||
1.153%, VAR ICE LIBOR USD 3 Month+0.930%, 07/18/2027 (C) | 530 | 530 | ||||||
Applebee’s Funding, Ser 2019-1A, Cl A2I | ||||||||
4.194%, 06/07/2049 (C) | 1,861 | 1,911 | ||||||
Balboa Bay Loan Funding, Ser 2020-1A, Cl A | ||||||||
1.490%, VAR ICE LIBOR USD 3 Month+1.350%, 01/20/2032 (C) | 1,405 | 1,409 | ||||||
Barings CLO, Ser 2017-IA, Cl AR | ||||||||
1.024%, VAR ICE LIBOR USD 3 Month+0.800%, 01/20/2028 (C) | 1,070 | 1,070 | ||||||
Brazos Higher Education Authority, Ser 2010-1, Cl A2 | ||||||||
1.388%, VAR ICE LIBOR USD 3 Month+1.200%, 02/25/2035 | 3,050 | 3,090 | ||||||
Brazos Higher Education Authority, Ser 2011-2, Cl A3 | ||||||||
1.218%, VAR ICE LIBOR USD 3 Month+1.000%, 10/27/2036 | 2,150 | 2,160 | ||||||
BVRT CMO | ||||||||
1.610%, 02/10/2022 | 1,175 | 1,175 | ||||||
BVRT Financing Trust | ||||||||
0.000%, 01/10/2033 (G) | 795 | 795 | ||||||
BVRT Financing Trust, Ser 2020, Cl A71 | ||||||||
1.900%, 07/10/2032 | 780 | 781 | ||||||
CARLYLE US CLO, Ser 2021-1A, Cl A1 | ||||||||
1.331%, VAR ICE LIBOR USD 3 Month+1.140%, 04/15/2034 (C) | 1,150 | 1,150 | ||||||
88 | SEI Institutional Managed Trust / Semi-Annual Report / March 31, 2021 |
| Description | Face Amount (Thousands) | Market Value ($ Thousands) | ||||||
ASSET-BACKED SECURITIES (continued) |
| |||||||
Chase Funding Mortgage Loan Asset- Backed Certificates, Ser 2003-6, Cl 1A5 | ||||||||
4.968%, 11/25/2034 | $ | 36 | $ | 37 | ||||
CIT Education Loan Trust, Ser 2007-1, Cl A | ||||||||
0.291%, VAR ICE LIBOR USD 3 Month+0.090%, 03/25/2042 (C) | 1,090 | 1,070 | ||||||
Citicorp Residential Mortgage Trust, Ser 2007-1, Cl A5 | ||||||||
5.133%, 03/25/2037 | 1,575 | 1,619 | ||||||
Citicorp Residential Mortgage Trust, Ser 2007-1, Cl M1 | ||||||||
5.133%, 03/25/2037 | 1,430 | 1,480 | ||||||
College Ave Student Loans, Ser 2021-A, Cl A2 | ||||||||
1.600%, 07/25/2051 (C) | 902 | 891 | ||||||
College Avenue Student Loans, Ser 2017-A, Cl A1 | ||||||||
1.759%, VAR ICE LIBOR USD 1 Month+1.650%, 11/26/2046 (C) | 519 | 529 | ||||||
College Avenue Student Loans, Ser 2018-A, Cl A2 | ||||||||
4.130%, 12/26/2047 (C) | 325 | 342 | ||||||
College Avenue Student Loans, Ser 2019-A, Cl A2 | ||||||||
3.280%, 12/28/2048 (C) | 592 | 609 | ||||||
Countrywide Asset-Backed Certificates, Ser 2004-5, Cl 1A | ||||||||
0.609%, VAR ICE LIBOR USD 1 Month+0.500%, 10/25/2034 | 384 | 376 | ||||||
Countrywide Asset-Backed Certificates, Ser 2004-6, Cl 1A1 | ||||||||
0.649%, VAR ICE LIBOR USD 1 Month+0.540%, 12/25/2034 | 265 | 259 | ||||||
Countrywide Asset-Backed Certificates, Ser 2007-13, Cl 2A2 | ||||||||
0.909%, VAR ICE LIBOR USD 1 Month+0.800%, 10/25/2047 | 1,627 | 1,614 | ||||||
Countrywide Home Equity Loan Trust, Ser 2006-F, Cl 2A1A | ||||||||
0.246%, VAR ICE LIBOR USD 1 Month+0.140%, 07/15/2036 | 321 | 298 | ||||||
CSEMC, Ser 2020-1, Cl A | ||||||||
7.252%, 08/09/2024 | 1,303 | 1,280 | ||||||
Dividend Solar Loans, Ser 2019-1, Cl A | ||||||||
3.670%, 08/22/2039 (C) | 1,594 | 1,683 | ||||||
Dryden XXVI Senior Loan Fund, Ser 2018- 26A, Cl AR | ||||||||
1.141%, VAR ICE LIBOR USD 3 Month+0.900%, 04/15/2029 (C) | 1,150 | 1,149 | ||||||
Educational Funding of the South, Ser 2011- 1, Cl A2 | ||||||||
0.868%, VAR ICE LIBOR USD 3 Month+0.650%, 04/25/2035 | 597 | 597 | ||||||
| Description | Face Amount (Thousands) | Market Value ($ Thousands) | ||||||
ASSET-BACKED SECURITIES (continued) |
| |||||||
Elmwood CLO II, Ser 2021-2A, Cl AR | ||||||||
0.000%, 04/20/2034 (C)(G) | $ | 1,800 | $ | 1,800 | ||||
First Franklin Mortgage Loan Asset-Backed Certificates, Ser 2004-FF5, Cl A3C | ||||||||
1.109%, VAR ICE LIBOR USD 1 Month+1.000%, 08/25/2034 | 374 | 379 | ||||||
FNMA Grantor Trust, Ser 2017-T1, Cl A | ||||||||
2.898%, 06/25/2027 | 199 | 213 | ||||||
Ford Credit Floorplan Master Owner Trust A, Ser 2018-4, Cl A | ||||||||
4.060%, 11/15/2030 | 1,860 | 2,102 | ||||||
Ford Credit Floorplan Master Owner Trust A, Ser 2020-1, Cl A1 | ||||||||
0.700%, 09/15/2025 | 808 | 810 | ||||||
Galaxy XXIX CLO, Ser 2018-29A, Cl A | ||||||||
0.984%, VAR ICE LIBOR USD 3 Month+0.790%, 11/15/2026 (C) | 1,559 | 1,558 | ||||||
Global SC Finance, Ser 2014-1A, Cl A2 | ||||||||
3.090%, 07/17/2029 (C) | 563 | 567 | ||||||
GoldenTree Loan Opportunities IX, Ser 2018-9A, Cl AR2 | ||||||||
1.322%, VAR ICE LIBOR USD 3 Month+1.110%, 10/29/2029 (C) | 3,000 | 3,004 | ||||||
Golub Capital BDC 3 CLO 1, Ser 2021-1A, Cl A | ||||||||
1.711%, VAR ICE LIBOR USD 3 Month+1.600%, 04/15/2033 (C) | 900 | 900 | ||||||
GSAMP Trust, Ser 2003-SEA, Cl A1 | ||||||||
0.909%, VAR ICE LIBOR USD 1 Month+0.800%, 02/25/2033 | 574 | 549 | ||||||
GSAMP Trust, Ser 2006-HE3, Cl A2D | ||||||||
0.609%, VAR ICE LIBOR USD 1 Month+0.500%, 05/25/2046 | 3,300 | 3,172 | ||||||
GSAMP Trust, Ser 2006-NC1, Cl A3 | ||||||||
0.689%, VAR ICE LIBOR USD 1 Month+0.580%, 02/25/2036 | 885 | 884 | ||||||
Higher Education Funding, Ser 2014-1, Cl A | ||||||||
1.238%, VAR ICE LIBOR USD 3 Month+1.050%, 05/25/2034 (C) | 1,334 | 1,341 | ||||||
Hildene Community Funding CDO, Ser 2020-1A, Cl AR | ||||||||
3.250%, 11/01/2035 (C) | 1,240 | 1,226 | ||||||
Hilton Grand Vacations Trust, Ser 2020-AA, Cl A | ||||||||
2.740%, 02/25/2039 (C) | 713 | 741 | ||||||
Home Partners of America Trust, Ser 2019- 2, Cl A | ||||||||
2.703%, 10/19/2039 (C) | 1,687 | 1,705 | ||||||
HSI Asset Securitization Trust, Ser 2006- OPT3, Cl 3A3 | ||||||||
0.289%, VAR ICE LIBOR USD 1 Month+0.180%, 02/25/2036 | 90 | 90 | ||||||
SEI Institutional Managed Trust / Semi-Annual Report / March 31, 2021 | 89 |
SCHEDULE OF INVESTMENTS (Unaudited)
March 31, 2021
Core Fixed Income Fund (Continued)
| Description | Face Amount (Thousands) | Market Value ($ Thousands) | ||||||
ASSET-BACKED SECURITIES (continued) |
| |||||||
HSI Asset Securitization Trust, Ser 2006- OPT4, Cl 1A1 | ||||||||
0.449%, VAR ICE LIBOR USD 1 Month+0.340%, 03/25/2036 | $ | 44 | $ | 44 | ||||
Invitation Homes Trust, Ser 2018-SFR2, Cl A | ||||||||
1.006%, VAR ICE LIBOR USD 1 Month+0.900%, | 3,280 | 3,286 | ||||||
JFIN CLO, Ser 2017-2A, Cl A1AR | ||||||||
1.394%, VAR ICE LIBOR USD 3 Month+1.170%, | 27 | 27 | ||||||
JGWPT XXX, Ser 2013-3A, Cl A | ||||||||
4.080%, 01/17/2073 (C) | 834 | 915 | ||||||
JGWPT XXXII, Ser 2014-2A, Cl A | ||||||||
3.610%, 01/17/2073 (C) | 1,148 | 1,222 | ||||||
Laurel Road Prime Student Loan Trust, Ser 2020-A, Cl A1FX | ||||||||
0.720%, 11/25/2050 (C) | 115 | 115 | ||||||
LCM XIII, Ser 2019-13A, Cl ARR | ||||||||
1.363%, VAR ICE LIBOR USD 3 Month+1.140%, 07/19/2027 (C) | 1,400 | 1,400 | ||||||
LCM XXI, Ser 2018-21A, Cl AR | ||||||||
1.104%, VAR ICE LIBOR USD 3 Month+0.880%, 04/20/2028 (C) | 1,126 | 1,125 | ||||||
LCM XXIV, Ser 2021-24A, Cl AR | ||||||||
1.000%, VAR ICE LIBOR USD 3 Month+0.980%, 03/20/2030 (C) | 950 | 950 | ||||||
LoanCore Issuer, Ser 2019-CRE2, Cl A | ||||||||
1.236%, VAR ICE LIBOR USD 1 Month+1.130%, 05/15/2036 (C) | 3,500 | 3,499 | ||||||
Magnetite VII, Ser 2018-7A, Cl A1R2 | ||||||||
1.041%, VAR ICE LIBOR USD 3 Month+0.800%, 01/15/2028 (C) | 1,000 | 1,000 | ||||||
Magnetite XXVIII, Ser 2020-28A, Cl A | ||||||||
1.487%, VAR ICE LIBOR USD 3 Month+1.270%, 10/25/2031 (C) | 1,800 | 1,802 | ||||||
MF, Ser 2020-FL4, Cl A | ||||||||
1.806%, VAR ICE LIBOR USD 1 Month+1.700%, 11/15/2035 (C) | 980 | 987 | ||||||
Mid-State Trust, Ser 2003-11, Cl A1 | ||||||||
4.864%, 07/15/2038 | 1,666 | 1,772 | ||||||
Mill City Mortgage Trust, Ser 2015-2, Cl A2 | ||||||||
3.000%, 09/25/2057 (B)(C) | 247 | 247 | ||||||
Morgan Stanley Resecuritization Trust, Ser 2015-R7, Cl 1BXA | ||||||||
7.728%, 02/26/2029 (B)(C) | 930 | 928 | ||||||
Navient Private Education Loan Trust, Ser 2014-AA, Cl A3 | ||||||||
1.706%, VAR ICE LIBOR USD 1 Month+1.600%, | 457 | 465 | ||||||
Navient Private Education Loan Trust, Ser 2016-AA, Cl A2B | ||||||||
2.256%, VAR ICE LIBOR USD 1 Month+2.150%, | 399 | 411 | ||||||
| Description | Face Amount (Thousands) | Market Value ($ Thousands) | ||||||
ASSET-BACKED SECURITIES (continued) |
| |||||||
Navient Private Education Loan Trust, Ser 2018-BA, Cl A2A | ||||||||
3.610%, 12/15/2059 (C) | $ | 489 | $ | 512 | ||||
Navient Private Education Loan Trust, Ser 2020-IA, Cl A1A | ||||||||
1.330%, 04/15/2069 (C) | 2,885 | 2,856 | ||||||
Navient Private Education Refi Loan Trust, Ser 2018-A, Cl A2 | ||||||||
3.190%, 02/18/2042 (C) | 237 | 240 | ||||||
Navient Private Education Refi Loan Trust, Ser 2018-CA, Cl A2 | ||||||||
3.520%, 06/16/2042 (C) | 154 | 158 | ||||||
Navient Private Education Refi Loan Trust, Ser 2018-DA, Cl A2A | ||||||||
4.000%, 12/15/2059 (C) | 867 | 926 | ||||||
Navient Private Education Refi Loan Trust, Ser 2019-A, Cl A2A | ||||||||
3.420%, 01/15/2043 (C) | 1,476 | 1,516 | ||||||
Navient Private Education Refi Loan Trust, Ser 2019-CA, Cl A2 | ||||||||
3.130%, 02/15/2068 (C) | 2,132 | 2,188 | ||||||
Navient Private Education Refi Loan Trust, Ser 2019-D, Cl A2A | ||||||||
3.010%, 12/15/2059 (C) | 1,717 | 1,795 | ||||||
Navient Private Education Refi Loan Trust, Ser 2019-FA, Cl A2 | ||||||||
2.600%, 08/15/2068 (C) | 3,732 | 3,843 | ||||||
Navient Private Education Refi Loan Trust, Ser 2019-GA, Cl A | ||||||||
2.400%, 10/15/2068 (C) | 713 | 732 | ||||||
Navient Private Education Refi Loan Trust, Ser 2020-A, Cl A2A | ||||||||
2.460%, 11/15/2068 (C) | 1,271 | 1,305 | ||||||
Navient Private Education Refi Loan Trust, Ser 2020-A, Cl A2B | ||||||||
1.006%, VAR ICE LIBOR USD 1 | ||||||||
Month+0.900%, 11/15/2068 (C) | 836 | 833 | ||||||
Navient Private Education Refi Loan Trust, Ser 2020-BA, Cl A1 | ||||||||
1.800%, 01/15/2069 (C) | 124 | 124 | ||||||
Navient Private Education Refi Loan Trust, Ser 2020-BA, Cl A2 | ||||||||
2.120%, 01/15/2069 (C) | 748 | 761 | ||||||
Navient Private Education Refi Loan Trust, Ser 2020-DA, Cl A | ||||||||
1.690%, 05/15/2069 (C) | 902 | 911 | ||||||
Navient Private Education Refi Loan Trust, Ser 2020-GA, Cl A | ||||||||
1.170%, 09/16/2069 (C) | 2,240 | 2,248 | ||||||
Navient Private Education Refi Loan Trust, Ser 2020-HA, Cl A | ||||||||
1.310%, 01/15/2069 (C) | 1,789 | 1,800 | ||||||
90 | SEI Institutional Managed Trust / Semi-Annual Report / March 31, 2021 |
��
| Description | Face Amount (Thousands) | Market Value ($ Thousands) | ||||||
ASSET-BACKED SECURITIES (continued) |
| |||||||
Navient Private Education Refi Loan Trust, Ser 2021-A, Cl A | ||||||||
0.840%, 05/15/2069 (C) | $ | 208 | $ | 207 | ||||
Navient Private Education Refi Loan Trust, Ser 2021-BA, Cl A | ||||||||
0.940%, 07/15/2069 (C) | 3,305 | 3,302 | ||||||
Navient Student Loan Trust, Ser 2014-1, Cl A3 | ||||||||
0.619%, VAR ICE LIBOR USD 1 Month+0.510%, 06/25/2031 | 2,788 | 2,767 | ||||||
Navient Student Loan Trust, Ser 2014-3, Cl A | ||||||||
0.729%, VAR ICE LIBOR USD 1 Month+0.620%, 03/25/2083 | 2,344 | 2,315 | ||||||
Navient Student Loan Trust, Ser 2014-4, Cl A | ||||||||
0.729%, VAR ICE LIBOR USD 1 Month+0.620%, 03/25/2083 | 1,597 | 1,598 | ||||||
Navient Student Loan Trust, Ser 2016-2A, Cl A3 | ||||||||
1.609%, VAR ICE LIBOR USD 1 Month+1.500%, | 1,270 | 1,317 | ||||||
Navient Student Loan Trust, Ser 2017-1A, Cl A3 | ||||||||
1.259%, VAR ICE LIBOR USD 1 Month+1.150%, | 1,000 | 1,018 | ||||||
Navient Student Loan Trust, Ser 2017-3A, Cl A3 | ||||||||
1.159%, VAR ICE LIBOR USD 1 Month+1.050%, | 2,900 | 2,947 | ||||||
Navient Student Loan Trust, Ser 2019-BA, Cl A2A | ||||||||
3.390%, 12/15/2059 (C) | 1,406 | 1,482 | ||||||
Navient Student Loan Trust, Ser 2020-2A, Cl A1A | ||||||||
1.320%, 08/26/2069 (C) | 1,612 | 1,576 | ||||||
Navient Student Loan Trust, Ser 2021-1A, Cl A1A | ||||||||
1.310%, 12/26/2069 (C) | 575 | 563 | ||||||
Nelnet Student Loan Trust, Ser 2004-3, Cl A5 | ||||||||
0.398%, VAR ICE LIBOR USD 3 Month+0.180%, 10/27/2036 | 583 | 575 | ||||||
Nelnet Student Loan Trust, Ser 2004-4, Cl A5 | ||||||||
0.378%, VAR ICE LIBOR USD 3 Month+0.160%, 01/25/2037 | 991 | 979 | ||||||
Nelnet Student Loan Trust, Ser 2005-1, Cl A5 | ||||||||
0.328%, VAR ICE LIBOR USD 3 Month+0.110%, 10/25/2033 | 3,428 | 3,381 | ||||||
Nelnet Student Loan Trust, Ser 2005-2, Cl A5 | ||||||||
0.287%, VAR ICE LIBOR USD 3 Month+0.100%, 03/23/2037 | 2,931 | 2,854 | ||||||
| Description | Face Amount (Thousands) | Market Value ($ Thousands) | ||||||
ASSET-BACKED SECURITIES (continued) |
| |||||||
Nelnet Student Loan Trust, Ser 2005-3, Cl A5 | ||||||||
0.307%, VAR ICE LIBOR USD 3 Month+0.120%, 12/24/2035 | $ | 2,895 | $ | 2,859 | ||||
Nelnet Student Loan Trust, Ser 2005-4, Cl A4 | ||||||||
0.367%, VAR ICE LIBOR USD 3 Month+0.180%, 03/22/2032 | 455 | 439 | ||||||
Nelnet Student Loan Trust, Ser 2007-2A, Cl A3L | ||||||||
0.551%, VAR ICE LIBOR USD 3 Month+0.350%, 03/25/2026 (C) | 44 | 44 | ||||||
Nelnet Student Loan Trust, Ser 2014-2A, Cl A3 | ||||||||
0.959%, VAR ICE LIBOR USD 1 Month+0.850%, 07/27/2037 (C) | 950 | 954 | ||||||
Nelnet Student Loan Trust, Ser 2014-4A, Cl A2 | ||||||||
1.059%, VAR ICE LIBOR USD 1 Month+0.950%, 11/25/2048 (C) | 2,155 | 2,191 | ||||||
Neuberger Berman Loan Advisers CLO 40, Ser 2021-40A, Cl A | ||||||||
1.248%, VAR ICE LIBOR USD 3 Month+1.060%, 04/16/2033 (C) | 1,825 | 1,825 | ||||||
Oak Street Investment Grade Net Lease Fund, Ser 2020-1A, Cl A1 | ||||||||
1.850%, 11/20/2050 (C) | 1,113 | 1,118 | ||||||
Octagon Investment Partners 50, Ser 2020- 4A, Cl A1 | ||||||||
1.470%, VAR ICE LIBOR USD 3 Month+1.300%, 10/15/2033 (C) | 1,725 | 1,728 | ||||||
Octagon Investment Partners XIV, Ser 2021- 1A, Cl AARR | ||||||||
1.060%, VAR ICE LIBOR USD 3 Month+0.950%, 07/15/2029 (C) | 3,200 | 3,199 | ||||||
Orange Lake Timeshare Trust, Ser 2019-A, Cl A | ||||||||
3.060%, 04/09/2038 (C) | 809 | 841 | ||||||
Origen Manufactured Housing, Ser 2006-A, Cl A2 | ||||||||
2.090%, 10/15/2037 (B) | 929 | 898 | ||||||
Parliament Funding II ltd, Ser 2020-1A, Cl A | ||||||||
2.674%, VAR ICE LIBOR USD 3 Month+2.450%, 08/12/2030 (C) | 825 | 828 | ||||||
PFCA Home Equity Investment Trust, Ser 2004-GP2, Cl A | ||||||||
3.475%, 08/25/2035 (B)(C) | 1,248 | 1,240 | ||||||
RAMP Trust, Ser 2006-RZ3, Cl M1 | ||||||||
0.459%, VAR ICE LIBOR USD 1 Month+0.350%, 08/25/2036 | 5,897 | 5,754 | ||||||
Rockford Tower CLO, Ser 2019-2A, Cl A | ||||||||
1.512%, VAR ICE LIBOR USD 3 Month+1.330%, 08/20/2032 (C) | 3,150 | 3,155 | ||||||
SEI Institutional Managed Trust / Semi-Annual Report / March 31, 2021 | 91 |
SCHEDULE OF INVESTMENTS (Unaudited)
March 31, 2021
Core Fixed Income Fund (Continued)
| Description | Face Amount (Thousands) | Market Value ($ Thousands) | ||||||
ASSET-BACKED SECURITIES (continued) |
| |||||||
SBA Small Business Investment, Ser 2018- 10B, Cl 1 | ||||||||
3.548%, 09/10/2028 | $ | 1,149 | $ | 1,230 | ||||
SBA Small Business Investment, Ser 2019- 10A, Cl 1 | ||||||||
3.113%, 03/10/2029 | 694 | 738 | ||||||
SLM Private Credit Student Loan Trust, Ser 2004-B, Cl A3 | ||||||||
0.514%, VAR ICE LIBOR USD 3 Month+0.330%, 03/15/2024 | 447 | 446 | ||||||
SLM Private Credit Student Loan Trust, Ser 2005-A, Cl A4 | ||||||||
0.494%, VAR ICE LIBOR USD 3 Month+0.310%, 12/15/2038 | 1,399 | 1,378 | ||||||
SLM Student Loan Trust, Ser 2003-1, Cl A5C | ||||||||
0.934%, VAR ICE LIBOR USD 3 Month+0.750%, | 674 | 660 | ||||||
SLM Student Loan Trust, Ser 2003-7A, Cl A5A | ||||||||
1.384%, VAR ICE LIBOR USD 3 Month+1.200%, | 2,183 | 2,185 | ||||||
SLM Student Loan Trust, Ser 2005-4, Cl A4 | ||||||||
0.388%, VAR ICE LIBOR USD 3 Month+0.170%, 07/25/2040 | 3,000 | 2,919 | ||||||
SLM Student Loan Trust, Ser 2006-8, Cl A6 | ||||||||
0.378%, VAR ICE LIBOR USD 3 Month+0.160%, 01/25/2041 | 2,440 | 2,387 | ||||||
SLM Student Loan Trust, Ser 2007-2, Cl A4 | ||||||||
0.278%, VAR ICE LIBOR USD 3 Month+0.060%, 07/25/2022 | 2,941 | 2,839 | ||||||
SLM Student Loan Trust, Ser 2007-3, Cl A4 | ||||||||
0.278%, VAR ICE LIBOR USD 3 Month+0.060%, 01/25/2022 | 848 | 819 | ||||||
SLM Student Loan Trust, Ser 2007-7, Cl B | ||||||||
0.968%, VAR ICE LIBOR USD 3 Month+0.750%, 10/27/2070 | 1,050 | 951 | ||||||
SLM Student Loan Trust, Ser 2008-2, Cl A3 | ||||||||
0.968%, VAR ICE LIBOR USD 3 Month+0.750%, 04/25/2023 | 803 | 789 | ||||||
SLM Student Loan Trust, Ser 2008-2, Cl B | ||||||||
1.418%, VAR ICE LIBOR USD 3 Month+1.200%, 01/25/2083 | 685 | 611 | ||||||
SLM Student Loan Trust, Ser 2008-3, Cl B | ||||||||
1.418%, VAR ICE LIBOR USD 3 Month+1.200%, 04/26/2083 | 685 | 639 | ||||||
SLM Student Loan Trust, Ser 2008-4, Cl A4 | ||||||||
1.868%, VAR ICE LIBOR USD 3 Month+1.650%, 07/25/2022 | 632 | 637 | ||||||
SLM Student Loan Trust, Ser 2008-4, Cl B | ||||||||
2.068%, VAR ICE LIBOR USD 3 Month+1.850%, 04/25/2073 | 685 | 677 | ||||||
| Description | Face Amount (Thousands) | Market Value ($ Thousands) | ||||||
ASSET-BACKED SECURITIES (continued) |
| |||||||
SLM Student Loan Trust, Ser 2008-5, Cl A4 | ||||||||
1.918%, VAR ICE LIBOR USD 3 Month+1.700%, 07/25/2023 | $ | 108 | $ | 109 | ||||
SLM Student Loan Trust, Ser 2008-5, Cl B | ||||||||
2.068%, VAR ICE LIBOR USD 3 Month+1.850%, 07/25/2073 | 685 | 672 | ||||||
SLM Student Loan Trust, Ser 2008-6, Cl A4 | ||||||||
1.318%, VAR ICE LIBOR USD 3 Month+1.100%, 07/25/2023 | 3,161 | 3,161 | ||||||
SLM Student Loan Trust, Ser 2008-6, Cl B | ||||||||
2.068%, VAR ICE LIBOR USD 3 Month+1.850%, 07/26/2083 | 685 | 672 | ||||||
SLM Student Loan Trust, Ser 2008-7, Cl B | ||||||||
2.068%, VAR ICE LIBOR USD 3 Month+1.850%, 07/26/2083 | 685 | 681 | ||||||
SLM Student Loan Trust, Ser 2008-8, Cl B | ||||||||
2.468%, VAR ICE LIBOR USD 3 Month+2.250%, 10/25/2075 | 685 | 694 | ||||||
SLM Student Loan Trust, Ser 2008-9, Cl A | ||||||||
1.718%, VAR ICE LIBOR USD 3 Month+1.500%, 04/25/2023 | 1,339 | 1,349 | ||||||
SLM Student Loan Trust, Ser 2008-9, Cl B | ||||||||
2.468%, VAR ICE LIBOR USD 3 Month+2.250%, 10/25/2083 | 685 | 690 | ||||||
SLM Student Loan Trust, Ser 2009-3, Cl A | ||||||||
0.859%, VAR ICE LIBOR USD 1 Month+0.750%, 01/25/2045 (C) | 555 | 561 | ||||||
SLM Student Loan Trust, Ser 2010-1, Cl A | ||||||||
0.509%, VAR ICE LIBOR USD 1 Month+0.400%, 03/25/2025 | 357 | 351 | ||||||
SLM Student Loan Trust, Ser 2012-1, Cl A3 | ||||||||
1.059%, VAR ICE LIBOR USD 1 Month+0.950%, 09/25/2028 | 1,825 | 1,802 | ||||||
SLM Student Loan Trust, Ser 2012-2, Cl A | ||||||||
0.809%, VAR ICE LIBOR USD 1 Month+0.700%, 01/25/2029 | 1,560 | 1,512 | ||||||
SLM Student Loan Trust, Ser 2012-6, Cl A3 | ||||||||
0.859%, VAR ICE LIBOR USD 1 Month+0.750%, 05/26/2026 | 337 | 334 | ||||||
SMB Private Education Loan Trust, Ser 2016-A, Cl A2A | ||||||||
2.700%, 05/15/2031 (C) | 932 | 959 | ||||||
SMB Private Education Loan Trust, Ser 2016-B, Cl A2A | ||||||||
2.430%, 02/17/2032 (C) | 464 | 475 | ||||||
SMB Private Education Loan Trust, Ser 2016-B, Cl A2B | ||||||||
1.556%, VAR ICE LIBOR USD 1 Month+1.450%, 02/17/2032 (C) | 1,490 | 1,505 | ||||||
SMB Private Education Loan Trust, Ser 2016-C, Cl A2B | ||||||||
1.206%, VAR ICE LIBOR USD 1 Month+1.100%, 09/15/2034 (C) | 483 | 487 | ||||||
92 | SEI Institutional Managed Trust / Semi-Annual Report / March 31, 2021 |
| Description | Face Amount (Thousands) | Market Value ($ Thousands) | ||||||
ASSET-BACKED SECURITIES (continued) |
| |||||||
SMB Private Education Loan Trust, Ser 2018-C, Cl A2A | ||||||||
3.630%, 11/15/2035 (C) | $ | 559 | $ | 590 | ||||
SMB Private Education Loan Trust, Ser 2019-A, Cl A2A | ||||||||
3.440%, 07/15/2036 (C) | 2,505 | 2,658 | ||||||
SMB Private Education Loan Trust, Ser 2020-B, Cl A1A | ||||||||
1.290%, 07/15/2053 (C) | 1,733 | 1,736 | ||||||
SMB Private Education Loan Trust, Ser 2020-PTA, Cl A2A | ||||||||
1.600%, 09/15/2054 (C) | 1,669 | 1,679 | ||||||
SMB Private Education Loan Trust, Ser 2020-PTB, Cl A2A | ||||||||
1.600%, 09/15/2054 (C) | 4,353 | 4,369 | ||||||
SMB Private Education Loan Trust, Ser 2021-A, Cl APT1 | ||||||||
1.070%, 01/15/2053 (C) | 7,127 | 7,029 | ||||||
SoFi Consumer Loan Program Trust, Ser 2017-4, Cl A | ||||||||
2.500%, 05/26/2026 (C) | 19 | 19 | ||||||
SoFi Consumer Loan Program Trust, Ser 2017-6, Cl A2 | ||||||||
2.820%, 11/25/2026 (C) | 24 | 24 | ||||||
SoFi Consumer Loan Program Trust, Ser 2019-4, Cl A | ||||||||
2.450%, 08/25/2028 (C) | 627 | 632 | ||||||
SoFi Professional Loan Program Trust, Ser 2020-A, Cl A2FX | ||||||||
2.540%, 05/15/2046 (C) | 1,293 | 1,330 | ||||||
SoFi Professional Loan Program Trust, Ser 2020-C, Cl AFX | ||||||||
1.950%, 02/15/2046 (C) | 1,206 | 1,225 | ||||||
SoFi Professional Loan Program, Ser 2016- D, Cl A1 | ||||||||
1.059%, VAR ICE LIBOR USD 1 Month+0.950%, | �� | 49 | 49 | |||||
SoFi Professional Loan Program, Ser 2016- E, Cl A1 | ||||||||
0.959%, VAR ICE LIBOR USD 1 Month+0.850%, | 79 | 79 | ||||||
SoFi Professional Loan Program, Ser 2017- A, Cl A1 | ||||||||
0.809%, VAR ICE LIBOR USD 1 Month+0.700%, | 97 | 97 | ||||||
SoFi Professional Loan Program, Ser 2017- E, Cl A1 | ||||||||
0.609%, VAR ICE LIBOR USD 1 Month+0.500%, | 39 | 39 | ||||||
SoFi Professional Loan Program, Ser 2018- A, Cl A2B | ||||||||
2.950%, 02/25/2042 (C) | 391 | 399 | ||||||
| Description | Face Amount (Thousands) | Market Value ($ Thousands) | ||||||
ASSET-BACKED SECURITIES (continued) |
| |||||||
South Carolina Student Loan, Ser 2015-A, Cl A | ||||||||
1.609%, VAR ICE LIBOR USD 1 Month+1.500%, 01/25/2036 | $ | 951 | $ | 960 | ||||
Stack Infrastructure Issuer, Ser 2020-1A, Cl A2 | ||||||||
1.893%, 08/25/2045 (C) | 1,355 | 1,358 | ||||||
Structured Asset Investment Loan Trust, Ser 2004-8, Cl A2 | ||||||||
0.659%, VAR ICE LIBOR USD 1 Month+0.550%, 09/25/2034 | 463 | 449 | ||||||
Structured Asset Investment Loan Trust, Ser 2005-HE1, Cl M1 | ||||||||
0.814%, VAR ICE LIBOR USD 1 Month+0.705%, 07/25/2035 | 7 | 7 | ||||||
Structured Asset Securities Mortgage Loan Trust, Ser 2007-WF1, Cl A1 | ||||||||
0.319%, VAR ICE LIBOR USD 1 Month+0.210%, 02/25/2037 | 3,962 | 3,777 | ||||||
STWD, Ser 2019-FL1, Cl A | ||||||||
1.186%, VAR ICE LIBOR USD 1 Month+1.080%, 07/15/2038 (C) | 100 | 100 | ||||||
Sunrun Vulcan Issuer, Ser 2021-1A, Cl A | ||||||||
2.460%, 01/30/2052 (C) | 730 | 725 | ||||||
Symphony CLO XIX, Ser 2018-19A, Cl A | ||||||||
1.183%, VAR ICE LIBOR USD 3 Month+0.960%, 04/16/2031 (C) | 1,700 | 1,700 | ||||||
Symphony CLO XXVI, Ser 2021-26A, Cl AR | ||||||||
1.189%, VAR ICE LIBOR USD 3 Month+1.080%, 04/20/2033 (C) | 1,140 | 1,140 | ||||||
TCI-Flatiron CLO, Ser 2021-1A, Cl AR2 | ||||||||
1.386%, VAR ICE LIBOR USD 3 Month+1.150%, 01/17/2032 (C) | 1,500 | 1,501 | ||||||
Towd Point Mortgage Trust, Ser 2015-5, Cl A1B | ||||||||
2.750%, 05/25/2055 (B)(C) | 66 | 66 | ||||||
Towd Point Mortgage Trust, Ser 2017-4, Cl A1 | ||||||||
2.750%, 06/25/2057 (B)(C) | 1,270 | 1,310 | ||||||
Towd Point Mortgage Trust, Ser 2017-5, Cl A1 | ||||||||
0.709%, VAR ICE LIBOR USD 1 Month+0.600%, 02/25/2057 (C) | 785 | 785 | ||||||
Towd Point Mortgage Trust, Ser 2017-6, Cl M1 | ||||||||
3.250%, 10/25/2057 (B)(C) | 1,050 | 1,097 | ||||||
Towd Point Mortgage Trust, Ser 2019-4, Cl A1 | ||||||||
2.900%, 10/25/2059 (B)(C) | 1,254 | 1,310 | ||||||
Towd Point Mortgage Trust, Ser 2019-HY2, Cl A1 | ||||||||
1.109%, VAR ICE LIBOR USD 1 Month+1.000%, 05/25/2058 (C) | 1,092 | 1,101 | ||||||
SEI Institutional Managed Trust / Semi-Annual Report / March 31, 2021 | 93 |
SCHEDULE OF INVESTMENTS (Unaudited)
March 31, 2021
Core Fixed Income Fund (Continued)
| Description | Face Amount (Thousands) | Market Value ($ Thousands) | ||||||
ASSET-BACKED SECURITIES (continued) |
| |||||||
Towd Point Mortgage Trust, Ser 2019-MH1, Cl A1 | ||||||||
3.000%, 11/25/2058 (B)(C) | $ | 590 | $ | 604 | ||||
Towd Point Mortgage Trust, Ser 2020-3, Cl A1 | ||||||||
3.088%, 02/25/2063 (B)(C) | 1,709 | 1,772 | ||||||
TPG Real Estate Finance Issuer, Ser 2018-FL2, Cl A | ||||||||
1.238%, VAR ICE LIBOR USD 1 Month+1.130%, | 3,967 | 3,976 | ||||||
Trinity Rail Leasing, Ser 2020-2A, Cl A2 | ||||||||
2.560%, 11/19/2050 (C) | 955 | �� | 979 | |||||
Triton Container Finance VIII, Ser 2020-1A, Cl A | ||||||||
2.110%, 09/20/2045 (C) | 397 | 394 | ||||||
United States Small Business | ||||||||
Administration, Ser 2019-20D, Cl 1 | ||||||||
2.980%, 04/01/2039 | 213 | 223 | ||||||
United States Small Business | ||||||||
Administration, Ser 2019-25G, Cl 1 | ||||||||
2.690%, 07/01/2044 | 373 | 387 | ||||||
Venture XXV CLO, Ser 2021-25A, Cl BR | ||||||||
1.924%, VAR ICE LIBOR USD 3 Month+1.700%, | 925 | 924 | ||||||
Venture XXVI CLO, Ser 2021-26A, Cl BR | ||||||||
1.924%, VAR ICE LIBOR USD 3 Month+1.700%, | 500 | 500 | ||||||
Verizon Owner Trust, Ser 2019-C, Cl A1A | ||||||||
1.940%, 04/22/2024 | 96 | 98 | ||||||
Wells Fargo Home Equity Asset-Backed | ||||||||
Securities Trust, Ser 2006-2, Cl M2 | ||||||||
0.399%, VAR ICE LIBOR USD 1 Month+0.290%, 07/25/2036 | 6,442 | 6,247 | ||||||
Zais CLO, Ser 2020-16A, Cl A2 | ||||||||
2.590%, VAR ICE LIBOR USD 3 Month+2.300%, | 1,525 | 1,527 | ||||||
|
|
| ||||||
| 241,873 | ||||||||
|
|
| ||||||
Total Asset-Backed Securities |
| 303,818 | ||||||
|
|
| ||||||
SOVEREIGN DEBT — 2.3% |
| |||||||
Abu Dhabi Government International Bond | ||||||||
3.875%, 04/16/2050 (C) | 2,170 | 2,356 | ||||||
2.500%, 10/11/2022 (C) | 1,010 | 1,041 | ||||||
2.500%, 04/16/2025 (C) | 1,151 | 1,213 | ||||||
Argentine Republic Government International Bond | ||||||||
1.000%, 07/09/2029 | 203 | 73 | ||||||
0.125%, 0.500%, 07/09/2021, | ||||||||
07/09/2030 (F) | 1,216 | 407 | ||||||
| Description | Face Amount (Thousands) | Market Value ($ Thousands) | ||||||
SOVEREIGN DEBT (continued) |
| |||||||
0.125%, 1.125%, 07/09/2021, 07/09/2035 (F) | $ | 2,557 | $ | 764 | ||||
0.125%, 2.500%, 07/09/2021, 07/09/2041 (F) | 1,460 | 503 | ||||||
Brazil Notas do Tesouro Nacional | ||||||||
10.000%, 01/01/2025 | BRL | 20,585 | 3,849 | |||||
Brazil Notas do Tesouro Nacional, Ser F | ||||||||
10.000%, 01/01/2023 | 3,994 | 745 | ||||||
10.000%, 01/01/2027 | 2,571 | 478 | ||||||
Brazilian Government International Bond | ||||||||
5.625%, 01/07/2041 | $ | 1,120 | 1,161 | |||||
5.000%, 01/27/2045 | 3,400 | 3,219 | ||||||
4.625%, 01/13/2028 (D) | 2,890 | 3,052 | ||||||
2.625%, 01/05/2023 | 200 | 206 | ||||||
China Government Bond | ||||||||
3.390%, 05/21/2025 | CNY | 2,000 | 313 | |||||
3.310%, 11/30/2025 | 11,500 | 1,795 | ||||||
Colombia Government International Bond | ||||||||
5.625%, 02/26/2044 | $ | 660 | 748 | |||||
5.000%, 06/15/2045 | 830 | 882 | ||||||
3.875%, 02/15/2061 | 1,040 | 931 | ||||||
Egypt Government International Bond | ||||||||
5.577%, 02/21/2023 (C) | 410 | 427 | ||||||
Export-Import Bank of India | ||||||||
3.375%, 08/05/2026 (C) | 350 | 371 | ||||||
Indonesia Government International Bond | ||||||||
5.875%, 01/15/2024 (C) | 840 | 950 | ||||||
5.250%, 01/08/2047 (C) | 400 | 483 | ||||||
5.125%, 01/15/2045 (C) | 400 | 474 | ||||||
4.350%, 01/11/2048 | 460 | 499 | ||||||
3.850%, 07/18/2027 (C) | 800 | 877 | ||||||
3.750%, 04/25/2022 (C) | 740 | 763 | ||||||
3.700%, 10/30/2049 | 1,550 | 1,574 | ||||||
3.500%, 01/11/2028 | 400 | 429 | ||||||
Israel Government International Bond | ||||||||
3.375%, 01/15/2050 | 280 | 283 | ||||||
2.750%, 07/03/2030 | 470 | 492 | ||||||
Italy Buoni Poliennali Del Tesoro | ||||||||
2.300%, 10/15/2021 | EUR | 12,390 | 14,775 | |||||
Japan Bank for International Cooperation | ||||||||
1.750%, 10/17/2024 | $ | 950 | 987 | |||||
Kenya Government International Bond | ||||||||
7.250%, 02/28/2028 (C) | 200 | 210 | ||||||
6.875%, 06/24/2024 | 200 | 220 | ||||||
Kuwait International Government Bond | ||||||||
3.500%, 03/20/2027 (C) | 930 | 1,026 | ||||||
Mexico Government International Bond | ||||||||
6.050%, 01/11/2040 | 1,210 | 1,448 | ||||||
4.750%, 03/08/2044 | 10,498 | 11,024 | ||||||
4.600%, 02/10/2048 | 337 | 343 | ||||||
4.500%, 04/22/2029 | 1,445 | 1,601 | ||||||
4.350%, 01/15/2047 | 400 | 395 | ||||||
94 | SEI Institutional Managed Trust / Semi-Annual Report / March 31, 2021 |
| Description | Face Amount (Thousands) | Market Value ($ Thousands) | ||||||
SOVEREIGN DEBT (continued) |
| |||||||
3.750%, 01/11/2028 | $ | 390 | $ | 417 | ||||
3.600%, 01/30/2025 | 3,300 | 3,586 | ||||||
2.659%, 05/24/2031 | 2,504 | 2,360 | ||||||
Nigeria Government International Bond | ||||||||
7.143%, 02/23/2030 (C) | 240 | 244 | ||||||
6.500%, 11/28/2027 (C) | 220 | 227 | ||||||
Panama Government International Bond | ||||||||
4.500%, 04/01/2056 | 540 | 589 | ||||||
2.252%, 09/29/2032 | 620 | 589 | ||||||
Paraguay Government International Bond | ||||||||
5.400%, 03/30/2050 (C) | 664 | 748 | ||||||
2.739%, 01/29/2033 (C) | 477 | 458 | ||||||
Peruvian Government International Bond | ||||||||
5.625%, 11/18/2050 | 600 | 791 | ||||||
3.300%, 03/11/2041 | 821 | 796 | ||||||
2.783%, 01/23/2031 | 2,292 | 2,290 | ||||||
2.392%, 01/23/2026 | 657 | 675 | ||||||
Province of Quebec Canada | ||||||||
2.625%, 02/13/2023 | 620 | 647 | ||||||
Provincia de Buenos Aires | ||||||||
9.125%, 03/16/2024 (C)(H) | 230 | 88 | ||||||
7.875%, 06/15/2027 (C)(H) | 250 | 95 | ||||||
6.500%, 02/15/2023 (C)(H) | 300 | 110 | ||||||
Qatar Government International Bond | ||||||||
4.817%, 03/14/2049 (C) | 1,640 | 2,007 | ||||||
4.000%, 03/14/2029 (C) | 880 | 999 | ||||||
3.875%, 04/23/2023 | 430 | 458 | ||||||
3.250%, 06/02/2026 | 200 | 217 | ||||||
Republic of Poland Government | ||||||||
International Bond | ||||||||
5.000%, 03/23/2022 | 100 | 104 | ||||||
4.000%, 01/22/2024 | 1,327 | 1,453 | ||||||
Russian Federal Bond - OFZ |
| |||||||
8.150%, 02/03/2027 | RUB | 315,940 | 4,481 | |||||
7.700%, 03/16/2039 | 162,070 | 2,281 | ||||||
7.650%, 04/10/2030 | 63,630 | 883 | ||||||
7.250%, 05/10/2034 | 24,200 | 327 | ||||||
7.000%, 01/25/2023 | 34,160 | 463 | ||||||
7.000%, 08/16/2023 | 231,430 | 3,144 | ||||||
6.900%, 05/23/2029 | 452,100 | 5,978 | ||||||
Russian Foreign Bond - Eurobond | ||||||||
7.500%, 03/31/2030 | $ | 458 | 529 | |||||
5.625%, 04/04/2042 | 2,000 | 2,449 | ||||||
4.875%, 09/16/2023 | 200 | 218 | ||||||
Saudi Government International Bond MTN | ||||||||
2.875%, 03/04/2023 (C) | 360 | 374 | ||||||
|
|
| ||||||
Total Sovereign Debt |
| 104,462 | ||||||
|
|
| ||||||
| Description | Face Amount (Thousands) | Market Value ($ Thousands) | ||||||
LOAN PARTICIPATIONS — 1.5% |
| |||||||
Allied Universal Holdco LLC (f/k/a USAGM Holdco, LLC), Initial Term Loan, 1st Lien | ||||||||
4.365%, VAR LIBOR+4.250%, 07/10/2026 | $ | 1,264 | $ | 1,260 | ||||
Alterra Mountain Company, Initial Bluebird Term Loan, 1st Lien | ||||||||
2.865%, VAR LIBOR+2.750%, 07/31/2024 | 568 | 558 | ||||||
AMWINS Group Inc. | ||||||||
3.000%, 02/19/2028 | 450 | 446 | ||||||
APi Group DE, Inc., Initial Term Loan, 1st Lien | ||||||||
2.615%, VAR LIBOR+2.500%, 10/01/2026 (I) | 894 | 889 | ||||||
Aramark Intermediate HoldCo Corp., Term Loan B, 1st Lien | ||||||||
1.865%, 01/15/2027 | 134 | 132 | ||||||
1.865%, VAR LIBOR+1.750%, 03/11/2025 | 274 | 270 | ||||||
AsplundhTree Expert, LLC | ||||||||
1.853%, 09/07/2027 (I) | 419 | 418 | ||||||
Asurion, LLC, New B-7 Term Loan, 1st Lien | ||||||||
3.115%, VAR LIBOR+3.000%, | ||||||||
11/03/2024 | 569 | 567 | ||||||
Asurion, LLC, New B-8 Term Loan, 1st Lien | ||||||||
3.365%, VAR LIBOR+3.250%, | ||||||||
12/23/2026 (I) | 333 | 331 | ||||||
Asurion, LLC, New B-9 Term Loan, 1st Lien | ||||||||
3.365%, VAR LIBOR+3.250%, 07/31/2027 | 380 | 377 | ||||||
athenahealth, Inc., Term B-1 Loan, 1st Lien | ||||||||
4.453%, VAR LIBOR+4.250%, | ||||||||
02/11/2026 | 1,715 | 1,716 | ||||||
Atlantic Aviation FBO, Term Loan B, 1st Lien | ||||||||
3.870%, 12/06/2025 | 157 | 157 | ||||||
Avolon TLB Borro | ||||||||
2.611%, 12/01/2027 | 280 | 280 | ||||||
B.C. Unlimited Liability Company | ||||||||
1.865%, VAR LIBOR+1.750%, 11/19/2026 | 1,458 | 1,430 | ||||||
Bausch Health Companies Inc., Initial Term Loan, 1st Lien | ||||||||
3.115%, VAR LIBOR+3.000%, 06/02/2025 | 721 | 718 | ||||||
Bausch Health Companies Inc., Term Loan, 1st Lien | ||||||||
2.865%, 11/27/2025 | 394 | 391 | ||||||
Berry Global, Inc. | ||||||||
1.898%, 07/01/2026 | �� | 671 | 665 | |||||
BJ’s Wholesale Club, Term Loan B, 1st Lien | ||||||||
2.106%, VAR LIBOR+2.000%, 02/03/2024 | 124 | 124 | ||||||
SEI Institutional Managed Trust / Semi-Annual Report / March 31, 2021 | 95 |
SCHEDULE OF INVESTMENTS (Unaudited)
March 31, 2021
Core Fixed Income Fund (Continued)
| Description | Face Amount (Thousands) | Market Value ($ Thousands) | ||||||
LOAN PARTICIPATIONS (continued) |
| |||||||
Brightview Landscapes LLC, Initial Term Loan, 1st Lien | ||||||||
2.625%, 08/15/2025 | $ | 156 | $ | 155 | ||||
Brookfeild WEC Holdings | ||||||||
3.250%, 08/01/2025 | 229 | 227 | ||||||
Caesars Resort Collection, LLC, Term B Loan, 1st Lien | ||||||||
2.865%, VAR LIBOR+2.750%, 12/23/2024 | 937 | 922 | ||||||
Caesars Resort Collection, LLC, Term B-1 Loan, 1st Lien | ||||||||
4.615%, VAR LIBOR+4.500%, 07/21/2025 | 618 | 619 | ||||||
Change Healthcare Holdings, Inc. (fka Emdeon Inc.), Closing Date Term Loan, 1st Lien | ||||||||
3.500%, VAR LIBOR+2.500%, 03/01/2024 | 1,397 | 1,396 | ||||||
Charter Communications Operating Llc Lien1 | ||||||||
1.870%, 04/30/2025 (I) | 1,060 | 1,057 | ||||||
Charter Communications Operating, LLC, Term B-2 Loan, 1st Lien | ||||||||
1.870%, VAR LIBOR+1.750%, 02/01/2027 | 160 | 159 | ||||||
Citadel Securities, LP, Term Loan, 1st Lien | ||||||||
2.615%, 02/02/2028 | 691 | 683 | ||||||
CityCenter Holdings, LLC , Term B Loan, 1st Lien | ||||||||
3.000%, VAR LIBOR+2.250%, 04/18/2024 | 715 | 705 | ||||||
Clarios Global | ||||||||
3.350%, 04/30/2026 | 397 | 393 | ||||||
Clarios Global LP, Initial Dollar Term Loan, 1st Lien | ||||||||
3.615%, VAR LIBOR+3.500%, 04/30/2026 | 659 | 652 | ||||||
CSC Holdings, LLC | ||||||||
2.606%, VAR LIBOR+2.500%, 04/15/2027 | 218 | 215 | ||||||
DCert Buyer, Inc., Initial Term Loan, 1st Lien | ||||||||
4.115%, VAR LIBOR+4.000%, 10/16/2026 | 1,351 | 1,348 | ||||||
Deerfield Dakota Holding, LLC , Initial Dollar Term Loan, 1st Lien | ||||||||
4.750%, VAR LIBOR+3.750%, 04/09/2027 | 975 | 975 | ||||||
Dell International, LLC | ||||||||
2.000%, 09/19/2025 | 561 | 560 | ||||||
Delta Topco, Inc., Initial Term Loan, 1st Lien | ||||||||
4.500%, VAR LIBOR+3.750%, 12/01/2027 | 250 | 249 | ||||||
| Description | Face Amount (Thousands) | Market Value ($ Thousands) | ||||||
LOAN PARTICIPATIONS (continued) |
| |||||||
Endo Luxembourg Finance Company S.a.r.l, Term Loan, 1st Lien | ||||||||
5.750%, 03/27/2028 (I) | $ | 239 | $ | 237 | ||||
Energizer Holdings | ||||||||
2.750%, 12/22/2027 | 210 | 209 | ||||||
Entercom Media Corp., Term B-2 Loan, 1st Lien | ||||||||
2.609%, VAR LIBOR+2.500%, 11/18/2024 | 25 | 24 | ||||||
EyeCare Partners, LLC, Term Loan, 1st Lien | ||||||||
3.865%, VAR LIBOR+3.750%, 02/18/2027 | 308 | 305 | ||||||
First Eagle Holdings, Term Loan | ||||||||
2.754%, 02/01/2027 | 264 | 261 | ||||||
Focus Financial Partnersm LLC, Tranche B-3, Term Loan, 1st Lien | ||||||||
2.115%, VAR LIBOR+2.000%, 07/03/2024 | 601 | 594 | ||||||
Formula One Management Limited, Facility B3 (USD), 1st Lien | ||||||||
3.500%, VAR LIBOR+2.500%, 02/01/2024 | 50 | 49 | ||||||
Four Seasons Holdings Inc., Term Loan 2013, 1st Lien | ||||||||
2.115%, 11/30/2023 | 600 | 598 | ||||||
Froneri International Limited, Facility B1, Term Loan, 1st Lien | ||||||||
2.365%, VAR LIBOR+2.250%, 01/29/2027 | 437 | 430 | ||||||
Garda World Security Corp | ||||||||
4.360%, 10/30/2026 | 268 | 268 | ||||||
Genesee & Wyoming Inc., Initial Term Loan, 1st Lien | ||||||||
2.254%, VAR LIBOR+2.000%, 12/30/2026 | 1,392 | 1,387 | ||||||
GFL Environmental, 2020 Refinancing Term Loan, 1st Lien | ||||||||
3.500%, 05/30/2025 | 108 | 108 | ||||||
Global Medical Response, Inc., 2020 Refinancing Term Loan, 1st Lien | ||||||||
5.750%, VAR LIBOR+4.750%, 10/02/2025 | 724 | 721 | ||||||
Go Daddy Operating Company LLC, Term Loan B, 1st Lien | ||||||||
1.865%, 02/15/2024 (B) | 319 | 317 | ||||||
Golden Nugget, Inc., Initial B Term Loan, 1st Lien | ||||||||
3.250%, VAR LIBOR+2.750%, 10/04/2023 (I) | 171 | 168 | ||||||
Great Outdoors Group, LLC, Term B-1 Loan, 1st Lien | ||||||||
5.000%, VAR LIBOR+4.250%, 03/06/2028 | 310 | 310 | ||||||
96 | SEI Institutional Managed Trust / Semi-Annual Report / March 31, 2021 |
| Description | Face Amount (Thousands) | Market Value ($ Thousands) | ||||||
LOAN PARTICIPATIONS (continued) |
| |||||||
Grifols Worldwide Operations Limited, | ||||||||
Dollar Tranche B Term Loan, 1st Lien | ||||||||
2.081%, VAR LIBOR+2.000%, 11/15/2027 | $ | 1,368 | $ | 1,352 | ||||
Harbor Freight Tools USA, Inc., Initial Term Loan (2020), 1st Lien | ||||||||
4.000%, VAR LIBOR+3.000%, 10/19/2027 | 798 | 797 | ||||||
HCA Inc., Tranche B-12, Term Loan | ||||||||
1.865%, 03/13/2025 | 241 | 240 | ||||||
Hilton Worldwide Finance LLC, Refinanced Series B-2 Term Loan, 1st Lien | ||||||||
1.859%, VAR LIBOR+1.750%, 06/22/2026 | 1,348 | 1,335 | ||||||
Horizon Therapeudics | ||||||||
2.500%, 03/15/2028 (I) | 1,040 | 1,036 | ||||||
Hudson River, Term Loan, 1st Lien | ||||||||
0.141%, 03/20/2028 | 450 | 445 | ||||||
iHeartCommunications, Inc. (fka Clear Channel Communications, Inc.), New Term Loan, 1st Lien | ||||||||
3.115%, VAR LIBOR+3.000%, 05/01/2026 | 895 | 883 | ||||||
INEOS Styrolution Group GmbH, 2026 Tranche B Dollar Term Loan, 1st Lien | ||||||||
3.250%, VAR LIBOR+2.750%, 01/29/2026 | 490 | 488 | ||||||
Jane Street Group, LLC, Dollar Term Loan, 1st Lien | ||||||||
2.865%, VAR LIBOR+2.750%, 01/26/2028 | 530 | 524 | ||||||
Level 3 Financing, Inc., Tranche B 2027 Term Loan, 1st Lien | ||||||||
1.865%, VAR LIBOR+1.750%, 03/01/2027 | 1,162 | 1,146 | ||||||
McAfee, LLC, Term B USD Loan | ||||||||
3.865%, VAR LIBOR+3.750%, 09/30/2024 | 1,181 | 1,180 | ||||||
Michaels Stores, Inc., 2020 Refinancing Term B Loan, 1st Lien | ||||||||
4.250%, VAR LIBOR+3.500%, 10/01/2027 | 653 | 651 | ||||||
Micro Focus, MA FinanceCo | ||||||||
2.865%, 06/21/2024 (B) | 11 | 11 | ||||||
Milano Acquisition Corp., Term B Loan, 1st Lien | ||||||||
4.750%, VAR LIBOR+4.000%, 10/01/2027 (I) | 1,360 | 1,353 | ||||||
MPH Acquisition Holdings LLC, Initial Term Loan, 1st Lien | ||||||||
3.750%, VAR LIBOR+2.750%, 06/07/2023 (I) | 640 | 636 | ||||||
| Description | Face Amount (Thousands) | Market Value ($ Thousands) | ||||||
LOAN PARTICIPATIONS (continued) |
| |||||||
Nexstar Broadcasting, Inc., Term B-4 Loan, 1st Lien | ||||||||
2.865%, VAR LIBOR+2.750%, 09/18/2026 | �� | $ | 1,454 | $ | 1,442 | |||
Numericable U.S. LLC, Term Loan B, 1st Lien | ||||||||
3.794%, 01/31/2026 | 214 | 212 | ||||||
Option Care Health, Inc., Term B Loan, 1st Lien | ||||||||
3.865%, VAR LIBOR+3.750%, 08/06/2026 | 535 | 532 | ||||||
Pactiv Evergreen Inc., Tranche B-1 U.S. Term Loan, 1st Lien | ||||||||
2.865%, VAR LIBOR+2.750%, 02/05/2023 (I) | 310 | 309 | ||||||
Parexel International Corporation, Initial Term Loan, 1st Lien | ||||||||
2.865%, VAR LIBOR+2.750%, 09/27/2024 (I) | 610 | 602 | ||||||
PCI Gaming Authority, Term B Facility Loan | ||||||||
2.615%, 05/29/2026 | 465 | 462 | ||||||
Peraton Corp., Delayed Draw Term Loan B, 1st Lien | ||||||||
4.500%, 02/01/2028 (I) | 746 | 745 | ||||||
Peraton Corp., Term B Loan, 1st Lien | ||||||||
4.500%, VAR LIBOR+3.750%, 02/01/2028 | 424 | 424 | ||||||
Petco Health and Wellness Company, Inc., | ||||||||
Initial Term Loan, 1st Lien | ||||||||
4.000%, VAR LIBOR+3.250%, 03/03/2028 (I) | 650 | 647 | ||||||
Phoenix Guarantor Inc., Tranche B-1 Term Loan, 1st Lien | ||||||||
3.361%, VAR LIBOR+3.250%, 03/05/2026 | 1,308 | 1,293 | ||||||
PPD Inc. | ||||||||
2.750%, 01/13/2028 (I) | 1,160 | 1,153 | ||||||
Prime Security Services Borrower, LLC, | ||||||||
2021 Refinancing Term B-1 Loan, 1st Lien | ||||||||
3.500%, VAR LIBOR+2.750%, 09/23/2026 | 970 | 966 | ||||||
Rackspace Technology Global, Inc., 2021 Term B Loan, 1st Lien | ||||||||
3.500%, VAR LIBOR+2.750%, 02/15/2028 (I) | 645 | 639 | ||||||
Realogy Group LLC (fka Realogy Corporation), Extended 2025 Term Loan, 1st Lien | ||||||||
3.000%, VAR LIBOR+2.250%, 02/08/2025 | 26 | 26 | ||||||
Realpage Inc. | ||||||||
0.000%, 02/18/2028 (I) | 1,050 | 1,045 | ||||||
SEI Institutional Managed Trust / Semi-Annual Report / March 31, 2021 | 97 |
SCHEDULE OF INVESTMENTS (Unaudited)
March 31, 2021
Core Fixed Income Fund (Continued)
| Description | Face Amount (Thousands) | Market Value ($ Thousands) | ||||||
LOAN PARTICIPATIONS (continued) |
| |||||||
Regionalcare Hospital Partners Holdings, Inc., Term B Loan, 1st Lien | ||||||||
3.865%, VAR LIBOR+3.750%, 11/16/2025 | $ | 1,128 | $ | 1,125 | ||||
Reynolds Consumer Products LLC, Initial Term Loan, 1st Lien | ||||||||
1.865%, VAR LIBOR+1.750%, 02/04/2027 | 1,212 | 1,205 | ||||||
Scientific Games International, Inc., Initial Term B-5 Loan, 1st Lien | ||||||||
2.865%, VAR LIBOR+2.750%, 08/14/2024 | 1,434 | 1,406 | ||||||
Seattle SpinCo, Inc., Initial Term Loan, 1st Lien | ||||||||
2.865%, VAR LIBOR+2.500%, 06/21/2024 | 77 | 77 | ||||||
Sotera Health Holdings LLC, Refinancing Loan, 1st Lien | ||||||||
3.250%, 12/11/2026 | 1,230 | 1,225 | ||||||
Station Casinos LLC, Term B-1 Facility Term Loan, 1st Lien | ||||||||
2.500%, 02/08/2027 | 680 | 669 | ||||||
Terrier Media Buyer, Inc., 2021 Term B Loan, 1st Lien | ||||||||
3.609%, VAR LIBOR+3.500%, 12/17/2026 | 683 | 676 | ||||||
TKC Holdings, Inc. Term Loan B | ||||||||
4.750%, VAR LIBOR+3.750%, 02/01/2023 | 1,201 | 1,172 | ||||||
TKC Holdings, Inc., Initial Term Loan, 1st Lien | ||||||||
4.750%, VAR LIBOR+3.750%, 02/01/2023 | 3 | 3 | ||||||
Trans Union LLC, 2019 Replacement Term | ||||||||
B-5 Loan, 1st Lien | ||||||||
1.865%, 11/16/2026 (I) | 643 | 639 | ||||||
TransDigm Inc., Tranche F Refinancing Term Loan, 1st Lien | ||||||||
2.365%, 12/09/2025 | 60 | 59 | ||||||
Triton Water Holdings Inc., Initial Term Loan, 1st Lien | ||||||||
4.000%, 03/31/2028 (I) | 820 | 816 | ||||||
UFC Holdings, Term Loan, 1st Lien | ||||||||
3.750%, 04/29/2026 | 986 | 981 | ||||||
Univision Communications Inc., 2020 | ||||||||
Replacement First-Lien Term Loan, 1st Lien | ||||||||
4.750%, VAR LIBOR+3.750%, 03/15/2026 | 1,059 | 1,057 | ||||||
US Foods, Inc. (aka U.S. Foodservice, Inc.), | ||||||||
Initial Term Loan, 1st Lien | ||||||||
1.865%, 06/27/2023 (B) | 327 | 323 | ||||||
| Description | Face Amount (Thousands) | Market Value ($ Thousands) | ||||||
LOAN PARTICIPATIONS (continued) |
| |||||||
US Foods, Inc., Term Loan | ||||||||
4.365%, 09/13/2026 | $ | 87 | $ | 85 | ||||
Verscend Holding Corp | ||||||||
0.000%, (I) | 410 | 410 | ||||||
Verscend Holding Corp., Term B Loan, 1st Lien | ||||||||
4.615%, VAR LIBOR+4.500%, 08/27/2025 (I) | 328 | 328 | ||||||
VFH Parent LLC, Initial Term Loan, 1st Lien | ||||||||
3.110%, VAR LIBOR+3.000%, 03/01/2026 (I) | 117 | 117 | ||||||
VICI Properties 1 LLC, Term B Loan, 1st Lien | ||||||||
1.861%, VAR LIBOR+1.750%, 12/20/2024 | 1,065 | 1,052 | ||||||
Virgin Media Bristol LLC, N Facility, 1st Lien | ||||||||
2.511%, VAR LIBOR+2.500%, 01/31/2028 (I) | 1,377 | 1,363 | ||||||
Western Digital Corporation, Term Loan B-4 | ||||||||
1.865%, VAR LIBOR+1.750%, 04/29/2023 | 238 | 238 | ||||||
Whatabrands LLC, 2020 Refinancing Term Loan, 1st Lien | ||||||||
2.856%, VAR LIBOR+2.750%, 07/31/2026 | 10 | 10 | ||||||
Wynn Resorts, Term Loan, 1st Lien | ||||||||
1.870%, 09/20/2024 | 1,350 | 1,303 | ||||||
XPO Logistics, Inc., Term Loan B, 1st Lien | ||||||||
1.859%, 02/24/2025 (B) | 550 | 546 | ||||||
Zayo Group Holdings Inc., Initial Dollar Term Loan, 1st Lien | ||||||||
3.115%, VAR LIBOR+3.000%, 03/09/2027 (I) | 630 | 624 | ||||||
|
|
| ||||||
Total Loan Participations |
| 67,113 | ||||||
|
|
| ||||||
U.S. GOVERNMENT AGENCY OBLIGATIONS — 0.4% |
| |||||||
FHLB DN | ||||||||
0.075%, 04/28/2021 (A) | 11,885 | 11,885 | ||||||
FNMA | ||||||||
0.500%, 06/17/2025 | 4,215 | 4,173 | ||||||
Resolution Funding Interest | ||||||||
1.319%, 01/15/2030 (A) | 905 | 763 | ||||||
Resolution Funding Principal | ||||||||
1.355%, 01/15/2030 (A) | 910 | 767 | ||||||
1.304%, 04/15/2030 (A) | 1,165 | 975 | ||||||
| 98 | SEI Institutional Managed Trust / Semi-Annual Report / March 31, 2021 |
| Description | Face Amount (Thousands) | Market Value ($ Thousands) | ||||||
U.S. GOVERNMENT AGENCY OBLIGATIONS (continued) |
| |||||||
Tennessee Valley Authority 0.750%, 05/15/2025 | $ | 1,055 | $ | 1,053 | ||||
|
|
| ||||||
Total U.S. Government Agency Obligations | 19,616 | |||||||
|
|
| ||||||
MUNICIPAL BONDS — 0.4% |
| |||||||
California — 0.1% |
| |||||||
Los Angeles, Community College District, | ||||||||
6.750%, 08/01/2049 | 353 | 579 | ||||||
University of California, Ser N, RB | ||||||||
3.256%, 05/15/2060 | 2,435 | 2,430 | ||||||
|
|
| ||||||
| 3,009 | ||||||||
|
|
| ||||||
Georgia — 0.1% | ||||||||
Georgia State, Municipal Electric Authority, RB | ||||||||
7.055%, 04/01/2057 | 1,075 | 1,495 | ||||||
|
|
| ||||||
Massachusetts — 0.0% | ||||||||
Massachusetts, Ser C, GO | ||||||||
Callable 03/01/2030 @ 100 | ||||||||
3.000%, 03/01/2049 | 635 | 665 | ||||||
|
|
| ||||||
Nevada — 0.0% | ||||||||
Clark County, Department of Aviation, Ser C, RB | ||||||||
6.820%, 07/01/2045 | 728 | 1,090 | ||||||
|
|
| ||||||
New York — 0.2% | ||||||||
Metropolitan New York, Transportation Authority, Ser C2, RB | ||||||||
5.175%, 11/15/2049 | 260 | 322 | ||||||
New York and New Jersey, Port Authority, RB | ||||||||
4.458%, 10/01/2062 | 505 | 622 | ||||||
New York City, Ser D, GO | ||||||||
1.823%, 08/01/2030 | 610 | 573 | ||||||
New York City, Transitional Finance | ||||||||
Authority Future Tax Secured Revenue, Sub-Ser B-3, RB | ||||||||
Callable 08/01/2030 @ 100 | ||||||||
2.000%, 08/01/2035 | 1,000 | 921 | ||||||
New York City, Transitional Finance | ||||||||
Authority Future Tax Secured Revenue, Sub-Ser D-3, RB | ||||||||
Callable 11/01/2030 @ 100 | ||||||||
2.400%, 11/01/2032 | 610 | 605 | ||||||
| Description | Face Amount (Thousands) | Market Value ($ Thousands) | ||||||
MUNICIPAL BONDS (continued) |
| |||||||
New York City, Transitional Finance | ||||||||
Authority, Future Tax Secured Revenue, RB | ||||||||
5.508%, 08/01/2037 | $ | 275 | $ | 359 | ||||
New York City, Water & Sewer System, Ser GG, RB | ||||||||
Callable 06/15/2030 @ 100 | ||||||||
4.000%, 06/15/2050 | 560 | 649 | ||||||
New York City, Water & Sewer System, Sub-Ser, RB | ||||||||
Callable 12/15/2030 @ 100 | ||||||||
4.000%, 06/15/2050 | 90 | 105 | ||||||
New York State, Dormitory Authority, RB | ||||||||
5.289%, 03/15/2033 | 850 | 1,019 | ||||||
New York State, Urban Development, Ser E, RB | ||||||||
Callable 03/15/2030 @ 100 | ||||||||
4.000%, 03/15/2043 | 1,100 | 1,253 | ||||||
|
|
| ||||||
| 6,428 | ||||||||
|
|
| ||||||
Ohio — 0.0% | ||||||||
Ohio State University, Ser A, RB | ||||||||
4.800%, 06/01/2111 | 433 | 556 | ||||||
|
|
| ||||||
Texas — 0.0% | ||||||||
North Texas, Tollway Authority, Ser B, RB | ||||||||
6.718%, 01/01/2049 | 632 | 1,002 | ||||||
University of Texas, Ser B, RB | ||||||||
Callable 02/15/2049 @ 100 | ||||||||
2.439%, 08/15/2049 | 295 | 271 | ||||||
|
|
| ||||||
| 1,273 | ||||||||
|
|
| ||||||
Virginia — 0.0% | ||||||||
University of Virginia, RB | ||||||||
Callable 03/01/2050 @ 100 | ||||||||
2.256%, 09/01/2050 | 725 | 635 | ||||||
|
|
| ||||||
Total Municipal Bonds | 15,151 | |||||||
|
|
| ||||||
| Shares | ||||||||
AFFILIATED PARTNERSHIP — 2.0% |
| |||||||
SEI Liquidity Fund, L.P. | ||||||||
0.020% **†(J) | 88,022,939 | 88,058 | ||||||
|
|
| ||||||
Total Affiliated Partnership | 88,058 | |||||||
|
|
| ||||||
SEI Institutional Managed Trust / Semi-Annual Report / March 31, 2021 | 99 |
SCHEDULE OF INVESTMENTS (Unaudited)
March 31, 2021
Core Fixed Income Fund (Continued)
| Description | Shares | Market Value ($ Thousands) | ||||||
CASH EQUIVALENT — 6.8% |
| |||||||
SEI Daily Income Trust, Government Fund, Cl F | ||||||||
0.010%**† | 303,630,851 | $ | 303,631 | |||||
|
|
| ||||||
Total Cash Equivalent | 303,631 | |||||||
|
|
| ||||||
Total Investments in Securities — 114.9% | $ | 5,141,823 | ||||||
|
|
| ||||||
| Contracts | ||||||||
PURCHASED OPTIONS* — 0.0% | ||||||||
Total Purchased Options (K) | 1,989 | $ | 271 | |||||
|
|
| ||||||
| Description | Contracts | Market Value ($Thousands) | ||||||
PURCHASED SWAPTION** — 0.0% | ||||||||
Total Purchased Swaption (L) | 5,220,000 | $ | 365 | |||||
|
|
| ||||||
WRITTEN OPTIONS* — (0.0)% | ||||||||
Total Written Options (K) | (1,686 | ) | $ | (383 | ) | |||
|
|
| ||||||
WRITTEN SWAPTIONS* — (0.0)% | ||||||||
Total Written Swaptions (L) | (7,912,000 | ) | $ | (115 | ) | |||
|
|
| ||||||
A list of the exchange traded option contracts held by the Fund at March 31, 2021, is as follows:
| Description | Number of Contracts | Notional Amount (Thousands) †† | Exercise Price | Expiration Date | Value (Thousands) | |||||||||||||||
PURCHASED OPTIONS — 0.0% |
| |||||||||||||||||||
Put Options | ||||||||||||||||||||
March 2022, IMM Eurodollar Future Option* | 850 | $ | 82 | $99.63 | 3/19/2022 | $ | 85 | |||||||||||||
|
|
|
|
|
| |||||||||||||||
Call Options | ||||||||||||||||||||
May 2021, U.S. 10 Year Future Option* | 314 | 133 | 132.50 | 4/17/2021 | 54 | |||||||||||||||
May 2021, U.S. 5 Year Future Option* | 316 | 82 | 124.00 | 4/17/2021 | 37 | |||||||||||||||
May 2021, U.S. 5 Year Future Option* | 316 | 47 | 124.25 | 4/17/2021 | 20 | |||||||||||||||
May 2021, U.S. Bond Future Option* | 193 | 167 | 158.00 | 4/17/2021 | 75 | |||||||||||||||
|
|
|
|
|
| |||||||||||||||
| 429 | 186 | |||||||||||||||||||
|
|
|
|
|
| |||||||||||||||
Total Purchased Options | $ | 510 | $ | 271 | ||||||||||||||||
|
|
|
|
|
| |||||||||||||||
WRITTEN OPTIONS —(0.0)% | ||||||||||||||||||||
Put Options | ||||||||||||||||||||
March 2022, IMM Eurodollar Future Option* | (670 | ) | $ | (34 | ) | 99.38 | 03/19/22 | $ | (38 | ) | ||||||||||
March 2022, IMM Eurodollar Future Option* | (23 | ) | (5 | ) | 99.75 | 03/19/22 | (3 | ) | ||||||||||||
|
|
|
|
|
| |||||||||||||||
| (39 | ) | (41 | ) | |||||||||||||||||
|
|
|
|
|
| |||||||||||||||
Call Options | ||||||||||||||||||||
June 2021, U.S. 10 Year Future Option* | (157 | ) | (149 | ) | 132.00 | 05/22/21 | (86 | ) | ||||||||||||
June 2021, U.S. 10 Year Future Option* | (168 | ) | (75 | ) | 134.00 | 05/22/21 | (24 | ) | ||||||||||||
May 2021, U.S. 10 Year Future Option* | (161 | ) | (108 | ) | 134.00 | 04/17/21 | (8 | ) | ||||||||||||
June 2021, U.S. 5 Year Future Option* | (316 | ) | (127 | ) | 124.00 | 05/22/21 | (79 | ) | ||||||||||||
June 2021, U.S. Bond Future Option* | (118 | ) | (226 | ) | 157.00 | 05/22/21 | (142 | ) | ||||||||||||
May 2021, U.S. Bond Future Option* | (73 | ) | (45 | ) | 164.00 | 04/17/21 | (3 | ) | ||||||||||||
|
|
|
|
|
| |||||||||||||||
| (730 | ) | (342 | ) | |||||||||||||||||
|
|
|
|
|
| |||||||||||||||
100 | SEI Institutional Managed Trust / Semi-Annual Report / March 31, 2021 |
| Description | Number of Contracts | Notional Amount (Thousands) †† | Exercise Price | Expiration Date | Value (Thousands) | |||||||||||||||
WRITTEN OPTIONS (continued) | ||||||||||||||||||||
Total Written Options | $ | (769 | ) | $ | (383 | ) | ||||||||||||||
|
|
|
|
|
| |||||||||||||||
| Description | Counterparty | Number of Contracts/ Notional Amount†† | Exercise Price | Expiration Date | Value (Thousands) | |||||||||||||||
PURCHASED SWAPTION — 0.0% |
| |||||||||||||||||||
Put Swaptions | ||||||||||||||||||||
Swaption 30 Year* | Bank of America Merill Lynch | $ | 5,220,000 | $2.75 | 01/20/2024 | $ | 365 | |||||||||||||
|
|
| ||||||||||||||||||
WRITTEN SWAPTIONS — (0.0)% |
| |||||||||||||||||||
Call Swaptions | ||||||||||||||||||||
Swaption* | Bank of America Merill Lynch | $ | (1,437,000 | ) | $1.75 | 06/19/2021 | $ | (5 | ) | |||||||||||
Swaption* | Bank of America Merill Lynch | (356,000 | ) | $1.75 | 06/19/2021 | (1 | ) | |||||||||||||
Swaption* | Bank of America Merill Lynch | (683,000 | ) | $1.75 | 06/19/2021 | (2 | ) | |||||||||||||
Swaption* | Bank of America Merill Lynch | (740,000 | ) | $1.80 | 06/19/2021 | (4 | ) | |||||||||||||
Swaption* | Bank of America Merill Lynch | (740,000 | ) | $1.80 | 06/19/2021 | (4 | ) | |||||||||||||
|
|
| ||||||||||||||||||
Put Swaptions | ||||||||||||||||||||
Swaption* | Bank of America Merill Lynch | (1,437,000 | ) | $2.25 | 06/19/2021 | (39 | ) | |||||||||||||
Swaption* | Bank of America Merill Lynch | (356,000 | )�� | $2.25 | 06/19/2021 | (9 | ) | |||||||||||||
Swaption* | Bank of America Merill Lynch | (683,000 | ) | $2.25 | 06/19/2021 | (19 | ) | |||||||||||||
Swaption* | Bank of America Merill Lynch | (740,000 | ) | $2.30 | 06/19/2021 | (16 | ) | |||||||||||||
Swaption* | Bank of America Merill Lynch | (740,000 | ) | $2.30 | 06/19/2021 | (16 | ) | |||||||||||||
|
|
|
|
|
| |||||||||||||||
Total Written Swaptions | $ | (7,912,000 | ) | $ | (115 | ) | ||||||||||||||
|
|
|
|
|
| |||||||||||||||
†† Represents cost. | ||||||||||||||||||||
A list of the open futures contracts held by the Fund at March 31, 2021, is as follows:
| Type of Contract | Number of (Short) | Expiration Date | Notional Amount (Thousands) | Value (Thousands) | Unrealized Appreciation (Depreciation) (Thousands) | |||||||||||||||
90-Day Euro$ | (2,083 | ) | Jun-2021 | $ | (519,830 | ) | $ | (519,838 | ) | $ | (8 | ) | ||||||||
90-Day Euro$ | (1,522 | ) | Dec-2021 | (378,889 | ) | (379,492 | ) | (603 | ) | |||||||||||
90-Day Euro$ | 1,630 | Dec-2023 | 403,373 | 402,590 | (783 | ) | ||||||||||||||
Euro-Bund | (276 | ) | Jun-2021 | (57,174 | ) | (55,560 | ) | (180 | ) | |||||||||||
Euro-Buxl | (5 | ) | Jun-2021 | (1,263 | ) | (1,211 | ) | 17 | ||||||||||||
Euro-OAT | 76 | Jun-2021 | 14,829 | 14,466 | 5 | |||||||||||||||
U.S. 2-Year Treasury Note | 185 | Jul-2021 | 40,867 | 40,834 | (33 | ) | ||||||||||||||
U.S. 2-Year Treasury Note | (486 | ) | Jul-2021 | (107,384 | ) | (107,273 | ) | 111 | ||||||||||||
U.S. 5-Year Treasury Note | 3,755 | Jul-2021 | 469,053 | 463,361 | (5,692 | ) | ||||||||||||||
U.S. 10-Year Treasury Note | 528 | Jun-2021 | 70,881 | 69,135 | (1,746 | ) | ||||||||||||||
U.S. 10-Year Treasury Note | (560 | ) | Jun-2021 | (75,005 | ) | (73,325 | ) | 1,680 | ||||||||||||
U.S. Long Treasury Bond | 457 | Jun-2021 | 74,203 | 70,649 | (3,554 | ) | ||||||||||||||
U.S. Long Treasury Bond | (334 | ) | Jun-2021 | (53,517 | ) | (51,634 | ) | 1,883 | ||||||||||||
U.S. Ultra Long Treasury Bond | 590 | Jun-2021 | 111,627 | 106,919 | (4,708 | ) | ||||||||||||||
Ultra 10-Year U.S. Treasury Note | (504 | ) | Jun-2021 | (75,077 | ) | (72,418 | ) | 2,659 | ||||||||||||
|
|
|
|
|
|
|
|
| ||||||||||||
| $ | (83,306 | ) | $ | (92,797 | ) | $ | (10,952 | ) | ||||||||||||
|
|
|
|
|
|
|
|
| ||||||||||||
SEI Institutional Managed Trust / Semi-Annual Report / March 31, 2021 | 101 |
SCHEDULE OF INVESTMENTS (Unaudited)
March 31, 2021
Core Fixed Income Fund (Continued)
A list of the open forward foreign currency contracts held by the Fund at March 31, 2021, is as follows:
| Counterparty | Settlement Date | Currency to Deliver (Thousands) | Currency to Receive (Thousands) | Unrealized Appreciation (Depreciation) (Thousands) | ||||||||||||||||||||
BNP Paribas | 04/19/21 | EUR | 18,240 | USD | 22,277 | $ | 832 | |||||||||||||||||
Citigroup | 04/19/21 | USD | 2,379 | GBP | 1,753 | 39 | ||||||||||||||||||
Citigroup | 04/19/21 | USD | 3,148 | EUR | 2,600 | (91 | ) | |||||||||||||||||
Citigroup | 04/19/21 | USD | 3,179 | BRL | 16,979 | (173 | ) | |||||||||||||||||
Citigroup | 04/19/21 | USD | 8,091 | RUB | 607,800 | (63 | ) | |||||||||||||||||
Citigroup | 04/19/21 | USD | 14,535 | JPY | 1,498,110 | (973 | ) | |||||||||||||||||
Citigroup | 04/19/21 | USD | 14,574 | AUD | 18,672 | (353 | ) | |||||||||||||||||
Citigroup | 04/19/21 | CNH | 14,971 | USD | 2,302 | 24 | ||||||||||||||||||
Citigroup | 04/19/21 | USD | 15,411 | IDR | 216,529,634 | (546 | ) | |||||||||||||||||
Citigroup | 04/19/21 | USD | 26,800 | CAD | 33,952 | 217 | ||||||||||||||||||
Citigroup | 04/19/21 | USD | 11,305 | CAD | 14,118 | (71 | ) | |||||||||||||||||
Citigroup | 04/19/21 | COP | 5,189,635 | USD | 1,501 | 88 | ||||||||||||||||||
Goldman Sachs | 04/19/21 | USD | 1,048 | BRL | 5,680 | (43 | ) | |||||||||||||||||
Goldman Sachs | 04/19/21 | USD | 3,889 | RUB | 291,022 | (45 | ) | |||||||||||||||||
Goldman Sachs | 04/19/21 | EUR | 16,648 | USD | 20,426 | 854 | ||||||||||||||||||
|
|
| ||||||||||||||||||||||
| $ | (304 | ) | ||||||||||||||||||||||
A list of the open centrally cleared swap agreements held by the Fund at March 31, 2021, is as follows:
| Interest Rate Swaps | ||||||||||||||||||||||||||||||||
| Fund Pays | Fund Receives | Payment Frequency | Termination Date | Currency | Notional Amount (Thousands) | Value (Thousands) | Upfront (Thousands) | Net Unrealized Appreciation (Depreciation) (Thousands) | ||||||||||||||||||||||||
0.19% | USD LIBOR BBA | Semi-Annual | 06/15/2022 | USD | 40,784 | $ | (11 | ) | $ | – | $ | (11 | ) | |||||||||||||||||||
1.10% | USD-LIBOR-BBA | Semi-Annual | 12/18/2025 | USD | 61,056 | (569 | ) | – | (569 | ) | ||||||||||||||||||||||
USD FEDL01 | 0.26% | Annual | 05/15/2027 | USD | 37,002 | 1,872 | (111 | ) | 1,983 | |||||||||||||||||||||||
1.35% | USD-LIBOR-BBA | Quarterly | 02/15/2028 | USD | 40,028 | 333 | 221 | 112 | ||||||||||||||||||||||||
0.56% | USD-SOFRRATE | Annual | 07/20/2045 | USD | 8,660 | 2,369 | 108 | 2,261 | ||||||||||||||||||||||||
USD-SOFRRATE | 0.74% | Annual | 08/19/2045 | USD | 5,670 | 1,352 | – | 1,352 | ||||||||||||||||||||||||
1.2% | USD-LIBOR-BBA | Quarterly | 02/15/2047 | USD | 2,162 | 458 | 12 | 446 | ||||||||||||||||||||||||
1.225% | USD-LIBOR-BBA | Quarterly | 02/15/2047 | USD | 1,086 | 224 | 1 | 223 | ||||||||||||||||||||||||
USD-LIBOR-BBA | 1.6% | Quarterly | 02/15/2047 | USD | 2,748 | 354 | 15 | 339 | ||||||||||||||||||||||||
1.00% | USD-LIBOR-BBA | Quarterly | 02/15/2047 | USD | 12,509 | 3,164 | 148 | 3,016 | ||||||||||||||||||||||||
2.00% | USD-LIBOR-BBA | Quarterly | 02/15/2047 | USD | 7,258 | 367 | (5 | ) | 372 | |||||||||||||||||||||||
0.90% | USD LIBOR BBA | Quarterly | 03/17/2050 | USD | 3,996 | 1,194 | 5 | 1,189 | ||||||||||||||||||||||||
1.2% | USD LIBOR BBA | Quarterly | 10/07/2050 | USD | 5,663 | 1,329 | 28 | 1,301 | ||||||||||||||||||||||||
2.00% | USD-LIBOR-BBA | Quarterly | 06/03/2051 | USD | 494 | 28 | 5 | 23 | ||||||||||||||||||||||||
2.05% | USD-LIBOR-BBA | Quarterly | 06/07/2051 | USD | 1,480 | 67 | – | 67 | ||||||||||||||||||||||||
|
|
|
|
|
|
|
|
| ||||||||||||||||||||||||
| $ | 12,531 | $ | 427 | $ | 12,104 | |||||||||||||||||||||||||||
|
|
|
|
|
|
|
|
| ||||||||||||||||||||||||
102 | SEI Institutional Managed Trust / Semi-Annual Report / March 31, 2021 |
| Credit Default Swaps | ||||||||||||||||||||||||||||||||
Reference Entity/ Obligation | Buy/Sell Protection | (Pays)/ Receives Rate | Payment Frequency | Termination Date | Notional Amount (Thousands) | Value (Thousands) | Upfront Payments/ Receipts (Thousands) | Net Unrealized Appreciation (Depreciation) (Thousands) | ||||||||||||||||||||||||
CDX.NA.IG.34 | Sell | 1.00% | Quarterly | 06/20/2025 | (13,261 | ) | $ | 264 | $ | 115 | $ | 149 | ||||||||||||||||||||
CDX.NA.IG.36 | Sell | 5.00% | Quarterly | 06/20/2026 | (25,030 | ) | 2,234 | 2,129 | 105 | |||||||||||||||||||||||
TEMPORARY NAME | Sell | 1.00% | Quarterly | 06/20/2026 | (101,726 | ) | 2,346 | 2,217 | 129 | |||||||||||||||||||||||
|
|
|
|
|
| |||||||||||||||||||||||||||
| $ | 4,844 | $ | 4,461 | $ | 383 | |||||||||||||||||||||||||||
|
|
|
|
|
| |||||||||||||||||||||||||||
Percentages are based on Net Assets of $4,474,703 ($ Thousands). |
| * | Non-income producing security. |
| ** | The rate reported is the 7-day effective yield as of March 31, 2021. |
| † | Investment in Affiliated Security (see Note 6). |
| (A) | Zero coupon security. The rate shown on the Schedule of Investments is the security’s effective yield at the time of purchase. |
| (B) | Variable or floating rate security, the interest rate of which adjusts periodically based on changes in current interest rates and prepayments on the underlying pool of assets. |
| (C) | Security exempt from registration under Rule 144A of the Securities Act of 1933. These securities may be resold in transactions exempt from registration normally to qualified institutions. On March 31, 2021, the value of these securities amounted to $588,160 ($ Thousands), representing 13.1% of the Net Assets of the Fund. |
| (D) | Certain securities or partial positions of certain securities are on loan at March 31, 2021 (See Note 10). The total market value of securities on loan at March 31, 2021 was $86,550 ($ Thousands). |
| (E) | Perpetual security with no stated maturity date. |
| (F) | Step Bonds – Represents the current rate, the step rate, the step date and the final maturity date. |
| (G) | No interest rate available. |
| (H) | Security is in default on interest payment. |
| (I) | Unsettled bank loan. Interest rate may not be available. |
| (J) | This security was purchased with cash collateral held from securities on loan. The total market value of such securities as of March 31, 2021 was $88,058 ($ Thousands). |
| (K) | Refer to table below for details on Options Contracts. |
| (L) | Refer to table below for details on Swaption Contracts. |
ABS — Asset-Backed Security
ACES — Alternative Credit Enhancement Structure
ARM — Adjustable Rate Mortgage
AUD — Australian Dollar
BRL — Brazilian Real
CAD — Canadian Dollar
Cl — Class
CLO — Collateralized Loan Obligation
CMO — Collateralized Mortgage Obligation
CNH — Chinese Yuan Offshore
CNY — Chinese Yuan Offshore
COP — Colombian Peso
DAC — Designated Activity Company
EUR — Euro
FHLMC — Federal Home Loan Mortgage Corporation
FNMA — Federal National Mortgage Association
FREMF— Freddie Mac Multi-Family
FRESB — Freddie Mac Small Balance Mortgage Trust
GBP — British Pound Sterling
GNMA — Government National Mortgage Association
GO — General Obligation
ICE— Intercontinental Exchange
IDR — Indonesian Rupiah
IO — Interest Only — face amount represents notional amount.
JPY — Japanese Yen
JSC — Joint-Stock Company
LIBOR— London Interbank Offered Rate
LLC — Limited Liability Company
L.P. — Limited Partnership
Ltd. — Limited
MTN — Medium Term Note
PO — Principal Only
Pty — Proprietary
RB — Revenue Bond
REMIC — Real Estate Mortgage Investment Conduit
RUB — Russian Ruble
Ser — Series
TBA — To Be Announced
USD — U.S. Dollar
VAR — Variable Rate
SEI Institutional Managed Trust / Semi-Annual Report / March 31, 2021 | 103 |
SCHEDULE OF INVESTMENTS (Unaudited)
March 31, 2021
Core Fixed Income Fund (Concluded)
The following is a list of the level of inputs used as of March 31, 2021, in valuing the Fund’s investments and other financial instruments carried at value ($ Thousands):
| Investments in Securities | Level 1 ($) | Level 2 ($) | Level 3 ($) | Total ($) | ||||||||||||
Mortgage-Backed Securities | – | 1,534,297 | – | 1,534,297 | ||||||||||||
U.S. Treasury Obligations | – | 1,357,357 | – | 1,357,357 | ||||||||||||
Corporate Obligations | – | 1,348,320 | – | 1,348,320 | ||||||||||||
Asset-Backed Securities | – | 303,818 | – | 303,818 | ||||||||||||
Sovereign Debt | – | 104,462 | – | 104,462 | ||||||||||||
Loan Participations | – | 67,113 | – | 67,113 | ||||||||||||
U.S. Government Agency Obligations | – | 19,616 | – | 19,616 | ||||||||||||
Municipal Bonds | – | 15,151 | – | 15,151 | ||||||||||||
Affiliated Partnership | – | 88,058 | – | 88,058 | ||||||||||||
Cash Equivalent | 303,631 | – | – | 303,631 | ||||||||||||
|
|
|
|
|
|
|
|
|
|
|
| |||||
Total Investments in Securities | 303,631 | 4,838,192 | – | 5,141,823 | ||||||||||||
|
|
|
|
|
|
|
|
|
|
|
| |||||
| Other Financial Instruments | Level 1 ($) | Level 2 ($) | Level 3 ($) | Total ($) | ||||||||||||
Purchased Options | 271 | – | – | 271 | ||||||||||||
Written Options | (383 | ) | – | – | (383 | ) | ||||||||||
Purchased Swaptions | – | 365 | – | 365 | ||||||||||||
Written Swaptions | – | (115 | ) | – | (115 | ) | ||||||||||
Futures Contracts* | ||||||||||||||||
Unrealized Appreciation | 6,355 | – | – | 6,355 | ||||||||||||
Unrealized Depreciation | (17,307 | ) | – | – | (17,307 | ) | ||||||||||
Forwards Contracts* | ||||||||||||||||
Unrealized Appreciation | – | 2,054 | – | 2,054 | ||||||||||||
Unrealized Depreciation | – | (2,358 | ) | – | (2,358 | ) | ||||||||||
Centrally Cleared Swaps | ||||||||||||||||
Interest Rate Swaps* | ||||||||||||||||
Unrealized Appreciation | – | 12,684 | – | 12,684 | ||||||||||||
Unrealized Depreciation | – | (580 | ) | – | (580 | ) | ||||||||||
Credit Default Swaps* | ||||||||||||||||
Unrealized Appreciation | – | 383 | – | 383 | ||||||||||||
|
|
|
|
|
|
|
|
|
|
|
| |||||
Total Other Financial Instruments | (11,064 | ) | 12,433 | – | 1,369 | |||||||||||
|
|
|
|
|
|
|
|
|
|
|
| |||||
* Futures contracts, forward contracts and swaps contracts are valued at the unrealized appreciation (depreciation) on the instrument.
For the period ended March 31, 2021, there were no transfers in or out of Level 3.
For more information on valuation inputs, see Note 2 – Significant Accounting Policies in Notes to Financial Statements.
The following is a summary of the Fund’s transactions with affiliates for the period ended March 31, 2021 ($ Thousands):
| Security Description | Value 9/30/2020 | Purchases at Cost | Proceeds from Sales | Realized Gain/ (Loss) | Change in Unrealized Appreciation/ (Depreciation) | Value 3/31/2021 | Shares | Income | Capital Gains | |||||||||
SEI Liquidity Fund, L.P. | $7,459 | $632,665 | $(552,153) | $93 | $(6) | $88,058 | 88,022,939 | $21 | $— | |||||||||
SEI Daily Income Trust, Government Fund, Cl F | 185,394 | 2,347,887 | (2,229,650) | — | — | 303,631 | 303,630,851 | 10 | — | |||||||||
|
|
|
|
|
|
|
| |||||||||||
Totals | $192,853 | $2,980,552 | $(2,781,803) | $93 | $(6) | $391,689 | $31 | $— | ||||||||||
|
|
|
|
|
|
|
|
Amounts designated as “—” are either $0 or have been rounded to $0.
The accompanying notes are an integral part of the financial statements.
104 | SEI Institutional Managed Trust / Semi-Annual Report / March 31, 2021 |
SCHEDULE OF INVESTMENTS (Unaudited)
March 31, 2021
High Yield Bond Fund

†Percentages are based on total investments.
| Description | Face Amount (Thousands) | Market Value ($ Thousands) | ||||||
CORPORATE OBLIGATIONS — 72.6% |
| |||||||
Communication Services — 9.1% |
| |||||||
Altice Financing | ||||||||
7.500%, 05/15/2026 (A) | $ | 315 | $ | 329 | ||||
5.000%, 01/15/2028 (A) | 4,050 | 4,004 | ||||||
Altice France | ||||||||
8.125%, 02/01/2027 (A) | 1,346 | 1,475 | ||||||
7.375%, 05/01/2026 (A) | 3,221 | 3,350 | ||||||
Altice France Holding | ||||||||
10.500%, 05/15/2027 (A) | 490 | 552 | ||||||
6.000%, 02/15/2028 (A) | 1,756 | 1,730 | ||||||
AMC Entertainment Holdings | ||||||||
12.000%cash/0.000% PIK, 06/15/2026 (A) | 621 | 505 | ||||||
10.500%, 04/24/2026 (A) | 38 | 40 | ||||||
6.125%, 05/15/2027 | 420 | 256 | ||||||
5.750%, 06/15/2025 | 230 | 147 | ||||||
ANGI Group | ||||||||
3.875%, 08/15/2028 (A) | 1,980 | 1,980 | ||||||
Belo | ||||||||
7.250%, 09/15/2027 | 250 | 291 | ||||||
CB Escrow | ||||||||
8.000%, 10/15/2025 (A) | 105 | 112 | ||||||
CCO Holdings | ||||||||
5.875%, 05/01/2027 (A) | 280 | 289 | ||||||
5.750%, 02/15/2026 (A) | 1,044 | 1,077 | ||||||
5.500%, 05/01/2026 (A) | 556 | 573 | ||||||
5.375%, 06/01/2029 (A) | 625 | 670 | ||||||
5.125%, 05/01/2027 (A) | 3,257 | 3,444 | ||||||
5.000%, 02/01/2028 (A) | 735 | 777 | ||||||
4.750%, 03/01/2030 (A) | 300 | 311 | ||||||
4.500%, 08/15/2030 (A) | 459 | 468 | ||||||
| Description | Face Amount (Thousands) | Market Value ($ Thousands) | ||||||
CORPORATE OBLIGATIONS (continued) |
| |||||||
4.250%, 02/01/2031 (A) | $ | 3,609 | $ | 3,617 | ||||
Cincinnati Bell | ||||||||
7.000%, 07/15/2024 (A) | 305 | 315 | ||||||
Cinemark USA | ||||||||
8.750%, 05/01/2025 (A) | 115 | 126 | ||||||
Clear Channel International BV | ||||||||
6.625%, 08/01/2025 (A) | 1,439 | 1,504 | ||||||
Clear Channel Outdoor Holdings Inc | ||||||||
7.750%, 04/15/2028 (A) | 3,234 | 3,206 | ||||||
Clear Channel Worldwide Holdings | ||||||||
9.250%, 02/15/2024 | 1,250 | 1,300 | ||||||
5.125%, 08/15/2027 (A) | 1,820 | 1,832 | ||||||
Connect Finco SARL | ||||||||
6.750%, 10/01/2026 (A) | 1,170 | 1,246 | ||||||
Consolidated Communications | ||||||||
6.500%, 10/01/2028 (A) | 3,823 | 4,129 | ||||||
5.000%, 10/01/2028 (A) | 471 | 475 | ||||||
Digicel Holdings Bermuda | ||||||||
8.750%, 05/25/2024 (A) | 826 | 852 | ||||||
DISH DBS | ||||||||
7.750%, 07/01/2026 | 2,353 | 2,592 | ||||||
7.375%, 07/01/2028 | 2,145 | 2,250 | ||||||
5.875%, 07/15/2022 | 45 | 47 | ||||||
5.875%, 11/15/2024 | 3,112 | 3,257 | ||||||
5.000%, 03/15/2023 | 1,072 | 1,118 | ||||||
DKT Finance ApS | ||||||||
9.375%, 06/17/2023 (A) | 1,845 | 1,893 | ||||||
Entercom Media | ||||||||
6.500%, 05/01/2027 (A) | 237 | 245 | ||||||
Front Range BidCo | ||||||||
6.125%, 03/01/2028 (A) | 571 | 587 | ||||||
4.000%, 03/01/2027 (A) | 1,141 | 1,123 | ||||||
Frontier Communications | ||||||||
11.000%, 09/15/2025 (B) | 905 | 619 | ||||||
10.500%, 09/15/2022 (B) | 1,035 | 708 | ||||||
6.875%, 01/15/2025 (B) | 1,435 | 929 | ||||||
6.750%, 05/01/2029 (A) | 457 | 482 | ||||||
5.875%, 10/15/2027 (A) | 206 | 218 | ||||||
5.000%, 05/01/2028 (A) | 1,073 | 1,092 | ||||||
Gray Television | ||||||||
4.750%, 10/15/2030 (A) | 581 | 576 | ||||||
iHeartCommunications (C) | ||||||||
8.375%, 05/01/2027 | 4,143 | 4,449 | ||||||
6.375%, 05/01/2026 | 94 | 100 | ||||||
5.250%, 08/15/2027 (A) | 1,088 | 1,119 | ||||||
4.750%, 01/15/2028 (A) | 842 | 848 | ||||||
Intelsat Jackson Holdings | ||||||||
9.750%, | 2,202 | 1,360 | ||||||
8.500%, | 1,695 | 1,063 | ||||||
5.500%, 08/01/2023 (B) | 268 | 164 | ||||||
Intelsat Luxembourg | ||||||||
8.125%, 06/01/2023 (B) | 635 | 25 | ||||||
| SEI Institutional Managed Trust / Semi-Annual Report / March 31, 2021 | 105 |
SCHEDULE OF INVESTMENTS (Unaudited)
March 31, 2021
High Yield Bond Fund (Continued)
| Description | Face Amount (Thousands) | Market Value ($ Thousands) | ||||||
CORPORATE OBLIGATIONS (continued) |
| |||||||
Lamar Media | ||||||||
4.875%, 01/15/2029 | $ | 115 | $ | 120 | ||||
4.000%, 02/15/2030 | 565 | 563 | ||||||
Level 3 Financing | ||||||||
5.375%, 05/01/2025 | 760 | 776 | ||||||
4.625%, 09/15/2027 (A) | 764 | 786 | ||||||
4.250%, 07/01/2028 (A) | 540 | 546 | ||||||
3.625%, 01/15/2029 (A) | 2,124 | 2,058 | ||||||
Live Nation Entertainment | ||||||||
6.500%, 05/15/2027 (A) | 236 | 262 | ||||||
5.625%, 03/15/2026 (A) | 264 | 274 | ||||||
4.875%, 11/01/2024 (A) | 1,782 | 1,814 | ||||||
4.750%, 10/15/2027 (A) | 459 | 463 | ||||||
3.750%, 01/15/2028 (A) | 55 | 54 | ||||||
Lumen Technologies | ||||||||
7.500%, 04/01/2024 | 1,275 | 1,429 | ||||||
6.875%, 01/15/2028 | 395 | 440 | ||||||
5.125%, 12/15/2026 (A) | 2,625 | 2,765 | ||||||
4.500%, 01/15/2029 (A) | 1,040 | 1,014 | ||||||
4.000%, 02/15/2027 (A) | 593 | 606 | ||||||
Meredith | ||||||||
6.875%, 02/01/2026 | 419 | 430 | ||||||
6.500%, 07/01/2025 (A) | 55 | 59 | ||||||
Midcontinent Communications | ||||||||
5.375%, 08/15/2027 (A) | 582 | 605 | ||||||
Netflix | ||||||||
5.875%, 11/15/2028 | 470 | 569 | ||||||
5.375%, 11/15/2029 (A) | 205 | 242 | ||||||
4.875%, 04/15/2028 | 1,273 | 1,447 | ||||||
4.875%, 06/15/2030 (A) | 666 | 767 | ||||||
Nexstar (Escrow Security) | ||||||||
5.625%, 07/15/2027 (A) | 4,838 | 5,086 | ||||||
Nexstar Broadcasting | ||||||||
4.750%, 11/01/2028 (A) | 644 | 651 | ||||||
Outfront Media Capital | ||||||||
6.250%, 06/15/2025 (A) | 554 | 586 | ||||||
5.000%, 08/15/2027 (A) | 465 | 470 | ||||||
4.250%, 01/15/2029 (A) | 1,980 | 1,906 | ||||||
Sable International Finance | ||||||||
5.750%, 09/07/2027 (A) | 946 | 997 | ||||||
Salem Media Group | ||||||||
6.750%, 06/01/2024 (A) | 3,640 | 3,585 | ||||||
Scripps (Escrow Security) | ||||||||
5.875%, 07/15/2027 (A) | 680 | 700 | ||||||
Scripps II (Escrow Security) | ||||||||
5.375%, 01/15/2031 (A) | 81 | 81 | ||||||
3.875%, 01/15/2029 (A) | 605 | 594 | ||||||
Sinclair Television Group | ||||||||
5.125%, 02/15/2027 (A) | 1,337 | 1,305 | ||||||
4.125%, 12/01/2030 (A) | 3,370 | 3,244 | ||||||
Sirius XM Radio | ||||||||
5.500%, 07/01/2029 (A) | 869 | 940 | ||||||
| Description | Face Amount (Thousands) | Market Value ($ Thousands) | ||||||
CORPORATE OBLIGATIONS (continued) |
| |||||||
5.000%, 08/01/2027 (A) | $ | 1,106 | $ | 1,160 | ||||
4.625%, 07/15/2024 (A) | 340 | 350 | ||||||
4.125%, 07/01/2030 (A) | 1,323 | 1,325 | ||||||
SoftBank Group | ||||||||
6.000%, VAR USD ICE Swap 11:00 NY | 605 | 607 | ||||||
5.125%, 09/19/2027 | 527 | 558 | ||||||
Sprint | ||||||||
7.875%, 09/15/2023 | 1,276 | 1,458 | ||||||
7.625%, 02/15/2025 | 4,366 | 5,189 | ||||||
7.625%, 03/01/2026 | 1,490 | 1,825 | ||||||
Sprint Capital | ||||||||
8.750%, 03/15/2032 | 1,403 | 2,075 | ||||||
TEGNA | ||||||||
4.625%, 03/15/2028 | 1,609 | 1,637 | ||||||
Telecom Italia Capital | ||||||||
6.000%, 09/30/2034 | 285 | 323 | ||||||
Telesat Canada | ||||||||
6.500%, 10/15/2027 (A) | 4,447 | 4,455 | ||||||
4.875%, 06/01/2027 (A) | 1,120 | 1,120 | ||||||
T-Mobile USA | ||||||||
4.750%, 02/01/2028 | 964 | 1,030 | ||||||
3.500%, 04/15/2025 (A) | 96 | 104 | ||||||
3.500%, 04/15/2031 | 930 | 938 | ||||||
3.375%, 04/15/2029 | 905 | 914 | ||||||
2.250%, 02/15/2026 | 111 | 112 | ||||||
Trilogy International Partners | ||||||||
8.875%, 05/01/2022 (A) | 980 | 951 | ||||||
Trilogy Private Notes | ||||||||
10.000%, | 32 | 32 | ||||||
United States Cellular | ||||||||
6.700%, 12/15/2033 | 1,289 | 1,561 | ||||||
Urban One | ||||||||
7.375%, 02/01/2028 (A) | 5,230 | 5,415 | ||||||
Windstream Escrow | ||||||||
7.750%, 08/15/2028 (A) | 1,355 | 1,377 | ||||||
WMG Acquisition | ||||||||
3.000%, 02/15/2031 (A) | 275 | 261 | ||||||
|
|
| ||||||
| 140,857 | ||||||||
|
|
| ||||||
Consumer Discretionary — 14.1% |
| |||||||
1011778 BC ULC / New Red Finance Inc | ||||||||
4.375%, 01/15/2028 (A) | 561 | 564 | ||||||
4.000%, 10/15/2030 (A) | 1,559 | 1,504 | ||||||
3.500%, 02/15/2029 (A) | 93 | 91 | ||||||
Abercrombie & Fitch Management | ||||||||
8.750%, 07/15/2025 (A) | 915 | 1,011 | ||||||
Academy | ||||||||
6.000%, 11/15/2027 (A) | 1,028 | 1,082 | ||||||
Adelphia Communications (Escrow Security) | ||||||||
10.250%, | 150 | 1 | ||||||
9.500%, | 25 | – | ||||||
| 106 | SEI Institutional Managed Trust / Semi-Annual Report / March 31, 2021 |
| Description | Face Amount (Thousands) | Market Value ($ Thousands) | ||||||
CORPORATE OBLIGATIONS (continued) |
| |||||||
7.875%, | $ | 225 | $ | – | ||||
Adient Global Holdings | ||||||||
4.875%, 08/15/2026 (A) | 525 | 539 | ||||||
Adient US | ||||||||
9.000%, 04/15/2025 (A) | 144 | 160 | ||||||
7.000%, 05/15/2026 (A) | 5 | 5 | ||||||
Adtalem Global Education | ||||||||
5.500%, 03/01/2028 (A) | 1,710 | 1,688 | ||||||
Allied Universal Holdco | ||||||||
9.750%, 07/15/2027 (A) | 674 | 740 | ||||||
6.625%, 07/15/2026 | 856 | 908 | ||||||
American Axle & Manufacturing | ||||||||
6.875%, 07/01/2028 | 158 | 166 | ||||||
6.500%, 04/01/2027 | 375 | 389 | ||||||
6.250%, 04/01/2025 | 410 | 422 | ||||||
6.250%, 03/15/2026 | 600 | 615 | ||||||
American Greetings | ||||||||
8.750%, 04/15/2025 (A) | 3,210 | 3,306 | ||||||
Aramark Services | ||||||||
5.000%, 02/01/2028 (A) | 277 | 287 | ||||||
Asbury Automotive Group | ||||||||
4.750%, 03/01/2030 | 49 | 50 | ||||||
4.500%, 03/01/2028 | 2,031 | 2,078 | ||||||
Ashtead Capital | ||||||||
4.125%, 08/15/2025 (A) | 375 | 385 | ||||||
Ashton Woods USA | ||||||||
6.625%, 01/15/2028 (A) | 3,069 | 3,268 | ||||||
Aventine (Escrow Security) | ||||||||
0.000%, | 2,750 | – | ||||||
Bally’s | ||||||||
6.750%, 06/01/2027 (A) | 1,240 | 1,330 | ||||||
BCPE Ulysses Intermediate | ||||||||
7.750%cash/0.750% PIK, 04/01/2027 (A) | 1,091 | 1,132 | ||||||
Boyd Gaming | ||||||||
8.625%, 06/01/2025 (A) | 461 | 513 | ||||||
6.000%, 08/15/2026 | 300 | 312 | ||||||
Boyne USA | ||||||||
7.250%, 05/01/2025 (A) | 230 | 239 | ||||||
Brookfield Residential Properties | ||||||||
4.875%, 02/15/2030 (A) | 712 | 712 | ||||||
Cablevision Systems | ||||||||
5.875%, 09/15/2022 | 92 | 97 | ||||||
Caesars Entertainment | ||||||||
6.250%, 07/01/2025 (A) | 2,119 | 2,254 | ||||||
Caesars Resort Collection | ||||||||
5.250%, 10/15/2025 (A) | 1,640 | 1,654 | ||||||
Carnival | ||||||||
11.500%, 04/01/2023 (A) | 872 | 1,000 | ||||||
10.500%, 02/01/2026 (A) | 836 | 985 | ||||||
9.875%, 08/01/2027 (A) | 180 | 212 | ||||||
5.750%, 03/01/2027 (A) | 3,836 | 3,943 | ||||||
| Description | Face Amount (Thousands) | Market Value ($ Thousands) | ||||||
CORPORATE OBLIGATIONS (continued) |
| |||||||
CBS Radio | ||||||||
7.250%, 11/01/2024 (A) | $ | 315 | $ | 326 | ||||
CD&R Smokey Buyer | ||||||||
6.750%, 07/15/2025 (A) | 257 | 276 | ||||||
Cedar Fair | ||||||||
5.500%, 05/01/2025 (A) | 180 | 189 | ||||||
5.375%, 06/01/2024 | 1,207 | 1,221 | ||||||
5.250%, 07/15/2029 | 65 | 67 | ||||||
Cengage Learning | ||||||||
9.500%, 06/15/2024 (A) | 3,565 | 3,632 | ||||||
Century Communities | ||||||||
6.750%, 06/01/2027 | 444 | 472 | ||||||
5.875%, 07/15/2025 | 1,061 | 1,098 | ||||||
Cirsa Finance International Sarl | ||||||||
7.875%, 12/20/2023 (A) | 1,326 | 1,341 | ||||||
Claire’s Stores | ||||||||
9.000%, 03/15/2019 (B) | 815 | – | ||||||
Clarios Global | ||||||||
6.750%, 05/15/2025 (A) | 1,378 | 1,474 | ||||||
Constellation | ||||||||
8.500%, 09/15/2025 (A) | 485 | 457 | ||||||
Cooper-Standard Automotive | ||||||||
13.000%, 06/01/2024 (A) | 320 | 365 | ||||||
5.625%, 11/15/2026 (A) | 885 | 748 | ||||||
CSC Holdings | ||||||||
7.500%, 04/01/2028 (A) | 1,220 | 1,345 | ||||||
6.500%, 02/01/2029 (A) | 1,010 | 1,116 | ||||||
5.750%, 01/15/2030 (A) | 2,655 | 2,796 | ||||||
4.625%, 12/01/2030 (A) | 2,093 | 2,059 | ||||||
4.125%, 12/01/2030 (A) | 1,790 | 1,778 | ||||||
3.375%, 02/15/2031 (A) | 327 | 308 | ||||||
Cumulus Media New Holdings | ||||||||
6.750%, 07/01/2026 (A) | 2,590 | 2,639 | ||||||
Dana | ||||||||
5.625%, 06/15/2028 | 1,196 | 1,280 | ||||||
5.375%, 11/15/2027 | 539 | 566 | ||||||
Dana Financing Luxembourg Sarl | ||||||||
6.500%, 06/01/2026 (A) | 730 | 757 | ||||||
Diamond Sports Group | ||||||||
6.625%, 08/15/2027 (A) | 2,773 | 1,456 | ||||||
5.375%, 08/15/2026 (A) | 7,358 | 5,296 | ||||||
eG Global Finance | ||||||||
8.500%, 10/30/2025 (A) | 520 | 551 | ||||||
6.750%, 02/07/2025 (A) | 2,375 | 2,428 | ||||||
Entercom Media | ||||||||
6.750%, 03/31/2029 (A) | 2,269 | 2,358 | ||||||
Fontainebleau Las Vegas Holdings | ||||||||
11.000%, | 3,108 | – | ||||||
Ford Motor | ||||||||
9.625%, 04/22/2030 | 157 | 219 | ||||||
9.000%, 04/22/2025 | 1,567 | 1,898 | ||||||
8.500%, 04/21/2023 | 2,094 | 2,335 | ||||||
| SEI Institutional Managed Trust / Semi-Annual Report / March 31, 2021 | 107 |
SCHEDULE OF INVESTMENTS (Unaudited)
March 31, 2021
High Yield Bond Fund (Continued)
| Description | Face Amount (Thousands) | Market Value ($ Thousands) | ||||||
CORPORATE OBLIGATIONS (continued) |
| |||||||
Ford Motor Credit | ||||||||
5.584%, 03/18/2024 | $ | 65 | $ | 70 | ||||
5.125%, 06/16/2025 | 130 | 140 | ||||||
5.113%, 05/03/2029 | 1,855 | 1,988 | ||||||
4.687%, 06/09/2025 | 655 | 695 | ||||||
4.542%, 08/01/2026 | 730 | 772 | ||||||
4.271%, 01/09/2027 | 310 | 322 | ||||||
4.134%, 08/04/2025 | 250 | 261 | ||||||
4.125%, 08/17/2027 | 1,315 | 1,358 | ||||||
4.063%, 11/01/2024 | 984 | 1,029 | ||||||
4.000%, 11/13/2030 | 1,497 | 1,485 | ||||||
3.815%, 11/02/2027 | 745 | 753 | ||||||
3.813%, 10/12/2021 | 1,125 | 1,137 | ||||||
3.810%, 01/09/2024 | 123 | 127 | ||||||
3.470%, 04/05/2021 | 915 | 915 | ||||||
3.350%, 11/01/2022 | 160 | 163 | ||||||
3.096%, 05/04/2023 | 271 | 275 | ||||||
3.087%, 01/09/2023 | 34 | 35 | ||||||
2.979%, 08/03/2022 | 995 | 1,010 | ||||||
1.104%, VAR ICE LIBOR USD 3 Month+0.880%, 10/12/2021 | 575 | 572 | ||||||
Ford Motor Credit MTN | ||||||||
4.389%, 01/08/2026 | 740 | 778 | ||||||
Gap | ||||||||
8.875%, 05/15/2027 (A) | 85 | 99 | ||||||
GCI | ||||||||
4.750%, 10/15/2028 (A) | 314 | 321 | ||||||
GEMS MENASA Cayman | ||||||||
7.125%, 07/31/2026 (A) | 1,102 | 1,148 | ||||||
Getty Images | ||||||||
9.750%, 03/01/2027 (A) | 1,325 | 1,411 | ||||||
G-III Apparel Group | ||||||||
7.875%, 08/15/2025 (A) | 990 | 1,077 | ||||||
Goodyear Tire & Rubber | ||||||||
5.250%, 04/30/2031 | 180 | 180 | ||||||
GrubHub Holdings | ||||||||
5.500%, 07/01/2027 (A) | 1,020 | 1,061 | ||||||
Hanesbrands | ||||||||
4.625%, 05/15/2024 (A) | 2,293 | 2,433 | ||||||
Hertz | ||||||||
7.625%, | 172 | 185 | ||||||
7.125%, | 465 | 464 | ||||||
6.000%, | 540 | 541 | ||||||
5.500%, | 559 | 555 | ||||||
Hilton Domestic Operating | ||||||||
5.750%, 05/01/2028 (A) | 246 | 265 | ||||||
5.375%, 05/01/2025 (A) | 74 | 78 | ||||||
3.750%, 05/01/2029 (A) | 97 | 96 | ||||||
3.625%, 02/15/2032 (A) | 1,074 | 1,042 | ||||||
Houghton Mifflin Harcourt Publishers | ||||||||
9.000%, 02/15/2025 (A) | 2,550 | 2,728 | ||||||
| Description | Face Amount (Thousands) | Market Value ($ Thousands) | ||||||
CORPORATE OBLIGATIONS (continued) |
| |||||||
Inn Of The Mountain Gods Resort & Casino | ||||||||
9.250%, 11/30/2023 (F) | $ | 2,182 | $ | 2,149 | ||||
International Game Technology | ||||||||
6.250%, 01/15/2027 (A) | 2,800 | 3,102 | ||||||
4.125%, 04/15/2026 (A) | 200 | 206 | ||||||
IRB Holding Corp. | ||||||||
7.000%, 06/15/2025 (A) | 125 | 135 | ||||||
6.750%, 02/15/2026 (A) | 1,773 | 1,835 | ||||||
Ken Garff Automotive | ||||||||
4.875%, 09/15/2028 (A) | 278 | 278 | ||||||
L Brands | ||||||||
9.375%, 07/01/2025 (A) | 78 | 97 | ||||||
7.500%, 06/15/2029 | 271 | 308 | ||||||
6.875%, 07/01/2025 (A) | 252 | 280 | ||||||
6.875%, 11/01/2035 | 37 | 44 | ||||||
6.750%, 07/01/2036 | 1,040 | 1,227 | ||||||
6.625%, 10/01/2030 (A) | 1,099 | 1,245 | ||||||
LBM Acquisition | ||||||||
6.250%, 01/15/2029 (A) | 1,106 | 1,139 | ||||||
LCPR Senior Secured Financing DAC | ||||||||
6.750%, 10/15/2027 (A) | 1,999 | 2,131 | ||||||
Liberty Interactive | ||||||||
8.250%, 02/01/2030 | 3,457 | 3,924 | ||||||
Lions Gate Capital Holdings | ||||||||
6.375%, 02/01/2024 (A) | 1,375 | 1,419 | ||||||
5.500%, 04/15/2029 (A) | 510 | 510 | ||||||
Lithia Motors | ||||||||
4.375%, 01/15/2031 (A) | 1,135 | 1,178 | ||||||
Macy’s | ||||||||
8.375%, 06/15/2025 (A) | 311 | 344 | ||||||
Macy’s Retail Holdings | ||||||||
5.875%, 04/01/2029 (A) | 1,440 | 1,477 | ||||||
Marriott Ownership Resorts | ||||||||
6.500%, 09/15/2026 | 555 | 580 | ||||||
6.125%, 09/15/2025 (A) | 234 | 249 | ||||||
Mattamy Group | ||||||||
4.625%, 03/01/2030 (A) | 1,388 | 1,379 | ||||||
Mattel | ||||||||
6.750%, 12/31/2025 (A) | 273 | 287 | ||||||
5.875%, 12/15/2027 (A) | 190 | 209 | ||||||
3.750%, 04/01/2029 (A) | 98 | 99 | ||||||
3.375%, 04/01/2026 (A) | 78 | 81 | ||||||
McGraw Hill | ||||||||
8.000%, 11/30/2024 (A) | 2,075 | 2,093 | ||||||
Melco Resorts Finance | ||||||||
5.250%, 04/26/2026 | 826 | 859 | ||||||
Meritage Homes | ||||||||
3.875%, 04/15/2029 (A) | 796 | 796 | ||||||
MGM Resorts International | ||||||||
6.750%, 05/01/2025 | 850 | 914 | ||||||
6.000%, 03/15/2023 | 1,285 | 1,377 | ||||||
5.750%, 06/15/2025 | 467 | 509 | ||||||
| 108 | SEI Institutional Managed Trust / Semi-Annual Report / March 31, 2021 |
| Description | Face Amount (Thousands) | Market Value ($ Thousands) | ||||||
CORPORATE OBLIGATIONS (continued) |
| |||||||
Michaels Stores | ||||||||
4.750%, 10/01/2027 (A) | $ | 990 | $ | 1,077 | ||||
Millennium (Escrow Security) | ||||||||
7.625%, | 175 | – | ||||||
Monitronics International Inc | ||||||||
9.125%, | 5,936 | – | ||||||
National CineMedia | ||||||||
5.875%, 04/15/2028 (A) | 150 | 139 | ||||||
NCL | ||||||||
12.250%, 05/15/2024 (A) | 1,070 | 1,295 | ||||||
Neiman Marcus Group (Escrow Security) | ||||||||
0.000%, | 1,582 | 562 | ||||||
NESCO Holdings II | ||||||||
5.500%, 04/15/2029 (A) | 71 | 73 | ||||||
Newell Brands | ||||||||
5.875%, 04/01/2036 | 90 | 110 | ||||||
4.700%, 04/01/2026 | 240 | 265 | ||||||
NMG Holding | ||||||||
7.125%, 04/01/2026 (A) | 3,080 | 3,142 | ||||||
Nordstrom | ||||||||
8.750%, 05/15/2025 (A) | 280 | 317 | ||||||
Panther BF Aggregator 2 | ||||||||
8.500%, 05/15/2027 (A) | 3,224 | 3,471 | ||||||
6.250%, 05/15/2026 (A) | 1,444 | 1,534 | ||||||
Peninsula Pacific Entertainment | ||||||||
8.500%, 11/15/2027 (A) | 4,517 | 4,856 | ||||||
Penn National Gaming | ||||||||
5.625%, 01/15/2027 (A) | 1,300 | 1,349 | ||||||
PetSmart | ||||||||
7.750%, 02/15/2029 (A) | 673 | 731 | ||||||
4.750%, 02/15/2028 (A) | 611 | 626 | ||||||
Photo Holdings Merger Sub | ||||||||
8.500%, 10/01/2026 (A) | 575 | 623 | ||||||
PM General Purchaser | ||||||||
9.500%, 10/01/2028 (A) | 233 | 249 | ||||||
Prime Security Services Borrower | ||||||||
5.750%, 04/15/2026 | 1,044 | 1,127 | ||||||
3.375%, 08/31/2027 (A) | 605 | 587 | ||||||
QVC | ||||||||
4.750%, 02/15/2027 | 570 | 590 | ||||||
4.375%, 09/01/2028 | 278 | 280 | ||||||
Radiate Holdco | ||||||||
6.500%, 09/15/2028 (A) | 550 | 581 | ||||||
4.500%, 09/15/2026 (A) | 550 | 556 | ||||||
Remington Outdoor Company Inc | ||||||||
0.000%, 12/31/2049 (F) | 1,245 | – | ||||||
Royal Caribbean Cruises | ||||||||
11.500%, 06/01/2025 (A) | 458 | 534 | ||||||
10.875%, 06/01/2023 (A) | 903 | 1,039 | ||||||
9.125%, 06/15/2023 (A) | 581 | 640 | ||||||
Sabre GLBL Inc. | ||||||||
9.250%, 04/15/2025 (A) | 168 | 200 | ||||||
| Description | Face Amount (Thousands) | Market Value ($ Thousands) | ||||||
CORPORATE OBLIGATIONS (continued) |
| |||||||
7.375%, 09/01/2025 (A) | $ | 290 | $ | 316 | ||||
Scientific Games International | ||||||||
8.625%, 07/01/2025 (A) | 845 | 919 | ||||||
8.250%, 03/15/2026 (A) | 1,375 | 1,475 | ||||||
7.250%, 11/15/2029 (A) | 435 | 472 | ||||||
7.000%, 05/15/2028 (A) | 846 | 904 | ||||||
SeaWorld Parks & Entertainment | ||||||||
9.500%, 08/01/2025 (A) | 1,935 | 2,103 | ||||||
Service International | ||||||||
7.500%, 04/01/2027 | 640 | 765 | ||||||
Shea Homes | ||||||||
4.750%, 02/15/2028 (A) | 711 | 724 | ||||||
4.750%, 04/01/2029 (A) | 825 | 834 | ||||||
Signal Parent | ||||||||
6.125%, 04/01/2029 (A) | 340 | 337 | ||||||
Silversea Cruise Finance | ||||||||
7.250%, 02/01/2025 (A) | 1,493 | 1,545 | ||||||
Six Flags Entertainment | ||||||||
5.500%, 04/15/2027 (A) | 80 | 83 | ||||||
4.875%, 07/31/2024 (A) | 4,128 | 4,168 | ||||||
Six Flags Theme Parks | ||||||||
7.000%, 07/01/2025 (A) | 668 | 723 | ||||||
Specialty Building Products Holdings | ||||||||
6.375%, 09/30/2026 (A) | 1,045 | 1,079 | ||||||
Speedway Motorsports | ||||||||
4.875%, 11/01/2027 (A) | 846 | 846 | ||||||
SRS Distribution Inc. | ||||||||
8.250%, 07/01/2026 (A) | 1,310 | 1,380 | ||||||
Staples | ||||||||
10.750%, 04/15/2027 (A) | 1,355 | 1,338 | ||||||
7.500%, 04/15/2026 (A) | 1,753 | 1,849 | ||||||
Stars Group Holdings BV | ||||||||
7.000%, 07/15/2026 (A) | 175 | 183 | ||||||
Station Casinos | ||||||||
5.000%, 10/01/2025 (A) | 386 | 391 | ||||||
4.500%, 02/15/2028 (A) | 510 | 507 | ||||||
Studio City Finance | ||||||||
5.000%, 01/15/2029 (A) | 1,880 | 1,887 | ||||||
Sugarhouse HSP Gaming Prop Mezz | ||||||||
5.875%, 05/15/2025 (A) | 3,550 | 3,461 | ||||||
Superior Plus | ||||||||
4.500%, 03/15/2029 (A) | 97 | 98 | ||||||
Telenet Finance Luxembourg Notes Sarl | ||||||||
5.500%, 03/01/2028 (A) | 2,200 | 2,310 | ||||||
Tempur Sealy International | ||||||||
5.500%, 06/15/2026 | 605 | 632 | ||||||
4.000%, 04/15/2029 (A) | 385 | 383 | ||||||
Tenneco | ||||||||
7.875%, 01/15/2029 (A) | 138 | 155 | ||||||
5.375%, 12/15/2024 | 110 | 110 | ||||||
5.125%, 04/15/2029 (A) | 2,319 | 2,286 | ||||||
5.000%, 07/15/2026 | 3,160 | 2,978 | ||||||
| SEI Institutional Managed Trust / Semi-Annual Report / March 31, 2021 | 109 |
SCHEDULE OF INVESTMENTS (Unaudited)
March 31, 2021
High Yield Bond Fund (Continued)
| Description | Face Amount (Thousands) | Market Value ($ Thousands) | ||||||
CORPORATE OBLIGATIONS (continued) |
| |||||||
Terrier Media Buyer | ||||||||
8.875%, 12/15/2027 (A) | $ | 2,838 | $ | 3,054 | ||||
Univision Communications | ||||||||
9.500%, 05/01/2025 (A) | 1,580 | 1,730 | ||||||
6.625%, 06/01/2027 (A) | 784 | 837 | ||||||
Vail Resorts | ||||||||
6.250%, 05/15/2025 (A) | 437 | 466 | ||||||
Virgin Media Finance | ||||||||
5.000%, 07/15/2030 (A) | 493 | 492 | ||||||
Virgin Media Secured Finance | ||||||||
5.500%, 05/15/2029 (A) | 1,191 | 1,264 | ||||||
4.500%, 08/15/2030 (A) | 480 | 484 | ||||||
Virgin Media Vendor Financing Notes IV DAC | ||||||||
5.000%, 07/15/2028 (A) | 1,334 | 1,359 | ||||||
Vista Outdoor | ||||||||
4.500%, 03/15/2029 (A) | 1,080 | 1,069 | ||||||
White Capital Buyer | ||||||||
6.875%, 10/15/2028 (A) | 105 | 111 | ||||||
White Capital Parent | ||||||||
8.250%cash/0% PIK, 03/15/2026 (A) | 1,710 | 1,783 | ||||||
William Carter | ||||||||
5.625%, 03/15/2027 (A) | 225 | 238 | ||||||
Wynn Las Vegas | ||||||||
5.500%, 03/01/2025 (A) | 1,135 | 1,199 | ||||||
5.250%, 05/15/2027 (A) | 190 | 199 | ||||||
Wynn Resorts Finance | ||||||||
7.750%, 04/15/2025 (A) | 1,550 | 1,680 | ||||||
5.125%, 10/01/2029 (A) | 250 | 256 | ||||||
Yum! Brands | ||||||||
7.750%, 04/01/2025 (A) | 110 | 120 | ||||||
6.875%, 11/15/2037 | 1,065 | 1,289 | ||||||
5.350%, 11/01/2043 | 130 | 137 | ||||||
4.625%, 01/31/2032 | 217 | 222 | ||||||
3.625%, 03/15/2031 | 239 | 230 | ||||||
|
|
| ||||||
| 218,535 | ||||||||
|
|
| ||||||
Consumer Staples — 3.0% | ||||||||
Albertsons | ||||||||
5.875%, 02/15/2028 | 408 | 434 | ||||||
5.750%, 03/15/2025 | 61 | 63 | ||||||
4.875%, 02/15/2030 | 185 | 190 | ||||||
4.625%, 01/15/2027 | 2,072 | 2,148 | ||||||
3.500%, 02/15/2023 (A) | 130 | 133 | ||||||
3.500%, 03/15/2029 (A) | 1,756 | 1,671 | ||||||
3.250%, 03/15/2026 (A) | 499 | 497 | ||||||
Central Garden & Pet | ||||||||
5.125%, 02/01/2028 | 265 | 280 | ||||||
4.125%, 10/15/2030 | 187 | 189 | ||||||
Chobani | ||||||||
7.500%, 04/15/2025 (A) | 780 | 812 | ||||||
4.625%, 11/15/2028 (A) | 1,807 | 1,843 | ||||||
| Description | Face Amount (Thousands) | Market Value ($ Thousands) | ||||||
CORPORATE OBLIGATIONS (continued) |
| |||||||
Coty | ||||||||
6.500%, 04/15/2026 (A) | $ | 2,070 | $ | 2,086 | ||||
Dole Food | ||||||||
7.250%, 06/15/2025 (A) | 1,398 | 1,435 | ||||||
Edgewell Personal Care | ||||||||
5.500%, 06/01/2028 (A) | 305 | 322 | ||||||
4.125%, 04/01/2029 (A) | 117 | 116 | ||||||
Energizer Holdings | ||||||||
4.750%, 06/15/2028 (A) | 469 | 484 | ||||||
4.375%, 03/31/2029 (A) | 1,138 | 1,142 | ||||||
Fresh Market | ||||||||
9.750%, 05/01/2023 (A) | 1,100 | 1,132 | ||||||
High Ridge Brands Co. (Escrow Security) | ||||||||
8.478%, 03/15/2025 | 760 | – | ||||||
JBS USA LUX | ||||||||
5.500%, 01/15/2030 | 1,215 | 1,345 | ||||||
Kraft Heinz Foods | ||||||||
3.000%, 06/01/2026 | 2,080 | 2,193 | ||||||
Lamb Weston Holdings | ||||||||
4.875%, 11/01/2026 (A) | 360 | 373 | ||||||
4.875%, 05/15/2028 (A) | 135 | 145 | ||||||
4.625%, 11/01/2024 (A) | 1,917 | 1,989 | ||||||
LSF9 Atlantis Holdings | ||||||||
7.750%, 02/15/2026 (A) | 1,955 | 2,001 | ||||||
New Albertsons | ||||||||
8.700%, 05/01/2030 | 955 | 1,203 | ||||||
Performance Food Group | ||||||||
6.875%, 05/01/2025 (A) | 50 | 53 | ||||||
5.500%, 10/15/2027 (A) | 355 | 371 | ||||||
Post Holdings | ||||||||
5.750%, 03/01/2027 (A) | 995 | 1,046 | ||||||
5.625%, 01/15/2028 (A) | 565 | 594 | ||||||
5.500%, 12/15/2029 (A) | 621 | 665 | ||||||
4.625%, 04/15/2030 (A) | 153 | 153 | ||||||
Primo Water Holdings | ||||||||
5.500%, 04/01/2025 (A) | 2,427 | 2,494 | ||||||
Rite Aid | ||||||||
8.000%, 11/15/2026 (A) | 1,310 | 1,375 | ||||||
7.700%, 02/15/2027 | 925 | 905 | ||||||
7.500%, 07/01/2025 (A) | 2,465 | 2,561 | ||||||
Sigma Holdco BV | ||||||||
7.875%, 05/15/2026 (A) | 4,792 | 4,791 | ||||||
Simmons Foods | ||||||||
4.625%, 03/01/2029 (A) | 820 | 827 | ||||||
Spectrum Brands | ||||||||
5.750%, 07/15/2025 | 54 | 56 | ||||||
5.500%, 07/15/2030 (A) | 267 | 286 | ||||||
5.000%, 10/01/2029 (A) | 100 | 105 | ||||||
3.875%, 03/15/2031 (A) | 93 | 91 | ||||||
TreeHouse Foods | ||||||||
4.000%, 09/01/2028 | 40 | 40 | ||||||
| 110 | SEI Institutional Managed Trust / Semi-Annual Report / March 31, 2021 |
| Description | Face Amount (Thousands) | Market Value ($ Thousands) | ||||||
CORPORATE OBLIGATIONS (continued) |
| |||||||
Triton Water Holdings Inc. | ||||||||
6.250%, 04/01/2029 (A) | $ | 1,303 | $ | 1,329 | ||||
Turning Point Brands | ||||||||
5.625%, 02/15/2026 (A) | 1,140 | 1,183 | ||||||
Vector Group | ||||||||
10.500%, 11/01/2026 (A) | 2,890 | 3,096 | ||||||
5.750%, 02/01/2029 (A) | 970 | 1,000 | ||||||
|
|
| ||||||
| 47,247 | ||||||||
|
|
| ||||||
Energy — 11.0% | ||||||||
Aethon United BR | ||||||||
8.250%, 02/15/2026 (A) | 990 | 1,025 | ||||||
Antero Midstream Partners | ||||||||
7.875%, 05/15/2026 (A) | 838 | 901 | ||||||
5.750%, 03/01/2027 (A) | 1,622 | 1,622 | ||||||
5.750%, 01/15/2028 (A) | 300 | 300 | ||||||
5.375%, 09/15/2024 | 865 | 875 | ||||||
Antero Resources | ||||||||
8.375%, 07/15/2026 (A) | 1,555 | 1,714 | ||||||
7.625%, 02/01/2029 (A) | 375 | 399 | ||||||
5.625%, 06/01/2023 | 400 | 401 | ||||||
Apache | ||||||||
5.100%, 09/01/2040 | 2,061 | 2,015 | ||||||
4.875%, 11/15/2027 | 1,747 | 1,791 | ||||||
4.625%, 11/15/2025 | 468 | 482 | ||||||
4.375%, 10/15/2028 | 278 | 277 | ||||||
Archrock Partners | ||||||||
6.250%, 04/01/2028 (A) | 1,928 | 1,958 | ||||||
Ascent Resources Utica Holdings | ||||||||
9.000%, 11/01/2027 (A) | 678 | 861 | ||||||
8.250%, 12/31/2028 (A) | 2,416 | 2,513 | ||||||
7.000%, 11/01/2026 (A) | 1,606 | 1,605 | ||||||
Baytex Energy | ||||||||
8.750%, 04/01/2027 (A) | 390 | 354 | ||||||
Blue Racer Midstream | ||||||||
7.625%, 12/15/2025 (A) | 870 | 938 | ||||||
6.625%, 07/15/2026 (A) | 205 | 211 | ||||||
Buckeye Partners | ||||||||
4.500%, 03/01/2028 (A) | 230 | 231 | ||||||
4.125%, 03/01/2025 (A) | 230 | 235 | ||||||
4.125%, 12/01/2027 | 305 | 301 | ||||||
California Resources | ||||||||
7.125%, 02/01/2026 (A) | 284 | 289 | ||||||
Carrizo Oil & Gas | ||||||||
8.250%, 07/15/2025 | 185 | 157 | ||||||
6.250%, 04/15/2023 | 175 | 156 | ||||||
Cheniere Energy | ||||||||
4.625%, 10/15/2028 (A) | 1,045 | 1,087 | ||||||
Cheniere Energy Partners | ||||||||
5.625%, 10/01/2026 | 1,321 | 1,381 | ||||||
4.500%, 10/01/2029 | 6,562 | 6,824 | ||||||
4.000%, 03/01/2031 (A) | 549 | 559 | ||||||
| Description | Face Amount (Thousands) | Market Value ($ Thousands) | ||||||
CORPORATE OBLIGATIONS (continued) |
| |||||||
Chesapeake Energy | ||||||||
5.875%, 02/01/2029 (A) | $ | 227 | $ | 241 | ||||
5.500%, 02/01/2026 (A) | 1,022 | 1,064 | ||||||
Chesapeake Energy (Escrow Security) | ||||||||
0.000%, 12/31/2049 | 3,650 | – | ||||||
Citgo Holding | ||||||||
9.250%, 08/01/2024 (A) | 4,540 | 4,506 | ||||||
CITGO Petroleum | ||||||||
6.375%, 06/15/2026 (A) | 476 | 480 | ||||||
CNX Midstream Partners | ||||||||
6.500%, 03/15/2026 (A) | 1,035 | 1,053 | ||||||
CNX Resources | ||||||||
7.250%, 03/14/2027 (A) | 2,240 | 2,406 | ||||||
6.000%, 01/15/2029 (A) | 1,031 | 1,071 | ||||||
Comstock Resources | ||||||||
7.500%, 05/15/2025 (A) | 190 | 197 | ||||||
6.750%, 03/01/2029 (A) | 2,262 | 2,319 | ||||||
Continental Resources | ||||||||
5.750%, 01/15/2031 (A) | 1,294 | 1,462 | ||||||
Crestwood Midstream Partners | ||||||||
5.750%, 04/01/2025 | 1,420 | 1,428 | ||||||
5.625%, 05/01/2027 (A) | 265 | 260 | ||||||
CrownRock | ||||||||
5.625%, 10/15/2025 (A) | 1,520 | 1,551 | ||||||
DCP Midstream Operating | ||||||||
8.125%, 08/16/2030 | 1,125 | 1,458 | ||||||
5.625%, 07/15/2027 | 638 | 693 | ||||||
5.125%, 05/15/2029 | 538 | 572 | ||||||
Delek Logistics Partners | ||||||||
6.750%, 05/15/2025 | 811 | 811 | ||||||
Devon Energy | ||||||||
7.950%, 04/15/2032 | 834 | 1,118 | ||||||
Endeavor Energy Resources | ||||||||
6.625%, 07/15/2025 (A) | 148 | 158 | ||||||
Energy Transfer | ||||||||
5.500%, 06/01/2027 | 1,564 | 1,613 | ||||||
EnLink Midstream | ||||||||
5.625%, 01/15/2028 (A) | 195 | 189 | ||||||
5.375%, 06/01/2029 | 4,066 | 3,802 | ||||||
EnLink Midstream Partners | ||||||||
4.850%, 07/15/2026 | 190 | 184 | ||||||
Enviva Partners | ||||||||
6.500%, 01/15/2026 (A) | 2,160 | 2,263 | ||||||
EP Energy (Escrow Security) | ||||||||
0.000%, 05/01/2021 | 972 | – | ||||||
0.000%, 06/15/2023 | 669 | – | ||||||
0.000%, 02/15/2025 | 653 | – | ||||||
EQM Midstream Partners | ||||||||
6.500%, 07/01/2027 (A) | 712 | 774 | ||||||
6.000%, 07/01/2025 (A) | 747 | 804 | ||||||
4.750%, 01/15/2031 (A) | 204 | 198 | ||||||
4.500%, 01/15/2029 (A) | �� | 424 | 413 | |||||
| SEI Institutional Managed Trust / Semi-Annual Report / March 31, 2021 | 111 |
SCHEDULE OF INVESTMENTS (Unaudited)
March 31, 2021
High Yield Bond Fund (Continued)
| Description | Face Amount (Thousands) | Market Value ($ Thousands) | ||||||
CORPORATE OBLIGATIONS (continued) |
| |||||||
EQT | ||||||||
8.500%, 02/01/2030 | $ | 540 | $ | 689 | ||||
7.625%, 02/01/2025 | 1,460 | 1,680 | ||||||
5.000%, 01/15/2029 | 92 | 98 | ||||||
3.900%, 10/01/2027 | 10 | 10 | ||||||
Exterran Energy Solutions | ||||||||
8.125%, 05/01/2025 | 1,819 | 1,673 | ||||||
Genesis Energy | ||||||||
8.000%, 01/15/2027 | 717 | 726 | ||||||
7.750%, 02/01/2028 | 708 | 708 | ||||||
6.500%, 10/01/2025 | 825 | 809 | ||||||
Great Western Petroleum | ||||||||
12.000%, 09/01/2025 (A) | 1,038 | 924 | ||||||
Gulfport Energy | ||||||||
6.375%, 05/15/2025 (B) | 183 | 165 | ||||||
6.375%, 01/15/2026 (B) | 585 | 526 | ||||||
6.000%, 10/15/2024 (B) | 215 | 192 | ||||||
Harvest Midstream I | ||||||||
7.500%, 09/01/2028 (A) | 1,990 | 2,139 | ||||||
Hess Midstream Operations | ||||||||
5.625%, 02/15/2026 (A) | 2,043 | 2,111 | ||||||
Hilcorp Energy I | ||||||||
6.250%, 11/01/2028 (A) | 57 | 59 | ||||||
6.000%, 02/01/2031 (A) | 1,462 | 1,484 | ||||||
5.750%, 02/01/2029 (A) | 2,704 | 2,728 | ||||||
Holly Energy Partners | ||||||||
5.000%, 02/01/2028 (A) | 190 | 192 | ||||||
Laredo Petroleum | ||||||||
10.125%, 01/15/2028 | 1,574 | 1,509 | ||||||
9.500%, 01/15/2025 | 1,992 | 1,917 | ||||||
Marathon Oil | ||||||||
6.600%, 10/01/2037 | 1,527 | 1,898 | ||||||
MEG Energy | ||||||||
7.125%, 02/01/2027 (A) | 1,580 | 1,655 | ||||||
6.500%, 01/15/2025 (A) | 384 | 397 | ||||||
5.875%, 02/01/2029 (A) | 82 | 82 | ||||||
Moss Creek Resources Holdings | ||||||||
10.500%, 05/15/2027 (A) | 1,820 | 1,570 | ||||||
7.500%, 01/15/2026 (A) | 2,022 | 1,628 | ||||||
Motiva Enterprises | ||||||||
6.850%, 01/15/2040 (A) | 967 | 1,150 | ||||||
Nabors Industries | ||||||||
7.250%, 01/15/2026 (A) | 155 | 129 | ||||||
5.750%, 02/01/2025 | 430 | 319 | ||||||
New Fortress Energy | ||||||||
6.750%, 09/15/2025 (A) | 618 | 635 | ||||||
NGL Energy Operating | ||||||||
7.500%, 02/01/2026 (A) | 3,396 | 3,485 | ||||||
NGL Energy Partners | ||||||||
7.500%, 11/01/2023 | 2,075 | 2,002 | ||||||
7.500%, 04/15/2026 | 155 | 132 | ||||||
6.125%, 03/01/2025 | 2,123 | 1,805 | ||||||
| Description | Face Amount (Thousands) | Market Value ($ Thousands) | ||||||
CORPORATE OBLIGATIONS (continued) |
| |||||||
Northern Oil and Gas | ||||||||
8.125%, 03/01/2028 (A) | $ | 1,991 | $ | 1,980 | ||||
NuStar Logistics | ||||||||
6.375%, 10/01/2030 | 685 | 740 | ||||||
6.000%, 06/01/2026 | 180 | 194 | ||||||
5.750%, 10/01/2025 | 685 | 733 | ||||||
5.625%, 04/28/2027 | 50 | 52 | ||||||
Oasis Midstream Partners | ||||||||
8.000%, 04/01/2029 (A) | 248 | 255 | ||||||
Occidental Petroleum | ||||||||
8.875%, 07/15/2030 | 1,188 | 1,498 | ||||||
8.500%, 07/15/2027 | 1,188 | 1,408 | ||||||
8.000%, 07/15/2025 | 696 | 799 | ||||||
6.625%, 09/01/2030 | 968 | 1,088 | ||||||
6.450%, 09/15/2036 | 1,380 | 1,524 | ||||||
6.375%, 09/01/2028 | 1,771 | 1,944 | ||||||
6.125%, 01/01/2031 | 3,012 | 3,326 | ||||||
5.875%, 09/01/2025 | 721 | 769 | ||||||
5.550%, 03/15/2026 | 980 | 1,039 | ||||||
5.500%, 12/01/2025 | 2,079 | 2,194 | ||||||
4.625%, 06/15/2045 | 1,165 | 1,016 | ||||||
4.500%, 07/15/2044 | 95 | 81 | ||||||
4.400%, 04/15/2046 | 95 | 80 | ||||||
3.400%, 04/15/2026 | 753 | 724 | ||||||
3.200%, 08/15/2026 | 2,827 | 2,708 | ||||||
2.900%, 08/15/2024 | 271 | 268 | ||||||
2.700%, 02/15/2023 | 299 | 298 | ||||||
Ovintiv | ||||||||
8.125%, 09/15/2030 | 95 | 123 | ||||||
6.500%, 08/15/2034 | 65 | 78 | ||||||
Parkland Fuel | ||||||||
5.875%, 07/15/2027 (A) | 1,255 | 1,338 | ||||||
PBF Holding | ||||||||
9.250%, 05/15/2025 (A) | 175 | 178 | ||||||
6.000%, 02/15/2028 | 205 | 151 | ||||||
PDC Energy | ||||||||
5.750%, 05/15/2026 | 1,805 | 1,872 | ||||||
Peabody Energy | ||||||||
6.375%, 03/31/2025 (A) | 769 | 300 | ||||||
Precision Drilling | ||||||||
7.750%, 12/15/2023 | 280 | 281 | ||||||
7.125%, 01/15/2026 (A) | 285 | 277 | ||||||
Range Resources | ||||||||
8.250%, 01/15/2029 (A) | 107 | 114 | ||||||
4.875%, 05/15/2025 | 708 | 700 | ||||||
Seventy Seven Energy (Escrow Security) | ||||||||
6.500%, | 305 | – | ||||||
Seventy Seven Operating (Escrow Security) | ||||||||
6.625%, | 1,869 | – | ||||||
Shelf Drilling Holdings | ||||||||
8.875%, 11/15/2024 (A) | 335 | 335 | ||||||
8.250%, 02/15/2025 (A) | 1,415 | 1,033 | ||||||
| 112 | SEI Institutional Managed Trust / Semi-Annual Report / March 31, 2021 |
| Description | Face Amount (Thousands) | Market Value ($ Thousands) | ||||||
CORPORATE OBLIGATIONS (continued) |
| |||||||
SM Energy | ||||||||
6.625%, 01/15/2027 | $ | 718 | $ | 664 | ||||
6.125%, 11/15/2022 | 105 | 103 | ||||||
5.625%, 06/01/2025 | 1,785 | 1,651 | ||||||
5.000%, 01/15/2024 | 1,288 | 1,211 | ||||||
Southwestern Energy | ||||||||
7.750%, 10/01/2027 | 838 | 896 | ||||||
7.500%, 04/01/2026 | 1,000 | 1,058 | ||||||
6.450%, 01/23/2025 | 502 | 536 | ||||||
Summit Midstream Holdings | ||||||||
5.750%, 04/15/2025 | 218 | 178 | ||||||
5.500%, 08/15/2022 | 1,383 | 1,338 | ||||||
Sunoco | ||||||||
5.875%, 03/15/2028 | 1,585 | 1,659 | ||||||
4.500%, 05/15/2029 (A) | 668 | 665 | ||||||
Tallgrass Energy Partners | ||||||||
7.500%, 10/01/2025 (A) | 381 | 410 | ||||||
6.000%, 03/01/2027 (A) | 2,065 | 2,086 | ||||||
6.000%, 12/31/2030 (A) | 3,516 | 3,476 | ||||||
5.500%, 09/15/2024 (A) | 75 | 76 | ||||||
5.500%, 01/15/2028 (A) | 70 | 68 | ||||||
Targa Resources Partners | ||||||||
6.875%, 01/15/2029 | 192 | 212 | ||||||
6.500%, 07/15/2027 | 2,833 | 3,079 | ||||||
5.875%, 04/15/2026 | 525 | 550 | ||||||
5.000%, 01/15/2028 | 1,056 | 1,100 | ||||||
4.875%, 02/01/2031 | 250 | 253 | ||||||
4.250%, 11/15/2023 | 65 | 65 | ||||||
4.000%, 01/15/2032 (A) | 167 | 157 | ||||||
TerraForm Power Operating | ||||||||
4.750%, 01/15/2030 (A) | 375 | 389 | ||||||
4.250%, 01/31/2023 (A) | 1,164 | 1,202 | ||||||
Transocean | ||||||||
11.500%, 01/30/2027 (A) | 1,045 | 896 | ||||||
8.000%, 02/01/2027 (A) | 1,670 | 998 | ||||||
7.500%, 04/15/2031 | 990 | 474 | ||||||
Transocean Guardian | ||||||||
5.875%, 01/15/2024 (A) | 1,354 | 1,184 | ||||||
Transocean Pontus | ||||||||
6.125%, 08/01/2025 (A) | 1,593 | 1,505 | ||||||
Transocean Proteus | ||||||||
6.250%, 12/01/2024 (A) | 816 | 775 | ||||||
USA Compression Partners | ||||||||
6.875%, 04/01/2026 | 1,365 | 1,400 | ||||||
6.875%, 09/01/2027 | 1,700 | 1,751 | ||||||
Valaris PLC | ||||||||
5.850%, 01/15/2044 (B) | 2,145 | 279 | ||||||
5.400%, 12/01/2042 (B) | 280 | 36 | ||||||
4.875%, 06/01/2022 (B) | 480 | 63 | ||||||
Vine Energy Holdings | ||||||||
6.750%, 04/15/2029 (A) | 1,312 | 1,312 | ||||||
| Description | Face Amount (Thousands) | Market Value ($ Thousands) | ||||||
CORPORATE OBLIGATIONS (continued) |
| |||||||
Vine Oil & Gas | ||||||||
9.750%, 04/15/2023 (A) | $ | 591 | $ | 633 | ||||
8.750%, 04/15/2023 (A) | 228 | 243 | ||||||
Western Gas Partners | ||||||||
3.950%, 06/01/2025 | 244 | 251 | ||||||
Western Midstream Operating | ||||||||
4.750%, 08/15/2028 | 855 | 893 | ||||||
4.650%, 07/01/2026 | 870 | 913 | ||||||
2.325%, VAR ICE LIBOR USD 3 Month+1.850%, 01/13/2023 | 520 | 510 | ||||||
WPX Energy | ||||||||
5.875%, 06/15/2028 | 81 | 89 | ||||||
5.750%, 06/01/2026 | 199 | 208 | ||||||
|
|
| ||||||
| 170,769 | ||||||||
|
|
| ||||||
Financials — 6.0% | ||||||||
Acrisure | ||||||||
7.000%, 11/15/2025 (A) | 1,543 | 1,593 | ||||||
4.250%, 02/15/2029 (A) | 1,254 | 1,233 | ||||||
AG Issuer | ||||||||
6.250%, 03/01/2028 (A) | 856 | 896 | ||||||
Alliant Holdings Intermediate | ||||||||
6.750%, 10/15/2027 (A) | 1,415 | 1,519 | ||||||
AmWINS Group | ||||||||
7.750%, 07/01/2026 (A) | 559 | 598 | ||||||
AssuredPartners | ||||||||
7.000%, 08/15/2025 (A) | 1,625 | 1,676 | ||||||
5.625%, 01/15/2029 (A) | 1,029 | 1,049 | ||||||
Bank of America | ||||||||
5.875%, VAR ICE LIBOR USD 3 Month+2.931%(D) | 855 | 932 | ||||||
Barclays | ||||||||
7.750%, VAR USD Swap Semi 30/360 | 1,630 | 1,779 | ||||||
6.125%, VAR US Treas Yield Curve | 590 | 648 | ||||||
Citigroup | ||||||||
5.950%, VAR ICE LIBOR USD 3 Month+3.905%(D) | 50 | 54 | ||||||
5.000%, VAR United States Secured Overnight Financing Rate+3.813%(D) | 2,339 | 2,410 | ||||||
Credit Agricole | ||||||||
6.875%, VAR USD Swap Semi 30/360 | 612 | 679 | ||||||
Donnelley Financial Solutions | ||||||||
8.250%, 10/15/2024 | 603 | 629 | ||||||
Finance of America Funding | ||||||||
7.875%, 11/15/2025 (A) | 1,688 | 1,746 | ||||||
Freedom Mortgage | ||||||||
8.250%, 04/15/2025 (A) | 3,345 | 3,483 | ||||||
| SEI Institutional Managed Trust / Semi-Annual Report / March 31, 2021 | 113 |
SCHEDULE OF INVESTMENTS (Unaudited)
March 31, 2021
High Yield Bond Fund (Continued)
| Description | Face Amount (Thousands) | Market Value ($ Thousands) | ||||||
CORPORATE OBLIGATIONS (continued) |
| |||||||
8.125%, 11/15/2024 (A) | $ | 1,555 | $ | 1,611 | ||||
7.625%, 05/01/2026 (A) | 1,235 | 1,296 | ||||||
FS Energy and Power Fund | ||||||||
7.500%, 08/15/2023 (A) | 900 | 904 | ||||||
Genworth Holdings | ||||||||
4.900%, 08/15/2023 | 657 | 645 | ||||||
Genworth Mortgage Holdings | ||||||||
6.500%, 08/15/2025 (A) | 1,106 | 1,195 | ||||||
HAT Holdings I | ||||||||
6.000%, 04/15/2025 (A) | 1,489 | 1,571 | ||||||
3.750%, 09/15/2030 (A) | 724 | 697 | ||||||
Home Point Capital | ||||||||
5.000%, 02/01/2026 (A) | 1,385 | 1,371 | ||||||
HSBC Holdings | ||||||||
4.600%, VAR US Treas Yield Curve Rate T Note Const Mat 5 Yr+3.649%(D) | 783 | 773 | ||||||
Hunt | ||||||||
6.250%, 02/15/2026 (A) | 937 | 967 | ||||||
5.250%, 04/15/2029 (A) | 2,550 | 2,550 | ||||||
Intesa Sanpaolo MTN | ||||||||
5.710%, 01/15/2026 (A) | 945 | 1,059 | ||||||
Jefferies Finance | ||||||||
6.250%, 06/03/2026 (A) | 834 | 876 | ||||||
JPMorgan Chase | ||||||||
5.000%, VAR United States Secured Overnight Financing Rate+3.380%(D) | 856 | 885 | ||||||
4.000%, VAR United States Secured Overnight Financing Rate+2.745%(D) | 1,691 | 1,674 | ||||||
Ladder Capital Finance Holdings LLLP | ||||||||
5.250%, 03/15/2022 (A) | 1,280 | 1,290 | ||||||
5.250%, 10/01/2025 (A) | 636 | 636 | ||||||
4.250%, 02/01/2027 (A) | 1,288 | 1,269 | ||||||
LD Holdings Group | ||||||||
6.500%, 11/01/2025 (A) | 1,298 | 1,360 | ||||||
6.125%, 04/01/2028 (A) | 1,265 | 1,286 | ||||||
Lloyds Banking Group | ||||||||
7.500%, VAR USD Swap Semi 30/360 5 Yr Curr+4.760%(D) | 1,965 | 2,191 | ||||||
LPL Holdings | ||||||||
4.625%, 11/15/2027 (A) | 2,231 | 2,315 | ||||||
Merger Sub II | ||||||||
10.750%, 08/01/2027 (A) | 1,741 | 1,948 | ||||||
MGIC Investment | ||||||||
5.250%, 08/15/2028 | 340 | 354 | ||||||
Morgan Stanley | ||||||||
5.875%, VAR ICE LIBOR USD 3 Month+4.435%(D) | 855 | 962 | ||||||
5.300%, VAR ICE LIBOR USD 3 Month+3.160%(D) | 535 | 551 | ||||||
| Description | Face Amount (Thousands) | Market Value ($ Thousands) | ||||||
CORPORATE OBLIGATIONS (continued) |
| |||||||
MPH Acquisition Holdings | ||||||||
5.750%, 11/01/2028 (A) | $ | 1,592 | $ | 1,561 | ||||
MSCI | ||||||||
5.375%, 05/15/2027 (A) | 300 | 321 | ||||||
Nationstar Mortgage Holdings | ||||||||
6.000%, 01/15/2027 (A) | 1,464 | 1,519 | ||||||
5.500%, 08/15/2028 (A) | 2,822 | 2,833 | ||||||
5.125%, 12/15/2030 (A) | 443 | 435 | ||||||
Navient | ||||||||
5.000%, 03/15/2027 | 706 | 708 | ||||||
New Residential Investment | ||||||||
6.250%, 10/15/2025 (A) | 3,329 | 3,341 | ||||||
NFP | ||||||||
7.000%, 05/15/2025 (A) | 276 | 296 | ||||||
6.875%, 08/15/2028 (A) | 864 | 897 | ||||||
OneMain Finance | ||||||||
7.125%, 03/15/2026 | 2,105 | 2,428 | ||||||
6.625%, 01/15/2028 | 342 | 388 | ||||||
5.375%, 11/15/2029 | 1,172 | 1,247 | ||||||
4.000%, 09/15/2030 | 1,517 | 1,475 | ||||||
PennyMac Financial Services | ||||||||
4.250%, 02/15/2029 (A) | 1,661 | 1,588 | ||||||
PRA Group | ||||||||
7.375%, 09/01/2025 (A) | 1,465 | 1,568 | ||||||
Quicken Loans | ||||||||
5.250%, 01/15/2028 (A) | 682 | 718 | ||||||
3.875%, 03/01/2031 (A) | 642 | 619 | ||||||
3.625%, 03/01/2029 (A) | 86 | 83 | ||||||
Radian Group | ||||||||
4.875%, 03/15/2027 | 550 | 577 | ||||||
Saracen Development | ||||||||
11.000%cash/3.000% PIK, | 2,296 | 2,647 | ||||||
Starwood Property Trust | ||||||||
5.500%, 11/01/2023 (A) | 1,240 | 1,296 | ||||||
4.750%, 03/15/2025 | 1,366 | 1,418 | ||||||
StoneX Group | ||||||||
8.625%, 06/15/2025 (A) | 778 | 822 | ||||||
United Wholesale Mortgage | ||||||||
5.500%, 11/15/2025 (A) | 1,716 | 1,789 | ||||||
Verscend Escrow | ||||||||
9.750%, 08/15/2026 (A) | 1,130 | 1,212 | ||||||
VistaJet Malta Finance | ||||||||
10.500%, 06/01/2024 (A) | 3,591 | 3,914 | ||||||
Voya Financial | ||||||||
4.700%, VAR ICE LIBOR USD 3 Month+2.084%, 01/23/2048 | 778 | 794 | ||||||
WeWork | ||||||||
7.875%, 05/01/2025 (A) | 3,090 | 3,059 | ||||||
|
| |||||||
| 92,713 | ||||||||
|
| |||||||
| 114 | SEI Institutional Managed Trust / Semi-Annual Report / March 31, 2021 |
| Description | Face Amount (Thousands) | Market Value ($ Thousands) | ||||||
CORPORATE OBLIGATIONS (continued) |
| |||||||
Health Care — 6.5% | ||||||||
Acadia Healthcare | ||||||||
5.500%, 07/01/2028 (A) | $ | 763 | $ | 803 | ||||
AdaptHealth | ||||||||
4.625%, 08/01/2029 (A) | 69 | 69 | ||||||
Air Methods | ||||||||
8.000%, 05/15/2025 (A) | 5,500 | 5,170 | ||||||
Akumin | ||||||||
7.000%, 11/01/2025 (A) | 1,050 | 1,117 | ||||||
Avantor Funding | ||||||||
4.625%, 07/15/2028 (A) | 321 | 335 | ||||||
Bausch Health | ||||||||
9.000%, 12/15/2025 (A) | 1,695 | 1,841 | ||||||
7.250%, 05/30/2029 (A) | 195 | 218 | ||||||
7.000%, 03/15/2024 (A) | 723 | 740 | ||||||
7.000%, 01/15/2028 (A) | 945 | 1,026 | ||||||
6.250%, 02/15/2029 (A) | 3,638 | 3,861 | ||||||
6.125%, 04/15/2025 (A) | 1,935 | 1,984 | ||||||
5.250%, 01/30/2030 (A) | 3,604 | 3,618 | ||||||
5.250%, 02/15/2031 (A) | 1,370 | 1,363 | ||||||
5.000%, 01/30/2028 (A) | 890 | 907 | ||||||
5.000%, 02/15/2029 (A) | 706 | 697 | ||||||
Bausch Health Americas | ||||||||
9.250%, 04/01/2026 (A) | 385 | 427 | ||||||
8.500%, 01/31/2027 (A) | 842 | 934 | ||||||
Catalent Pharma Solutions | ||||||||
3.125%, 02/15/2029 (A) | 58 | 56 | ||||||
Centene | ||||||||
5.375%, 06/01/2026 (A) | 530 | 554 | ||||||
4.625%, 12/15/2029 | 917 | 992 | ||||||
4.250%, 12/15/2027 | 1,637 | 1,721 | ||||||
3.375%, 02/15/2030 | 320 | 323 | ||||||
Change Healthcare Holdings | ||||||||
5.750%, 03/01/2025 | 829 | 845 | ||||||
CHS | ||||||||
8.000%, 03/15/2026 (A) | 85 | 92 | ||||||
6.875%, 04/15/2029 (A) | 1,684 | 1,760 | ||||||
6.000%, 01/15/2029 (A) | 120 | 127 | ||||||
5.625%, 03/15/2027 (A) | 240 | 252 | ||||||
4.750%, 02/15/2031 (A) | 1,110 | 1,084 | ||||||
DaVita | ||||||||
3.750%, 02/15/2031 (A) | 2,996 | 2,871 | ||||||
Emergent BioSolutions | ||||||||
3.875%, 08/15/2028 (A) | 3,198 | 3,126 | ||||||
Encompass Health | ||||||||
5.750%, 09/15/2025 | 915 | 945 | ||||||
4.750%, 02/01/2030 | 1,384 | 1,424 | ||||||
4.625%, 04/01/2031 | 137 | 142 | ||||||
4.500%, 02/01/2028 | 375 | 384 | ||||||
Endo DAC | ||||||||
9.500%, 07/31/2027 (A) | 1,121 | 1,218 | ||||||
6.000%, 02/01/2025 (A) | 698 | 612 | ||||||
| Description | Face Amount (Thousands) | Market Value ($ Thousands) | ||||||
CORPORATE OBLIGATIONS (continued) |
| |||||||
6.000%, 06/30/2028 (A) | $ | 1,257 | $ | 1,018 | ||||
Endo Finance | ||||||||
5.750%, 01/15/2022 (A) | 981 | 976 | ||||||
Endo Luxembourg Finance I S.a.r.l. | ||||||||
6.125%, 04/01/2029 (A) | 2,134 | 2,156 | ||||||
Envision Healthcare Corporation | ||||||||
8.750%, 10/15/2026 (A) | 2,628 | 1,945 | ||||||
Global Medical Response | ||||||||
6.500%, 10/01/2025 (A) | 1,164 | 1,205 | ||||||
HCA | ||||||||
5.875%, 02/15/2026 | 4,455 | 5,107 | ||||||
5.875%, 02/01/2029 | 465 | 542 | ||||||
5.625%, 09/01/2028 | 130 | 150 | ||||||
5.375%, 02/01/2025 | 2,747 | 3,064 | ||||||
3.500%, 09/01/2030 | 2,485 | 2,514 | ||||||
Hill-Rom Holdings | ||||||||
5.000%, 02/15/2025 (A) | 445 | 457 | ||||||
4.375%, 09/15/2027 (A) | 1,000 | 1,030 | ||||||
Hologic | ||||||||
3.250%, 02/15/2029 (A) | 508 | 502 | ||||||
Horizon Pharma USA | ||||||||
5.500%, 08/01/2027 (A) | 797 | 851 | ||||||
IQVIA | ||||||||
5.000%, 10/15/2026 (A) | 805 | 836 | ||||||
Jaguar Holding II | ||||||||
5.000%, 06/15/2028 (A) | 95 | 99 | ||||||
4.625%, 06/15/2025 (A) | 96 | 100 | ||||||
Legacy LifePoint Health | ||||||||
6.750%, 04/15/2025 (A) | 374 | 397 | ||||||
LifePoint Health | ||||||||
5.375%, 01/15/2029 (A) | 490 | 483 | ||||||
4.375%, 02/15/2027 (A) | 5,501 | 5,391 | ||||||
Mallinckrodt International Finance | ||||||||
5.625%, | 315 | 221 | ||||||
5.500%, | 630 | 443 | ||||||
MEDNAX | ||||||||
6.250%, 01/15/2027 (A) | 992 | 1,061 | ||||||
Ortho-Clinical Diagnostics | ||||||||
7.250%, 02/01/2028 (A) | 1,139 | 1,248 | ||||||
Owens & Minor | ||||||||
4.500%, 03/31/2029 (A) | 112 | 113 | ||||||
Par Pharmaceutical | ||||||||
7.500%, 04/01/2027 (A) | 1,757 | 1,868 | ||||||
Prestige Brands | ||||||||
5.125%, 01/15/2028 (A) | 115 | 121 | ||||||
Prime Security Services Borrower | ||||||||
6.250%, 01/15/2028 (A) | 640 | 666 | ||||||
Radiology Partners | ||||||||
9.250%, 02/01/2028 (A) | 974 | 1,060 | ||||||
RP Escrow Issuer | ||||||||
5.250%, 12/15/2025 (A) | 1,051 | 1,089 | ||||||
| SEI Institutional Managed Trust / Semi-Annual Report / March 31, 2021 | 115 |
SCHEDULE OF INVESTMENTS (Unaudited)
March 31, 2021
High Yield Bond Fund (Continued)
| Description | Face Amount (Thousands) | Market Value ($ Thousands) | ||||||
CORPORATE OBLIGATIONS (continued) |
| |||||||
Select Medical | ||||||||
6.250%, 08/15/2026 (A) | $ | 841 | $ | 894 | ||||
Surgery Center Holdings | ||||||||
6.750%, 07/01/2025 (A) | 828 | 846 | ||||||
Syneos Health | ||||||||
3.625%, 01/15/2029 (A) | 625 | 608 | ||||||
Tenet Healthcare | ||||||||
7.500%, 04/01/2025 (A) | 164 | 177 | ||||||
6.875%, 11/15/2031 | 595 | 661 | ||||||
6.250%, 02/01/2027 (A) | 1,433 | 1,513 | ||||||
6.125%, 10/01/2028 (A) | 5,877 | 6,121 | ||||||
5.125%, 05/01/2025 | 1,729 | 1,753 | ||||||
5.125%, 11/01/2027 (A) | 480 | 502 | ||||||
4.875%, 01/01/2026 (A) | 1,684 | 1,750 | ||||||
4.625%, 07/15/2024 | 495 | 503 | ||||||
4.625%, 06/15/2028 (A) | 2,470 | 2,532 | ||||||
US Acute Care Solutions | ||||||||
6.375%, 03/01/2026 (A) | 594 | 616 | ||||||
Varex Imaging | ||||||||
7.875%, 10/15/2027 (A) | 1,335 | 1,485 | ||||||
|
| |||||||
| 100,312 | ||||||||
|
| |||||||
Industrials — 8.5% | ||||||||
ACCO Brands | ||||||||
4.250%, 03/15/2029 (A) | 285 | 277 | ||||||
ADT Security | ||||||||
4.875%, 07/15/2032 (A) | 1,508 | 1,532 | ||||||
Allison Transmission | ||||||||
5.875%, 06/01/2029 (A) | 210 | 230 | ||||||
4.750%, 10/01/2027 (A) | 1,632 | 1,734 | ||||||
3.750%, 01/30/2031 (A) | 190 | 184 | ||||||
American Airlines | ||||||||
11.750%, 07/15/2025 (A) | 1,184 | 1,464 | ||||||
5.750%, 04/20/2029 (A) | 3,144 | 3,351 | ||||||
5.500%, 04/20/2026 (A) | 2,213 | 2,307 | ||||||
American Builders & Contractors Supply | ||||||||
4.000%, 01/15/2028 (A) | 2,134 | 2,134 | ||||||
American Woodmark | ||||||||
4.875%, 03/15/2026 (A) | 585 | 600 | ||||||
Arconic | ||||||||
6.125%, 02/15/2028 (A) | 729 | 779 | ||||||
5.900%, 02/01/2027 | 535 | 607 | ||||||
ASGN | ||||||||
4.625%, 05/15/2028 (A) | 1,122 | 1,158 | ||||||
ATS Automation Tooling Systems | ||||||||
4.125%, 12/15/2028 (A) | 270 | 268 | ||||||
Avis Budget Car Rental | ||||||||
6.375%, 04/01/2024 (A) | 1,080 | 1,098 | ||||||
5.375%, 03/01/2029 (A) | 163 | 169 | ||||||
5.250%, 03/15/2025 (A) | 195 | 198 | ||||||
Beacon Roofing Supply | ||||||||
4.875%, 11/01/2025 (A) | 850 | 869 | ||||||
| Description | Face Amount (Thousands) | Market Value ($ Thousands) | ||||||
CORPORATE OBLIGATIONS (continued) |
| |||||||
Boeing | ||||||||
5.805%, 05/01/2050 | $ | 1,112 | $ | 1,402 | ||||
5.150%, 05/01/2030 | 225 | 259 | ||||||
Boise Cascade | ||||||||
4.875%, 07/01/2030 (A) | 924 | 968 | ||||||
Bombardier | ||||||||
7.875%, 04/15/2027 (A) | 820 | 804 | ||||||
7.500%, 12/01/2024 (A) | 1,856 | 1,854 | ||||||
7.500%, 03/15/2025 (A) | 875 | 861 | ||||||
6.000%, 10/15/2022 (A) | 4,073 | 4,073 | ||||||
Brand Industrial Services | ||||||||
8.500%, 07/15/2025 (A) | 1,464 | 1,475 | ||||||
Brink’s | ||||||||
5.500%, 07/15/2025 (A) | 235 | 248 | ||||||
Builders FirstSource | ||||||||
5.000%, 03/01/2030 (A) | 853 | 894 | ||||||
BWX Technologies | ||||||||
5.375%, 07/15/2026 (A) | 1,692 | 1,747 | ||||||
4.125%, 06/30/2028 (A) | 397 | 401 | ||||||
4.125%, 04/15/2029 (A) | 1,706 | 1,730 | ||||||
Cargo Aircraft Management | ||||||||
4.750%, 02/01/2028 (A) | 1,900 | 1,959 | ||||||
CDW | ||||||||
4.250%, 04/01/2028 | 370 | 383 | ||||||
3.250%, 02/15/2029 | 171 | 169 | ||||||
Clark Equipment | ||||||||
5.875%, 06/01/2025 (A) | 696 | 736 | ||||||
Clean Harbors | ||||||||
4.875%, 07/15/2027 (A) | 1,267 | 1,337 | ||||||
Cloud Crane | ||||||||
10.125%, 08/01/2024 (A) | 290 | 303 | ||||||
Core & Main Holdings LP | ||||||||
8.625%cash/0.750% PIK, 09/15/2024 (A) | 1,635 | 1,660 | ||||||
Core & Main LP | ||||||||
6.125%, 08/15/2025 (A) | 1,331 | 1,366 | ||||||
CoreCivic | ||||||||
5.000%, 10/15/2022 | 245 | 247 | ||||||
4.625%, 05/01/2023 | 475 | 468 | ||||||
CP Atlas Buyer | ||||||||
7.000%, 12/01/2028 (A) | 2,501 | 2,629 | ||||||
Delta Air Lines | ||||||||
7.375%, 01/15/2026 | 283 | 332 | ||||||
7.000%, 05/01/2025 (A) | 2,035 | 2,343 | ||||||
4.750%, 10/20/2028 (A) | 1,627 | 1,768 | ||||||
EnerSys | ||||||||
4.375%, 12/15/2027 (A) | 559 | 572 | ||||||
EnPro Industries | ||||||||
5.750%, 10/15/2026 | 328 | 347 | ||||||
Fortress Transportation & Infrastructure Investors | ||||||||
9.750%, 08/01/2027 (A) | 995 | 1,133 | ||||||
| 116 | SEI Institutional Managed Trust / Semi-Annual Report / March 31, 2021 |
| Description | Face Amount (Thousands) | Market Value ($ Thousands) | ||||||
CORPORATE OBLIGATIONS (continued) |
| |||||||
6.750%, 03/15/2022 | $ | 468 | $ | 469 | ||||
6.500%, 10/01/2025 (A) | 1,170 | 1,223 | ||||||
GFL Environmental | ||||||||
8.500%, 05/01/2027 (A) | 232 | 255 | ||||||
5.125%, 12/15/2026 (A) | 1,125 | 1,185 | ||||||
4.000%, 08/01/2028 (A) | 874 | 846 | ||||||
3.750%, 08/01/2025 (A) | 208 | 211 | ||||||
3.500%, 09/01/2028 (A) | 650 | 630 | ||||||
GrafTech Finance | ||||||||
4.625%, 12/15/2028 (A) | 1,985 | 1,996 | ||||||
Granite Holdings US Acquisition | ||||||||
11.000%, 10/01/2027 (A) | 1,895 | 2,137 | ||||||
Griffon | ||||||||
5.750%, 03/01/2028 | 450 | 480 | ||||||
H&E Equipment Services | ||||||||
3.875%, 12/15/2028 (A) | 1,790 | 1,741 | ||||||
Harsco | ||||||||
5.750%, 07/31/2027 (A) | 465 | 476 | ||||||
Hawaiian Brand Intellectual Property | ||||||||
5.750%, 01/20/2026 (A) | 818 | 869 | ||||||
Herc Holdings | ||||||||
5.500%, 07/15/2027 (A) | 2,160 | 2,299 | ||||||
Hillman Group | ||||||||
6.375%, 07/15/2022 (A) | 3,171 | 3,175 | ||||||
Howmet Aerospace | ||||||||
6.875%, 05/01/2025 | 155 | 180 | ||||||
Icahn Enterprises | ||||||||
4.750%, 09/15/2024 | 2,305 | 2,394 | ||||||
4.375%, 02/01/2029 (A) | 560 | 547 | ||||||
JELD-WEN | ||||||||
6.250%, 05/15/2025 (A) | 235 | 250 | ||||||
4.875%, 12/15/2027 (A) | 15 | 15 | ||||||
4.625%, 12/15/2025 (A) | 355 | 359 | ||||||
Korn Ferry | ||||||||
4.625%, 12/15/2027 (A) | 1,444 | 1,471 | ||||||
Masonite International | ||||||||
5.750%, 09/15/2026 (A) | 42 | 44 | ||||||
5.375%, 02/01/2028 (A) | 198 | 210 | ||||||
MasTec | ||||||||
4.500%, 08/15/2028 (A) | 343 | 356 | ||||||
Mileage Plus Holdings LLC | ||||||||
6.500%, 06/20/2027 (A) | 1,306 | 1,430 | ||||||
New Enterprise Stone & Lime | ||||||||
6.250%, 03/15/2026 (A) | 1,035 | 1,061 | ||||||
Nielsen Finance | ||||||||
5.875%, 10/01/2030 (A) | 412 | 445 | ||||||
5.625%, 10/01/2028 (A) | 412 | 433 | ||||||
5.000%, 04/15/2022 (A) | 253 | 253 | ||||||
PGT Escrow Issuer | ||||||||
6.750%, 08/01/2026 (A) | 300 | 319 | ||||||
PowerTeam Services | ||||||||
9.033%, 12/04/2025 (A) | 2,139 | 2,375 | ||||||
| Description | Face Amount (Thousands) | Market Value ($ Thousands) | ||||||
CORPORATE OBLIGATIONS (continued) |
| |||||||
RBS Global | ||||||||
4.875%, 12/15/2025 (A) | $ | 1,491 | $ | 1,521 | ||||
Rolls-Royce | ||||||||
5.750%, 10/15/2027 (A) | 1,955 | 2,080 | ||||||
Sensata Technologies | ||||||||
5.000%, 10/01/2025 (A) | 1,173 | 1,296 | ||||||
4.375%, 02/15/2030 (A) | 1,779 | 1,866 | ||||||
4.000%, 04/15/2029 (A) | 416 | 423 | ||||||
3.750%, 02/15/2031 (A) | 414 | 408 | ||||||
Signature Aviation US Holdings | ||||||||
4.000%, 03/01/2028 (A) | 3,630 | 3,691 | ||||||
Spirit AeroSystems | ||||||||
7.500%, 04/15/2025 (A) | 268 | 288 | ||||||
4.600%, 06/15/2028 | 1,900 | 1,862 | ||||||
3.950%, 06/15/2023 | 1,305 | 1,292 | ||||||
Spirit Loyalty Cayman | ||||||||
8.000%, 09/20/2025 (A) | 695 | 785 | ||||||
SPX FLOW | ||||||||
5.875%, 08/15/2026 (A) | 230 | 239 | ||||||
Standard Industries | ||||||||
5.000%, 02/15/2027 (A) | 30 | 31 | ||||||
4.750%, 01/15/2028 (A) | 725 | 752 | ||||||
3.375%, 01/15/2031 (A) | 132 | 125 | ||||||
Stericycle | ||||||||
3.875%, 01/15/2029 (A) | 109 | 108 | ||||||
Stevens Holding | ||||||||
6.125%, 10/01/2026 (A) | 245 | 262 | ||||||
Team Health Holdings | ||||||||
6.375%, 02/01/2025 (A) | 4,066 | 3,583 | ||||||
Terex | ||||||||
5.625%, 02/01/2025 (A) | 710 | 730 | ||||||
5.000%, 05/15/2029 (A) | 120 | 124 | ||||||
Tervita | ||||||||
11.000%, 12/01/2025 (A) | 2,220 | 2,520 | ||||||
TransDigm | ||||||||
8.000%, 12/15/2025 (A) | 500 | 544 | ||||||
6.250%, 03/15/2026 (A) | 3,537 | 3,749 | ||||||
5.500%, 11/15/2027 | 1,982 | 2,049 | ||||||
4.625%, 01/15/2029 (A) | 488 | 481 | ||||||
TriMas | ||||||||
4.875%, 10/15/2025 (A) | 205 | 210 | ||||||
4.125%, 04/15/2029 (A) | 224 | 224 | ||||||
Triumph Group | ||||||||
8.875%, 06/01/2024 (A) | 344 | 387 | ||||||
7.750%, 08/15/2025 | 2,360 | 2,372 | ||||||
6.250%, 09/15/2024 (A) | 250 | 254 | ||||||
5.250%, 06/01/2022 | 165 | 164 | ||||||
Tutor Perini | ||||||||
6.875%, 05/01/2025 (A) | 4,915 | 5,082 | ||||||
Uber Technologies | ||||||||
7.500%, 05/15/2025 (A) | 554 | 598 | ||||||
| SEI Institutional Managed Trust / Semi-Annual Report / March 31, 2021 | 117 |
SCHEDULE OF INVESTMENTS (Unaudited)
March 31, 2021
High Yield Bond Fund (Continued)
| Description | Face Amount (Thousands) | Market Value ($ Thousands) | ||||||
CORPORATE OBLIGATIONS (continued) |
| |||||||
United Airlines Holdings | ||||||||
4.875%, 01/15/2025 | $ | 1,510 | $ | 1,538 | ||||
United Rentals North America | ||||||||
5.500%, 05/15/2027 | 378 | 403 | ||||||
4.875%, 01/15/2028 | 875 | 922 | ||||||
Univar Solutions USA | ||||||||
5.125%, 12/01/2027 (A) | 281 | 292 | ||||||
Wabash National | ||||||||
5.500%, 10/01/2025 (A) | 340 | 348 | ||||||
Welbilt | ||||||||
9.500%, 02/15/2024 | 190 | 196 | ||||||
WESCO Distribution | ||||||||
7.250%, 06/15/2028 (A) | 356 | 398 | ||||||
7.125%, 06/15/2025 (A) | 356 | 389 | ||||||
Western Global Airlines | ||||||||
10.375%, 08/15/2025 (A) | 1,135 | 1,277 | ||||||
Wolverine Escrow | ||||||||
13.125%, 11/15/2027 (A) | 100 | 86 | ||||||
9.000%, 11/15/2026 (A) | 614 | 613 | ||||||
XPO Logistics | ||||||||
6.750%, 08/15/2024 (A) | 1,781 | 1,868 | ||||||
6.250%, 05/01/2025 (A) | 215 | 230 | ||||||
6.125%, 09/01/2023 (A) | 230 | 234 | ||||||
|
| |||||||
| 132,455 | ||||||||
|
| |||||||
Information Technology — 3.4% |
| |||||||
ACI Worldwide | ||||||||
5.750%, 08/15/2026 (A) | 394 | 416 | ||||||
Alliance Data Systems | ||||||||
4.750%, 12/15/2024 (A) | 840 | 862 | ||||||
AMS | ||||||||
7.000%, 07/31/2025 (A) | 1,617 | 1,731 | ||||||
Arches Buyer | ||||||||
6.125%, 12/01/2028 (A) | 1,686 | 1,737 | ||||||
4.250%, 06/01/2028 (A) | 108 | 108 | ||||||
Ascend Learning LLC | ||||||||
6.875%, 08/01/2025 (A) | 530 | 543 | ||||||
Austin BidCo | ||||||||
7.125%, 12/15/2028 (A) | 955 | 972 | ||||||
Avaya | ||||||||
6.125%, 09/15/2028 (A) | 2,918 | 3,104 | ||||||
Black Knight InfoServ | ||||||||
3.625%, 09/01/2028 (A) | 236 | 232 | ||||||
BY Crown Parent | ||||||||
4.250%, 01/31/2026 (A) | 1,136 | 1,174 | ||||||
Castle US Holding | ||||||||
9.500%, 02/15/2028 (A) | 1,025 | 1,045 | ||||||
CDK Global | ||||||||
5.875%, 06/15/2026 | 33 | 34 | ||||||
5.250%, 05/15/2029 (A) | 190 | 204 | ||||||
CommScope | ||||||||
8.250%, 03/01/2027 (A) | 1,973 | 2,111 | ||||||
| Description | Face Amount (Thousands) | Market Value ($ Thousands) | ||||||
CORPORATE OBLIGATIONS (continued) |
| |||||||
7.125%, 07/01/2028 (A) | $ | 325 | $ | 345 | ||||
6.000%, 03/01/2026 (A) | 600 | 634 | ||||||
CommScope Technologies | ||||||||
6.000%, 06/15/2025 (A) | 2,654 | 2,707 | ||||||
CPI CG | ||||||||
8.625%, 03/15/2026 (A) | 800 | 838 | ||||||
Diebold Nixdorf | ||||||||
9.375%, 07/15/2025 (A) | 694 | 773 | ||||||
Entegris | ||||||||
4.625%, 02/10/2026 (A) | 635 | 657 | ||||||
4.375%, 04/15/2028 (A) | 725 | 748 | ||||||
Gartner | ||||||||
4.500%, 07/01/2028 (A) | 50 | 52 | ||||||
3.750%, 10/01/2030 (A) | 117 | 116 | ||||||
Go Daddy Operating | ||||||||
5.250%, 12/01/2027 (A) | 1,868 | 1,952 | ||||||
Hughes Satellite Systems | ||||||||
5.250%, 08/01/2026 | 549 | 604 | ||||||
Microchip Technology | ||||||||
4.250%, 09/01/2025 (A) | 136 | 142 | ||||||
NCR | ||||||||
8.125%, 04/15/2025 (A) | 122 | 134 | ||||||
6.125%, 09/01/2029 (A) | 450 | 476 | ||||||
5.750%, 09/01/2027 (A) | 1,225 | 1,296 | ||||||
5.125%, 04/15/2029 (A) | 843 | 852 | ||||||
5.000%, 10/01/2028 (A) | 692 | 699 | ||||||
Nuance Communications | ||||||||
5.625%, 12/15/2026 | 1,757 | 1,843 | ||||||
ON Semiconductor | ||||||||
3.875%, 09/01/2028 (A) | 416 | 428 | ||||||
Open Text Holdings | ||||||||
4.125%, 02/15/2030 (A) | 1,885 | 1,911 | ||||||
Plantronics | ||||||||
4.750%, 03/01/2029 (A) | 164 | 161 | ||||||
Presidio Holdings | ||||||||
8.250%, 02/01/2028 (A) | 567 | 617 | ||||||
4.875%, 02/01/2027 (A) | 160 | 164 | ||||||
PTC | ||||||||
4.000%, 02/15/2028 (A) | 1,438 | 1,460 | ||||||
3.625%, 02/15/2025 (A) | 549 | 563 | ||||||
Science Applications International | ||||||||
4.875%, 04/01/2028 (A) | 1,982 | 2,049 | ||||||
Seagate HDD Cayman | ||||||||
5.750%, 12/01/2034 | 856 | 971 | ||||||
3.375%, 07/15/2031 (A) | 1,221 | 1,174 | ||||||
3.125%, 07/15/2029 (A) | 1,865 | 1,801 | ||||||
SS&C Technologies | ||||||||
5.500%, 09/30/2027 (A) | 498 | 530 | ||||||
Switch | ||||||||
3.750%, 09/15/2028 (A) | 58 | 57 | ||||||
Synaptics | ||||||||
4.000%, 06/15/2029 (A) | 1,224 | 1,215 | ||||||
| 118 | SEI Institutional Managed Trust / Semi-Annual Report / March 31, 2021 |
| Description | Face Amount (Thousands) | Market Value ($ Thousands) | ||||||
CORPORATE OBLIGATIONS (continued) |
| |||||||
Twilio | ||||||||
3.875%, 03/15/2031 | $ | 479 | $ | 489 | ||||
3.625%, 03/15/2029 | 479 | 485 | ||||||
Veritas US | ||||||||
10.500%, 02/01/2024 (A) | 1,031 | 1,055 | ||||||
7.500%, 09/01/2025 (A) | 3,280 | 3,411 | ||||||
Viasat | ||||||||
6.500%, 07/15/2028 (A) | 2,455 | 2,585 | ||||||
5.625%, 09/15/2025 (A) | 1,548 | 1,573 | ||||||
Xerox Holdings | ||||||||
5.500%, 08/15/2028 (A) | 278 | 288 | ||||||
5.000%, 08/15/2025 (A) | 278 | 289 | ||||||
ZoomInfo Technologies | ||||||||
3.875%, 02/01/2029 (A) | 19 | 19 | ||||||
|
|
| ||||||
| 52,436 | ||||||||
|
|
| ||||||
Materials — 7.2% |
| |||||||
Alcoa Nederland Holding BV | ||||||||
7.000%, 09/30/2026 (A) | 285 | 301 | ||||||
6.750%, 09/30/2024 (A) | 495 | 512 | ||||||
6.125%, 05/15/2028 (A) | 1,098 | 1,196 | ||||||
5.500%, 12/15/2027 (A) | 200 | 215 | ||||||
Allegheny Technologies | ||||||||
7.875%, 08/15/2023 | 1,764 | 1,913 | ||||||
5.875%, 12/01/2027 | 999 | 1,034 | ||||||
Arconic | ||||||||
6.000%, 05/15/2025 (A) | 283 | 305 | ||||||
ARD Finance | ||||||||
6.500%cash/0% PIK, 06/30/2027 (A) | 2,092 | 2,196 | ||||||
Ardagh Packaging Finance | ||||||||
6.000%, 02/15/2025 (A) | 356 | 367 | ||||||
5.250%, 04/30/2025 (A) | 1,280 | 1,345 | ||||||
5.250%, 08/15/2027 (A) | 455 | 466 | ||||||
4.125%, 08/15/2026 (A) | 993 | 1,019 | ||||||
Ashland | ||||||||
6.875%, 05/15/2043 | 851 | 1,064 | ||||||
Axalta Coating Systems | ||||||||
4.750%, 06/15/2027 (A) | 394 | 412 | ||||||
3.375%, 02/15/2029 (A) | 205 | 200 | ||||||
Baffinland Iron Mines | ||||||||
8.750%, 07/15/2026 (A) | 4,170 | 4,410 | ||||||
Berry Global | ||||||||
4.500%, 02/15/2026 (A) | 1,343 | 1,377 | ||||||
Big River Steel | ||||||||
6.625%, 01/31/2029 (A) | 264 | 288 | ||||||
Boart Longyear Management Pty | ||||||||
10.000%cash/4.500% PIK, 12/31/2022 | 2,103 | 1,609 | ||||||
BWAY Holding | ||||||||
7.250%, 04/15/2025 (A) | 1,994 | 1,994 | ||||||
Carpenter Technology | ||||||||
6.375%, 07/15/2028 | 184 | 198 | ||||||
| Description | Face Amount (Thousands) | Market Value ($ Thousands) | ||||||
CORPORATE OBLIGATIONS (continued) |
| |||||||
CEMEX Materials | ||||||||
7.700%, 07/21/2025 (A) | $ | 920 | $ | 1,049 | ||||
CF Industries | ||||||||
5.150%, 03/15/2034 | 228 | 261 | ||||||
4.950%, 06/01/2043 | 682 | 781 | ||||||
Chemours | ||||||||
7.000%, 05/15/2025 | 320 | 329 | ||||||
5.750%, 11/15/2028 (A) | 2,436 | 2,565 | ||||||
5.375%, 05/15/2027 | 511 | 542 | ||||||
Clearwater Paper | ||||||||
5.375%, 02/01/2025 (A) | 910 | 965 | ||||||
Cleveland-Cliffs | ||||||||
4.875%, 03/01/2031 (A) | 139 | 137 | ||||||
4.625%, 03/01/2029 (A) | 193 | 193 | ||||||
Compass Minerals International | ||||||||
6.750%, 12/01/2027 (A) | 1,120 | 1,198 | ||||||
Constellium | ||||||||
5.875%, 02/15/2026 (A) | 1,316 | 1,356 | ||||||
5.750%, 05/15/2024 (A) | 847 | 858 | ||||||
5.625%, 06/15/2028 (A) | 495 | 522 | ||||||
3.750%, 04/15/2029 (A) | 267 | 255 | ||||||
Cornerstone Chemical | ||||||||
6.750%, 08/15/2024 (A) | 6,420 | 6,051 | ||||||
Crown Americas | ||||||||
4.750%, 02/01/2026 | 835 | 866 | ||||||
4.250%, 09/30/2026 | 2,195 | 2,332 | ||||||
CVR Partners | ||||||||
9.250%, 06/15/2023 (A) | 1,905 | 1,922 | ||||||
Element Solutions | ||||||||
3.875%, 09/01/2028 (A) | 1,772 | 1,750 | ||||||
First Quantum Minerals | ||||||||
7.500%, 04/01/2025 (A) | 1,350 | 1,394 | ||||||
6.875%, 03/01/2026 (A) | 1,941 | 2,009 | ||||||
6.875%, 10/15/2027 (A) | 693 | 743 | ||||||
6.500%, 03/01/2024 (A) | 1,189 | 1,207 | ||||||
Flex Acquisition | ||||||||
7.875%, 07/15/2026 (A) | 822 | 862 | ||||||
FMG Resources August 2006 Pty | ||||||||
4.375%, 04/01/2031 (A) | 147 | 150 | ||||||
Forterra Finance | ||||||||
6.500%, 07/15/2025 (A) | 185 | 199 | ||||||
Freeport-McMoRan | ||||||||
5.450%, 03/15/2043 | 2,690 | 3,230 | ||||||
5.400%, 11/14/2034 | 589 | 701 | ||||||
4.625%, 08/01/2030 | 526 | 572 | ||||||
4.375%, 08/01/2028 | 696 | 738 | ||||||
4.125%, 03/01/2028 | 334 | 351 | ||||||
GCP Applied Technologies | ||||||||
5.500%, 04/15/2026 (A) | 575 | 592 | ||||||
Graham Packaging Company | ||||||||
7.125%, 08/15/2028 (A) | 85 | 90 | ||||||
| SEI Institutional Managed Trust / Semi-Annual Report / March 31, 2021 | 119 |
SCHEDULE OF INVESTMENTS (Unaudited)
March 31, 2021
High Yield Bond Fund (Continued)
| Description | Face Amount (Thousands) | Market Value ($ Thousands) | ||||||
CORPORATE OBLIGATIONS (continued) |
| |||||||
Greif | ||||||||
6.500%, 03/01/2027 (A) | $ | 345 | $ | 364 | ||||
Hecla Mining | ||||||||
7.250%, 02/15/2028 | 620 | 665 | ||||||
Hexion | ||||||||
7.875%, 07/15/2027 (A) | 1,365 | 1,468 | ||||||
IAMGOLD | ||||||||
5.750%, 10/15/2028 (A) | 1,860 | 1,884 | ||||||
INEOS Group Holdings | ||||||||
5.625%, 08/01/2024 (A) | 1,340 | 1,357 | ||||||
Innophos Holdings | ||||||||
9.375%, 02/15/2028 (A) | 1,790 | 1,929 | ||||||
Kraton Polymers | ||||||||
4.250%, 12/15/2025 (A) | 798 | 801 | ||||||
LABL Escrow Issuer | ||||||||
10.500%, 07/15/2027 (A) | 290 | 323 | ||||||
6.750%, 07/15/2026 (A) | 390 | 418 | ||||||
LSB Industries | ||||||||
9.625%, 05/01/2023 (A) | 5,050 | 5,177 | ||||||
Mineral Resources | ||||||||
8.125%, 05/01/2027 (A) | 2,205 | 2,437 | ||||||
Mountain Province Diamonds | ||||||||
8.000%, 12/15/2022 (A) | 2,470 | 2,266 | ||||||
New Gold Inc | ||||||||
7.500%, 07/15/2027 (A) | 1,010 | 1,046 | ||||||
6.375%, 05/15/2025 (A) | 199 | 205 | ||||||
Northwest Acquisitions ULC | ||||||||
7.125%, 11/01/2022 (A)(B) | 2,115 | – | ||||||
Nouryon Holding BV | ||||||||
8.000%, 10/01/2026 (A) | 455 | 483 | ||||||
NOVA Chemicals | ||||||||
5.250%, 06/01/2027 (A) | 590 | 619 | ||||||
5.000%, 05/01/2025 (A) | 1,800 | 1,876 | ||||||
4.875%, 06/01/2024 (A) | 300 | 314 | ||||||
Novelis | ||||||||
5.875%, 09/30/2026 (A) | 1,884 | 1,972 | ||||||
4.750%, 01/30/2030 (A) | 745 | 767 | ||||||
OCI | ||||||||
5.250%, 11/01/2024 (A) | 1,779 | 1,850 | ||||||
4.625%, 10/15/2025 (A) | 635 | 656 | ||||||
Owens-Brockway Glass Container | ||||||||
6.625%, 05/13/2027 (A) | 1,195 | 1,299 | ||||||
6.375%, 08/15/2025 (A) | 600 | 663 | ||||||
5.875%, 08/15/2023 (A) | 679 | 727 | ||||||
Rain CII Carbon | ||||||||
7.250%, 04/01/2025 (A) | 4,700 | 4,865 | ||||||
Reichhold Industries | ||||||||
9.000%, | 859 | – | ||||||
Reynolds Group Issuer | ||||||||
4.000%, 10/15/2027 | 1,125 | 1,102 | ||||||
Scotts Miracle-Gro | ||||||||
4.500%, 10/15/2029 | 84 | 87 | ||||||
| Description | Face Amount (Thousands) | Market Value ($ Thousands) | ||||||
CORPORATE OBLIGATIONS (continued) |
| |||||||
4.000%, 04/01/2031 (A) | $ | 639 | $ | 630 | ||||
Summit Materials | ||||||||
5.250%, 01/15/2029 | 119 | 124 | ||||||
5.125%, 06/01/2025 (A) | 1,302 | 1,322 | ||||||
Taseko Mines | ||||||||
7.000%, 02/15/2026 (A) | 1,659 | 1,689 | ||||||
Trident TPI Holdings | ||||||||
9.250%, 08/01/2024 (A) | 1,410 | 1,495 | ||||||
Trinseo Materials Operating | ||||||||
5.375%, 09/01/2025 (A) | 460 | 473 | ||||||
5.125%, 04/01/2029 (A) | 156 | 161 | ||||||
Trivium Packaging Finance BV | ||||||||
8.500%, 08/15/2027 (A) | 453 | 492 | ||||||
5.500%, 08/15/2026 (A) | 599 | 628 | ||||||
Tronox | ||||||||
6.500%, 05/01/2025 (A) | 507 | 544 | ||||||
4.625%, 03/15/2029 (A) | 1,038 | 1,039 | ||||||
United States Steel | ||||||||
6.875%, 08/15/2025 | 778 | 793 | ||||||
6.875%, 03/01/2029 | 1,444 | 1,480 | ||||||
Valvoline | ||||||||
4.250%, 02/15/2030 (A) | 185 | 189 | ||||||
Venator Finance Sarl | ||||||||
9.500%, 07/01/2025 (A) | 871 | 973 | ||||||
5.750%, 07/15/2025 (A) | 2,400 | 2,328 | ||||||
Warrior Met Coal | ||||||||
8.000%, 11/01/2024 (A) | 1,350 | 1,384 | ||||||
|
|
| ||||||
| 112,555 | ||||||||
|
|
| ||||||
Real Estate — 2.2% | ||||||||
Brookfield Property | ||||||||
5.750%, 05/15/2026 | 5,328 | 5,481 | ||||||
Diversified Healthcare Trust | ||||||||
9.750%, 06/15/2025 | 2,080 | 2,355 | ||||||
4.375%, 03/01/2031 | 645 | 630 | ||||||
GEO Group | ||||||||
5.125%, 04/01/2023 | 35 | 31 | ||||||
Howard Hughes | ||||||||
5.375%, 08/01/2028 (A) | 562 | 591 | ||||||
Iron Mountain | ||||||||
5.250%, 03/15/2028 (A) | 756 | 785 | ||||||
5.250%, 07/15/2030 (A) | 765 | 789 | ||||||
5.000%, 07/15/2028 (A) | 990 | 1,012 | ||||||
4.875%, 09/15/2027 (A) | 1,667 | 1,706 | ||||||
4.875%, 09/15/2029 (A) | 1,000 | 1,012 | ||||||
4.500%, 02/15/2031 (A) | 268 | 265 | ||||||
iStar | ||||||||
4.750%, 10/01/2024 | 566 | 589 | ||||||
4.250%, 08/01/2025 | 1,119 | 1,127 | ||||||
Kennedy-Wilson | ||||||||
5.000%, 03/01/2031 | 94 | 95 | ||||||
4.750%, 03/01/2029 | 95 | 96 | ||||||
| 120 | SEI Institutional Managed Trust / Semi-Annual Report / March 31, 2021 |
| Description | Face Amount (Thousands) | Market Value ($ Thousands) | ||||||
CORPORATE OBLIGATIONS (continued) |
| |||||||
MGM Growth Properties Operating Partnership | ||||||||
5.750%, 02/01/2027 | $ | 204 | $ | 225 | ||||
5.625%, 05/01/2024 | 1,130 | 1,213 | ||||||
4.625%, 06/15/2025 (A) | 261 | 275 | ||||||
4.500%, 09/01/2026 | 1,618 | 1,694 | ||||||
4.500%, 01/15/2028 | 95 | 98 | ||||||
3.875%, 02/15/2029 (A) | 227 | 226 | ||||||
QualityTech | ||||||||
3.875%, 10/01/2028 (A) | 1,317 | 1,310 | ||||||
Realogy Group | ||||||||
9.375%, 04/01/2027 (A) | 998 | 1,105 | ||||||
RHP Hotel Properties | ||||||||
5.000%, 04/15/2023 | 415 | 415 | ||||||
4.750%, 10/15/2027 | 355 | 363 | ||||||
4.500%, 02/15/2029 (A) | 164 | 165 | ||||||
Service Properties Trust | ||||||||
4.950%, 02/15/2027 | 2,565 | 2,536 | ||||||
3.950%, 01/15/2028 | 1,961 | 1,814 | ||||||
Uniti Group | ||||||||
7.875%, 02/15/2025 | 813 | 880 | ||||||
7.125%, 12/15/2024 (A) | 115 | 118 | ||||||
6.500%, 02/15/2029 (A) | 163 | 162 | ||||||
6.000%, 04/15/2023 (A) | 240 | 244 | ||||||
VICI Properties | ||||||||
4.625%, 12/01/2029 (A) | 448 | 465 | ||||||
4.250%, 12/01/2026 (A) | 429 | 439 | ||||||
4.125%, 08/15/2030 (A) | 711 | 717 | ||||||
3.750%, 02/15/2027 (A) | 580 | 581 | ||||||
XHR | ||||||||
6.375%, 08/15/2025 (A) | 1,810 | 1,912 | ||||||
|
|
| ||||||
| 33,521 | ||||||||
|
|
| ||||||
Utilities — 1.6% | ||||||||
Calpine | ||||||||
5.000%, 02/01/2031 (A) | 373 | 364 | ||||||
4.625%, 02/01/2029 (A) | 140 | 136 | ||||||
4.500%, 02/15/2028 (A) | 2,881 | 2,905 | ||||||
3.750%, 03/01/2031 (A) | 3,114 | 2,968 | ||||||
NRG Energy | ||||||||
7.250%, 05/15/2026 | 305 | 317 | ||||||
6.625%, 01/15/2027 | 1,113 | 1,158 | ||||||
5.250%, 06/15/2029 (A) | 100 | 107 | ||||||
3.625%, 02/15/2031 (A) | 2,153 | 2,099 | ||||||
3.375%, 02/15/2029 (A) | 590 | 576 | ||||||
Pacific Gas and Electric | ||||||||
4.750%, 02/15/2044 | 337 | 342 | ||||||
4.300%, 03/15/2045 | 394 | 382 | ||||||
3.950%, 12/01/2047 | 840 | 771 | ||||||
PG&E | ||||||||
5.250%, 07/01/2030 | 2,588 | 2,747 | ||||||
5.000%, 07/01/2028 | 568 | 600 | ||||||
| Description | Face Amount (Thousands) | Market Value ($ Thousands) | ||||||
CORPORATE OBLIGATIONS (continued) |
| |||||||
Pike | ||||||||
5.500%, 09/01/2028 (A) | $ | 1,536 | $ | 1,563 | ||||
Rockpoint Gas Storage Canada | ||||||||
7.000%, 03/31/2023 (A) | 1,895 | 1,909 | ||||||
Solaris Midstream Holdings | ||||||||
7.625%, 04/01/2026 (A) | 745 | 762 | ||||||
Talen Energy Supply | ||||||||
7.625%, 06/01/2028 (A) | 556 | 563 | ||||||
6.625%, 01/15/2028 (A) | 1,035 | 1,034 | ||||||
Vistra Operations | ||||||||
5.625%, 02/15/2027 (A) | 462 | 480 | ||||||
5.500%, 09/01/2026 (A) | 360 | 373 | ||||||
5.000%, 07/31/2027 (A) | 2,456 | 2,533 | ||||||
4.300%, 07/15/2029 (A) | 808 | 853 | ||||||
|
|
| ||||||
| 25,542 | ||||||||
|
|
| ||||||
Total Corporate Obligations (Cost $1,098,704) ($ Thousands) | 1,126,942 | |||||||
|
|
| ||||||
ASSET-BACKED SECURITIES — 11.5% |
| |||||||
Other Asset-Backed Securities — 11.5% |
| |||||||
Airplanes Pass-Through Trust, Ser 2001-1A, Cl A9 (H) | ||||||||
0.735%, VAR ICE LIBOR USD 1 Month+0.550%, 03/15/2019 (A)(B)(F) | 587 | 21 | ||||||
Apex Credit CLO, Ser 2020-1A, Cl E1 | ||||||||
7.809%, VAR ICE LIBOR USD 3 Month+7.560%, 10/20/2031 (A) | 1,258 | 1,233 | ||||||
Ares XXXIV CLO, Ser 2020-2A, Cl FR | ||||||||
8.823%, VAR ICE LIBOR USD 3 Month+8.600%, 04/17/2033 (A)(F) | 1,446 | 1,359 | ||||||
B&M CLO, Ser 2014-1A, Cl E | ||||||||
5.973%, VAR ICE LIBOR USD 3 Month+5.750%, 04/16/2026 (A)(F) | 2,480 | 1,438 | ||||||
Battalion CLO VII, Ser 2014-7A | ||||||||
0.000%, | 4,490 | 1,616 | ||||||
Battalion CLO VIII, Ser 2015-8A | ||||||||
0.000%, | 3,390 | 2,441 | ||||||
Battalion CLO X, Ser 2016-10A | ||||||||
0.000%, | 4,450 | 4,227 | ||||||
Battalion CLO XI, Ser 2017-11A | ||||||||
0.000%, | 5,857 | 4,803 | ||||||
Battalion CLO XII, Ser 2018-12A | ||||||||
0.000%, | 4,663 | 3,730 | ||||||
Battalion CLO XIV, Ser 2019-14A | ||||||||
0.000%, 04/20/2032 (F)(I) | 3,427 | 2,639 | ||||||
| SEI Institutional Managed Trust / Semi-Annual Report / March 31, 2021 | 121 |
SCHEDULE OF INVESTMENTS (Unaudited)
March 31, 2021
High Yield Bond Fund (Continued)
| Description | Face Amount (Thousands) | Market Value ($ Thousands) | ||||||
ASSET-BACKED SECURITIES (continued) |
| |||||||
Battalion CLO XVI, Ser 2019-16A | ||||||||
0.000%, | $ | 2,128 | $ | 1,958 | ||||
Battalion CLO, Warehouse Note | ||||||||
0.000% (F)(J) | 3,119 | 3,119 | ||||||
Benefit Street Partners CLO III, Ser 2013-IIIA | ||||||||
0.000%, | 2,531 | 860 | ||||||
Benefit Street Partners CLO IV | ||||||||
0.000%, | 7 | 3,395 | ||||||
Benefit Street Partners CLO IX | ||||||||
0.000%, | 2,293 | 1,559 | ||||||
Benefit Street Partners CLO V | ||||||||
0.000%, | 6,387 | 1 | ||||||
Benefit Street Partners CLO V-B | ||||||||
0.000%, | 10,259 | 6,207 | ||||||
Benefit Street Partners CLO VI, Ser 2015-VIA | ||||||||
0.000%, | 7,502 | 3,151 | ||||||
Benefit Street Partners CLO VII, Ser 2015-VIII | ||||||||
0.000%, | 6,715 | 2,368 | ||||||
Benefit Street Partners CLO VIII | ||||||||
0.000%, | 6,720 | 3,898 | ||||||
Benefit Street Partners CLO X, Ser 2016-10A | ||||||||
0.000%, | 7,631 | 4,426 | ||||||
Benefit Street Partners CLO XII, Ser 2017- 12A, Cl C | ||||||||
3.291%, VAR ICE LIBOR USD 3 Month+3.050%, 10/15/2030 (A)(F) | 1,238 | 1,201 | ||||||
Benefit Street Partners CLO XIV, Ser 2018-14A | ||||||||
0.000%, | 3,809 | 2,857 | ||||||
Benefit Street Partners CLO XVIII, Ser 2019-18A | ||||||||
0.000%, | 3,486 | 2,637 | ||||||
Benefit Street Partners CLO XX, Ser 2020-20A | ||||||||
0.000%, | 2,261 | 2,426 | ||||||
Benefit Street Partners CLO XXIII, Ser 2021- 23A, Cl Sub | ||||||||
0.000%, | 5,130 | 4,322 | ||||||
Benefit Street Partners CLO, Warehouse Note | ||||||||
0.000%, (F)(J) | 3,157 | 3,157 | ||||||
Bighorn III, Warehouse Note | ||||||||
0.000%, (F)(J) | 3,390 | 3,390 | ||||||
Blue Ridge CLO II, Ser 2014-2A, Cl D | ||||||||
5.023%, VAR ICE LIBOR USD 3 Month+4.800%, | 2,277 | 1,480 | ||||||
Blue Ridge CLO II, Ser 2014-2A, Cl E | ||||||||
6.023%, VAR ICE LIBOR USD 3 Month+5.800%, | 2,639 | 224 | ||||||
| Description | Face Amount (Thousands) | Market Value ($ Thousands) | ||||||
ASSET-BACKED SECURITIES (continued) |
| |||||||
Cathedral Lake CLO, Ser 2015-3A | ||||||||
0.000%, | $ | 2,725 | $ | 1,144 | ||||
Cathedral Lake V, Ser 2018-5A | ||||||||
0.000%, | 3,139 | 1,569 | ||||||
Great Lakes CLO, Ser 2014-1A | ||||||||
0.000%, | 4,860 | 2,187 | ||||||
Great Lakes CLO, Ser 2015-1A | ||||||||
0.000%, | 4,519 | 2,260 | ||||||
Great Lakes CLO, Ser 2015-1A, Cl ER | ||||||||
8.000%, VAR ICE LIBOR USD 3 Month+7.360%, 01/16/2030 (A)(F) | 3,253 | 3,027 | ||||||
Great Lakes CLO, Ser 2015-1A, Cl FR | ||||||||
11.000%, VAR ICE LIBOR USD 3 Month+10.000%, | 1,198 | 1,091 | ||||||
Great Lakes CLO, Ser 2017-1A, Cl ER | ||||||||
7.741%, VAR ICE LIBOR USD 3 Month+7.500%, 10/15/2029 (A)(F) | 3,321 | 3,223 | ||||||
Great Lakes CLO, Ser 2017-1A, Cl FR | ||||||||
10.241%, VAR ICE LIBOR USD 3 Month+10.000%, | 1,940 | 1,801 | ||||||
Ivy Hill Middle Market Credit Fund VII, Ser 2013-7A | ||||||||
0.000%, | 2,484 | 1,242 | ||||||
Ivy Hill Middle Market Credit Fund XII, Ser 2017-12A | ||||||||
0.000%, | 651 | 560 | ||||||
Ivy Hill Middle Market Credit Fund XII, Ser 2017-12A, Cl D | ||||||||
7.784%, VAR ICE LIBOR USD 3 Month+7.560%, 07/20/2029 (A)(F) | 3,223 | 3,162 | ||||||
IVY Hill Middle Market Credit Fund XIV, Ser 2018-14A | ||||||||
0.000%, | 1,169 | 739 | ||||||
Ivy Hill Middle Market Credit Fund XIV, | ||||||||
Ser 2018-14A, Cl D 7.293%, VAR ICE LIBOR USD 3 Month+7.070%, | 1,559 | 1,481 | ||||||
JFIN CLO, Ser 2018-1A, Cl BR | ||||||||
2.574%, VAR ICE LIBOR USD 3 Month+2.350%, 07/20/2028 (A)(F) | 1,757 | 1,757 | ||||||
LCM CLO, Ser 31A | ||||||||
0.000%, | 1,115 | 870 | ||||||
Lockwood Grove CLO, Ser 2014-1A | ||||||||
0.000%, | 3,797 | 2,506 | ||||||
Lockwood Grove CLO, Ser 2018-1A, Cl ERR | ||||||||
6.068%, VAR ICE LIBOR USD 3 Month+5.850%, 01/25/2030 (A)(F) | 2,499 | 2,399 | ||||||
| 122 | SEI Institutional Managed Trust / Semi-Annual Report / March 31, 2021 |
| Description | Face Amount (Thousands) | Market Value ($ Thousands) | ||||||
ASSET-BACKED SECURITIES (continued) |
| |||||||
Neuberger Berman CLO XXII, Ser 2016-22A | ||||||||
0.000%, | $ | 3,640 | $ | 2,257 | ||||
Neuberger Berman CLO XXII, Ser 2016-22A, Cl F | ||||||||
0.100%, | 112 | 18 | ||||||
Neuberger Berman Loan Advisers CLO | ||||||||
0.000%, | 3,438 | 3,301 | ||||||
Neuberger Berman Loan Advisers CLO, Ser 2020-36A | ||||||||
0.114%, | 14 | 13 | ||||||
0.000%, | 1,095 | 931 | ||||||
Neuberger Berman Loan Advisers CLO, Ser 2020-39 | ||||||||
0.000%, | 3,294 | 2,907 | ||||||
Neuberger Berman Loan Advisers CLO, Ser 2021-41 | ||||||||
0.000%, | 2,670 | 2,328 | ||||||
Neuberger Berman Loan Advisers, Warehouse Note | ||||||||
0.000% (E)(F)(J) | 2,713 | 2,581 | ||||||
NewStar Clarendon Fund CLO, Ser 2015-1A, Cl E | ||||||||
6.268%, VAR ICE LIBOR USD 3 Month+6.050%, | 3,439 | 3,350 | ||||||
NewStar Exeter Fund CLO, Ser 2015-1A, Cl E | ||||||||
7.424%, VAR ICE LIBOR USD 3 Month+7.200%, 01/20/2027 (A)(F) | 3,890 | 3,579 | ||||||
NewStar Fairfield Fund CLO, Ser 2015-2A | ||||||||
0.000%, | 7,983 | 3,952 | ||||||
OCP CLO, Ser 2017-14A | ||||||||
0.000%, | 1,655 | 1,158 | ||||||
OCP CLO, Ser 2020-19A | ||||||||
0.000%, | 1,224 | 1,236 | ||||||
OCP CLO, Warehouse Note | ||||||||
0.000% (F)(J) | 5,356 | 5,259 | ||||||
Shackleton CLO, Ser 2014-6A | ||||||||
0.000%, | 7,935 | 1 | ||||||
Shackleton CLO, Ser 2014-6RA | ||||||||
0.000%, | 6,388 | 2,300 | ||||||
Shackleton CLO, Ser 2019-14A | ||||||||
0.000%, | 1,999 | 1,559 | ||||||
TCP Whitney CLO, Ser 2017-1I | ||||||||
0.000%, | 9,085 | 7,404 | ||||||
TCW CLO, Ser 2017-1A | ||||||||
0.000%, | 4,194 | 2,894 | ||||||
TCW CLO, Ser 2018-1A | ||||||||
0.000%, | 2,978 | 2,353 | ||||||
TCW CLO, Ser 2019-2A | ||||||||
0.000%, | 3,528 | 2,611 | ||||||
TCW CLO, Ser 2020-1 | ||||||||
0.000%, | 5,111 | 3,169 | ||||||
| Description | Face Amount (Thousands) | Market Value ($ Thousands) | ||||||
ASSET-BACKED SECURITIES (continued) |
| |||||||
Telos CLO, Ser 2018-5A, Cl BR | ||||||||
1.703%, VAR ICE LIBOR USD 3 Month+1.480%, 04/17/2028 (A)(F) | $ | 1,001 | $ | 987 | ||||
Venture 35 CLO, Ser 2018-35A | ||||||||
0.000%, | 11,892 | 5,946 | ||||||
Venture CDO, Ser 2016-25A | ||||||||
0.000%, | 2,030 | 1,177 | ||||||
Venture XXVI CLO, Ser 2017-26A | ||||||||
0.000%, | 1,609 | 724 | ||||||
Venture XXVIII CLO, Ser 2017-28A | ||||||||
0.000%, | 3,228 | 1,775 | ||||||
Voya CLO, Ser 2020-2 | ||||||||
0.000%, 07/21/2031 (F)(I) | 4,915 | 5,417 | ||||||
|
|
| ||||||
Total Asset-Backed Securities | 178,348 | |||||||
|
|
| ||||||
LOAN PARTICIPATIONS — 11.1% |
| |||||||
1236904 B.C. Ltd., Initial Term Loan, 1st Lien | ||||||||
5.609%, 03/04/2027 (K) | 177 | 175 | ||||||
AAdvantage Loyalty IP Ltd., Initial Term Loan, 1st Lien | ||||||||
5.500%, 04/20/2028 (L) | 3,059 | 3,131 | ||||||
Agrofresh Inc., Initial Term Loan, 1st Lien | ||||||||
7.250%, 12/31/2024 (L) | 1,695 | 1,690 | ||||||
AI Aqua Merger Sub Inc., Tranche B-1 Term Loan, 1st Lien | ||||||||
4.250%, VAR LIBOR+3.250%, 12/13/2023 | 2,139 | 2,135 | ||||||
Alvogen Pharma US Inc., January 2020 Loan, 1st Lien | ||||||||
6.250%, 12/31/2023 | 1,266 | 1,259 | ||||||
AMC Entertainment Holdings Inc., Term Loan B-1, 1st Lien | ||||||||
3.195%, VAR LIBOR+3.000%, 04/22/2026 (L) | 1,529 | 1,317 | ||||||
American Gaming, Term Loan, 1st Lien | ||||||||
14.000%, 02/15/2024 (F) | 859 | 902 | ||||||
American Tire Distributors, Inc., Initial Term Loan, 1st Lien | ||||||||
8.500%, 09/02/2024 (L) | 2,747 | 2,679 | ||||||
American Trailer World Corp., Initial Term Loan, 1st Lien | ||||||||
4.500%, 03/03/2028 | 643 | 638 | ||||||
Ankura Consulting Group LLC, Closing Date Term Loan, 1st Lien | ||||||||
5.250%, 03/17/2028 | 505 | 501 | ||||||
AP Gaming I LLC, Incremental Term Loan B, 1st Lien | ||||||||
4.500%, 02/15/2024 | 722 | 706 | ||||||
| SEI Institutional Managed Trust / Semi-Annual Report / March 31, 2021 | 123 |
SCHEDULE OF INVESTMENTS (Unaudited)
March 31, 2021
High Yield Bond Fund (Continued)
| Description | Face Amount (Thousands) | Market Value ($ Thousands) | ||||||
LOAN PARTICIPATIONS (continued) |
| |||||||
Apollo Commercial Real Estate Finance Inc., Term Loan B-1, 1st Lien | ||||||||
4.000%, 03/11/2028 | $ | 758 | $ | 748 | ||||
Arctic Canadian Diamond Company Ltd., Term Loan A-2, 1st Lien | ||||||||
6.000%, 12/31/2024 (E)(F) | 167 | 167 | ||||||
Arctic Canadian Diamond Company Ltd., Term Loan, 2nd Lien | ||||||||
17.500%, 12/07/2025 (E)(F) | 975 | 975 | ||||||
Aruba Investments Holdings LLC, Initial Term Loan, 2nd Lien | ||||||||
8.500%, 11/24/2028 (K) | 1,060 | 1,063 | ||||||
Ascend Learning LLC, Amendment No. 2 Incremental Term Loan, 1st Lien | ||||||||
4.750%, 07/12/2024 | 93 | 93 | ||||||
Ascend Learning LLC, Initial Term Loan, 1st Lien | ||||||||
4.000%, VAR LIBOR+3.250%, 07/12/2024 | 140 | 139 | ||||||
Asurion LLC, New Term Loan B, 1st Lien | ||||||||
3.365%, VAR LIBOR+3.250%, 12/23/2026 | 658 | 654 | ||||||
Asurion LLC, New Term Loan B, 2nd Lien | ||||||||
5.365%, 01/31/2028 (L) | 884 | 899 | ||||||
Autokiniton, Term Loan B, 1st Lien | ||||||||
5.250%, 03/26/2028 (L) | 651 | 652 | ||||||
Avianca Holdings S.A., DIP Delayed Draw Loan A-1, 1st Lien | ||||||||
12.500%, 11/10/2021 (F)(L) | 1,416 | 1,422 | ||||||
10.500%, 11/10/2021 | 169 | 1 | ||||||
Bausch Health Companies Inc., Initial Term Loan, 1st Lien | ||||||||
3.115%, VAR LIBOR+3.000%, 06/02/2025 (L) | 441 | 440 | ||||||
Boardriders Inc., Closing Date Tranche A Loan, 1st Lien | ||||||||
9.000%, 10/23/2023 (F) | 389 | 378 | ||||||
Boardriders Inc., Closing Date Tranche B-2 Loan, 1st Lien | ||||||||
7.500%, 04/23/2024 (F)(L) | 2,051 | 1,880 | ||||||
Bright Bidco, Term Loan B, 1st Lien | ||||||||
4.500%, 06/30/2024 (K)(L) | 889 | 676 | ||||||
Buckeye Partners L.P., Term Loan B-1, 1st Lien | ||||||||
2.365%, 11/01/2026 | 228 | 226 | ||||||
BWay Holding Company , Initial Term Loan, 1st Lien | ||||||||
3.443%, VAR LIBOR+3.250%, 04/03/2024 | 1,715 | 1,677 | ||||||
Caesars Resort Collection LLC, Term Loan B-1, 1st Lien | ||||||||
4.615%, VAR LIBOR+4.500%, 07/21/2025 (L) | 1,965 | 1,968 | ||||||
| Description | Face Amount (Thousands) | Market Value ($ Thousands) | ||||||
LOAN PARTICIPATIONS (continued) |
| |||||||
Carestream Health Inc., 2023 Extended Term Loan, 1st Lien | ||||||||
7.750%, 05/08/2023 | $ | 1,407 | $ | 1,400 | ||||
Carestream Health Inc., 2023 Extended Term Loan, 2nd Lien | ||||||||
5.500%, 08/08/2023 (F) | 2,333 | 2,100 | ||||||
CBAC Borrower LLC, Term Loan B, 1st Lien | ||||||||
4.109%, 07/08/2024 (K) | 1,494 | 1,433 | ||||||
CCI Buyer Inc., Initial Term Loan, 1st Lien | ||||||||
4.750%, 12/17/2027 | 168 | 168 | ||||||
Cengage Learning Inc., 2016 Refinancing Term Loan, 1st Lien | ||||||||
5.250%, VAR LIBOR+4.250%, 06/07/2023 (L) | 2,646 | 2,615 | ||||||
Cenveo Corporation, Exit Term Loan, 1st Lien | ||||||||
10.500%, 06/07/2023 (F) | 2,322 | 2,275 | ||||||
Claire’s Stores Inc., Initial Term Loan, 1st Lien | ||||||||
6.615%, VAR LIBOR+6.500%, 12/18/2026 | 1,127 | 1,063 | ||||||
Clarios Global LP, Initial Dollar Term Loan, 1st Lien | ||||||||
3.615%, VAR LIBOR+3.500%, 04/30/2026 (L) | 679 | 671 | ||||||
CNT Holdings I Corp, Initial Term Loan, 1st Lien | ||||||||
4.500%, VAR LIBOR+3.750%, 11/08/2027 | 771 | 769 | ||||||
ConvergeOne Holdings Corp., Initial Term Loan, 1st Lien | ||||||||
5.109%, VAR LIBOR+5.000%, 01/04/2026 | 2,774 | 2,673 | ||||||
Cornerstone OnDemand Inc., Term Loan, 1st Lien | ||||||||
4.361%, VAR LIBOR+4.250%, 04/22/2027 | 169 | 169 | ||||||
Delta Topco Inc., Initial Term Loan, 2nd Lien | ||||||||
8.000%, 12/01/2028 (K) | 891 | 910 | ||||||
E.W. Scripps Company, Term Loan B, 1st Lien | ||||||||
3.750%, 01/07/2028 | 595 | 592 | ||||||
East Valley Tourist Development Authority, Term Loan, 1st Lien | ||||||||
9.000%, VAR LIBOR+8.000%, 03/07/2022 (F) | 2,168 | 2,136 | ||||||
Endo Luxembourg Finance Company S.a.r.l, Term Loan, 1st Lien | ||||||||
5.750%, 03/27/2028 (L) | 758 | 750 | ||||||
Endurance International Group Holdings Inc., Initial Term Loan, 1st Lien | ||||||||
4.250%, 02/10/2028 (L) | 961 | 950 | ||||||
| 124 | SEI Institutional Managed Trust / Semi-Annual Report / March 31, 2021 |
| Description | Face Amount (Thousands) | Market Value ($ Thousands) | ||||||
LOAN PARTICIPATIONS (continued) |
| |||||||
Enterprise Development Authority, Term Loan B, 1st Lien | ||||||||
5.000%, 02/18/2028 (L) | $ | 2,818 | $ | 2,825 | ||||
Envision Healthcare Corporation, Initial Term Loan, 1st Lien | ||||||||
3.859%, VAR LIBOR+3.750%, 10/10/2025 (L) | 5,739 | 4,938 | ||||||
Epic Crude Services LP, Term Loan, 1st Lien | ||||||||
5.260%, VAR LIBOR+5.000%, 03/02/2026 | 1,711 | 1,242 | ||||||
Epic Y-Grade Services LP, Term Loan, 1st Lien | ||||||||
7.000%, 06/30/2027 (L) | 4,341 | 3,734 | ||||||
eResearchTechnology Inc., Initial Term Loan, 1st Lien | ||||||||
5.500%, 02/04/2027 (L) | 2,382 | 2,383 | ||||||
Foresight Energy Operating LLC, Tranche A Term Loan, 1st Lien | ||||||||
9.500%, 06/30/2027 (F) | 273 | 269 | ||||||
Forest City Enterprises L.P., Replacement Term Loan, 1st Lien | ||||||||
3.615%, 12/08/2025 | 551 | 538 | ||||||
Gannett Holdings LLC, Term Loan, 1st Lien | ||||||||
7.750%, 02/09/2026 | 1,286 | 1,294 | ||||||
Gates Global LLC, Initial B-2 Dollar Term Loan, 1st Lien | ||||||||
3.500%, VAR LIBOR+2.750%, 04/01/2024 | 411 | 410 | ||||||
Getty Images Inc., Initial Dollar Term Loan, 1st Lien | ||||||||
4.625%, VAR LIBOR+4.500%, 02/19/2026 (L) | 515 | 510 | ||||||
GFL Environmental, 2020 Refinancing Term Loan, 1st Lien | ||||||||
3.500%, 05/30/2025 | 214 | 214 | ||||||
Global Medical Response Inc., 2018 New Term Loan, 1st Lien | ||||||||
5.250%, VAR LIBOR+4.250%, 03/14/2025 | 1,006 | 999 | ||||||
Grab Holdings Inc., Initial Term Loan, 1st Lien | ||||||||
5.500%, 01/29/2026 | 3,448 | 3,500 | ||||||
Graham Packaging Company Inc., Initial Term Loan, 1st Lien | ||||||||
3.750%, 08/04/2027 (L) | 349 | 346 | ||||||
Green Energy Partners/Stonewall LLC, Term Loan B-1 Conversion Advances, 1st Lien | ||||||||
6.500%, VAR LIBOR+5.500%, 11/13/2021 (F) | 397 | 370 | ||||||
Greeneden U.S. Holdings I LLC, Initial Dollar Term Loan, 1st Lien | ||||||||
4.750%, 12/01/2027 | 285 | 285 | ||||||
| Description | Face Amount (Thousands) | Market Value ($ Thousands) | ||||||
LOAN PARTICIPATIONS (continued) |
| |||||||
Gulf Finance LLC, Term Loan B, 1st Lien | ||||||||
6.250%, 08/25/2023 (L) | $ | 1,992 | $ | 1,645 | ||||
Hercules Achievement Inc., Initial Term Loan, 1st Lien | ||||||||
4.500%, VAR LIBOR+3.500%, 12/16/2024 | 307 | 296 | ||||||
Hoffmaster Group, Term Loan B, 1st Lien | ||||||||
5.000%, 11/21/2023 (F)(L) | 505 | 466 | ||||||
Hub International Limited, Initial Term Loan, 1st Lien | ||||||||
2.965%, VAR LIBOR+3.000%, 04/25/2025 (L) | 1,050 | 1,034 | ||||||
iHeartCommunications Inc., New Term Loan, 1st Lien | ||||||||
3.115%, VAR LIBOR+3.000%, 05/01/2026 (L) | 474 | 468 | ||||||
Indivior Finance S.a r.l., 2017 Replacement USD Term Loan, 1st Lien | ||||||||
5.500%, 12/19/2022 (F) | 639 | 635 | ||||||
Informatica LLC, Dollar 2020 Term Loan, 1st Lien | ||||||||
3.365%, VAR LIBOR+3.250%, 02/25/2027 | 97 | 96 | ||||||
IRB Holding Corp., Fourth Amendment Incremental Term Loan, 1st Lien | ||||||||
4.250%, 12/15/2027 (K)(L) | 229 | 228 | ||||||
Ivanti Software Inc., First Amendment Term Loan, 1st Lien | ||||||||
4.750%, 12/01/2027 (L) | 302 | 300 | ||||||
Ivanti Software Inc., Initial Term Loan, 1st Lien | ||||||||
5.750%, 12/01/2027 | 1,525 | 1,530 | ||||||
J.C. Penney Corporation Inc., Term Loan, 1st Lien | ||||||||
5.250%, VAR LIBOR+4.250%, 06/23/2023 (B) | 2,253 | 6 | ||||||
Journey Personal Care Corp., Initial Term Loan, 1st Lien | ||||||||
5.000%, 03/01/2028 (L) | 2,030 | 2,031 | ||||||
Knight Energy Services, Exit Facility Loan | ||||||||
8.500%, 02/09/2024 (F) | 62 | — | ||||||
Lanai Holdings II, Inc., Initial Term Loan, 1st Lien | ||||||||
5.750%, VAR LIBOR+4.750%, 08/29/2022 (L) | 4,101 | 4,070 | ||||||
Lifescan Global Corporation, Initial Term Loan, 1st Lien | ||||||||
6.000%, 10/01/2024 (K)(L) | 5,904 | 5,720 | ||||||
Liftoff Mobile Inc., Initial Term Loan, 1st Lien | ||||||||
4.250%, 03/17/2028 | 769 | 765 | ||||||
| SEI Institutional Managed Trust / Semi-Annual Report / March 31, 2021 | 125 |
SCHEDULE OF INVESTMENTS (Unaudited)
March 31, 2021
High Yield Bond Fund (Continued)
| Description | Face Amount (Thousands) | Market Value ($ Thousands) | ||||||
LOAN PARTICIPATIONS (continued) |
| |||||||
Mashantucket (Western) Pequot Tribe, Term Loan B, 1st Lien | ||||||||
8.375%, VAR LIBOR+8.125%, 02/16/2022 | $ | 5,371 | $ | 5,304 | ||||
Mavenir Systems Inc., Initial Term Loan, 1st Lien | ||||||||
7.000%, VAR LIBOR+6.000%, 05/08/2025 (F) | 1,548 | 1,544 | ||||||
McGraw Hill LLC, Term Loan B, 1st Lien | ||||||||
5.750%, 11/01/2024 (L) | 2,082 | 2,077 | ||||||
Meredith Corporation, Tranche B-3 Term Loan, 1st Lien | ||||||||
5.250%, VAR LIBOR+4.250%, 01/31/2025 | 318 | 322 | ||||||
Mileage Plus Holdings LLC, Initial Term Loan, 1st Lien | ||||||||
6.250%, VAR LIBOR+5.250%, 06/21/2027 | 937 | 994 | ||||||
Misys Limited, Dollar Term Loan, 1st Lien | ||||||||
4.500%, VAR LIBOR+3.500%, 06/13/2024 | 1,083 | 1,060 | ||||||
MLN US HoldCo LLC, Term Loan B, 1st Lien | ||||||||
4.603%, VAR LIBOR+4.500%, 11/30/2025 | 802 | 702 | ||||||
Monitronics International Inc, Term Loan, 1st Lien | ||||||||
7.750%, 03/29/2024 (F) | 218 | 212 | ||||||
Navitas Midstream Midland Basin LLC, Initial Term Loan, 1st Lien | ||||||||
5.500%, 12/13/2024 | 1,111 | 1,110 | ||||||
Nouryon Finance B.V., Initial Dollar Term Loan, 1st Lien | ||||||||
2.860%, VAR LIBOR+3.000%, 10/01/2025 | 539 | 530 | ||||||
Optiv, Term Loan, 1st Lien | ||||||||
4.250%, VAR LIBOR+3.250%, 02/01/2024 | 1,293 | 1,245 | ||||||
Park River Holdings Inc., Initial Term Loan, 1st Lien | ||||||||
4.000%, 12/28/2027 | 128 | 127 | ||||||
Peak 10 Holding Corporation, Initial Term Loan, 1st Lien | ||||||||
3.703%, VAR LIBOR+3.500%, 08/01/2024 | 4,674 | 4,347 | ||||||
Penney Borrower LLC, Initial Loan, 1st Lien | ||||||||
9.500%, 12/07/2026 (L) | 1,026 | 958 | ||||||
Peraton Corp., Delayed Draw Term Loan B, 1st Lien | ||||||||
4.500%, 02/01/2028 (L) | 638 | 637 | ||||||
Peraton Corp., Term Loan B, 1st Lien | ||||||||
4.500%, 02/01/2028 (L) | 362 | 362 | ||||||
| Description | Face Amount (Thousands) | Market Value ($ Thousands) | ||||||
LOAN PARTICIPATIONS (continued) |
| |||||||
Petco Health & Wellness Company Inc., Initial Term Loan, 1st Lien | ||||||||
4.000%, 03/03/2028 (L) | $ | 350 | $ | 348 | ||||
PetSmart LLC, Initial Term Loan, 1st Lien | ||||||||
4.250%, 02/11/2028 (L) | 2,020 | 2,016 | ||||||
Plantronics Inc., Initial Term Loan B, 1st Lien | ||||||||
2.615%, 07/02/2025 | 905 | 892 | ||||||
Playtika Holding Corp., Term Loan B-1, 1st Lien | ||||||||
2.750%, 03/13/2028 (L) | 1,310 | 1,302 | ||||||
Polymer Additives Inc., Closing Date Term Loan, 1st Lien | ||||||||
6.212%, 07/31/2025 (L) | 4,451 | 4,037 | ||||||
Premier Brands Group Holdings LLC, Term Loan, 1st Lien | ||||||||
8.254%, 03/19/2024 | 348 | 237 | ||||||
8.187%, 03/19/2024 | 373 | 254 | ||||||
Rent-A-Center Inc., Initial Term Loan, 1st Lien | ||||||||
4.750%, 02/17/2028 | 2,618 | 2,629 | ||||||
Revlon Consumer Products Corporation, 2016 Term Loan, 1st Lien | ||||||||
4.250%, VAR LIBOR+3.500%, 09/07/2023 (L) | 4,926 | 2,309 | ||||||
S&S Holdings LLC, Initial Term Loan, 1st Lien | ||||||||
5.500%, 03/11/2028 | 758 | 736 | ||||||
Sabre GLBL Inc., Term Loan B, 1st Lien | ||||||||
4.115%, 12/17/2027 | 929 | 938 | ||||||
Schweitzer-Mauduit International Inc., Term Loan B, 1st Lien | ||||||||
4.500%, 01/27/2028 (L) | 932 | 928 | ||||||
Serta Simmons Bedding LLC, Initial Exchange Term Loan, 1st Lien | ||||||||
8.500%, 08/10/2023 (L) | 384 | 366 | ||||||
Shutterfly, Insitutional Term Loan, 1st Lien | ||||||||
7.000%, 09/25/2026 (L) | 208 | 209 | ||||||
SIJ LLC, Term Loan, 1st Lien | ||||||||
10.000%, 07/15/2026 (F) | 3,075 | 3,044 | ||||||
Sotera Health Holdings LLC, Refinancing Loan, 1st Lien | ||||||||
3.250%, 12/11/2026 | 1,651 | 1,645 | ||||||
SP PF Buyer LLC, Closing Date Term Loan, 1st Lien | ||||||||
4.615%, 12/22/2025 | 1,509 | 1,454 | ||||||
SRS Distribution Inc., Term Loan B, 1st Lien | ||||||||
3.146%, 05/23/2025 (L) | 722 | 714 | ||||||
Staples Inc., 2019 Refinancing New Term Loan B-1, 1st Lien | ||||||||
5.205%, VAR LIBOR+5.000%, 04/16/2026 (L) | 3,152 | 3,070 | ||||||
| 126 | SEI Institutional Managed Trust / Semi-Annual Report / March 31, 2021 |
| Description | Face Amount (Thousands) | Market Value ($ Thousands) | ||||||
LOAN PARTICIPATIONS (continued) |
| |||||||
Steinway Musical Instruments Inc., Closing Date Loan, 1st Lien | ||||||||
4.750%, 02/14/2025 | $ | 448 | $ | 442 | ||||
Sunshine Luxembourg VII S.a.r.l., Term Loan B-3, 1st Lien | ||||||||
4.500%, 10/01/2026 (L) | 788 | 786 | ||||||
Syniverse Holdings Inc., Initial Term Loan, 2nd Lien | ||||||||
10.000%, 03/11/2024 | 1,125 | 1,095 | ||||||
Syniverse Holdings Inc., Tranche C Term Loan , 1st Lien | ||||||||
6.000%, VAR LIBOR+5.000%, 03/09/2023 (L) | 6,355 | 6,260 | ||||||
Team Health Holdings Inc., Initial Term Loan, 1st Lien | ||||||||
3.750%, VAR LIBOR+2.750%, 02/06/2024 | 4,312 | 4,000 | ||||||
Thryv Inc., Initial Term Loan, 1st Lien | ||||||||
9.500%, 03/01/2026 | 1,285 | 1,286 | ||||||
Titan Acquisition Limited, Initial Term Loan, 1st Lien | ||||||||
3.267%, VAR LIBOR+3.000%, 03/28/2025 | 1,067 | 1,044 | ||||||
Tortoise Borrower LLC, Initial Term Loan, 1st Lien | ||||||||
4.500%, 01/31/2025 (L) | 1,026 | 908 | ||||||
Traverse Midstream Partners LLC, Advance Term Loan, 1st Lien | ||||||||
6.500%, VAR LIBOR+4.000%, 09/27/2024 (F)(L) | 1,729 | 1,712 | ||||||
Triton Water Holdings Inc., Initial Term Loan, 1st Lien | ||||||||
4.000%, 03/31/2028 (L) | 1,308 | 1,302 | ||||||
Tutor Perini Corporation, Term Loan, 1st Lien | ||||||||
5.750%, 08/18/2027 (L) | 1,931 | 1,951 | ||||||
Twin River Worldwide Holdings Inc., Term B-1 Facility Loan, 1st Lien | ||||||||
9.000%, VAR LIBOR+8.000%, 05/11/2026 (F) | 756 | 808 | ||||||
U.S. Renal Care Inc., Initial Term Loan, 1st Lien | ||||||||
5.125%, VAR LIBOR+5.000%, 06/26/2026 | 483 | 480 | ||||||
Valaris PLC, DIP Term Loan | ||||||||
0.000%, | 1,115 | 1,113 | ||||||
VeriFone Systems Inc., Initial Term Loan, 1st Lien | ||||||||
4.182%, 08/20/2025 (L) | 1,531 | 1,492 | ||||||
Vertic Group Corporation, Term Loan, 1st Lien | ||||||||
3.119%, 03/02/2027 | 149 | 147 | ||||||
| Description | Face Amount (Thousands) | Market Value ($ Thousands) | ||||||
LOAN PARTICIPATIONS (continued) |
| |||||||
Vertical Midco GmbH, Facility B (USD) Term Loan, 1st Lien | ||||||||
4.478%, VAR LIBOR+4.250%, 07/30/2027 | $ | 276 | $ | 276 | ||||
White Cap Buyer LLC, Initial Closing Date Term Loan, 1st Lien | ||||||||
4.500%, 10/19/2027 | 443 | 442 | ||||||
Wilsonart LLC, Term Loan D, 1st Lien | ||||||||
4.250%, VAR LIBOR+3.250%, 12/19/2023 | 1,137 | 1,134 | ||||||
Wilsonart LLC, Term Loan E, 1st Lien | ||||||||
4.500%, 12/19/2026 (L) | 695 | 693 | ||||||
Wok Holdings Inc., Initial Term Loan, 1st Lien | ||||||||
6.365%, 03/01/2026 | 650 | 618 | ||||||
Woodford Express LLC, Initial Term Loan, 1st Lien | ||||||||
6.000%, 01/27/2025 | 1,963 | 1,781 | ||||||
Zayo Group Holdings Inc., Initial Dollar Term Loan, 1st Lien | ||||||||
3.115%, VAR LIBOR+3.000%, 03/09/2027 (L) | 307 | 305 | ||||||
|
|
| ||||||
Total Loan Participations | 171,746 | |||||||
|
|
| ||||||
| Shares | ||||||||
COMMON STOCK — 2.0% |
| |||||||
21st Century Oncology Private Company *(E)(F) | 15,311 | 172 | ||||||
Aquity Holdings Inc *(F) | 85,745 | 900 | ||||||
Arctic Canadian Diamond Company Ltd. | 1,054 | – | ||||||
Aspect Software, Cl CR1 *(F) | 27,500 | – | ||||||
Aspect Software, Cl CR2 *(F) | 11,134 | – | ||||||
Battalion Oil * | 607 | 7 | ||||||
Berry Corp | 331,646 | 1,827 | ||||||
Cenveo Corporation *(F) | 38,426 | 442 | ||||||
CHC Group LLC * | 7,983 | – | ||||||
Chesapeake Energy * | 4,043 | 175 | ||||||
Clear Channel Outdoor Holdings Inc, Cl A * | 202,317 | 364 | ||||||
Copper Property Pass-Through Certificates | 147,922 | 2,590 | ||||||
Cumulus Media Inc, Cl A * | 33,499 | 305 | ||||||
EP Energy * | 15,235 | 1,112 | ||||||
Extraction Oil & Gas * | 121,543 | 4,368 | ||||||
FTS International, Cl A * | 51,419 | 1,272 | ||||||
Global Aviation Holdings Inc, Cl A *(F) | 97,655 | – | ||||||
Guitar Center (E)(F) | 13,905 | 1,970 | ||||||
Gymboree *(F) | 40,312 | 20 | ||||||
Hexion Holdings Corp * | 105,856 | 1,588 | ||||||
iHeartMedia Inc *(C) | 104,022 | 1,888 | ||||||
Knight Energy Services *(F)(M) | 1,764 | – | ||||||
| SEI Institutional Managed Trust / Semi-Annual Report / March 31, 2021 | 127 |
SCHEDULE OF INVESTMENTS (Unaudited)
March 31, 2021
High Yield Bond Fund (Continued)
| Description | Shares | Market Value ($ Thousands) | ||||||
COMMON STOCK (continued) |
| |||||||
Magnachip Semiconductor * | 36,341 | $ | 905 | |||||
Medical Card Systems *(F) | 284,758 | – | ||||||
Mmodal (Escrow | 67,688 | 8 | ||||||
Monitronics International | 211,006 | 2,146 | ||||||
Motors Liquidation GUC Trust | 213 | – | ||||||
MYT Holding LLC *(E)(F) | 273,738 | 1,629 | ||||||
Neiman Marcus | 6,554 | 410 | ||||||
Nine West FKA Premier Brands * | 92,548 | 139 | ||||||
Noble Corp | 25,319 | 429 | ||||||
Oasis Petroleum Inc | 11,454 | 680 | ||||||
Parker Drilling *(O) | 79,089 | 522 | ||||||
Penney Borrower LLC | 19,723 | 204 | ||||||
Quad/Graphics Inc | 166 | 1 | ||||||
Reichhold Industries *(E)(F) | 1,427 | 1,809 | ||||||
Remainco LLC *(E)(F) | 27,268 | 33 | ||||||
Remington Outdoor Company Inc *(E)(F) | 12,794 | – | ||||||
Rue 21 * | 1,835 | 183 | ||||||
SandRidge Energy * | 8,295 | 33 | ||||||
TE Holdcorp *(F) | 50,160 | – | ||||||
Titan Energy LLC * | 22,243 | 2 | ||||||
Tourmaline Oil Corp | 75,020 | 1,428 | ||||||
VICI Properties Inc ‡ | 52,784 | 1,491 | ||||||
Whiting Petroleum * | 13,557 | 481 | ||||||
Windstream Services *(F) | 10,897 | 135 | ||||||
|
|
| ||||||
Total Common Stock (Cost $34,855) ($ Thousands) | 31,668 | |||||||
|
|
| ||||||
| Face Amount (Thousands) | ||||||||
CONVERTIBLE BONDS — 0.8% |
| |||||||
Air Canada CV to 65.1337 | ||||||||
4.000%, 07/01/2025 (A) | $ | 260 | 410 | |||||
Apollo Commercial Real Estate Finance CV to 50.226 | ||||||||
4.750%, 08/23/2022 | 282 | 282 | ||||||
Cheniere Energy CV to 7.2265 | ||||||||
4.250%, 03/15/2045 | 615 | 503 | ||||||
Chesapeake Energy CV to 116.7134 | ||||||||
5.500%, 09/15/2026 | 100 | 2 | ||||||
CNX Resources CV to 77.8816 | ||||||||
2.250%, 05/01/2026 (A) | 270 | 365 | ||||||
DISH Network CV to 15.343 | ||||||||
3.375%, 08/15/2026 | 1,312 | 1,261 | ||||||
Golar LNG CV to 26.9925 | ||||||||
2.750%, 02/15/2022 | 556 | 537 | ||||||
Liberty Latin America CV to 48.4315 | ||||||||
2.000%, 07/15/2024 | 1,740 | 1,713 | ||||||
Liberty Media CV to 16.776 | ||||||||
3.750%, 02/15/2030 | 2,556 | 1,958 | ||||||
Liberty Media CV to 22.947 | ||||||||
4.000%, 11/15/2029 | 490 | 375 | ||||||
| Description | Face Amount (Thousands) | Market Value ($ Thousands) | ||||||
CONVERTIBLE BONDS (continued) |
| |||||||
MGIC Investment CV to 74.0741 | ||||||||
9.000%, 04/01/2063 (A) | $ | 2,242 | $ | 3,010 | ||||
Pebblebrook Hotel Trust CV to 39.2549 | ||||||||
1.750%, 12/15/2026 | 715 | 837 | ||||||
Twitter CV to 7.6905 | ||||||||
0.892%, 03/15/2026 (A) | 765 | 723 | ||||||
|
|
| ||||||
Total Convertible Bonds (Cost $10,743) ($ Thousands) | 11,976 | |||||||
|
|
| ||||||
| Shares | ||||||||
PREFERRED STOCK — 0.4% |
| |||||||
Boardriders Inc., | 215,931 | 225 | ||||||
Claire’s Stores, 0.000% (E)(F) | 792 | 732 | ||||||
Crestwood Equity Partners, 9.250% (D)(N) | 202,389 | 1,749 | ||||||
Danaher, 5.000% | 554 | 718 | ||||||
FHLMC, 0.000% (D) | 16,903 | 139 | ||||||
FNMA, 0.000% (D) | 24,650 | 200 | ||||||
Foresight, 0.000% | 32,601 | 318 | ||||||
Guitar Center, 0.000% (E)(F) | 366 | 35 | ||||||
Ladenburg Thalmann Financial Services, | ||||||||
6.500% | 64,356 | 1,282 | ||||||
MYT Holding LLC, 0.000% | 384,147 | 388 | ||||||
Neiman Marcus Group, 0.000% (E)(F) | 3,938 | – | ||||||
Qurate Retail, 8.000% | 2,044 | 208 | ||||||
TE Holdcorp, 0.000% (F) | 87,794 | – | ||||||
ViacomCBS, 5.750% | 7,652 | 514 | ||||||
|
|
| ||||||
Total Preferred Stock | 6,508 | |||||||
|
|
| ||||||
| Face Amount (Thousands) | ||||||||
MUNICIPAL BONDS — 0.1% |
| |||||||
Puerto Rico — 0.1% | ||||||||
Commonwealth of Puerto Rico, Ser A, GO | ||||||||
Callable 07/01/2022 @ 100 | ||||||||
5.250%, | 350 | 292 | ||||||
5.125%, 07/01/2037 (B) | 340 | 278 | ||||||
5.000%, 07/01/2041 (B) | 765 | 618 | ||||||
|
|
| ||||||
Total Municipal Bonds | 1,188 | |||||||
|
|
| ||||||
| 128 | SEI Institutional Managed Trust / Semi-Annual Report / March 31, 2021 |
| Description | Number of Warrants | Market Value ($ Thousands) | ||||||
WARRANTS — 0.1% |
| |||||||
Carestream Health Inc. | ||||||||
Strike Price $– *‡‡(E)(F) | 47 | $ | – | |||||
Chesapeake Energy, Expires 02/12/2026 | ||||||||
Strike Price $36 * | 5,032 | 85 | ||||||
Chesapeake Energy, Expires 02/12/2026 | ||||||||
Strike Price $32 * | 4,069 | 80 | ||||||
Chesapeake Energy, Expires 02/12/2026 | ||||||||
Strike Price $28 * | 3,661 | 73 | ||||||
Guitar Center, Expires 12/22/2070 | ||||||||
Strike Price $100 *(E)(F) | 3,680 | 230 | ||||||
Guitar Center, Expires 12/22/2070 | ||||||||
Strike Price $160 *(E)(F) | 3,681 | 152 | ||||||
Guitar Center, Expires 12/30/2027 | ||||||||
Strike Price $– *(F) | 14,007 | – | ||||||
Noble Corp, Expires 02/05/2028 | ||||||||
Strike Price $– * | 22,660 | 121 | ||||||
Remington Outdoor Company Inc | ||||||||
Strike Price $– *‡‡(E)(F) | 12,902 | – | ||||||
SandRidge Energy, Expires 10/07/2022 | ||||||||
Strike Price $41 * | 7,653 | – | ||||||
SandRidge Energy, Expires 10/07/2022 | ||||||||
Strike Price $42 * | 3,221 | – | ||||||
Windstream | ||||||||
Strike Price $– *‡‡(E)(F) | 104 | 1 | ||||||
Windstream Services | ||||||||
Strike Price $– *‡‡(F) | 12,184 | 157 | ||||||
|
| |||||||
Total Warrants (Cost $793) ($ Thousands) | 899 | |||||||
|
| |||||||
| Shares | ||||||||
AFFILIATED PARTNERSHIP — 0.0% |
| |||||||
SEI Liquidity Fund, L.P. | ||||||||
0.020% **†(P) | 1,141 | 1 | ||||||
|
| |||||||
Total Affiliated Partnership (Cost $1) ($ Thousands) | 1 | |||||||
|
| |||||||
CASH EQUIVALENT — 1.6% |
| |||||||
SEI Daily Income Trust, Government Fund, Cl F | ||||||||
0.010%**† | 25,175,629 | 25,176 | ||||||
|
| |||||||
Total Cash Equivalent (Cost $25,176) ($ Thousands) | 25,176 | |||||||
|
| |||||||
Total Investments in Securities — 100.2% |
| $ | 1,554,452 | |||||
|
| |||||||
Percentages are based on Net Assets of $1,551,158 ($ Thousands). |
| * | Non-income producing security. |
| ** | The rate reported is the 7-day effective yield as of March 31, 2021. |
| ‡ | Real Estate Investment Trust. |
| ‡‡ | Expiration date not available. |
| † | Investment in Affiliated Security (see Note 6). |
| (A) | Security exempt from registration under Rule 144A of the Securities Act of 1933. These securities may be resold in transactions exempt from registration normally to qualified institutions. On March 31, 2021, the value of these securities amounted to $943,693 ($ Thousands), representing 60.8% of the Net Assets of the Fund. |
| (B) | Security is in default on interest payment. |
| (C) | Security, or a portion thereof, is owned through a holding entity, Bamboo Temple, LLC. |
| (D) | Perpetual security with no stated maturity date. |
| (E) | Security fair valued using methods determined in good faith by the Valuation Committee of the Board of Trustees. The total market value of such securities as of March 31, 2021 was $29,807 ($ Thousands) and represented 1.9% of the Net Assets of the Fund. |
| (F) | Level 3 security in accordance with fair value hierarchy. |
| (G) | Securities considered restricted. The total market value of such securities as of March 31, 2021 was $39 ($ Thousands) and represented 0.0% of the Net Assets of the Fund. |
| (H) | Security, or a portion thereof, is owned through a holding entity, 717 AEP Leasing, LLC. |
| (I) | No interest rate available. |
| (J) | Warehouse Note - Interest rate and maturity date are unavailable. |
| (K) | Variable or floating rate security, the interest rate of which adjusts periodically based on changes in current interest rates and prepayments on the underlying pool of assets. |
| (L) | Unsettled bank loan. Interest rate may not be available. |
| (M) | Security, or a portion thereof, is owned through a holding entity, Knights Energy Topco, LLC. |
| (N) | Security is a Master Limited Partnership. At March 31, 2021, such securities amounted to $1,749 ($ Thousands), or 0.1% of the Net Assets of the Fund (See Note 2). |
| (O) | Securities considered illiquid. The total value of such securities as March 31, 2021 was $522 ($Thousands) and represented 0.0% of the Net Assets of the Fund. |
| (P) | This security was purchased with cash collateral held from securities on loan. The total market value of such securities as of March 31, 2021 was $1 ($ Thousands). |
CDO — Collateralized Debt Obligation
Cl — Class
CLO — Collateralized Loan Obligation
CV — Convertible Security
DAC — Designated Activity Company
FHLMC — Federal Home Loan Mortgage Corporation
FNMA — Federal National Mortgage Association
GO — General Obligation
ICE— Intercontinental Exchange
LIBOR— London Interbank Offered Rate
LLC — Limited Liability Company
LLLP — Limited Liability Limited Partnership
L.P. — Limited Partnership
Ltd. — Limited
MSCI — Morgan Stanley Capital International
MTN — Medium Term Note
PIK — Payment-in-Kind
Pty — Proprietary
Ser — Series
SPX — Standard & Poor’s 500 Index
ULC — Unlimited Liability Company
USD — U.S. Dollar
VAR — Variable Rate
| SEI Institutional Managed Trust / Semi-Annual Report / March 31, 2021 | 129 |
SCHEDULE OF INVESTMENTS (Unaudited)
March 31, 2021
High Yield Bond Fund (Concluded)
The following is a list of the level of inputs used as of March 31, 2021, in valuing the Fund’s
investments carried at value ($ Thousands):
| Investments in Securities | Level 1 ($) | Level 2 ($) | Level 3 ($) | Total ($) | ||||||||||||
Corporate Obligations | – | 1,121,551 | 5,391 | 1,126,942 | ||||||||||||
Asset-Backed Securities | – | 1,233 | 177,115 | 178,348 | ||||||||||||
Loan Participations | – | 149,338 | 22,408 | 171,746 | ||||||||||||
Common Stock | 18,450 | 3,545 | 9,673 | 31,668 | ||||||||||||
Convertible Bonds | – | 11,976 | – | 11,976 | ||||||||||||
Preferred Stock | 2,545 | 2,971 | 992 | 6,508 | ||||||||||||
Municipal Bonds | – | 896 | 292 | 1,188 | ||||||||||||
Warrants | – | 359 | 540 | 899 | ||||||||||||
Affiliated Partnership | – | 1 | – | 1 | ||||||||||||
Cash Equivalent | 25,176 | �� | – | – | 25,176 | |||||||||||
|
|
|
|
|
|
|
| |||||||||
Total Investments in Securities | 46,171 | 1,291,870 | 216,411 | 1,554,452 | ||||||||||||
|
|
|
|
|
|
|
| |||||||||
The following is a reconciliation of the investments in which significant unobservable inputs (Level 3) were used in determining value ($ Thousands):
| Investments in Corporate Obligations | Investments in Asset-Backed Securities | Investments in Loan Participations | Investments in Common Stock | Investments in Preferred Stock | Investments in Convertible Bonds | Investments in Municipal Bonds | Investments in Warrants | |||||||||||||||||||||||||
Balance as of September 30, 2020 | $ | 7,108 | $ | 114,965 | $ | 24,952 | $ | 6,107 | $ | 1,445 | $ | 8 | $ | 1,584 | $ | 110 | ||||||||||||||||
Accrued discounts/premiums | (3 | ) | 127 | 126 | – | – | (17 | ) | – | – | ||||||||||||||||||||||
Realized gain/(loss) | 256 | 868 | (483 | ) | (2,199 | ) | 77 | (38 | ) | 101 | (58 | ) | ||||||||||||||||||||
Change in unrealized appreciation/ (depreciation) | (909 | ) | 55,623 | 2,326 | 5,160 | (102 | ) | 47 | 11 | 362 | ||||||||||||||||||||||
Purchases | 105 | 31,028 | 3,607 | 1,762 | 34 | – | – | 329 | ||||||||||||||||||||||||
Sales | (3,909 | ) | (25,496 | ) | (8,120 | ) | (1,157 | ) | (100 | ) | – | (1,404 | ) | (203 | ) | |||||||||||||||||
Net transfer into Level 3 | 2,743 | – | – | – | 1 | – | – | – | ||||||||||||||||||||||||
Net transfer out of Level 3 | – | – | – | – | (363 | ) | – | – | – | |||||||||||||||||||||||
|
| |||||||||||||||||||||||||||||||
Ending Balance as of March 31, 2021(1) | $ | 5,391 | $ | 177,115 | $ | 22,408 | $ | 9,673 | $ | 992 | $ | – | $ | 292 | $ | 540 | ||||||||||||||||
|
| |||||||||||||||||||||||||||||||
Changes in unrealized gains/(losses) included in earnings related to securities still held at reporting date | $ | (1,072 | ) | $ | 44,635 | $ | 1,292 | $ | 1,683 | $ | (102 | ) | $ | – | $ | 62 | $ | 257 | ||||||||||||||
|
| |||||||||||||||||||||||||||||||
(1) Of the $216,411 ($ Thousands) in Level 3 securities as of March 31, 2021, $14,013 ($ Thousands) or 0.9% of the Net Assets of the Fund are not valued via third party pricing vendors and broker quotes. If significant, the disclosure of the unobservable inputs and the interrelationships and sensitivity between these inputs are required for those Level 3 securities that are not valued by third party pricing vendors or broker quotes. The value of these securities is immaterial and no further disclosure is required.
For the period ended March 31, 2021, there were transfers between Level 2 and Level 3 assets and liabilities due to the availability of observable inputs to determine fair value.
For more information on valuation inputs, see Note 2 – Significant Accounting Policies in Notes to Financial Statements.
The following is a summary of the Fund’s transactions with affiliates for the period ended March 31, 2021 ($ Thousands):
| Security Description | Value 9/30/2020 | Purchases at Cost | Proceeds from Sales | Realized Gain/ (Loss) | Change in Unrealized Appreciation/ (Depreciation) | Value 3/31/2021 | Shares | Income | Capital Gains | |||||||||
SEI Liquidity Fund, L.P. | $ 1 | $– | $– | $– | $– | $ 1 | 1,141 | $– | $– | |||||||||
SEI Daily Income Trust, Government Fund, Cl F | 7,810 | 325,815 | (308,449) | – | – | 25,176 | 25,175,629 | 2 | – | |||||||||
|
|
|
|
|
|
|
| |||||||||||
Totals | $7,811 | $325,815 | $(308,449) | $– | $– | $25,177 | $2 | $– | ||||||||||
|
|
|
|
|
|
|
|
Amounts designated as “—” are either $0 or have been rounded to $0.
The accompanying notes are an integral part of the financial statements.
| 130 | SEI Institutional Managed Trust / Semi-Annual Report / March 31, 2021 |
SCHEDULE OF INVESTMENTS (Unaudited)
March 31, 2021
Conservative Income Fund
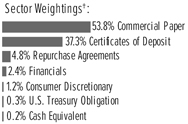
†Percentages are based on total investments.
| Description | Face Amount (Thousands) | Market Value ($ Thousands) | ||||||
COMMERCIAL PAPER — 53.8% |
| |||||||
Banks — 2.9% | ||||||||
Banque et Caisse d Epargne de l Etat | ||||||||
0.220%, 04/08/2021 (A) | $ | 4,000 | $ | 4,000 | ||||
HSBC Bank | ||||||||
0.310%, 01/07/2022 (A) | 2,000 | 1,996 | ||||||
0.270%, 02/02/2022 (A) | 1,500 | 1,497 | ||||||
Toronto-Dominion Bank | ||||||||
0.060%, | 2,000 | 2,000 | ||||||
|
|
| ||||||
| 9,493 | ||||||||
|
|
| ||||||
Consumer Discretionary — 1.7% |
| |||||||
American Honda Finance | ||||||||
0.200%, 04/22/2021 (A) | 2,900 | 2,900 | ||||||
Hyundai Capital America | ||||||||
0.210%, | 2,900 | 2,900 | ||||||
|
|
| ||||||
| 5,800 | ||||||||
|
|
| ||||||
Financials — 44.9% | ||||||||
Alinghi Funding | ||||||||
0.291%, | 2,000 | 1,998 | ||||||
0.268%, | 1,500 | 1,498 | ||||||
0.260%, | 3,000 | 2,997 | ||||||
Antalis | ||||||||
0.200%, | 1,000 | 1,000 | ||||||
0.090%, | 2,000 | 2,000 | ||||||
ASB Finance | ||||||||
0.199%, | 2,000 | 1,999 | ||||||
Autobahn Funding | ||||||||
0.090%, | 4,000 | 4,000 | ||||||
Bayerische Landesbank | ||||||||
0.070%, 04/01/2021 (A) | 8,000 | 8,000 | ||||||
0.050%, 04/05/2021 (A) | 4,000 | 4,000 | ||||||
Bedford Row Funding | ||||||||
0.272%, 08/12/2021 (B) | 1,000 | 1,000 | ||||||
0.272%, 11/04/2021 (B) | 1,000 | 1,000 | ||||||
0.271%, | 1,000 | 1,000 | ||||||
0.090%, | 2,000 | 2,000 | ||||||
BNZ International Funding | ||||||||
0.210%, | 4,000 | 3,998 | ||||||
0.205%, | 2,000 | 1,998 | ||||||
BPCE | ||||||||
0.336%, | 2,000 | 1,997 | ||||||
0.336%, | 2,000 | 1,997 | ||||||
0.301%, | 1,000 | 1,000 | ||||||
| Description | Face Amount (Thousands) | Market Value ($ Thousands) | ||||||
COMMERCIAL PAPER (continued) |
| |||||||
Caisse d’Amortissement de la Dette Sociale | ||||||||
0.259%, | $ | 2,000 | $ | 1,999 | ||||
Citigroup Global Markets | ||||||||
0.261%, | 4,000 | 3,999 | ||||||
Concord Minutemen Capital | ||||||||
0.386%, | 350 | 350 | ||||||
Credit Industriel et Commercial | ||||||||
0.250%, | 4,000 | 3,999 | ||||||
Crown Point Capital | ||||||||
0.260%, | 5,000 | 5,000 | ||||||
0.231%, | 1,500 | 1,498 | ||||||
DBS Bank | ||||||||
0.229%, | 4,000 | 3,998 | ||||||
0.219%, | 5,000 | 5,000 | ||||||
Erste Abwicklungsanstalt | ||||||||
0.050%, | 10,000 | 10,000 | ||||||
Fairway Finance | ||||||||
0.260%, | 2,000 | 1,999 | ||||||
Federation des Caisses Desjardins du Quebec | ||||||||
0.090%, | 6,000 | 6,000 | ||||||
Landesbank Baden-Wuerttemberg NY | ||||||||
0.090%, | 7,000 | 7,000 | ||||||
Lime Funding | ||||||||
0.208%, | 1,000 | 999 | ||||||
Longship Funding | ||||||||
0.060%, | 7,000 | 7,000 | ||||||
Mackinac Funding | ||||||||
0.288%, | 2,000 | 2,000 | ||||||
Macquarie Bank | ||||||||
0.175%, | 3,000 | 2,999 | ||||||
Mitsubishi UFJ Trust & Banking | ||||||||
0.260%, | 3,000 | 3,000 | ||||||
Mizuho Bank NY | ||||||||
0.150%, | 5,000 | 5,000 | ||||||
National Bank of Canada | ||||||||
0.200%, | 3,000 | 2,997 | ||||||
National Securities Clearing | ||||||||
0.100%, | 7,000 | 7,000 | ||||||
Natixis NY | ||||||||
0.290%, | 2,000 | 2,000 | ||||||
Nieuw Amsterdam Receivables | ||||||||
0.148%, | 2,000 | 1,999 | ||||||
Oversea-Chinese Banking | ||||||||
0.279%, | 2,000 | 1,999 | ||||||
PSP Capital | ||||||||
0.220%, | 3,000 | 3,000 | ||||||
Ridgefield Funding | ||||||||
0.260%, | 2,000 | 2,000 | ||||||
0.259%, | 2,000 | 2,000 | ||||||
Societe Generale | ||||||||
0.301%, | 2,000 | 1,999 | ||||||
| SEI Institutional Managed Trust / Semi-Annual Report / March 31, 2021 | 131 |
SCHEDULE OF INVESTMENTS (Unaudited)
March 31, 2021
Conservative Income Fund (Continued)
| Description | Face Amount (Thousands) | Market Value ($ Thousands) | ||||||
COMMERCIAL PAPER (continued) |
| |||||||
Suncorp-Metway | ||||||||
0.260%, | $ | 3,500 | $ | 3,500 | ||||
Swedbank NY | ||||||||
0.050%, 04/01/2021 (A) | 5,000 | 5,000 | ||||||
|
|
| ||||||
| 148,816 | ||||||||
|
|
| ||||||
Health Care — 0.9% | ||||||||
UnitedHealth Group | ||||||||
0.150%, | 2,900 | 2,900 | ||||||
|
|
| ||||||
Industrials — 0.9% | ||||||||
Hitachi America Capital | ||||||||
0.170%, 04/08/2021 (A)(B) | 2,900 | 2,900 | ||||||
|
|
| ||||||
Materials — 0.8% | ||||||||
Amcor Flexibles North America | ||||||||
0.180%, | 2,750 | 2,750 | ||||||
|
|
| ||||||
Utilities — 1.7% | ||||||||
American Water Capital | ||||||||
0.130%, | 2,900 | 2,900 | ||||||
PPL Electric Utilities | ||||||||
0.140%, | 2,900 | 2,900 | ||||||
|
|
| ||||||
| 5,800 | ||||||||
|
|
| ||||||
Total Commercial Paper | ||||||||
(Cost $178,441) ($ Thousands) | 178,459 | |||||||
|
|
| ||||||
CORPORATE OBLIGATIONS — 3.6% |
| |||||||
Consumer Discretionary — 1.2% |
| |||||||
Jets Stadium Development | ||||||||
0.160%, VAR N/A0.000%, | ||||||||
04/01/2047 (B)(D) | 4,000 | 4,000 | ||||||
|
|
| ||||||
Financials — 2.4% | ||||||||
Bank of Montreal | ||||||||
0.222%, VAR ICE LIBOR USD 3 | ||||||||
Month+0.040%, 09/17/2021 | 2,000 | 2,000 | ||||||
Canadian Imperial Bank of Commerce NY | ||||||||
0.358%, VAR ICE LIBOR USD 3 Month+0.140%, 07/23/2021 | 1,500 | 1,501 | ||||||
Credit Suisse NY | ||||||||
0.310%, VAR United States Secured Overnight Financing Rate+0.300%, 11/16/2021 | 2,000 | 2,002 | ||||||
DNB Bank | ||||||||
0.395%, VAR ICE LIBOR USD 3 Month+0.200%, 05/05/2021 | 1,500 | 1,500 | ||||||
| Description | Face Amount (Thousands) | Market Value ($ Thousands) | ||||||
CORPORATE OBLIGATIONS (continued) |
| |||||||
Svenska Handelsbanken NY | ||||||||
0.300%, VAR ICE LIBOR USD 3 Month+0.110%, 06/16/2021 | $ | 1,000 | $ | 1,000 | ||||
|
|
| ||||||
| 8,003 | ||||||||
|
|
| ||||||
Total Corporate Obligations |
| 12,003 | ||||||
|
|
| ||||||
U.S. TREASURY OBLIGATION — 0.3% |
| |||||||
U.S. Treasury Notes | ||||||||
0.240%, VAR US Treasury 3 Month Bill Money Market Yield+0.220%, 07/31/2021 | 1,000 | 1,001 | ||||||
|
|
| ||||||
Total U.S. Treasury Obligation |
| 1,001 | ||||||
|
|
| ||||||
CERTIFICATES OF DEPOSIT — 37.3% |
| |||||||
Australia & New Zealand Banking Group | ||||||||
0.215%, | 1,500 | 1,500 | ||||||
0.214%, | 1,000 | 1,000 | ||||||
Bank of America | ||||||||
0.275%, 10/01/2021 | 500 | 500 | ||||||
Bank of Montreal | ||||||||
0.311%, 06/24/2021 | 1,000 | 1,000 | ||||||
0.243%, 08/06/2021 | 2,000 | 2,001 | ||||||
0.225%, 02/23/2022 | 1,000 | 1,000 | ||||||
Bank of Nova Scotia | ||||||||
0.225%, | 1,500 | 1,500 | ||||||
Bedford Row Funding | ||||||||
0.253%, 09/27/2021 | 3,000 | 3,000 | ||||||
Canadian Imperial Bank of Commerce NY | ||||||||
0.353%, 08/06/2021 | 1,000 | 1,001 | ||||||
0.344%, 01/14/2022 | 1,000 | 1,001 | ||||||
0.278%, 10/04/2021 | 1,500 | 1,500 | ||||||
0.060%, 04/05/2021 | 5,000 | 5,000 | ||||||
Citibank | ||||||||
0.270%, 06/14/2021 | 3,000 | 3,001 | ||||||
Cooperatieve Rabobank UA | ||||||||
0.250%, 08/16/2021 | 2,000 | 2,000 | ||||||
Credit Industriel et Commercial | ||||||||
0.370%, 06/18/2021 | 1,000 | 1,000 | ||||||
Credit Suisse NY | ||||||||
0.300%, 08/23/2021 | 1,000 | 1,000 | ||||||
0.240%, 04/08/2022 | 1,500 | 1,500 | ||||||
DNB Bank | ||||||||
0.301%, | 2,000 | 2,001 | ||||||
DZ Bank AG | ||||||||
0.140%, 04/14/2021 | 5,000 | 5,000 | ||||||
| 132 | SEI Institutional Managed Trust / Semi-Annual Report / March 31, 2021 |
| Description | Face Amount (Thousands) | Market Value ($ Thousands) | ||||||
CERTIFICATES OF DEPOSIT (continued) |
| |||||||
HSBC Bank | ||||||||
0.330%, 08/31/2021 (B) | $ | 2,000 | $ | 2,001 | ||||
Kookmin Bank | ||||||||
0.334%, 02/07/2022 | 1,000 | 1,000 | ||||||
Landesbank Baden-Wuerttemberg NY | ||||||||
0.250%, 07/08/2021 | 3,000 | 3,001 | ||||||
Mizuho Bank NY | ||||||||
0.280%, 05/10/2021 | 3,000 | 3,001 | ||||||
0.260%, 08/06/2021 | 3,000 | 3,001 | ||||||
0.210%, 08/26/2021 | 2,000 | 2,000 | ||||||
MUFG Bank NY | ||||||||
0.240%, 10/22/2021 | 1,000 | 1,000 | ||||||
0.240%, 10/27/2021 | 3,000 | 3,001 | ||||||
National Australia Bank | ||||||||
0.354%, 07/08/2021 (B) | 1,000 | 1,001 | ||||||
0.233%, 03/29/2022 (B) | 1,500 | 1,500 | ||||||
Nordea Bank Abp NY | ||||||||
0.285%, 06/09/2021 | 1,500 | 1,500 | ||||||
Norinchukin Bank | ||||||||
0.225%, 09/27/2021 | 1,500 | 1,500 | ||||||
0.060%, 04/01/2021 | 8,500 | 8,500 | ||||||
Oversea-Chinese Banking | ||||||||
0.110%, 04/06/2021 | 7,000 | 7,000 | ||||||
Royal Bank of Canada | ||||||||
0.650%, 05/03/2021 | 1,000 | 1,001 | ||||||
0.430%, 07/26/2021 | 1,500 | 1,502 | ||||||
0.273%, 12/10/2021 | 1,000 | 1,000 | ||||||
Skandinaviska Enskilda Banken NY | ||||||||
0.250%, 05/13/2021 | 2,000 | 2,000 | ||||||
Standard Chartered Bank NY | ||||||||
0.214%, 09/03/2021 | 3,000 | 3,000 | ||||||
Sumitomo Mitsui Banking | ||||||||
0.280%, 06/01/2021 | 2,000 | 2,001 | ||||||
0.270%, 05/03/2021 | 2,000 | 2,000 | ||||||
0.260%, 07/06/2021 | 3,000 | 3,001 | ||||||
0.224%, 09/13/2021 | 2,000 | 2,000 | ||||||
0.050%, 04/05/2021 | 9,000 | 9,000 | ||||||
Svenska Handelsbanken NY | ||||||||
0.231%, 08/09/2021 | 1,750 | 1,750 | ||||||
0.208%, 09/02/2021 | 1,000 | 1,000 | ||||||
Swedbank NY | ||||||||
0.274%, 10/20/2021 | 2,000 | 2,000 | ||||||
0.250%, 07/26/2021 | 2,000 | 2,001 | ||||||
Toronto-Dominion Bank | ||||||||
0.430%, 07/28/2021 | 1,500 | 1,501 | ||||||
0.400%, 08/16/2021 | 1,000 | 1,001 | ||||||
0.276%, 08/24/2021 | 1,000 | 1,000 | ||||||
0.250%, 02/18/2022 | 2,000 | 2,000 | ||||||
UBS AG | ||||||||
0.395%, 07/09/2021 | 1,500 | 1,500 | ||||||
0.220%, 02/08/2022 | 2,500 | 2,499 | ||||||
| Description | Face Amount (Thousands) | Market Value ($ Thousands) | ||||||
CERTIFICATES OF DEPOSIT (continued) |
| |||||||
Westpac Banking | ||||||||
0.358%, 07/02/2021 (B) | $ | 1,000 | $ | 1,000 | ||||
0.213%, 02/04/2022 (B) | 1,500 | 1,500 | ||||||
0.202%, 02/17/2022 (B) | 2,800 | 2,800 | ||||||
0.191%, 09/01/2021 (B) | 1,000 | 1,000 | ||||||
|
|
| ||||||
Total Certificates of Deposit |
| 123,568 | ||||||
|
|
| ||||||
| Shares | ||||||||
CASH EQUIVALENT — 0.2% | ||||||||
SEI Daily Income Trust, Government Fund, Cl F | ||||||||
0.010%**† | 695,388 | 695 | ||||||
|
|
| ||||||
Total Cash Equivalent |
| 695 | ||||||
|
|
| ||||||
| Face Amount (Thousands) | ||||||||
REPURCHASE AGREEMENTS — 4.9% |
| |||||||
Bank of America Securities 0.010%, dated 3/31/2021, to be repurchased on 4/01/2021, repurchase price $6,000,002 (collateralized by various GNMA obligations, ranging in par value $299,938 - $2,465,280, 2.020% - 5.000%, 4/20/2041 - 2/20/2050; with total market value $2,040,000) (C) | 6,000 | 6,000 | ||||||
Goldman Sachs & Co 0.010%, dated 3/31/2021, to be repurchased on 4/01/2021, repurchase price $2,000,001 (collateralized by GNMA obligation, par value $7,040,200, 4.500%, 6/20/2050; with total market value $6,120,000) (C) | 2,000 | 2,000 | ||||||
TD Securities 0.010%, dated 3/31/2021, to be repurchased on 4/01/2021, repurchase price $8,000,002 (collateralized by various U.S Treasury obligations, ranging in par value $107,000 - $999,500, 0.500% - 2.750%, 6/30/2021 - 11/15/2029; with total market value $8,160,088) (C) | 8,000 | 8,000 | ||||||
|
|
| ||||||
Total Repurchase Agreements |
| 16,000 | ||||||
|
|
| ||||||
Total Investments in Securities - 100.1% |
| $ | 331,726 | |||||
|
|
| ||||||
| SEI Institutional Managed Trust / Semi-Annual Report / March 31, 2021 | 133 |
SCHEDULE OF INVESTMENTS (Unaudited)
March 31, 2021
Conservative Income Fund (Concluded)
Percentages are based on Net Assets of $331,066 ($Thousands). |
| ** | The rate reported is the 7-day effective yield as of March 31, 2021. |
| † | Investment in Affiliated Security (see Note 6). |
| (A) | Zero coupon security. The rate shown on the Schedule of Investments is the security’s effective yield at the time of purchase. |
| (B) | Security exempt from registration under Rule 144A of the Securities Act of 1933. These securities may be resold in transactions exempt from registration normally to qualified institutions. On March 31, 2021, the value of these securities amounted to $162,869 ($Thousands), representing 49.2% of the Net Assets of the Fund. |
| (C) | Tri-Party Repurchase Agreement. |
| (D) | Variable or floating rate security, the interest rate of which adjusts periodically based on changes in current interest rates and prepayments on the underlying pool of assets. |
Cl — Class
ICE— Intercontinental Exchange
LIBOR— London Interbank Offered Rate
USD — U.S. Dollar
VAR — Variable Rate
The following is a list of the level of inputs used as of March 31, 2021, in valuing the Fund’s investments carried at value ($Thousands):
| Investments in Securities | Level 1 ($) | Level 2 ($) | Level 3 ($) | Total ($) | ||||||||||||
Commercial Paper | – | 178,459 | – | 178,459 | ||||||||||||
Corporate Obligations | – | 12,003 | – | 12,003 | ||||||||||||
U.S. Treasury Obligation | – | 1,001 | – | 1,001 | ||||||||||||
Certificates of Deposit | – | 123,568 | – | 123,568 | ||||||||||||
Cash Equivalent | 695 | – | – | 695 | ||||||||||||
Repurchase Agreements | – | 16,000 | – | 16,000 | ||||||||||||
|
|
|
|
|
|
|
| |||||||||
Total Investments in Securities | 695 | 331,031 | – | 331,726 | ||||||||||||
|
|
|
|
|
|
|
| |||||||||
For the period ended March 31, 2021, there were no transfers in or out of Level 3.
For more information on valuation inputs, see Note 2 – Significant Accounting Policies in Notes to Financial Statements.
The following is a summary of the Fund’s transactions with affiliates for the period ended March 31, 2021 ($Thousands):
| Security Description | Value 9/30/2020 | Purchases at Cost | Proceeds from Sales | Realized Gain/ (Loss) | Change in Unrealized Appreciation/ (Depreciation) | Value 3/31/2021 | Shares | Income | Capital Gains | |||||||||
| SEI Daily Income Trust, Government Fund, Cl F | $ 716 | $ 2,971 | $ (2,992) | $ — | $ — | $ 695 | 695,388 | $ — | $ — | |||||||||
|
|
|
|
|
|
|
|
Amounts designated as “—” are either $0 or have been rounded to $0.
The accompanying notes are an integral part of the financial statements.
| 134 | SEI Institutional Managed Trust / Semi-Annual Report / March 31, 2021 |
SCHEDULE OF INVESTMENTS (Unaudited)
March 31, 2021
Tax-Free Conservative Income Fund

†Percentages are based on total investments.
| Description | Face Amount (Thousands) | Market Value ($ Thousands) | ||||||
MUNICIPAL BONDS — 76.8% |
| |||||||
Alaska — 0.5% |
| |||||||
Alaska State, Housing Finance, Ser B, RB | ||||||||
0.050%, 12/01/2030 (A) | $ | 960 | $ | 960 | ||||
|
|
| ||||||
Arizona — 0.7% | ||||||||
Yavapai County, Industrial Development Authority, Drake Cement Project, Ser A, RB | ||||||||
0.110%, 09/01/2035 (A)(B) | 1,500 | 1,500 | ||||||
|
|
| ||||||
California — 4.9% | ||||||||
Los Angeles County, Schools Pooled Financing Program, Ser B-3, RB | ||||||||
2.000%, 12/30/2021 | 1,000 | 1,014 | ||||||
Riverside County, Office of Education Pooled Notes, Ser A, RB | ||||||||
2.000%, 12/01/2021 | 4,000 | 4,050 | ||||||
Southern California, Metropolitan Water District, Sub-Ser C, RB | ||||||||
0.320%, 07/01/2047 (A) | 5,000 | 5,000 | ||||||
|
|
| ||||||
| 10,064 | ||||||||
|
|
| ||||||
Colorado — 0.8% | ||||||||
University of Colorado, Ser A-1, RB | ||||||||
0.050%, 06/01/2050 (A) | 1,600 | 1,600 | ||||||
|
|
| ||||||
Connecticut — 2.9% | ||||||||
Connecticut State, Housing Finance Authority, Mortgage Finance Program, Sub-Ser A-3, RB | ||||||||
0.070%, 11/15/2045 (A) | 1,150 | 1,150 | ||||||
Connecticut State, Housing Finance Authority, Mortgage Finance Program, Sub-Ser C-3, RB | ||||||||
0.070%, 11/15/2045 (A) | 375 | 375 | ||||||
Connecticut State, Housing Finance Authority, Mortgage Finance Program, Sub-Ser F-3, RB | ||||||||
0.070%, 05/15/2040 (A) | 1,300 | 1,300 | ||||||
| Description | Face Amount (Thousands) | Market Value ($ Thousands) | ||||||
MUNICIPAL BONDS (continued) |
| |||||||
Connecticut State, Ser C, GO | ||||||||
0.120%, | $ | 3,170 | $ | 3,170 | ||||
|
|
| ||||||
| 5,995 | ||||||||
|
|
| ||||||
District of Columbia — 3.4% |
| |||||||
District of Columbia, Medlantic/Helix Project, Ser A, RB | ||||||||
0.040%, | 2,300 | 2,300 | ||||||
RBC Municipal Products Trust, Ser 2018-G63, GO | ||||||||
0.100%, | 2,000 | 2,000 | ||||||
Tender Option Bond Trust Receipts, Ser 2019-XG0267, RB | ||||||||
0.100%, | 2,650 | 2,650 | ||||||
|
|
| ||||||
| 6,950 | ||||||||
|
|
| ||||||
Florida — 4.2% | ||||||||
Miami-Dade County, Industrial Development Authority, Dave and Mary Alper Jewish Community Center Project, RB | ||||||||
0.090%, | 2,895 | 2,895 | ||||||
Palm Beach County, Raymond Kravis Center Project, RB | ||||||||
0.060%, | 5,885 | 5,885 | ||||||
|
|
| ||||||
| 8,780 | ||||||||
|
|
| ||||||
Georgia — 1.0% | ||||||||
Georgia State, Municipal Electric Authority, Project One, | ||||||||
0.060%, | 2,000 | 2,000 | ||||||
|
|
| ||||||
Illinois — 7.1% | ||||||||
Aurora, Fox Valley Counseling Center, RB | ||||||||
0.080%, | 1,710 | 1,710 | ||||||
Illinois State, Development Finance Authority, Glenwood School For Boys, RB | ||||||||
0.090%, | 2,000 | 2,000 | ||||||
Illinois State, Development Finance Authority, YMCA Metropolitan Chicago Project, RB | ||||||||
0.090%, | 3,500 | 3,500 | ||||||
| SEI Institutional Managed Trust / Semi-Annual Report / March 31, 2021 | 135 |
SCHEDULE OF INVESTMENTS (Unaudited)
March 31, 2021
Tax-Free Conservative Income Fund (Continued)
| Description | Face Amount (Thousands) | Market Value ($ Thousands) | ||||||
MUNICIPAL BONDS (continued) |
| |||||||
Illinois State, Finance Authority, Northwestern University, Sub-Ser, RB | ||||||||
0.070%, | $ | 1,980 | $ | 1,980 | ||||
Tender Option Bond Trust Receipts, | ||||||||
0.120%, | 4,250 | 4,250 | ||||||
University of Illinois, Hospital & Health Sciences System, Ser B, RB | ||||||||
0.090%, | 1,200 | 1,200 | ||||||
|
|
| ||||||
| 14,640 | ||||||||
|
|
| ||||||
Iowa — 7.8% | ||||||||
Iowa State, Finance Authority, Midwestern Disaster Area Economic Development, CJ Bio America Project, RB | ||||||||
0.140%, | 7,000 | 7,000 | ||||||
Iowa State, Finance Authority, Pollution Control Facilities, MidAmerican Energy Project, RB | ||||||||
0.080%, | 1,500 | 1,500 | ||||||
Iowa State, Finance Authority, Pollution Control Facilities, MidAmerican Energy Project, Ser B, RB | ||||||||
0.080%, | 3,000 | 3,000 | ||||||
Iowa State, Finance Authority, RB, GNMA/ FNMA/FHLMC | ||||||||
0.060%, | 625 | 625 | ||||||
Iowa State, Finance Authority, Ser B-RE, RB, GNMA/FNMA/FHLMC | ||||||||
0.070%, | 2,000 | 2,000 | ||||||
Iowa State, Finance Authority, UnityPoint Health Project, RB | ||||||||
0.020%, | 2,000 | 2,000 | ||||||
|
|
| ||||||
| 16,125 | ||||||||
|
|
| ||||||
Louisiana — 2.5% | ||||||||
Louisiana State, Offshore Terminal Authority, RB | ||||||||
0.080%, | 1,850 | 1,850 | ||||||
Louisiana State, Public Facilities Authority, Air Products and Chemicals Project, Ser B, RB | ||||||||
0.050%, | 2,300 | 2,300 | ||||||
| Description | Face Amount (Thousands) | Market Value ($ Thousands) | ||||||
MUNICIPAL BONDS (continued) |
| |||||||
Louisiana State, Public Facilities Authority, Linlake Ventures Project, RB | ||||||||
0.050%, | $ | 1,000 | $ | 1,000 | ||||
|
|
| ||||||
| 5,150 | ||||||||
|
|
| ||||||
Maryland — 0.8% | ||||||||
Maryland State, Community Development Administration, Department of Housing and Community Development, Crusader Arms Apartments Project, Ser D, RB | ||||||||
0.110%, | 1,070 | 1,070 | ||||||
Maryland State, Health & Higher Educational Facilities Authority, Anne Arundel Health System Project, Ser B, RB | ||||||||
0.080%, | 500 | 500 | ||||||
|
|
| ||||||
| 1,570 | ||||||||
|
|
| ||||||
Massachusetts — 1.4% | ||||||||
Truro, GO | ||||||||
2.000%, 06/11/2021 | 2,900 | 2,910 | ||||||
|
|
| ||||||
Michigan — 2.4% | ||||||||
Central Michigan University, Ser A, RB | ||||||||
0.070%, | 1,400 | 1,400 | ||||||
Michigan State University, Ser A, RB | ||||||||
0.060%, | 1,700 | 1,700 | ||||||
Michigan State, Housing Development Authority, Single Family Mortgage Project, Ser D, RB | ||||||||
0.110%, | 1,900 | 1,900 | ||||||
|
|
| ||||||
| 5,000 | ||||||||
|
|
| ||||||
Minnesota — 0.2% | ||||||||
Minneapolis, University Gateway Project, RB | ||||||||
0.060%, | 500 | 500 | ||||||
|
|
| ||||||
Mississippi — 2.6% | ||||||||
Jackson County, Chevron USA Project, RB | ||||||||
0.020%, | 4,100 | 4,100 | ||||||
Mississippi State, Business Finance, Chevron, Ser L, RB | ||||||||
0.020%, | 1,300 | 1,300 | ||||||
|
|
| ||||||
| 5,400 | ||||||||
|
|
| ||||||
| 136 | SEI Institutional Managed Trust / Semi-Annual Report / March 31, 2021 |
| Description | Face Amount (Thousands) | Market Value ($ Thousands) | ||||||
MUNICIPAL BONDS (continued) |
| |||||||
Missouri — 2.1% | ||||||||
Kansas City, Special Obligation, H Roe Bartle Project, Ser E, RB | ||||||||
0.080%, | $ | 920 | $ | 920 | ||||
RBC Municipal Products Trust, Ser C-16, RB | ||||||||
0.130%, | 3,500 | 3,500 | ||||||
|
|
| ||||||
| 4,420 | ||||||||
|
|
| ||||||
Nevada — 0.3% | ||||||||
Tender Option Bond Trust Receipts, Ser 2020-XF2858, RB | ||||||||
0.120%, | 700 | 700 | ||||||
|
|
| ||||||
New Jersey — 2.4% | ||||||||
Jersey City, Ser C, GO | ||||||||
2.000%, 06/17/2021 | 5,000 | 5,020 | ||||||
|
|
| ||||||
New York — 5.4% | ||||||||
Carmel, Central School District, GO | ||||||||
1.500%, 06/17/2021 | 2,000 | 2,005 | ||||||
New York City, Health and Hospitals, Ser B, RB | ||||||||
0.060%, | 400 | 400 | ||||||
New York City, Water & Sewer System, RB | ||||||||
0.030%, | 2,300 | 2,300 | ||||||
New York State, Housing Finance Agency, Ser A, RB | ||||||||
0.080%, | 1,000 | 1,000 | ||||||
Oneida County, Industrial Development Agency, Mohawk Valley Community College Dormitory Project, Ser A, RB | ||||||||
0.120%, | 1,200 | 1,200 | ||||||
Oswego County, Industrial Development Agency, O.H. Properties Project, Ser A, RB | ||||||||
0.120%, | 445 | 445 | ||||||
RBC Municipal Products Trust, Ser 2018-G5, GO | ||||||||
0.100%, | 1,900 | 1,900 | ||||||
Tender Option Bond Trust Receipts, Ser 2017-XF0550, RB | ||||||||
0.160%, | 2,000 | 2,000 | ||||||
|
|
| ||||||
| 11,250 | ||||||||
|
|
| ||||||
| Description | Face Amount (Thousands) | Market Value ($ Thousands) | ||||||
MUNICIPAL BONDS (continued) |
| |||||||
North Carolina — 1.1% |
| |||||||
North Carolina, Medical Care Commission, Ser A, RB | ||||||||
0.060%, | $ | 800 | $ | 800 | ||||
Raleigh, Downtown Improvement Project, Ser A, RB | ||||||||
0.060%, | 1,460 | 1,460 | ||||||
|
|
| ||||||
| 2,260 | ||||||||
|
|
| ||||||
North Dakota — 1.5% | ||||||||
North Dakota, Housing Finance Agency, Ser H, RB | ||||||||
0.070%, | 3,100 | 3,100 | ||||||
|
|
| ||||||
Ohio — 2.4% | ||||||||
Akron, Bath Copley Joint Township Hospital District, Ser B-R, RB | ||||||||
0.070%, | 1,230 | 1,230 | ||||||
Fairborn, School District, School Facilities Construction and Improvement, Ser A, GO | ||||||||
4.000%, 12/01/2021 | 350 | 359 | ||||||
Franklin County, Hospital Facilities Revenue, RB | ||||||||
0.060%, | 500 | 500 | ||||||
Franklin County, Hospital Facilities Revenue, Sub-Ser R, RB | ||||||||
0.070%, | 1,065 | 1,065 | ||||||
Hamilton County, Health Care Facilities Authority, Children’s Home Project, RB | ||||||||
0.080%, | 800 | 800 | ||||||
Parma, GO | ||||||||
1.000%, 07/22/2021 | 1,000 | 1,002 | ||||||
|
|
| ||||||
| 4,956 | ||||||||
|
|
| ||||||
Oregon — 0.5% | ||||||||
Oregon State, Facilities Authority, Ser B, RB | ||||||||
0.020%, | 1,100 | 1,100 | ||||||
|
|
| ||||||
Pennsylvania — 3.1% | ||||||||
Emmaus, General Authority, RB | ||||||||
0.050%, 12/01/2028 | 200 | 200 | ||||||
| SEI Institutional Managed Trust / Semi-Annual Report / March 31, 2021 | 137 |
SCHEDULE OF INVESTMENTS (Unaudited)
March 31, 2021
Tax-Free Conservative Income Fund (Concluded)
| Description | Face Amount (Thousands) | Market Value ($ Thousands) | ||||||
MUNICIPAL BONDS (continued) |
| |||||||
Montgomery County, Industrial Development Authority, Acts Retirement Life Communities, RB, AGC | ||||||||
0.130%, | $ | 175 | $ | 175 | ||||
Pennsylvania State, Economic Development Financing Authority, PPL Energy Supply Project, RB | ||||||||
0.090%, | 3,000 | 3,000 | ||||||
Philadelphia Gas Works, Ser D, RB | ||||||||
0.060%, | 600 | 600 | ||||||
Philadelphia, Ser A, RB | ||||||||
4.000%, 06/30/2021 | 2,000 | 2,019 | ||||||
South Central, General Authority, Wellspan Health Highland Groups, RB | ||||||||
0.100%, | 500 | 500 | ||||||
|
|
| ||||||
| 6,494 | ||||||||
|
|
| ||||||
Tennessee — 1.0% | ||||||||
Clarksville, Public Building Authority, Pooled Financing, RB | ||||||||
0.110%, | 2,000 | 2,000 | ||||||
|
|
| ||||||
Texas — 11.8% | ||||||||
Denton, Independent School District, Ser B, GO | ||||||||
0.090%, | 840 | 840 | ||||||
Harris County, Health Facilities Development Authority, Methodist Hospital System Project, RB | ||||||||
0.010%, | 1,500 | 1,500 | ||||||
Houston, Combined Utility System Revenue, RB | ||||||||
0.070%, | 1,125 | 1,125 | ||||||
North Fort Bend, Water Authority, Ser 2019-XF0816, RB | ||||||||
0.170%, | 1,500 | 1,500 | ||||||
Port Arthur, Navigation District, Industrial Development, Petrochemicals USA Project, RB | ||||||||
0.100%, | 5,300 | 5,300 | ||||||
0.100%, | 2,500 | 2,500 | ||||||
| Description | Face Amount (Thousands) | Market Value ($ Thousands) | ||||||
MUNICIPAL BONDS (continued) |
| |||||||
Port Arthur, Navigation District, Industrial Development, Petrochemicals USA Project, Ser A, RB | ||||||||
0.100%, | $ | 1,000 | $ | 1,000 | ||||
Tarrant County, Cultural Education Facilities Finance, Christus Health, RB | ||||||||
0.070%, | 1,525 | 1,525 | ||||||
Tarrant County, Cultural Education Facilities Finance, Methodist Hospitals of Dallas Project, Ser R, RB | ||||||||
0.020%, | 1,800 | 1,800 | ||||||
Texas State, Veterans Bonds, GO | ||||||||
0.100%, | 2,230 | 2,230 | ||||||
0.090%, | 1,100 | 1,100 | ||||||
0.070%, | 700 | 700 | ||||||
Texas State, Veterans Bonds, Ser A, GO | ||||||||
0.070%, | 300 | 300 | ||||||
Texas State, Veterans Bonds, Ser B, GO | ||||||||
0.070%, | 2,750 | 2,750 | ||||||
Texas State, Veterans Bonds, Ser B, GO | ||||||||
0.070%, | 285 | 285 | ||||||
|
|
| ||||||
| 24,455 | ||||||||
|
|
| ||||||
Virginia — 0.7% | ||||||||
Fairfax County, Industrial Development Authority, Inova Health System Project, RB | ||||||||
0.070%, | 635 | 635 | ||||||
Loudoun County, Economic Development Authority, Howard Hughes Institute, Ser F, RB | ||||||||
0.080%, | 900 | 900 | ||||||
|
|
| ||||||
| 1,535 | ||||||||
|
|
| ||||||
Washington — 0.1% | ||||||||
Port Tacoma, Sub-Ser B, RB | ||||||||
0.070%, | 300 | 300 | ||||||
|
|
| ||||||
West Virginia — 0.2% | ||||||||
West Virginia, Hospital Finance Authority, West Virginia University, RB | ||||||||
0.070%, | 475 | 475 | ||||||
|
|
| ||||||
| 138 | SEI Institutional Managed Trust / Semi-Annual Report / March 31, 2021 |
| Description | Face Amount (Thousands) | Market Value ($ Thousands) | ||||||
MUNICIPAL BONDS (continued) |
| |||||||
Wisconsin — 1.0% | ||||||||
Wisconsin State, Housing & Economic Development Authority, Ser C, RB | ||||||||
0.070%, 05/01/2046 (A) | $ | 2,000 | $ | 2,000 | ||||
|
|
| ||||||
Total Municipal Bonds | ||||||||
(Cost $159,202) ($ Thousands) | 159,209 | |||||||
|
|
| ||||||
TAX-EXEMPT COMMERCIAL PAPER — 23.1% |
| |||||||
Brownsville, Utility System | ||||||||
0.220%, 12/16/2021 | 1,500 | 1,500 | ||||||
Fort Bend, Independent School District | ||||||||
0.110%, 04/28/2021 | 1,000 | 1,000 | ||||||
Garland, Water & Sewer | ||||||||
0.150%, 05/25/2021 | 4,000 | 4,000 | ||||||
Honolulu City and County | ||||||||
0.160%, 07/07/2021 | 4,000 | 4,000 | ||||||
King County | ||||||||
0.130%, 05/19/2021 | 1,000 | 1,000 | ||||||
0.100%, 06/03/2021 | 1,000 | 1,000 | ||||||
Memphis | ||||||||
0.100%, 05/06/2021 | 5,000 | 5,000 | ||||||
Michigan State University | ||||||||
0.110%, 05/06/2021 | 5,000 | 5,000 | ||||||
New York State, Power Authority | ||||||||
0.290%, 07/13/2021 | 2,000 | 2,001 | ||||||
North East, Independent School District | ||||||||
0.210%, 05/03/2021 | 7,000 | 7,000 | ||||||
Omaha, Public Power District | ||||||||
0.130%, 05/06/2021 | 1,000 | 1,000 | ||||||
Port Authority of New York & New Jersey | ||||||||
0.120%, 06/09/2021 | 1,525 | 1,525 | ||||||
San Diego, Public Facilities Financing Authority | ||||||||
0.100%, 04/21/2021 | 5,000 | 5,000 | ||||||
University of Minnesota | ||||||||
0.110%, 05/20/2021 | 3,000 | 3,000 | ||||||
University of Texas | ||||||||
0.120%, 05/19/2021 | 900 | 900 | ||||||
0.100%, 05/20/2021 | 2,000 | 2,000 | ||||||
University of Washington | ||||||||
0.150%, 07/07/2021 | 3,000 | 3,000 | ||||||
|
|
| ||||||
Total Tax-Exempt Commercial Paper |
| |||||||
(Cost $47,925) ($ Thousands) | 47,926 | |||||||
|
|
| ||||||
Total Investments in Securities — 99.9% |
| |||||||
(Cost $207,127) ($ Thousands) | $ | 207,135 | ||||||
|
|
| ||||||
Percentages are based on Net Assets of $207,338 ($ Thousands). |
| (A) | Variable or floating rate security, the interest rate of which adjusts periodically based on prevailing interest rates. |
| (B) | Securities are held in connection with a letter of credit issued by a major bank. |
| (C) | Security exempt from registration under Rule 144A of the Securities Act of 1933. These securities may be resold in transactions exempt from registration normally to qualified institutions. On March 31, 2021, the value of these securities amounted to $18,500 ($ Thousands), representing 8.9% of the Net Assets of the Fund. |
AGC — Assured Guaranty Corporation
FHLMC — Federal Home Loan Mortgage Corporation
FNMA — Federal National Mortgage Association
GNMA — Government National Mortgage Association
GO — General Obligation
RB — Revenue Bond
Ser — Series
As of March 31, 2021, all of the Fund’s investments were considered Level 2, in accordance with the authoritative guidance on fair value measurements and disclosure under U.S. GAAP.
For the period ended March 31, 2021, there were no transfers in or out of Level 3.
For more information on valuation inputs, see Note 2 – Significant Accounting Policies in Notes to Financial Statements.
The accompanying notes are an integral part of the financial statements.
| SEI Institutional Managed Trust / Semi-Annual Report / March 31, 2021 | 139 |
SCHEDULE OF INVESTMENTS (Unaudited)
March 31, 2021
Real Return Fund

†Percentages are based on total investments.
| Description | Face Amount (Thousands) | Market Value ($ Thousands) | ||||||
U.S. TREASURY OBLIGATIONS — 99.5% |
| |||||||
U.S. Treasury Inflation Protected Securities | ||||||||
2.375%, 01/15/2025 | $ | 10,450 | $ | 12,239 | ||||
2.000%, 01/15/2026 | 7,624 | 9,007 | ||||||
0.625%, 04/15/2023 | 15,956 | 16,982 | ||||||
0.625%, 01/15/2024 | 17,914 | 19,416 | ||||||
0.625%, 01/15/2026 | 14,115 | 15,689 | ||||||
0.500%, 04/15/2024 | 9,973 | 10,808 | ||||||
0.375%, 07/15/2023 | 18,607 | 19,927 | ||||||
0.375%, 07/15/2025 | 16,154 | 17,790 | ||||||
0.250%, 01/15/2025 | 16,819 | 18,260 | ||||||
0.125%, 04/15/2022 | 16,049 | 16,507 | ||||||
0.125%, 07/15/2022 | 15,630 | 16,247 | ||||||
0.125%, 01/15/2023 | 19,029 | 19,956 | ||||||
0.125%, 07/15/2024 | 16,409 | 17,751 | ||||||
0.125%, 10/15/2024 | 13,692 | 14,806 | ||||||
0.125%, 04/15/2025 | 11,454 | 12,396 | ||||||
0.125%, 10/15/2025 | 13,844 | 15,075 | ||||||
0.125%, 10/15/2025 | 83 | 90 | ||||||
|
|
| ||||||
Total U.S. Treasury Obligations | 252,946 | |||||||
|
|
| ||||||
| Description | Shares | Market Value ($ Thousands) | ||||||
CASH EQUIVALENT — 0.6% | ||||||||
SEI Daily Income Trust, Government Fund, Cl F | ||||||||
0.010%**† | 1,342,207 | $ | 1,342 | |||||
|
|
| ||||||
Total Cash Equivalent | 1,342 | |||||||
|
|
| ||||||
Total Investments in Securities — 100.1% |
| $ | 254,288 | |||||
|
|
| ||||||
Percentages are based on Net Assets of $254,159 ($ Thousands). |
| ** | The rate reported is the 7-day effective yield as of March 31, 2021. |
| † | Investment in Affiliated Security (see Note 6). |
Cl — Class
The following is a list of the level of inputs used as of March 31, 2021, in valuing the Fund’s investments carried at value ($ Thousands):
| Investments in Securities | Level 1 ($) | Level 2 ($) | Level 3 ($) | Total ($) | ||||||||||||
U.S. Treasury Obligations | – | 252,946 | – | 252,946 | ||||||||||||
Cash Equivalent | 1,342 | – | – | 1,342 | ||||||||||||
|
|
|
|
|
|
|
|
|
|
|
| |||||
Total Investments in Securities | 1,342 | 252,946 | – | 254,288 | ||||||||||||
|
|
|
|
|
|
|
|
|
|
|
| |||||
For the period ended March 31, 2021, there were no transfers in or out of Level 3.
For more information on valuation inputs, see Note 2 — Significant Accounting Policies in Notes to Financial Statements.
The following is a summary of the Fund’s transactions with affiliates for the period ended March 31, 2021 ($Thousands):
| Security Description | Value 9/30/2020 | Purchases at Cost | Proceeds from Sales | Realized Gain/ (Loss) | Change in Unrealized Appreciation/ (Depreciation) | Value 3/31/2021 | Shares | Income | Capital Gains | |||||||||
SEI Daily Income Trust, Government Fund, Cl F | $ 394 | $ 17,932 | $ (16,984) | $ — | $ — | $ 1,342 | 1,342,207 | $ — | $ — | |||||||||
|
|
|
|
|
|
|
|
Amounts designated as “—” are either $0 or have been rounded to $0.
The accompanying notes are an integral part of the financial statements.
| 140 | SEI Institutional Managed Trust / Semi-Annual Report / March 31, 2021 |
CONSOLIDATED SUMMARY SCHEDULE OF INVESTMENTS (Unaudited)
March 31, 2021
Dynamic Asset Allocation Fund
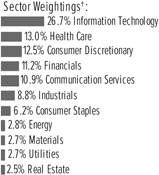
†Percentages are based on total investments.
| Description | Percentage of Net Assets (%) | Shares | Market Value ($ Thousands) | |||||||||
COMMON STOCK — 87.0% |
| |||||||||||
Communication Services — 9.8% |
| |||||||||||
Alphabet Inc, Cl A * | 1.7 | % | 6,710 | $ | 13,839 | |||||||
Alphabet Inc, Cl C * | 1.6 | 6,383 | 13,204 | |||||||||
AT&T Inc | 0.6 | 158,703 | 4,804 | |||||||||
Comcast Corp, Cl A | 0.7 | 101,680 | 5,502 | |||||||||
Facebook Inc, Cl A * | 1.9 | 53,451 | 15,743 | |||||||||
Netflix Inc * | 0.6 | 9,781 | 5,102 | |||||||||
Verizon Communications Inc | 0.6 | 92,098 | 5,356 | |||||||||
Walt Disney Co/The | 0.9 | 40,250 | 7,427 | |||||||||
Other Securities | 1.2 | 10,642 | ||||||||||
| �� |
|
|
| |||||||||
| 81,619 | ||||||||||||
|
|
| ||||||||||
Consumer Discretionary — 11.0% |
| |||||||||||
Amazon.com Inc, Cl A * | 3.5 | 9,463 | 29,279 | |||||||||
Home Depot Inc/The | 0.9 | 23,882 | 7,290 | |||||||||
McDonald’s Corp | 0.4 | 16,607 | 3,722 | |||||||||
NIKE Inc, Cl B | 0.5 | 28,238 | 3,753 | |||||||||
Tesla Inc * | 1.4 | 17,081 | 11,409 | |||||||||
Other Securities | 4.3 | 36,708 | ||||||||||
|
|
| ||||||||||
| 92,161 | ||||||||||||
|
|
| ||||||||||
Consumer Staples — 5.5% |
| |||||||||||
Coca-Cola Co/The | 0.5 | 86,282 | 4,548 | |||||||||
Costco Wholesale Corp | 0.4 | 9,776 | 3,446 | |||||||||
PepsiCo Inc | 0.5 | 30,640 | 4,334 | |||||||||
Procter & Gamble Co/The | 0.9 | 54,766 | 7,417 | |||||||||
Walmart Inc | 0.5 | 30,876 | 4,194 | |||||||||
Other Securities | 2.7 | 21,987 | ||||||||||
|
|
| ||||||||||
| 45,926 | ||||||||||||
|
|
| ||||||||||
Energy — 2.5% |
| |||||||||||
Chevron Corp | 0.5 | 42,823 | 4,487 | |||||||||
Exxon Mobil Corp | 0.6 | 94,200 | 5,259 | |||||||||
Other Securities | 1.4 | 11,181 | ||||||||||
|
|
| ||||||||||
| 20,927 | ||||||||||||
|
|
| ||||||||||
Financials — 9.8% |
| |||||||||||
Bank of America Corp | 0.8 | 169,073 | 6,541 | |||||||||
Berkshire Hathaway Inc, Cl B * | 1.3 | 42,330 | 10,814 | |||||||||
Citigroup Inc | 0.4 | 46,445 | 3,379 | |||||||||
JPMorgan Chase & Co | 1.2 | 67,717 | 10,308 | |||||||||
| Description | Percentage of Net Assets (%) | Shares | Market Value ($ Thousands) | |||||||||
COMMON STOCK (continued) |
| |||||||||||
Wells Fargo & Co | 0.4 | % | 91,933 | $ | 3,592 | |||||||
Other Securities | 5.7 | 47,478 | ||||||||||
|
|
| ||||||||||
| 82,112 | ||||||||||||
|
|
| ||||||||||
Health Care — 11.1% |
| |||||||||||
Abbott Laboratories | 0.6 | 39,424 | 4,725 | |||||||||
AbbVie Inc | 0.5 | 39,241 | 4,247 | |||||||||
Eli Lilly and Co | 0.4 | 17,666 | 3,300 | |||||||||
Johnson & Johnson | 1.2 | 58,344 | 9,589 | |||||||||
Merck & Co Inc | 0.5 | 56,266 | 4,338 | |||||||||
Pfizer Inc | 0.5 | 124,057 | 4,495 | |||||||||
Thermo Fisher Scientific Inc | 0.5 | 8,776 | 4,005 | |||||||||
UnitedHealth Group Inc | 0.9 | 20,991 | 7,810 | |||||||||
Other Securities | 6.0 | 50,651 | ||||||||||
|
|
| ||||||||||
| 93,160 | ||||||||||||
|
|
| ||||||||||
Industrials — 7.4% |
| |||||||||||
Honeywell International Inc | 0.4 | 15,452 | 3,354 | |||||||||
Union Pacific Corp | 0.4 | 14,842 | 3,271 | |||||||||
Other Securities | 6.6 | 55,627 | ||||||||||
|
|
| ||||||||||
| 62,252 | ||||||||||||
|
|
| ||||||||||
Information Technology — 23.3% |
| |||||||||||
Adobe Inc * | 0.6 | 10,633 | 5,055 | |||||||||
Apple Inc | 5.1 | 350,560 | 42,821 | |||||||||
Broadcom Inc | 0.5 | 9,075 | 4,208 | |||||||||
Cisco Systems Inc/Delaware | 0.6 | 93,972 | 4,859 | |||||||||
Intel Corp | 0.7 | 90,397 | 5,785 | |||||||||
Mastercard Inc, Cl A | 0.8 | 19,482 | 6,937 | |||||||||
Microsoft Corp | 4.7 | 167,534 | 39,499 | |||||||||
NVIDIA Corp | 0.9 | 13,728 | 7,330 | |||||||||
PayPal Holdings Inc * | 0.8 | 25,985 | 6,310 | |||||||||
QUALCOMM Inc | 0.4 | 25,268 | 3,350 | |||||||||
salesforce.com Inc * | 0.5 | 20,372 | 4,316 | |||||||||
Texas Instruments Inc | 0.5 | 20,511 | 3,876 | |||||||||
Visa Inc, Cl A | 1.0 | 37,732 | 7,989 | |||||||||
Other Securities | 6.2 | 52,815 | ||||||||||
|
|
| ||||||||||
| 195,150 | ||||||||||||
|
|
| ||||||||||
Materials — 2.0% |
| |||||||||||
Other Securities | 2.0 | 16,455 | ||||||||||
|
|
| ||||||||||
Real Estate — 2.2% |
| |||||||||||
Other Securities ‡ | 2.2 | 18,465 | ||||||||||
|
|
| ||||||||||
| SEI Institutional Managed Trust / Semi-Annual Report / March 31, 2021 | 141 |
CONSOLIDATED SUMMARY SCHEDULE OF INVESTMENTS (Unaudited)
March 31, 2021
Dynamic Asset Allocation Fund (Continued)
| Description | Percentage of Net Assets (%) | Shares | Market Value ($ Thousands) | |||||||||
COMMON STOCK (continued) |
| |||||||||||
Utilities — 2.4% |
| |||||||||||
NextEra Energy Inc | 0.4 | % | 43,592 | $ | 3,296 | |||||||
Other Securities | 2.0 | 16,605 | ||||||||||
|
|
| ||||||||||
| 19,901 | ||||||||||||
|
|
| ||||||||||
Total Common Stock |
| |||||||||||
(Cost $363,574) ($ Thousands) |
| 728,128 | ||||||||||
|
|
| ||||||||||
FOREIGN COMMON STOCK — 2.2% |
| |||||||||||
Consumer Discretionary — 0.1% |
| |||||||||||
Other Securities | 0.1 | 833 | ||||||||||
|
|
| ||||||||||
Financials — 0.2% |
| |||||||||||
Other Securities | 0.2 | 1,805 | ||||||||||
|
|
| ||||||||||
Health Care — 0.5% |
| |||||||||||
Medtronic PLC | 0.4 | 29,941 | 3,537 | |||||||||
Other Securities | 0.1 | 486 | ||||||||||
|
|
| ||||||||||
| 4,023 | ||||||||||||
|
|
| ||||||||||
Industrials — 0.5% |
| |||||||||||
Other Securities | 0.5 | 3,762 | ||||||||||
|
|
| ||||||||||
| Description | Percentage of Net Assets (%) | Shares | Market Value ($ Thousands) | |||||||||
FOREIGN COMMON STOCK (continued) |
| |||||||||||
Information Technology — 0.5% |
| |||||||||||
Accenture PLC, Cl A | 0.4 | % | 14,048 | $ | 3,881 | |||||||
Other Securities | 0.1 | 333 | ||||||||||
|
|
| ||||||||||
| 4,214 | ||||||||||||
|
|
| ||||||||||
Materials — 0.4% |
| |||||||||||
Other Securities | 0.4 | 3,653 | ||||||||||
|
|
| ||||||||||
Total Foreign Common Stock |
| |||||||||||
(Cost $9,664) ($ Thousands) |
| 18,290 | ||||||||||
|
|
| ||||||||||
Total Investments in Securities — 89.2% |
| |||||||||||
(Cost $373,238) ($ Thousands) |
| $ | 746,418 | |||||||||
|
|
| ||||||||||
| Contracts | ||||||||||||
PURCHASED OPTION* — 0.4% |
| |||||||||||
Total Purchased Option (A) |
| |||||||||||
(Cost $823) ($ Thousands) |
| 185,919,788 | $ | 3,393 | ||||||||
|
|
| ||||||||||
PURCHASED SWAPTIONS* — 2.3% |
| |||||||||||
Total Purchased Swaption (B) |
| |||||||||||
(Cost $5,038) ($ Thousands) |
| 612,455,481 | $ | 19,052 | ||||||||
|
|
| ||||||||||
A list of the open option contracts held by the Fund at March 31, 2021 is as follows:
| Description | Number of Contracts | Notional Amount (Thousands) † | Exercise Price | Expiration Date | Value (Thousands) | |||||||||||||||
PURCHASED OPTION — 0.4% |
| |||||||||||||||||||
Call Options | ||||||||||||||||||||
EUR PUT USD CALL* | 185,919,788 | $ | 823 | $1.19 | 4/17/2021 | $ | 3,393 | |||||||||||||
|
|
|
| |||||||||||||||||
Total Purchased Option | $ | 823 | $ | 3,393 | ||||||||||||||||
|
|
|
| |||||||||||||||||
† Represents Cost
A list of the open OTC swaption contracts held by the Fund at March 31, 2021 is as follows:
| Description | Counterparty | Number of Contracts/ Notional Amount | Exercise Price | Expiration Date | Value (Thousands) | |||||||||||||
PURCHASED SWAPTIONS — 2.3% |
| |||||||||||||||||
Call Swaptions | ||||||||||||||||||
CMS One Look* | Bank of America Merill Lynch | 80,642,481 | $2.00 | 08/19/2023 | $ | 11,776 | ||||||||||||
CMS One Look* | Bank of America Merill Lynch | 531,813,000 | $0.14 | 07/17/2021 | 7,276 | |||||||||||||
|
|
|
| |||||||||||||||
Total Purchased Swaptions | 612,455,481 | $ | 19,052 | |||||||||||||||
|
|
|
| |||||||||||||||
| 142 | SEI Institutional Managed Trust / Semi-Annual Report / March 31, 2021 |
A list of the open futures contracts held by the Fund at March 31, 2021 is as follows:
| Type of Contract | Number of Contracts Long | Expiration Date | Notional Amount (Thousands) | Value (Thousands) | Unrealized Appreciation (Depreciation) (Thousands) | |||||||||||||
MSCI EAFE Index | 114 | Jun-2021 | $ | 12,502 | $ | 12,494 | $ | (8 | ) | |||||||||
S&P 500 Index E-MINI^ | 364 | Jun-2021 | 71,297 | 72,207 | 910 | |||||||||||||
|
|
|
|
|
|
|
|
| ||||||||||
| $ | 83,799 | $ | 84,701 | $ | 902 | |||||||||||||
|
|
|
|
|
|
|
|
| ||||||||||
A list of the open forward foreign currency contracts held by the Fund at March 31, 2021 is as follows:
| Counterparty | Settlement Date | Currency to Deliver (Thousands) | Currency to Receive (Thousands) | Unrealized (Depreciation) (Thousands) | ||||||||||||||||||||
Bank of America | 01/11/22 | USD | 170 | SAR | 637 | $ | — | |||||||||||||||||
Bank of America | 01/11/22 | SAR | 157,631 | USD | 41,965 | (50 | ) | |||||||||||||||||
|
|
| ||||||||||||||||||||||
| $ | (50 | ) | ||||||||||||||||||||||
|
|
| ||||||||||||||||||||||
A list of the open centrally cleared swap agreements held by the Fund at March 31, 2021, is as follows:
| Interest Rate Swap | ||||||||||||||||||
| Fund Pays | Fund Receives | Payment Frequency | Termination Date | Currency | Notional Amount (Thousands) | Value (Thousands) | Upfront Payments/ Receipts (Thousands) | Net Unrealized Appreciation (Thousands) | ||||||||||
1Y CPI-CPURNSA | 2.1475% | Annually | 12/10/2030 | USD | 27,761 | $ 1,265 | $ – | $ 1,265 | ||||||||||
|
|
| ||||||||||||||||
A list of the open OTC swap agreements held by the Fund at March 31, 2021, is as follows:
| Total Return Swaps | ||||||||||||||||||||||||||||||||||||
| Counterparty | Reference Entity/ Obligation | Fund Pays | Fund Receives | Payment Frequency | Termination Date | Currency | Notional Amount (Thousands) | Value (Thousands) | Upfront Payments/ Receipts (Thousands) | Net Unrealized (Depreciation) (Thousands) | ||||||||||||||||||||||||||
BNP Paribas^ | BLOOMBERG COMMODITY INDEX TOTAL RETURN | 12 BPS | BLOOMBERG COMMODITY INDEX TOTAL RETURN | Quarterly | 05/18/2021 | USD | (47,209 | ) | $ | (992 | ) | $ | – | $ | (992 | ) | ||||||||||||||||||||
BNP Paribas^ | BLOOMBERG COMMODITY INDEX TOTAL RETURN | 7 BPS | BLOOMBERG COMMODITY INDEX TOTAL RETURN | Quarterly | 06/18/2021 | USD | (33,924 | ) | (268 | ) | – | (268 | ) | |||||||||||||||||||||||
BNP Paribas^ | BLOOMBERG COMMODITY INDEX TOTAL RETURN | 0.10% | BLOOMBERG COMMODITY INDEX TOTAL RETURN | Quarterly | 12/09/2021 | USD | (37,166 | ) | (861 | ) | – | (861 | ) | |||||||||||||||||||||||
BNP Paribas | BLOOMBERG COMMODITY INDEX TOTAL RETURN | | USD LIBOR 3-Months | | BLOOMBERG COMMODITY INDEX TOTAL RETURN | Quarterly | 12/16/2021 | USD | (13,566 | ) | (172 | ) | – | (172 | ) | |||||||||||||||||||||
|
| |||||||||||||||||||||||||||||||||||
| $ | (2,293 | ) | $ | – | $ | (2,293 | ) | |||||||||||||||||||||||||||||
|
| |||||||||||||||||||||||||||||||||||
Percentages are based on a Net Assets of $836,723 ($ Thousands). |
| * | Non-income producing security. |
| ‡ | Real Estate Investment Trust. |
| ^ | Security, or a portion thereof, is held by the Dynamic Commodity Strategy Subsidiary Ltd. as of March 31, 2021. |
| (A) | Refer to table below for details on Options Contracts. |
| (B) | Refer to table below for details on Swaption Contracts. |
BPS — Basis Points
Cl — Class
EAFE — Europe, Australasia and Far East
Ltd. — Limited
MSCI — Morgan Stanley Capital International
OTC — Over The Counter
PLC — Public Limited Company
S&P — Standard & Poor’s
SAR — Saudi Riyal
USD — U.S. Dollar
SEI Institutional Managed Trust / Semi-Annual Report / March 31, 2021 | 143 |
CONSOLIDATED SUMMARY SCHEDULE OF INVESTMENTS (Unaudited)
March 31, 2021
Dynamic Asset Allocation Fund (Concluded)
The Summary Schedule of Investments does not reflect the complete portfolio holdings. It includes the Fund’s 50 largest holdings and each investment of any issuer that exceeds 1% of the Fund’s net assets. “Other Securities” represent all issues not required to be disclosed under the rules adopted by the U.S. Securities and Exchange Commission (“SEC”). In certain instances, securities for which footnotes listed above may otherwise apply are included in the Other Securities caption. The complete schedule of portfolio holdings is available (i) without charge, upon request, by calling (800) 342-5734; and (ii) on the SEC’s website at http://www.sec.gov.
The following is a list of the level of inputs used as of March 31, 2021, in valuing the Fund’s investments and other financial instruments carried at value ($ Thousands):
| Investments in Securities | Level 1 ($) | Level 2 ($) | Level 3 ($) | Total ($) | ||||||||||||
Common Stock | 728,128 | – | – | 728,128 | ||||||||||||
Foreign Common Stock | 18,290 | – | – | 18,290 | ||||||||||||
|
|
|
|
|
|
|
|
|
|
|
| |||||
Total Investments in Securities | 746,418 | – | – | 746,418 | ||||||||||||
|
|
|
|
|
|
|
|
|
|
|
| |||||
| Other Financial Instruments | Level 1 ($) | Level 2 ($) | Level 3 ($) | Total ($) | ||||||||||||
Purchased Option | 3,393 | – | – | 3,393 | ||||||||||||
Purchased Swaptions | – | 19,052 | – | 19,052 | ||||||||||||
Futures Contracts* | ||||||||||||||||
Unrealized Appreciation | 910 | – | – | 910 | ||||||||||||
Unrealized Depreciation | (8 | ) | – | – | (8 | ) | ||||||||||
Forwards Contracts* | ||||||||||||||||
Unrealized Depreciation | – | (50 | ) | – | (50 | ) | ||||||||||
Centrally Cleared Swaps | ||||||||||||||||
Interest Rate Swaps* | ||||||||||||||||
Unrealized Appreciation | – | 1,265 | – | 1,265 | ||||||||||||
OTC Swaps | ||||||||||||||||
Total Return Swaps* | ||||||||||||||||
Unrealized Depreciation | – | (2,293 | ) | – | (2,293 | ) | ||||||||||
|
|
|
|
|
|
|
|
|
|
|
| |||||
Total Other Financial Instruments | 4,295 | 17,974 | – | 22,269 | ||||||||||||
|
|
|
|
|
|
|
|
|
|
|
| |||||
* Futures contracts, forward contracts, and swap contracts are valued at the unrealized appreciation/ (depreciation) on the instruments.
For the period ended March 31, 2021, there were no transfers in or out of Level 3.
Amounts designated as “—” are either $0 or have been rounded to $0.
For more information on valuation inputs, see Note 2 — Significant Accounting Policies in Notes to Financial Statements.
The accompanying notes are an integral part of the financial statements.
| 144 | SEI Institutional Managed Trust / Semi-Annual Report / March 31, 2021 |
SCHEDULE OF INVESTMENTS (Unaudited)
March 31, 2021
Multi-Strategy Alternative Fund
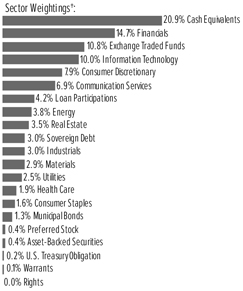
†Percentages are based on total investments.
| Description | Shares | Market Value ($ Thousands) | ||||||
COMMON STOCK — 37.6% |
| |||||||
Communication Services — 4.3% | ||||||||
Activision Blizzard Inc | 16,210 | $ | 1,507 | |||||
AT&T Inc | 24,982 | 756 | ||||||
Bumble, Cl A | 41,806 | 2,608 | ||||||
Cinemark Holdings Inc | 117,970 | 2,408 | ||||||
Clear Channel Outdoor Holdings Inc, Cl A * | 7,401 | 13 | ||||||
Cumulus Media Inc, Cl A * | 5,075 | 46 | ||||||
DISH Network Corp, Cl A * | 40,431 | 1,464 | ||||||
iHeartMedia Inc *(A) | 5,524 | 100 | ||||||
Intelsat *(B) | 9,697 | 4 | ||||||
Marcus Corp/The | 25,891 | 518 | ||||||
News Corp, Cl A | 88,191 | 2,243 | ||||||
Sciplay, Cl A * | 2,609 | 42 | ||||||
Snap Inc, Cl A * | 53,694 | 2,808 | ||||||
Take-Two Interactive Software Inc, Cl A * | 4,259 | 753 | ||||||
United States Cellular Corp * | 3,164 | 115 | ||||||
Urban One, Cl A | 12,426 | 67 | ||||||
ViacomCBS Inc, Cl B | 32,100 | 1,448 | ||||||
Vonage Holdings Corp * | 54,396 | 643 | ||||||
Walt Disney Co/The | 4,965 | 916 | ||||||
Warner Music Group, Cl A | 23,546 | 808 | ||||||
Windstream Services *(C) | 5,206 | 64 | ||||||
Zillow Group Inc, Cl A * | 9,140 | 1,201 | ||||||
|
|
| ||||||
| 20,532 | ||||||||
|
|
| ||||||
Consumer Discretionary — 3.4% | ||||||||
Accel Entertainment, Cl A * | 6,302 | 69 | ||||||
Aramark | 18,683 | 706 | ||||||
BorgWarner Inc | 49,480 | 2,294 | ||||||
Caleres Inc (N) | 115,062 | 2,508 | ||||||
Cenveo Corporation *(C) | 2,777 | 32 | ||||||
| Description | Shares | Market Value ($ Thousands) | ||||||
COMMON STOCK (continued) |
| |||||||
Coupang, Cl A | 7,125 | $ | 352 | |||||
Everi Holdings Inc * | 5,329 | 75 | ||||||
Full House Resorts * | 47,796 | 407 | ||||||
Garrett Motion Inc *(B) | 342,910 | 1,780 | ||||||
General Motors Co | 582 | 33 | ||||||
Guitar Center *(D) | 2,167 | 307 | ||||||
Harley-Davidson Inc, Cl A | 21,524 | 863 | ||||||
MercadoLibre Inc * | 611 | 899 | ||||||
Monitronics International | 9,238 | 94 | ||||||
Red Rock Resorts Inc, Cl A | 21,657 | 706 | ||||||
Ulta Beauty Inc * | 7,904 | 2,444 | ||||||
Vivint Smart Home * | 1,973 | 28 | ||||||
Wynn Resorts Ltd | 20,160 | 2,527 | ||||||
|
|
| ||||||
| 16,124 | ||||||||
|
|
| ||||||
Consumer Staples — 0.7% | ||||||||
Coty Inc, Cl A | 271,783 | 2,448 | ||||||
Molson Coors Beverage Co, Cl B | 15,090 | 772 | ||||||
Tyson Foods Inc, Cl A | 388 | 29 | ||||||
|
|
| ||||||
| 3,249 | ||||||||
|
|
| ||||||
Energy — 0.7% | ||||||||
APA | 140,520 | 2,515 | ||||||
Chesapeake Energy * | 8,498 | 369 | ||||||
Extraction Oil & Gas * | 8,373 | 301 | ||||||
NextDecade * | 14,675 | 39 | ||||||
Parker Drilling * | 4,414 | 29 | ||||||
|
|
| ||||||
| 3,253 | ||||||||
|
|
| ||||||
Financials — 11.9% | ||||||||
26 Capital Acquisition | 7,116 | 71 | ||||||
26 Capital Acquisition, Cl A | 56 | 1 | ||||||
7GC & Holdings * | 5,284 | 54 | ||||||
7GC & Holdings, Cl A * | 5,766 | 57 | ||||||
890 5th Avenue Partners | 1,942 | 19 | ||||||
Accelerate Acquisition | 12,958 | 129 | ||||||
ACON S2 Acquisition * | 5,474 | 54 | ||||||
ACON S2 Acquisition, Cl A | 9,212 | 90 | ||||||
Adara Acquisition | 1,018 | 10 | ||||||
Adit EdTech Acquisition | 21,242 | 208 | ||||||
AEA-Bridges Impact, Cl A | 4,074 | 40 | ||||||
Aequi Acquisition * | 11,216 | 112 | ||||||
Agile Growth | 14,089 | 140 | ||||||
Alkuri Global Acquisition * | 12,804 | 126 | ||||||
Alpha Capital Acquisition | 1,119 | 11 | ||||||
Altimar Acquisition II | 2,760 | 28 | ||||||
Altimar Acquisition III | 1,680 | 17 | ||||||
Altimeter Growth * | 34,185 | 418 | ||||||
Anzu Special Acquisition I * | 43,233 | 431 | ||||||
Apollo Strategic Growth Capital II * | 102 | 1 | ||||||
Arctos NorthStar Acquisition | 15,390 | 154 | ||||||
Ares Acquisition * | 3,240 | 32 | ||||||
Arrowroot Acquisition | 23,729 | 236 | ||||||
Astrea Acquisition | 35,167 | 348 | ||||||
| SEI Institutional Managed Trust / Semi-Annual Report / March 31, 2021 | 145 |
SCHEDULE OF INVESTMENTS (Unaudited)
March 31, 2021
Multi-Strategy Alternative Fund (Continued)
| Description | Shares | Market Value ($ Thousands) | ||||||
COMMON STOCK (continued) | ||||||||
Athlon Acquisition | 9,126 | $ | 90 | |||||
Athlon Acquisition, Cl A | 1,620 | 16 | ||||||
Atlantic Avenue Acquisition, Cl A * | 75,497 | 732 | ||||||
Atlantic Coastal Acquisition | 17,080 | 168 | ||||||
Austerlitz Acquisition I * | 5,092 | 51 | ||||||
Austerlitz Acquisition II | 5,092 | 51 | ||||||
Authentic Equity Acquisition * | 29,762 | 294 | ||||||
Authentic Equity Acquisition, Cl A | 7,484 | 73 | ||||||
Avanti Acquisition * | 4,355 | 45 | ||||||
Avanti Acquisition, Cl A | 4,838 | 47 | ||||||
B Riley Principal 150 Merger * | 1,018 | 10 | ||||||
Biotech Acquisition * | 16,548 | 164 | ||||||
Bite Acquisition | 30,053 | 297 | ||||||
BlueRiver Acquisition | 3,454 | 34 | ||||||
BlueRiver Acquisition, Cl A | 518 | 5 | ||||||
Bluescape Opportunities Acquisition, Cl A | 4,852 | 48 | ||||||
BOA Acquisition | 26,458 | 262 | ||||||
Bright Lights Acquisition | 4,876 | 49 | ||||||
Bright Lights Acquisition, Cl A | 10,489 | 101 | ||||||
Broadscale Acquisition | 51,509 | 510 | ||||||
Broadstone Acquisition * | 152 | 2 | ||||||
Broadstone Acquisition, Cl A * | 36,974 | 362 | ||||||
Burgundy Technology Acquisition, Cl A * | 18,875 | 187 | ||||||
Capstar Special Purpose Acquisition, Cl A * | 6,105 | 60 | ||||||
Carney Technology Acquisition II * | 14,165 | 141 | ||||||
Carney Technology Acquisition II, Cl A * | 3,197 | 31 | ||||||
Cartesian Growth * | 26,039 | 259 | ||||||
Cascade Acquisition * | 130 | 1 | ||||||
Cascade Acquisition, Cl A * | 3,371 | 33 | ||||||
Catcha Investment | 4,799 | 48 | ||||||
CBRE Acquisition Holdings * | 648 | 6 | ||||||
CC Neuberger Principal Holdings II * | 85 | 1 | ||||||
CC Neuberger Principal Holdings II, Cl A * | 9,352 | 92 | ||||||
Centricus Acquisition | 443 | 4 | ||||||
Cerberus Telecom Acquisition, Cl A * | 2,546 | 25 | ||||||
CF Acquisition IV * | 29,600 | 297 | ||||||
CF Acquisition IV, Cl A * | 16,048 | 157 | ||||||
CF Acquisition V | 14,469 | 144 | ||||||
CF Acquisition VIII | 564 | 6 | ||||||
CHP Merger, Cl A * | 15,825 | 157 | ||||||
Churchill Capital V, Cl A | 2,200 | 22 | ||||||
Churchill Capital VII | 19,566 | 195 | ||||||
Clarim Acquisition * | 15,429 | 154 | ||||||
Cohn Robbins Holdings, Cl A * | 8,159 | 80 | ||||||
Colicity | 15,219 | 154 | ||||||
Colonnade Acquisition II | 24,928 | 246 | ||||||
Concord Acquisition, Cl A | 13,020 | 127 | ||||||
Constellation Acquisition I | 14,122 | 140 | ||||||
Constellation Acquisition I, Cl A | 32 | — | ||||||
Conx, Cl A | 3,884 | 39 | ||||||
Corner Growth Acquisition * | 1,537 | 16 | ||||||
Corner Growth Acquisition, Cl A | 15,876 | 155 | ||||||
| Description | Shares | Market Value ($ Thousands) | ||||||
COMMON STOCK (continued) | ||||||||
COVA Acquisition | 48,594 | $ | 484 | |||||
Crown PropTech Acquisitions | 21,642 | 215 | ||||||
D & Z Media Acquisition | 31,299 | 310 | ||||||
D8 Holdings, Cl A * | 29,661 | 295 | ||||||
Decarbonization Plus Acquisition II | 118,410 | 1,191 | ||||||
Decarbonization Plus Acquisition III | 8,228 | 82 | ||||||
Deep Lake Capital Acquisition | 3,140 | 32 | ||||||
Delwinds Insurance Acquisition | 5,890 | 58 | ||||||
DFP Healthcare Acquisitions, Cl A | 8,369 | 84 | ||||||
DHB Capital * | 21,510 | 213 | ||||||
DHC Acquisition * | 19,482 | 195 | ||||||
DiamondHead Holdings, Cl A | 12,958 | 128 | ||||||
Digital Transformation Opportunities | 8,908 | 88 | ||||||
dMY Technology Group IV | 115,523 | 1,160 | ||||||
DPCM Capital * | 2,148 | 21 | ||||||
Duddell Street Acquisition, Cl A | 14,309 | 140 | ||||||
Dune Acquisition | 8,983 | 90 | ||||||
Dune Acquisition, Cl A | 3,942 | 38 | ||||||
E.Merge Technology Acquisition, Cl A * | 82,738 | 807 | ||||||
East Resources Acquisition, Cl A * | 36,639 | 358 | ||||||
ECP Environmental Growth Opportunities * | 2,037 | 20 | ||||||
Edify Acquisition | 12,783 | 127 | ||||||
Edify Acquisition, Cl A | 9,904 | 96 | ||||||
eHealth Inc * | 21,309 | 1,550 | ||||||
EJF Acquisition * | 43,524 | 433 | ||||||
Empowerment & Inclusion Capital I * | 6,685 | 66 | ||||||
Empowerment & Inclusion Capital I, Cl A | 1,456 | 14 | ||||||
Environmental Impact Acquisition | 242 | 2 | ||||||
Epiphany Technology Acquisition | 3,233 | 32 | ||||||
Epiphany Technology Acquisition, Cl A | 3,019 | 29 | ||||||
EQ Health Acquisition | 28,676 | 284 | ||||||
Equity Distribution Acquisition, Cl A * | 2,033 | 20 | ||||||
ESM Acquisition | 7,288 | 72 | ||||||
Evo Acquisition | 24,152 | 240 | ||||||
Far Peak Acquisition * | 924 | 9 | ||||||
Far Peak Acquisition, Cl A | 14,209 | 139 | ||||||
FinServ Acquisition, Cl A * | 2,345 | 31 | ||||||
FinServ Acquisition II | 2,137 | 21 | ||||||
Fintech Evolution Acquisition Group | 35,614 | 352 | ||||||
First Reserve Sustainable Growth | 13,168 | 131 | ||||||
FirstMark Horizon Acquisition, Cl A | 1,001 | 10 | ||||||
Flame Acquisition | 12,609 | 125 | ||||||
Foresight Acquisition * | 18,452 | 183 | ||||||
Forest Road Acquisition II * | 10,080 | 100 | ||||||
Fortistar Sustainable Solutions | 38,382 | 380 | ||||||
Fortress Value Acquisition III, Cl A | 645 | 6 | ||||||
Forum Merger III * | 2,571 | 26 | ||||||
Freedom Acquisition I * | 2,037 | 20 | ||||||
Fusion Acquisition II | 76,555 | 760 | ||||||
G&P Acquisition | 58,341 | 579 | ||||||
Gaming & Hospitality Acquisition | 24,627 | 244 | ||||||
GigCapital4 * | 23,881 | 236 | ||||||
| 146 | SEI Institutional Managed Trust / Semi-Annual Report / March 31, 2021 |
| Description | Shares | Market Value ($ Thousands) | ||||||
COMMON STOCK (continued) | ||||||||
Global Partner Acquisition II * | 5,496 | $ | 54 | |||||
Global Synergy Acquisition | 2,309 | 23 | ||||||
Global Synergy Acquisition, Cl A | 971 | 9 | ||||||
GO Acquisition * | 3,110 | 32 | ||||||
GO Acquisition, Cl A * | 28,264 | 278 | ||||||
Goal Acquisitions (B) | 161,241 | 1,620 | ||||||
Golden Falcon Acquisition * | 9,752 | 98 | ||||||
Golden Falcon Acquisition, Cl A * | 5,406 | 52 | ||||||
Gores Guggenheim * | 4,860 | 48 | ||||||
Gores Holdings VII * | 1,018 | 10 | ||||||
Gores Metropoulos II * | 15,485 | 157 | ||||||
Growth Capital Acquisition | 45,132 | 447 | ||||||
GX Acquisition II | 11,824 | 117 | ||||||
Hamilton Lane Alliance Holdings I * | 4,211 | 42 | ||||||
Haymaker Acquisition III * | 1,003 | 10 | ||||||
Healthcare Capital | 20,413 | 201 | ||||||
Healthcare Capital, Cl A | 1,837 | 18 | ||||||
Hennessy Capital Investment V | 26,074 | 264 | ||||||
Hennessy Capital Investment V, Cl A | 4,664 | 46 | ||||||
HIG Acquisition * | 8,763 | 90 | ||||||
HIG Acquisition, Cl A | 754 | 7 | ||||||
Highland Transcend Partners I, Cl A | 810 | 8 | ||||||
Horizon Acquisition, Cl A * | 4,897 | 48 | ||||||
HPX * | 80 | 1 | ||||||
HPX, Cl A * | 38,319 | 376 | ||||||
Hudson Executive Investment III * | 3,941 | 39 | ||||||
IG Acquisition * | 5,268 | 54 | ||||||
IG Acquisition, Cl A | 32,608 | 322 | ||||||
INSU Acquisition III, Cl A | 6,867 | 68 | ||||||
InterPrivate II Acquisition | 11,562 | 114 | ||||||
InterPrivate III Financial Partners | 1,716 | 17 | ||||||
InterPrivate IV InfraTech Partners | 1,620 | 16 | ||||||
Investindustrial Acquisition, Cl A | 6,689 | 65 | ||||||
Isleworth Healthcare | 36,802 | 357 | ||||||
Isos Acquisition | 10,931 | 109 | ||||||
ITHAX Acquisition | 56,589 | 568 | ||||||
Itiquira Acquisition | 15,167 | 151 | ||||||
Jack Creek Investment * | 31,694 | 314 | ||||||
Jaws Mustang Acquisition * | 27,274 | 277 | ||||||
JOFF Fintech Acquisition | 12,319 | 123 | ||||||
Kadem Sustainable Impact | 392 | 4 | ||||||
Kairos Acquisition | 16,771 | 167 | ||||||
Kairos Acquisition, Cl A | 1,120 | 11 | ||||||
Kernel Group Holdings | 41,213 | 411 | ||||||
Khosla Ventures Acquisition, Cl A | 3,498 | 35 | ||||||
Khosla Ventures Acquisition III, Cl A | 6,530 | 65 | ||||||
KINS Technology Group * | 6,925 | 70 | ||||||
Kismet Acquisition Three | 21,087 | 208 | ||||||
Kismet Acquisition Two | 27,859 | 277 | ||||||
KL Acquisition | 4,069 | 40 | ||||||
KludeIn I Acquisition, Cl A * | 485 | 5 | ||||||
L&F Acquisition, Cl A | 2,998 | 30 | ||||||
| Description | Shares | Market Value ($ Thousands) | ||||||
COMMON STOCK (continued) | ||||||||
Lefteris Acquisition, Cl A | 24,404 | $ | 240 | |||||
Legato Merger | 76,677 | 777 | ||||||
LendingTree Inc * | 5,146 | 1,096 | ||||||
Leo Holdings II | 13,250 | 131 | ||||||
Leo Holdings II, Cl A | 1,358 | 13 | ||||||
Leo Holdings III | 32 | — | ||||||
LGL Systems Acquisition, Cl A | 2,526 | 25 | ||||||
LightJump Acquisition | 31 | — | ||||||
Lionheart Acquisition II * | 3,004 | 31 | ||||||
Lionheart Acquisition II, Cl A | 11,485 | 113 | ||||||
Live Oak Mobility Acquisition * | 971 | 10 | ||||||
Locust Walk Acquisition * | 1,767 | 17 | ||||||
M3-Brigade Acquisition II | 4,218 | 42 | ||||||
Magnum Opus Acquisition | 19,438 | 192 | ||||||
Malacca Straits Acquisition, Cl A | 5,134 | 51 | ||||||
Marlin Technology, Cl A * | 103,758 | 1,025 | ||||||
Mason Industrial Technology * | 46,677 | 464 | ||||||
MCAP Acquisition | 39,766 | 396 | ||||||
MDH Acquisition | 33,841 | 336 | ||||||
Mission Advancement | 78,453 | 781 | ||||||
Montes Archimedes Acquisition, Cl A * | 52,176 | 510 | ||||||
Monument Circle Acquisition * | 44,977 | 443 | ||||||
Motive Capital | 18,142 | 181 | ||||||
Mudrick Capital Acquisition II * | 31,721 | 320 | ||||||
Music Acquisition | 4,316 | 43 | ||||||
Natural Order Acquisition | 971 | 10 | ||||||
NightDragon Acquisition | 749 | 8 | ||||||
Noble Corp * | 2,760 | 47 | ||||||
Noble Rock Acquisition * | 34,889 | 345 | ||||||
North Atlantic Acquisition | 29,311 | 291 | ||||||
Northern Genesis Acquisition II | 5,252 | 53 | ||||||
Northern Star Investment II, Cl A | 387 | 4 | ||||||
Northern Star Investment III | 11,090 | 110 | ||||||
Northern Star Investment IV | 10,200 | 101 | ||||||
Novus Capital II | 6,748 | 67 | ||||||
Oaktree Acquisition II, Cl A * | 6,546 | 65 | ||||||
Old Republic International Corp | 37,529 | 820 | ||||||
Omnichannel Acquisition * | 520 | 5 | ||||||
Omnichannel Acquisition, Cl A * | 9,407 | 92 | ||||||
One Equity Partners Open Water I * | 43,826 | 437 | ||||||
Open Lending, Cl A * | 24,710 | 875 | ||||||
Oyster Enterprises Acquisition | 55,962 | 553 | ||||||
Penney Borrower LLC * | 3,070 | 32 | ||||||
Peridot Acquisition II * | 61,456 | 611 | ||||||
Pine Technology Acquisition | 18,129 | 180 | ||||||
Pioneer Merger | 14,038 | 140 | ||||||
Pioneer Merger, Cl A * | 1,942 | 19 | ||||||
Pivotal Investment III * | 7,431 | 74 | ||||||
PMV Consumer Acquisition, Cl A | 1,307 | 13 | ||||||
Poema Global Holdings | 17,288 | 173 | ||||||
Poema Global Holdings, Cl A | 2,981 | 29 | ||||||
Pontem * | 24,208 | 240 | ||||||
| SEI Institutional Managed Trust / Semi-Annual Report / March 31, 2021 | 147 |
SCHEDULE OF INVESTMENTS (Unaudited)
March 31, 2021
Multi-Strategy Alternative Fund (Continued)
| Description | Shares | Market Value ($ Thousands) | ||||||
COMMON STOCK (continued) | ||||||||
Pontem, Cl A | 4,826 | $ | 47 | |||||
Population Health Investment | 746 | 7 | ||||||
Population Health Investment, Cl A | 988 | 10 | ||||||
Power & Digital Infrastructure Acquisition | 1,498 | 15 | ||||||
Powered Brands | 8,398 | 83 | ||||||
Prime Impact Acquisition I * | 5,808 | 57 | ||||||
Prime Impact Acquisition I, Cl A | 46,548 | 453 | ||||||
Priveterra Acquisition * | 25,231 | 251 | ||||||
PROG Holdings Inc (N) | 37,800 | 1,636 | ||||||
Progress Acquisition | 38,838 | 384 | ||||||
Property Solutions Acquisition II | 3,240 | 32 | ||||||
PropTech Investment II, Cl A * | 485 | 5 | ||||||
Provident Acquisition, Cl A | 243 | 2 | ||||||
Quantum FinTech Acquisition | 17,602 | 175 | ||||||
Recharge Acquisition * | 1,499 | 15 | ||||||
Recharge Acquisition, Cl A | 4,236 | 41 | ||||||
Ribbit LEAP *(B) | 58,788 | 647 | ||||||
RMG Acquisition III * | 83,367 | 829 | ||||||
RMG Acquisition III, Cl A (B) | 152 | 2 | ||||||
Roman DBDR Tech Acquisition, Cl A | 9,894 | 98 | ||||||
Rosecliff Acquisition I | 16,690 | 166 | ||||||
Rotor Acquisition | 4,261 | 43 | ||||||
RXR Acquisition * | 3,240 | 32 | ||||||
Sandbridge X2 | 11,126 | 111 | ||||||
Sarissa Capital Acquisition, Cl A | 1,304 | 13 | ||||||
Science Strategic Acquisition Alpha | 30,163 | 300 | ||||||
ScION Tech Growth I * | 33,428 | 337 | ||||||
ScION Tech Growth I, Cl A | 7,402 | 72 | ||||||
ScION Tech Growth II | 10,642 | 106 | ||||||
SCP & CO Healthcare Acquisition * | 34,685 | 346 | ||||||
SCP & CO Healthcare Acquisition, Cl A | 2 | — | ||||||
SCVX * | 5,374 | 53 | ||||||
Seven Oaks Acquisition, Cl A * | 1,092 | 11 | ||||||
Silver Crest Acquisition | 21,473 | 213 | ||||||
SilverBox Engaged Merger I | 45,460 | 451 | ||||||
Simon Property Group Acquisition Holdings | 102 | 1 | ||||||
Slam * | 1,689 | 17 | ||||||
Soaring Eagle Acquisition | 46,098 | 467 | ||||||
Social Leverage Acquisition I | 11,424 | 114 | ||||||
Spartacus Acquisition * | 12,989 | 132 | ||||||
Spartacus Acquisition, Cl A | 14,548 | 144 | ||||||
Spartan Acquisition III | 3,461 | 35 | ||||||
Sports Entertainment Acquisition, Cl A * | 49,756 | 486 | ||||||
Sports Ventures Acquisition | 2,189 | 22 | ||||||
Sports Ventures Acquisition, Cl A | 13,074 | 126 | ||||||
SportsTek Acquisition | 35,782 | 356 | ||||||
Supernova Partners Acquisition, Cl A | 170 | 2 | ||||||
Supernova Partners Acquisition II | 971 | 10 | ||||||
Sustainable Development Acquisition I * | 12,597 | 125 | ||||||
SVF Investment, Cl A | 28,818 | 294 | ||||||
SVF Investment 3, Cl A | 260 | 3 | ||||||
Switchback II, Cl A | 1,554 | 15 | ||||||
| Description | Shares | Market Value ($ Thousands) | ||||||
COMMON STOCK (continued) | ||||||||
Tailwind International Acquisition * | 45,399 | $ | 449 | |||||
Tailwind Two Acquisition * | 9,976 | 99 | ||||||
Tastemaker Acquisition | 53 | 1 | ||||||
TB Acquisition | 21,719 | 214 | ||||||
TCW Special Purpose Acquisition | 27,147 | 270 | ||||||
Tekkorp Digital Acquisition, Cl A * | 1,243 | 12 | ||||||
Thayer Ventures Acquisition * | 390 | 4 | ||||||
Thimble Point Acquisition * | 17,495 | 175 | ||||||
Thoma Bravo Advantage, Cl A * | 44,121 | 461 | ||||||
Thunder Bridge Capital Partners III, Cl A * | 12,003 | 119 | ||||||
Tiga Acquisition, Cl A | 1,623 | 16 | ||||||
TLG Acquisition One * | 44,603 | 442 | ||||||
Trepont Acquisition I, Cl A | 4,622 | 45 | ||||||
Tuatara Capital Acquisition | 4,244 | 42 | ||||||
TWC Tech Holdings II * | 2,637 | 27 | ||||||
TWC Tech Holdings II, Cl A * | 2,146 | 21 | ||||||
Twelve Seas Investment II | 58,904 | 580 | ||||||
Twin Ridge Capital Acquisition | 5,314 | 53 | ||||||
TZP Strategies Acquisition | 19,673 | 196 | ||||||
Velocity Acquisition | 14,802 | 146 | ||||||
Virtuoso Acquisition | 19,799 | 195 | ||||||
VPC Impact Acquisition Holdings II | 14,676 | 145 | ||||||
VPC Impact Acquisition Holdings III | 3,307 | 33 | ||||||
Waldencast Acquisition | 940 | 9 | ||||||
Warrior Technologies Acquisition * | 37,562 | 372 | ||||||
Wells Fargo & Co | 19,338 | 756 | ||||||
Yucaipa Acquisition, Cl A | 3,257 | 32 | ||||||
Z-Work Acquisition * | 3,699 | 37 | ||||||
|
|
| ||||||
| 56,448 | ||||||||
|
|
| ||||||
Health Care — 0.8% | ||||||||
Alexion Pharmaceuticals Inc * | 6,471 | 989 | ||||||
Bausch Health * | 51,908 | 1,648 | ||||||
Change Healthcare Inc * | 2,656 | 59 | ||||||
Intercept Pharmaceuticals * | 6,848 | 158 | ||||||
Monitronics International Inc *(C) | 9,199 | 93 | ||||||
PRA Health Sciences Inc * | 644 | 99 | ||||||
Viatris Inc, Cl W * | 53,976 | 754 | ||||||
Viracta Therapeutics | 9,424 | 87 | ||||||
|
|
| ||||||
| 3,887 | ||||||||
|
|
| ||||||
Industrials — 1.6% | ||||||||
ADT Inc | 3,170 | 27 | ||||||
Air Transport Services Group | 73,436 | 2,149 | ||||||
BWX Technologies Inc, Cl W (N) | 37,433 | 2,468 | ||||||
Cornerstone Building Brands Inc * | 3,879 | 55 | ||||||
Interface Inc, Cl A | 1,752 | 22 | ||||||
Middleby Corp/The *(N) | 14,886 | 2,467 | ||||||
Uber Technologies Inc * | 10,189 | 555 | ||||||
|
|
| ||||||
| 7,743 | ||||||||
|
|
| ||||||
Information Technology — 7.8% | ||||||||
ACV Auctions, Cl A | 3,785 | 131 | ||||||
Alliance Data Systems Corp | 18,090 | 2,028 | ||||||
| 148 | SEI Institutional Managed Trust / Semi-Annual Report / March 31, 2021 |
| Description | Shares | Market Value ($ Thousands) | ||||||
COMMON STOCK (continued) | ||||||||
Applied Materials Inc | 2,202 | $ | 294 | |||||
Aquity Holdings Inc *(C) | 3,945 | 41 | ||||||
Avaya Holdings Corp * | 24,884 | 698 | ||||||
Ceridian HCM Holding Inc * | 13,828 | 1,165 | ||||||
Dynatrace Inc * | 28,465 | 1,373 | ||||||
Fiserv Inc, Cl A * | 11,485 | 1,367 | ||||||
Flex * | 78,042 | 1,429 | ||||||
GoDaddy Inc, Cl A * | 32,224 | 2,501 | ||||||
Inphi Corp * | 4,147 | 740 | ||||||
Mastercard Inc, Cl A | 5,836 | 2,078 | ||||||
Maxim Integrated Products Inc | 13,609 | 1,244 | ||||||
Mmodal (Escrow Security) *(C) | 3,007 | — | ||||||
Nuance Communications Inc * | 24,658 | 1,076 | ||||||
ON Semiconductor Corp * | 42,252 | 1,758 | ||||||
Qualtrics International, Cl A | 16,155 | 532 | ||||||
RealPage Inc * | 62,923 | 5,487 | ||||||
RingCentral Inc, Cl A * | 1,712 | 510 | ||||||
salesforce.com Inc * | 7,152 | 1,515 | ||||||
Shift4 Payments, Cl A * | 10,720 | 879 | ||||||
Shopify, Cl A * | 1,005 | 1,112 | ||||||
Slack Technologies Inc, Cl A * | 73,458 | 2,985 | ||||||
StoneCo Ltd, Cl A * | 7,814 | 478 | ||||||
Twilio Inc, Cl A * | 1,690 | 576 | ||||||
Vishay Intertechnology Inc (N) | 101,344 | 2,441 | ||||||
Vontier * | 24,362 | 737 | ||||||
Xilinx Inc | 12,719 | 1,576 | ||||||
|
|
| ||||||
| 36,751 | ||||||||
|
|
| ||||||
Materials — 1.1% | ||||||||
Allegheny Technologies Inc *(N) | 114,177 | 2,405 | ||||||
Arctic Canadian Diamond Company Ltd. * | 228 | — | ||||||
Constellium, Cl A *(N) | 161,349 | 2,372 | ||||||
Hexion Holdings Corp * | 9,735 | 146 | ||||||
Libbey Glass Inc. * | 1,549 | 54 | ||||||
Tronox Holdings | 2,883 | 53 | ||||||
|
|
| ||||||
| 5,030 | ||||||||
|
|
| ||||||
Real Estate — 3.1% | ||||||||
Agree Realty Corp ‡ | 11,502 | 774 | ||||||
Copper Property Pass-Through Certificates * | 23,020 | 403 | ||||||
Kimco Realty Corp ‡ | 82,266 | 1,542 | ||||||
Lamar Advertising Co, Cl A ‡ | 8,857 | 832 | ||||||
Outfront Media Inc ‡ | 68,104 | 1,487 | ||||||
Park Hotels & Resorts Inc ‡ | 105,395 | 2,274 | ||||||
Regency Centers Corp ‡ | 8,246 | 468 | ||||||
Sabra Health Care Inc ‡(N) | 129,546 | 2,249 | ||||||
Service Properties Trust ‡ | 1,981 | 24 | ||||||
SL Green Realty ‡(N) | 32,731 | 2,291 | ||||||
Vornado Realty Trust ‡(N) | 51,887 | 2,355 | ||||||
|
|
| ||||||
| 14,699 | ||||||||
|
|
| ||||||
Utilities — 2.2% | ||||||||
Clearway Energy Inc, Cl C (N) | 74,985 | 2,110 | ||||||
| Description | Shares | Market Value ($ Thousands) | ||||||
COMMON STOCK (continued) | ||||||||
Exelon Corp | 17,336 | $ | 758 | |||||
FirstEnergy Corp (N) | 70,992 | 2,463 | ||||||
NRG Energy Inc | 66,208 | 2,498 | ||||||
PG&E Corp * | 206,166 | 2,414 | ||||||
|
|
| ||||||
| 10,243 | ||||||||
|
|
| ||||||
Total Common Stock |
| 177,959 | ||||||
|
|
| ||||||
| Face Amount (Thousands) | ||||||||
CORPORATE OBLIGATIONS — 15.9% |
| |||||||
Communication Services — 1.3% |
| |||||||
Altice France Holding | ||||||||
6.000%, 02/15/2028 (E) | $ | 359 | 354 | |||||
AMC Entertainment Holdings | ||||||||
6.125%, 05/15/2027 | 55 | 34 | ||||||
5.750%, 06/15/2025 | 30 | 19 | ||||||
CB Escrow | ||||||||
8.000%, 10/15/2025 (E) | 567 | 603 | ||||||
CCO Holdings | ||||||||
5.750%, 02/15/2026 (E) | 99 | 102 | ||||||
5.375%, 06/01/2029 (E) | 85 | 91 | ||||||
Consolidated Communications | ||||||||
6.500%, 10/01/2028 (E) | 419 | 453 | ||||||
5.000%, 10/01/2028 (E) | 119 | 120 | ||||||
Digicel Group | ||||||||
10.000%, 04/01/2024 | 30 | 29 | ||||||
6.750%, 03/01/2023 (E) | 110 | 101 | ||||||
DISH DBS | ||||||||
7.750%, 07/01/2026 | 225 | 248 | ||||||
7.375%, 07/01/2028 | 40 | 42 | ||||||
EW Scripps | ||||||||
5.125%, 05/15/2025 (E) | 1,315 | 1,341 | ||||||
Frontier Communications | ||||||||
10.500%, 09/15/2022 (F) | 125 | 85 | ||||||
7.125%, 01/15/2023 (F) | 75 | 49 | ||||||
6.875%, 01/15/2025 (F) | 85 | 55 | ||||||
Intelsat Luxembourg | ||||||||
8.125%, 06/01/2023 (F) | 45 | 2 | ||||||
Salem Media Group | ||||||||
6.750%, 06/01/2024 (E) | 395 | 389 | ||||||
Sinclair Television Group | ||||||||
4.125%, 12/01/2030 (E) | 177 | 170 | ||||||
Spanish Broadcasting System | ||||||||
9.750%, 03/01/2026 (E) | 158 | 155 | ||||||
T-Mobile USA | ||||||||
3.500%, 04/15/2031 | 65 | 66 | ||||||
3.375%, 04/15/2029 | 65 | 66 | ||||||
Townsquare Media | ||||||||
6.875%, 02/01/2026 (E) | 342 | 364 | ||||||
| SEI Institutional Managed Trust / Semi-Annual Report / March 31, 2021 | 149 |
SCHEDULE OF INVESTMENTS (Unaudited)
March 31, 2021
Multi-Strategy Alternative Fund (Continued)
| Description | Face Amount (Thousands) | Market Value ($ Thousands) | ||||||
CORPORATE OBLIGATIONS (continued) |
| |||||||
Trilogy International Partners | ||||||||
8.875%, 05/01/2022 (E) | $ | 305 | $ | 296 | ||||
Urban One | ||||||||
7.375%, 02/01/2028 (E) | 539 | 558 | ||||||
Windstream Escrow | ||||||||
7.750%, 08/15/2028 (E) | 142 | 144 | ||||||
|
|
| ||||||
| 5,936 | ||||||||
|
|
| ||||||
Consumer Discretionary — 4.0% |
| |||||||
1011778 BC ULC / New Red Finance | ||||||||
4.250%, 05/15/2024 (E) | 256 | 259 | ||||||
American Greetings | ||||||||
8.750%, 04/15/2025 (E) | 265 | 273 | ||||||
Ashton Woods USA | ||||||||
6.625%, 01/15/2028 (E) | 200 | 213 | ||||||
At Home Holding III | ||||||||
8.750%, 09/01/2025 (E) | 209 | 228 | ||||||
Bally’s | ||||||||
6.750%, 06/01/2027 (E) | 60 | 64 | ||||||
BCPE Ulysses Intermediate | ||||||||
7.750%cash/8.500% PIK, 04/01/2027 (E) | 63 | 65 | ||||||
Bed Bath & Beyond | ||||||||
5.165%, 08/01/2044 | 300 | 273 | ||||||
Boyd Gaming | ||||||||
6.375%, 04/01/2026 | 93 | 96 | ||||||
6.000%, 08/15/2026 | 1,281 | 1,334 | ||||||
Caesars Entertainment | ||||||||
6.250%, 07/01/2025 (E) | 523 | 556 | ||||||
Carnival | ||||||||
11.500%, 04/01/2023 (E) | 125 | 143 | ||||||
10.500%, 02/01/2026 (E) | 95 | 112 | ||||||
9.875%, 08/01/2027 (E) | 135 | 159 | ||||||
5.750%, 03/01/2027 (E) | 15 | 15 | ||||||
Cengage Learning | ||||||||
9.500%, 06/15/2024 (E) | 460 | 469 | ||||||
Chukchansi Economic Development Authority | ||||||||
10.250%, | 45 | 22 | ||||||
9.750%, | 263 | 132 | ||||||
Cirsa Finance International Sarl | ||||||||
7.875%, 12/20/2023 (E) | 20 | 20 | ||||||
Clarios Global | ||||||||
6.750%, 05/15/2025 (E) | 82 | 88 | ||||||
4.375%, 05/15/2026 | EUR | 100 | 122 | |||||
Cooper-Standard Automotive | ||||||||
5.625%, 11/15/2026 (E) | $ | 178 | 150 | |||||
CSC Holdings | ||||||||
5.750%, 01/15/2030 (E) | 50 | 53 | ||||||
4.625%, 12/01/2030 (E) | 591 | 581 | ||||||
4.125%, 12/01/2030 (E) | 155 | 154 | ||||||
3.375%, 02/15/2031 (E) | 177 | 167 | ||||||
| Description | Face Amount (Thousands) | Market Value ($ Thousands) | ||||||
CORPORATE OBLIGATIONS (continued) |
| |||||||
Cumulus Media New Holdings | ||||||||
6.750%, 07/01/2026 (E) | $ | 199 | $ | 203 | ||||
Dave & Buster’s | ||||||||
7.625%, 11/01/2025 (E) | 164 | 175 | ||||||
Diamond Sports Group | ||||||||
6.625%, 08/15/2027 (E) | 477 | 250 | ||||||
5.375%, 08/15/2026 (E) | 530 | 381 | ||||||
Empire Communities | ||||||||
7.375%, 12/15/2025 | CAD | 79 | 65 | |||||
7.000%, 12/15/2025 (E) | $ | 551 | 580 | |||||
Everi Payments | ||||||||
7.500%, 12/15/2025 (E) | 180 | 187 | ||||||
Ford Motor | ||||||||
8.500%, 04/21/2023 | 110 | 123 | ||||||
Full House Resorts | ||||||||
8.250%, 02/15/2028 (E) | 199 | 212 | ||||||
Genting New York | ||||||||
3.300%, 02/15/2026 (E) | 123 | 123 | ||||||
Getty Images | ||||||||
9.750%, 03/01/2027 (E) | 170 | 181 | ||||||
Goodyear Tire & Rubber | ||||||||
9.500%, 05/31/2025 | 288 | 323 | ||||||
5.625%, 04/30/2033 | 137 | 137 | ||||||
5.250%, 04/30/2031 | 27 | 27 | ||||||
Houghton Mifflin Harcourt Publishers | ||||||||
9.000%, 02/15/2025 (E) | 515 | 551 | ||||||
Inn Of The Mountain Gods Resort & Casino | ||||||||
9.250%, 11/30/2023 (C) | 183 | 180 | ||||||
Jacobs Entertainment | ||||||||
7.875%, 02/01/2024 (E) | 225 | 234 | ||||||
L Brands | ||||||||
7.600%, 07/15/2037 | 5 | 6 | ||||||
6.750%, 07/01/2036 | 80 | 94 | ||||||
6.625%, 10/01/2030 (E) | 60 | 68 | ||||||
LBM Acquisition | ||||||||
6.250%, 01/15/2029 (E) | 251 | 259 | ||||||
Liberty Interactive | ||||||||
8.250%, 02/01/2030 | 460 | 522 | ||||||
Life Time | ||||||||
8.000%, 04/15/2026 (E) | 161 | 166 | ||||||
5.750%, 01/15/2026 (E) | 210 | 216 | ||||||
Macy’s Retail Holdings | ||||||||
4.500%, 12/15/2034 | 296 | 263 | ||||||
2.875%, 02/15/2023 | 3 | 3 | ||||||
Mattamy Group | ||||||||
4.625%, 03/01/2030 (E) | 800 | 795 | ||||||
McGraw Hill | ||||||||
8.000%, 11/30/2024 (E) | 285 | 287 | ||||||
MDC Partners | ||||||||
7.500%, 05/01/2024 (E) | 71 | 72 | ||||||
MGM Resorts International | ||||||||
7.750%, 03/15/2022 | 763 | 804 | ||||||
| 150 | SEI Institutional Managed Trust / Semi-Annual Report / March 31, 2021 |
| Description | Face Amount (Thousands) | Market Value ($ Thousands) | ||||||
CORPORATE OBLIGATIONS (continued) |
| |||||||
Michaels Stores | ||||||||
8.000%, 07/15/2027 (E) | $ | 178 | $ | 197 | ||||
Mohegan Gaming & Entertainment | ||||||||
8.000%, 02/01/2026 (E) | 331 | 334 | ||||||
Monitronics International Inc | ||||||||
9.125%, | 495 | — | ||||||
NCL | ||||||||
12.250%, 05/15/2024 (E) | 155 | 188 | ||||||
5.875%, 03/15/2026 (E) | 235 | 238 | ||||||
3.625%, 12/15/2024 (E) | 162 | 153 | ||||||
NCL Finance | ||||||||
6.125%, 03/15/2028 (E) | 40 | 41 | ||||||
NMG Holding | ||||||||
7.125%, 04/01/2026 (E) | 250 | 255 | ||||||
PetSmart | ||||||||
4.750%, 02/15/2028 (E) | 204 | 209 | ||||||
Royal Caribbean Cruises | ||||||||
10.875%, 06/01/2023 (E) | 120 | 138 | ||||||
9.125%, 06/15/2023 (E) | 65 | 72 | ||||||
Scientific Games International | ||||||||
7.250%, 11/15/2029 (E) | 140 | 152 | ||||||
5.000%, 10/15/2025 (E) | 815 | 844 | ||||||
Sugarhouse HSP Gaming Prop Mezz | ||||||||
5.875%, 05/15/2025 (E) | 480 | 468 | ||||||
Tenneco | ||||||||
5.125%, 04/15/2029 (E) | 195 | 192 | ||||||
Terrier Media Buyer | ||||||||
8.875%, 12/15/2027 (E) | 295 | 317 | ||||||
Univision Communications | ||||||||
6.625%, 06/01/2027 (E) | 401 | 428 | ||||||
5.125%, 02/15/2025 (E) | 305 | 308 | ||||||
William Hill MTN | ||||||||
4.750%, 05/01/2026 | GBP | 200 | 314 | |||||
Wynn Las Vegas | ||||||||
5.500%, 03/01/2025 (E) | $ | 50 | 53 | |||||
5.250%, 05/15/2027 (E) | 60 | 63 | ||||||
4.250%, 05/30/2023 (E) | 400 | 407 | ||||||
Wynn Resorts Finance | ||||||||
7.750%, 04/15/2025 (E) | 120 | 130 | ||||||
|
|
| ||||||
| 18,736 | ||||||||
|
|
| ||||||
Consumer Staples — 0.8% | ||||||||
Albertsons | ||||||||
7.500%, 03/15/2026 (E) | 1,452 | 1,604 | ||||||
Fresh Market | ||||||||
9.750%, 05/01/2023 (E) | 420 | 432 | ||||||
New Albertsons | ||||||||
8.700%, 05/01/2030 | 235 | 296 | ||||||
Post Holdings | ||||||||
4.500%, 09/15/2031 (E) | 135 | 133 | ||||||
Rite Aid | ||||||||
8.000%, 11/15/2026 (E) | 76 | 80 | ||||||
| Description | Face Amount (Thousands) | Market Value ($ Thousands) | ||||||
CORPORATE OBLIGATIONS (continued) |
| |||||||
7.700%, 02/15/2027 | $ | 345 | $ | 338 | ||||
Turning Point Brands | ||||||||
5.625%, 02/15/2026 (E) | 273 | 283 | ||||||
US Foods | ||||||||
6.250%, 04/15/2025 (E) | 250 | 268 | ||||||
Vector Group | ||||||||
10.500%, 11/01/2026 (E) | 225 | 241 | ||||||
5.750%, 02/01/2029 (E) | 305 | 315 | ||||||
|
|
| ||||||
| 3,990 | ||||||||
|
|
| ||||||
Energy — 2.7% | ||||||||
Aethon United BR | ||||||||
8.250%, 02/15/2026 (E) | 160 | 166 | ||||||
Antero Midstream Partners | ||||||||
7.875%, 05/15/2026 (E) | 195 | 210 | ||||||
5.750%, 03/01/2027 (E) | 150 | 150 | ||||||
5.750%, 01/15/2028 (E) | 20 | 20 | ||||||
5.375%, 09/15/2024 | 60 | 61 | ||||||
Antero Resources | ||||||||
7.625%, 02/01/2029 (E) | 170 | 181 | ||||||
Ascent Resources Utica Holdings | ||||||||
7.000%, 11/01/2026 (E) | 244 | 244 | ||||||
Baytex Energy | ||||||||
8.750%, 04/01/2027 (E) | 245 | 223 | ||||||
Cheniere Energy Partners | ||||||||
4.500%, 10/01/2029 | 85 | 88 | ||||||
Chesapeake Energy | ||||||||
5.875%, 02/01/2029 (E) | 59 | 63 | ||||||
5.500%, 02/01/2026 (E) | 165 | 172 | ||||||
Chesapeake Energy (Escrow Security) | ||||||||
0.000%, 12/31/2049 | 225 | — | ||||||
CNX Midstream Partners | ||||||||
6.500%, 03/15/2026 (E) | 195 | 198 | ||||||
CNX Resources | ||||||||
7.250%, 03/14/2027 (E) | 140 | 150 | ||||||
Comstock Resources | ||||||||
9.750%, 08/15/2026 | 70 | 76 | ||||||
Crestwood Midstream Partners | ||||||||
5.750%, 04/01/2025 | 150 | 151 | ||||||
EnLink Midstream | ||||||||
5.625%, 01/15/2028 (E) | 80 | 77 | ||||||
5.375%, 06/01/2029 | 325 | 304 | ||||||
EnLink Midstream Partners | ||||||||
6.000%, VAR ICE LIBOR USD 3 Month+4.110%(H) | 122 | 76 | ||||||
5.600%, 04/01/2044 | 148 | 123 | ||||||
5.450%, 06/01/2047 | 190 | 153 | ||||||
4.850%, 07/15/2026 | 85 | 82 | ||||||
EQM Midstream Partners | ||||||||
6.500%, 07/15/2048 | 115 | 115 | ||||||
EQT | ||||||||
8.500%, 02/01/2030 | 115 | 147 | ||||||
| SEI Institutional Managed Trust / Semi-Annual Report / March 31, 2021 | 151 |
SCHEDULE OF INVESTMENTS (Unaudited)
March 31, 2021
Multi-Strategy Alternative Fund (Continued)
| Description | Face Amount (Thousands) | Market Value ($ Thousands) | ||||||
CORPORATE OBLIGATIONS (continued) |
| |||||||
7.625%, 02/01/2025 | $ | 140 | $ | 161 | ||||
Genesis Energy | ||||||||
8.000%, 01/15/2027 | 105 | 106 | ||||||
7.750%, 02/01/2028 | 80 | 80 | ||||||
Harvest Midstream I | ||||||||
7.500%, 09/01/2028 (E) | 158 | 170 | ||||||
Indigo Natural Resources | ||||||||
5.375%, 02/01/2029 (E) | 82 | 81 | ||||||
Laredo Petroleum | ||||||||
10.125%, 01/15/2028 | 160 | 153 | ||||||
9.500%, 01/15/2025 | 40 | 38 | ||||||
MEG Energy | ||||||||
7.125%, 02/01/2027 (E) | 100 | 105 | ||||||
5.875%, 02/01/2029 (E) | 80 | 80 | ||||||
New Fortress Energy | ||||||||
6.500%, 09/30/2026 (E) | 224 | 225 | ||||||
NGL Energy Operating | ||||||||
7.500%, 02/01/2026 (E) | 120 | 123 | ||||||
NGL Energy Partners | ||||||||
7.500%, 11/01/2023 | 205 | 198 | ||||||
7.500%, 04/15/2026 | 107 | 91 | ||||||
6.125%, 03/01/2025 | 242 | 206 | ||||||
Northern Oil and Gas | ||||||||
8.125%, 03/01/2028 (E) | 205 | 204 | ||||||
Oasis Midstream Partners | ||||||||
8.000%, 04/01/2029 (E) | 115 | 118 | ||||||
Occidental Petroleum | ||||||||
6.125%, 01/01/2031 | 40 | 44 | ||||||
5.550%, 03/15/2026 | 95 | 101 | ||||||
5.500%, 12/01/2025 | 70 | 74 | ||||||
4.625%, 06/15/2045 | 120 | 105 | ||||||
4.500%, 07/15/2044 | 10 | 8 | ||||||
4.400%, 04/15/2046 | 10 | 8 | ||||||
PBF Holding | ||||||||
7.250%, 06/15/2025 | 101 | 82 | ||||||
6.000%, 02/15/2028 | 58 | 43 | ||||||
Petrobras Global Finance BV | ||||||||
6.900%, 03/19/2049 | 595 | 652 | ||||||
6.750%, 06/03/2050 | 526 | 561 | ||||||
Petroleos Mexicanos | ||||||||
6.950%, 01/28/2060 (E) | 351 | 303 | ||||||
6.875%, 10/16/2025 (E) | 223 | 242 | ||||||
6.375%, 01/23/2045 | 650 | 539 | ||||||
6.350%, 02/12/2048 | 1,074 | 894 | ||||||
5.950%, 01/28/2031 (E) | 305 | 293 | ||||||
4.500%, 01/23/2026 | 211 | 209 | ||||||
3.500%, 01/30/2023 | 604 | 612 | ||||||
Petroleos Mexicanos MTN | ||||||||
6.750%, 09/21/2047 | 507 | 435 | ||||||
Pride International | ||||||||
7.875%, 08/15/2040 (F) | 50 | 9 | ||||||
| Description | Face Amount (Thousands) | Market Value ($ Thousands) | ||||||
CORPORATE OBLIGATIONS (continued) |
| |||||||
Range Resources | ||||||||
9.250%, 02/01/2026 | $ | 285 | $ | 310 | ||||
Shelf Drilling Holdings | ||||||||
8.875%, 11/15/2024 (E) | 60 | 60 | ||||||
8.250%, 02/15/2025 (E) | 230 | 168 | ||||||
Southwestern Energy | ||||||||
7.750%, 10/01/2027 | 25 | 27 | ||||||
7.500%, 04/01/2026 | 202 | 214 | ||||||
Sunoco | ||||||||
4.500%, 05/15/2029 (E) | 109 | 109 | ||||||
Targa Resources Partners | ||||||||
4.000%, 01/15/2032 (E) | 145 | 136 | ||||||
Transocean | ||||||||
11.500%, 01/30/2027 (E) | 145 | 124 | ||||||
6.800%, 03/15/2038 | 290 | 133 | ||||||
USA Compression Partners | ||||||||
6.875%, 09/01/2027 | 170 | 175 | ||||||
Valaris PLC | ||||||||
5.850%, 01/15/2044 (F) | 185 | 24 | ||||||
Vine Energy Holdings | ||||||||
6.750%, 04/15/2029 (E) | 191 | 191 | ||||||
Vine Oil & Gas | ||||||||
9.750%, 04/15/2023 (E) | 158 | 169 | ||||||
8.750%, 04/15/2023 (E) | 158 | 168 | ||||||
Western Midstream Operating | ||||||||
2.325%, VAR ICE LIBOR USD 3 Month+1.850%, 01/13/2023 | 715 | 701 | ||||||
|
|
| ||||||
| 13,292 | ||||||||
|
|
| ||||||
Financials — 2.0% | ||||||||
AG Issuer | ||||||||
6.250%, 03/01/2028 (E) | 330 | 345 | ||||||
Barclays | ||||||||
7.750%, VAR USD Swap Semi 30/360 5 Yr Curr+4.842%(H) | 195 | 213 | ||||||
Burford Capital Global Finance | ||||||||
6.250%, 04/15/2028 (E) | 154 | 158 | ||||||
Finance of America Funding | ||||||||
7.875%, 11/15/2025 (E) | 305 | 316 | ||||||
Freedom Mortgage | ||||||||
8.250%, 04/15/2025 (E) | 591 | 615 | ||||||
8.125%, 11/15/2024 (E) | 437 | 453 | ||||||
FS Energy and Power Fund | ||||||||
7.500%, 08/15/2023 (E) | 65 | 65 | ||||||
Genworth Holdings | ||||||||
4.900%, 08/15/2023 | 109 | 107 | ||||||
4.800%, 02/15/2024 | 130 | 126 | ||||||
Genworth Mortgage Holdings | ||||||||
6.500%, 08/15/2025 (E) | 140 | 151 | ||||||
Goldman Sachs International | ||||||||
12.656%, | EGP | 11,250 | 691 | |||||
| 152 | SEI Institutional Managed Trust / Semi-Annual Report / March 31, 2021 |
| Description | Face Amount (Thousands) | Market Value ($ Thousands) | ||||||
CORPORATE OBLIGATIONS (continued) |
| |||||||
GTCR AP Finance | ||||||||
8.000%, 05/15/2027 (E) | $ | 225 | $ | 242 | ||||
Home Point Capital | ||||||||
5.000%, 02/01/2026 (E) | 105 | 104 | ||||||
HSBC Bank MTN | ||||||||
12.370%, | EGP | 1,800 | 113 | |||||
Hunt | ||||||||
5.250%, 04/15/2029 (E) | $ | 230 | 230 | |||||
ICBC Standard Bank MTN | ||||||||
12.527%, | EGP | 23,644 | 1,459 | |||||
JPMorgan Chase Bank MTN | ||||||||
12.704%, | 8,707 | 522 | ||||||
Ladder Capital Finance Holdings LLLP | ||||||||
5.250%, 03/15/2022 (E) | $ | 320 | 322 | |||||
5.250%, 10/01/2025 (E) | 35 | 35 | ||||||
LD Holdings Group | ||||||||
6.500%, 11/01/2025 (E) | 150 | 157 | ||||||
6.125%, 04/01/2028 (E) | 65 | 66 | ||||||
MDGH - GMTN BV MTN | ||||||||
4.500%, 11/07/2028 | 200 | 231 | ||||||
Nationstar Mortgage Holdings | ||||||||
5.500%, 08/15/2028 (E) | 115 | 116 | ||||||
5.125%, 12/15/2030 (E) | 35 | 34 | ||||||
New Residential Investment | ||||||||
6.250%, 10/15/2025 (E) | 280 | 281 | ||||||
Novo Banco MTN | ||||||||
3.500%, 01/02/2043 | EUR | 20 | 21 | |||||
3.500%, 01/23/2043 | 280 | 289 | ||||||
OneMain Finance | ||||||||
7.125%, 03/15/2026 | $ | 105 | 121 | |||||
6.875%, 03/15/2025 | 100 | 114 | ||||||
PennyMac Financial Services | ||||||||
4.250%, 02/15/2029 (E) | 160 | 153 | ||||||
Saracen Development | ||||||||
11.000%cash/3.000% PIK, 10/15/2025 (C)(D)(E) | 384 | 443 | ||||||
VistaJet Malta Finance | ||||||||
10.500%, 06/01/2024 (E) | 135 | 147 | ||||||
VTB Bank Via VTB Capital | ||||||||
6.950%, 10/17/2022 | 653 | 692 | ||||||
WeWork | ||||||||
7.875%, 05/01/2025 (E) | 577 | 571 | ||||||
|
|
| ||||||
| 9,703 | ||||||||
|
|
| ||||||
Health Care — 1.0% | ||||||||
Akumin | ||||||||
7.000%, 11/01/2025 (E) | 185 | 197 | ||||||
APX Group | ||||||||
8.500%, 11/01/2024 | 390 | 405 | ||||||
Bausch Health | ||||||||
9.000%, 12/15/2025 (E) | 82 | 89 | ||||||
6.250%, 02/15/2029 (E) | 315 | 334 | ||||||
| Description | Face Amount (Thousands) | Market Value ($ Thousands) | ||||||
CORPORATE OBLIGATIONS (continued) |
| |||||||
6.125%, 04/15/2025 (E) | $ | 164 | $ | 168 | ||||
5.000%, 02/15/2029 (E) | 218 | 215 | ||||||
Bausch Health Americas | ||||||||
9.250%, 04/01/2026 (E) | 61 | 68 | ||||||
8.500%, 01/31/2027 (E) | 547 | 607 | ||||||
Centene | ||||||||
4.625%, 12/15/2029 | 214 | 232 | ||||||
3.375%, 02/15/2030 | 82 | 83 | ||||||
CHS | ||||||||
8.125%, 06/30/2024 (E) | 253 | 264 | ||||||
6.875%, 04/15/2029 (E) | 142 | 148 | ||||||
DaVita | ||||||||
4.625%, 06/01/2030 (E) | 118 | 120 | ||||||
3.750%, 02/15/2031 (E) | 54 | 52 | ||||||
Endo DAC | ||||||||
9.500%, 07/31/2027 (E) | 114 | 124 | ||||||
6.000%, 06/30/2028 (E) | 128 | 104 | ||||||
Endo Luxembourg Finance I S.a.r.l. | ||||||||
6.125%, 04/01/2029 (E) | 200 | 202 | ||||||
FXI Holdings | ||||||||
7.875%, 11/01/2024 (E) | 123 | 127 | ||||||
HCA | ||||||||
5.875%, 02/01/2029 | 70 | 82 | ||||||
Jaguar Holding II | ||||||||
5.000%, 06/15/2028 (E) | 205 | 213 | ||||||
LifePoint Health | ||||||||
5.375%, 01/15/2029 (E) | 211 | 208 | ||||||
4.375%, 02/15/2027 (E) | 127 | 124 | ||||||
Prime Security Services Borrower | ||||||||
6.250%, 01/15/2028 (E) | 105 | 109 | ||||||
RP Escrow Issuer | ||||||||
5.250%, 12/15/2025 (E) | 65 | 67 | ||||||
Surgery Center Holdings | ||||||||
6.750%, 07/01/2025 (E) | 87 | 89 | ||||||
Tenet Healthcare | ||||||||
6.250%, 02/01/2027 (E) | 80 | 84 | ||||||
Varex Imaging | ||||||||
7.875%, 10/15/2027 (E) | 225 | 250 | ||||||
Verisure Holding | ||||||||
3.250%, 02/15/2027 (E) | EUR | 115 | 136 | |||||
|
|
| ||||||
| 4,901 | ||||||||
|
|
| ||||||
Industrials — 1.2% | ||||||||
American Airlines | ||||||||
5.750%, 04/20/2029 (E) | $ | 135 | 144 | |||||
5.500%, 04/20/2026 (E) | 90 | 94 | ||||||
American Builders & Contractors Supply | ||||||||
5.875%, 05/15/2026 (E) | 56 | 58 | ||||||
Arconic | ||||||||
6.125%, 02/15/2028 (E) | 79 | 84 | ||||||
Beacon Roofing Supply | ||||||||
4.875%, 11/01/2025 (E) | 134 | 137 | ||||||
| SEI Institutional Managed Trust / Semi-Annual Report / March 31, 2021 | 153 |
SCHEDULE OF INVESTMENTS (Unaudited)
March 31, 2021
Multi-Strategy Alternative Fund (Continued)
| Description | Face Amount (Thousands) | Market Value ($ Thousands) | ||||||
CORPORATE OBLIGATIONS (continued) |
| |||||||
Bombardier | ||||||||
7.875%, 04/15/2027 (E) | $ | 115 | $ | 113 | ||||
7.500%, 12/01/2024 (E) | 25 | 25 | ||||||
7.500%, 03/15/2025 (E) | 115 | 113 | ||||||
6.000%, 10/15/2022 (E) | 35 | 35 | ||||||
Builders FirstSource | ||||||||
6.750%, 06/01/2027 (E) | 919 | 986 | ||||||
Danaos | ||||||||
8.500%, 03/01/2028 (E) | 145 | 155 | ||||||
Delta Air Lines | ||||||||
7.000%, 05/01/2025 (E) | 185 | 213 | ||||||
Dycom Industries | ||||||||
4.500%, 04/15/2029 (E) | 19 | 19 | ||||||
Fortress Transportation & Infrastructure Investors | ||||||||
9.750%, 08/01/2027 (E) | 240 | 273 | ||||||
6.500%, 10/01/2025 (E) | 50 | 52 | ||||||
Garda World Security | ||||||||
9.500%, 11/01/2027 (E) | 310 | 343 | ||||||
8.750%, 05/15/2025 (E) | 33 | 34 | ||||||
GFL Environmental | ||||||||
8.500%, 05/01/2027 (E) | 100 | 110 | ||||||
3.500%, 09/01/2028 (E) | 169 | 164 | ||||||
GrafTech Finance | ||||||||
4.625%, 12/15/2028 (E) | 118 | 119 | ||||||
Icahn Enterprises | ||||||||
4.375%, 02/01/2029 (E) | 165 | 161 | ||||||
New Enterprise Stone & Lime | ||||||||
6.250%, 03/15/2026 (E) | 110 | 113 | ||||||
Parts Europe | ||||||||
6.500%, 07/16/2025 | EUR | 219 | 269 | |||||
Sensata Technologies | ||||||||
4.000%, 04/15/2029 (E) | $ | 38 | 39 | |||||
Team Health Holdings | ||||||||
6.375%, 02/01/2025 (E) | 165 | 145 | ||||||
Tervita | ||||||||
11.000%, 12/01/2025 (E) | 230 | 261 | ||||||
TransDigm | ||||||||
8.000%, 12/15/2025 (E) | 109 | 119 | ||||||
6.375%, 06/15/2026 | 164 | 170 | ||||||
6.250%, 03/15/2026 (E) | 333 | 353 | ||||||
TransDigm UK Holdings | ||||||||
6.875%, 05/15/2026 | 55 | 58 | ||||||
Triumph Group | ||||||||
8.875%, 06/01/2024 (E) | 55 | 62 | ||||||
7.750%, 08/15/2025 | 290 | 291 | ||||||
6.250%, 09/15/2024 (E) | 20 | 20 | ||||||
5.250%, 06/01/2022 | 70 | 69 | ||||||
Tutor Perini | ||||||||
6.875%, 05/01/2025 (E) | 370 | 383 | ||||||
| Description | Face Amount (Thousands) | Market Value ($ Thousands) | ||||||
CORPORATE OBLIGATIONS (continued) |
| |||||||
Western Global Airlines | ||||||||
10.375%, 08/15/2025 (E) | $ | 160 | $ | 180 | ||||
|
|
| ||||||
| 5,964 | ||||||||
|
|
| ||||||
Information Technology — 0.5% |
| |||||||
Banff Merger Sub | ||||||||
9.750%, 09/01/2026 (E) | 415 | 442 | ||||||
Cablevision Lightpath | ||||||||
3.875%, 09/15/2027 (E) | 134 | 133 | ||||||
Castle US Holding | ||||||||
9.500%, 02/15/2028 (E) | 170 | 174 | ||||||
CommScope | ||||||||
7.125%, 07/01/2028 (E) | 55 | 59 | ||||||
6.000%, 03/01/2026 (E) | 150 | 158 | ||||||
CommScope Technologies | ||||||||
6.000%, 06/15/2025 (E) | 289 | 295 | ||||||
Flexential Intermediate | ||||||||
11.250%, 08/01/2024 (E) | 240 | 257 | ||||||
TTM Technologies | ||||||||
4.000%, 03/01/2029 (E) | 133 | 131 | ||||||
Twilio | ||||||||
3.875%, 03/15/2031 | 65 | 66 | ||||||
3.625%, 03/15/2029 | 65 | 66 | ||||||
Veritas US | ||||||||
10.500%, 02/01/2024 (E) | 514 | 526 | ||||||
7.500%, 09/01/2025 (E) | 193 | 201 | ||||||
|
|
| ||||||
| 2,508 | ||||||||
|
|
| ||||||
Materials — 1.7% | ||||||||
Allegheny Technologies | ||||||||
7.875%, 08/15/2023 | 145 | 157 | ||||||
Ardagh Packaging Finance | ||||||||
6.000%, 02/15/2025 (E) | 147 | 152 | ||||||
Axalta Coating Systems | ||||||||
3.375%, 02/15/2029 (E) | 178 | 174 | ||||||
Baffinland Iron Mines | ||||||||
8.750%, 07/15/2026 (E) | 690 | 730 | ||||||
Cleveland-Cliffs | ||||||||
9.875%, 10/17/2025 (E) | 122 | 143 | ||||||
Cornerstone Chemical | ||||||||
6.750%, 08/15/2024 (E) | 855 | 806 | ||||||
CSN Inova Ventures | ||||||||
6.750%, 01/28/2028 (E) | 350 | 371 | ||||||
Eldorado | ||||||||
9.500%, 06/01/2024 (E) | 109 | 118 | ||||||
First Quantum Minerals | ||||||||
7.500%, 04/01/2025 (E) | 385 | 398 | ||||||
6.875%, 10/15/2027 (E) | 130 | 139 | ||||||
6.500%, 03/01/2024 (E) | 208 | 211 | ||||||
FMG Resources August 2006 Pty | ||||||||
4.375%, 04/01/2031 (E) | 181 | 184 | ||||||
| 154 | SEI Institutional Managed Trust / Semi-Annual Report / March 31, 2021 |
| Description | Face Amount (Thousands) | Market Value ($ Thousands) | ||||||
CORPORATE OBLIGATIONS (continued) |
| |||||||
Freeport-McMoRan | ||||||||
5.450%, 03/15/2043 | $ | 195 | $ | 234 | ||||
LSB Industries | ||||||||
9.625%, 05/01/2023 (E) | 775 | 795 | ||||||
Mercer International | ||||||||
5.125%, 02/01/2029 (E) | 263 | 273 | ||||||
Mineral Resources | ||||||||
8.125%, 05/01/2027 (E) | 265 | 293 | ||||||
Mountain Province Diamonds | ||||||||
8.000%, 12/15/2022 (E) | 390 | 358 | ||||||
Northwest Acquisitions ULC | ||||||||
7.125%, 11/01/2022 (E)(F) | 460 | – | ||||||
Novelis | ||||||||
5.875%, 09/30/2026 (E) | 243 | 254 | ||||||
Rain CII Carbon | ||||||||
7.250%, 04/01/2025 (E) | 600 | 621 | ||||||
Rayonier AM Products | ||||||||
7.625%, 01/15/2026 (E) | 160 | 170 | ||||||
Trident TPI Holdings | ||||||||
9.250%, 08/01/2024 (E) | 417 | 442 | ||||||
Tronox | ||||||||
4.625%, 03/15/2029 (E) | 353 | 353 | ||||||
|
|
| ||||||
| 7,376 | ||||||||
|
|
| ||||||
Real Estate — 0.3% | ||||||||
Diversified Healthcare Trust | ||||||||
9.750%, 06/15/2025 | 210 | 238 | ||||||
4.375%, 03/01/2031 | 85 | 83 | ||||||
GLP Capital | ||||||||
4.000%, 01/15/2031 | 82 | 85 | ||||||
Iron Mountain | ||||||||
5.250%, 07/15/2030 (E) | 119 | 123 | ||||||
4.500%, 02/15/2031 (E) | 86 | 85 | ||||||
Realogy Group | ||||||||
9.375%, 04/01/2027 (E) | 160 | 177 | ||||||
Service Properties Trust | ||||||||
4.950%, 10/01/2029 | 41 | 39 | ||||||
3.950%, 01/15/2028 | 198 | 183 | ||||||
Uniti Group | ||||||||
7.125%, 12/15/2024 (E) | 50 | 51 | ||||||
6.000%, 04/15/2023 (E) | 170 | 173 | ||||||
|
|
| ||||||
| 1,237 | ||||||||
|
|
| ||||||
Utilities — 0.4% | ||||||||
Calpine | ||||||||
5.125%, 03/15/2028 (E) | 116 | 117 | ||||||
5.000%, 02/01/2031 (E) | 191 | 186 | ||||||
Eskom Holdings SOC MTN | ||||||||
8.450%, 08/10/2028 | 860 | 934 | ||||||
NRG Energy | ||||||||
5.250%, 06/15/2029 (E) | 20 | 21 | ||||||
| Description | Face Amount (Thousands) | Market Value ($ Thousands) | ||||||
CORPORATE OBLIGATIONS (continued) |
| |||||||
Oryx Funding | ||||||||
5.800%, 02/03/2031 (E) | $ | 212 | $ | 219 | ||||
Vistra Operations | ||||||||
5.500%, 09/01/2026 (E) | 55 | 57 | ||||||
|
|
| ||||||
| 1,534 | ||||||||
|
|
| ||||||
Total Corporate Obligations | 75,177 | |||||||
|
|
| ||||||
| Shares | ||||||||
EXCHANGE TRADED FUNDS — 10.6% |
| |||||||
Merger Fund, Cl L | 2,877,796 | 50,390 | ||||||
VelocityShares Daily 2x VIX Short Term ETN | 498 | 6 | ||||||
|
|
| ||||||
Total Exchange Traded Funds | 50,396 | |||||||
|
|
| ||||||
| Face Amount (Thousands) | ||||||||
LOAN PARTICIPATIONS — 4.0% |
| |||||||
1236904 B.C. Ltd., Initial Term Loan, 1st Lien | ||||||||
5.609%, 03/04/2027 (G) | 262 | 258 | ||||||
Advisors Group, 1st Lien | ||||||||
4.609%, 07/31/2026 | 60 | 60 | ||||||
Agrofresh Inc., Initial Term Loan, 1st Lien | ||||||||
7.250%, 12/31/2024 | 302 | 301 | ||||||
AMC Entertainment Holdings, Inc. (fka AMC Entertainment Inc.), Term B-1 Loan, 1st Lien | ||||||||
3.195%, VAR LIBOR+ | 177 | 152 | ||||||
American Gaming, Term Loan, 1st Lien | ||||||||
14.000%, 02/15/2024 (C) | 129 | 135 | ||||||
American Greetings, Term Loan, 1st Lien | ||||||||
5.500%, 04/06/2024 (G) | 203 | 202 | ||||||
American Tire Distributors, Inc., Initial Term Loan, 1st Lien | ||||||||
8.500%, 09/02/2024 (G) | 431 | 420 | ||||||
Apollo Commercial Real Estate Finance, Inc., Term B-1 Loan, 1st Lien | ||||||||
4.000%, VAR LIBOR+ | 200 | 197 | ||||||
Arctic Canadian Diamond Company Ltd., Term Loan A-2, 1st Lien | ||||||||
6.000%, 12/31/2024 (G) | 36 | 36 | ||||||
Arctic Canadian Diamond Company Ltd., Term Loan, 2nd Lien | ||||||||
17.500%, 12/07/2025 (G) | 215 | 215 | ||||||
| SEI Institutional Managed Trust / Semi-Annual Report / March 31, 2021 | 155 |
SCHEDULE OF INVESTMENTS (Unaudited)
March 31, 2021
Multi-Strategy Alternative Fund (Continued)
| Description | Face Amount (Thousands) | Market Value ($ Thousands) | ||||||
LOAN PARTICIPATIONS (continued) |
| |||||||
Avianca Holdings S.A., DIP Delayed Draw Loan A-1, 1st Lien | ||||||||
12.500%, 11/10/2021 (C)(G) | $ | 229 | $ | 231 | ||||
Boardriders Inc., Closing Date Tranche A Loan, 1st Lien | ||||||||
9.000%, 10/23/2023 (C)(G) | 46 | 45 | ||||||
Boardriders Inc., Closing Date Tranche B-2 Loan, 1st Lien | ||||||||
7.500%, 04/23/2024 (C)(G)(J) | 242 | 221 | ||||||
Bright Bidco, Term Loan B, 1st Lien | ||||||||
4.500%, 06/30/2024 (G)(J) | 450 | 343 | ||||||
Carestream Health Inc., 2023 Extended Term Loan, 1st Lien | ||||||||
7.750%, 05/08/2023 (G) | 501 | 498 | ||||||
Carestream Health Inc., 2023 Extended Term Loan, 2nd Lien | ||||||||
5.500%, 08/08/2023 (C)(G) | 162 | 146 | ||||||
CBAC Borrower LLC, Term Loan B, 1st Lien | ||||||||
4.109%, 07/08/2024 (G) | 244 | 234 | ||||||
Cengage Learning Inc., 2016 Refinancing Term Loan, 1st Lien | ||||||||
5.250%, VAR LIBOR+ | 338 | 334 | ||||||
Century Casinos, Inc., Term Loan, 1st Lien | ||||||||
6.610%, 12/07/2026 | 185 | 178 | ||||||
Cenveo Corporation, Exit Term Loan, 1st Lien | ||||||||
10.500%, 06/07/2023 (C)(G) | 576 | 564 | ||||||
ConvergeOne Holdings Corp., Initial Term Loan, 1st Lien | ||||||||
5.109%, VAR LIBOR+ | 490 | 473 | ||||||
Cooper’s Hawk Intermediate Holding, LLC, Initial Term Loan, 1st Lien | ||||||||
6.609%, 10/31/2026 (C) | 174 | 168 | ||||||
DMT Solutions Global Corporation, Term B-2 Loan, 1st Lien | ||||||||
9.250%, 07/02/2024 | — | — | ||||||
8.000%, 07/02/2024 | 104 | 103 | ||||||
DMT Solutions Global Corporation, Term Loan | ||||||||
8.000%, 07/02/2024 | 104 | 103 | ||||||
East Valley Tourist Development Authority, Term Loan, 1st Lien | ||||||||
9.000%, VAR LIBOR+ | 131 | 129 | ||||||
ELO Touch Solutions, Term Loan B, 1st Lien | ||||||||
6.609%, 12/14/2025 | 176 | 177 | ||||||
Endo Luxembourg Finance Company I S.a.r.l., Initial Term Loan, 1st Lien | ||||||||
5.000%, 04/27/2024 (G) | — | — | ||||||
| Description | Face Amount (Thousands) | Market Value ($ Thousands) | ||||||
LOAN PARTICIPATIONS (continued) |
| |||||||
Enterprise Development Authority, Term Loan B, 1st Lien | ||||||||
5.000%, 02/18/2028 | $ | 84 | $ | 84 | ||||
Envision Healthcare Corporation, Initial Term Loan, 1st Lien | ||||||||
3.859%, VAR LIBOR+ | 879 | 757 | ||||||
Epic Y-Grade Services LP, Term Loan, 1st Lien | ||||||||
7.000%, 06/30/2027 | 614 | 528 | ||||||
Getty Images, Inc., Initial Dollar Term Loan, 1st Lien | ||||||||
4.625%, VAR LIBOR+ | 146 | 144 | ||||||
Glass Mountain, Term Loan B, 1st Lien | ||||||||
5.500%, 12/23/2024 | 68 | 16 | ||||||
Golden Nugget, Inc., Initial B Term Loan, 1st Lien | ||||||||
3.250%, VAR LIBOR+ | 115 | 113 | ||||||
Herschend Entertainment Co., 1st Lien | ||||||||
6.750%, 08/25/2025 (C) | 215 | 219 | ||||||
Hurtigruten Group, 1st Lien | ||||||||
8.000%, 06/11/2023 | 138 | 155 | ||||||
ICH US Intermediate Holdings II, Inc., Initial Term Loan, 1st Lien | ||||||||
6.750%, 12/24/2026 (C)(G) | 5 | 5 | ||||||
Innovacare, Term Loan, 1st Lien | ||||||||
6.750%, 12/24/2026 (C)(G) | 265 | 265 | ||||||
Inteliquent, Term Loan, 1st Lien | ||||||||
5.500%, 02/10/2024 | 105 | 105 | ||||||
J.C. Penney Borrower LLC, Term Loan | ||||||||
9.250%, 12/07/2025 (C)(G) | 382 | 386 | ||||||
J.C. Penney Corporation Inc., Term Loan, 1st Lien | ||||||||
5.250%, VAR LIBOR+ | 378 | 1 | ||||||
Jadex Inc., Refinancing Term Loan, 1st Lien | ||||||||
5.500%, 02/18/2028 | 155 | 153 | ||||||
Lanai Holdings II, Inc., Initial Term Loan, 1st Lien | ||||||||
5.750%, VAR LIBOR+ | 948 | 941 | ||||||
Lannett Company, Inc, Term Loan B | ||||||||
6.375%, 11/25/2022 (G) | 212 | 202 | ||||||
Libbey, 1st Lien | ||||||||
11.000%, 11/13/2025 (G) | 139 | 137 | ||||||
Lifescan Global Corporation, Initial Term Loan, 1st Lien | ||||||||
6.000%, 10/01/2024 | 915 | 886 | ||||||
| 156 | SEI Institutional Managed Trust / Semi-Annual Report / March 31, 2021 |
| Description | Face Amount (Thousands) | Market Value ($ Thousands) | ||||||
LOAN PARTICIPATIONS (continued) |
| |||||||
Mashantucket (Western) Pequot Tribe, Term Loan B, 1st Lien | ||||||||
8.375%, VAR LIBOR+ | $ | 564 | $ | 557 | ||||
Mavenir Systems Inc., Initial Term Loan, 1st Lien | ||||||||
7.000%, VAR LIBOR+ | 409 | 408 | ||||||
McGraw Hill LLC, Term Loan B, 1st Lien | ||||||||
5.750%, 11/01/2024 | 298 | 297 | ||||||
MSG National, 1st Lien | ||||||||
7.000%, 12/31/2049 | 309 | 317 | ||||||
Newport Parent, Inc., Initial Term Loan, 1st Lien | ||||||||
7.500%, 12/10/2027 (J) | 235 | 235 | ||||||
Onex TSG Intermediate Corp., Initial Term Loan, 1st Lien | ||||||||
5.500%, 02/28/2028 | 195 | 193 | ||||||
Peak 10 Holding Corporation, Initial Term Loan, 1st Lien | ||||||||
3.703%, VAR LIBOR+ | 669 | 622 | ||||||
Penney Borrower LLC, Initial Loan, 1st Lien | ||||||||
9.500%, 12/07/2026 | 160 | 149 | ||||||
Peraton Corp., Delayed Draw Term Loan B, 1st Lien | ||||||||
4.500%, 02/01/2028 (J) | 131 | 131 | ||||||
Peraton Corp., Term B Loan, 1st Lien | ||||||||
4.500%, VAR LIBOR+ | 74 | 74 | ||||||
PLNTF Holdings Inc., 1st Lien | ||||||||
9.000%, 03/12/2026 (G) | 205 | 203 | ||||||
Polymer Additives Inc., Closing Date Term Loan, 1st Lien | ||||||||
6.212%, 07/31/2025 (G)(J) | 658 | 597 | ||||||
Premier Brands Group Holdings LLC, Term Loan, 1st Lien | ||||||||
8.254%, 03/19/2024 (G) | 30 | 20 | ||||||
8.187%, 03/19/2024 (G)(J) | 55 | 38 | ||||||
R.R. Donnelley & Sons Company, Term B Loan | ||||||||
5.109%, 01/15/2024 | 229 | 227 | ||||||
Revlon Consumer Products Corporation, 2016 Term Loan, 1st Lien | ||||||||
4.250%, VAR LIBOR+ | 896 | 420 | ||||||
S&S Holdings LLC, Initial Term Loan, 1st Lien | ||||||||
5.500%, 03/11/2028 (G) | 245 | 238 | ||||||
SIJ LLC, Term Loan, 1st Lien | ||||||||
10.000%, 07/15/2026 (C)(G) | 356 | 353 | ||||||
Spencer Gifts LLC (Spirit Halloween Superstores LLC), Term Loan, 1st Lien | ||||||||
6.110%, 06/19/2026 (G) | 215 | 214 | ||||||
| Description | Face Amount (Thousands) | Market Value ($ Thousands) | ||||||
LOAN PARTICIPATIONS (continued) |
| |||||||
Syniverse Holdings Inc., Initial Term Loan, 2nd Lien | ||||||||
10.000%, 03/11/2024 | $ | 140 | $ | 136 | ||||
Syniverse Holdings Inc., Tranche C Term Loan , 1st Lien | ||||||||
6.000%, VAR LIBOR+ | 1,208 | 1,190 | ||||||
Team Health Holdings Inc., Initial Term Loan, 1st Lien | ||||||||
3.750%, VAR LIBOR+ | 618 | 573 | ||||||
Traverse Midstream Partners LLC, Advance Term Loan, 1st Lien | ||||||||
6.500%, VAR LIBOR+ | 414 | 410 | ||||||
Twin River Worldwide Holdings Inc., Term B-1 Facility Loan, 1st Lien | ||||||||
9.000%, VAR LIBOR+ | 249 | 267 | ||||||
Valaris PLC, DIP Term Loan | ||||||||
0.000%, 08/17/2021 (C)(G)(J) | 49 | 48 | ||||||
Vida Capital, Term Loan | ||||||||
6.109%, 10/01/2026 (C)(G) | 190 | 181 | ||||||
|
|
| ||||||
Total Loan Participations (Cost $18,651) ($ Thousands) | 19,118 | |||||||
|
|
| ||||||
| Shares | ||||||||
FOREIGN COMMON STOCK — 3.9% |
| |||||||
Canada — 0.4% | ||||||||
Ayr Wellness, Cl A | 1,640 | 49 | ||||||
Lightspeed POS * | 24,495 | 1,540 | ||||||
Mercer Park Brand Acquisition, Cl A | 6,210 | 63 | ||||||
Tourmaline Oil Corp | 5,763 | 110 | ||||||
|
|
| ||||||
| 1,762 | ||||||||
|
|
| ||||||
China — 0.5% | ||||||||
Baidu ADR * | 1,812 | 394 | ||||||
Tencent Music Entertainment Group ADR * | 88,300 | 1,810 | ||||||
|
|
| ||||||
| 2,204 | ||||||||
|
|
| ||||||
Hong Kong — 0.5% | ||||||||
Alibaba Group Holding * | 35,382 | 1,001 | ||||||
Alibaba Group Holding ADR * | 3,292 | 747 | ||||||
Tencent Holdings Ltd | 6,300 | 494 | ||||||
|
|
| ||||||
| 2,242 | ||||||||
|
|
| ||||||
Italy — 0.2% | ||||||||
Nexi * | 55,216 | 966 | ||||||
|
|
| ||||||
| SEI Institutional Managed Trust / Semi-Annual Report / March 31, 2021 | 157 |
SCHEDULE OF INVESTMENTS (Unaudited)
March 31, 2021
Multi-Strategy Alternative Fund (Continued)
| Description | Shares | Market Value ($ Thousands) | ||||||
FOREIGN COMMON STOCK (continued) |
| |||||||
Japan — 0.2% | ||||||||
Appier Group (B) | 6,557 | $ | 96 | |||||
Murata Manufacturing Co Ltd | 10,000 | 800 | ||||||
|
|
| ||||||
| 896 | ||||||||
|
|
| ||||||
Luxembourg — 0.0% | ||||||||
SES SA, Cl A | 12,454 | 99 | ||||||
|
|
| ||||||
Norway — 0.2% | ||||||||
BW LPG (E) | 174,101 | 1,195 | ||||||
|
|
| ||||||
South Korea — 0.6% | ||||||||
Kakao Corp | 2,806 | 1,234 | ||||||
LG Chemical Ltd | 1,369 | 974 | ||||||
NHN KCP * | 787 | 35 | ||||||
SK Hynix Inc | 3,397 | 398 | ||||||
|
|
| ||||||
| 2,641 | ||||||||
|
|
| ||||||
Taiwan — 0.7% | ||||||||
Himax Technologies ADR * | 76,620 | 1,046 | ||||||
Sea Ltd ADR * | 6,244 | 1,394 | ||||||
Taiwan Semiconductor Manufacturing Co Ltd ADR | 8,358 | 988 | ||||||
|
|
| ||||||
| 3,428 | ||||||||
|
|
| ||||||
United Kingdom — 0.6% |
| |||||||
21Vianet Group ADR * | 36,787 | 1,188 | ||||||
John Menzies PLC | 10,304 | 47 | ||||||
Micro Focus International ADR | 10,890 | 84 | ||||||
Willis Towers Watson PLC | 7,364 | 1,685 | ||||||
|
|
| ||||||
| 3,004 | ||||||||
|
|
| ||||||
Total Foreign Common Stock (Cost $17,614) ($ Thousands) | 18,437 | |||||||
|
|
| ||||||
| Face Amount (Thousands) | ||||||||
SOVEREIGN DEBT — 2.9% |
| |||||||
Angolan Government International Bond MTN | ||||||||
8.000%, 11/26/2029 | $ | 341 | 319 | |||||
Argentine Republic Government International Bond | ||||||||
1.000%, 07/09/2029 | 100 | 36 | ||||||
0.125% , –%, 07/09/2021, | 386 | 115 | ||||||
0.125% , –%, 07/09/2021, | 495 | 181 | ||||||
| Description | Face Amount (Thousands) | Market Value ($ Thousands) | ||||||||||
SOVEREIGN DEBT (continued) |
| |||||||||||
0.125% , –%, 07/09/2021, | $ | 415 | $ | 128 | ||||||||
Bahamas Government International Bond | ||||||||||||
8.950%, 10/15/2032 (E) | 541 | 576 | ||||||||||
Bahrain Government International Bond | ||||||||||||
7.000%, 01/26/2026 | 400 | 460 | ||||||||||
Egypt Government International Bond | ||||||||||||
8.875%, 05/29/2050 (E) | 1,435 | 1,463 | ||||||||||
8.700%, 03/01/2049 | 579 | 580 | ||||||||||
8.150%, 11/20/2059 (E) | 200 | 190 | ||||||||||
5.875%, 02/16/2031 (E) | 365 | 342 | ||||||||||
Ghana Government International Bond | ||||||||||||
7.750%, 04/07/2029 (E) | 262 | 259 | ||||||||||
6.409%, 04/07/2025 (E)(I) | 200 | 155 | ||||||||||
Jordan Government International Bond | ||||||||||||
5.850%, 07/07/2030 (E) | 289 | 294 | ||||||||||
4.950%, 07/07/2025 (E) | 433 | 445 | ||||||||||
Nigeria Government International Bond | ||||||||||||
7.625%, 11/21/2025 | 1,333 | 1,501 | ||||||||||
Oman Government International Bond | ||||||||||||
7.000%, 01/25/2051 (E) | 214 | 211 | ||||||||||
Paraguay Government International Bond | ||||||||||||
4.625%, 01/25/2023 | 1,810 | 1,905 | ||||||||||
Republic of South Africa Government Bond | ||||||||||||
8.250%, 03/31/2032 | ZAR | 10,472 | 613 | |||||||||
Russian Federal Bond - OFZ | ||||||||||||
7.400%, 07/17/2024 | RUB | 103,941 | 1,426 | |||||||||
7.150%, 11/12/2025 | 49,657 | 675 | ||||||||||
Saudi Government International Bond MTN | ||||||||||||
3.750%, 01/21/2055 (E) | $ | 300 | 294 | |||||||||
2.750%, 02/03/2032 (E) | 972 | 972 | ||||||||||
Turkey Government International Bond | ||||||||||||
6.375%, 10/14/2025 | 506 | 501 | ||||||||||
Verisure Midholding | ||||||||||||
5.250%, 02/15/2029 | EUR | 248 | 301 | |||||||||
|
|
| ||||||||||
Total Sovereign Debt (Cost $13,989) ($ Thousands) | 13,942 | |||||||||||
|
|
| ||||||||||
MUNICIPAL BONDS — 1.3% |
| |||||||||||
Puerto Rico — 1.3% | ||||||||||||
Commonwealth of Puerto Rico, Ser A, GO | ||||||||||||
5.000%, 07/01/2020 (F) | $ | 5 | 4 | |||||||||
Commonwealth of Puerto Rico, Ser A, GO | ||||||||||||
Callable 05/06/2021 @ 100 | ||||||||||||
8.000%, 07/01/2035 (F) | 6,515 | 5,114 | ||||||||||
Commonwealth of Puerto Rico, Ser A, GO | ||||||||||||
Callable 07/01/2022 @ 100 | ||||||||||||
5.500%, 07/01/2026 (C)(F) | 5 | 4 | ||||||||||
5.500%, 07/01/2039 (F) | 325 | 272 | ||||||||||
5.250%, 07/01/2023 (C)(F) | 30 | 25 | ||||||||||
5.125%, 07/01/2037 (F) | 20 | 17 | ||||||||||
| 158 | SEI Institutional Managed Trust / Semi-Annual Report / March 31, 2021 |
| Description | Face Amount (Thousands) | Market Value ($ Thousands) | ||||||
MUNICIPAL BONDS (continued) | ||||||||
5.000%, 07/01/2032 (F) | $ | 5 | $ | 4 | ||||
5.000%, 07/01/2041 (F) | 705 | 569 | ||||||
Commonwealth of Puerto Rico, Ser B, GO | ||||||||
4.400%, 07/01/2020 (F) | 10 | 8 | ||||||
4.250%, 07/01/2019 (F) | 5 | 4 | ||||||
Commonwealth of Puerto Rico, Ser C, GO | ||||||||
Callable 05/06/2021 @ 100 | ||||||||
6.000%, 07/01/2032 (F) | 5 | 4 | ||||||
Commonwealth of Puerto Rico, Ser C, GO | ||||||||
Callable 07/01/2021 @ 100 | ||||||||
6.500%, 07/01/2040 (F) | 5 | 4 | ||||||
Commonwealth of Puerto Rico, Ser E, GO | ||||||||
Callable 07/01/2021 @ 100 | ||||||||
5.375%, 07/01/2030 (F) | 5 | 5 | ||||||
|
|
| ||||||
Total Municipal Bonds (Cost $4,180) ($ Thousands) | 6,034 | |||||||
|
|
| ||||||
| Shares | ||||||||
PREFERRED STOCK — 0.4% | ||||||||
Consumer Discretionary — 0.0% | ||||||||
Boardriders Inc., ~ *(C)(D) | 25,646 | 26 | ||||||
Guitar Center, ~ *(D) | 40 | 4 | ||||||
|
|
| ||||||
| 30 | ||||||||
|
|
| ||||||
Energy — 0.0% | ||||||||
Crestwood Equity Partners, 9.250% (L) | 19,536 | 169 | ||||||
NuStar Logistics, 6.975% | 2,565 | 63 | ||||||
|
|
| ||||||
| 232 | ||||||||
|
|
| ||||||
Financials — 0.3% | ||||||||
FHLMC, 8.375% *(N) | 134,140 | 676 | ||||||
FNMA, 8.250% *(N) | 133,608 | 742 | ||||||
|
|
| ||||||
| 1,418 | ||||||||
|
|
| ||||||
Real Estate — 0.1% | ||||||||
Colony Capital, 7.150% ‡ | 12,189 | 308 | ||||||
|
|
| ||||||
Total Preferred Stock (Cost $2,645) ($ Thousands) | 1,988 | |||||||
|
|
| ||||||
| Face Amount (Thousands) | ||||||||
ASSET-BACKED SECURITIES — 0.4% |
| |||||||
Non-Agency Mortgage-Backed Obligations — 0.0% |
| |||||||
CHT Mortgage Trust, Ser 2017-CSMO, Cl F | ||||||||
3.847%, VAR ICE LIBOR USD 1 Month+3.741%, 11/15/2036 (C)(E) | 175 | 175 | ||||||
|
|
| ||||||
| Description | Face Amount (Thousands) | Market Value ($ Thousands) | ||||||
ASSET-BACKED SECURITIES (continued) |
| |||||||
Other Asset-Backed Securities — 0.4% |
| |||||||
Cifc Funding, Ser 2018-4RA, Cl C | ||||||||
3.423%, VAR ICE LIBOR USD 3 Month+3.200%, 10/17/2030 (E) | $ | 250 | $ | 249 | ||||
Octagon Investment Partners 43, Ser 2019- 1A, Cl D | ||||||||
4.118%, VAR ICE LIBOR USD 3 Month+3.900%, 10/25/2032 (E) | 250 | 250 | ||||||
OHA Credit Funding 4, Ser 2019-4A, Cl D | ||||||||
3.972%, VAR ICE LIBOR USD 3 Month+3.750%, 10/22/2032 (E) | 250 | 248 | ||||||
THL Credit Wind River CLO, Ser 2017-2A, Cl DR | ||||||||
2.841%, VAR ICE LIBOR USD 3 Month+2.600%, 10/15/2027 (E) | 250 | 248 | ||||||
TPG Real Estate Finance Issuer, Ser 2021- FL4, Cl D | ||||||||
3.706%, VAR ICE LIBOR USD 1 Month+3.600%, 03/15/2038 (E) | 100 | 100 | ||||||
TPG Real Estate Finance Issuer, Ser 2021- FL4, Cl E | ||||||||
4.456%, VAR ICE LIBOR USD 1 Month+4.350%, 03/15/2038 (E) | 100 | 100 | ||||||
Tryon Park CLO, Ser 2018-1A, Cl CR | ||||||||
2.941%, VAR ICE LIBOR USD 3 Month+2.700%, 04/15/2029 (E) | 250 | 245 | ||||||
Venture XVII CLO, Ser 2018-17A, Cl DRR | ||||||||
3.061%, VAR ICE LIBOR USD 3 Month+2.820%, 04/15/2027 (E) | 200 | 191 | ||||||
|
|
| ||||||
| 1,631 | ||||||||
|
|
| ||||||
Total Asset-Backed Securities (Cost $1,822) ($ Thousands) | 1,806 | |||||||
|
|
| ||||||
CONVERTIBLE BONDS — 0.4% | ||||||||
Air Canada CV to 65.1337 | ||||||||
4.000%, 07/01/2025 (E) | 60 | 95 | ||||||
Aurora Cannabis CV to 11.5308 | ||||||||
5.500%, 02/28/2024 | 127 | 111 | ||||||
CNX Resources CV to 77.8816 | ||||||||
2.250%, 05/01/2026 (E) | 50 | 68 | ||||||
Liberty Latin America CV to 48.4315 | ||||||||
2.000%, 07/15/2024 | 265 | 261 | ||||||
Liberty Media CV to 16.776 | ||||||||
3.750%, 02/15/2030 | 227 | 174 | ||||||
Liberty Media CV to 22.947 | ||||||||
4.000%, 11/15/2029 | 217 | 166 | ||||||
MGIC Investment CV to 74.0741 | ||||||||
9.000%, 04/01/2063 (E) | 340 | 456 | ||||||
Pebblebrook Hotel Trust CV to 39.2549 | ||||||||
1.750%, 12/15/2026 | 115 | 134 | ||||||
| SEI Institutional Managed Trust / Semi-Annual Report / March 31, 2021 | 159 |
SCHEDULE OF INVESTMENTS (Unaudited)
March 31, 2021
Multi-Strategy Alternative Fund (Continued)
| Description | Face Amount (Thousands) | Market Value ($ Thousands) | ||||||
CONVERTIBLE BONDS (continued) |
| |||||||
Tilray CV to 5.9735 | ||||||||
5.000%, 10/01/2023 | $ | 257 | $ | 236 | ||||
|
|
| ||||||
Total Convertible Bonds |
| 1,701 | ||||||
|
|
| ||||||
U.S. TREASURY OBLIGATION — 0.2% |
| |||||||
U.S. Treasury Bill | ||||||||
0.039%, 06/03/2021 (I) | 722 | 722 | ||||||
|
|
| ||||||
Total U.S. Treasury Obligation |
| 722 | ||||||
|
|
| ||||||
| Description | Number of Warrants | Market Value ($ Thousands) | ||||||
WARRANTS — 0.1% | ||||||||
7GC & Holdings, Expires 01/03/2027 | ||||||||
Strike Price $12 * | 12,464 | $ | 10 | |||||
ACON S2 Acquisition, Expires 09/18/2027 | ||||||||
Strike Price $12 * | 15,358 | 14 | ||||||
Adit EdTech Acquisition, Expires 01/03/2028 | ||||||||
Strike Price $12 * | 2,591 | 1 | ||||||
AEA-Bridges Impact, Expires 01/03/2026 | ||||||||
Strike Price $12 * | 174 | – | ||||||
Aequi Acquisition, Expires 12/03/2027 | ||||||||
Strike Price $12 * | 930 | 1 | ||||||
ArcLight Clean Transition, Expires 09/25/2027 | ||||||||
Strike Price $12 * | 1,624 | 9 | ||||||
Athlon Acquisition, Expires 03/08/2026 | ||||||||
Strike Price $12 * | 15,680 | 8 | ||||||
Atlantic Avenue Acquisition, Expires 10/09/2027 | ||||||||
Strike Price $12 * | 32,776 | 24 | ||||||
Authentic Equity Acquisition, Expires 01/03/2028 | ||||||||
Strike Price $12 * | 11,501 | 7 | ||||||
Avanti Acquisition, Expires 01/03/2026 | ||||||||
Strike Price $12 * | 633 | 1 | ||||||
BlueRiver Acquisition, Expires 01/07/2026 | ||||||||
Strike Price $12 * | 4,749 | 3 | ||||||
Bright Lights Acquisition, Expires 01/03/2028 | ||||||||
Strike Price $12 * | 29,690 | 18 | ||||||
Broadstone Acquisition, Expires 09/18/2028 | ||||||||
Strike Price $12 * | 8,680 | 6 | ||||||
Burgundy Technology Acquisition, Expires 10/08/2025 | ||||||||
Strike Price $12 * | 4,631 | 5 | ||||||
Capstar Special Purpose Acquisition, Expires 07/12/2027 | ||||||||
Strike Price $12 * | 3,645 | 3 | ||||||
Carney Technology Acquisition II, Expires 12/03/2027 | ||||||||
Strike Price $12 * | 515 | – | ||||||
Cascade Acquisition, Expires 12/03/2027 | ||||||||
Strike Price $12 * | 1,120 | 1 | ||||||
CF Acquisition IV, Expires 12/17/2025 | ||||||||
Strike Price $12 * | 14,977 | 14 | ||||||
CF Acquisition V, Expires 01/03/2028 | ||||||||
Strike Price $12 * | 6,743 | 5 | ||||||
Chesapeake Energy, Expires 02/12/2026 | ||||||||
Strike Price $32 * | 794 | 16 | ||||||
Chesapeake Energy, Expires 02/12/2026 | ||||||||
Strike Price $28 * | 715 | 14 | ||||||
Chesapeake Energy, Expires 02/12/2026 | ||||||||
Strike Price $36 * | 606 | 10 | ||||||
D & Z Media Acquisition, Expires 01/03/2028 | ||||||||
Strike Price $12 * | 4,480 | 3 | ||||||
| 160 | SEI Institutional Managed Trust / Semi-Annual Report / March 31, 2021 |
| Description | Number of Warrants | Market Value ($ Thousands) | ||||||
WARRANTS (continued) |
| |||||||
D8 Holdings, Expires 08/08/2027 | ||||||||
Strike Price $12 * | 11,250 | $ | 13 | |||||
Deep Lake Capital Acquisition, Expires 01/03/2028 | ||||||||
Strike Price $12 * | 3,354 | 2 | ||||||
Delwinds Insurance Acquisition, Expires 08/04/2027 | ||||||||
Strike Price $12 * | 14,640 | 8 | ||||||
Dune Acquisition, Expires 11/01/2027 | ||||||||
Strike Price $12 * | 1,120 | 1 | ||||||
E.Merge Technology Acquisition, Expires 08/02/2025 | ||||||||
Strike Price $12 * | 9,009 | 9 | ||||||
East Resources Acquisition, Expires 07/04/2027 | ||||||||
Strike Price $12 * | 17,767 | 14 | ||||||
Edify Acquisition, Expires 01/03/2028 | ||||||||
Strike Price $12 * | 31,375 | 16 | ||||||
Empower, Expires 12/03/2027 | ||||||||
Strike Price $12 * | 6,258 | 7 | ||||||
Empowerment & Inclusion Capital I, Expires 01/03/2028 | ||||||||
Strike Price $12 * | 4,211 | 2 | ||||||
Equity Distribution Acquisition, Expires 09/12/2025 | ||||||||
Strike Price $12 * | 1,120 | 1 | ||||||
Fortistar Sustainable Solutions, Expires 01/03/2028 | ||||||||
Strike Price $12 * | 11,480 | 7 | ||||||
Goal Acquisitions, Expires 02/03/2022 | ||||||||
Strike Price $12 * | 1,120 | 1 | ||||||
Guitar Center, Expires 12/22/2070 | ||||||||
Strike Price $100 *(D) | 574 | 36 | ||||||
Guitar Center, Expires 12/30/2027 | ||||||||
Strike Price $– *(C) | 1,552 | – | ||||||
Guitar Center, Expires 12/22/2070 | ||||||||
Strike Price $160 *(D) | 574 | 24 | ||||||
Healthcare Capital, Expires 03/11/2025 | ||||||||
Strike Price $12 * | 14,758 | 9 | ||||||
Hennessy Capital Investment V, Expires 01/14/2026 | ||||||||
Strike Price $12 * | 11,468 | 13 | ||||||
HIG Acquisition, Expires 10/26/2025 | ||||||||
Strike Price $12 * | 3,751 | 4 | ||||||
HPX, Expires 07/17/2025 | ||||||||
Strike Price $12 * | 20,689 | 17 | ||||||
IG Acquisition, Expires 10/08/2027 | ||||||||
Strike Price $12 * | 8,433 | 8 | ||||||
INSU Acquisition III, Expires 01/03/2027 | ||||||||
Strike Price $12 * | 115 | – | ||||||
Investindustrial Acquisition, Expires 11/02/2027 | ||||||||
Strike Price $12 * | 3,211 | 2 | ||||||
| Description | Number of Warrants | Market Value ($ Thousands) | ||||||
WARRANTS (continued) |
| |||||||
Isleworth Healthcare Acquisition, Expires 08/02/2027 | ||||||||
Strike Price $12 * | 17,952 | $ | 8 | |||||
Jack Creek Investment, Expires 01/03/2028 | ||||||||
Strike Price $12 * | 11,612 | 6 | ||||||
Jaws Mustang Acquisition, Expires 02/02/2026 | ||||||||
Strike Price $12 * | 2,634 | 3 | ||||||
Kairos Acquisition, Expires 01/03/2028 | ||||||||
Strike Price $12 * | 2,186 | 1 | ||||||
KINS Technology Group, Expires 01/03/2026 | ||||||||
Strike Price $12 * | 6,720 | 4 | ||||||
Kismet Acquisition One, Expires 08/09/2025 | ||||||||
Strike Price $12 * | 3,240 | 3 | ||||||
Lakestar Spac I, Expires 01/03/2026 | ||||||||
Strike Price $12 * | 102 | – | ||||||
Legato Merger, Expires 01/03/2026 | ||||||||
Strike Price $12 * | 5,152 | 2 | ||||||
Leo Holdings II, Expires 01/10/2028 | ||||||||
Strike Price $12 * | 5,661 | 4 | ||||||
LGL Systems Acquisition, Expires 11/15/2026 | ||||||||
Strike Price $12 * | 1,263 | 2 | ||||||
Lionheart Acquisition II, Expires 02/14/2026 | ||||||||
Strike Price $12 * | 21,396 | 15 | ||||||
Marlin Technology, Expires 03/08/2026 | ||||||||
Strike Price $12 * | 3,290 | 2 | ||||||
Marquee Raine Acquisition, Expires 12/04/2025 | ||||||||
Strike Price $12 * | 1,021 | 1 | ||||||
Mason Industrial Technology, Expires 01/03/2028 | ||||||||
Strike Price $12 * | 2,800 | 2 | ||||||
Montes Archimedes Acquisition, Expires 01/03/2026 | ||||||||
Strike Price $12 * | 296 | – | ||||||
Monument Circle Acquisition, Expires 01/03/2028 | ||||||||
Strike Price $12 * | 7,851 | 4 | ||||||
Mudrick Capital Acquisition II, Expires 09/13/2027 | ||||||||
Strike Price $12 * | 17,679 | 11 | ||||||
Natural Order Acquisition, Expires 09/18/2025 | ||||||||
Strike Price $12 * | 2,037 | 2 | ||||||
Noble Corp, Expires 02/05/2028 | ||||||||
Strike Price $– * | 2,470 | 13 | ||||||
North Atlantic Acquisition, Expires 10/23/2025 | ||||||||
Strike Price $12 * | 10,709 | 6 | ||||||
OCA Acquisition, Expires 01/03/2028 | ||||||||
Strike Price $12 * | 21,124 | 10 | ||||||
Omnichannel Acquisition, Expires 01/02/2028 | ||||||||
| SEI Institutional Managed Trust / Semi-Annual Report / March 31, 2021 | 161 |
SCHEDULE OF INVESTMENTS (Unaudited)
March 31, 2021
Multi-Strategy Alternative Fund (Continued)
| Description | Number of Warrants | Market Value ($ Thousands) | ||||||
WARRANTS (continued) |
| |||||||
Strike Price $12 * | 1,876 | $ | 2 | |||||
One Equity Partners Open Water I, Expires 01/03/2028 | ||||||||
Strike Price $12 * | 14,378 | 10 | ||||||
Oyster Enterprises Acquisition, Expires 01/03/2028 | ||||||||
Strike Price $12 * | 8,983 | 5 | ||||||
PMV Consumer Acquisition, Expires 09/03/2027 | ||||||||
Strike Price $12 * | 1,680 | 1 | ||||||
Poema Global Holdings, Expires 01/03/2028 | ||||||||
Strike Price $12 * | 6,498 | 4 | ||||||
Population Health Investment, Expires 10/04/2025 | ||||||||
Strike Price $12 * | 180 | – | ||||||
Prime Impact Acquisition I, Expires 10/04/2030 | ||||||||
Strike Price $12 * | 24,394 | 20 | ||||||
Progress Acquisition, Expires 01/03/2028 | ||||||||
Strike Price $12 * | 2,800 | 1 | ||||||
Recharge Acquisition, Expires 10/08/2027 | ||||||||
Strike Price $12 * | 95 | – | ||||||
RMG Acquisition III, Expires 01/03/2028 | ||||||||
Strike Price $12 * | 11 | – | ||||||
Roman DBDR Tech Acquisition, Expires 11/03/2025 | ||||||||
Strike Price $12 * | 11,429 | 9 | ||||||
Rotor Acquisition, Expires 06/18/2027 | ||||||||
Strike Price $12 * | 3,240 | 2 | ||||||
Science Strategic Acquisition Alpha, Expires 01/03/2028 | ||||||||
Strike Price $12 * | 16,801 | 10 | ||||||
ScION Tech Growth I, Expires 11/04/2025 | ||||||||
Strike Price $12 * | 7,979 | 7 | ||||||
SCP & CO Healthcare Acquisition, Expires 01/30/2028 | ||||||||
Strike Price $12 * | 2,240 | 1 | ||||||
SCVX, Expires 01/27/2025 | ||||||||
Strike Price $12 * | 1,714 | 2 | ||||||
Silver Crest Acquisition, Expires 04/03/2028 | ||||||||
Strike Price $12 * | 11,548 | 6 | ||||||
Spartacus Acquisition, Expires 11/03/2027 | ||||||||
Strike Price $12 * | 15,858 | 10 | ||||||
Sports Entertainment Acquisition, Expires 11/02/2025 | ||||||||
Strike Price $12 * | 543 | 1 | ||||||
Thayer Ventures Acquisition, Expires 01/04/2030 | ||||||||
Strike Price $12 * | 2,223 | 1 | ||||||
TLG Acquisition One, Expires 01/28/2028 | ||||||||
Strike Price $12 * | 1,016 | 1 | ||||||
Trepont Acquisition I, Expires 11/27/2025 | ||||||||
Strike Price $12 * | 2,031 | 1 | ||||||
| Description | Number of Warrants | Market Value ($ Thousands) | ||||||
WARRANTS (continued) |
| |||||||
Union Acquisition II, Expires 04/04/2025 | ||||||||
Strike Price $12 * | 19,909 | $ | 14 | |||||
Virtuoso Acquisition, Expires 01/03/2028 | ||||||||
Strike Price $12 * | 17,940 | 11 | ||||||
Vistas Media Acquisition, Expires 08/04/2026 | ||||||||
Strike Price $12 * | 6,608 | 4 | ||||||
Windstream Services | ||||||||
Strike Price $– *‡‡(C) | 5,809 | 75 | ||||||
Yellowstone Acquisition, Expires 10/24/2025 | ||||||||
Strike Price $12 * | 2,146 | 2 | ||||||
|
|
| ||||||
Total Warrants | 666 | |||||||
|
|
| ||||||
| Number of Rights | ||||||||
RIGHTS — 0.0% | ||||||||
Celgene Corp CVR *‡‡ | 2,073 | – | ||||||
|
|
| ||||||
Total Rights | – | |||||||
|
|
| ||||||
| Shares | ||||||||
CASH EQUIVALENTS — 20.6% |
| |||||||
Morgan Stanley Institutional Liquidity Fund Treasury Securities Portfolio, Cl I | ||||||||
0.004%** | 1,344,449 | 1,344 | ||||||
SEI Daily Income Trust, Government Fund, Cl F | ||||||||
0.010%**† | 95,930,025 | 95,930 | ||||||
|
|
| ||||||
Total Cash Equivalents | 97,274 | |||||||
|
|
| ||||||
Total Investments in Securities — 98.3% |
| $ | 465,220 | |||||
|
|
| ||||||
COMMON STOCK SOLD SHORT— (9.8)% |
| |||||||
Communication Services — (0.7)% |
| |||||||
Cogent Communications Holdings Inc | (6,162 | ) | (424 | ) | ||||
New York Times Co/The, Cl A | (18,278 | ) | (925 | ) | ||||
Verizon Communications Inc | (23,028 | ) | (1,339 | ) | ||||
Warner Music Group, Cl A | (19,837 | ) | (681 | ) | ||||
|
|
| ||||||
| (3,369 | ) | |||||||
|
|
| ||||||
Consumer Discretionary — (2.3)% |
| |||||||
Asbury Automotive Group Inc * | (3,718 | ) | (731 | ) | ||||
AutoNation Inc * | (5,975 | ) | (557 | ) | ||||
Brunswick Corp/DE | (14,929 | ) | (1,424 | ) | ||||
| 162 | SEI Institutional Managed Trust / Semi-Annual Report / March 31, 2021 |
| Description | Shares | Market Value ($ Thousands) | ||||||
COMMON STOCK SOLD SHORT (continued) |
| |||||||
Camping World Holdings Inc, Cl A | (27,439 | ) | $ | (998 | ) | |||
Carvana Co, Cl A * | (1,531 | ) | (402 | ) | ||||
Dick’s Sporting Goods Inc | (15,460 | ) | (1,177 | ) | ||||
Foot Locker Inc, Cl A | (660 | ) | (37 | ) | ||||
Gap Inc/The | (1,286 | ) | (38 | ) | ||||
Grand Canyon Education Inc * | (5,685 | ) | (609 | ) | ||||
H&R Block Inc | (18,386 | ) | (401 | ) | ||||
Hibbett Sports Inc * | (10,453 | ) | (720 | ) | ||||
Hyatt Hotels Corp, Cl A | (4,482 | ) | (371 | ) | ||||
MarineMax Inc * | (6,527 | ) | (322 | ) | ||||
Peloton Interactive Inc, Cl A * | (8,455 | ) | (951 | ) | ||||
Polaris Inc | (2,744 | ) | (366 | ) | ||||
Skechers USA Inc, Cl A * | (17,448 | ) | (728 | ) | ||||
Thor Industries Inc | (2,834 | ) | (382 | ) | ||||
Urban Outfitters Inc * | (972 | ) | (36 | ) | ||||
Winnebago Industries | (3,433 | ) | (263 | ) | ||||
Workhorse Group Inc * | (15,284 | ) | (210 | ) | ||||
|
|
| ||||||
| (10,723 | ) | |||||||
|
|
| ||||||
Consumer Staples — (1.2)% |
| |||||||
Campbell Soup Co | (39,400 | ) | (1,981 | ) | ||||
General Mills Inc | (12,300 | ) | (754 | ) | ||||
J M Smucker Co/The | (9,977 | ) | (1,262 | ) | ||||
Kroger Co/The | (20,443 | ) | (736 | ) | ||||
SpartanNash Co | (38,450 | ) | (755 | ) | ||||
|
|
| ||||||
| (5,488 | ) | |||||||
|
|
| ||||||
Energy — (0.2)% |
| |||||||
Frontline Ltd | (121,389 | ) | (868 | ) | ||||
|
|
| ||||||
Financials — (0.6)% |
| |||||||
FactSet Research Systems Inc | (1,462 | ) | (451 | ) | ||||
Goldman Sachs Group Inc/The | (1,629 | ) | (533 | ) | ||||
Houlihan Lokey Inc, Cl A | (13,398 | ) | (891 | ) | ||||
Moelis & Co, Cl A | (7,038 | ) | (386 | ) | ||||
Pinnacle Financial Partners Inc | (4,209 | ) | (373 | ) | ||||
Raymond James Financial Inc | (3,256 | ) | (399 | ) | ||||
|
|
| ||||||
| (3,033 | ) | |||||||
|
|
| ||||||
Health Care — 0.0% |
| |||||||
Hologic Inc * | (1,057 | ) | (79 | ) | ||||
|
|
| ||||||
Industrials — (0.8)% |
| |||||||
AeroVironment Inc * | (2,130 | ) | (247 | ) | ||||
Air Lease Corp, Cl A | (4,972 | ) | (244 | ) | ||||
Alaska Air Group Inc | (3,547 | ) | (246 | ) | ||||
Atlas Air Worldwide Holdings Inc * | (4,233 | ) | (256 | ) | ||||
Caterpillar Inc, Cl A | (2,427 | ) | (563 | ) | ||||
Delta Air Lines Inc, Cl A * | (7,831 | ) | (378 | ) | ||||
| Description | Shares | Market Value ($ Thousands) | ||||||
COMMON STOCK SOLD SHORT (continued) |
| |||||||
GATX | (2,696 | ) | $ | (250 | ) | |||
Korn Ferry | (4,045 | ) | (252 | ) | ||||
Masco Corp | (4,298 | ) | (257 | ) | ||||
Terex Corp | (12,248 | ) | (564 | ) | ||||
Titan Machinery Inc * | (2,889 | ) | (74 | ) | ||||
TPI Composites * | (8,070 | ) | (455 | ) | ||||
|
|
| ||||||
| (3,786 | ) | |||||||
|
|
| ||||||
Information Technology — (3.1)% |
| |||||||
Advanced Micro Devices Inc * | (21,919 | ) | (1,721 | ) | ||||
Akamai Technologies Inc * | (5,757 | ) | (587 | ) | ||||
Amdocs Ltd | (3,325 | ) | (233 | ) | ||||
Analog Devices Inc | (8,573 | ) | (1,330 | ) | ||||
Apple Inc | (4,713 | ) | (576 | ) | ||||
Automatic Data Processing Inc | (5,182 | ) | (977 | ) | ||||
Bill.com Holdings Inc * | (2,813 | ) | (409 | ) | ||||
Broadridge Financial Solutions Inc | (4,075 | ) | (624 | ) | ||||
Check Point Software Technologies Ltd * | (7,292 | ) | (816 | ) | ||||
International Business Machines Corp | (10,752 | ) | (1,433 | ) | ||||
Jack Henry & Associates Inc | (3,929 | ) | (596 | ) | ||||
Marvell Technology Group Ltd | (8,198 | ) | (402 | ) | ||||
Okta Inc, Cl A * | (3,004 | ) | (662 | ) | ||||
Paycom Software Inc * | (1,111 | ) | (411 | ) | ||||
PTC Inc * | (4,157 | ) | (572 | ) | ||||
Qorvo Inc * | (2,887 | ) | (527 | ) | ||||
salesforce.com Inc * | (5,650 | ) | (1,197 | ) | ||||
Splunk Inc * | (2,284 | ) | (309 | ) | ||||
Sykes Enterprises Inc * | (1,717 | ) | (76 | ) | ||||
Trade Desk Inc/The, Cl A * | (344 | ) | (224 | ) | ||||
Workday Inc, Cl A * | (3,557 | ) | (884 | ) | ||||
Yext * | (19,208 | ) | (278 | ) | ||||
|
|
| ||||||
| (14,844 | ) | |||||||
|
|
| ||||||
Real Estate — (0.9)% |
| |||||||
Digital Realty Trust Inc, Cl A | (6,260 | ) | (881 | ) | ||||
Equinix Inc | (1,297 | ) | (881 | ) | ||||
Hudson Pacific Properties Inc | (13,590 | ) | (369 | ) | ||||
Iron Mountain Inc | (16,987 | ) | (629 | ) | ||||
Redfin Corp * | (11,164 | ) | (743 | ) | ||||
SL Green Realty | (5,101 | ) | (357 | ) | ||||
Vornado Realty Trust | (8,035 | ) | (365 | ) | ||||
|
|
| ||||||
| (4,225 | ) | |||||||
|
|
| ||||||
Total Common Stock Sold Short (Proceeds $43,742) ($ Thousands) | (46,415 | ) | ||||||
|
|
| ||||||
| SEI Institutional Managed Trust / Semi-Annual Report / March 31, 2021 | 163 |
SCHEDULE OF INVESTMENTS (Unaudited)
March 31, 2021
Multi-Strategy Alternative Fund (Continued)
| Description | Face Amount (Thousands) | Market Value ($ Thousands) | ||||||
CORPORATE OBLIGATIONS SOLD SHORT — (2.8)% |
| |||||||
Communication Services — (0.3)% |
| |||||||
Front Range BidCo | ||||||||
6.125%, 03/01/2028 (E) | $ | (476 | ) | $ | (490 | ) | ||
Gray Television | ||||||||
7.000%, 05/15/2027 (E) | (177 | ) | (192 | ) | ||||
Outfront Media Capital | ||||||||
5.000%, 08/15/2027 (E) | (545 | ) | (550 | ) | ||||
|
|
| ||||||
| (1,232 | ) | |||||||
|
|
| ||||||
Consumer Discretionary — (1.2)% |
| |||||||
American Axle & Manufacturing |
| |||||||
6.875%, 07/01/2028 | (154 | ) | (162 | ) | ||||
6.250%, 04/01/2025 | (115 | ) | (119 | ) | ||||
6.250%, 03/15/2026 | (41 | ) | (42 | ) | ||||
Aramark Services | ||||||||
5.000%, 02/01/2028 (E) | (640 | ) | (664 | ) | ||||
Beazer Homes USA | ||||||||
5.875%, 10/15/2027 | (260 | ) | (269 | ) | ||||
Expedia Group | ||||||||
6.250%, 05/01/2025 (E) | (72 | ) | (83 | ) | ||||
5.000%, 02/15/2026 | (123 | ) | (139 | ) | ||||
3.250%, 02/15/2030 | (149 | ) | (150 | ) | ||||
Goodyear Tire & Rubber | ||||||||
4.875%, 03/15/2027 | (142 | ) | (146 | ) | ||||
MGM Resorts International | ||||||||
5.500%, 04/15/2027 | (500 | ) | (537 | ) | ||||
4.625%, 09/01/2026 | (900 | ) | (944 | ) | ||||
Radiate Holdco | ||||||||
6.500%, 09/15/2028 (E) | (400 | ) | (422 | ) | ||||
Tenneco | ||||||||
7.875%, 01/15/2029 (E) | (203 | ) | (228 | ) | ||||
Terrier Media Buyer | ||||||||
8.875%, 12/15/2027 (E) | (633 | ) | (681 | ) | ||||
Wynn Las Vegas | ||||||||
5.250%, 05/15/2027 (E) | (445 | ) | (466 | ) | ||||
ZF Finance GmbH MTN | ||||||||
3.750%, 09/21/2028 | (94 | ) | (120 | ) | ||||
3.000%, 09/21/2025 | (500 | ) | (620 | ) | ||||
|
|
| ||||||
| (5,792 | ) | |||||||
|
|
| ||||||
Consumer Staples — (0.1)% |
| |||||||
B&G Foods | ||||||||
5.250%, 09/15/2027 | (246 | ) | (256 | ) | ||||
Spectrum Brands | ||||||||
3.875%, 03/15/2031 (E) | (230 | ) | (225 | ) | ||||
|
|
| ||||||
| (481 | ) | |||||||
|
|
| ||||||
Energy — (0.2)% | ||||||||
Apache | ||||||||
4.375%, 10/15/2028 | (115 | ) | (115 | ) | ||||
DCP Midstream Operating | ||||||||
5.625%, 07/15/2027 | (138 | ) | (150 | ) | ||||
5.125%, 05/15/2029 | (55 | ) | (59 | ) | ||||
EQT | ||||||||
5.000%, 01/15/2029 | (27 | ) | (29 | ) | ||||
| Description | Face Amount (Thousands) | Market Value ($ Thousands) | ||||||
CORPORATE OBLIGATIONS SOLD SHORT (continued) |
| |||||||
PBF Logistics | ||||||||
6.875%, 05/15/2023 | $ | (156 | ) | $ | (156 | ) | ||
Southwestern Energy | ||||||||
8.375%, 09/15/2028 | (96 | ) | (105 | ) | ||||
7.750%, 10/01/2027 | (171 | ) | (183 | ) | ||||
Targa Resources Partners | ||||||||
6.875%, 01/15/2029 | (44 | ) | (48 | ) | ||||
Western Midstream Operating |
| |||||||
5.300%, 02/01/2030 | (232 | ) | (251 | ) | ||||
|
|
| ||||||
| (1,096 | ) | |||||||
|
|
| ||||||
Financials — (0.1)% | ||||||||
MPH Acquisition Holdings | ||||||||
5.750%, 11/01/2028 (E) | (82 | ) | (81 | ) | ||||
PennyMac Financial Services | ||||||||
4.250%, 02/15/2029 (E) | (200 | ) | (191 | ) | ||||
|
|
| ||||||
| (272 | ) | |||||||
|
|
| ||||||
Health Care — 0.0% | ||||||||
Global Medical Response | ||||||||
6.500%, 10/01/2025 (E) | (117 | ) | (121 | ) | ||||
|
|
| ||||||
Industrials — (0.2)% | ||||||||
ACCO Brands | ||||||||
4.250%, 03/15/2029 (E) | (230 | ) | (224 | ) | ||||
Builders FirstSource | ||||||||
5.000%, 03/01/2030 (E) | (384 | ) | (402 | ) | ||||
Rolls-Royce | ||||||||
5.750%, 10/15/2027 (E) | (83 | ) | (88 | ) | ||||
Spirit AeroSystems | ||||||||
7.500%, 04/15/2025 (E)(N) | (143 | ) | (154 | ) | ||||
4.600%, 06/15/2028 | (108 | ) | (106 | ) | ||||
|
|
| ||||||
| (974 | ) | |||||||
|
|
| ||||||
Information Technology — (0.2)% |
| |||||||
CommScope | ||||||||
8.250%, 03/01/2027 (E) | (400 | ) | (428 | ) | ||||
Diebold Nixdorf | ||||||||
9.375%, 07/15/2025 (E) | (188 | ) | (209 | ) | ||||
Endure Digital | ||||||||
6.000%, 02/15/2029 (E) | (246 | ) | (240 | ) | ||||
Plantronics | ||||||||
5.500%, 05/31/2023 (E) | (6 | ) | (6 | ) | ||||
4.750%, 03/01/2029 (E) | (190 | ) | (187 | ) | ||||
|
|
| ||||||
| (1,070 | ) | |||||||
|
|
| ||||||
Materials — (0.3)% | ||||||||
Mauser Packaging Solutions Holding |
| |||||||
5.500%, 04/15/2024 (E) | (691 | ) | (702 | ) | ||||
Trivium Packaging Finance BV |
| |||||||
8.500%, 08/15/2027 (E) | (600 | ) | (651 | ) | ||||
5.500%, 08/15/2026 (E) | (189 | ) | (199 | ) | ||||
|
|
| ||||||
| (1,552 | ) | |||||||
|
|
| ||||||
Real Estate — (0.1)% | ||||||||
Diversified Healthcare Trust | ||||||||
4.750%, 02/15/2028 | (150 | ) | (148 | ) | ||||
| 164 | SEI Institutional Managed Trust / Semi-Annual Report / March 31, 2021 |
| Description | Face Amount (Thousands) | Market Value ($ Thousands) | ||||||
CORPORATE OBLIGATIONS SOLD SHORT (continued) |
| |||||||
Outfront Media Capital | ||||||||
4.625%, 03/15/2030 (E) | $ | (111 | ) | $ | (107 | ) | ||
RHP Hotel Properties | ||||||||
4.500%, 02/15/2029 (E) | (271 | ) | (272 | ) | ||||
|
|
| ||||||
| (527 | ) | |||||||
|
|
| ||||||
Utilities — (0.1)% | ||||||||
PG&E | ||||||||
5.000%, 07/01/2028 | (223 | ) | (235 | ) | ||||
|
|
| ||||||
Total Corporate Obligations Sold Short (Proceeds $13,147) ($ Thousands) |
| (13,352 | ) | |||||
|
|
| ||||||
| Shares | ||||||||
FOREIGN COMMON STOCK SOLD SHORT— (2.6)% |
| |||||||
Canada — (0.2)% | ||||||||
BCE Inc | (15,055 | ) | (679 | ) | ||||
Rogers Communications Inc, Cl B | (9,623 | ) | (444 | ) | ||||
|
|
| ||||||
| (1,123 | ) | |||||||
|
|
| ||||||
China — (0.1)% | ||||||||
JinkoSolar Holding ADR * | (8,279 | ) | (345 | ) | ||||
|
|
| ||||||
Denmark — (0.2)% | ||||||||
Demant A/S * | (16,968 | ) | (721 | ) | ||||
|
|
| ||||||
Germany — (0.1)% | ||||||||
TeamViewer AG * | (15,705 | ) | (672 | ) | ||||
|
|
| ||||||
Ireland — (0.2)% | ||||||||
Accenture PLC, Cl A | (2,254 | ) | (623 | ) | ||||
ICON PLC * | (266 | ) | (52 | ) | ||||
|
|
| ||||||
| (675 | ) | |||||||
|
|
| ||||||
Israel — (0.1)% | ||||||||
Wix.com Ltd * | (1,798 | ) | (502 | ) | ||||
|
|
| ||||||
Japan — (0.3)% | ||||||||
Rakuten Group Inc | (57,700 | ) | (689 | ) | ||||
Z Holdings Corp | (123,800 | ) | (617 | ) | ||||
|
|
| ||||||
| (1,306 | ) | |||||||
|
|
| ||||||
Mexico — (0.2)% | ||||||||
America Movil ADR, Cl L | (71,153 | ) | (966 | ) | ||||
|
|
| ||||||
| Description | Shares | Market Value ($ Thousands) | ||||||
FOREIGN COMMON STOCK SOLD SHORT (continued) |
| |||||||
Spain — (0.1)% | ||||||||
Cellnex Telecom SA | (10,497 | ) | $ | (606 | ) | |||
|
|
| ||||||
Switzerland — (0.5)% | ||||||||
Logitech International | (11,370 | ) | (1,188 | ) | ||||
Temenos AG | (7,159 | ) | (1,035 | ) | ||||
|
|
| ||||||
| (2,223 | ) | |||||||
|
|
| ||||||
United Kingdom — (0.6)% | ||||||||
Allegion PLC | (3,455 | ) | (434 | ) | ||||
Aon PLC, Cl A | (7,927 | ) | (1,824 | ) | ||||
AstraZeneca PLC ADR | (13,747 | ) | (684 | ) | ||||
|
|
| ||||||
| (2,942 | ) | |||||||
|
|
| ||||||
Total Foreign Common Stock Sold Short (Proceeds $11,345) ($ Thousands) |
| (12,081 | ) | |||||
|
|
| ||||||
EXCHANGE TRADED FUNDS SOLD SHORT— (2.4)% |
| |||||||
Exchange Traded Fund — (2.4)% |
| |||||||
iShares Russell 2000 ETF | (10,335 | ) | (2,284 | ) | ||||
SPDR S&P 500 ETF Trust | (22,479 | ) | (8,909 | ) | ||||
|
|
| ||||||
Total Exchange Traded Funds Sold Short (Proceeds $11,074) ($ Thousands) |
| (11,193 | ) | |||||
|
|
| ||||||
| Face Amount (Thousands) | ||||||||
SOVEREIGN DEBT — -0.2% |
| |||||||
Altice Financing | ||||||||
2.250%, 01/15/25 | EUR | (201 | ) | (230 | ) | |||
Boparan Finance | ||||||||
7.625%, 11/30/25 | GBP | (136 | ) | (185 | ) | |||
Douglas GmbH | ||||||||
6.000%, 04/08/26 | EUR | (154 | ) | (177 | ) | |||
Rolls-Royce | ||||||||
4.625%, 02/16/26 | (83 | ) | (105 | ) | ||||
|
|
| ||||||
Total Sovereign Debt |
| (697 | ) | |||||
|
|
| ||||||
U.S. TREASURY OBLIGATIONS SOLD SHORT — 0.0% |
| |||||||
U.S. Treasury Notes | ||||||||
1.125%, 02/15/31 | $ | (76 | ) | (72 | ) | |||
0.500%, 02/28/26 | (114 | ) | (111 | ) | ||||
|
|
| ||||||
Total U.S. Treasury Obligations (Proceeds $186) ($ Thousands) |
| (183 | ) | |||||
|
|
| ||||||
| SEI Institutional Managed Trust / Semi-Annual Report / March 31, 2021 | 165 |
SCHEDULE OF INVESTMENTS (Unaudited)
March 31, 2021
Multi-Strategy Alternative Fund (Continued)
| Description |
Face Amount | Market Value ($ Thousands) | ||||||
Total Investments Sold Short — (17.8)% |
| $ | (83,921 | ) | ||||
|
|
| ||||||
| Contracts | ||||||||
PURCHASED OPTIONS* — 0.2% |
| |||||||
Total Purchased Options (M) | 2,454 | $ | 781 | |||||
|
|
| ||||||
WRITTEN OPTIONS* — (0.1)% |
| |||||||
Total Written Options (M) | (816 | ) | $ | (570 | ) | |||
|
|
| ||||||
A list of the open exchange traded options contracts for the Fund at March 31, 2021, is as follows:
| Description | Number of Contracts | Notional Amount (Thousands) †† | Exercise Price | Expiration Date | Value (Thousands) | |||||||||||||||
PURCHASED OPTIONS — 0.0% |
| |||||||||||||||||||
Put Options | ||||||||||||||||||||
Beazer Homes USA, Inc.* | 65 | $ | 4 | $15.00 | 4/17/2021 | $ | – | |||||||||||||
iShares iBoxx $ High Yield Corporate Bond ETF* | 204 | 14 | 85.00 | 4/17/2021 | 2 | |||||||||||||||
iShares iBoxx $ High Yield Corporate Bond ETF* | 123 | 9 | 85.00 | 5/22/2021 | 7 | |||||||||||||||
iShares iBoxx $ Inv Grade Corporate Bond ETF* | 32 | 3 | 126.00 | 4/17/2021 | 1 | |||||||||||||||
PBF Energy Inc* | 29 | 3 | 12.00 | 4/17/2021 | 1 | |||||||||||||||
PBF Energy Inc* | 11 | 1 | 11.00 | 4/17/2021 | – | |||||||||||||||
PennyMac Financial Services Inc* | 15 | 3 | 60.00 | 5/22/2021 | 3 | |||||||||||||||
S&P 500 Index* | 1 | 4 | 3,800.00 | 4/17/2021 | 1 | |||||||||||||||
S&P 500 Index* | 28 | 31 | 3,810.00 | 4/17/2021 | 14 | |||||||||||||||
S&P 500 Index* | 57 | 79 | 3,650.00 | 4/17/2021 | 30 | |||||||||||||||
S&P 500 Index* | 60 | 83 | 3,710.00 | 4/17/2021 | 43 | |||||||||||||||
S&P 500 Index* | 58 | 88 | 3,650.00 | 4/17/2021 | 50 | |||||||||||||||
S&P 500 Index* | 17 | 65 | 3,920.00 | 4/17/2021 | 66 | |||||||||||||||
S&P 500 Index* | 28 | 101 | 3,950.00 | 4/17/2021 | 66 | |||||||||||||||
S&P 500 Index* | 57 | 211 | 3,850.00 | 4/17/2021 | 104 | |||||||||||||||
S&P 500 Index* | 60 | 263 | 3,910.00 | 4/17/2021 | 147 | |||||||||||||||
S&P 500 Index* | 17 | 22 | 3,720.00 | 4/17/2021 | 22 | |||||||||||||||
S&P 500 Index* | 58 | 227 | 3,850.00 | 4/17/2021 | 157 | |||||||||||||||
SPDR® S&P® Oil & Gas Exploration & Production ETF* | 21 | 6 | 79.00 | 4/17/2021 | 5 | |||||||||||||||
|
|
|
|
|
| |||||||||||||||
| 1,217 | 719 | |||||||||||||||||||
|
|
|
|
|
| |||||||||||||||
Call Options | ||||||||||||||||||||
Advanced Micro Devices Inc* | 53 | 4 | 150.00 | 4/17/2021 | – | |||||||||||||||
Altitude Acquisition Corp* | 11 | 1 | 10.00 | 4/17/2021 | – | |||||||||||||||
American Axle & Manufact. Holdings, Inc.* | 46 | 3 | 12.00 | 4/17/2021 | – | |||||||||||||||
Artius Acquisition Inc* | 134 | 7 | 10.00 | 4/17/2021 | 3 | |||||||||||||||
Burgundy Technology Acquisition Corp* | 11 | – | 10.00 | 4/17/2021 | – | |||||||||||||||
Capital Venture Acquisition Corp* | 78 | 10 | 12.50 | 5/22/2021 | 2 | |||||||||||||||
CONX Corp.* | 62 | 1 | 10.00 | 4/17/2021 | 1 | |||||||||||||||
Express, Inc.* | 46 | 3 | 5.00 | 5/22/2021 | 3 | |||||||||||||||
Far Peak Acquisition Corp Class A* | 11 | – | 10.00 | 6/19/2021 | – | |||||||||||||||
Ford Mortor Co* | 70 | 5 | 15.00 | 6/19/2021 | 2 | |||||||||||||||
Forum Merger III Corp* | 56 | 2 | 10.00 | 4/17/2021 | 1 | |||||||||||||||
| 166 | SEI Institutional Managed Trust / Semi-Annual Report / March 31, 2021 |
| Description | Number of Contracts | Notional Amount (Thousands) †† | Exercise Price | Expiration Date | Value (Thousands) | |||||||||||||||
PURCHASED OPTIONS (continued) |
| |||||||||||||||||||
General Motors Co* | 51 | $ | 9 | $70.00 | 6/19/2021 | $ | 5 | |||||||||||||
IG Acquisition Corp* | 11 | – | 10.00 | 4/17/2021 | – | |||||||||||||||
Lefteris Acquisition Corp* | 28 | 1 | 10.00 | 4/17/2021 | – | |||||||||||||||
Michaels Companies Inc* | 34 | 1 | 22.50 | 4/17/2021 | – | |||||||||||||||
Michaels Companies Inc* | 22 | – | 22.50 | 6/19/2021 | – | |||||||||||||||
NextGen Acquisition Corp Class A* | 10 | 1 | 10.00 | 4/17/2021 | – | |||||||||||||||
Peridot Acquisition Corp* | 25 | 3 | 12.50 | 4/17/2021 | – | |||||||||||||||
Peridot Acquisition Corp* | 51 | 6 | 15.00 | 4/17/2021 | – | |||||||||||||||
ProShares UltraShort 20+ Year Treasury* | 57 | 3 | 23.00 | 4/17/2021 | 2 | |||||||||||||||
Qell Acquisition Corp* | 25 | 1 | 10.00 | 4/17/2021 | 1 | |||||||||||||||
RedBall Acquisition Corp* | 114 | 3 | 10.00 | 4/17/2021 | 1 | |||||||||||||||
Root Inc* | 24 | 4 | 20.00 | 5/22/2021 | 2 | |||||||||||||||
Social Capital Hedosophia Hldgs Corp VI* | 56 | 5 | 10.00 | 6/19/2021 | 5 | |||||||||||||||
Social Capital Hedosophia Hldgs Corp VI* | 56 | 7 | 10.00 | 7/17/2021 | 7 | |||||||||||||||
Social Capital Hedosophia HoldingsCorpIV* | 103 | 14 | 10.00 | 7/17/2021 | 15 | |||||||||||||||
Social Capital Hedosophia HoldingsCorpIV* | 41 | 4 | 10.00 | 6/19/2021 | 5 | |||||||||||||||
Sports Entertainment Acquisition Corp* | 28 | – | 10.00 | 4/17/2021 | – | |||||||||||||||
Supernova Partners Acquisition Co Inc* | 8 | – | 10.00 | 5/22/2021 | – | |||||||||||||||
Supernova Partners Acquisition Co Inc* | 84 | 5 | 10.00 | 4/17/2021 | 1 | |||||||||||||||
Tap Co* | 16 | 3 | 57.50 | 7/17/2021 | 2 | |||||||||||||||
TWC Tech Holdings II Corp* | 9 | – | 10.00 | 4/17/2021 | – | |||||||||||||||
Tyson Foods, Inc.* | 32 | 6 | 85.00 | 7/17/2021 | 3 | |||||||||||||||
VG Acquisition Corp* | 50 | 3 | 10.00 | 4/17/2021 | 1 | |||||||||||||||
|
|
|
|
|
| |||||||||||||||
| 115 | 62 | |||||||||||||||||||
|
|
|
|
|
| |||||||||||||||
Total Purchased Options | $ | 1,332 | $ | 781 | ||||||||||||||||
|
|
|
|
|
| |||||||||||||||
WRITTEN OPTIONS — 0.0% | ||||||||||||||||||||
Put Options | ||||||||||||||||||||
iShares iBoxx $ High Yield Corporate Bond ETF* | (204 | ) | $ | (4 | ) | 80.00 | 04/17/21 | $ | (2) | |||||||||||
iShares iBoxx $ High Yield Corporate Bond ETF* | (123 | ) | (2 | ) | 80.00 | 05/22/21 | (3 | ) | ||||||||||||
S&P 500 Index* | (56 | ) | (110 | ) | 3,880.00 | 04/17/21 | (59 | ) | ||||||||||||
S&P 500 Index* | (34 | ) | (73 | ) | 3,820.00 | 04/17/21 | (74 | ) | ||||||||||||
S&P 500 Index* | (114 | ) | (253 | ) | 3,750.00 | 04/17/21 | (107 | ) | ||||||||||||
S&P 500 Index* | (119 | ) | (284 | ) | 3,810.00 | 04/17/21 | (155 | ) | ||||||||||||
S&P 500 Index* | (115 | ) | (275 | ) | 3,750.00 | 04/17/21 | (169 | ) | ||||||||||||
|
|
|
|
|
| |||||||||||||||
| (1,001 | ) | (569 | ) | |||||||||||||||||
|
|
|
|
|
| |||||||||||||||
Call Options | ||||||||||||||||||||
Peridot Acquisition Corp* | (51 | ) | (3 | ) | 20.00 | 04/17/21 | (1 | ) | ||||||||||||
|
|
|
|
|
| |||||||||||||||
| (3 | ) | (1 | ) | |||||||||||||||||
|
|
|
|
|
| |||||||||||||||
Total Written Options | $ | (1,004 | ) | $ | (570 | ) | ||||||||||||||
|
|
|
|
|
| |||||||||||||||
†† Represents Cost
A list of the open futures contracts held by the Fund at March 31, 2021 is as follows:
| Type of Contract | Number of Contracts Short | Expiration Date | Notional Amount (Thousands) | Value (Thousands) | Unrealized Appreciation (Depreciation) (Thousands) | |||||||||||||||
S&P 500 Index E-MINI | (9 | ) | Jun-2021 | $ | (1,770 | ) | $ | (1,785 | ) | $ | (15) | |||||||||
U.S. 10-Year Treasury Note | (3 | ) | Jun-2021 | (400 | ) | (393 | ) | 7 | ||||||||||||
U.S. Long Treasury Bond | (17 | ) | Jun-2021 | (2,706 | ) | (2,628 | ) | 78 | ||||||||||||
|
|
|
|
|
|
|
| |||||||||||||
| $ | (4,876 | ) | $ | (4,806 | ) | $ | 70 | |||||||||||||
|
|
|
|
|
|
|
| |||||||||||||
| SEI Institutional Managed Trust / Semi-Annual Report / March 31, 2021 | 167 |
SCHEDULE OF INVESTMENTS (Unaudited)
March 31, 2021
Multi-Strategy Alternative Fund (Continued)
A list of the open forward foreign currency contracts held by the Fund at March 31, 2021 is as follows:
| Counterparty | Settlement Date | Currency to Deliver (Thousands) | Currency to Receive (Thousands) | Unrealized Appreciation (Depreciation) (Thousands) | ||||||||||||||||||||
Bank of America | 06/16/21 | USD | 182 | IDR | 2,649,220 | $ | (2 | ) | ||||||||||||||||
Barclays PLC | 04/05/21 | USD | 636 | BRL | 3,586 | (1 | ) | |||||||||||||||||
Barclays PLC | 04/05/21 | BRL | 3,780 | USD | 649 | (21 | ) | |||||||||||||||||
Barclays PLC | 04/21/21 | USD | 402 | AUD | 513 | (11 | ) | |||||||||||||||||
Barclays PLC | 04/21/21 | AUD | 513 | USD | 398 | 7 | ||||||||||||||||||
Barclays PLC | 05/14/21 | CAD | 100 | USD | 79 | – | ||||||||||||||||||
Barclays PLC | 05/14/21 | CAD | 140 | USD | 112 | 1 | ||||||||||||||||||
Barclays PLC | 05/14/21 | EUR | 510 | USD | 624 | 25 | ||||||||||||||||||
Barclays PLC | 05/19/21 | USD | 236 | JPY | 24,747 | (12 | ) | |||||||||||||||||
Barclays PLC | 06/16/21 | USD | 252 | EUR | 212 | (3 | ) | |||||||||||||||||
Barclays PLC | 06/16/21 | USD | 1,379 | TRY | 10,615 | (157 | ) | |||||||||||||||||
BNYMellon | 06/16/21 | USD | 51 | CAD | 64 | – | ||||||||||||||||||
BNYMellon | 06/16/21 | USD | 76 | CAD | 96 | – | ||||||||||||||||||
BNYMellon | 06/16/21 | GBP | 252 | USD | 352 | 4 | ||||||||||||||||||
BNYMellon | 06/16/21 | CAD | 302 | USD | 240 | – | ||||||||||||||||||
BNYMellon | 06/16/21 | USD | 439 | EUR | 369 | (5 | ) | |||||||||||||||||
BNYMellon | 06/16/21 | EUR | 1,049 | USD | 1,254 | 19 | ||||||||||||||||||
Citi | 04/21/21 | USD | 771 | CAD | 989 | 15 | ||||||||||||||||||
Citi | 04/21/21 | CAD | 1,576 | USD | 1,242 | (12 | ) | |||||||||||||||||
Citi | 05/19/21 | USD | 121 | JPY | 12,696 | (6 | ) | |||||||||||||||||
Citi | 05/20/21 | CNH | 1,826 | USD | 281 | 3 | ||||||||||||||||||
Credit Suisse First Boston | 06/16/21 | TRY | 7,235 | USD | 843 | 11 | ||||||||||||||||||
Deutsche Bank | 06/16/21 | USD | 165 | IDR | 2,411,361 | – | ||||||||||||||||||
Deutsche Bank | 06/16/21 | RUB | 91,631 | USD | 1,241 | 39 | ||||||||||||||||||
Deutsche Bank | 06/17/21 | ZAR | 9,535 | USD | 622 | (17 | ) | |||||||||||||||||
Goldman Sachs | 04/05/21 | USD | 506 | BRL | 2,865 | 2 | ||||||||||||||||||
Goldman Sachs | 04/05/21 | USD | 1,037 | BRL | 5,694 | (28 | ) | |||||||||||||||||
Goldman Sachs | 04/05/21 | BRL | 8,560 | USD | 1,578 | 62 | ||||||||||||||||||
Goldman Sachs | 07/02/21 | BRL | 2,865 | USD | 503 | (1 | ) | |||||||||||||||||
Goldman Sachs | 04/21/21 | ILS | 466 | USD | 142 | 2 | ||||||||||||||||||
Goldman Sachs | 04/21/21 | USD | 494 | AUD | 637 | (10 | ) | |||||||||||||||||
Goldman Sachs | 04/21/21 | USD | 534 | CAD | 677 | 5 | ||||||||||||||||||
Goldman Sachs | 04/21/21 | AUD | 637 | USD | 494 | 9 | ||||||||||||||||||
Goldman Sachs | 04/21/21 | USD | 1,147 | ILS | 3,665 | (48 | ) | |||||||||||||||||
Goldman Sachs | 05/19/21 | USD | 985 | JPY | 105,054 | (34 | ) | |||||||||||||||||
Goldman Sachs | 05/19/21 | JPY | 20,943 | USD | 192 | 2 | ||||||||||||||||||
Goldman Sachs | 05/20/21 | USD | 324 | CNH | 2,119 | (3 | ) | |||||||||||||||||
Goldman Sachs | 05/20/21 | USD | 710 | KRW | 802,914 | 3 | ||||||||||||||||||
Goldman Sachs | 05/20/21 | USD | 189 | KRW | 211,161 | (1 | ) | |||||||||||||||||
Goldman Sachs | 05/20/21 | CNH | 12,871 | USD | 1,977 | 23 | ||||||||||||||||||
Goldman Sachs | 05/20/21 | KRW | 3,379,688 | USD | 3,028 | 28 | ||||||||||||||||||
Goldman Sachs | 05/20/21 | KRW | 1,092,532 | USD | 960 | (10 | ) | |||||||||||||||||
Goldman Sachs | 06/16/21 | USD | 430 | RUB | 32,056 | (9 | ) | |||||||||||||||||
Goldman Sachs | 06/16/21 | USD | 480 | GBP | 345 | (3 | ) | |||||||||||||||||
HSBC | 04/05/21 | USD | 660 | BRL | 3,573 | (27 | ) | |||||||||||||||||
HSBC | 04/21/21 | CAD | 1,370 | USD | 1,080 | (9 | ) | |||||||||||||||||
HSBC | 05/19/21 | USD | 1,060 | JPY | 111,204 | (53 | ) | |||||||||||||||||
| 168 | SEI Institutional Managed Trust / Semi-Annual Report / March 31, 2021 |
| Counterparty | Settlement Date | Currency to Deliver (Thousands) | Currency to Receive (Thousands) | Unrealized Appreciation (Depreciation) (Thousands) | ||||||||||||||||||||
HSBC | 05/20/21 | USD | 585 | CNH | 3,807 | $ | (7 | ) | ||||||||||||||||
HSBC | 06/16/21 | USD | 269 | RUB | 19,865 | (9 | ) | |||||||||||||||||
HSBC | 06/16/21 | EUR | 429 | USD | 511 | 6 | ||||||||||||||||||
HSBC | 06/16/21 | USD | 650 | MXN | 13,928 | 25 | ||||||||||||||||||
JPMorgan Chase Bank | 04/05/21 | BRL | 3,379 | USD | 602 | 4 | ||||||||||||||||||
JPMorgan Chase Bank | 04/21/21 | CAD | 253 | USD | 200 | (2 | ) | |||||||||||||||||
JPMorgan Chase Bank | 05/19/21 | USD | 648 | JPY | 67,946 | (32 | ) | |||||||||||||||||
JPMorgan Chase Bank | 06/16/21 | CNY | 286 | USD | 44 | – | ||||||||||||||||||
JPMorgan Chase Bank | 06/16/21 | USD | 543 | CHF | 497 | (14 | ) | |||||||||||||||||
JPMorgan Chase Bank | 06/16/21 | USD | 730 | CNY | 4,756 | (9 | ) | |||||||||||||||||
JPMorgan Chase Bank | 06/16/21 | EUR | 1,414 | USD | 1,683 | 19 | ||||||||||||||||||
JPMorgan Chase Bank | 06/16/21 | USD | 1,496 | RUB | 111,742 | (31 | ) | |||||||||||||||||
JPMorgan Chase Bank | 06/16/21 | TRY | 3,380 | USD | 403 | 14 | ||||||||||||||||||
JPMorgan Chase Bank | 06/16/21 | IDR | 36,814,101 | USD | 2,534 | 25 | ||||||||||||||||||
Montgomery/Bank of America | 04/21/21 | USD | 594 | CAD | 753 | 5 | ||||||||||||||||||
Montgomery/Bank of America | 05/19/21 | JPY | 72,570 | USD | 692 | 35 | ||||||||||||||||||
Montgomery/Bank of America | 06/16/21 | USD | 153 | CHF | 140 | (4 | ) | |||||||||||||||||
Montgomery/Bank of America | 06/16/21 | USD | 498 | GBP | 356 | (7 | ) | |||||||||||||||||
Montgomery/Bank of America | 06/16/21 | USD | 628 | EUR | 528 | (7 | ) | |||||||||||||||||
Morgan Stanley | 04/21/21 | USD | 271 | CAD | 345 | 3 | ||||||||||||||||||
Morgan Stanley | 04/21/21 | CAD | 877 | USD | 692 | (6 | ) | |||||||||||||||||
Morgan Stanley | 04/21/21 | USD | 1,696 | AUD | 2,189 | (29 | ) | |||||||||||||||||
Morgan Stanley | 04/21/21 | AUD | 2,189 | USD | 1,696 | 29 | ||||||||||||||||||
Morgan Stanley | 05/19/21 | USD | 747 | JPY | 79,231 | (30 | ) | |||||||||||||||||
Morgan Stanley | 05/19/21 | JPY | 46,599 | USD | 443 | 21 | ||||||||||||||||||
Morgan Stanley | 06/16/21 | USD | 1,371 | RUB | 102,786 | (23 | ) | |||||||||||||||||
Morgan Stanley | 06/16/21 | USD | 1,549 | EUR | 1,298 | (22 | ) | |||||||||||||||||
Morgan Stanley | 06/16/21 | RUB | 345,983 | USD | 4,614 | 77 | ||||||||||||||||||
NATWEST MARKETS INC. (PAS) | 05/20/21 | USD | 250 | CNH | 1,625 | (3 | ) | |||||||||||||||||
NATWEST MARKETS INC. (PAS) | 05/20/21 | CNH | 919 | USD | 141 | 1 | ||||||||||||||||||
State Street | 04/21/21 | USD | 235 | CAD | 295 | (1 | ) | |||||||||||||||||
State Street | 04/21/21 | USD | 470 | ILS | 1,491 | (22 | ) | |||||||||||||||||
State Street | 04/21/21 | CAD | 2,132 | USD | 1,714 | 18 | ||||||||||||||||||
State Street | 04/21/21 | CAD | 1,050 | USD | 829 | (7 | ) | |||||||||||||||||
State Street | 05/19/21 | USD | 176 | JPY | 19,106 | (3 | ) | |||||||||||||||||
State Street | 05/19/21 | JPY | 331,846 | USD | 3,164 | 159 | ||||||||||||||||||
State Street | 05/20/21 | USD | 329 | CNH | 2,169 | – | ||||||||||||||||||
State Street | 05/20/21 | USD | 520 | CNH | 3,384 | (6 | ) | |||||||||||||||||
State Street | 05/20/21 | CNH | 17,153 | USD | 2,635 | 31 | ||||||||||||||||||
State Street | 06/16/21 | USD | 87 | CHF | 79 | (2 | ) | |||||||||||||||||
State Street | 06/16/21 | EUR | 1,543 | USD | 1,836 | 20 | ||||||||||||||||||
TD Bank | 04/21/21 | CAD | 664 | USD | 524 | (5 | ) | |||||||||||||||||
TD Bank | 05/20/21 | CNH | 10,628 | USD | 1,635 | 21 | ||||||||||||||||||
TD Bank | 06/16/21 | EUR | 335 | USD | 398 | 4 | ||||||||||||||||||
UBS | 04/21/21 | USD | 899 | ILS | 2,853 | (43 | ) | |||||||||||||||||
UBS | 04/21/21 | CAD | 967 | USD | 764 | (6 | ) | |||||||||||||||||
UBS | 04/21/21 | USD | 1,035 | CAD | 1,314 | 11 | ||||||||||||||||||
UBS | 04/21/21 | USD | 1,761 | AUD | 2,273 | (30 | ) | |||||||||||||||||
UBS | 04/21/21 | AUD | 2,273 | USD | 1,757 | 26 | ||||||||||||||||||
| SEI Institutional Managed Trust / Semi-Annual Report / March 31, 2021 | 169 |
SCHEDULE OF INVESTMENTS (Unaudited)
March 31, 2021
Multi-Strategy Alternative Fund (Continued)
| Counterparty | Settlement Date | Currency to Deliver (Thousands) | Currency to Receive (Thousands) | Unrealized Appreciation (Depreciation) (Thousands) | ||||||||||||||||||||
UBS | 04/21/21 | ILS | 2,853 | USD | 867 | $ | 11 | |||||||||||||||||
UBS | 05/19/21 | USD | 353 | JPY | 37,296 | (15) | ||||||||||||||||||
UBS | 05/19/21 | JPY | 9,427 | USD | 90 | 5 | ||||||||||||||||||
UBS | 05/20/21 | USD | 1,455 | CNH | 9,480 | (15) | ||||||||||||||||||
UBS | 05/20/21 | CNH | 2,223 | USD | 342 | 4 | ||||||||||||||||||
UBS | 06/16/21 | USD | 266 | CHF | 244 | (7) | ||||||||||||||||||
UBS | 06/16/21 | USD | 2,275 | EUR | 1,912 | (24) | ||||||||||||||||||
Westpac Banking | 04/21/21 | USD | 2,382 | CAD | 3,019 | 20 | ||||||||||||||||||
Westpac Banking | 05/19/21 | USD | 303 | JPY | 31,815 | (15) | ||||||||||||||||||
Westpac Banking | 06/16/21 | USD | 74 | EUR | 62 | (1) | ||||||||||||||||||
Westpac Banking | 06/16/21 | GBP | 689 | USD | 964 | 14 | ||||||||||||||||||
|
| |||||||||||||||||||||||
| $ | (52) | |||||||||||||||||||||||
|
| |||||||||||||||||||||||
A list of the open OTC swap agreements held by the Fund at March 31, 2021 is as follows:
| Total Return Swaps | ||||||||||||||||||||||||||||||||||
| Counterparty | Reference Entity/ Obligation | Fund Pays | Fund Receives | Payment Frequency | Termination Date | Currency | Notional Amount (Thousands) | Value (Thousands) | Upfront Payments/ Receipts (Thousands) | Net Unrealized Appreciation (Depreciation) (Thousands) | ||||||||||||||||||||||||
| Morgan Stanley | PERSPECTA Inc | FEDEF-1D | ASSET RETURN | Semi-Annually | 05/21/2021 | USD | (133) | $ | – | $ | – | $ | – | |||||||||||||||||||||
| Bank of America Merrill Lynch | Indonesia Government Bond | 3-MONTH USD - LIBOR + 1% | INDONESIA GOVERNMENT | Semi-Annually | 05/21/2021 | USD | 20,380,635 | 92 | – | 92 | ||||||||||||||||||||||||
| Deutsche Bank | Indonesia Treasury Bond | 3-MONTH USD - LIBOR | INDONESIA GOVERNMENT | Semi-Annually | 06/15/2032 | USD | 8,422,378 | 20 | – | 20 | ||||||||||||||||||||||||
| Goldman Sachs | NETMARBLE CORP | ASSET RETURN | NETMARBLE CORP | Monthly | 12/15/2025 | KRW | 373 | (32 | ) | – | (32) | |||||||||||||||||||||||
| Goldman Sachs | NOVATEK MICROELECT | 1 MONTH LIBOR + 50 | NOVATEK MICROELECT | Annually | 12/15/2025 | USD | (1,178) | 182 | – | 182 | ||||||||||||||||||||||||
| Goldman Sachs | Russell 2000 Growth Index Technology | ASSET RETURN | RUSSELL 2000 GROWTH INDEX TECHNOLOGY | Monthly | 12/15/2025 | USD | 9,555 | 452 | – | 452 | ||||||||||||||||||||||||
| Goldman Sachs | SILERGY CORP | 1 MONTH LIBOR + 50 | SILERGY CORP | Annually | 12/08/2022 | USD | (1,271) | (74 | ) | – | (74) | |||||||||||||||||||||||
| Goldman Sachs | WINBOND ELECTRONICS | ASSET RETURN | WINBOND ELECTRONICS | Monthly | 12/15/2025 | TWD | (14) | (55 | ) | – | (55) | |||||||||||||||||||||||
| Morgan Stanley | CDN PAC RLWAYS | ASSET RETURN | CDN PAC RLWAY(S) | Monthly | 03/23/2023 | USD | 758 | (34 | ) | – | (34) | |||||||||||||||||||||||
| Morgan Stanley | CHANGEHEALTHCARE | FEDEF-1D | CHANGEHEALTHCARE(L) | Annually | 03/05/2023 | USD | (870) | (8 | ) | – | (8) | |||||||||||||||||||||||
| Morgan Stanley | COHERENT INC | FEDEF-1D | COHERENT INC (L) | Annually | 03/05/2023 | USD | (2,513) | (12 | ) | – | (12) | |||||||||||||||||||||||
| Morgan Stanley | DIALOG SEMI | EURIB-1M | DIALOG SEMI(L) | Annually | 02/16/2023 | EUR | (1,230) | 15 | – | 15 | ||||||||||||||||||||||||
| Morgan Stanley | EXTENDED STAY | FEDEF-1D | EXTENDED STAY (L) | Annually | 03/24/2023 | USD | (63) | — | – | – | ||||||||||||||||||||||||
| Morgan Stanley | GRANDVISION NV | EURIB-1M | GRANDVISION NV(L) | Annually | 11/01/2021 | EUR | (69) | 2 | – | 2 | ||||||||||||||||||||||||
| Morgan Stanley | GW PHRMA PLC | FEDEF-1D | GW PHRMA PLC (L) | Annually | 03/01/2023 | USD | (959) | 9 | – | 9 | ||||||||||||||||||||||||
| Morgan Stanley | II-VI Inc | ASSET RETURN | II-VI INC (S) | Monthly | 03/10/2023 | USD | 592 | (17 | ) | – | (17) | |||||||||||||||||||||||
| Morgan Stanley | JAZZ PHARMA | ASSET RETURN | JAZZ PHARMA(S) | Monthly | 02/04/2023 | USD | 40 | – | – | – | ||||||||||||||||||||||||
| Morgan Stanley | KANSAS CITY STHRN | FEDEF-1D | KANSAS CITY STHRN(L) | Annually | 03/23/2023 | USD | (1,080) | 44 | – | 44 | ||||||||||||||||||||||||
| Morgan Stanley | MARVELL TECH | ASSET RETURN | MARVELL TECH(S) | Monthly | 02/11/2023 | USD | 72 | 3 | – | 3 | ||||||||||||||||||||||||
| Morgan Stanley | SHAW COMM | DISC -1D | SHAW COMM (L) | Annually | 03/16/2023 | CAD | (1,608) | (24 | ) | – | (24) | |||||||||||||||||||||||
|
| |||||||||||||||||||||||||||||||||
| $ | 563 | $ | – | $ | 563 | |||||||||||||||||||||||||||||
|
| |||||||||||||||||||||||||||||||||
A list of the open centrally cleared swap agreements held by the Fund at March 31, 2021 is as follows:
| Credit Default Swaps | ||||||||||||||||||||||||||
| Reference Entity/Obligation | Buy/Sell Protection | (Pays)/Receives Rate | Payment Frequency | Termination Date | Notional Amount (Thousands) | Value (Thousands) | Upfront Payments/ Receipts (Thousands) | Net Unrealized Appreciation (Depreciation) (Thousands) | ||||||||||||||||||
CDX.HY.34 | Buy | 5.00% | Quarterly | 06/20/2025 | $336 | $ | (30 | ) | $ | (1) | $ | (29) | ||||||||||||||
CDX.HY.34 | Buy | 5.00% | Quarterly | 06/20/2025 | 480 | (42 | ) | (3) | (39) | |||||||||||||||||
| CDX.HY.34 | Buy | 5.00% | Quarterly | 06/20/2025 | 336 | (29 | ) | (1) | (28) | ||||||||||||||||
CDX.HY.34 | Buy | 5.00% | Quarterly | 06/20/2025 | 336 | (30 | ) | (1) | (29) | |||||||||||||||||
CDX.HY.34 | Buy | 5.00% | Quarterly | 06/20/2025 | 173 | (15 | ) | (1) | (14) | |||||||||||||||||
| 170 | SEI Institutional Managed Trust / Semi-Annual Report / March 31, 2021 |
| Reference Entity/Obligation | Buy/Sell Protection | (Pays)/Receives Rate | Payment Frequency | Termination Date | Notional Amount (Thousands) | Value (Thousands) | Upfront Payments/ Receipts (Thousands) | Net Unrealized Appreciation (Depreciation) (Thousands) | ||||||||||||||||||||||||||
CDX.HY.34 | Buy | 5.00% | Quarterly | 06/20/2025 | $374 | $ | (33 | ) | $ | — | $ | (33 | ) | |||||||||||||||||||||
CDX.HY.36 | Buy | 5.00% | Quarterly | 06/20/2026 | 383 | (34 | ) | (34 | ) | — | ||||||||||||||||||||||||
| CDX.HY.36 | Buy | 5.00% | Quarterly | 06/20/2026 | 1,897 | (169 | ) | (162 | ) | (7 | ) | ||||||||||||||||||||||
CDX.HY.36 | Buy | 5.00% | Quarterly | 06/20/2026 | 154 | (14 | ) | (14 | ) | — | ||||||||||||||||||||||||
GAP Inc. | Buy | 1.00% | Quarterly | 06/20/2025 | 270 | 2 | 37 | (35 | ) | |||||||||||||||||||||||||
Mexico | Buy | 1.00% | Quarterly | 06/20/2023 | 1,273 | (14 | ) | — | (14 | ) | ||||||||||||||||||||||||
Mexico | Buy | 1.00% | Quarterly | 12/20/2023 | 2,550 | (28 | ) | (21 | ) | (7 | ) | |||||||||||||||||||||||
Mexico | Buy | 1.00% | Quarterly | 12/20/2023 | 458 | (5 | ) | 3 | (8 | ) | ||||||||||||||||||||||||
Nordstrom | Buy | 1.00% | Quarterly | 06/20/2025 | 50 | 2 | 3 | (1 | ) | |||||||||||||||||||||||||
Republic of Turkey | Sell | 1.00% | Quarterly | 12/20/2022 | (654 | ) | (40 | ) | (10 | ) | (30 | ) | ||||||||||||||||||||||
Republic of Turkey | Buy | 1.00% | Quarterly | 06/20/2024 | 885 | 97 | 55 | 42 | ||||||||||||||||||||||||||
Simon Property Group | Buy | 1.00% | Quarterly | 06/20/2025 | 275 | (3 | ) | 16 | (19 | ) | ||||||||||||||||||||||||
SOAF | Buy | 1.00% | Quarterly | 12/20/2024 | 3,399 | 103 | — | 103 | ||||||||||||||||||||||||||
|
|
|
|
|
| |||||||||||||||||||||||||||||
| $ (282) | $ (134) | $ (148) | ||||||||||||||||||||||||||||||||
|
|
|
|
|
| |||||||||||||||||||||||||||||
| Interest Rate Swaps | ||||||||||||||||||||||||
| Fund Pays | Fund Receives | Payment Frequency | Termination Date | Currency | Notional Amount (Thousands) | Value (Thousands) | Upfront Payments/ Receipts (Thousands) | Net Unrealized Appreciation (Depreciation) | ||||||||||||||||
4.788 | 1.0 X MXIBTIIE + 0.0 BPS | Monthly | 06/14/2023 | MXN | 30,556 | $ (13) | $ – | $ (13) | ||||||||||||||||
5.7 | 1.0 X MXIBTIIE + 0.0 BPS | Monthly | 06/10/2026 | MXN | 30,700 | (32) | – | (32) | ||||||||||||||||
1.0 X WIBR6M + 0.0 BPS | 1.91 | Semi-Annually | 06/16/2031 | PLN | 11,421 | 1 | – | 1 | ||||||||||||||||
1.0 X SORF6M + 0.0 BPS | 1.6515 | Semi-Annually | 06/16/2031 | SGD | 1,065 | (11) | – | (11) | ||||||||||||||||
|
|
|
|
|
|
|
|
| ||||||||||||||||
| $ (55) | $ – | $ (55) | ||||||||||||||||||||||
|
|
|
|
|
|
|
|
| ||||||||||||||||
| Percentages | are based on Net Assets of $473,092 ($ Thousands). |
| * | Non-income producing security. |
| ** | The rate reported is the 7-day effective yield as of March 31, 2021. |
| ‡ | Real Estate Investment Trust. |
| ‡‡ | Expiration date not available. |
 | There is currently no rate available. |
| † | Investment in Affiliated Security (see Note 6). |
| (A) | Security, or a portion thereof, is owned through a holding entity, Bamboo Temple, LLC. |
| (B) | Securities considered illiquid. The total value of such securities as of March 31, 2021 was $2,885 ($ Thousands) and represented 0.6% of the Net Assets of the Fund. |
| (C) | Level 3 security in accordance with fair value hierarchy. |
| (D) | Security fair valued using methods determined in good faith by the Valuation Committee of the Board of Trustees. The total market value of such securities as of March 31, 2021 was $983 ($ Thousands) and represented 0.2% of the Net Assets of the Fund. |
| (E) | Security exempt from registration under Rule 144A of the Securities Act of 1933. These securities may be resold in transactions exempt from registration normally to qualified institutions. On March 31, 2021, the value of these securities amounted to $54,449 ($ Thousands), representing 11.5% of the Net Assets of the Fund. |
| (F) | Security is in default on interest payment. |
| (G) | Variable or floating rate security, the interest rate of which adjusts periodically based on changes in current interest rates and prepayments on the underlying pool of assets. (H) Perpetual security with no stated maturity date. |
| (I) | Zero coupon security. The rate shown on the Schedule of Investments is the security’s effective yield at the time of purchase. |
| (J) | Unsettled bank loan. Interest rate may not be available. |
| (K) | Step Bonds – Represents the current rate, the step rate, the step date and the final maturity date. |
| (L) | Security is a Master Limited Partnership. At March 31, 2021, such securities amounted to $169 ($ Thousands), or 0.0% of the Net Assets of the Fund (See Note 2). |
| (M) | Refer to table below for details on Options Contracts. |
| (N) | Security, or portion thereof, has been pledged as collateral on securities sold short. |
| ADR | — American Depositary Receipt |
AUD— Australian Dollar
BPS— Basis Points
CAD— Canadian Dollar
CHF — Swiss Franc
Cl — Class
CLO — Collateralized Loan Obligation
CNH— Chinese Yuan Offshore
CNY— Chinese Yuan
CV — Conversion Ratio
DAC — Designated Activity Company
EGP — Egyptian Pound
ETF — Exchange-Traded Fund
EUR—Euro
ETN — Exchange Traded Note
FHLMC — Federal Home Loan Mortgage Corporation
FNMA — Federal National Mortgage Association
GO — General Obligation
GBP— British Pound Sterling
ICE— Intercontinental Exchange
ILS— Israeli New Sheckels
JPY— Japanese Yen
KRW— Korean Won
LIBOR— London Interbank Offered Rate
LLC — Limited Liability Company
LLLP — Limited Liability Limited Partnership
L.P. — Limited Partnership
Ltd. — Limited
MTN — Medium Term Note
MXN — Mexican Peso
OTC — Over The Counter
PIK — Payment-in-Kind
| SEI Institutional Managed Trust / Semi-Annual Report / March 31, 2021 | 171 |
SCHEDULE OF INVESTMENTS (Unaudited)
March 31, 2021
Multi-Strategy Alternative Fund (Concluded)
PLC — Public Limited Company
Pty — Proprietary
RUB — Russian Ruble
S&P— Standard & Poor’s
SGD — Singapore Dollar
Ser — Series
SPDR — Standard & Poor’s Depository Receipt
TRY—Turkish Lira
ULC — Unlimited Liability Company
USD — U.S. Dollar
VAR — Variable Rate
ZAR — South African Rand
The following is a list of the level of inputs used as of March 31, 2021, in valuing the Fund’s investments and other financial instruments carried at value ($thousands):
Investments in Securities | Level 1 ($) | Level 2 ($) | Level 3 ($) | Total ($) | ||||||||||||||||
Common Stock | 177,098 | 537 | 324 | 177,959 | ||||||||||||||||
Corporate Obligations | – | 74,554 | 623 | 75,177 | ||||||||||||||||
Exchange Traded Funds | 50,396 | – | – | 50,396 | ||||||||||||||||
Loan Participations | – | 14,937 | 4,181 | 19,118 | ||||||||||||||||
Foreign Common Stock | 18,437 | – | – | 18,437 | ||||||||||||||||
Sovereign Debt | – | 13,942 | – | 13,942 | ||||||||||||||||
Municipal Bonds | – | 6,005 | 29 | 6,034 | ||||||||||||||||
Preferred Stock | 1,958 | 4 | 26 | 1,988 | ||||||||||||||||
Asset-Backed Securities | – | 1,631 | 175 | 1,806 | ||||||||||||||||
Convertible Bonds | – | 1,701 | – | 1,701 | ||||||||||||||||
U.S. Treasury Obligation | – | 722 | – | 722 | ||||||||||||||||
Warrants | – | 591 | 75 | 666 | ||||||||||||||||
Rights | – | – | – | – | ||||||||||||||||
Cash Equivalents | 97,274 | – | – | 97,274 | ||||||||||||||||
|
|
|
|
|
|
|
| |||||||||||||
Total Investments in Securities | 345,163 | 114,624 | 5,433 | 465,220 | ||||||||||||||||
|
|
|
|
|
|
|
| |||||||||||||
Securities Sold Short | ||||||||||||||||||||
Common Stock | (46,415) | – | – | (46,415) | ||||||||||||||||
Corporate Obligations | – | (13,352) | – | (13,352) | ||||||||||||||||
Foreign Common Stock | (12,081) | – | – | (12,081) | ||||||||||||||||
Exchange Traded Funds | (11,193) | – | – | (11,193) | ||||||||||||||||
Sovereign Debt | – | (697) | – | (697) | ||||||||||||||||
U.S. Treasury Obligations | – | (183) | – | (183) | ||||||||||||||||
|
|
|
|
|
|
|
| |||||||||||||
Total Securities Sold Short | (69,689) | (14,232) | – | (83,921) | ||||||||||||||||
|
|
|
|
|
|
|
| |||||||||||||
| Other Financial Instruments | Level 1 ($) | Level 2 ($) | Level 3 ($) | Total ($) | ||||||||||||
Purchased Options | 781 | – | – | 781 | ||||||||||||
Written Options | (570) | – | – | (570) | ||||||||||||
Futures Contracts* | ||||||||||||||||
Unrealized Appreciation | 85 | – | – | 85 | ||||||||||||
Unrealized Depreciation | (15) | – | – | (15) | ||||||||||||
Forwards Contracts* | ||||||||||||||||
Unrealized Appreciation | – | 868 | – | 868 | ||||||||||||
Unrealized Depreciation | – | (920) | – | (920) | ||||||||||||
OTC Swaps | ||||||||||||||||
Total Return Swaps* | ||||||||||||||||
Unrealized Appreciation | – | 819 | – | 819 | ||||||||||||
Unrealized Depreciation | – | (256 | ) | – | (256) | |||||||||||
Centrally Cleared Swaps | ||||||||||||||||
Credit Default Swaps* | ||||||||||||||||
Unrealized Appreciation | – | 145 | – | 145 | ||||||||||||
Unrealized Depreciation | – | (293 | ) | – | (293) | |||||||||||
Interest Rate Swaps* | ||||||||||||||||
Unrealized Appreciation | – | 1 | – | 1 | ||||||||||||
Unrealized Depreciation | – | (56 | ) | – | (56) | |||||||||||
|
|
|
|
|
|
|
| |||||||||
Total Other Financial Instruments | 281 | 308 | – | 589 | ||||||||||||
|
|
|
|
|
|
|
| |||||||||
* Futures contracts, forward contracts and swap contracts are valued at the unrealized appreciation (depreciation) on the instrument.
The following is a reconciliation of the investments in which significant unobservable inputs (Level 3) were used in determining value ($ Thousands):
Investments in Common Stock | Investments in Corporate Obligations | Investments in Loan Participations | Investments in Municipal Bonds | Investments in Preferred Stock | Investments in Asset-Backed Securities | Investments in Backed Securities | Investments in Warrants | |||||||||||||||||||||||||
Balance as of September 30, 2020 | $ | 245 | $ | 654 | $ | 2,658 | $ | 152 | $ | 26 | $ | – | $ | 161 | $ | – | ||||||||||||||||
Accrued discounts/premiums | – | (5 | ) | 11 | – | – | – | – | – | |||||||||||||||||||||||
Realized gain/(loss) | (149 | ) | 28 | (57 | ) | 9 | – | – | – | – | ||||||||||||||||||||||
Change in unrealized appreciation/ (depreciation) | (31 | ) | 10 | (280 | ) | 2 | (31 | ) | – | (161 | ) | (51 | ) | |||||||||||||||||||
Purchases | 275 | 12 | 686 | – | 4 | – | – | 51 | ||||||||||||||||||||||||
Sales | (80 | ) | (256 | ) | (441 | ) | (134 | ) | – | – | – | – | ||||||||||||||||||||
Net transfer into Level 3 | 64 | 180 | 2,498 | – | 27 | 175 | – | 75 | ||||||||||||||||||||||||
Net transfer out of Level 3 | – | – | (894 | ) | – | – | – | – | – | |||||||||||||||||||||||
Ending Balance as of March 31, 2021(1) | $ | 324 | $ | 623 | $ | 4,181 | $ | 29 | $ | 26 | $ | 175 | $ | – | $ | 75 | ||||||||||||||||
|
|
| ||||||||||||||||||||||||||||||
Changes in unrealized gains/(losses) included in earnings related to securities still held at reporting date | $ | (221 | ) | $ | (22 | ) | $ | (128 | ) | $ | 6 | $ | (31 | ) | $ | 1 | $ | (161 | ) | $ | (27 | ) | ||||||||||
|
|
| ||||||||||||||||||||||||||||||
| 172 | SEI Institutional Managed Trust / Semi-Annual Report / March 31, 2021 |
(1) Of the $5,433 ($ Thousands) in Level 3 securities as of March 31, 2021, $983 ($ Thousands) or 0.2% of the Net Assets of the Fund are not valued via third party pricing vendors and broker quotes. If significant, the disclosure of the unobservable inputs and the interrelationships and sensitivity between these inputs are required for those Level 3 securities that are not valued by third party pricing vendors or broker quotes. The value of these securities is immaterial and no further disclosure is required.
For the period ended March 31, 2021, there were transfers between Level 2 and Level 3 assets and liabilities due to the availability of observable inputs to determine fair value.
For more information on valuation inputs, see Note 2 – Significant Accounting Policies in Notes to Financial Statements.
The following is a summary of the Fund’s transactions with affiliates for the period ended March 31, 2021 ($ Thousands):
| ||||||||||||||||||
| Change in | ||||||||||||||||||
| Security Description | Value 9/30/2020 | Purchases at Cost | Proceeds from Sales | Realized Gain (Loss) | Unrealized Appreciation (Depreciation) | Value 3/31/2021 | Shares | Income | Capital Gains | |||||||||
| ||||||||||||||||||
SEI Daily Income Trust, Government Fund, Cl F | $78,712 | $363,399 | $(346,181) | $— | $— | $95,930 | 95,930,025 | $5 | $— | |||||||||
|
|
|
|
|
|
|
| |||||||||||
Amounts designated as “—” are either $0 or have been rounded to $0.
The accompanying notes are an integral part of the financial statements.
| SEI Institutional Managed Trust / Semi-Annual Report / March 31, 2021 | 173 |
CONSOLIDATED SCHEDULE OF INVESTMENTS (Unaudited)
March 31, 2021
Multi-Asset Accumulation Fund
Sector Weightings†:
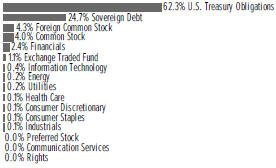
†Percentages are based on total investments.
| Description | Face Amount (Thousands) | Market Value ($ Thousands) | ||||||
U.S. TREASURY OBLIGATIONS — 37.8% |
| |||||||
U.S. Treasury Bills | ||||||||
0.115%, 04/22/2021 (A)(B) | $ | 48,070 | $ | 48,069 | ||||
0.110%, 04/08/2021 (A)(B) | 204,289 | 204,289 | ||||||
0.110%, 04/29/2021 (A)(B) | 39,119 | 39,119 | ||||||
0.110%, 05/13/2021 (A)(B) | 26,963 | 26,962 | ||||||
0.100%, 05/20/2021 (B) | 7,478 | 7,478 | ||||||
0.090%, 05/27/2021 (B) | 2,780 | 2,780 | ||||||
0.090%, 06/03/2021 (B) | 4,803 | 4,803 | ||||||
0.090%, 06/24/2021 (A)(B) | 8,379 | 8,379 | ||||||
0.090%, 07/08/2021 (A)(B) | 64,938 | 64,935 | ||||||
0.085%, 07/29/2021 (A)(B) | 27,368 | 27,366 | ||||||
0.070%, 08/05/2021 (A)(B) | 881 | 881 | ||||||
0.067%, 04/27/2021 (A)(B) | 72,000 | 71,999 | ||||||
0.060%, 09/02/2021 (A)(B) | 632 | 632 | ||||||
0.060%, 09/09/2021 (A)(B) | 89,297 | 89,287 | ||||||
0.055%, 09/16/2021 (B) | 24,163 | 24,160 | ||||||
0.045%, 08/26/2021 (A)(B) | 7,973 | 7,972 | ||||||
U.S. Treasury Inflation Protected Securities | ||||||||
3.875%, 04/15/2029 | 3,182 | 4,463 | ||||||
3.625%, 04/15/2028 | 1,617 | 2,177 | ||||||
3.375%, 04/15/2032 | 5,158 | 7,506 | ||||||
2.500%, 01/15/2029 | 1,828 | 2,336 | ||||||
2.375%, 01/15/2025 | 1,110 | 1,300 | ||||||
2.375%, 01/15/2027 | 1,297 | 1,587 | ||||||
2.125%, 02/15/2040 | 2,421 | 3,457 | ||||||
2.125%, 02/15/2041 | 1,194 | 1,721 | ||||||
2.000%, 01/15/2026 | 1,318 | 1,557 | ||||||
1.750%, 01/15/2028 | 592 | 711 | ||||||
1.375%, 02/15/2044 | 1,122 | 1,459 | ||||||
1.000%, 02/15/2046 | 1,104 | 1,344 | ||||||
1.000%, 02/15/2049 | 4,678 | 5,818 | ||||||
0.875%, 01/15/2029 | 23,252 | 26,635 | ||||||
0.750%, 07/15/2028 | 23,249 | 26,487 | ||||||
0.750%, 02/15/2042 | 4,631 | 5,329 | ||||||
0.750%, 02/15/2045 | 833 | 959 | ||||||
0.625%, 07/15/2021 | 1,161 | 1,180 | ||||||
| Description | Face Amount (Thousands) | Market Value ($ Thousands) | ||||||||
U.S. TREASURY OBLIGATIONS (continued) |
| |||||||||
0.625%, 01/15/2024 | $ | 1,121 | $ | 1,215 | ||||||
0.625%, 01/15/2026 | 5,504 | 6,118 | ||||||||
0.625%, 02/15/2043 | 1,138 | 1,280 | ||||||||
0.500%, 01/15/2028 | 29,343 | 32,651 | ||||||||
0.375%, 07/15/2023 | 1,124 | 1,204 | ||||||||
0.375%, 07/15/2025 | 4,412 | 4,859 | ||||||||
0.375%, 01/15/2027 | 19,600 | 21,608 | ||||||||
0.375%, 07/15/2027 | 19,120 | 21,196 | ||||||||
0.250%, 01/15/2025 | 552 | 599 | ||||||||
0.250%, 07/15/2029 | 39,678 | 43,610 | ||||||||
0.125%, 04/15/2021 | 552 | 553 | ||||||||
0.125%, 01/15/2022 | 578 | 591 | ||||||||
0.125%, 04/15/2022 | 7,529 | 7,744 | ||||||||
0.125%, 07/15/2022 | 569 | 591 | ||||||||
0.125%, 01/15/2023 | 9,633 | 10,102 | ||||||||
0.125%, 07/15/2024 | 4,407 | 4,767 | ||||||||
0.125%, 10/15/2024 | 5,506 | 5,954 | ||||||||
0.125%, 04/15/2025 | 810 | 877 | ||||||||
0.125%, 10/15/2025 | 7,662 | 8,343 | ||||||||
0.125%, 10/15/2025 | 403 | 439 | ||||||||
0.125%, 07/15/2026 | 5,827 | 6,365 | ||||||||
0.125%, 01/15/2030 | 35,483 | 38,345 | ||||||||
0.125%, 07/15/2030 | 30,608 | 33,176 | ||||||||
0.125%, 01/15/2031 | 8,742 | 9,400 | ||||||||
|
|
| ||||||||
Total U.S. Treasury Obligations |
| 986,724 | ||||||||
|
|
| ||||||||
SOVEREIGN DEBT — 15.5% |
| |||||||||
Andina de Fomento | ||||||||||
4.375%, 06/15/2022 (A) | 125 | 130 | ||||||||
Asian Development Bank | ||||||||||
2.625%, 01/30/2024 (A) | 375 | 398 | ||||||||
2.625%, 01/12/2027 (A) | 1,750 | 1,889 | ||||||||
2.375%, 08/10/2027 (A) | 500 | 530 | ||||||||
2.000%, 04/24/2026 (A) | 500 | 524 | ||||||||
1.750%, 08/14/2026 (A) | 500 | 517 | ||||||||
Asian Infrastructure Investment Bank | ||||||||||
2.250%, 05/16/2024 (A) | 375 | 395 | ||||||||
Canada Government International Bond | ||||||||||
2.000%, 11/15/2022 (A) | 375 | 386 | ||||||||
Council of Europe Development Bank | ||||||||||
2.625%, 02/13/2023 (A) | 500 | 522 | ||||||||
2.500%, 02/27/2024 (A) | 750 | 794 | ||||||||
1.750%, 09/26/2022 (A) | 250 | 256 | ||||||||
Deutsche Bundesrepublik Inflation Linked Bond | ||||||||||
0.500%, 04/15/2030 | EUR | 39,893 | 57,019 | |||||||
0.100%, 04/15/2023 | 7,400 | 9,016 | ||||||||
0.100%, 04/15/2026 | 8,232 | 10,680 | ||||||||
| 174 | SEI Institutional Managed Trust / Semi-Annual Report / March 31, 2021 |
| Description | Face Amount (Thousands) | Market Value ($ Thousands) | ||||||||
SOVEREIGN DEBT (continued) |
| |||||||||
0.100%, 04/15/2046 | EUR | 4,714 | $ | 8,018 | ||||||
European Bank for Reconstruction & Development MTN | ||||||||||
2.750%, 03/07/2023 (A) | $ | 750 | 786 | |||||||
1.875%, 02/23/2022 (A) | 375 | 381 | ||||||||
European Investment Bank | ||||||||||
4.875%, 02/15/2036 (A) | 250 | 333 | ||||||||
3.250%, 01/29/2024 (A) | 1,500 | 1,619 | ||||||||
3.125%, 12/14/2023 (A) | 250 | 268 | ||||||||
2.625%, 03/15/2024 (A) | 1,000 | 1,064 | ||||||||
2.500%, 03/15/2023 (A) | 375 | 392 | ||||||||
2.500%, 10/15/2024 (A) | 1,000 | 1,068 | ||||||||
2.375%, 05/24/2027 (A) | 250 | 267 | ||||||||
2.125%, 04/13/2026 (A) | 500 | 527 | ||||||||
1.875%, 02/10/2025 (A) | 500 | 523 | ||||||||
Export Development Canada | ||||||||||
2.750%, 03/15/2023 (A) | 750 | 787 | ||||||||
2.625%, 02/21/2024 (A) | 1,375 | 1,461 | ||||||||
2.500%, 01/24/2023 (A) | 750 | 781 | ||||||||
French Republic Government Bond OAT | ||||||||||
3.400%, 07/25/2029 | EUR | 1,315 | 2,209 | |||||||
3.150%, 07/25/2032 | 2,591 | 4,774 | ||||||||
2.100%, 07/25/2023 (C) | 1,977 | 2,526 | ||||||||
1.850%, 07/25/2027 | 20,052 | 29,277 | ||||||||
1.800%, 07/25/2040 (C) | 1,800 | 3,449 | ||||||||
1.100%, 07/25/2022 | 1,137 | 1,399 | ||||||||
0.700%, 07/25/2030 (C) | 20,122 | 28,895 | ||||||||
0.250%, 07/25/2024 | 1,916 | 2,426 | ||||||||
0.100%, 07/25/2021 | 1,272 | 1,511 | ||||||||
0.100%, 03/01/2025 | 5,256 | 6,571 | ||||||||
0.100%, 03/01/2028 | 1,574 | 2,052 | ||||||||
0.100%, 03/01/2029 | 11,014 | 14,761 | ||||||||
0.100%, 07/25/2036 (C) | 4,068 | 5,828 | ||||||||
0.100%, 07/25/2047 (C) | 1,038 | 1,603 | ||||||||
Inter-American Development Bank | ||||||||||
7.000%, 06/15/2025 (A) | $ | 500 | 631 | |||||||
3.125%, 09/18/2028 (A) | 375 | 415 | ||||||||
3.000%, 10/04/2023 (A) | 250 | 267 | ||||||||
3.000%, 02/21/2024 (A) | 250 | 268 | ||||||||
2.625%, 01/16/2024 (A) | 375 | 398 | ||||||||
2.500%, 01/18/2023 (A) | 750 | 781 | ||||||||
2.000%, 06/02/2026 (A) | 1,000 | 1,045 | ||||||||
2.000%, 07/23/2026 (A) | 375 | 392 | ||||||||
1.750%, 09/14/2022 (A) | 1,000 | 1,022 | ||||||||
International Bank for Reconstruction & Development | ||||||||||
7.625%, 01/19/2023 (A) | 750 | 849 | ||||||||
4.750%, 02/15/2035 (A) | 250 | 324 | ||||||||
3.000%, 09/27/2023 (A) | 750 | 799 | ||||||||
2.500%, 03/19/2024 (A) | 750 | 796 | ||||||||
2.500%, 11/25/2024 (A) | 500 | 534 | ||||||||
2.500%, 07/29/2025 (A) | 375 | 401 | ||||||||
| Description | Face Amount (Thousands) | Market Value ($ Thousands) | ||||||||
SOVEREIGN DEBT (continued) |
| |||||||||
2.500%, 11/22/2027 (A) | $ | 750 | $ | 801 | ||||||
2.125%, 07/01/2022 (A) | 375 | 384 | ||||||||
1.875%, 10/07/2022 (A) | 875 | 897 | ||||||||
1.875%, 10/27/2026 (A) | 375 | 390 | ||||||||
1.750%, 04/19/2023 (A) | 1,000 | 1,030 | ||||||||
1.500%, 08/28/2024 (A) | 375 | 387 | ||||||||
International Finance MTN | ||||||||||
2.875%, 07/31/2023 (A) | 375 | 397 | ||||||||
2.125%, 04/07/2026 (A) | 1,000 | 1,053 | ||||||||
2.000%, 10/24/2022 (A) | 750 | 771 | ||||||||
Italy Buoni Poliennali Del Tesoro | ||||||||||
3.100%, 09/15/2026 (C) | EUR | 2,778 | 4,048 | |||||||
2.600%, 09/15/2023 (C) | 2,393 | 3,113 | ||||||||
2.550%, 09/15/2041 (C) | 1,230 | 2,238 | ||||||||
2.350%, 09/15/2024 (C) | 2,106 | 2,808 | ||||||||
2.350%, 09/15/2035 (C) | 3,131 | 5,133 | ||||||||
2.100%, 09/15/2021 (C) | 1,533 | 1,847 | ||||||||
1.300%, 05/15/2028 (C) | 1,549 | 2,096 | ||||||||
1.250%, 09/15/2032 (C) | 2,675 | 3,782 | ||||||||
0.400%, 05/15/2030 (C) | 2,502 | 3,213 | ||||||||
0.100%, 05/15/2022 (C) | 2,083 | 2,497 | ||||||||
Korea Development Bank/The | ||||||||||
4.625%, 11/16/2021 (A) | $ | 250 | 256 | |||||||
Korea International Bond | ||||||||||
2.750%, 01/19/2027 (A) | 1,000 | 1,077 | ||||||||
Nordic Investment Bank | ||||||||||
1.250%, 08/02/2021 (A) | 500 | 502 | ||||||||
North American Development Bank | ||||||||||
2.400%, 10/26/2022 (A) | 200 | 205 | ||||||||
Province of Alberta Canada | ||||||||||
3.350%, 11/01/2023 (A) | 250 | 268 | ||||||||
3.300%, 03/15/2028 (A) | 500 | 550 | ||||||||
2.950%, 01/23/2024 (A) | 250 | 267 | ||||||||
2.200%, 07/26/2022 (A) | 1,000 | 1,025 | ||||||||
Province of British Columbia Canada | ||||||||||
6.500%, 01/15/2026 (A) | 250 | 309 | ||||||||
2.000%, 10/23/2022 (A) | 750 | 771 | ||||||||
Province of Manitoba Canada | ||||||||||
3.050%, 05/14/2024 (A) | 250 | 269 | ||||||||
2.600%, 04/16/2024 (A) | 500 | 531 | ||||||||
2.125%, 05/04/2022 (A) | 250 | 255 | ||||||||
Province of Ontario Canada | ||||||||||
3.200%, 05/16/2024 (A) | 250 | 270 | ||||||||
2.500%, 04/27/2026 (A) | 1,000 | 1,066 | ||||||||
2.450%, 06/29/2022 (A) | 250 | 257 | ||||||||
2.400%, 02/08/2022 (A) | 750 | 763 | ||||||||
2.250%, 05/18/2022 (A) | 500 | 511 | ||||||||
2.200%, 10/03/2022 (A) | 500 | 514 | ||||||||
2.000%, 10/02/2029 (A) | 500 | 503 | ||||||||
Province of Quebec Canada | ||||||||||
7.500%, 09/15/2029 (A) | 450 | 638 | ||||||||
2.875%, 10/16/2024 (A) | 500 | 539 | ||||||||
| SEI Institutional Managed Trust / Semi-Annual Report / March 31, 2021 | 175 |
CONSOLIDATED SCHEDULE OF INVESTMENTS (Unaudited)
March 31, 2021
Multi-Asset Accumulation Fund (Continued)
| Description | Face Amount (Thousands) | Market Value ($ Thousands) | ||||||||
SOVEREIGN DEBT (continued) |
| |||||||||
2.625%, 02/13/2023 (A) | $ | 500 | $ | 522 | ||||||
2.500%, 04/09/2024 (A) | 1,000 | 1,060 | ||||||||
2.500%, 04/20/2026 (A) | 750 | 800 | ||||||||
Svensk Exportkredit AB MTN | ||||||||||
2.875%, 03/14/2023 (A) | 1,000 | 1,050 | ||||||||
United Kingdom Gilt Inflation Linked | ||||||||||
4.125%, 07/22/2030 | GBP | 500 | 2,559 | |||||||
2.500%, 07/17/2024 | 340 | 1,671 | ||||||||
2.000%, 01/26/2035 | 932 | 3,711 | ||||||||
1.875%, 11/22/2022 | 716 | 1,079 | ||||||||
1.250%, 11/22/2027 | 6,831 | 12,299 | ||||||||
1.250%, 11/22/2032 | 11,126 | 23,330 | ||||||||
1.250%, 11/22/2055 | 460 | 1,638 | ||||||||
1.125%, 11/22/2037 | 2,768 | 6,531 | ||||||||
0.750%, 03/22/2034 | 2,283 | 4,692 | ||||||||
0.750%, 11/22/2047 | 567 | 1,553 | ||||||||
0.625%, 03/22/2040 | 3,402 | 7,841 | ||||||||
0.625%, 11/22/2042 | 1,941 | 4,714 | ||||||||
0.500%, 03/22/2050 | 690 | 1,877 | ||||||||
0.375%, 03/22/2062 | 500 | 1,659 | ||||||||
0.250%, 03/22/2052 | 1,217 | 3,258 | ||||||||
0.125%, 03/22/2024 | 1,215 | 1,850 | ||||||||
0.125%, 03/22/2026 | 2,396 | 3,861 | ||||||||
0.125%, 08/10/2028 | 6,172 | 10,565 | ||||||||
0.125%, 03/22/2029 | 6,452 | 11,167 | ||||||||
0.125%, 03/22/2044 | 3,646 | 8,276 | ||||||||
0.125%, 08/10/2048 | 1,608 | 3,943 | ||||||||
0.125%, 03/22/2058 | 1,151 | 3,338 | ||||||||
0.125%, 11/22/2065 | 1,131 | 3,816 | ||||||||
0.125%, 03/22/2068 | 2,950 | 10,762 | ||||||||
|
|
| ||||||||
Total Sovereign Debt | 405,187 | |||||||||
|
|
| ||||||||
| Shares | ||||||||||
FOREIGN COMMON STOCK — 2.7% |
| |||||||||
Australia — 0.1% | ||||||||||
Afterpay * | 485 | 38 | ||||||||
AGL Energy Ltd | 11,836 | 87 | ||||||||
AMP Ltd | 26,830 | 26 | ||||||||
Ampol | 9,474 | 177 | ||||||||
APA Group | 22,955 | 175 | ||||||||
ASX Ltd | 1,383 | 75 | ||||||||
Aurizon Holdings Ltd | 21,309 | 63 | ||||||||
AusNet Services | 121,425 | 170 | ||||||||
Brambles Ltd | 4,589 | 37 | ||||||||
CIMIC Group Ltd | 2,946 | 39 | ||||||||
Coca-Cola Amatil Ltd | 13,155 | 135 | ||||||||
Cochlear Ltd | 834 | 134 | ||||||||
Computershare Ltd | 8,847 | 101 | ||||||||
Crown Resorts Ltd | 10,576 | 95 | ||||||||
CSL Ltd | 423 | 85 | ||||||||
| Description | Shares | Market Value ($ Thousands) | ||||||
FOREIGN COMMON STOCK (continued) |
| |||||||
Lendlease Group ‡ | 3,959 | $ | 39 | |||||
Northern Star Resources Ltd | 10,849 | 78 | ||||||
Oil Search Ltd | 44,079 | 138 | ||||||
Orica Ltd | 4,582 | 49 | ||||||
Origin Energy Ltd | 26,344 | 94 | ||||||
REA Group Ltd | 1,032 | 111 | ||||||
Santos Ltd | 27,255 | 147 | ||||||
SEEK Ltd | 3,243 | 70 | ||||||
Sonic Healthcare Ltd | 4,379 | 117 | ||||||
Tabcorp Holdings Ltd | 30,312 | 108 | ||||||
Telstra Corp Ltd, Cl B | 53,641 | 139 | ||||||
Treasury Wine Estates Ltd | 13,519 | 107 | ||||||
Washington H Soul Pattinson & Co Ltd | 3,573 | 86 | ||||||
Wesfarmers Ltd | 1,419 | 57 | ||||||
WiseTech Global | 2,479 | 55 | ||||||
Woodside Petroleum Ltd | 8,953 | 164 | ||||||
Woolworths Group Ltd | 6,248 | 194 | ||||||
|
|
| ||||||
| 3,190 | ||||||||
|
|
| ||||||
Austria — 0.0% | ||||||||
Erste Group Bank AG * | 2,047 | 70 | ||||||
OMV AG | 2,664 | 135 | ||||||
Verbund AG ‡ | 1,734 | 126 | ||||||
|
|
| ||||||
| 331 | ||||||||
|
|
| ||||||
Belgium — 0.0% | ||||||||
Ageas | 1,537 | 93 | ||||||
Anheuser-Busch InBev SA/NV | 1,152 | 73 | ||||||
Argenx * | 261 | 72 | ||||||
Groupe Bruxelles Lambert SA | 357 | 37 | ||||||
KBC Group NV | 780 | 57 | ||||||
Proximus SADP | 11,315 | 247 | ||||||
UCB SA, Cl A | 560 | 53 | ||||||
|
|
| ||||||
| 632 | ||||||||
|
|
| ||||||
Canada — 0.3% | ||||||||
Agnico Eagle Mines Ltd | 1,001 | 58 | ||||||
Algonquin Power & Utilities Corp | 24,181 | 383 | ||||||
Alimentation Couche-Tard Inc, Cl B | 1,594 | 51 | ||||||
AltaGas Ltd | 5,402 | 90 | ||||||
Atco Ltd/Canada, Cl I | 4,301 | 143 | ||||||
Bank of Nova Scotia/The, Cl C | 1,590 | 99 | ||||||
Barrick Gold Corp | 5,117 | 102 | ||||||
Bausch Health Cos Inc * | 2,723 | 86 | ||||||
BCE Inc | 6,461 | 292 | ||||||
BlackBerry Ltd * | 8,664 | 73 | ||||||
Cameco Corp | 14,669 | 243 | ||||||
Canadian Natural Resources Ltd | 3,289 | 102 | ||||||
Canadian Pacific Railway Ltd | 271 | 104 | ||||||
Canadian Tire Corp Ltd, Cl A | 758 | 108 | ||||||
Canadian Utilities Ltd, Cl A | 7,703 | 207 | ||||||
Canopy Growth Corp * | 1,708 | 55 | ||||||
| 176 | SEI Institutional Managed Trust / Semi-Annual Report / March 31, 2021 |
| Description | Shares | Market Value ($ Thousands) | ||||||
FOREIGN COMMON STOCK (continued) |
| |||||||
CCL Industries Inc, Cl B | 2,082 | $ | 115 | |||||
CGI Inc, Cl A * | 1,997 | 166 | ||||||
CI Financial Corp | 3,354 | 48 | ||||||
Constellation Software Inc/Canada | 100 | 140 | ||||||
Dollarama Inc | 1,227 | 54 | ||||||
Emera Inc | 7,106 | 316 | ||||||
Empire Co Ltd, Cl A | 6,029 | 188 | ||||||
Enbridge Inc | 7,000 | 255 | ||||||
First Quantum Minerals Ltd (Canada) | 2,143 | 41 | ||||||
Fortis Inc/Canada | 10,888 | 472 | ||||||
Franco-Nevada Corp | 892 | 112 | ||||||
George Weston Ltd | 1,417 | 125 | ||||||
Gildan Activewear Inc | 2,328 | 71 | ||||||
Hydro One Ltd | 14,737 | 343 | ||||||
iA Financial Corp Inc | 540 | 29 | ||||||
Imperial Oil Ltd | 4,941 | 120 | ||||||
Inter Pipeline Ltd | 9,895 | 141 | ||||||
Keyera | 5,373 | 112 | ||||||
Kinross Gold Corp | 6,886 | 46 | ||||||
Loblaw Cos Ltd | 7,305 | 408 | ||||||
Magna International Inc, Cl A | 1,415 | 125 | ||||||
Metro Inc/CN, Cl A | 10,610 | 484 | ||||||
Nutrien Ltd | 1,332 | 72 | ||||||
Onex Corp | 820 | 51 | ||||||
Open Text Corp | 2,952 | 141 | ||||||
Parkland | 2,087 | 63 | ||||||
Pembina Pipeline | 5,103 | 147 | ||||||
Restaurant Brands International Inc | 1,026 | 67 | ||||||
Rogers Communications Inc, Cl B | 3,644 | 168 | ||||||
Royal Bank of Canada | 1,066 | 98 | ||||||
Saputo Inc | 4,704 | 141 | ||||||
Shaw Communications Inc, Cl B | 6,821 | 177 | ||||||
Shopify Inc, Cl A * | 63 | 70 | ||||||
Suncor Energy Inc | 4,386 | 92 | ||||||
TC Energy Corp | 4,998 | 229 | ||||||
TELUS Corp | 8,437 | 168 | ||||||
Thomson Reuters | 1,656 | 145 | ||||||
Toronto-Dominion Bank/The | 1,857 | 121 | ||||||
Wheaton Precious Metals Corp | 1,963 | 75 | ||||||
WSP Global Inc | 1,000 | 95 | ||||||
|
|
| ||||||
| 8,227 | ||||||||
|
|
| ||||||
China — 0.0% | ||||||||
Sands China Ltd | 18,800 | 94 | ||||||
|
|
| ||||||
Denmark — 0.1% | ||||||||
Ambu A/S, Cl B | 4,155 | 196 | ||||||
Carlsberg A/S, Cl B | 1,017 | 157 | ||||||
Chr Hansen Holding A/S | 903 | 82 | ||||||
Coloplast A/S, Cl B | 1,334 | 201 | ||||||
Danske Bank A/S | 4,552 | 85 | ||||||
Demant A/S * | 2,181 | 93 | ||||||
| Description | Shares | Market Value ($ Thousands) | ||||||
FOREIGN COMMON STOCK (continued) |
| |||||||
DSV A/S | 468 | $ | 92 | |||||
Genmab A/S * | 197 | 65 | ||||||
GN Store Nord A/S | 902 | 71 | ||||||
H Lundbeck A/S, Cl H | 2,569 | 88 | ||||||
Novo Nordisk A/S, Cl B | 1,755 | 119 | ||||||
Novozymes A/S, Cl B | 2,193 | 141 | ||||||
Orsted A/S | 1,151 | 186 | ||||||
Pandora A/S | 660 | 71 | ||||||
Tryg A/S | 3,506 | 83 | ||||||
|
|
| ||||||
| 1,730 | ||||||||
|
|
| ||||||
Finland — 0.0% | ||||||||
Elisa Oyj | 5,330 | 320 | ||||||
Fortum Oyj | 5,767 | 154 | ||||||
Neste Oyj | 2,790 | 149 | ||||||
Nokia Oyj | 27,055 | 108 | ||||||
Orion Oyj, Cl B | 2,179 | 87 | ||||||
UPM-Kymmene Oyj, Cl V | 1,682 | 61 | ||||||
|
|
| ||||||
| 879 | ||||||||
|
|
| ||||||
France — 0.2% | ||||||||
Aeroports de Paris, Cl A | 373 | 45 | ||||||
Air Liquide SA | 839 | 137 | ||||||
Arkema SA | 736 | 89 | ||||||
Atos SE | 672 | 53 | ||||||
BioMerieux | 1,592 | 203 | ||||||
Bouygues SA | 892 | 36 | ||||||
Capgemini SE | 433 | 74 | ||||||
Carrefour SA | 6,251 | 113 | ||||||
Covivio ‡ | 434 | 37 | ||||||
Dassault Systemes SE | 328 | 70 | ||||||
Edenred | 1,268 | 66 | ||||||
Electricite de France SA | 8,558 | 115 | ||||||
Engie SA | 7,170 | 102 | ||||||
Getlink SE | 4,624 | 71 | ||||||
Iliad SA | 643 | 122 | ||||||
Ipsen SA | 596 | 51 | ||||||
Kering | 119 | 82 | ||||||
Legrand SA | 1,748 | 163 | ||||||
L’Oreal SA | 545 | 209 | ||||||
LVMH Moet Hennessy Louis Vuitton SE | 84 | 56 | ||||||
Natixis SA | 15,647 | 75 | ||||||
Orange SA | 24,112 | 298 | ||||||
Orpea | 727 | 84 | ||||||
Pernod Ricard SA | 684 | 129 | ||||||
Publicis Groupe SA | 2,651 | 162 | ||||||
Remy Cointreau SA | 674 | 125 | ||||||
Sanofi | 904 | 90 | ||||||
SCOR SE | 1,457 | 50 | ||||||
Sodexo SA | 1,245 | 120 | ||||||
STMicroelectronics NV | 1,562 | 60 | ||||||
Suez | 7,348 | 156 | ||||||
| SEI Institutional Managed Trust / Semi-Annual Report / March 31, 2021 | 177 |
CONSOLIDATED SCHEDULE OF INVESTMENTS (Unaudited)
March 31, 2021
Multi-Asset Accumulation Fund (Continued)
| Description | Shares | Market Value ($ Thousands) | ||||||
FOREIGN COMMON STOCK (continued) |
| |||||||
Thales SA, Cl A | 220 | $ | 22 | |||||
TOTAL SA | 2,344 | 110 | ||||||
Ubisoft Entertainment SA * | 1,282 | 98 | ||||||
Valeo SA | 1,298 | 44 | ||||||
Veolia Environnement SA | 5,206 | 134 | ||||||
Vinci SA | 720 | 74 | ||||||
Vivendi SA | 5,328 | 175 | ||||||
Wendel SA | 480 | 60 | ||||||
Worldline SA/France *(C) | 865 | 73 | ||||||
|
|
| ||||||
| 4,033 | ||||||||
|
|
| ||||||
Germany — 0.1% | ||||||||
adidas AG | 308 | 96 | ||||||
Allianz SE | 347 | 89 | ||||||
Beiersdorf AG | 1,765 | 187 | ||||||
Brenntag AG | 810 | 69 | ||||||
Carl Zeiss Meditec AG | 1,160 | 175 | ||||||
Commerzbank AG | 2,444 | 15 | ||||||
Continental AG | 286 | 38 | ||||||
Covestro AG | 1,507 | 102 | ||||||
Delivery Hero SE * | 598 | 78 | ||||||
Deutsche Boerse AG | 198 | 33 | ||||||
Deutsche Telekom AG | 6,455 | 130 | ||||||
Deutsche Wohnen SE ‡ | 1,750 | 82 | ||||||
E.ON SE | 13,577 | 158 | ||||||
GEA Group AG | 1,568 | 64 | ||||||
Hannover Rueck SE | 313 | 57 | ||||||
HeidelbergCement AG | 879 | 80 | ||||||
Henkel AG & Co KGaA | 1,543 | 153 | ||||||
Infineon Technologies AG | 1,964 | 84 | ||||||
Merck KGaA | 757 | 130 | ||||||
Muenchener Rueckversicherungs- Gesellschaft AG in Muenchen | 274 | 85 | ||||||
QIAGEN NV * | 3,235 | 157 | ||||||
RWE AG | 3,275 | 129 | ||||||
Siemens Healthineers AG (C) | 1,867 | 101 | ||||||
Symrise AG, Cl A | 1,058 | 129 | ||||||
TeamViewer *(C) | 1,526 | 65 | ||||||
Telefonica Deutschland Holding AG | 34,091 | 100 | ||||||
Uniper SE | 3,925 | 143 | ||||||
United Internet AG | 1,752 | 70 | ||||||
Volkswagen AG | 147 | 53 | ||||||
Zalando SE * | 783 | 77 | ||||||
|
|
| ||||||
| 2,929 | ||||||||
|
|
| ||||||
Hong Kong — 0.1% | ||||||||
AIA Group Ltd | 6,600 | 80 | ||||||
ASM Pacific Technology Ltd | 10,328 | 132 | ||||||
Budweiser Brewing APAC | 35,200 | 105 | ||||||
CK Asset Holdings Ltd ‡ | 5,708 | 35 | ||||||
CK Hutchison Holdings Ltd | 28,208 | 225 | ||||||
CK Infrastructure Holdings Ltd | 22,000 | 131 | ||||||
| Description | Shares | Market Value ($ Thousands) | ||||||
FOREIGN COMMON STOCK (continued) |
| |||||||
CLP Holdings Ltd, Cl B | 35,338 | $ | 343 | |||||
Galaxy Entertainment Group Ltd | 10,000 | 90 | ||||||
HK Electric Investments & HK Electric Investments Ltd | 290,000 | 288 | ||||||
HKT Trust & HKT Ltd | 208,010 | 296 | ||||||
Hong Kong & China Gas Co Ltd | 137,714 | 218 | ||||||
Melco Resorts & Entertainment Ltd ADR | 3,036 | 60 | ||||||
PCCW Ltd | 286,649 | 161 | ||||||
Power Assets Holdings Ltd | 44,474 | 263 | ||||||
SJM Holdings Ltd | 33,000 | 43 | ||||||
Swire Properties Ltd ‡ | 18,400 | 57 | ||||||
Techtronic Industries Co Ltd | 6,501 | 111 | ||||||
WH Group Ltd | 111,000 | 90 | ||||||
Wynn Macau Ltd | 27,600 | 54 | ||||||
|
|
| ||||||
| 2,782 | ||||||||
|
|
| ||||||
Ireland — 0.0% | ||||||||
CRH PLC | 355 | 17 | ||||||
Flutter Entertainment PLC | 353 | 76 | ||||||
James Hardie Industries PLC | 2,747 | 83 | ||||||
Kerry Group PLC, Cl A | 1,065 | 134 | ||||||
|
|
| ||||||
| 310 | ||||||||
|
|
| ||||||
Israel — 0.0% | ||||||||
Azrieli Group Ltd ‡ | 1,204 | 74 | ||||||
Bank Leumi Le-Israel BM * | 11,928 | 79 | ||||||
Elbit Systems Ltd | 527 | 75 | ||||||
Nice Ltd * | 238 | 52 | ||||||
Teva Pharmaceutical Industries Ltd ADR * | 5,833 | 67 | ||||||
|
|
| ||||||
| 347 | ||||||||
|
|
| ||||||
Italy — 0.1% | ||||||||
Assicurazioni Generali SpA | 5,334 | 107 | ||||||
Atlantia SpA | 3,095 | 58 | ||||||
Ferrari NV | 156 | 33 | ||||||
Infrastrutture Wireless Italiane | 16,564 | 185 | ||||||
Intesa Sanpaolo SpA | 22,601 | 61 | ||||||
Moncler SpA | 390 | 22 | ||||||
Nexi * | 4,854 | 85 | ||||||
Poste Italiane SpA | 8,102 | 103 | ||||||
Prysmian SpA | 903 | 29 | ||||||
Recordati SpA | 3,108 | 168 | ||||||
Snam SpA | 34,507 | 192 | ||||||
Telecom Italia SpA/Milano | 154,497 | 84 | ||||||
Tenaris SA | 3,361 | 38 | ||||||
Terna Rete Elettrica Nazionale SpA | 30,067 | 227 | ||||||
|
|
| ||||||
| 1,392 | ||||||||
|
|
| ||||||
Japan — 1.0% | ||||||||
ABC-Mart Inc, Cl H | 1,500 | 85 | ||||||
Advantest Corp | 1,200 | 105 | ||||||
Aeon Co Ltd, Cl H | 7,400 | 221 | ||||||
| 178 | SEI Institutional Managed Trust / Semi-Annual Report / March 31, 2021 |
| Description | Shares | Market Value ($ Thousands) | ||||||
FOREIGN COMMON STOCK (continued) |
| |||||||
Air Water Inc | 6,100 | $ | 107 | |||||
Aisin Seiki Co Ltd | 1,500 | 57 | ||||||
Ajinomoto Co Inc | 30,600 | 627 | ||||||
Alfresa Holdings Corp | 6,100 | 118 | ||||||
ANA Holdings Inc | 5,500 | 128 | ||||||
Asahi Group Holdings Ltd | 2,900 | 122 | ||||||
Asahi Intecc Co Ltd | 3,700 | 102 | ||||||
Asahi Kasei Corp | 9,000 | 104 | ||||||
Astellas Pharma Inc | 6,600 | 102 | ||||||
Bandai Namco Holdings Inc | 800 | 57 | ||||||
Bank of Kyoto Ltd/The | 300 | 19 | ||||||
Calbee Inc | 7,900 | 202 | ||||||
Canon Inc | 1,900 | 43 | ||||||
Casio Computer | 4,900 | 92 | ||||||
Central Japan Railway Co | 400 | 60 | ||||||
Chiba Bank Ltd/The, Cl B | 2,600 | 17 | ||||||
Chubu Electric Power Co Inc | 34,100 | 440 | ||||||
Chugai Pharmaceutical Co Ltd | 2,700 | 110 | ||||||
Chugoku Electric Power Co Inc/The | 88,300 | 1,086 | ||||||
Coca-Cola Bottlers Japan Inc | 8,200 | 143 | ||||||
Concordia Financial Group Ltd | 18,000 | 73 | ||||||
CyberAgent Inc | 12,800 | 231 | ||||||
Dai Nippon Printing Co Ltd | 3,300 | 69 | ||||||
Dai-ichi Life Holdings | 5,400 | 93 | ||||||
Daiichi Sankyo Co Ltd | 3,300 | 96 | ||||||
Daito Trust Construction Co Ltd | 900 | 105 | ||||||
Daiwa House Industry Co Ltd ‡ | 2,400 | 70 | ||||||
Daiwa House Investment Corp ‡ | 42 | 113 | ||||||
Dentsu Group Inc | 3,500 | 112 | ||||||
Disco | 500 | 157 | ||||||
Eisai Co Ltd | 2,000 | 134 | ||||||
FUJIFILM Holdings Corp | 3,500 | 208 | ||||||
GLP J-Reit ‡ | 44 | 72 | ||||||
GMO Payment Gateway Inc | 600 | 80 | ||||||
Hakuhodo DY Holdings Inc | 3,400 | 57 | ||||||
Hamamatsu Photonics | 1,500 | 89 | ||||||
Hankyu Hanshin Holdings Inc | 3,600 | 115 | ||||||
Hino Motors Ltd | 8,200 | 71 | ||||||
Hirose Electric Co Ltd | 882 | 136 | ||||||
Hisamitsu Pharmaceutical | 1,700 | 111 | ||||||
Hitachi Metals Ltd | 3,300 | 54 | ||||||
Hoya Corp | 800 | 94 | ||||||
Ibiden | 1,500 | 69 | ||||||
Idemitsu Kosan Co Ltd | 12,498 | 323 | ||||||
Iida Group Holdings | 5,600 | 136 | ||||||
Inpex Corp | 19,800 | 135 | ||||||
IT Holdings | 4,800 | 115 | ||||||
Ito En | 2,900 | 178 | ||||||
ITOCHU Corp | 3,700 | 120 | ||||||
Itochu Techno-Solutions Corp | 2,800 | 90 | ||||||
Japan Metropolitan Fund Invest, Cl A ‡ | 64 | 66 | ||||||
Japan Post Bank Co Ltd | 7,900 | 76 | ||||||
| Description | Shares | Market Value ($ Thousands) | ||||||
FOREIGN COMMON STOCK (continued) |
| |||||||
Japan Real Estate Investment Corp ‡ | 53 | $ | 313 | |||||
Japan Tobacco Inc | 6,700 | 129 | ||||||
JFE Holdings | 14,700 | 181 | ||||||
JSR Corp | 3,200 | 97 | ||||||
JXTG Holdings Inc | 57,300 | 260 | ||||||
Kakaku.com Inc | 4,300 | 118 | ||||||
Kansai Electric Power Co Inc/The | 64,000 | 694 | ||||||
Kansai Paint Co Ltd | 3,000 | 80 | ||||||
Kao Corp | 1,800 | 119 | ||||||
KDDI Corp | 8,800 | 270 | ||||||
Keikyu Corp | 4,000 | 60 | ||||||
Keio Corp | 1,600 | 108 | ||||||
Keyence | 200 | 91 | ||||||
Kikkoman Corp | 900 | 54 | ||||||
Kirin Holdings Co Ltd | 6,000 | 115 | ||||||
Kobe Bussan | 3,500 | 94 | ||||||
Komatsu Ltd | 7,000 | 217 | ||||||
Konami Holdings Corp | 3,000 | 179 | ||||||
Kose | 900 | 128 | ||||||
Kubota | 900 | 21 | ||||||
Kyocera Corp | 1,500 | 95 | ||||||
Kyowa Hakko Kirin Co Ltd | 6,200 | 186 | ||||||
Kyushu Electric Power Co Inc | 37,800 | 374 | ||||||
Lasertec Corp | 700 | 92 | ||||||
Lawson Inc | 8,000 | 393 | ||||||
LIXIL Group Corp | 3,000 | 83 | ||||||
M3 Inc | 1,200 | 82 | ||||||
Marubeni Corp | 14,900 | 124 | ||||||
Marui Group | 6,700 | 126 | ||||||
McDonald’s Holdings Co Japan Ltd | 1,723 | 80 | ||||||
Medipal Holdings Corp | 6,800 | 131 | ||||||
MEIJI Holdings Co Ltd | 2,000 | 129 | ||||||
Mercari * | 1,200 | 55 | ||||||
Mitsubishi Chemical Holdings Corp, Cl B | 20,700 | 155 | ||||||
Mitsui Chemicals Inc | 1,800 | 57 | ||||||
Mitsui Fudosan Co Ltd ‡ | 2,500 | 57 | ||||||
Murata Manufacturing Co Ltd | 1,500 | 120 | ||||||
Nabtesco Corp | 1,500 | 69 | ||||||
Nagoya Railroad Co Ltd | 3,100 | 74 | ||||||
NEC Corp | 3,300 | 195 | ||||||
NGK Spark Plug Co Ltd | 5,500 | 95 | ||||||
NH Foods Ltd | 3,800 | 163 | ||||||
Nintendo Co Ltd | 204 | 114 | ||||||
Nippon Building Fund Inc ‡ | 43 | 253 | ||||||
Nippon Paint Holdings | 4,000 | 58 | ||||||
Nippon Prologis Inc ‡ | 40 | 129 | ||||||
Nippon Shinyaku | 2,300 | 171 | ||||||
Nippon Telegraph & Telephone Corp | 11,200 | 288 | ||||||
Nissan Chemical | 1,600 | 86 | ||||||
Nisshin Seifun Group Inc | 15,415 | 258 | ||||||
Nissin Foods Holdings Co Ltd | 2,000 | 149 | ||||||
Nitori Holdings | 400 | 78 | ||||||
| SEI Institutional Managed Trust / Semi-Annual Report / March 31, 2021 | 179 |
CONSOLIDATED SCHEDULE OF INVESTMENTS (Unaudited)
March 31, 2021
Multi-Asset Accumulation Fund (Continued)
| Description | Shares | Market Value ($ Thousands) | ||||||
FOREIGN COMMON STOCK (continued) |
| |||||||
Nomura Real Estate Master Fund ‡ | 44 | $ | 66 | |||||
Nomura Research Institute Ltd | 2,934 | 91 | ||||||
NTT Data Corp | 10,000 | 155 | ||||||
Obic Co Ltd | 300 | 55 | ||||||
Odakyu Electric Railway Co Ltd | 3,300 | 90 | ||||||
Oji Holdings Corp | 22,200 | 144 | ||||||
Olympus | 6,000 | 124 | ||||||
Ono Pharmaceutical Co Ltd | 3,800 | 99 | ||||||
Oracle Corp Japan | 1,200 | 117 | ||||||
Oriental Land | 300 | 45 | ||||||
Orix JREIT Inc ‡ | 51 | 89 | ||||||
Osaka Gas Co Ltd | 22,700 | 443 | ||||||
Otsuka Corp | 2,000 | 94 | ||||||
Otsuka Holdings Co Ltd | 2,600 | 110 | ||||||
Pan Pacific International Holdings Corp | 10,600 | 250 | ||||||
PeptiDream Inc * | 1,665 | 76 | ||||||
Pigeon | 3,500 | 133 | ||||||
Pola Orbis Holdings Inc | 3,200 | 77 | ||||||
Rakuten Group | 8,100 | 97 | ||||||
Ricoh Co Ltd | 5,000 | 51 | ||||||
Rohm Co Ltd | 1,200 | 117 | ||||||
Ryohin Keikaku Co Ltd | 4,000 | 95 | ||||||
Santen Pharmaceutical Co Ltd | 10,500 | 145 | ||||||
SCSK | 1,200 | 71 | ||||||
Sega Sammy Holdings Inc | 7,600 | 119 | ||||||
Seibu Holdings Inc | 8,600 | 95 | ||||||
Seven & i Holdings Co Ltd | 5,800 | 234 | ||||||
Sharp | 3,900 | 67 | ||||||
Shimadzu Corp | 2,800 | 101 | ||||||
Shimamura Co Ltd | 700 | 81 | ||||||
Shimano | 300 | 72 | ||||||
Shimizu Corp | 8,200 | 66 | ||||||
Shiseido Co Ltd | 2,300 | 154 | ||||||
Shizuoka Bank Ltd/The | 12,000 | 94 | ||||||
SoftBank Group Corp | 1,300 | 110 | ||||||
Sohgo Security Services | 3,300 | 156 | ||||||
Sompo Holdings | 2,100 | 81 | ||||||
Sony Group | 1,200 | 126 | ||||||
Square Enix Holdings Co Ltd | 1,700 | 95 | ||||||
Subaru Corp | 4,000 | 80 | ||||||
SUMCO Corp | 3,800 | 87 | ||||||
Sumitomo Corp | 6,500 | 93 | ||||||
Sumitomo Dainippon Pharma Co Ltd | 7,800 | 136 | ||||||
Sumitomo Metal Mining | 1,000 | 43 | ||||||
Suntory Beverage & Food Ltd | 4,700 | 175 | ||||||
Suzuken Co Ltd/Aichi Japan | 6,100 | 239 | ||||||
Sysmex Corp | 1,400 | 151 | ||||||
T&D Holdings | 7,300 | 94 | ||||||
Taisei Corp | 2,300 | 89 | ||||||
Taisho Pharmaceutical Holdings Co Ltd | 1,900 | 123 | ||||||
Taiyo Nippon Sanso Corp | 5,000 | 95 | ||||||
Takeda Pharmaceutical Co Ltd | 4,318 | 156 | ||||||
| Description | Shares | Market Value ($ Thousands) | ||||||
FOREIGN COMMON STOCK (continued) |
| |||||||
TDK Corp | 700 | $ | 97 | |||||
Teijin Ltd | 6,400 | 110 | ||||||
Terumo Corp | 4,300 | 156 | ||||||
Toho Co Ltd/Tokyo | 3,600 | 146 | ||||||
Toho Gas Co Ltd | 5,312 | 328 | ||||||
Tohoku Electric Power Co Inc | 42,500 | 402 | ||||||
Tokio Marine Holdings Inc | 2,300 | 110 | ||||||
Tokyo Electric Power Co Holdings Inc * | 108,600 | 363 | ||||||
Tokyo Electron | 200 | 85 | ||||||
Tokyo Gas Co Ltd | 26,800 | 597 | ||||||
Tokyu Corp | 2,200 | 29 | ||||||
Toray Industries Inc | 10,000 | 64 | ||||||
Tosoh Corp | 5,500 | 105 | ||||||
TOTO Ltd | 1,000 | 62 | ||||||
Toyo Suisan Kaisha Ltd | 5,600 | 236 | ||||||
Toyota Industries Corp | 1,900 | 170 | ||||||
Toyota Motor Corp | 1,700 | 133 | ||||||
Trend Micro Inc/Japan | 3,400 | 170 | ||||||
Unicharm Corp | 3,600 | 151 | ||||||
United Urban Investment Corp ‡ | 66 | 89 | ||||||
Yakult Honsha Co Ltd | 2,900 | 147 | ||||||
Yamaha | 1,600 | 87 | ||||||
Yamato Holdings Co Ltd | 3,700 | 102 | ||||||
Yamazaki Baking Co Ltd | 27,600 | 447 | ||||||
Yokogawa Electric | 2,300 | 42 | ||||||
Z Holdings Corp | 17,700 | 88 | ||||||
|
|
| ||||||
| 26,204 | ||||||||
|
|
| ||||||
Netherlands — 0.1% | ||||||||
ABN AMRO Bank NV | 4,803 | 59 | ||||||
Adyen NV * | 34 | 76 | ||||||
Aegon NV | 17,146 | 82 | ||||||
Akzo Nobel NV | 447 | 50 | ||||||
ArcelorMittal SA | 3,503 | 101 | ||||||
ASML Holding NV | 100 | 61 | ||||||
Galapagos * | 800 | 62 | ||||||
Koninklijke Ahold Delhaize NV | 3,412 | 95 | ||||||
Koninklijke DSM NV | 490 | 83 | ||||||
Koninklijke KPN NV | 54,612 | 186 | ||||||
Koninklijke Philips NV | 2,715 | 155 | ||||||
Koninklijke Vopak NV | 7,020 | 350 | ||||||
Prosus NV | 898 | 100 | ||||||
Wolters Kluwer NV | 2,040 | 178 | ||||||
|
|
| ||||||
| 1,638 | ||||||||
|
|
| ||||||
New Zealand — 0.0% | ||||||||
a2 Milk Co Ltd * | 5,550 | 34 | ||||||
Auckland International Airport Ltd | 16,947 | 93 | ||||||
Fisher & Paykel Healthcare Corp Ltd | 8,997 | 202 | ||||||
Mercury NZ Ltd | 15,400 | 70 | ||||||
| 180 | SEI Institutional Managed Trust / Semi-Annual Report / March 31, 2021 |
| Description | Shares | Market Value ($ Thousands) | ||||||
FOREIGN COMMON STOCK (continued) |
| |||||||
Spark New Zealand Ltd | 35,401 | $ | 111 | |||||
|
|
| ||||||
| 510 | ||||||||
|
|
| ||||||
Norway — 0.0% | ||||||||
Adevinta, Cl B * | 4,613 | 68 | ||||||
Equinor ASA | 8,101 | 159 | ||||||
Gjensidige Forsikring ASA | 6,791 | 160 | ||||||
Norsk Hydro ASA | 31,213 | 200 | ||||||
Schibsted, Cl A | 1,345 | 56 | ||||||
Telenor ASA | 9,091 | 160 | ||||||
Yara International ASA | 3,013 | 157 | ||||||
|
|
| ||||||
| 960 | ||||||||
|
|
| ||||||
Portugal — 0.0% | ||||||||
Banco Espirito Santo SA * | 50,830 | — | ||||||
EDP - Energias de Portugal SA | 33,777 | 193 | ||||||
Galp Energia SGPS SA | 16,599 | 194 | ||||||
Jeronimo Martins SGPS SA | 3,401 | 57 | ||||||
|
|
| ||||||
| 444 | ||||||||
|
|
| ||||||
Singapore — 0.1% | ||||||||
CapitaLand Ltd ‡ | 53,100 | 148 | ||||||
CapitaLand Mall Trust ‡ | 73,740 | 119 | ||||||
City Developments Ltd | 7,600 | 45 | ||||||
Genting Singapore Ltd | 158,200 | 108 | ||||||
Jardine Matheson Holdings Ltd | 1,864 | 122 | ||||||
Jardine Strategic Holdings Ltd | 2,900 | 96 | ||||||
Oversea-Chinese Banking Corp Ltd | 2,700 | 24 | ||||||
Singapore Airlines Ltd | 31,000 | 128 | ||||||
Singapore Technologies Engineering Ltd | 25,400 | 74 | ||||||
Singapore Telecommunications Ltd | 26,400 | 48 | ||||||
Venture Corp Ltd | 4,500 | 67 | ||||||
Wilmar International Ltd | 44,800 | 181 | ||||||
|
|
| ||||||
| 1,160 | ||||||||
|
|
| ||||||
Spain — 0.1% | ||||||||
Aena SME SA | 513 | 83 | ||||||
Cellnex Telecom SA | 1,977 | 114 | ||||||
Enagas SA | 5,776 | 126 | ||||||
Endesa SA | 5,109 | 136 | ||||||
Ferrovial SA | 1,532 | 40 | ||||||
Grifols SA | 5,142 | 135 | ||||||
Iberdrola SA | 12,650 | 163 | ||||||
Industria de Diseno Textil SA | 3,329 | 110 | ||||||
Naturgy Energy Group SA | 5,272 | 130 | ||||||
Red Electrica Corp SA | 12,580 | 223 | ||||||
Repsol SA, Cl A | 8,569 | 106 | ||||||
Siemens Gamesa Renewable Energy SA | 1,571 | 61 | ||||||
Telefonica SA | 11,895 | 53 | ||||||
|
|
| ||||||
| 1,480 | ||||||||
|
|
| ||||||
| Description | Shares | Market Value ($ Thousands) | ||||||
FOREIGN COMMON STOCK (continued) |
| |||||||
Sweden — 0.1% | ||||||||
Atlas Copco AB, Cl A | 345 | $ | 21 | |||||
Boliden AB | 2,335 | 87 | ||||||
Electrolux AB | 3,309 | 92 | ||||||
Epiroc AB, Cl A | 2,231 | 51 | ||||||
Epiroc AB, Cl B | 1,891 | 40 | ||||||
Essity AB, Cl B | 1,340 | 42 | ||||||
H & M Hennes & Mauritz, Cl B | 3,456 | 78 | ||||||
ICA Gruppen AB | 3,041 | 149 | ||||||
Industrivarden AB, Cl C | 4,865 | 171 | ||||||
Kinnevik | 1,565 | 76 | ||||||
Lundin Petroleum AB | 5,244 | 165 | ||||||
Nordea Bank Abp * | 6,982 | 69 | ||||||
Skandinaviska Enskilda Banken AB, Cl A | 7,936 | 97 | ||||||
Svenska Cellulosa AB SCA, Cl B | 4,559 | 81 | ||||||
Svenska Handelsbanken AB, Cl A | 7,194 | 78 | ||||||
Swedbank AB, Cl A | 4,910 | 87 | ||||||
Swedish Match AB | 1,119 | 88 | ||||||
Tele2 AB, Cl B | 8,542 | 115 | ||||||
Telefonaktiebolaget LM Ericsson, Cl B | 10,512 | 139 | ||||||
Telia Co AB | 21,669 | 94 | ||||||
|
|
| ||||||
| 1,820 | ||||||||
|
|
| ||||||
Switzerland — 0.1% | ||||||||
Adecco Group AG | 1,187 | 80 | ||||||
Baloise Holding AG | 496 | 85 | ||||||
Barry Callebaut AG | 104 | 236 | ||||||
Chocoladefabriken Lindt & Spruengli AG | 1 | 92 | ||||||
Cie Financiere Richemont SA, Cl A | 1,317 | 127 | ||||||
Geberit AG | 215 | 137 | ||||||
Givaudan SA | 26 | 101 | ||||||
LafargeHolcim Ltd | 1,540 | 91 | ||||||
Lonza Group AG | 163 | 92 | ||||||
Nestle SA | 1,850 | 207 | ||||||
Partners Group Holding AG | 76 | 97 | ||||||
Roche Holding AG | 524 | 170 | ||||||
Schindler Holding AG | 179 | 52 | ||||||
SGS SA, Cl B | 41 | 117 | ||||||
Sika AG | 195 | 56 | ||||||
Sonova Holding AG | 307 | 82 | ||||||
Straumann Holding AG | 58 | 73 | ||||||
Swatch Group AG/The, Cl B | 358 | 103 | ||||||
Swiss Life Holding AG | 180 | 89 | ||||||
Swiss Prime Site AG ‡ | 588 | 54 | ||||||
Swisscom AG | 788 | 424 | ||||||
Temenos AG | 552 | 80 | ||||||
UBS Group AG | 5,937 | 92 | ||||||
Vifor Pharma AG | 505 | 69 | ||||||
Zurich Insurance Group AG | 87 | 37 | ||||||
|
|
| ||||||
| 2,843 | ||||||||
|
|
| ||||||
| SEI Institutional Managed Trust / Semi-Annual Report / March 31, 2021 | 181 |
CONSOLIDATED SCHEDULE OF INVESTMENTS (Unaudited)
March 31, 2021
Multi-Asset Accumulation Fund (Continued)
| Description | Shares | Market Value ($ Thousands) | ||||||
FOREIGN COMMON STOCK (continued) |
| |||||||
United Kingdom — 0.2% | ||||||||
Admiral Group PLC | 1,718 | $ | 74 | |||||
Anglo American PLC | 1,722 | 68 | ||||||
Antofagasta PLC | 4,517 | 105 | ||||||
Aon PLC, Cl A | 234 | 54 | ||||||
Associated British Foods PLC | 2,191 | 73 | ||||||
AstraZeneca PLC | 1,317 | 132 | ||||||
Auto Trader Group PLC | 16,934 | 130 | ||||||
AVEVA Group | 1,393 | 66 | ||||||
Barratt Developments PLC | 2,222 | 23 | ||||||
Berkeley Group Holdings PLC | 1,325 | 81 | ||||||
BHP Group | 3,324 | 96 | ||||||
BP PLC | 43,552 | 177 | ||||||
British American Tobacco PLC | 1,681 | 64 | ||||||
BT Group PLC, Cl A | 64,702 | 138 | ||||||
Bunzl PLC | 3,000 | 96 | ||||||
Burberry Group PLC | 2,826 | 74 | ||||||
Coca-Cola European Partners PLC | 1,665 | 87 | ||||||
Coca-Cola HBC AG | 3,429 | 109 | ||||||
Compass Group PLC | 3,169 | 64 | ||||||
DCC PLC | 1,122 | 97 | ||||||
Diageo PLC | 2,888 | 119 | ||||||
Experian PLC | 2,610 | 90 | ||||||
GlaxoSmithKline PLC | 6,114 | 109 | ||||||
Halma PLC | 5,482 | 180 | ||||||
Hikma Pharmaceuticals PLC | 4,056 | 127 | ||||||
HSBC Holdings PLC | 22,379 | 131 | ||||||
Imperial Brands PLC | 3,182 | 66 | ||||||
Informa PLC | 13,266 | 102 | ||||||
InterContinental Hotels Group PLC | 1,158 | 79 | ||||||
J Sainsbury PLC | 33,428 | 112 | ||||||
Johnson Matthey PLC | 1,866 | 78 | ||||||
Kingfisher PLC | 20,403 | 90 | ||||||
Linde PLC | 660 | 185 | ||||||
National Grid PLC | 15,406 | 184 | ||||||
NMC Health PLC * | 12,179 | 1 | ||||||
Ocado Group PLC * | 1,150 | 32 | ||||||
Pearson PLC | 15,495 | 165 | ||||||
Persimmon PLC | 1,353 | 55 | ||||||
Reckitt Benckiser Group PLC | 405 | 36 | ||||||
RELX PLC | 3,034 | 76 | ||||||
Rio Tinto PLC | 815 | 62 | ||||||
Rolls-Royce Holdings PLC | 19,553 | 28 | ||||||
Royal Dutch Shell PLC, Cl A | 4,518 | 88 | ||||||
Royal Dutch Shell PLC, Cl B | 2,304 | 42 | ||||||
Sage Group PLC/The | 12,410 | 105 | ||||||
Severn Trent PLC | 2,894 | 92 | ||||||
Smith & Nephew PLC | 7,784 | 148 | ||||||
Smiths Group PLC | 3,056 | 65 | ||||||
Smurfit Kappa Group PLC | 1,116 | 53 | ||||||
Spirax-Sarco Engineering | 249 | 39 | ||||||
SSE PLC | 8,543 | 171 | ||||||
| Description | Shares | Market Value ($ Thousands) | ||||||
FOREIGN COMMON STOCK (continued) |
| |||||||
Trane Technologies PLC | 641 | $ | 106 | |||||
Unilever PLC | 292 | 16 | ||||||
United Utilities Group PLC, Cl B | 14,303 | 183 | ||||||
Vodafone Group PLC | 67,936 | 124 | ||||||
Whitbread PLC | 1,095 | 52 | ||||||
Wm Morrison Supermarkets PLC | 34,659 | 87 | ||||||
WPP PLC | 8,141 | 103 | ||||||
|
|
| ||||||
| 5,389 | ||||||||
|
|
| ||||||
Total Foreign Common Stock | 69,324 | |||||||
|
|
| ||||||
COMMON STOCK — 2.4% | ||||||||
Communication Services — 0.3% | ||||||||
Activision Blizzard Inc | 2,448 | 228 | ||||||
Alphabet Inc, Cl A *(A) | 115 | 237 | ||||||
AT&T Inc | 11,538 | 349 | ||||||
Capcom | 6,800 | 221 | ||||||
Charter Communications Inc, Cl A * | 355 | 219 | ||||||
Comcast Corp, Cl A | 4,650 | 252 | ||||||
Discovery Inc, Cl A * | 5,410 | 235 | ||||||
DISH Network Corp, Cl A * | 4,240 | 154 | ||||||
Electronic Arts Inc | 1,763 | 239 | ||||||
Facebook Inc, Cl A * | 839 | 247 | ||||||
Fox Corp | 6,025 | 210 | ||||||
Interpublic Group of Cos Inc/The | 10,256 | 300 | ||||||
Live Nation Entertainment Inc * | 2,226 | 188 | ||||||
Lumen Technologies Inc | 27,586 | 368 | ||||||
Netflix Inc * | 350 | 183 | ||||||
News Corp, Cl B | 11,316 | 266 | ||||||
Nexon Co Ltd | 5,800 | 188 | ||||||
Omnicom Group Inc | 4,808 | 356 | ||||||
Quebecor Inc, Cl B | 5,817 | 156 | ||||||
Scout24 | 1,869 | 142 | ||||||
Softbank Corp | 10,500 | 137 | ||||||
Take-Two Interactive Software Inc, Cl A * | 1,489 | 263 | ||||||
T-Mobile US Inc * | 2,109 | 264 | ||||||
TPG Telecom | 15,717 | 76 | ||||||
Twitter Inc * | 2,423 | 154 | ||||||
Verizon Communications Inc | 10,486 | 610 | ||||||
ViacomCBS Inc, Cl B | 2,272 | 102 | ||||||
Walt Disney Co/The | 1,361 | 251 | ||||||
|
|
| ||||||
| 6,595 | ||||||||
|
|
| ||||||
Consumer Discretionary — 0.2% | ||||||||
Advance Auto Parts Inc | 554 | 102 | ||||||
Amazon.com Inc, Cl A * | 29 | 90 | ||||||
Aptiv PLC * | 615 | 85 | ||||||
AutoZone Inc * | 63 | 88 | ||||||
Best Buy Co Inc | 879 | 101 | ||||||
| 182 | SEI Institutional Managed Trust / Semi-Annual Report / March 31, 2021 |
| Description | Shares | Market Value ($ Thousands) | ||||||
COMMON STOCK (continued) |
| |||||||
Booking Holdings Inc * | 33 | $ | 77 | |||||
BorgWarner Inc | 1,798 | 83 | ||||||
CarMax Inc * | 607 | 81 | ||||||
Chipotle Mexican Grill Inc, Cl A * | 60 | 85 | ||||||
Darden Restaurants Inc | 642 | 91 | ||||||
Dollar General Corp | 398 | 81 | ||||||
Dollar Tree Inc * | 704 | 81 | ||||||
Domino’s Pizza Inc | 229 | 84 | ||||||
DR Horton Inc | 1,517 | 135 | ||||||
eBay Inc | 1,485 | 91 | ||||||
Etsy Inc * | 261 | 53 | ||||||
Expedia Group Inc | 886 | 153 | ||||||
Faurecia * | 81 | 4 | ||||||
Ford Motor Co * | 6,979 | 85 | ||||||
Gap Inc/The | 1,693 | 50 | ||||||
General Motors Co | 1,328 | 76 | ||||||
Hanesbrands Inc | 5,402 | 106 | ||||||
Hasbro Inc | 959 | 92 | ||||||
HelloFresh * | 1,530 | 114 | ||||||
Hilton Worldwide Holdings Inc * | 1,035 | 125 | ||||||
Home Depot Inc/The | 344 | 105 | ||||||
L Brands Inc * | 1,468 | 91 | ||||||
Leggett & Platt Inc | 1,806 | 82 | ||||||
Lennar Corp, Cl A | 714 | 72 | ||||||
LKQ Corp * | 2,394 | 101 | ||||||
Lowe’s Cos Inc | 368 | 70 | ||||||
Marriott International Inc/MD, Cl A | 281 | 42 | ||||||
McDonald’s Corp | 63 | 14 | ||||||
MGM Resorts International | 631 | 24 | ||||||
Mohawk Industries Inc * | 714 | 137 | ||||||
Newell Brands Inc, Cl B | 3,837 | 103 | ||||||
NIKE Inc, Cl B | 338 | 45 | ||||||
O’Reilly Automotive Inc * | 186 | 94 | ||||||
PulteGroup Inc | 545 | 29 | ||||||
PVH Corp | 953 | 101 | ||||||
Ralph Lauren Corp, Cl A | 665 | 82 | ||||||
Ross Stores Inc | 854 | 102 | ||||||
Starbucks Corp | 1,082 | 118 | ||||||
Stellantis | 4,810 | 85 | ||||||
Tapestry Inc * | 2,823 | 116 | ||||||
Target Corp, Cl A | 521 | 103 | ||||||
Tesla Inc * | 46 | 31 | ||||||
TJX Cos Inc/The | 1,474 | 98 | ||||||
Tractor Supply Co | 712 | 126 | ||||||
Ulta Beauty Inc * | 141 | 44 | ||||||
Under Armour Inc, Cl A * | 2,909 | 64 | ||||||
VF Corp | 958 | 77 | ||||||
Whirlpool Corp | 398 | 88 | ||||||
Wynn Resorts Ltd | 363 | 46 | ||||||
Yamada Denki Co Ltd | 12,900 | 70 | ||||||
Yum! Brands Inc | 758 | 82 | ||||||
| Description | Shares | Market Value ($ Thousands) | ||||||
COMMON STOCK (continued) |
| |||||||
ZOZO Inc | 2,500 | $ | 74 | |||||
|
|
| ||||||
| 4,729 | ||||||||
|
|
| ||||||
Consumer Staples — 0.3% | ||||||||
Altria Group Inc | 3,669 | 188 | ||||||
Archer-Daniels-Midland Co | 2,936 | 167 | ||||||
Brown-Forman Corp, Cl B | 1,763 | 122 | ||||||
Campbell Soup Co | 7,410 | 373 | ||||||
Church & Dwight Co Inc | 2,077 | 181 | ||||||
Clorox Co/The | 1,065 | 205 | ||||||
Coca-Cola Co/The | 3,032 | 160 | ||||||
Coles Group Ltd | 5,570 | 68 | ||||||
Colgate-Palmolive Co | 3,689 | 291 | ||||||
Conagra Brands Inc | 4,939 | 186 | ||||||
Constellation Brands Inc, Cl A | 1,139 | 260 | ||||||
Cosmos Pharmaceutical Corp | 700 | 109 | ||||||
Costco Wholesale Corp | 479 | 169 | ||||||
Estee Lauder Cos Inc/The, Cl A | 852 | 248 | ||||||
General Mills Inc | 5,970 | 366 | ||||||
Hershey Co/The | 1,347 | 213 | ||||||
Hormel Foods Corp | 9,195 | 439 | ||||||
J M Smucker Co/The | 2,772 | 351 | ||||||
Kellogg Co | 4,858 | 308 | ||||||
Kesko Oyj, Cl B | 4,597 | 141 | ||||||
Kimberly-Clark Corp | 2,081 | 289 | ||||||
Kobayashi Pharmaceutical | 1,800 | 168 | ||||||
Kraft Heinz Co/The | 4,956 | 198 | ||||||
Kroger Co/The | 6,207 | 223 | ||||||
Lamb Weston Holdings Inc | 2,378 | 184 | ||||||
Lion Corp | 12,000 | 234 | ||||||
McCormick & Co Inc/MD | 2,162 | 193 | ||||||
Molson Coors Beverage Co, Cl B | 3,119 | 160 | ||||||
Mondelez International Inc, Cl A | 3,684 | 216 | ||||||
Monster Beverage Corp * | 3,145 | 286 | ||||||
PepsiCo Inc | 1,095 | 155 | ||||||
Philip Morris International Inc | 2,561 | 227 | ||||||
Procter & Gamble Co/The | 2,075 | 281 | ||||||
Sundrug Co Ltd | 1,500 | 55 | ||||||
Sysco Corp, Cl A | 2,272 | 179 | ||||||
Tesco | 17,126 | 54 | ||||||
Tsuruha Holdings Inc | 900 | 116 | ||||||
Tyson Foods Inc, Cl A | 2,695 | 200 | ||||||
Unilever | 3,228 | 180 | ||||||
Walgreens Boots Alliance Inc | 4,466 | 245 | ||||||
Walmart Inc | 1,137 | 154 | ||||||
Welcia Holdings Co Ltd | 4,000 | 138 | ||||||
|
|
| ||||||
| 8,680 | ||||||||
|
|
| ||||||
Energy — 0.1% | ||||||||
APA Corp | 4,561 | 82 | ||||||
Baker Hughes Co, Cl A | 6,778 | 146 | ||||||
Cabot Oil & Gas Corp | 9,055 | 170 | ||||||
Chevron Corp | 1,364 | 143 | ||||||
| SEI Institutional Managed Trust / Semi-Annual Report / March 31, 2021 | 183 |
CONSOLIDATED SCHEDULE OF INVESTMENTS (Unaudited)
March 31, 2021
Multi-Asset Accumulation Fund (Continued)
| Description | Shares | Market Value ($ Thousands) | ||||||
COMMON STOCK (continued) |
| |||||||
ConocoPhillips | 8,119 | $ | 430 | |||||
Devon Energy Corp | 6,537 | 143 | ||||||
Diamondback Energy Inc, Cl A | 2,478 | 182 | ||||||
EOG Resources Inc | 2,533 | 184 | ||||||
Exxon Mobil Corp | 6,272 | 350 | ||||||
Hess Corp | 3,016 | 213 | ||||||
HollyFrontier Corp | 5,221 | 187 | ||||||
Kinder Morgan Inc | 8,358 | 139 | ||||||
Marathon Oil Corp | 17,930 | 192 | ||||||
Marathon Petroleum Corp | 842 | 45 | ||||||
NOV Inc | 9,602 | 132 | ||||||
ONEOK Inc | 2,048 | 104 | ||||||
Phillips 66 | 2,119 | 173 | ||||||
Pioneer Natural Resources Co | 950 | 151 | ||||||
Schlumberger NV, Cl A | 6,517 | 177 | ||||||
Valero Energy Corp | 2,323 | 166 | ||||||
Williams Cos Inc/The | 6,562 | 155 | ||||||
|
|
| ||||||
| 3,664 | ||||||||
|
|
| ||||||
Financials — 0.1% | ||||||||
Allstate Corp/The | 963 | 111 | ||||||
American International Group Inc | 273 | 13 | ||||||
Ameriprise Financial Inc | 518 | 120 | ||||||
Arthur J Gallagher & Co | 347 | 43 | ||||||
Assurant Inc | 976 | 138 | ||||||
Bank of America Corp | 1,088 | 42 | ||||||
Bank of New York Mellon Corp/The | 1,593 | 75 | ||||||
BlackRock Inc | 75 | 57 | ||||||
Capital One Financial Corp | 280 | 36 | ||||||
Cboe Global Markets Inc | 436 | 43 | ||||||
Charles Schwab Corp/The | 1,358 | 89 | ||||||
Chubb Ltd | 198 | 31 | ||||||
Cincinnati Financial Corp | 315 | 33 | ||||||
Citizens Financial Group Inc | 2,888 | 128 | ||||||
Discover Financial Services | 794 | 75 | ||||||
Equities | 570 | 19 | ||||||
Fifth Third Bancorp | 3,964 | 148 | ||||||
Franklin Resources Inc | 2,773 | 82 | ||||||
Globe Life Inc | 870 | 84 | ||||||
Goldman Sachs Group Inc/The | 156 | 51 | ||||||
Hartford Financial Services Group Inc/The | 671 | 45 | ||||||
Huntington Bancshares Inc/OH | 2,954 | 46 | ||||||
Intercontinental Exchange Inc | 482 | 54 | ||||||
Invesco Ltd | 3,850 | 97 | ||||||
Japan Post Holdings Co Ltd | 13,200 | 118 | ||||||
JPMorgan Chase & Co | 293 | 45 | ||||||
KeyCorp | 2,956 | 59 | ||||||
Loews Corp | 1,583 | 81 | ||||||
London Stock Exchange Group | 368 | 35 | ||||||
M&T Bank Corp | 598 | 91 | ||||||
MarketAxess Holdings Inc | 80 | 40 | ||||||
Marsh & McLennan Cos Inc | 634 | 77 | ||||||
MetLife Inc | 351 | 21 | ||||||
| Description | Shares | Market Value ($ Thousands) | ||||||
COMMON STOCK (continued) |
| |||||||
Morgan Stanley | 1,357 | $ | 105 | |||||
MSCI Inc, Cl A | 231 | 97 | ||||||
Nasdaq Inc, Cl A | 368 | 54 | ||||||
Nomura Holdings | 3,700 | 20 | ||||||
Northern Trust Corp | 370 | 39 | ||||||
ORIX | 6,600 | 112 | ||||||
People’s United Financial Inc | 7,837 | 140 | ||||||
PNC Financial Services Group Inc/The | 607 | 106 | ||||||
Principal Financial Group Inc, Cl A | 1,498 | 90 | ||||||
Progressive Corp/The | 529 | 51 | ||||||
Prudential Financial Inc | 736 | 67 | ||||||
Raymond James Financial Inc | 1,182 | 145 | ||||||
Regions Financial Corp | 3,285 | 68 | ||||||
State Street Corp | 770 | 65 | ||||||
SVB Financial Group, Cl B * | 177 | 87 | ||||||
Synchrony Financial | 2,695 | 110 | ||||||
T Rowe Price Group Inc | 327 | 56 | ||||||
Travelers Cos Inc/The | 101 | 15 | ||||||
US Bancorp | 2,336 | 129 | ||||||
Wells Fargo & Co | 1,682 | 66 | ||||||
Willis Towers Watson PLC | 490 | 112 | ||||||
|
|
| ||||||
| 3,961 | ||||||||
|
|
| ||||||
Health Care — 0.3% | ||||||||
Abbott Laboratories | 643 | 77 | ||||||
AbbVie Inc | 968 | 105 | ||||||
ABIOMED Inc * | 280 | 89 | ||||||
Agilent Technologies Inc | 1,033 | 131 | ||||||
Alcon Inc | 1,519 | 107 | ||||||
Alexion Pharmaceuticals Inc * | 503 | 77 | ||||||
Align Technology Inc * | 126 | 68 | ||||||
AmerisourceBergen Corp, Cl A | 593 | 70 | ||||||
Amgen Inc, Cl A | 646 | 161 | ||||||
Amplifon | 2,640 | 99 | ||||||
Anthem Inc | 269 | 97 | ||||||
Baxter International Inc | 1,597 | 135 | ||||||
Becton Dickinson and Co | 396 | 96 | ||||||
Biogen Inc * | 318 | 89 | ||||||
Bio-Rad Laboratories Inc, Cl A * | 142 | 81 | ||||||
Boston Scientific Corp * | 1,661 | 64 | ||||||
Bristol-Myers Squibb Co | 1,520 | 96 | ||||||
Cardinal Health Inc | 1,236 | 75 | ||||||
Centene Corp * | 1,160 | 74 | ||||||
Cerner Corp | 2,555 | 184 | ||||||
Cigna Corp | 272 | 66 | ||||||
Cooper Cos Inc/The, Cl A | 283 | 109 | ||||||
CVS Health Corp | 1,342 | 101 | ||||||
Danaher Corp, Cl A | 606 | 136 | ||||||
DaVita Inc * | 510 | 55 | ||||||
DENTSPLY SIRONA Inc | 1,707 | 109 | ||||||
Dexcom Inc * | 138 | 50 | ||||||
DiaSorin SpA | 1,134 | 182 | ||||||
Edwards Lifesciences Corp, Cl A * | 1,150 | 96 | ||||||
| 184 | SEI Institutional Managed Trust / Semi-Annual Report / March 31, 2021 |
| Description | Shares | Market Value ($ Thousands) | ||||||
COMMON STOCK (continued) | ||||||||
Eli Lilly and Co | 431 | $ | 80 | |||||
Eurofins Scientific | 990 | 95 | ||||||
Gilead Sciences Inc | 1,887 | 122 | ||||||
HCA Healthcare Inc | 406 | 76 | ||||||
Henry Schein Inc * | 950 | 66 | ||||||
Hologic Inc * | 720 | 54 | ||||||
Humana Inc | 183 | 77 | ||||||
IDEXX Laboratories Inc * | 187 | 91 | ||||||
Illumina Inc * | 236 | 91 | ||||||
Incyte Corp * | 941 | 76 | ||||||
Intuitive Surgical Inc * | 130 | 96 | ||||||
Johnson & Johnson | 1,720 | 283 | ||||||
Laboratory Corp of America Holdings * | 675 | 172 | ||||||
McKesson Corp | 787 | 153 | ||||||
Medtronic PLC | 1,787 | 211 | ||||||
Merck & Co Inc | 1,941 | 150 | ||||||
Mettler-Toledo International Inc * | 80 | 92 | ||||||
PerkinElmer Inc | 728 | 93 | ||||||
Perrigo Co PLC | 1,841 | 75 | ||||||
Pfizer Inc | 2,320 | 84 | ||||||
Quest Diagnostics Inc | 658 | 84 | ||||||
Regeneron Pharmaceuticals Inc * | 198 | 94 | ||||||
ResMed Inc | 368 | 71 | ||||||
Sartorius Stedim Biotech | 446 | 184 | ||||||
Shionogi & Co Ltd | 1,600 | 86 | ||||||
Stryker Corp | 346 | 84 | ||||||
Thermo Fisher Scientific Inc | 120 | 55 | ||||||
UnitedHealth Group Inc | 200 | 74 | ||||||
Universal Health Services Inc, Cl B | 971 | 130 | ||||||
Varian Medical Systems Inc * | 434 | 77 | ||||||
Vertex Pharmaceuticals Inc * | 533 | 115 | ||||||
Viatris Inc, Cl W * | 4,959 | 69 | ||||||
Waters Corp * | 259 | 74 | ||||||
West Pharmaceutical Services Inc | 276 | 78 | ||||||
Zimmer Biomet Holdings Inc | 639 | 102 | ||||||
Zoetis Inc, Cl A | 653 | 103 | ||||||
|
|
| ||||||
| 6,596 | ||||||||
|
|
| ||||||
Industrials — 0.2% | ||||||||
3M Co | 411 | 79 | ||||||
A O Smith Corp | 980 | 66 | ||||||
Alaska Air Group Inc | 511 | 35 | ||||||
Allegion PLC | 654 | 82 | ||||||
Amada Holdings | 10,600 | 118 | ||||||
AMETEK Inc | 926 | 118 | ||||||
Carrier Global Corp | 916 | 39 | ||||||
CH Robinson Worldwide Inc | 631 | 60 | ||||||
Cintas Corp | 146 | 50 | ||||||
Copart Inc * | 726 | 79 | ||||||
CSX Corp | 987 | 95 | ||||||
Cummins Inc | 289 | 75 | ||||||
Daifuku Co Ltd | 500 | 49 | ||||||
Delta Air Lines Inc, Cl A * | 1,126 | 54 | ||||||
| Description | Shares | Market Value ($ Thousands) | ||||||
COMMON STOCK (continued) | ||||||||
Dover Corp | 565 | $ | 78 | |||||
Eaton Corp PLC | 402 | 56 | ||||||
Emerson Electric Co | 986 | 89 | ||||||
Equifax Inc | 349 | 63 | ||||||
Expeditors International of Washington Inc | 870 | 94 | ||||||
Fastenal Co, Cl A | 1,178 | 59 | ||||||
Flowserve Corp | 1,578 | 61 | ||||||
Fortive Corp | 1,754 | 124 | ||||||
Fortune Brands Home & Security Inc | 492 | 47 | ||||||
General Dynamics Corp | 849 | 154 | ||||||
General Electric Co | 5,173 | 68 | ||||||
Hitachi Construction Machinery Co Ltd | 3,400 | 109 | ||||||
Honeywell International Inc | 255 | 55 | ||||||
Howmet Aerospace Inc | 2,374 | 76 | ||||||
Huntington Ingalls Industries Inc, Cl A | 251 | 52 | ||||||
IHS Markit Ltd | 978 | 95 | ||||||
Illinois Tool Works Inc | 606 | 134 | ||||||
Ingersoll Rand Inc * | 1,458 | 72 | ||||||
Jacobs Engineering Group Inc | 539 | 70 | ||||||
JB Hunt Transport Services Inc | 390 | 66 | ||||||
Johnson Controls International PLC | 3,007 | 180 | ||||||
Kansas City Southern | 477 | 126 | ||||||
Knorr-Bremse AG | 603 | 76 | ||||||
Kyushu Railway Co | 3,200 | 75 | ||||||
L3Harris Technologies Inc | 320 | 65 | ||||||
Lockheed Martin Corp | 186 | 69 | ||||||
Masco Corp | 1,288 | 77 | ||||||
MonotaRO | 1,800 | 49 | ||||||
Nielsen Holdings PLC | 2,219 | 56 | ||||||
Norfolk Southern Corp | 347 | 93 | ||||||
Northrop Grumman Corp | 381 | 123 | ||||||
NSK | 10,300 | 106 | ||||||
Otis Worldwide Corp | 879 | 60 | ||||||
PACCAR Inc | 370 | 34 | ||||||
Parker-Hannifin Corp, Cl A | 549 | 173 | ||||||
Pentair PLC | 1,382 | 86 | ||||||
Quanta Services Inc | 797 | 70 | ||||||
Rational | 61 | 48 | ||||||
Raytheon Technologies Corp | 905 | 70 | ||||||
Rentokil Initial | 12,011 | 80 | ||||||
Robert Half International Inc | 845 | 66 | ||||||
Rockwell Automation Inc | 289 | 77 | ||||||
Rollins Inc | 4,270 | 147 | ||||||
Snap-on Inc | 986 | 227 | ||||||
Southwest Airlines Co, Cl A | 1,959 | 120 | ||||||
Textron Inc | 2,178 | 122 | ||||||
TransDigm Group Inc * | 128 | 75 | ||||||
Union Pacific Corp | 229 | 51 | ||||||
United Parcel Service Inc, Cl B | 363 | 62 | ||||||
United Rentals Inc * | 170 | 56 | ||||||
Verisk Analytics Inc, Cl A | 884 | 156 | ||||||
Waste Management Inc | 830 | 107 | ||||||
| SEI Institutional Managed Trust / Semi-Annual Report / March 31, 2021 | 185 |
CONSOLIDATED SCHEDULE OF INVESTMENTS (Unaudited)
March 31, 2021
Multi-Asset Accumulation Fund (Continued)
| Description | Shares | Market Value ($ Thousands) | ||||||
COMMON STOCK (continued) |
| |||||||
Xinyi Glass Holdings | 30,000 | $ | 98 | |||||
Xylem Inc/NY | 691 | 73 | ||||||
|
|
| ||||||
| 5,774 | ||||||||
|
|
| ||||||
Information Technology — 0.2% |
| |||||||
Accenture PLC, Cl A | 286 | 79 | ||||||
Adobe Inc * | 91 | 43 | ||||||
Advanced Micro Devices Inc * | 498 | 39 | ||||||
Akamai Technologies Inc * | 831 | 85 | ||||||
Analog Devices Inc | 376 | 58 | ||||||
ANSYS Inc * | 69 | 23 | ||||||
Applied Materials Inc | 1,164 | 156 | ||||||
Arista Networks Inc * | 322 | 97 | ||||||
Autodesk Inc, Cl A * | 232 | 64 | ||||||
Automatic Data Processing Inc | 263 | 50 | ||||||
Broadcom Inc | 192 | 89 | ||||||
Cadence Design Systems Inc * | 1,227 | 168 | ||||||
Check Point Software Technologies Ltd * | 1,215 | 136 | ||||||
Cisco Systems Inc/Delaware | 2,109 | 109 | ||||||
Citrix Systems Inc | 455 | 64 | ||||||
Cognizant Technology Solutions Corp, Cl A | 1,546 | 121 | ||||||
Corning Inc, Cl B | 2,864 | 125 | ||||||
CyberArk Software Ltd * | 688 | 89 | ||||||
DXC Technology Co | 1,512 | 47 | ||||||
F5 Networks Inc, Cl A * | 250 | 52 | ||||||
Fidelity National Information Services | ||||||||
Inc, Cl B | 799 | 112 | ||||||
Fiserv Inc, Cl A * | 491 | 58 | ||||||
FleetCor Technologies Inc * | 390 | 105 | ||||||
FLIR Systems Inc | 2,455 | 139 | ||||||
Fortinet Inc * | 468 | 86 | ||||||
Fujitsu Ltd | 400 | 58 | ||||||
Gartner Inc * | 1,003 | 183 | ||||||
Global Payments Inc | 249 | 50 | ||||||
Hewlett Packard Enterprise Co | 8,829 | 139 | ||||||
HP Inc | 2,363 | 75 | ||||||
Intel Corp | 981 | 63 | ||||||
International Business Machines Corp | 341 | 46 | ||||||
Intuit Inc | 357 | 137 | ||||||
IPG Photonics Corp * | 202 | 43 | ||||||
Jack Henry & Associates Inc | 424 | 64 | ||||||
Juniper Networks Inc | 1,507 | 38 | ||||||
Keysight Technologies Inc * | 736 | 106 | ||||||
KLA Corp | 464 | 153 | ||||||
Logitech International SA | 1,003 | 105 | ||||||
Microchip Technology Inc | 571 | 89 | ||||||
Micron Technology Inc * | 831 | 73 | ||||||
Microsoft Corp | 768 | 181 | ||||||
Motorola Solutions Inc | 235 | 44 | ||||||
NetApp Inc | 725 | 53 | ||||||
NortonLifeLock Inc | 4,139 | 88 | ||||||
NVIDIA Corp | 28 | 15 | ||||||
Oracle Corp, Cl B | 2,724 | 191 | ||||||
| Description | Shares | Market Value ($ Thousands) | ||||||
COMMON STOCK (continued) |
| |||||||
Paychex Inc | 150 | $ | 15 | |||||
Paycom Software Inc * | 198 | 73 | ||||||
Qorvo Inc * | 628 | 115 | ||||||
QUALCOMM Inc | 570 | 76 | ||||||
salesforce.com Inc * | 252 | 53 | ||||||
Seagate Technology PLC | 1,509 | 116 | ||||||
ServiceNow Inc * | 159 | 80 | ||||||
Skyworks Solutions Inc | 656 | 120 | ||||||
Synopsys Inc * | 211 | 52 | ||||||
Tecmo Koei Holdings | 3,380 | 152 | ||||||
Texas Instruments Inc | 282 | 53 | ||||||
Tyler Technologies Inc * | 247 | 105 | ||||||
VeriSign Inc * | 681 | 135 | ||||||
Vontier * | 1,892 | 57 | ||||||
Western Digital Corp | 1,138 | 76 | ||||||
Western Union Co/The | 1,980 | 49 | ||||||
Wix.com Ltd * | 230 | 64 | ||||||
Xerox Holdings Corp | 2,375 | 58 | ||||||
Xilinx Inc | 654 | 81 | ||||||
Zebra Technologies Corp, Cl A * | 113 | 55 | ||||||
|
|
| ||||||
| 5,773 | ||||||||
|
|
| ||||||
Materials — 0.2% | ||||||||
Air Products and Chemicals Inc | 580 | 163 | ||||||
Albemarle Corp | 1,075 | 157 | ||||||
Amcor PLC | 12,350 | 144 | ||||||
Avery Dennison Corp | 1,153 | 212 | ||||||
B2Gold Corp | 14,044 | 60 | ||||||
Ball Corp | 1,307 | 111 | ||||||
Celanese Corp, Cl A | 628 | 94 | ||||||
CF Industries Holdings Inc | 3,811 | 173 | ||||||
Corteva Inc | 5,121 | 239 | ||||||
Dow Inc | 2,337 | 149 | ||||||
DuPont de Nemours Inc | 705 | 54 | ||||||
Eastman Chemical Co | 1,987 | 219 | ||||||
Ecolab Inc | 731 | 156 | ||||||
Evolution Mining Ltd | 34,376 | 107 | ||||||
FMC Corp | 1,834 | 203 | ||||||
Freeport-McMoRan Inc, Cl B | 3,462 | 114 | ||||||
International Flavors & Fragrances Inc | 1,993 | 278 | ||||||
International Paper Co | 1,705 | 92 | ||||||
Kirkland Lake Gold Ltd | 1,686 | 57 | ||||||
Kuraray Co Ltd | 7,300 | 83 | ||||||
LyondellBasell Industries NV, Cl A | 1,153 | 120 | ||||||
Martin Marietta Materials Inc, Cl A | 696 | 234 | ||||||
Mosaic Co/The | 5,396 | 170 | ||||||
Newcrest Mining Ltd | 3,749 | 69 | ||||||
Newmont Corp | 4,763 | 287 | ||||||
Nucor Corp | 2,612 | 210 | ||||||
Packaging Corp of America | 1,034 | 139 | ||||||
Pan American Silver | 2,322 | 70 | ||||||
PPG Industries Inc | 1,382 | 208 | ||||||
Sealed Air Corp | 3,350 | 154 | ||||||
| 186 | SEI Institutional Managed Trust / Semi-Annual Report / March 31, 2021 |
| Description | Shares | Market Value ($ Thousands) | ||||||
COMMON STOCK (continued) | ||||||||
Sherwin-Williams Co/The, Cl A | 276 | $ | 204 | |||||
SSR Mining Inc | 3,657 | 52 | ||||||
Vulcan Materials Co | 1,039 | 175 | ||||||
Westrock Co | 3,440 | 179 | ||||||
Yamana Gold Inc | 8,773 | 38 | ||||||
|
|
| ||||||
| 5,174 | ||||||||
|
|
| ||||||
Real Estate — 0.1% | ||||||||
Alexandria Real Estate Equities Inc ‡ | 628 | 103 | ||||||
American Tower Corp, Cl A ‡ | 353 | 84 | ||||||
Boston Properties Inc ‡ | 379 | 38 | ||||||
Crown Castle International Corp ‡ | 437 | 75 | ||||||
Digital Realty Trust Inc, Cl A ‡ | 526 | 74 | ||||||
Duke Realty Corp ‡ | 2,124 | 89 | ||||||
Equinix Inc ‡ | 66 | 45 | ||||||
Equity Residential ‡ | 1,670 | 120 | ||||||
Essex Property Trust Inc ‡ | 198 | 54 | ||||||
Extra Space Storage Inc ‡ | 738 | 98 | ||||||
Federal Realty Investment Trust ‡ | 1,348 | 137 | ||||||
Healthpeak Properties Inc ‡ | 1,687 | 54 | ||||||
Host Hotels & Resorts Inc ‡ | 2,919 | 49 | ||||||
Iron Mountain Inc ‡ | 1,556 | 58 | ||||||
Mid-America Apartment Communities Inc ‡ | 1,107 | 160 | ||||||
Prologis Inc ‡ | 549 | 58 | ||||||
Public Storage ‡ | 325 | 80 | ||||||
Realty Income Corp ‡ | 2,310 | 147 | ||||||
Regency Centers Corp ‡ | 515 | 29 | ||||||
SBA Communications Corp, Cl A ‡ | 152 | 42 | ||||||
Simon Property Group Inc ‡ | 848 | 97 | ||||||
SL Green Realty Corp ‡ | 29 | 2 | ||||||
UDR Inc ‡ | 2,549 | 112 | ||||||
Vonovia SE ‡ | 1,105 | 72 | ||||||
Vornado Realty Trust ‡ | 747 | 34 | ||||||
Welltower Inc ‡ | 476 | 34 | ||||||
Weyerhaeuser Co ‡ | 1,020 | 36 | ||||||
|
|
| ||||||
| 1,981 | ||||||||
|
|
| ||||||
Utilities — 0.4% | ||||||||
AES Corp/The | 8,922 | 239 | ||||||
Alliant Energy Corp | 7,767 | 421 | ||||||
Ameren Corp | 5,646 | 459 | ||||||
American Electric Power Co Inc | 5,935 | 503 | ||||||
American Water Works Co Inc | 1,287 | 193 | ||||||
Atmos Energy Corp | 1,688 | 167 | ||||||
Brookfield Renewable, Cl A | 2,401 | 113 | ||||||
CenterPoint Energy Inc | 10,623 | 241 | ||||||
CMS Energy Corp | 7,099 | 435 | ||||||
Consolidated Edison Inc | 7,733 | 578 | ||||||
Dominion Energy Inc | 7,520 | 571 | ||||||
DTE Energy Co | 2,191 | 292 | ||||||
Duke Energy Corp | 3,471 | 335 | ||||||
Edison International | 5,332 | 312 | ||||||
Elia System Operator SA/NV | 1,419 | 157 | ||||||
| Description | Shares | Market Value ($ Thousands) | ||||||
COMMON STOCK (continued) | ||||||||
Entergy Corp | 2,469 | $ | 246 | |||||
Evergy Inc | 5,347 | 318 | ||||||
Eversource Energy | 5,556 | 481 | ||||||
Exelon Corp | 5,763 | 252 | ||||||
FirstEnergy Corp | 5,862 | 203 | ||||||
NextEra Energy Inc | 3,133 | 237 | ||||||
NiSource Inc | 15,120 | 365 | ||||||
Northland Power | 2,592 | 94 | ||||||
NRG Energy Inc | 6,095 | 230 | ||||||
Pinnacle West Capital Corp | 3,525 | 287 | ||||||
PPL Corp | 9,644 | 278 | ||||||
Public Service Enterprise Group Inc | 5,156 | 310 | ||||||
Sempra Energy | 2,197 | 291 | ||||||
Southern Co/The | 5,517 | 343 | ||||||
WEC Energy Group Inc | 5,563 | 521 | ||||||
Xcel Energy Inc | 7,537 | 501 | ||||||
|
|
| ||||||
| 9,973 | ||||||||
|
|
| ||||||
Total Common Stock | 62,900 | |||||||
|
|
| ||||||
| Face Amount (Thousands) | ||||||||
CORPORATE OBLIGATIONS — 1.7% |
| |||||||
Communication Services — 0.0% | ||||||||
Alphabet Inc | ||||||||
3.625%, 05/19/2021 (A) | $ | 150 | 151 | |||||
|
|
| ||||||
Consumer Discretionary — 0.1% | ||||||||
Toyota Motor | ||||||||
3.419%, 07/20/2023 (A) | 500 | 533 | ||||||
Toyota Motor Credit MTN | ||||||||
3.200%, 01/11/2027 (A) | 750 | 814 | ||||||
2.625%, 01/10/2023 (A) | 375 | 390 | ||||||
University of Southern California | ||||||||
5.250%, 10/01/2111 (A) | 100 | 140 | ||||||
|
|
| ||||||
| 1,877 | ||||||||
|
|
| ||||||
Consumer Staples — 0.1% | ||||||||
Coca-Cola | ||||||||
3.200%, 11/01/2023 (A) | 500 | 537 | ||||||
Colgate-Palmolive MTN | ||||||||
2.250%, 11/15/2022 (A) | 1,250 | 1,291 | ||||||
Procter & Gamble Co/The | ||||||||
2.150%, 08/11/2022 (A) | 250 | 256 | ||||||
|
|
| ||||||
| 2,084 | ||||||||
|
|
| ||||||
Energy — 0.1% | ||||||||
Chevron Corp | ||||||||
2.954%, 05/16/2026 (A) | 1,000 | 1,072 | ||||||
| SEI Institutional Managed Trust / Semi-Annual Report / March 31, 2021 | 187 |
CONSOLIDATED SCHEDULE OF INVESTMENTS (Unaudited)
March 31, 2021
Multi-Asset Accumulation Fund (Continued)
| Description | Face Amount (Thousands) | Market Value ($ Thousands) | ||||||
CORPORATE OBLIGATIONS (continued) |
| |||||||
Equinor ASA | ||||||||
2.450%, 01/17/2023 (A) | $ | 1,250 | $ | 1,297 | ||||
Nexen Inc | ||||||||
5.875%, 03/10/2035 (A) | 100 | 124 | ||||||
Shell International Finance BV | ||||||||
3.250%, 05/11/2025 (A) | 250 | 270 | ||||||
XTO Energy Inc | ||||||||
6.750%, 08/01/2037 (A) | 300 | 416 | ||||||
|
|
| ||||||
| 3,179 | ||||||||
|
|
| ||||||
Financials — 1.0% | ||||||||
Bank of Montreal MTN | ||||||||
2.550%, 11/06/2022 (A) | 250 | 258 | ||||||
1.900%, 08/27/2021 (A) | 750 | 755 | ||||||
Bank of New York Mellon | ||||||||
3.550%, 09/23/2021 (A) | 200 | 202 | ||||||
Bank of Nova Scotia | ||||||||
2.700%, 03/07/2022 (A) | 500 | 511 | ||||||
Berkshire Hathaway Inc | ||||||||
3.400%, 01/31/2022 (A) | 150 | 154 | ||||||
2.750%, 03/15/2023 (A) | 1,000 | 1,045 | ||||||
BlackRock Inc | ||||||||
3.375%, 06/01/2022 (A) | 500 | 518 | ||||||
Canadian Imperial Bank of Commerce | ||||||||
2.550%, 06/16/2022 (A) | 500 | 514 | ||||||
CME Group | ||||||||
3.000%, 09/15/2022 (A) | 100 | 104 | ||||||
3.000%, 03/15/2025 (A) | 1,000 | 1,069 | ||||||
FMS Wertmanagement | ||||||||
2.750%, 03/06/2023 (A) | 375 | 393 | ||||||
2.750%, 01/30/2024 (A) | 375 | 399 | ||||||
2.000%, 08/01/2022 (A) | 875 | 896 | ||||||
Kreditanstalt fuer Wiederaufbau | ||||||||
2.875%, 04/03/2028 (A) | 375 | 409 | ||||||
2.625%, 02/28/2024 (A) | 1,000 | 1,064 | ||||||
2.500%, 11/20/2024 (A) | 1,000 | 1,068 | ||||||
2.375%, 08/25/2021 (A) | 1,000 | 1,009 | ||||||
2.125%, 03/07/2022 (A) | 500 | 509 | ||||||
2.125%, 06/15/2022 (A) | 500 | 512 | ||||||
2.125%, 01/17/2023 (A) | 1,250 | 1,292 | ||||||
2.000%, 09/29/2022 (A) | 750 | 770 | ||||||
Landwirtschaftliche Rentenbank | ||||||||
2.500%, 11/15/2027 (A) | 125 | 133 | ||||||
2.375%, 06/10/2025 (A) | 625 | 666 | ||||||
2.250%, 10/01/2021 (A) | 1,000 | 1,010 | ||||||
2.000%, 01/13/2025 (A) | 250 | 262 | ||||||
Landwirtschaftliche Rentenbank MTN | ||||||||
1.750%, 07/27/2026 (A) | 1,125 | 1,163 | ||||||
National Australia Bank Ltd | ||||||||
3.000%, 01/20/2023 (A) | 200 | 209 | ||||||
1.875%, 07/12/2021 (A) | 750 | 753 | ||||||
| Description | Face Amount (Thousands) | Market Value ($ Thousands) | ||||||
CORPORATE OBLIGATIONS (continued) |
| |||||||
Oesterreichische Kontrollbank | ||||||||
3.125%, 11/07/2023 (A) | $ | 250 | $ | 268 | ||||
2.625%, 01/31/2022 (A) | 250 | 255 | ||||||
1.625%, 09/17/2022 (A) | 250 | 255 | ||||||
Oesterreichische Kontrollbank AG MTN | ||||||||
2.875%, 03/13/2023 (A) | 500 | 525 | ||||||
Svensk Exportkredit MTN | ||||||||
3.125%, 11/08/2021 (A) | 375 | 381 | ||||||
2.875%, 05/22/2021 (A) | 250 | 251 | ||||||
2.375%, 03/09/2022 (A) | 125 | 128 | ||||||
2.000%, 08/30/2022 (A) | 250 | 256 | ||||||
1.625%, 09/12/2021 (A) | 250 | 251 | ||||||
1.625%, 11/14/2022 (A) | 125 | 128 | ||||||
Toronto-Dominion Bank MTN | ||||||||
3.500%, 07/19/2023 (A) | 250 | 268 | ||||||
3.250%, 06/11/2021 (A) | 125 | 126 | ||||||
3.250%, 03/11/2024 (A) | 125 | 134 | ||||||
2.125%, 04/07/2021 (A) | 875 | 875 | ||||||
Wells Fargo Bank | ||||||||
3.625%, 10/22/2021 (A) | 250 | 254 | ||||||
2.897%, VAR ICE LIBOR USD 3 Month+0.610%, 05/27/2022 (A) | 500 | 502 | ||||||
2.082%, VAR ICE LIBOR USD 3 Month+0.650%, 09/09/2022 (A) | 500 | 504 | ||||||
Wells Fargo Bank NA | ||||||||
3.550%, 08/14/2023 (A) | 750 | 802 | ||||||
Westpac Banking | ||||||||
2.000%, 08/19/2021 (A) | 750 | 755 | ||||||
|
|
| ||||||
| 24,565 | ||||||||
|
|
| ||||||
Health Care — 0.1% |
| |||||||
Johnson & Johnson | ||||||||
5.950%, 08/15/2037 (A) | 300 | 423 | ||||||
3.375%, 12/05/2023 (A) | 500 | 541 | ||||||
2.450%, 03/01/2026 (A) | 1,000 | 1,064 | ||||||
Novartis Capital | ||||||||
4.400%, 05/06/2044 (A) | 250 | 303 | ||||||
|
|
| ||||||
| 2,331 | ||||||||
|
|
| ||||||
Industrials — 0.0% |
| |||||||
3M Co MTN | ||||||||
5.700%, 03/15/2037 (A) | 150 | 198 | ||||||
GE Capital International Funding Unlimited Co | ||||||||
4.418%, 11/15/2035 (A) | 750 | 859 | ||||||
|
|
| ||||||
| 1,057 | ||||||||
|
|
| ||||||
Information Technology — 0.2% |
| |||||||
Apple | ||||||||
3.000%, 02/09/2024 (A) | 375 | 400 | ||||||
2.850%, 02/23/2023 (A) | 1,000 | 1,044 | ||||||
2.850%, 05/11/2024 (A) | 250 | 267 | ||||||
| 188 | SEI Institutional Managed Trust / Semi-Annual Report / March 31, 2021 |
| Description | Face Amount (Thousands) | Market Value ($ Thousands) | ||||||
CORPORATE OBLIGATIONS (continued) |
| |||||||
2.500%, 02/09/2022 (A) | $ | 500 | $ | 509 | ||||
2.450%, 08/04/2026 (A) | 375 | 395 | ||||||
2.400%, 05/03/2023 (A) | 250 | 261 | ||||||
Microsoft | ||||||||
3.700%, 08/08/2046 (A) | 500 | 559 | ||||||
3.300%, 02/06/2027 (A) | 1,000 | 1,101 | ||||||
2.125%, 11/15/2022 (A) | 500 | 515 | ||||||
Visa | ||||||||
4.150%, 12/14/2035 (A) | 125 | 148 | ||||||
3.150%, 12/14/2025 (A) | 500 | 545 | ||||||
2.800%, 12/14/2022 (A) | 125 | 130 | ||||||
2.150%, 09/15/2022 (A) | 125 | 128 | ||||||
|
|
| ||||||
| 6,002 | ||||||||
|
|
| ||||||
Utilities — 0.1% | ||||||||
Duke Energy Carolinas LLC | ||||||||
2.950%, 12/01/2026 (A) | 1,000 | 1,076 | ||||||
Florida Power & Light Co | ||||||||
3.125%, 12/01/2025 (A) | 1,000 | 1,079 | ||||||
Southern California Gas | ||||||||
5.125%, 11/15/2040 (A) | 150 | 185 | ||||||
3.750%, 09/15/2042 (A) | 250 | 268 | ||||||
|
|
| ||||||
| 2,608 | ||||||||
|
|
| ||||||
Total Corporate Obligations |
| 43,854 | ||||||
|
|
| ||||||
| Shares | ||||||||
EXCHANGE TRADED FUNDS — 0.6% |
| |||||||
iShares iBoxx $ Investment Grade Corporate Bond ETF | 130,327 | 16,949 | ||||||
|
|
| ||||||
Total Exchange Traded Funds | 16,949 | |||||||
|
|
| ||||||
PREFERRED STOCK — 0.0% | ||||||||
Consumer Discretionary — 0.0% |
| |||||||
Volkswagen AG, 0.000% | 220 | 62 | ||||||
|
|
| ||||||
Health Care — 0.0% | ||||||||
Sartorius AG, 0.000% | 155 | 77 | ||||||
|
|
| ||||||
Materials — 0.0% | ||||||||
FUCHS PETROLUB SE, 0.000% | 1,520 | 73 | ||||||
|
|
| ||||||
Total Preferred Stock (Cost $174) ($ Thousands) | 212 | |||||||
|
|
| ||||||
| Description | Number of Rights | Market Value ($ Thousands) | ||||||
RIGHTS — 0.0% | ||||||||
Computershare, Expires 04/26/2021 * | 1,005 | $ | 1 | |||||
Snam SpA, Expires 04/14/2021 * | 34,507 | – | ||||||
|
|
| ||||||
Total Rights |
| 1 | ||||||
|
|
| ||||||
Total Investments in Securities — 60.7% |
| $ | 1,585,151 | |||||
|
|
| ||||||
| SEI Institutional Managed Trust / Semi-Annual Report / March 31, 2021 | 189 |
CONSOLIDATED SCHEDULE OF INVESTMENTS (Unaudited)
March 31, 2021
Multi-Asset Accumulation Fund (Continued)
A list of the open futures contracts held by the Fund at March 31, 2021, is as follows:
| Type of Contract | Number of Contracts Long (Short) | Expiration Date | Notional Amount (Thousands) | Value (Thousands) | Unrealized Appreciation (Depreciation) (Thousands) | |||||||||||||||
Amsterdam Index | 103 | Apr-2021 | $ | 16,700 | $ | 16,927 | $ | 432 | ||||||||||||
Australian 10-Year Bond | 1,696 | Jun-2021 | 181,415 | 178,410 | (720 | ) | ||||||||||||||
Bloomberg Commodity Index(A) | 1,145 | Jun-2021 | 9,905 | 9,595 | (310 | ) | ||||||||||||||
Brent Crude(A) | 636 | May-2021 | 42,134 | 39,629 | (2,505 | ) | ||||||||||||||
CAC40 10 Euro Index | 84 | Apr-2021 | 6,034 | 5,989 | 27 | |||||||||||||||
Canadian 10-Year Bond | 1,655 | Jun-2021 | 186,948 | 182,730 | (4,998 | ) | ||||||||||||||
Coffee C | 89 | Jul-2021 | 4,334 | 4,185 | (149 | ) | ||||||||||||||
Coffee C | 86 | May-2021 | 4,058 | 3,983 | (75 | ) | ||||||||||||||
Coffee C(A) | (26) | Jul-2021 | (1,255 | ) | (1,223 | ) | 32 | |||||||||||||
Copper | 85 | May-2021 | 7,976 | 8,491 | 514 | |||||||||||||||
Corn(A) | 670 | Jul-2021 | 17,778 | 18,341 | 564 | |||||||||||||||
Cotton No. 2(A) | 90 | Jul-2021 | 3,905 | 3,698 | (207 | ) | ||||||||||||||
Cotton No. 2 | 48 | May-2021 | 1,964 | 1,941 | (23 | ) | ||||||||||||||
Cotton No. 2(A) | 37 | Jul-2021 | 1,509 | 1,520 | 11 | |||||||||||||||
DAX Index | 29 | Jun-2021 | 12,592 | 12,806 | 367 | |||||||||||||||
Euro STOXX 50 | 69 | Jun-2021 | 3,107 | 3,135 | 65 | |||||||||||||||
Euro-Bob | 678 | Jun-2021 | 110,425 | 107,639 | 50 | |||||||||||||||
Euro-BTP | 244 | Jun-2021 | 43,784 | 42,818 | 160 | |||||||||||||||
Euro-Bund | 1,432 | Jun-2021 | 296,000 | 288,268 | (798 | ) | ||||||||||||||
Euro-Buxl | 104 | Jun-2021 | 26,269 | 25,184 | (417 | ) | ||||||||||||||
Feeder Cattle(A) | 13 | Aug-2021 | 1,012 | 1,022 | 11 | |||||||||||||||
Feeder Cattle(A) | 38 | Aug-2021 | 3,030 | 2,988 | (42 | ) | ||||||||||||||
Feeder Cattle(A) | 59 | May-2021 | 4,300 | 4,407 | 107 | |||||||||||||||
FTSE 100 Index | 142 | Jun-2021 | 13,210 | 13,086 | (53 | ) | ||||||||||||||
FTSE MIB Index | 98 | Jun-2021 | 14,022 | 14,048 | 203 | |||||||||||||||
FTSE/JSE Top 40 Index | 87 | Jun-2021 | 3,586 | 3,605 | (20 | ) | ||||||||||||||
Gasoline(A) | 71 | May-2021 | 5,815 | 5,826 | 10 | |||||||||||||||
Gasoline(A) | 126 | May-2021 | 10,820 | 10,339 | (481 | ) | ||||||||||||||
Gold | 269 | Jul-2021 | 46,712 | 46,150 | (563 | ) | ||||||||||||||
Hang Seng China Enterprises Index | 139 | May-2021 | 9,739 | 9,783 | 49 | |||||||||||||||
Hang Seng Index | 127 | May-2021 | 22,908 | 23,128 | 233 | |||||||||||||||
IBEX | 29 | Apr-2021 | 2,979 | 2,927 | (18 | ) | ||||||||||||||
Japanese 10-Year Bond | 105 | Jun-2021 | 145,966 | 143,636 | 152 | |||||||||||||||
Japanese 10-Year Bond | 1 | Jun-2021 | 1,372 | 1,368 | (1 | ) | ||||||||||||||
Japanese 10-Year Government Bond E-MINI | 1,428 | Jun-2021 | 197,955 | 195,074 | 194 | |||||||||||||||
KC HRW Wheat(A) | 44 | Jul-2021 | 1,310 | 1,280 | (30 | ) | ||||||||||||||
KOSPI 200 Index | 47 | Jun-2021 | 4,227 | 4,305 | 71 | |||||||||||||||
Lean Hogs | 144 | Jun-2021 | 5,737 | 6,065 | 329 | |||||||||||||||
Live Cattle | 371 | Jul-2021 | 17,798 | 18,238 | 440 | |||||||||||||||
LME Copper(A) | 141 | Jun-2021 | 28,155 | 30,977 | 2,822 | |||||||||||||||
LME Lead(A) | 25 | Jun-2021 | 1,267 | 1,232 | (35 | ) | ||||||||||||||
LME Nickel(A) | 84 | Jun-2021 | 9,221 | 8,095 | (1,126 | ) | ||||||||||||||
LME Primary Aluminum | 400 | Jun-2021 | 21,384 | 22,088 | 703 | |||||||||||||||
LME Zinc(A) | 175 | Jun-2021 | 12,162 | 12,323 | 162 | |||||||||||||||
Long Gilt 10-Year Bond | 810 | Jul-2021 | 146,780 | 142,588 | (1,680 | ) | ||||||||||||||
Low Sulphur Gasoil(A) | 224 | Jun-2021 | 11,859 | 11,418 | (440 | ) | ||||||||||||||
MSCI Emerging Markets | 1,665 | Jun-2021 | 110,942 | 110,098 | (844 | ) | ||||||||||||||
Natural Gas(A) | 115 | May-2021 | 3,007 | 3,067 | 60 | |||||||||||||||
Natural Gas | 341 | Jul-2021 | 9,336 | 9,316 | (20 | ) | ||||||||||||||
NY Harbor ULSD(A) | 202 | May-2021 | 15,958 | 15,040 | (918 | ) | ||||||||||||||
NYMEX Cocoa(A) | 477 | Jul-2021 | 11,928 | 11,377 | (551 | ) | ||||||||||||||
OMX Stockholm 30 | 122 | Apr-2021 | 3,090 | 3,062 | 42 | |||||||||||||||
Russell 2000 Index E-MINI | 1,606 | Jun-2021 | 188,505 | 178,467 | (10,038 | ) | ||||||||||||||
S&P - Goldman Sachs Commodity Index(A) | 454 | Apr-2021 | 55,396 | 52,914 | (2,482 | ) | ||||||||||||||
| 190 | SEI Institutional Managed Trust / Semi-Annual Report / March 31, 2021 |
| Type of Contract | Number of Contracts Long (Short) | Expiration Date | Notional Amount (Thousands) | Value (Thousands) | Unrealized Appreciation (Depreciation) (Thousands) | |||||||||||||||||||||||
S&P 500 Index E-MINI(A) | 2,084 | Jun-2021 | $ | 409,552 | $ | 413,403 | $ | 3,851 | ||||||||||||||||||||
S&P Mid Cap 400 Index E-MINI | 87 | Jun-2021 | 22,985 | 22,666 | (319 | ) | ||||||||||||||||||||||
S&P TSX 60 Index | 143 | Jun-2021 | 25,492 | 25,283 | (49 | ) | ||||||||||||||||||||||
SGX Nifty 50 | 241 | May-2021 | 7,142 | 7,108 | (34 | ) | ||||||||||||||||||||||
Silver | 146 | May-2021 | 19,730 | 17,908 | (1,822 | ) | ||||||||||||||||||||||
Silver(A) | 12 | Jul-2021 | 1,457 | 1,474 | 17 | |||||||||||||||||||||||
Soybean(A) | 132 | Jul-2021 | 9,184 | 9,423 | 239 | |||||||||||||||||||||||
Soybean Meal(A) | 132 | Jul-2021 | 5,268 | 5,607 | 339 | |||||||||||||||||||||||
Soybean Oil | 144 | Jul-2021 | 4,559 | 4,386 | (173 | ) | ||||||||||||||||||||||
Soybean Oil | 4 | May-2021 | 129 | 127 | (2 | ) | ||||||||||||||||||||||
Soybean Oil | 3 | Jul-2021 | 90 | 91 | 2 | |||||||||||||||||||||||
SPI 200 Index | 45 | Jun-2021 | 5,861 | 5,798 | 23 | |||||||||||||||||||||||
SPI 200 Index | 55 | Jun-2021 | 7,256 | 7,086 | (48 | ) | ||||||||||||||||||||||
Sugar No. 11 | 1,053 | Jul-2021 | 18,407 | 17,419 | (988 | ) | ||||||||||||||||||||||
TOPIX Index | 298 | Jun-2021 | 51,799 | 52,696 | 1,729 | |||||||||||||||||||||||
U.S. 2-Year Treasury Note | 405 | Jul-2021 | 89,458 | 89,394 | (64 | ) | ||||||||||||||||||||||
U.S. 5-Year Interest Rate Swap | 136 | Jun-2021 | 13,264 | 13,171 | (94 | ) | ||||||||||||||||||||||
U.S. 5-Year Treasury Note | 487 | Jul-2021 | 60,702 | 60,095 | (607 | ) | ||||||||||||||||||||||
U.S. 10-Year Interest Rate Swap | 1,437 | Jun-2021 | 131,485 | 128,836 | (2,649 | ) | ||||||||||||||||||||||
U.S. 10-Year Treasury Note | 7,140 | Jun-2021 | 958,594 | 934,894 | (23,700 | ) | ||||||||||||||||||||||
U.S. Long Treasury Bond | 876 | Jun-2021 | 140,883 | 135,424 | (5,459 | ) | ||||||||||||||||||||||
U.S. Ultra Long Treasury Bond | 64 | Jun-2021 | 12,120 | 11,598 | (522 | ) | ||||||||||||||||||||||
Wheat(A) | 168 | Jul-2021 | 5,151 | 5,172 | 22 | |||||||||||||||||||||||
Wheat(A) | 202 | Jul-2021 | 6,248 | 6,219 | (29 | ) | ||||||||||||||||||||||
Wheat(A) | 1 | Sep-2021 | 32 | 31 | (1 | ) | ||||||||||||||||||||||
WTI Crude Oil(A) | 177 | May-2021 | 11,233 | 10,475 | (758 | ) | ||||||||||||||||||||||
| $ | 4,135,151 | $ | 4,059,187 | $ | (52,830 | ) | ||||||||||||||||||||||
A list of the open forward foreign currency contracts held by the Fund at March 31, 2021, is as follows:
| Counterparty | Settlement Date | Currency to Deliver (Thousands) | Currency to Receive (Thousands) | Unrealized Appreciation (Depreciation) (Thousands) | ||||||||||||||||||
Barclays PLC | 04/28/21 | GBP | 70,700 | USD | 97,559 | $ | 18 | |||||||||||||||
BNYMellon | 04/29/21 | AUD | 4,800 | USD | 3,656 | — | ||||||||||||||||
BNYMellon | 04/29/21 | CAD | 11,200 | USD | 8,906 | (7 | ) | |||||||||||||||
Citigroup | 06/16/21 | USD | 1,877 | HUF | 555,500 | (76 | ) | |||||||||||||||
Citigroup | 06/16/21 | USD | 2,940 | RUB | 218,950 | (69 | ) | |||||||||||||||
Citigroup | 06/16/21 | USD | 4,074 | PLN | 15,200 | (220 | ) | |||||||||||||||
Citigroup | 06/16/21 | USD | 402 | CZK | 8,950 | 1 | ||||||||||||||||
Citigroup | 06/16/21 | USD | 3,881 | CZK | 83,550 | (119 | ) | |||||||||||||||
Citigroup | 06/16/21 | USD | 1,261 | CLP | 914,125 | 13 | ||||||||||||||||
Citigroup | 06/16/21 | USD | 3,883 | CLP | 2,742,375 | (61 | ) | |||||||||||||||
Citigroup | 06/16/21 | USD | 1,834 | BRL | 10,588 | 33 | ||||||||||||||||
Citigroup | 06/16/21 | USD | 5,648 | BRL | 31,013 | (181 | ) | |||||||||||||||
Citigroup | 06/16/21 | USD | 7,562 | GBP | 5,423 | (79 | ) | |||||||||||||||
Citigroup | 06/16/21 | CNH | 10,950 | USD | 1,675 | 16 | ||||||||||||||||
Citigroup | 06/16/21 | USD | 76 | CNH | 500 | — | ||||||||||||||||
Citigroup | 06/16/21 | USD | 11,604 | CNH | 75,600 | (148 | ) | |||||||||||||||
Citigroup | 06/16/21 | BRL | 8,750 | USD | 1,572 | 30 | ||||||||||||||||
Citigroup | 06/16/21 | BRL | 2,950 | USD | 515 | (5 | ) | |||||||||||||||
Citigroup | 06/16/21 | PLN | 15,200 | USD | 4,058 | 204 | ||||||||||||||||
| SEI Institutional Managed Trust / Semi-Annual Report / March 31, 2021 | 191 |
CONSOLIDATED SCHEDULE OF INVESTMENTS (Unaudited)
March 31, 2021
Multi-Asset Accumulation Fund (Continued)
| Counterparty | Settlement Date | Currency to Deliver (Thousands) | Currency to Receive (Thousands) | Unrealized Appreciation (Depreciation) (Thousands) | ||||||||||||||||||||
Citigroup | 06/16/21 | USD | 17,066 | EUR | 14,163 | $ | (395 | ) | ||||||||||||||||
Citigroup | 06/16/21 | USD | 17,418 | MXN | 362,050 | 129 | ||||||||||||||||||
Citigroup | 06/16/21 | USD | 400 | MXN | 8,250 | — | ||||||||||||||||||
Citigroup | 06/16/21 | GBP | 18,182 | USD | 25,471 | 384 | ||||||||||||||||||
Citigroup | 06/16/21 | USD | 666 | KRW | 754,950 | 4 | ||||||||||||||||||
Citigroup | 06/16/21 | USD | 21,685 | KRW | 24,174,500 | (229 | ) | |||||||||||||||||
Citigroup | 06/16/21 | USD | 9,173 | INR | 682,950 | 52 | ||||||||||||||||||
Citigroup | 06/16/21 | USD | 16,230 | INR | 1,195,700 | (80 | ) | |||||||||||||||||
Citigroup | 06/16/21 | RUB | 53,250 | USD | 692 | (6 | ) | |||||||||||||||||
Citigroup | 06/16/21 | CZK | 50,250 | USD | 2,309 | 46 | ||||||||||||||||||
Citigroup | 06/16/21 | CZK | 22,550 | USD | 1,013 | (2 | ) | |||||||||||||||||
Citigroup | 06/16/21 | MXN | 81,850 | USD | 3,898 | (69 | ) | |||||||||||||||||
Citigroup | 06/16/21 | EUR | 91,686 | USD | 111,527 | 3,602 | ||||||||||||||||||
Citigroup | 06/16/21 | EUR | 2,500 | USD | 2,939 | (4 | ) | |||||||||||||||||
Citigroup | 06/16/21 | INR | 293,100 | USD | 3,977 | 18 | ||||||||||||||||||
Citigroup | 06/16/21 | INR | 165,800 | USD | 2,231 | (8 | ) | |||||||||||||||||
Citigroup | 06/16/21 | HUF | 555,500 | USD | 1,856 | 56 | ||||||||||||||||||
Citigroup | 06/16/21 | CLP | 1,059,150 | USD | 1,452 | (23 | ) | |||||||||||||||||
Citigroup | 06/16/21 | KRW | 3,534,350 | USD | 3,152 | 16 | ||||||||||||||||||
Citigroup | 06/16/21 | KRW | 1,761,750 | USD | 1,556 | (7 | ) | |||||||||||||||||
Citigroup | 06/17/21 | USD | 10,544 | ZAR | 160,181 | 196 | ||||||||||||||||||
Citigroup | 06/17/21 | USD | 7,060 | ZAR | 104,469 | (56 | ) | |||||||||||||||||
Citigroup | 06/17/21 | ZAR | 48,050 | USD | 3,117 | (105 | ) | |||||||||||||||||
JPMorgan Chase Bank | 06/16/21 | USD | 1,877 | HUF | 555,500 | (76 | ) | |||||||||||||||||
JPMorgan Chase Bank | 06/16/21 | USD | 2,940 | RUB | 218,950 | (70 | ) | |||||||||||||||||
JPMorgan Chase Bank | 06/16/21 | USD | 4,074 | PLN | 15,200 | (220 | ) | |||||||||||||||||
JPMorgan Chase Bank | 06/16/21 | USD | 402 | CZK | 8,950 | 1 | ||||||||||||||||||
JPMorgan Chase Bank | 06/16/21 | USD | 3,881 | CZK | 83,550 | (119 | ) | |||||||||||||||||
JPMorgan Chase Bank | 06/16/21 | USD | 1,261 | CLP | 914,125 | 13 | ||||||||||||||||||
JPMorgan Chase Bank | 06/16/21 | USD | 3,883 | CLP | 2,742,375 | (62 | ) | |||||||||||||||||
JPMorgan Chase Bank | 06/16/21 | USD | 1,834 | BRL | 10,588 | 32 | ||||||||||||||||||
JPMorgan Chase Bank | 06/16/21 | USD | 5,648 | BRL | 31,013 | (182 | ) | |||||||||||||||||
JPMorgan Chase Bank | 06/16/21 | CNH | 10,950 | USD | 1,675 | 15 | ||||||||||||||||||
JPMorgan Chase Bank | 06/16/21 | USD | 76 | CNH | 500 | — | ||||||||||||||||||
JPMorgan Chase Bank | 06/16/21 | USD | 11,604 | CNH | 75,600 | (149 | ) | |||||||||||||||||
JPMorgan Chase Bank | 06/16/21 | BRL | 8,750 | USD | 1,572 | 30 | ||||||||||||||||||
JPMorgan Chase Bank | 06/16/21 | BRL | 2,950 | USD | 515 | (5 | ) | |||||||||||||||||
JPMorgan Chase Bank | 06/16/21 | USD | 12,893 | EUR | 10,700 | (298 | ) | |||||||||||||||||
JPMorgan Chase Bank | 06/16/21 | PLN | 15,200 | USD | 4,058 | 203 | ||||||||||||||||||
JPMorgan Chase Bank | 06/16/21 | USD | 17,418 | MXN | 362,050 | 128 | ||||||||||||||||||
JPMorgan Chase Bank | 06/16/21 | USD | 400 | MXN | 8,250 | (1 | ) | |||||||||||||||||
JPMorgan Chase Bank | 06/16/21 | GBP | 18,182 | USD | 25,471 | 383 | ||||||||||||||||||
JPMorgan Chase Bank | 06/16/21 | USD | 666 | KRW | 754,950 | 3 | ||||||||||||||||||
JPMorgan Chase Bank | 06/16/21 | USD | 21,685 | KRW | 24,174,500 | (229 | ) | |||||||||||||||||
JPMorgan Chase Bank | 06/16/21 | USD | 9,173 | INR | 682,950 | 52 | ||||||||||||||||||
JPMorgan Chase Bank | 06/16/21 | USD | 16,230 | INR | 1,195,700 | (80 | ) | |||||||||||||||||
JPMorgan Chase Bank | 06/16/21 | RUB | 53,250 | USD | 692 | (6 | ) | |||||||||||||||||
JPMorgan Chase Bank | 06/16/21 | CZK | 50,250 | USD | 2,309 | 46 | ||||||||||||||||||
JPMorgan Chase Bank | 06/16/21 | CZK | 22,550 | USD | 1,013 | (2 | ) | |||||||||||||||||
| 192 | SEI Institutional Managed Trust / Semi-Annual Report / March 31, 2021 |
| Counterparty | Settlement Date | Currency to Deliver (Thousands) | Currency to Receive (Thousands) | Unrealized Appreciation (Depreciation) (Thousands) | ||||||||||||||||||||
JPMorgan Chase Bank | 06/16/21 | MXN | 81,850 | USD | 3,898 | $ | (69 | ) | ||||||||||||||||
JPMorgan Chase Bank | 06/16/21 | EUR | 91,446 | USD | 111,237 | 3,594 | ||||||||||||||||||
JPMorgan Chase Bank | 06/16/21 | EUR | 2,500 | USD | 2,939 | (5 | ) | |||||||||||||||||
JPMorgan Chase Bank | 06/16/21 | INR | 293,100 | USD | 3,977 | 18 | ||||||||||||||||||
JPMorgan Chase Bank | 06/16/21 | INR | 165,800 | USD | 2,231 | (8 | ) | |||||||||||||||||
JPMorgan Chase Bank | 06/16/21 | HUF | 555,500 | USD | 1,856 | 55 | ||||||||||||||||||
JPMorgan Chase Bank | 06/16/21 | CLP | 1,059,150 | USD | 1,452 | (24 | ) | |||||||||||||||||
JPMorgan Chase Bank | 06/16/21 | KRW | 3,534,350 | USD | 3,152 | 15 | ||||||||||||||||||
JPMorgan Chase Bank | 06/16/21 | KRW | 1,761,750 | USD | 1,556 | (8 | ) | |||||||||||||||||
JPMorgan Chase Bank | 06/17/21 | USD | 10,544 | ZAR | 160,181 | 195 | ||||||||||||||||||
JPMorgan Chase Bank | 06/17/21 | USD | 7,060 | ZAR | 104,469 | (57 | ) | |||||||||||||||||
JPMorgan Chase Bank | 06/17/21 | ZAR | 48,050 | USD | 3,117 | (105 | ) | |||||||||||||||||
State Street | 04/28/21 - 04/29/21 | EUR | 119,700 | USD | 142,269 | 1,517 | ||||||||||||||||||
State Street | 04/29/21 | CHF | 2,900 | USD | 3,083 | (2 | ) | |||||||||||||||||
State Street | 04/29/21 | GBP | 3,700 | USD | 5,094 | (10 | ) | |||||||||||||||||
State Street | 04/29/21 | HKD | 22,500 | USD | 2,896 | 2 | ||||||||||||||||||
State Street | 04/30/21 | JPY | 3,221,600 | USD | 29,357 | 187 | ||||||||||||||||||
State Street | 04/30/21 | JPY | 3,298 | USD | 30 | — | ||||||||||||||||||
|
|
| ||||||||||||||||||||||
| $ | 7,571 | |||||||||||||||||||||||
|
|
| ||||||||||||||||||||||
A list of the open OTC swap agreements held by the Fund at March 31, 2021 is as follows:
| ||||||||||||||||||||||||||||||||||||||
| Total Return Swaps | ||||||||||||||||||||||||||||||||||||||
| ||||||||||||||||||||||||||||||||||||||
| Counterparty | Reference Entity/ Obligation | Fund Pays | Fund Receives | Payment Frequency | Termination Date | Currency | Notional Amount ($ Thousands) | Value ($ Thousands) | Upfront Payments ($ Thousands) | Net Unrealized Appreciation (Depreciation) ($ Thousands) | ||||||||||||||||||||||||||||
| ||||||||||||||||||||||||||||||||||||||
Bank of America | | Bovespa Index | | | NEGATIVE PRICE RETURN | | | POSITIVE PRICE RETURN | | At Maturity | 04/14/2021 | BRL | $ | 4,777 | $ | 4,444 | $ | – | $ | (120 | ) | |||||||||||||||||
Citibank | Taiwan Index (TAIEX) | | NEGATIVE PRICE RETURN | | | POSITIVE PRICE RETURN | | At Maturity | 04/21/2021 | TWD | 5,386 | 5,410 | – | 79 | ||||||||||||||||||||||||
JPMorgan Chase | | Taiwan Index (TAIEX) | | | NEGATIVE PRICE RETURN | | | POSITIVE PRICE RETURN | | At Maturity | 04/21/2021 | TWD | 8,030 | 8,058 | – | 111 | ||||||||||||||||||||||
Merrill Lynch | | Taiwan Index (TAIEX) | | | NEGATIVE PRICE RETURN | | | POSITIVE PRICE RETURN | | At Maturity | 04/21/2021 | TWD | 7,904 | 7,943 | – | 120 | ||||||||||||||||||||||
Citibank | | Hang Seng Index | | | NEGATIVE PRICE RETURN | | | POSITIVE PRICE RETURN | | At Maturity | 04/30/2021 | HKD | 2,243 | 2,252 | – | 11 | ||||||||||||||||||||||
JPMorgan Chase | | Hang Seng Index | | | NEGATIVE PRICE RETURN | | | POSITIVE PRICE RETURN | | At Maturity | 04/30/2021 | HKD | 21,009 | 21,113 | – | 116 | ||||||||||||||||||||||
Bank of America | | Hang Seng Index | | | NEGATIVE PRICE RETURN | | | POSITIVE PRICE RETURN | | At Maturity | 04/30/2021 | HKD | 14,970 | 15,061 | – | 99 | ||||||||||||||||||||||
JPMorgan Chase | | Hang Seng Index | | | NEGATIVE PRICE RETURN | | | POSITIVE PRICE RETURN | | At Maturity | 04/30/2021 | HKD | 4,696 | 4,735 | – | 41 | ||||||||||||||||||||||
Bank of America | | Hang Seng Index | | | NEGATIVE PRICE RETURN | | | POSITIVE PRICE RETURN | | At Maturity | 04/30/2021 | HKD | 16,310 | 16,390 | – | 89 | ||||||||||||||||||||||
Merrill Lynch | SGX Nifty 50 | | NEGATIVE PRICE RETURN | | | POSITIVE PRICE RETURN | | At Maturity | 05/02/2021 | USD | 2,672 | 2,654 | – | (18 | ) | |||||||||||||||||||||||
Bank of America | | Cotton No. 2 (A) | | | NEGATIVE PRICE RETURN | | | POSITIVE PRICE RETURN | | At Maturity | 05/06/2021 | USD | 570 | 566 | – | (4 | ) | |||||||||||||||||||||
Merrill Lynch | | Soybean Oil (A) | | | NEGATIVE PRICE RETURN | | | POSITIVE PRICE RETURN | | At Maturity | 05/14/2021 | USD | 5,008 | 6,096 | – | 1,089 | ||||||||||||||||||||||
Citibank | | Soybean Oil (A) | | | NEGATIVE PRICE RETURN | | | POSITIVE PRICE RETURN | | At Maturity | 05/14/2021 | USD | 1,238 | 1,492 | – | 254 | ||||||||||||||||||||||
JPMorgan Chase | KOSPI Index | | NEGATIVE PRICE RETURN | | | POSITIVE PRICE RETURN | | At Maturity | 06/13/2021 | KRW | 15,746 | 16,121 | – | 311 | ||||||||||||||||||||||||
Bank of America | Swiss Market | | NEGATIVE PRICE RETURN | | | POSITIVE PRICE RETURN | | At Maturity | 06/19/2021 | CHF | 9,127 | 9,173 | – | 183 | ||||||||||||||||||||||||
Bank of America | | Live Cattle (A) | | | NEGATIVE PRICE RETURN | | | POSITIVE PRICE RETURN | | At Maturity | 07/02/2021 | USD | 7,434 | 7,521 | – | 88 | ||||||||||||||||||||||
Citibank | Sugar (A) | | NEGATIVE PRICE RETURN | | | POSITIVE PRICE RETURN | | At Maturity | 07/02/2021 | USD | 17 | 17 | – | – | ||||||||||||||||||||||||
Bank of America | Sugar (A) | | NEGATIVE PRICE RETURN | | | POSITIVE PRICE RETURN | | At Maturity | 07/02/2021 | USD | 86 | 83 | – | (3 | ) | |||||||||||||||||||||||
Bank of America | | Cotton No. 2 (A) | | | NEGATIVE PRICE RETURN | | | POSITIVE PRICE RETURN | | At Maturity | 07/11/2021 | USD | 328 | 329 | – | 1 | ||||||||||||||||||||||
Citibank | | Soybean Oil (A) | | | NEGATIVE PRICE RETURN | | | POSITIVE PRICE RETURN | | At Maturity | 07/17/2021 | USD | 332 | 335 | – | 4 | ||||||||||||||||||||||
Merrill Lynch | | Soybean Oil (A) | | | NEGATIVE PRICE RETURN | | | POSITIVE PRICE RETURN | | At Maturity | 07/17/2021 | USD | 1,432 | 1,431 | – | (1 | ) | |||||||||||||||||||||
Bank of America | Corn (A) | | NEGATIVE PRICE RETURN | | | POSITIVE PRICE RETURN | | At Maturity | 07/17/2021 | USD | 7,321 | 7,556 | – | 234 | ||||||||||||||||||||||||
Citibank | Soybean (A) | | NEGATIVE PRICE RETURN | | | POSITIVE PRICE RETURN | | At Maturity | 07/17/2021 | USD | 10,271 | 10,423 | – | 151 | ||||||||||||||||||||||||
Citibank | | Soybean Meal (A) | | | NEGATIVE PRICE RETURN | | | POSITIVE PRICE RETURN | | At Maturity | 07/17/2021 | USD | 5,412 | 5,735 | – | 322 | ||||||||||||||||||||||
Merrill Lynch | | Soybean Meal (A) | | | NEGATIVE PRICE RETURN | | | POSITIVE PRICE RETURN | | At Maturity | 07/17/2021 | USD | 5,210 | 5,522 | – | 312 | ||||||||||||||||||||||
Citibank | Wheat (A) | | NEGATIVE PRICE RETURN | | | POSITIVE PRICE RETURN | | At Maturity | 07/17/2021 | USD | 824 | 831 | – | 8 | ||||||||||||||||||||||||
|
|
|
|
|
| |||||||||||||||||||||||||||||||||
| $ | 161,291 | $ | – | $ | 3,477 | |||||||||||||||||||||||||||||||||
|
|
|
|
|
| |||||||||||||||||||||||||||||||||
| SEI Institutional Managed Trust / Semi-Annual Report / March 31, 2021 | 193 |
CONSOLIDATED SCHEDULE OF INVESTMENTS (Unaudited)
March 31, 2021
Multi-Asset Accumulation Fund (Concluded)
A list of the open centrally cleared swap agreements held by the Fund at March 31, 2021 is as follows:
| Interest Rate Swaps | ||||||||||||||||||||||||||||||||
| Fund Pays | Fund Receives | Payment Frequency | Termination Date | Currency | Notional Amount (Thousands) | Value (Thousands) | Upfront Payments/ Receipts (Thousands) | Net Unrealized Depreciation (Thousands) | ||||||||||||||||||||||||
3 MONTH USD - LIBOR | 0.25% | Semi-Annually | 09/15/2023 | USD | 375,557 | $ | (1,187) | $ | (820) | $ | (367) | |||||||||||||||||||||
USD-LIBOR-BBA 3M | 0.50% | Semi-Annually | 06/16/2026 | USD | 142,459 | (4,447) | (238) | (4,209) | ||||||||||||||||||||||||
3 MONTH USD - LIBOR | 0.50% | Semi-Annually | 09/15/2026 | USD | 121,347 | (4,420) | (3,285) | (1,135) | ||||||||||||||||||||||||
|
|
|
|
|
| |||||||||||||||||||||||||||
| $ | (10,054) | $ | (4,343) | $ | (5,711) | |||||||||||||||||||||||||||
|
|
|
|
|
| |||||||||||||||||||||||||||
Percentages are based on Net Assets of $2,611,685 ($ Thousands). |
| * | Non-income producing security. |
| ‡ | Real Estate Investment Trust. |
| (A) | Security, or a portion thereof, is held by the Accumulation Commodity Strategy Subsidiary, Ltd. as of March 31, 2021. |
| (B) | Zero coupon security. The rate shown on the Schedule of Investments is the security’s effective yield at the time of purchase. |
| (C) | Security exempt from registration under Rule 144A of the Securities Act of 1933. These securities may be resold in transactions exempt from registration normally to qualified institutions. On March 31, 2021, the value of these securities amounted to $73,315 ($ Thousands), representing 2.8% of the Net Assets of the Fund. |
| (D) | No interest rate available. |
ADR — American Depositary Receipt
AUD — Australian Dollar
BBA — British Bankers Association
BRL — Brazilian Real
CAD — Canadian Dollar
CHF — Swiss Franc
Cl — Class
CLP — Chilean Peso
CNH — Chinese Yuan Offshore
CZK — Czech Koruna
DAX — German Stock Exchange
ETF — Exchange-Traded Fund
EUR — Euro
FTSE — Financial Times and Stock Exchange
GBP — British Pound Sterling
HKD — Hong Kong Dollar
HUF — Hungarian Forint
IBEX — Spanish Stock Exchange Index
ICE— Intercontinental Exchange
INR — Indian Rupee
JPY — Japanese Yen
JSE — Johannesburg Stock Exchange
KOSPI — Korea Composite Stock Exchange
KRW — Korean Won
LIBOR— London Interbank Offered Rate
LLC — Limited Liability Company
LME — London Metal Exchange
Ltd. — Limited
MSCI — Morgan Stanley Capital International
MTN — Medium Term Note
MXN — Mexican Peso
NYMEX — New York Mercantile Exchange
OMX — Offset Market Exchange
PLC — Public Limited Company
PLN — Polish Zloty
RUB — Russian Ruble
S&P — Standard & Poor’s
SGX — Singapore Exchange
SPI — Share Price Index
TAIEX — Taiwan Capitalization Weighted Stock Index
TOPIX — Tokyo Stock Exchange
TSX — Toronto Stock Exchange
TWD — Taiwan Dollar
ULSD — Ultra-Low Sulfur Diesel
USD — United States Dollar
VAR — Variable Rate
ZAR — South African Rand
| 194 | SEI Institutional Managed Trust / Semi-Annual Report / March 31, 2021 |
The following is a list of the level of inputs used as of March 31, 2021, in valuing the Fund’s investments and other financial instruments carried at value ($ Thousands):
| Investments in Securities | Level 1 ($) | Level 2 ($) | Level 3 ($) | Total ($) | ||||||||||||
U.S. Treasury Obligations | – | 986,724 | – | 986,724 | ||||||||||||
Sovereign Debt | 2,559 | 402,628 | – | 405,187 | ||||||||||||
Foreign Common Stock | 69,324 | – | – | 69,324 | ||||||||||||
Common Stock | 62,748 | 152 | – | 62,900 | ||||||||||||
Corporate Obligations | – | 43,854 | – | 43,854 | ||||||||||||
Exchange Traded Funds | 16,949 | – | – | 16,949 | ||||||||||||
Preferred Stock | 212 | – | – | 212 | ||||||||||||
Rights | 1 | – | – | 1 | ||||||||||||
|
|
|
|
|
|
|
| |||||||||
Total Investments in Securities | 151,793 | 1,433,358 | ��� | 1,585,151 | ||||||||||||
|
|
|
|
|
|
|
| |||||||||
| Other Financial Instruments | Level 1 ($) | Level 2 ($) | Level 3 ($) | Total ($) | ||||||||||||
Futures Contracts* | ||||||||||||||||
Unrealized Appreciation | 14,032 | – | – | 14,032 | ||||||||||||
Unrealized Depreciation | (66,862) | – | – | (66,862) | ||||||||||||
Forwards Contracts* | ||||||||||||||||
Unrealized Appreciation | – | 11,307 | – | 11,307 | ||||||||||||
Unrealized Depreciation | – | (3,736) | – | (3,736) | ||||||||||||
OTC Swaps | ||||||||||||||||
Total Return Swaps* | ||||||||||||||||
Unrealized Appreciation | – | 3,623 | – | 3,623 | ||||||||||||
Unrealized Depreciation | – | (146) | – | (146) | ||||||||||||
Centrally Cleared Swaps | ||||||||||||||||
Interest Rate Swaps* | ||||||||||||||||
Unrealized Depreciation | – | (5,711) | – | (5,711) | ||||||||||||
|
|
|
|
|
|
|
| |||||||||
Total Other Financial Instruments | (52,830) | 5,337 | – | (47,493) | ||||||||||||
|
|
|
|
|
|
|
| |||||||||
* Futures contracts, forward contracts and swap contracts are valued at the unrealized appreciation (depreciation) on the instrument.
For the period ended March 31, 2021, there were no transfers in or out of Level 3.
For more information on valuation inputs, see Note 2 – Significant Accounting Policies in Notes to Financial Statements.
Amounts designated as “—” are either $0 or have been rounded to $0.
| SEI Institutional Managed Trust / Semi-Annual Report / March 31, 2021 | 195 |
SCHEDULE OF INVESTMENTS (Unaudited)
March 31, 2021
Multi-Asset Income Fund
Sector Weightings †:
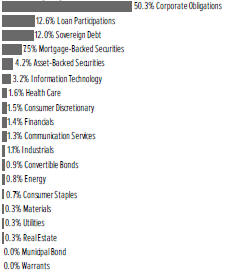
†Percentages are based on total investments.
| Description | Face Amount (Thousands) | Market Value ($ Thousands) | ||||||
CORPORATE OBLIGATIONS — 47.6% |
| |||||||
Communication Services — 3.6% |
| |||||||
Altice France Holding | ||||||||
10.500%, 05/15/2027 (A) | $ | 850 | $ | 957 | ||||
AT&T | ||||||||
4.350%, 03/01/2029 | 700 | 791 | ||||||
3.500%, 06/01/2041 | 350 | 345 | ||||||
2.750%, 06/01/2031 | 375 | 373 | ||||||
2.550%, 12/01/2033 (A) | 1,428 | 1,354 | ||||||
2.300%, 06/01/2027 | 1,050 | 1,073 | ||||||
1.650%, 02/01/2028 | 875 | 846 | ||||||
Bharti Airtel | ||||||||
3.250%, 06/03/2031 (A) | 1,360 | 1,327 | ||||||
CCO Holdings | ||||||||
4.500%, 05/01/2032 (A) | 1,540 | 1,559 | ||||||
CenturyLink | ||||||||
7.650%, 03/15/2042 | 748 | 851 | ||||||
Charter Communications Operating | ||||||||
5.125%, 07/01/2049 | 200 | 224 | ||||||
4.908%, 07/23/2025 | 3,200 | 3,629 | ||||||
3.750%, 02/15/2028 | 650 | 703 | ||||||
Clear Channel Worldwide Holdings | ||||||||
9.250%, 02/15/2024 | 40 | 42 | ||||||
Digicel Group 0.5 | ||||||||
8.000%, 04/01/2025 (A) | 86 | 71 | ||||||
Digicel International Finance | ||||||||
8.750%, 05/25/2024 (A) | 61 | 62 | ||||||
DISH DBS | ||||||||
7.750%, 07/01/2026 | 700 | 771 | ||||||
Frontier Communications | ||||||||
6.750%, 05/01/2029 (A) | 380 | 401 | ||||||
| Description | Face Amount (Thousands) | Market Value ($ Thousands) | ||||||
CORPORATE OBLIGATIONS (continued) |
| |||||||
5.000%, 05/01/2028 (A) | $ | 395 | $ | 402 | ||||
iHeartCommunications (B) | ||||||||
6.375%, 05/01/2026 | 400 | 424 | ||||||
Intelsat Jackson Holdings | ||||||||
9.750%, 07/15/2025 (A)(C) | 650 | 401 | ||||||
5.500%, 08/01/2023 (C) | 1,747 | 1,070 | ||||||
Lumen Technologies | ||||||||
5.125%, 12/15/2026 (A) | 1,250 | 1,317 | ||||||
Mauritius Investments | ||||||||
6.500%, 10/13/2026 | 2,470 | 2,761 | ||||||
4.755%, 11/11/2024 | 400 | 418 | ||||||
Millicom International Cellular | ||||||||
6.625%, 10/15/2026 (A) | 216 | 230 | ||||||
6.250%, 03/25/2029 (A) | 477 | 530 | ||||||
5.125%, 01/15/2028 (A) | 252 | 265 | ||||||
Netflix | ||||||||
6.375%, 05/15/2029 | 490 | 608 | ||||||
Playtika Holding | ||||||||
4.250%, 03/15/2029 (A) | 868 | 855 | ||||||
Scripps (Escrow Security) | ||||||||
5.875%, 07/15/2027 (A) | 450 | 463 | ||||||
Scripps II (Escrow Security) | ||||||||
5.375%, 01/15/2031 (A) | 580 | 577 | ||||||
Sprint Capital | ||||||||
8.750%, 03/15/2032 | 510 | 754 | ||||||
6.875%, 11/15/2028 | 520 | 656 | ||||||
TEGNA | ||||||||
4.625%, 03/15/2028 | 1,050 | 1,068 | ||||||
Telecom Argentina | ||||||||
8.500%, 08/06/2025 (A) | 28 | 25 | ||||||
Telecom Italia Capital | ||||||||
6.000%, 09/30/2034 | 500 | 567 | ||||||
T-Mobile USA | ||||||||
4.500%, 04/15/2050 (A) | 1,516 | 1,699 | ||||||
Townsquare Media | ||||||||
6.875%, 02/01/2026 (A) | 902 | 961 | ||||||
Turk Telekomunikasyon | ||||||||
6.875%, 02/28/2025 (A) | 370 | 393 | ||||||
Urban One | ||||||||
7.375%, 02/01/2028 (A) | 740 | 766 | ||||||
Verizon Communications | ||||||||
3.700%, 03/22/2061 | 310 | 305 | ||||||
3.550%, 03/22/2051 | 140 | 139 | ||||||
3.400%, 03/22/2041 | 430 | 435 | ||||||
2.100%, 03/22/2028 | 515 | 518 | ||||||
VTR Comunicaciones | ||||||||
5.125%, 01/15/2028 (A) | 770 | 805 | ||||||
|
|
| ||||||
| 34,791 | ||||||||
|
|
| ||||||
Consumer Discretionary — 6.2% |
| |||||||
Adient US | ||||||||
7.000%, 05/15/2026 (A) | 6 | 6 | ||||||
| 196 | SEI Institutional Managed Trust / Semi-Annual Report / March 31, 2021 |
| Description | Face Amount (Thousands) | Market Value ($ Thousands) | ||||||
CORPORATE OBLIGATIONS (continued) |
| |||||||
Adtalem Global Education | ||||||||
5.500%, 03/01/2028 (A) | $ | 810 | $ | 800 | ||||
Allen Media | ||||||||
10.500%, 02/15/2028 (A) | 760 | 802 | ||||||
Banijay Entertainment SASU | ||||||||
5.375%, 03/01/2025 (A) | 650 | 671 | ||||||
BCPE Ulysses Intermediate | ||||||||
7.750%cash/8.500% PIK, 04/01/2027 (A) | 1,660 | 1,722 | ||||||
Bed Bath & Beyond | ||||||||
5.165%, 08/01/2044 | 750 | 683 | ||||||
BorgWarner | ||||||||
5.000%, 10/01/2025 (A) | 560 | 645 | ||||||
Boyd Gaming | ||||||||
4.750%, 12/01/2027 | 1,200 | 1,223 | ||||||
Burlington Coat Factory Warehouse | ||||||||
6.250%, 04/15/2025 (A) | 297 | 315 | ||||||
CalAtlantic Group | ||||||||
5.250%, 06/01/2026 | 330 | 332 | ||||||
Carnival | ||||||||
9.875%, 08/01/2027 (A) | 450 | 530 | ||||||
Carriage Services | ||||||||
6.625%, 06/01/2026 (A) | 350 | 367 | ||||||
Carvana | ||||||||
5.500%, 04/15/2027 (A) | 360 | 362 | ||||||
CSC Holdings | ||||||||
5.750%, 01/15/2030 (A) | 1,525 | 1,606 | ||||||
Dealer Tire | ||||||||
8.000%, 02/01/2028 (A) | 1,284 | 1,357 | ||||||
Diamond Sports Group | ||||||||
6.625%, 08/15/2027 (A) | 500 | 262 | ||||||
5.375%, 08/15/2026 (A) | 330 | 238 | ||||||
Downstream Development Authority of the Quapaw Tribe of Oklahoma | ||||||||
10.500%, 02/15/2023 (A) | 410 | 424 | ||||||
eG Global Finance | ||||||||
6.750%, 02/07/2025 (A) | 488 | 499 | ||||||
Empire Communities | ||||||||
7.000%, 12/15/2025 (A) | 570 | 601 | ||||||
Expedia Group | ||||||||
4.625%, 08/01/2027 (A) | 647 | 720 | ||||||
Ford Motor | ||||||||
9.000%, 04/22/2025 | 270 | 327 | ||||||
8.500%, 04/21/2023 | 1,276 | 1,423 | ||||||
Ford Motor Credit | ||||||||
5.125%, 06/16/2025 | 1,075 | 1,160 | ||||||
4.000%, 11/13/2030 | 290 | 288 | ||||||
2.900%, 02/16/2028 | 290 | 279 | ||||||
Foundation Building Materials | ||||||||
6.000%, 03/01/2029 (A) | 355 | 351 | ||||||
General Motors | ||||||||
5.950%, 04/01/2049 | 50 | 63 | ||||||
| Description | Face Amount (Thousands) | Market Value ($ Thousands) | ||||||
CORPORATE OBLIGATIONS (continued) |
| |||||||
4.000%, 04/01/2025 | $ | 250 | $ | 271 | ||||
General Motors Financial | ||||||||
5.650%, 01/17/2029 | 175 | 207 | ||||||
Genting New York | ||||||||
3.300%, 02/15/2026 (A) | 395 | 394 | ||||||
Getty Images | ||||||||
9.750%, 03/01/2027 (A) | 720 | 767 | ||||||
GrubHub Holdings | ||||||||
5.500%, 07/01/2027 (A) | 300 | 312 | ||||||
Hilton Domestic Operating | ||||||||
4.000%, 05/01/2031 (A) | 459 | 459 | ||||||
Installed Building Products | ||||||||
5.750%, 02/01/2028 (A) | 450 | 470 | ||||||
IRB Holding Corp. | ||||||||
6.750%, 02/15/2026 (A) | 435 | 450 | ||||||
L Brands | ||||||||
6.875%, 07/01/2025 (A) | 330 | 367 | ||||||
5.250%, 02/01/2028 | 740 | 794 | ||||||
LBM Acquisition | ||||||||
6.250%, 01/15/2029 (A) | 865 | 891 | ||||||
Liberty Interactive | ||||||||
8.500%, 07/15/2029 | 330 | 376 | ||||||
Lions Gate Capital Holdings | ||||||||
5.875%, 11/01/2024 (A) | 750 | 772 | ||||||
Mattel | ||||||||
3.375%, 04/01/2026 (A) | 930 | 960 | ||||||
MDC Holdings | ||||||||
6.000%, 01/15/2043 | 270 | 341 | ||||||
Melco Resorts Finance | ||||||||
5.375%, 12/04/2029 (A) | 920 | 977 | ||||||
MercadoLibre | ||||||||
3.125%, 01/14/2031 | 840 | 800 | ||||||
2.375%, 01/14/2026 | 210 | 208 | ||||||
MGM China Holdings | ||||||||
4.750%, 02/01/2027 (A) | 390 | 396 | ||||||
Michaels Stores | ||||||||
8.000%, 07/15/2027 (A) | 480 | 530 | ||||||
NCL | ||||||||
12.250%, 05/15/2024 (A) | 1,000 | 1,210 | ||||||
10.250%, 02/01/2026 (A) | 580 | 680 | ||||||
5.875%, 03/15/2026 (A) | 120 | 122 | ||||||
3.625%, 12/15/2024 (A) | 1,600 | 1,510 | ||||||
NESCO Holdings II | ||||||||
5.500%, 04/15/2029 (A) | 284 | 291 | ||||||
NMG Holding | ||||||||
7.125%, 04/01/2026 (A) | 490 | 500 | ||||||
Park River Holdings | ||||||||
5.625%, 02/01/2029 (A) | 325 | 315 | ||||||
PetSmart | ||||||||
7.750%, 02/15/2029 (A) | 250 | 272 | ||||||
4.750%, 02/15/2028 (A) | 250 | 256 | ||||||
| SEI Institutional Managed Trust / Semi-Annual Report / March 31, 2021 | 197 |
SCHEDULE OF INVESTMENTS (Unaudited)
March 31, 2021
Multi-Asset Income Fund (Continued)
| Description | Face Amount (Thousands) | Market Value ($ Thousands) | ||||||
CORPORATE OBLIGATIONS (continued) |
| |||||||
PM General Purchaser | ||||||||
9.500%, 10/01/2028 (A) | $ | 930 | $ | 993 | ||||
Prime Security Services Borrower | ||||||||
5.750%, 04/15/2026 (A) | 130 | 140 | ||||||
QVC | ||||||||
5.450%, 08/15/2034 | 440 | 440 | ||||||
Real Hero Merger Sub 2 | ||||||||
6.250%, 02/01/2029 (A) | 155 | 160 | ||||||
Rent-A-Center | ||||||||
6.375%, 02/15/2029 (A) | 370 | 392 | ||||||
Royal Caribbean Cruises | ||||||||
11.500%, 06/01/2025 (A) | 80 | 93 | ||||||
5.500%, 04/01/2028 (A) | 945 | 950 | ||||||
5.250%, 11/15/2022 | 415 | 427 | ||||||
Sabre GLBL Inc. | ||||||||
9.250%, 04/15/2025 (A) | 1,043 | 1,244 | ||||||
Sands China | ||||||||
5.125%, 08/08/2025 | 200 | 224 | ||||||
SeaWorld Parks & Entertainment | ||||||||
9.500%, 08/01/2025 (A) | 1,150 | 1,250 | ||||||
Silversea Cruise Finance | ||||||||
7.250%, 02/01/2025 (A) | 750 | 776 | ||||||
Six Flags Entertainment | ||||||||
5.500%, 04/15/2027 (A) | 928 | 962 | ||||||
Specialty Building Products Holdings | ||||||||
6.375%, 09/30/2026 (A) | 1,592 | 1,644 | ||||||
Superior Plus | ||||||||
4.500%, 03/15/2029 (A) | 1,405 | 1,419 | ||||||
Tempur Sealy International | ||||||||
4.000%, 04/15/2029 (A) | 1,984 | 1,974 | ||||||
Terrier Media Buyer | ||||||||
8.875%, 12/15/2027 (A) | 850 | 915 | ||||||
Univision Communications | ||||||||
9.500%, 05/01/2025 (A) | 300 | 328 | ||||||
Viking Cruises | ||||||||
7.000%, 02/15/2029 (A) | 660 | 680 | ||||||
Virgin Media Secured Finance | ||||||||
5.000%, 04/15/2027 | GBP | 800 | 1,155 | |||||
Virgin Media Vendor Financing Notes III DAC | ||||||||
4.875%, 07/15/2028 (A) | 725 | 1,030 | ||||||
VOC Escrow | ||||||||
5.000%, 02/15/2028 (A) | $ | 1,070 | 1,057 | |||||
Wendy’s International | ||||||||
7.000%, 12/15/2025 | 570 | 633 | ||||||
WW International | ||||||||
8.625%, 12/01/2025 (A) | 620 | 645 | ||||||
Wyndham Destinations | ||||||||
6.625%, 07/31/2026 (A) | 278 | 316 | ||||||
Wynn Macau | ||||||||
5.625%, 08/26/2028 (A) | 800 | 836 | ||||||
5.125%, 12/15/2029 (A) | 470 | 482 | ||||||
| Description | Face Amount (Thousands) | Market Value ($ Thousands) | ||||||
CORPORATE OBLIGATIONS (continued) |
| |||||||
Wynn Resorts Finance | ||||||||
7.750%, 04/15/2025 (A) | $ | 740 | $ | 802 | ||||
Yum! Brands | ||||||||
7.750%, 04/01/2025 (A) | 27 | 30 | ||||||
4.750%, 01/15/2030 (A) | 454 | 480 | ||||||
Ziggo BV | ||||||||
4.875%, 01/15/2030 (A) | 686 | 701 | ||||||
|
|
| ||||||
| 57,132 | ||||||||
|
|
| ||||||
Consumer Staples — 2.1% | ||||||||
Altria Group | ||||||||
2.350%, 05/06/2025 | 425 | 441 | ||||||
Anheuser-Busch InBev Worldwide | ||||||||
4.750%, 01/23/2029 | 1,650 | 1,927 | ||||||
Bellis Acquisition | ||||||||
3.250%, 02/16/2026 (A) | GBP | 200 | 277 | |||||
BRF | ||||||||
4.875%, 01/24/2030 | $ | 1,440 | 1,469 | |||||
Constellation Brands | ||||||||
3.150%, 08/01/2029 | 600 | 628 | ||||||
Coty | ||||||||
4.000%, 04/15/2023 | EUR | 1,625 | 1,866 | |||||
Herbalife Nutrition | ||||||||
7.875%, 09/01/2025 (A) | $ | 603 | 656 | |||||
H-Food Holdings | ||||||||
8.500%, 06/01/2026 (A) | 500 | 511 | ||||||
HLF Financing Sarl | ||||||||
7.250%, 08/15/2026 (A) | 1,452 | 1,521 | ||||||
Keurig Dr Pepper | ||||||||
4.597%, 05/25/2028 | 1,000 | 1,155 | ||||||
Kraft Heinz Foods | ||||||||
5.500%, 06/01/2050 | 190 | 233 | ||||||
5.000%, 07/15/2035 | 1,546 | 1,779 | ||||||
4.875%, 10/01/2049 | 330 | 369 | ||||||
4.375%, 06/01/2046 | 1,671 | 1,742 | ||||||
Kronos Acquisition Holdings | ||||||||
7.000%, 12/31/2027 (A) | 880 | 843 | ||||||
Lindley | ||||||||
4.625%, 04/12/2023 | 190 | 196 | ||||||
Performance Food Group | ||||||||
6.875%, 05/01/2025 (A) | 3 | 3 | ||||||
5.500%, 10/15/2027 (A) | 450 | 471 | ||||||
Post Holdings | ||||||||
4.625%, 04/15/2030 (A) | 429 | 430 | ||||||
Prosperous Ray | ||||||||
4.625%, 11/12/2023 | 300 | 325 | ||||||
Spectrum Brands | ||||||||
5.000%, 10/01/2029 (A) | 75 | 79 | ||||||
Triton Water Holdings Inc. | ||||||||
6.250%, 04/01/2029 (A) | 470 | 479 | ||||||
United Natural Foods | ||||||||
6.750%, 10/15/2028 (A) | 664 | 710 | ||||||
| 198 | SEI Institutional Managed Trust / Semi-Annual Report / March 31, 2021 |
| Description | Face Amount (Thousands) | Market Value ($ Thousands) | ||||||
CORPORATE OBLIGATIONS (continued) |
| |||||||
US Foods | ||||||||
4.750%, 02/15/2029 (A) | $ | 1,171 | $ | 1,171 | ||||
|
|
| ||||||
| 19,281 | ||||||||
|
|
| ||||||
Energy — 7.1% | ||||||||
Antero Midstream Partners | ||||||||
5.750%, 03/01/2027 (A) | 950 | 950 | ||||||
5.375%, 09/15/2024 | 1,060 | 1,072 | ||||||
Berry Petroleum | ||||||||
7.000%, 02/15/2026 (A) | 1,500 | 1,451 | ||||||
Blue Racer Midstream | ||||||||
7.625%, 12/15/2025 (A) | 570 | 614 | ||||||
Buckeye Partners | ||||||||
4.350%, 10/15/2024 | 245 | 252 | ||||||
4.125%, 12/01/2027 | 865 | 854 | ||||||
3.950%, 12/01/2026 | 860 | 850 | ||||||
Cenovus Energy | ||||||||
5.375%, 07/15/2025 | 825 | 927 | ||||||
Cheniere Corpus Christi Holdings | ||||||||
7.000%, 06/30/2024 | 250 | 288 | ||||||
5.125%, 06/30/2027 | 850 | 972 | ||||||
Continental Resources | ||||||||
4.500%, 04/15/2023 | 131 | 136 | ||||||
4.375%, 01/15/2028 | 100 | 106 | ||||||
DCP Midstream Operating | ||||||||
6.750%, 09/15/2037 (A) | 302 | 337 | ||||||
6.450%, 11/03/2036 (A) | 115 | 129 | ||||||
5.375%, 07/15/2025 | 650 | 704 | ||||||
Devon Energy | ||||||||
5.850%, 12/15/2025 | 1,021 | 1,190 | ||||||
5.000%, 06/15/2045 | 200 | 218 | ||||||
Endeavor Energy Resources | ||||||||
5.500%, 01/30/2026 (A) | 330 | 342 | ||||||
Energy Transfer Operating | ||||||||
4.200%, 09/15/2023 | 3,225 | 3,453 | ||||||
EQT | ||||||||
8.500%, 02/01/2030 | 190 | 242 | ||||||
Equities Midstream Partners | ||||||||
4.000%, 08/01/2024 | 640 | 651 | ||||||
Exterran Energy Solutions | ||||||||
8.125%, 05/01/2025 | 700 | 644 | ||||||
Gazprom PJSC Via Gaz Capital | ||||||||
4.950%, 03/23/2027 (A) | 500 | 547 | ||||||
Gazprom PJSC Via Gaz Capital MTN | ||||||||
7.288%, 08/16/2037 | 300 | 393 | ||||||
Genesis Energy | ||||||||
7.750%, 02/01/2028 | 718 | 718 | ||||||
Global Partners | ||||||||
6.875%, 01/15/2029 | 545 | 585 | ||||||
GNL Quintero | ||||||||
4.634%, 07/31/2029 | 400 | 439 | ||||||
| Description | Face Amount (Thousands) | Market Value ($ Thousands) | ||||||
CORPORATE OBLIGATIONS (continued) |
| |||||||
Indigo Natural Resources | ||||||||
5.375%, 02/01/2029 (A) | $ | 1,175 | $ | 1,158 | ||||
KazMunayGas National JSC | ||||||||
4.750%, 04/19/2027 (A) | 800 | 912 | ||||||
KazTransGas JSC | ||||||||
4.375%, 09/26/2027 (A) | 300 | 334 | ||||||
Laredo Petroleum | ||||||||
9.500%, 01/15/2025 | 498 | 479 | ||||||
Marathon Petroleum | ||||||||
3.800%, 04/01/2028 | 325 | 351 | ||||||
3.625%, 09/15/2024 | 350 | 378 | ||||||
MEG Energy | ||||||||
7.125%, 02/01/2027 (A) | 1,190 | 1,247 | ||||||
5.875%, 02/01/2029 (A) | 500 | 501 | ||||||
MPLX | ||||||||
4.800%, 02/15/2029 | 250 | 286 | ||||||
4.000%, 03/15/2028 | 950 | 1,048 | ||||||
Nabors Industries | ||||||||
9.000%, 02/01/2025 (A) | 1,597 | 1,637 | ||||||
NGL Energy Operating | ||||||||
7.500%, 02/01/2026 (A) | 1,025 | 1,052 | ||||||
NGL Energy Partners | ||||||||
7.500%, 11/01/2023 | 1,150 | 1,110 | ||||||
NGPL PipeCo | ||||||||
7.768%, 12/15/2037 (A) | 1,000 | 1,324 | ||||||
NuStar Logistics | ||||||||
6.375%, 10/01/2030 | 670 | 724 | ||||||
6.000%, 06/01/2026 | 915 | 986 | ||||||
Occidental Petroleum | ||||||||
8.000%, 07/15/2025 | 1,015 | 1,165 | ||||||
7.200%, 03/15/2029 | 140 | 153 | ||||||
7.150%, 05/15/2028 | 1,000 | 1,090 | ||||||
6.625%, 09/01/2030 | 700 | 787 | ||||||
6.125%, 01/01/2031 | 330 | 364 | ||||||
5.550%, 03/15/2026 | 725 | 769 | ||||||
4.400%, 04/15/2046 | 390 | 331 | ||||||
ONEOK | ||||||||
6.350%, 01/15/2031 | 325 | 407 | ||||||
Parsley Energy | ||||||||
5.625%, 10/15/2027 (A) | 480 | 520 | ||||||
PBF Holding | ||||||||
9.250%, 05/15/2025 (A) | 180 | 184 | ||||||
Petrobras Global Finance BV | ||||||||
5.299%, 01/27/2025 | 1,160 | 1,282 | ||||||
Petroleos de Venezuela | ||||||||
6.000%, 10/28/2022 (C) | 8,860 | 243 | ||||||
6.000%, 05/16/2024 (C) | 3,790 | 165 | ||||||
6.000%, 11/15/2026 (C) | 1,110 | 48 | ||||||
5.500%, 04/12/2037 (C) | 130 | 6 | ||||||
5.375%, 04/12/2027 (C) | 2,570 | 112 | ||||||
Petroleos Mexicanos | ||||||||
7.690%, 01/23/2050 | 406 | 379 | ||||||
| SEI Institutional Managed Trust / Semi-Annual Report / March 31, 2021 | 199 |
SCHEDULE OF INVESTMENTS (Unaudited)
March 31, 2021
Multi-Asset Income Fund (Continued)
| Description | Face Amount (Thousands) | Market Value ($ Thousands) | ||||||
CORPORATE OBLIGATIONS (continued) |
| |||||||
6.950%, 01/28/2060 | $ | 207 | $ | 179 | ||||
6.500%, 03/13/2027 | 430 | 449 | ||||||
6.490%, 01/23/2027 | 160 | 167 | ||||||
6.350%, 02/12/2048 | 242 | 201 | ||||||
5.350%, 02/12/2028 | 180 | 175 | ||||||
4.500%, 01/23/2026 | 40 | 40 | ||||||
Petroleos Mexicanos MTN | ||||||||
6.750%, 09/21/2047 | 20 | 17 | ||||||
Phillips 66 | ||||||||
3.900%, 03/15/2028 | 525 | 576 | ||||||
Plains All American Pipeline | ||||||||
3.650%, 06/01/2022 | 1,700 | 1,740 | ||||||
3.600%, 11/01/2024 | 175 | 186 | ||||||
Range Resources | ||||||||
9.250%, 02/01/2026 | 1,740 | 1,891 | ||||||
8.250%, 01/15/2029 (A) | 210 | 225 | ||||||
5.875%, 07/01/2022 | 196 | 197 | ||||||
5.000%, 08/15/2022 | 220 | 224 | ||||||
5.000%, 03/15/2023 | 730 | 742 | ||||||
ReNew Power Synthetic | ||||||||
6.670%, 03/12/2024 | 200 | 210 | ||||||
Sabine Pass Liquefaction | ||||||||
5.625%, 03/01/2025 | 800 | 914 | ||||||
SEPLAT Petroleum Development | ||||||||
9.250%, 04/01/2023 | 550 | 563 | ||||||
Summit Midstream Holdings | ||||||||
5.750%, 04/15/2025 | 925 | 754 | ||||||
5.500%, 08/15/2022 | 1,100 | 1,064 | ||||||
Summit Midstream Partners | ||||||||
9.500%, VAR ICE LIBOR USD 3 Month+7.430%(E) | 757 | 467 | ||||||
Suncor Energy | ||||||||
3.100%, 05/15/2025 | 400 | 427 | ||||||
Sunoco | ||||||||
5.500%, 02/15/2026 | 240 | 247 | ||||||
4.500%, 05/15/2029 (A) | 780 | 777 | ||||||
Tallgrass Energy Partners | ||||||||
6.000%, 12/31/2030 (A) | 230 | 227 | ||||||
5.500%, 09/15/2024 (A) | 472 | 479 | ||||||
Targa Resources Partners | ||||||||
4.875%, 02/01/2031 (A) | 830 | 841 | ||||||
4.000%, 01/15/2032 (A) | 170 | 160 | ||||||
TechnipFMC | ||||||||
6.500%, 02/01/2026 (A) | 1,270 | 1,328 | ||||||
Total Capital International | ||||||||
2.829%, 01/10/2030 | 1,350 | 1,403 | ||||||
Transocean | ||||||||
11.500%, 01/30/2027 (A) | 3,565 | 3,058 | ||||||
7.500%, 01/15/2026 (A) | 500 | 319 | ||||||
Transocean Poseidon | ||||||||
6.875%, 02/01/2027 (A) | 470 | 434 | ||||||
| Description | Face Amount (Thousands) | Market Value ($ Thousands) | ||||||
CORPORATE OBLIGATIONS (continued) |
| |||||||
Transportadora de Gas del Sur | ||||||||
6.750%, 05/02/2025 (A) | $ | 1,250 | $ | 1,081 | ||||
USA Compression Partners | ||||||||
6.875%, 04/01/2026 | 1,175 | 1,205 | ||||||
Valero Energy | ||||||||
2.850%, 04/15/2025 | 350 | 366 | ||||||
Western Midstream Operating | ||||||||
5.450%, 04/01/2044 | 1,100 | 1,128 | ||||||
5.300%, 03/01/2048 | 530 | 532 | ||||||
WPX Energy | ||||||||
4.500%, 01/15/2030 | 173 | 186 | ||||||
YPF | ||||||||
4.000%, 9.000%, 01/01/2023, 02/12/2026 (A)(F) | 825 | 673 | ||||||
|
|
| ||||||
| 66,448 | ||||||||
|
|
| ||||||
Financials — 10.4% | ||||||||
ABN AMRO Bank | ||||||||
4.375% (D)(E) | EUR | 400 | 500 | |||||
Acrisure | ||||||||
4.250%, 02/15/2029 (A) | $ | 975 | 959 | |||||
AIA Group | ||||||||
3.900%, 04/06/2028 (A) | 475 | 520 | ||||||
AIA Group MTN | ||||||||
3.200%, 03/11/2025 (A) | 425 | 452 | ||||||
AIB Group MTN | ||||||||
4.750%, 10/12/2023 (A) | 550 | 601 | ||||||
Akbank T.A.S. | ||||||||
6.797%, VAR USD Swap Semi 30/360 5 Yr Curr+4.029%, | 200 | 185 | ||||||
Alliant Holdings Intermediate | ||||||||
6.750%, 10/15/2027 (A) | 760 | 816 | ||||||
American Express | ||||||||
3.469%, VAR ICE LIBOR USD 3 Month+3.285%(E) | 370 | 367 | ||||||
American International Group | ||||||||
4.200%, 04/01/2028 | 275 | 309 | ||||||
3.900%, 04/01/2026 | 325 | 358 | ||||||
3.400%, 06/30/2030 | 225 | 239 | ||||||
Arch Capital Finance | ||||||||
4.011%, 12/15/2026 | 1,025 | 1,154 | ||||||
Aviation Capital Group | ||||||||
5.500%, 12/15/2024 (A) | 390 | 436 | ||||||
1.950%, 01/30/2026 (A) | 350 | 341 | ||||||
Avolon Holdings Funding | ||||||||
5.125%, 10/01/2023 (A) | 140 | 149 | ||||||
4.250%, 04/15/2026 (A) | 430 | 450 | ||||||
2.875%, 02/15/2025 (A) | 1,250 | 1,245 | ||||||
Banco Bilbao Vizcaya Argentaria | ||||||||
5.875%, VAR EUR Swap Annual 5 Yr+5.660%(E) | EUR | 800 | 1,001 | |||||
| 200 | SEI Institutional Managed Trust / Semi-Annual Report / March 31, 2021 |
| Description | Face Amount (Thousands) | Market Value ($ Thousands) | ||||||
CORPORATE OBLIGATIONS (continued) |
| |||||||
Banco de Bogota | ||||||||
6.250%, 05/12/2026 (A) | $ | 980 | $ | 1,100 | ||||
Banco do Brasil | ||||||||
9.000%, VAR US Treas Yield Curve Rate T Note Const Mat 10 Yr+6.362%(E) | 200 | 218 | ||||||
6.250%, VAR US Treas Yield Curve Rate T Note Const Mat 10 Yr+4.398%(E) | 1,920 | 1,888 | ||||||
Banco Mercantil del Norte | ||||||||
7.625%, VAR US Treas Yield Curve Rate T Note Const Mat 10 Yr+5.353%(A)(E) | 200 | 219 | ||||||
7.500%, VAR US Treas Yield Curve Rate T Note Const Mat 10 Yr+5.470%(A)(E) | 970 | 1,061 | ||||||
6.750%, VAR US Treas Yield Curve Rate T Note Const Mat 5 Yr+4.967%(A)(E) | 420 | 438 | ||||||
Banco Santander | ||||||||
4.250%, 04/11/2027 | 400 | 446 | ||||||
3.306%, 06/27/2029 | 400 | 424 | ||||||
2.749%, 12/03/2030 | 200 | 190 | ||||||
2.746%, 05/28/2025 | 600 | 626 | ||||||
Bank of America | ||||||||
6.250%, VAR ICE LIBOR USD 3 Month+3.705%(E) | 150 | 166 | ||||||
3.419%, VAR ICE LIBOR USD 3 Month+1.040%, 12/20/2028 | 2,115 | 2,267 | ||||||
Bank of America MTN | ||||||||
4.200%, 08/26/2024 | 1,050 | 1,158 | ||||||
4.000%, 01/22/2025 | 1,350 | 1,475 | ||||||
3.824%, VAR ICE LIBOR USD 3 Month+1.575%, 01/20/2028 | 1,525 | 1,675 | ||||||
Banque Centrale de Tunisie International Bond | ||||||||
6.750%, 10/31/2023 (A) | EUR | 440 | 472 | |||||
Banque Ouest Africaine de Developpement | ||||||||
2.750%, 01/22/2033 (A) | 1,870 | 2,261 | ||||||
Barclays | ||||||||
8.000%, VAR US Treas Yield Curve Rate T Note Const Mat 5 Yr+5.672%(E) | $ | 1,170 | 1,299 | |||||
7.125%, VAR UK Govt Bonds 5 Year Note Generic Bid Yield+6.579%(E) | GBP | 700 | 1,087 | |||||
2.852%, VAR United States Secured Overnight Financing Rate+2.714%, 05/07/2026 | $ | 725 | 759 | |||||
BBVA Bancomer | ||||||||
5.125%, VAR US Treas Yield Curve Rate T Note Const Mat 5 Yr+2.650%, | 410 | 422 | ||||||
| Description | Face Amount (Thousands) | Market Value ($ Thousands) | ||||||
CORPORATE OBLIGATIONS (continued) |
| |||||||
BNP Paribas | ||||||||
3.375%, 01/09/2025 (A) | $ | 1,000 | $ | 1,073 | ||||
1.323%, VAR United States Secured Overnight Financing Rate+1.004%, 01/13/2027 (A) | 675 | 660 | ||||||
BPCE | ||||||||
4.625%, 09/12/2028 (A) | 500 | 577 | ||||||
2.277%, VAR United States Secured Overnight Financing Rate+1.312%, 01/20/2032 (A) | 375 | 362 | ||||||
CIT Group | ||||||||
6.125%, 03/09/2028 | 195 | 233 | ||||||
5.250%, 03/07/2025 | 185 | 208 | ||||||
Citigroup | ||||||||
6.300%, VAR ICE LIBOR USD 3 Month+3.423%(E) | 1,250 | 1,328 | ||||||
5.900%, VAR ICE LIBOR USD 3 Month+4.230%(E) | 675 | 713 | ||||||
4.289%, VAR ICE LIBOR USD 3 Month+4.095%(E) | 700 | 696 | ||||||
4.125%, 07/25/2028 | 1,450 | 1,606 | ||||||
3.400%, 05/01/2026 | 1,675 | 1,824 | ||||||
Commerzbank | ||||||||
6.125% (D)(E) | EUR | 400 | 503 | |||||
Compass Group Diversified Holdings | ||||||||
5.250%, 04/15/2029 (A) | $ | 548 | 574 | |||||
Cooperatieve Rabobank UA | ||||||||
4.625%, VAR EUR Swap Annual 5 Yr+4.098%(E) | EUR | 1,400 | 1,799 | |||||
Credit Agricole | ||||||||
6.500%, VAR EUR Swap Annual 5 Yr+5.120%(E) | 490 | 584 | ||||||
Credit Bank of Moscow Via CBOM Finance | ||||||||
7.500%, VAR USD Swap Semi 30/360 5 Yr Curr+5.416%, 10/05/2027 | $ | 470 | 474 | |||||
Credit Suisse Group | ||||||||
7.500%, VAR USD Swap Semi 30/360 5 Yr Curr+4.600%(A)(E) | 410 | 433 | ||||||
7.250%, VAR USD ICE Swap 11:00 NY 5 Yr+4.332%(A)(E) | 200 | 217 | ||||||
3.869%, VAR ICE LIBOR USD 3 Month+1.410%, 01/12/2029 (A) | 600 | 643 | ||||||
Credit Suisse Group Funding Guernsey | ||||||||
4.550%, 04/17/2026 | 802 | 897 | ||||||
Deutsche Bank | ||||||||
6.000%, VAR US Treas Yield Curve Rate T Note Const Mat 5 Yr+4.524%(E) | 400 | 405 | ||||||
Deutsche Bank NY | ||||||||
3.729%, VAR United States Secured Overnight Financing Rate+2.757%, 01/14/2032 | 2,350 | 2,287 | ||||||
| SEI Institutional Managed Trust / Semi-Annual Report / March 31, 2021 | 201 |
SCHEDULE OF INVESTMENTS (Unaudited)
March 31, 2021
Multi-Asset Income Fund (Continued)
| Description | Face Amount (Thousands) | Market Value ($ Thousands) | ||||||
CORPORATE OBLIGATIONS (continued) |
| |||||||
DP World MTN | ||||||||
5.625%, 09/25/2048 | $ | 200 | $ | 234 | ||||
Eastern & Southern African Trade & Development Bank MTN | ||||||||
5.375%, 03/14/2022 | 210 | 215 | ||||||
Erste Group Bank | ||||||||
6.500%, VAR EUR Swap Annual 5 Yr+6.204%(E) | EUR | 400 | 528 | |||||
Finance of America Funding |
| |||||||
7.875%, 11/15/2025 (A) | $ | 300 | 310 | |||||
First Horizon National | ||||||||
4.000%, 05/26/2025 | 625 | 686 | ||||||
3.550%, 05/26/2023 | 650 | 687 | ||||||
Freedom Mortgage | ||||||||
7.625%, 05/01/2026 (A) | 1,450 | 1,522 | ||||||
Global Aircraft Leasing | ||||||||
7.250%cash/7.250% PIK, 09/15/2024 (A) | 3,078 | 2,951 | ||||||
HSBC Holdings | ||||||||
5.250%, VAR EUR Swap Annual 5 Yr+4.383%(E) | EUR | 700 | 861 | |||||
4.950%, 03/31/2030 | $ | 226 | 264 | |||||
3.803%, VAR ICE LIBOR USD 3 Month+1.211%, | 700 | 756 | ||||||
1.645%, VAR United States Secured Overnight Financing Rate+1.538%, | 1,000 | 1,000 | ||||||
Huarong Finance 2017 | ||||||||
4.500% (D)(E) | 200 | 201 | ||||||
Huarong Finance 2017 MTN | ||||||||
4.000% (D)(E) | 310 | 314 | ||||||
Huarong Finance 2019 MTN | ||||||||
3.750%, 05/29/2024 | 250 | 263 | ||||||
Huarong Finance II MTN | ||||||||
5.000%, 11/19/2025 | 210 | 231 | ||||||
4.625%, 06/03/2026 | 610 | 659 | ||||||
Intercontinental Exchange | ||||||||
2.100%, 06/15/2030 | 800 | 770 | ||||||
Intesa Sanpaolo MTN | ||||||||
5.710%, 01/15/2026 (A) | 1,080 | 1,210 | ||||||
Itau Unibanco Holding | ||||||||
4.625%, VAR US Treas Yield Curve Rate T Note Const Mat 5 Yr+3.222%(A)(E) | 1,120 | 1,049 | ||||||
JPMorgan Chase | ||||||||
4.125%, 12/15/2026 | 3,400 | 3,827 | ||||||
2.956%, VAR United States Secured Overnight Financing Rate+2.515%, | 250 | 254 | ||||||
Kaisa Group Holdings | ||||||||
8.500%, 06/30/2022 | 200 | 203 | ||||||
LD Holdings Group | ||||||||
6.500%, 11/01/2025 (A) | 860 | 901 | ||||||
| Description | Face Amount (Thousands) | Market Value ($ Thousands) | ||||||
CORPORATE OBLIGATIONS (continued) |
| |||||||
6.125%, 04/01/2028 (A) | $ | 1,155 | $ | 1,175 | ||||
Lloyds Banking Group | ||||||||
4.947% (D)(E) | EUR | 290 | 370 | |||||
Morgan Stanley | ||||||||
3.625%, 01/20/2027 | $ | 750 | 823 | |||||
Morgan Stanley MTN | ||||||||
3.950%, 04/23/2027 | 1,100 | 1,216 | ||||||
1.794%, VAR United States Secured Overnight Financing Rate+1.034%, | 625 | 581 | ||||||
MPH Acquisition Holdings | ||||||||
5.750%, 11/01/2028 (A) | 1,473 | 1,444 | ||||||
Nationstar Mortgage Holdings | ||||||||
5.500%, 08/15/2028 (A) | 1,754 | 1,761 | ||||||
Nationwide Building Society | ||||||||
3.960%, VAR ICE LIBOR USD 3 Month+1.855%, | 450 | 491 | ||||||
Natwest Group | ||||||||
8.000%, VAR USD Swap Semi 30/360 5 Yr Curr+5.720%(E) | 750 | 879 | ||||||
4.500%, VAR UK Govt Bonds 5 Year Note Generic Bid Yield+3.992%(E) | GBP | 1,160 | 1,596 | |||||
3.754%, VAR US Treas Yield Curve Rate T Note Const Mat 5 Yr+2.100%, | $ | 225 | 239 | |||||
2.523%, VAR ICE LIBOR USD 3 Month+2.320%(E) | 1,000 | 974 | ||||||
Navient | ||||||||
5.000%, 03/15/2027 | 1,100 | 1,103 | ||||||
NFP | ||||||||
6.875%, 08/15/2028 (A) | 1,353 | 1,405 | ||||||
NMI Holdings | ||||||||
7.375%, 06/01/2025 (A) | 570 | 658 | ||||||
Noble Holdings International |
| |||||||
11.000%, 02/15/2028 | 248 | 259 | ||||||
OneMain Finance | ||||||||
4.000%, 09/15/2030 | 732 | 712 | ||||||
Park Aerospace Holdings | ||||||||
4.500%, 03/15/2023 (A) | 170 | 178 | ||||||
Raymond James Financial | ||||||||
4.650%, 04/01/2030 | 400 | 465 | ||||||
Turkiye Vakiflar Bankasi TAO |
| |||||||
8.125%, 03/28/2024 | 760 | 782 | ||||||
6.500%, 01/08/2026 (A) | 680 | 651 | ||||||
UBS Group | ||||||||
7.000%, VAR USD Swap Semi 30/360 5 Yr Curr+4.344%(A)(E) | 510 | 560 | ||||||
7.000%, VAR USSW5YF+4.866%(E) | 1,050 | 1,197 | ||||||
UniCredit MTN | ||||||||
7.296%, VAR USD ICE Swap 11:00 NY 5 Yr+4.914%, | 460 | 542 | ||||||
| 202 | SEI Institutional Managed Trust / Semi-Annual Report / March 31, 2021 |
| Description | Face Amount (Thousands) | Market Value ($ Thousands) | ||||||
CORPORATE OBLIGATIONS (continued) |
| |||||||
5.459%, VAR US Treas Yield Curve Rate T Note Const Mat 5 Yr+4.750%, | $ | 440 | $ | 466 | ||||
United Wholesale Mortgage | ||||||||
5.500%, 04/15/2029 (A) | 1,360 | 1,358 | ||||||
Wells Fargo | ||||||||
5.875%, VAR ICE LIBOR USD 3 Month+3.990%(E) | 525 | 578 | ||||||
Wells Fargo MTN | ||||||||
4.100%, 06/03/2026 | 1,575 | 1,750 | ||||||
Yapi ve Kredi Bankasi | ||||||||
7.875%, VAR US Treas Yield Curve Rate T Note Const Mat 5 Yr+7.415%, 01/22/2031 (A) | 1,050 | 1,018 | ||||||
Yapi ve Kredi Bankasi MTN | ||||||||
13.875%, VAR USD Swap Semi 30/360 5 Yr Curr+11.245%(E) | 480 | 531 | ||||||
8.250%, 10/15/2024 (A) | 500 | 520 | ||||||
6.100%, 03/16/2023 | 510 | 510 | ||||||
|
|
| ||||||
| 94,517 | ||||||||
|
|
| ||||||
Health Care — 2.5% | ||||||||
AbbVie | ||||||||
3.200%, 11/21/2029 | 1,375 | 1,462 | ||||||
AdaptHealth | ||||||||
6.125%, 08/01/2028 (A) | 670 | 710 | ||||||
4.625%, 08/01/2029 (A) | 705 | 701 | ||||||
Akumin | ||||||||
7.000%, 11/01/2025 (A) | 500 | 532 | ||||||
Bausch Health | ||||||||
5.000%, 01/30/2028 (A) | 325 | 331 | ||||||
Bausch Health Americas | ||||||||
8.500%, 01/31/2027 (A) | 700 | 777 | ||||||
Bayer US Finance II | ||||||||
4.375%, 12/15/2028 (A) | 300 | 338 | ||||||
4.250%, 12/15/2025 (A) | 500 | 556 | ||||||
Becton Dickinson | ||||||||
3.700%, 06/06/2027 | 690 | 760 | ||||||
2.823%, 05/20/2030 | 625 | 640 | ||||||
CAB SELAS | ||||||||
3.375%, 02/01/2028 (A) | EUR | 475 | 556 | |||||
Catalent Pharma Solutions | ||||||||
3.125%, 02/15/2029 (A) | $ | 440 | 422 | |||||
Cheplapharm Arzneimittel GmbH | ||||||||
5.500%, 01/15/2028 (A) | 1,188 | 1,234 | ||||||
CHS | ||||||||
6.875%, 04/15/2029 (A) | 930 | 972 | ||||||
4.750%, 02/15/2031 (A) | 945 | 923 | ||||||
Cidron Aida Finco Sarl | ||||||||
6.250%, 04/01/2028 (A) | GBP | 440 | 613 | |||||
CVS Health | ||||||||
3.750%, 04/01/2030 | $ | 590 | 640 | |||||
| Description | Face Amount (Thousands) | Market Value ($ Thousands) | ||||||
CORPORATE OBLIGATIONS (continued) |
| |||||||
DaVita | ||||||||
3.750%, 02/15/2031 (A) | $ | 1,760 | $ | 1,686 | ||||
DENTSPLY SIRONA | ||||||||
3.250%, 06/01/2030 | 325 | 340 | ||||||
DH Europe Finance II Sarl | ||||||||
2.600%, 11/15/2029 | 175 | 179 | ||||||
Endo DAC | ||||||||
9.500%, 07/31/2027 (A) | 650 | 706 | ||||||
Endo Luxembourg Finance I S.a.r.l. | ||||||||
6.125%, 04/01/2029 (A) | 600 | 606 | ||||||
Laboratoire Eimer Selas | ||||||||
5.000%, 02/01/2029 (A) | EUR | 225 | 268 | |||||
LifePoint Health | ||||||||
5.375%, 01/15/2029 (A) | $ | 1,185 | 1,167 | |||||
Prestige Brands | ||||||||
3.750%, 04/01/2031 (A) | 810 | 773 | ||||||
Prime Security Services Borrower |
| |||||||
6.250%, 01/15/2028 (A) | 330 | 344 | ||||||
Radiology Partners | ||||||||
9.250%, 02/01/2028 (A) | 400 | 436 | ||||||
Select Medical | ||||||||
6.250%, 08/15/2026 (A) | 450 | 478 | ||||||
Stryker | ||||||||
1.950%, 06/15/2030 | 825 | 796 | ||||||
Tenet Healthcare | ||||||||
6.250%, 02/01/2027 (A) | 200 | 211 | ||||||
Teva Pharmaceutical Finance LLC | ||||||||
6.150%, 02/01/2036 | 380 | 410 | ||||||
Teva Pharmaceutical Finance Netherlands III BV | ||||||||
3.150%, 10/01/2026 | 320 | 306 | ||||||
US Renal Care | ||||||||
10.625%, 07/15/2027 (A) | 40 | 44 | ||||||
Verisure Holding | ||||||||
3.250%, 02/15/2027 (A) | EUR | 475 | 563 | |||||
Verisure Midholding | ||||||||
5.250%, 02/15/2029 (A) | 500 | 607 | ||||||
Zimmer Biomet Holdings | ||||||||
3.550%, 03/20/2030 | $ | 800 | 855 | |||||
Zoetis | ||||||||
2.000%, 05/15/2030 | 1,100 | 1,059 | ||||||
|
|
| ||||||
| 24,001 | ||||||||
|
|
| ||||||
Industrials — 7.0% | ||||||||
AerCap Ireland Capital DAC | ||||||||
6.500%, 07/15/2025 | 285 | 332 | ||||||
4.875%, 01/16/2024 | 400 | 435 | ||||||
4.625%, 07/01/2022 | 2,300 | 2,406 | ||||||
4.500%, 09/15/2023 | 340 | 366 | ||||||
Aeropuertos Dominicanos Siglo XXI |
| |||||||
6.750%, 03/30/2029 (A) | 350 | 365 | ||||||
| SEI Institutional Managed Trust / Semi-Annual Report / March 31, 2021 | 203 |
SCHEDULE OF INVESTMENTS (Unaudited)
March 31, 2021
Multi-Asset Income Fund (Continued)
| Description | Face Amount (Thousands) | Market Value ($ Thousands) | ||||||
CORPORATE OBLIGATIONS (continued) |
| |||||||
Air Lease | ||||||||
4.650%, VAR US Treas Yield Curve Rate T Note Const Mat 5 Yr+4.076%(E) | $ | 575 | $ | 566 | ||||
3.250%, 03/01/2025 | 850 | 895 | ||||||
Air Lease MTN | ||||||||
3.750%, 06/01/2026 | 600 | 641 | ||||||
Allied Universal Holdco | ||||||||
9.750%, 07/15/2027 | 649 | 712 | ||||||
American Airlines | ||||||||
5.750%, 04/20/2029 (A) | 1,071 | 1,141 | ||||||
5.500%, 04/20/2026 (A) | 582 | 607 | ||||||
American News | ||||||||
8.500%, 09/01/2026 (A) | 2,063 | 2,310 | ||||||
Arcosa | ||||||||
4.375%, 04/15/2029 (A) | 500 | 500 | ||||||
Avis Budget Car Rental | ||||||||
6.375%, 04/01/2024 (A) | 10 | 10 | ||||||
5.375%, 03/01/2029 (A) | 705 | 729 | ||||||
Boeing | ||||||||
5.930%, 05/01/2060 | 410 | 524 | ||||||
5.805%, 05/01/2050 | 350 | 441 | ||||||
5.150%, 05/01/2030 | 150 | 172 | ||||||
3.450%, 11/01/2028 | 375 | 385 | ||||||
3.250%, 03/01/2028 | 425 | 435 | ||||||
Bombardier | ||||||||
7.500%, 03/15/2025 (A) | 350 | 344 | ||||||
6.125%, 01/15/2023 (A) | 810 | 844 | ||||||
Carrier Global | ||||||||
2.493%, 02/15/2027 | 1,100 | 1,135 | ||||||
2.242%, 02/15/2025 | 2,125 | 2,200 | ||||||
Core & Main Holdings LP | ||||||||
8.625%cash/9.375% PIK, 09/15/2024 (A) | 650 | 660 | ||||||
CoreCivic | ||||||||
4.625%, 05/01/2023 | 280 | 276 | ||||||
Cornerstone Building Brands | ||||||||
6.125%, 01/15/2029 (A) | 827 | 881 | ||||||
CoStar Group | ||||||||
2.800%, 07/15/2030 (A) | 625 | 611 | ||||||
CP Atlas Buyer | ||||||||
7.000%, 12/01/2028 (A) | 955 | 1,004 | ||||||
Delta Air Lines | ||||||||
7.000%, 05/01/2025 (A) | 1,050 | 1,209 | ||||||
DP World MTN | ||||||||
6.850%, 07/02/2037 (A) | 100 | 129 | ||||||
5.625%, 09/25/2048 (A) | 750 | 879 | ||||||
Dun & Bradstreet | ||||||||
6.875%, 08/15/2026 (A) | 688 | 735 | ||||||
Dycom Industries | ||||||||
4.500%, 04/15/2029 (A) | 1,177 | 1,179 | ||||||
| Description | Face Amount (Thousands) | Market Value ($ Thousands) | ||||||
CORPORATE OBLIGATIONS (continued) |
| |||||||
GE Capital Funding | ||||||||
4.400%, 05/15/2030 (A) | $ | 425 | $ | 481 | ||||
GE Capital International Funding Unlimited Co | ||||||||
3.373%, 11/15/2025 | 400 | 434 | ||||||
General Electric MTN | ||||||||
6.875%, 01/10/2039 | 590 | 827 | ||||||
GFL Environmental | ||||||||
8.500%, 05/01/2027 (A) | 849 | 935 | ||||||
5.125%, 12/15/2026 (A) | 175 | 184 | ||||||
4.000%, 08/01/2028 (A) | 1,188 | 1,149 | ||||||
3.750%, 08/01/2025 (A) | 400 | 406 | ||||||
Granite Holdings US Acquisition |
| |||||||
11.000%, 10/01/2027 (A) | 820 | 925 | ||||||
H&E Equipment Services | ||||||||
3.875%, 12/15/2028 (A) | 340 | 331 | ||||||
Hawaiian Brand Intellectual Property |
| |||||||
5.750%, 01/20/2026 (A) | 1,365 | 1,451 | ||||||
Hillenbrand | ||||||||
3.750%, 03/01/2031 | 589 | 577 | ||||||
Husky III Holding | ||||||||
13.000%cash/13.750% PIK, 02/15/2025 (A) | 600 | 653 | ||||||
IAA | ||||||||
5.500%, 06/15/2027 (A) | 250 | 262 | ||||||
IHS Markit | ||||||||
4.750%, 08/01/2028 | 700 | 808 | ||||||
IHS Netherlands Holdco BV | ||||||||
7.125%, 03/18/2025 | 1,000 | 1,045 | ||||||
KOC Holding | ||||||||
6.500%, 03/11/2025 | 2,170 | 2,265 | ||||||
5.250%, 03/15/2023 | 1,330 | 1,347 | ||||||
Legends Hospitality Holding | ||||||||
5.000%, 02/01/2026 (A) | 510 | 519 | ||||||
Mexico City Airport Trust | ||||||||
5.500%, 10/31/2046 (A) | 400 | 396 | ||||||
5.500%, 07/31/2047 | 892 | 885 | ||||||
4.250%, 10/31/2026 (A) | 210 | 223 | ||||||
3.875%, 04/30/2028 (A) | 1,190 | 1,208 | ||||||
MHP Lux | ||||||||
6.950%, 04/03/2026 | 1,870 | 1,963 | ||||||
MV24 Capital BV | ||||||||
6.748%, 06/01/2034 | 3,217 | 3,339 | ||||||
Northrop Grumman | ||||||||
3.250%, 01/15/2028 | 1,950 | 2,091 | ||||||
Otis Worldwide | ||||||||
2.565%, 02/15/2030 | 1,425 | 1,434 | ||||||
Park-Ohio Industries | ||||||||
6.625%, 04/15/2027 | 1,090 | 1,101 | ||||||
RR Donnelley & Sons | ||||||||
8.250%, 07/01/2027 | 584 | 689 | ||||||
| 204 | SEI Institutional Managed Trust / Semi-Annual Report / March 31, 2021 |
| Description | Face Amount (Thousands) | Market Value ($ Thousands) | ||||||
CORPORATE OBLIGATIONS (continued) |
| |||||||
Sensata Technologies | ||||||||
4.000%, 04/15/2029 (A) | $ | 380 | $ | 387 | ||||
Spirit Loyalty Cayman | ||||||||
8.000%, 09/20/2025 (A) | 840 | 949 | ||||||
Stanley Black & Decker | ||||||||
4.250%, 11/15/2028 | 650 | 745 | ||||||
Swire Pacific Financing MTN | ||||||||
4.500%, 10/09/2023 | 200 | 217 | ||||||
Titan Acquisition | ||||||||
7.750%, 04/15/2026 (A) | 1,465 | 1,523 | ||||||
TransDigm | ||||||||
8.000%, 12/15/2025 (A) | 170 | 185 | ||||||
7.500%, 03/15/2027 | 260 | 277 | ||||||
6.500%, 05/15/2025 | 390 | 397 | ||||||
6.250%, 03/15/2026 (A) | 800 | 848 | ||||||
5.500%, 11/15/2027 | 960 | 992 | ||||||
4.625%, 01/15/2029 (A) | 505 | 497 | ||||||
TriMas | ||||||||
4.125%, 04/15/2029 (A) | 1,430 | 1,430 | ||||||
Uber Technologies | ||||||||
6.250%, 01/15/2028 (A) | 835 | 903 | ||||||
United Airlines, Pass Through Trust , Ser 2020-1, Class B | ||||||||
4.875%, 01/15/2026 | 80 | 83 | ||||||
WESCO Distribution | ||||||||
7.250%, 06/15/2028 (A) | 678 | 759 | ||||||
Wolverine Escrow | ||||||||
9.000%, 11/15/2026 (A) | 105 | 105 | ||||||
8.500%, 11/15/2024 (A) | 1,370 | 1,367 | ||||||
XPO CNW | ||||||||
6.700%, 05/01/2034 | 650 | 768 | ||||||
|
|
| ||||||
| 66,418 | ||||||||
|
|
| ||||||
Information Technology — 3.2% |
| |||||||
Arches Buyer | ||||||||
6.125%, 12/01/2028 (A) | 364 | 375 | ||||||
Austin BidCo | ||||||||
7.125%, 12/15/2028 (A) | 275 | 280 | ||||||
Banff Merger Sub | ||||||||
9.750%, 09/01/2026 (A) | 200 | 213 | ||||||
Blast Motion | ||||||||
7.000%, 01/15/2024 (A)(G) | 520 | 519 | ||||||
Broadcom | ||||||||
3.500%, 01/15/2028 | 53 | 56 | ||||||
3.500%, 02/15/2041 (A) | 525 | 500 | ||||||
3.469%, 04/15/2034 | 4,325 | 4,351 | ||||||
3.419%, 04/15/2033 | 1,150 | 1,171 | ||||||
Brunello Bidco | ||||||||
3.500%, 02/15/2028 (A) | EUR | 550 | 644 | |||||
Castle US Holding | ||||||||
9.500%, 02/15/2028 (A) | $ | 839 | 856 | |||||
| Description | Face Amount (Thousands) | Market Value ($ Thousands) | ||||||
CORPORATE OBLIGATIONS (continued) |
| |||||||
CommScope | ||||||||
8.250%, 03/01/2027 (A) | $ | 710 | $ | 760 | ||||
7.125%, 07/01/2028 (A) | 885 | 940 | ||||||
Dell International | ||||||||
6.020%, 06/15/2026 (A) | 1,600 | 1,893 | ||||||
5.450%, 06/15/2023 (A) | 525 | 574 | ||||||
Endure Digital | ||||||||
6.000%, 02/15/2029 (A) | 2,819 | 2,752 | ||||||
Global Payments | ||||||||
3.200%, 08/15/2029 | 225 | 237 | ||||||
2.650%, 02/15/2025 | 400 | 420 | ||||||
Hewlett Packard Enterprise | ||||||||
4.900%, 10/15/2025 | 1,865 | 2,126 | ||||||
Lam Research | ||||||||
1.900%, 06/15/2030 | 300 | 290 | ||||||
MEGlobal Canada ULC MTN | ||||||||
5.875%, 05/18/2030 (A) | 660 | 795 | ||||||
NCR | ||||||||
5.125%, 04/15/2029 (A) | 2,824 | 2,856 | ||||||
NXP BV | ||||||||
3.400%, 05/01/2030 (A) | 225 | 237 | ||||||
Open Text Holdings | ||||||||
4.125%, 02/15/2030 (A) | 3 | 3 | ||||||
Prosus | ||||||||
4.850%, 07/06/2027 (A) | 740 | 828 | ||||||
3.680%, 01/21/2030 (A) | 250 | 258 | ||||||
Prosus MTN | ||||||||
4.027%, 08/03/2050 (A) | 560 | 508 | ||||||
Saga | ||||||||
3.375%, 05/12/2024 | GBP | 610 | 793 | |||||
Seagate HDD Cayman | ||||||||
3.125%, 07/15/2029 (A) | $ | 1,769 | 1,708 | |||||
Shift4 Payments | ||||||||
4.625%, 11/01/2026 (A) | 490 | 510 | ||||||
Sunny Express Enterprises | ||||||||
3.350% (D)(E) | 200 | 203 | ||||||
Switch | ||||||||
3.750%, 09/15/2028 (A) | 450 | 443 | ||||||
TTM Technologies | ||||||||
4.000%, 03/01/2029 (A) | 349 | 344 | ||||||
ZoomInfo Technologies | ||||||||
3.875%, 02/01/2029 (A) | 630 | 616 | ||||||
|
|
| ||||||
| 29,059 | ||||||||
|
|
| ||||||
Materials — 3.0% | ||||||||
Anglo American Capital | ||||||||
5.625%, 04/01/2030 (A) | 500 | 597 | ||||||
Ardagh Metal Packaging Finance USA |
| |||||||
4.000%, 09/01/2029 (A) | 2,008 | 2,003 | ||||||
Axalta Coating Systems | ||||||||
3.375%, 02/15/2029 (A) | 1,405 | 1,370 | ||||||
| SEI Institutional Managed Trust / Semi-Annual Report / March 31, 2021 | 205 |
SCHEDULE OF INVESTMENTS (Unaudited)
March 31, 2021
Multi-Asset Income Fund (Continued)
| Description | Face Amount (Thousands) | Market Value ($ Thousands) | ||||||
CORPORATE OBLIGATIONS (continued) |
| |||||||
Berry Global | ||||||||
5.625%, 07/15/2027 (A) | $ | 550 | $ | 581 | ||||
1.570%, 01/15/2026 (A) | 325 | 320 | ||||||
Braskem Netherlands Finance BV |
| |||||||
4.500%, 01/10/2028 (A) | 970 | 997 | ||||||
Cemex | ||||||||
7.375%, 06/05/2027 (A) | 1,010 | 1,144 | ||||||
Cleveland-Cliffs | ||||||||
5.750%, 03/01/2025 | 550 | 567 | ||||||
4.875%, 03/01/2031 (A) | 715 | 703 | ||||||
Constellium | ||||||||
3.750%, 04/15/2029 (A) | 1,045 | 999 | ||||||
Element Solutions | ||||||||
3.875%, 09/01/2028 (A) | 303 | 299 | ||||||
First Quantum Minerals | ||||||||
6.875%, 10/15/2027 (A) | 1,100 | 1,180 | ||||||
Freeport-McMoRan | ||||||||
5.450%, 03/15/2043 | 750 | 900 | ||||||
Glencore Funding | ||||||||
4.125%, 03/12/2024 (A) | 400 | 433 | ||||||
Hudbay Minerals | ||||||||
6.125%, 04/01/2029 (A) | 150 | 160 | ||||||
4.500%, 04/01/2026 (A) | 1,235 | 1,284 | ||||||
Huntsman International | ||||||||
4.500%, 05/01/2029 | 375 | 415 | ||||||
INEOS Quattro Finance II | ||||||||
3.375%, 01/15/2026 (A) | 205 | 205 | ||||||
Ingevity | ||||||||
3.875%, 11/01/2028 (A) | 735 | 713 | ||||||
Kleopatra Finco Sarl | ||||||||
4.250%, 03/01/2026 (A) | EUR | 425 | 499 | |||||
Kleopatra Holdings 2 SCA | ||||||||
6.500%, 09/01/2026 (A) | 375 | 425 | ||||||
LABL Escrow Issuer | ||||||||
6.750%, 07/15/2026 (A) | $ | 950 | 1,018 | |||||
Metinvest BV | ||||||||
7.750%, 04/23/2023 (A) | 375 | 398 | ||||||
Minerals Technologies | ||||||||
5.000%, 07/01/2028 (A) | 180 | 186 | ||||||
Newcrest Finance Pty | ||||||||
3.250%, 05/13/2030 (A) | 150 | 157 | ||||||
Northwest Acquisitions ULC | ||||||||
7.125%, 11/01/2022 (A)(C) | 960 | – | ||||||
Nouryon Holding BV | ||||||||
8.000%, 10/01/2026 (A) | 650 | 690 | ||||||
Novelis | ||||||||
4.750%, 01/30/2030 (A) | 800 | 824 | ||||||
OCI | ||||||||
5.250%, 11/01/2024 (A) | 325 | 338 | ||||||
Owens-Brockway Glass Container |
| |||||||
6.625%, 05/13/2027 (A) | 267 | 290 | ||||||
| Description | Face Amount (Thousands) | Market Value ($ Thousands) | ||||||
CORPORATE OBLIGATIONS (continued) |
| |||||||
Pactiv | ||||||||
8.375%, 04/15/2027 | $ | 1,265 | $ | 1,455 | ||||
Rayonier AM Products | ||||||||
7.625%, 01/15/2026 (A) | 131 | 139 | ||||||
Samarco Mineracao | ||||||||
5.750%, 10/24/2023 (C) | 200 | 169 | ||||||
4.125%, 11/01/2022 (C) | 200 | 156 | ||||||
Sasol Financing USA | ||||||||
5.875%, 03/27/2024 | 1,080 | 1,145 | ||||||
5.500%, 03/18/2031 | 440 | 431 | ||||||
4.375%, 09/18/2026 | 1,800 | 1,836 | ||||||
Sealed Air | ||||||||
6.875%, 07/15/2033 (A) | 411 | 506 | ||||||
SRM Escrow Issuer | ||||||||
6.000%, 11/01/2028 (A) | 710 | 744 | ||||||
Suzano Austria GmbH | ||||||||
6.000%, 01/15/2029 | 530 | 624 | ||||||
5.750%, 07/14/2026 | 400 | 470 | ||||||
Syngenta Finance MTN | ||||||||
1.250%, 09/10/2027 | EUR | 200 | 234 | |||||
Teck Resources | ||||||||
3.900%, 07/15/2030 | $ | 250 | 261 | |||||
Vale Overseas | ||||||||
6.250%, 08/10/2026 | 880 | 1,047 | ||||||
|
|
| ||||||
| 28,912 | ||||||||
|
|
| ||||||
Real Estate — 1.0% | ||||||||
Agree | ||||||||
2.900%, 10/01/2030 | 175 | 176 | ||||||
Alexandria Real Estate Equities |
| |||||||
3.375%, 08/15/2031 | 375 | 395 | ||||||
CyrusOne | ||||||||
1.450%, 01/22/2027 | EUR | 380 | 450 | |||||
Diversified Healthcare Trust | ||||||||
9.750%, 06/15/2025 | $ | 470 | 532 | |||||
Duke Realty | ||||||||
1.750%, 07/01/2030 | 300 | 279 | ||||||
Essex Portfolio | ||||||||
3.000%, 01/15/2030 | 400 | 409 | ||||||
Five Point Operating | ||||||||
7.875%, 11/15/2025 (A) | 590 | 617 | ||||||
GEO Group | ||||||||
5.875%, 10/15/2024 | 770 | 614 | ||||||
5.125%, 04/01/2023 | 80 | 71 | ||||||
MPT Operating Partnership | ||||||||
3.692%, 06/05/2028 | GBP | 544 | 782 | |||||
Realogy Group | ||||||||
9.375%, 04/01/2027 (A) | $ | 617 | 683 | |||||
7.625%, 06/15/2025 (A) | 646 | 705 | ||||||
5.750%, 01/15/2029 (A) | 420 | 414 | ||||||
Service Properties Trust | ||||||||
5.500%, 12/15/2027 | 410 | 433 | ||||||
| 206 | SEI Institutional Managed Trust / Semi-Annual Report / March 31, 2021 |
| Description | Face Amount (Thousands) | Market Value ($ Thousands) | ||||||
CORPORATE OBLIGATIONS (continued) |
| |||||||
Spirit Realty | ||||||||
3.200%, 01/15/2027 | $ | 600 | $ | 626 | ||||
VEREIT Operating Partnership | ||||||||
4.875%, 06/01/2026 | 1,000 | 1,145 | ||||||
2.850%, 12/15/2032 | 375 | 363 | ||||||
WP Carey | ||||||||
4.250%, 10/01/2026 | 700 | 786 | ||||||
|
|
| ||||||
| 9,480 | ||||||||
|
|
| ||||||
Utilities — 1.5% |
| |||||||
AES | ||||||||
2.450%, 01/15/2031 (A) | 340 | 325 | ||||||
Alliant Energy Finance | ||||||||
4.250%, 06/15/2028 (A) | 125 | 140 | ||||||
American Electric Power | ||||||||
2.300%, 03/01/2030 | 300 | 292 | ||||||
AmeriGas Partners | ||||||||
5.875%, 08/20/2026 | 75 | 83 | ||||||
Berkshire Hathaway Energy | ||||||||
4.250%, 10/15/2050 | 350 | 400 | ||||||
Calpine | ||||||||
3.750%, 03/01/2031 (A) | 1,875 | 1,787 | ||||||
Eskom Holdings SOC MTN | ||||||||
6.750%, 08/06/2023 | 230 | 237 | ||||||
6.350%, 08/10/2028 | 500 | 528 | ||||||
FirstEnergy | ||||||||
2.650%, 03/01/2030 | 800 | 760 | ||||||
2.250%, 09/01/2030 | 885 | 821 | ||||||
Greenko Investment | ||||||||
4.875%, 08/16/2023 (A) | 410 | 416 | ||||||
NiSource | ||||||||
3.600%, 05/01/2030 | 50 | 54 | ||||||
NRG Energy | ||||||||
7.250%, 05/15/2026 | 1,070 | 1,113 | ||||||
5.750%, 01/15/2028 | 40 | 42 | ||||||
3.625%, 02/15/2031 (A) | 543 | 529 | ||||||
3.375%, 02/15/2029 (A) | 204 | 199 | ||||||
Pike | ||||||||
5.500%, 09/01/2028 (A) | 668 | 680 | ||||||
Sempra Energy | ||||||||
3.400%, 02/01/2028 | 1,075 | 1,152 | ||||||
Southern California Edison | ||||||||
4.200%, 03/01/2029 | 450 | 500 | ||||||
Suburban Propane Partners | ||||||||
5.500%, 06/01/2024 | 250 | 254 | ||||||
Talen Energy Supply | ||||||||
10.500%, 01/15/2026 (A) | 540 | 483 | ||||||
TransAlta | ||||||||
6.500%, 03/15/2040 | 1,020 | 1,146 | ||||||
| Description | Face Amount (Thousands) | Market Value ($ Thousands) | ||||||
CORPORATE OBLIGATIONS (continued) |
| |||||||
Vistra Operations | ||||||||
3.550%, 07/15/2024 (A) | $ | 1,200 | $ | 1,256 | ||||
|
|
| ||||||
| 13,197 | ||||||||
|
|
| ||||||
Total Corporate Obligations | 443,236 | |||||||
|
|
| ||||||
LOAN PARTICIPATIONS — 11.9% |
| |||||||
Academy, Ltd., Initial Term Loan, 1st Lien | ||||||||
5.750%, 11/05/2027 | 898 | 898 | ||||||
ACProducts, Inc., Initial Term Loan, 1st Lien | ||||||||
7.500%, VAR LIBOR+6.500%, 08/18/2025 | 497 | 507 | ||||||
Acrisure, LLC, 2020 Term Loan, 1st Lien | ||||||||
3.615%, VAR LIBOR+3.500%, 02/15/2027 | 366 | 361 | ||||||
ADS Tactical Inc, Term Loan, 1st Lien | ||||||||
0.000%, 03/19/2026 (K) | 1,200 | 1,188 | ||||||
Adtalem Global, Term Loan, 1st Lien | ||||||||
0.000%, 02/12/2028 (H) | 870 | 861 | ||||||
Allen Media, Term Loan, 1st Lien | ||||||||
5.754%, VAR LIBOR+5.500%, 02/10/2027 | 981 | 978 | ||||||
Allied Universal Holdco LLC (f/k/a USAGM Holdco, LLC), Initial Term Loan, 1st Lien | ||||||||
4.365%, VAR LIBOR+4.250%, 07/10/2026 | 1,281 | 1,276 | ||||||
Alterra Mountain Company, Additional Term Loan, 1st Lien | ||||||||
5.500%, VAR LIBOR+4.500%, 08/01/2026 | 554 | 556 | ||||||
Alterra Mountain Company, Initial Bluebird Term Loan, 1st Lien | ||||||||
2.865%, VAR LIBOR+2.750%, 07/31/2024 | 554 | 543 | ||||||
AMC Entertainment Holdings, Inc. (fka AMC Entertainment Inc.), Term B-1 Loan, 1st Lien | ||||||||
3.195%, VAR LIBOR+3.000%, 04/22/2026 (H) | 2 | 1 | ||||||
Amentum Government Services Holdings LLC, Initial Term Loan, 1st Lien | ||||||||
3.615%, VAR LIBOR+3.500%, 01/29/2027 | 363 | 359 | ||||||
Amentum Government Services Holdings LLC, Tranche 1 Term Loan, 1st Lien | ||||||||
3.615%, VAR LIBOR+3.500%, 01/29/2027 | 183 | 181 | ||||||
| SEI Institutional Managed Trust / Semi-Annual Report / March 31, 2021 | 207 |
SCHEDULE OF INVESTMENTS (Unaudited)
March 31, 2021
Multi-Asset Income Fund (Continued)
| Description | Face Amount (Thousands) | Market Value ($ Thousands) | ||||||
LOAN PARTICIPATIONS (continued) |
| |||||||
American Axle & Manufacturing, Inc., Tranche B Term Loan, 1st Lien | ||||||||
3.000%, VAR LIBOR+2.250%, 04/06/2024 | $ | 339 | $ | 337 | ||||
AmeriLife Holdings LLC, Initial Term Loan, 1st Lien | ||||||||
4.115%, VAR LIBOR+4.000%, 03/18/2027 | 159 | 159 | ||||||
APi Group DE, Inc., Initial Term Loan, 1st Lien | ||||||||
2.615%, VAR LIBOR+2.500%, 10/01/2026 (H) | 830 | 825 | ||||||
Apollo Commercial Real Estate Finance, Inc., Term B-1 Loan, 1st Lien | ||||||||
4.000%, VAR LIBOR+3.500%, 03/11/2028 | 1,080 | 1,067 | ||||||
Apollo Commercial Real Estate Finance, Inc., Term Loan, 1st Lien | ||||||||
2.861%, 05/15/2026 | 20 | 19 | ||||||
Applovin Corporation, Initial Term Loan, 1st Lien | ||||||||
3.615%, VAR LIBOR+3.500%, 08/15/2025 | 874 | 872 | ||||||
Arctic Canadian Diamond, Term Loan, 2nd Lien | ||||||||
12.500%, 12/31/2027 | 700 | 700 | ||||||
Aristocrat Leisure Limited, Initial Term Loan, 1st Lien | ||||||||
4.750%, VAR LIBOR+3.750%, 10/19/2024 | 377 | 378 | ||||||
Asurion, LLC, New B-7 Term Loan, 1st Lien | ||||||||
3.115%, VAR LIBOR+3.000%, 11/03/2024 | 725 | 722 | ||||||
Asurion, LLC, New B-8 Term Loan, 1st Lien | ||||||||
3.365%, VAR LIBOR+3.250%, 12/23/2026 (H) | 808 | 802 | ||||||
Asurion, LLC, New B-9 Term Loan, 1st Lien | ||||||||
3.365%, VAR LIBOR+3.250%, 07/31/2027 | 510 | 506 | ||||||
athenahealth, Inc., Term B-1 Loan, 1st Lien | ||||||||
4.453%, VAR LIBOR+4.250%, 02/11/2026 | 644 | 645 | ||||||
Bausch Health Companies Inc., Initial Term Loan, 1st Lien | ||||||||
3.115%, VAR LIBOR+3.000%, 06/02/2025 | 148 | 148 | ||||||
Blackstone CQP Holdco LP, Initial Term Loan, 1st Lien | ||||||||
3.687%, VAR LIBOR+3.500%, 09/30/2024 | 983 | 979 | ||||||
| Description | Face Amount (Thousands) | Market Value ($ Thousands) | ||||||
LOAN PARTICIPATIONS (continued) |
| |||||||
Boyd Gaming Corporation, Refinancing Term B Loan, 1st Lien | ||||||||
2.331%, VAR LIBOR+2.250%, 09/15/2023 | $ | 763 | $ | 761 | ||||
BWay Holding Company , Initial Term Loan, 1st Lien | ||||||||
3.443%, VAR LIBOR+3.250%, 04/03/2024 | 928 | 907 | ||||||
Caesars Resort Collection, LLC, | ||||||||
2.865%, VAR LIBOR+2.750%, 12/23/2024 | 950 | 936 | ||||||
Caesars Resort Collection, LLC, | ||||||||
4.615%, VAR LIBOR+4.500%, 07/21/2025 | 577 | 577 | ||||||
Cardinal Parent, Inc., Initial Term Loan, 1st Lien | ||||||||
5.250%, VAR LIBOR+4.500%, 11/12/2027 | 624 | 624 | ||||||
Castle US Holding Corporation, Initial Dollar Term Loan, 1st Lien | ||||||||
4.004%, VAR LIBOR+3.750%, 01/29/2027 | 367 | 362 | ||||||
ChampionX Holding Inc., Term Loan, 1st Lien | ||||||||
6.000%, VAR LIBOR+5.000%, 06/03/2027 (H) | 1,600 | 1,628 | ||||||
Change Healthcare Holdings, Inc. (fka Emdeon Inc.), Closing Date Term Loan, 1st Lien | ||||||||
3.500%, VAR LIBOR+2.500%, 03/01/2024 | 490 | 489 | ||||||
Cinemark USA, Term Loan, 1st Lien | ||||||||
1.870%, 03/31/2025 | 159 | 151 | ||||||
Citadel Securities, LP, Term Loan, 1st Lien | ||||||||
2.615%, 02/02/2028 | 1,007 | 996 | ||||||
City Brewing Company, Term Loan, 1st Lien | ||||||||
0.000%, 03/31/2028 (H) | 980 | 975 | ||||||
Clarios Global | ||||||||
3.350%, 04/30/2026 | 841 | 832 | ||||||
Claros Mortgage Trust, Inc., Initial Term Loan, 1st Lien | ||||||||
6.000%, VAR LIBOR+5.000%, 08/09/2026 (H) | 308 | 307 | ||||||
ClubCorp Holdings, Inc., Term B Loan, 1st Lien | ||||||||
3.004%, VAR LIBOR+2.750%, 09/18/2024 | 868 | 814 | ||||||
CNT Holdings I Corp, Initial Term Loan, 1st Lien | ||||||||
4.500%, VAR LIBOR+3.750%, 11/08/2027 | 750 | 748 | ||||||
| 208 | SEI Institutional Managed Trust / Semi-Annual Report / March 31, 2021 |
| Description | Face Amount (Thousands) | Market Value ($ Thousands) | ||||||
LOAN PARTICIPATIONS (continued) |
| |||||||
Commscope, Inc., Initial Term Loan, 1st Lien | ||||||||
3.365%, VAR LIBOR+3.250%, 04/06/2026 | $ | 946 | $ | 939 | ||||
Conservice Midco, LLC, Initial Term Loan, 1st Lien | ||||||||
4.503%, VAR LIBOR+4.250%, 05/13/2027 | 1,667 | 1,664 | ||||||
CoreCivic, Inc., Term Loan, 1st Lien | ||||||||
5.500%, VAR LIBOR+4.500%, 12/18/2024 | 354 | 340 | ||||||
CP Atlas Buyer, Inc., Term B Loan, 1st Lien | ||||||||
4.250%, VAR LIBOR+3.750%, 11/23/2027 | 410 | 407 | ||||||
Crosby US Acquisition Corp., Initial Term Loan, 1st Lien | ||||||||
4.861%, VAR LIBOR+4.750%, 06/26/2026 | 1,007 | 997 | ||||||
CWGS Group, LLC, Term Loan, 1st Lien | ||||||||
3.500%, VAR LIBOR+2.750%, 11/08/2023 (H) | 687 | 684 | ||||||
DCert Buyer, Inc., First Amendment Refinancing Loan, 2nd Lien | ||||||||
7.115%, VAR LIBOR+7.000%, 02/19/2029 | 2,190 | 2,200 | ||||||
DCert Buyer, Inc., Initial Term Loan, 1st Lien | ||||||||
4.115%, VAR LIBOR+4.000%, 10/16/2026 | 1,139 | 1,135 | ||||||
Deerfield Dakota Holding, LLC , Initial Dollar Term Loan, 1st Lien | ||||||||
4.750%, VAR LIBOR+3.750%, 04/09/2027 | 248 | 248 | ||||||
Deerfield, Term Loan, 1st Lien | ||||||||
9.000%, VAR LIBOR+8.000%, 04/10/2028 | 840 | 852 | ||||||
Delta Topco, Inc., Initial Term Loan, 1st Lien | ||||||||
4.500%, VAR LIBOR+3.750%, 12/01/2027 | 580 | 579 | ||||||
Douglas Dynamics L.L.C., 2020 Term B Loan, 1st Lien | ||||||||
4.750%, VAR LIBOR+3.750%, 06/08/2026 | 98 | 97 | ||||||
Edelman Financials, Term Loan, 1st Lien | ||||||||
0.000%, 03/15/2028 (H) | 2,005 | 1,992 | ||||||
Empire Today, Term Loan, 1st Lien | ||||||||
0.000%, 03/24/2028 (H) | 660 | 657 | ||||||
Endo Luxembourg Finance Company S.a.r.l, Term Loan, 1st Lien | ||||||||
5.750%, 03/27/2028 (H) | 748 | 740 | ||||||
Endurance International Group Holdings, Inc., Initial Term Loan, 1st Lien | ||||||||
4.250%, VAR LIBOR+3.500%, 02/10/2028 | 525 | 519 | ||||||
| Description | Face Amount (Thousands) | Market Value ($ Thousands) | ||||||
LOAN PARTICIPATIONS (continued) |
| |||||||
Entercom Media Corp., Term B-2 Loan, 1st Lien | ||||||||
2.609%, VAR LIBOR+2.500%, 11/18/2024 | $ | 351 | $ | 343 | ||||
Equinox Holdings Inc., Incremental Term B-2 Loan, 1st Lien | ||||||||
10.000%, 03/08/2024 | 248 | 248 | ||||||
EyeCare Partners, LLC, Term Loan, 1st Lien | ||||||||
3.865%, VAR LIBOR+3.750%, 02/18/2027 | 763 | 755 | ||||||
EyeCare Partners, Term Loan, 1st Lien Cov-Lite | ||||||||
8.365%, VAR LIBOR+8.250%, 02/18/2028 | 550 | 527 | ||||||
First Brand Group, Term Loan, 2nd Lien | ||||||||
9.500%, 03/30/2028 (H) | 1,350 | 1,337 | ||||||
First Brands Group, LLC, 2021 Term Loan, 1st Lien | ||||||||
6.000%, VAR LIBOR+5.000%, 03/30/2027 (H) | 860 | 859 | ||||||
Focus Financial Partnersm LLC, Tranche B-3, Term Loan, 1st Lien | ||||||||
2.115%, VAR LIBOR+2.000%, 07/03/2024 | 1,812 | 1,791 | ||||||
Foundation Building Materials, Inc., Initial Term Loan, 1st Lien | ||||||||
3.750%, VAR LIBOR+3.250%, 01/31/2028 | 174 | 172 | ||||||
Foundation Building Materials, Term Loan, 1st Lien | ||||||||
3.750%, 01/31/2028 | 101 | 100 | ||||||
Froneri International Limited, Facility B1, Term Loan, 1st Lien | ||||||||
2.625%, VAR Euribor+2.625%, 01/29/2027 | 330 | 383 | ||||||
2.365%, VAR LIBOR+2.250%, 01/29/2027 | 139 | 137 | ||||||
Gannett Holdings LLC, Term Loan, 1st Lien | ||||||||
7.750%, 02/09/2026 | 912 | 918 | ||||||
Garda World Security Corp | ||||||||
4.360%, 10/30/2026 | 679 | 679 | ||||||
Garrett LX S.a.r.l., Term Loan, 1st Lien | ||||||||
0.000%, 03/05/2028 (H) | 1,200 | 1,191 | ||||||
Genesee & Wyoming Inc., Initial Term Loan, 1st Lien | ||||||||
2.254%, VAR LIBOR+2.000%, 12/30/2026 | 484 | 482 | ||||||
Getty Images, Inc., Initial Dollar Term Loan, 1st Lien | ||||||||
4.625%, VAR LIBOR+4.500%, 02/19/2026 | 556 | 550 | ||||||
| SEI Institutional Managed Trust / Semi-Annual Report / March 31, 2021 | 209 |
SCHEDULE OF INVESTMENTS (Unaudited)
March 31, 2021
Multi-Asset Income Fund (Continued)
| Description | Face Amount (Thousands) | Market Value ($ Thousands) | ||||||
LOAN PARTICIPATIONS (continued) |
| |||||||
GFL Environmental, 2020 Refinancing Term Loan, 1st Lien | ||||||||
3.500%, 05/30/2025 | $ | 135 | $ | 135 | ||||
Global Medical Response, Inc., 2020 Refinancing Term Loan, 1st Lien | ||||||||
5.750%, VAR LIBOR+4.750%, 10/02/2025 | 1,190 | 1,185 | ||||||
Global Tel*Link Corporation, Term Loan, 1st Lien | ||||||||
5.118%, VAR LIBOR+4.250%, 11/29/2026 | 110 | 84 | ||||||
4.365%, VAR LIBOR+0.040%, 11/29/2025 | 579 | 543 | ||||||
Globallogic Holdings Inc., 2020 Incremental Term B-2 Loan | ||||||||
4.500%, VAR LIBOR+3.750%, 09/14/2027 | 945 | 943 | ||||||
Globaltranz Enterprises, Inc., Initial Term Loan, 1st Lien | ||||||||
5.118%, VAR LIBOR+5.000%, 05/15/2026 | 523 | 499 | ||||||
Grab Holdings, Inc., Initial Term Loan, 1st Lien | ||||||||
5.500%, VAR LIBOR+4.500%, 01/29/2026 | 1,325 | 1,345 | ||||||
Graham Packaging Company Inc., Initial Term Loan (2021), 1st Lien | ||||||||
3.750%, VAR LIBOR+3.000%, 08/04/2027 | 578 | 574 | ||||||
Great Outdoors Group, LLC, Term B-1 Loan, 1st Lien | ||||||||
5.000%, VAR LIBOR+4.250%, 03/06/2028 | 1,057 | 1,058 | ||||||
Grifols Worldwide Operations Limited, Dollar Tranche B Term Loan, 1st Lien | ||||||||
2.081%, VAR LIBOR+2.000%, 11/15/2027 | 464 | 459 | ||||||
Harbor Freight Tools USA, Inc., Initial Term Loan (2020), 1st Lien | ||||||||
4.000%, VAR LIBOR+3.000%, 10/19/2027 | 588 | 587 | ||||||
Hillman Group, Term Loan, 1st Lien | ||||||||
0.000%, 02/24/2028 (H) | 375 | 373 | ||||||
Hilton Worldwide Finance LLC, Refinanced Series B-2 Term Loan, 1st Lien | ||||||||
1.859%, VAR LIBOR+1.750%, 06/22/2026 | 410 | 406 | ||||||
Hoya Midco, LLC, Initial Term Loan, 1st Lien | ||||||||
4.500%, VAR LIBOR+3.500%, 06/30/2024 | 928 | 909 | ||||||
Hudson River, Term Loan, 1st Lien | ||||||||
0.141%, 03/20/2028 | 910 | 901 | ||||||
| Description | Face Amount (Thousands) | Market Value ($ Thousands) | ||||||
LOAN PARTICIPATIONS (continued) |
| |||||||
Idera, Inc., Term B-1 Loan, 1st Lien | ||||||||
4.500%, VAR LIBOR+3.750%, 03/02/2028 | $ | 725 | $ | 719 | ||||
Idera, Term Loan, 2nd Lien | ||||||||
7.500%, 03/02/2029 | 175 | 174 | ||||||
iHeartCommunications, Inc. (fka Clear Channel Communications, Inc.), New Term Loan, 1st Lien | ||||||||
3.115%, VAR LIBOR+3.000%, 05/01/2026 | 302 | 298 | ||||||
IHeartcommunications, Inc., Term Loan | ||||||||
4.750%, 05/01/2026 | 318 | 318 | ||||||
INEOS Styrolution Group GmbH, 2026 Tranche B Dollar Term Loan, 1st Lien | ||||||||
3.250%, VAR LIBOR+2.750%, 01/29/2026 | 350 | 349 | ||||||
IRB Holding Corp., 2020 Replacement Term B Loan, 1st Lien | ||||||||
3.750%, VAR LIBOR+2.750%, 02/05/2025 | 119 | 118 | ||||||
Jane Street Group, LLC, Dollar Term Loan, 1st Lien | ||||||||
2.865%, VAR LIBOR+2.750%, 01/26/2028 | 745 | 736 | ||||||
JetBlue Airways Corporation, Term Loan, 1st Lien | ||||||||
6.250%, VAR LIBOR+5.250%, 06/17/2024 | 886 | 905 | ||||||
Lions Gate Capital Holdings LLC, Term B Loan, 1st Lien | ||||||||
2.365%, VAR LIBOR+2.250%, 03/24/2025 | 152 | 150 | ||||||
LS Group Opco Acquisition LLC (LS Group PropCo Acquisition LLC), Initial Term Loan, 1st Lien | ||||||||
4.250%, VAR LIBOR+3.500%, 11/02/2027 | 359 | 359 | ||||||
Maravai Intermediate Holdings, LLC, Initial Term Loan, 1st Lien | ||||||||
5.250%, VAR LIBOR+4.250%, 10/19/2027 | 137 | 138 | ||||||
McAfee, LLC, Term B USD Loan | ||||||||
3.865%, VAR LIBOR+3.750%, 09/30/2024 | 262 | 262 | ||||||
Michaels Stores, Inc., 2020 Refinancing Term B Loan, 1st Lien | ||||||||
4.250%, VAR LIBOR+3.500%, 10/01/2027 | 1,125 | 1,123 | ||||||
Milano Acquisition Corp., Term B Loan, 1st Lien | ||||||||
4.750%, VAR LIBOR+4.000%, 10/01/2027 (H) | 1,995 | 1,985 | ||||||
| 210 | SEI Institutional Managed Trust / Semi-Annual Report / March 31, 2021 |
| Description | Face Amount (Thousands) | Market Value ($ Thousands) | ||||||
LOAN PARTICIPATIONS (continued) |
| |||||||
Mileage Plus Holdings LLC (Mileage Plus Intellectual Property Assets, Ltd.), Initial Term Loan, 1st Lien | ||||||||
6.250%, VAR LIBOR+5.250%, 06/21/2027 | $ | 740 | $ | 786 | ||||
Mister Car Wash Holdings, Inc., Initial Term Loan, 1st Lien | ||||||||
3.358%, VAR LIBOR+3.250%, 05/14/2026 | 359 | 354 | ||||||
Mitchell International, Inc., Amendment No. 2 New Term Loan Facility, 1st Lien | ||||||||
4.750%, VAR LIBOR+4.250%, 11/29/2024 | 622 | 622 | ||||||
Mitchell International, Inc., Initial Term Loan, 1st Lien | ||||||||
3.365%, VAR LIBOR+3.250%, 11/29/2024 | 977 | 961 | ||||||
MPH Acquisition Holdings LLC, Initial Term Loan, 1st Lien | ||||||||
3.750%, VAR LIBOR+2.750%, 06/07/2023 (H) | 710 | 706 | ||||||
Navistar, Inc., Tranche B Term Loan, 1st Lien | ||||||||
3.620%, VAR LIBOR+3.500%, 11/06/2024 | 534 | 534 | ||||||
Newport Parent, Inc., Initial Term Loan, 1st Lien | ||||||||
7.500%, 12/10/2027 | 919 | 918 | ||||||
Nexstar Broadcasting, Inc., Term B-4 Loan, 1st Lien | ||||||||
2.865%, VAR LIBOR+2.750%, 09/18/2026 | 804 | 798 | ||||||
Nielsen Finance LLC, Dollar Term B-5 Loan, 1st Lien | ||||||||
4.750%, VAR LIBOR+3.750%, 06/04/2025 | 78 | 78 | ||||||
Option Care Health, Inc., Term B Loan, 1st Lien | ||||||||
3.865%, VAR LIBOR+3.750%, 08/06/2026 | 1,407 | 1,400 | ||||||
Packers Holdings, LLC, Initial Term Loan, 1st Lien | ||||||||
4.000%, VAR LIBOR+3.250%, 03/09/2028 | 925 | 914 | ||||||
Pactiv Evergreen Inc., Tranche B-1 U.S. Term Loan, 1st Lien | ||||||||
2.865%, VAR LIBOR+2.750%, 02/05/2023 (H) | 236 | 235 | ||||||
PAE Incorporated, Initial Term Loan, 1st Lien | ||||||||
5.250%, 10/19/2027 | 419 | 419 | ||||||
| Description | Face Amount (Thousands) | Market Value ($ Thousands) | ||||||
LOAN PARTICIPATIONS (continued) |
| |||||||
Parexel International Corporation, Initial Term Loan, 1st Lien | ||||||||
2.865%, VAR LIBOR+2.750%, 09/27/2024 (H) | $ | 331 | $ | 327 | ||||
Particle Investment S.a.r.l. (WebPros), Term Loan, 1st Lien | ||||||||
5.750%, 02/18/2027 (D) | 383 | 380 | ||||||
Peraton Corp, Term Loan, 1st Lien | ||||||||
0.000%, 02/26/2029 (H) | 600 | 609 | ||||||
Peraton Corp., Delayed Draw Term Loan B, 1st Lien | ||||||||
4.500%, 02/01/2028 (H) | 606 | 605 | ||||||
Peraton Corp., Term B Loan, 1st Lien | ||||||||
4.500%, VAR LIBOR+3.750%, 02/01/2028 | 344 | 344 | ||||||
Petco Health and Wellness Company, Inc., Initial Term Loan, 1st Lien | ||||||||
4.000%, VAR LIBOR+3.250%, 03/03/2028 (H) | 1,240 | 1,234 | ||||||
PetSmart LLC, Initial Term Loan, 1st Lien | ||||||||
4.250%, VAR LIBOR+3.750%, 02/11/2028 | 660 | 659 | ||||||
Phoenix Guarantor Inc., Tranche B-1 Term Loan, 1st Lien | ||||||||
3.361%, VAR LIBOR+3.250%, 03/05/2026 | 707 | 699 | ||||||
Planview Parent, Inc., Closing Date Term Loan, 1st Lien | ||||||||
4.750%, VAR LIBOR+4.000%, 12/17/2027 | 319 | 319 | ||||||
Precision Medicine Group, LLC, Amendment No. 1 Refinancing Term Loan, 1st Lien | ||||||||
3.750%, VAR LIBOR+3.000%, 11/18/2027 | 671 | 665 | ||||||
Prime Security Services Borrower, LLC, 2021 Refinancing Term B-1 Loan, 1st Lien | ||||||||
3.500%, VAR LIBOR+2.750%, 09/23/2026 | 397 | 395 | ||||||
Project Alpha Intermediate Holding, Inc., 2021 Refinancing Term Loan, 1st Lien | ||||||||
4.150%, VAR LIBOR+4.000%, 04/26/2024 | 236 | 236 | ||||||
Rackspace Technology Global, Inc., 2021 Term B Loan, 1st Lien | ||||||||
3.500%, VAR LIBOR+2.750%, 02/15/2028 (H) | 1,060 | 1,050 | ||||||
Radiology Partners Inc., Term Loan, 1st Lien | ||||||||
5.295%, 07/09/2025 | 295 | 293 | ||||||
Radiology Partners, Inc., Term B Loan | ||||||||
4.357%, 07/09/2025 | 345 | 342 | ||||||
| SEI Institutional Managed Trust / Semi-Annual Report / March 31, 2021 | 211 |
SCHEDULE OF INVESTMENTS (Unaudited)
March 31, 2021
Multi-Asset Income Fund (Continued)
| Description | Face Amount (Thousands) | Market Value ($ Thousands) | ||||||
LOAN PARTICIPATIONS (continued) |
| |||||||
Radnet Management, Inc., Term B-1 Loan, 1st Lien | ||||||||
6.000%, VAR LIBOR+3.750%, 06/30/2023 | $ | 13 | $ | 13 | ||||
4.750%, VAR LIBOR+3.750%, 06/30/2023 | 822 | 822 | ||||||
Realogy Group LLC (fka Realogy Corporation), Extended 2025 Term Loan, 1st Lien | ||||||||
3.000%, VAR LIBOR+2.250%, 02/08/2025 | 85 | 84 | ||||||
Redstone HoldCo 2 LP, Initial Term Loan, 1st Lien | ||||||||
6.000%, VAR LIBOR+5.000%, 09/01/2027 | 1,501 | 1,505 | ||||||
Regionalcare Hospital Partners Holdings, Inc., Term B Loan, 1st Lien | ||||||||
3.865%, VAR LIBOR+3.750%, 11/16/2025 | 1,030 | 1,027 | ||||||
Reynolds Consumer Products LLC, Initial Term Loan, 1st Lien | ||||||||
1.865%, VAR LIBOR+1.750%, 02/04/2027 | 203 | 202 | ||||||
Royal Carribbean Cruises, Term Loan, 1st Lien | ||||||||
0.000%, 04/05/2022 (H) | 360 | 338 | ||||||
Ryan Specialty Group, LLC, Initial Term Loan, 1st Lien | ||||||||
4.000%, VAR LIBOR+3.000%, 09/01/2027 | 537 | 536 | ||||||
Scientific Games International, Inc., Initial Term B-5 Loan, 1st Lien | ||||||||
2.865%, VAR LIBOR+2.750%, 08/14/2024 | 745 | 730 | ||||||
Sedgwick Claims Management Services, Inc. (Lightning Cayman Merger Sub, Ltd.), 2020 Term Loan, 1st Lien | ||||||||
5.250%, VAR LIBOR+4.250%, 09/03/2026 | 347 | 348 | ||||||
Sedgwick Claims Management Services, Inc. (Lightning Cayman Merger Sub, Ltd.), Initial Term Loan, 1st Lien | ||||||||
3.365%, VAR LIBOR+3.250%, 12/31/2025 | 857 | 845 | ||||||
SkyMiles IP Ltd. (Delta Air Lines, Inc.), Initial Term Loan, 1st Lien | ||||||||
4.750%, VAR LIBOR+3.750%, 10/20/2027 | 780 | 818 | ||||||
Sorenson, Term Loan, 1st Lien | ||||||||
6.25%, 03/17/2026 | 350 | 350 | ||||||
Sotera Health Holdings LLC, Refinancing Loan, 1st Lien | ||||||||
3.250%, 12/11/2026 | 890 | 887 | ||||||
| Description | Face Amount (Thousands) | Market Value ($ Thousands) | ||||||
LOAN PARTICIPATIONS (continued) |
| |||||||
Surf Holdings S.a r.l., Dollar Tranche Term Loan, 1st Lien | ||||||||
3.676%, VAR LIBOR+3.500%, 03/05/2027 | $ | 466 | $ | 461 | ||||
Surgery Center Holdings, Inc., Initial Term Loan, 1st Lien | ||||||||
4.250%, VAR LIBOR+3.250%, 02/01/2026 | 506 | 501 | ||||||
Symplr Software, Inc., Initial Term Loan, 1st Lien | ||||||||
5.250%, VAR LIBOR+4.500%, 12/22/2027 | 480 | 480 | ||||||
Terrier Media Buyer, Inc., 2021 Term B Loan, 1st Lien | ||||||||
3.609%, VAR LIBOR+3.500%, 12/17/2026 | 928 | 919 | ||||||
TKC Holdings, Inc. Term Loan B | ||||||||
4.750%, VAR LIBOR+3.750%, 02/01/2023 | 679 | 663 | ||||||
Travelport Finance (Luxembourg) S.a r.l., Initial Term Loan (Priority), 1st Lien | ||||||||
9.000%, VAR LIBOR+8.000%, 02/28/2025 | 453 | 461 | ||||||
Triton Water Holdings Inc., Initial Term Loan, 1st Lien | ||||||||
4.000%, 03/31/2028 (H) | 790 | 786 | ||||||
TruGreen Limited Partnership, Initial Term Loan, 2nd Lien | ||||||||
9.250%, VAR LIBOR+8.500%, 11/02/2028 | 200 | 206 | ||||||
Tutor Perini Corporation, Term Loan, 1st Lien | ||||||||
5.750%, 08/18/2027 | 418 | 422 | ||||||
U.S. Renal Care, Inc., Initial Term Loan, 1st Lien | ||||||||
5.125%, VAR LIBOR+5.000%, 06/26/2026 | 1,801 | 1,789 | ||||||
UFC Holdings, Term Loan, 1st Lien | ||||||||
3.750%, 04/29/2026 | 666 | 663 | ||||||
UKG Inc., 2021 Incremental Term Loan, 1st Lien | ||||||||
4.000%, VAR LIBOR+3.250%, 05/04/2026 | 100 | 99 | ||||||
UKG Inc., Initial Term Loan (2020), 2nd Lien | ||||||||
7.500%, VAR LIBOR+6.750%, 05/03/2027 | 25 | 26 | ||||||
Ultimus Group Midco LLC, The, Initial Term Loan, 1st Lien | ||||||||
3.865%, VAR LIBOR+3.750%, 05/04/2026 | 580 | 579 | ||||||
| 212 | SEI Institutional Managed Trust / Semi-Annual Report / March 31, 2021 |
| Description | Face Amount (Thousands) | Market Value ($ Thousands) | ||||||
LOAN PARTICIPATIONS (continued) |
| |||||||
Univision Communications Inc., 2020 Replacement First-Lien Term Loan, 1st Lien | ||||||||
4.750%, VAR LIBOR+3.750%, 03/15/2026 | $ | 711 | $ | 710 | ||||
US Foods, Inc., Term Loan | ||||||||
4.365%, 09/13/2026 | 675 | 660 | ||||||
Verscend Holding Corp., Term B Loan, 1st Lien | ||||||||
4.615%, VAR LIBOR+4.500%, 08/27/2025 (H) | 217 | 216 | ||||||
VFH Parent LLC, Initial Term Loan, 1st Lien | ||||||||
3.110%, VAR LIBOR+3.000%, 03/01/2026 (H) | 253 | 252 | ||||||
VICI Properties 1 LLC, Term B Loan, 1st Lien | ||||||||
1.861%, VAR LIBOR+1.750%, 12/20/2024 | 440 | 435 | ||||||
Virgin Media Bristol LLC, N Facility, 1st Lien | ||||||||
2.511%, VAR LIBOR+2.500%, 01/31/2028 (H) | 935 | 926 | ||||||
Virgin Media Bristol LLC, N Facility, Term Loan, 1st Lien | ||||||||
0.000%, 01/31/2029 (H) | 590 | 589 | ||||||
Virgin Pulse, Inc, Term Loan, 1st Lien | ||||||||
0.000%, 03/30/2028 (H) | 950 | 943 | ||||||
Virtusa Corporation, Closing Date Term Loan, 1st Lien | ||||||||
5.000%, VAR LIBOR+4.250%, 02/11/2028 (H) | 1,685 | 1,686 | ||||||
Whatabrands LLC, 2020 Refinancing Term Loan, 1st Lien | ||||||||
2.856%, VAR LIBOR+2.750%, 07/31/2026 | 163 | 161 | ||||||
WIN Waste Innovations Holdings Inc., Initial Term Loan, 1st Lien | ||||||||
3.250%, VAR LIBOR+2.750%, 03/24/2028 (H) | 350 | 349 | ||||||
WP CityMD Bidco LLC, First Amendment Refinancing Term Loan, 1st Lien | ||||||||
4.500%, VAR LIBOR+3.750%, 08/13/2026 (H) | 760 | 758 | ||||||
| Description | Face Amount (Thousands) | Market Value ($ Thousands) | ||||||
LOAN PARTICIPATIONS (continued) |
| |||||||
WP CPP Holdings, Term B Loan | ||||||||
4.750%, VAR LIBOR+3.750%, 04/30/2025 | $ | 854 | $ | 829 | ||||
|
|
| ||||||
Total Loan Participations | 111,088 | |||||||
|
|
| ||||||
| Shares | ||||||||
COMMON STOCK — 11.4% | ||||||||
Communication Services — 1.2% |
| |||||||
Activision Blizzard Inc | 2,465 | 229 | ||||||
Alphabet Inc, Cl A * | 947 | 1,953 | ||||||
Alphabet Inc, Cl C * | 908 | 1,878 | ||||||
AT&T Inc | 22,493 | 681 | ||||||
Charter Communications Inc, Cl A * | 446 | 275 | ||||||
Comcast Corp, Cl A | 14,429 | 781 | ||||||
Discovery Inc, Cl A * | 459 | 20 | ||||||
Discovery Inc, Cl C * | 914 | 34 | ||||||
DISH Network Corp, Cl A * | 751 | 27 | ||||||
Electronic Arts Inc | 881 | 119 | ||||||
Facebook Inc, Cl A * | 7,578 | 2,232 | ||||||
Fox Corp | 1,418 | 51 | ||||||
Interpublic Group of Cos Inc/The | 1,182 | 34 | ||||||
Live Nation Entertainment Inc * | 457 | 39 | ||||||
Lumen Technologies Inc | 3,203 | 43 | ||||||
Netflix Inc * | 1,397 | 729 | ||||||
News Corp, Cl A | 1,127 | 29 | ||||||
News Corp, Cl B | 450 | 11 | ||||||
Omnicom Group Inc | 634 | 47 | ||||||
Take-Two Interactive Software Inc, Cl A * | 386 | 68 | ||||||
T-Mobile US Inc * | 1,839 | 230 | ||||||
Twitter Inc * | 2,480 | 158 | ||||||
Verizon Communications Inc | 13,057 | 759 | ||||||
ViacomCBS Inc, Cl B | 1,835 | 83 | ||||||
Walt Disney Co/The | 5,691 | 1,050 | ||||||
|
|
| ||||||
| 11,560 | ||||||||
|
|
| ||||||
Consumer Discretionary — 1.4% |
| |||||||
Advance Auto Parts Inc | 206 | 38 | ||||||
Amazon.com Inc, Cl A * | 1,345 | 4,161 | ||||||
Aptiv PLC * | 852 | 117 | ||||||
AutoZone Inc * | 68 | 95 | ||||||
Best Buy Co Inc | 697 | 80 | ||||||
Booking Holdings Inc * | 129 | 301 | ||||||
BorgWarner Inc | 797 | 37 | ||||||
Caesars Entertainment Inc * | 630 | 55 | ||||||
CarMax Inc * | 497 | 66 | ||||||
Carnival Corp * | 2,537 | 67 | ||||||
| SEI Institutional Managed Trust / Semi-Annual Report / March 31, 2021 | 213 |
SCHEDULE OF INVESTMENTS (Unaudited)
March 31, 2021
Multi-Asset Income Fund (Continued)
| Description | Shares | Market Value ($ Thousands) | ||||||
COMMON STOCK (continued) | ||||||||
Cengage Learning Holdings II Inc * | 5,114 | $ | 72 | |||||
Chipotle Mexican Grill Inc, Cl A * | 91 | 129 | ||||||
Darden Restaurants Inc | 431 | 61 | ||||||
Dollar General Corp | 764 | 155 | ||||||
Dollar Tree Inc * | 730 | 84 | ||||||
Domino’s Pizza Inc | 115 | 42 | ||||||
DR Horton Inc | 1,023 | 91 | ||||||
eBay Inc | 2,003 | 123 | ||||||
Etsy Inc * | 401 | 81 | ||||||
Expedia Group Inc | 437 | 75 | ||||||
Ford Motor Co * | 12,028 | 147 | ||||||
Gap Inc/The | 525 | 16 | ||||||
Garmin Ltd | 486 | 64 | ||||||
General Motors Co | 4,009 | 230 | ||||||
Genuine Parts Co | 487 | 56 | ||||||
Hanesbrands Inc | 1,017 | 20 | ||||||
Hasbro Inc | 409 | 39 | ||||||
Hilton Worldwide Holdings Inc * | 899 | 109 | ||||||
Home Depot Inc/The | 3,388 | 1,034 | ||||||
L Brands Inc * | 718 | 44 | ||||||
Las Vegas Sands Corp | 999 | 61 | ||||||
Leggett & Platt Inc | 350 | 16 | ||||||
Lennar Corp, Cl A | 843 | 85 | ||||||
LKQ Corp * | 960 | 41 | ||||||
Lowe’s Cos Inc | 2,299 | 437 | ||||||
Marriott International Inc/MD, Cl A | 821 | 122 | ||||||
McDonald’s Corp | 2,348 | 526 | ||||||
MGM Resorts International | 1,343 | 51 | ||||||
Mohawk Industries Inc * | 176 | 34 | ||||||
Newell Brands Inc, Cl B | 1,194 | 32 | ||||||
NIKE Inc, Cl B | 4,031 | 536 | ||||||
Norwegian Cruise Line Holdings Ltd * | 900 | 25 | ||||||
NVR Inc * | 11 | 52 | ||||||
O’Reilly Automotive Inc * | 227 | 115 | ||||||
Penn National Gaming Inc * | 446 | 47 | ||||||
Pool Corp | 130 | 45 | ||||||
PulteGroup Inc | 777 | 41 | ||||||
PVH Corp | 198 | 21 | ||||||
Ralph Lauren Corp, Cl A | 119 | 15 | ||||||
Ross Stores Inc | 1,110 | 133 | ||||||
Royal Caribbean Cruises Ltd | 663 | 57 | ||||||
Starbucks Corp | 3,693 | 403 | ||||||
Tapestry Inc * | 857 | 35 | ||||||
Target Corp, Cl A | 1,559 | 309 | ||||||
Tesla Inc * | 2,410 | 1,610 | ||||||
TJX Cos Inc/The | 3,831 | 253 | ||||||
Tractor Supply Co | 380 | 67 | ||||||
Ulta Beauty Inc * | 187 | 58 | ||||||
Under Armour Inc, Cl A * | 727 | 16 | ||||||
Under Armour Inc, Cl C * | 448 | 8 | ||||||
VF Corp | 1,022 | 82 | ||||||
Whirlpool Corp | 199 | 44 | ||||||
| Description | Shares | Market Value ($ Thousands) | ||||||
COMMON STOCK (continued) | ||||||||
Wynn Resorts Ltd | 304 | $ | 38 | |||||
Yum! Brands Inc | 970 | 105 | ||||||
|
|
| ||||||
| 13,209 | ||||||||
|
|
| ||||||
Consumer Staples — 0.7% | ||||||||
Altria Group Inc | 5,784 | 296 | ||||||
Archer-Daniels-Midland Co | 1,739 | 99 | ||||||
Brown-Forman Corp, Cl B | 612 | 42 | ||||||
Campbell Soup Co | 549 | 28 | ||||||
Church & Dwight Co Inc | 740 | 65 | ||||||
Clorox Co/The | 382 | 74 | ||||||
Coca-Cola Co/The | 12,228 | 645 | ||||||
Colgate-Palmolive Co | 2,667 | 210 | ||||||
Conagra Brands Inc | 1,486 | 56 | ||||||
Constellation Brands Inc, Cl A | 521 | 119 | ||||||
Costco Wholesale Corp | 1,390 | 490 | ||||||
Estee Lauder Cos Inc/The, Cl A | 712 | 207 | ||||||
General Mills Inc | 1,918 | 118 | ||||||
Hershey Co/The | 455 | 72 | ||||||
Hormel Foods Corp | 946 | 45 | ||||||
J M Smucker Co/The | 322 | 41 | ||||||
Kellogg Co | 845 | 53 | ||||||
Kimberly-Clark Corp | 1,074 | 149 | ||||||
Kraft Heinz Co/The | 1,961 | 78 | ||||||
Kroger Co/The | 2,327 | 84 | ||||||
Lamb Weston Holdings Inc | 468 | 36 | ||||||
McCormick & Co Inc/MD | 753 | 67 | ||||||
Molson Coors Beverage Co, Cl B | 580 | 30 | ||||||
Mondelez International Inc, Cl A | 4,452 | 261 | ||||||
Monster Beverage Corp * | 1,136 | 103 | ||||||
PepsiCo Inc | 4,349 | 615 | ||||||
Philip Morris International Inc | 4,899 | 435 | ||||||
Procter & Gamble Co/The | 7,750 | 1,050 | ||||||
Sysco Corp, Cl A | 1,577 | 124 | ||||||
Tyson Foods Inc, Cl A | 891 | 66 | ||||||
Walgreens Boots Alliance Inc | 2,212 | 121 | ||||||
Walmart Inc | 4,369 | 593 | ||||||
|
|
| ||||||
| 6,472 | ||||||||
|
|
| ||||||
Energy — 0.3% | ||||||||
APA | 1,082 | 19 | ||||||
Baker Hughes Co, Cl A | 2,074 | 45 | ||||||
Cabot Oil & Gas Corp | 1,207 | 23 | ||||||
Chevron Corp | 6,073 | 636 | ||||||
ConocoPhillips | 4,232 | 224 | ||||||
Devon Energy Corp | 1,630 | 36 | ||||||
Diamondback Energy Inc, Cl A | 524 | 39 | ||||||
EOG Resources Inc | 1,832 | 133 | ||||||
Exxon Mobil Corp | 13,357 | 746 | ||||||
Halliburton Co | 2,863 | 61 | ||||||
Hess Corp | 829 | 59 | ||||||
HollyFrontier Corp | 389 | 14 | ||||||
Kinder Morgan Inc | 6,072 | 101 | ||||||
| 214 | SEI Institutional Managed Trust / Semi-Annual Report / March 31, 2021 |
| Description | Shares | Market Value ($ Thousands) | ||||||
COMMON STOCK (continued) |
| |||||||
Marathon Oil Corp | 2,288 | $ | 24 | |||||
Marathon Petroleum Corp | 2,038 | 109 | ||||||
NOV Inc | 1,125 | 15 | ||||||
Oasis Petroleum Inc | 1 | — | ||||||
Occidental Petroleum Corp | 2,659 | 71 | ||||||
ONEOK Inc | 1,442 | 73 | ||||||
Phillips 66 | 1,421 | 116 | ||||||
Pioneer Natural Resources Co | 637 | 101 | ||||||
Schlumberger NV, Cl A | 4,376 | 119 | ||||||
Titan Energy LLC * | 12,743 | 1 | ||||||
Valero Energy Corp | 1,268 | 91 | ||||||
Williams Cos Inc/The | 3,779 | 90 | ||||||
|
|
| ||||||
| 2,946 | ||||||||
|
|
| ||||||
Financials — 1.3% | ||||||||
Aflac Inc | 2,042 | 105 | ||||||
Allstate Corp/The | 951 | 109 | ||||||
American Express Co | 2,060 | 291 | ||||||
American International Group Inc | 2,805 | 130 | ||||||
Ameriprise Financial Inc | 359 | 83 | ||||||
Aon PLC, Cl A | 702 | 162 | ||||||
Arthur J Gallagher & Co | 584 | 73 | ||||||
Aspect *(G) | 57 | — | ||||||
Assurant Inc | 187 | 27 | ||||||
Bank of America Corp | 23,903 | 925 | ||||||
Bank of New York Mellon Corp/The | 2,507 | 119 | ||||||
Berkshire Hathaway Inc, Cl B * | 5,984 | 1,529 | ||||||
BlackRock Inc | 442 | 333 | ||||||
Capital One Financial Corp | 1,450 | 184 | ||||||
Cboe Global Markets Inc | 350 | 35 | ||||||
Charles Schwab Corp/The | 4,728 | 308 | ||||||
Chubb Ltd | 1,432 | 226 | ||||||
Cincinnati Financial Corp | 441 | 45 | ||||||
Citigroup Inc | 6,553 | 477 | ||||||
Citizens Financial Group Inc | 1,434 | 63 | ||||||
CME Group Inc | 1,130 | 231 | ||||||
Comerica Inc | 388 | 28 | ||||||
Discover Financial Services | 1,003 | 95 | ||||||
Everest Re Group Ltd | 125 | 31 | ||||||
Fifth Third Bancorp | 2,166 | 81 | ||||||
First Republic Bank/CA | 578 | 96 | ||||||
Franklin Resources Inc | 832 | 25 | ||||||
Globe Life Inc | 309 | 30 | ||||||
Goldman Sachs Group Inc/The | 1,079 | 353 | ||||||
Hartford Financial Services Group Inc/The | 1,086 | 73 | ||||||
Huntington Bancshares Inc/OH | 3,178 | 50 | ||||||
Intercontinental Exchange Inc | 1,784 | 199 | ||||||
Invesco Ltd | 1,059 | 27 | ||||||
JPMorgan Chase & Co | 9,575 | 1,458 | ||||||
KeyCorp | 2,907 | 58 | ||||||
Lincoln National Corp | 602 | 37 | ||||||
Loews Corp | 664 | 34 | ||||||
M&T Bank Corp | 414 | 63 | ||||||
| Description | Shares | Market Value ($ Thousands) | ||||||
COMMON STOCK (continued) | ||||||||
MarketAxess Holdings Inc | 114 | $ | 57 | |||||
Marsh & McLennan Cos Inc | 1,610 | 196 | ||||||
MetLife Inc | 2,348 | 143 | ||||||
Moody’s Corp | 510 | 152 | ||||||
Morgan Stanley | 4,752 | 369 | ||||||
MSCI Inc, Cl A | 252 | 106 | ||||||
Nasdaq Inc, Cl A | 388 | 57 | ||||||
Noble Corp * | 7,982 | 135 | ||||||
Northern Trust Corp | 634 | 67 | ||||||
People’s United Financial Inc | 1,164 | 21 | ||||||
PNC Financial Services Group Inc/The | 1,344 | 236 | ||||||
Principal Financial Group Inc, Cl A | 806 | 48 | ||||||
Progressive Corp/The | 1,825 | 174 | ||||||
Prudential Financial Inc | 1,290 | 118 | ||||||
Raymond James Financial Inc | 395 | 48 | ||||||
Regions Financial Corp | 3,209 | 66 | ||||||
S&P Global Inc | 759 | 268 | ||||||
State Street Corp | 1,139 | 96 | ||||||
SVB Financial Group, Cl B * | 169 | 83 | ||||||
Synchrony Financial | 1,640 | 67 | ||||||
T Rowe Price Group Inc | 704 | 121 | ||||||
Travelers Cos Inc/The | 778 | 117 | ||||||
Truist Financial Corp | 4,295 | 250 | ||||||
Unum Group | 549 | 15 | ||||||
US Bancorp | 4,361 | 241 | ||||||
W R Berkley Corp | 448 | 34 | ||||||
Wells Fargo & Co | 13,017 | 509 | ||||||
Willis Towers Watson PLC | 402 | 92 | ||||||
Zions Bancorp NA | 462 | 25 | ||||||
|
|
| ||||||
| 12,104 | ||||||||
|
|
| ||||||
Health Care — 1.5% | ||||||||
Abbott Laboratories | 5,587 | 670 | ||||||
AbbVie Inc | 5,565 | 602 | ||||||
ABIOMED Inc * | 142 | 45 | ||||||
Agilent Technologies Inc | 933 | 119 | ||||||
Alexion Pharmaceuticals Inc * | 714 | 109 | ||||||
Align Technology Inc * | 226 | 122 | ||||||
AmerisourceBergen Corp, Cl A | 439 | 52 | ||||||
Amgen Inc, Cl A | 1,817 | 452 | ||||||
Anthem Inc | 767 | 275 | ||||||
Baxter International Inc | 1,572 | 133 | ||||||
Becton Dickinson and Co | 924 | 225 | ||||||
Biogen Inc * | 474 | 133 | ||||||
Bio-Rad Laboratories Inc, Cl A * | 66 | 38 | ||||||
Boston Scientific Corp * | 4,542 | 176 | ||||||
Bristol-Myers Squibb Co | 7,049 | 445 | ||||||
Cardinal Health Inc | 873 | 53 | ||||||
Catalent Inc * | 553 | 58 | ||||||
Centene Corp * | 1,818 | 116 | ||||||
Cerner Corp | 986 | 71 | ||||||
Cigna Corp | 1,110 | 268 | ||||||
Cooper Cos Inc/The, Cl A | 146 | 56 | ||||||
| SEI Institutional Managed Trust / Semi-Annual Report / March 31, 2021 | 215 |
SCHEDULE OF INVESTMENTS (Unaudited)
March 31, 2021
Multi-Asset Income Fund (Continued)
| Description | Shares | Market Value ($ Thousands) | ||||||
COMMON STOCK (continued) |
| |||||||
CVS Health Corp | 4,082 | $ | 307 | |||||
Danaher Corp, Cl A | 1,989 | 448 | ||||||
DaVita Inc * | 250 | 27 | ||||||
DENTSPLY SIRONA Inc | 691 | 44 | ||||||
Dexcom Inc * | 296 | 106 | ||||||
Edwards Lifesciences Corp, Cl A * | 1,977 | 165 | ||||||
Eli Lilly and Co | 2,504 | 468 | ||||||
Gilead Sciences Inc | 3,961 | 256 | ||||||
HCA Healthcare Inc | 823 | 155 | ||||||
Henry Schein Inc * | 474 | 33 | ||||||
Hologic Inc * | 848 | 63 | ||||||
Humana Inc | 401 | 168 | ||||||
IDEXX Laboratories Inc * | 265 | 130 | ||||||
Illumina Inc * | 455 | 175 | ||||||
Incyte Corp * | 608 | 49 | ||||||
Intuitive Surgical Inc * | 371 | 274 | ||||||
IQVIA Holdings Inc * | 592 | 114 | ||||||
Johnson & Johnson | 8,247 | 1,355 | ||||||
Laboratory Corp of America Holdings * | 296 | 75 | ||||||
McKesson Corp | 501 | 98 | ||||||
Medtronic PLC | 4,244 | 501 | ||||||
Merck & Co Inc | 7,976 | 615 | ||||||
Mettler-Toledo International Inc * | 76 | 88 | ||||||
PerkinElmer Inc | 365 | 47 | ||||||
Perrigo Co PLC | 414 | 17 | ||||||
Pfizer Inc | 17,585 | 637 | ||||||
Quest Diagnostics Inc | 395 | 51 | ||||||
Regeneron Pharmaceuticals Inc * | 327 | 155 | ||||||
ResMed Inc | 452 | 88 | ||||||
STERIS PLC | 288 | 55 | ||||||
Stryker Corp | 1,031 | 251 | ||||||
Teleflex Inc | 142 | 59 | ||||||
Thermo Fisher Scientific Inc | 1,231 | 562 | ||||||
UnitedHealth Group Inc | 2,976 | 1,107 | ||||||
Universal Health Services Inc, Cl B | 241 | 32 | ||||||
Varian Medical Systems Inc * | 271 | 48 | ||||||
Vertex Pharmaceuticals Inc * | 825 | 177 | ||||||
Viatris Inc, Cl W * | 3,998 | 56 | ||||||
Waters Corp * | 205 | 58 | ||||||
West Pharmaceutical Services Inc | 224 | 63 | ||||||
Zimmer Biomet Holdings Inc | 676 | 108 | ||||||
Zoetis Inc, Cl A | 1,516 | 239 | ||||||
|
|
| ||||||
| 13,742 | ||||||||
|
|
| ||||||
Industrials — 0.9% | ||||||||
3M Co | 1,805 | 348 | ||||||
A O Smith Corp | 402 | 27 | ||||||
Alaska Air Group Inc | 341 | 24 | ||||||
Allegion PLC | 270 | 34 | ||||||
American Airlines Group Inc | 1,751 | 42 | ||||||
AMETEK Inc | 710 | 91 | ||||||
Boeing Co/The * | 1,739 | 443 | ||||||
Carrier Global Corp | 2,545 | 107 | ||||||
| Description | Shares | Market Value ($ Thousands) | ||||||
COMMON STOCK (continued) |
| |||||||
Caterpillar Inc, Cl A | 1,701 | $ | 394 | |||||
CH Robinson Worldwide Inc | 444 | 42 | ||||||
Cintas Corp | 268 | 91 | ||||||
Copart Inc * | 624 | 68 | ||||||
CSX Corp | 2,424 | 234 | ||||||
Cummins Inc | 457 | 118 | ||||||
Deere & Co | 983 | 368 | ||||||
Delta Air Lines Inc, Cl A * | 1,968 | 95 | ||||||
Dover Corp | 470 | 64 | ||||||
Eaton Corp PLC | 1,240 | 171 | ||||||
Emerson Electric Co | 1,894 | 171 | ||||||
Equifax Inc | 368 | 67 | ||||||
Expeditors International of Washington Inc | 546 | 59 | ||||||
Fastenal Co, Cl A | 1,766 | 89 | ||||||
FedEx Corp | 761 | 216 | ||||||
Fortive Corp | 1,025 | 72 | ||||||
Fortune Brands Home & Security Inc | 451 | 43 | ||||||
Generac Holdings Inc * | 190 | 62 | ||||||
General Dynamics Corp | 717 | 130 | ||||||
General Electric Co | 27,327 | 359 | ||||||
Honeywell International Inc | 2,205 | 479 | ||||||
Howmet Aerospace Inc | 1,110 | 36 | ||||||
Huntington Ingalls Industries Inc, Cl A | 119 | 25 | ||||||
IDEX Corp | 253 | 53 | ||||||
IHS Markit Ltd | 1,169 | 113 | ||||||
Illinois Tool Works Inc | 905 | 200 | ||||||
Ingersoll Rand Inc * | 1,127 | 55 | ||||||
Jacobs Engineering Group Inc | 386 | 50 | ||||||
JB Hunt Transport Services Inc | 276 | 46 | ||||||
Johnson Controls International PLC | 2,278 | 136 | ||||||
Kansas City Southern | 275 | 73 | ||||||
L3Harris Technologies Inc | 640 | 130 | ||||||
Lockheed Martin Corp | 786 | 290 | ||||||
Masco Corp | 787 | 47 | ||||||
Nielsen Holdings PLC | 1,058 | 27 | ||||||
Norfolk Southern Corp | 792 | 213 | ||||||
Northrop Grumman Corp | 490 | 159 | ||||||
Old Dominion Freight Line Inc, Cl A | 290 | 70 | ||||||
Otis Worldwide Corp | 1,256 | 86 | ||||||
PACCAR Inc | 1,116 | 104 | ||||||
Parker-Hannifin Corp, Cl A | 404 | 127 | ||||||
Pentair PLC | 494 | 31 | ||||||
Quanta Services Inc | 421 | 37 | ||||||
Raytheon Technologies Corp | 4,765 | 368 | ||||||
Republic Services Inc | 634 | 63 | ||||||
Robert Half International Inc | 353 | 28 | ||||||
Rockwell Automation Inc | 362 | 96 | ||||||
Rollins Inc | 670 | 23 | ||||||
Roper Technologies Inc | 328 | 132 | ||||||
Snap-on Inc | 172 | 40 | ||||||
Southwest Airlines Co, Cl A | 1,833 | 112 | ||||||
Stanley Black & Decker Inc | 490 | 98 | ||||||
| 216 | SEI Institutional Managed Trust / Semi-Annual Report / March 31, 2021 |
| Description | Shares | Market Value ($ Thousands) | ||||||
COMMON STOCK (continued) |
| |||||||
Teledyne Technologies Inc * | 115 | $ | 48 | |||||
Textron Inc | 694 | 39 | ||||||
Trane Technologies PLC | 775 | 128 | ||||||
TransDigm Group Inc * | 173 | 102 | ||||||
Union Pacific Corp | 2,107 | 464 | ||||||
United Airlines Holdings Inc * | 980 | 56 | ||||||
United Parcel Service Inc, Cl B | 2,244 | 381 | ||||||
United Rentals Inc * | 231 | 76 | ||||||
Verisk Analytics Inc, Cl A | 527 | 93 | ||||||
Waste Management Inc | 1,227 | 158 | ||||||
Westinghouse Air Brake Technologies Corp | 593 | 47 | ||||||
WW Grainger Inc | 147 | 59 | ||||||
Xylem Inc/NY | 606 | 64 | ||||||
|
|
| ||||||
| 9,291 | ||||||||
|
|
| ||||||
Information Technology — 3.1% | ||||||||
Accenture PLC, Cl A | 1,998 | 552 | ||||||
Adobe Inc * | 1,512 | 719 | ||||||
Advanced Micro Devices Inc * | 3,851 | 302 | ||||||
Akamai Technologies Inc * | 483 | 49 | ||||||
Amphenol Corp, Cl A | 1,886 | 124 | ||||||
Analog Devices Inc | 1,148 | 178 | ||||||
ANSYS Inc * | 269 | 91 | ||||||
Apple Inc | 49,599 | 6,058 | ||||||
Applied Materials Inc | 2,860 | 382 | ||||||
Arista Networks Inc * | 178 | 54 | ||||||
Autodesk Inc, Cl A * | 685 | 190 | ||||||
Automatic Data Processing Inc | 1,361 | 256 | ||||||
Broadcom Inc | 1,283 | 595 | ||||||
Broadridge Financial Solutions Inc | 387 | 59 | ||||||
Cadence Design Systems Inc * | 879 | 120 | ||||||
CDW Corp/DE | 430 | 71 | ||||||
Cisco Systems Inc/Delaware | 13,314 | 688 | ||||||
Citrix Systems Inc | 397 | 56 | ||||||
Cognizant Technology Solutions Corp, Cl A | 1,685 | 132 | ||||||
Corning Inc, Cl B | 2,381 | 104 | ||||||
DXC Technology Co | 736 | 23 | ||||||
Enphase Energy Inc * | 400 | 65 | ||||||
F5 Networks Inc, Cl A * | 193 | 40 | ||||||
Fidelity National Information Services Inc, Cl B | 1,960 | 276 | ||||||
Fiserv Inc, Cl A * | 1,828 | 218 | ||||||
FleetCor Technologies Inc * | 267 | 72 | ||||||
FLIR Systems Inc | 380 | 21 | ||||||
Fortinet Inc * | 430 | 79 | ||||||
Gartner Inc * | 297 | 54 | ||||||
Global Payments Inc | 927 | 187 | ||||||
Hewlett Packard Enterprise Co | 4,216 | 66 | ||||||
HP Inc | 3,893 | 123 | ||||||
Intel Corp | 12,779 | 818 | ||||||
International Business Machines Corp | 2,787 | 371 | ||||||
Intuit Inc | 865 | 331 | ||||||
IPG Photonics Corp * | 106 | 22 | ||||||
| Description | Shares | Market Value ($ Thousands) | ||||||
COMMON STOCK (continued) |
| |||||||
Jack Henry & Associates Inc | 262 | $ | 40 | |||||
Juniper Networks Inc | 1,052 | 27 | ||||||
Keysight Technologies Inc * | 578 | 83 | ||||||
KLA Corp | 481 | 159 | ||||||
Lam Research Corp | 447 | 266 | ||||||
Leidos Holdings Inc | 452 | 44 | ||||||
Mastercard Inc, Cl A | 2,759 | 982 | ||||||
Maxim Integrated Products Inc | 861 | 79 | ||||||
Microchip Technology Inc | 831 | 129 | ||||||
Micron Technology Inc * | 3,559 | 314 | ||||||
Microsoft Corp | 23,704 | 5,589 | ||||||
Monolithic Power Systems Inc | 140 | 49 | ||||||
Motorola Solutions Inc | 551 | 104 | ||||||
NetApp Inc | 712 | 52 | ||||||
NortonLifeLock Inc | 1,684 | 36 | ||||||
NVIDIA Corp | 1,951 | 1,042 | ||||||
NXP Semiconductors NV | 868 | 175 | ||||||
Oracle Corp, Cl B | 5,872 | 412 | ||||||
Paychex Inc | 998 | 98 | ||||||
Paycom Software Inc * | 161 | 60 | ||||||
PayPal Holdings Inc * | 3,685 | 895 | ||||||
Qlik *(G) | 3,600 | — | ||||||
Qlik, Cl A *(G)(I) | 56 | 57 | ||||||
Qlik, Cl B *(G) | 13,812 | — | ||||||
Qorvo Inc * | 341 | 62 | ||||||
QUALCOMM Inc | 3,566 | 473 | ||||||
salesforce.com Inc * | 2,893 | 613 | ||||||
Seagate Technology PLC | 598 | 46 | ||||||
ServiceNow Inc * | 625 | 313 | ||||||
Skyworks Solutions Inc | 533 | 98 | ||||||
Synopsys Inc * | 482 | 119 | ||||||
TE Connectivity Ltd | 1,070 | 138 | ||||||
Teradyne Inc | 557 | 68 | ||||||
Texas Instruments Inc | 2,898 | 548 | ||||||
Trimble Inc * | 800 | 62 | ||||||
Tyler Technologies Inc * | 128 | 54 | ||||||
VeriSign Inc * | 308 | 61 | ||||||
Visa Inc, Cl A | 5,319 | 1,126 | ||||||
Western Digital Corp | 985 | 66 | ||||||
Western Union Co/The | 1,292 | 32 | ||||||
Xilinx Inc | 747 | 93 | ||||||
Zebra Technologies Corp, Cl A * | 163 | 79 | ||||||
|
|
| ||||||
| 28,289 | ||||||||
|
|
| ||||||
Materials — 0.4% | ||||||||
Air Products and Chemicals Inc | 694 | 195 | ||||||
Albemarle Corp | 353 | 52 | ||||||
Amcor PLC | 5,141 | 60 | ||||||
Avery Dennison Corp | 274 | 50 | ||||||
Ball Corp | 1,021 | 87 | ||||||
Celanese Corp, Cl A | 340 | 51 | ||||||
CF Industries Holdings Inc | 667 | 30 | ||||||
Corteva Inc | 2,334 | 109 | ||||||
| SEI Institutional Managed Trust / Semi-Annual Report / March 31, 2021 | 217 |
SCHEDULE OF INVESTMENTS (Unaudited)
March 31, 2021
Multi-Asset Income Fund (Continued)
| Description | Shares | Market Value ($ Thousands) | ||||||
COMMON STOCK (continued) | ||||||||
Dow Inc | 2,331 | $ | 149 | |||||
DuPont de Nemours Inc | 1,688 | 130 | ||||||
Eastman Chemical Co | 442 | 49 | ||||||
Ecolab Inc | 773 | 165 | ||||||
FMC Corp | 429 | 47 | ||||||
Freeport-McMoRan Inc, Cl B | 4,590 | 151 | ||||||
International Flavors & Fragrances Inc | 765 | 107 | ||||||
International Paper Co | 1,201 | 65 | ||||||
Linde PLC | 1,645 | 461 | ||||||
LyondellBasell Industries NV, Cl A | 784 | 82 | ||||||
Martin Marietta Materials Inc, Cl A | 190 | 64 | ||||||
Mosaic Co/The | 1,105 | 35 | ||||||
Newmont Corp | 2,524 | 152 | ||||||
Nucor Corp | 911 | 73 | ||||||
Packaging Corp of America | 308 | 41 | ||||||
PPG Industries Inc | 761 | 114 | ||||||
Sealed Air Corp | 462 | 21 | ||||||
Sherwin-Williams Co/The, Cl A | 249 | 184 | ||||||
Vulcan Materials Co | 400 | 68 | ||||||
Westrock Co | 863 | 45 | ||||||
|
|
| ||||||
| 2,837 | ||||||||
|
|
| ||||||
Real Estate — 0.3% | ||||||||
Alexandria Real Estate Equities Inc ‡ | 401 | 66 | ||||||
American Tower Corp, Cl A ‡ | 1,413 | 338 | ||||||
AvalonBay Communities Inc ‡ | 433 | 80 | ||||||
Boston Properties Inc ‡ | 415 | 42 | ||||||
CBRE Group Inc, Cl A *‡ | 1,033 | 82 | ||||||
Crown Castle International Corp ‡ | 1,348 | 232 | ||||||
Digital Realty Trust Inc, Cl A ‡ | 868 | 122 | ||||||
Duke Realty Corp ‡ | 1,245 | 52 | ||||||
Equinix Inc ‡ | 283 | 192 | ||||||
Equity Residential ‡ | 1,059 | 76 | ||||||
Essex Property Trust Inc ‡ | 195 | 53 | ||||||
Extra Space Storage Inc ‡ | 440 | 58 | ||||||
Federal Realty Investment Trust ‡ | 206 | 21 | ||||||
Healthpeak Properties Inc ‡ | 1,749 | 56 | ||||||
Host Hotels & Resorts Inc ‡ | 2,164 | 36 | ||||||
Iron Mountain Inc ‡ | 910 | 34 | ||||||
Kimco Realty Corp ‡ | 1,243 | 23 | ||||||
Mid-America Apartment Communities Inc ‡ | 387 | 56 | ||||||
Prologis Inc ‡ | 2,358 | 250 | ||||||
Public Storage ‡ | 465 | 115 | ||||||
Realty Income Corp ‡ | 1,187 | 75 | ||||||
Regency Centers Corp ‡ | 482 | 27 | ||||||
SBA Communications Corp, Cl A ‡ | 335 | 93 | ||||||
Simon Property Group Inc ‡ | 1,066 | 121 | ||||||
UDR Inc ‡ | 952 | 42 | ||||||
Ventas Inc ‡ | 1,217 | 65 | ||||||
Vornado Realty Trust ‡ | 469 | 21 | ||||||
Welltower Inc ‡ | 1,278 | 92 | ||||||
| Description | Shares | Market Value ($ Thousands) | ||||||
COMMON STOCK (continued) | ||||||||
Weyerhaeuser Co ‡ | 2,276 | $ | 81 | |||||
|
|
| ||||||
| 2,601 | ||||||||
|
|
| ||||||
Utilities — 0.3% | ||||||||
AES Corp/The | 2,161 | 58 | ||||||
Alliant Energy Corp | 833 | 45 | ||||||
Ameren Corp | 758 | 62 | ||||||
American Electric Power Co Inc | 1,552 | 131 | ||||||
American Water Works Co Inc | 566 | 85 | ||||||
Atmos Energy Corp | 402 | 40 | ||||||
CenterPoint Energy Inc | 1,750 | 40 | ||||||
CMS Energy Corp | 857 | 52 | ||||||
Consolidated Edison Inc | 1,042 | 78 | ||||||
Dominion Energy Inc | 2,590 | 197 | ||||||
DTE Energy Co | 594 | 79 | ||||||
Duke Energy Corp | 2,458 | 237 | ||||||
Edison International | 1,248 | 73 | ||||||
Entergy Corp | 603 | 60 | ||||||
Evergy Inc | 778 | 46 | ||||||
Eversource Energy | 1,050 | 91 | ||||||
Exelon Corp | 3,164 | 138 | ||||||
FirstEnergy Corp | 1,630 | 57 | ||||||
NextEra Energy Inc | 6,168 | 466 | ||||||
NiSource Inc | 1,208 | 29 | ||||||
NRG Energy Inc | 813 | 31 | ||||||
Pinnacle West Capital Corp | 349 | 28 | ||||||
PPL Corp | 2,347 | 68 | ||||||
Public Service Enterprise Group Inc | 1,624 | 98 | ||||||
Sempra Energy | 906 | 120 | ||||||
Southern Co/The | 3,358 | 209 | ||||||
WEC Energy Group Inc | 980 | 92 | ||||||
Xcel Energy Inc | 1,643 | 109 | ||||||
|
|
| ||||||
| 2,819 | ||||||||
|
|
| ||||||
Total Common Stock | 105,870 | |||||||
|
|
| ||||||
Face Amount (Thousands) | ||||||||||
SOVEREIGN DEBT — 11.3% | ||||||||||
Abu Dhabi Government International Bond |
| |||||||||
4.125%, 10/11/2047 (A) | $ | 380 | 428 | |||||||
3.875%, 04/16/2050 (A) | 1,630 | 1,770 | ||||||||
Angolan Government International Bond |
| |||||||||
9.375%, 05/08/2048 | 200 | 188 | ||||||||
9.125%, 11/26/2049 (A) | 1,170 | 1,086 | ||||||||
8.000%, 11/26/2029 (A) | 420 | 394 | ||||||||
Argentine Republic Government International Bond |
| |||||||||
1.000%, 07/09/2029 | 262 | 94 | ||||||||
0.500%, 07/09/2029 | EUR | 6 | 2 | |||||||
0.125%, 07/09/2021 | $ | 1,310 | 452 | |||||||
| 218 | SEI Institutional Managed Trust / Semi-Annual Report / March 31, 2021 |
| Description | Face Amount (Thousands) | Market Value ($ Thousands) | ||||||||
SOVEREIGN DEBT (continued) |
| |||||||||
0.125% ,0.500%, 07/09/2021, 07/09/2030 (F) | $ | 3,760 | $ | 1,259 | ||||||
0.125%, 07/09/2030 | EUR | 165 | 63 | |||||||
0.125%, 07/09/2035 | $ | 1,686 | 503 | |||||||
Armenia Government International Bond | ||||||||||
3.950%, 09/26/2029 (A) | 290 | 274 | ||||||||
Azerbaijan Government International Bond | ||||||||||
3.500%, 09/01/2032 | 1,360 | 1,343 | ||||||||
Bahrain Government International Bond | ||||||||||
7.375%, 05/14/2030 (A) | 1,610 | 1,787 | ||||||||
Belize Government International Bond | ||||||||||
4.938%, 02/20/2034 | 165 | 65 | ||||||||
Benin Government International Bond | ||||||||||
4.875%, 01/19/2032 | EUR | 1,480 | 1,653 | |||||||
Brazil Minas SPE via State of Minas Gerais | ||||||||||
5.333%, 02/15/2028 | $ | 140 | 152 | |||||||
Brazil Notas do Tesouro Nacional | ||||||||||
10.000%, 01/01/2029 | BRL | 1,400 | 259 | |||||||
Brazil Notas do Tesouro Nacional, Ser F | ||||||||||
10.000%, 01/01/2027 | 2,791 | 519 | ||||||||
CBB International Sukuk Programme SPC | ||||||||||
6.250%, 11/14/2024 (A) | $ | 300 | 329 | |||||||
Colombia Government International Bond | ||||||||||
4.125%, 05/15/2051 | 630 | 598 | ||||||||
3.125%, 04/15/2031 | 730 | 714 | ||||||||
3.000%, 01/30/2030 | 200 | 196 | ||||||||
Dominican Republic International Bond | ||||||||||
7.450%, 04/30/2044 | 600 | 706 | ||||||||
6.850%, 01/27/2045 | 660 | 729 | ||||||||
6.500%, 02/15/2048 (A) | 1,270 | 1,342 | ||||||||
6.400%, 06/05/2049 (A) | 660 | 691 | ||||||||
6.000%, 07/19/2028 (A) | 1,300 | 1,464 | ||||||||
4.500%, 01/30/2030 | 550 | 556 | ||||||||
Ecuador Government International Bond | ||||||||||
0.500%, 07/31/2040 (A) | 1,128 | 487 | ||||||||
13.352%, 07/31/2030 (A)(J) | 329 | 132 | ||||||||
Ecuador Government International Bond | ||||||||||
0.500%, 07/31/2030 (A) | 352 | 205 | ||||||||
Egypt Government International Bond | ||||||||||
8.875%, 05/29/2050 (A) | 710 | 724 | ||||||||
8.700%, 03/01/2049 (A) | 520 | 521 | ||||||||
8.500%, 01/31/2047 | 650 | 646 | ||||||||
7.903%, 02/21/2048 (A) | 360 | 339 | ||||||||
7.625%, 05/29/2032 (A) | 480 | 491 | ||||||||
7.600%, 03/01/2029 (A) | 510 | 542 | ||||||||
6.375%, 04/11/2031 (A) | EUR | 330 | 397 | |||||||
5.625%, 04/16/2030 | 1,560 | 1,821 | ||||||||
4.750%, 04/11/2025 | 100 | 122 | ||||||||
4.750%, 04/16/2026 | 680 | 824 | ||||||||
Ghana Government International Bond | ||||||||||
8.125%, 01/18/2026 | $ | 500 | 530 | |||||||
8.125%, 03/26/2032 (A) | 950 | 916 | ||||||||
| Description | Face Amount (Thousands) | Market Value ($ Thousands) | ||||||||
SOVEREIGN DEBT (continued) |
| |||||||||
Guatemala Government Bond | ||||||||||
6.125%, 06/01/2050 (A) | $ | 530 | $ | 613 | ||||||
5.750%, 06/06/2022 | 500 | 523 | ||||||||
4.900%, 06/01/2030 (A) | 280 | 307 | ||||||||
4.875%, 02/13/2028 | 790 | 869 | ||||||||
4.500%, 05/03/2026 (A) | 770 | 829 | ||||||||
4.375%, 06/05/2027 (A) | 790 | 845 | ||||||||
Hazine Mustesarligi Varlik Kiralama | ||||||||||
5.004%, 04/06/2023 (A) | 860 | 860 | ||||||||
Honduras Government International Bond | ||||||||||
7.500%, 03/15/2024 | 660 | 716 | ||||||||
Indonesia Government International Bond | ||||||||||
5.250%, 01/17/2042 | 1,000 | 1,195 | ||||||||
3.850%, 10/15/2030 | 200 | 220 | ||||||||
3.500%, 01/11/2028 | 880 | 943 | ||||||||
2.850%, 02/14/2030 | 900 | 916 | ||||||||
1.100%, 03/12/2033 | EUR | 400 | 455 | |||||||
0.900%, 02/14/2027 | 180 | 213 | ||||||||
Indonesia Treasury Bond | ||||||||||
7.000%, 05/15/2027 | IDR | 96,424,000 | 6,895 | |||||||
Iraq Government International Bond | ||||||||||
5.800%, 01/15/2028 | $ | 245 | 231 | |||||||
Israel Government International Bond | ||||||||||
3.375%, 01/15/2050 | 310 | 313 | ||||||||
2.750%, 07/03/2030 | 460 | 481 | ||||||||
Ivory Coast Government International Bond | ||||||||||
6.625%, 03/22/2048 | EUR | 420 | 497 | |||||||
6.125%, 06/15/2033 | $ | 650 | 664 | |||||||
5.750%, 12/31/2032 | 219 | 219 | ||||||||
5.250%, 03/22/2030 | EUR | 390 | 473 | |||||||
4.875%, 01/30/2032 (A) | 1,660 | 1,901 | ||||||||
Jamaica Government International Bond | ||||||||||
7.875%, 07/28/2045 | $ | 740 | 1,003 | |||||||
Kazakhstan Government International | ||||||||||
Bond MTN | ||||||||||
5.125%, 07/21/2025 | 720 | 835 | ||||||||
Kenya Government International Bond | ||||||||||
8.250%, 02/28/2048 (A) | 260 | 268 | ||||||||
8.000%, 05/22/2032 (A) | 910 | 965 | ||||||||
7.000%, 05/22/2027 (A) | 250 | 265 | ||||||||
Lebanon Government International Bond | ||||||||||
8.250%, 05/17/2034 (C) | 30 | 3 | ||||||||
8.200%, 05/17/2033 (C) | 40 | 5 | ||||||||
7.150%, 11/20/2031 (C) | 40 | 5 | ||||||||
7.050%, 11/02/2035 (C) | 100 | 11 | ||||||||
7.000%, 03/20/2028 (C) | 40 | 5 | ||||||||
6.850%, 03/23/2027 (C) | 100 | 11 | ||||||||
6.850%, 05/25/2029 (C) | 721 | 83 | ||||||||
6.750%, 11/29/2027 (C) | 410 | 47 | ||||||||
6.650%, 04/22/2024 (C) | 170 | 20 | ||||||||
6.650%, 11/03/2028 (C) | 80 | 9 | ||||||||
6.650%, 02/26/2030 (C) | 832 | 95 | ||||||||
| SEI Institutional Managed Trust / Semi-Annual Report / March 31, 2021 | 219 |
SCHEDULE OF INVESTMENTS (Unaudited)
March 31, 2021
Multi-Asset Income Fund (Continued)
| Description | Face Amount (Thousands) | Market Value ($ Thousands) | ||||||||||||||
SOVEREIGN DEBT (continued) |
| |||||||||||||||
6.600%, 11/27/2026 (C) | $ | 30 | $ | 4 | ||||||||||||
6.200%, 02/26/2025 (C) | 860 | 98 | ||||||||||||||
Mexican Bonos | ||||||||||||||||
8.500%, 05/31/2029 | MXN | 9,520 | 522 | |||||||||||||
6.500%, 06/09/2022 | 5,740 | 286 | ||||||||||||||
Mexico Government International Bond | ||||||||||||||||
4.750%, 03/08/2044 | $ | 440 | 462 | |||||||||||||
3.771%, 05/24/2061 | 520 | 458 | ||||||||||||||
3.600%, 01/30/2025 | 1,000 | 1,087 | ||||||||||||||
2.659%, 05/24/2031 | 360 | 339 | ||||||||||||||
Mongolia Government International Bond | ||||||||||||||||
5.625%, 05/01/2023 | 200 | 209 | ||||||||||||||
Morocco Government International Bond | ||||||||||||||||
3.000%, 12/15/2032 (A) | 730 | 684 | ||||||||||||||
1.500%, 11/27/2031 (A) | EUR | 290 | 320 | |||||||||||||
Mozambique International Bond | ||||||||||||||||
5.000%, 09/15/2023 | $ | 220 | 181 | |||||||||||||
Nigeria Government International Bond | ||||||||||||||||
8.747%, 01/21/2031 | 1,720 | 1,890 | ||||||||||||||
7.696%, 02/23/2038 (A) | 690 | 676 | ||||||||||||||
Oman Government International Bond | ||||||||||||||||
6.750%, 01/17/2048 | 200 | 191 | ||||||||||||||
6.250%, 01/25/2031 (A) | 1,600 | 1,672 | ||||||||||||||
Pakistan Government International Bond | ||||||||||||||||
8.250%, 09/30/2025 | 370 | 409 | ||||||||||||||
6.875%, 12/05/2027 | 200 | 209 | ||||||||||||||
Panama Government International Bond | ||||||||||||||||
4.500%, 04/01/2056 | 300 | 327 | ||||||||||||||
Papua New Guinea Government International Bond | ||||||||||||||||
8.375%, 10/04/2028 (A) | 290 | 298 | ||||||||||||||
Paraguay Government International Bond | ||||||||||||||||
6.100%, 08/11/2044 | 700 | 840 | ||||||||||||||
5.600%, 03/13/2048 (A) | 560 | 636 | ||||||||||||||
5.400%, 03/30/2050 (A) | 320 | 360 | ||||||||||||||
5.000%, 04/15/2026 (A) | 440 | 497 | ||||||||||||||
4.700%, 03/27/2027 (A) | 570 | 636 | ||||||||||||||
Perusahaan Penerbit SBSN Indonesia III | ||||||||||||||||
4.550%, 03/29/2026 (A) | 530 | 596 | ||||||||||||||
4.450%, 02/20/2029 (A) | 330 | 372 | ||||||||||||||
Peruvian Government International Bond | ||||||||||||||||
2.783%, 01/23/2031 | 480 | 480 | ||||||||||||||
Provincia de Buenos Aires | ||||||||||||||||
10.875%, 01/26/2021 (C) | 63 | 26 | ||||||||||||||
9.950%, 06/09/2021 (A) | 3,100 | 1,170 | ||||||||||||||
9.125%, 03/16/2024 (A) | 550 | 209 | ||||||||||||||
7.875%, 06/15/2027 (A) | 400 | 152 | ||||||||||||||
6.500%, 02/15/2023 (A) | 2,240 | 823 | ||||||||||||||
Provincia de Cordoba | ||||||||||||||||
3.000%, 06/01/2027 (A) | 526 | 308 | ||||||||||||||
Qatar Government International Bond | ||||||||||||||||
5.103%, 04/23/2048 (A) | 1,690 | 2,136 | ||||||||||||||
| Description | Face Amount (Thousands) | Market Value ($ Thousands) | ||||||||||||||
SOVEREIGN DEBT (continued) |
| |||||||||||||||
4.817%, 03/14/2049 (A) | $ | 1,130 | $ | 1,383 | ||||||||||||
4.625%, 06/02/2046 | 280 | 331 | ||||||||||||||
4.400%, 04/16/2050 (A) | 450 | 522 | ||||||||||||||
3.750%, 04/16/2030 (A) | 200 | 223 | ||||||||||||||
Republic of Armenia International Bond | ||||||||||||||||
3.600%, 02/02/2031 (A) | 1,300 | 1,189 | ||||||||||||||
Republic of Belarus International Bond | ||||||||||||||||
6.875%, 02/28/2023 | 260 | 265 | ||||||||||||||
6.200%, 02/28/2030 | 200 | 185 | ||||||||||||||
Republic of Uzbekistan Bond MTN | ||||||||||||||||
3.700%, 11/25/2030 (A) | 660 | 641 | ||||||||||||||
Romanian Government International Bond | ||||||||||||||||
5.125%, 06/15/2048 (A) | 200 | 226 | ||||||||||||||
3.375%, 01/28/2050 | EUR | 230 | 282 | |||||||||||||
2.875%, 05/26/2028 | 650 | 843 | ||||||||||||||
2.875%, 03/11/2029 | 1,490 | 1,933 | ||||||||||||||
2.124%, 07/16/2031 (A) | 250 | 300 | ||||||||||||||
2.000%, 12/08/2026 (A) | 590 | 739 | ||||||||||||||
2.000%, 01/28/2032 (A) | 110 | 130 | ||||||||||||||
Russian Federal Bond - OFZ | ||||||||||||||||
7.050%, 01/19/2028 | RUB | 434,240 | 5,821 | |||||||||||||
Russian Foreign Bond - Eurobond | ||||||||||||||||
5.250%, 06/23/2047 | $ | 200 | 237 | |||||||||||||
5.100%, 03/28/2035 (A) | 200 | 230 | ||||||||||||||
4.375%, 03/21/2029 (A) | 800 | 874 | ||||||||||||||
Saudi Government International Bond MTN | ||||||||||||||||
4.500%, 04/22/2060 (A) | 1,070 | 1,194 | ||||||||||||||
3.750%, 01/21/2055 (A) | 220 | 215 | ||||||||||||||
3.250%, 10/22/2030 (A) | 430 | 453 | ||||||||||||||
Senegal Government International Bond | ||||||||||||||||
4.750%, 03/13/2028 (A) | EUR | 740 | 883 | |||||||||||||
Serbia International Bond | ||||||||||||||||
1.500%, 06/26/2029 (A) | 500 | 588 | ||||||||||||||
South Africa Government International Bond | ||||||||||||||||
5.650%, 09/27/2047 | $ | 950 | 873 | |||||||||||||
4.850%, 09/27/2027 | 890 | 918 | ||||||||||||||
4.300%, 10/12/2028 | 200 | 197 | ||||||||||||||
Sri Lanka Government International Bond | ||||||||||||||||
7.550%, 03/28/2030 (A) | 910 | 554 | ||||||||||||||
6.850%, 03/14/2024 (A) | 200 | 127 | ||||||||||||||
6.850%, 11/03/2025 | 570 | 355 | ||||||||||||||
6.825%, 07/18/2026 (A) | 250 | 152 | ||||||||||||||
6.750%, 04/18/2028 (A) | 660 | 401 | ||||||||||||||
6.200%, 05/11/2027 (A) | 380 | 231 | ||||||||||||||
Third Pakistan International Sukuk | ||||||||||||||||
5.625%, 12/05/2022 | 630 | 646 | ||||||||||||||
Turkey Government International Bond | ||||||||||||||||
7.625%, 04/26/2029 | 560 | 575 | ||||||||||||||
7.375%, 02/05/2025 | 30 | 31 | ||||||||||||||
6.875%, 03/17/2036 | 60 | 57 | ||||||||||||||
6.000%, 01/14/2041 | 1,980 | 1,672 | ||||||||||||||
| 220 | SEI Institutional Managed Trust / Semi-Annual Report / March 31, 2021 |
| Description | Face Amount (Thousands) | Market Value ($ Thousands) | ||||||||||
SOVEREIGN DEBT (continued) |
| |||||||||||
5.200%, 02/16/2026 | EUR | 260 | $ | 306 | ||||||||
4.250%, 03/13/2025 | $ | 410 | 381 | |||||||||
4.250%, 04/14/2026 | 530 | 481 | ||||||||||
Ukraine Government International Bond | ||||||||||||
9.750%, 11/01/2028 (A) | 640 | 745 | ||||||||||
8.994%, 02/01/2024 | 670 | 743 | ||||||||||
7.750%, 09/01/2022 | 450 | 474 | ||||||||||
7.750%, 09/01/2023 | 910 | 981 | ||||||||||
7.750%, 09/01/2024 | 230 | 248 | ||||||||||
7.750%, 09/01/2027 | 250 | 267 | ||||||||||
7.375%, 09/25/2032 (A) | 200 | 201 | ||||||||||
7.253%, 03/15/2033 (A) | 420 | 418 | ||||||||||
Uzbekistan Government International Bond MTN | ||||||||||||
4.750%, 02/20/2024 (A) | 340 | 358 | ||||||||||
Zambia Government International Bond | ||||||||||||
5.375%, 09/20/2022 | 760 | 422 | ||||||||||
|
| |||||||||||
Total Sovereign Debt (Cost $109,095) ($ Thousands) | 105,185 | |||||||||||
|
| |||||||||||
MORTGAGE-BACKED SECURITIES — 7.1% |
| |||||||||||
Agency Mortgage-Backed Obligations — 1.6% | ||||||||||||
FHLMC REMIC CMO, Ser 2014-4320, Cl SD, IO | ||||||||||||
5.994%, 07/15/2039 | 385 | 71 | ||||||||||
FHLMC REMIC CMO, Ser 2019-4905, Cl SA, IO | ||||||||||||
5.991%, 08/25/2049 | 758 | 141 | ||||||||||
FHLMC REMIC CMO, Ser 2019-4936, Cl PS, IO | ||||||||||||
5.891%, 12/25/2049 | 238 | 36 | ||||||||||
FHLMC REMIC CMO, Ser 2019-4936, Cl ES, IO | ||||||||||||
5.891%, 12/25/2049 | 228 | 37 | ||||||||||
FHLMC REMIC CMO, Ser 2020-4980, Cl KI, IO | ||||||||||||
4.500%, 06/25/2050 | 6,001 | 921 | ||||||||||
FHLMC REMIC CMO, Ser 2020-4991, Cl IE, IO | ||||||||||||
5.000%, 07/25/2050 | 3,286 | 386 | ||||||||||
FHLMC REMIC CMO, Ser 2020-4998, Cl GI, IO | ||||||||||||
4.000%, 08/25/2050 | 3,042 | 470 | ||||||||||
FHLMC REMIC CMO, Ser 2020-5009, Cl DI, IO | ||||||||||||
2.000%, 09/25/2050 | 1,764 | 210 | ||||||||||
FHLMC REMIC CMO, Ser 2020-5012, Cl DI, IO | ||||||||||||
4.000%, 09/25/2050 | 1,034 | 170 | ||||||||||
| Description | Face Amount (Thousands) | Market Value ($ Thousands) | ||||||||||
MORTGAGE-BACKED SECURITIES (continued) |
| |||||||||||
FHLMC REMIC CMO, | ||||||||||||
3.000%, 08/25/2050 | $ | 715 | $ | 116 | ||||||||
FHLMC Stacr Remic Trust, | ||||||||||||
4.709%, VAR ICE LIBOR USD 1 Month+4.600%,12/25/2042 | 330 | 332 | ||||||||||
FHLMC Stacr Remic Trust, | ||||||||||||
2.409%, VAR ICE LIBOR USD 1 Month+2.300%,01/25/2050 (A) | 370 | 362 | ||||||||||
FHLMC Stacr Remic Trust, | ||||||||||||
5.209%, VAR ICE LIBOR USD 1 Month+5.100%,06/25/2050 (A) | 1,620 | 1,671 | ||||||||||
FNMA REMIC CMO, Ser 2012-115, | ||||||||||||
5.991%, 10/25/2042 | 435 | 90 | ||||||||||
FNMA REMIC CMO, Ser 2015-30, | ||||||||||||
5.491%, 05/25/2045 | 593 | 92 | ||||||||||
FNMA REMIC CMO, Ser 2015-34, | ||||||||||||
5.991%, 06/25/2045 | 925 | 182 | ||||||||||
FNMA REMIC CMO, Ser 2016-69, | ||||||||||||
5.991%, 10/25/2046 | 870 | 146 | ||||||||||
FNMA REMIC CMO, Ser 2017-104, | ||||||||||||
6.041%, 01/25/2048 | 1,835 | 334 | ||||||||||
FNMA REMIC CMO, Ser 2017-69, | ||||||||||||
6.041%, 09/25/2047 | 1,888 | 430 | ||||||||||
FNMA REMIC CMO, Ser 2017-86, | ||||||||||||
6.041%, 11/25/2047 | 1,663 | 354 | ||||||||||
FNMA REMIC CMO, Ser 2019-81, | ||||||||||||
5.891%, 01/25/2050 | 389 | 60 | ||||||||||
FNMA REMIC CMO, Ser 2020-45, | ||||||||||||
5.000%, 07/25/2050 | 498 | 75 | ||||||||||
FNMA REMIC CMO, Ser 2020-60, | ||||||||||||
4.000%, 09/25/2050 | 960 | 157 | ||||||||||
FNMA REMIC CMO, Ser 2020-60, | ||||||||||||
2.000%, 09/25/2050 | 2,097 | 246 | ||||||||||
FNMA REMIC CMO, Ser 2020-62, | ||||||||||||
4.000%, 06/25/2048 | 1,661 | 309 | ||||||||||
FNMA, Ser FN BL5547 | ||||||||||||
2.680%, 01/01/2035 | 100 | 103 | ||||||||||
FNMA, Ser FN BM6224 | ||||||||||||
2.790%, 01/01/2035 (D) | 348 | 362 | ||||||||||
GNMA REMIC CMO, Ser 2010-9, | ||||||||||||
6.494%, VAR ICE LIBOR USD 1 Month+6.600%,01/16/2040 | 1,859 | 385 | ||||||||||
GNMA REMIC CMO, Ser 2013-124, | ||||||||||||
5.939%, 08/20/2043 | 186 | 40 | ||||||||||
GNMA REMIC CMO, Ser 2014-117, | ||||||||||||
5.489% 08/20/2044 | 522 | 95 | ||||||||||
GNMA REMIC CMO, Ser 2014-158, | ||||||||||||
5.494%, 10/16/2044 | 245 | 38 | ||||||||||
| SEI Institutional Managed Trust / Semi-Annual Report / March 31, 2021 | 221 |
SCHEDULE OF INVESTMENTS (Unaudited)
March 31, 2021
Multi-Asset Income Fund (Continued)
| Description | Face Amount (Thousands) | Market Value ($ Thousands) | ||||||||||
MORTGAGE-BACKED SECURITIES (continued) |
| |||||||||||
GNMA REMIC CMO, Ser 2015-110, Cl MS, IO | ||||||||||||
5.599%, 08/20/2045 | $ | 284 | $ | 51 | ||||||||
GNMA REMIC CMO, Ser 2015-111, | ||||||||||||
4.000%, 08/20/2045 | 2,425 | 275 | ||||||||||
GNMA REMIC CMO, Ser 2015-168, | ||||||||||||
4.000%, 11/20/2045 | 936 | 96 | ||||||||||
GNMA REMIC CMO, Ser 2015-57, | ||||||||||||
5.489%, 04/20/2045 | 2,046 | 342 | ||||||||||
GNMA REMIC CMO, Ser 2016-109, | ||||||||||||
4.000%, 10/20/2045 | 1,388 | 150 | ||||||||||
GNMA REMIC CMO, Ser 2016-27, | ||||||||||||
4.000%, 06/20/2045 | 662 | 65 | ||||||||||
GNMA REMIC CMO, Ser 2017-112, | ||||||||||||
5.549%, 07/20/2047 | 1,409 | 251 | ||||||||||
GNMA REMIC CMO, Ser 2018-105, Cl SC, IO | ||||||||||||
6.089%, 08/20/2048 | 359 | 58 | ||||||||||
GNMA REMIC CMO, Ser 2018-122, Cl HS, IO | ||||||||||||
6.089%, 09/20/2048 | 614 | 115 | ||||||||||
GNMA REMIC CMO, Ser 2018-122, Cl SE, IO | ||||||||||||
6.089%, 09/20/2048 | 899 | 176 | ||||||||||
GNMA REMIC CMO, Ser 2018-124, Cl SN, IO | ||||||||||||
6.089%, 09/20/2048 | 2,524 | 505 | ||||||||||
GNMA REMIC CMO, Ser 2018-137, Cl SN, IO | ||||||||||||
6.039%, 10/20/2048 | 857 | 154 | ||||||||||
GNMA REMIC CMO, Ser 2018-139, Cl SQ, IO | ||||||||||||
6.039%, 10/20/2048 | 607 | 97 | ||||||||||
GNMA REMIC CMO, Ser 2018-67, | ||||||||||||
6.089% 05/20/2048 | 2,864 | 470 | ||||||||||
GNMA REMIC CMO, Ser 2018-7, | ||||||||||||
5.589%, 01/20/2048 | 1,693 | 334 | ||||||||||
GNMA REMIC CMO, Ser 2018-72, | ||||||||||||
4.000%, 04/20/2046 | 614 | 97 | ||||||||||
GNMA REMIC CMO, Ser 2019-1, | ||||||||||||
5.939%, 01/20/2049 | 468 | 68 | ||||||||||
GNMA REMIC CMO, Ser 2019-110, Cl SE, IO | ||||||||||||
5.989%, 09/20/2049 | 1,304 | 186 | ||||||||||
GNMA REMIC CMO, Ser 2019-110, Cl SD, IO | ||||||||||||
5.989%, 09/20/2049 | 1,309 | 211 | ||||||||||
GNMA REMIC CMO, Ser 2019-128, | ||||||||||||
4.000%, 10/20/2049 | 1,038 | 143 | ||||||||||
GNMA REMIC CMO, Ser 2019-129, | ||||||||||||
3.500%, 10/20/2049 | 3,216 | 449 | ||||||||||
GNMA REMIC CMO, Ser 2019-151, | ||||||||||||
3.500%, 10/20/2049 | 5,101 | 531 | ||||||||||
GNMA REMIC CMO, Ser 2019-151, | ||||||||||||
3.500%, 12/20/2049 | 2,058 | 297 | ||||||||||
GNMA REMIC CMO, Ser 2019-4, | ||||||||||||
5.939%, 01/20/2049 | 933 | 137 | ||||||||||
GNMA REMIC CMO, Ser 2019-52, | ||||||||||||
5.939%, 04/20/2049 | 1,215 | 166 | ||||||||||
GNMA REMIC CMO, Ser 2019-6, | ||||||||||||
5.939%, 01/20/2049 | 346 | 56 | ||||||||||
| Description | Face Amount (Thousands) | Market Value ($ Thousands) | ||||||||
MORTGAGE-BACKED SECURITIES (continued) |
| |||||||||
GNMA REMIC CMO, Ser 2019-69, | ||||||||||
3.159%, 06/20/2049 | $ | 432 | $ | 31 | ||||||
GNMA REMIC CMO, Ser 2019-78, | ||||||||||
5.989%, 06/20/2049 | 318 | 47 | ||||||||
GNMA REMIC CMO, Ser 2019-98, | ||||||||||
5.939%, 08/20/2049 | 974 | 165 | ||||||||
GNMA REMIC CMO, Ser 2020-61, | ||||||||||
6.329%, 07/20/2043 | 2,424 | 455 | ||||||||
GNMA REMIC CMO, Ser 2020-78, | ||||||||||
4.000%, 06/20/2050 | 2,553 | 357 | ||||||||
|
| |||||||||
| 14,956 | ||||||||||
|
| |||||||||
Non-Agency Mortgage-Backed Obligations – 5.5% |
| |||||||||
Alternative Loan Trust, Ser 2005-81, Cl A1 | ||||||||||
0.669%, VAR ICE LIBOR USD 1 Month+0.560%, 02/25/2037 | 615 | 512 | ||||||||
Barclays Commercial Mortgage Trust, Ser 2019-C5, Cl A4 | ||||||||||
3.063%,11/15/2052 | 870 | 917 | ||||||||
Benchmark Mortgage Trust, Ser 2019-B11, Cl XA, IO | ||||||||||
1.046%, 05/15/2052 (D) | 10,908 | 712 | ||||||||
BX Commercial Mortgage Trust, Ser 2019-IMC, Cl E | ||||||||||
2.256%, VAR ICE LIBOR USD 1 Month+2.150%, 04/15/2034 (A) | 1,970 | 1,933 | ||||||||
BX Trust, Ser 2018-GWMZ, Cl MC | ||||||||||
5.594%, VAR ICE LIBOR USD 1 Month+5.488%, 05/15/2037 (A) | 1,100 | 1,005 | ||||||||
Capmark Military Housing Trust, Ser 2007-AET2, Cl A | ||||||||||
6.063%,10/10/2052 (A) | 938 | 968 | ||||||||
CGMS Commercial Mortgage Trust, | ||||||||||
Ser 2017-MDRA, Cl C | ||||||||||
3.752%, 07/10/2030 (A)(D) | 1,620 | 1,600 | ||||||||
Connecticut Avenue Securities Trust, Ser 2018-R07, Cl 1B1 | ||||||||||
4.459%, VAR ICE LIBOR USD 1 Month+4.350%, 04/25/2031 (A) | 460 | 467 | ||||||||
Credit Suisse Mortgage Trust, Ser 2019-RIO, Cl B | ||||||||||
8.000%,12/15/2021 | 1,440 | 1,357 | ||||||||
CSMC Trust, Ser 2014-USA, Cl E | ||||||||||
4.373%, 09/15/2037 (A) | 320 | 264 | ||||||||
CSMC Trust, Ser 2017-RPL1, Cl M2 | ||||||||||
3.035%, 07/25/2057 (A)(D) | 1,190 | 1,025 | ||||||||
CSMC Trust, Ser 2019-UVIL, Cl A | ||||||||||
3.160%, 12/15/2041 (A) | 950 | 972 | ||||||||
CSWF, Ser 2018-TOP, Cl D | ||||||||||
1.906%, VAR ICE LIBOR USD 1 Month+1.800%, 08/15/2035 (A) | 1,072 | 1,070 | ||||||||
| 222 | SEI Institutional Managed Trust / Semi-Annual Report / March 31, 2021 |
| Description | Face Amount (Thousands) | Market Value ($ Thousands) | ||||||
MORTGAGE-BACKED SECURITIES (continued) |
| |||||||
FNMA Connecticut Avenue Securities, Ser 2018-C01, Cl 1B1 | ||||||||
3.659%, VAR ICE LIBOR USD 1 Month+3.550%, 07/25/2030 | $ | 570 | $ | 574 | ||||
FNMA Connecticut Avenue Securities, | ||||||||
2.259%, VAR ICE LIBOR USD 1 Month+2.150%, 10/25/2030 | 594 | 591 | ||||||
FNMA Connecticut Avenue Securities, Ser 2018-C03, Cl 1M2C | ||||||||
2.259%, VAR ICE LIBOR USD 1 Month+2.150%, 10/25/2030 | 2,470 | 2,426 | ||||||
GMACM Mortgage Loan Trust, | ||||||||
6.000%, 12/25/2035 | 1,168 | 1,111 | ||||||
GS Mortgage Securities Trust, | ||||||||
2.506%, VAR ICE LIBOR USD 1 Month+2.400%, 07/15/2032 (A) | 1,000 | 998 | ||||||
GS Mortgage Securities Trust, Ser 2018-SRP5, Cl C | ||||||||
5.731%, 09/15/2031 | 1,970 | 562 | ||||||
GS Mortgage Securities Trust, Ser 2020-DUNE, Cl A | ||||||||
1.206%, VAR ICE LIBOR USD 1 Month+1.100%, 12/15/2036 (A) | 1,830 | 1,829 | ||||||
HarborView Mortgage Loan Trust, | ||||||||
0.350%, VAR ICE LIBOR USD 1 Month+0.240%, 11/19/2036 | 2,095 | 1,932 | ||||||
Impac CMB Trust, Ser 2005-4, Cl 1M1 | ||||||||
0.754%, VAR ICE LIBOR USD 1 Month+0.430%, 05/25/2035 | 1,113 | 1,122 | ||||||
JPMCC Commercial Mortgage Securities Trust, Ser 2019-BOLT, Cl C | ||||||||
3.906%, VAR ICE LIBOR USD 1 Month+3.800%, 07/15/2034 (A) | 1,697 | 1,566 | ||||||
JPMCC Commercial Mortgage Securities Trust, Ser 2019-BOLT, Cl XCP, IO | ||||||||
2.052%, 07/15/2034 (A)(D) | 2,368 | 14 | ||||||
JPMorgan Chase Commercial Mortgage Securities Trust, Ser NNN, Cl FFL | ||||||||
2.606%, VAR ICE LIBOR USD 1 Month+2.500%, 01/16/2037 (A) | 1,584 | 1,573 | ||||||
JPMorgan Chase Commercial Mortgage Securities Trust, Ser WPT, Cl FFL | ||||||||
3.003%, VAR ICE LIBOR USD 1 Month+2.900%, 07/05/2033 (A) | 1,790 | 1,724 | ||||||
JPMorgan Chase Commercial Mortgage Securities, Ser 2019-BKWD, Cl E | ||||||||
2.706%, VAR ICE LIBOR USD 1 Month+2.600%, 09/15/2029 (A) | 1,730 | 1,713 | ||||||
| Description | Face Amount (Thousands) | Market Value ($ Thousands) | ||||||
MORTGAGE-BACKED SECURITIES (continued) |
| |||||||
Legacy Mortgage Asset Trust, | ||||||||
3.844%, 10/25/2066 (A) | $ | 660 | $ | 660 | ||||
Morgan Stanley Re-REMIC Trust, | ||||||||
1.549%, 06/26/2036 (A) | 299 | 275 | ||||||
Motel 6 Trust, Ser 2017-MTL6, Cl F | ||||||||
4.356%, VAR ICE LIBOR USD 1 Month+4.250%, 08/15/2034 (A) | 1,204 | 1,206 | ||||||
Natixis Commercial Mortgage Securities Trust, Ser 2019-TRUE, Cl A | ||||||||
3.511%, VAR ICE LIBOR USD 1 Month+2.011%, 04/18/2024 (A) | 870 | 858 | ||||||
Nomura Asset Acceptance Alternative Loan Trust, Ser 2003-A1, Cl M | ||||||||
6.572%, 05/25/2033 (D) | 793 | 538 | ||||||
Nomura Resecuritization Trust, Ser 2015-4R, Cl 5A1 | ||||||||
1.805%, VAR ICE LIBOR USD 1 Month+0.430%, 03/26/2036 (A) | 447 | 446 | ||||||
PMT Credit Risk Transfer Trust, | ||||||||
2.809%, VAR ICE LIBOR USD 1 Month+2.700%, 10/27/2022 (A) | 525 | 526 | ||||||
Radnor, Ser 2020-1, Cl M1C | ||||||||
1.859%, VAR ICE LIBOR USD 1 Month+1.750%, 02/25/2030 (A) | 1,830 | 1,779 | ||||||
RALI Series Trust, Ser 2006-QO2, Cl A2 | ||||||||
0.649%, VAR ICE LIBOR USD 1 Month+0.540%, 02/25/2046 | 1,420 | 452 | ||||||
RALI Series Trust, Ser 2007-QO2, Cl A1 | ||||||||
0.259%, VAR ICE LIBOR USD 1 Month+0.150%, 02/25/2047 | 959 | 504 | ||||||
Seasoned Credit Risk Transfer Trust, | ||||||||
4.750%, 05/25/2057 (D) | 1,720 | 1,773 | ||||||
Seasoned Credit Risk Transfer Trust, | ||||||||
4.750%, 08/25/2057 (A)(D) | 1,125 | 1,172 | ||||||
Seasoned Credit Risk Transfer Trust, Ser 2019-4, Cl M | ||||||||
4.500%, 02/25/2059 (A)(D) | 1,720 | 1,784 | ||||||
Seasoned Credit Risk Transfer Trust, | ||||||||
4.250%, 08/25/2059 (A)(D) | 2,230 | 2,317 | ||||||
Seasoned Credit Risk Transfer Trust, | ||||||||
4.250%, 11/25/2059 (A)(D) | 830 | 844 | ||||||
Seasoned Credit Risk Transfer Trust, Ser 2020-3, Cl M | ||||||||
4.250%, 05/25/2060 (A)(D) | 640 | 656 | ||||||
Shops at Crystals Trust, Ser 2106-CSTL, Cl D | ||||||||
3.731%, 07/05/2036 (A)(D) | 885 | 846 | ||||||
| SEI Institutional Managed Trust / Semi-Annual Report / March 31, 2021 | 223 |
SCHEDULE OF INVESTMENTS (Unaudited)
March 31, 2021
Multi-Asset Income Fund (Continued)
| Description | Face Amount (Thousands) | Market Value ($ Thousands) | ||||||||||||||
MORTGAGE-BACKED SECURITIES (continued) |
| |||||||||||||||
Tharaldson Hotel Portfolio Trust, Ser THL, Cl F | ||||||||||||||||
4.226%, VAR ICE LIBOR USD 1 | $ | 583 | $ | 525 | ||||||||||||
Tharaldson Hotel Portfolio Trust, Ser THL, Cl E | ||||||||||||||||
3.453%, VAR ICE LIBOR USD 1 Month+3.330%, 11/11/2034 (A) | 1,742 | 1,686 | ||||||||||||||
WaMu Mortgage Pass-Through Certificates Trust, Ser 2006-AR16, Cl 2A2 | ||||||||||||||||
2.526%,12/25/2036 (D) | 810 | 772 | ||||||||||||||
Wells Fargo Mortgage-Backed Securities Trust, Ser 2006-AR5, Cl 2A1 | ||||||||||||||||
2.804%,04/25/2036 (D) | 659 | 626 | ||||||||||||||
|
| |||||||||||||||
| 50,782 | ||||||||||||||||
|
| |||||||||||||||
Total Mortgage-Backed Securities (Cost $64,629) ($ Thousands) | 65,738 | |||||||||||||||
|
| |||||||||||||||
ASSET-BACKED SECURITIES — 4.0% |
| |||||||||||||||
Automotive — 0.5% |
| |||||||||||||||
Avis Budget Rental Car Funding AESOP, Ser 2019-3A, Cl C | ||||||||||||||||
3.150%, 03/20/2026 (A) | 820 | 850 | ||||||||||||||
Hertz Vehicle Financing II, Ser 2015-3A, Cl C | ||||||||||||||||
4.440%, 09/25/2021 (A) | 350 | 345 | ||||||||||||||
Hertz Vehicle Financing II, Ser 2016-2A, Cl C | ||||||||||||||||
4.990%, 03/25/2022 (A) | 3,000 | 2,951 | ||||||||||||||
Hertz Vehicle Financing II, Ser 2018-1A, Cl D | ||||||||||||||||
5.860%, 02/25/2024 (A) | 530 | 523 | ||||||||||||||
|
| |||||||||||||||
| 4,669 | ||||||||||||||||
|
| |||||||||||||||
Industrials – 0.1% |
| |||||||||||||||
United Airlines Pass-Through Trust, | ||||||||||||||||
Ser 2015-1, Cl A | ||||||||||||||||
3.700%, 12/01/2022 | 240 | 243 | ||||||||||||||
|
| |||||||||||||||
Mortgage Related Securities – 0.3% |
| |||||||||||||||
ACE Securities Home Equity Loan Trust, | ||||||||||||||||
Ser 2004 – HE3, Cl M1 | ||||||||||||||||
1.039%, VAR ICE LIBOR USD 1 | ||||||||||||||||
Month+0.930%, 11/25/2034 | 540 | 540 | ||||||||||||||
Asset Backed Securities Home Equity Loan | ||||||||||||||||
Trust, Ser 2007 – HE1, Cl A4 | ||||||||||||||||
0.249%, VAR ICE LIBOR USD 1 | ||||||||||||||||
Month+0.140%, 12/25/2036 | 1,515 | 1,478 | ||||||||||||||
| Description | Face Amount (Thousands) | Market Value ($ Thousands) | ||||||||||||||
ASSET-BACKED SECURITIES (continued) |
| |||||||||||||||
Option One Mortgage Loan Trust, Ser 2005-3, Cl M4 | ||||||||||||||||
1.039%, VAR ICE LIBOR USD 1 | ||||||||||||||||
Month+0.930%, 08/25/2035 | $ | 970 | $ | 894 | ||||||||||||
|
| |||||||||||||||
| 2,912 | ||||||||||||||||
|
| |||||||||||||||
Other Asset-Backed Securities – 3.1% |
| |||||||||||||||
522 Funding CLO, Ser 2019-5A, Cl E | ||||||||||||||||
7.581%, VAR ICE LIBOR USD 3 | ||||||||||||||||
Month+7.340%, 01/15/2033 (A) | 250 | 249 | ||||||||||||||
Apidos CLO XXII, Ser 2020-22A, Cl DR | ||||||||||||||||
6.974%, VAR ICE LIBOR USD 3 | ||||||||||||||||
Month+6.750%, 04/20/2031 (A) | 680 | 670 | ||||||||||||||
Avery Point VI CLO, Ser 2018-6A, Cl DR | ||||||||||||||||
3.145%, VAR ICE LIBOR USD 3 | ||||||||||||||||
Month+2.950%, 08/05/2027 (A) | 610 | 602 | ||||||||||||||
Bain Capital Credit CLO, Ser 2021-1A, Cl D | ||||||||||||||||
5.095%, VAR ICE LIBOR USD 3 | ||||||||||||||||
Month+2.910%, 04/18/2034 (A) | 450 | 446 | ||||||||||||||
Benefit Street Partners CLO IV, Ser 2021-IVA, Cl CRRR | ||||||||||||||||
3.824%, VAR ICE LIBOR USD 3 | ||||||||||||||||
Month+3.600%, 01/20/2032 (A) | 340 | 336 | ||||||||||||||
BlueMountain CLO, Ser 2018-1A, Cl CR | ||||||||||||||||
2.074%, VAR ICE LIBOR USD 3 | ||||||||||||||||
Month+1.850%, 04/20/2027 (A) | 700 | 696 | ||||||||||||||
BlueMountain CLO, Ser 2018-2A, Cl AR2 | ||||||||||||||||
1.232%, VAR ICE LIBOR USD 3 | ||||||||||||||||
Month+1.050%, 11/20/2028 (A) | 330 | 330 | ||||||||||||||
BlueMountain CLO, Ser 2018-2A, Cl ER | ||||||||||||||||
5.423%, VAR ICE LIBOR USD 3 | ||||||||||||||||
Month+5.200%, 07/18/2027 (A) | 1,000 | 935 | ||||||||||||||
Bristol Park CLO, Ser 2020-1A, Cl ER | ||||||||||||||||
7.241%, VAR ICE LIBOR USD 3 | ||||||||||||||||
Month+7.000%, 04/15/2029 (A) | 500 | 498 | ||||||||||||||
Canyon Capital CLO, Ser 2021-1A, Cl E | ||||||||||||||||
6.596%, VAR ICE LIBOR USD 3 | ||||||||||||||||
Month+6.410%, 04/15/2034 (A) | 280 | 279 | ||||||||||||||
Carlyle Global Market Strategies CLO, Ser 2018-2RA, Cl A1 | ||||||||||||||||
1.244%, VAR ICE LIBOR USD 3 | ||||||||||||||||
Month+1.050%, 05/15/2031 (A) | 1,045 | 1,046 | ||||||||||||||
Carlyle US CLO, Ser 2017-1A, Cl A1B | ||||||||||||||||
1.454%, VAR ICE LIBOR USD 3 | ||||||||||||||||
Month+1.230%, 04/20/2031 (A) | 646 | 647 | ||||||||||||||
Cathedral Lake VII, Ser 2021-7RA, Cl D | ||||||||||||||||
4.472%, VAR ICE LIBOR USD 3 | ||||||||||||||||
Month+4.280%, 01/15/2032 (A) | 700 | 693 | ||||||||||||||
Catskill Park CLO, Ser 2017-1A, Cl D | ||||||||||||||||
6.224%, VAR ICE LIBOR USD 3 | ||||||||||||||||
Month+6.000%, 04/20/2029 (A) | 900 | 898 | ||||||||||||||
Copper River CLO, Ser 2006-1A | ||||||||||||||||
0.000%, 01/20/2021 *(A)(J)(K) | 3,000 | 4 | ||||||||||||||
| 224 | SEI Institutional Managed Trust / Semi-Annual Report / March 31, 2021 |
| Description | Face Amount (Thousands) | Market Value ($ Thousands) | ||||||
ASSET-BACKED SECURITIES (continued) |
| |||||||
Countrywide Asset-Backed Certificates, Ser 2006-12, Cl 1A | ||||||||
0.369%, VAR ICE LIBOR USD 1 | ||||||||
Month+0.260%, 12/25/2036 | $ | 1,290 | $ | 1,243 | ||||
Credit Suisse European Mortgage Capital, Ser 2019-1OTF, Cl A | ||||||||
3.114%, VAR ICE LIBOR USD 3 | ||||||||
Month+2.900%, 08/09/2024 (A) | 975 | 963 | ||||||
Cumberland Park CLO, Ser 2018-2A, Cl DR | ||||||||
2.924%, VAR ICE LIBOR USD 3 | ||||||||
Month+2.700%, 07/20/2028 (A) | 500 | 499 | ||||||
Cumberland Park CLO, Ser 2018-2A, Cl ER | ||||||||
5.874%, VAR ICE LIBOR USD 3 | ||||||||
Month+5.650%, 07/20/2028 (A) | 600 | 595 | ||||||
Dividend Solar Loans, Ser 2019-1, Cl A | ||||||||
3.670%, 08/22/2039 (A) | 504 | 532 | ||||||
Dryden LXXV CLO, Ser 2021-75A, Cl ER | ||||||||
2 0.000% 04/15/2034 (A)(K) | 770 | 768 | ||||||
Dryden XLIII Senior Loan Fund, Ser 2021-43A, Cl ER | ||||||||
3 0.000% 04/20/2034 (A)(K) | 330 | 323 | ||||||
Educational Funding, Ser 2006-1A, Cl A3 | ||||||||
0.565%, VAR ICE LIBOR USD 3 | ||||||||
Month+0.350%, 04/25/2033 (A) | 492 | 407 | ||||||
First Franklin Mortgage Loan Trust, Ser 2006-FF15, Cl A5 | ||||||||
0.269%, VAR ICE LIBOR USD 1 | ||||||||
Month+0.160%, 11/25/2036 | 1,258 | 1,234 | ||||||
Halsey Point CLO I, Ser 2019-1A, Cl F | ||||||||
8.424%, VAR ICE LIBOR USD 3 | ||||||||
Month+8.200%, 01/20/2033 (A) | 290 | 261 | ||||||
Hildene Community Funding CDO, Ser 2020-1A, Cl AR | ||||||||
3.250%, 11/01/2035 (A) | 250 | 247 | ||||||
Jackson Mill CLO, Ser 2018-1A, Cl DR | ||||||||
3.041%, VAR ICE LIBOR USD 3 | ||||||||
Month+2.800%, 04/15/2027 (A) | 1,250 | 1,248 | ||||||
Jamestown CLO X, Ser 2017-10A, Cl A1 | ||||||||
1.473%, VAR ICE LIBOR USD 3 | ||||||||
Month+1.250%, 07/17/2029 (A) | 750 | 749 | ||||||
LCM XXII, Ser 2018-22A, Cl DR | ||||||||
5.724%, VAR ICE LIBOR USD 3 | ||||||||
Month+5.500%, 10/20/2028 (A) | 350 | 332 | ||||||
Legacy Mortgage Asset Trust, Ser 2019-GS1, Cl A1 | ||||||||
4.000%, 01/25/2059 (A) | 475 | 482 | ||||||
Marathon, Ser 2005-2A | ||||||||
0.000%, 12/20/2019 (A)(G)(J)(K) | 750 | – | ||||||
Marathon, Ser 2019-2A, Cl BA | ||||||||
3.524%, VAR ICE LIBOR USD 3 | ||||||||
Month+3.300%, 01/20/2033 (A) | 330 | 331 | ||||||
| Description | Face Amount (Thousands) | Market Value ($ Thousands) | ||||||
ASSET-BACKED SECURITIES (continued) |
| |||||||
Oaktree CLO, Ser 2019-1A, Cl D | ||||||||
4.022%, VAR ICE LIBOR USD 3 | ||||||||
Month+3.800%, 04/22/2030 (A) | $ | 250 | $ | 245 | ||||
Ocean Trails CLO IX, Ser 2020-9A, Cl A1 | ||||||||
2.153%, VAR ICE LIBOR USD 3 | ||||||||
Month+1.870%, 10/15/2029 (A) | 270 | 271 | ||||||
Ocean Trails CLO IX, Ser 2020-9A, Cl A2 | ||||||||
2.553%, VAR ICE LIBOR USD 3 | ||||||||
Month+2.270%, 10/15/2029 (A) | 310 | 311 | ||||||
Ocean Trails CLO VI, Ser 2021-6A, Cl DRR | ||||||||
3.687%, VAR ICE LIBOR USD 3 | ||||||||
Month+3.600%, 07/15/2028 (A) | 340 | 340 | ||||||
OHA Loan Funding, Ser 2019-1A, Cl DR2 | ||||||||
4.194%, VAR ICE LIBOR USD 3 | ||||||||
Month+4.000%, 11/15/2032 (A) | 250 | 252 | ||||||
OZLM VII, Ser 2018-7RA, Cl CR | ||||||||
3.223%, VAR ICE LIBOR USD 3 | ||||||||
Month+3.000%, 07/17/2029 (A) | 650 | 629 | ||||||
OZLM XI, Ser 2017-11A, Cl BR | ||||||||
2.505%, VAR ICE LIBOR USD 3 | ||||||||
Month+2.300%, 10/30/2030 (A) | 600 | 600 | ||||||
Parallel, Ser 2020-1A, Cl CR | ||||||||
2.224%, VAR ICE LIBOR USD 3 | ||||||||
Month+2.000%, 07/20/2029 (A) | 750 | 740 | ||||||
Popular ABS Mortgage Pass-Through Trust, Ser 2005-6, Cl A4 | ||||||||
3.480%, 01/25/2036 | 333 | 334 | ||||||
SMB Private Education Loan Trust, Ser 2021-A, Cl D1 | ||||||||
3.860%, 01/15/2053 (A) | 690 | 678 | ||||||
Sound Point CLO XXIII, Ser 2019-2A, Cl A1 | ||||||||
1.641%, VAR ICE LIBOR USD 3 | ||||||||
Month+1.400%, 04/15/2032 (A) | 710 | 710 | ||||||
Structured Asset Securities Mortgage Loan Trust, Ser 2006-GEL4, Cl M1 | ||||||||
0.679%, VAR ICE LIBOR USD 1 | ||||||||
Month+0.570%, 10/25/2036 (A) | 1,955 | 1,923 | ||||||
SUNNOVA HELIOS II, Ser 2019-AA, Cl C | ||||||||
5.320%, 06/20/2046 (A) | 548 | 574 | ||||||
Sunrun Atlas Issuer, Ser 2019-2, ClA | ||||||||
3.610%, 02/01/2055 (A) | 416 | 439 | ||||||
Symphony CLO XIX, Ser 2018-19A, Cl E | ||||||||
5.423%, VAR ICE LIBOR USD3 | ||||||||
Month+5.200%, 04/16/2031 (A) | 250 | 233 | ||||||
Venture XXXI CLO, Ser 2018-31A, Cl A1 | ||||||||
1.254%, VAR ICE LIBOR USD 3 | ||||||||
Month+1.030%, 04/20/2031 (A) | 680 | 681 | ||||||
Voya CLO, Ser 2018-3A, Cl A1A | ||||||||
1.391%, VAR ICE LIBOR USD 3 | ||||||||
Month+1.150%, 10/15/2031 (A) | 750 | 750 | ||||||
Voya CLO, Ser 2021-3A, Cl DR | ||||||||
7.050%, VAR ICE LIBOR USD 3 | ||||||||
Month+6.950%, 04/20/2034 (A) | 260 | 259 | ||||||
| SEI Institutional Managed Trust / Semi-Annual Report / March 31, 2021 | 225 |
SCHEDULE OF INVESTMENTS (Unaudited)
March 31, 2021
Multi-Asset Income Fund (Continued)
| Description | Face Amount (Thousands) | Market Value ($ Thousands) | ||||||
ASSET-BACKED SECURITIES (continued) |
| |||||||
Wachovia Asset Securitization Issuance II, |
| |||||||
Ser 2007-HE1, Cl A | ||||||||
0.249%, VAR ICE LIBOR USD 1 |
| |||||||
Month+0.140%, 07/25/2037 (A) | $ | 313 | $ | 293 | ||||
Whitehorse XII, Ser 2018-12A, Cl D | ||||||||
3.891%, VAR ICE LIBOR USD 3 |
| |||||||
Month+3.650%, 10/15/2031 (A) | 250 | 240 | ||||||
Zais CLO XIV, Ser 2020-16A, Cl D1 | ||||||||
5.770%, VAR ICE LIBOR USD 3 |
| |||||||
Month+5.480%, 10/20/2031 (A) | 250 | 247 | ||||||
|
| |||||||
| 29,292 | ||||||||
|
| |||||||
Total Asset-Backed Securities (Cost $41,225) ($ Thousands) | 37,116 | |||||||
|
| |||||||
CONVERTIBLE BONDS — 0.8% |
| |||||||
Alarm.com CV to 6.7939 | ||||||||
0.309%, 01/15/2026 (A)(J) | 187 | 173 | ||||||
Apollo Commercial Real Estate Finance CV to 50.226 | ||||||||
4.750%, 08/23/2022 | 2,190 | 2,193 | ||||||
Cheniere Energy CV to 7.2265 | ||||||||
4.250%, 03/15/2045 | 1,500 | 1,226 | ||||||
DISH Network CV to 15.343 | ||||||||
3.375%, 08/15/2026 | 610 | 586 | ||||||
DraftKings CV to 10.543 | ||||||||
0.000%, 03/15/2028 (A)(J) | 340 | 336 | ||||||
Gannett CV to 200.000 | ||||||||
6.000%, 12/01/2027 (G) | 240 | 316 | ||||||
GEO Corrections Holdings CV to 108.4011 | ||||||||
6.500%, 02/23/2026 (A) | 100 | 104 | ||||||
Innovate Capital Pte CV to 209.9661 | ||||||||
6.000%, 12/11/2024 | 71 | 18 | ||||||
JetBlue Airways CV to 38.5802 | ||||||||
0.500%, 04/01/2026 (A) | 310 | 341 | ||||||
Liberty Latin America CV to 48.4315 | ||||||||
2.000%, 07/15/2024 | 350 | 345 | ||||||
Liberty Media CV to 22.947 | ||||||||
4.000%, 11/15/2029 | 320 | 245 | ||||||
Live Nation Entertainment CV to 9.4469 | ||||||||
2.000%, 02/15/2025 | 1,250 | 1,384 | ||||||
Twitter CV to 7.6905 | ||||||||
0.000%, 03/15/2026 (A) | 210 | 199 | ||||||
|
| |||||||
Total Convertible Bonds (Cost $6,976) ($ Thousands) | 7,466 | |||||||
|
| |||||||
| Shares | ||||||||
PREFERRED STOCK — 0.5% | ||||||||
Energy — 0.4% | ||||||||
MPLX, 8.462% *(E)(G) | 70,655 | 2,367 | ||||||
| Description | Face Amount (Thousands) | Market Value ($ Thousands) | ||||||
PREFERRED STOCK (continued) | ||||||||
Targa Resources, 9.500% *(E) | 1,570 | $ | 1,646 | |||||
|
| |||||||
| 4,013 | ||||||||
|
| |||||||
Financials — 0.1% | ||||||||
B Riley Financial, 5.500% | 13,003 | 330 | ||||||
|
| |||||||
Total Preferred Stock | ||||||||
(Cost $4,270) ($ Thousands) | 4,343 | |||||||
|
| |||||||
| Face Amount (Thousands) | ||||||||
MUNICIPAL BOND — 0.0% | ||||||||
Illinois — 0.0% | ||||||||
Illinois State, GO | ||||||||
7.350%, 07/01/2035 | $ | 225 | 279 | |||||
|
| |||||||
Total Municipal Bond | ||||||||
(Cost $250) ($ Thousands) | 279 | |||||||
|
| |||||||
| Number of Warrants | ||||||||
WARRANTS — 0.0% | ||||||||
Noble Corp, Expires 02/05/2028 | ||||||||
Strike Price $0.01 * | 5,574 | 30 | ||||||
|
| |||||||
Total Warrants | ||||||||
(Cost $13) ($ Thousands) | 30 | |||||||
|
| |||||||
Total Investments in Securities — 94.6% |
| |||||||
(Cost $818,704) ($ Thousands) | $ | 880,351 | ||||||
|
| |||||||
| Contracts | ||||||||
PURCHASED OPTIONS* — 0.0% |
| |||||||
Total Purchased Options (L) | ||||||||
(Cost $635) ($ Thousands) | 12,363,482 | $ | 302 | |||||
|
| |||||||
WRITTEN OPTIONS* — (0.2)% |
| |||||||
Total Written Options (L) | ||||||||
(Premiums Received $2,910) ($ Thousands) | (16,717,213 | ) | $ | (2,218) | ||||
|
| |||||||
| 226 | SEI Institutional Managed Trust / Semi-Annual Report / March 31, 2021 |
A list of the open exchange traded options contracts held by the Fund at March 31, 2021 is as follows:
| Description | Number of Contracts | Notional Amount (Thousands) † | Exercise Price | Expiration Date | Value (Thousands) | |||||||||||||||
PURCHASED OPTIONS — 0.0% | ||||||||||||||||||||
Put Options | ||||||||||||||||||||
May 2021, S&P 500 E-mini 3rd Week Option* | 42 | $ | 191 | $ | 3,500.00 | 5/22/2021 | $ | 35 | ||||||||||||
April 2021, S&P 500 E-mini 3rd Week Option* | 22 | 62 | 3,600.00 | 4/17/2021 | 4 | |||||||||||||||
April 2021, S&P 500 E-mini 3rd Week Option* | 13 | 32 | 3,500.00 | 4/17/2021 | 2 | |||||||||||||||
June 2021, S&P 500 E-mini Option* | 53 | 128 | 3,600.00 | 6/19/2021 | 112 | |||||||||||||||
June 2021, S&P 500 E-mini Option* | 22 | 59 | 3,700.00 | 6/19/2021 | 61 | |||||||||||||||
USD Put/CAD Call* | 3,013,330 | 36 | 1.26 | 5/22/2021 | 33 | |||||||||||||||
USD Put/EUR Call* | 4,500,000 | 43 | 1.20 | 4/17/2021 | – | |||||||||||||||
USD Put/MXN Call* | 1,690,000 | 36 | 20.60 | 5/22/2021 | 40 | |||||||||||||||
USD Put/MXN Call* | 2,260,000 | 35 | 19.91 | 4/17/2021 | 12 | |||||||||||||||
USD Put/RUB Call* | 900,000 | 13 | 72.46 | 5/22/2021 | 3 | |||||||||||||||
|
|
|
| |||||||||||||||||
Total Purchased Options | $ | 635 | $ | 302 | ||||||||||||||||
|
|
|
| |||||||||||||||||
WRITTEN OPTIONS — (0.2)% | ||||||||||||||||||||
Put Options | ||||||||||||||||||||
April 2021, S&P 500 E-mini 3rd Week Option* | (22 | ) | $ | (29 | ) | 3,300.00 | 04/17/21 | $ | (1 | ) | ||||||||||
May 2021, S&P 500 E-mini 3rd Week Option* | (30 | ) | (89 | ) | 3,300.00 | 05/22/21 | (14 | ) | ||||||||||||
June 2021, S&P 500 E-mini Option* | (22 | ) | (27 | ) | 3,400.00 | 06/19/21 | (27 | ) | ||||||||||||
June 2021, S&P 500 E-mini Option* | (53 | ) | (64 | ) | 3,300.00 | 06/19/21 | (51 | ) | ||||||||||||
USD Put/CAD Call* | (3,013,330 | ) | (13 | ) | 1.23 | 05/22/21 | (7 | ) | ||||||||||||
USD Put/EUR Call* | (4,500,000 | ) | (12 | ) | 1.23 | 04/17/21 | – | |||||||||||||
USD Put/JPY Call* | (1,373,396 | ) | (4 | ) | 108.35 | 04/17/21 | – | |||||||||||||
USD Put/MXN Call* | (3,380,000 | ) | (33 | ) | 20.00 | 05/22/21 | (35 | ) | ||||||||||||
|
|
|
| |||||||||||||||||
| (271 | ) | (135 | ) | |||||||||||||||||
|
|
|
| |||||||||||||||||
Call Options | ||||||||||||||||||||
SPX US Index Option* | (180 | ) | (1,310 | ) | 3,960.00 | 04/17/21 | (966 | ) | ||||||||||||
SPX US Index Option* | (180 | ) | (1,296 | ) | 3,950.00 | 04/17/21 | (1,084 | ) | ||||||||||||
USD Call/CNY Put* | (2,990,000 | ) | (18 | ) | 6.58 | 04/17/21 | (15 | ) | ||||||||||||
USD Call/RUB Put* | (1,460,000 | ) | (15 | ) | 78.26 | 05/22/21 | (18 | ) | ||||||||||||
|
|
|
| |||||||||||||||||
| (2,639 | ) | (2,083 | ) | |||||||||||||||||
|
|
|
| |||||||||||||||||
Total Written Options | $ | (2,910 | ) | $ | (2,218 | ) | ||||||||||||||
|
|
|
| |||||||||||||||||
† Represents Cost
A list of the open futures contracts held by the Fund at March 31, 2021 is as follows:
| Type of Contract | Number of Contracts Long (Short) | Expiration Date | Notional Amount (Thousands) | Value (Thousands) | Unrealized Appreciation (Depreciation) (Thousands) | |||||||||||||||
90-Day Euro$ | 237 | Dec-2023 | $ | 58,651 | $ | 58,536 | $ | (115 | ) | |||||||||||
90-Day Euro$ | (32 | ) | Dec-2021 | (7,981 | ) | (7,979 | ) | 2 | ||||||||||||
Australian 10-Year Bond | 21 | Jun-2021 | 2,251 | 2,209 | (14 | ) | ||||||||||||||
Euro-Bob | 5 | Jun-2021 | 814 | 794 | 1 | |||||||||||||||
Euro-Bund | (39 | ) | Jun-2021 | (8,079 | ) | (7,851 | ) | (25 | ) | |||||||||||
S&P 500 Index E-MINI | 182 | Jun-2021 | 35,674 | 36,103 | 429 | |||||||||||||||
U.S. 2-Year Treasury Note | 553 | Jul-2021 | 122,165 | 122,062 | (103 | ) | ||||||||||||||
U.S. 5-Year Treasury Note | (245 | ) | Jul-2021 | (30,518 | ) | (30,233 | ) | 285 | ||||||||||||
U.S. 10-Year Treasury Note | 520 | Jun-2021 | 69,302 | 68,088 | (1,214 | ) | ||||||||||||||
| SEI Institutional Managed Trust / Semi-Annual Report / March 31, 2021 | 227 |
SCHEDULE OF INVESTMENTS (Unaudited)
March 31, 2021
Multi-Asset Income Fund (Continued)
| Type of Contract | Number of Contracts Long (Short) | Expiration Date | Notional Amount (Thousands) | Value (Thousands) | Unrealized Appreciation (Depreciation) (Thousands) | |||||||||||||||
U.S. Long Treasury Bond | 234 | Jun-2021 | $ | 37,576 | $ | 36,175 | $ | (1,401 | ) | |||||||||||
U.S. Ultra Long Treasury Bond | 185 | Jun-2021 | 35,252 | 33,526 | (1,726 | ) | ||||||||||||||
Ultra 10-Year U.S. Treasury Note | (83 | ) | Jun-2021 | (12,348 | ) | (11,926 | ) | 422 | ||||||||||||
|
|
|
|
|
| |||||||||||||||
| $ | 302,759 | $ | 299,504 | $ | (3,459 | ) | ||||||||||||||
|
|
|
|
|
| |||||||||||||||
A list of the open forward foreign currency contracts held by the Fund at March 31, 2021 is as follows:
| Counterparty | Settlement Date | Currency to Deliver (Thousands) | Currency to Receive (Thousands) | Unrealized Appreciation (Depreciation) (Thousands) | ||||||||||||||||||||
DEFAULT | 04/09/21 | EUR | 700 | USD | 841 | $ | 18 | |||||||||||||||||
ANZ | 06/16/21 | SEK | 23,643 | USD | 2,784 | 69 | ||||||||||||||||||
BNP Paribas | 04/19/21 | EUR | 730 | USD | 892 | 33 | ||||||||||||||||||
BNP Paribas | 04/19/21 | USD | 875 | NOK | 7,500 | 4 | ||||||||||||||||||
BNP Paribas | 04/19/21 | USD | 1,021 | RUB | 75,750 | (21 | ) | |||||||||||||||||
Citigroup | 04/06/21 -04/09/21 | EUR | 2,300 | USD | 2,764 | 61 | ||||||||||||||||||
Citigroup | 04/19/21 | AUD | 138 | USD | 108 | 3 | ||||||||||||||||||
Citigroup | 04/19/21 | USD | 699 | EUR | 580 | (17 | ) | |||||||||||||||||
Citigroup | 04/19/21 | GBP | 1,350 | USD | 1,886 | 23 | ||||||||||||||||||
Citigroup | 04/19/21 | GBP | 529 | USD | 718 | (12 | ) | |||||||||||||||||
Citigroup | 04/19/21 | USD | 1,901 | RUB | 143,230 | (9 | ) | |||||||||||||||||
Citigroup | 04/19/21 | USD | 2,091 | JPY | 217,040 | (126 | ) | |||||||||||||||||
Citigroup | 04/19/21 | USD | 2,095 | AUD | 2,687 | (49 | ) | |||||||||||||||||
Citigroup | 04/19/21 | USD | 915 | BRL | 5,370 | 35 | ||||||||||||||||||
Citigroup | 04/19/21 | USD | 1,917 | BRL | 10,724 | (19 | ) | |||||||||||||||||
Citigroup | 04/19/21 | USD | 3,098 | MXN | 62,721 | (38 | ) | |||||||||||||||||
Citigroup | 04/19/21 | MXN | 5,800 | USD | 279 | (4 | ) | |||||||||||||||||
Citigroup | 04/19/21 -05/10/21 | USD | 7,295 | CAD | 9,235 | 55 | ||||||||||||||||||
Citigroup | 04/19/21 | CAD | 1,770 | USD | 1,423 | 15 | ||||||||||||||||||
Citigroup | 04/19/21 -05/10/21 | CAD | 5,539 | USD | 4,372 | (36 | ) | |||||||||||||||||
Citigroup | 04/19/21 | RUB | 15,570 | USD | 211 | 5 | ||||||||||||||||||
Citigroup | 04/19/21 | BRL | 18,659 | USD | 3,527 | 224 | ||||||||||||||||||
Citigroup | 04/19/21 | JPY | 71,120 | USD | 689 | 45 | ||||||||||||||||||
Citigroup | 06/16/21 | NOK | 21,541 | USD | 2,541 | 17 | ||||||||||||||||||
Goldman Sachs | 04/19/21 | USD | 857 | EUR | 730 | 1 | ||||||||||||||||||
Goldman Sachs | 04/06/21 | USD | 983 | EUR | 810 | (30 | ) | |||||||||||||||||
Goldman Sachs | 04/19/21 | AUD | 32 | USD | 25 | 1 | ||||||||||||||||||
Goldman Sachs | 04/19/21 | USD | 205 | MXN | 4,230 | 1 | ||||||||||||||||||
Goldman Sachs | 04/19/21 | USD | 787 | CAD | 990 | 1 | ||||||||||||||||||
Goldman Sachs | 04/19/21 | GBP | 870 | USD | 1,193 | (7 | ) | |||||||||||||||||
Goldman Sachs | 04/19/21 | USD | 888 | BRL | 5,160 | 26 | ||||||||||||||||||
Goldman Sachs | 04/19/21 | EUR | 4,865 | USD | 5,962 | 241 | ||||||||||||||||||
Goldman Sachs | 04/19/21 | USD | 1,404 | RUB | 107,050 | 10 | ||||||||||||||||||
Goldman Sachs | 04/19/21 | USD | 3,990 | RUB | 298,562 | (46 | ) | |||||||||||||||||
Goldman Sachs | 04/19/21 | BRL | 2,940 | USD | 521 | — | ||||||||||||||||||
Goldman Sachs | 04/19/21 | BRL | 3,750 | USD | 649 | (15 | ) | |||||||||||||||||
Goldman Sachs | 05/03/21 | MXN | 18,496 | USD | 904 | 3 | ||||||||||||||||||
Goldman Sachs | 04/19/21 | MXN | 7,500 | USD | 359 | (6 | ) | |||||||||||||||||
Goldman Sachs | 04/19/21 - 05/12/21 | RUB | 560,658 | USD | 7,564 | 159 | ||||||||||||||||||
Goldman Sachs | 04/19/21 | RUB | 81,590 | USD | 1,073 | (5 | ) | |||||||||||||||||
HSBC | 04/09/21 | USD | 271 | EUR | 230 | (1 | ) | |||||||||||||||||
| 228 | SEI Institutional Managed Trust / Semi-Annual Report / March 31, 2021 |
| Counterparty | Settlement Date | Currency to Deliver (Thousands) | Currency to Receive (Thousands) | Unrealized Appreciation (Depreciation) (Thousands) | ||||||||||||||||||||
HSBC | 04/09/21 | EUR | 16,898 | USD | 20,531 | $ | 667 | |||||||||||||||||
JPMorgan Chase Bank | 04/09/21 | EUR | 3,803 | USD | 4,615 | 145 | ||||||||||||||||||
JPMorgan Chase Bank | 04/15/21 | SAR | 14,390 | USD | 3,834 | (3) | ||||||||||||||||||
JPMorgan Chase Bank | 04/19/21 | USD | 242 | NOK | 2,070 | 1 | ||||||||||||||||||
JPMorgan Chase Bank | 04/19/21 | USD | 485 | AUD | 630 | (6) | ||||||||||||||||||
JPMorgan Chase Bank | 04/19/21 | USD | 434 | CAD | 550 | 3 | ||||||||||||||||||
JPMorgan Chase Bank | 04/19/21 | USD | 578 | CAD | 722 | (4) | ||||||||||||||||||
JPMorgan Chase Bank | 04/19/21 | CAD | 1,080 | USD | 864 | 5 | ||||||||||||||||||
JPMorgan Chase Bank | 04/19/21 | CAD | 660 | USD | 519 | (6) | ||||||||||||||||||
JPMorgan Chase Bank | 04/19/21 | BRL | 2,580 | USD | 446 | (11) | ||||||||||||||||||
JPMorgan Chase Bank | 04/19/21 - 06/16/21 | USD | 6,700 | JPY | 719,537 | (185) | ||||||||||||||||||
JPMorgan Chase Bank | 04/19/21 - 05/18/21 | RUB | 44,893 | USD | 605 | 13 | ||||||||||||||||||
JPMorgan Chase Bank | 04/19/21 | JPY | 89,500 | USD | 852 | 42 | ||||||||||||||||||
JPMorgan Chase Bank | 04/19/21 | IDR | 113,153,060 | USD | 8,071 | 303 | ||||||||||||||||||
JPMorgan Chase Bank | 06/16/21 | NZD | 3,067 | USD | 2,198 | 51 | ||||||||||||||||||
JPMorgan Chase Bank | 06/16/21 | CAD | 3,472 | USD | 2,745 | (18) | ||||||||||||||||||
Morgan Stanley | 04/09/21 | USD | 1,018 | EUR | 843 | (27) | ||||||||||||||||||
Morgan Stanley | 04/19/21 | USD | 371 | AUD | 480 | (5) | ||||||||||||||||||
Morgan Stanley | 04/19/21 | USD | 373 | NZD | 520 | (9) | ||||||||||||||||||
Morgan Stanley | 04/19/21 | NZD | 520 | USD | 373 | 9 | ||||||||||||||||||
Morgan Stanley | 04/19/21 | USD | 4,248 | RUB | 324,170 | 34 | ||||||||||||||||||
Morgan Stanley | 04/19/21 | USD | 3,480 | NOK | 29,940 | 28 | ||||||||||||||||||
Morgan Stanley | 04/19/21 | USD | 1,103 | NOK | 9,370 | (5) | ||||||||||||||||||
Morgan Stanley | 04/19/21 | NOK | 21,330 | USD | 2,524 | 25 | ||||||||||||||||||
Morgan Stanley | 04/19/21 | JPY | 70,820 | USD | 672 | 31 | ||||||||||||||||||
Morgan Stanley | 05/24/21 | USD | 132 | MXN | 2,769 | 2 | ||||||||||||||||||
Standard Bank | 05/20/21 | GBP | 2,192 | USD | 3,050 | 26 | ||||||||||||||||||
State Street | 06/16/21 | USD | 5,086 | EUR | 4,268 | (62) | ||||||||||||||||||
UBS | 06/16/21 | AUD | 2,893 | USD | 2,228 | 24 | ||||||||||||||||||
|
| |||||||||||||||||||||||
| $ | 1,677 | |||||||||||||||||||||||
|
| |||||||||||||||||||||||
A list of the open centrally cleared swap agreements held by the Fund at March 31, 2021 is as follows:
| Credit Default Swaps | ||||||||||||||||||||||||||
| Reference Entity/Obligation | Buy/Sell Protection | (Pays)/ Receives Rate | Payment Frequency | Termination Date | Notional Amount (Thousands) | Value (Thousands) | Upfront Payments/ Receipts (Thousands) | Net Unrealized Appreciation (Depreciation) (Thousands) | ||||||||||||||||||
Transocean | Buy | 1.00% | Quarterly | 12/20/2022 | 235 | $ | 51 | $ | 33 | $ | 18 | |||||||||||||||
CDX.NA HY.36 | Buy | 5.00% | Quarterly | 06/20/2026 | 3,853 | (344) | (327) | (17) | ||||||||||||||||||
Republic of Turkey | Sell | 1.00% | Quarterly | 06/20/2026 | (1,400) | (232) | (225) | (7) | ||||||||||||||||||
CDS-DAIGR | Buy | 1.00% | Quarterly | 12/20/2024 | 1,290 | (31) | (21) | (10) | ||||||||||||||||||
CDS-DAIGR | Sell | 1.00% | Quarterly | 12/20/2024 | (1,290) | 28 | 11 | 17 | ||||||||||||||||||
CDX.NA.HY.30 | Sell | 5.00% | Quarterly | 06/20/2023 | (15,916) | 1,087 | 540 | 547 | ||||||||||||||||||
CDX.NA.HY.34 | Sell | 5.00% | Quarterly | 06/25/2025 | (6,092) | 551 | (199) | 750 | ||||||||||||||||||
CDX.NA.IG.34 | Sell | 1.00% | Quarterly | 06/20/2023 | (7,300) | 111 | 81 | 30 | ||||||||||||||||||
CDX.NA.IG.34-V1 | Sell | 1.00% | Quarterly | 06/20/2025 | (26,200) | 472 | 333 | 139 | ||||||||||||||||||
ICE CD Boeing Company | Sell | 1.00% | Quarterly | 06/20/2024 | (525) | 4 | 8 | (4) | ||||||||||||||||||
ICE CD CDXIG | Sell | 1.00% | Quarterly | 12/20/2024 | (2,375) | 43 | 46 | (3) | ||||||||||||||||||
ICE CD Chile | Sell | 1.00% | Quarterly | 06/20/2024 | (410) | 9 | 8 | 1 | ||||||||||||||||||
ICE CD Columbia | Sell | 1.00% | Quarterly | 12/20/2023 | (4,600) | 30 | (27) | 57 | ||||||||||||||||||
ICE CD Columbia | Sell | 1.00% | Quarterly | 06/20/2024 | (2,410) | 12 | 8 | 4 | ||||||||||||||||||
ICE CD General Electric | Sell | 1.00% | Quarterly | 06/20/2024 | (1,225) | 19 | (9) | 28 | ||||||||||||||||||
| SEI Institutional Managed Trust / Semi-Annual Report / March 31, 2021 | 229 |
SCHEDULE OF INVESTMENTS (Unaudited)
March 31, 2021
Multi-Asset Income Fund (Continued)
| Credit Default Swaps | ||||||||||||||||||||||||||||||||
| Reference Entity/Obligation | Buy/Sell Protection | (Pays)/ Receives Rate | Payment Frequency | Termination Date | Notional Amount (Thousands) | Value (Thousands) | Upfront Payments/ Receipts (Thousands) | Net Unrealized Appreciation (Depreciation) (Thousands) | ||||||||||||||||||||||||
ICE CD Kingdom of Saudi Arabia | Sell | 1.00% | Quarterly | 06/20/2024 | (5,490 | ) | $ | 111 | $ | 36 | $ | 75 | ||||||||||||||||||||
ICE CD Mexico | Sell | 1.00% | Quarterly | 06/20/2024 | (1,160 | ) | 12 | (10) | 22 | |||||||||||||||||||||||
ICE CD Peru | Sell | 1.00% | Quarterly | 06/20/2024 | (2,040 | ) | 33 | 24 | 9 | |||||||||||||||||||||||
ICE CD Peru | Sell | 1.00% | Quarterly | 12/20/2024 | (1,620 | ) | 26 | 27 | (1) | |||||||||||||||||||||||
ICE CD Philippines | Sell | 1.00% | Quarterly | 12/20/2023 | (740 | ) | 16 | 1 | 15 | |||||||||||||||||||||||
ICE CD Qatar | Sell | 1.00% | Quarterly | 06/20/2024 | (400 | ) | 9 | 6 | 3 | |||||||||||||||||||||||
ICE CD Qatar | Sell | 1.00% | Quarterly | 12/20/2024 | (860 | ) | 21 | 15 | 6 | |||||||||||||||||||||||
|
|
|
|
|
| |||||||||||||||||||||||||||
| $ | 2,038 | $ | 359 | $ | 1,679 | |||||||||||||||||||||||||||
|
|
|
|
|
| |||||||||||||||||||||||||||
| Interest Rate Swaps | ||||||||||||||||||||||||||||||
| Fund Pays | Fund Receives | Payment Frequency | Termination Date | Currency | Notional Amount (Thousands) | Value (Thousands) | Upfront (Thousands) | Net Unrealized Appreciation (Depreciation) (Thousands) | ||||||||||||||||||||||
WIBR3M | PLN @ 0.25% | Quarterly | 12/16/2021 | PLN | 22,350 | $ | (1) | $ | (1) | $ | – | |||||||||||||||||||
GOLDMAN SACHS BANK USA INC (PA | USD-SOFRRATE | Annually | 08/19/2045 | USD | 910 | 217 | – | 217 | ||||||||||||||||||||||
CITIGROUP GLOBAL MARKETS (PAS) | CMENA IR SWAP (SOFRRATE) | Annually | 07/20/2045 | USD | 7,020 | 1,920 | 18 | 1,902 | ||||||||||||||||||||||
EURO6M | 0.25% | Semi-Annual | 06/16/2041 | EUR | 490 | 26 | 16 | 10 | ||||||||||||||||||||||
EURO6M | 0.00% | Semi-Annual | 06/16/2031 | EUR | 4,650 | 54 | 29 | 25 | ||||||||||||||||||||||
GBP BP0006M | GBP @ 0.5% | Semi-Annual | 06/16/2031 | GBP | 600 | 48 | 42 | 6 | ||||||||||||||||||||||
MXIBTIIE | MXN @ 6.40% | Monthly | 06/04/2031 | MXN | 40,230 | 76 | 7 | 69 | ||||||||||||||||||||||
EURO6M | (0.25)% | Semi-Annual | 06/16/2028 | EUR | 4,740 | 48 | 41 | 7 | ||||||||||||||||||||||
6.25% | JIBA3M | Quarterly | 06/17/2026 | ZAR | 9,140 | 1 | 1 | – | ||||||||||||||||||||||
EURO6M | (0.25)% | Semi-Annual | 06/16/2026 | EUR | 3,440 | (8) | (7) | (1) | ||||||||||||||||||||||
MXN @ 5.55% | MXIBTIIE | Monthly | 06/10/2026 | MXN | 5,730 | 1 | – | 1 | ||||||||||||||||||||||
USD - LIBOR - BBA | 1.10% | Semi-Annual | 12/18/2025 | USD | 17,937 | (167) | – | (167) | ||||||||||||||||||||||
0.75% | WIBR6M | Annually | 12/16/2025 | PLN | 4,500 | (25) | (1) | (24) | ||||||||||||||||||||||
6.32% | BZDIOVRA | Monthly | 01/02/2025 | BRL | 11,111 | 119 | 19 | 100 | ||||||||||||||||||||||
28-DAY MXN - TIIE | 7.20% | Monthly | 07/17/2024 | MXN | 365,383 | 880 | – | 880 | ||||||||||||||||||||||
EURO6M | (0.50)% | Semi-Annual | 06/16/2024 | EUR | 5,900 | 14 | 18 | (4) | ||||||||||||||||||||||
BZDIOVRA | 4.93% | Monthly | 01/02/2024 | BRL | 3,450 | (41) | 1 | (42) | ||||||||||||||||||||||
KWCDC | 1.00% | Quarterly | 06/16/2023 | KRW | 11,402,540 | 29 | 37 | (8) | ||||||||||||||||||||||
2.75% | 3-MONTH CNY -CNREPOFIX | Annually | 06/16/2023 | CNY | 3,670 | (2) | – | (2) | ||||||||||||||||||||||
(0.50)% | EURO6M | Annually | 06/16/2023 | EUR | 3,990 | (1) | (4) | 3 | ||||||||||||||||||||||
0.345% | WIBR6M | Annually | 06/16/2023 | PLN | 2,055 | (3) | – | (3) | ||||||||||||||||||||||
28-DAY MXN - TIIE | 4.70% | Monthly | 06/14/2023 | MXN | 12,060 | (6) | – | (6) | ||||||||||||||||||||||
5.80% | BZDIOVRA | Monthly | 01/02/2023 | BRL | 11,150 | 21 | 11 | 10 | ||||||||||||||||||||||
BZDIOVRA | 4.23% | Monthly | 01/02/2023 | BRL | 4,470 | (29) | (1) | (28) | ||||||||||||||||||||||
BZDIOVRA | 3.39% | Monthly | 01/03/2022 | BRL | 14,750 | (23) | – | (23) | ||||||||||||||||||||||
BZDIOVRA | 4.12% | Monthly | 01/03/2022 | BRL | 6,150 | (4) | 22 | (26) | ||||||||||||||||||||||
USD - LIBOR - BBA | 1.60% | Quarterly | 02/15/2047 | USD | 807 | 104 | 5 | 99 | ||||||||||||||||||||||
EURO6M | 0.00% | Semi-Annual | 06/16/2051 | EUR | 400 | 67 | 54 | 13 | ||||||||||||||||||||||
|
|
|
|
|
| |||||||||||||||||||||||||
| $ | 3,315 | $ | 307 | $ | 3,008 | |||||||||||||||||||||||||
|
|
|
|
|
| |||||||||||||||||||||||||
| A list of open OTC swap agreements held by the Fund at March 31, 2021 is as follows: |
| Interest Rate Swaps |
| |||||||||||||||||||||||||
| Counterparty | Fund Pays | Fund Receives | Payment Frequency | Termination Date | Currency | Notional Amount (Thousands) | Value (Thousands) | Upfront Payments (Thousands) | Net Unrealized Appreciation (Depreciation) (Thousands) | |||||||||||||||||
Citibank | 1-DAY BRL - CETIP | 0.07024% | Annually | 01/04/2027 | BRL | 3,600 | $ | 20 | $ | – | $ | 20 | ||||||||||||||
Citibank | 1-DAY BRL - CETIP | 0.07024% | Annually | 01/04/2027 | BRL | 4,300 | 23 | 2 | 21 | |||||||||||||||||
Citibank | 1-DAY BRL - CETIP | 0.07024% | Annually | 01/04/2027 | BRL | 4,628 | 27 | 2 | 25 | |||||||||||||||||
Citibank | 1-DAY BRL - CETIP | 6.87% | Annually | 01/04/2027 | BRL | 15,030 | 117 | – | 117 | |||||||||||||||||
| ||||||||||||||||||||||||||
| 230 | SEI Institutional Managed Trust / Semi-Annual Report / March 31, 2021 |
| Counterparty | Fund Pays | Fund Receives | Payment Frequency | Termination Date | Currency | Notional Amount (Thousands) | Value (Thousands) | Upfront Payments (Thousands) | Net Unrealized Appreciation (Depreciation) (Thousands) | |||||||||||||||
JPMorgan Chase | 1-DAY BRL - CETIP | 0.07044% | Annually | 01/04/2027 | BRL | 3,000 | $ | 17 | $ | – | $ | 17 | ||||||||||||
|
|
|
|
|
| |||||||||||||||||||
| $ | 204 | $ | 4 | $ | 200 | |||||||||||||||||||
|
|
|
|
|
| |||||||||||||||||||
Percentages are based on Net Assets of $930,312 ($ Thousands).
| * | Non-income producing security. |
| ‡ | Real Estate Investment Trust. |
| (A) | Security exempt from registration under Rule 144A of the Securities Act of 1933. These securities may be resold in transactions exempt from registration normally to qualified institutions. On March 31, 2021, the value of these securities amounted to $336,954 ($ Thousands), representing 36.2% of the Net Assets of the Fund. |
| (B) | Security, or a portion thereof, is owned through a holding entity, Bamboo Temple, LLC. |
| (C) | Security is in default on interest payment. |
| (D) | Variable or floating rate security, the interest rate of which adjusts periodically based on changes in current interest rates and prepayments on the underlying pool of assets. |
| (E) | Perpetual security with no stated maturity date. |
| (F) | Step Bonds – Represents the current rate, the step rate, the step date and the final maturity date. |
| (G) | Level 3 security in accordance with fair value hierarchy. |
| (H) | Unsettled bank loan. Interest rate may not be available. |
| (I) | Security fair valued using methods determined in good faith by the Valuation Committee of the Board of Trustees. The total market value of such securities as of March 31, 2021 was $57 ($ Thousands) and represented 0.0% of the Net Assets of the Fund. |
| (J) | Zero coupon security. The rate shown on the Schedule of Investments is the security’s effective yield at the time of purchase. |
| (K) | No interest rate available. |
| (L) | Refer to table below for details on Options Contracts. |
ABS — Asset-Backed Security
AUD — Australian Dollar
BBA — British Bankers Association
BRL — Brazilian Real
CAD — Canadian Dollar
CETIP— Central of Custody and Financial Settlement of Securities
Cl — Class
CLO — Collateralized Loan Obligation
CMO — Collateralized Mortgage Obligation
CNY — Chinese Yuan Onshore
CV — Convertible Security
DAC — Designated Activity Company
EUR — Euro
FHLMC — Federal Home Loan Mortgage Corporation
FNMA — Federal National Mortgage Association
GBP — British Pound Sterling
GNMA — Government National Mortgage Association
GO — General Obligation
ICE— Intercontinental Exchange
IDR — Indonesian Rupiah
IO — Interest Only — face amount represents notional amount.
JPY — Japanese Yen
JSC — Joint-Stock Company
KRW — Korean Won
LIBOR— London Interbank Offered Rate
LLC — Limited Liability Company
L.P. — Limited Partnership
Ltd. — Limited
MTN — Medium Term Note
MXN — Mexican Peso
NOK — Norwegian Krone
PIK — Payment-in-Kind
PJSC — Public Joint-Stock Company
PLC — Public Limited Company
PLN — Polish Zloty
Pty — Proprietary
REMIC — Real Estate Mortgage Investment Conduit
RUB — Russian Ruble
S&P— Standard & Poor’s
SAR— Saudi Riyal
Ser — Series
SPX — Standard & Poor’s 500 Index
SEK — Swedish Krona
TIIE — Interbank Equilibrium Interest Rate
ULC — Unlimited Liability Company
USD — U.S. Dollar
VAR — Variable Rate
The following is a list of the level of inputs used as of March 31, 2021, in valuing the Fund’s investments and other financial instruments carried at value ($ Thousands):
| ||||||||||||||||
| Investments in Securities | Level 1 ($) | Level 2 ($) | Level 3 ($)(1) | Total ($) | ||||||||||||
| ||||||||||||||||
Corporate Obligations | – | 442,717 | 519 | 443,236 | ||||||||||||
Loan Participations | – | 111,088 | – | 111,088 | ||||||||||||
Common Stock | 105,606 | 207 | 57 | 105,870 | ||||||||||||
Sovereign Debt | – | 105,185 | – | 105,185 | ||||||||||||
Mortgage-Backed Securities | – | 65,738 | – | 65,738 | ||||||||||||
Asset-Backed Securities | – | 37,116 | – | 37,116 | ||||||||||||
Convertible Bonds | – | 7,150 | 316 | 7,466 | ||||||||||||
Preferred Stock | 119 | 1,857 | 2,367 | 4,343 | ||||||||||||
Municipal Bond | – | 279 | – | 279 | ||||||||||||
Warrants | – | 30 | – | 30 | ||||||||||||
|
|
|
|
|
|
|
| |||||||||
Total Investments in Securities | 105,725 | 771,367 | 3,259 | 880,351 | ||||||||||||
|
|
|
|
|
|
|
| |||||||||
| ||||||||||||||||
| Other Financial Instruments | Level 1 ($) | Level 2 ($) | Level 3 ($) | Total ($) | ||||||||||||
| ||||||||||||||||
Purchased Options | 302 | – | – | 302 | ||||||||||||
Written Options | (2,218 | ) | – | – | (2,218 | ) | ||||||||||
Futures Contracts* | ||||||||||||||||
Unrealized Appreciation | 1,139 | – | – | 1,139 | ||||||||||||
Unrealized Depreciation | (4,598 | ) | – | – | (4,598 | ) | ||||||||||
Forwards Contracts* | ||||||||||||||||
Unrealized Appreciation | – | 2,459 | – | 2,459 | ||||||||||||
Unrealized Depreciation | – | (782 | ) | – | (782 | ) | ||||||||||
OTC Swaps | ||||||||||||||||
Interest Rate Swaps* | ||||||||||||||||
Unrealized Appreciation | – | 200 | – | 200 | ||||||||||||
Centrally Cleared Swaps | ||||||||||||||||
Credit Default Swaps* | ||||||||||||||||
Unrealized Appreciation | – | 1,721 | – | 1,721 | ||||||||||||
Unrealized Depreciation | – | (42 | ) | – | (42 | ) | ||||||||||
Interest Rate Swaps* | ||||||||||||||||
Unrealized Appreciation | – | 3,342 | – | 3,342 | ||||||||||||
Unrealized Depreciation | – | (334 | ) | – | (334 | ) | ||||||||||
|
|
|
|
|
|
|
| |||||||||
Total Other Financial Instruments | (5,375 | ) | 6,564 | – | 1,189 | |||||||||||
|
|
|
|
|
|
|
| |||||||||
| SEI Institutional Managed Trust / Semi-Annual Report / March 31, 2021 | 231 |
SCHEDULE OF INVESTMENTS (Unaudited)
March 31, 2021
Multi-Asset Income Fund (Concluded)
* Futures contracts, forward contracts and swap contracts are valued at the unrealized appreciation
(depreciation) on the instrument.
(1) The following is a reconciliation of the investments in which significant unobservable inputs (Level 3) were used in determining value ($ Thousands):
| Investments in Corporate Obligations | Investments in Loan Participations | Investments in Common Stock | Investments in Convertible Bond | Investments in Preferred Stock | ||||||||||||||||
Balance as of October 1, 2020 | $ | – | $ | 232 | $ | 57 | $ | – | $ | – | ||||||||||
Accrued discounts/premiums | – | (5 | ) | – | – | – | ||||||||||||||
Realized gain/(loss) | – | 2 | – | – | – | |||||||||||||||
Change in unrealized appreciation/ (depreciation) | (1 | ) | 65 | – | – | – | ||||||||||||||
Purchases | 520 | 18 | – | – | – | |||||||||||||||
Sales | – | (312 | ) | – | – | – | ||||||||||||||
Net transfer into Level 3 | – | – | – | 316 | 2,367 | |||||||||||||||
Net transfer out of Level 3 | – | – | – | – | – | |||||||||||||||
|
| |||||||||||||||||||
Ending Balance as of March 31, 2021 | $ | 519 | $ | – | $ | 57 | $ | 316 | $ | 2,367 | ||||||||||
|
| |||||||||||||||||||
Changes in unrealized gains/(losses) included in earnings related to securities still held at reporting date | $ | (1 | ) | $ | 65 | $ | – | $ | – | $ | – | |||||||||
|
| |||||||||||||||||||
For the period ended March 31, 2021, there were transfers between Level 2 and Level 3 assets and liabilities due to the availability of observable inputs to determine fair value.
For more information on valuation inputs, see Note 2 – Significant Accounting Policies in Notes to
Financial Statements.
Amounts designated as “—” are either $0 or have been rounded to $0.
The accompanying notes are an integral part of the financial statements.
| 232 | SEI Institutional Managed Trust / Semi-Annual Report / March 31, 2021 |
CONSOLIDATED SCHEDULE OF INVESTMENTS (Unaudited)
March 31, 2021
Multi-Asset Inflation Managed Fund
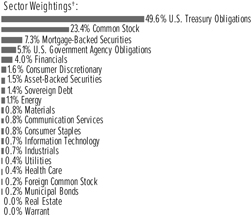
†Percentages are based on total investments.
| Description | Face Amount (Thousands) | Market Value ($ Thousands) | ||||||
U.S. TREASURY OBLIGATIONS — 64.4% |
| |||||||
U.S. Treasury Bills | ||||||||
0.090%, 07/08/2021 (A)(B) | $ | 1,000 | $ | 1,000 | ||||
0.053%, 05/06/2021 (A)(B) | 21,500 | 21,500 | ||||||
0.052%, 05/20/2021 (A)(B) | 21,500 | 21,500 | ||||||
0.050%, 04/22/2021 (A)(B) | 7,500 | 7,500 | ||||||
0.049%, 05/13/2021 (A)(B) | 21,500 | 21,499 | ||||||
0.045%, 06/10/2021 (A)(B) | 400 | 400 | ||||||
0.031%, 04/13/2021 (A)(B) | 176 | 176 | ||||||
U.S. Treasury Inflation Protected Securities | ||||||||
2.375%, 01/15/2025 | 19,102 | 22,374 | ||||||
2.000%, 01/15/2026 | 13,693 | 16,177 | ||||||
0.625%, 04/15/2023 | 30,982 | 32,976 | ||||||
0.625%, 01/15/2024 | 21,928 | 23,767 | ||||||
0.625%, 01/15/2026 | 11,746 | 13,055 | ||||||
0.500%, 04/15/2024 | 13,965 | 15,134 | ||||||
0.375%, 07/15/2023 | 28,578 | 30,606 | ||||||
0.375%, 07/15/2025 | 58,603 | 64,535 | ||||||
0.250%, 01/15/2025 | 31,359 | 34,046 | ||||||
0.125%, 01/15/2022 | 9,939 | 10,167 | ||||||
0.125%, 07/15/2022 | 36,680 | 38,126 | ||||||
0.125%, 01/15/2023 | 21,572 | 22,623 | ||||||
0.125%, 07/15/2024 | 7,513 | 8,128 | ||||||
0.125%, 10/15/2024 | 46,293 | 50,059 | ||||||
0.125%, 10/15/2025 | 22,003 | 23,959 | ||||||
0.125%, 07/15/2026 | 18,692 | 20,417 | ||||||
U.S. Treasury Notes | ||||||||
0.320%, VAR US Treasury 3 Month Bill Money Market Yield+0.300%, 10/31/2021 (A) | 5,300 | 5,306 | ||||||
0.134%, VAR US Treasury 3 Month Bill Money Market Yield+0.114%, 04/30/2022 (A) | 4,500 | 4,505 | ||||||
| Description | Face Amount (Thousands) | Market Value ($ Thousands) | ||||||
U.S. TREASURY OBLIGATIONS (continued) |
| |||||||
0.075%, VAR US Treasury 3 Month Bill Money Market Yield+0.055%, 07/31/2022 (A) | $ | 7,600 | $ | 7,603 | ||||
0.075%, VAR US Treasury 3 Month Bill Money Market Yield+0.055%, 10/31/2022 (A) | 2,900 | 2,902 | ||||||
0.069%, VAR US Treasury 3 Month Bill Money Market Yield+0.049%, 01/31/2023 (A) | 2,100 | 2,101 | ||||||
|
|
| ||||||
Total U.S. Treasury Obligations (Cost $499,613) ($ Thousands) | 522,141 | |||||||
|
|
| ||||||
| Shares | ||||||||
COMMON STOCK — 30.4% |
| |||||||
Communication Services — 2.5% |
| |||||||
Activision Blizzard Inc | 4,647 | 432 | ||||||
Alphabet Inc, Cl A * | 1,132 | 2,335 | ||||||
Alphabet Inc, Cl C * | 1,087 | 2,249 | ||||||
Anterix Inc * | 1,229 | 58 | ||||||
AT&T Inc | 92,447 | 2,798 | ||||||
ATN International Inc | 175 | 9 | ||||||
Cogent Communications Holdings Inc | 800 | 55 | ||||||
Electronic Arts Inc | 1,876 | 254 | ||||||
Facebook Inc, Cl A * | 8,722 | 2,569 | ||||||
Iridium Communications Inc * | 2,421 | 100 | ||||||
Liberty Broadband Corp, Cl C * | 986 | 148 | ||||||
Liberty Media Corp-Liberty Braves * | 700 | 19 | ||||||
Liberty Media Corp-Liberty Formula One, Cl C * | 1,100 | 48 | ||||||
Live Nation Entertainment Inc * | 800 | 68 | ||||||
Lumen Technologies Inc | 12,471 | 166 | ||||||
Madison Square Garden Entertainment Corp * | 378 | 31 | ||||||
Madison Square Garden Sports Corp * | 173 | 31 | ||||||
Match Group Inc * | 647 | 89 | ||||||
Netflix Inc * | 2,632 | 1,373 | ||||||
Pinterest Inc, Cl A * | 1,721 | 127 | ||||||
Roku Inc, Cl A * | 551 | 179 | ||||||
Shenandoah Telecommunications Co | 500 | 24 | ||||||
Spotify Technology SA * | 917 | 246 | ||||||
Take-Two Interactive Software Inc, Cl A * | 1,000 | 177 | ||||||
T-Mobile US Inc * | 7,335 | 919 | ||||||
Twitter Inc * | 2,187 | 139 | ||||||
Verizon Communications Inc | 55,414 | 3,222 | ||||||
ViacomCBS Inc, Cl B | 2,385 | 107 | ||||||
Vonage Holdings Corp * | 4,800 | 57 | ||||||
Walt Disney Co/The | 10,567 | 1,950 | ||||||
Zillow Group Inc, Cl C * | 500 | 65 | ||||||
| SEI Institutional Managed Trust / Semi-Annual Report / March 31, 2021 | 233 |
CONSOLIDATED SCHEDULE OF INVESTMENTS (Unaudited)
March 31, 2021
Multi-Asset Inflation Managed Fund (Continued)
| Description | Shares |
Market Value | ||||||
COMMON STOCK (continued) | ||||||||
Zynga Inc, Cl A * | 3,891 | $ | 40 | |||||
|
| |||||||
| 20,084 | ||||||||
|
| |||||||
Consumer Staples — 7.9% | ||||||||
Albertsons Cos Inc | 2,900 | 55 | ||||||
Altria Group Inc | 52,831 | 2,703 | ||||||
Andersons Inc/The | 1,700 | 47 | ||||||
Archer-Daniels-Midland Co | 15,700 | 895 | ||||||
B&G Foods Inc, Cl A | 1,029 | 32 | ||||||
BellRing Brands, Cl A * | 800 | 19 | ||||||
Beyond Meat Inc * | 1,500 | 195 | ||||||
BJ’s Wholesale Club Holdings Inc * | 4,200 | 188 | ||||||
Boston Beer Co Inc/The, Cl A * | 250 | 302 | ||||||
Brown-Forman Corp, Cl A | 1,128 | 72 | ||||||
Brown-Forman Corp, Cl B | 4,917 | 339 | ||||||
Bunge Ltd | 3,636 | 288 | ||||||
Calavo Growers Inc | 154 | 12 | ||||||
Cal-Maine Foods Inc | 1,150 | 44 | ||||||
Campbell Soup Co | 6,096 | 306 | ||||||
Casey’s General Stores Inc | 697 | 151 | ||||||
Celsius Holdings Inc * | 1,500 | 72 | ||||||
Central Garden & Pet Co, Cl A * | 1,700 | 88 | ||||||
Church & Dwight Co Inc | 7,279 | 636 | ||||||
Clorox Co/The | 3,614 | 697 | ||||||
Coca-Cola Co/The | 110,678 | 5,834 | ||||||
Coca-Cola Consolidated Inc | 200 | 58 | ||||||
Colgate-Palmolive Co | 24,423 | 1,925 | ||||||
Conagra Brands Inc | 13,786 | 518 | ||||||
Constellation Brands Inc, Cl A | 4,521 | 1,031 | ||||||
Costco Wholesale Corp | 12,458 | 4,391 | ||||||
Coty Inc, Cl A | 5,365 | 48 | ||||||
Darling Ingredients Inc * | 3,636 | 268 | ||||||
Edgewell Personal Care Co | 634 | 25 | ||||||
Energizer Holdings Inc | 2,113 | 100 | ||||||
Estee Lauder Cos Inc/The, Cl A | 6,343 | 1,845 | ||||||
Flowers Foods Inc | 5,007 | 119 | ||||||
Freshpet Inc * | 800 | 127 | ||||||
General Mills Inc | 17,395 | 1,067 | ||||||
Grocery Outlet Holding Corp * | 2,000 | 74 | ||||||
Hain Celestial Group Inc/The * | 2,234 | 97 | ||||||
Herbalife Nutrition Ltd * | 2,408 | 107 | ||||||
Hershey Co/The | 4,294 | 679 | ||||||
Hormel Foods Corp | 8,239 | 394 | ||||||
Hostess Brands Inc, Cl A * | 3,770 | 54 | ||||||
Ingredion Inc | 1,982 | 178 | ||||||
Inter Parfums Inc | 100 | 7 | ||||||
J & J Snack Foods Corp | 227 | 36 | ||||||
J M Smucker Co/The | 3,414 | 432 | ||||||
John B Sanfilippo & Son Inc | 500 | 45 | ||||||
Kellogg Co | 7,212 | 456 | ||||||
Keurig Dr Pepper Inc | 13,346 | 459 | ||||||
Kimberly-Clark Corp | 9,958 | 1,385 | ||||||
Kraft Heinz Co/The | 17,918 | 717 | ||||||
| Description | Shares |
Market Value | ||||||
COMMON STOCK (continued) | ||||||||
Kroger Co/The | 21,436 | $ | 771 | |||||
Lamb Weston Holdings Inc | 4,305 | 334 | ||||||
Lancaster Colony Corp | 550 | 96 | ||||||
McCormick & Co Inc/MD | 6,946 | 619 | ||||||
Medifast Inc | 354 | 75 | ||||||
Molson Coors Beverage Co, Cl B | 5,274 | 270 | ||||||
Mondelez International Inc, Cl A | 40,204 | 2,353 | ||||||
Monster Beverage Corp * | 9,821 | 895 | ||||||
National Beverage Corp, Cl A | 600 | 29 | ||||||
Nu Skin Enterprises Inc, Cl A | 1,143 | 60 | ||||||
PepsiCo Inc | 39,192 | 5,544 | ||||||
Performance Food Group Co * | 3,195 | 184 | ||||||
Philip Morris International Inc | 44,589 | 3,957 | ||||||
Pilgrim’s Pride Corp * | 1,078 | 26 | ||||||
Post Holdings Inc * | 1,872 | 198 | ||||||
Primo Water Corp | 4,125 | 67 | ||||||
Procter & Gamble Co/The | 70,214 | 9,509 | ||||||
Reynolds Consumer Products Inc | 1,300 | 39 | ||||||
Sanderson Farms Inc | 601 | 94 | ||||||
Seaboard Corp | 7 | 26 | ||||||
Simply Good Foods Co/The * | 1,900 | 58 | ||||||
Spectrum Brands Holdings Inc | 1,066 | 91 | ||||||
Sprouts Farmers Market Inc * | 3,028 | 81 | ||||||
Sysco Corp, Cl A | 13,729 | 1,081 | ||||||
TreeHouse Foods Inc * | 1,231 | 64 | ||||||
Tyson Foods Inc, Cl A | 8,158 | 606 | ||||||
United Natural Foods Inc * | 1,600 | 53 | ||||||
US Foods Holding Corp * | 6,256 | 238 | ||||||
USANA Health Sciences Inc * | 600 | 58 | ||||||
Vector Group Ltd | 1,429 | 20 | ||||||
Walgreens Boots Alliance Inc | 19,715 | 1,082 | ||||||
Walmart Inc | 39,328 | 5,342 | ||||||
WD-40 Co | 361 | 110 | ||||||
|
| |||||||
| 63,647 | ||||||||
|
| |||||||
Energy — 7.7% | ||||||||
Antero Midstream Corp | 21,800 | 197 | ||||||
Antero Resources Corp * | 10,847 | 111 | ||||||
APA | 21,748 | 389 | ||||||
Arch Resources Inc | 1,200 | 50 | ||||||
Archrock Inc | 9,200 | 87 | ||||||
Baker Hughes Co, Cl A | 40,110 | 867 | ||||||
Brigham Minerals Inc, Cl A | 1,383 | 20 | ||||||
Cabot Oil & Gas Corp | 23,725 | 446 | ||||||
Cactus Inc, Cl A | 2,400 | 74 | ||||||
ChampionX Corp * | 11,738 | 255 | ||||||
Cheniere Energy Inc * | 13,932 | 1,003 | ||||||
Chevron Corp | 112,509 | 11,790 | ||||||
Cimarex Energy Co | 5,389 | 320 | ||||||
Clean Energy Fuels Corp * | 7,200 | 99 | ||||||
CNX Resources Corp * | 11,660 | 171 | ||||||
ConocoPhillips | 78,702 | 4,169 | ||||||
Continental Resources Inc/OK, Cl A | 4,193 | 108 | ||||||
| 234 | SEI Institutional Managed Trust / Semi-Annual Report / March 31, 2021 |
| Description | Shares | Market Value ($ Thousands) | ||||||
COMMON STOCK (continued) | ||||||||
Delek US Holdings Inc | 3,533 | $ | 77 | |||||
Devon Energy Corp | 33,348 | 729 | ||||||
DHT Holdings Inc | 3,000 | 18 | ||||||
Diamondback Energy Inc, Cl A | 8,978 | 660 | ||||||
DMC Global Inc | 1,200 | 65 | ||||||
Dorian LPG Ltd * | 3,800 | 50 | ||||||
Dril-Quip Inc * | 2,488 | 83 | ||||||
EOG Resources Inc | 36,198 | 2,625 | ||||||
EQT Corp * | 16,298 | 303 | ||||||
Equitrans Midstream Corp | 27,822 | 227 | ||||||
Exxon Mobil Corp | 249,669 | 13,939 | ||||||
Frank’s International * | 13,200 | 47 | ||||||
Frontline Ltd | 6,986 | 50 | ||||||
Golar LNG Ltd | 5,677 | 58 | ||||||
Green Plains Inc * | 1,900 | 51 | ||||||
Halliburton Co | 51,769 | 1,111 | ||||||
Helix Energy Solutions Group Inc * | 6,312 | 32 | ||||||
Helmerich & Payne Inc | 6,538 | 176 | ||||||
Hess Corp | 16,120 | 1,141 | ||||||
HollyFrontier Corp | 8,731 | 312 | ||||||
Kinder Morgan Inc | 119,187 | 1,984 | ||||||
Kosmos Energy Ltd * | 29,600 | 91 | ||||||
Liberty Oilfield Services Inc, Cl A | 4,870 | 55 | ||||||
Magnolia Oil & Gas Corp, Cl A * | 7,409 | 85 | ||||||
Marathon Oil Corp | 45,362 | 484 | ||||||
Marathon Petroleum Corp | 37,504 | 2,006 | ||||||
Matador Resources Co | 5,400 | 127 | ||||||
Murphy Oil Corp | 7,823 | 128 | ||||||
NexTier Oilfield Solutions Inc * | 9,300 | 35 | ||||||
Nordic American Tankers Ltd | 4,900 | 16 | ||||||
NOV Inc | 23,723 | 326 | ||||||
Occidental Petroleum Corp | 48,809 | 1,299 | ||||||
Oceaneering International Inc, Cl A * | 3,277 | 37 | ||||||
ONEOK Inc | 32,054 | 1,624 | ||||||
Ovintiv Inc | 14,670 | 349 | ||||||
Par Pacific Holdings Inc * | 3,495 | 49 | ||||||
Patterson-UTI Energy Inc | 11,759 | 84 | ||||||
PBF Energy Inc, Cl A * | 5,520 | 78 | ||||||
PDC Energy Inc, Cl A * | 5,614 | 193 | ||||||
Phillips 66 | 26,374 | 2,151 | ||||||
Pioneer Natural Resources Co | 11,672 | 1,854 | ||||||
ProPetro Holding Corp * | 1,894 | 20 | ||||||
Range Resources Corp * | 13,557 | 140 | ||||||
Renewable Energy Group Inc * | 2,600 | 172 | ||||||
REX American Resources Corp * | 307 | 26 | ||||||
Schlumberger NV, Cl A | 82,198 | 2,235 | ||||||
Scorpio Tankers Inc | 2,888 | 53 | ||||||
SFL Corp Ltd | 5,683 | 46 | ||||||
SM Energy Co | 4,000 | 66 | ||||||
Southwestern Energy Co * | 39,622 | 184 | ||||||
Targa Resources Corp | 13,859 | 440 | ||||||
Tellurian * | 12,300 | 29 | ||||||
| Description | Shares | Market Value ($ Thousands) | ||||||
COMMON STOCK (continued) |
| |||||||
Transocean Ltd * | 31,635 | $ | 112 | |||||
Valero Energy Corp | 23,947 | 1,715 | ||||||
Williams Cos Inc/The | 73,244 | 1,735 | ||||||
World Fuel Services Corp | 3,440 | 121 | ||||||
|
| |||||||
| 62,059 | ||||||||
|
| |||||||
Health Care — 5.9% | ||||||||
10X Genomics Inc, Cl A * | 522 | 94 | ||||||
Abbott Laboratories | 15,602 | 1,870 | ||||||
AbbVie Inc | 15,791 | 1,709 | ||||||
ABIOMED Inc * | 524 | 167 | ||||||
Acadia Healthcare Co Inc, Cl A * | 1,266 | 72 | ||||||
ACADIA Pharmaceuticals Inc * | 1,000 | 26 | ||||||
Acceleron Pharma Inc * | 500 | 68 | ||||||
Adaptive Biotechnologies Corp * | 1,146 | 46 | ||||||
Agilent Technologies Inc | 3,098 | 394 | ||||||
Agios Pharmaceuticals Inc * | 800 | 41 | ||||||
Alexion Pharmaceuticals Inc * | 1,951 | 298 | ||||||
Align Technology Inc * | 701 | 380 | ||||||
Allscripts Healthcare Solutions Inc * | 1,658 | 25 | ||||||
Alnylam Pharmaceuticals Inc * | 1,173 | 166 | ||||||
Amedisys Inc * | 200 | 53 | ||||||
AmerisourceBergen Corp, Cl A | 933 | 110 | ||||||
Amgen Inc, Cl A | 5,380 | 1,339 | ||||||
Amicus Therapeutics Inc * | 3,123 | 31 | ||||||
AMN Healthcare Services Inc * | 700 | 52 | ||||||
Amphastar Pharmaceuticals Inc * | 1,493 | 27 | ||||||
ANI Pharmaceuticals Inc * | 300 | 11 | ||||||
Anthem Inc | 2,183 | 784 | ||||||
Arena Pharmaceuticals Inc * | 1,141 | 79 | ||||||
Arrowhead Pharmaceuticals Inc * | 926 | 61 | ||||||
Avanos Medical Inc * | 858 | 38 | ||||||
Avantor Inc * | 2,606 | 75 | ||||||
Baxter International Inc | 4,457 | 376 | ||||||
Becton Dickinson and Co | 2,635 | 641 | ||||||
Biogen Inc * | 1,392 | 389 | ||||||
Biohaven Pharmaceutical Holding Co Ltd * | 600 | 41 | ||||||
BioMarin Pharmaceutical Inc * | 1,643 | 124 | ||||||
Bio-Rad Laboratories Inc, Cl A * | 202 | 115 | ||||||
Bio-Techne Corp | 458 | 175 | ||||||
Bioxcel Therapeutics Inc * | 1,100 | 47 | ||||||
Bluebird Bio Inc * | 597 | 18 | ||||||
Blueprint Medicines Corp * | 540 | 52 | ||||||
Boston Scientific Corp * | 12,693 | 491 | ||||||
Bridgebio Pharma Inc * | 1,050 | 65 | ||||||
Bristol-Myers Squibb Co | 20,457 | 1,291 | ||||||
Bruker Corp | 1,124 | 72 | ||||||
Cantel Medical Corp | 404 | 32 | ||||||
Cardinal Health Inc | 2,475 | 150 | ||||||
Cardiovascular Systems Inc * | 256 | 10 | ||||||
CareDx Inc * | 700 | 48 | ||||||
Catalent Inc * | 1,529 | 161 | ||||||
Centene Corp * | 4,850 | 310 | ||||||
| SEI Institutional Managed Trust / Semi-Annual Report / March 31, 2021 | 235 |
CONSOLIDATED SCHEDULE OF INVESTMENTS (Unaudited)
March 31, 2021
Multi-Asset Inflation Managed Fund (Continued)
| Description | Shares | Market Value ($ Thousands) | ||||||
COMMON STOCK (continued) |
| |||||||
Cerner Corp | 3,481 | $ | 250 | |||||
Change Healthcare Inc * | 1,100 | 24 | ||||||
Charles River Laboratories International Inc * | 653 | 189 | ||||||
Chemed Corp | 150 | 69 | ||||||
ChemoCentryx Inc * | 900 | 46 | ||||||
Cigna Corp | 3,221 | 779 | ||||||
CONMED Corp | 400 | 52 | ||||||
Cooper Cos Inc/The, Cl A | 472 | 181 | ||||||
CorVel Corp * | 300 | 31 | ||||||
Covetrus Inc * | 1,935 | 58 | ||||||
CVS Health Corp | 11,278 | 848 | ||||||
Danaher Corp, Cl A | 5,537 | 1,246 | ||||||
DaVita Inc * | 658 | 71 | ||||||
Denali Therapeutics Inc * | 800 | 46 | ||||||
DENTSPLY SIRONA Inc | 1,904 | 121 | ||||||
Dexcom Inc * | 917 | 330 | ||||||
Edwards Lifesciences Corp, Cl A * | 7,041 | 589 | ||||||
Elanco Animal Health Inc * | 4,300 | 127 | ||||||
Eli Lilly and Co | 7,622 | 1,424 | ||||||
Emergent BioSolutions Inc * | 700 | 65 | ||||||
Enanta Pharmaceuticals Inc * | 1,100 | 54 | ||||||
Encompass Health Corp | 1,078 | 88 | ||||||
Ensign Group Inc/The | 379 | 36 | ||||||
Envista Holdings Corp * | 1,700 | 69 | ||||||
Exact Sciences Corp * | 1,239 | 163 | ||||||
Exelixis Inc * | 2,304 | 52 | ||||||
Fate Therapeutics Inc * | 800 | 66 | ||||||
FibroGen Inc * | 1,486 | 52 | ||||||
Genprex Inc | 16,100 | 69 | ||||||
Gilead Sciences Inc | 11,994 | 775 | ||||||
Global Blood Therapeutics Inc * | 800 | 33 | ||||||
Globus Medical Inc, Cl A * | 900 | 55 | ||||||
Guardant Health Inc * | 534 | 82 | ||||||
Haemonetics Corp * | 628 | 70 | ||||||
Halozyme Therapeutics Inc * | 1,268 | 53 | ||||||
HCA Healthcare Inc | 2,459 | 463 | ||||||
Health Catalyst Inc * | 1,000 | 47 | ||||||
HealthEquity Inc * | 600 | 41 | ||||||
HealthStream Inc * | 1,500 | 34 | ||||||
Henry Schein Inc * | 1,103 | 76 | ||||||
Hill-Rom Holdings Inc | 563 | 62 | ||||||
Hologic Inc * | 2,517 | 187 | ||||||
Humana Inc | 1,256 | 527 | ||||||
iBio | 39,000 | 60 | ||||||
ICU Medical Inc * | 224 | 46 | ||||||
IDEXX Laboratories Inc * | 716 | 350 | ||||||
Illumina Inc * | 1,453 | 558 | ||||||
Incyte Corp * | 1,843 | 150 | ||||||
Insmed Inc * | 855 | 29 | ||||||
Inspire Medical Systems Inc * | 300 | 62 | ||||||
Insulet Corp * | 510 | 133 | ||||||
| Description | Shares | Market Value ($ Thousands) | ||||||
COMMON STOCK (continued) | ||||||||
Integer Holdings Corp * | 500 | $ | 46 | |||||
Integra LifeSciences Holdings Corp * | 728 | 50 | ||||||
Intuitive Surgical Inc * | 1,163 | 859 | ||||||
Invitae Corp * | 648 | 25 | ||||||
Ionis Pharmaceuticals Inc * | 1,376 | 62 | ||||||
Iovance Biotherapeutics Inc * | 1,500 | 47 | ||||||
IQVIA Holdings Inc * | 1,882 | 363 | ||||||
iRhythm Technologies Inc * | 200 | 28 | ||||||
Ironwood Pharmaceuticals Inc, Cl A * | 2,400 | 27 | ||||||
Jazz Pharmaceuticals PLC * | 629 | 103 | ||||||
Johnson & Johnson | 24,369 | 4,005 | ||||||
Karuna Therapeutics Inc * | 500 | 60 | ||||||
Kodiak Sciences Inc * | 400 | 45 | ||||||
Laboratory Corp of America Holdings * | 833 | 212 | ||||||
LHC Group Inc * | 500 | 96 | ||||||
Ligand Pharmaceuticals Inc * | 278 | 42 | ||||||
Luminex Corp | 1,000 | 32 | ||||||
Masimo Corp * | 492 | 113 | ||||||
McKesson Corp | 1,239 | 242 | ||||||
Medpace Holdings Inc * | 300 | 49 | ||||||
Merck & Co Inc | 22,893 | 1,765 | ||||||
Merit Medical Systems Inc * | 600 | 36 | ||||||
Mesa Laboratories Inc | 102 | 25 | ||||||
Mettler-Toledo International Inc * | 210 | 243 | ||||||
Mirati Therapeutics Inc * | 366 | 63 | ||||||
Moderna Inc * | 2,309 | 302 | ||||||
ModivCare Inc * | 205 | 30 | ||||||
Molina Healthcare Inc * | 638 | 149 | ||||||
Natera Inc * | 641 | 65 | ||||||
Nektar Therapeutics, Cl A * | 2,584 | 52 | ||||||
Neogen Corp, Cl B * | 469 | 42 | ||||||
NeoGenomics Inc * | 1,022 | 49 | ||||||
Neurocrine Biosciences Inc * | 928 | 90 | ||||||
Nevro Corp * | 200 | 28 | ||||||
NextGen Healthcare Inc * | 3,016 | 55 | ||||||
Novavax Inc * | 538 | 98 | ||||||
Novocure Ltd * | 900 | 119 | ||||||
NuVasive Inc * | 600 | 39 | ||||||
Omnicell Inc * | 650 | 84 | ||||||
Orthofix Medical Inc * | 972 | 42 | ||||||
Pacific Biosciences of California Inc * | 1,400 | 47 | ||||||
Pacira BioSciences Inc * | 800 | 56 | ||||||
Patterson Cos Inc | 777 | 25 | ||||||
Penumbra Inc * | 450 | 122 | ||||||
PerkinElmer Inc | 1,122 | 144 | ||||||
Pfizer Inc | 50,235 | 1,820 | ||||||
PPD Inc * | 2,100 | 79 | ||||||
PRA Health Sciences Inc * | 698 | 107 | ||||||
Premier Inc, Cl A | 600 | 20 | ||||||
PTC Therapeutics * | 800 | 38 | ||||||
QIAGEN NV * | 2,804 | 137 | ||||||
Quest Diagnostics Inc | 933 | 120 | ||||||
| 236 | SEI Institutional Managed Trust / Semi-Annual Report / March 31, 2021 |
| Description | Shares |
Market Value | ||||||
COMMON STOCK (continued) | ||||||||
Quidel Corp * | 200 | $ | 26 | |||||
Regeneron Pharmaceuticals Inc * | 923 | 437 | ||||||
Repligen Corp * | 588 | 114 | ||||||
ResMed Inc | 1,314 | 255 | ||||||
Sage Therapeutics Inc * | 897 | 67 | ||||||
Sarepta Therapeutics Inc * | 609 | 45 | ||||||
Scholar Rock Holding Corp * | 1,000 | 51 | ||||||
Seagen Inc * | 1,052 | 146 | ||||||
STAAR Surgical Co * | 180 | 19 | ||||||
STERIS PLC | 917 | 175 | ||||||
Stryker Corp | 3,231 | 787 | ||||||
Supernus Pharmaceuticals Inc * | 437 | 11 | ||||||
Syneos Health Inc, Cl A * | 473 | 36 | ||||||
Tandem Diabetes Care Inc * | 400 | 35 | ||||||
Teladoc Health Inc * | 961 | 175 | ||||||
Teleflex Inc | 392 | 163 | ||||||
Tenet Healthcare Corp * | 1,100 | 57 | ||||||
TG Therapeutics Inc * | 1,500 | 72 | ||||||
Thermo Fisher Scientific Inc | 3,657 | 1,669 | ||||||
Turning Point Therapeutics Inc * | 400 | 38 | ||||||
Twist Bioscience Corp * | 400 | 50 | ||||||
Ultragenyx Pharmaceutical Inc * | 476 | 54 | ||||||
United Therapeutics Corp * | 461 | 77 | ||||||
UnitedHealth Group Inc | 8,410 | 3,129 | ||||||
Universal Health Services Inc, Cl B | 598 | 80 | ||||||
US Physical Therapy Inc | 26 | 3 | ||||||
Varian Medical Systems Inc * | 770 | 136 | ||||||
Veeva Systems Inc, Cl A * | 1,170 | 306 | ||||||
Vertex Pharmaceuticals Inc * | 2,428 | 522 | ||||||
Viatris Inc, Cl W * | 8,940 | 125 | ||||||
Vir Biotechnology * | 800 | 41 | ||||||
Waters Corp * | 601 | 171 | ||||||
West Pharmaceutical Services Inc | 570 | 161 | ||||||
Xencor Inc * | 1,609 | 69 | ||||||
Zimmer Biomet Holdings Inc | 1,846 | 296 | ||||||
Zoetis Inc, Cl A | 4,343 | 684 | ||||||
|
| |||||||
| 46,591 | ||||||||
|
| |||||||
Industrials — 0.0% | ||||||||
HMS Holdings Corp * | 500 | 19 | ||||||
KBR Inc | 1,300 | 50 | ||||||
ManTech International Corp/VA, Cl A | 256 | 22 | ||||||
|
| |||||||
| 91 | ||||||||
|
| |||||||
Information Technology — 1.9% | ||||||||
ACI Worldwide Inc * | 592 | 23 | ||||||
Adobe Inc * | 1,281 | 609 | ||||||
Amdocs Ltd | 953 | 67 | ||||||
ANSYS Inc * | 154 | 52 | ||||||
Aspen Technology Inc * | 476 | 69 | ||||||
Autodesk Inc, Cl A * | 463 | 128 | ||||||
Automatic Data Processing Inc | 1,240 | 234 | ||||||
Avalara Inc * | 300 | 40 | ||||||
| Description | Shares |
Market Value | ||||||
COMMON STOCK (continued) | ||||||||
Black Knight Inc * | 400 | $ | 30 | |||||
Blackbaud Inc, Cl A | 100 | 7 | ||||||
Bottomline Technologies DE Inc * | 717 | 32 | ||||||
Broadridge Financial Solutions Inc | 400 | 61 | ||||||
Cadence Design Systems Inc * | 982 | 135 | ||||||
Cass Information Systems Inc | 800 | 37 | ||||||
CDK Global Inc | 1,065 | 58 | ||||||
Citrix Systems Inc | 300 | 42 | ||||||
Cloudflare Inc, Cl A * | 700 | 49 | ||||||
Cognizant Technology Solutions Corp, Cl A | 1,645 | 129 | ||||||
Cognyte Software Ltd * | 600 | 17 | ||||||
CommVault Systems Inc * | 400 | 26 | ||||||
Coupa Software Inc * | 200 | 51 | ||||||
Crowdstrike Holdings Inc, Cl A * | 500 | 91 | ||||||
Datadog Inc, Cl A * | 675 | 56 | ||||||
DocuSign Inc, Cl A * | 500 | 101 | ||||||
Ebix Inc | 100 | 3 | ||||||
EPAM Systems Inc * | 102 | 40 | ||||||
Euronet Worldwide Inc * | 127 | 18 | ||||||
Fastly Inc, Cl A * | 600 | 40 | ||||||
Fidelity National Information Services Inc, Cl B | 1,618 | 228 | ||||||
Fiserv Inc, Cl A * | 1,600 | 190 | ||||||
Five9 Inc * | 300 | 47 | ||||||
FleetCor Technologies Inc * | 205 | 55 | ||||||
Fortinet Inc * | 350 | 65 | ||||||
Gartner Inc * | 500 | 91 | ||||||
Genpact Ltd | 700 | 30 | ||||||
Global Payments Inc | 962 | 194 | ||||||
Guidewire Software Inc, Cl Z * | 500 | 51 | ||||||
HubSpot Inc * | 100 | 45 | ||||||
International Business Machines Corp | 2,850 | 380 | ||||||
Intuit Inc | 1,073 | 411 | ||||||
Jack Henry & Associates Inc | 351 | 53 | ||||||
Manhattan Associates Inc * | 714 | 84 | ||||||
Mastercard Inc, Cl A | 2,652 | 944 | ||||||
Microsoft Corp | 22,084 | 5,207 | ||||||
MicroStrategy Inc, Cl A * | 105 | 71 | ||||||
MongoDB Inc, Cl A * | 200 | 53 | ||||||
NortonLifeLock Inc | 1,406 | 30 | ||||||
Nuance Communications Inc * | 1,126 | 49 | ||||||
Okta Inc, Cl A * | 400 | 88 | ||||||
Oracle Corp, Cl B | 5,396 | 378 | ||||||
PagerDuty Inc * | 1,465 | 59 | ||||||
Palo Alto Networks Inc * | 296 | 95 | ||||||
Paychex Inc | 1,175 | 115 | ||||||
Paycom Software Inc * | 51 | 19 | ||||||
PayPal Holdings Inc * | 3,077 | 747 | ||||||
Pegasystems Inc | 470 | 54 | ||||||
Perspecta Inc | 2,515 | 73 | ||||||
Progress Software Corp | 922 | 41 | ||||||
Proofpoint Inc * | 100 | 13 | ||||||
| SEI Institutional Managed Trust / Semi-Annual Report / March 31, 2021 | 237 |
CONSOLIDATED SCHEDULE OF INVESTMENTS (Unaudited)
March 31, 2021
Multi-Asset Inflation Managed Fund (Continued)
| Description | Shares |
Market Value | ||||||
COMMON STOCK (continued) |
| |||||||
PTC Inc * | 600 | $ | 83 | |||||
QAD Inc, Cl A | 677 | 45 | ||||||
Qualys Inc * | 154 | 16 | ||||||
RingCentral Inc, Cl A * | 200 | 60 | ||||||
salesforce.com Inc * | 2,586 | 548 | ||||||
ServiceNow Inc * | 512 | 256 | ||||||
Slack Technologies Inc, Cl A * | 1,514 | 62 | ||||||
Splunk Inc * | 458 | 62 | ||||||
Square Inc, Cl A * | 1,070 | 243 | ||||||
SS&C Technologies Holdings Inc | 560 | 39 | ||||||
StoneCo Ltd, Cl A * | 700 | 43 | ||||||
Synopsys Inc * | 561 | 139 | ||||||
Teradata Corp * | 1,200 | 46 | ||||||
Trade Desk Inc/The, Cl A * | 200 | 130 | ||||||
Twilio Inc, Cl A * | 500 | 170 | ||||||
Verint Systems Inc * | 600 | 27 | ||||||
Visa Inc, Cl A | 5,087 | 1,077 | ||||||
VMware Inc, Cl A * | 120 | 18 | ||||||
Western Union Co/The | 605 | 15 | ||||||
WEX Inc * | 200 | 42 | ||||||
Workday Inc, Cl A * | 551 | 137 | ||||||
Zoom Video Communications Inc, Cl A * | 552 | 177 | ||||||
Zscaler Inc * | 300 | 52 | ||||||
|
| |||||||
| 15,692 | ||||||||
|
| |||||||
Real Estate — 3.1% |
| |||||||
Acadia Realty Trust ‡ | 527 | 10 | ||||||
Agree Realty Corp ‡ | 900 | 61 | ||||||
Alexander & Baldwin Inc ‡ | 2,738 | 46 | ||||||
Alexandria Real Estate Equities Inc ‡ | 2,014 | 331 | ||||||
American Assets Trust Inc ‡ | 135 | 4 | ||||||
American Campus Communities Inc ‡ | 2,870 | 124 | ||||||
American Homes 4 Rent, Cl A ‡ | 5,494 | 183 | ||||||
American Tower Corp, Cl A ‡ | 8,427 | 2,015 | ||||||
Americold Realty Trust ‡ | 3,500 | 135 | ||||||
Apartment Income Corp ‡ | 3,622 | 155 | ||||||
Apartment Investment and Management Co, Cl A ‡ | 3,422 | 21 | ||||||
Apple Hospitality Inc ‡ | 6,014 | 88 | ||||||
AvalonBay Communities Inc ‡ | 2,953 | 545 | ||||||
Boston Properties Inc ‡ | 3,132 | 317 | ||||||
Brandywine Realty Trust ‡ | 1,921 | 25 | ||||||
Brixmor Property Group Inc ‡ | 5,385 | 109 | ||||||
Brookfield Property Inc, Cl A ‡ | 600 | 11 | ||||||
Camden Property Trust ‡ | 2,503 | 275 | ||||||
CareTrust Inc ‡ | 2,600 | 61 | ||||||
CBRE Group Inc, Cl A *‡ | 6,976 | 552 | ||||||
Colony Capital Inc ‡ | 1,266 | 8 | ||||||
Columbia Property Trust Inc ‡ | 350 | 6 | ||||||
CoreSite Realty Corp ‡ | 586 | 70 | ||||||
Corporate Office Properties Trust ‡ | 3,615 | 95 | ||||||
Cousins Properties Inc ‡ | 2,828 | 100 | ||||||
Crown Castle International Corp ‡ | 7,604 | 1,309 | ||||||
| Description | Shares |
Market Value | ||||||
COMMON STOCK (continued) |
| |||||||
CubeSmart ‡ | 4,481 | $ | 170 | |||||
CyrusOne Inc ‡ | 1,736 | 118 | ||||||
Digital Realty Trust Inc, Cl A ‡ | 4,857 | 684 | ||||||
Douglas Emmett Inc ‡ | 4,369 | 137 | ||||||
Duke Realty Corp ‡ | 6,565 | 275 | ||||||
EastGroup Properties Inc ‡ | 817 | 117 | ||||||
Empire State Realty Trust Inc, Cl A ‡ | 5,128 | 57 | ||||||
EPR Properties, Cl A ‡ | 2,153 | 100 | ||||||
Equinix Inc ‡ | 1,568 | 1,066 | ||||||
Equity Commonwealth ‡ | 650 | 18 | ||||||
Equity LifeStyle Properties Inc ‡ | 3,600 | 229 | ||||||
Equity Residential ‡ | 7,784 | 558 | ||||||
Essential Properties Realty Trust Inc ‡ | 1,802 | 41 | ||||||
Essex Property Trust Inc ‡ | 1,431 | 389 | ||||||
eXp World Holdings Inc *‡ | 1,900 | 87 | ||||||
Extra Space Storage Inc ‡ | 3,181 | 422 | ||||||
Federal Realty Investment Trust ‡ | 1,419 | 144 | ||||||
First Industrial Realty Trust Inc ‡ | 2,830 | 130 | ||||||
Forestar Group Inc *‡ | 4,100 | 95 | ||||||
Four Corners Property Trust Inc ‡ | 2,300 | 63 | ||||||
Franklin Street Properties Corp ‡ | 8,100 | 44 | ||||||
Gaming and Leisure Properties Inc ‡ | 5,101 | 216 | ||||||
Getty Realty Corp ‡ | 1,300 | 37 | ||||||
Global Net Lease Inc ‡ | 1,447 | 26 | ||||||
Healthcare Realty Trust Inc ‡ | 4,304 | 130 | ||||||
Healthcare Trust of America Inc, Cl A ‡ | 6,241 | 172 | ||||||
Healthpeak Properties Inc ‡ | 11,521 | 366 | ||||||
Highwoods Properties Inc ‡ | 2,151 | 92 | ||||||
Host Hotels & Resorts Inc ‡ | 14,088 | 237 | ||||||
Howard Hughes Corp/The *‡ | 1,109 | 106 | ||||||
Hudson Pacific Properties Inc ‡ | 4,182 | 113 | ||||||
Industrial Logistics Properties Trust ‡ | 1,400 | 32 | ||||||
Innovative Industrial Properties Inc, Cl A ‡ | 300 | 54 | ||||||
Invitation Homes Inc ‡ | 10,112 | 323 | ||||||
Iron Mountain Inc ‡ | 6,036 | 223 | ||||||
JBG SMITH Properties ‡ | 3,600 | 114 | ||||||
Jones Lang LaSalle Inc ‡ | 1,024 | 183 | ||||||
Kennedy-Wilson Holdings Inc ‡ | 1,545 | 31 | ||||||
Kilroy Realty Corp ‡ | 2,628 | 172 | ||||||
Kimco Realty Corp ‡ | 6,927 | 130 | ||||||
Kite Realty Group Trust ‡ | 3,400 | 66 | ||||||
Lamar Advertising Co, Cl A ‡ | 1,784 | 168 | ||||||
Lexington Realty Trust, Cl B ‡ | 5,988 | 67 | ||||||
Life Storage Inc ‡ | 1,650 | 142 | ||||||
LTC Properties Inc ‡ | 285 | 12 | ||||||
Macerich Co/The ‡ | 1,197 | 14 | ||||||
Mack-Cali Realty Corp ‡ | 3,324 | 51 | ||||||
Marcus & Millichap Inc *‡ | 600 | 20 | ||||||
Medical Properties Trust Inc ‡ | 8,458 | 180 | ||||||
Mid-America Apartment Communities Inc ‡ | 2,519 | 364 | ||||||
Monmouth Real Estate Investment Corp, Cl A ‡ | 2,406 | 43 | ||||||
| 238 | SEI Institutional Managed Trust / Semi-Annual Report / March 31, 2021 |
| Description | Shares |
Market Value | ||||||
COMMON STOCK (continued) | ||||||||
National Health Investors Inc ‡ | 941 | $ | 68 | |||||
National Retail Properties Inc ‡ | 3,300 | 145 | ||||||
National Storage Affiliates Trust ‡ | 2,043 | 82 | ||||||
Newmark Group Inc, Cl A ‡ | 3,459 | 35 | ||||||
Office Properties Income Trust ‡ | 433 | 12 | ||||||
Omega Healthcare Investors Inc ‡ | 5,274 | 193 | ||||||
Outfront Media Inc ‡ | 2,922 | 64 | ||||||
Paramount Group Inc ‡ | 1,707 | 17 | ||||||
Park Hotels & Resorts Inc ‡ | 6,954 | 150 | ||||||
Pebblebrook Hotel Trust ‡ | 2,977 | 72 | ||||||
Physicians Realty Trust ‡ | 3,578 | 63 | ||||||
Piedmont Office Realty Trust Inc, Cl A ‡ | 66 | 1 | ||||||
PotlatchDeltic Corp ‡ | 2,163 | 114 | ||||||
Prologis Inc ‡ | 13,295 | 1,409 | ||||||
PS Business Parks Inc ‡ | 602 | 93 | ||||||
Public Storage ‡ | 3,165 | 781 | ||||||
QTS Realty Trust Inc, Cl A ‡ | 502 | 31 | ||||||
Rayonier Inc ‡ | 3,008 | 97 | ||||||
Realty Income Corp ‡ | 7,669 | 487 | ||||||
Redfin Corp *‡ | 1,609 | 107 | ||||||
Regency Centers Corp ‡ | 3,449 | 196 | ||||||
Retail Opportunity Investments Corp ‡ | 1,900 | 30 | ||||||
Retail Properties of America Inc, Cl A ‡ | 2,190 | 23 | ||||||
Rexford Industrial Realty Inc ‡ | 2,128 | 107 | ||||||
RLJ Lodging Trust ‡ | 4,599 | 71 | ||||||
Ryman Hospitality Properties Inc *‡ | 972 | 75 | ||||||
Sabra Health Care Inc ‡ | 3,595 | 62 | ||||||
Saul Centers Inc ‡ | 834 | 33 | ||||||
SBA Communications Corp, Cl A ‡ | 1,975 | 548 | ||||||
Service Properties Trust ‡ | 2,918 | 35 | ||||||
Simon Property Group Inc ‡ | 6,531 | 743 | ||||||
SITE Centers Corp ‡ | 185 | 3 | ||||||
SL Green Realty ‡ | 1,753 | 123 | ||||||
Spirit Realty Capital Inc ‡ | 2,141 | 91 | ||||||
St Joe Co/The ‡ | 1,367 | 59 | ||||||
STAG Industrial Inc ‡ | 3,378 | 114 | ||||||
STORE Capital Corp ‡ | 5,355 | 179 | ||||||
Sun Communities Inc ‡ | 1,852 | 278 | ||||||
Sunstone Hotel Investors Inc ‡ | 6,306 | 79 | ||||||
Terreno Realty Corp ‡ | 1,178 | 68 | ||||||
UDR Inc ‡ | 6,488 | 285 | ||||||
Uniti Group Inc ‡ | 4,762 | 53 | ||||||
Universal Health Realty Income Trust ‡ | 400 | 27 | ||||||
Urban Edge Properties ‡ | 3,148 | 52 | ||||||
Ventas Inc ‡ | 8,383 | 447 | ||||||
VEREIT Inc ‡ | 4,024 | 155 | ||||||
VICI Properties Inc ‡ | 8,100 | 229 | ||||||
Vornado Realty Trust ‡ | 3,078 | 140 | ||||||
Washington Real Estate Investment Trust ‡ | 2,778 | 61 | ||||||
Weingarten Realty Investors ‡ | 962 | 26 | ||||||
Welltower Inc ‡ | 8,856 | 634 | ||||||
Weyerhaeuser Co ‡ | 13,592 | 484 | ||||||
| Description | Shares |
Market Value | ||||||
COMMON STOCK (continued) | ||||||||
WP Carey Inc ‡ | 4,179 | $ | 296 | |||||
Xenia Hotels & Resorts Inc *‡ | 2,300 | 45 | ||||||
|
| |||||||
| 25,356 | ||||||||
|
| |||||||
Utilities — 1.6% |
| |||||||
AES Corp/The | 8,142 | 218 | ||||||
Alliant Energy Corp | 3,628 | 197 | ||||||
Ameren Corp | 3,054 | 248 | ||||||
American Electric Power Co Inc | 6,079 | 515 | ||||||
American States Water Co | 600 | 45 | ||||||
American Water Works Co Inc | 1,659 | 249 | ||||||
Atmos Energy Corp | 1,173 | 116 | ||||||
Avangrid Inc | 1,200 | 60 | ||||||
Avista Corp | 400 | 19 | ||||||
Black Hills Corp, Cl A | 1,000 | 67 | ||||||
Brookfield Infrastructure, Cl A | 1,255 | 96 | ||||||
Brookfield Renewable, Cl A | 1,400 | 66 | ||||||
Brookfield Renewable Partners (C) | 856 | 36 | ||||||
California Water Service Group, Cl A | 1,300 | 73 | ||||||
CenterPoint Energy Inc | 7,208 | 163 | ||||||
Chesapeake Utilities Corp | 600 | 70 | ||||||
Clearway Energy Inc, Cl C | 1,319 | 37 | ||||||
CMS Energy Corp | 2,704 | 166 | ||||||
Consolidated Edison Inc | 4,544 | 340 | ||||||
Dominion Energy Inc | 10,007 | 760 | ||||||
DTE Energy Co | 2,733 | 364 | ||||||
Duke Energy Corp | 9,123 | 881 | ||||||
Edison International | 5,080 | 298 | ||||||
Entergy Corp | 2,793 | 278 | ||||||
Essential Utilities Inc | 2,403 | 108 | ||||||
Evergy Inc | 2,501 | 149 | ||||||
Eversource Energy | 4,082 | 353 | ||||||
Exelon Corp | 11,762 | 514 | ||||||
FirstEnergy Corp | 7,122 | 247 | ||||||
Hawaiian Electric Industries Inc | 228 | 10 | ||||||
IDACORP Inc, Cl A | 800 | 80 | ||||||
MDU Resources Group Inc | 3,045 | 96 | ||||||
MGE Energy Inc | 500 | 36 | ||||||
Middlesex Water Co | 800 | 63 | ||||||
National Fuel Gas Co | 337 | 17 | ||||||
New Jersey Resources Corp | 172 | 7 | ||||||
NextEra Energy Inc | 24,844 | 1,878 | ||||||
NiSource Inc | 4,246 | 102 | ||||||
NRG Energy Inc | 2,105 | 79 | ||||||
OGE Energy Corp | 1,715 | 56 | ||||||
ONE Gas Inc | 494 | 38 | ||||||
Ormat Technologies Inc | 400 | 31 | ||||||
PG&E Corp * | 16,661 | 195 | ||||||
Pinnacle West Capital Corp | 1,550 | 126 | ||||||
PNM Resources Inc | 1,652 | 81 | ||||||
Portland General Electric Co | 1,076 | 51 | ||||||
PPL Corp | 9,316 | 269 | ||||||
Public Service Enterprise Group Inc | 5,837 | 351 | ||||||
| SEI Institutional Managed Trust / Semi-Annual Report / March 31, 2021 | 239 |
CONSOLIDATED SCHEDULE OF INVESTMENTS (Unaudited)
March 31, 2021
Multi-Asset Inflation Managed Fund (Continued)
| Description | Shares | Market Value ($ Thousands) | ||||||
COMMON STOCK (continued) |
| |||||||
Sempra Energy | 3,584 | $ | 475 | |||||
SJW Group | 900 | 57 | ||||||
Southern Co/The | 12,824 | 797 | ||||||
Southwest Gas Holdings Inc | 376 | 26 | ||||||
Sunnova Energy International Inc * | 1,100 | 45 | ||||||
UGI Corp | 1,847 | 76 | ||||||
Unitil Corp | 600 | 27 | ||||||
Vistra Corp | 7,078 | 125 | ||||||
WEC Energy Group Inc | 3,415 | 320 | ||||||
Xcel Energy Inc | 6,274 | 417 | ||||||
|
| |||||||
| 12,664 | ||||||||
|
| |||||||
Total Common Stock | ||||||||
(Cost $173,903) ($ Thousands) | 246,184 | |||||||
| Face Amount (Thousands) | ||||||||
CORPORATE OBLIGATIONS — 14.7% |
| |||||||
Communication Services — 1.0% |
| |||||||
AT&T | ||||||||
3.500%, 09/15/2053 (D) | $ | 466 | 429 | |||||
2.750%, 06/01/2031 | 181 | 180 | ||||||
Baidu | ||||||||
3.425%, 04/07/2030 | 201 | 210 | ||||||
Cable One | ||||||||
4.000%, 11/15/2030 (D) | 387 | 383 | ||||||
CCO Holdings | ||||||||
5.000%, 02/01/2028 (D) | 282 | 298 | ||||||
4.000%, 03/01/2023 (D) | 603 | 609 | ||||||
Lumen Technologies | ||||||||
4.500%, 01/15/2029 (D) | 596 | 581 | ||||||
Netflix | ||||||||
5.875%, 11/15/2028 | 812 | 982 | ||||||
T-Mobile USA | ||||||||
3.375%, 04/15/2029 | 196 | 198 | ||||||
2.875%, 02/15/2031 | 374 | 361 | ||||||
2.625%, 04/15/2026 | 186 | 189 | ||||||
TWDC Enterprises 18 MTN | ||||||||
4.125%, 06/01/2044 | 288 | 326 | ||||||
Verizon Communications | ||||||||
5.012%, 04/15/2049 | 11 | 14 | ||||||
4.862%, 08/21/2046 | 279 | 334 | ||||||
3.400%, 03/22/2041 | 1,193 | 1,206 | ||||||
2.987%, 10/30/2056 (D) | 109 | 96 | ||||||
ViacomCBS | ||||||||
4.950%, 01/15/2031 | 223 | 264 | ||||||
3.375%, 07/08/2030 | 1,395 | 1,387 | ||||||
|
| |||||||
| 8,047 | ||||||||
|
| |||||||
| Description | Face Amount (Thousands) | Market Value ($ Thousands) | ||||||||
CORPORATE OBLIGATIONS (continued) |
| |||||||||
Consumer Discretionary — 2.1% |
| |||||||||
1011778 BC ULC / New Red Finance Inc | ||||||||||
3.500%, 02/15/2029 (D) | $ | 813 | $ | 792 | ||||||
Alibaba Group Holding | ||||||||||
2.125%, 02/09/2031 | 1,209 | 1,151 | ||||||||
AutoNation | ||||||||||
4.750%, 06/01/2030 | 148 | 170 | ||||||||
Booking Holdings | ||||||||||
4.625%, 04/13/2030 | 1,080 | 1,257 | ||||||||
Clarios Global | ||||||||||
4.375%, 05/15/2026 (D) | EUR | 155 | 189 | |||||||
Cox Communications | ||||||||||
2.950%, 06/30/2023 (D) | $ | 240 | 251 | |||||||
CSC Holdings | ||||||||||
6.750%, 11/15/2021 | 160 | 164 | ||||||||
Expedia Group | ||||||||||
6.250%, 05/01/2025 (D) | 24 | 28 | ||||||||
Falabella | ||||||||||
3.750%, 10/30/2027 | 300 | 323 | ||||||||
General Motors | ||||||||||
6.800%, 10/01/2027 | 201 | 249 | ||||||||
6.125%, 10/01/2025 | 145 | 170 | ||||||||
General Motors Financial | ||||||||||
5.100%, 01/17/2024 | 858 | 949 | ||||||||
Globo Comunicacao e Participacoes | ||||||||||
4.875%, 01/22/2030 (D) | 413 | 416 | ||||||||
Harley-Davidson Financial Services | ||||||||||
3.350%, 06/08/2025 (D) | 1,308 | 1,370 | ||||||||
Hilton Domestic Operating | ||||||||||
4.000%, 05/01/2031 (D) | 1,074 | 1,074 | ||||||||
Kimberly-Clark de Mexico | ||||||||||
2.431%, 07/01/2031 (D) | 300 | 292 | ||||||||
Las Vegas Sands | ||||||||||
3.200%, 08/08/2024 | 350 | 365 | ||||||||
2.900%, 06/25/2025 | 600 | 614 | ||||||||
Lear | ||||||||||
3.800%, 09/15/2027 | 97 | 106 | ||||||||
3.500%, 05/30/2030 | 312 | 325 | ||||||||
Levi Strauss | ||||||||||
3.500%, 03/01/2031 (D) | 401 | 387 | ||||||||
Marriott International | ||||||||||
5.750%, 05/01/2025 | 68 | 78 | ||||||||
Mattel | ||||||||||
3.750%, 04/01/2029 (D) | 339 | 343 | ||||||||
3.375%, 04/01/2026 (D) | 338 | 349 | ||||||||
MercadoLibre | ||||||||||
2.375%, 01/14/2026 | 200 | 198 | ||||||||
Newell Brands | ||||||||||
4.875%, 06/01/2025 | 71 | 78 | ||||||||
4.700%, 04/01/2026 | 289 | 320 | ||||||||
Nissan Motor | ||||||||||
4.345%, 09/17/2027 (D) | 1,086 | 1,181 | ||||||||
| 240 | SEI Institutional Managed Trust / Semi-Annual Report / March 31, 2021 |
| Description | Face Amount (Thousands) | Market Value ($ Thousands) | ||||||
CORPORATE OBLIGATIONS (continued) |
| |||||||
Ralph Lauren | ||||||||
2.950%, 06/15/2030 | $ | 1,299 | $ | 1,339 | ||||
Ross Stores | ||||||||
4.700%, 04/15/2027 | 842 | 958 | ||||||
Royal Caribbean Cruises | ||||||||
11.500%, 06/01/2025 (D) | 525 | 612 | ||||||
10.875%, 06/01/2023 (D) | 292 | 336 | ||||||
Time Warner Cable | ||||||||
4.500%, 09/15/2042 | 330 | 352 | ||||||
Wynn Macau | ||||||||
5.625%, 08/26/2028 (D) | 348 | 364 | ||||||
|
| |||||||
| 17,150 | ||||||||
|
| |||||||
Consumer Staples — 1.0% |
| |||||||
Albertsons | ||||||||
3.500%, 03/15/2029 (D) | 408 | 389 | ||||||
Altria Group | ||||||||
4.800%, 02/14/2029 | 167 | 192 | ||||||
3.400%, 05/06/2030 | 745 | 777 | ||||||
Anheuser-Busch InBev Worldwide | ||||||||
5.550%, 01/23/2049 | 755 | 970 | ||||||
4.600%, 06/01/2060 | 444 | 499 | ||||||
BAT Capital | ||||||||
4.700%, 04/02/2027 | 475 | 534 | ||||||
2.726%, 03/25/2031 | 521 | 506 | ||||||
2.259%, 03/25/2028 | 1,337 | 1,315 | ||||||
BRF GmbH | ||||||||
4.350%, 09/29/2026 | 299 | 306 | ||||||
Cencosud | ||||||||
5.150%, 02/12/2025 | 724 | 808 | ||||||
Coca-Cola Femsa | ||||||||
2.750%, 01/22/2030 | 326 | 330 | ||||||
1.850%, 09/01/2032 | 320 | 292 | ||||||
InRetail Consumer | ||||||||
3.250%, 03/22/2028 (D) | 321 | 319 | ||||||
Tyson Foods | ||||||||
3.950%, 08/15/2024 | 715 | 781 | ||||||
Virgolino de Oliveira Finance | ||||||||
10.500%, 01/28/2018 (D)(E) | 660 | 7 | ||||||
|
| |||||||
| 8,025 | ||||||||
|
| |||||||
Energy — 1.5% | ||||||||
Baker Hughes a GE | ||||||||
3.337%, 12/15/2027 | 501 | 535 | ||||||
BP Capital Markets America | ||||||||
2.939%, 06/04/2051 | 1,261 | 1,122 | ||||||
Cenovus Energy | ||||||||
5.375%, 07/15/2025 | 248 | 278 | ||||||
4.250%, 04/15/2027 | 52 | 56 | ||||||
Chevron USA | ||||||||
5.250%, 11/15/2043 | 593 | 765 | ||||||
| Description | Face Amount (Thousands) | Market Value ($ Thousands) | ||||||
CORPORATE OBLIGATIONS (continued) |
| |||||||
Enbridge Energy Partners | ||||||||
7.375%, 10/15/2045 | $ | 688 | $ | 971 | ||||
Energy Transfer | ||||||||
6.250%, 04/15/2049 | 413 | 483 | ||||||
Energy Transfer Operating | ||||||||
5.200%, 02/01/2022 | 465 | 477 | ||||||
Eni | ||||||||
4.250%, 05/09/2029 (D) | 900 | 1,004 | ||||||
Husky Energy | ||||||||
4.400%, 04/15/2029 | 1,334 | 1,423 | ||||||
Marathon Petroleum | ||||||||
6.500%, 03/01/2041 | 175 | 232 | ||||||
5.125%, 12/15/2026 | 227 | 265 | ||||||
Oleoducto Central | ||||||||
4.000%, 07/14/2027 (D) | 438 | 463 | ||||||
ONEOK | ||||||||
6.350%, 01/15/2031 | 142 | 178 | ||||||
Pertamina Persero MTN | ||||||||
6.450%, 05/30/2044 | 450 | 557 | ||||||
Petroleos Mexicanos | ||||||||
6.840%, 01/23/2030 | 181 | 184 | ||||||
Petroleos Mexicanos MTN | ||||||||
6.750%, 09/21/2047 | 380 | 326 | ||||||
Saudi Arabian Oil | ||||||||
2.250%, 11/24/2030 (D) | 328 | 314 | ||||||
Tengizchevroil Finance International | ||||||||
3.250%, 08/15/2030 (D) | 262 | 261 | ||||||
TransCanada PipeLines | ||||||||
6.100%, 06/01/2040 | 915 | 1,185 | ||||||
Transocean Poseidon | ||||||||
6.875%, 02/01/2027 (D) | 294 | 272 | ||||||
Valero Energy | ||||||||
2.700%, 04/15/2023 | 488 | 507 | ||||||
Williams | ||||||||
3.900%, 01/15/2025 | 217 | 235 | ||||||
|
| |||||||
| 12,093 | ||||||||
|
| |||||||
Financials — 5.1% | ||||||||
ABN AMRO Bank | ||||||||
4.750%, 07/28/2025 (D) | 269 | 301 | ||||||
AIB Group MTN | ||||||||
4.750%, 10/12/2023 (D) | 300 | 328 | ||||||
Aircastle | ||||||||
5.250%, 08/11/2025 (D) | 456 | 497 | ||||||
5.000%, 04/01/2023 | 37 | 39 | ||||||
4.400%, 09/25/2023 | 454 | 484 | ||||||
4.250%, 06/15/2026 | 62 | 66 | ||||||
4.125%, 05/01/2024 | 181 | 191 | ||||||
2.850%, 01/26/2028 (D) | 904 | 860 | ||||||
Alleghany | ||||||||
3.625%, 05/15/2030 | 931 | 1,003 | ||||||
| SEI Institutional Managed Trust / Semi-Annual Report / March 31, 2021 | 241 |
CONSOLIDATED SCHEDULE OF INVESTMENTS (Unaudited)
March 31, 2021
Multi-Asset Inflation Managed Fund (Continued)
| Description | Face Amount (Thousands) | Market Value ($ Thousands) | ||||||
CORPORATE OBLIGATIONS (continued) |
| |||||||
American Express | ||||||||
3.622%, VAR ICE LIBOR USD 3 Month+3.428%(F) | $ | 66 | $ | 66 | ||||
3.469%, VAR ICE LIBOR USD 3 Month+3.285%(F) | 521 | 516 | ||||||
Australia & New Zealand Banking Group | ||||||||
4.400%, 05/19/2026 (D) | 400 | 448 | ||||||
Aviation Capital Group | ||||||||
5.500%, 12/15/2024 (D) | 455 | 509 | ||||||
4.875%, 10/01/2025 (D) | 182 | 198 | ||||||
4.375%, 01/30/2024 (D) | 161 | 171 | ||||||
4.125%, 08/01/2025 (D) | 6 | 6 | ||||||
3.875%, 05/01/2023 (D) | 395 | 412 | ||||||
3.500%, 11/01/2027 (D) | 165 | 170 | ||||||
2.875%, 01/20/2022 (D) | 75 | 76 | ||||||
1.950%, 01/30/2026 (D) | 442 | 430 | ||||||
Banco de Credito del Peru MTN | ||||||||
3.125%, VAR US Treas Yield Curve Rate T Note Const Mat 5 Yr+3.000%, 07/01/2030 (D)(F) | 755 | 755 | ||||||
Banco Santander | ||||||||
5.179%, 11/19/2025 | 1,200 | 1,365 | ||||||
Banco Santander Mexico Institucion de Banca Multiple Grupo Financiero Santand | ||||||||
5.375%, 04/17/2025 (D) | 364 | 409 | ||||||
Bank of America | ||||||||
6.500%, VAR ICE LIBOR USD 3 Month+4.174%(F) | 362 | 405 | ||||||
6.300%, VAR ICE LIBOR USD 3 Month+4.553%(F) | 233 | 268 | ||||||
Bank of America MTN | ||||||||
3.124%, VAR ICE LIBOR USD 3 Month+1.160%, 01/20/2023 (F) | 1,200 | 1,226 | ||||||
Bank of New York Mellon | ||||||||
4.700%, VAR US Treas Yield Curve Rate T Note Const Mat 5 Yr+4.358%(F) | 203 | 220 | ||||||
Barclays | ||||||||
3.684%, 01/10/2023 | 695 | 711 | ||||||
BNP Paribas | ||||||||
1.323%, VAR United States Secured Overnight Financing Rate+1.004%, 01/13/2027 (D)(F) | 320 | 313 | ||||||
Capital One Financial | ||||||||
3.991%, VAR ICE LIBOR USD 3 Month+3.800%(F) | 403 | 401 | ||||||
2.600%, 05/11/2023 | 416 | 433 | ||||||
CDBL Funding 1 MTN | ||||||||
3.500%, 10/24/2027 | 620 | 657 | ||||||
| Description | Face Amount (Thousands) | Market Value ($ Thousands) | ||||||
CORPORATE OBLIGATIONS (continued) |
| |||||||
Charles Schwab | ||||||||
5.375%, VAR US Treas Yield Curve Rate T Note Const Mat 5 Yr+4.971%(F) | $ | 409 | $ | 453 | ||||
4.000%, VAR US Treas Yield Curve Rate T Note Const Mat 5 Yr+3.168%(F) | 756 | 765 | ||||||
China Cinda 2020 I Management MTN | ||||||||
3.125%, 03/18/2030 | 635 | 640 | ||||||
CITIC MTN | ||||||||
2.850%, 02/25/2030 | 343 | 340 | ||||||
Citigroup | ||||||||
5.950%, VAR ICE LIBOR USD 3 Month+4.068%(F) | 311 | 326 | ||||||
4.672%, VAR ICE LIBOR USD 3 Month+4.478%(F) | 283 | 284 | ||||||
4.289%, VAR ICE LIBOR USD 3 Month+4.095%(F) | 320 | 318 | ||||||
4.000%, VAR US Treas Yield Curve Rate T Note Const Mat 5 Yr+3.597%(F) | 359 | 363 | ||||||
Cooperatieve Rabobank UA | ||||||||
4.375%, 08/04/2025 | 657 | 728 | ||||||
Credit Suisse Group | ||||||||
7.500%, VAR USD Swap Semi 30/360 5 Yr Curr+4.598%(D)(F) | 200 | 216 | ||||||
7.500%, VAR USD Swap Semi 30/360 5 Yr Curr+4.600%(F) | 645 | 682 | ||||||
6.375%, VAR US Treas Yield Curve Rate T Note Const Mat 5 Yr+4.822%(D)(F) | 365 | 389 | ||||||
Danske Bank | ||||||||
3.244%, VAR ICE LIBOR USD 3 Month+1.591%, 12/20/2025 (D) | 900 | 958 | ||||||
Deutsche Bank NY | ||||||||
3.961%, VAR United States Secured Overnight Financing Rate+2.581%, 11/26/2025 | 315 | 341 | ||||||
2.129%, VAR United States Secured Overnight Financing Rate+1.870%, 11/24/2026 | 347 | 348 | ||||||
Discover Bank | ||||||||
4.682%, VAR USD Swap Semi 30/360 5 Yr Curr+1.730%, 08/09/2028 | 475 | 507 | ||||||
Discover Financial Services | ||||||||
6.125%, VAR US Treas Yield Curve Rate T Note Const Mat 5 Yr+5.783%(F) | 1,308 | 1,452 | ||||||
Fifth Third Bancorp | ||||||||
4.500%, VAR US Treas Yield Curve Rate T Note Const Mat 5 Yr+4.215%(F) | 247 | 262 | ||||||
| 242 | SEI Institutional Managed Trust / Semi-Annual Report / March 31, 2021 |
| Description | Face Amount (Thousands) | Market Value ($ Thousands) | ||||||
CORPORATE OBLIGATIONS (continued) |
| |||||||
Goldman Sachs Group MTN | ||||||||
2.905%, VAR ICE LIBOR USD 3 Month+0.990%, 07/24/2023 | $ | 728 | $ | 749 | ||||
1.790%, VAR ICE LIBOR USD 3 Month+1.600%, 11/29/2023 | 900 | 926 | ||||||
Guardian Life Insurance of America | ||||||||
4.850%, 01/24/2077 (D) | 145 | 168 | ||||||
HSBC Holdings | ||||||||
4.292%, VAR ICE LIBOR USD 3 Month+1.348%, 09/12/2026 | 261 | 288 | ||||||
4.041%, VAR ICE LIBOR USD 3 Month+1.546%, 03/13/2028 | 552 | 604 | ||||||
ING Groep | ||||||||
1.726%, VAR United States Secured Overnight Financing Rate+1.005%, 04/01/2027 | 1,191 | 1,189 | ||||||
JPMorgan Chase | ||||||||
4.005%, VAR ICE LIBOR USD 3 Month+3.800%(F) | 289 | 290 | ||||||
3.682%, VAR ICE LIBOR USD 3 Month+3.470%(F) | 349 | 348 | ||||||
3.522%, VAR ICE LIBOR USD 3 Month+3.320%(F) | 171 | 170 | ||||||
2.083%, VAR United States Secured Overnight Financing Rate+1.850%, 04/22/2026 | 605 | 621 | ||||||
Lincoln National | ||||||||
4.200%, 03/15/2022 | 355 | 368 | ||||||
MetLife | ||||||||
5.700%, 06/15/2035 | 80 | 108 | ||||||
Metropolitan Life Global Funding I | ||||||||
3.875%, 04/11/2022 (D) | 275 | 285 | ||||||
Morgan Stanley | ||||||||
4.051%, VAR ICE LIBOR USD 3 Month+3.810%(F) | 883 | 883 | ||||||
3.851%, VAR ICE LIBOR USD 3 Month+3.610%(F) | 84 | 84 | ||||||
Morgan Stanley MTN | ||||||||
5.000%, 11/24/2025 | 171 | 197 | ||||||
3.591%, VAR ICE LIBOR USD 3 Month+1.340%, 07/22/2028 | 854 | 931 | ||||||
Natwest Group | ||||||||
8.625%, VAR USD Swap Semi 30/360 5 Yr Curr+7.598%(F) | 425 | 435 | ||||||
2.523%, VAR ICE LIBOR USD 3 Month+2.320%(F) | 600 | 585 | ||||||
Navient | ||||||||
6.625%, 07/26/2021 | 770 | 784 | ||||||
Navient MTN | ||||||||
7.250%, 01/25/2022 | 52 | 54 | ||||||
OEC Finance | ||||||||
7.125%, 12/26/2046 (D) | 240 | 38 | ||||||
| Description | Face Amount (Thousands) | Market Value ($ Thousands) | ||||||
CORPORATE OBLIGATIONS (continued) |
| |||||||
Santander Holdings USA | ||||||||
4.400%, 07/13/2027 | $ | 405 | $ | 450 | ||||
SLM | ||||||||
4.200%, 10/29/2025 | 699 | 734 | ||||||
Standard Chartered | ||||||||
7.750%, VAR USD Swap Semi 30/360 5 Yr Curr+5.723%(D)(F) | 200 | 217 | ||||||
7.500%, VAR USD Swap Semi 30/360 5 Yr Curr+6.301%(F) | 412 | 431 | ||||||
1.722%, VAR ICE LIBOR USD 3 Month+1.510%(D)(F) | 400 | 374 | ||||||
Standard Chartered MTN | ||||||||
4.300%, 02/19/2027 (D) | 475 | 514 | ||||||
State Street | ||||||||
2.901%, VAR United States Secured Overnight Financing Rate+2.600%, 03/30/2026 | 63 | 67 | ||||||
Synchrony Financial | ||||||||
4.500%, 07/23/2025 | 945 | 1,046 | ||||||
Truist Financial | ||||||||
5.100%, VAR US Treas Yield Curve Rate T Note Const Mat 10 Yr+4.349%(F) | 829 | 903 | ||||||
UBS Group | ||||||||
7.125%, VAR USSW5YF+5.883%(F) | 606 | 617 | ||||||
UniCredit | ||||||||
2.569%, VAR US Treas Yield Curve Rate T Note Const Mat 1 Yr+2.300%, 09/22/2026 (D) | 1,335 | 1,340 | ||||||
US Bancorp | ||||||||
5.300%, VAR ICE LIBOR USD 3 Month+2.914%(F) | 474 | 520 | ||||||
Voya Financial | ||||||||
5.650%, VAR ICE LIBOR USD 3 Month+3.580%, 05/15/2053 | 258 | 276 | ||||||
Wells Fargo | ||||||||
3.900%, VAR US Treas Yield Curve Rate T Note Const Mat 5 Yr+3.453%(F) | 327 | 330 | ||||||
2.188%, VAR United States Secured Overnight Financing Rate+2.000%, 04/30/2026 | 433 | 447 | ||||||
|
| |||||||
| 41,677 | ||||||||
|
| |||||||
Health Care — 0.5% | ||||||||
Banner Health | ||||||||
1.897%, 01/01/2031 | 250 | 238 | ||||||
Centene | ||||||||
4.250%, 12/15/2027 | 146 | 153 | ||||||
Cigna | ||||||||
4.375%, 10/15/2028 | 382 | 435 | ||||||
4.125%, 11/15/2025 | 286 | 319 | ||||||
3.750%, 07/15/2023 | 87 | 93 | ||||||
| SEI Institutional Managed Trust / Semi-Annual Report / March 31, 2021 | 243 |
CONSOLIDATED SCHEDULE OF INVESTMENTS (Unaudited)
March 31, 2021
Multi-Asset Inflation Managed Fund (Continued)
| Description | Face Amount (Thousands) | Market Value ($ Thousands) | ||||||
CORPORATE OBLIGATIONS (continued) |
| |||||||
CVS Health | ||||||||
5.050%, 03/25/2048 | $ | 513 | $ | 628 | ||||
Sutter Health | ||||||||
1.321%, 08/15/2025 | 630 | 628 | ||||||
Takeda Pharmaceutical | ||||||||
4.400%, 11/26/2023 | 820 | 896 | ||||||
Utah Acquisition Sub | ||||||||
3.950%, 06/15/2026 | 437 | 481 | ||||||
|
| |||||||
| 3,871 | ||||||||
|
| |||||||
Industrials — 0.9% | ||||||||
AerCap Ireland Capital DAC | ||||||||
6.500%, 07/15/2025 | 190 | 222 | ||||||
4.450%, 04/03/2026 | 173 | 187 | ||||||
Air Lease | ||||||||
3.875%, 07/03/2023 | 75 | 80 | ||||||
3.625%, 04/01/2027 | 40 | 42 | ||||||
Air Lease MTN | ||||||||
4.250%, 02/01/2024 | 296 | 321 | ||||||
2.875%, 01/15/2026 | 244 | 253 | ||||||
Alfa | ||||||||
5.250%, 03/25/2024 (D) | 660 | 722 | ||||||
Allison Transmission | ||||||||
3.750%, 01/30/2031 (D) | 605 | 586 | ||||||
Delta Air Lines | ||||||||
4.750%, 10/20/2028 (D) | 475 | 516 | ||||||
4.500%, 10/20/2025 (D) | 409 | 436 | ||||||
Embraer Netherlands Finance BV | ||||||||
6.950%, 01/17/2028 (D) | 236 | 259 | ||||||
5.400%, 02/01/2027 | 670 | 698 | ||||||
ENA Master Trust | ||||||||
4.000%, 05/19/2048 (D) | 272 | 276 | ||||||
GE Capital European Funding Unlimited MTN | ||||||||
4.625%, 02/22/2027 | EUR | 150 | 220 | |||||
GFL Environmental | ||||||||
3.500%, 09/01/2028 (D) | $ | 610 | 592 | |||||
Lima Metro Line 2 Finance | ||||||||
5.875%, 07/05/2034 | 234 | 274 | ||||||
4.350%, 04/05/2036 (D) | 225 | 238 | ||||||
Odebrecht Holdco Finance | ||||||||
0.000%, 09/10/2058 (B)(D) | 294 | 7 | ||||||
Rumo Luxembourg Sarl | ||||||||
5.875%, 01/18/2025 (D) | 409 | 432 | ||||||
Southwest Airlines | ||||||||
5.250%, 05/04/2025 | 513 | 584 | ||||||
TransDigm | ||||||||
6.250%, 03/15/2026 (D) | 405 | 429 | ||||||
Westinghouse Air Brake Technologies | ||||||||
3.200%, 06/15/2025 | 141 | 149 | ||||||
|
| |||||||
| 7,523 | ||||||||
|
| |||||||
| Description | Face Amount (Thousands) | Market Value ($ Thousands) | ||||||
CORPORATE OBLIGATIONS (continued) |
| |||||||
Information Technology — 1.0% |
| |||||||
Broadcom | ||||||||
5.000%, 04/15/2030 | $ | 243 | $ | 276 | ||||
4.150%, 11/15/2030 | 855 | 924 | ||||||
4.110%, 09/15/2028 | 688 | 751 | ||||||
3.500%, 01/15/2028 | 161 | 171 | ||||||
3.500%, 02/15/2041 (D) | 558 | 531 | ||||||
Infor | ||||||||
1.750%, 07/15/2025 (D) | 340 | 343 | ||||||
Mastercard | ||||||||
3.300%, 03/26/2027 | 330 | 362 | ||||||
Micron Technology | ||||||||
4.185%, 02/15/2027 | 1,182 | 1,312 | ||||||
NXP BV | ||||||||
2.700%, 05/01/2025 (D) | 106 | 111 | ||||||
Oracle | ||||||||
2.500%, 04/01/2025 | 834 | 875 | ||||||
Prosus | ||||||||
3.680%, 01/21/2030 (D) | 569 | 587 | ||||||
SK Hynix | ||||||||
2.375%, 01/19/2031 (D) | 290 | 274 | ||||||
Tencent Holdings MTN | ||||||||
3.240%, 06/03/2050 (D) | 439 | 403 | ||||||
2.390%, 06/03/2030 | 320 | 309 | ||||||
1.810%, 01/26/2026 (D) | 649 | 651 | ||||||
|
| |||||||
| 7,880 | ||||||||
|
| |||||||
Materials — 1.1% | ||||||||
Alpek | ||||||||
4.250%, 09/18/2029 (D) | 203 | 215 | ||||||
3.250%, 02/25/2031 (D) | 483 | 478 | ||||||
Ardagh Metal Packaging Finance USA | ||||||||
3.250%, 09/01/2028 (D) | 538 | 532 | ||||||
Axalta Coating Systems | ||||||||
3.375%, 02/15/2029 (D) | 648 | 632 | ||||||
Cemex | ||||||||
3.875%, 07/11/2031 (D) | 610 | 595 | ||||||
DuPont de Nemours | ||||||||
4.493%, 11/15/2025 | 690 | 779 | ||||||
4.205%, 11/15/2023 | 690 | 749 | ||||||
Eastman Chemical Co | ||||||||
3.800%, 03/15/2025 | 318 | 346 | ||||||
Fresnillo | ||||||||
4.250%, 10/02/2050 (D) | 1,335 | 1,312 | ||||||
GUSAP III | ||||||||
4.250%, 01/21/2030 (D) | 675 | 710 | ||||||
Indonesia Asahan Aluminium Persero | ||||||||
4.750%, 05/15/2025 (D) | 342 | 372 | ||||||
Industrias Penoles | ||||||||
4.750%, 08/06/2050 (D) | 295 | 305 | ||||||
INEOS Quattro Finance 2 | ||||||||
2.500%, 01/15/2026 (D) | EUR | 333 | 391 | |||||
| 244 | SEI Institutional Managed Trust / Semi-Annual Report / March 31, 2021 |
| Description | Face Amount (Thousands) | Market Value ($ Thousands) | ||||||
CORPORATE OBLIGATIONS (continued) |
| |||||||
Ingevity | ||||||||
3.875%, 11/01/2028 (D) | $ | 537 | $ | 521 | ||||
Inversiones CMPC | ||||||||
4.375%, 05/15/2023 | 389 | 410 | ||||||
Nutrition & Biosciences | ||||||||
1.832%, 10/15/2027 (D) | 232 | 227 | ||||||
Suzano Austria GmbH | ||||||||
3.750%, 01/15/2031 | 173 | 179 | ||||||
Volcan Cia Minera SAA | ||||||||
4.375%, 02/11/2026 (D) | 170 | 175 | ||||||
|
| |||||||
| 8,928 | ||||||||
|
| |||||||
Real Estate — 0.0% | ||||||||
Host Hotels & Resorts | ||||||||
3.750%, 10/15/2023 | 16 | 17 | ||||||
Rexford Industrial Realty | ||||||||
2.125%, 12/01/2030 | 266 | 248 | ||||||
|
| |||||||
| 265 | ||||||||
|
| |||||||
Utilities — 0.5% | ||||||||
AES Panama Generation Holdings SRL | ||||||||
4.375%, 05/31/2030 (D) | 304 | 315 | ||||||
Chile Electricity PEC | ||||||||
0.000%, 01/25/2028 (B)(D) | 523 | 426 | ||||||
Comision Federal de Electricidad | ||||||||
3.348%, 02/09/2031 (D) | 687 | 660 | ||||||
Enel Chile | ||||||||
4.875%, 06/12/2028 | 650 | 752 | ||||||
Israel Electric | ||||||||
5.000%, 11/12/2024 (D) | 792 | 889 | ||||||
NextEra Energy Capital Holdings | ||||||||
2.750%, 05/01/2025 | 170 | 179 | ||||||
Perusahaan Listrik Negara MTN | ||||||||
6.150%, 05/21/2048 | 230 | 280 | ||||||
Star Energy Geothermal Darajat II | ||||||||
4.850%, 10/14/2038 (D) | 340 | 370 | ||||||
Terraform Global Operating | ||||||||
6.125%, 03/01/2026 (D) | 74 | 76 | ||||||
|
| |||||||
| 3,947 | ||||||||
|
| |||||||
Total Corporate Obligations | ||||||||
(Cost $116,868) ($ Thousands) | 119,406 | |||||||
|
| |||||||
MORTGAGE-BACKED SECURITIES — 9.5% |
| |||||||
Agency Mortgage-Backed Obligations — 1.8% |
| |||||||
FHLMC CMO, Ser 2017-4693, Cl SL, IO | ||||||||
6.044%, VAR ICE LIBOR USD 1 Month+6.150%,06/15/2047 | 1,701 | 407 | ||||||
| Description | Face Amount (Thousands) | Market Value ($ Thousands) | ||||||
MORTGAGE-BACKED SECURITIES (continued) |
| |||||||
FHLMC CMO, Ser 2017-4727, Cl SA, IO | ||||||||
6.094%, VAR ICE LIBOR USD 1 Month+6.200%,11/15/2047 | $ | 1,362 | $ | 294 | ||||
FHLMC CMO, Ser 2020-4976, Cl MI, IO | ||||||||
4.500%,05/25/2050 | 3,161 | 577 | ||||||
FHLMC CMO, Ser 2020-4981, Cl HS, IO | ||||||||
5.991%, VAR ICE LIBOR USD 1 Month+6.100%,06/25/2050 | 4,291 | 728 | ||||||
FHLMC CMO, Ser 2020-5015, Cl BI, IO | ||||||||
4.000%,09/25/2050 | 2,421 | 447 | ||||||
FNMA CMO, Ser 2011-131, Cl ST, IO | ||||||||
6.431%, VAR ICE LIBOR USD 1 Month+6.540%,12/25/2041 | 858 | 170 | ||||||
FNMA CMO, Ser 2014-17, Cl SA, IO | ||||||||
5.941%, VAR ICE LIBOR USD 1 Month+6.050%,04/25/2044 | 2,175 | 532 | ||||||
FNMA CMO, Ser 2014-78, Cl SE, IO | ||||||||
5.991%, VAR ICE LIBOR USD 1 Month+6.100%,12/25/2044 | 1,388 | 267 | ||||||
FNMA CMO, Ser 2016-77, Cl DS, IO | ||||||||
5.891%, VAR ICE LIBOR USD 1 Month+6.000%,10/25/2046 | 1,384 | 296 | ||||||
FNMA CMO, Ser 2017-62, Cl AS, IO | ||||||||
6.041%, VAR ICE LIBOR USD 1 Month+6.150%,08/25/2047 | 1,632 | 342 | ||||||
FNMA CMO, Ser 2017-81, Cl SA, IO | ||||||||
6.091%, VAR ICE LIBOR USD 1 Month+6.200%,10/25/2047 | 1,731 | 407 | ||||||
FNMA CMO, Ser 2017-97, Cl LS, IO | ||||||||
6.091%, VAR ICE LIBOR USD 1 Month+6.200%,12/25/2047 | 1,939 | 482 | ||||||
FNMA CMO, Ser 2020-26, Cl GS, IO | ||||||||
5.891%, VAR ICE LIBOR USD 1 Month+6.000%,05/25/2050 | 2,188 | 379 | ||||||
FNMA CMO, Ser 2020-89, Cl KI, IO | ||||||||
4.000%,12/25/2050 | 5,097 | 846 | ||||||
FNMA TBA | ||||||||
2.500%,04/01/2043 | 7,725 | 7,922 | ||||||
GNMA CMO, Ser 2017-122, Cl SA, IO | ||||||||
6.089%, VAR ICE LIBOR USD 1 Month+6.200%,08/20/2047 | 1,185 | 263 | ||||||
GNMA CMO, Ser 2017-134, Cl SE, IO | ||||||||
6.089%, VAR ICE LIBOR USD 1 Month+6.200%,09/20/2047 | 1,113 | 223 | ||||||
|
| |||||||
| 14,582 | ||||||||
|
| |||||||
Non-Agency Mortgage-Backed Obligations — 7.7% |
| |||||||
Alternative Loan Trust, Ser 2005-20CB, Cl 3A6 | ||||||||
5.500%,07/25/2035 | 61 | 54 | ||||||
Alternative Loan Trust, Ser 2006-24CB, Cl A16 | ||||||||
5.750%,08/25/2036 | 251 | 196 | ||||||
| SEI Institutional Managed Trust / Semi-Annual Report / March 31, 2021 | 245 |
CONSOLIDATED SCHEDULE OF INVESTMENTS (Unaudited)
March 31, 2021
Multi-Asset Inflation Managed Fund (Continued)
| Description | Face Amount (Thousands) | Market Value ($ Thousands) | ||||||
MORTGAGE-BACKED SECURITIES (continued) |
| |||||||
Alternative Loan Trust, Ser 2006-28CB, Cl A14 | ||||||||
6.250%,10/25/2036 | $ | 218 | $ | 161 | ||||
Alternative Loan Trust, Ser 2006-J1, Cl 1A13 | ||||||||
5.500%,02/25/2036 | 137 | 124 | ||||||
Ashford Hospitality Trust, Ser 2018-KEYS, Cl A | ||||||||
1.106%, VAR ICE LIBOR USD 1 Month+1.000%,06/15/2035 (D) | 1,000 | 999 | ||||||
BAMLL Commercial Mortgage Securities Trust, Ser 2013-WBRK, Cl D | ||||||||
3.534%,03/10/2037 (D)(F) | 365 | 327 | ||||||
BAMLL Commercial Mortgage Securities Trust, Ser 2017-SCH, Cl AF | ||||||||
1.106%, VAR ICE LIBOR USD 1 Month+1.000%,11/15/2033 (D) | 1,610 | 1,572 | ||||||
BBCMS Mortgage Trust, Ser 2020-BID, Cl A | ||||||||
2.246%, VAR ICE LIBOR USD 1 Month+2.140%,10/15/2037 (D) | 744 | 748 | ||||||
Bellemeade Re, Ser 2018-3A, Cl M1B | ||||||||
1.959%, VAR ICE LIBOR USD 1 Month+1.850%,10/25/2028 (D) | 311 | 313 | ||||||
Bellemeade Re, Ser 2019-1A, Cl M1B | ||||||||
1.859%, VAR ICE LIBOR USD 1 Month+1.750%,03/25/2029 (D) | 675 | 668 | ||||||
Bellemeade Re, Ser 2019-2A, Cl M1C | ||||||||
2.109%, VAR ICE LIBOR USD 1 Month+2.000%,04/25/2029 (D) | 481 | 483 | ||||||
Bellemeade Re, Ser 2019-3A, Cl M1C | ||||||||
2.059%, VAR ICE LIBOR USD 1 Month+1.950%,07/25/2029 (D) | 340 | 339 | ||||||
Bellemeade Re, Ser 2019-3A, Cl M1B | ||||||||
1.709%, VAR ICE LIBOR USD 1 Month+1.600%,07/25/2029 (D) | 466 | 468 | ||||||
Bellemeade Re, Ser 2019-4A, Cl M1B | ||||||||
2.109%, VAR ICE LIBOR USD 1 Month+2.000%,10/25/2029 (D) | 675 | 676 | ||||||
Bellemeade Re, Ser 2020-2A, Cl M1B | ||||||||
3.309%, VAR ICE LIBOR USD 1 Month+3.200%,08/26/2030 (D) | 403 | 406 | ||||||
Bellemeade Re, Ser 2020-3A, Cl M1B | ||||||||
2.959%, VAR ICE LIBOR USD 1 Month+2.850%,10/25/2030 (D) | 266 | 269 | ||||||
Bellemeade Re, Ser 2020-4A, Cl M2A | ||||||||
2.709%, VAR ICE LIBOR USD 1 Month+2.600%,06/25/2030 (D) | 320 | 320 | ||||||
Bellemeade Re, Ser 2021-1A, Cl M1C | ||||||||
2.967%, VAR SOFR30A+2.950%,03/25/2031 (D) | 437 | 437 | ||||||
BHMS, Ser 2018-ATLS, Cl A | ||||||||
1.356%, VAR ICE LIBOR USD 1 Month+1.250%,07/15/2035 (D) | 774 | 774 | ||||||
| Description | Face Amount (Thousands) | Market Value ($ Thousands) | ||||||
MORTGAGE-BACKED SECURITIES (continued) |
| |||||||
BX Trust, Ser 2018-EXCL, Cl A | ||||||||
1.194%, VAR ICE LIBOR USD 1 Month+1.088%,09/15/2037 (D) | $ | 867 | $ | 841 | ||||
CCUBS Commercial Mortgage Trust, Ser 2017-C1, Cl A4 | ||||||||
3.544%,11/15/2050 (F) | 1,115 | 1,220 | ||||||
CFCRE Commercial Mortgage Trust, Ser 2016-C4, Cl A4 | ||||||||
3.283%,05/10/2058 | 670 | 725 | ||||||
CGRBS Commercial Mortgage Trust, Ser 2013-VN05, Cl A | ||||||||
3.369%,03/13/2035 (D) | 915 | 954 | ||||||
Chase Mortgage Finance Trust, Ser 2007- S5, Cl 1A17 | ||||||||
6.000%,07/25/2037 | 108 | 75 | ||||||
Chase Mortgage Finance, Ser 2019-CL1, Cl M3 | ||||||||
2.209%, VAR ICE LIBOR USD 1 Month+2.100%,04/25/2047 (D) | 140 | 142 | ||||||
CHL Mortgage Pass-Through Trust, Ser 2006-10, Cl 1A8 | ||||||||
6.000%,05/25/2036 | 150 | 107 | ||||||
CHL Mortgage Pass-Through Trust, Ser 2006-13, Cl 1A19 | ||||||||
6.250%,09/25/2036 | 70 | 47 | ||||||
Citigroup Commercial Mortgage Trust, Ser 2013-GC11, Cl D | ||||||||
4.419%,04/10/2046 (D)(F) | 343 | 346 | ||||||
Citigroup Commercial Mortgage Trust, Ser 2015-GC27, Cl A5 | ||||||||
3.137%,02/10/2048 | 980 | 1,046 | ||||||
Citigroup Commercial Mortgage Trust, Ser 2015-GC35, Cl A4 | ||||||||
3.818%,11/10/2048 | 435 | 479 | ||||||
Citigroup Commercial Mortgage Trust, Ser 2016-GC36, Cl A5 | ||||||||
3.616%,02/10/2049 | 540 | 590 | ||||||
Citigroup Commercial Mortgage Trust, Ser 2017-P8, Cl AS | ||||||||
3.789%, (F) | 411 | 450 | ||||||
CLNY Trust, Ser 2019-IKPR, Cl D | ||||||||
2.131%, VAR ICE LIBOR USD 1 Month+2.025%,11/15/2038 (D) | 680 | 661 | ||||||
COMM Mortgage Trust, Ser 2010-C1, Cl D | ||||||||
5.759%,07/10/2046 (D)(F) | 740 | 752 | ||||||
COMM Mortgage Trust, Ser 2013-CR12, Cl A4 | ||||||||
4.046%,10/10/2046 | 870 | 935 | ||||||
COMM Mortgage Trust, Ser 2015-3BP, Cl A | ||||||||
3.178%,02/10/2035 (D) | 200 | 212 | ||||||
COMM Mortgage Trust, Ser 2015-CR24, Cl A5 | ||||||||
3.696%,08/10/2048 | 545 | 598 | ||||||
| 246 | SEI Institutional Managed Trust / Semi-Annual Report / March 31, 2021 |
| Description | Face Amount (Thousands) | Market Value ($ Thousands) | ||||||
MORTGAGE-BACKED SECURITIES (continued) |
| |||||||
COMM Mortgage Trust, | ||||||||
3.350%,02/10/2048 | $ | 250 | $ | 269 | ||||
Commercial Mortgage Pass-Through Certificates, Ser 2013-SFS, Cl A1 | ||||||||
1.873%,04/12/2035 (D) | 112 | 112 | ||||||
Connecticut Avenue Securities Trust, | ||||||||
2.509%, VAR ICE LIBOR USD 1 | ||||||||
Month+2.400%,04/25/2031 (D) | 242 | 242 | ||||||
Connecticut Avenue Securities Trust, | ||||||||
2.409%, VAR ICE LIBOR USD 1 | ||||||||
Month+2.300%,08/25/2031 (D) | 146 | 146 | ||||||
Connecticut Avenue Securities Trust, | ||||||||
2.259%, VAR ICE LIBOR USD 1 | ||||||||
Month+2.150%,09/25/2031 (D) | 76 | 76 | ||||||
Connecticut Avenue Securities Trust, | ||||||||
2.209%, VAR ICE LIBOR USD 1 | ||||||||
Month+2.100%,06/25/2039 (D) | 218 | 218 | ||||||
Connecticut Avenue Securities Trust, | ||||||||
2.109%, VAR ICE LIBOR USD 1 | ||||||||
Month+2.000%,07/25/2039 (D) | 120 | 120 | ||||||
Connecticut Avenue Securities Trust, | ||||||||
2.209%, VAR ICE LIBOR USD 1 | ||||||||
Month+2.100%,09/25/2039 (D) | 310 | 311 | ||||||
Connecticut Avenue Securities Trust, | ||||||||
2.209%, VAR ICE LIBOR USD 1 | ||||||||
Month+2.100%,10/25/2039 (D) | 564 | 564 | ||||||
Connecticut Avenue Securities Trust, Ser 2020-R02, Cl 2M2 | ||||||||
2.109%, VAR ICE LIBOR USD 1 | ||||||||
Month+2.000%,01/25/2040 (D) | 457 | 456 | ||||||
CSAIL Commercial Mortgage Trust, | ||||||||
3.504%,06/15/2057 | 436 | 470 | ||||||
CSAIL Commercial Mortgage Trust, | ||||||||
3.808%,11/15/2048 | 1,090 | 1,196 | ||||||
DBWF Mortgage Trust, | ||||||||
1.140%, VAR ICE LIBOR USD 1 | ||||||||
Month+1.030%,12/19/2030 (D) | 761 | 760 | ||||||
Deutsche Alt-A Securities Mortgage Loan Trust, Ser 2006-AR4, Cl A2 | ||||||||
0.489%, VAR ICE LIBOR USD 1 | ||||||||
Month+0.380%,12/25/2036 | 391 | 194 | ||||||
Eagle RE, Ser 2020-1, Cl M1A | ||||||||
1.009%, VAR ICE LIBOR USD 1 | ||||||||
Month+0.900%,01/25/2030 (D) | 790 | 788 | ||||||
| Description | Face Amount (Thousands) | Market Value ($ Thousands) | ||||||
MORTGAGE-BACKED SECURITIES (continued) |
| |||||||
FHLMC Multifamily Structured Credit Risk, | ||||||||
2.017%, VAR | ||||||||
SOFR30A+2.000%,01/25/2051 (D) | $ | 152 | $ | 152 | ||||
FHLMC STACR Remic Trust, | ||||||||
1.809%, VAR ICE LIBOR USD 1 | ||||||||
Month+1.700%,01/25/2050 (D) | 667 | 665 | ||||||
FHLMC STACR Remic Trust, | ||||||||
2.817%, VAR | ||||||||
SOFR30A+2.800%,10/25/2050 (D) | 740 | 744 | ||||||
FHLMC STACR Trust, | ||||||||
2.159%, VAR ICE LIBOR USD 1 | ||||||||
Month+2.050%,07/25/2049 (D) | 52 | 52 | ||||||
FHLMC STACR Trust, | ||||||||
2.059%, VAR ICE LIBOR USD 1 | ||||||||
Month+1.950%,10/25/2049 (D) | 467 | 467 | ||||||
FHLMC STACR Trust, | ||||||||
2.259%, VAR ICE LIBOR USD 1 | ||||||||
Month+2.150%,11/25/2048 (D) | 363 | 359 | ||||||
FHLMC STACR Trust, | ||||||||
1.959%, VAR ICE LIBOR USD 1 | ||||||||
Month+1.850%,09/25/2049 (D) | 319 | 317 | ||||||
FHLMC Structured Agency Credit Risk Debt Notes, Ser 2017-DNA3, Cl M2 | ||||||||
2.609%, VAR ICE LIBOR USD 1 | ||||||||
Month+2.500%,03/25/2030 | 450 | 459 | ||||||
FHLMC Structured Agency Credit Risk Debt Notes, Ser 2017-HQA1, Cl M2 | ||||||||
3.659%, VAR ICE LIBOR USD 1 | ||||||||
Month+3.550%,08/25/2029 | 633 | 649 | ||||||
FHLMC Structured Agency Credit Risk Debt Notes, Ser 2017-HQA2, Cl M2B | ||||||||
2.759%, VAR ICE LIBOR USD 1 | ||||||||
Month+2.650%,12/25/2029 | 649 | 653 | ||||||
FHLMC Structured Agency Credit Risk Debt Notes, Ser 2017-HQA2, Cl M2 | ||||||||
2.759%, VAR ICE LIBOR USD 1 | ||||||||
Month+2.650%,12/25/2029 | 230 | 231 | ||||||
FHLMC Structured Agency Credit Risk Debt Notes, Ser 2017-HQA3, Cl M2 | ||||||||
2.459%, VAR ICE LIBOR USD 1 | ||||||||
Month+2.350%,04/25/2030 | 684 | 693 | ||||||
First Horizon Alternative Mortgage | ||||||||
Securities Trust, Ser 2006-FA3, Cl A9 | ||||||||
6.000%,07/25/2036 | 147 | 101 | ||||||
FNMA Connecticut Avenue Securities, | ||||||||
Ser 2015-C01, Cl 1M2 | ||||||||
Month+4.300%,02/25/2025 | 257 | 260 | ||||||
| SEI Institutional Managed Trust / Semi-Annual Report / March 31, 2021 | 247 |
CONSOLIDATED SCHEDULE OF INVESTMENTS (Unaudited)
March 31, 2021
Multi-Asset Inflation Managed Fund (Continued)
| Description | Face Amount (Thousands) | Market Value ($ Thousands) | ||||||
MORTGAGE-BACKED SECURITIES (continued) |
| |||||||
FNMA Connecticut Avenue Securities, | ||||||||
Ser 2015-C02, Cl 2M2 | ||||||||
Month+4.000%,05/25/2025 | $ | 98 | $ | 99 | ||||
FNMA Connecticut Avenue Securities, | ||||||||
Ser 2015-C02, Cl 1M2 | ||||||||
Month+4.000%,05/25/2025 | 342 | 346 | ||||||
FNMA Connecticut Avenue Securities, | ||||||||
Ser 2015-C03, Cl 1M2 | ||||||||
Month+5.000%,07/25/2025 | 343 | 352 | ||||||
FNMA Connecticut Avenue Securities, | ||||||||
Ser 2015-C03, Cl 2M2 | ||||||||
Month+5.000%,07/25/2025 | 207 | 209 | ||||||
FNMA Connecticut Avenue Securities, | ||||||||
Ser 2015-C04, Cl 1M2 | ||||||||
Month+5.700%,04/25/2028 | 143 | 152 | ||||||
FNMA Connecticut Avenue Securities, | ||||||||
Ser 2016-C05, Cl 2M2 | ||||||||
Month+4.450%,01/25/2029 | 471 | 490 | ||||||
FNMA Connecticut Avenue Securities, | ||||||||
Ser 2016-C06, Cl 1M2 | ||||||||
Month+4.250%,04/25/2029 | 179 | 187 | ||||||
FNMA Connecticut Avenue Securities, | ||||||||
Ser 2016-C07, Cl 2M2 | ||||||||
Month+4.350%,05/25/2029 | 158 | 165 | ||||||
FNMA Connecticut Avenue Securities, | ||||||||
Ser 2017-C01, Cl 1M2 | ||||||||
Month+3.550%, 07/25/2029 | 480 | 494 | ||||||
FNMA Connecticut Avenue Securities, | ||||||||
Ser 2017-C02, Cl 2M2C | ||||||||
Month+3.650%,09/25/2029 | 719 | 740 | ||||||
FNMA Connecticut Avenue Securities, | ||||||||
Ser 2017-C04, Cl 2M2 | ||||||||
Month+2.850%,11/25/2029 | 595 | 602 | ||||||
GS Mortgage Securities Trust, | ||||||||
Ser 2011- GC5, Cl D | 13 | 8 | ||||||
GS Mortgage Securities Trust, | ||||||||
Ser 2014- GC18, Cl D | 679 | 222 | ||||||
GS Mortgage Securities Trust, | ||||||||
Ser 2014- GC22, Cl A5 3.862%,06/10/2047 | 789 | 855 | ||||||
| Description | Face Amount (Thousands) | Market Value ($ Thousands) | ||||||
MORTGAGE-BACKED SECURITIES (continued) |
| |||||||
GS Mortgage Securities Trust, | ||||||||
Ser 2018- GS9, Cl A4 | $ | 1,350 | $ | 1,510 | ||||
GS Mortgage Securities Trust, | ||||||||
Ser 2019- BOCA, Cl A | ||||||||
Month+1.200%,06/15/2038 (D) | 331 | 332 | ||||||
GS Mortgage Securities Trust, | ||||||||
Ser 2019-SMP, Cl A | ||||||||
Month+1.150%,08/15/2032 (D) | 450 | 450 | ||||||
Home RE, Ser 2020-1, Cl M1B | ||||||||
3.359%, VAR ICE LIBOR USD 1 | ||||||||
Month+3.250%,10/25/2030 (D) | 620 | 631 | ||||||
HomeBanc Mortgage Trust, | ||||||||
Ser 2005-1,Cl A1 | ||||||||
0.609%, VAR ICE LIBOR USD 1 | ||||||||
Month+0.500%,03/25/2035 | 94 | 85 | ||||||
JPMBB Commercial Mortgage SecuritiesTrust, |
| |||||||
Ser 23014-C21, Cl A5 | 925 | 998 | ||||||
JPMBB Commercial Mortgage Securities Trust,2 |
| |||||||
Ser 2014-C22, Cl XA, | 17,692 | 420 | ||||||
JPMBB Commercial Mortgage Securities Trust, |
| |||||||
Ser 2015-C30, Cl A5 | 540 | 594 | ||||||
JPMBB Commercial Mortgage Securities Trust, |
| |||||||
Ser 2015-C31, Cl A3 | 1,092 | 1,192 | ||||||
JPMCC Commercial Mortgage Securities Trust, |
| |||||||
Ser 2017-JP7, Cl XA,IO | 6,625 | 311 | ||||||
JPMorgan Chase Commercial Mortgage Securities Trust, |
| |||||||
Ser 2014-C20, Cl A5 3.805%,07/15/2047 | 900 | 971 | ||||||
JPMorgan Chase Commercial Mortgage Securities Trust, |
| |||||||
Ser 2020-NNN, Cl EFL | ||||||||
Month+1.850%,01/16/2037 (D) | 67 | 66 | ||||||
LB-UBS Commercial Mortgage Trust, | ||||||||
Ser 2006-C6, Cl AJ 5.452%,09/15/2039 (F) | 211 | 122 | ||||||
LSTAR Commercial Mortgage Trust, | ||||||||
Ser 2016-4, Cl A2 2.579%,03/10/2049 (D) | 853 | 866 | ||||||
Morgan Stanley Bank of America Merrill Lynch Trust, |
| |||||||
Ser 2014-C16, Cl A5 | 920 | 993 | ||||||
Morgan Stanley Capital I Trust, | ||||||||
Ser 2015- XLF2, Cl SNMA | ||||||||
Month+1.950%,11/15/2026 (D) | 204 | 177 | ||||||
| 248 | SEI Institutional Managed Trust / Semi-Annual Report / March 31, 2021 |
| Description | Face Amount (Thousands) | Market Value ($ Thousands) | ||||||
MORTGAGE-BACKED SECURITIES (continued) |
| |||||||
Morgan Stanley Capital I Trust, Ser 2016- UB12, Cl A4 | ||||||||
3.596%, 12/15/2049 | $ | 835 | $ | 908 | ||||
Mortgage Insurance-Linked Notes, Ser 2019-1, Cl M1 | ||||||||
2.009%, VAR ICE LIBOR USD 1 Month+1.900%, 11/26/2029 (D) | 553 | 554 | ||||||
Natixis Commercial Mortgage Securities Trust, Ser 2018-850T, Cl A | ||||||||
0.890%, VAR ICE LIBOR USD 1 Month+0.784%, 07/15/2033 (D) | 910 | 904 | ||||||
Natixis Commercial Mortgage Securities Trust, Ser 2019-MILE, Cl A | ||||||||
1.606%, VAR ICE LIBOR USD 1 Month+1.500%, 07/15/2036 (D) | 313 | 314 | ||||||
Oaktown Re V, Ser 2020-2A, Cl M1B 3.709%, VAR ICE LIBOR USD 1 | ||||||||
Month+3.600%, 10/25/2030 (D) | 1,107 | 1,125 | ||||||
PMT Credit Risk Transfer Trust, Ser 2019- 1R, Cl A | ||||||||
2.115%, VAR ICE LIBOR USD 1 Month+2.000%, 03/27/2024 (D) | 148 | 141 | ||||||
PMT Credit Risk Transfer Trust, Ser 2019- 2R, Cl A | ||||||||
2.859%, VAR ICE LIBOR USD 1 Month+2.750%, 05/27/2023 (D) | 315 | 311 | ||||||
PMT Credit Risk Transfer Trust, Ser 2019- 3R, Cl A | ||||||||
2.809%, VAR ICE LIBOR USD 1 Month+2.700%, 10/27/2022 (D) | 93 | 94 | ||||||
PMT Credit Risk Transfer Trust, Ser 2020- 1R, Cl A | ||||||||
2.459%, VAR ICE LIBOR USD 1 Month+2.350%, 02/27/2023 (D) | 314 | 312 | ||||||
Radnor RE, Ser 2019-1, Cl M1B 2.059%, VAR ICE LIBOR USD 1 | ||||||||
Month+1.950%, 02/25/2029 (D) | 423 | 424 | ||||||
Radnor RE, Ser 2019-2, Cl M1B 1.859%, VAR ICE LIBOR USD 1 | ||||||||
Month+1.750%, 06/25/2029 (D) | 486 | 485 | ||||||
Radnor RE, Ser 2020-1, Cl M1A 1.059%, VAR ICE LIBOR USD 1 | ||||||||
Month+0.950%, 02/25/2030 (D) | 289 | 289 | ||||||
Radnor RE, Ser 2020-2, Cl M1C 4.709%, VAR ICE LIBOR USD 1 | ||||||||
Month+4.600%, 10/25/2030 (D) | 446 | 455 | ||||||
STACR Trust, Ser 2018-DNA3, Cl M2 2.209%, VAR ICE LIBOR USD 1 | ||||||||
Month+2.100%, 09/25/2048 (D) | 295 | 294 | ||||||
Starwood Retail Property Trust, Ser 2014- STAR, Cl A | ||||||||
1.576%, VAR ICE LIBOR USD 1 Month+1.470%, 11/15/2027 (D) | 1,611 | 1,184 | ||||||
| Description | Face Amount (Thousands) | Market Value ($ Thousands) | ||||||
MORTGAGE-BACKED SECURITIES (continued) |
| |||||||
Traingle Re, Ser 2020-1, Cl M1B 4.009%, VAR ICE LIBOR USD 1 | ||||||||
Month+3.900%, 10/25/2030 (D) | $ | 1,274 | $ | 1,294 | ||||
Traingle Re, Ser 2021-1, Cl M1B 3.109%, VAR ICE LIBOR USD 1 | ||||||||
Month+3.000%, 08/25/2033 (D) | 455 | 455 | ||||||
UBS Commercial Mortgage Trust, Ser 2018- C10, Cl A4 | ||||||||
4.313%, 05/15/2051 | 1,155 | 1,310 | ||||||
UBS Commercial Mortgage Trust, Ser 2018- C8, Cl A4 | ||||||||
3.983%, 02/15/2051 | 900 | 998 | ||||||
UBS Commercial Mortgage Trust, Ser 2018- C9, Cl A4 | ||||||||
4.117%, (F) | 1,410 | 1,574 | ||||||
UBS-Barclays Commercial Mortgage Trust, Ser 2012-C4, Cl A5 | ||||||||
2.850%, 12/10/2045 | 596 | 614 | ||||||
Wells Fargo Commercial Mortgage Trust, Ser 2015-SG1, Cl C | ||||||||
4.463%, (F) | 441 | 418 | ||||||
Wells Fargo Commercial Mortgage Trust, Ser 2015-SG1, Cl A4 | ||||||||
3.789%, 09/15/2048 | 483 | 522 | ||||||
Wells Fargo Commercial Mortgage Trust, Ser 2016-C35, Cl XA, IO | ||||||||
1.922%, (F) | 3,707 | 279 | ||||||
Wells Fargo Commercial Mortgage Trust, Ser 2016-NXS6, Cl C | ||||||||
4.316%, (F) | 925 | 965 | ||||||
Wells Fargo Commercial Mortgage Trust, Ser 2018-C48, Cl A5 | ||||||||
4.302%, 01/15/2052 | 106 | 120 | ||||||
Wells Fargo Credit Risk Transfer Securities Trust, Ser 2015-WF1, Cl 2M2 | ||||||||
5.609%, VAR ICE LIBOR USD 1 Month+5.500%, 11/25/2025 (D) | 82 | 66 | ||||||
Wells Fargo Credit Risk Transfer Securities Trust, Ser 2015-WF1, Cl 1M2 | ||||||||
5.359%, VAR ICE LIBOR USD 1 Month+5.250%, 11/25/2025 (D) | 277 | 220 | ||||||
|
| |||||||
| 62,506 | ||||||||
|
| |||||||
Total Mortgage-Backed Securities (Cost $75,729) ($ Thousands) | 77,088 | |||||||
|
| |||||||
| SEI Institutional Managed Trust / Semi-Annual Report / March 31, 2021 | 249 |
CONSOLIDATED SCHEDULE OF INVESTMENTS (Unaudited)
March 31, 2021
Multi-Asset Inflation Managed Fund (Continued)
| Description | Face Amount (Thousands) | Market Value ($ Thousands) | ||||||
U.S. GOVERNMENT AGENCY OBLIGATIONS — 6.6% |
| |||||||
FFCB | ||||||||
0.440%, VAR US Treasury 3 Month Bill Money Market Yield+0.420%, 11/07/2022 | $ | 1,200 | $ | 1,207 | ||||
0.390%, VAR United States Secured Overnight Financing Rate+0.380%, 05/08/2023 | 7,900 | 7,962 | ||||||
0.320%, VAR United States Secured Overnight Financing Rate+0.310%, 11/07/2022 | 2,500 | 2,511 | ||||||
0.300%, 09/01/2023 | 300 | 300 | ||||||
0.290%, VAR US Treasury 3 Month Bill Money Market Yield+0.270%, 05/16/2022 | 3,000 | 3,007 | ||||||
0.145%, VAR United States Secured Overnight Financing Rate+0.135%, 11/06/2023 | 2,000 | 2,004 | ||||||
0.100%, VAR United States Secured Overnight Financing Rate+0.090%, 09/23/2022 | 500 | 500 | ||||||
0.070%, VAR United States Secured Overnight Financing Rate+0.060%, 01/13/2023 | 1,400 | 1,401 | ||||||
FHLB | ||||||||
0.620%, 02/26/2026 | 200 | 196 | ||||||
0.600%, 04/28/2023 | 1,000 | 1,000 | ||||||
FHLB DN(A) | ||||||||
0.330%, 06/18/2009 (B) | 2,000 | 2,000 | ||||||
FHLMC | ||||||||
0.450%, 05/26/2023 | 1,000 | 1,001 | ||||||
0.400%, 05/24/2024 | 400 | 399 | ||||||
0.375%, 05/05/2023 | 1,000 | 1,004 | ||||||
0.375%, 07/21/2025 | 1,400 | 1,377 | ||||||
0.350%, 01/27/2023 | 1,200 | 1,201 | ||||||
FHLMC MTN | ||||||||
0.200%, VAR United States Secured Overnight Financing Rate+0.190%, 06/02/2022 | 1,000 | 1,002 | ||||||
0.160%, VAR United States Secured Overnight Financing Rate+0.150%, 03/04/2022 | 2,000 | 2,003 | ||||||
0.155%, VAR United States Secured Overnight Financing Rate+0.145%, 12/09/2021 | 1,500 | 1,501 | ||||||
0.140%, VAR United States Secured Overnight Financing Rate+0.130%, 08/05/2022 | 2,600 | 2,604 | ||||||
| Description | Face Amount (Thousands) | Market Value ($ Thousands) | ||||||
U.S. GOVERNMENT AGENCY OBLIGATIONS (continued) |
| |||||||
FNMA | ||||||||
0.625%, 04/22/2025 | $ | 1,300 | $ | 1,296 | ||||
0.500%, 06/17/2025 | 1,500 | 1,485 | ||||||
0.400%, 07/20/2023 | 400 | 400 | ||||||
0.400%, VAR United States Secured Overnight Financing Rate+0.390%, 04/15/2022 | 2,100 | 2,108 | ||||||
0.375%, 06/14/2024 | 700 | 700 | ||||||
0.370%, VAR United States Secured Overnight Financing Rate+0.360%, 01/20/2022 | 2,300 | 2,307 | ||||||
0.360%, VAR United States Secured Overnight Financing Rate+0.350%, 04/07/2022 | 3,800 | 3,813 | ||||||
0.330%, VAR United States Secured Overnight Financing Rate+0.320%, 10/22/2021 | 1,800 | 1,803 | ||||||
0.310%, VAR United States Secured Overnight Financing Rate+0.300%, 01/27/2022 | 1,700 | 1,704 | ||||||
0.250%, 05/22/2023 | 1,500 | 1,502 | ||||||
0.250%, 07/10/2023 | 1,100 | 1,101 | ||||||
0.250%, 11/27/2023 | 100 | 100 | ||||||
0.120%, VAR United States Secured Overnight Financing Rate+0.110%, 03/04/2022 | 1,000 | 1,001 | ||||||
|
| |||||||
Total U.S. Government Agency Obligations | 53,500 | |||||||
|
| |||||||
ASSET-BACKED SECURITIES — 1.9% | ||||||||
Automotive — 0.5% | ||||||||
Avis Budget Rental Car Funding AESOP, Ser 2016-1A, Cl A | ||||||||
2.990%, 06/20/2022 (D) | 323 | 324 | ||||||
Avis Budget Rental Car Funding AESOP, Ser 2018-1A, Cl A | ||||||||
3.700%, 09/20/2024 (D) | 930 | 991 | ||||||
Avis Budget Rental Car Funding AESOP, Ser 2018-2A, Cl A | ||||||||
4.000%, 03/20/2025 (D) | 1,080 | 1,171 | ||||||
Exeter Automobile Receivables Trust, Ser 2019-3A, Cl B | ||||||||
2.580%, 08/15/2023 (D) | 553 | 555 | ||||||
First Investors Auto Owner Trust, Ser 2020- 1A, Cl A | ||||||||
1.490%, 01/15/2025 (D) | 296 | 298 | ||||||
Flagship Credit Auto Trust, Ser 2016-4, Cl D | ||||||||
3.890%, 11/15/2022 (D) | 439 | 444 | ||||||
| 250 | SEI Institutional Managed Trust / Semi-Annual Report / March 31, 2021 |
��
| Description | Face Amount (Thousands) | Market Value ($ Thousands) | ||||||
ASSET-BACKED SECURITIES (continued) |
| |||||||
Hertz Vehicle Financing II, Ser 2017-1A, Cl A | ||||||||
2.960%, 10/25/2021 (D) | $ | 183 | $ | 184 | ||||
Hertz Vehicle Financing II, Ser 2018-1A, Cl A | ||||||||
3.290%, 02/25/2024 (D) | 74 | 74 | ||||||
Hertz Vehicle Financing II, Ser 2019-1A, Cl A | ||||||||
3.710%, 03/25/2023 (D) | 85 | 85 | ||||||
Hertz Vehicle Financing II, Ser 2019-2A, Cl A | ||||||||
3.420%, 05/25/2025 (D) | 112 | 112 | ||||||
|
| |||||||
| 4,238 | ||||||||
|
| |||||||
Credit Cards — 0.2% | ||||||||
Brex Commercial Charge Card Master Trust, Ser 2021-1, Cl A | ||||||||
2.090%, 07/17/2024 (D) | 437 | 437 | ||||||
World Financial Network Credit Card Master Trust, Ser 2018-B, Cl M | ||||||||
3.810%, 07/15/2025 | 710 | 720 | ||||||
World Financial Network Credit Card Master Trust, Ser 2019-B, Cl M | ||||||||
3.040%, 04/15/2026 | 770 | 790 | ||||||
|
| |||||||
| 1,947 | ||||||||
|
| |||||||
Other Asset-Backed Securities — 1.2% |
| |||||||
Affirm Asset Securitization Trust, Ser 2020- A, Cl A | ||||||||
2.100%, 02/18/2025 (D) | 552 | 558 | ||||||
Ballyrock CLO 15, Ser 2021-1A, Cl C | ||||||||
3.266%, VAR ICE LIBOR USD 3 Month+3.100%, 04/15/2034 (D) | 600 | 600 | ||||||
Dryden 77 CLO, Ser 2020-77A, Cl A | ||||||||
2.182%, VAR ICE LIBOR USD 3 Month+2.000%, 05/20/2031 (D) | 500 | 502 | ||||||
Dryden 78 CLO, Ser 2020-78A, Cl C | ||||||||
2.173%, VAR ICE LIBOR USD 3 Month+1.950%, 04/17/2033 (D) | 620 | 624 | ||||||
Dryden 78 CLO, Ser 2020-78A, Cl D | ||||||||
3.223%, VAR ICE LIBOR USD 3 Month+3.000%, 04/17/2033 (D) | 320 | 318 | ||||||
Elevation CLO, Ser 2020-11A, Cl C | ||||||||
2.441%, VAR ICE LIBOR USD 3 Month+2.200%, 04/15/2033 (D) | 550 | 550 | ||||||
Goldentree Loan Management US CLO 7, Ser 2020-7A, Cl A | ||||||||
2.124%, VAR ICE LIBOR USD 3 Month+1.900%, 04/20/2031 (D) | 755 | 755 | ||||||
Hardee’s Funding, Ser 2018-1A, Cl A23 | ||||||||
5.710%, 06/20/2048 (D) | 390 | 432 | ||||||
Hardee’s Funding, Ser 2020-1A, Cl A2 | ||||||||
3.981%, 12/20/2050 (D) | 271 | 280 | ||||||
HFX, Ser 2017-1A | ||||||||
3.647%, 03/15/2035 | 830 | 867 | ||||||
| Description | Face Amount (Thousands) | Market Value ($ Thousands) | ||||||
ASSET-BACKED SECURITIES (continued) |
| |||||||
Invitation Homes Trust, Ser 2018-SFR2, Cl C | ||||||||
1.386%, VAR ICE LIBOR USD 1 Month+1.280%, 06/17/2037 (D) | $ | 228 | $ | 229 | ||||
Invitation Homes Trust, Ser 2018-SFR3, Cl C | ||||||||
1.408%, VAR ICE LIBOR USD 1 Month+1.300%, 07/17/2037 (D) | 400 | 401 | ||||||
Kayne CLO 7, Ser 2020-7A, Cl C | ||||||||
2.223%, VAR ICE LIBOR USD 3 Month+2.000%, 04/17/2033 (D) | 280 | 282 | ||||||
Magnetite XXVI, Ser 2020-26A, Cl A | ||||||||
1.991%, VAR ICE LIBOR USD 3 Month+1.750%, 07/15/2030 (D) | 1,042 | 1,045 | ||||||
Marlette Funding Trust, Ser 2018-4A, Cl A | ||||||||
3.710%, 12/15/2028 (D) | 6 | 6 | ||||||
Marlette Funding Trust, Ser 2020-1A, Cl A | ||||||||
2.240%, 03/15/2030 (D) | 61 | 61 | ||||||
Neighborly Issuer, Ser 2021-1A, Cl A2 | ||||||||
3.584%, 04/30/2051 (D) | 329 | 330 | ||||||
OCP CLO, Ser 2020-18A, Cl A | ||||||||
2.024%, VAR ICE LIBOR USD 3 Month+1.800%, 04/20/2030 (D) | 758 | 758 | ||||||
Prosper Marketplace Issuance Trust, Ser 2019-3A, Cl A | ||||||||
3.190%, 07/15/2025 (D) | 8 | 9 | ||||||
SoFi Consumer Loan Program Trust, Ser 2017-6, Cl A2 | ||||||||
2.820%, 11/25/2026 (D) | 25 | 25 | ||||||
SoFi Consumer Loan Program, Ser 2017-5, Cl A2 | ||||||||
2.780%, 09/25/2026 (D) | 114 | 115 | ||||||
SoFi Consumer Loan Program, Ser 2018-3, Cl A2 | ||||||||
3.670%, 08/25/2027 (D) | 60 | 60 | ||||||
Upstart Securitization Trust, Ser 2020-3, Cl A | ||||||||
1.702%, 11/20/2030 (D) | 398 | 402 | ||||||
Voya CLO, Ser 2020-1A, Cl DR | ||||||||
3.091%, VAR ICE LIBOR USD 3 Month+2.850%, 04/15/2031 (D) | 250 | 248 | ||||||
|
| |||||||
| 9,457 | ||||||||
|
| |||||||
Total Asset-Backed Securities | 15,642 | |||||||
|
| |||||||
SOVEREIGN DEBT — 1.8% | ||||||||
Abu Dhabi Government International Bond MTN | ||||||||
2.500%, 04/16/2025 (D) | 477 | 503 | ||||||
Brazil Notas do Tesouro Nacional, Ser F | ||||||||
10.000%, 01/01/2023 | BRL 25,639 | 4,784 | ||||||
| SEI Institutional Managed Trust / Semi-Annual Report / March 31, 2021 | 251 |
CONSOLIDATED SCHEDULE OF INVESTMENTS (Unaudited)
March 31, 2021
Multi-Asset Inflation Managed Fund (Continued)
Description | Face Amount (Thousands) | Market Value ($ Thousands) | ||||||
SOVEREIGN DEBT (continued) |
| |||||||
Canadian Government Real Return Bond | ||||||||
0.500%, 12/01/2050 | CAD 3,392 | $ | 2,918 | |||||
Colombia Government International Bond | ||||||||
3.125%, 04/15/2031 | $ 225 | 220 | ||||||
Dominican Republic International Bond | ||||||||
4.875%, 09/23/2032 (D) | 923 | 941 | ||||||
Egypt Government International Bond MTN | ||||||||
5.875%, 02/16/2031 (D) | 805 | 754 | ||||||
Financiera de Desarrollo | ||||||||
2.400%, 09/28/2027 (D) | 1,068 | 1,053 | ||||||
Israel Government International Bond | ||||||||
3.875%, 07/03/2050 | 503 | 553 | ||||||
Malaysia Government International Bond | ||||||||
3.882%, 03/10/2022 | MYR 4,695 | 1,153 | ||||||
Oman Government International Bond | ||||||||
6.250%, 01/25/2031 (D) | $ 253 | 265 | ||||||
4.875%, 02/01/2025 | 200 | 208 | ||||||
Qatar Government International Bond | ||||||||
3.400%, 04/16/2025 (D) | 298 | 324 | ||||||
Saudi Government International Bond MTN | ||||||||
2.900%, 10/22/2025 (D) | 544 | 577 | ||||||
Uruguay Government International Bond | ||||||||
4.375%, 01/23/2031 | 187 | 216 | ||||||
|
|
| ||||||
| Total Sovereign Debt | ||||||||
(Cost $14,918) ($ Thousands) |
| 14,469 | ||||||
|
|
| ||||||
| Shares | ||||||||
FOREIGN COMMON STOCK — 0.3% |
| |||||||
Ireland — 0.1% | ||||||||
Accenture PLC, Cl A | 1,656 | 458 | ||||||
|
|
| ||||||
United Kingdom — 0.2% | ||||||||
Alkermes PLC * | 111 | 2 | ||||||
Atlassian Corp PLC, Cl A * | 500 | 105 | ||||||
Cushman & Wakefield PLC *‡ | 4,838 | 79 | ||||||
Horizon Therapeutics PLC * | 2,028 | 187 | ||||||
LivaNova PLC * | 557 | 41 | ||||||
Medtronic PLC | 12,149 | 1,435 | ||||||
Perrigo Co PLC | 430 | 18 | ||||||
Royalty Pharma PLC, Cl A | 1,200 | 52 | ||||||
|
|
| ||||||
| 1,919 | ||||||||
|
|
| ||||||
| Total Foreign Common Stock | ||||||||
(Cost $1,628) ($ Thousands) | 2,377 | |||||||
|
|
| ||||||
Description | Face Amount (Thousands) | Market Value ($ Thousands) | ||||||
MUNICIPAL BONDS — 0.3% | ||||||||
California — 0.1% | ||||||||
California State, GO | ||||||||
5.700%, 11/01/2021 | $ | 645 | $ | 665 | ||||
|
|
| ||||||
New York — 0.1% | ||||||||
City of New York, Ser D, GO | ||||||||
1.923%, 08/01/2031 | 535 | 498 | ||||||
Port Authority of New York & New Jersey, | ||||||||
Ser AAA, RB | ||||||||
1.086%, 07/01/2023 | 515 | 523 | ||||||
|
|
| ||||||
| 1,021 | ||||||||
|
|
| ||||||
West Virginia — 0.1% | ||||||||
Tobacco Settlement Finance Authority, RB | ||||||||
Callable 12/01/2030 @ 100 | ||||||||
3.000%, 06/01/2035 | 600 | 616 | ||||||
|
|
| ||||||
| Total Municipal Bonds | ||||||||
(Cost $2,314) ($ Thousands) | 2,302 | |||||||
|
|
| ||||||
Number of Warrants | ||||||||
WARRANTS — 0.0% | ||||||||
Occidental Petroleum, Expires 08/06/2027 | ||||||||
Strike Price $22 * | 6,651 | 79 | ||||||
|
|
| ||||||
| Total Warrants | ||||||||
(Cost $—) ($ Thousands) | 79 | |||||||
|
|
| ||||||
| Total Investments in Securities — 129.9% |
| |||||||
(Cost $953,811) ($ Thousands) |
| $ | 1,053,188 | |||||
|
|
| ||||||
| Shares | ||||||||
COMMON STOCK SOLD SHORT— (13.3)% |
| |||||||
Communication Services — (0.6)% |
| |||||||
Altice USA Inc, Cl A * | (3,800 | ) | (124 | ) | ||||
Cable One Inc | (100 | ) | (183 | ) | ||||
Cardlytics Inc * | (100 | ) | (11 | ) | ||||
Charter Communications Inc, Cl A * | (1,474 | ) | (910 | ) | ||||
Comcast Corp, Cl A | (43,489 | ) | (2,353 | ) | ||||
Discovery Inc, Cl C * | (1,100 | ) | (41 | ) | ||||
DISH Network Corp, Cl A * | (2,248 | ) | (81 | ) | ||||
Interpublic Group of Cos Inc/The | (2,965 | ) | (87 | ) | ||||
Liberty Broadband Corp, Cl A * | (458 | ) | (66 | ) | ||||
Liberty Broadband Corp, Cl C * | (1,275 | ) | (191 | ) | ||||
New York Times Co/The, Cl A | (2,500 | ) | (127 | ) | ||||
News Corp, Cl A | (5,900 | ) | (150 | ) | ||||
News Corp, Cl B | (768 | ) | (18 | ) | ||||
Nexstar Media Group Inc, Cl A | (154 | ) | (22 | ) | ||||
Omnicom Group Inc | (841 | ) | (62 | ) | ||||
Sirius XM Holdings Inc | (16,000 | ) | (97 | ) | ||||
| 252 | SEI Institutional Managed Trust / Semi-Annual Report / March 31, 2021 |
| Description | Shares | Market Value ($ Thousands) | ||||||
COMMON STOCK SOLD SHORT (continued) | ||||||||
ViacomCBS Inc, Cl B | (5,920 | ) | $ | (267 | ) | |||
|
|
| ||||||
| (4,790 | ) | |||||||
|
|
| ||||||
Consumer Discretionary — (8.9)% |
| |||||||
Acushnet Holdings Corp | (600 | ) | (25 | ) | ||||
Adtalem Global Education Inc * | (347 | ) | (14 | ) | ||||
Advance Auto Parts Inc | (529 | ) | (97 | ) | ||||
Amazon.com Inc, Cl A * | (1,862 | ) | (5,761 | ) | ||||
American Axle & Manufacturing Holdings Inc * | (7,357 | ) | (71 | ) | ||||
Aramark | (4,948 | ) | (187 | ) | ||||
AutoZone Inc * | (146 | ) | (205 | ) | ||||
Best Buy Co Inc | (2,299 | ) | (264 | ) | ||||
Bloomin’ Brands Inc | (4,000 | ) | (108 | ) | ||||
Booking Holdings Inc * | (395 | ) | (920 | ) | ||||
BorgWarner Inc | (13,163 | ) | (610 | ) | ||||
Boyd Gaming Corp * | (2,581 | ) | (152 | ) | ||||
Bright Horizons Family Solutions Inc * | (1,690 | ) | (290 | ) | ||||
Brinker International Inc | (1,041 | ) | (74 | ) | ||||
Brunswick Corp/DE | (3,077 | ) | (293 | ) | ||||
Burlington Stores Inc * | (663 | ) | (198 | ) | ||||
Caesars Entertainment Inc * | (4,399 | ) | (385 | ) | ||||
Callaway Golf Co | (3,233 | ) | (86 | ) | ||||
Capri Holdings Ltd * | (3,956 | ) | (202 | ) | ||||
CarMax Inc * | (1,617 | ) | (215 | ) | ||||
Carnival Corp * | (10,671 | ) | (283 | ) | ||||
Carter’s Inc | (1,251 | ) | (111 | ) | ||||
Carvana Co, Cl A * | (512 | ) | (134 | ) | ||||
Cavco Industries Inc * | (56 | ) | (13 | ) | ||||
Century Communities Inc * | (1,241 | ) | (75 | ) | ||||
Chegg Inc * | (2,100 | ) | (180 | ) | ||||
Chipotle Mexican Grill Inc, Cl A * | (649 | ) | (922 | ) | ||||
Choice Hotels International Inc | (1,098 | ) | (118 | ) | ||||
Churchill Downs Inc | (1,200 | ) | (273 | ) | ||||
Cooper Tire & Rubber Co | (3,608 | ) | (202 | ) | ||||
Cooper-Standard Holdings Inc * | (900 | ) | (33 | ) | ||||
Cracker Barrel Old Country Store Inc | (300 | ) | (52 | ) | ||||
Crocs Inc * | (1,814 | ) | (146 | ) | ||||
Dana Inc | (8,223 | ) | (200 | ) | ||||
Darden Restaurants Inc | (3,260 | ) | (463 | ) | ||||
Deckers Outdoor Corp * | (1,034 | ) | (342 | ) | ||||
Dollar General Corp | (2,288 | ) | (464 | ) | ||||
Dollar Tree Inc * | (1,664 | ) | (190 | ) | ||||
Domino’s Pizza Inc | (999 | ) | (367 | ) | ||||
Dorman Products Inc * | (1,952 | ) | (200 | ) | ||||
DR Horton Inc | (10,859 | ) | (968 | ) | ||||
eBay Inc | (6,845 | ) | (419 | ) | ||||
Etsy Inc * | (900 | ) | (182 | ) | ||||
Expedia Group Inc | (1,167 | ) | (201 | ) | ||||
Five Below Inc * | (200 | ) | (38 | ) | ||||
Floor & Decor Holdings Inc, Cl A * | (1,100 | ) | (105 | ) | ||||
Foot Locker Inc, Cl A | (1,200 | ) | (68 | ) | ||||
| Description | Shares | Market Value ($ Thousands) | ||||||
COMMON STOCK SOLD SHORT (continued) | ||||||||
Ford Motor Co * | (205,792 | ) | $ | (2,521 | ) | |||
Fox Factory Holding Corp * | (1,822 | ) | (232 | ) | ||||
frontdoor Inc * | (200 | ) | (11 | ) | ||||
GameStop Corp, Cl A * | (400 | ) | (76 | ) | ||||
Gap Inc/The | (1,900 | ) | (57 | ) | ||||
Garmin Ltd | (5,299 | ) | (699 | ) | ||||
General Motors Co | (64,574 | ) | (3,710 | ) | ||||
Gentex Corp | (15,188 | ) | (542 | ) | ||||
Gentherm Inc * | (2,300 | ) | (170 | ) | ||||
Genuine Parts Co | (2,635 | ) | (305 | ) | ||||
G-III Apparel Group Ltd * | (2,400 | ) | (72 | ) | ||||
Goodyear Tire & Rubber Co/The | (14,530 | ) | (255 | ) | ||||
GoPro Inc, Cl A * | (1,939 | ) | (23 | ) | ||||
Grand Canyon Education Inc * | (555 | ) | (59 | ) | ||||
Grubhub Inc * | (432 | ) | (26 | ) | ||||
H&R Block Inc | (800 | ) | (17 | ) | ||||
Hanesbrands Inc | (12,191 | ) | (240 | ) | ||||
Harley-Davidson Inc, Cl A | (8,077 | ) | (324 | ) | ||||
Hasbro Inc | (4,310 | ) | (414 | ) | ||||
Helen of Troy Ltd * | (864 | ) | (182 | ) | ||||
Hilton Grand Vacations Inc * | (1,900 | ) | (71 | ) | ||||
Hilton Worldwide Holdings Inc * | (6,811 | ) | (824 | ) | ||||
Home Depot Inc/The | (9,079 | ) | (2,771 | ) | ||||
Installed Building Products Inc | (978 | ) | (108 | ) | ||||
iRobot * | (1,147 | ) | (140 | ) | ||||
Jack in the Box Inc | (713 | ) | (78 | ) | ||||
Johnson Outdoors Inc, Cl A | (205 | ) | (29 | ) | ||||
KB Home | (4,435 | ) | (206 | ) | ||||
Kohl’s Corp | (1,500 | ) | (89 | ) | ||||
Kontoor Brands Inc | (2,100 | ) | (102 | ) | ||||
L Brands Inc * | (2,081 | ) | (129 | ) | ||||
Las Vegas Sands Corp | (8,359 | ) | (508 | ) | ||||
Laureate Education Inc, Cl A * | (900 | ) | (12 | ) | ||||
La-Z-Boy Inc, Cl Z | (377 | ) | (16 | ) | ||||
LCI Industries | (1,612 | ) | (213 | ) | ||||
Lear Corp | (3,464 | ) | (628 | ) | ||||
Leggett & Platt Inc | (4,876 | ) | (223 | ) | ||||
Lennar Corp, Cl A | (8,901 | ) | (901 | ) | ||||
Lennar Corp, Cl B | (700 | ) | (58 | ) | ||||
LGI Homes Inc * | (972 | ) | (145 | ) | ||||
Lithia Motors Inc, Cl A | (200 | ) | (78 | ) | ||||
LKQ Corp * | (3,705 | ) | (157 | ) | ||||
Lowe’s Cos Inc | (6,496 | ) | (1,235 | ) | ||||
Lululemon Athletica Inc * | (3,572 | ) | (1,096 | ) | ||||
M/I Homes Inc * | (738 | ) | (44 | ) | ||||
Magnite Inc * | (500 | ) | (21 | ) | ||||
Malibu Boats Inc, Cl A * | (1,100 | ) | (88 | ) | ||||
Marriott International Inc/MD, Cl A | (6,441 | ) | (954 | ) | ||||
Marriott Vacations Worldwide Corp | (1,070 | ) | (186 | ) | ||||
Mattel Inc * | (10,669 | ) | (213 | ) | ||||
McDonald’s Corp | (17,494 | ) | (3,921 | ) | ||||
MDC Holdings Inc | (2,586 | ) | (154 | ) | ||||
| SEI Institutional Managed Trust / Semi-Annual Report / March 31, 2021 | 253 |
CONSOLIDATED SCHEDULE OF INVESTMENTS (Unaudited)
March 31, 2021
Multi-Asset Inflation Managed Fund (Continued)
| Description | Shares | Market Value ($ Thousands) | ||||||
COMMON STOCK SOLD SHORT (continued) | ||||||||
Meritage Homes Corp * | (1,303 | ) | $ | (120 | ) | |||
MGM Resorts International | (10,587 | ) | (402 | ) | ||||
Mohawk Industries Inc * | (1,766 | ) | (340 | ) | ||||
Motorcar Parts of America Inc * | (1,229 | ) | (28 | ) | ||||
Murphy USA Inc | (100 | ) | (14 | ) | ||||
Nautilus Inc * | (300 | ) | (5 | ) | ||||
Newell Brands Inc, Cl B | (13,437 | ) | (360 | ) | ||||
NIKE Inc, Cl B | (37,411 | ) | (4,972 | ) | ||||
Norwegian Cruise Line Holdings Ltd * | (8,138 | ) | (225 | ) | ||||
NVR Inc * | (137 | ) | (645 | ) | ||||
Ollie’s Bargain Outlet Holdings Inc * | (522 | ) | (45 | ) | ||||
O’Reilly Automotive Inc * | (562 | ) | (285 | ) | ||||
Papa John’s International Inc, Cl A | (1,038 | ) | (92 | ) | ||||
Peloton Interactive Inc, Cl A * | (7,261 | ) | (816 | ) | ||||
Penn National Gaming Inc * | (3,639 | ) | (382 | ) | ||||
Perdoceo Education Corp * | (666 | ) | (8 | ) | ||||
Planet Fitness Inc, Cl A * | (1,899 | ) | (147 | ) | ||||
Polaris Inc | (2,313 | ) | (309 | ) | ||||
Pool Corp | (450 | ) | (155 | ) | ||||
PulteGroup Inc | (9,436 | ) | (495 | ) | ||||
Purple Innovation Inc, Cl A * | (300 | ) | (10 | ) | ||||
PVH Corp | (2,263 | ) | (239 | ) | ||||
Qurate Retail Inc | (1,700 | ) | (20 | ) | ||||
Ralph Lauren Corp, Cl A | (1,250 | ) | (154 | ) | ||||
RH * | (200 | ) | (119 | ) | ||||
Ross Stores Inc | (3,067 | ) | (368 | ) | ||||
Royal Caribbean Cruises Ltd | (4,453 | ) | (381 | ) | ||||
Scientific Games Corp, Cl A * | (1,162 | ) | (45 | ) | ||||
Service Corp International/US | (4,226 | ) | (216 | ) | ||||
Shake Shack Inc, Cl A * | (900 | ) | (101 | ) | ||||
Six Flags Entertainment Corp | (606 | ) | (28 | ) | ||||
Skechers USA Inc, Cl A * | (4,608 | ) | (192 | ) | ||||
Skyline Champion Corp * | (850 | ) | (38 | ) | ||||
Smith & Wesson Brands Inc | (2,099 | ) | (37 | ) | ||||
Sonos Inc * | (2,896 | ) | (109 | ) | ||||
Stamps.com Inc * | (100 | ) | (20 | ) | ||||
Standard Motor Products Inc | (2,395 | ) | (100 | ) | ||||
Starbucks Corp | (26,605 | ) | (2,907 | ) | ||||
Steven Madden Ltd | (2,500 | ) | (93 | ) | ||||
Stitch Fix Inc, Cl A * | (400 | ) | (20 | ) | ||||
Stoneridge Inc * | (1,630 | ) | (52 | ) | ||||
Strategic Education Inc | (360 | ) | (33 | ) | ||||
Stride * | (1,700 | ) | (51 | ) | ||||
Sturm Ruger & Co Inc | (399 | ) | (26 | ) | ||||
Tapestry Inc * | (8,626 | ) | (355 | ) | ||||
Target Corp, Cl A | (4,723 | ) | (935 | ) | ||||
Taylor Morrison Home Corp, Cl A * | (5,241 | ) | (161 | ) | ||||
Tempur Sealy International Inc | (6,644 | ) | (243 | ) | ||||
Tenneco Inc, Cl A * | (2,537 | ) | (27 | ) | ||||
Terminix Global Holdings Inc * | (2,643 | ) | (126 | ) | ||||
Tesla Inc * | (8,708 | ) | (5,816 | ) | ||||
Texas Roadhouse Inc, Cl A * | (1,228 | ) | (118 | ) | ||||
| Description | Shares | Market Value ($ Thousands) | ||||||
COMMON STOCK SOLD SHORT (continued) | ||||||||
Thor Industries Inc | (2,925 | ) | $ | (394) | ||||
TJX Cos Inc/The | (9,975 | ) | (660) | |||||
Toll Brothers Inc | (4,949 | ) | (281) | |||||
TopBuild Corp * | (1,282 | ) | (268) | |||||
Tractor Supply Co | (917 | ) | (162) | |||||
Travel + Leisure Co | (2,439 | ) | (149) | |||||
Tri Pointe Homes Inc * | (6,220 | ) | (127) | |||||
Tupperware Brands Corp * | (1,800 | ) | (48) | |||||
Ulta Beauty Inc * | (388 | ) | (120) | |||||
Under Armour Inc, Cl A * | (6,425 | ) | (142) | |||||
Under Armour Inc, Cl C * | (6,679 | ) | (123) | |||||
Vail Resorts Inc | (1,047 | ) | (305) | |||||
VF Corp | (10,442 | ) | (835) | |||||
Vista Outdoor Inc * | (2,340 | ) | (75) | |||||
Visteon Corp * | (1,722 | ) | (210) | |||||
Wayfair Inc, Cl A * | (376 | ) | (118) | |||||
Wendy’s Co/The | (4,028 | ) | (82) | |||||
Whirlpool Corp | (2,165 | ) | (477) | |||||
Williams-Sonoma Inc | (929 | ) | (166) | |||||
Wingstop Inc, Cl A | (700 | ) | (89) | |||||
Winnebago Industries | (2,203 | ) | (169) | |||||
Wolverine World Wide Inc | (2,146 | ) | (82) | |||||
Workhorse Group Inc * | (4,100 | ) | (56) | |||||
WW International Inc * | (1,400 | ) | (44) | |||||
Wyndham Hotels & Resorts Inc | (2,896 | ) | (202) | |||||
Wynn Resorts Ltd | (2,049 | ) | (257) | |||||
YETI Holdings Inc * | (2,669 | ) | (193) | |||||
Yum China Holdings Inc | (9,882 | ) | (585) | |||||
Yum! Brands Inc | (7,598 | ) | (822) | |||||
|
| |||||||
|
(72,465) |
| ||||||
|
| |||||||
Information Technology — (2.5)% | ||||||||
Advanced Micro Devices Inc * | (5,622 | ) | (441) | |||||
Amphenol Corp, Cl A | (4,684 | ) | (309) | |||||
Analog Devices Inc | (1,310 | ) | (203) | |||||
Apple Inc | (46,864 | ) | (5,724) | |||||
Applied Materials Inc | (5,332 | ) | (712) | |||||
Arista Networks Inc * | (444 | ) | (134) | |||||
Arrow Electronics Inc, Cl A * | (1,102 | ) | (122) | |||||
Broadcom Inc | (2,052 | ) | (951) | |||||
CDW Corp/DE | (1,205 | ) | (200) | |||||
Ciena Corp * | (1,100 | ) | (60) | |||||
Cisco Systems Inc/Delaware | (23,547 | ) | (1,218) | |||||
Cognex Corp | (1,068 | ) | (89) | |||||
Corning Inc, Cl B | (5,402 | ) | (235) | |||||
Dell Technologies Inc, Cl C * | (1,524 | ) | (134) | |||||
Enphase Energy Inc * | (429 | ) | (70) | |||||
Entegris Inc | (600 | ) | (67) | |||||
ePlus Inc * | (200 | ) | (20) | |||||
F5 Networks Inc, Cl A * | (397 | ) | (83) | |||||
Fabrinet * | (590 | ) | (53) | |||||
Hewlett Packard Enterprise Co | (10,554 | ) | (166) | |||||
| 254 | SEI Institutional Managed Trust / Semi-Annual Report / March 31, 2021 |
| Description | Shares | Market Value ($ Thousands) | ||||||
COMMON STOCK SOLD SHORT (continued) | ||||||||
HP Inc | (8,755 | ) | $ | (278) | ||||
II-VI Inc * | (482 | ) | (33) | |||||
Infinera Corp * | (1,500 | ) | (15) | |||||
Inphi Corp * | (300 | ) | (54) | |||||
Intel Corp | (20,853 | ) | (1,335) | |||||
Jabil Inc | (1,522 | ) | (79) | |||||
Juniper Networks Inc | (591 | ) | (15) | |||||
Keysight Technologies Inc * | (1,153 | ) | (165) | |||||
KLA Corp | (922 | ) | (305) | |||||
Lam Research Corp | (838 | ) | (499) | |||||
Lumentum Holdings Inc * | (700 | ) | (64) | |||||
Marvell Technology Group Ltd | (3,399 | ) | (167) | |||||
Microchip Technology Inc | (1,143 | ) | (177) | |||||
Micron Technology Inc * | (5,949 | ) | (525) | |||||
MKS Instruments Inc | (476 | ) | (88) | |||||
Monolithic Power Systems Inc | (322 | ) | (114) | |||||
Motorola Solutions Inc | (1,157 | ) | (218) | |||||
NetApp Inc | (1,554 | ) | (113) | |||||
Novanta Inc * | (200 | ) | (26) | |||||
NVIDIA Corp | (2,973 | ) | (1,587) | |||||
ON Semiconductor Corp * | (623 | ) | (26) | |||||
PC Connection Inc | (200 | ) | (9) | |||||
Pure Storage Inc, Cl A * | (1,188 | ) | (26) | |||||
Qorvo Inc * | (461 | ) | (84) | |||||
QUALCOMM Inc | (5,920 | ) | (785) | |||||
Skyworks Solutions Inc | (1,200 | ) | (220) | |||||
SolarEdge Technologies Inc * | (307 | ) | (88) | |||||
Super Micro Computer Inc * | (2,252 | ) | (88) | |||||
SYNNEX Corp | (600 | ) | (69) | |||||
Teradyne Inc | (1,129 | ) | (137) | |||||
Texas Instruments Inc | (5,307 | ) | (1,003) | |||||
Trimble Inc * | (1,124 | ) | (87) | |||||
Ubiquiti Inc | (161 | ) | (48) | |||||
Universal Display Corp | (154 | ) | (37) | |||||
Western Digital Corp | (1,686 | ) | (113) | |||||
Xerox Holdings Corp | (1,149 | ) | (28) | |||||
Xilinx Inc | (996 | ) | (123) | |||||
Zebra Technologies Corp, Cl A * | (361 | ) | (175) | |||||
|
| |||||||
| (19,994) | ||||||||
|
| |||||||
Materials — (1.3)% | ||||||||
Air Products and Chemicals Inc | (2,914 | ) | (820) | |||||
Albemarle Corp | (1,462 | ) | (214) | |||||
Alcoa Corp * | (1,900 | ) | (62) | |||||
Avery Dennison Corp | (1,328 | ) | (244) | |||||
Axalta Coating Systems Ltd * | (827 | ) | (24) | |||||
Ball Corp | (4,004 | ) | (339) | |||||
Berry Global Group Inc * | (2,202 | ) | (135) | |||||
Celanese Corp, Cl A | (1,072 | ) | (161) | |||||
CF Industries Holdings Inc | (541 | ) | (25) | |||||
Chemours Co/The | (2,100 | ) | (59) | |||||
Cleveland-Cliffs Inc | (5,500 | ) | (111) | |||||
| Description | Shares | Market Value ($ Thousands) | ||||||
COMMON STOCK SOLD SHORT (continued) | ||||||||
Commercial Metals Co, Cl A | (1,331 | ) | $ | (41) | ||||
Corteva Inc | (9,528 | ) | (444) | |||||
Crown Holdings Inc | (1,763 | ) | (171) | |||||
Dow Inc | (9,684 | ) | (619) | |||||
DuPont de Nemours Inc | (7,393 | ) | (571) | |||||
Eastman Chemical Co | (1,491 | ) | (164) | |||||
Ecolab Inc | (3,121 | ) | (668) | |||||
Element Solutions Inc | (900 | ) | (16) | |||||
FMC Corp | (2,033 | ) | (225) | |||||
Freeport-McMoRan Inc, Cl B | (15,797 | ) | (520) | |||||
Graphic Packaging Holding Co | (2,560 | ) | (46) | |||||
Hecla Mining Co | (3,195 | ) | (18) | |||||
Huntsman Corp | (1,331 | ) | (38) | |||||
International Flavors & Fragrances Inc | (2,307 | ) | (322) | |||||
International Paper Co | (5,193 | ) | (281) | |||||
Louisiana-Pacific Corp | (1,326 | ) | (74) | |||||
LyondellBasell Industries NV, Cl A | (1,515 | ) | (158) | |||||
Martin Marietta Materials Inc, Cl A | (473 | ) | (159) | |||||
Mosaic Co/The | (3,039 | ) | (96) | |||||
Newmont Corp | (9,915 | ) | (598) | |||||
Nucor Corp | (3,565 | ) | (286) | |||||
Packaging Corp of America | (1,302 | ) | (175) | |||||
PPG Industries Inc | (3,662 | ) | (550) | |||||
Reliance Steel & Aluminum Co | (319 | ) | (49) | |||||
RPM International Inc | (2,228 | ) | (205) | |||||
Scotts Miracle-Gro Co/The, Cl A | (700 | ) | (171) | |||||
Sealed Air Corp | (152 | ) | (7) | |||||
Sherwin-Williams Co/The, Cl A | (1,114 | ) | (822) | |||||
Sonoco Products Co | (512 | ) | (32) | |||||
Southern Copper Corp | (1,175 | ) | (80) | |||||
Steel Dynamics Inc | (2,754 | ) | (140) | |||||
SunCoke Energy Inc | (7,400 | ) | (52) | |||||
United States Steel Corp | (1,000 | ) | (26) | |||||
Vulcan Materials Co | (1,321 | ) | (223) | |||||
Westrock Co | (4,454 | ) | (232) | |||||
|
| |||||||
|
(10,473) |
| ||||||
|
| |||||||
Total Common Stock Sold Short | ||||||||
(Proceeds $78,405) ($ Thousands) | (107,722) | |||||||
|
| |||||||
FOREIGN COMMON STOCK SOLD SHORT — (0.5)% | ||||||||
United Kingdom — (0.5)% | ||||||||
Adient PLC * | (4,918 | ) | (217) | |||||
Amcor PLC | (23,168 | ) | (271) | |||||
Aptiv PLC * | (13,862 | ) | (1,912) | |||||
| SEI Institutional Managed Trust / Semi-Annual Report / March 31, 2021 | 255 |
CONSOLIDATED SCHEDULE OF INVESTMENTS (Unaudited)
March 31, 2021
Multi-Asset Inflation Managed Fund (Continued)
| Description | Shares | Market Value ($ Thousands) | ||||||
FOREIGN COMMON STOCK SOLD SHORT (continued) | ||||||||
Linde PLC | (6,144 | ) | $ | (1,721) | ||||
|
| |||||||
Total Foreign Common Stock Sold Short | (4,121) | |||||||
|
| |||||||
PREFERRED STOCK SOLD SHORT — 0.0% |
| |||||||
Consumer Discretionary — 0.0% |
| |||||||
Qurate Retail, 8.000% | (51 | ) | (5) | |||||
|
| |||||||
Total Preferred Stock Sold Short | (5) | |||||||
|
| |||||||
Total Investments Sold Short — (13.8)% | $ | (111,848) | ||||||
|
| |||||||
| Contracts | ||||||||
PURCHASED OPTIONS* — 0.2% |
| |||||||
Total Purchased Options (G) | 512 | $ | 1,500 | |||||
|
| |||||||
WRITTEN OPTIONS* — (0.1)% |
| |||||||
Total Written Options (G) | (431 | ) | $ | (631) | ||||
|
| |||||||
A list of open exchange traded options contracts for the Fund at March 31, 2021, is as follows:
| Description | Number of Contracts | Notional Amount (Thousands) † | Exercise Price | Expiration Date | Value (Thousands) | |||||||||||||||
PURCHASED OPTIONS — 0.2% | ||||||||||||||||||||
Put Options | ||||||||||||||||||||
CRUDE OIL OPT IPE Jun21P *(A) | 18 | $ | 46 | $60.00 | 4/17/2021 | $ | 34 | |||||||||||||
SOYBEAN OIL OPTN May21P *(A) | 125 | 26 | 50.00 | 4/17/2021 | 61 | |||||||||||||||
ZINC SPT OP (LME) May21P *(A) | 40 | 43 | 2,600.00 | 5/22/2021 | 23 | |||||||||||||||
|
|
|
| |||||||||||||||||
| 115 | 118 | |||||||||||||||||||
|
|
|
| |||||||||||||||||
Call Options | ||||||||||||||||||||
COFFEE ‘C’ FUT OP May21C *(A) | 40 | $ | 216 | 110.00 | 4/17/2021 | $ | 203 | |||||||||||||
July 2021, Corn Future*(A) | 61 | 212 | 320.00 | 6/19/2021 | 730 | |||||||||||||||
GOLD FUT OPT(CMX) Jun21C *(A) | 20 | 283 | 1,600.00 | 5/22/2021 | 247 | |||||||||||||||
LEAD LME SPOT OPT May21C *(A) | 90 | 379 | 2,000.00 | 5/22/2021 | 91 | |||||||||||||||
NICKEL LME FUT OP May21C *(A) | 9 | 35 | 17,000.00 | 5/22/2021 | 15 | |||||||||||||||
SILVER OPTION | 9 | 16 | 28.00 | 4/17/2021 | 6 | |||||||||||||||
SUGAR (WRLD) OPTN May21C *(A) | 100 | 179 | 14.00 | 4/17/2021 | 90 | |||||||||||||||
| 256 | SEI Institutional Managed Trust / Semi-Annual Report / March 31, 2021 |
| Description | Number of Contracts | Notional Amount (Thousands) † | Exercise Price | Expiration Date | Value (Thousands) | |||||||||||||||
PURCHASED OPTIONS (continued) | ||||||||||||||||||||
|
|
|
| |||||||||||||||||
| $ | 1,320 | $ | 1,382 | |||||||||||||||||
|
|
|
| |||||||||||||||||
Total Purchased Options |
$ |
1,435 |
| $ | 1,500 | |||||||||||||||
|
|
|
| |||||||||||||||||
WRITTEN OPTIONS — (0.1)% | ||||||||||||||||||||
Put Options | ||||||||||||||||||||
CRUDE OIL OPT IPE Jun21P *(A) | (18) | $ | (3) | 50.00 | 04/17/21 | $ | (6) | |||||||||||||
CRUDE OIL OPT IPE Jun21P *(A) | (18) | (23) | 55.00 | 04/17/21 | (14) | |||||||||||||||
NATURAL GAS OPTN Jul21P *(A) | (4) | (7) | 2.85 | 06/19/21 | (9) | |||||||||||||||
NICKEL LME FUT OP May21P *(A) | (9) | (23) | 15,000.00 | 05/22/21 | (13) | |||||||||||||||
Silver OPT May21P *(A) | (18) | (52) | 25.00 | 04/17/21 | (92) | |||||||||||||||
SOYBEAN OIL OPTN May21P *(A) | (63) | (14) | 47.00 | 04/17/21 | (10) | |||||||||||||||
SOYBEAN OIL OPTN May21P *(A) | (62) | (15) | 48.00 | 04/17/21 | (13) | |||||||||||||||
ZINC SPT OP (LME) May21P *(A) | (40) | (8) | 2,350.00 | 05/22/21 | (5) | |||||||||||||||
|
|
|
| |||||||||||||||||
| (145) | (162) | |||||||||||||||||||
|
|
|
| |||||||||||||||||
Call Options | ||||||||||||||||||||
COFFEE ‘C’ FUT OP May21C *(A) | (20) | $ | (11) | 145.00 | 04/17/21 | $ | – | |||||||||||||
June 2021, Crude Oil IPE Future*(A) | (18) | (26) | 60.00 | 04/17/21 | (83) | |||||||||||||||
NATURAL GAS OPTN Jul21C *(A) | (4) | (13) | 2.85 | 06/19/21 | (4) | |||||||||||||||
NICKEL LME FUT OP May21C *(A) | (9) | (6) | 2,000.00 | 05/22/21 | (2) | |||||||||||||||
Silver OPT May21C *(A) | (18) | (70) | 33.00 | 04/17/21 | (6) | |||||||||||||||
SUGAR (WRLD) OPTN May21C *(A) | (100) | (31) | 18.00 | 04/17/21 | (1) | |||||||||||||||
July 2021, WTI Crude Oil ICE Future*(A) | (30) | (98) | 49.00 | 06/19/21 | (373) | |||||||||||||||
|
|
|
| |||||||||||||||||
|
(255) |
| (469) | |||||||||||||||||
|
|
|
| |||||||||||||||||
Total Written Options | $ | (400) | $ | (631) | ||||||||||||||||
|
|
|
| |||||||||||||||||
† Represents Cost
| SEI Institutional Managed Trust / Semi-Annual Report / March 31, 2021 | 257 |
CONSOLIDATED SCHEDULE OF INVESTMENTS (Unaudited)
March 31, 2021
Multi-Asset Inflation Managed Fund (Continued)
A list of the open futures contracts held by the Fund at March 31, 2021, is as follows:
| Type of Contract | Number of (Short) | Expiration Date | Notional Amount (Thousands) | Value (Thousands) | Unrealized Appreciation (Depreciation) (Thousands) | |||||||||||||||
Brent Crude(A) | 52 | May-2021 | $ | 3,166 | $ | 3,240 | $ | 74 | ||||||||||||
Brent Crude(A) | 18 | May-2021 | 1,207 | 1,129 | (77) | |||||||||||||||
Brent Crude(A) | 101 | May-2021 | 6,805 | 6,293 | (512) | |||||||||||||||
Canadian 10-Year Bond | (67 | ) | Jun-2021 | (7,435) | (7,398) | (41) | ||||||||||||||
Coffee C(A) | 14 | May-2021 | 647 | 648 | 2 | |||||||||||||||
Coffee C(A) | (41 | ) | May-2021 | (1,982) | (1,899) | 83 | ||||||||||||||
Coffee C(A) | (2 | ) | Jul-2021 | (100) | (94) | 6 | ||||||||||||||
Copper(A) | 73 | May-2021 | 7,067 | 7,292 | 225 | |||||||||||||||
Copper(A) | 39 | Jul-2021 | 3,462 | 3,900 | 438 | |||||||||||||||
Corn(A) | 160 | May-2021 | 4,126 | 4,514 | 388 | |||||||||||||||
Corn(A) | 103 | Sep-2021 | 2,432 | 2,554 | 122 | |||||||||||||||
Corn(A) | 15 | Dec-2021 | 338 | 358 | 20 | |||||||||||||||
Cotton No. 2(A) | (8 | ) | May-2021 | (340) | (324) | 17 | ||||||||||||||
Cotton No. 2(A) | (1 | ) | Jul-2021 | (44) | (41) | 3 | ||||||||||||||
Cotton No. 2(A) | 28 | May-2021 | 1,215 | 1,132 | (82) | |||||||||||||||
Euro-Buxl | 39 | Jun-2021 | 9,768 | 9,444 | (63) | |||||||||||||||
Feeder Cattle(A) | (21 | ) | May-2021 | (1,545) | (1,569) | (24) | ||||||||||||||
Gasoline(A) | 57 | May-2021 | 4,578 | 4,692 | 114 | |||||||||||||||
Gasoline(A) | 25 | May-2021 | 1,876 | 2,058 | 182 | |||||||||||||||
Gasoline(A) | (20 | ) | Jul-2021 | (1,642) | (1,627) | 15 | ||||||||||||||
Gold(A) | 37 | Jul-2021 | 6,331 | 6,348 | 17 | |||||||||||||||
Gold(A) | 26 | Jul-2021 | 4,592 | 4,461 | (131) | |||||||||||||||
Heating Oil(A) | 26 | May-2021 | 2,061 | 1,933 | (128) | |||||||||||||||
KC HRW Wheat(A) | 34 | May-2021 | 1,071 | 979 | (92) | |||||||||||||||
KC HRW Wheat(A) | (2 | ) | Jul-2021 | (62) | (58) | 4 | ||||||||||||||
KC HRW Wheat(A) | (88 | ) | May-2021 | (2,634) | (2,533) | 101 | ||||||||||||||
Lean Hogs(A) | 81 | Jun-2021 | 3,261 | 3,412 | 151 | |||||||||||||||
Live Cattle(A) | (5 | ) | Jul-2021 | (241) | (246) | (4) | ||||||||||||||
Live Cattle(A) | 49 | Jul-2021 | 2,335 | 2,409 | 74 | |||||||||||||||
LME Lead(A) | (7 | ) | May-2021 | (370) | (344) | 26 | ||||||||||||||
LME Lead(A) | (34 | ) | Jun-2021 | (1,786) | (1,676) | 110 | ||||||||||||||
LME Nickel(A) | 22 | May-2021 | 2,428 | 2,118 | (310) | |||||||||||||||
LME Nickel(A) | 35 | Jun-2021 | 3,651 | 3,373 | (278) | |||||||||||||||
LME Primary Aluminum(A) | 67 | Jun-2021 | 3,730 | 3,700 | (30) | |||||||||||||||
LME Primary Aluminum(A) | 18 | May-2021 | 926 | 990 | 64 | |||||||||||||||
LME Zinc(A) | 5 | May-2021 | 338 | 352 | 13 | |||||||||||||||
LME Zinc(A) | (4 | ) | May-2021 | (283) | (281) | 2 | ||||||||||||||
LME Zinc(A) | 31 | Jun-2021 | 2,166 | 2,183 | 17 | |||||||||||||||
Long Gilt 10-Year Bond | (93 | ) | Jul-2021 | (16,880) | (16,371) | 207 | ||||||||||||||
Low Sulphur Gasoil(A) | 46 | May-2021 | 2,300 | 2,335 | 34 | |||||||||||||||
Low Sulphur Gasoil(A) | 10 | May-2021 | 508 | 508 | – | |||||||||||||||
Low Sulphur Gasoil(A) | (2 | ) | Jul-2021 | (102) | (102) | – | ||||||||||||||
MSCI EAFE Index | (113 | ) | Jun-2021 | (12,455) | (12,385) | 70 | ||||||||||||||
Natural Gas(A) | (11 | ) | Jul-2021 | (290) | (301) | (11) | ||||||||||||||
Natural Gas(A) | (3 | ) | May-2021 | (75) | (78) | (3) | ||||||||||||||
Natural Gas(A) | (108 | ) | Apr-2022 | (2,787) | (2,682) | 105 | ||||||||||||||
Natural Gas(A) | 108 | Feb-2022 | 3,225 | 3,043 | (182) | |||||||||||||||
Natural Gas(A) | 220 | Aug-2021 | 5,944 | 6,028 | 83 | |||||||||||||||
NY Harbor ULSD(A) | 6 | May-2021 | 437 | 446 | 9 | |||||||||||||||
NYMEX Cocoa(A) | (110 | ) | May-2021 | (2,697) | (2,583) | 114 | ||||||||||||||
Palladium(A) | (3 | ) | Jul-2021 | (718) | (786) | (68) | ||||||||||||||
Platinum(A) | (8 | ) | Jul-2021 | (476) | (477) | – | ||||||||||||||
S&P 500 Index E-MINI | (129 | ) | Jun-2021 | (25,491) | (25,590) | (99) | ||||||||||||||
Silver(A) | 3 | Oct-2021 | 422 | 369 | (53) | |||||||||||||||
Silver(A) | 20 | May-2021 | 2,719 | 2,453 | (266) | |||||||||||||||
258 | SEI Institutional Managed Trust / Semi-Annual Report / March 31, 2021 |
| Type of Contract | Number of (Short) | Expiration Date | Notional Amount (Thousands) | Value (Thousands) | Unrealized Appreciation (Depreciation) (Thousands) | |||||||||||||||
Silver(A) | 7 | Jul-2021 | $ | 947 | $ | 860 | $ | (87) | ||||||||||||
Soybean(A) | (17 | ) | May-2021 | (1,167) | (1,221) | (54) | ||||||||||||||
Soybean(A) | (3 | ) | Jul-2021 | (214) | (214) | – | ||||||||||||||
Soybean(A) | 63 | May-2021 | 4,343 | 4,526 | 183 | |||||||||||||||
Soybean(A) | 50 | Nov-2021 | 2,927 | 3,141 | 213 | |||||||||||||||
Soybean Meal(A) | (3 | ) | Jul-2021 | (127) | (127) | (1) | ||||||||||||||
Soybean Meal(A) | (6 | ) | Dec-2021 | (227) | (239) | (12) | ||||||||||||||
Soybean Meal(A) | (49 | ) | May-2021 | (2,039) | (2,074) | (34) | ||||||||||||||
Soybean Meal(A) | 76 | May-2021 | 3,274 | 3,216 | (58) | |||||||||||||||
Soybean Oil(A) | 109 | May-2021 | 3,087 | 3,461 | 374 | |||||||||||||||
Soybean Oil(A) | 33 | Jul-2021 | 1,010 | 1,005 | (5) | |||||||||||||||
Soybean Oil(A) | 97 | Dec-2021 | 2,471 | 2,680 | 208 | |||||||||||||||
Sugar No. 11(A) | 26 | Jul-2021 | 447 | 430 | (17) | |||||||||||||||
Sugar No. 11(A) | 81 | May-2021 | 1,413 | 1,340 | (73) | |||||||||||||||
U.S. 2-Year Treasury Note | (587 | ) | Jul-2021 | (129,610) | (129,566) | 44 | ||||||||||||||
U.S. 5-Year Treasury Note | (551 | ) | Jul-2021 | (68,682) | (67,993) | 689 | ||||||||||||||
U.S. 10-Year Treasury Note | (197 | ) | Jun-2021 | (26,231) | (25,795) | 436 | ||||||||||||||
U.S. Ultra Long Treasury Bond | (85 | ) | Jun-2021 | (16,000) | (15,404) | 597 | ||||||||||||||
Ultra 10-Year U.S. Treasury Note | (45 | ) | Jun-2021 | (6,475) | (6,466) | 9 | ||||||||||||||
Wheat(A) | 86 | May-2021 | 2,768 | 2,657 | (111) | |||||||||||||||
Wheat(A) | (3 | ) | Jul-2021 | (93) | (92) | – | ||||||||||||||
Wheat(A) | (18 | ) | May-2021 | (562) | (556) | 5 | ||||||||||||||
Wheat(A) | (25 | ) | Dec-2021 | (807) | (780) | 27 | ||||||||||||||
WTI Crude Oil(A) | 140 | May-2021 | 6,081 | 8,285 | 2,204 | |||||||||||||||
WTI Crude Oil(A) | (3 | ) | Jun-2021 | (182) | (177) | 5 | ||||||||||||||
WTI Crude Oil(A) | 50 | Jun-2021 | 3,106 | 2,952 | (154) | |||||||||||||||
WTI Crude Oil(A) | 108 | Apr-2021 | 6,238 | 6,389 | 151 | |||||||||||||||
WTI Crude Oil(A) | (99 | ) | Apr-2021 | (5,985) | (5,857) | 128 | ||||||||||||||
|
|
|
|
|
| |||||||||||||||
| $ | (205,592) | $ | (200,370) | $ | 5,103 | |||||||||||||||
|
|
|
|
|
| |||||||||||||||
A list of the open forward foreign currency contracts held by the Fund at March 31, 2021, is as follows:
| Counterparty | Settlement Date | Currency to Deliver (Thousands) | Currency to Receive (Thousands) | Unrealized Appreciation (Depreciation) (Thousands) | ||||||||||||||||||||
Bank of America | 04/05/21 | BRL | 2,958 | USD | 517 | $ | (7) | |||||||||||||||||
Bank of America | 04/09/21 | USD | 1,392 | GBP | 996 | (18) | ||||||||||||||||||
Barclays PLC | 06/04/21 | AUD | 10,317 | USD | 7,869 | 10 | ||||||||||||||||||
BNP Paribas | �� | 04/08/21 | ZAR | 9,155 | USD | 590 | (30) | |||||||||||||||||
BNP Paribas | 04/22/21 | CAD | 27,836 | USD | 21,931 | (218) | ||||||||||||||||||
BNP Paribas | 05/27/21 | EUR | 8,136 | USD | 9,722 | 149 | ||||||||||||||||||
Brown Brothers Harriman | 04/09/21 | GBP | 361 | USD | 495 | (4) | ||||||||||||||||||
Brown Brothers Harriman | 04/15/21 | SEK | 4,055 | USD | 464 | (1) | ||||||||||||||||||
Brown Brothers Harriman | 04/17/21 | USD | – | ZAR | – | – | ||||||||||||||||||
Brown Brothers Harriman | 04/22/21 | CAD | 721 | USD | 571 | (3) | ||||||||||||||||||
Brown Brothers Harriman | 04/22/21 | USD | 436 | CAD | 553 | 4 | ||||||||||||||||||
Brown Brothers Harriman | 04/22/21 | USD | 408 | CAD | 509 | (3) | ||||||||||||||||||
Brown Brothers Harriman | 05/06/21 | USD | 169 | CHF | 159 | – | ||||||||||||||||||
Brown Brothers Harriman | 05/06/21 | USD | 195 | CHF | 181 | (3) | ||||||||||||||||||
Brown Brothers Harriman | 05/20/21 | USD | 14 | JPY | 1,549 | – | ||||||||||||||||||
Brown Brothers Harriman | 05/20/21 | JPY | 35 | USD | 0 | – | ||||||||||||||||||
Brown Brothers Harriman | 05/27/21 | EUR | 334 | USD | 393 | 1 | ||||||||||||||||||
Brown Brothers Harriman | 06/04/21 | AUD | 267 | USD | 203 | – | ||||||||||||||||||
SEI Institutional Managed Trust / Semi-Annual Report / March 31, 2021 | 259 |
CONSOLIDATED SCHEDULE OF INVESTMENTS (Unaudited)
March 31, 2021
Multi-Asset Inflation Managed Fund (Continued)
| Counterparty | Settlement Date | Currency to Deliver (Thousands) | Currency to Receive (Thousands) | Unrealized Appreciation | ||||||||||||||||||||
Citigroup | 04/05/21 | BRL | 55,521 | USD | 10,135 | $ | 299 | |||||||||||||||||
Citigroup | 04/15/21 | IDR | 8,415,713 | USD | 577 | (1) | ||||||||||||||||||
Citigroup | 04/22/21 | KRW | 75,131 | USD | 69 | 2 | ||||||||||||||||||
Citigroup | 05/04/21 | USD | 164 | BRL | 932 | 1 | ||||||||||||||||||
Citigroup | 05/20/21 | JPY | 496,029 | USD | 4,681 | 189 | ||||||||||||||||||
Goldman Sachs | 05/25/21 | USD | 3,959 | RUB | 295,483 | (73) | ||||||||||||||||||
HSBC | 04/09/21 | GBP | 441 | USD | 615 | 7 | ||||||||||||||||||
HSBC | 04/15/21 | USD | 610 | IDR | 8,547,480 | (23) | ||||||||||||||||||
HSBC | 05/06/21 | USD | 8,032 | CHF | 7,235 | (335) | ||||||||||||||||||
HSBC | 05/20/21 | USD | 4,404 | JPY | 482,592 | (34) | ||||||||||||||||||
JPMorgan Chase Bank | 04/16/21 | MXN | 11,914 | USD | 554 | (27) | ||||||||||||||||||
Morgan Stanley | 04/15/21 | SEK | 83,245 | USD | 9,982 | 429 | ||||||||||||||||||
Morgan Stanley | 05/04/21 | USD | 5,341 | BRL | 30,174 | (5) | ||||||||||||||||||
Morgan Stanley | 05/27/21 | NZD | 5,523 | USD | 4,003 | 137 | ||||||||||||||||||
Morgan Stanley | 09/23/21 | MYR | 5,106 | USD | 1,234 | 7 | ||||||||||||||||||
RBS | 04/22/21 | USD | 1,233 | CAD | 1,566 | 14 | ||||||||||||||||||
Standard Bank | 04/09/21 | GBP | 466 | USD | 648 | 5 | ||||||||||||||||||
UBS | 04/05/21 | USD | 10,198 | BRL | 58,479 | 162 | ||||||||||||||||||
UBS | 04/08/21 | USD | 607 | ZAR | 9,195 | 15 | ||||||||||||||||||
UBS | 04/12/21 | USD | – | HKD | – | — | ||||||||||||||||||
UBS | 04/16/21 | USD | 579 | MXN | 11,969 | 5 | ||||||||||||||||||
UBS | 05/03/21 | BRL | – | USD | – | — | ||||||||||||||||||
UBS | 05/04/21 | BRL | 58,479 | USD | 10,184 | (159) | ||||||||||||||||||
|
| |||||||||||||||||||||||
| $ | 492 | |||||||||||||||||||||||
|
| |||||||||||||||||||||||
A list of the open OTC swap agreements held by the Fund at March 31, 2021 is as follows:
Credit Default Swaps
| ||||||||||||||||||||||||
| Counterparty | Reference Entity/ Obligation | Buy/Sell Protection | (Pays)/Receives Rate | Payment Frequency | Termination Date | Notional Amount | Value (Thousands) | Upfront Payments/ | Net Unrealized Appreciation (Depreciation) (Thousands) | |||||||||||||||
Citibank | CMBX.BBB.6 | Buy | 3.00% | Monthly | 09/17/2058 | $245 | $ | 27 | $ | 17 | $ | 10 | ||||||||||||
Citibank | CMBX.BBB.6 | Buy | 3.00% | Monthly | 09/17/2058 | 257 | 28 | 17 | 11 | |||||||||||||||
Citibank | CMBX.BBB.6 | Buy | 3.00% | Monthly | 09/17/2058 | 258 | 28 | 17 | 11 | |||||||||||||||
Citibank | CMBX.BBB.6 | Sell | 3.00% | Monthly | 05/11/2063 | (33) | (9) | (4) | (5) | |||||||||||||||
Citibank | CMBX.BBB.6 | Sell | 3.00% | Monthly | 05/11/2063 | (89) | (24) | (11) | (13) | |||||||||||||||
Citibank | CMBX.BBB.6 | Sell | 3.00% | Monthly | 05/11/2063 | (32) | (9) | (4) | (5) | |||||||||||||||
Citibank | CMBX.BBB.6 | Sell | 3.00% | Monthly | 05/11/2063 | (7) | (2) | (1) | (1) | |||||||||||||||
Citibank | CMBX.BBB.6 | Sell | 3.00% | Monthly | 05/11/2063 | (20) | (5) | (2) | (3) | |||||||||||||||
Credit Suisse | CMBX.BBB.6 | Sell | 3.00% | Monthly | 05/11/2063 | (106) | (29) | (13) | (16) | |||||||||||||||
Credit Suisse | CMBX.BBB.6 | Sell | 3.00% | Monthly | 05/11/2063 | (3) | (1) | (1) | — | |||||||||||||||
Deutsche Bank | CMBX.BBB.6 | Sell | 3.00% | Monthly | 05/11/2063 | (33) | (9) | (3) | (6) | |||||||||||||||
Citibank | CMBX.BBB.6 | Sell | 3.00% | Monthly | 05/11/2063 | (45) | (12) | (6) | (6) | |||||||||||||||
Deutsche Bank | CMBX.BBB.6 | Sell | 3.00% | Monthly | 05/11/2063 | (201) | (54) | (25) | (29) | |||||||||||||||
Citibank | CMBX.BBB.6 | Sell | 3.00% | Monthly | 05/11/2063 | (28) | (8) | (3) | (5) | |||||||||||||||
Goldman Sachs | CMBX.BBB.9 | Buy | 3.00% | Monthly | 09/17/2058 | 518 | 57 | 90 | (33) | |||||||||||||||
Goldman Sachs | CMBX.NA.BBB.6 | Sell | 3.00% | Monthly | 12/31/2049 | (435) | (117) | (31) | (86) | |||||||||||||||
Goldman Sachs | CMBX.NA.BBB.6 | Sell | 3.00% | Monthly | 12/31/2049 | (261) | (70) | (16) | (54) | |||||||||||||||
Deutsche Bank | CMBX.NA.BBB.6 | Sell | 3.00% | Monthly | 12/31/2049 | (42) | (11) | (2) | (9) | |||||||||||||||
Deutsche Bank | CMBX.NA.BBB.6 | Sell | 3.00% | Monthly | 12/31/2049 | (1,093) | (295) | (71) | (224) | |||||||||||||||
Credit Suisse | CMBX.NA.BBB.6 | Sell | 3.00% | Monthly | 12/31/2049 | (227) | (61) | (15) | (46) | |||||||||||||||
Credit Suisse | CMBX.NA.BBB.6 | Sell | 3.00% | Monthly | 12/31/2049 | (812) | (219) | (49) | (170) | |||||||||||||||
260 | SEI Institutional Managed Trust / Semi-Annual Report / March 31, 2021 |
| Counterparty | Reference Entity/ Obligation | Buy/Sell Protection | (Pays)/Receives Rate | Payment Frequency | Termination Date | Notional Amount | Value (Thousands) | Upfront Payments/ | Net Unrealized Appreciation (Depreciation) (Thousands) | |||||||||||||||||||||||||||
JPMorgan Chase | CMBX.NA.BBB.6 | Sell | 3.00% | Monthly | 05/11/2063 | $(201) | $ | (54) | $ | (19) | $ | (35) | ||||||||||||||||||||||||
Citibank | CMBX.NA.BBB.6 | Sell | 3.00% | Monthly | 05/11/2063 | (5) | (1) | (1) | — | |||||||||||||||||||||||||||
Citibank | CMBX.NA.BBB.6 | Sell | 3.00% | Monthly | 05/11/2063 | (46) | (12) | (5) | (7) | |||||||||||||||||||||||||||
Citibank | CMBX.NA.BBB.6 | Sell | 3.00% | Monthly | 05/11/2063 | (66) | (18) | (7) | (11) | |||||||||||||||||||||||||||
Citibank | CMBX.NA.BBB.6 | Sell | 3.00% | Monthly | 05/11/2063 | (93) | (25) | (10) | (15) | |||||||||||||||||||||||||||
JPMorgan Chase | CMBX.NA.BBB.6 | Sell | 3.00% | Monthly | 05/11/2063 | (49) | (13) | (5) | (8) | |||||||||||||||||||||||||||
JPMorgan Chase | CMBX.NA.BBB.6 | Sell | 3.00% | Monthly | 05/11/2063 | (46) | (12) | (4) | (8) | |||||||||||||||||||||||||||
Citibank | CMBX.NA.BBB.6 | Sell | 3.00% | Monthly | 05/11/2063 | (93) | (25) | (10) | (15) | |||||||||||||||||||||||||||
Deutsche Bank | CMBX.NA.BBB.6 | Sell | 3.00% | Monthly | 05/11/2063 | (112) | (30) | (13) | (17) | |||||||||||||||||||||||||||
Goldman Sachs | CMBX.NA.BBB.6 | Sell | 3.00% | Monthly | 05/11/2063 | (222) | (60) | (23) | (37) | |||||||||||||||||||||||||||
Deutsche Bank | CMBX.NA.BBB.6 | Sell | 3.00% | Monthly | 05/11/2063 | (113) | (30) | (13) | (17) | |||||||||||||||||||||||||||
Goldman Sachs | CMBX.NA.BBB.6 | Sell | 3.00% | Monthly | 05/11/2063 | (329) | (89) | (44) | (45) | |||||||||||||||||||||||||||
Goldman Sachs | CMBX.NA.BBB.6 | Sell | 3.00% | Monthly | 05/11/2063 | (198) | (53) | (31) | (22) | |||||||||||||||||||||||||||
Goldman Sachs | CMBX.NA.BBB.6 | Sell | 3.00% | Monthly | 05/11/2063 | (276) | (74) | (44) | (30) | |||||||||||||||||||||||||||
Goldman Sachs | CMBX.NA.BBB.6 | Sell | 3.00% | Monthly | 05/11/2063 | (194) | (52) | (16) | (36) | |||||||||||||||||||||||||||
Goldman Sachs | CMBX.NA.BBB.6 | Sell | 3.00% | Monthly | 05/11/2063 | (16) | (4) | (1) | (3) | |||||||||||||||||||||||||||
Goldman Sachs | CMBX.NA.BBB.6 | Sell | 3.00% | Monthly | 05/11/2063 | (32) | (9) | (3) | (6) | |||||||||||||||||||||||||||
Goldman Sachs | CMBX.NA.BBB.6 | Sell | 3.00% | Monthly | 05/11/2063 | (32) | (9) | (3) | (6) | |||||||||||||||||||||||||||
Citibank | CMBX.NA.BBB.6 | Sell | 3.00% | Monthly | 05/11/2063 | (21) | (6) | (2) | (4) | |||||||||||||||||||||||||||
Citibank | CMBX.NA.BBB.6 | Sell | 3.00% | Monthly | 05/11/2063 | (18) | (5) | (2) | (3) | |||||||||||||||||||||||||||
Citibank | CMBX.NA.BBB.6 | Sell | 3.00% | Monthly | 05/11/2063 | (60) | (16) | (7) | (9) | |||||||||||||||||||||||||||
Goldman Sachs | CMBX.NA.BBB.6 | Sell | 3.00% | Monthly | 05/11/2063 | (65) | (18) | (7) | (11) | |||||||||||||||||||||||||||
JPMorgan Chase | CMBX.NA.BBB.6 | Sell | 3.00% | Monthly | 05/11/2063 | (503) | (135) | (60) | (75) | |||||||||||||||||||||||||||
JPMorgan Chase | CMBX.NA.BBB.6 | Sell | 3.00% | Monthly | 05/11/2063 | (175) | (47) | (21) | (26) | |||||||||||||||||||||||||||
CGG | CMBX.NA.BBB.6 | Sell | 3.00% | Monthly | 05/11/2063 | (33) | (9) | (4) | (5) | |||||||||||||||||||||||||||
Citibank | CMBX.NA.BBB.6 | Sell | 3.00% | Monthly | 05/11/2063 | (30) | (8) | (4) | (4) | |||||||||||||||||||||||||||
Morgan Stanley | CMBX.NA.BBB-.9 | Buy | 3.00% | Monthly | 09/17/2058 | 553 | 61 | 113 | (52) | |||||||||||||||||||||||||||
JPMorgan Chase | CMBX.NA.BBB-.9 | Buy | 3.00% | Monthly | 09/17/2058 | 184 | 20 | 37 | (17) | |||||||||||||||||||||||||||
Citibank | CMBX.NA.BBB-.9 | Buy | 3.00% | Monthly | 09/17/2058 | 553 | 61 | 111 | (50) | |||||||||||||||||||||||||||
Citibank | CMBX.NA.BBB-.9 | Buy | 3.00% | Monthly | 09/17/2058 | 553 | 61 | 111 | (50) | |||||||||||||||||||||||||||
Citibank | CMBX.NA.BBB-.9 | Buy | 3.00% | Monthly | 09/17/2058 | 1,782 | 195 | 361 | (166) | |||||||||||||||||||||||||||
Citibank | CMBX.NA.BBB-.9 | Buy | 3.00% | Monthly | 09/17/2058 | 891 | 98 | 177 | (79) | |||||||||||||||||||||||||||
Citibank | CMBX.NA.BBB-.9 | Buy | 3.00% | Monthly | 09/17/2058 | 45 | 39 | 9 | 30 | |||||||||||||||||||||||||||
Citibank | CMBX.NA.BBB-.9 | Buy | 3.00% | Monthly | 09/17/2058 | 43 | 38 | 9 | 29 | |||||||||||||||||||||||||||
Citibank | CMBX.NA.BBB-.9 | Buy | 3.00% | Monthly | 09/17/2058 | 1,045 | 115 | 76 | 39 | |||||||||||||||||||||||||||
Citibank | CMBX.NA.BBB-.9 | Buy | 3.00% | Monthly | 09/17/2058 | 1,045 | 115 | 73 | 42 | |||||||||||||||||||||||||||
Citibank | CMBX.NA.BBB-.9 | Buy | 3.00% | Monthly | 09/17/2058 | 594 | 142 | 40 | 102 | |||||||||||||||||||||||||||
Morgan Stanley | CMBX.NA.BBB-.9 | Buy | 3.00% | Monthly | 09/17/2058 | 276 | 30 | 54 | (24) | |||||||||||||||||||||||||||
Citibank | CMBX.NA.BBB-.9 | Buy | 3.00% | Monthly | 09/17/2058 | 523 | 57 | 40 | 17 | |||||||||||||||||||||||||||
Credit Suisse | CMBX-A-.6 | Sell | 2.00% | Monthly | 05/11/2063 | (1,305) | (103) | (28) | (75) | |||||||||||||||||||||||||||
|
|
|
|
|
| |||||||||||||||||||||||||||||||
| $ | (680) | $ | 708 | $ | (1,388) | |||||||||||||||||||||||||||||||
|
|
|
|
|
| |||||||||||||||||||||||||||||||
| Total Return Swaps | ||||||||||||||||||||||||||
| Counterparty | Reference Entity/ Obligation | Fund Pays | Fund Receives | Payment Frequency | Termination Date | Currency | Notional Amount (Thousands) | Value (Thousands) | Upfront Payments/ Receipts (Thousands) | Net Unrealized Appreciation (Depreciation) (Thousands) | ||||||||||||||||
Barclays PLC | IBOX.HY | 3-Month USD LIBOR | IBOX.HY | Quarterly | 06/20/2021 | USD | 16,070 | $ | (173 | ) | $ | 8 | $ | (181) | ||||||||||||
Macquarie Bank | BLOOMBERG COMMODITY INDEX TOTAL RETURN | US T-BILL HIGH DISCOUNT RATE + 9 BPS | BLOOMBERG COMMODITY INDEX TOTAL RETURN | Monthly | 04/07/2021 | USD | (11,121) | (237 | ) | – | (237) | |||||||||||||||
Macquarie Bank | MACQUARIE COMMODITY PRODUCT 251E | 0.32% | MACQUARIE COMMODITY PRODUCT 251E | Monthly | 04/07/2021 | USD | (2,759) | (32 | ) | – | (32) | |||||||||||||||
Merrill Lynch(A) | BLOOMBERG COMMODITY INDEX 2 MONTH FORWARD TR | US T-BILL HIGH DISCOUNT RATE + 12 BPS | BLOOMBERG COMMODITY INDEX 2 MONTH FORWARD TR | Monthly | 04/07/2021 | USD | (1,862) | (32 | ) | – | (32) | |||||||||||||||
SEI Institutional Managed Trust / Semi-Annual Report / March 31, 2021 | 261 |
CONSOLIDATED SCHEDULE OF INVESTMENTS (Unaudited)
March 31, 2021
Multi-Asset Inflation Managed Fund (Continued)
| Total Return Swaps (continued) | ||||||||||||||||||||||||||||||||||||||||
| Counterparty | Reference Entity/ Obligation | Fund Pays | Fund Receives | Payment Frequency | Termination Date | Currency | Notional Amount (Thousands) | Value (Thousands) | Upfront Payments/ Receipts (Thousands) | Net Unrealized Appreciation (Depreciation) (Thousands) | ||||||||||||||||||||||||||||||
Merrill Lynch(A) | BLOOMBERG COMMODITY | US T-BILL HIGH | BLOOMBERG | |||||||||||||||||||||||||||||||||||||
| INDEX TOTAL RETURN | | DISCOUNT RATE + 11 BPS | | | COMMODITY INDEX TOTAL RETURN | | Monthly | 04/07/2021 | USD | (13,237) | $ | (282 | ) | $ | – | $ | (282 | ) | ||||||||||||||||||||||
Merrill Lynch(A) | BofA Merrill Lynch | BofA Merrill Lynch | ||||||||||||||||||||||||||||||||||||||
| Commodity MLBXCS3T | 3-Month U.S. Treasury | Commodity MLBXCS3T | ||||||||||||||||||||||||||||||||||||||
| Tot Ret | rate plus 16 BPS | Tot Ret | Monthly | 04/07/2021 | USD | (2,891) | (40 | ) | – | (40 | ) | |||||||||||||||||||||||||||||
Societe Generale(A) | BLOOMBERG COMMODITY | US T-BILL HIGH | BLOOMBERG | |||||||||||||||||||||||||||||||||||||
| INDEX 2 MONTH | DISCOUNT RATE + | COMMODITY INDEX 2 | ||||||||||||||||||||||||||||||||||||||
| FORWARD TR | 14 BPS | MONTH FORWARD TR | Monthly | 04/07/2021 | USD | (2,029) | (35 | ) | – | (35 | ) | |||||||||||||||||||||||||||||
Societe Generale(A) | BLOOMBERG COMMODITY | US T-BILL HIGH | BLOOMBERG | |||||||||||||||||||||||||||||||||||||
| INDEX TOTAL RETURN | DISCOUNT RATE + | COMMODITY INDEX | ||||||||||||||||||||||||||||||||||||||
| 11 BPS | TOTAL RETURN | Monthly | 04/07/2021 | USD | (8,103) | (173 | ) | – | (173 | ) | ||||||||||||||||||||||||||||||
Societe Generale(A) | SOCIETE GENERALE | SOCIETE GENERALE | ||||||||||||||||||||||||||||||||||||||
| COMMODITIES CUSTOM | COMMODITIES CUSTOM | |||||||||||||||||||||||||||||||||||||||
| ALPHA 061 | 0.35% | ALPHA 061 | Monthly | 04/07/2021 | USD | (4,406) | (2 | ) | – | (2 | ) | |||||||||||||||||||||||||||||
|
| |||||||||||||||||||||||||||||||||||||||
| $ | (1,006 | ) | $ | 8 | $ | (1,014 | ) | |||||||||||||||||||||||||||||||||
|
| |||||||||||||||||||||||||||||||||||||||
| A list of the open centrally cleared swap agreements held by the Fund at March 31, 2021 is as follows: |
| Credit Default Swaps | ||||||||||||||||||||||||||||||||
| Reference Entity/Obligation | Buy/Sell Protection | (Pays)/Receives Rate | Payment Frequency | Termination Date | Notional Amount (Thousands) | Value (Thousands) | Upfront Payments/ Receipts | Net Unrealized Appreciation (Depreciation) (Thousands) | ||||||||||||||||||||||||
CDX.NAIG.34.V1 | Buy | 1.00% | Quarterly | 06/20/2025 | $ | 83,710 | $ | (1,507 | ) | $ | (262 | ) | $ | (1,245 | ) | |||||||||||||||||
CDX.NAIG.34.V1 | Sell | 1.00% | Quarterly | 06/20/2025 | (83,710 | ) | 1,507 | 1,421 | 86 | |||||||||||||||||||||||
CDX.NAIG.36.V1 | Buy | 1.00% | Quarterly | 06/20/2026 | 83,710 | (1,957 | ) | (1,805 | ) | (152 | ) | |||||||||||||||||||||
China | Sell | 1.00% | Quarterly | 06/20/2025 | (21,400 | ) | 675 | 678 | (3 | ) | ||||||||||||||||||||||
China | Buy | 1.00% | Quarterly | 06/20/2026 | 21,400 | (717 | ) | (726 | ) | 9 | ||||||||||||||||||||||
Malaysia | Buy | 1.00% | Quarterly | 12/20/2025 | 39,000 | (1,078 | ) | (918 | ) | (160 | ) | |||||||||||||||||||||
Malaysia | Sell | 1.00% | Quarterly | 12/20/2025 | (19,025 | ) | 526 | 544 | (18 | ) | ||||||||||||||||||||||
Malaysia | Sell | 1.00% | Quarterly | 12/20/2025 | (19,975 | ) | 552 | 563 | (11 | ) | ||||||||||||||||||||||
Malaysia | Buy | 1.00% | Quarterly | 06/20/2026 | 39,000 | (1,096 | ) | (1,117 | ) | 21 | ||||||||||||||||||||||
People’s Republic of China | Buy | 1.00% | Quarterly | 06/20/2025 | 21,400 | (675 | ) | (428 | ) | (247 | ) | |||||||||||||||||||||
|
|
|
|
|
| |||||||||||||||||||||||||||
| $ | (3,770 | ) | $ | (2,050 | ) | $ | (1,720 | ) | ||||||||||||||||||||||||
|
|
|
|
|
| |||||||||||||||||||||||||||
| Interest Rate Swaps | ||||||||||||||||||||||||
| Fund Pays | Fund Receives | Payment Frequency | Termination Date | Currency | Notional Amount (Thousands) | Value (Thousands) | Upfront Payments/ Receipts (Thousands) | Net Unrealized Appreciation (Depreciation) (Thousands) | ||||||||||||||||
-0.0165% | 3-MONTH SEK - STIBOR | Annually | 08/30/2024 | SEK | 153,850 | $ | (184 | ) | $ | – | $ | (184 | ) | |||||||||||
-0.043% | 6-MONTH EUR - EURIBOR | Annually | 11/10/2050 | EUR | 3,030 | (539 | ) | – | (539 | ) | ||||||||||||||
3-MONTH USD - LIBOR | 2.631% | Quarterly | 11/10/2035 | USD | 1,190 | (101 | ) | – | (101 | ) | ||||||||||||||
3-MONTH USD - LIBOR | 1.593% | Quarterly | 09/27/2029 | USD | 2,230 | 11 | – | 11 | ||||||||||||||||
3-MONTH USD - LIBOR | 2.1495% | Quarterly | 06/04/2029 | USD | 4,220 | (205 | ) | – | (205 | ) | ||||||||||||||
3-MONTH USD - LIBOR | 2.3545 | Quarterly | 07/12/2027 | USD | 1,075 | (73 | ) | – | (73 | ) | ||||||||||||||
3-MONTH USD - LIBOR | 0.5575% | Quarterly | 06/05/2027 | USD | 15,800 | 693 | – | 693 | ||||||||||||||||
3-MONTH USD - LIBOR | 2.44 | Quarterly | 04/04/2027 | USD | 10,400 | (829 | ) | – | (829 | ) | ||||||||||||||
3-MONTH USD - LIBOR | 1.67 | Quarterly | 11/09/2026 | USD | 1,490 | (40 | ) | – | (40 | ) | ||||||||||||||
3-MONTH USD - LIBOR | 1.66 | Quarterly | 11/08/2026 | USD | 1,490 | (39 | ) | – | (39 | ) | ||||||||||||||
3-MONTH USD - LIBOR | 1.60% | Quarterly | 10/25/2026 | USD | 6,110 | (179 | ) | – | (179 | ) | ||||||||||||||
3-MONTH USD - LIBOR | 2.293% | Quarterly | 08/04/2025 | USD | 2,717 | (173 | ) | – | (173 | ) | ||||||||||||||
3-MONTH USD - LIBOR | 2.49% | Quarterly | 06/09/2025 | USD | 1,710 | (130 | ) | – | (130 | ) | ||||||||||||||
2.31% | 3-MONTH USD -LIBOR | Quarterly | 05/18/2025 | USD | 2,820 | (195 | ) | – | (195 | ) | ||||||||||||||
3-MONTH USD - LIBOR | 1.99% | Semi-Annually | 04/21/2025 | USD | – | – | – | – | ||||||||||||||||
3-MONTH USD - LIBOR | 1.99% | Quarterly | 04/21/2025 | USD | 2,760 | (155 | ) | – | (155 | ) | ||||||||||||||
6-MONTH EUR - EURIBOR | .022% | Semi-Annually | 11/10/2050 | EUR | 3,030 | 473 | 23 | 450 | ||||||||||||||||
CAD @ 2.297% | CDOR 3M | Semi-Annually | 03/03/2051 | CAD | 1,870 | 77 | – | 77 | ||||||||||||||||
262 | SEI Institutional Managed Trust / Semi-Annual Report / March 31, 2021 |
| Fund Pays | Fund Receives | Payment Frequency | Termination Date | Currency | Notional Amount (Thousands) | Value (Thousands) | Upfront Payments/ Receipts (Thousands) | Net Unrealized Appreciation (Depreciation) (Thousands) | ||||||||||||||||||||||
CAD @ 2.3325% | CDOR 3M | Semi-Annually | 03/03/2051 | CAD | 1,870 | $ | 55 | $ | – | $ | 55 | |||||||||||||||||||
|
|
|
|
|
| |||||||||||||||||||||||||
| $ | (1,532) | $ | 23 | $ | (1,555) | |||||||||||||||||||||||||
|
|
|
|
|
| |||||||||||||||||||||||||
A list of the open reverse repurchase agreements held by the Fund at March 31, 2021 is as follows:
| Multi-Asset Real Return Fund | ||||||||||
Principal Amount ($ Thousands) | Counterparty | Value ($ Thousands) | ||||||||
| $ (13,538 | ) | Chase Securities | 0.08% | $ | (13,538) | |||||
| (16,133 | ) | Chase Securities | 0.08% | (16,133) | ||||||
| (20,396 | ) | Chase Securities | 0.08% | (20,396) | ||||||
| (22,425 | ) | Chase Securities | 0.08% | (22,425) | ||||||
| (27,226 | ) | Chase Securities | 0.08% | (27,226) | ||||||
| (30,062 | ) | Chase Securities | 0.08% | (30,062) | ||||||
| (49,065 | ) | Chase Securities | 0.08% | (49,065) | ||||||
| (19,710 | ) | Chase Securities | 0.10% | (19,710) | ||||||
| (3,124 | ) | Chase Securities | 0.12% | (3,124) | ||||||
| (7,931 | ) | Chase Securities | 0.12% | (7,931) | ||||||
| (10,575 | ) | Chase Securities | 0.13% | (10,575) | ||||||
| (18,170 | ) | Chase Securities | 0.14% | (18,170) | ||||||
| (14,659 | ) | Chase Securities | 0.16% | (14,659) | ||||||
| (10,124 | ) | Chase Securities | 0.17% | (10,124) | ||||||
|
| |||||||||
| $ | (263,138) | |||||||||
|
| |||||||||
Percentages are based on Net Assets of $810,875 ($ Thousands). |
| * | Non-income producing security. |
| ‡ | Real Estate Investment Trust. |
| (A) | Security, or a portion thereof, is held by the Accumulation Commodity Strategy Subsidiary, Ltd. as of March 31, 2021. |
| (B) | Zero coupon security. The rate shown on the Schedule of Investments is the security’s effective yield at the time of purchase. |
| (C) | Security is a Master Limited Partnership. At March 31, 2021, such securities amounted to $36 ($ Thousands), or 0.0% of the Net Assets of the Fund (See Note 2). |
| (D) | Security exempt from registration under Rule 144A of the Securities Act of 1933. These securities may be resold in transactions exempt from registration normally to qualified institutions. On March 31, 2021, the value of these securities amounted to $88,997 ($ Thousands), representing 11.0% of the Net Assets of the Fund. |
| (E) | Security is in default on interest payment. |
| (F) | Perpetual security with no stated maturity date. |
| (G) | Refer to table below for details on Options Contracts. |
AUD — Australian Dollar |
BPS— Basis Points |
BRL — Brazilian Real |
CAD — Canadian Dollar |
Cl — Class |
CLO — Collateralized Loan Obligation |
CHF — Swiss franc |
CMBX — Commercial Mortgage-Backed Index |
CMO — Collateralized Mortgage Obligation |
DAC — Designated Activity Company |
DN — Discount Note |
EAFE — Europe, Australasia and Far East |
EUR — Euro |
FFCB — Federal Farm Credit Bank |
FHLB — Federal Home Loan Bank |
FHLMC —Federal Home Loan Mortgage Corporation |
FNMA — Federal National Mortgage Association |
GBP — British Pound Sterling |
GNMA — Government National Mortgage Association
GO — General Obligation
HKD — Hong Kong Dollar
HRW — Hard Red Winter
ICE — Intercontinental Exchange
IDR — Indonesian Rupiah
IO — Interest Only — face amount represents notional amount.
JPY — Japanese Yen
KRW — Korean Won
LIBOR— London Interbank Offered Rate
LME — London Metal Exchange
Ltd. — Limited
MSCI — Morgan Stanley Capital International
MTN — Medium Term Note
MXN — Mexican Peso
MYR — Malaysian Ringgit
NZD — New Zealand Dollar
OTC — Over The Counter
PLC — Public Limited Company
RB — Revenue Bond
REMIC — Real Estate Mortgage Investment Conduit
RUB — Russian Ruble
S&P — Standard & Poor’s
SEK — Swedish Krona
Ser — Series
STIBOR — Stockholm Interbank Offered Rate
TBA — To Be Announced
ULC — Unlimited Liability Company
ULSD — Ultra-Low Sulfur Diesel
USD — U.S. Dollar
WTI — West Texas Intermediate
VAR — Variable Rate
ZAR — South African Rand
The following is a list of the level of inputs used as of March 31, 2021, in valuing the Fund’s investments and other financial instruments carried at value ($ Thousands):
| Investments in Securities | Level 1 ($) | Level 2 ($) | Level 3 ($) | Total ($) | ||||||||||||
U.S. Treasury Obligations | – | 522,141 | – | 522,141 | ||||||||||||
Common Stock | 246,184 | – | – | 246,184 | ||||||||||||
Corporate Obligations | – | 119,406 | – | 119,406 | ||||||||||||
Mortgage-Backed Securities | – | 77,088 | – | 77,088 | ||||||||||||
U.S. Government Agency Obligations | – | 53,500 | – | 53,500 | ||||||||||||
Asset-Backed Securities | – | 15,642 | – | 15,642 | ||||||||||||
Sovereign Debt | – | 14,469 | – | 14,469 | ||||||||||||
Foreign Common Stock | 2,377 | – | – | 2,377 | ||||||||||||
Municipal Bonds | – | 2,302 | – | 2,302 | ||||||||||||
Warrant | 79 | – | – | 79 | ||||||||||||
|
|
|
|
|
|
|
| |||||||||
Total Investments in Securities | 248,640 | 804,548 | – | 1,053,188 | ||||||||||||
|
|
|
|
|
|
|
| |||||||||
Securities Sold Short | ||||||||||||||||
Common Stock | (107,722) | – | – | (107,722) | ||||||||||||
Foreign Common Stock | (4,121) | – | – | (4,121) | ||||||||||||
Preferred Stock | (5) | – | – | (5) | ||||||||||||
|
|
|
|
|
|
|
| |||||||||
Total Securities Sold Short | (111,848) | – | – | (111,848) | ||||||||||||
|
|
|
|
|
|
|
| |||||||||
SEI Institutional Managed Trust / Semi-Annual Report / March 31, 2021 | 263 |
CONSOLIDATED SCHEDULE OF INVESTMENTS (Unaudited)
March 31, 2021
Multi-Asset Inflation Managed Fund (Concluded)
| Other Financial Instruments | Level 1 ($) | Level 2 ($) | Level 3 ($) | Total ($) | ||||||||||||
Purchased Options | 1,500 | – | – | 1,500 | ||||||||||||
Written Options | (631) | – | – | (631) | ||||||||||||
Futures Contracts* | ||||||||||||||||
Unrealized Appreciation | 8,163 | – | – | 8,163 | ||||||||||||
Unrealized Depreciation | (3,060) | – | – | (3,060) | ||||||||||||
Forwards Contracts* | ||||||||||||||||
Unrealized Appreciation | – | 1,436 | – | 1,436 | ||||||||||||
Unrealized Depreciation | – | (944) | – | (944) | ||||||||||||
OTC Swaps | ||||||||||||||||
Credit Default Swaps* | ||||||||||||||||
Unrealized Appreciation | – | 291 | – | 291 | ||||||||||||
Unrealized Depreciation | – | (1,679) | – | (1,679) | ||||||||||||
Total Return Swaps* | ||||||||||||||||
Unrealized Depreciation | – | (1,014) | – | (1,014) | ||||||||||||
Centrally Cleared Swaps | ||||||||||||||||
Credit Default Swaps* | ||||||||||||||||
Unrealized Appreciation | – | 116 | – | 116 | ||||||||||||
Unrealized Depreciation | – | (1,836) | – | (1,836) | ||||||||||||
Interest Rate Swaps* | ||||||||||||||||
Unrealized Appreciation | – | 1,286 | – | 1,286 | ||||||||||||
Unrealized Depreciation | – | (2,841) | – | (2,841) | ||||||||||||
Reverse Repurchase Agreements | – | (263,138) | – | (263,138) | ||||||||||||
|
|
|
|
|
|
|
| |||||||||
Total Other Financial Instruments | 5,972 | (268,323) | – | (262,351) | ||||||||||||
|
|
|
|
|
|
|
| |||||||||
* Futures contracts, forward contracts and swap contracts are valued at the unrealized appreciation (depreciation) on the instrument.
For the period ended March 31, 2021, there were no transfers in or out of Level 3.
For more information on valuation inputs, see Note 2 – Significant Accounting Policies in Notes to Financial Statements.
Amounts designated as “—” are either $0 or have been rounded to $0.
The accompanying notes are an integral part of the financial statements.
| 264 | SEI Institutional Managed Trust / Semi-Annual Report / March 31, 2021 |
SCHEDULE OF INVESTMENTS (Unaudited)
March 31, 2021
Multi-Asset Capital Stability Fund
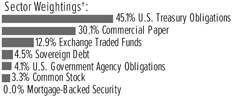
†Percentages are based on total investments.
| Description | Face Amount (Thousands) | Market Value ($ Thousands) | ||||||
U.S. TREASURY OBLIGATIONS — 30.1% |
| |||||||
U.S. Treasury Bills | ||||||||
0.155%, 04/29/2021 (A) | $ | 147,497 | $ | 147,495 | ||||
0.071%, 04/22/2021 (A) | 36,914 | 36,914 | ||||||
U.S. Treasury Inflation Protected Securities | ||||||||
3.875%, 04/15/2029 | 621 | 871 | ||||||
3.625%, 04/15/2028 | 363 | 489 | ||||||
3.375%, 04/15/2032 | 155 | 225 | ||||||
2.500%, 01/15/2029 | 310 | 396 | ||||||
2.375%, 01/15/2025 | 623 | 729 | ||||||
2.375%, 01/15/2027 | 342 | 418 | ||||||
2.125%, 02/15/2040 | 242 | 345 | ||||||
2.125%, 02/15/2041 | 258 | 371 | ||||||
2.000%, 01/15/2026 | 472 | 557 | ||||||
1.750%, 01/15/2028 | 338 | 406 | ||||||
1.375%, 02/15/2044 | 508 | 660 | ||||||
1.000%, 02/15/2046 | 301 | 367 | ||||||
1.000%, 02/15/2048 | 308 | 381 | ||||||
1.000%, 02/15/2049 | 289 | 360 | ||||||
0.875%, 01/15/2029 | 6,998 | 8,650 | ||||||
0.875%, 02/15/2047 | 353 | 423 | ||||||
0.750%, 07/15/2028 | 710 | 809 | ||||||
0.750%, 02/15/2042 | 544 | 626 | ||||||
0.750%, 02/15/2045 | 517 | 595 | ||||||
0.625%, 04/15/2023 | 937 | 997 | ||||||
0.625%, 01/15/2024 | 962 | 1,043 | ||||||
0.625%, 01/15/2026 | 925 | 1,028 | ||||||
0.625%, 02/15/2043 | 326 | 366 | ||||||
0.500%, 04/15/2024 | 652 | 707 | ||||||
0.500%, 01/15/2028 | 914 | 1,017 | ||||||
0.375%, 07/15/2023 | 1,209 | 1,295 | ||||||
0.375%, 07/15/2025 | 976 | 1,075 | ||||||
0.375%, 01/15/2027 | 862 | 950 | ||||||
0.375%, 07/15/2027 | 878 | 973 | ||||||
0.250%, 01/15/2025 | 1,214 | 1,318 | ||||||
0.250%, 07/15/2029 | 670 | 736 | ||||||
0.250%, 02/15/2050 | 368 | 382 | ||||||
0.125%, 04/15/2022 | 857 | 881 | ||||||
0.125%, 07/15/2022 | 1,012 | 1,052 | ||||||
0.125%, 01/15/2023 | 1,281 | 1,344 | ||||||
0.125%, 07/15/2024 | 910 | 984 | ||||||
0.125%, 10/15/2024 | 868 | 938 | ||||||
0.125%, 04/15/2025 | 1,074 | 1,162 | ||||||
0.125%, 10/15/2025 | 689 | 750 | ||||||
| Description | Face Amount (Thousands) | Market Value ($ Thousands) | ||||||
U.S. TREASURY OBLIGATIONS (continued) |
| |||||||
0.125%, 07/15/2026 | $ | 872 | $ | 953 | ||||
0.125%, 01/15/2030 | 843 | 911 | ||||||
0.125%, 07/15/2030 | 1,135 | 1,231 | ||||||
0.125%, 01/15/2031 | 712 | 765 | ||||||
0.125%, 02/15/2051 | 212 | 212 | ||||||
|
| |||||||
Total U.S. Treasury Obligations (Cost $221,467) ($ Thousands) | 225,157 | |||||||
|
| |||||||
COMMERCIAL PAPER (A) — 20.1% |
| |||||||
Canadian Natural Resources | ||||||||
0.320%, 04/21/2021 | 10,000 | 9,998 | ||||||
Centennial Energy Holdings | ||||||||
0.350%, 04/05/2021 | 5,000 | 5,000 | ||||||
CNPC Finance HK | ||||||||
0.340%, 04/09/2021 | 13,000 | 12,999 | ||||||
Conagra Brands | ||||||||
0.350%, 04/05/2021 | 14,000 | 13,999 | ||||||
Exelon Generation | ||||||||
0.551%, 05/10/2021 | 13,850 | 13,847 | ||||||
General Motors Financial | ||||||||
0.360%, 04/09/2021 | 5,000 | 5,000 | ||||||
0.360%, 04/28/2021 | 5,000 | 4,998 | ||||||
Harley-Davidson Financial Services | ||||||||
0.340%, 04/08/2021 | 7,000 | 7,000 | ||||||
0.340%, 04/12/2021 | 6,000 | 5,999 | ||||||
Humana | ||||||||
0.300%, 05/25/2021 | 5,000 | 4,996 | ||||||
Intesa Sanpaolo Funding | ||||||||
0.250%, 04/16/2021 | 14,100 | 14,097 | ||||||
Jabil | ||||||||
0.600%, 04/05/2021 | 6,000 | 5,999 | ||||||
Romulus Funding | ||||||||
0.752%, 04/06/2021 | 13,800 | 13,799 | ||||||
Smithfield Foods | ||||||||
0.280%, 04/01/2021 | 10,450 | 10,450 | ||||||
Syngenta Wilmington | ||||||||
0.801%, 04/05/2021 | 14,150 | 14,149 | ||||||
Walgreens Boots Alliance | ||||||||
0.270%, 05/18/2021 | 8,050 | 8,047 | ||||||
|
| |||||||
Total Commercial Paper (Cost $150,377) ($ Thousands) | 150,377 | |||||||
|
| |||||||
| Shares | ||||||||
|
| |||||||
EXCHANGE TRADED FUNDS — 8.6% |
| |||||||
Italy — 0.0% | ||||||||
Lyxor FTSE MIB UCITS ETF | 4,800 | 134 | ||||||
|
| |||||||
United States — 8.6% | ||||||||
iShares MSCI Hong Kong ETF | 17,953 | 477 | ||||||
Energy Select Sector SPDR Fund | 42,224 | 2,071 | ||||||
Financial Select Sector SPDR Fund | 20,972 | 714 | ||||||
| SEI Institutional Managed Trust / Semi-Annual Report / March 31, 2021 | 265 |
SCHEDULE OF INVESTMENTS (Unaudited)
March 31, 2021
Multi-Asset Capital Stability Fund (Continued)
| Description | Shares | Market Value ($ Thousands) | ||||||
EXCHANGE TRADED FUNDS (continued) |
| |||||||
Industrial Select Sector SPDR Fund | 4,446 | $ | 438 | |||||
Invesco QQQ Trust Series, Ser 1 | 1,889 | 603 | ||||||
iShares Core S&P 500 ETF | 78,425 | 31,199 | ||||||
Materials Select Sector SPDR Fund | 7,129 | 562 | ||||||
SPDR S&P Homebuilders ETF | 2,335 | 164 | ||||||
Technology Select Sector SPDR Fund | 3,604 | 479 | ||||||
Vanguard Intermediate-Term Corporate Bond ETF | 31,173 | 2,900 | ||||||
Vanguard S&P 500 ETF | 58,148 | 21,184 | ||||||
Vanguard Small-Capital ETF | 13,790 | 2,952 | ||||||
Xtrackers Harvest CSI 300 China A-Shares ETF | 7,408 | 286 | ||||||
|
| |||||||
| 64,029 | ||||||||
|
| |||||||
Total Exchange Traded Funds | 64,163 | |||||||
|
| |||||||
| Face Amount (Thousands) | ||||||||
SOVEREIGN DEBT — 3.0% |
| |||||||
Japanese Government CPI Linked Bond | ||||||||
0.100%, 03/10/2026 | JPY 1,377,118 | 12,594 | ||||||
0.100%, 03/10/2027 | 1,100,956 | 10,063 | ||||||
|
| |||||||
Total Sovereign Debt (Cost $23,985) ($ Thousands) | 22,657 | |||||||
|
| |||||||
U.S. GOVERNMENT AGENCY OBLIGATIONS — 2.7% |
| |||||||
FHLB | ||||||||
2.000%, 09/09/2022 | $ | 14,285 | 14,664 | |||||
1.375%, 02/17/2023 | 4,655 | 4,760 | ||||||
0.125%, 08/12/2022 | 900 | 899 | ||||||
|
| |||||||
Total U.S. Government Agency Obligations | 20,323 | |||||||
|
| |||||||
| Shares | ||||||||
COMMON STOCK — 2.2% |
| |||||||
United Kingdom — 0.0% |
| |||||||
Medtronic PLC | 898 | 106 | ||||||
|
| |||||||
United States — 2.2% |
| |||||||
Communication Services — 0.3% |
| |||||||
Facebook Inc, Cl A * | 946 | 279 | ||||||
Netflix Inc * | 515 | 269 | ||||||
Walt Disney Co/The | 5,917 | 1,092 | ||||||
World Wrestling Entertainment Inc, Cl A | 11,047 | 599 | ||||||
|
| |||||||
| 2,239 | ||||||||
|
| |||||||
| Description | Shares | Market Value ($ Thousands) | ||||||
COMMON STOCK (continued) |
| |||||||
Consumer Discretionary — 1.1% |
| |||||||
Amazon.com Inc, Cl A * | 48 | $ | 148 | |||||
AMC Entertainment Holdings, Cl A | 4,945 | 51 | ||||||
AutoZone Inc * | 444 | 624 | ||||||
Caesars Entertainment Inc * | 3,422 | 299 | ||||||
Carnival Corp * | 22,915 | 608 | ||||||
Ford Motor Co * | 92,276 | 1,130 | ||||||
General Motors Co | 19,329 | 1,111 | ||||||
Hovnanian Enterprises, Cl A * | 361 | 38 | ||||||
KB Home | 79 | 4 | ||||||
Las Vegas Sands Corp | 44,895 | 2,728 | ||||||
Lennar Corp, Cl A | 138 | 14 | ||||||
Magna International Inc, Cl A | 1,899 | 167 | ||||||
MGM Resorts International | 6,355 | 241 | ||||||
Norwegian Cruise Line Holdings Ltd * | 22,741 | 627 | ||||||
PulteGroup Inc | 243 | 13 | ||||||
Royal Caribbean Cruises Ltd | 6,107 | 523 | ||||||
Toll Brothers Inc | 689 | 39 | ||||||
Tri Pointe Homes Inc * | 187 | 4 | ||||||
|
| |||||||
| 8,369 | ||||||||
|
| |||||||
Financials — 0.5% |
| |||||||
American Express Co | 96 | 14 | ||||||
Bank of New York Mellon Corp/The | 901 | 42 | ||||||
Berkshire Hathaway Inc, Cl B * | 214 | 55 | ||||||
Cboe Global Markets Inc | 529 | 52 | ||||||
Citigroup Inc | 12,662 | 921 | ||||||
Discover Financial Services | 185 | 18 | ||||||
Goldman Sachs Group Inc/The | 240 | 78 | ||||||
JPMorgan Chase & Co | 7,083 | 1,078 | ||||||
MarketAxess Holdings Inc | 106 | 53 | ||||||
Morgan Stanley | 11,216 | 871 | ||||||
US Bancorp | 2,111 | 117 | ||||||
Wells Fargo & Co | 8,121 | 317 | ||||||
|
| |||||||
| 3,616 | ||||||||
|
| |||||||
Health Care — 0.0% |
| |||||||
BioNTech ADR * | 380 | 42 | ||||||
Gilead Sciences Inc | 622 | 40 | ||||||
Moderna Inc * | 248 | 32 | ||||||
Pfizer Inc | 5,108 | 185 | ||||||
Viatris Inc, Cl W * | 1,267 | 18 | ||||||
|
| |||||||
| 317 | ||||||||
|
| |||||||
Industrials — 0.2% |
| |||||||
Caterpillar Inc, Cl A | 752 | 174 | ||||||
Delta Air Lines Inc, Cl A * | 9,164 | 443 | ||||||
Southwest Airlines Co, Cl A | 7,355 | 449 | ||||||
|
| |||||||
| 1,066 | ||||||||
|
| |||||||
Information Technology — 0.1% |
| |||||||
Apple Inc | 896 | 109 | ||||||
266 | SEI Institutional Managed Trust / Semi-Annual Report / March 31, 2021 |
| Description | Shares | Market Value ($ Thousands) | ||||||
COMMON STOCK (continued) |
| |||||||
Visa Inc, Cl A | 2,199 | $ | 466 | |||||
|
| |||||||
| 575 | ||||||||
|
| |||||||
Total Common Stock | 16,288 | |||||||
|
| |||||||
Face Amount (Thousands) | ||||||||
MORTGAGE-BACKED SECURITY — 0.0% |
| |||||||
Agency Mortgage-Backed Obligations — 0.0% |
| |||||||
FNMA TBA | ||||||||
5.000%,04/30/2037 | $ | 200 | 222 | |||||
|
| |||||||
Total Mortgage-Backed Security (Cost $221) ($ Thousands) | 222 | |||||||
|
| |||||||
Total Investments in Securities — 66.7% | $ | 499,187 | ||||||
|
| |||||||
| Contracts | ||||||||
PURCHASED OPTIONS*(B) — 0.0% |
| |||||||
Total Purchased Options | 47 | $ | 22 | |||||
|
| |||||||
WRITTEN OPTIONS*(B) — (0.0)% |
| |||||||
Total Written Options (Premiums Received $134) ($ Thousands) | (87) | $ | (4) | |||||
|
| |||||||
A list of open exchange traded options held by the Fund at March 31, 2021, is as follows:
| Description | Number of Contracts | Notional Amount (Thousands) † | Exercise Price | Expiration Date | Value (Thousands) | |||||||||||||||
PURCHASED OPTIONS — 0.0% | ||||||||||||||||||||
Put Options | ||||||||||||||||||||
SPX US* | 24 | $ | 223 | $ | 3,500.00 | 4/17/2021 | $ | 6 | ||||||||||||
|
|
|
| |||||||||||||||||
Call Options | ||||||||||||||||||||
SPY UN* | 23 | 10 | 400.00 | 5/22/2021 | 16 | |||||||||||||||
|
|
|
| |||||||||||||||||
Total Purchased Options | 233 | $ | 22 | |||||||||||||||||
|
|
|
| |||||||||||||||||
WRITTEN OPTIONS — (0.0)% | ||||||||||||||||||||
Put Options | ||||||||||||||||||||
SPX US* | (40 | ) | $ | (44) | 2,500.00 | 04/17/21 | $ | (1) | ||||||||||||
SPX US* | (24 | ) | (82) | 3,050.00 | 04/17/21 | (2) | ||||||||||||||
SPY UN* | (23 | ) | (8) | 310.00 | 05/22/21 | (1) | ||||||||||||||
|
|
|
| |||||||||||||||||
Total Written Options | (134) | $ | (4) | |||||||||||||||||
|
|
|
| |||||||||||||||||
†Represents cost.
SEI Institutional Managed Trust / Semi-Annual Report / March 31, 2021 | 267 |
SCHEDULE OF INVESTMENTS (Unaudited)
March 31, 2021
Multi-Asset Capital Stability Fund (Continued)
A list of the open futures contracts held by the Fund at March 31, 2021, is as follows:
| Type of Contract | Number of Contracts Long (Short) | Expiration Date | Notional Amount (Thousands) | Value (Thousands) | Unrealized Appreciation (Depreciation) (Thousands) | |||||||||||||||
Australian 3-Year Bond | 30 | Jun-2021 | $ | 2,713 | $ | 2,674 | $ | 2 | ||||||||||||
Amsterdam Index | 5 | Apr-2021 | 809 | 822 | 23 | |||||||||||||||
Australian 10-Year Bond | 13 | Jun-2021 | 1,385 | 1,367 | 3 | |||||||||||||||
CAC40 10 Euro Index | 12 | Apr-2021 | 864 | 855 | 2 | |||||||||||||||
Canadian 10-Year Bond | 65 | Jun-2021 | 7,329 | 7,177 | (181) | |||||||||||||||
DAX Index | 1 | Jun-2021 | 432 | 441 | 13 | |||||||||||||||
Euro STOXX 50 | (29 | ) | Jun-2021 | (1,308) | (1,318) | (26) | ||||||||||||||
FTSE 100 Index | (31 | ) | Jun-2021 | (2,885) | (2,857) | 15 | ||||||||||||||
FTSE 100 Index | 23 | Jun-2021 | 2,136 | 2,120 | (7) | |||||||||||||||
FTSE MIB Index | 1 | Jun-2021 | 143 | 143 | 2 | |||||||||||||||
IBEX | 2 | Apr-2021 | 204 | 202 | – | |||||||||||||||
Japanese 10-Year Bond | (11 | ) | Jun-2021 | (15,282) | (15,048) | (26) | ||||||||||||||
Long Gilt 10-Year Bond | 21 | Jul-2021 | 3,811 | 3,697 | (46) | |||||||||||||||
MSCI EAFE Index | 193 | Jun-2021 | 21,220 | 21,153 | (67) | |||||||||||||||
MSCI Emerging Markets | 64 | Jun-2021 | 4,244 | 4,232 | (12) | |||||||||||||||
MSCI Singapore Index | 53 | May-2021 | 1,402 | 1,412 | 8 | |||||||||||||||
NASDAQ 100 Index E-MINI | 20 | Jun-2021 | 5,238 | 5,236 | (2) | |||||||||||||||
Nikkei 225 Index | (4 | ) | Jun-2021 | (578) | (587) | (10) | ||||||||||||||
Nikkei 225 Index | 130 | Jun-2021 | 3,488 | 3,433 | 1 | |||||||||||||||
OMX Stockholm 30 | 135 | Apr-2021 | 3,416 | 3,388 | 49 | |||||||||||||||
Russell 2000 Index E-MINI | 35 | Jun-2021 | 4,041 | 3,889 | (152) | |||||||||||||||
S&P 500 Index E-MINI | (60 | ) | Jun-2021 | (11,796) | (11,902) | (106) | ||||||||||||||
S&P 500 Index E-MINI^ | 17 | Jun-2021 | 3,355 | 3,372 | 17 | |||||||||||||||
S&P Mid Cap 400 Index E-MINI | 13 | Jun-2021 | 3,389 | 3,387 | (2) | |||||||||||||||
S&P TSX 60 Index | 6 | Jun-2021 | 1,070 | 1,061 | (2) | |||||||||||||||
S&P TSX 60 Index | 6 | Jun-2021 | 1,055 | 1,061 | 6 | |||||||||||||||
SPI 200 Index | (20 | ) | Jun-2021 | (2,597) | (2,577) | 10 | ||||||||||||||
SPI 200 Index | 19 | Jun-2021 | 2,486 | 2,448 | 5 | |||||||||||||||
U.S. 5-Year Treasury Note | 160 | Jul-2021 | 20,006 | 19,744 | (263) | |||||||||||||||
U.S. 5-Year Treasury Note | (51 | ) | Jul-2021 | (6,333) | (6,293) | 40 | ||||||||||||||
U.S. 10-Year Treasury Note | (61 | ) | Jun-2021 | (8,083) | (7,987) | 96 | ||||||||||||||
U.S. 10-Year Treasury Note | 110 | Jun-2021 | 14,767 | 14,403 | (364) | |||||||||||||||
|
|
|
|
|
| |||||||||||||||
| $ | 60,141 | $ | 59,148 | $ | (974) | |||||||||||||||
|
|
|
|
|
| |||||||||||||||
A list of the open forward foreign currency contracts held by the Fund at March 31, 2021, is as follows:
| Counterparty | Settlement Date | Currency to Deliver (Thousands) | Currency to Receive (Thousands) | Unrealized Appreciation (Depreciation) (Thousands) | ||||||||||||||||||||
ANZ | 04/22/21 | CNH | 3,705 | USD | 569 | $ | 6 | |||||||||||||||||
ANZ | 08/13/21 | HKD | 57,660 | USD | 7,437 | 18 | ||||||||||||||||||
Bank of America | 04/19/21 | USD | 537 | EUR | 451 | (7) | ||||||||||||||||||
Bank of America | 04/22/21 | USD | 600 | CAD | 746 | (6) | ||||||||||||||||||
Bank of America | 05/27/21 | EUR | 799 | USD | 950 | 10 | ||||||||||||||||||
Barclays PLC | 04/22/21 | USD | 969 | KRW | 1,058,733 | (31) | ||||||||||||||||||
Barclays PLC | 04/22/21 | KRW | 539,407 | USD | 485 | 6 | ||||||||||||||||||
Barclays PLC | 09/23/21 | USD | 2,400 | MYR | 9,922 | (15) | ||||||||||||||||||
BNP Paribas | 04/15/21 | USD | 711 | NOK | 6,079 | 1 | ||||||||||||||||||
BNP Paribas | 04/22/21 | USD | 385 | CNH | 2,497 | (6) | ||||||||||||||||||
Brown Brothers Harriman | 04/08/21 | USD | 249 | ZAR | 3,740 | 4 | ||||||||||||||||||
Brown Brothers Harriman | 04/08/21 | USD | 512 | ZAR | 7,500 | (4) | ||||||||||||||||||
268 | SEI Institutional Managed Trust / Semi-Annual Report / March 31, 2021 |
| Counterparty | Settlement Date | Currency to Deliver (Thousands) | Currency to Receive (Thousands) | Unrealized (Depreciation) | ||||||||||||||||||||
Brown Brothers Harriman | 04/09/21 | EUR | 206 | GBP | 184 | $ | 11 | |||||||||||||||||
Brown Brothers Harriman | 04/09/21 | GBP | 264 | EUR | 306 | (4 | ) | |||||||||||||||||
Brown Brothers Harriman | 04/09/21 | CHF | 443 | GBP | 367 | 36 | ||||||||||||||||||
Brown Brothers Harriman | 04/09/21 - 05/27/21 | EUR | 657 | USD | 784 | 12 | ||||||||||||||||||
Brown Brothers Harriman | 04/09/21 | GBP | 513 | USD | 710 | 2 | ||||||||||||||||||
Brown Brothers Harriman | 04/09/21 | GBP | 181 | USD | 247 | (3 | ) | |||||||||||||||||
Brown Brothers Harriman | 05/27/21 | USD | 474 | EUR | 404 | 1 | ||||||||||||||||||
Brown Brothers Harriman | 04/09/21 | USD | 252 | EUR | 206 | (10 | ) | |||||||||||||||||
Brown Brothers Harriman | 04/09/21 | USD | 573 | GBP | 419 | 6 | ||||||||||||||||||
Brown Brothers Harriman | 04/09/21 | USD | 507 | GBP | 363 | (5 | ) | |||||||||||||||||
Brown Brothers Harriman | 04/09/21 - 05/06/21 | USD | 1,531 | CHF | 1,406 | (36 | ) | |||||||||||||||||
Brown Brothers Harriman | 04/15/21 | USD | 495 | SEK | 4,120 | (22 | ) | |||||||||||||||||
Brown Brothers Harriman | 04/15/21 | USD | 990 | NOK | 8,375 | (9 | ) | |||||||||||||||||
Brown Brothers Harriman | 04/15/21 | NOK | 3,036 | USD | 358 | 2 | ||||||||||||||||||
Brown Brothers Harriman | 04/15/21 | NOK | 4,072 | EUR | 403 | (4 | ) | |||||||||||||||||
Brown Brothers Harriman | 04/15/21 | SEK | 4,120 | USD | 490 | 17 | ||||||||||||||||||
Brown Brothers Harriman | 04/16/21 | USD | 952 | MXN | 19,765 | 13 | ||||||||||||||||||
Brown Brothers Harriman | 04/16/21 | USD | 243 | MXN | 4,983 | – | ||||||||||||||||||
Brown Brothers Harriman | 04/16/21 | MXN | 30,056 | USD | 1,449 | (17 | ) | |||||||||||||||||
Brown Brothers Harriman | 04/19/21 | EUR | 299 | TRY | 2,778 | (19 | ) | |||||||||||||||||
Brown Brothers Harriman | 04/19/21 | TRY | 2,778 | USD | 375 | 43 | ||||||||||||||||||
Brown Brothers Harriman | 04/22/21 | USD | 827 | CAD | 1,047 | 6 | ||||||||||||||||||
Brown Brothers Harriman | 04/22/21 | CAD | 1,206 | USD | 952 | (7 | ) | |||||||||||||||||
Brown Brothers Harriman | 05/06/21 | CHF | 965 | USD | 1,067 | 40 | ||||||||||||||||||
Brown Brothers Harriman | 05/10/21 | GBP | – | USD | – | – | ||||||||||||||||||
Brown Brothers Harriman | 05/20/21 | USD | 1,424 | JPY | 153,397 | (35 | ) | |||||||||||||||||
Brown Brothers Harriman | 05/20/21 | JPY | 202,387 | USD | 1,911 | 78 | ||||||||||||||||||
Brown Brothers Harriman | 05/27/21 | AUD | 465 | USD | 355 | 1 | ||||||||||||||||||
Brown Brothers Harriman | 05/27/21 | NZD | 506 | AUD | 465 | – | ||||||||||||||||||
Brown Brothers Harriman | 05/27/21 | USD | 935 | NZD | 1,290 | (32 | ) | |||||||||||||||||
Brown Brothers Harriman | 05/27/21 | NZD | 8,198 | USD | 5,929 | 190 | ||||||||||||||||||
Brown Brothers Harriman | 06/04/21 | USD | 238 | AUD | 312 | – | ||||||||||||||||||
Citigroup | 04/22/21 | CAD | 2,261 | USD | 1,791 | (8 | ) | |||||||||||||||||
Citigroup | 04/22/21 | PHP | 11,568 | USD | 238 | – | ||||||||||||||||||
Citigroup | 05/20/21 | CLP | 394,091 | USD | 544 | (5 | ) | |||||||||||||||||
Citigroup | 05/21/21 | USD | 988 | SGD | 1,330 | 1 | ||||||||||||||||||
Credit Suisse First Boston | 04/22/21 | PHP | 12,196 | USD | 253 | 2 | ||||||||||||||||||
Deutsche Bank | 05/20/21 | USD | 550 | CLP | 394,091 | (1 | ) | |||||||||||||||||
Deutsche Bank | 06/04/21 | AUD | 3,377 | USD | 2,576 | 3 | ||||||||||||||||||
Goldman Sachs | 04/15/21 | NOK | 4,270 | USD | 501 | 1 | ||||||||||||||||||
Goldman Sachs | 04/22/21 | USD | 1,692 | KRW | 1,913,195 | 4 | ||||||||||||||||||
Goldman Sachs | 04/22/21 | USD | 251 | KRW | 272,482 | (9 | ) | |||||||||||||||||
Goldman Sachs | 04/22/21 | PHP | 12,196 | USD | 253 | 1 | ||||||||||||||||||
Goldman Sachs | 04/22/21 | KRW | 910,717 | USD | 817 | 10 | ||||||||||||||||||
Goldman Sachs | 05/20/21 | COP | 1,747,142 | USD | 483 | 7 | ||||||||||||||||||
Goldman Sachs | 05/25/21 | USD | 480 | RUB | 35,810 | (9 | ) | |||||||||||||||||
Goldman Sachs | 05/25/21 | RUB | 17,683 | USD | 235 | 2 | ||||||||||||||||||
Goldman Sachs | 06/23/21 | ILS | 3,672 | USD | 1,114 | 11 | ||||||||||||||||||
Goldman Sachs | 07/07/21 | TWD | 21,809 | USD | 797 | 22 | ||||||||||||||||||
| SEI Institutional Managed Trust / Semi-Annual Report / March 31, 2021 | 269 |
SCHEDULE OF INVESTMENTS (Unaudited)
March 31, 2021
Multi-Asset Capital Stability Fund (Continued)
| Counterparty | Settlement Date | Currency to Deliver (Thousands) | Currency to Receive (Thousands) | Unrealized Appreciation (Depreciation) (Thousands) | ||||||||||||||||||||
HSBC | 04/22/21 | USD | 909 | CNH | 5,902 | $ | (11 | ) | ||||||||||||||||
HSBC | 05/06/21 | CHF | 555 | USD | 619 | 29 | ||||||||||||||||||
JPMorgan Chase Bank | 08/01/07 | USD | – | ZAR | 7,782,876 | – | ||||||||||||||||||
JPMorgan Chase Bank | 04/09/21 | USD | 729 | GBP | 516 | (18 | ) | |||||||||||||||||
JPMorgan Chase Bank | 04/22/21 | USD | 237 | PHP | 11,631 | 2 | ||||||||||||||||||
JPMorgan Chase Bank | 04/22/21 | USD | 2,961 | CAD | 3,755 | 27 | ||||||||||||||||||
JPMorgan Chase Bank | 04/22/21 | CNH | 4,696 | USD | 724 | 9 | ||||||||||||||||||
JPMorgan Chase Bank | 05/20/21 | USD | 487 | COP | 1,747,142 | (12 | ) | |||||||||||||||||
Morgan Stanley | 04/09/21 | GBP | 925 | USD | 1,260 | (16 | ) | |||||||||||||||||
Morgan Stanley | 04/22/21 | USD | 250 | KRW | 275,743 | (6 | ) | |||||||||||||||||
Morgan Stanley | 09/23/21 | MYR | 1,963 | USD | 470 | (2 | ) | |||||||||||||||||
RBS | 04/09/21 | USD | 623 | GBP | 454 | 3 | ||||||||||||||||||
RBS | 04/15/21 | INR | 34,845 | USD | 472 | (3 | ) | |||||||||||||||||
RBS | 04/27/21 | USD | 791 | TWD | 22,451 | – | ||||||||||||||||||
RBS | 04/27/21 | USD | 950 | TWD | 26,413 | (20 | ) | |||||||||||||||||
RBS | 06/04/21 | AUD | 935 | NZD | 1,017 | – | ||||||||||||||||||
Standard Bank | 04/09/21 | GBP | 419 | USD | 584 | 6 | ||||||||||||||||||
Standard Bank | 04/22/21 | USD | 250 | KRW | 275,089 | (6 | ) | |||||||||||||||||
Standard Bank | 04/22/21 | USD | 596 | PHP | 29,125 | 4 | ||||||||||||||||||
Standard Bank | 04/22/21 | PHP | 82,431 | USD | 1,696 | (2 | ) | |||||||||||||||||
Standard Bank | 04/22/21 | KRW | 277,112 | USD | 247 | 2 | ||||||||||||||||||
Standard Bank | 04/27/21 - 06/18/21 | TWD | 69,160 | USD | 2,491 | 51 | ||||||||||||||||||
Standard Bank | 05/20/21 | JPY | 10,934,248 | USD | 103,169 | 4,150 | ||||||||||||||||||
Standard Bank | 05/27/21 | EUR | 702 | USD | 839 | 12 | ||||||||||||||||||
Standard Bank | 07/07/21 | USD | 788 | TWD | 21,809 | (13 | ) | |||||||||||||||||
UBS | 04/08/21 | ZAR | 11,239 | USD | 729 | (31 | ) | |||||||||||||||||
UBS | 04/16/21 | USD | 736 | MXN | 15,217 | 6 | ||||||||||||||||||
UBS | 04/22/21 | USD | 788 | KRW | 874,964 | (12 | ) | |||||||||||||||||
UBS | 04/22/21 | USD | 958 | CAD | 1,214 | 8 | ||||||||||||||||||
UBS | 04/22/21 | KRW | 549,046 | USD | 498 | 11 | ||||||||||||||||||
|
|
| ||||||||||||||||||||||
| $ | 4,431 | |||||||||||||||||||||||
|
|
| ||||||||||||||||||||||
A list of the open OTC swap agreements held by the Fund at March 31, 2021 is as follows:
| Variance Swaps | ||||||||||||||||||||||||||||||||||||
| Counterparty | Reference Entity/ Obligation | Volatility Strike Price | Payment Frequency | Termination Date | Currency | Notional Amount (Thousands) | Value (Thousands) | Upfront Payments/ Receipts (Thousands) | Net Unrealized Appreciation (Depreciation) (Thousands) | |||||||||||||||||||||||||||
Bank of America | USDJPY VARSWAP Long | |||||||||||||||||||||||||||||||||||
Merill Lynch | 7.20 | % | Quarterly | 9/18/2021 | USD | (33) | $ | 2 | $ | – | $ | 2 | ||||||||||||||||||||||||
Bank of America | USDJPY VARSWAP Long | |||||||||||||||||||||||||||||||||||
Merill Lynch | 7.85 | % | Quarterly | 9/18/2021 | USD | 38 | (4 | ) | – | (4) | ||||||||||||||||||||||||||
|
| |||||||||||||||||||||||||||||||||||
| $ | (2 | ) | $ | – | $ | (2) | ||||||||||||||||||||||||||||||
|
| |||||||||||||||||||||||||||||||||||
| 270 | SEI Institutional Managed Trust / Semi-Annual Report / March 31, 2021 |
A list of the open centrally cleared swap agreements held by the Fund at March 31, 2021 is as follows:
| Credit Default Swaps | ||||||||||||||||||||||||||
| Reference Entity/ Obligation | Buy/Sell Protection | (Pays)/ Receives Rate | Payment Frequency | Termination Date | Notional Amount (Thousands) | Value (Thousands) | Upfront Payments/ Receipts (Thousands) | Net Unrealized Appreciation (Depreciation) (Thousands) | ||||||||||||||||||
CDX.CD.SI.34 | Sell | 1.00% | Quarterly | 06/20/2025 | (11,104 | ) | $ | 315 | $ | (152) | $ | 467 | ||||||||||||||
CDX.NA.HY.S35V1-5Y | Sell | (308.205)% | Quarterly | 12/20/2025 | (6,670 | ) | 605 | 532 | 73 | |||||||||||||||||
CDX.NA.IG.S35V1-5Y | Sell | (369.554)% | Quarterly | 12/20/2025 | (5,700 | ) | 136 | 128 | 8 | |||||||||||||||||
ITRAXX.XOVER.S34V1-5Y | Sell | (74.635)% | Quarterly | 12/20/2025 | (1,115 | ) | 158 | 127 | 31 | |||||||||||||||||
|
|
|
|
|
|
| ||||||||||||||||||||
| $ | 1,214 | $ | 635 | $ | 579 | |||||||||||||||||||||
| Interest Rate Swaps | ||||||||||||||||||||||||||||||||
| Fund Pays | Fund Receives | Payment Frequency | Termination Date | Currency | Notional Amount (Thousands) | Value (Thousands) | Upfront Payments/ Receipts (Thousands) | Net Unrealized Appreciation (Depreciation) (Thousands) | ||||||||||||||||||||||||
0.888% | AUD/BBR/6M/BBSW/0.00000 | Semi-Annual | 11/25/2030 | USD | 2,720 | $ | (173) | $ | – | $ | (173) | |||||||||||||||||||||
0.895% | NZD/BKBM/3M/BKBM/0.00000 | Semi-Annual | 11/26/2030 | USD | 2,490 | (163) | – | (163) | ||||||||||||||||||||||||
6M AUD BBSW | 0.897% | Semi-Annual | 12/02/2030 | USD | 2,130 | (135) | – | (135) | ||||||||||||||||||||||||
3M NZD BKBM | 0.865% | Semi-Annual | 12/03/2030 | USD | 2,000 | (135) | – | (135) | ||||||||||||||||||||||||
6-MONTH AUD - BBSW | 1.005 | Semi-Annual | 12/10/2030 | USD | 1,580 | (88) | – | (88) | ||||||||||||||||||||||||
3-MONTH NZD - BKBM | 0.911 | Semi-Annual | 12/11/2030 | USD | 1,520 | (99) | – | (99) | ||||||||||||||||||||||||
6-MONTH AUD - BBSW | 1.019 | Semi-Annual | 12/17/2030 | USD | 940 | (52) | – | (52) | ||||||||||||||||||||||||
3-MONTH NZD - BKBM | 0.945 | Semi-Annual | 12/18/2030 | USD | 1,010 | (63) | – | (63) | ||||||||||||||||||||||||
|
|
|
|
|
| |||||||||||||||||||||||||||
| $ | (908) | $ | – | $ | (908) | |||||||||||||||||||||||||||
|
|
|
|
|
| |||||||||||||||||||||||||||
Percentages are based on Net Assets of $748,926 ($ Thousands). |
| * | Non-income producing security. |
| (A) | Zero coupon security. The rate shown on the Schedule of Investments is the security’s effective yield at the time of purchase. |
| (B) | Refer to table below for details on Options Contracts. |
ADR — American Depositary Receipt
AUD — Australian Dollar
CAC40 — Cotation Assistée en Continu
CAD — Canadian Dollar
CBOE — Chicago Board Options Exchange
CHF — Swiss Franc
Cl — Class
CLP — Chilean Peso
CNH — Chinese Yuan Offshore
COP — Colombian Peso
CPI — Consumer Price Index
CSI — Commodity Selection Index
DAX — German Stock Index
EAFE — Europe, Australasia and Far East
ETF — Exchange-Traded Fund
EUR — Euro
FHLB — Federal Home Loan Bank
FNMA — Federal National Mortgage Association
FTSE — Financial Times Stock Exchange
GBP — British Pound Sterling
HKD — Hong Kong Dollar
IBEX — Spanish Stock Exchange Index
INR — Indian Rupee
ILS — Israeli New Sheckels
JPY — Japanese Yen
KRW — Korean Won
Ltd. — Limited
MIB — Milano Indice di Borsa
MSCI — Morgan Stanley Capital International
MYR — Malaysian Ringgit
MXN — Mexican Peso
NASDAQ — National Association of Securities Dealers and Automated Quotations
NOK — Norwegian Krone
NZD — New Zealand Dollar
PHP — Philippine peso
PLC — Public Limited Company
OMX — Option Market Index
RUB — Russian Ruble
S&P — Standard & Poor’s
SGD — Singapore Dollar
SEK — Swedish Krona
SPDR — Standard & Poor’s Depository Receipt
SPI — Share Price Index
SPX — Standard & Poor’s 500 Index
TBA — To Be Announced
TRY — Turkish Lira
TSX — Toronto Stock Exchange
TWD — Taiwan Dollar
UCITS — Undertakings for the Collective Investment in Transferable Securities
USD — U.S. Dollar
ZAR — South African Rand
| SEI Institutional Managed Trust / Semi-Annual Report / March 31, 2021 | 271 |
SCHEDULE OF INVESTMENTS (Unaudited)
March 31, 2021
Multi-Asset Capital Stability Fund (Concluded)
The following is a list of the level of inputs used as of March 31, 2021, in valuing the Fund’s investments and other financial instruments carried at value ($ Thousands):
Investments in Securities | Level 1 ($) | Level 2 ($) | Level 3 ($) | Total ($) | ||||||||||||
U.S. Treasury Obligations | – | 225,157 | – | 225,157 | ||||||||||||
Commercial Paper | – | 150,377 | – | 150,377 | ||||||||||||
Exchange Traded Funds | 64,163 | – | – | 64,163 | ||||||||||||
Sovereign Debt | – | 22,657 | – | 22,657 | ||||||||||||
U.S. Government Agency | – | 20,323 | – | 20,323 | ||||||||||||
Common Stock | 16,288 | – | – | 16,288 | ||||||||||||
Mortgage-Backed Security | – | 222 | – | 222 | ||||||||||||
|
|
|
|
|
|
|
| |||||||||
Total Investments in Securities | 80,451 | 418,736 | – | 499,187 | ||||||||||||
|
|
|
|
|
|
|
| |||||||||
Other Financial Instruments | Level 1 ($) | Level 2 ($) | Level 3 ($) | Total ($) | ||||||||||||
Purchased Options | 22 | – | – | 22 | ||||||||||||
Written Options | (4) | – | – | (4) | ||||||||||||
Futures Contracts* | ||||||||||||||||
Unrealized Appreciation | 292 | – | – | 292 | ||||||||||||
Unrealized Depreciation | (1,266) | – | – | (1,266) | ||||||||||||
Forwards Contracts* | ||||||||||||||||
Unrealized Appreciation | – | 4,887 | – | 4,887 | ||||||||||||
Unrealized Depreciation | – | (456) | – | (456) | ||||||||||||
OTC Swaps | ||||||||||||||||
Variance Swaps* | ||||||||||||||||
Unrealized Appreciation | – | 2 | – | 2 | ||||||||||||
Unrealized Depreciation | – | (4) | – | (4) | ||||||||||||
Centrally Cleared Swaps | ||||||||||||||||
Credit Default Swaps* | ||||||||||||||||
Unrealized Appreciation | – | 579 | – | 579 | ||||||||||||
Interest Rate Swaps* | ||||||||||||||||
Unrealized Depreciation | – | (908) | – | (908) | ||||||||||||
|
|
|
|
|
|
|
| |||||||||
Total Other Financial Instruments | (956) | 4,100 | – | 3,144 | ||||||||||||
|
|
|
|
|
|
|
| |||||||||
* Futures contracts, forward contracts and swap contracts are valued at the unrealized appreciation (depreciation) on the instrument.
For the period ended March 31, 2021, there were no transfers in or out of Level 3.
For more information on valuation inputs, see Note 2 – Significant Accounting Policies in Notes to Financial Statements.
Amounts designated as “—” are either $0 or have been rounded to $0.
The accompanying notes are an integral part of the financial statements.
272 | SEI Institutional Managed Trust / Semi-Annual Report / March 31, 2021 |
(This page intentionally left blank)
STATEMENTS OF ASSETS AND LIABILITIES ($ Thousands)
March 31, 2021 (Unaudited)
| Large Cap Fund | Large Cap Value Fund | |||||||
Assets: | ||||||||
Investments, at value † | $ | 2,171,889 | * | $ | 1,471,040 | * | ||
Affiliated investments, at value †† | 28,601 | 15,156 | ||||||
Cash and cash equivalents | – | 20 | ||||||
Cash pledged as collateral on futures contracts | 690 | 385 | ||||||
Foreign currency, at value ††† | – | – | ||||||
Receivable for fund shares sold | 1,566 | 1,107 | ||||||
Receivable for investment securities sold | 6,391 | 1,322 | ||||||
Dividends and interest receivable | 2,375 | 2,699 | ||||||
Receivable for Variation Margin on Futures Contracts | 58 | 21 | ||||||
Foreign tax reclaim receivable | 29 | 226 | ||||||
Prepaid expenses |
| 43 |
|
| 28 |
| ||
Total Assets |
| 2,211,642 |
|
| 1,492,004 |
| ||
Liabilities: | ||||||||
Payable upon return on securities loaned | 12,244 | 3,612 | ||||||
Payable for investment securities purchased | 6,425 | 1,097 | ||||||
Payable for fund shares redeemed | 2,271 | 1,238 | ||||||
Administration fees payable | 473 | 383 | ||||||
Shareholder servicing fees payable Class F | 446 | 289 | ||||||
Shareholder servicing fees payable Class I | – | 1 | ||||||
Income distribution payable | – | – | ||||||
Due to custodian | – | – | ||||||
Payable for Variation Margin on Futures Contracts | – | – | ||||||
Investment advisory fees payable | 688 | 435 | ||||||
Chief Compliance Officer fees payable | 2 | 1 | ||||||
Administration servicing fees payable Class I | – | – | ||||||
Accrued expense payable |
| 164 |
|
| 101 |
| ||
Total Liabilities |
| 22,713 |
|
| 7,157 |
| ||
Net Assets | $ | 2,188,929 |
| $ | 1,484,847 |
| ||
† Cost of investments and repurchase agreements | $ | 1,277,765 | $ | 996,114 | ||||
†† Cost of affiliated investments | 28,592 | 15,158 | ||||||
††† Cost of foreign currency | – | – | ||||||
†††††† Cost (premiums received) | – | – | ||||||
* Includes market value of securities on loan |
| 12,142 |
|
| 3,564 |
| ||
Amounts designated as “—” are either $0 or have been rounded to $0.
The accompanying notes are an integral part of the financial statements.
| 274 | SEI Institutional Managed Trust / Semi-Annual Report / March 31, 2021 |
| Large Cap Growth Fund | Large Cap Index Fund | Tax-Managed Large Cap Fund | S&P 500 Index Fund | Small Cap Fund | Small Cap Value Fund | Small Cap Growth Fund | Tax-Managed Small/ Mid Cap Fund | |||||||||||||||||||||||
| $ | 1,650,549 | * | $ | 906,368 | * | $ | 4,327,903 | * | $ | 933,527 | $ | 659,422 | * | $ | 404,248 | * | $ | 426,378 | * | $ | 993,157 | * | ||||||||
| 28,875 | 8,833 | 106,523 | 6,427 | 34,012 | 52,555 | 87,623 | 144,424 | |||||||||||||||||||||||
| 3 | – | – | 3 | – | 5 | 3 | – | |||||||||||||||||||||||
| 948 | 434 | – | 418 | 273 | 306 | 397 | 145 | |||||||||||||||||||||||
| – | – | 135 | – | – | – | – | – | |||||||||||||||||||||||
| 1,329 | 1,217 | 534 | 1,773 | 436 | 492 | 469 | 207 | |||||||||||||||||||||||
| – | – | 11,097 | – | 2,871 | – | 5,968 | 1,012 | |||||||||||||||||||||||
| 248 | 604 | 4,965 | 612 | 458 | 514 | 96 | 788 | |||||||||||||||||||||||
| 85 | 37 | – | 40 | 63 | 70 | 92 | 22 | |||||||||||||||||||||||
| 20 | – | 489 | 12 | – | – | – | – | |||||||||||||||||||||||
| 33 | 20 | 82 | 19 | 12 | 7 | 7 | 17 | |||||||||||||||||||||||
| 1,682,090 |
|
| 917,513 |
|
| 4,451,728 |
|
| 942,831 |
|
| 697,547 |
|
| 458,197 |
|
| 521,033 |
|
| 1,139,772 |
| |||||||
| 6,775 | 73 | 1,158 | – | 8,118 | 29,639 | 69,800 | 114,340 | |||||||||||||||||||||||
| – | 2,122 | – | – | 2,246 | – | 5,887 | 997 | |||||||||||||||||||||||
| 1,016 | 719 | 1,690 | 260 | 578 | 508 | 458 | 307 | |||||||||||||||||||||||
| 398 | 69 | 793 | 110 | 173 | 116 | 114 | 255 | |||||||||||||||||||||||
| 305 | 76 | 827 | 39 | 143 | 84 | 88 | 174 | |||||||||||||||||||||||
| 1 | – | – | 1 | – | – | – | – | |||||||||||||||||||||||
| 1 | – | – | – | – | – | – | – | |||||||||||||||||||||||
| – | – | 97,311 | – | – | – | – | – | |||||||||||||||||||||||
| – | – | 3 | – | – | – | – | – | |||||||||||||||||||||||
| 457 | 15 | 1,496 | 16 | 347 | 228 | 213 | 508 | |||||||||||||||||||||||
| 2 | 1 | 4 | 1 | 1 | – | – | 1 | |||||||||||||||||||||||
| – | – | – | 1 | – | – | – | – | |||||||||||||||||||||||
| 119 | 181 | 292 | 84 | 46 | 28 | 29 | 64 | |||||||||||||||||||||||
| 9,074 |
|
| 3,256 |
|
| 103,574 |
|
| 512 |
|
| 11,652 |
|
| 30,603 |
|
| 76,589 |
|
| 116,646 |
| |||||||
$ | 1,673,016 |
| $ | 914,257 |
| $ | 4,348,154 |
| $ | 942,319 |
| $ | 685,895 |
| $ | 427,594 |
| $ | 444,444 |
| $ | 1,023,126 |
| |||||||
| $ | 763,459 | $ | 653,757 | $ | 1,678,734 | $ | 267,301 | $ | 463,872 | $ | 274,059 | $ | 333,715 | $ | 548,850 | |||||||||||||||
| 28,876 | 8,833 | 106,521 | 6,427 | 34,011 | 52,553 | 87,622 | 144,418 | |||||||||||||||||||||||
| – | – | 129 | – | – | – | – | – | |||||||||||||||||||||||
| – | – | – | – | – | – | – | – | |||||||||||||||||||||||
| 6,907 |
|
| 69 |
|
| 1,141 |
|
| – |
|
| 6,203 |
|
| 28,779 |
|
| 69,599 |
|
| 112,616 |
| |||||||
SEI Institutional Managed Trust / Semi-Annual Report / March 31, 2021 | 275 |
STATEMENTS OF ASSETS AND LIABILITIES ($ Thousands)
March 31, 2021 (Unaudited)
| Large Cap Fund | Large Cap Value Fund | |||||||
Net Assets: | ||||||||
Paid-in capital — (unlimited authorization — no par value) | $ | 1,230,590 |
| $ | 1,022,899 |
| ||
Total distributable earnings |
| 958,339 |
|
| 461,948 |
| ||
Net Assets | $ | 2,188,929 |
| $ | 1,484,847 |
| ||
Net Asset Value, Offering and Redemption Price Per Share — Class F | $ | 16.59 |
| $ | 26.46 |
| ||
| ($2,073,950,895 ÷ |
|
| ($1,296,238,252 ÷ |
| |||
| 125,036,734 shares | ) |
| 48,992,541 shares | ) | |||
Net Asset Value, Offering and Redemption Price Per Share — Class I |
| N/A |
| $ | 26.49 |
| ||
| ($2,948,204 ÷ |
| ||||||
| 111,301 shares | ) | ||||||
Net Asset Value, Offering and Redemption Price Per Share — Class Y | $ | 16.59 |
| $ | 26.46 |
| ||
| ($ 114,977,935 ÷ |
|
| ($185,660,397 ÷ |
| |||
| 6,928,474 shares | ) |
| 7,016,688 shares | ) | |||
N/A – Not applicable. Share class currently not offered.
The accompanying notes are an integral part of the financial statements.
276 | SEI Institutional Managed Trust / Semi-Annual Report / March 31, 2021 |
Large Cap Growth Fund | Large Cap Index Fund | Tax-Managed Large Cap Fund | S&P 500 Index Fund | Small Cap Fund | Small Cap Value Fund | Small Cap Growth Fund | Tax-Managed Small/ Mid Cap Fund | |||||||||||||||||||||||
| $ | 709,039 | $ | 667,461 | $ | 1,554,040 | $ | 237,004 | $ | 444,927 | $ | 301,555 | $ | 289,994 | $ | 528,750 | |||||||||||||||
| 963,977 | 246,796 | 2,794,114 | 705,315 | 240,968 | 126,039 | 154,450 | 494,376 | |||||||||||||||||||||||
| $ | 1,673,016 | $ | 914,257 | $ | 4,348,154 | $ | 942,319 | $ | 685,895 | $ | 427,594 | $ | 444,444 | $ | 1,023,126 | |||||||||||||||
| $ | 46.91 | $ | 14.32 | $ | 32.82 | $ | 85.25 | $ | 15.91 | $ | 26.64 | $ | 45.07 | $ | 27.30 | |||||||||||||||
| ($1,470,631,363 ÷ | ($914,257,196 ÷ | ($3,871,553,411 ÷ | ($936,591,436 ÷ | ($655,211,639 ÷ | ($362,613,299 ÷ | ($400,058,264 ÷ | ($914,930,997 ÷ | |||||||||||||||||||||||
| 31,352,828 shares | ) | 63,839,119 shares | ) | 117,947,474 shares | ) | 10,986,156 shares | ) | 41,177,895 shares | ) | 13,613,248 shares | ) | 8,875,430 shares | ) | 33,519,323 shares | ) | |||||||||||||||
| $ | 45.41 | N/A | N/A | $ | 85.80 | N/A | $ | 26.37 | $ | 42.60 | N/A | |||||||||||||||||||
| ($3,438,310 ÷ | ($5,727,565 ÷ | ($1,784,654 ÷ | ($1,890,371 ÷ | |||||||||||||||||||||||||||
| 75,713 shares | ) | 66,754 shares | ) | 67,684 shares | ) | 44,371 shares | ) | |||||||||||||||||||||||
| $ | 46.97 | N/A | $ | 32.84 | N/A | $ | 16.07 | $ | 26.66 | $ | 45.77 | $ | 27.33 | |||||||||||||||||
| ($198,946,429 ÷ | ($476,600,956 ÷ | ($30,683,107 ÷ | ($63,195,750 ÷ | ($42,495,116 ÷ | ($108,194,547 ÷ | |||||||||||||||||||||||||
| 4,235,224 shares | ) | 14,512,327 shares | ) | 1,909,792 shares | ) | 2,370,866 shares | ) | 928,456 shares | ) | 3,958,240 shares | ) | |||||||||||||||||||
SEI Institutional Managed Trust / Semi-Annual Report / March 31, 2021 | 277 |
STATEMENTS OF ASSETS AND LIABILITIES ($ Thousands)
March 31, 2021 (Unaudited)
| Mid-Cap Fund | U.S. Managed Volatility Fund | |||||||
Assets: | ||||||||
Investments, at value † | $ | 79,347 | * | $ | 986,198 | * | ||
Affiliated investments, at value †† | 1,689 | 23,975 | ||||||
Repurchase agreements† | – | – | ||||||
Cash and cash equivalents | 20 | 16 | ||||||
Cash pledged as collateral on swap contracts | – | – | ||||||
Cash pledged as collateral on futures contracts | 27 | 396 | ||||||
Foreign currency, at value ††† | – | – | ||||||
Receivable for fund shares sold | 215 | 434 | ||||||
Receivable for investment securities sold | – | – | ||||||
Dividends and interest receivable | 88 | 1,834 | ||||||
Unrealized gain on forward foreign currency contracts | – | – | ||||||
Options purchased, at value ††††† | – | – | ||||||
Swaptions purchased, at value †††††† | – | – | ||||||
Receivable for Variation Margin on Futures Contracts | – | 35 | ||||||
Receivable for Variation Margin on Swap Contracts | – | – | ||||||
Foreign tax reclaim receivable | – | 18 | ||||||
Prepaid expenses |
| 1 |
|
| 35 |
| ||
Total Assets |
| 81,387 |
|
| 1,012,941 |
| ||
Liabilities: | ||||||||
Payable upon return on securities loaned | 580 | 11,343 | ||||||
Payable for fund shares redeemed | 24 | 1,996 | ||||||
Administration fees payable | 20 | 184 | ||||||
Shareholder servicing fees payable Class F | 16 | 166 | ||||||
Shareholder servicing fees payable Class I | – | – | ||||||
Payable for investment securities purchased | – | – | ||||||
Income distribution payable | – | – | ||||||
Options written, at value ††††† | – | – | ||||||
Swaptions written, at value †††††† | – | – | ||||||
Due to custodian | – | – | ||||||
Payable for Variation Margin on Swap Contracts | – | – | ||||||
Payable for Variation Margin on Futures Contracts | – | – | ||||||
Unrealized loss on forward foreign currency contracts | – | – | ||||||
Investment advisory fees payable | 27 | 331 | ||||||
Trustees fees payable | – | – | ||||||
Chief Compliance Officer fees payable | – | 2 | ||||||
Administration servicing fees payable Class I | – | – | ||||||
Accrued expense payable |
| 5 |
|
| 122 |
| ||
Total Liabilities |
| 672 |
|
| 14,144 |
| ||
Net Assets | $ | 80,715 |
| $ | 998,797 |
| ||
† Cost of investments and repurchase agreements | $ | 62,699 | $ | 753,623 | ||||
†† Cost of affiliated investments | 1,689 | 23,975 | ||||||
††† Cost of foreign currency | – | – | ||||||
††††† Cost (premiums received) | – | – | ||||||
†††††† Cost (premiums received) | – | – | ||||||
* Includes market value of securities on loan |
| 564 |
|
| 11,216 |
| ||
Amounts designated as “—” are either $0 or have been rounded to $0.
The accompanying notes are an integral part of the financial statements
278 | SEI Institutional Managed Trust / Semi-Annual Report / March 31, 2021 |
| Global Managed Volatility Fund | Tax-Managed Managed Volatility Fund | Tax-Managed International Managed Volatility Fund | Real Estate Fund | Core Fixed Income Fund | High Yield Bond Fund | Conservative Income Fund | ||||||||||||||||||||
| $ | 1,019,191 | * | $ | 961,487 | * | $ | 376,840 | * | $ | 99,406 | $ | 4,750,134 | * | $ | 1,529,275 | $ | 315,031 | |||||||||
| 20,139 | 28,651 | 17,529 | 1,180 | 391,689 | 25,177 | 695 | ||||||||||||||||||||
| – | – | – | – | – | – | 16,000 | ||||||||||||||||||||
| 3,431 | – | 1,389 | – | – | – | – | ||||||||||||||||||||
| – | – | – | – | 10,045 | – | – | ||||||||||||||||||||
| 244 | 572 | 335 | – | 4,823 | – | – | ||||||||||||||||||||
| 573 | 110 | 1,205 | – | 2,429 | 10 | – | ||||||||||||||||||||
| 485 | 239 | 141 | 397 | 3,200 | 1,090 | 152 | ||||||||||||||||||||
| – | – | – | 2,482 | 635,371 | 29,876 | – | ||||||||||||||||||||
| 2,000 | 1,271 | 1,757 | 222 | 17,940 | 18,677 | 67 | ||||||||||||||||||||
| 4,802 | – | – | – | 2,054 | – | – | ||||||||||||||||||||
| – | – | – | – | 271 | – | – | ||||||||||||||||||||
| – | – | – | – | 365 | – | – | ||||||||||||||||||||
| 14 | 51 | 2 | – | 572 | – | – | ||||||||||||||||||||
| – | – | – | – | 610 | – | – | ||||||||||||||||||||
| 2,536 | 10 | 1,796 | – | 665 | 59 | – | ||||||||||||||||||||
| 22 | 20 | 8 | 2 | 12 | 32 | 7 | ||||||||||||||||||||
| 1,053,437 | 992,411 | 401,002 | 103,689 | 5,820,180 | 1,604,196 | 331,952 | ||||||||||||||||||||
|
16,388 |
| 10,521 | 11,869 | – | 87,887 | 1 | – | ||||||||||||||||||
| 1,759 | 715 | 396 | 1,005 | 4,707 | 1,071 | 818 | ||||||||||||||||||||
| 250 | 236 | 142 | 26 | 569 | 242 | – | ||||||||||||||||||||
| 188 | 188 | 69 | 18 | 796 | 287 | 24 | ||||||||||||||||||||
| – | – | – | – | 1 | – | – | ||||||||||||||||||||
| – | – | – | 604 | 1,235,676 | 46,414 | – | ||||||||||||||||||||
| – | – | – | – | 536 | 713 | 1 | ||||||||||||||||||||
| – | – | – | – | 383 | – | – | ||||||||||||||||||||
| – | – | – | – | 115 | – | – | ||||||||||||||||||||
| – | – | – | – | 8,875 | 3,609 | – | ||||||||||||||||||||
| – | – | – | – | 46 | – | – | ||||||||||||||||||||
| 6 | – | 25 | – | 1,935 | – | – | ||||||||||||||||||||
| 167 | – | – | – | 2,358 | – | – | ||||||||||||||||||||
| 474 | 361 | 123 | 49 | 813 | 540 | 16 | ||||||||||||||||||||
| – | – | – | – | 36 | – | – | ||||||||||||||||||||
| 1 | 1 | – | – | 15 | 2 | – | ||||||||||||||||||||
| – | – | – | – | 1 | – | – | ||||||||||||||||||||
| 96 | 73 | 36 | 7 | 728 | 159 | 27 | ||||||||||||||||||||
| 19,329 | 12,095 | 12,660 | 1,709 | 1,345,477 | 53,038 | 886 | ||||||||||||||||||||
| $ | 1,034,108 | $ | 980,316 | $ | 388,342 | $ | 101,980 | $ | 4,474,703 | $ | 1,551,158 | $ | 331,066 | |||||||||||||
| $ | 899,107 | $ | 485,152 | $ | 303,780 | $ | 75,089 | $ | 4,728,372 | $ | 1,462,459 | $ | 330,991 | |||||||||||||
| 20,138 | 28,651 | 17,528 | 1,180 | 391,660 | 25,177 | 695 | ||||||||||||||||||||
| 574 | 107 | 1,213 | – | 2,201 | 8 | – | ||||||||||||||||||||
| – | – | – | – | (259 | ) | – | – | |||||||||||||||||||
| – | – | – | – | 49 | – | – | ||||||||||||||||||||
| 16,081 | 10,374 | 11,208 | – | 86,550 | – | – | ||||||||||||||||||||
SEI Institutional Managed Trust / Semi-Annual Report / March 31, 2021 | 279 |
STATEMENTS OF ASSETS AND LIABILITIES ($ Thousands)
March 31, 2021 (Unaudited)
| Mid-Cap Fund | U.S. Managed Volatility Fund | |||||||
Net Assets: | ||||||||
Paid-in capital — (unlimited authorization — no par value) | $ | 62,217 |
| $ | 738,678 |
| ||
Total distributable earnings/(loss) |
| 18,498 |
|
| 260,119 |
| ||
Net Assets | $ | 80,715 |
| $ | 998,797 |
| ||
Net Asset Value, Offering and Redemption Price Per Share — Class F | $ | 30.83 |
| $ | 17.21 |
| ||
| ($76,223,898 ÷ |
|
| ($786,754,081 ÷ |
| |||
| 2,472,690 shares | ) |
| 45,724,690 shares | ) | |||
Net Asset Value, Offering and Redemption Price Per Share — Class I | $ | 30.77 |
| $ | 17.20 |
| ||
| ($727,074 ÷ |
|
| ($1,405,400 ÷ |
| |||
| 23,630 shares | ) |
| 81,703 shares | ) | |||
Net Asset Value, Offering and Redemption Price Per Share — Class Y | $ | 30.84 |
| $ | 17.21 |
| ||
| ($3,764,412 ÷ |
|
| ($210,637,697 ÷ |
| |||
| 122,059 shares | ) |
| 12,238,158 shares | ) | |||
N/A - Not applicable. Share class currently not offered.
The accompanying notes are an integral part of the financial statements.
280 | SEI Institutional Managed Trust / Semi-Annual Report / March 31, 2021 |
| Global Managed Volatility Fund | Tax-Managed Managed Volatility Fund | Tax-Managed International Managed Volatility Fund | Real Estate Fund | Core Fixed Income Fund | High Yield Bond Fund | Conservative Income Fund | ||||||||||||||||||||
| $ | 860,442 | $ | 486,623 | $ | 360,255 | $ | 82,470 | $ | 4,483,573 | $ | 1,731,864 | $ | 331,025 | |||||||||||||
| 173,666 | 493,693 | 28,087 | 19,510 | (8,870) | (180,706) | 41 | ||||||||||||||||||||
| $ | 1,034,108 | $ | 980,316 | $ | 388,342 | $ | 101,980 | $ | 4,474,703 | $ | 1,551,158 | $ | 331,066 | |||||||||||||
| $ | 11.25 | $ | 18.68 | $ | 11.01 | $ | 15.51 | $ | 11.35 | $ | 6.91 | $ | 10.00 | |||||||||||||
| ($901,453,429 ÷ | ($898,615,060 ÷ | ($330,129,793 ÷ | ($83,884,865 ÷ | ($3,970,081,961 ÷ | ($1,363,556,725 ÷ | ($313,133,646 ÷ | ||||||||||||||||||||
| 80,125,916 shares | ) | 48,109,594 shares | ) | 29,971,216 shares | ) | 5,406,868 shares | ) | 349,854,068 shares | ) | 197,200,481 shares | ) | 31,311,952 shares | ) | |||||||||||||
| $ | 10.98 | N/A | N/A | $ | 15.48 | $ | 11.33 | $ | 6.66 | N/A | ||||||||||||||||
| ($1,005,090 ÷ | ($374,308 ÷ | ($5,147,966 ÷ | ($498,375 ÷ | |||||||||||||||||||||||
| 91,512 shares | ) | 24,180 shares | ) | 454,309 shares | ) | 74,873 shares | ) | |||||||||||||||||||
| $ | 11.27 | $ | 18.68 | $ | 11.02 | $ | 15.52 | $ | 11.36 | $ | 6.91 | $ | 10.01 | |||||||||||||
| ($131,649,267 ÷ | ($81,701,340 ÷ | ($58,212,000 ÷ | ($17,720,943 ÷ | ($499,473,054 ÷ | ($187,103,172 ÷ | ($17,932,169 ÷ | ||||||||||||||||||||
| 11,681,403 shares | ) | 4,373,151 shares | ) | 5,282,881 shares | ) | 1,141,557 shares | ) | 43,986,502 shares | ) | 27,061,152 shares | ) | 1,792,112 shares | ) | |||||||||||||
SEI Institutional Managed Trust / Semi-Annual Report / March 31, 2021 | 281 |
STATEMENTS OF ASSETS AND LIABILITIES/CONSOLIDATED STATEMENTS OF ASSETS AND LIABILITIES ($ Thousands)
March 31, 2021 (Unaudited)
| Tax-Free Conservative Income Fund | ||||
Assets: | ||||
Investments, at value † | $ | 207,135 | ||
Affiliated investments, at value †† | – | |||
Cash and cash equivalents | 181 | |||
Due from Broker | – | |||
Cash pledged as collateral on swap contracts | – | |||
Cash pledged as collateral on futures contracts | – | |||
Cash pledged as collateral on options contracts | – | |||
Foreign currency, at value ††† | – | |||
Receivable for fund shares sold | 91 | |||
Receivable for investment securities sold | – | |||
Dividends and interest receivable | 228 | |||
Unrealized gain on forward foreign currency contracts | – | |||
Unrealized gain on foreign spot currency contracts | – | |||
OTC Swap contracts, at value †††† | – | |||
Options purchased, at value ††††† | – | |||
Swaptions purchased, at value ††††† † | – | |||
Receivable for Variation Margin on Futures Contracts | – | |||
Receivable for Variation Margin on Swap Contracts | – | |||
Foreign tax reclaim receivable | – | |||
Prepaid expenses | 4 | |||
Total Assets | 207,639 | |||
Liabilities: | ||||
Payable for fund shares redeemed | 271 | |||
Payable for securities sold short@ | – | |||
Payable for investment securities purchased | – | |||
Income distribution payable | – | |||
OTC Swap contracts, at value †††† | – | |||
Options written, at value ††††† | – | |||
Reverse repurchase agreements | – | |||
Payable for Variation Margin on Swap Contracts | – | |||
Payable for Variation Margin on Futures Contracts | – | |||
Administration fees payable | – | |||
Unrealized loss on foreign currency spot contracts | – | |||
Unrealized loss on forward foreign currency contracts | – | |||
Shareholder servicing fees payable Class F | – | |||
Investment advisory fees payable | 11 | |||
Chief Compliance Officer fees payable | – | |||
Unfunded commitments on loan participations | – | |||
Accrued expense payable | 19 | |||
Total Liabilities | 301 | |||
Net Assets | $ | 207,338 | ||
† Cost of investments and repurchase agreements | $ | 207,127 | ||
†† Cost of affiliated investments | – | |||
††† Cost of foreign currency | – | |||
†††† Cost (premiums received) | – | |||
††††† Cost (premiums received) | – | |||
†††††† Cost (premiums received) | – | |||
@Proceeds from securities sold short | – | |||
Amounts designated as “—” are either $0 or have been rounded to $0.
The accompanying notes are an integral part of the financial statements.
282 | SEI Institutional Managed Trust / Semi-Annual Report / March 31, 2021 |
| Real Return Fund | Dynamic Asset Allocation Fund | Multi-Strategy Alternative Fund | Multi-Asset Accumulation Fund | Multi-Asset Income Fund | Multi-Asset Inflation Managed Fund | Multi-Asset Capital Stability Fund | ||||||||||||||||||||
| $ | 252,946 | $ | 746,418 | $ | 369,290 | $ | 1,585,151 | $ | 880,351 | $ | 1,053,188 | $ | 499,187 | |||||||||||||
| 1,342 | – | 95,930 | – | – | – | – | ||||||||||||||||||||
| – | 65,376 | 74,023 | 934,392 | 13,905 | 128,068 | 175,040 | ||||||||||||||||||||
| – | 3,707 | 870 | 6,033 | – | 335 | – | ||||||||||||||||||||
| – | – | 277 | 12,096 | 9,986 | 3,822 | 1,036 | ||||||||||||||||||||
| – | 2,502 | – | 59,010 | 5,334 | 10,390 | 4,470 | ||||||||||||||||||||
| – | – | – | – | 34,622 | – | – | ||||||||||||||||||||
| – | – | 3,021 | 5,972 | 1,094 | 87 | 75,762 | ||||||||||||||||||||
| 146 | 621 | 225 | 2,067 | 383 | 704 | 380 | ||||||||||||||||||||
| – | 1,990 | 24,372 | 83 | 17,335 | 14,315 | 563 | ||||||||||||||||||||
| 276 | 495 | 1,428 | 2,380 | 7,592 | 2,433 | 210 | ||||||||||||||||||||
| – | – | 868 | 11,307 | 2,459 | 1,436 | 4,887 | ||||||||||||||||||||
| – | – | – | 9 | 5 | 100 | – | ||||||||||||||||||||
| – | – | 819 | 3,623 | 204 | 1,172 | 2 | ||||||||||||||||||||
| – | 3,393 | 781 | – | 302 | 1,500 | 22 | ||||||||||||||||||||
| – | 19,052 | – | – | – | – | – | ||||||||||||||||||||
| – | 359 | 8 | 9,661 | 255 | 2,425 | 670 | ||||||||||||||||||||
| – | 19 | 19 | 300 | 273 | 163 | 32 | ||||||||||||||||||||
| – | – | 54 | 271 | 61 | 26 | – | ||||||||||||||||||||
| 6 | 17 | 10 | 56 | 20 | 19 | 17 | ||||||||||||||||||||
| 254,716 | 843,949 | 571,995 | 2,632,411 | 974,181 | 1,220,183 | 762,278 | ||||||||||||||||||||
| 447 | 669 | 668 | 2,838 | 1,029 | 841 | 1,570 | ||||||||||||||||||||
| – | – | 83,921 | – | – | 111,848 | – | ||||||||||||||||||||
| – | 3,589 | 11,932 | 3,618 | 38,328 | 26,601 | 10,550 | ||||||||||||||||||||
| – | – | – | – | 152 | – | – | ||||||||||||||||||||
| – | 2,293 | 256 | 146 | – | 2,858 | 4 | ||||||||||||||||||||
| – | – | 570 | – | 2,218 | 631 | 4 | ||||||||||||||||||||
| – | – | – | – | – | 263,138 | – | ||||||||||||||||||||
| – | – | 25 | 606 | 151 | 159 | 28 | ||||||||||||||||||||
| – | 56 | 9 | 7,097 | 515 | 1,400 | 313 | ||||||||||||||||||||
| 41 | 204 | 122 | 552 | 180 | 191 | 83 | ||||||||||||||||||||
| – | – | – | 11 | – | 96 | – | ||||||||||||||||||||
| – | 50 | 920 | 3,736 | 782 | 944 | 456 | ||||||||||||||||||||
| 20 | 167 | 99 | 514 | 65 | 162 | 61 | ||||||||||||||||||||
| 28 | 132 | 302 | 1,422 | 333 | 228 | 231 | ||||||||||||||||||||
| – | 1 | – | 3 | – | 1 | 1 | ||||||||||||||||||||
| – | – | 49 | – | – | – | – | ||||||||||||||||||||
| 21 | 65 | 30 | 183 | 116 | 210 | 51 | ||||||||||||||||||||
| 557 | 7,226 | 98,903 | 20,726 | 43,869 | 409,308 | 13,352 | ||||||||||||||||||||
| $ | 254,159 | $ | 836,723 | $ | 473,092 | $ | 2,611,685 | $ | 930,312 | $ | 810,875 | $ | 748,926 | |||||||||||||
| $ | 240,352 | $ | 373,238 | $ | 353,242 | $ | 1,498,885 | $ | 818,704 | $ | 953,811 | $ | 476,309 | |||||||||||||
| 1,342 | – | 95,930 | – | – | – | – | ||||||||||||||||||||
| – | – | 3,007 | 5,955 | 1,116 | 87 | 78,891 | ||||||||||||||||||||
| – | – | – | – | 4 | 716 | – | ||||||||||||||||||||
| – | 823 | 328 | – | (2,275 | ) | 1,173 | 99 | |||||||||||||||||||
| – | 5,038 | – | – | – | – | – | ||||||||||||||||||||
| – | – | 80,200 | – | – | 81,594 | – | ||||||||||||||||||||
SEI Institutional Managed Trust / Semi-Annual Report / March 31, 2021 | 283 |
STATEMENTS OF ASSETS AND LIABILITIES/CONSOLIDATED STATEMENTS OF ASSETS AND LIABILITIES ($ Thousands)
March 31, 2021 (Unaudited)
| Tax-Free Conservative Income Fund | ||||
Net Assets: | ||||
Paid-in capital — (unlimited authorization — no par value) | $ | 207,348 |
| |
Total distributable earnings/(loss) |
| (10) |
| |
Net Assets | $ | 207,338 |
| |
Net Asset Value, Offering and Redemption Price Per Share — Class F | $ | 10.00 |
| |
| ($199,912,621 ÷ |
| ||
| 19,993,696 shares | ) | ||
Net Asset Value, Offering and Redemption Price Per Share — Class Y | $ | 10.01 |
| |
| ($7,424,949 ÷ |
| ||
| 742,020 shares | ) | ||
N/A - Not applicable. Share class currently not offered.
The accompanying notes are an integral part of the financial statements.
284 | SEI Institutional Managed Trust / Semi-Annual Report / March 31, 2021 |
| Real Return Fund | Dynamic Asset Allocation Fund | Multi-Strategy Alternative Fund | Multi-Asset Accumulation Fund | Multi-Asset Income Fund | Multi-Asset Inflation Managed Fund | Multi-Asset Capital Stability Fund | ||||||||||||||||||||
| $ | 243,728 | $ | 432,639 | $ | 445,591 | $ | 2,743,900 | $ | 880,831 | $ | 949,282 | $ | 722,236 | |||||||||||||
| 10,431 | 404,084 | 27,501 | (132,215) | 49,481 | (138,407) | 26,690 | ||||||||||||||||||||
| $ | 254,159 | $ | 836,723 | $ | 473,092 | $ | 2,611,685 | $ | 930,312 | $ | 810,875 | $ | 748,926 | |||||||||||||
| $ | 10.60 | $ | 16.84 | $ | 10.52 | $ | 9.64 | $ | 11.25 | $ | 8.37 | $ | 10.41 | |||||||||||||
| ($233,755,257 ÷ | ($789,701,852 ÷ | ($464,439,135 ÷ | ($2,415,500,636 ÷ | ($753,205,754 ÷ | ($765,761,790 ÷ | ($707,571,994 ÷ | ||||||||||||||||||||
| 22,045,302 shares | ) | 46,891,657 shares | ) | 44,139,186 shares | ) | 250,577,828 shares | ) | 66,935,438 shares | ) | 91,501,486 shares | ) | 67,952,944 shares | ) | |||||||||||||
| $ | 10.65 | $ | 16.85 | $ | 10.52 | $ | 9.72 | $ | 11.25 | $ | 8.37 | $ | 10.43 | |||||||||||||
| ($20,404,113 ÷ | ($47,021,275 ÷ | ($8,652,789 ÷ | ($196,184,277 ÷ | ($177,106,314 ÷ | ($45,113,697 ÷ | ($41,353,618 ÷ | ||||||||||||||||||||
| 1,916,483 shares | ) | 2,790,437 shares | ) | 822,850 shares | ) | 20,180,047 shares | ) | 15,740,331 shares | ) | 5,390,165 shares | ) | 3,965,395 shares | ) | |||||||||||||
SEI Institutional Managed Trust / Semi-Annual Report / March 31, 2021 | 285 |
STATEMENTS OF OPERATIONS ($ Thousands)
For the six month period ended March 31, 2021 (Unaudited)
| Large Cap Fund | Large Cap Value Fund | Large Cap Growth Fund | ||||||||||
Investment Income: | ||||||||||||
Dividends | $ 18,302 | $ 21,768 | $ 5,691 | |||||||||
Income from affiliated investments(1) | 1 | 1 | 1 | |||||||||
Interest income | – | – | – | |||||||||
Security lending income - net(1) (2) | 119 | 64 | 4 | |||||||||
Less: foreign taxes withheld | (71 | ) | (251 | ) | (17 | ) | ||||||
Total Investment Income | 18,351 | 21,582 | 5,679 | |||||||||
Expenses: | ||||||||||||
Investment advisory fees | 4,209 | 2,483 | 3,262 | |||||||||
Administration fees | 3,050 | 2,125 | 2,416 | |||||||||
Shareholder servicing fees Class F | 2,560 | 1,552 | 1,801 | |||||||||
Shareholder servicing fees Class I | – | 3 | 4 | |||||||||
Trustees’ fees | 22 | 14 | 17 | |||||||||
Chief compliance officer fees | 6 | 4 | 5 | |||||||||
Administration servicing fees Class I | – | 3 | 4 | |||||||||
Printing fees | 117 | 77 | 87 | |||||||||
Custodian/Wire agent fees | 61 | 38 | 46 | |||||||||
Professional fees | 56 | 37 | 42 | |||||||||
Registration fees | 37 | 22 | 26 | |||||||||
Pricing fees | 19 | 11 | 15 | |||||||||
Other expenses | 23 | 14 | 17 | |||||||||
Total Expenses | 10,160 | 6,383 | 7,742 | |||||||||
Less: | ||||||||||||
Waiver of investment advisory fees | (297 | ) | (170 | ) | (599 | ) | ||||||
Waiver of shareholder servicing fees Class F | (20 | ) | (12 | ) | (14 | ) | ||||||
Waiver of shareholder servicing fees Class I | – | – | (1 | ) | ||||||||
Waiver of administration fees | (354 | ) | (88 | ) | (82 | ) | ||||||
Net Expenses | 9,489 | 6,113 | 7,046 | |||||||||
Net Investment Income (Loss) | 8,862 | 15,469 | (1,367 | ) | ||||||||
Net Realized Gain (Loss) on: | ||||||||||||
Investments | 104,642 | 60,912 | 92,151 | |||||||||
Affiliated investments | 1 | (3 | ) | 1 | ||||||||
Futures contracts | 3,314 | 1,900 | 2,398 | |||||||||
Net Change in Unrealized Appreciation (Depreciation) on: | ||||||||||||
Investments | 323,816 | 324,682 | 113,125 | |||||||||
Affiliated investments | (1 | ) | 1 | 2 | ||||||||
Futures contracts | 115 | (2 | ) | (96 | ) | |||||||
Foreign currency translation of other assets and liabilities denominated in foreign currencies | – | – | – | |||||||||
Net Increase in Net Assets Resulting from Operations | $ 440,749 | $ 402,959 | $ 206,214 | |||||||||
| (1) | See Note 6 in Notes to Financial Statements. |
| (2) | Income is from the investment of collateral in an affiliated security. |
Amounts designated as “—” are either $0 or have been rounded to $0.
The accompanying notes are an integral part of the financial statements.
| 286 | SEI Institutional Managed Trust / Semi-Annual Report / March 31, 2021 |
| Large Cap Index Fund | Tax-Managed Large Cap Fund | S&P 500 Index Fund | Small Cap Fund | Small Cap Value Fund | Small Cap Growth Fund | Tax-Managed Small/Mid Cap Fund | ||||||||||||||||||||
| $ 6,302 | $ 41,585 | $ 7,355 | $ 4,605 | $ 3,704 | $ 1,342 | $ 6,371 | ||||||||||||||||||||
| 2 | 1 | 1 | 1 | 1 | – | 1 | ||||||||||||||||||||
| – | – | – | 4 | – | – | – | ||||||||||||||||||||
| 6 | 45 | 3 | 84 | 67 | 188 | 70 | ||||||||||||||||||||
| – | (163 | ) | – | (15 | ) | (9 | ) | (4 | ) | (10 | ) | |||||||||||||||
| 6,310 | 41,468 | 7,359 | 4,679 | 3,763 | 1,526 | 6,432 | ||||||||||||||||||||
| 203 | 8,225 | 135 | 2,075 | 1,268 | 1,347 | 2,980 | ||||||||||||||||||||
| 1,217 | 4,484 | 991 | 958 | 585 | 622 | 1,375 | ||||||||||||||||||||
| 1,014 | 4,581 | 1,119 | 761 | 411 | 465 | 1,021 | ||||||||||||||||||||
| – | – | 7 | – | 2 | 2 | – | ||||||||||||||||||||
| 8 | 41 | – | 6 | 4 | 4 | 9 | ||||||||||||||||||||
| 2 | 11 | 2 | 2 | 1 | 1 | 2 | ||||||||||||||||||||
| – | – | 7 | – | 2 | 2 | – | ||||||||||||||||||||
| 44 | 223 | 49 | 35 | 21 | 23 | 50 | ||||||||||||||||||||
| 21 | 112 | 25 | 16 | 9 | 10 | 23 | ||||||||||||||||||||
| 20 | 106 | 23 | 16 | 10 | 11 | 23 | ||||||||||||||||||||
| 14 | 52 | 15 | 10 | 5 | 5 | 14 | ||||||||||||||||||||
| 10 | 33 | 11 | 8 | 5 | 5 | 10 | ||||||||||||||||||||
| 43 | 42 | 54 | 6 | 3 | 4 | 9 | ||||||||||||||||||||
| 2,596 | 17,910 | 2,438 | 3,893 | 2,326 | 2,501 | 5,516 | ||||||||||||||||||||
| (122 | ) | – | (45 | ) | (240 | ) | (152 | ) | (225 | ) | (352 | ) | ||||||||||||||
| (609 | ) | (37 | ) | (895 | ) | (6 | ) | (3 | ) | (4 | ) | (123 | ) | |||||||||||||
| – | – | (1 | ) | – | – | – | – | |||||||||||||||||||
| (843 | ) | (94 | ) | (364 | ) | (38 | ) | (16 | ) | (17 | ) | (54 | ) | |||||||||||||
| 1,022 | 17,779 | 1,133 | 3,609 | 2,155 | 2,255 | 4,987 | ||||||||||||||||||||
| 5,288 | 23,689 | 6,226 | 1,070 | 1,608 | (729 | ) | 1,445 | |||||||||||||||||||
| (1,719 | ) | 151,322 | 43,105 | 107,751 | 27,607 | 77,691 | 73,068 | |||||||||||||||||||
| – | 8 | – | 1 | 5 | – | 10 | ||||||||||||||||||||
| 2,203 | 3,867 | 2,456 | (498 | ) | (716 | ) | 99 | (209 | ) | |||||||||||||||||
| 140,473 | 662,735 | 104,914 | 135,112 | 139,863 | 48,572 | 227,772 | ||||||||||||||||||||
| 27 | 3 | – | (1 | ) | (2 | ) | (1 | ) | (3 | ) | ||||||||||||||||
| (2 | ) | (171 | ) | (24 | ) | 15 | 17 | 15 | (2 | ) | ||||||||||||||||
| – | 8 | – | – | – | – | – | ||||||||||||||||||||
| $ 146,270 | $ 841,461 | $ 156,677 | $ 243,450 | $ 168,382 | $ 125,647 | $ 302,081 | ||||||||||||||||||||
| SEI Institutional Managed Trust / Semi-Annual Report / March 31, 2021 | 287 |
STATEMENTS OF OPERATIONS ($ Thousands)
For the six month period ended March 31, 2021 (Unaudited)
| Mid-Cap Fund | U.S. Managed Volatility Fund | Global Managed Volatility Fund | ||||||||||
Investment Income: | ||||||||||||
Dividends | $ 653 | $ 18,711 | $ 11,312 | |||||||||
Income from affiliated investments(1) | – | 1 | – | |||||||||
Interest income | – | 4 | – | |||||||||
Security lending income - net(1) (2) | – | 36 | 27 | |||||||||
Less: foreign taxes withheld | (1 | ) | (108 | ) | (567 | ) | ||||||
Total Investment Income | 652 | 18,644 | 10,772 | |||||||||
Expenses: | ||||||||||||
Investment advisory fees | 144 | 4,904 | 3,404 | |||||||||
Administration fees | 108 | 2,231 | 1,571 | |||||||||
Shareholder servicing fees Class F | 86 | 977 | 1,136 | |||||||||
Shareholder servicing fees Class I | 1 | 2 | 1 | |||||||||
Trustees’ fees | 1 | 17 | 11 | |||||||||
Administration servicing fees Class I | 1 | 2 | 1 | |||||||||
Chief compliance officer fees | – | 4 | 3 | |||||||||
Distribution fees Class F | – | 2 | – | |||||||||
Printing fees | 4 | 89 | 57 | |||||||||
Professional fees | 2 | 43 | 28 | |||||||||
Registration fees | 2 | 30 | 20 | |||||||||
Custodian/Wire agent fees | 2 | 47 | 46 | |||||||||
Pricing fees | 2 | 17 | 16 | |||||||||
Other expenses | 1 | 17 | 13 | |||||||||
Total Expenses | 354 | 8,382 | 6,307 | |||||||||
Less: | ||||||||||||
Waiver of investment advisory fees | – | (1,966 | ) | (566 | ) | |||||||
Waiver of shareholder servicing fees Class F | (1 | ) | (8 | ) | (9 | ) | ||||||
Waiver of shareholder servicing fees Class I | – | – | – | |||||||||
Waiver of administration fees | – | (504 | ) | (77 | ) | |||||||
Net Expenses | 353 | 5,904 | 5,655 | |||||||||
Net Investment Income | 299 | 12,740 | 5,117 | |||||||||
Net Realized Gain (Loss) on: | ||||||||||||
Investments | 8,084 | 161,697 | 60,839 | |||||||||
Affiliated investments | – | (1 | ) | (2 | ) | |||||||
Futures contracts | 2 | 6,710 | 1,460 | |||||||||
Foreign currency translation | – | 99 | 29 | |||||||||
Forward foreign currency contracts | – | – | (2,782 | ) | ||||||||
Purchased and written options | – | – | – | |||||||||
Swap contracts | – | – | – | |||||||||
Net Change in Unrealized Appreciation (Depreciation) on: | ||||||||||||
Investments | 11,111 | 47,673 | 26,528 | |||||||||
Affiliated investments | – | – | 1 | |||||||||
Futures contracts | (1 | ) | (146 | ) | 39 | |||||||
Purchased and written options | – | – | – | |||||||||
Purchased and written swaptions | – | – | – | |||||||||
Swap contracts | – | – | – | |||||||||
Foreign currency translation of other assets and liabilities denominated in foreign currencies | – | (5 | ) | (65 | ) | |||||||
Forward foreign currency contracts | – | – | 2,416 | |||||||||
Net Increase (Decrease) in Net Assets Resulting from Operations | $ 19,495 | $ 228,767 | $ 93,580 | |||||||||
| (1) | See Note 6 in Notes to Financial Statements. |
| (2) | Income is from the investment of collateral in an affiliated security. |
Amounts designated as “—” are either $0 or have been rounded to $0.
The accompanying notes are an integral part of the financial statements.
| 288 | SEI Institutional Managed Trust / Semi-Annual Report / March 31, 2021 |
| Tax-Managed Managed Volatility Fund | Tax-Managed International Managed Volatility Fund | Real Estate Fund | Core Fixed Income Fund | High Yield Bond Fund | Conservative Income Fund | Tax-Free Conservative Income Fund | ||||||||||||||||||||
| $ 11,057 | $ 6,292 | $ 1,245 | $ – | $ 732 | $ – | $ – | ||||||||||||||||||||
| 1 | – | – | 10 | 2 | – | – | ||||||||||||||||||||
| – | – | – | 44,617 | 53,575 | 349 | 167 | ||||||||||||||||||||
| 2 | 43 | – | 21 | – | – | – | ||||||||||||||||||||
| (41 | ) | (415 | ) | – | – | (1 | ) | – | – | |||||||||||||||||
| 11,019 | 5,920 | 1,245 | 44,648 | 54,308 | 349 | 167 | ||||||||||||||||||||
| 3,115 | 1,238 | 316 | 5,919 | 3,695 | 160 | 105 | ||||||||||||||||||||
| 1,438 | 857 | 146 | 3,376 | 1,512 | 320 | 210 | ||||||||||||||||||||
| 1,100 | 406 | 99 | 4,800 | 1,670 | 374 | 254 | ||||||||||||||||||||
| – | – | – | 6 | 1 | – | – | ||||||||||||||||||||
| 10 | 4 | 1 | 36 | 16 | 3 | 2 | ||||||||||||||||||||
| – | – | – | 6 | 1 | – | – | ||||||||||||||||||||
| 3 | 1 | – | 9 | 4 | 1 | 1 | ||||||||||||||||||||
| – | – | – | – | – | – | – | ||||||||||||||||||||
| 52 | 21 | 5 | 221 | 81 | 17 | 11 | ||||||||||||||||||||
| 25 | 10 | 3 | 103 | 40 | 8 | 6 | ||||||||||||||||||||
| 17 | 6 | 2 | 51 | 26 | 5 | 3 | ||||||||||||||||||||
| 27 | 33 | 3 | 98 | 44 | 10 | 6 | ||||||||||||||||||||
| 9 | 16 | 1 | 251 | 127 | 8 | 10 | ||||||||||||||||||||
| 10 | 4 | 2 | 25 | 15 | 3 | 2 | ||||||||||||||||||||
| 5,806 | 2,596 | 578 | 14,901 | 7,232 | 909 | 610 | ||||||||||||||||||||
| (1,025 | ) | (525 | ) | (42 | ) | (1,190 | ) | (578 | ) | (64 | ) | (42 | ) | |||||||||||||
| (9 | ) | (3 | ) | (1 | ) | (38 | ) | (13 | ) | (224 | ) | (153 | ) | |||||||||||||
| – | – | – | (1 | ) | – | – | – | |||||||||||||||||||
| (69 | ) | (19 | ) | (1 | ) | – | (103 | ) | (287 | ) | (258 | ) | ||||||||||||||
| 4,703 | 2,049 | 534 | 13,672 | 6,538 | 334 | 157 | ||||||||||||||||||||
| 6,316 | 3,871 | 711 | 30,976 | 47,770 | 15 | 10 | ||||||||||||||||||||
| 14,235 | 2,323 | 3,579 | 3,783 | 7,907 | 1 | – | ||||||||||||||||||||
| – | (1 | ) | – | 93 | – | – | – | |||||||||||||||||||
| 1,315 | 300 | – | (10,638 | ) | – | – | – | |||||||||||||||||||
| (5 | ) | 39 | – | (2,594 | ) | (26 | ) | – | – | |||||||||||||||||
| – | – | – | 429 | – | – | – | ||||||||||||||||||||
| – | – | – | (282 | ) | – | – | – | |||||||||||||||||||
| – | – | – | 4,936 | 94 | – | – | ||||||||||||||||||||
| 100,937 | 31,134 | 14,420 | (123,705 | ) | 118,201 | (30 | ) | (26 | ) | |||||||||||||||||
| – | 2 | – | (6 | ) | – | – | – | |||||||||||||||||||
| (49 | ) | 68 | – | (9,130 | ) | – | – | – | ||||||||||||||||||
| – | – | – | 200 | – | – | – | ||||||||||||||||||||
| – | – | – | 201 | – | – | – | ||||||||||||||||||||
| – | – | – | 9,385 | (44 | ) | – | – | |||||||||||||||||||
| 14 | (39 | ) | – | 6 | – | – | – | |||||||||||||||||||
| – | – | – | 1,160 | – | – | – | ||||||||||||||||||||
| $ 122,763 | $ 37,697 | $ 18,710 | $ (95,186 | ) | $ 173,902 | $ (14 | ) | $ (16 | ) | |||||||||||||||||
| SEI Institutional Managed Trust / Semi-Annual Report / March 31, 2021 | 289 |
STATEMENTS OF OPERATIONS/CONSOLIDATED STATEMENTS OF OPERATIONS ($ Thousands)
For the six month period ended March 31, 2021 (Unaudited)
| Real Return Fund | Dynamic Asset Allocation Fund | |||||||
Investment Income: | ||||||||
Dividends | $ – | $ 5,901 | ||||||
Income from affiliated investments(1) | – | – | ||||||
Interest income | 2,301 | 3 | ||||||
Less: foreign taxes withheld | – | – | ||||||
Total Investment Income | 2,301 | 5,904 | ||||||
Expenses: | ||||||||
Shareholder servicing fees Class F | 298 | 943 | ||||||
Investment advisory fees | 286 | 2,398 | ||||||
Administration fees | 260 | 1,199 | ||||||
Trustees’ fees | 3 | 8 | ||||||
Chief compliance officer fees | 1 | 2 | ||||||
Printing fees | 14 | 43 | ||||||
Custodian/Wire agent fees | 8 | 11 | ||||||
Professional fees | 7 | 21 | ||||||
Registration fees | 4 | 13 | ||||||
Pricing fees | 2 | 9 | ||||||
Dividend expense on securities sold short | – | – | ||||||
Interest expense | – | – | ||||||
Other expenses | 3 | 8 | ||||||
Total Expenses | 886 | 4,655 | ||||||
Less: | ||||||||
Waiver of investment advisory fees | (117 | ) | (1,654 | ) | ||||
Waiver of shareholder servicing fees Class F | (179 | ) | – | |||||
Waiver of administration fees | (13 | ) | (53 | ) | ||||
Net Expenses | 577 | 2,948 | ||||||
Net Investment Income (Loss) | 1,724 | 2,956 | ||||||
Net Realized Gain (Loss) on: | ||||||||
Investments | 1,932 | 35,530 | ||||||
Securities sold short | – | – | ||||||
Futures contracts | – | 12,727 | ||||||
Foreign currency translation | – | 20 | ||||||
Forward foreign currency contracts | – | (20 | ) | |||||
Purchased and written options | – | – | ||||||
Purchased and written swaptions | – | 2,956 | ||||||
Swap contracts | – | (790 | ) | |||||
Capital gains on Investments | – | – | ||||||
Net Change in Unrealized Appreciation (Depreciation) on: | ||||||||
Investments | 2,490 | 83,702 | ||||||
Securities sold short | – | – | ||||||
Futures contracts | – | 551 | ||||||
Purchased and written options | – | 2,570 | ||||||
Purchased and written swaptions | – | 12,022 | ||||||
Swap contracts | – | (916 | ) | |||||
Foreign currency translation of other assets and liabilities denominated in foreign currencies | – | (1 | ) | |||||
Forward foreign currency contracts | – | (38 | ) | |||||
Net Increase in Net Assets Resulting from Operations | $ 6,146 | $ 151,269 | ||||||
| (1) | See Note 6 in Notes to Financial Statements. |
| (2) | Income is from the investment of collateral in an affiliated security. |
| 290 | SEI Institutional Managed Trust / Semi-Annual Report / March 31, 2021 |
| Multi-Strategy Alternative Fund | Multi-Asset Accumulation Fund | Multi-Asset Income Fund | Multi-Asset Inflation Managed Fund | Multi-Asset Capital Stability Fund | ||||||||||||||
| $ 1,350 | $ 1,690 | $ 855 | $ 3,471 | $ 612 | ||||||||||||||
| 5 | – | – | – | – | ||||||||||||||
| 4,957 | 1,779 | 19,746 | 7,824 | 853 | ||||||||||||||
| – | (103 | ) | (46 | ) | – | – | ||||||||||||
| 6,312 | 3,366 | 20,555 | 11,295 | 1,465 | ||||||||||||||
| 591 | 3,057 | 971 | 932 | 913 | ||||||||||||||
| 3,608 | 9,896 | 2,825 | 2,177 | 1,553 | ||||||||||||||
| 722 | 3,522 | 1,413 | 1,187 | 1,165 | ||||||||||||||
| 5 | 27 | 10 | 8 | 8 | ||||||||||||||
| 1 | 7 | 2 | 2 | 2 | ||||||||||||||
| 26 | 141 | 50 | 42 | 42 | ||||||||||||||
| 14 | 44 | 21 | 16 | 16 | ||||||||||||||
| 13 | 69 | 25 | 21 | 20 | ||||||||||||||
| 8 | 47 | 16 | 14 | 13 | ||||||||||||||
| 52 | 57 | 117 | 52 | 11 | ||||||||||||||
| 1,080 | – | – | 662 | – | ||||||||||||||
| 564 | – | – | 390 | – | ||||||||||||||
| 8 | 38 | 14 | 13 | 12 | ||||||||||||||
| 6,692 | 16,905 | 5,464 | 5,516 | 3,755 | ||||||||||||||
| (1,490 | ) | (1,450 | ) | (849 | ) | (863 | ) | (155 | ) | |||||||||
| (5 | ) | – | (583 | ) | – | (548 | ) | |||||||||||
| (310 | ) | (221 | ) | (334 | ) | (84 | ) | (656 | ) | |||||||||
| 4,887 | 15,234 | 3,698 | 4,569 | 2,396 | ||||||||||||||
| 1,425 | (11,868 | ) | 16,857 | 6,726 | (931 | ) | ||||||||||||
| 52,976 | 5,309 | 12,625 | (1,297 | ) | 5,860 | |||||||||||||
| (16,995 | ) | – | – | (11,684 | ) | – | ||||||||||||
| (228 | ) | 193,534 | (1,765 | ) | 19,844 | 5,794 | ||||||||||||
| (262 | ) | (8,207 | ) | (343 | ) | 446 | (1,037 | ) | ||||||||||
| (796 | ) | 5,080 | (2,045 | ) | (1,901 | ) | 1,104 | |||||||||||
| (308 | ) | – | (5,162 | ) | (2,056 | ) | 614 | |||||||||||
| 10 | – | – | 1,106 | – | ||||||||||||||
| (951 | ) | 28,136 | 1,567 | 2,824 | (570 | ) | ||||||||||||
| 1,293 | – | – | – | – | ||||||||||||||
| 2,856 | 15,391 | 27,277 | 52,919 | 8,465 | ||||||||||||||
| 46 | – | – | (12,167 | ) | – | |||||||||||||
| 84 | (67,999 | ) | (3,364 | ) | 1,574 | (495 | ) | |||||||||||
| (237 | ) | – | (975 | ) | (419 | ) | (137 | ) | ||||||||||
| 3 | – | – | (306 | ) | – | |||||||||||||
| 181 | (4,961 | ) | 2,873 | 3,316 | (1,380 | ) | ||||||||||||
| (37 | ) | (18 | ) | (125 | ) | (6 | ) | (3,148 | ) | |||||||||
| (69 | ) | 7,285 | 1,635 | 102 | 4,291 | |||||||||||||
| $ 38,991 | $ 161,682 | $ 49,055 | $ 59,021 | $ 18,430 | ||||||||||||||
| SEI Institutional Managed Trust / Semi-Annual Report / March 31, 2021 | 291 |
STATEMENTS OF CHANGES IN NET ASSETS ($ Thousands)
For the six month period ended March 31, 2021 (Unaudited) and the year ended September 30,
| Large Cap Fund | Large Cap Value Fund | Large Cap Growth Fund | ||||||||||||||||||||||
| 10/01/20 to 03/31/21 | 2020 | 10/01/20 to 03/31/21 | 2020 | 10/01/20 to 03/31/21 | 2020 | |||||||||||||||||||
Operations: | ||||||||||||||||||||||||
Net investment income (loss) | $ | 8,862 | $ | 25,302 | $ | 15,469 | $ | 27,385 | $ | (1,367 | ) | $ | 2,087 | |||||||||||
Net realized gain (loss) from investments, securities sold short, futures contracts, forward foreign currency contracts, options, swaptions and swap contracts | 107,957 | 29,421 | 62,809 | (69,598 | ) | 94,550 | 132,163 | |||||||||||||||||
Net change in unrealized appreciation (depreciation) on investments, securities sold short, futures contracts, forward foreign currency contracts, options, swaptions and swap contracts | 323,930 | 97,010 | 324,681 | (80,344 | ) | 113,031 | 305,182 | |||||||||||||||||
Net change in unrealized appreciation (depreciation) on foreign currency transactions | — | — | — | — | — | — | ||||||||||||||||||
Contribution from Adviser(1) | — | — | — | — | — | — | ||||||||||||||||||
Net Increase (Decrease) in Net Assets Resulting from Operations | 440,749 | 151,733 | 402,959 | (122,557 | ) | 206,214 | 439,432 | |||||||||||||||||
Distributions: | ||||||||||||||||||||||||
Class F: | (63,755 | ) | (158,501 | ) | (12,193 | ) | (45,392 | ) | (127,247 | ) | (76,682 | ) | ||||||||||||
Class I: | N/A | N/A | (25 | ) | (104 | ) | (330 | ) | (159 | ) | ||||||||||||||
Class Y: | (3,540 | ) | (9,625 | ) | (1,887 | ) | (6,239 | ) | (16,536 | ) | (9,790 | ) | ||||||||||||
Return of Capital: | ||||||||||||||||||||||||
Class F | — | — | — | — | — | — | ||||||||||||||||||
Class Y | — | — | — | — | — | — | ||||||||||||||||||
Total Distributions | (67,295 | ) | (168,126 | ) | (14,105 | ) | (51,735 | ) | (144,113 | ) | (86,631 | ) | ||||||||||||
Capital Share Transactions:(2) | ||||||||||||||||||||||||
Class F: | ||||||||||||||||||||||||
Proceeds from shares issued | 121,916 | 255,737 | 89,207 | 258,992 | 112,018 | 208,478 | ||||||||||||||||||
Reinvestment of dividends & distributions | 58,838 | 147,271 | 11,477 | 42,535 | 119,106 | 71,751 | ||||||||||||||||||
Cost of shares redeemed | (405,239 | ) | (602,760 | ) | (242,161 | ) | (241,351 | ) | (211,283 | ) | (511,913 | ) | ||||||||||||
Net increase (decrease) from Class F transactions | (224,485 | ) | (199,752 | ) | (141,477 | ) | 60,176 | 19,841 | (231,684 | ) | ||||||||||||||
Class I: | ||||||||||||||||||||||||
Proceeds from shares issued | N/A | N/A | 155 | 577 | 534 | 566 | ||||||||||||||||||
Reinvestment of dividends & distributions | N/A | N/A | 22 | 87 | 290 | 124 | ||||||||||||||||||
Cost of shares redeemed | N/A | N/A | (433 | ) | (872 | ) | (727 | ) | (741 | ) | ||||||||||||||
Net increase (decrease) from Class I transactions | N/A | N/A | (256 | ) | (208 | ) | 97 | (51 | ) | |||||||||||||||
Class Y: | ||||||||||||||||||||||||
Proceeds from shares issued | 6,242 | 29,697 | 11,539 | 35,301 | 17,883 | 21,651 | ||||||||||||||||||
Reinvestment of dividends & distributions | 3,437 | 9,360 | 1,761 | 5,806 | 15,475 | 9,124 | ||||||||||||||||||
Cost of shares redeemed | (17,096 | ) | (66,154 | ) | (23,789 | ) | (23,082 | ) | (12,361 | ) | (55,926 | ) | ||||||||||||
Net increase (decrease) from Class Y transactions | (7,417 | ) | (27,097 | ) | (10,489 | ) | 18,025 | 20,997 | (25,151 | ) | ||||||||||||||
Increase (Decrease) in Net Assets Derived from Capital Share Transactions | (231,902 | ) | (226,849 | ) | (152,222 | ) | 77,993 | 40,935 | (256,886 | ) | ||||||||||||||
Net Increase (Decrease) in Net Assets | 141,552 | (243,242 | ) | 236,632 | (96,299 | ) | 103,036 | 95,915 | ||||||||||||||||
Net Assets | ||||||||||||||||||||||||
Beginning of period | 2,047,377 | 2,290,619 | 1,248,215 | 1,344,514 | 1,569,980 | 1,474,065 | ||||||||||||||||||
End of period | $ | 2,188,929 | $ | 2,047,377 | $ | 1,484,847 | $ | 1,248,215 | $ | 1,673,016 | $ | 1,569,980 | ||||||||||||
| (1) | See Note 6 in Notes to Financial Statements for additional information. |
| (2) | See Note 7 in Notes to Financial Statements for additional information. |
N/A — Not applicable. Shares currently not offered.
Amounts designated as “—” are either $0 or have been rounded to $0.
The accompanying notes are an integral part of the financial statements.
| 292 | SEI Institutional Managed Trust / Semi-Annual Report / March 31, 2021 |
| Large Cap Index Fund | Tax-Managed Large Cap Fund | S&P 500 Index Fund | Small Cap Fund | |||||||||||||||||||||||||||
| 10/01/20 to 03/31/21 | 2020 | 10/01/20 to 03/31/21 | 2020 | 10/01/20 to 03/31/21 | 2020 | 10/01/20 to 03/31/21 | 2020 | |||||||||||||||||||||||
| $ 5,288 | $ | 8,859 | $ | 23,689 | $ | 46,679 | $ | 6,226 | $ | 13,594 | $ | 1,070 | $ | 970 | ||||||||||||||||
| 484 | (7,319 | ) | 155,197 | 58,583 | 45,561 | 45,503 | 107,254 | (34,061 | ) | |||||||||||||||||||||
| 140,498 | 86,442 | 662,567 | 149,757 | 104,890 | 49,436 | 135,126 | 18,549 | |||||||||||||||||||||||
| — | — | 8 | (3 | ) | — | — | — | — | ||||||||||||||||||||||
| — | �� | — | — | — | — | 221 | — | — | ||||||||||||||||||||||
| 146,270 | 87,982 | 841,461 | 255,016 | 156,677 | 108,754 | 243,450 | (14,542 | ) | ||||||||||||||||||||||
| (4,776) | (9,299 | ) | (68,021 | ) | (305,586 | ) | (47,910 | ) | (38,922 | ) | (648 | ) | (1,000 | ) | ||||||||||||||||
| N/A | N/A | N/A | N/A | (296 | ) | (204 | ) | N/A | N/A | |||||||||||||||||||||
| N/A | N/A | (8,824 | ) | (39,347 | ) | N/A | N/A | (62 | ) | (132 | ) | |||||||||||||||||||
| — | — | — | — | — | — | — | (31 | ) | ||||||||||||||||||||||
| — | — | — | — | — | — | — | (4 | ) | ||||||||||||||||||||||
| (4,776) | (9,299 | ) | (76,845 | ) | (344,933 | ) | (48,206 | ) | (39,126 | ) | (710 | ) | (1,167 | ) | ||||||||||||||||
| 217,040 | 395,051 | 144,938 | 329,873 | 43,129 | 234,977 | 33,563 | 90,876 | |||||||||||||||||||||||
| 4,555 | 8,893 | 60,244 | 269,671 | 43,128 | 35,284 | 602 | 959 | |||||||||||||||||||||||
| (155,289) | (231,827 | ) | (383,661 | ) | (700,148 | ) | (102,213 | ) | (321,680 | ) | (114,123 | ) | (127,496 | ) | ||||||||||||||||
| 66,306 | 172,117 | (178,479 | ) | (100,604 | ) | (15,956 | ) | (51,419 | ) | (79,958 | ) | (35,661 | ) | |||||||||||||||||
| N/A | N/A | N/A | N/A | 538 | 1,642 | N/A | N/A | |||||||||||||||||||||||
| N/A | N/A | N/A | N/A | 252 | 152 | N/A | N/A | |||||||||||||||||||||||
| N/A | N/A | N/A | N/A | (1,070 | ) | (2,187 | ) | N/A | N/A | |||||||||||||||||||||
| N/A | N/A | N/A | N/A | (280 | ) | (393 | ) | N/A | N/A | |||||||||||||||||||||
| N/A | N/A | 13,940 | 57,471 | N/A | N/A | 1,878 | 10,275 | |||||||||||||||||||||||
| N/A | N/A | 8,197 | 36,243 | N/A | N/A | 60 | 132 | |||||||||||||||||||||||
| N/A | N/A | (37,489 | ) | (116,964 | ) | N/A | N/A | (8,347 | ) | (16,903 | ) | |||||||||||||||||||
| N/A | N/A | (15,352 | ) | (23,250 | ) | N/A | N/A | (6,409 | ) | (6,496 | ) | |||||||||||||||||||
| 66,306 | 172,117 | (193,831 | ) | (123,854 | ) | (16,236 | ) | (51,812 | ) | (86,367 | ) | (42,157 | ) | |||||||||||||||||
| 207,800 | 250,800 | 570,785 | (213,771 | ) | 92,235 | 17,816 | 156,373 | (57,866 | ) | |||||||||||||||||||||
| 706,457 | 455,657 | 3,777,369 | 3,991,140 | 850,084 | 832,268 | 529,522 | 587,388 | |||||||||||||||||||||||
| $ 914,257 | $ | 706,457 | $ | 4,348,154 | $ | 3,777,369 | $ | 942,319 | $ | 850,084 | $ | 685,895 | $ | 529,522 | ||||||||||||||||
| SEI Institutional Managed Trust / Semi-Annual Report / March 31, 2021 | 293 |
STATEMENTS OF CHANGES IN NET ASSETS ($ Thousands)
For the six month period ended March 31, 2021 (Unaudited) and the year ended September 30,
Small Cap Value Fund | Small Cap Growth Fund | Tax-Managed Small/Mid Cap Fund | ||||||||||||||||||||||
| 10/01/20 to 03/31/21 | 2020 | 10/01/20 to 03/31/21 | 2020 | 10/01/20 to 03/31/21 | 2020 | |||||||||||||||||||
Operations: | ||||||||||||||||||||||||
Net investment income (loss) | $ | 1,608 | $ | 2,758 | $ | (729 | ) | $ | (1,155 | ) | $ | 1,445 | $ | 1,906 | ||||||||||
Net realized gain (loss) from investments, securities sold short, futures contracts, forward foreign currency contracts, options, swaptions and swap contracts | 26,896 | (19,553 | ) | 77,790 | (5,988 | ) | 72,869 | (22,116 | ) | |||||||||||||||
Net realized gain (loss) on foreign currency transactions | — | — | — | — | — | — | ||||||||||||||||||
Net change in unrealized appreciation (depreciation) on investments, securities sold short, futures contracts, forward foreign currency contracts, options,swaptions and swap contracts | 139,878 | (31,753 | ) | 48,586 | 23,393 | 227,767 | (34,962 | ) | ||||||||||||||||
Net change in unrealized appreciation (depreciation) on foreign currency transactions | — | — | — | — | — | — | ||||||||||||||||||
Net Increase (Decrease) in Net Assets Resulting from Operations | 168,382 | (48,548 | ) | 125,647 | 16,250 | 302,081 | (55,172 | ) | ||||||||||||||||
Distributions: | ||||||||||||||||||||||||
Class F: | (1,245 | ) | (3,137 | ) | — | (10,166 | ) | (628 | ) | (18,990 | ) | |||||||||||||
Class I: | (5 | ) | (16 | ) | — | (51 | ) | N/A | N/A | |||||||||||||||
Class Y: | (293 | ) | (627 | ) | — | (1,146 | ) | (215 | ) | (2,600 | ) | |||||||||||||
Total Distributions | (1,543 | ) | (3,780 | ) | — | (11,363 | ) | (843 | ) | (21,590 | ) | |||||||||||||
Capital Share Transactions:(1) | ||||||||||||||||||||||||
Class F: | ||||||||||||||||||||||||
Proceeds from shares issued | 36,648 | 71,807 | 46,308 | 47,465 | 56,560 | 100,445 | ||||||||||||||||||
Reinvestment of dividends & distributions | 1,162 | 2,903 | — | 9,353 | 550 | 16,582 | ||||||||||||||||||
Cost of shares redeemed | (66,399 | ) | (53,427 | ) | (49,940 | ) | (64,054 | ) | (75,242 | ) | (155,596 | ) | ||||||||||||
Net increase (decrease) from Class F transactions | (28,589 | ) | 21,283 | (3,632 | ) | (7,236 | ) | (18,132 | ) | (38,569 | ) | |||||||||||||
Class I: | ||||||||||||||||||||||||
Proceeds from shares issued | 125 | 523 | 296 | 228 | N/A | N/A | ||||||||||||||||||
Reinvestment of dividends & distributions | 4 | 15 | — | 45 | N/A | N/A | ||||||||||||||||||
Cost of shares redeemed | (219 | ) | (786 | ) | (135 | ) | (453 | ) | N/A | N/A | ||||||||||||||
Net increase (decrease) from Class I transactions | (90 | ) | (248 | ) | 161 | (180 | ) | N/A | N/A | |||||||||||||||
Class Y: | ||||||||||||||||||||||||
Proceeds from shares issued | 3,057 | 21,832 | 2,132 | 4,087 | 2,487 | 21,632 | ||||||||||||||||||
Reinvestment of dividends & distributions | 272 | 573 | — | 1,059 | 199 | 2,395 | ||||||||||||||||||
Cost of shares redeemed | (11,542 | ) | (14,083 | ) | (4,683 | ) | (6,360 | ) | (12,171 | ) | (29,000 | ) | ||||||||||||
Net increase (decrease) from Class Y transactions | (8,213 | ) | 8,322 | (2,551 | ) | (1,214 | ) | (9,485 | ) | (4,973 | ) | |||||||||||||
Increase (Decrease) in Net Assets Derived from Capital Share Transactions | (36,892 | ) | 29,357 | (6,022 | ) | (8,630 | ) | (27,617 | ) | (43,542 | ) | |||||||||||||
Net Increase (Decrease) in Net Assets | 129,947 | (22,971 | ) | 119,625 | (3,743 | ) | 273,621 | (120,304 | ) | |||||||||||||||
Net Assets | ||||||||||||||||||||||||
Beginning of period | 297,647 | 320,618 | 324,819 | 328,562 | 749,505 | 869,809 | ||||||||||||||||||
End of period | $ | 427,594 | $ | 297,647 | $ | 444,444 | $ | 324,819 | $ | 1,023,126 | $ | 749,505 | ||||||||||||
| (1) | See Note 6 in Notes to Financial Statements for additional information. |
| (2) | See Note 7 in Notes to Financial Statements for additional information. |
N/A — Not applicable. Shares currently not offered.
Amounts designated as “—” are either $0 or have been rounded to $0.
The accompanying notes are an integral part of the financial statements.
| 294 | SEI Institutional Managed Trust / Semi-Annual Report / March 31, 2021 |
| Mid-Cap Fund | U.S. Managed Volatility Fund | Global Managed Volatility Fund | Tax-Managed Managed Volatility Fund | Tax-Managed International Managed Volatility Fund | ||||||||||||||||||||||||||||||||||
| 10/01/20 to 03/31/21 | 2020 | 10/01/20 to 03/31/21 | 2020 | 10/01/20 to 03/31/21 | 2020 | 10/01/20 to 03/31/21 | 2020 | 10/01/20 to 03/31/21 | 2020 | |||||||||||||||||||||||||||||
| $ | 299 | $ | 1,023 | $ | 12,740 | $ | 28,854 | $ | 5,117 | $ | 13,575 | $ | 6,316 | $ | 15,096 | $ | 3,871 | $ | 7,045 | |||||||||||||||||||
| 8,086 | (6,157 | ) | 168,406 | 3,236 | 59,515 | 315 | 15,548 | 12,195 | 2,622 | (22,643 | ) | |||||||||||||||||||||||||||
| — | — | 99 | (112 | ) | 29 | 368 | (3 | ) | 70 | 39 | 195 | |||||||||||||||||||||||||||
| 11,110 | (1,701 | ) | 47,527 | (121,553 | ) | 28,984 | (79,501 | ) | 100,895 | (56,745 | ) | 31,204 | 4,071 | |||||||||||||||||||||||||
| — | — | (5 | ) | (8 | ) | (65 | ) | 270 | 7 | (6 | ) | (39 | ) | 124 | ||||||||||||||||||||||||
| 19,495 | (6,835 | ) | 228,767 | (89,583 | ) | 93,580 | (64,973 | ) | 122,763 | (29,390 | ) | 37,697 | (11,208 | ) | ||||||||||||||||||||||||
| (361) | (2,451 | ) | (67,450 | ) | (41,118 | ) | (9,100 | ) | (55,847 | ) | (11,588 | ) | (38,400 | ) | (5,612 | ) | (9,743 | ) | ||||||||||||||||||||
| (3) | (16 | ) | (112 | ) | (61 | ) | (8 | ) | (55 | ) | N/A | N/A | N/A | N/A | ||||||||||||||||||||||||
| (19) | (73 | ) | (77,919 | ) | (45,813 | ) | (1,740 | ) | (13,197 | ) | (1,129 | ) | (3,643 | ) | (1,091 | ) | (1,383 | ) | ||||||||||||||||||||
| (383) | (2,540 | ) | (145,481 | ) | (86,992 | ) | (10,848 | ) | (69,099 | ) | (12,717 | ) | (42,043 | ) | (6,703 | ) | (11,126 | ) | ||||||||||||||||||||
| 9,151 | 26,083 | 65,171 | 187,528 | 78,782 | 215,299 | 44,907 | 145,802 | 27,802 | 91,287 | |||||||||||||||||||||||||||||
| 337 | 1,995 | 57,969 | 35,925 | 7,835 | 48,789 | 9,868 | 33,071 | 4,832 | 8,442 | |||||||||||||||||||||||||||||
| (18,235) | (54,382 | ) | (153,493 | ) | (287,534 | ) | (170,936 | ) | (305,585 | ) | (113,344 | ) | (261,670 | ) | (44,271 | ) | (95,568 | ) | ||||||||||||||||||||
| (8,747) | (26,304 | ) | (30,353 | ) | (64,081 | ) | (84,319 | ) | (41,497 | ) | (58,569 | ) | (82,797 | ) | (11,637 | ) | 4,161 | |||||||||||||||||||||
| 29 | 54 | 18 | 78 | 20 | 35 | N/A | N/A | N/A | N/A | |||||||||||||||||||||||||||||
| 3 | 16 | 112 | 61 | 8 | 55 | N/A | N/A | N/A | N/A | |||||||||||||||||||||||||||||
| (64) | (148 | ) | (96 | ) | (73 | ) | (52 | ) | (100 | ) | N/A | N/A | N/A | N/A | ||||||||||||||||||||||||
| (32) | (78 | ) | 34 | 66 | (24 | ) | (10 | ) | N/A | N/A | N/A | N/A | ||||||||||||||||||||||||||
| 1,146 | 1,405 | 69,015 | 359,723 | 13,242 | 63,543 | 4,294 | 17,661 | 2,378 | 38,026 | |||||||||||||||||||||||||||||
| 18 | 70 | 76,816 | 43,974 | 1,591 | 12,675 | 965 | 3,115 | 934 | 1,164 | |||||||||||||||||||||||||||||
| (777) | (1,323 | ) | (836,826 | ) | (364,414 | ) | (36,923 | ) | (124,771 | ) | (8,712 | ) | (26,773 | ) | (2,832 | ) | (27,290 | ) | ||||||||||||||||||||
| 387 | 152 | (690,995 | ) | 39,283 | (22,090 | ) | (48,553 | ) | (3,453 | ) | (5,997 | ) | 480 | 11,900 | ||||||||||||||||||||||||
| (8,392) | (26,230 | ) | (721,314 | ) | (24,732 | ) | (106,433 | ) | (90,060 | ) | (62,022 | ) | (88,794 | ) | (11,157 | ) | 16,061 | |||||||||||||||||||||
| 10,720 | (35,605 | ) | (638,028 | ) | (201,307 | ) | (23,701 | ) | (224,132 | ) | 48,024 | (160,227 | ) | 19,837 | (6,273 | ) | ||||||||||||||||||||||
| 69,995 | 105,600 | 1,636,825 | 1,838,132 | 1,057,809 | 1,281,941 | 932,292 | 1,092,519 | 368,505 | 374,778 | |||||||||||||||||||||||||||||
| $ | 80,715 | $ | 69,995 | $ | 998,797 | $ | 1,636,825 | $ | 1,034,108 | $ | 1,057,809 | $ | 980,316 | $ | 932,292 | $ | 388,342 | $ | 368,505 | |||||||||||||||||||
| SEI Institutional Managed Trust / Semi-Annual Report / March 31, 2021 | 295 |
STATEMENTS OF CHANGES IN NET ASSETS/CONSOLIDATED STATEMENTS OF CHANGES IN NET ASSETS ($ Thousands)
For the six month period ended March 31, 2021 (Unaudited) and the year ended September 30,
| Real Estate Fund | Core Fixed Income Fund | High Yield Bond Fund | ||||||||||||||||||||||
| 10/01/20 to 03/31/21 | 2020 | 10/01/20 to 03/31/21 | 2020 | 10/01/20 to 03/31/21 | 2020 | |||||||||||||||||||
Operations: | ||||||||||||||||||||||||
Net investment income | $ | 711 | $ | 1,184 | $ | 30,976 | $ | 85,126 | $ | 47,770 | $ | 84,980 | ||||||||||||
Net realized gain (loss) from investments, securities sold short, futures contracts, forward foreign currency contracts, options, swaptions and swap contracts | 3,579 | 305 | (1,679 | ) | 194,337 | 8,001 | (27,172 | ) | ||||||||||||||||
Net realized gain (loss) on foreign currency transactions | — | — | (2,594 | ) | 33 | (26 | ) | — | ||||||||||||||||
Net change in unrealized appreciation (depreciation) on investments, securities sold short, futures contracts, forward foreign currency contracts, options, swaptions and swap contracts | 14,420 | (21,515 | ) | (121,895 | ) | 35,614 | 118,157 | (55,093 | ) | |||||||||||||||
Net change in unrealized appreciation (depreciation) on foreign currency transactions | — | — | 6 | 293 | — | (4 | ) | |||||||||||||||||
Net Increase (Decrease) in Net Assets Resulting from Operations | 18,710 | (20,026 | ) | (95,186 | ) | 315,403 | 173,902 | 2,711 | ||||||||||||||||
Distributions: | ||||||||||||||||||||||||
Class F: | (4,043 | ) | (8,039 | ) | (176,926 | ) | (124,229 | ) | (62,056 | ) | (86,586 | ) | ||||||||||||
Class I: | (17 | ) | (33 | ) | (212 | ) | (152 | ) | (22 | ) | (341 | ) | ||||||||||||
Class Y: | (948 | ) | (2,999 | ) | (21,585 | ) | (15,467 | ) | (8,550 | ) | (11,678 | ) | ||||||||||||
Total Distributions | (5,008 | ) | (11,071 | ) | (198,723 | ) | (139,848 | ) | (70,628 | ) | (98,605 | ) | ||||||||||||
Capital Share Transactions:(1) | ||||||||||||||||||||||||
Class F: | ||||||||||||||||||||||||
Proceeds from shares issued | 4,188 | 16,604 | 664,887 | 769,935 | 131,786 | 358,748 | ||||||||||||||||||
Reinvestment of dividends & distributions | 3,624 | 7,213 | 161,138 | 113,156 | 55,413 | 76,665 | ||||||||||||||||||
Cost of shares redeemed | (9,171 | ) | (32,671 | ) | (453,349 | ) | (935,584 | ) | (172,288 | ) | (538,608 | ) | ||||||||||||
Net increase (decrease) from Class F transactions | (1,359 | ) | (8,854 | ) | 372,676 | (52,493 | ) | 14,911 | (103,195 | ) | ||||||||||||||
Class I: | ||||||||||||||||||||||||
Proceeds from shares issued | 5 | 11 | 916 | 530 | 56 | 90 | ||||||||||||||||||
Reinvestment of dividends & distributions | 17 | 34 | 159 | 108 | 22 | 25 | ||||||||||||||||||
Cost of shares redeemed | (2 | ) | (60 | ) | (288 | ) | (1,212 | ) | (20 | ) | (11,413 | ) | ||||||||||||
Net increase (decrease) from Class I transactions | 20 | (15 | ) | 787 | (574 | ) | 58 | (11,298 | ) | |||||||||||||||
Class Y: | ||||||||||||||||||||||||
Proceeds from shares issued | 795 | 5,967 | 94,725 | 105,560 | 12,491 | 52,287 | ||||||||||||||||||
Reinvestment of dividends & distributions | 893 | 2,883 | 20,637 | 14,711 | 8,331 | 11,206 | ||||||||||||||||||
Cost of shares redeemed | (3,756 | ) | (19,091 | ) | (39,420 | ) | (123,452 | ) | (20,267 | ) | (62,620 | ) | ||||||||||||
Net increase (decrease) from Class Y transactions | (2,068 | ) | (10,241 | ) | 75,942 | (3,181 | ) | 555 | 873 | |||||||||||||||
Increase (Decrease) in Net Assets Derived from Capital Share Transactions | (3,407 | ) | (19,110 | ) | 449,405 | (56,248 | ) | 15,524 | (113,620 | ) | ||||||||||||||
Net Increase (Decrease) in Net Assets | 10,295 | (50,207 | ) | 155,496 | 119,307 | 118,798 | (209,514 | ) | ||||||||||||||||
Net Assets | ||||||||||||||||||||||||
Beginning of period | 91,685 | 141,892 | 4,319,207 | 4,199,900 | 1,432,360 | 1,641,874 | ||||||||||||||||||
End of period | $ | 101,980 | $ | 91,685 | $ | 4,474,703 | $ | 4,319,207 | $ | 1,551,158 | $ | 1,432,360 | ||||||||||||
| (1) | Commenced operations on May 8, 2020. |
| (2) | See Note 6 in Notes to Financial Statements for additional information. |
| (3) | See Note 7 in Notes to Financial Statements for additional information. |
N/A — Not applicable. Shares currently not offered.
Amounts designated as “—” are either $0 or have been rounded to $0.
The accompanying notes are an integral part of the financial statements.
| 296 | SEI Institutional Managed Trust / Semi-Annual Report / March 31, 2021 |
| Conservative Income Fund | Tax-Free Conservative Income Fund | Real Return Fund | Dynamic Asset Allocation Fund | |||||||||||||||||||||||||||
| 10/01/20 to 03/31/21 | 2020 | 10/01/20 to 03/31/21 | 2020 | 10/01/20 to 03/31/21 | 2020 | 10/01/20 to 03/31/21 | 2020 | |||||||||||||||||||||||
| $ 15 | $ | 2,653 | $ | 10 | $ | 1,199 | $ | 1,724 | $ | 1,888 | $ | 2,956 | $ | 7,914 | ||||||||||||||||
| 1 | — | — | 2 | 1,932 | 411 | 50,403 | 50,611 | |||||||||||||||||||||||
| — | — | — | — | — | — | 20 | 101 | |||||||||||||||||||||||
| (30) | 9 | (26 | ) | 30 | 2,490 | 10,202 | 97,891 | 44,779 | ||||||||||||||||||||||
| — | — | — | — | — | — | (1 | ) | — | ||||||||||||||||||||||
| (14) | 2,662 | (16 | ) | 1,231 | 6,146 | 12,501 | 151,269 | 103,405 | ||||||||||||||||||||||
| (15) | (2,402 | ) | (10 | ) | (1,127 | ) | (866 | ) | (1,237 | ) | (53,187 | ) | (12,413 | ) | ||||||||||||||||
| N/A | N/A | N/A | N/A | N/A | N/A | N/A | N/A | |||||||||||||||||||||||
| (1) | (233 | ) | — | (79 | ) | (92 | ) | (142 | ) | (3,265 | ) | (929 | ) | |||||||||||||||||
| (16) | (2,635 | ) | (10 | ) | (1,206 | ) | (958 | ) | (1,379 | ) | (56,452 | ) | (13,342 | ) | ||||||||||||||||
| 98,808 | 285,508 | 45,179 | 130,240 | 29,756 | 70,584 | 56,075 | 103,949 | |||||||||||||||||||||||
| 12 | 1,803 | 8 | 886 | 711 | 1,015 | 49,479 | 11,598 | |||||||||||||||||||||||
| (104,679) | (197,477 | ) | (58,073 | ) | (80,689 | ) | (40,325 | ) | (70,315 | ) | (129,182 | ) | (201,652 | ) | ||||||||||||||||
| (5,859) | 89,834 | (12,886 | ) | 50,437 | (9,858 | ) | 1,284 | (23,628 | ) | (86,105 | ) | |||||||||||||||||||
| N/A | N/A | N/A | N/A | N/A | N/A | N/A | N/A | |||||||||||||||||||||||
| N/A | N/A | N/A | N/A | N/A | N/A | N/A | N/A | |||||||||||||||||||||||
| N/A | N/A | N/A | N/A | N/A | N/A | N/A | N/A | |||||||||||||||||||||||
| N/A | N/A | N/A | N/A | N/A | N/A | N/A | N/A | |||||||||||||||||||||||
| 4,916 | 15,773 | 4,604 | 1,033 | 3,772 | 8,386 | 2,226 | 9,584 | |||||||||||||||||||||||
| 1 | 221 | 1 | 77 | 87 | 134 | 3,205 | 911 | |||||||||||||||||||||||
| (9,248) | (16,860 | ) | (2,953 | ) | (12,069 | ) | (5,274 | ) | (12,417 | ) | (5,429 | ) | (45,256 | ) | ||||||||||||||||
| (4,331) | (866 | ) | 1,652 | (10,959 | ) | (1,415 | ) | (3,897 | ) | 2 | (34,761 | ) | ||||||||||||||||||
| (10,190) | 88,968 | (11,234 | ) | 39,478 | (11,273 | ) | (2,613 | ) | (23,626 | ) | (120,866 | ) | ||||||||||||||||||
| (10,220) | 88,995 | (11,260 | ) | 39,503 | (6,085 | ) | 8,509 | 71,191 | (30,803 | ) | ||||||||||||||||||||
| 341,286 | 252,291 | 218,598 | 179,095 | 260,244 | 251,735 | 765,532 | 796,335 | |||||||||||||||||||||||
| $ 331,066 | $ | 341,286 | $ | 207,338 | $ | 218,598 | $ | 254,159 | $ | 260,244 | $ | 836,723 | $ | 765,532 | ||||||||||||||||
| SEI Institutional Managed Trust / Semi-Annual Report / March 31, 2021 | 297 |
STATEMENTS OF CHANGES IN NET ASSETS/CONSOLIDATED STATEMENTS OF CHANGES IN NET ASSETS
($ Thousands)
For the six month period ended March 31, 2021 (Unaudited) and the year ended September 30,
| Multi-Strategy Alternative Fund | Multi-Asset Accumulation Fund | Multi-Asset Income Fund | ||||||||||||||||||||||
| 10/01/20 to 03/31/21 | 2020 | 10/01/20 to 03/31/21 | 2020 | 10/01/20 to 03/31/21 | 2020 | |||||||||||||||||||
Operations: | ||||||||||||||||||||||||
Net investment income (loss) | $ | 1,425 | $ | 3,976 | $ | (11,868 | ) | $ | (6,348 | ) | $ | 16,857 | $ | 35,324 | ||||||||||
Net realized gain (loss) from investments, securities sold short, futures contracts, forward foreign currency contracts, options, swaptions and swap contracts | 33,708 | 11,248 | 232,059 | 5,433 | 5,220 | (24,946 | ) | |||||||||||||||||
Net realized gain (loss) on foreign currency transactions | (262 | ) | (855 | ) | (8,207 | ) | (11,559 | ) | (343 | ) | (1,592 | ) | ||||||||||||
Capital gain distribution from investment | 1,293 | 600 | — | — | — | — | ||||||||||||||||||
Net change in unrealized appreciation (depreciation) on investments, securities sold short, futures contracts, forward foreign currency contracts, options, swaptions and swap contracts | 2,864 | 6,731 | (50,284 | ) | 49,165 | 27,448 | 3,989 | |||||||||||||||||
Net change in unrealized appreciation (depreciation) on foreign currency transactions | (37 | ) | 163 | (18 | ) | 96 | (127 | ) | 95 | |||||||||||||||
Net Increase (Decrease) in Net Assets Resulting from Operations | 38,991 | 21,863 | 161,682 | 36,787 | 49,055 | 12,870 | ||||||||||||||||||
Distributions: | ||||||||||||||||||||||||
Class F: | (13,167 | ) | (4,719 | ) | (126,250 | ) | (310,159 | ) | (11,878 | ) | (30,727 | ) | ||||||||||||
Class Y: | (263 | ) | (112 | ) | (9,708 | ) | (25,800 | ) | (2,594 | ) | (6,369 | ) | ||||||||||||
Total Distributions | (13,430 | ) | (4,831 | ) | (135,958 | ) | (335,959 | ) | (14,472 | ) | (37,096 | ) | ||||||||||||
Capital Share Transactions:(1) | ||||||||||||||||||||||||
Class F: | ||||||||||||||||||||||||
Proceeds from shares issued | 30,051 | 76,936 | 192,866 | 363,378 | 61,928 | 180,731 | ||||||||||||||||||
Reinvestment of dividends & distributions | 11,882 | 4,272 | 115,417 | 285,126 | 10,357 | 26,371 | ||||||||||||||||||
Cost of shares redeemed | (66,074 | ) | (106,599 | ) | (336,714 | ) | (610,752 | ) | (118,378 | ) | (231,680 | ) | ||||||||||||
Net increase (decrease) from Class F transactions | (24,141 | ) | (25,391 | ) | (28,431 | ) | 37,752 | (46,093 | ) | (24,578 | ) | |||||||||||||
Class Y: | ||||||||||||||||||||||||
Proceeds from shares issued | 400 | 1,101 | 19,044 | 41,566 | 27,233 | 41,023 | ||||||||||||||||||
Reinvestment of dividends & distributions | 247 | 105 | 9,575 | 25,402 | 2,451 | 6,125 | ||||||||||||||||||
Cost of shares redeemed | (907 | ) | (2,865 | ) | (24,756 | ) | (75,457 | ) | (20,133 | ) | (43,905 | ) | ||||||||||||
Net increase (decrease) from Class Y transactions | (260 | ) | (1,659 | ) | 3,863 | (8,489 | ) | 9,551 | 3,243 | |||||||||||||||
Increase (Decrease) in Net Assets Derived from Capital Share Transactions | (24,401 | ) | (27,050 | ) | (24,568 | ) | 29,263 | (36,542 | ) | (21,335 | ) | |||||||||||||
Net Increase (Decrease) in Net Assets | 1,160 | (10,018 | ) | 1,156 | (269,909 | ) | (1,959 | ) | (45,561 | ) | ||||||||||||||
Net Assets | ||||||||||||||||||||||||
Beginning of period | 471,932 | 481,950 | 2,610,529 | 2,880,438 | 932,271 | 977,832 | ||||||||||||||||||
End of period | $ | 473,092 | $ | 471,932 | $ | 2,611,685 | $ | 2,610,529 | $ | 930,312 | $ | 932,271 | ||||||||||||
| (1) | See Note 6 in Notes to Financial Statements for additional information. |
| (2) | See Note 7 in Notes to Financial Statements for additional information. |
Amounts designated as “—” are either $0 or have been rounded to $0.
The accompanying notes are an integral part of the financial statements.
| 298 | SEI Institutional Managed Trust / Semi-Annual Report / March 31, 2021 |
| Multi-Asset Inflation Managed Fund | Multi-Asset Capital Stability Fund | |||||||||||||||||||||
| 10/01/20 to 03/31/21 | 2020 | 10/01/20 to 03/31/21 | 2020 | |||||||||||||||||||
| $ 6,726 | $ | 10,505 | $ | (931 | ) | $ | 2,867 | |||||||||||||||
| 6,836 | (37,228 | ) | 12,802 | 5,506 | ||||||||||||||||||
| 446 | (1,408 | ) | (1,037 | ) | 564 | |||||||||||||||||
| — | — | — | — | |||||||||||||||||||
| 45,019 | (1,777 | ) | 10,744 | 10,762 | ||||||||||||||||||
| (6) | 15 | (3,148 | ) | (20 | ) | |||||||||||||||||
| 59,021 | (29,893 | ) | 18,430 | 19,679 | ||||||||||||||||||
| (10,636) | (12,032 | ) | (7,473 | ) | (24,500 | ) | ||||||||||||||||
| (776) | (920 | ) | (530 | ) | (1,745 | ) | ||||||||||||||||
| (11,412) | (12,952 | ) | (8,003 | ) | (26,245 | ) | ||||||||||||||||
| 74,134 | 140,432 | 95,972 | 244,633 | |||||||||||||||||||
| 9,692 | 11,038 | 6,005 | 19,404 | |||||||||||||||||||
| (98,909) | (173,715 | ) | (136,648 | ) | (210,326 | ) | ||||||||||||||||
| (15,083) | (22,245 | ) | (34,671 | ) | 53,711 | |||||||||||||||||
| 4,120 | 10,235 | 6,557 | 14,849 | |||||||||||||||||||
| 761 | 899 | 519 | 1,706 | |||||||||||||||||||
| (7,667) | (19,217 | ) | (14,638 | ) | (15,678 | ) | ||||||||||||||||
| (2,786) | (8,083 | ) | (7,562 | ) | 877 | |||||||||||||||||
| (17,869) | (30,328 | ) | (42,233 | ) | 54,588 | |||||||||||||||||
| 29,740 | (73,173 | ) | (31,806 | ) | 48,022 | |||||||||||||||||
| 781,135 | 854,308 | 780,732 | 732,710 | |||||||||||||||||||
| $ 810,875 | $ | 781,135 | $ | 748,926 | $ | 780,732 | ||||||||||||||||
| SEI Institutional Managed Trust / Semi-Annual Report / March 31, 2021 | 299 |
CONSOLIDATED STATEMENT OF CASH FLOWS ($ Thousands)
For the period ended March 31, 2021
Multi-Asset Inflation Managed Fund | ||||
Cash Flows from Operating Activities: | ||||
Net Increase in Net Assets from Operations | $ | 59,021 | ||
Adjustments to Reconcile Net Increase in Net Assets Resulting from Operations to Net Cash Provided in Operating Activities: | ||||
Purchase of Investment Securities | (414,429 | ) | ||
Proceeds from Disposition of Investment Securities | 407,675 | |||
Proceeds from Securities Sold Short | 29,972 | |||
Purchases to Cover Securities Sold Short | (27,042 | ) | ||
Purchased Options/Purchases to Cover Written Options | (2,869 | ) | ||
Amortization (Accretion of Market Discount) | (2,827 | ) | ||
Net Realized (Gain) Loss on: | ||||
Investments and Securities Sold Short | 15,037 | |||
Net Change in Unrealized (Appreciation) Depreciation on: | ||||
Investments and Securities Sold Short | (40,333 | ) | ||
Changes in Assets: | ||||
Cash Collateral on Forwards | 687 | |||
Cash Collateral on Swaps | 6,469 | |||
Cash Collateral on Futures | (5,894 | ) | ||
Receivable for Investment Securities Sold | (14,299 | ) | ||
Dividends and Interest Receivable | (103 | ) | ||
OTC Options, at value | 368 | |||
OTC Swaptions, at value | 285 | |||
OTC Swap Contracts, at Value | 1,708 | |||
Foreign Tax Reclaim receivable | (9 | ) | ||
Unrealized Loss on Forward Foreign Currency Contracts | (823 | ) | ||
Prepaid expenses | (6 | ) | ||
Receivable for Variation Margin | (482 | ) | ||
Changes in Liabilities: | ||||
Payable for Investment Securities Purchased | 24,624 | |||
Administration Fees Payable | 25 | |||
Shareholder Servicing Fees Payable | 10 | |||
Payable for securities sold short | 26,782 | |||
OTC Swap Contracts, at Value | (2,904 | ) | ||
OTC Swaptions, at Value | (951 | ) | ||
OTC Options, at value | 189 | |||
Payable for Variation Margin | 643 | |||
Investment Advisory Fees Payable | 14 | |||
Due to Broker | (261 | ) | ||
Unrealized Gain on Forward Foreign Currency Contracts | 713 | |||
Accrued Expenses Payable | 91 | |||
Net Cash Provided by Operating Activities | 34,694 | |||
Cash Flows used from Financing Activities | ||||
Reverse Repurchase Agreements | 28,587 | |||
Dividends and Distributions | (11,412 | ) | ||
Proceeds from Shares Issued | 78,184 | |||
Reinvestment of Dividends and Distributions | 10,453 | |||
Cost of Shares Redeemed | (106,530 | ) | ||
Net Cash Provided by Financing Activities | (718 | ) | ||
Net Change in Cash, Restricted Cash, and Foreign Currency | 33,976 | |||
Cash, Restricted Cash, and Foreign Currency at Beginning of Period | $ | 94,179 | ||
Cash, Restricted Cash, and Foreign Currency at End of Period | $ | 128,155 | ||
Supplemental Disclosure of Cash Flow Information | ||||
Interest paid | $ | 3,135 | ||
The accompanying notes are an integral part of the financial statements.
| 300 | SEI Institutional Managed Trust / Semi-Annual Report / March 31, 2021 |
For the period ended March 31, 2021 (Unaudited) and the years or periods ended September 30, (unless otherwise For a share outstanding throughout each period
| Net Asset Value, Beginning of Period | Net Investment Income (Loss)(1) | Net Realized and Unrealized Gains (Losses) on Investments(1) | Total from | Dividends from Net Investment Income | Distributions from Net Realized Capital Gains | Total Dividends and Distributions | Net Asset Value, End of Period | Total Return† | Net Assets End of Period ($ Thousands) | Ratio of Net Expenses to Average Net Assets | Ratio of Expenses to Average Net Assets (Excluding Fees Paid Indirectly and Including Waivers) | Ratio of Expenses Net Assets | Ratio of Net Investment Income (Loss) to Average Net Assets | Portfolio Turnover Rate† | ||||||||||||||||||||||||||||||||||||||||||||||
Large Cap Fund |
| |||||||||||||||||||||||||||||||||||||||||||||||||||||||||||
Class F | ||||||||||||||||||||||||||||||||||||||||||||||||||||||||||||
2021@ | $ | 13.95 | $ | 0.06 | $ | 3.06 | $ | 3.12 | $ | (0.06) | $ | (0.42 | ) | $ | (0.48 | ) | $ | 16.59 | 22.72 | % | $ | 2,073,951 | 0.89% | 0.89% | 0.95% | 0.81% | 16% | |||||||||||||||||||||||||||||||||
2020 | 13.94 | 0.16 | 0.89 | 1.05 | (0.18) | (0.86 | ) | (1.04 | ) | 13.95 | 7.67 | 1,944,209 | 0.89 | 0.89 | 0.96 | 1.16 | 63 | |||||||||||||||||||||||||||||||||||||||||||
2019 | 15.92 | 0.19 | (0.22) | (0.03) | (0.18) | (1.77 | ) | (1.95 | ) | 13.94 | 1.17 | 2,158,883 | 0.89 | 0.89 | 0.95 | 1.37 | 72 | |||||||||||||||||||||||||||||||||||||||||||
2018 | 14.65 | 0.13 | 2.22 | 2.35 | (0.12) | (0.96 | ) | (1.08 | ) | 15.92 | 16.80 | 2,439,320 | 0.89 | 0.89 | 0.94 | 0.87 | 80 | |||||||||||||||||||||||||||||||||||||||||||
2017 | 12.54 | 0.12 | 2.11 | 2.23 | (0.12) | — | (0.12 | ) | 14.65 | 17.88 | 2,362,180 | 0.89 | 0.89 | 0.95 | 0.91 | 100 | ||||||||||||||||||||||||||||||||||||||||||||
2016 | 13.71 | 0.12 | 1.16 | 1.28 | (0.12) | (2.33 | ) | (2.45 | ) | 12.54 | 10.15 | 2,237,663 | �� | 0.91(2) | 0.91(2) | 0.99(2) | 1.01 | 68 | ||||||||||||||||||||||||||||||||||||||||||
Class Y | ||||||||||||||||||||||||||||||||||||||||||||||||||||||||||||
2021@ | $ | 13.95 | $ | 0.08 | $ | 3.06 | $ | 3.14 | $ | (0.08) | $ | (0.42 | ) | $ | (0.50 | ) | $ | 16.59 | 22.86 | % | $ | 114,978 | 0.64% | 0.64% | 0.70% | 1.06% | 16% | |||||||||||||||||||||||||||||||||
2020 | 13.95 | 0.19 | 0.89 | 1.08 | (0.22) | (0.86 | ) | (1.08 | ) | 13.95 | 7.86 | 103,168 | 0.64 | 0.64 | 0.71 | 1.41 | 63 | |||||||||||||||||||||||||||||||||||||||||||
2019 | 15.93 | 0.22 | (0.22) | — | (0.21) | (1.77 | ) | (1.98 | ) | 13.95 | 1.44 | 131,736 | 0.64 | 0.64 | 0.70 | 1.62 | 72 | |||||||||||||||||||||||||||||||||||||||||||
2018 | 14.66 | 0.17 | 2.22 | 2.39 | (0.16) | (0.96 | ) | (1.12 | ) | 15.93 | 17.08 | 137,136 | 0.64 | 0.64 | 0.69 | 1.11 | 80 | |||||||||||||||||||||||||||||||||||||||||||
2017 | 12.55 | 0.16 | 2.10 | 2.26 | (0.15) | — | (0.15 | ) | 14.66 | 18.16 | 156,329 | 0.64 | 0.64 | 0.70 | 1.16 | 100 | ||||||||||||||||||||||||||||||||||||||||||||
2016 | 13.71 | 0.16 | 1.16 | 1.32 | (0.15) | (2.33 | ) | (2.48 | ) | 12.55 | 10.50 | 164,611 | 0.66(2) | 0.66(2) | 0.74(2) | 1.26 | 68 | |||||||||||||||||||||||||||||||||||||||||||
Large Cap Value Fund |
| |||||||||||||||||||||||||||||||||||||||||||||||||||||||||||
Class F |
| |||||||||||||||||||||||||||||||||||||||||||||||||||||||||||
2021@ | $ | 20.11 | $ | 0.25 | $ | 6.33 | $ | 6.58 | $ | (0.23) | $ | — | $ | (0.23 | ) | $ | 26.46 | 32.95 | % | $ | 1,296,238 | 0.89% | 0.89% | 0.93% | 2.15% | 14% | ||||||||||||||||||||||||||||||||||
2020 | 23.25 | 0.45 | (2.70) | (2.25) | (0.46) | (0.43 | ) | (0.89 | ) | 20.11 | (9.96 | ) | 1,097,338 | 0.89 | 0.89 | 0.93 | 2.15 | 65 | ||||||||||||||||||||||||||||||||||||||||||
2019 | 26.21 | 0.50 | (0.92) | (0.42) | (0.48) | (2.06 | ) | (2.54 | ) | 23.25 | (0.91 | ) | 1,190,700 | 0.89 | 0.89 | 0.93 | 2.17 | 52 | ||||||||||||||||||||||||||||||||||||||||||
2018 | 24.70 | 0.39 | 2.39 | 2.78 | (0.37) | (0.90 | ) | (1.27 | ) | 26.21 | 11.54 | 1,285,571 | 0.89 | 0.89 | 0.93 | 1.51 | 83 | |||||||||||||||||||||||||||||||||||||||||||
2017 | 21.20 | 0.32 | 3.49 | 3.81 | (0.31) | — | (0.31 | ) | 24.70 | 18.13 | 1,261,075 | 0.89 | 0.89 | 0.93 | 1.38 | 76 | ||||||||||||||||||||||||||||||||||||||||||||
2016 | 22.35 | 0.32 | 1.78 | 2.10 | (0.30) | (2.95 | ) | (3.25 | ) | 21.20 | 10.16 | 1,300,029 | 0.91(2) | 0.91(2) | 0.95(2) | 1.56 | 70 | |||||||||||||||||||||||||||||||||||||||||||
Class I | ||||||||||||||||||||||||||||||||||||||||||||||||||||||||||||
2021@ | $ | 20.13 | $ | 0.22 | $ | 6.34 | $ | 6.56 | $ | (0.20) | $ | — | $ | (0.20 | ) | $ | 26.49 | 32.82 | % | $ | 2,948 | 1.11% | 1.11% | 1.18% | 1.93% | 14% | ||||||||||||||||||||||||||||||||||
2020 | 23.27 | 0.41 | (2.71) | (2.30) | (0.41) | (0.43 | ) | (0.84 | ) | 20.13 | (10.17 | ) | 2,454 | 1.11 | 1.11 | 1.18 | 1.93 | 65 | ||||||||||||||||||||||||||||||||||||||||||
2019 | 26.23 | 0.45 | (0.93) | (0.48) | (0.42) | (2.06 | ) | (2.48 | ) | 23.27 | (1.14 | ) | 3,042 | 1.11 | 1.11 | 1.18 | 1.95 | 52 | ||||||||||||||||||||||||||||||||||||||||||
2018 | 24.71 | 0.33 | 2.40 | 2.73 | (0.31) | (0.90 | ) | (1.21 | ) | 26.23 | 11.30 | 4,427 | 1.11 | 1.11 | 1.18 | 1.29 | 83 | |||||||||||||||||||||||||||||||||||||||||||
2017 | 21.21 | 0.27 | 3.49 | 3.76 | (0.26) | — | (0.26 | ) | 24.71 | 17.84 | 4,666 | 1.11 | 1.11 | 1.18 | 1.16 | 76 | ||||||||||||||||||||||||||||||||||||||||||||
2016 | 22.35 | 0.28 | 1.78 | 2.06 | (0.25) | (2.95 | ) | (3.20 | ) | 21.21 | 9.93 | 6,165 | 1.13(2) | 1.13(2) | 1.20(2) | 1.33 | 70 | |||||||||||||||||||||||||||||||||||||||||||
Class Y | ||||||||||||||||||||||||||||||||||||||||||||||||||||||||||||
2021@ | $ | 20.11 | $ | 0.28 | $ | 6.32 | $ | 6.60 | $ | (0.25) | $ | — | $ | (0.25 | ) | $ | 26.46 | 33.11 | % | $ | 185,661 | 0.64% | 0.64% | 0.68% | 2.39% | 14% | ||||||||||||||||||||||||||||||||||
2020 | 23.26 | 0.51 | (2.71) | (2.20) | (0.52) | (0.43 | ) | (0.95 | ) | 20.11 | (9.76 | ) | 148,423 | 0.64 | 0.64 | 0.68 | 2.40 | 65 | ||||||||||||||||||||||||||||||||||||||||||
2019 | 26.21 | 0.55 | (0.91) �� | (0.36) | (0.53) | (2.06 | ) | (2.59 | ) | 23.26 | (0.62 | ) | 150,772 | 0.64 | 0.64 | 0.69 | 2.41 | 52 | ||||||||||||||||||||||||||||||||||||||||||
2018 | 24.70 | 0.45 | 2.40 | 2.85 | (0.44) | (0.90 | ) | (1.34 | ) | 26.21 | 11.82 | 141,700 | 0.64 | 0.64 | 0.68 | 1.77 | 83 | |||||||||||||||||||||||||||||||||||||||||||
2017 | 21.21 | 0.38 | 3.48 | 3.86 | (0.37) | — | (0.37 | ) | 24.70 | 18.37 | 120,357 | 0.64 | 0.64 | 0.69 | 1.63 | 76 | ||||||||||||||||||||||||||||||||||||||||||||
2016(3) | 23.90 | 0.35 | 0.16 | 0.51 | (0.25) | (2.95 | ) | (3.20 | ) | 21.21 | 2.88 | 22,004 | 0.66(2) | 0.66(2) | 0.70(2) | 1.89 | 70 | |||||||||||||||||||||||||||||||||||||||||||
| † | Returns and portfolio turnover rates are for the period indicated and have not been annualized. Returns do not reflect the deduction of taxes the shareholder would pay on fund distributions or redemption of fund shares. |
| @ | For the six-month period ended March 31, 2021. All ratios for the period have been annualized. |
| (1) | Per share net investment income and net realized and unrealized gains (losses) calculated using average shares. |
| (2) | The expense ratio includes proxy expenses outside of the cap. |
| (3) | Commenced operations on October 30, 2015. All ratios for the period have been annualized. |
Amounts designated as “—“ are either $0 or have been rounded to $0.
The accompanying notes are an integral part of the financial statements.
| SEI Institutional Managed Trust / Semi-Annual Report / March 31, 2021 | 301 |
FINANCIAL HIGHLIGHTS
For the period ended March 31, 2021 (Unaudited) and the years or periods ended September 30, (unless otherwise For a share outstanding throughout each period
| Net Asset Value, Beginning of Period | Net Investment Income (Loss)(1) | Net Realized and Unrealized Gains (Losses) on Investments(1) | Total from | Dividends from Net Investment Income | Distributions from Net Realized Capital Gains | Total Dividends and Distributions | Net Asset Value, End of Period | Total Return† | Net Assets End of Period ($ Thousands) | Ratio of Net Expenses to Average Net Assets | Ratio of Expenses to Average Net Assets (Excluding Fees Paid Indirectly and Including Waivers) | Ratio of Expenses to Average Net Assets (Excluding Fees Paid Indirectly and Waivers) | Ratio of Net Investment Income (Loss) to Average Net Assets | Portfolio Turnover Rate† | ||||||||||||||||||||||||||||||||||||||||||||||
Large Cap Growth Fund |
| |||||||||||||||||||||||||||||||||||||||||||||||||||||||||||
Class F | ||||||||||||||||||||||||||||||||||||||||||||||||||||||||||||
2021@ | $ | 45.29 | $ | (0.05 | ) | $ | 5.93 | $ | 5.88 | $ | (0.03) | $ | (4.23 | ) | $ | (4.26 | ) | $ | 46.91 | 13.55 | % | $ | 1,470,631 | 0.89% | 0.89% | 0.98% | (0.20)% | 21% | ||||||||||||||||||||||||||||||||
2020 | 35.79 | 0.04 | 11.63 | 11.67 | (0.08) | (2.09 | ) | (2.17 | ) | 45.29 | 34.07 | 1,395,858 | 0.89 | 0.89 | 0.98 | 0.11 | 58 | |||||||||||||||||||||||||||||||||||||||||||
2019 | 39.89 | 0.13 | 0.22 | 0.35 | (0.12) | (4.33 | ) | (4.45 | ) | 35.79 | 2.43 | 1,314,152 | 0.89 | 0.89 | 0.98 | 0.36 | 88 | |||||||||||||||||||||||||||||||||||||||||||
2018 | 34.72 | 0.06 | 8.03 | 8.09 | (0.05) | (2.87 | ) | (2.92 | ) | 39.89 | 24.74 | 1,416,472 | 0.89 | 0.89 | 0.98 | 0.16 | 75 | |||||||||||||||||||||||||||||||||||||||||||
2017 | 29.74 | 0.06 | 4.96 | 5.02 | (0.04) | — | (0.04 | ) | 34.72 | 16.89 | 1,364,210 | 0.89 | 0.89 | 0.98 | 0.20 | 95 | ||||||||||||||||||||||||||||||||||||||||||||
2016 | 32.22 | 0.02 | 3.02 | 3.04 | (0.01) | (5.51 | ) | (5.52 | ) | 29.74 | 9.77 | 1,421,656 | 0.91(2) | 0.91(2) | 1.00(2) | 0.06 | 93 | |||||||||||||||||||||||||||||||||||||||||||
Class I | ||||||||||||||||||||||||||||||||||||||||||||||||||||||||||||
2021@ | $ | 43.99 | $ | (0.09 | ) | $ | 5.74 | $ | 5.65 | $ | — | $ | (4.23 | ) | $ | (4.23 | ) | $ | 45.41 | 13.42 | % | $ | 3,438 | 1.11% | 1.11% | 1.23% | (0.42)% | 21% | ||||||||||||||||||||||||||||||||
2020 | 34.86 | (0.04 | ) | 11.30 | 11.26 | (0.04) | (2.09 | ) | (2.13 | ) | 43.99 | 33.75 | 3,239 | 1.11 | 1.11 | 1.23 | (0.12) | 58 | ||||||||||||||||||||||||||||||||||||||||||
2019 | 38.96 | 0.05 | 0.21 | 0.26 | (0.03) | (4.33 | ) | (4.36 | ) | 34.86 | 2.22 | 2,643 | 1.11 | 1.11 | 1.16 | 0.14 | 88 | |||||||||||||||||||||||||||||||||||||||||||
2018 | 34.02 | (0.02 | ) | 7.84 | 7.82 | (0.01) | (2.87 | ) | (2.88 | ) | 38.96 | 24.42 | 3,863 | 1.11 | 1.11 | 1.23 | (0.06) | 75 | ||||||||||||||||||||||||||||||||||||||||||
2017 | 29.17 | (0.01 | ) | 4.86 | 4.85 | — | — | — | 34.02 | 16.63 | 3,607 | 1.11 | 1.11 | 1.23 | (0.03) | 95 | ||||||||||||||||||||||||||||||||||||||||||||
2016 | 31.75 | (0.04 | ) | 2.97 | 2.93 | — | (5.51 | ) | (5.51 | ) | 29.17 | 9.54 | 4,783 | 1.13(2) | 1.13(2) | 1.25(2) | (0.15) | 93 | ||||||||||||||||||||||||||||||||||||||||||
Class Y | ||||||||||||||||||||||||||||||||||||||||||||||||||||||||||||
2021@ | $ | 45.35 | $ | 0.01 | $ | 5.92 | $ | 5.93 | $ | (0.08) | $ | (4.23 | ) | $ | (4.31 | ) | $ | 46.97 | 13.66 | % | $ | 198,947 | 0.64% | 0.64% | 0.73% | 0.05% | 21% | |||||||||||||||||||||||||||||||||
2020 | 35.84 | 0.14 | 11.63 | 11.77 | (0.17) | (2.09 | ) | (2.26 | ) | 45.35 | 34.39 | 170,883 | 0.64 | 0.64 | 0.73 | 0.36 | 58 | |||||||||||||||||||||||||||||||||||||||||||
2019 | 39.96 | 0.21 | 0.24 | 0.45 | (0.24) | (4.33 | ) | (4.57 | ) | 35.84 | 2.70 | 157,270 | 0.64 | 0.64 | 0.73 | 0.60 | 88 | |||||||||||||||||||||||||||||||||||||||||||
2018 | 34.76 | 0.15 | 8.04 | 8.19 | (0.12) | (2.87 | ) | (2.99 | ) | 39.96 | 25.04 | 139,001 | 0.64 | 0.64 | 0.73 | 0.41 | 75 | |||||||||||||||||||||||||||||||||||||||||||
2017 | 29.80 | 0.14 | 4.96 | 5.10 | (0.14) | — | (0.14 | ) | 34.76 | 17.17 | 123,109 | 0.64 | 0.64 | 0.74 | 0.45 | 95 | ||||||||||||||||||||||||||||||||||||||||||||
2016(3) | 34.91 | 0.07 | 0.36 | 0.43 | (0.03) | (5.51 | ) | (5.54 | ) | 29.80 | 1.58 | 20,481 | 0.66(2) | 0.66(2) | 0.75(2) | 0.25 | 93 | |||||||||||||||||||||||||||||||||||||||||||
Large Cap Index Fund |
| |||||||||||||||||||||||||||||||||||||||||||||||||||||||||||
Class F | ||||||||||||||||||||||||||||||||||||||||||||||||||||||||||||
2021@ | $ | 11.98 | $ | 0.09 | $ | 2.33 | $ | 2.42 | $ | (0.08) | $ | — | $ | (0.08 | ) | $ | 14.32 | 20.27 | % | $ | 914,257 | 0.25% | 0.25% | 0.64% | 1.30% | 5% | ||||||||||||||||||||||||||||||||||
2020 | 10.54 | 0.17 | 1.46 | 1.63 | (0.17) | (0.02 | ) | (0.19 | ) | 11.98 | 15.67 | 706,457 | 0.25 | 0.25 | 0.64 | 1.52 | 8 | |||||||||||||||||||||||||||||||||||||||||||
2019 | 10.37 | 0.18 | 0.18 | 0.36 | (0.17) | (0.02 | ) | (0.19 | ) | 10.54 | 3.61 | 455,657 | 0.25 | 0.25 | 0.65 | 1.81 | 6 | |||||||||||||||||||||||||||||||||||||||||||
2018(4) | 10.00 | 0.13 | 0.31 | 0.44 | (0.07) | — | (0.07 | ) | 10.37 | 4.47 | ‡ | 233,871 | 0.25 | 0.25 | 0.64 | 1.93 | 6 | |||||||||||||||||||||||||||||||||||||||||||
Tax-Managed Large Cap Fund |
| |||||||||||||||||||||||||||||||||||||||||||||||||||||||||||
Class F | ||||||||||||||||||||||||||||||||||||||||||||||||||||||||||||
2021@ | $ | 27.26 | $ | 0.17 | $ | 5.95 | $ | 6.12 | $ | (0.15) | $ | (0.41 | ) | $ | (0.56 | ) | $ | 32.82 | 22.69 | % | $ | 3,871,553 | 0.89% | 0.89% | 0.90% | 1.12% | 9% | |||||||||||||||||||||||||||||||||
2020 | 27.53 | 0.31 | 1.80 | 2.11 | (0.34) | (2.04 | ) | (2.38 | ) | 27.26 | 7.84 | 3,368,577 | 0.89 | 0.89 | 0.91 | 1.19 | 40 | |||||||||||||||||||||||||||||||||||||||||||
2019 | 27.66 | 0.31 | 0.04 | 0.35 | (0.30) | �� | (0.18 | ) | (0.48 | ) | 27.53 | 1.42 | 3,543,245 | 0.89 | 0.89 | 0.91 | 1.20 | 54 | ||||||||||||||||||||||||||||||||||||||||||
2018 | 24.11 | 0.22 | 3.83 | 4.05 | (0.20) | (0.30 | ) | (0.50 | ) | 27.66 | 16.99 | 3,773,973 | 0.89 | 0.89 | 0.90 | 0.84 | 44 | |||||||||||||||||||||||||||||||||||||||||||
2017 | 20.74 | 0.18 | 3.37 | 3.55 | (0.18) | — | (0.18 | ) | 24.11 | 17.19 | 3,385,550 | 0.90(5) | 0.90(5) | 0.94(5) | 0.82 | 88 | ||||||||||||||||||||||||||||||||||||||||||||
2016 | 19.13 | 0.19 | 1.60 | 1.79 | (0.18) | — | (0.18 | ) | 20.74 | 9.42 | 3,427,251 | 0.91(2) | 0.91(2) | 1.00(2) | 0.95 | 89 | ||||||||||||||||||||||||||||||||||||||||||||
Class Y | ||||||||||||||||||||||||||||||||||||||||||||||||||||||||||||
2021@ | $ | 27.27 | $ | 0.21 | $ | 5.96 | $ | 6.17 | $ | (0.19) | $ | (0.41 | ) | $ | (0.60 | ) | $ | 32.84 | 22.86 | % | $ | 476,601 | 0.64% | 0.64% | 0.65% | 1.37% | 9% | |||||||||||||||||||||||||||||||||
2020 | 27.54 | 0.38 | 1.80 | 2.18 | (0.41) | (2.04 | ) | (2.45 | ) | 27.27 | 8.11 | 408,792 | 0.64 | 0.64 | 0.66 | 1.44 | 40 | |||||||||||||||||||||||||||||||||||||||||||
2019 | 27.67 | 0.38 | 0.04 | 0.42 | (0.37) | (0.18 | ) | (0.55 | ) | 27.54 | 1.67 | 447,895 | 0.64 | 0.64 | 0.66 | 1.46 | 54 | |||||||||||||||||||||||||||||||||||||||||||
2018 | 24.13 | 0.28 | 3.82 | 4.10 | (0.26) | (0.30 | ) | (0.56 | ) | 27.67 | 17.22 | 371,706 | 0.64 | 0.64 | 0.65 | 1.08 | 44 | |||||||||||||||||||||||||||||||||||||||||||
2017 | 20.75 | 0.24 | 3.37 | 3.61 | (0.23) | — | (0.23 | ) | 24.13 | 17.52 | 317,822 | 0.65(5) | 0.65(5) | 0.69(5) | 1.07 | 88 | ||||||||||||||||||||||||||||||||||||||||||||
2016 | 19.13 | 0.24 | 1.61 | 1.85 | (0.23) | — | (0.23 | ) | 20.75 | 9.75 | 198,095 | 0.66(2) | 0.66(2) | 0.75(2) | 1.20 | 89 | ||||||||||||||||||||||||||||||||||||||||||||
| † | Returns and portfolio turnover rates are for the period indicated and have not been annualized. Returns do not reflect the deduction of taxes the shareholder would pay on fund distributions or redemption of fund shares. |
| @ | For the six-month period ended March 31, 2021. All ratios for the period have been annualized. |
| (1) | Per share net investment income and net realized and unrealized gains (losses) calculated using average shares. |
| (2) | The expense ratio includes proxy expenses outside of the cap. |
| (3) | Commenced operations on October 30, 2015. All ratios for the period have been annualized. |
| (4) | Commenced operations on January 31, 2018. All ratios for the period have been annualized. |
| (5) | The expense ratio includes litigation expenses outside the cap. |
| ‡ | Includes contribution from SIMC. Without the cash contribution, the Fund’s return would have been 4.26% (See Note 6 in the Notes to Financial Statements). |
Amounts designated as “—“are either $0 or have been rounded to $0.
The accompanying notes are an integral part of the financial statements.
| 302 | SEI Institutional Managed Trust / Semi-Annual Report / March 31, 2021 |
FINANCIAL HIGHLIGHTS
For the period ended March 31, 2021 (Unaudited) and the years or periods ended September 30, (unless otherwise For a share outstanding throughout each period
| Net Asset Value, Beginning of Period | Net Investment Income (Loss)(1) | Net Realized and Unrealized Gains (Losses) on Investments(1) | Total from | Dividends from Net Investment Income | Distributions from Net Realized Capital Gains | Total Dividends and Distributions | Net Asset Value, End of Period | Total Return† | Net Assets End of Period ($ Thousands) | Ratio of Net Expenses to Average Net Assets | Ratio of Expenses to Average Net Assets (Excluding Fees Paid Indirectly and Including Waivers) | Ratio of Expenses to Average Net Assets (Excluding Fees Paid Indirectly and Waivers) | Ratio of Net Investment Income (Loss) to Average Net Assets | Portfolio Turnover Rate† | ||||||||||||||||||||||||||||||||||||||||||||||
S&P 500 Index Fund |
| |||||||||||||||||||||||||||||||||||||||||||||||||||||||||||
Class F | ||||||||||||||||||||||||||||||||||||||||||||||||||||||||||||
2021@ | $ | 75.64 | $ | 0.56 | $ | 13.39 | $ | 13.95 | $ | (0.51 | ) | $ | (3.83 | ) | $ | (4.34 | ) | $ | 85.25 | 18.97 | % | $ | 936,591 | 0.25% | 0.25% | 0.54% | 1.38% | 4% | ||||||||||||||||||||||||||||||||
2020 | 69.00 | 1.15 | 8.74 | 9.89 | (1.20 | ) | (2.05 | ) | (3.25 | ) | 75.64 | 14.82 | (2) | 844,753 | 0.25 | 0.25 | 0.54 | 1.64 | 19 | |||||||||||||||||||||||||||||||||||||||||
2019 | 68.94 | 1.24 | 1.29 | 2.53 | (1.23 | ) | (1.24 | ) | (2.47 | ) | 69.00 | 4.07 | 826,946 | 0.25 | 0.25 | 0.54 | 1.90 | 11 | ||||||||||||||||||||||||||||||||||||||||||
2018(3) | 60.22 | 1.20 | 9.19 | 10.39 | (1.13 | ) | (0.54 | ) | (1.67 | ) | 68.94 | 17.53 | 904,819 | 0.29 | 0.29 | 0.55 | 1.85 | 17 | ||||||||||||||||||||||||||||||||||||||||||
2017 | 53.32 | 0.89 | 8.47 | 9.36 | (0.87 | ) | (1.59 | ) | (2.46 | ) | 60.22 | 18.12 | 417,308 | 0.43 | 0.43 | 0.54 | 1.58 | 21 | ||||||||||||||||||||||||||||||||||||||||||
2016 | 47.23 | 0.86 | 6.13 | 6.99 | (0.83 | ) | (0.07 | ) | (0.90 | ) | 53.32 | 14.93 | 386,477 | 0.45(4) | 0.45(4) | 0.57(4) | 1.69 | 10 | ||||||||||||||||||||||||||||||||||||||||||
Class I | ||||||||||||||||||||||||||||||||||||||||||||||||||||||||||||
2021@ | $ | 76.11 | $ | 0.40 | $ | 13.48 | $ | 13.88 | $ | (0.36 | ) | $ | (3.83 | ) | $ | (4.19 | ) | $ | 85.80 | 18.73 | % | $ | 5,728 | 0.65% | 0.65% | 0.79% | 0.98% | 4% | ||||||||||||||||||||||||||||||||
2020 | 69.39 | 0.87 | 8.82 | 9.69 | (0.92 | ) | (2.05 | ) | (2.97 | ) | 76.11 | 14.37 | (2) | 5,331 | 0.65 | 0.65 | 0.79 | 1.23 | 19 | |||||||||||||||||||||||||||||||||||||||||
2019 | 69.31 | 0.98 | 1.30 | 2.28 | (0.96 | ) | (1.24 | ) | (2.20 | ) | 69.39 | 3.66 | 5,322 | 0.65 | 0.65 | 0.79 | 1.49 | 11 | ||||||||||||||||||||||||||||||||||||||||||
2018(3) | 60.56 | 0.92 | 9.30 | 10.22 | (0.93 | ) | (0.54 | ) | (1.47 | ) | 69.31 | 17.13 | 6,372 | 0.65 | 0.65 | 0.80 | 1.43 | 17 | ||||||||||||||||||||||||||||||||||||||||||
2017 | 53.58 | 0.77 | 8.52 | 9.29 | (0.72 | ) | (1.59 | ) | (2.31 | ) | 60.56 | 17.87 | 6,328 | 0.65 | 0.65 | 0.79 | 1.36 | 21 | ||||||||||||||||||||||||||||||||||||||||||
2016 | 47.46 | 0.76 | 6.15 | 6.91 | (0.72 | ) | (0.07 | ) | (0.79 | ) | 53.58 | 14.67 | 6,473 | 0.67(4) | 0.67(4) | 0.82(4) | 1.49 | 10 | ||||||||||||||||||||||||||||||||||||||||||
Small Cap Fund |
| |||||||||||||||||||||||||||||||||||||||||||||||||||||||||||
Class F | ||||||||||||||||||||||||||||||||||||||||||||||||||||||||||||
2021@ | $ | 10.74 | $ | 0.02 | $ | 5.16 | $ | 5.18 | $ | (0.01 | ) | $ | — | $ | (0.01 | ) | $ | 15.91 | 48.30 | % | $ | 655,212 | 1.14% | 1.14% | 1.22% | 0.32% | 70% | |||||||||||||||||||||||||||||||||
2020 | 11.05 | 0.02 | (0.31) | (0.29) | (0.02 | )(5) | — | (0.02 | ) | 10.74 | (2.60 | ) | 503,795 | 1.14 | 1.14 | 1.23 | 0.16 | 149 | ||||||||||||||||||||||||||||||||||||||||||
2019 | 14.28 | 0.01 | (1.67) | (1.66) | (0.01 | ) | (1.56 | ) | (1.57 | ) | 11.05 | (10.85 | ) | 554,260 | 1.14 | 1.14 | 1.24 | 0.11 | 116 | |||||||||||||||||||||||||||||||||||||||||
2018 | 13.25 | (0.02 | ) | 1.97 | 1.95 | — | (0.92 | ) | (0.92 | ) | 14.28 | 15.56 | 690,400 | 1.14 | 1.14 | 1.24 | (0.17) | 162 | ||||||||||||||||||||||||||||||||||||||||||
2017 | 11.61 | (0.02 | ) | 1.68 | 1.66 | (0.02 | ) | — | (0.02 | ) | 13.25 | 14.29 | 588,341 | 1.14 | 1.14 | 1.24 | (0.12) | 135 | ||||||||||||||||||||||||||||||||||||||||||
2016 | 11.99 | — | 0.88 | 0.88 | — | (1.26 | ) | (1.26 | ) | 11.61 | 7.76 | 550,556 | 1.16(4) | 1.16(4) | 1.26(4) | 0.03 | 104 | |||||||||||||||||||||||||||||||||||||||||||
Class Y | ||||||||||||||||||||||||||||||||||||||||||||||||||||||||||||
2021@ | $ | 10.85 | $ | 0.04 | $ | 5.21 | $ | 5.25 | $ | (0.03 | ) | $ | — | $ | (0.03 | ) | $ | 16.07 | 48.43 | % | $ | 30,683 | 0.89% | 0.89% | 0.97% | 0.57% | 70% | |||||||||||||||||||||||||||||||||
2020 | 11.15 | 0.04 | (0.29) | (0.25) | (0.05 | )(5) | — | (0.05 | ) | 10.85 | (2.23 | ) | 25,727 | 0.89 | 0.89 | 0.98 | 0.41 | 149 | ||||||||||||||||||||||||||||||||||||||||||
2019 | 14.38 | 0.04 | (1.69) | (1.65) | (0.02 | ) | (1.56 | ) | (1.58 | ) | 11.15 | (10.66 | ) | 33,128 | 0.89 | 0.89 | 0.99 | 0.36 | 116 | |||||||||||||||||||||||||||||||||||||||||
2018 | 13.31 | 0.01 | 1.98 | 1.99 | —* | (0.92 | ) | (0.92 | ) | 14.38 | 15.83 | 36,423 | 0.89 | 0.89 | 0.99 | 0.07 | 162 | |||||||||||||||||||||||||||||||||||||||||||
2017 | 11.66 | 0.02 | 1.67 | 1.69 | (0.04 | ) | — | (0.04 | ) | 13.31 | 14.51 | 39,149 | 0.89 | 0.89 | 0.99 | 0.13 | 135 | |||||||||||||||||||||||||||||||||||||||||||
2016 | 12.01 | 0.03 | 0.89 | 0.92 | (0.01 | ) | (1.26 | ) | (1.27 | ) | 11.66 | 8.08 | 37,859 | 0.91(4) | 0.91(4) | 1.01(4) | 0.28 | 104 | ||||||||||||||||||||||||||||||||||||||||||
| † | Returns and portfolio turnover rates are for the period indicated and have not been annualized. Returns do not reflect the deduction of taxes the shareholder would pay on fund distributions or redemption of fund shares. |
| @ | For the six-month period ended March 31, 2021. All ratios for the period have been annualized. |
| * | Amount represents less than $0.01 per share. |
| (1) | Per share net investment income and net realized and unrealized gains (losses) calculated using average shares. |
| (2) | Includes contribution from SIMC. Without the cash contribution, the Fund’s return for Class F and Class I would have been 14.78% and 14.33%, respectively (See Note 6 in the Notes to Financial Statements). |
| (3) | On April 20, 2018, the Class Y shares and Class E shares were converted to Class F shares. The performance and financial history shown of the class is solely that of the fund’s Class F shares. |
| (4) | The expense ratio includes proxy expenses outside of the cap. |
| (5) | Includes return of capital less than $0.005. |
Amounts designated as “—” are either $0 or have been rounded to $0.
The accompanying notes are an integral part of the financial statements.
| SEI Institutional Managed Trust / Semi-Annual Report / March 31, 2021 | 303 |
FINANCIAL HIGHLIGHTS
For the period ended March 31, 2021 (Unaudited) and the years or periods ended September 30, (unless otherwise For a share outstanding throughout each period
| Net Asset Value, Beginning of Period | Net Investment Income (Loss)(1) | Net Realized and Unrealized Gains (Losses) on Investments(1) | Total from | Dividends from Net Investment Income | Distributions from Net Realized Capital Gains | Total Dividends and Distributions | Net Asset of Period | Total Return† | Net Assets End of Period ($ Thousands) | Ratio of Net Expenses to Average Net Assets | Ratio of Expenses to Average Net Assets (Excluding Fees Paid Indirectly and Including Waivers) | Ratio of Expenses Net Assets | Ratio of Net Investment Income (Loss) to Average Net Assets | Portfolio Turnover Rate† | ||||||||||||||||||||||||||||||||||||||||||||||
Small Cap Value Fund |
| |||||||||||||||||||||||||||||||||||||||||||||||||||||||||||
Class F |
| |||||||||||||||||||||||||||||||||||||||||||||||||||||||||||
2021@ | $ | 17.07 | $ | 0.09 | $ | 9.57 | $ | 9.66 | $ | (0.09) | $ | — | $ | (0.09 | ) | $ | 26.64 | 56.71 | % | $ | 362,613 | 1.14% | 1.14% | 1.23% | 0.79% | 47% | ||||||||||||||||||||||||||||||||||
2020 | 20.60 | 0.17 | (3.46) | (3.29) | (0.24) | — | (0.24 | ) | 17.07 | (16.03 | ) | 250,718 | 1.14 | 1.14 | 1.24 | 0.91 | 65 | |||||||||||||||||||||||||||||||||||||||||||
2019 | 25.54 | 0.27 | (2.86) | (2.59) | (0.25) | (2.10 | ) | (2.35 | ) | 20.60 | (9.62 | ) | 274,660 | 1.14 | 1.14 | 1.24 | 1.30 | 74 | ||||||||||||||||||||||||||||||||||||||||||
2018 | 26.16 | 0.17 | 1.53 | 1.70 | (0.17) | (2.15 | ) | (2.32 | ) | 25.54 | 6.81 | 336,361 | 1.14 | 1.14 | 1.24 | 0.68 | 132 | |||||||||||||||||||||||||||||||||||||||||||
2017 | 22.75 | 0.11 | 3.43 | 3.54 | (0.13) | — | (0.13 | ) | 26.16 | 15.61 | 349,296 | 1.14 | 1.14 | 1.23 | 0.45 | 123 | ||||||||||||||||||||||||||||||||||||||||||||
2016 | 21.80 | 0.14 | 2.27 | 2.41 | (0.15) | (1.31 | ) | (1.46 | ) | 22.75 | 11.60 | 362,348 | 1.17(2) | 1.17(2) | 1.26(2) | 0.63 | 87 | |||||||||||||||||||||||||||||||||||||||||||
Class I |
| |||||||||||||||||||||||||||||||||||||||||||||||||||||||||||
2021@ | $ | 16.90 | $ | 0.06 | $ | 9.47 | $ | 9.53 | $ | (0.06) | $ | — | $ | (0.06 | ) | $ | 26.37 | 56.52 | % | $ | 1,785 | 1.36% | 1.36% | 1.48% | 0.59% | 47% | ||||||||||||||||||||||||||||||||||
2020 | 20.39 | 0.12 | (3.42) | (3.30) | (0.19) | — | (0.19 | ) | 16.90 | (16.20 | ) | 1,204 | 1.36 | 1.36 | 1.49 | 0.67 | 65 | |||||||||||||||||||||||||||||||||||||||||||
2019 | 25.31 | 0.22 | (2.84) | (2.62) | (0.20) | (2.10 | ) | (2.30 | ) | 20.39 | (9.83 | ) | 1,703 | 1.36 | 1.36 | 1.49 | 1.07 | 74 | ||||||||||||||||||||||||||||||||||||||||||
2018 | 25.94 | 0.12 | 1.51 | 1.63 | (0.11) | (2.15 | ) | (2.26 | ) | 25.31 | 6.59 | 2,354 | 1.36 | 1.36 | 1.49 | 0.46 | 132 | |||||||||||||||||||||||||||||||||||||||||||
2017 | 22.57 | 0.05 | 3.41 | 3.46 | (0.09) | — | (0.09 | ) | 25.94 | 15.37 | 2,466 | 1.36 | 1.36 | 1.48 | 0.22 | 123 | ||||||||||||||||||||||||||||||||||||||||||||
2016 | 21.64 | 0.09 | 2.25 | 2.34 | (0.10) | (1.31 | ) | (1.41 | ) | 22.57 | 11.34 | 2,910 | 1.39(2) | 1.39(2) | 1.51(2) | 0.40 | 87 | |||||||||||||||||||||||||||||||||||||||||||
Class Y |
| |||||||||||||||||||||||||||||||||||||||||||||||||||||||||||
2021@ | $ | 17.08 | $ | 0.12 | $ | 9.57 | $ | 9.69 | $ | (0.11) | $ | — | $ | (0.11 | ) | $ | 26.66 | 56.91 | % | $ | 63,196 | 0.89% | 0.89% | 0.98% | 1.03% | 47% | ||||||||||||||||||||||||||||||||||
2020 | 20.61 | 0.21 | (3.46) | (3.25) | (0.28) | — | (0.28 | ) | 17.08 | (15.80 | ) | 45,725 | 0.89 | 0.89 | 0.99 | 1.13 | 65 | |||||||||||||||||||||||||||||||||||||||||||
2019 | 25.56 | 0.33 | (2.87) | (2.54) | (0.31) | (2.10 | ) | (2.41 | ) | 20.61 | (9.42 | ) | 44,255 | 0.89 | 0.89 | 0.99 | 1.55 | 74 | ||||||||||||||||||||||||||||||||||||||||||
2018 | 26.18 | 0.24 | 1.52 | 1.76 | (0.23) | (2.15 | ) | (2.38 | ) | 25.56 | 7.07 | 41,421 | 0.89 | 0.88 | 0.99 | 0.94 | 132 | |||||||||||||||||||||||||||||||||||||||||||
2017 | 22.76 | 0.18 | 3.43 | 3.61 | (0.19) | — | (0.19 | ) | 26.18 | 15.94 | 37,243 | 0.89 | 0.89 | 0.99 | 0.74 | 123 | ||||||||||||||||||||||||||||||||||||||||||||
2016(3) | 22.95 | 0.18 | 1.09 | 1.27 | (0.15) | (1.31 | ) | (1.46 | ) | 22.76 | 6.04 | 7,207 | 0.92(2) | 0.92(2) | 1.02(2) | 0.91 | 87 | |||||||||||||||||||||||||||||||||||||||||||
Small Cap Growth Fund |
| |||||||||||||||||||||||||||||||||||||||||||||||||||||||||||
Class F |
| |||||||||||||||||||||||||||||||||||||||||||||||||||||||||||
2021@ | $ | 32.60 | $ | (0.08 | ) | $ | 12.55 | $ | 12.47 | $ | — | $ | — | $ | — | $ | 45.07 | 38.28 | % | $ | 400,058 | 1.11% | 1.11% | 1.23% | (0.37)% | 122% | ||||||||||||||||||||||||||||||||||
2020 | 31.88 | (0.12 | ) | 1.96 | 1.84 | — | (1.12 | ) | (1.12 | ) | 32.60 | 5.68 | 290,981 | 1.11 | 1.11 | 1.23 | (0.39) | 173 | ||||||||||||||||||||||||||||||||||||||||||
2019 | 42.96 | (0.11 | ) | (6.04) | (6.15) | — | (4.93 | ) | (4.93 | ) | 31.88 | (13.89 | ) | 293,814 | 1.11 | 1.11 | 1.24 | (0.33) | 172 | |||||||||||||||||||||||||||||||||||||||||
2018 | 34.42 | (0.20 | ) | 8.86 | 8.66 | — | (0.12 | ) | (0.12 | ) | 42.96 | 25.25 | 386,055 | 1.11 | 1.11 | 1.24 | (0.53) | 168 | ||||||||||||||||||||||||||||||||||||||||||
2017 | 28.86 | (0.17 | ) | 5.73 | 5.56 | — | — | — | 34.42 | 19.27 | 312,759 | 1.11 | 1.11 | 1.23 | (0.55) | 116 | ||||||||||||||||||||||||||||||||||||||||||||
2016 | 26.60 | (0.08 | ) | 2.34 | 2.26 | — | — | — | 28.86 | 8.50 | 312,240 | 1.14(2) | 1.14(2) | 1.26(2) | (0.31) | 124 | ||||||||||||||||||||||||||||||||||||||||||||
Class I |
| |||||||||||||||||||||||||||||||||||||||||||||||||||||||||||
2021@ | $ | 30.85 | $ | (0.12 | ) | $ | 11.87 | $ | 11.75 | $ | — | $ | — | $ | — | $ | 42.60 | 38.09 | % | $ | 1,891 | 1.36% | 1.36% | 1.48% | (0.63)% | 122% | ||||||||||||||||||||||||||||||||||
2020 | 30.29 | (0.19 | ) | 1.87 | 1.68 | — | (1.12 | ) | (1.12 | ) | 30.85 | 5.44 | 1,245 | 1.36 | 1.36 | 1.48 | (0.64) | 173 | ||||||||||||||||||||||||||||||||||||||||||
2019 | 41.21 | (0.19 | ) | (5.80) | (5.99) | — | (4.93 | ) | (4.93 | ) | 30.29 | (14.13 | ) | 1,408 | 1.36 | 1.36 | 1.49 | (0.59) | 172 | |||||||||||||||||||||||||||||||||||||||||
2018 | 33.11 | (0.28 | ) | 8.50 | 8.22 | — | (0.12 | ) | (0.12 | ) | 41.21 | 24.92 | 2,127 | 1.36 | 1.36 | 1.49 | (0.79) | 168 | ||||||||||||||||||||||||||||||||||||||||||
2017 | 27.83 | (0.24 | ) | 5.52 | 5.28 | — | — | — | 33.11 | 18.97 | 2,079 | 1.36 | 1.36 | 1.48 | (0.79) | 116 | ||||||||||||||||||||||||||||||||||||||||||||
2016 | 25.71 | (0.14 | ) | 2.26 | 2.12 | — | — | — | 27.83 | 8.25 | 2,253 | 1.39(2) | 1.39(2) | 1.51(2) | (0.56) | 124 | ||||||||||||||||||||||||||||||||||||||||||||
Class Y |
| |||||||||||||||||||||||||||||||||||||||||||||||||||||||||||
2021@ | $ | 33.06 | $ | (0.03 | ) | $ | 12.74 | $ | 12.71 | $ | — | $ | — | $ | — | $ | 45.77 | 38.45 | % | $ | 42,495 | 0.86% | 0.86% | 0.98% | (0.13)% | 122% | ||||||||||||||||||||||||||||||||||
2020 | 32.23 | (0.04 | ) | 1.99 | 1.95 | — | (1.12 | ) | (1.12 | ) | 33.06 | 5.97 | 32,593 | 0.86 | 0.86 | 0.98 | (0.14) | 173 | ||||||||||||||||||||||||||||||||||||||||||
2019 | 43.27 | (0.03 | ) | (6.08) | (6.11) | — | (4.93 | ) | (4.93 | ) | 32.23 | (13.68 | ) | 33,340 | 0.86 | 0.86 | 0.99 | (0.08) | 172 | |||||||||||||||||||||||||||||||||||||||||
2018 | 34.59 | (0.11 | ) | 8.91 | 8.80 | — | (0.12 | ) | (0.12 | ) | 43.27 | 25.56 | 34,078 | 0.86 | 0.86 | 0.99 | (0.28) | 168 | ||||||||||||||||||||||||||||||||||||||||||
2017 | 28.93 | (0.11 | ) | 5.77 | 5.66 | — | — | — | 34.59 | 19.57 | 28,446 | 0.86 | 0.86 | 0.98 | (0.36) | 116 | ||||||||||||||||||||||||||||||||||||||||||||
2016(3) | 27.72 | (0.02 | ) | 1.23 | 1.21 | — | — | — | 28.93 | 4.37 | 7,243 | 0.89(2) | 0.89(2) | 1.01(2) | (0.08) | 124 | ||||||||||||||||||||||||||||||||||||||||||||
| † | Returns and portfolio turnover rates are for the period indicated and have not been annualized. Returns do not reflect the deduction of taxes the shareholder would pay on fund distributions or redemption of fund shares. |
| @ | For the six-month period ended March 31, 2021. All ratios for the period have been annualized. |
| (1) | Per share net investment income and net realized and unrealized gains (losses) calculated using average shares. |
| (2) | The expense ratio includes proxy expenses outside of the cap. |
| (3) | Commenced operations on October 30, 2015. All ratios for the period have been annualized. |
Amounts designated as “—” are either $0 or have been rounded to $0.
The accompanying notes are an integral part of the financial statements.
| 304 | SEI Institutional Managed Trust / Semi-Annual Report / March 31, 2021 |
FINANCIAL HIGHLIGHTS
For the period ended March 31, 2021 (Unaudited) and the years or periods ended September 30, (unless otherwise For a share outstanding throughout each period
| Net Asset Value, Beginning of Period | Net Investment Income (Loss)(1) | Net Realized and Unrealized Gains (Losses) on Investments(1) | Total from | Dividends from Net Investment Income | Distributions from Net Realized Capital Gains | Total Dividends and Distributions | Net Asset Value, End of Period | Total Return† | Net Assets End of Period ($ Thousands) | Ratio of Net Expenses to Average Net Assets | Ratio of Expenses to Average Net Assets (Excluding Fees Paid Indirectly and Including Waivers) | Ratio of Expenses Net Assets | Ratio of Net Investment Income (Loss) to Average Net Assets | Portfolio Turnover Rate† | ||||||||||||||||||||||||||||||||||||||||||||||
Tax-Managed Small/Mid Cap Fund |
| |||||||||||||||||||||||||||||||||||||||||||||||||||||||||||
Class F |
| |||||||||||||||||||||||||||||||||||||||||||||||||||||||||||
2021@ | $ | 19.41 | $ | 0.03 | $ | 7.88 | $ | 7.91 | $ | (0.02) | $ | — | $ | (0.02 | ) | $ | 27.30 | 40.76 | % | $ | 914,931 | 1.11% | 1.11% | 1.23% | 0.29% | 38% | ||||||||||||||||||||||||||||||||||
2020 | 21.04 | 0.04 | (1.15) | (1.11) | (0.08) | (0.44 | ) | (0.52 | ) | 19.41 | (5.47 | ) | 664,941 | 1.11 | 1.11 | 1.24 | 0.22 | 90 | ||||||||||||||||||||||||||||||||||||||||||
2019 | 25.02 | 0.11 | (2.32) | (2.21) | (0.10) | (1.67 | ) | (1.77 | ) | 21.04 | (8.27 | ) | 771,375 | 1.11 | 1.11 | 1.23 | 0.54 | 115 | ||||||||||||||||||||||||||||||||||||||||||
2018 | 22.09 | 0.02 | 3.34 | 3.36 | (0.02) | (0.41 | ) | (0.43 | ) | 25.02 | 15.38 | 907,519 | 1.11 | 1.11 | 1.23 | 0.07 | 186 | |||||||||||||||||||||||||||||||||||||||||||
2017 | 18.97 | 0.03 | 3.17 | 3.20 | (0.08) | — | (0.08 | ) | 22.09 | 16.91 | 782,449 | 1.11(2) | 1.11(2) | 1.24(2) | 0.12 | 151 | ||||||||||||||||||||||||||||||||||||||||||||
2016 | 17.53 | 0.06 | 1.44 | 1.50 | (0.06) | — | (0.06 | ) | 18.97 | 8.55 | 643,288 | 1.13(3) | 1.13(3) | 1.25(3) | 0.35 | 107 | ||||||||||||||||||||||||||||||||||||||||||||
Class Y |
| |||||||||||||||||||||||||||||||||||||||||||||||||||||||||||
2021@ | $ | 19.45 | $ | 0.06 | $ | 7.87 | $ | 7.93 | $ | (0.05) | $ | — | $ | (0.05 | ) | $ | 27.33 | 40.82 | % | $ | 108,195 | 0.89% | 0.89% | 0.98% | 0.51% | 38% | ||||||||||||||||||||||||||||||||||
2020 | 21.06 | 0.09 | (1.14) | (1.05) | (0.12) | (0.44 | ) | (0.56 | ) | 19.45 | (5.20 | ) | 84,564 | 0.89 | 0.89 | 0.99 | 0.44 | 90 | ||||||||||||||||||||||||||||||||||||||||||
2019 | 25.07 | 0.16 | (2.34) | (2.18) | (0.16) | (1.67 | ) | (1.83 | ) | 21.06 | (8.12 | ) | 98,434 | 0.89 | 0.89 | 0.99 | 0.77 | 115 | ||||||||||||||||||||||||||||||||||||||||||
2018 | 22.11 | 0.07 | 3.35 | 3.42 | (0.05) | (0.41 | ) | (0.46 | ) | 25.07 | 15.69 | 88,854 | 0.89 | 0.89 | 0.98 | 0.29 | 186 | |||||||||||||||||||||||||||||||||||||||||||
2017 | 18.98 | 0.07 | 3.17 | 3.24 | (0.11) | — | (0.11 | ) | 22.11 | 17.14 | 75,183 | 0.90(2) | 0.90(2) | 0.99(2) | 0.34 | 151 | ||||||||||||||||||||||||||||||||||||||||||||
2016 | 17.55 | 0.10 | 1.44 | 1.54 | (0.11) | — | (0.11 | ) | 18.98 | 8.79 | 47,185 | 0.91(3) | 0.91(3) | 1.00(3) | 0.58 | 107 | ||||||||||||||||||||||||||||||||||||||||||||
Mid-Cap Fund |
| |||||||||||||||||||||||||||||||||||||||||||||||||||||||||||
Class F |
| |||||||||||||||||||||||||||||||||||||||||||||||||||||||||||
2021@ | $ | 23.59 | $ | 0.11 | $ | 7.27 | $ | 7.38 | $ | (0.14) | $ | — | $ | (0.14 | ) | $ | 30.83 | 31.40 | % | $ | 76,224 | 0.98% | 0.98% | 0.98% | 0.82% | 54% | ||||||||||||||||||||||||||||||||||
2020 | 24.94 | 0.28 | (1.00) | (0.72) | (0.29) | (0.34 | ) | (0.63 | ) | 23.59 | (2.87 | ) | 66,828 | 0.98 | 0.98 | 0.98 | 1.17 | 108 | ||||||||||||||||||||||||||||||||||||||||||
2019 | 29.13 | 0.22 | (1.43) | (1.21) | (0.20) | (2.78 | ) | (2.98 | ) | 24.94 | (3.10 | ) | 102,280 | 0.98 | 0.98 | 0.99 | 0.89 | 99 | ||||||||||||||||||||||||||||||||||||||||||
2018 | 27.81 | 0.19 | 3.37 | 3.56 | (0.21) | (2.03 | ) | (2.24 | ) | 29.13 | 13.41 | 131,640 | 0.98 | 0.98 | 0.99 | 0.66 | 99 | |||||||||||||||||||||||||||||||||||||||||||
2017 | 24.00 | 0.17 | 3.99 | 4.16 | (0.16) | (0.19 | ) | (0.35 | ) | 27.81 | 17.52 | 112,423 | 0.98 | 0.98 | 0.99 | 0.67 | 112 | |||||||||||||||||||||||||||||||||||||||||||
2016 | 25.08 | 0.27 | 2.86 | 3.13 | (0.34) | (3.87 | ) | (4.21 | ) | 24.00 | 14.10 | 87,780 | 1.01(3) | 1.01(3) | 1.01(3) | 1.16 | 115 | |||||||||||||||||||||||||||||||||||||||||||
Class I |
| |||||||||||||||||||||||||||||||||||||||||||||||||||||||||||
2021@ | $ | 23.55 | $ | 0.09 | $ | 7.24 | $ | 7.33 | $ | (0.11) | $ | — | $ | (0.11 | ) | $ | 30.77 | 31.23 | % | $ | 727 | 1.20% | 1.20% | 1.23% | 0.64% | 54% | ||||||||||||||||||||||||||||||||||
2020 | 24.91 | 0.22 | (0.99) | (0.77) | (0.25) | (0.34 | ) | (0.59 | ) | 23.55 | (3.13 | ) | 583 | 1.20 | 1.20 | 1.23 | 0.96 | 108 | ||||||||||||||||||||||||||||||||||||||||||
2019 | 29.09 | 0.16 | (1.41) | (1.25) | (0.15) | (2.78 | ) | (2.93 | ) | 24.91 | (3.27 | ) | 716 | 1.20 | 1.20 | 1.24 | 0.66 | 99 | ||||||||||||||||||||||||||||||||||||||||||
2018 | 27.78 | 0.12 | 3.36 | 3.48 | (0.14) | (2.03 | ) | (2.17 | ) | 29.09 | 13.11 | 821 | 1.20 | 1.21 | 1.24 | 0.42 | 99 | |||||||||||||||||||||||||||||||||||||||||||
2017 | 23.96 | 0.12 | 4.00 | 4.12 | (0.11) | (0.19 | ) | (0.30 | ) | 27.78 | 17.32 | 864 | 1.20 | 1.20 | 1.24 | 0.46 | 112 | |||||||||||||||||||||||||||||||||||||||||||
2016 | 25.04 | 0.22 | 2.85 | 3.07 | (0.28) | (3.87 | ) | (4.15 | ) | 23.96 | 13.84 | 871 | 1.24(3) | 1.24(3) | 1.27(3) | 0.97 | 115 | |||||||||||||||||||||||||||||||||||||||||||
Class Y |
| |||||||||||||||||||||||||||||||||||||||||||||||||||||||||||
2021@ | $ | 23.61 | $ | 0.15 | $ | 7.25 | $ | 7.40 | $ | (0.17) | $ | — | $ | (0.17 | ) | $ | 30.84 | 31.49 | % | $ | 3,764 | 0.73% | 0.73% | 0.73% | 1.08% | 54% | ||||||||||||||||||||||||||||||||||
2020 | 24.96 | 0.33 | (0.99) | (0.66) | (0.35) | (0.34 | ) | (0.69 | ) | 23.61 | (2.61 | ) | 2,584 | 0.73 | 0.73 | 0.73 | 1.42 | 108 | ||||||||||||||||||||||||||||||||||||||||||
2019 | 29.15 | 0.28 | (1.42) | (1.14) | (0.27) | (2.78 | ) | (3.05 | ) | 24.96 | (2.85 | ) | 2,604 | 0.73 | 0.73 | 0.74 | 1.14 | 99 | ||||||||||||||||||||||||||||||||||||||||||
2018 | 27.83 | 0.26 | 3.37 | 3.63 | (0.28) | (2.03 | ) | (2.31 | ) | 29.15 | 13.68 | 2,962 | 0.73 | 0.74 | 0.74 | 0.92 | 99 | |||||||||||||||||||||||||||||||||||||||||||
2017 | 24.01 | 0.24 | 4.00 | 4.24 | (0.23) | (0.19 | ) | (0.42 | ) | 27.83 | 17.84 | 2,267 | 0.73 | 0.73 | 0.74 | 0.93 | 112 | |||||||||||||||||||||||||||||||||||||||||||
2016(4) | 26.61 | 0.30 | 1.29 | 1.59 | (0.32) | (3.87 | ) | (4.19 | ) | 24.01 | 7.56 | 479 | 0.78(3) | 0.78(3) | 0.78(3) | 1.43 | 115 | |||||||||||||||||||||||||||||||||||||||||||
| † | Returns and portfolio turnover rates are for the period indicated and have not been annualized. Returns do not reflect the deduction of taxes the shareholder would pay on fund distributions or redemption of fund shares. |
| @ | For the six-month period ended March 31, 2021. All ratios for the period have been annualized. |
| (1) | Per share net investment income and net realized and unrealized gains (losses) calculated using average shares. |
| (2) | The expense ratio includes litigation expenses outside the cap. |
| (3) | The expense ratio includes proxy expenses outside of the cap. |
| (4) | Commenced operations on October 30, 2015. All ratios for the period have been annualized. |
Amounts designated as “—” are either $0 or have been rounded to $0.
The accompanying notes are an integral part of the financial statements.
| SEI Institutional Managed Trust / Semi-Annual Report / March 31, 2021 | 305 |
FINANCIAL HIGHLIGHTS
For the period ended March 31, 2021 (Unaudited) and the years or periods ended September 30, (unless otherwise For a share outstanding throughout each period
| Net Asset Value, Beginning of Period | Net Investment Income (Loss)(1) | Net Realized and Unrealized Gains (Losses) on Investments(1) | Total from | Dividends from Net Investment Income | Distributions from Net Realized Capital Gains | Total Dividends and Distributions | Net Asset Value, End of Period | Total Return† | Net Assets End of | Ratio of Net Expenses to Average Net Assets | Ratio of Expenses to Average Net Assets (Excluding Fees Paid Indirectly and Including Waivers) | Ratio of Expenses Net Assets | Ratio of Net Investment Income (Loss) to Average Net Assets | Portfolio Turnover Rate† | ||||||||||||||||||||||||||||||||||||||||||||||
U.S. Managed Volatility Fund |
| |||||||||||||||||||||||||||||||||||||||||||||||||||||||||||
Class F |
| |||||||||||||||||||||||||||||||||||||||||||||||||||||||||||
2021@ | $ | 16.14 | $ | 0.14 | $ | 2.44 | $ | 2.58 | $ | (0.11) | $ | (1.40 | ) | $ | (1.51 | ) | $ | 17.21 | 16.48 | % | $ | 786,754 | 0.90% | 0.90% | 1.23% | 1.63% | 29% | |||||||||||||||||||||||||||||||||
2020 | 17.78 | 0.26 | (1.08) | (0.82) | (0.29) | (0.53 | ) | (0.82 | ) | 16.14 | (4.87 | ) | 764,608 | 0.90 | 0.90 | 1.23 | 1.55 | 77 | ||||||||||||||||||||||||||||||||||||||||||
2019 | 18.69 | 0.32 | 0.91 | 1.23 | (0.31) | (1.83 | ) | (2.14 | ) | 17.78 | 7.89 | 914,612 | 0.93 | 0.93 | 1.23 | 1.89 | 44 | |||||||||||||||||||||||||||||||||||||||||||
2018 | 18.26 | 0.26 | 1.80 | 2.06 | (0.27) | (1.36 | ) | (1.63 | ) | 18.69 | 11.83 | 934,551 | 0.97 | 0.97 | 1.23 | 1.44 | 72 | |||||||||||||||||||||||||||||||||||||||||||
2017 | 17.04 | 0.25 | 1.72 | 1.97 | (0.26) | (0.49 | ) | (0.75 | ) | 18.26 | 11.85 | 994,387 | 1.00 | 1.00 | 1.23 | 1.45 | 48 | |||||||||||||||||||||||||||||||||||||||||||
2016 | 16.23 | 0.25 | 1.62 | 1.87 | (0.26) | (0.80 | ) | (1.06 | ) | 17.04 | 12.01 | 1,126,685 | 1.02(2) | 1.02(2) | 1.25(2) | 1.53 | 43 | |||||||||||||||||||||||||||||||||||||||||||
Class I |
| |||||||||||||||||||||||||||||||||||||||||||||||||||||||||||
2021@ | $ | 16.13 | $ | 0.12 | $ | 2.44 | $ | 2.56 | $ | (0.09) | $ | (1.40 | ) | $ | (1.49 | ) | $ | 17.20 | 16.34 | % | $ | 1,405 | 1.15% | 1.15% | 1.48% | 1.38% | 29% | |||||||||||||||||||||||||||||||||
2020 | 17.78 | 0.21 | (1.08) | (0.87) | (0.25) | (0.53 | ) | (0.78 | ) | 16.13 | (5.17 | ) | 1,282 | 1.15 | 1.15 | 1.48 | 1.29 | 77 | ||||||||||||||||||||||||||||||||||||||||||
2019 | 18.69 | 0.28 | 0.91 | 1.19 | (0.27) | (1.83 | ) | (2.10 | ) | 17.78 | 7.62 | 1,345 | 1.18 | 1.18 | 1.48 | 1.64 | 44 | |||||||||||||||||||||||||||||||||||||||||||
2018 | 18.26 | 0.21 | 1.80 | 2.01 | (0.22) | (1.36 | ) | (1.58 | ) | 18.69 | 11.55 | 1,183 | 1.22 | 1.22 | 1.48 | 1.18 | 72 | |||||||||||||||||||||||||||||||||||||||||||
2017 | 17.03 | 0.21 | 1.71 | 1.92 | (0.20) | (0.49 | ) | (0.69 | ) | 18.26 | 11.58 | 1,426 | 1.25 | 1.25 | 1.48 | 1.21 | 48 | |||||||||||||||||||||||||||||||||||||||||||
2016 | 16.21 | 0.21 | 1.62 | 1.83 | (0.21) | (0.80 | ) | (1.01 | ) | 17.03 | 11.76 | 1,928 | 1.27(2) | 1.27(2) | 1.50(2) | 1.28 | 43 | |||||||||||||||||||||||||||||||||||||||||||
Class Y |
| |||||||||||||||||||||||||||||||||||||||||||||||||||||||||||
2021@ | $ | 16.15 | $ | 0.15 | $ | 2.45 | $ | 2.60 | $ | (0.14) | $ | (1.40 | ) | $ | (1.54 | ) | $ | 17.21 | 16.55 | % | $ | 210,638 | 0.65% | 0.65% | 0.98% | 1.75% | 29% | |||||||||||||||||||||||||||||||||
2020 | 17.79 | 0.30 | (1.08) | (0.78) | (0.33) | (0.53 | ) | (0.86 | ) | 16.15 | (4.62 | ) | 870,935 | 0.65 | 0.65 | 0.98 | 1.79 | 77 | ||||||||||||||||||||||||||||||||||||||||||
2019 | 18.70 | 0.37 | 0.91 | 1.28 | (0.36) | (1.83 | ) | (2.19 | ) | 17.79 | 8.16 | 922,175 | 0.68 | 0.68 | 0.98 | 2.15 | 44 | |||||||||||||||||||||||||||||||||||||||||||
2018 | 18.27 | 0.30 | 1.80 | 2.10 | (0.31) | (1.36 | ) | (1.67 | ) | 18.70 | 12.11 | 682,081 | 0.72 | 0.72 | 0.98 | 1.68 | 72 | |||||||||||||||||||||||||||||||||||||||||||
2017 | 17.05 | 0.30 | 1.71 | 2.01 | (0.30) | (0.49 | ) | (0.79 | ) | 18.27 | 12.13 | 585,729 | 0.75 | 0.75 | 0.98 | 1.73 | 48 | |||||||||||||||||||||||||||||||||||||||||||
2016 | 16.24 | 0.29 | 1.62 | 1.91 | (0.30) | (0.80 | ) | (1.10 | ) | 17.05 | 12.28 | 486,555 | 0.77(2) | 0.77(2) | 1.00(2) | 1.78 | 43 | |||||||||||||||||||||||||||||||||||||||||||
Global Managed Volatility Fund |
| |||||||||||||||||||||||||||||||||||||||||||||||||||||||||||
Class F |
| |||||||||||||||||||||||||||||||||||||||||||||||||||||||||||
2021@ | $ | 10.40 | $ | 0.05 | $ | 0.91 | $ | 0.96 | $ | (0.09) | $ | (0.02 | ) | $ | (0.11 | ) | $ | 11.25 | 9.26 | % | $ | 901,453 | 1.11% | 1.11% | 1.24% | 0.94% | 43% | |||||||||||||||||||||||||||||||||
2020 | 11.46 | 0.12 | (0.57) | (0.45) | (0.28) | (0.33 | ) | (0.61 | ) | 10.40 | (4.33 | ) | 913,791 | 1.11 | 1.11 | 1.25 | 1.12 | 86 | ||||||||||||||||||||||||||||||||||||||||||
2019 | 12.08 | 0.18 | 0.26 | 0.44 | (0.29) | (0.77 | ) | (1.06 | ) | 11.46 | 4.75 | 1,060,614 | 1.11 | 1.11 | 1.24 | 1.61 | 66 | |||||||||||||||||||||||||||||||||||||||||||
2018 | 11.97 | 0.17 | 0.77 | 0.94 | (0.18) | (0.65 | ) | (0.83 | ) | 12.08 | 8.12 | 1,184,336 | 1.11 | 1.11 | 1.24 | 1.46 | 55 | |||||||||||||||||||||||||||||||||||||||||||
2017 | 11.51 | 0.17 | 1.03 | 1.20 | (0.32) | (0.42 | ) | (0.74 | ) | 11.97 | 11.16 | 1,242,592 | 1.11 | 1.11 | 1.24 | 1.45 | 61 | |||||||||||||||||||||||||||||||||||||||||||
2016 | 10.83 | 0.17 | 1.20 | 1.37 | (0.55) | (0.14 | ) | (0.69 | ) | 11.51 | 13.08 | 1,618,549 | 1.13(2) | 1.13(2) | 1.25(2) | 1.50 | 58 | |||||||||||||||||||||||||||||||||||||||||||
Class I |
| |||||||||||||||||||||||||||||||||||||||||||||||||||||||||||
2021@ | $ | 10.15 | $ | 0.04 | $ | 0.88 | $ | 0.92 | $ | (0.07) | $ | (0.02 | ) | $ | (0.09 | ) | $ | 10.98 | 9.04 | % | $ | 1,005 | 1.36% | 1.36% | 1.49% | 0.70% | 43% | |||||||||||||||||||||||||||||||||
2020 | 11.19 | 0.09 | (0.55) | (0.46) | (0.25) | (0.33 | ) | (0.58 | ) | 10.15 | (4.51 | ) | 952 | 1.36 | 1.36 | 1.50 | 0.88 | 86 | ||||||||||||||||||||||||||||||||||||||||||
2019 | 11.82 | 0.15 | 0.25 | 0.40 | (0.26) | (0.77 | ) | (1.03 | ) | 11.19 | 4.45 | 1,067 | 1.36 | 1.36 | 1.49 | 1.36 | 66 | |||||||||||||||||||||||||||||||||||||||||||
2018 | 11.73 | 0.14 | 0.75 | 0.89 | (0.15) | (0.65 | ) | (0.80 | ) | 11.82 | 7.87 | 1,225 | 1.36 | 1.36 | 1.49 | 1.19 | 55 | |||||||||||||||||||||||||||||||||||||||||||
2017 | 11.29 | 0.14 | 1.00 | 1.14 | (0.28) | (0.42 | ) | (0.70 | ) | 11.73 | 10.80 | 1,573 | 1.36 | 1.36 | 1.48 | 1.24 | 61 | |||||||||||||||||||||||||||||||||||||||||||
2016 | 10.62 | 0.15 | 1.18 | 1.33 | (0.52) | (0.14 | ) | (0.66 | ) | 11.29 | 12.97 | 2,734 | 1.38(2) | 1.38(2) | 1.51(2) | 1.41 | 58 | |||||||||||||||||||||||||||||||||||||||||||
Class Y |
| |||||||||||||||||||||||||||||||||||||||||||||||||||||||||||
2021@ | $ | 10.43 | $ | 0.06 | $ | 0.92 | $ | 0.98 | $ | (0.12) | $ | (0.02 | ) | $ | (0.14 | ) | $ | 11.27 | 9.41 | % | $ | 131,650 | 0.86% | 0.86% | 0.99% | 1.18% | 43% | |||||||||||||||||||||||||||||||||
2020 | 11.49 | 0.15 | (0.58) | (0.43) | (0.30) | (0.33 | ) | (0.63 | ) | 10.43 | (4.08 | ) | 143,066 | 0.86 | 0.86 | 1.00 | 1.39 | 86 | ||||||||||||||||||||||||||||||||||||||||||
2019 | 12.12 | 0.21 | 0.25 | 0.46 | (0.32) | (0.77 | ) | (1.09 | ) | 11.49 | 4.95 | 220,260 | 0.86 | 0.86 | 0.99 | 1.86 | 66 | |||||||||||||||||||||||||||||||||||||||||||
2018 | 12.00 | 0.20 | 0.78 | 0.98 | (0.21) | (0.65 | ) | (0.86 | ) | 12.12 | 8.46 | 233,708 | 0.86 | 0.86 | 0.99 | 1.74 | 55 | |||||||||||||||||||||||||||||||||||||||||||
2017 | 11.55 | 0.22 | 1.00 | 1.22 | (0.35) | (0.42 | ) | (0.77 | ) | 12.00 | 11.32 | 213,561 | 0.87 | 0.87 | 0.99 | 1.87 | 61 | |||||||||||||||||||||||||||||||||||||||||||
2016 | 10.85 | 0.21 | 1.20 | 1.41 | (0.57) | (0.14 | ) | (0.71 | ) | 11.55 | 13.49 | 102,388 | 0.88(2) | 0.88(2) | 1.01(2) | 1.86 | 58 | |||||||||||||||||||||||||||||||||||||||||||
| † | Returns and portfolio turnover rates are for the period indicated and have not been annualized. Returns do not reflect the deduction of taxes the shareholder would pay on fund distributions or redemption of fund shares. |
| @ | For the six-month period ended March 31, 2021. All ratios for the period have been annualized. |
| (1) | Per share net investment income and net realized and unrealized gains (losses) calculated using average shares. |
| (2) | The expense ratio includes proxy expenses outside of the cap. |
Amounts designated as “—“are either $0 or have been rounded to $0.
The accompanying notes are an integral part of the financial statements.
| 306 | SEI Institutional Managed Trust / Semi-Annual Report / March 31, 2021 |
FINANCIAL HIGHLIGHTS
For the period ended March 31, 2021 (Unaudited) and the years or periods ended September 30, (unless otherwise For a share outstanding throughout each period
| Net Asset Value, Beginning of Period | Net Investment (Loss)(1) | Net Realized and Unrealized Gains (Losses) on Investments(1) | Total from | Dividends from Net Investment Income | Distributions from Net Realized Capital Gains | Total Dividends and Distributions | Net Asset Value, End of Period | Total Return† | Net Assets End of | Ratio of Net Expenses to Average Net Assets | Ratio of Expenses to Average Net Assets (Excluding Fees Paid Indirectly and Including Waivers) | Ratio of Expenses Net Assets | Ratio of Net Investment Income (Loss) to Average Net Assets | Portfolio Turnover Rate† | ||||||||||||||||||||||||||||||||||||||||||||||
Tax-Managed Managed Volatility Fund |
| |||||||||||||||||||||||||||||||||||||||||||||||||||||||||||
Class F |
| |||||||||||||||||||||||||||||||||||||||||||||||||||||||||||
2021@ | $ | 16.66 | $ | 0.11 | $ | 2.14 | $ | 2.25 | $ | (0.10 | ) | $ (0.13) | $ | (0.23 | ) | $ | 18.68 | 13.61 | % | $ | 898,615 | 1.00% | 1.00% | 1.23% | 1.30% | 11% | ||||||||||||||||||||||||||||||||||
2020 | 17.61 | 0.25 | (0.51 | ) | (0.26 | ) | (0.27 | ) | (0.42) | (0.69 | ) | 16.66 | (1.53 | ) | 856,160 | 1.00 | 1.00 | 1.23 | 1.48 | 27 | ||||||||||||||||||||||||||||||||||||||||
2019 | 17.22 | 0.27 | 0.88 | 1.15 | (0.27 | ) | (0.49) | (0.76 | ) | 17.61 | 7.16 | 1,004,802 | 1.00 | 1.00 | 1.23 | 1.65 | 29 | |||||||||||||||||||||||||||||||||||||||||||
2018 | 15.96 | 0.21 | 1.70 | 1.91 | (0.22 | ) | (0.43) | (0.65 | ) | 17.22 | 12.26 | 1,030,813 | 1.00 | 1.00 | 1.23 | 1.31 | 24 | |||||||||||||||||||||||||||||||||||||||||||
2017 | 14.74 | 0.23 | 1.61 | 1.84 | (0.23 | ) | (0.39) | (0.62 | ) | 15.96 | 12.84 | 994,011 | 1.00 | 1.00 | 1.23 | 1.53 | 22 | |||||||||||||||||||||||||||||||||||||||||||
2016 | 13.88 | 0.22 | 1.41 | 1.63 | (0.21 | ) | (0.56) | (0.77 | ) | 14.74 | 12.24 | 1,162,478 | 1.02(2) | 1.02(2) | 1.25(2) | 1.52 | 32 | |||||||||||||||||||||||||||||||||||||||||||
Class Y |
| |||||||||||||||||||||||||||||||||||||||||||||||||||||||||||
2021@ | $ | 16.66 | $ | 0.14 | $ | 2.13 | $ | 2.27 | $ | (0.12 | ) | $ (0.13) | $ | (0.25 | ) | $ | 18.68 | 13.75 | % | $ | 81,701 | 0.75% | 0.75% | 0.98% | 1.54% | 11% | ||||||||||||||||||||||||||||||||||
2020 | 17.62 | 0.29 | (0.52 | ) | (0.23 | ) | (0.31 | ) | (0.42) | (0.73 | ) | 16.66 | (1.34 | ) | 76,132 | 0.75 | 0.75 | 0.98 | 1.73 | 27 | ||||||||||||||||||||||||||||||||||||||||
2019 | 17.23 | 0.31 | 0.88 | 1.19 | (0.31 | ) | (0.49) | (0.80 | ) | 17.62 | 7.42 | 87,717 | 0.75 | 0.75 | 0.99 | 1.88 | 29 | |||||||||||||||||||||||||||||||||||||||||||
2018 | 15.96 | 0.26 | 1.70 | 1.96 | (0.26 | ) | (0.43) | (0.69 | ) | 17.23 | 12.60 | 78,609 | 0.75 | 0.75 | 0.99 | 1.56 | 24 | |||||||||||||||||||||||||||||||||||||||||||
2017 | 14.74 | 0.27 | 1.61 | 1.88 | (0.27 | ) | (0.39) | (0.66 | ) | 15.96 | 13.12 | 61,804 | 0.75 | 0.75 | 0.98 | 1.80 | 22 | |||||||||||||||||||||||||||||||||||||||||||
2016 | 13.89 | 0.26 | 1.40 | 1.66 | (0.25 | ) | (0.56) | (0.81 | ) | 14.74 | 12.42 | 37,017 | 0.77(2) | 0.77(2) | 1.01(2) | 1.81 | 32 | |||||||||||||||||||||||||||||||||||||||||||
Tax-Managed International Managed Volatility Fund |
| |||||||||||||||||||||||||||||||||||||||||||||||||||||||||||
Class F |
| |||||||||||||||||||||||||||||||||||||||||||||||||||||||||||
2021@ | $ | 10.15 | $ | 0.11 | $ | 0.93 | $ | 1.04 | $ | (0.18 | ) | $ — | $ | (0.18 | ) | $ | 11.01 | 10.33 | % | $ | 330,130 | 1.11% | 1.11% | 1.40% | 1.99% | 40% | ||||||||||||||||||||||||||||||||||
2020 | 10.77 | 0.19 | (0.49 | ) | (0.30 | ) | (0.32 | ) | — | (0.32 | ) | 10.15 | (3.08 | ) | 315,250 | 1.11 | 1.11 | 1.41 | 1.84 | 79 | ||||||||||||||||||||||||||||||||||||||||
2019 | 11.38 | 0.27 | (0.61 | ) | (0.34 | ) | (0.27 | ) | — | (0.27 | ) | 10.77 | (2.76 | ) | 331,996 | 1.11 | 1.11 | 1.40 | 2.54 | 55 | ||||||||||||||||||||||||||||||||||||||||
2018 | 11.56 | 0.26 | (0.15 | ) | 0.11 | (0.29 | ) | — | (0.29 | ) | 11.38 | 0.93 | 355,027 | 1.11 | 1.11 | 1.40 | 2.21 | 54 | ||||||||||||||||||||||||||||||||||||||||||
2017(3) | 10.00 | 0.23 | 1.33 | 1.56 | — | — | — | 11.56 | 15.65 | 336,350 | 1.11 | 1.11 | 1.39 | 2.29 | 51 | |||||||||||||||||||||||||||||||||||||||||||||
Class Y |
| |||||||||||||||||||||||||||||||||||||||||||||||||||||||||||
2021@ | $ | 10.17 | $ | 0.12 | $ | 0.94 | $ | 1.06 | $ | (0.21 | ) | $ — | $ | (0.21 | ) | $ | 11.02 | 10.47 | % | $ | 58,212 | 0.86% | 0.86% | 1.15% | 2.26% | 40% | ||||||||||||||||||||||||||||||||||
2020 | 10.79 | 0.23 | (0.51 | ) | (0.28 | ) | (0.34 | ) | — | (0.34 | ) | 10.17 | (2.84 | ) | 53,255 | 0.86 | 0.86 | 1.16 | 2.27 | 79 | ||||||||||||||||||||||||||||||||||||||||
2019 | 11.40 | 0.32 | (0.63 | ) | (0.31 | ) | (0.30 | ) | — | (0.30 | ) | 10.79 | (2.47 | ) | 42,782 | 0.86 | 0.86 | 1.15 | 3.05 | 55 | ||||||||||||||||||||||||||||||||||||||||
2018 | 11.58 | 0.30 | (0.16 | ) | 0.14 | (0.32 | ) | — | (0.32 | ) | 11.40 | 1.16 | 25,862 | 0.86 | 0.86 | 1.15 | 2.60 | 54 | ||||||||||||||||||||||||||||||||||||||||||
2017(3) | 10.00 | 0.30 | 1.29 | 1.59 | (0.01 | ) | — | (0.01 | ) | 11.58 | 15.90 | 13,652 | 0.86 | 0.86 | 1.15 | 2.92 | 51 | |||||||||||||||||||||||||||||||||||||||||||
Real Estate Fund |
| |||||||||||||||||||||||||||||||||||||||||||||||||||||||||||
Class F |
| |||||||||||||||||||||||||||||||||||||||||||||||||||||||||||
2021@ | $ | 13.51 | $ | 0.10 | $ | 2.65 | $ | 2.75 | $ | (0.08 | ) | $ (0.67) | $ | (0.75 | ) | $ | 15.51 | 21.03 | % | $ | 83,885 | 1.14% | 1.14% | 1.23% | 1.42% | 43% | ||||||||||||||||||||||||||||||||||
2020 | 17.24 | 0.14 | (2.47 | ) | (2.33 | ) | (0.28 | ) | (1.12) | (1.40 | ) | 13.51 | (14.21 | ) | 74,099 | 1.14 | 1.14 | 1.23 | 0.95 | 123 | ||||||||||||||||||||||||||||||||||||||||
2019 | 16.06 | 0.23 | 2.31 | 2.54 | (0.21 | ) | (1.15) | (1.36 | ) | 17.24 | 17.35 | 104,562 | 1.14 | 1.14 | 1.24 | 1.47 | 71 | |||||||||||||||||||||||||||||||||||||||||||
2018 | 17.15 | 0.24 | 0.62 | 0.86 | (0.23 | ) | (1.72) | (1.95 | ) | 16.06 | 5.04 | 94,715 | 1.14 | 1.14 | 1.24 | 1.27 | 103 | |||||||||||||||||||||||||||||||||||||||||||
2017 | 19.37 | 0.03 | (0.21 | ) | (0.18 | ) | (0.41 | ) | (1.63) | (2.04 | ) | 17.15 | (0.57 | ) | 137,877 | 1.14 | 1.14 | 1.24 | 0.16 | 67 | ||||||||||||||||||||||||||||||||||||||||
2016 | 17.96 | 0.29 | 2.69 | 2.98 | (0.16 | ) | (1.41) | (1.57 | ) | 19.37 | 17.13 | 174,178 | 1.16(2) | 1.16(2) | 1.25(2) | 1.54 | 84 | |||||||||||||||||||||||||||||||||||||||||||
Class I |
| |||||||||||||||||||||||||||||||||||||||||||||||||||||||||||
2021@ | $ | 13.48 | $ | 0.09 | $ | 2.65 | $ | 2.74 | $ | (0.07 | ) | $ (0.67) | $ | (0.74 | ) | $ | 15.48 | 20.95 | % | $ | 374 | 1.36% | 1.36% | 1.48% | 1.21% | 43% | ||||||||||||||||||||||||||||||||||
2020 | 17.20 | 0.11 | (2.46 | ) | (2.35 | ) | (0.25 | ) | (1.12) | (1.37 | ) | 13.48 | (14.38 | ) | 307 | 1.36 | 1.36 | 1.48 | 0.79 | 123 | ||||||||||||||||||||||||||||||||||||||||
2019 | 16.03 | 0.21 | 2.29 | 2.50 | (0.18 | ) | (1.15) | (1.33 | ) | 17.20 | 17.06 | 420 | 1.36 | 1.36 | 1.48 | 1.33 | 71 | |||||||||||||||||||||||||||||||||||||||||||
2018 | 17.13 | 0.24 | 0.58 | 0.82 | (0.20 | ) | (1.72) | (1.92 | ) | 16.03 | 4.80 | 455 | 1.36 | 1.36 | 1.49 | 1.31 | 103 | |||||||||||||||||||||||||||||||||||||||||||
2017 | 19.35 | (0.02 | ) | (0.20 | ) | (0.22 | ) | (0.37 | ) | (1.63) | (2.00 | ) | 17.13 | (0.80 | ) | 529 | 1.36 | 1.36 | 1.49 | (0.09) | 67 | |||||||||||||||||||||||||||||||||||||||
2016 | 17.94 | 0.25 | 2.69 | 2.94 | (0.12 | ) | (1.41) | (1.53 | ) | 19.35 | 16.90 | 651 | 1.38(2) | 1.38(2) | 1.50(2) | 1.33 | 84 | |||||||||||||||||||||||||||||||||||||||||||
Class Y |
| |||||||||||||||||||||||||||||||||||||||||||||||||||||||||||
2021@ | $ | 13.51 | $ | 0.12 | $ | 2.66 | $ | 2.78 | $ | (0.10 | ) | $ (0.67) | $ | (0.77 | ) | $ | 15.52 | 21.24 | % | $ | 17,721 | 0.89% | 0.89% | 0.98% | 1.65% | 43% | ||||||||||||||||||||||||||||||||||
2020 | 17.25 | 0.21 | (2.51 | ) | (2.30 | ) | (0.32 | ) | (1.12) | (1.44 | ) | 13.51 | (14.04 | ) | 17,279 | 0.89 | 0.89 | 0.98 | 1.40 | 123 | ||||||||||||||||||||||||||||||||||||||||
2019 | 16.07 | 0.27 | 2.31 | 2.58 | (0.25 | ) | (1.15) | (1.40 | ) | 17.25 | 17.65 | 36,910 | 0.89 | 0.89 | 0.98 | 1.72 | 71 | |||||||||||||||||||||||||||||||||||||||||||
2018 | 17.15 | 0.32 | 0.58 | 0.90 | (0.26 | ) | (1.72) | (1.98 | ) | 16.07 | 5.30 | 36,197 | 0.89 | 0.89 | 0.99 | 1.76 | 103 | |||||||||||||||||||||||||||||||||||||||||||
2017 | 19.38 | 0.07 | (0.21 | ) | (0.14 | ) | (0.46 | ) | (1.63) | (2.09 | ) | 17.15 | (0.37 | ) | 36,892 | 0.89 | 0.89 | 0.99 | 0.41 | 67 | ||||||||||||||||||||||||||||||||||||||||
2016 | 17.96 | 0.32 | 2.72 | 3.04 | (0.21 | ) | (1.41) | (1.62 | ) | 19.38 | 17.49 | 36,591 | 0.92(2) | 0.92(2) | 1.01(2) | 1.64 | 84 | |||||||||||||||||||||||||||||||||||||||||||
| † | Returns and portfolio turnover rates are for the period indicated and have not been annualized. Returns do not reflect the deduction of taxes the shareholder would pay on fund distributions or redemption of fund shares. |
| @ | For the six-month period ended March 31, 2021. All ratios for the period have been annualized. |
| (1) | Per share net investment income and net realized and unrealized gains (losses) calculated using average shares. |
| (2) | The expense ratio includes proxy expenses outside of the cap. |
| (3) | Commenced operations on October 17, 2016. All ratios for the period have been annualized. |
Amounts designated as “—“are either $0 or have been rounded to $0.
The accompanying notes are an integral part of the financial statements.
| SEI Institutional Managed Trust / Semi-Annual Report / March 31, 2021 | 307 |
FINANCIAL HIGHLIGHTS
For the period ended March 31, 2021 (Unaudited) and the years or periods ended September 30, (unless otherwise For a share outstanding throughout each period
| Net Asset Value, Beginning of Period | Net Investment (Loss)(1) | Net Realized and Unrealized Gains (Losses) on Investments(1) | Total from | Dividends from Net Investment Income | Distributions from Net Realized Capital Gains | Total Dividends and Distributions | Net Asset Value, End of Period | Total Return† | Net Assets End of Period | Ratio of Net Expenses to Average Net Assets | Ratio of Expenses to Average Net Assets (Excluding Fees Paid Indirectly and Including Waivers) | Ratio of Expenses Net Assets | Ratio of Net Investment Income (Loss) to Average Net Assets | Portfolio Turnover Rate† | ||||||||||||||||||||||||||||||||||||||||||||||
Core Fixed Income Fund |
| |||||||||||||||||||||||||||||||||||||||||||||||||||||||||||
Class F | ||||||||||||||||||||||||||||||||||||||||||||||||||||||||||||
2021@ | $ | 12.15 | $ | 0.08 | $ | (0.33 | ) | $ | (0.25 | ) | $ | (0.09 | ) | $ | (0.46 | ) | $ | (0.55 | ) | $ | 11.35 | (2.17 | )% | $ | 3,970,082 | 0.66% | 0.66% | 0.72% | 1.41% | 188% | ||||||||||||||||||||||||||||||
2020 | 11.65 | 0.23 | 0.65 | 0.88 | (0.27 | ) | (0.11 | ) | (0.38 | ) | 12.15 | 7.75 | 3,859,455 | 0.66 | 0.66 | 0.73 | 1.98 | 357 | ||||||||||||||||||||||||||||||||||||||||||
2019 | 10.86 | 0.31 | 0.81 | 1.12 | (0.33 | ) | — | (0.33 | ) | 11.65 | 10.45 | 3,755,355 | 0.66 | 0.66 | 0.73 | 2.78 | 387 | |||||||||||||||||||||||||||||||||||||||||||
2018 | 11.32 | 0.29 | (0.46 | ) | (0.17 | ) | (0.29 | ) | — | (0.29 | ) | 10.86 | (1.53 | ) | 3,600,785 | 0.67 | 0.67 | 0.77 | 2.55 | 384 | ||||||||||||||||||||||||||||||||||||||||
2017 | 11.71 | 0.25 | (0.15 | ) | 0.10 | (0.26 | ) | (0.23 | ) | (0.49 | ) | 11.32 | 1.02 | 1,855,251 | 0.67 | 0.67 | 0.80 | 2.19 | 386 | |||||||||||||||||||||||||||||||||||||||||
2016 | 11.47 | 0.26 | 0.37 | 0.63 | (0.27 | ) | (0.12 | ) | (0.39 | ) | 11.71 | 5.64 | 2,070,113 | 0.69(2) | 0.69(2) | 0.88(2) | 2.29 | 336 | ||||||||||||||||||||||||||||||||||||||||||
Class I | ||||||||||||||||||||||||||||||||||||||||||||||||||||||||||||
2021@ | $ | 12.14 | $ | 0.07 | $ | (0.34 | ) | $ | (0.27 | ) | $ | (0.08 | ) | $ | (0.46 | ) | $ | (0.54 | ) | $ | 11.33 | (2.36 | )% | $ | 5,148 | 0.88% | 0.88% | 0.97% | 1.19% | 188% | ||||||||||||||||||||||||||||||
2020 | 11.64 | 0.21 | 0.66 | 0.87 | (0.26 | ) | (0.11 | ) | (0.37 | ) | 12.14 | 7.59 | 4,698 | 0.88 | 0.88 | 0.98 | 1.76 | 357 | ||||||||||||||||||||||||||||||||||||||||||
2019 | 10.86 | 0.29 | 0.79 | 1.08 | (0.30 | ) | — | (0.30 | ) | 11.64 | 10.11 | 5,085 | 0.88 | 0.88 | 0.98 | 2.57 | 387 | |||||||||||||||||||||||||||||||||||||||||||
2018 | 11.31 | 0.26 | (0.45 | ) | (0.19 | ) | (0.26 | ) | — | (0.26 | ) | 10.86 | (1.66 | ) | 6,255 | 0.89 | 0.89 | 1.02 | 2.29 | 384 | ||||||||||||||||||||||||||||||||||||||||
2017 | 11.70 | 0.22 | (0.14 | ) | 0.08 | (0.24 | ) | (0.23 | ) | (0.47 | ) | 11.31 | 0.80 | 5,975 | 0.89 | 0.89 | 1.05 | 1.97 | 386 | |||||||||||||||||||||||||||||||||||||||||
2016 | 11.46 | 0.24 | 0.36 | 0.60 | (0.24 | ) | (0.12 | ) | (0.36 | ) | 11.70 | 5.41 | 9,313 | 0.91(2) | 0.91(2) | 1.13(2) | 2.07 | 336 | ||||||||||||||||||||||||||||||||||||||||||
Class Y | ||||||||||||||||||||||||||||||||||||||||||||||||||||||||||||
2021@ | $ | 12.16 | $ | 0.10 | $ | (0.33 | ) | $ | (0.23 | ) | $ | (0.11 | ) | $ | (0.46 | ) | $ | (0.57 | ) | $ | 11.36 | (2.04 | )% | $ | 499,473 | 0.41% | 0.41% | 0.47% | 1.66% | 188% | ||||||||||||||||||||||||||||||
2020 | 11.66 | 0.26 | 0.65 | 0.91 | (0.30 | ) | (0.11 | ) | (0.41 | ) | 12.16 | 7.98 | 455,054 | 0.41 | 0.41 | 0.48 | 2.22 | 357 | ||||||||||||||||||||||||||||||||||||||||||
2019 | 10.87 | 0.34 | 0.80 | 1.14 | (0.35 | ) | — | (0.35 | ) | 11.66 | 10.71 | 439,460 | 0.41 | 0.41 | 0.48 | 3.03 | 387 | |||||||||||||||||||||||||||||||||||||||||||
2018 | 11.32 | 0.31 | (0.44 | ) | (0.13 | ) | (0.32 | ) | — | (0.32 | ) | 10.87 | (1.20 | ) | 392,931 | 0.42 | 0.42 | 0.52 | 2.80 | 384 | ||||||||||||||||||||||||||||||||||||||||
2017 | 11.71 | 0.28 | (0.15 | ) | 0.13 | (0.29 | ) | (0.23 | ) | (0.52 | ) | 11.32 | 1.27 | 225,440 | 0.42 | 0.42 | 0.55 | 2.46 | 386 | |||||||||||||||||||||||||||||||||||||||||
2016 | 11.47 | 0.29 | 0.37 | 0.66 | (0.30 | ) | (0.12 | ) | (0.42 | ) | 11.71 | 5.90 | 70,916 | 0.44(2) | 0.44(2) | 0.63(2) | 2.55 | 336 | ||||||||||||||||||||||||||||||||||||||||||
High Yield Bond Fund |
| |||||||||||||||||||||||||||||||||||||||||||||||||||||||||||
Class F | ||||||||||||||||||||||||||||||||||||||||||||||||||||||||||||
2021@ | $ | 6.46 | $ | 0.21 | $ | 0.56 | $ | 0.77 | $ | (0.19 | ) | $ | (0.13 | ) | $ | (0.32 | ) | $ | 6.91 | 12.02 | % | $ | 1,363,557 | 0.89% | 0.89% | 0.98% | 6.26% | 40% | ||||||||||||||||||||||||||||||||
2020 | 6.91 | 0.36 | (0.39 | ) | (0.03 | ) | (0.38 | ) | (0.04 | ) | (0.42 | ) | 6.46 | (0.33 | ) | 1,257,617 | 0.89 | 0.89 | 0.98 | 5.54 | 88 | |||||||||||||||||||||||||||||||||||||||
2019 | 7.13 | 0.39 | (0.11 | ) | 0.28 | (0.39 | ) | (0.11 | ) | (0.50 | ) | 6.91 | 4.24 | 1,444,565 | 0.89 | 0.89 | 0.98 | 5.68 | 69 | |||||||||||||||||||||||||||||||||||||||||
2018 | 7.33 | 0.38 | (0.11 | ) | 0.27 | (0.38 | ) | (0.09 | ) | (0.47 | ) | 7.13 | 3.88 | 1,484,436 | 0.89 | 0.89 | 0.98 | 5.38 | 58 | |||||||||||||||||||||||||||||||||||||||||
2017 | 7.18 | 0.42 | 0.26 | 0.68 | (0.41 | ) | (0.12 | ) | (0.53 | ) | 7.33 | 9.75 | 1,469,480 | 0.90(3) | 0.90(3) | 1.01(3) | 5.83 | 62 | ||||||||||||||||||||||||||||||||||||||||||
2016 | 7.01 | 0.42 | 0.26 | 0.68 | (0.42 | ) | (0.09 | ) | (0.51 | ) | 7.18 | 10.44 | 1,737,907 | 0.91(2) | 0.91(2) | 1.10(2) | 6.16 | 56 | ||||||||||||||||||||||||||||||||||||||||||
Class I | ||||||||||||||||||||||||||||||||||||||||||||||||||||||||||||
2021@ | $ | 6.22 | $ | 0.20 | $ | 0.54 | $ | 0.74 | $ | (0.17 | ) | $ | (0.13 | ) | $ | (0.30 | ) | $ | 6.66 | 12.09 | % | $ | 498 | 1.11% | 1.11% | 1.23% | 6.04% | 40% | ||||||||||||||||||||||||||||||||
2020 | 6.65 | 0.33 | (0.37 | ) | (0.04 | ) | (0.35 | ) | (0.04 | ) | (0.39 | ) | 6.22 | (0.46 | ) | 409 | 1.11 | 1.11 | 1.23 | 4.99 | 88 | |||||||||||||||||||||||||||||||||||||||
2019 | 6.88 | 0.36 | (0.12 | ) | 0.24 | (0.36 | ) | (0.11 | ) | (0.47 | ) | 6.65 | 3.79 | 11,926 | 1.12 | 1.12 | 1.23 | 5.51 | 69 | |||||||||||||||||||||||||||||||||||||||||
2018 | 7.08 | 0.35 | (0.11 | ) | 0.24 | (0.35 | ) | (0.09 | ) | (0.44 | ) | 6.88 | 3.61 | 545 | 1.10 | 1.10 | 1.22 | 5.08 | 58 | |||||||||||||||||||||||||||||||||||||||||
2017 | 6.93 | 0.39 | 0.26 | 0.65 | (0.38 | ) | (0.12 | ) | (0.50 | ) | 7.08 | 9.65 | 1,147 | 1.12(3) | 1.12(3) | 1.25(3) | 5.58 | 62 | ||||||||||||||||||||||||||||||||||||||||||
2016 | 6.78 | 0.40 | 0.23 | 0.63 | (0.39 | ) | (0.09 | ) | (0.48 | ) | 6.93 | 9.95 | 1,078 | 1.14(2) | 1.14(2) | 1.36(2) | 6.01 | 56 | ||||||||||||||||||||||||||||||||||||||||||
Class Y | ||||||||||||||||||||||||||||||||||||||||||||||||||||||||||||
2021@ | $ | 6.46 | $ | 0.22 | $ | 0.56 | $ | 0.78 | $ | (0.20 | ) | $ | (0.13 | ) | $ | (0.33 | ) | $ | 6.91 | 12.16 | % | $ | 187,103 | 0.64% | 0.64% | 0.73% | 6.51% | 40% | ||||||||||||||||||||||||||||||||
2020 | 6.91 | 0.38 | (0.39 | ) | (0.01 | ) | (0.40 | ) | (0.04 | ) | (0.44 | ) | 6.46 | (0.07 | ) | 174,334 | 0.64 | 0.64 | 0.73 | 5.78 | 88 | |||||||||||||||||||||||||||||||||||||||
2019 | 7.13 | 0.41 | (0.11 | ) | 0.30 | (0.41 | ) | (0.11 | ) | (0.52 | ) | 6.91 | 4.51 | 185,383 | 0.64 | 0.64 | 0.73 | 5.92 | 69 | |||||||||||||||||||||||||||||||||||||||||
2018 | 7.32 | 0.40 | (0.11 | ) | 0.29 | (0.39 | ) | (0.09 | ) | (0.48 | ) | 7.13 | 4.27 | 177,644 | 0.64 | 0.64 | 0.73 | 5.62 | 58 | |||||||||||||||||||||||||||||||||||||||||
2017 | 7.18 | 0.44 | 0.25 | 0.69 | (0.43 | ) | (0.12 | ) | (0.55 | ) | 7.32 | 9.87 | 187,087 | 0.65(3) | 0.65(3) | 0.76(3) | 6.08 | 62 | ||||||||||||||||||||||||||||||||||||||||||
2016 | 7.01 | 0.44 | 0.26 | 0.70 | (0.44 | ) | (0.09 | ) | (0.53 | ) | 7.18 | 10.72 | 199,015 | 0.66(2) | 0.66(2) | 0.85(2) | 6.42 | 56 | ||||||||||||||||||||||||||||||||||||||||||
| † | Returns and portfolio turnover rates are for the period indicated and have not been annualized. Returns do not reflect the deduction of taxes the shareholder would pay on fund distributions or redemption of fund shares. |
| @ | For the six-month period ended March 31, 2021. All ratios for the period have been annualized. |
| (1) | Per share net investment income and net realized and unrealized gains (losses) calculated using average shares. |
| (2) | The expense ratio includes proxy expenses outside of the cap. |
| (3) | The expense ratio includes litigation expenses outside the cap. |
Amounts designated as “—” are either $0 or have been rounded to $0.
The accompanying notes are an integral part of the financial statements.
| 308 | SEI Institutional Managed Trust / Semi-Annual Report / March 31, 2021 |
FINANCIAL HIGHLIGHTS/CONSOLIDATED FINANCIAL HIGHLIGHTS
For the period ended March 31, 2021 (Unaudited) and the years or periods ended September 30, (unless otherwise For a share outstanding throughout each period
| Net Asset Value, Beginning of Period | Net Investment (Loss)(1) | Net Realized and Unrealized Gains (Losses) on Investments(1) | Total from | Dividends from Net Investment Income | Distributions from Net Realized Capital Gains | Total Dividends and Distributions | Net Asset Value, End of Period | Total Return† | Net Assets End of | Ratio of Net Expenses to Average Net Assets | Ratio of Expenses to Average Net Assets (Excluding Fees Paid Indirectly and Including Waivers) | Ratio of Expenses Net Assets | Ratio of Net Investment Income (Loss) to Average Net Assets | Portfolio Turnover Rate† | ||||||||||||||||||||||||||||||||||||||||||||||
Conservative Income Fund |
| |||||||||||||||||||||||||||||||||||||||||||||||||||||||||||
Class F | ||||||||||||||||||||||||||||||||||||||||||||||||||||||||||||
2021@ | $ | 10.00 | $ | — | $ — | $ | — | $ —* | $ | — | $ —* | $ | 10.00 | 0.00 | % | $ | 313,134 | 0.21 | %(2) | 0.21 | %(2) | 0.58 | % | —% | –% | |||||||||||||||||||||||||||||||||||
2020 | 10.00 | 0.09 | 0.01 | 0.10 | (0.10 | ) | — | (0.10 | ) | 10.00 | 0.96 | 319,030 | 0.30 | 0.30 | 0.59 | 0.90 | – | |||||||||||||||||||||||||||||||||||||||||||
2019 | 10.00 | 0.23 | — | 0.23 | (0.23 | ) | — | (0.23 | ) | 10.00 | 2.32 | 229,166 | 0.30 | 0.30 | 0.59 | 2.29 | – | |||||||||||||||||||||||||||||||||||||||||||
2018 | 10.00 | 0.16 | — | 0.16 | (0.16 | ) | — | (0.16 | ) | 10.00 | 1.60 | 209,822 | 0.30 | 0.30 | 0.59 | 1.60 | – | |||||||||||||||||||||||||||||||||||||||||||
2017 | 10.00 | 0.08 | — | 0.08 | (0.08 | ) | — | (0.08 | ) | 10.00 | 0.83 | 190,440 | 0.30 | 0.30 | 0.58 | 0.84 | – | |||||||||||||||||||||||||||||||||||||||||||
2016(3) | 10.00 | 0.02 | — | 0.02 | (0.02 | ) | — | (0.02 | ) | 10.00 | 0.16 | 75,011 | 0.30 | (4) | 0.30 | (4) | 0.61 | (4) | 0.37 | – | ||||||||||||||||||||||||||||||||||||||||
Class Y | ||||||||||||||||||||||||||||||||||||||||||||||||||||||||||||
2021@ | $ | 10.00 | $ | 0.01 | $ — | $ | 0.01 | $ —* | $ | — | $ —* | $ | 10.01 | 0.10 | % | $ | 17,932 | 0.11 | %(2) | 0.11 | %(2) | 0.33 | % | 0.10 | % | –% | ||||||||||||||||||||||||||||||||||
2020 | 10.00 | 0.11 | — | 0.11 | (0.11 | ) | — | (0.11 | ) | 10.00 | 1.06 | 22,256 | 0.20 | 0.20 | 0.34 | 1.05 | – | |||||||||||||||||||||||||||||||||||||||||||
2019 | 10.00 | 0.24 | — | 0.24 | (0.24 | ) | — | (0.24 | ) | 10.00 | 2.42 | 23,125 | 0.20 | 0.20 | 0.34 | 2.38 | – | |||||||||||||||||||||||||||||||||||||||||||
2018 | 10.00 | 0.17 | — | 0.17 | (0.17 | ) | — | (0.17 | ) | 10.00 | 1.70 | 27,498 | 0.20 | 0.20 | 0.34 | 1.71 | – | |||||||||||||||||||||||||||||||||||||||||||
2017 | 10.00 | 0.10 | (0.01 | ) | 0.09 | (0.09 | ) | — | (0.09 | ) | 10.00 | 0.94 | 19,984 | 0.20 | 0.20 | 0.33 | 0.96 | – | ||||||||||||||||||||||||||||||||||||||||||
2016(3) | 10.00 | 0.02 | — | 0.02 | (0.02 | ) | — | (0.02 | ) | 10.00 | 0.20 | 16,796 | 0.20 | (4) | 0.20 | (4) | 0.36 | (4) | 0.47 | – | ||||||||||||||||||||||||||||||||||||||||
Tax-Free Conservative Income Fund |
| |||||||||||||||||||||||||||||||||||||||||||||||||||||||||||
Class F | ||||||||||||||||||||||||||||||||||||||||||||||||||||||||||||
2021@ | $ | 10.00 | $ | — | $ — | $ | — | $ —* | $ | — | $ —* | $ | 10.00 | 0.00 | % | $ | 199,913 | 0.15 | %(2) | 0.15 | %(2) | 0.59 | % | 0.01 | % | –% | ||||||||||||||||||||||||||||||||||
2020 | 10.00 | 0.06 | — | 0.06 | (0.06 | ) | — | (0.06 | ) | 10.00 | 0.64 | 212,828 | 0.30 | 0.30 | 0.59 | 0.62 | – | |||||||||||||||||||||||||||||||||||||||||||
2019 | 10.00 | 0.14 | — | 0.14 | (0.14 | ) | — | (0.14 | ) | 10.00 | 1.37 | 162,368 | 0.30 | 0.30 | 0.59 | 1.36 | – | |||||||||||||||||||||||||||||||||||||||||||
2018 | 10.00 | 0.10 | — | 0.10 | (0.10 | ) | — | (0.10 | ) | 10.00 | 0.99 | 162,338 | 0.30 | 0.30 | 0.59 | 0.99 | – | |||||||||||||||||||||||||||||||||||||||||||
2017 | 10.00 | 0.05 | — | 0.05 | (0.05 | ) | — | (0.05 | ) | 10.00 | 0.51 | 163,219 | 0.30 | 0.30 | 0.59 | 0.51 | – | |||||||||||||||||||||||||||||||||||||||||||
2016(3) | 10.00 | 0.01 | — | 0.01 | (0.01 | ) | — | (0.01 | ) | 10.00 | 0.12 | 30,946 | 0.30 | (4) | 0.30 | (4) | 0.60 | (4) | 0.27 | – | ||||||||||||||||||||||||||||||||||||||||
Class Y | ||||||||||||||||||||||||||||||||||||||||||||||||||||||||||||
2021@ | $ | 10.00 | $ | 0.01 | $ — | $ | 0.01 | $ —* | $ | — | $ —* | $ | 10.01 | 0.10 | % | $ | 7,425 | 0.05 | %(2) | 0.05 | %(2) | 0.34 | % | 0.11 | % | –% | ||||||||||||||||||||||||||||||||||
2020 | 10.00 | 0.09 | (0.02 | ) | 0.07 | (0.07 | ) | — | (0.07 | ) | 10.00 | 0.73 | 5,770 | 0.20 | 0.20 | 0.34 | 0.87 | – | ||||||||||||||||||||||||||||||||||||||||||
2019 | 10.00 | 0.15 | — | 0.15 | (0.15 | ) | — | (0.15 | ) | 10.00 | 1.47 | 16,727 | 0.20 | 0.20 | 0.34 | 1.45 | – | |||||||||||||||||||||||||||||||||||||||||||
2018 | 10.00 | 0.11 | — | 0.11 | (0.11 | ) | — | (0.11 | ) | 10.00 | 1.09 | 11,126 | 0.20 | 0.20 | 0.34 | 1.13 | – | |||||||||||||||||||||||||||||||||||||||||||
2017 | 10.00 | 0.06 | — | 0.06 | (0.06 | ) | — | (0.06 | ) | 10.00 | 0.60 | 3,782 | 0.20 | 0.20 | 0.34 | 0.63 | – | |||||||||||||||||||||||||||||||||||||||||||
2016(3) | 10.00 | 0.02 | — | 0.02 | (0.02 | ) | — | (0.02 | ) | 10.00 | 0.16 | 13,922 | 0.20 | (4) | 0.20 | (4) | 0.35 | (4) | 0.37 | – | ||||||||||||||||||||||||||||||||||||||||
| † | Returns and portfolio turnover rates are for the period indicated and have not been annualized. Returns do not reflect the deduction of taxes the shareholder would pay on fund distributions or redemption of fund shares. |
| @ | For the six-month period ended March 31, 2021. All ratios for the period have been annualized. |
| * | Amount represents less than $0.005 per share. |
| (1) | Per share net investment income and net realized and unrealized gains (losses) calculated using average shares. |
| (2) | The Distributor and/or Administrator have voluntarily agreed to waive and reduce its fee and/or reimburse certain expenses of the Fund in order to limit the one-day net income yield of the Fund to not less than 0.01% of the Fund’s average daily net assets of the shares class. |
| (3) | Commenced operations on April 22, 2016. All ratios for the period have been annualized. |
| (4) | The expense ratio includes proxy expenses outside of the cap. |
Amounts designated as “—“are either $0 or have been rounded to $0.
The accompanying notes are an integral part of the financial statements.
| SEI Institutional Managed Trust / Semi-Annual Report / March 31, 2021 | 309 |
FINANCIAL HIGHLIGHTS/CONSOLIDATED FINANCIAL HIGHLIGHTS
For the period ended March 31, 2021 (Unaudited) and the years or periods ended September 30, (unless otherwise For a share outstanding throughout each period
| Net Asset Value, Beginning of Period | Net Investment Income (Loss)(1) | Net Realized and Unrealized Gains (Losses) on Investments(1) | Total from | Dividends from Net Investment Income | Distributions from Net Realized Capital Gains | Total Dividends and Distributions | Net Asset Value, End of Period | Total Return† | Net Assets End of Period ($ Thousands) | Ratio of Net Expenses to Average Net Assets | Ratio of Expenses to Average Net Assets (Excluding Fees Paid Indirectly and Including Waivers) | Ratio of Expenses Net Assets | Ratio of Net Investment Income (Loss) to Average Net Assets | Portfolio Turnover Rate† | ||||||||||||||||||||||||||||||||||||||||||||||
Real Return Fund |
| |||||||||||||||||||||||||||||||||||||||||||||||||||||||||||
Class F |
| |||||||||||||||||||||||||||||||||||||||||||||||||||||||||||
2021@ | $ | 10.40 | $ | 0.07 | $ | 0.17 | $ | 0.24 | $ (0.04) | $ — | $ | (0.04 | ) | $ | 10.60 | 2.29 | % | $ | 233,755 | 0.45% | 0.45% | 0.70% | 1.32% | 16 | % | |||||||||||||||||||||||||||||||||||
2020 | 9.96 | 0.07 | 0.42 | 0.49 | (0.05) | — | (0.05 | ) | 10.40 | 4.98 | 238,849 | 0.45 | 0.45 | 0.70 | 0.72 | 41 | ||||||||||||||||||||||||||||||||||||||||||||
2019 | 9.91 | 0.16 | 0.15 | 0.31 | (0.26) | — | (0.26 | ) | 9.96 | 3.14 | 227,413 | 0.45 | 0.45 | 0.70 | 1.59 | 34 | ||||||||||||||||||||||||||||||||||||||||||||
2018 | 10.03 | 0.25 | (0.23) | 0.02 | (0.14) | — | (0.14 | ) | 9.91 | 0.24 | 238,889 | 0.45 | 0.45 | 0.71 | 2.51 | 35 | ||||||||||||||||||||||||||||||||||||||||||||
2017 | 10.14 | 0.11 | (0.11) | — | (0.11)(2) | — | (0.11 | ) | 10.03 | 0.03 | 252,333 | 0.45 | 0.45 | 0.73 | 1.07 | 49 | ||||||||||||||||||||||||||||||||||||||||||||
2016 | 9.91 | — | 0.23 | 0.23 | — | — | — | 10.14 | 2.32 | 291,380 | 0.47(3) | 0.47(3) | 0.82(3) | (0.02) | 38 | |||||||||||||||||||||||||||||||||||||||||||||
Class Y |
| |||||||||||||||||||||||||||||||||||||||||||||||||||||||||||
2021@ | $ | 10.44 | $ | 0.07 | $ | 0.19 | $ | 0.26 | $ (0.05) | $ — | $ | (0.05 | ) | $ | 10.65 | 2.45 | % | $ | 20,404 | 0.35% | 0.35% | 0.45% | 1.41% | 16 | % | |||||||||||||||||||||||||||||||||||
2020 | 10.00 | 0.08 | 0.42 | 0.50 | (0.06) | — | (0.06 | ) | 10.44 | 5.01 | 21,395 | 0.35 | 0.35 | 0.45 | 0.84 | 41 | ||||||||||||||||||||||||||||||||||||||||||||
2019 | 9.94 | 0.18 | 0.14 | 0.32 | (0.26) | — | (0.26 | ) | 10.00 | 3.31 | 24,322 | 0.35 | 0.35 | 0.46 | 1.80 | 34 | ||||||||||||||||||||||||||||||||||||||||||||
2018 | 10.06 | 0.26 | (0.23) | 0.03 | (0.15) | — | (0.15 | ) | 9.94 | 0.29 | 16,691 | 0.35 | 0.35 | 0.46 | 2.60 | 35 | ||||||||||||||||||||||||||||||||||||||||||||
2017 | 10.17 | 0.12 | (0.11) | 0.01 | (0.12)(2) | — | (0.12 | ) | 10.06 | 0.11 | 18,205 | 0.35 | 0.35 | 0.48 | 1.15 | 49 | ||||||||||||||||||||||||||||||||||||||||||||
2016 | 9.92 | 0.01 | 0.24 | 0.25 | — | — | — | 10.17 | 2.52 | 28,835 | 0.37(3) | 0.37(3) | 0.57(3) | 0.07 | 38 | |||||||||||||||||||||||||||||||||||||||||||||
Dynamic Asset Allocation Fund |
| |||||||||||||||||||||||||||||||||||||||||||||||||||||||||||
Class F |
| |||||||||||||||||||||||||||||||||||||||||||||||||||||||||||
2021@ | $ | 14.98 | $ | 0.06 | $ | 2.96 | $ | 3.02 | $ (0.89) | $ (0.27) | $ | (1.16 | ) | $ | 16.84 | 20.81 | % | $ | 789,702 | 0.75% | 0.75% | 1.18% | 0.72% | 4 | % | |||||||||||||||||||||||||||||||||||
2020 | 13.23 | 0.14 | 1.84 | 1.98 | (0.23) | — | (0.23 | ) | 14.98 | 15.07 | 723,775 | 0.75 | 0.75 | 1.18 | 1.06 | 16 | ||||||||||||||||||||||||||||||||||||||||||||
2019 | 13.22 | 0.17 | 0.07 | 0.24 | (0.23) | — | (0.23 | ) | 13.23 | 2.14 | 725,857 | 0.75 | 0.75 | 1.18 | 1.31 | 5 | ||||||||||||||||||||||||||||||||||||||||||||
2018 | 12.10 | 0.17 | 1.15 | 1.32 | (0.18) | (0.02) | (0.20 | ) | 13.22 | 10.95 | 800,036 | 0.75 | 0.75 | 1.19 | 1.30 | 11 | ||||||||||||||||||||||||||||||||||||||||||||
2017 | 10.18 | 0.15 | 1.87 | 2.02 | (0.10) | — | (0.10 | ) | 12.10 | 19.95 | 696,463 | 0.75 | 0.75 | 1.18 | 1.30 | 3 | ||||||||||||||||||||||||||||||||||||||||||||
2016 | 9.09 | 0.14 | 0.99 | 1.13 | (0.04) | — | (0.04 | ) | 10.18 | 12.39 | 488,778 | 0.77(3) | 0.77(3) | 1.21(3) | 1.42 | 7 | ||||||||||||||||||||||||||||||||||||||||||||
Class Y |
| |||||||||||||||||||||||||||||||||||||||||||||||||||||||||||
2021@ | $ | 15.01 | $ | 0.08 | $ | 2.95 | $ | 3.03 | $ (0.92) | $ (0.27) | $ | (1.19 | ) | $ | 16.85 | 20.92 | % | $ | 47,021 | 0.50% | 0.50% | 0.93% | 1.03% | 4 | % | |||||||||||||||||||||||||||||||||||
2020 | 13.26 | 0.08 | 1.93 | 2.01 | (0.26) | — | (0.26 | ) | 15.01 | 15.31 | 41,757 | 0.50 | 0.50 | 0.93 | 0.59 | 16 | ||||||||||||||||||||||||||||||||||||||||||||
2019 | 13.25 | 0.19 | 0.08 | 0.27 | (0.26) | — | (0.26 | ) | 13.26 | 2.43 | 70,477 | 0.50 | 0.50 | 0.93 | 1.51 | 5 | ||||||||||||||||||||||||||||||||||||||||||||
2018 | 12.12 | 0.19 | 1.17 | 1.36 | (0.21) | (0.02) | (0.23 | ) | 13.25 | 11.26 | 78,280 | 0.50 | 0.50 | 0.93 | 1.51 | 11 | ||||||||||||||||||||||||||||||||||||||||||||
2017 | 10.20 | 0.17 | 1.87 | 2.04 | (0.12) | — | (0.12 | ) | 12.12 | 20.17 | 73,159 | 0.50 | 0.50 | 0.93 | 1.55 | 3 | ||||||||||||||||||||||||||||||||||||||||||||
2016 | 9.09 | 0.16 | 0.99 | 1.15 | (0.04) | — | (0.04 | ) | 10.20 | 12.67 | 48,523 | 0.52(3) | 0.52(3) | 0.96(3) | 1.66 | 7 | ||||||||||||||||||||||||||||||||||||||||||||
| † | Returns and portfolio turnover rates are for the period indicated and have not been annualized. Returns do not reflect the deduction of taxes the shareholder would pay on fund distributions or redemption of fund shares. |
| @ | For the six-month period ended March 31, 2021. All ratios for the period have been annualized. |
| (1) | Per share net investment income and net realized and unrealized gains (losses) calculated using average shares. |
| (2) | Includes return of capital of $0.01. |
| (3) | The expense ratio includes proxy expenses outside of the cap. |
Amounts designated as “—“are either $0 or have been rounded to $0.
The accompanying notes are an integral part of the financial statements.
| 310 | SEI Institutional Managed Trust / Semi-Annual Report / March 31, 2021 |
FINANCIAL HIGHLIGHTS/CONSOLIDATED FINANCIAL HIGHLIGHTS
For the period ended March 31, 2021 (Unaudited) and the years or periods ended September 30, (unless otherwise For a share outstanding throughout each period
| Net Asset Value, Beginning of Period | Net Investment Income (Loss)(1) | Net Realized and Unrealized Gains (Losses) on Investments(1) | Total from | Dividends from Net Investment Income | Distributions from Net Realized Capital Gains | Total Dividends and Distributions | Net Asset Value, End of Period | Total Return† | Net Assets End of Period ($ Thousands) | Ratio of Net Expenses to Average Net Assets | Ratio of Expenses to Average Net Assets (Excluding Fees Paid Indirectly and Including Waivers) | Ratio of Expenses Net Assets | Ratio of Net Investment Income (Loss) to Average Net Assets | Portfolio Turnover Rate† | ||||||||||||||||||||||||||||||||||||||||
Multi-Strategy Alternative Fund |
| |||||||||||||||||||||||||||||||||||||||||||||||||||||
Class F |
| |||||||||||||||||||||||||||||||||||||||||||||||||||||
2021@ | $ | 9.98 | $ | 0.03 | $ | 0.80 | $ | 0.83 | $ (0.05) | $ | (0.24 | ) | $ | (0.29 | ) | $ | 10.52 | 8.37 | % | $ | 464,439 | 2.03%(2) | 2.03%(2) | 2.78%(2) | 0.59% | 260% | ||||||||||||||||||||||||||||
2020 | 9.61 | 0.08 | 0.39 | 0.47 | (0.10) | — | (0.10 | ) | 9.98 | 4.90 | 463,468 | 1.72(3) | 1.72(3) | 2.54(3) | 0.84 | 527 | ||||||||||||||||||||||||||||||||||||||
2019 | 10.10 | 0.14 | (0.18) | (0.04) | (0.16) | (0.29) | (0.45 | ) | 9.61 | (0.18 | ) | 472,129 | 1.44(4) | 1.44(4) | 2.38(4) | 1.24 | 315 | |||||||||||||||||||||||||||||||||||||
2018 | 10.11 | 0.07 | 0.14 | 0.21 | (0.02) | (0.20) | (0.22 | ) | 10.10 | 2.11 | 509,559 | 1.41(5) | 1.41(5) | 2.41(5) | 0.72 | 266(6) | ||||||||||||||||||||||||||||||||||||||
2017 | 9.67 | (0.01 | ) | 0.46 | 0.45 | (0.01) | — | (0.01 | ) | 10.11 | 4.62 | 508,046 | 1.41(7) | 1.41(7) | 2.44(7) | (0.12) | 215(6) | |||||||||||||||||||||||||||||||||||||
2016 | 9.60 | 0.09 | 0.23 | 0.32 | (0.15) | (0.10) | (0.25 | ) | 9.67 | 3.40 | 573,752 | 1.12(8)(9) | 1.12(8)(9) | 2.39(8)(9) | 0.95 | 149 | ||||||||||||||||||||||||||||||||||||||
Class Y |
| |||||||||||||||||||||||||||||||||||||||||||||||||||||
2021@ | $ | 9.98 | $ | 0.04 | $ | 0.82 | $ | 0.86 | $ (0.08) | $ (0.24) | $ | (0.32 | ) | $ | 10.52 | 8.63 | % | $ | 8,653 | 1.78%(10) | 1.78%(10) | 2.53%(10) | 0.83% | 260% | ||||||||||||||||||||||||||||||
2020 | 9.61 | 0.11 | 0.38 | 0.49 | (0.12) | — | (0.12 | ) | 9.98 | 5.16 | 8,464 | 1.47(11) | 1.47(11) | 2.29(11) | 1.12 | 527 | ||||||||||||||||||||||||||||||||||||||
2019 | 10.11 | 0.13 | (0.15) | (0.02) | (0.19) | (0.29) | (0.48 | ) | 9.61 | (0.01 | ) | 9,821 | 1.20(12) | 1.20(12) | 2.15(12) | 1.11 | 315 | |||||||||||||||||||||||||||||||||||||
2018 | 10.12 | 0.10 | 0.14 | 0.24 | (0.05) | (0.20) | (0.25 | ) | 10.11 | 2.36 | 5,951 | 1.16(13) | 1.16(13) | 2.16(13) | 0.95 | 266(6) | ||||||||||||||||||||||||||||||||||||||
2017 | 9.68 | 0.03 | 0.44 | 0.47 | (0.03) | — | (0.03 | ) | 10.12 | 4.79 | 4,841 | 1.14(14) | 1.14(14) | 2.16(14) | 0.34 | 215(6) | ||||||||||||||||||||||||||||||||||||||
2016 | 9.60 | — | 0.36 | 0.36 | (0.18) | (0.10) | (0.28 | ) | 9.68 | 3.77 | 1,352 | 0.96(8)(15) | 0.96(8)(15) | 2.18(8)(15) | — | 149 | ||||||||||||||||||||||||||||||||||||||
Multi-Asset Accumulation Fund |
| |||||||||||||||||||||||||||||||||||||||||||||||||||||
Class F |
| |||||||||||||||||||||||||||||||||||||||||||||||||||||
2021@ | $ | 9.55 | $ | (0.04 | ) | $ | 0.64 | $ | 0.60 | $ — | $ (0.51) | $ | (0.51 | ) | $ | 9.64 | 6.34 | % | $ | 2,415,501 | 1.17% | 1.17% | 1.30% | (0.91)% | 14% | |||||||||||||||||||||||||||||
2020 | 10.63 | (0.02 | ) | 0.18 | 0.16 | (0.13) | (1.11) | (1.24 | ) | 9.55 | 1.51 | 2,420,060 | 1.17 | 1.17 | 1.30 | (0.23) | 61 | |||||||||||||||||||||||||||||||||||||
2019 | 9.81 | 0.08 | 1.03 | 1.11 | (0.27) | (0.02) | (0.29 | ) | 10.63 | 11.94 | 2,659,785 | 1.17 | 1.17 | 1.30 | 0.80 | 63 | ||||||||||||||||||||||||||||||||||||||
2018 | 10.01 | 0.06 | 0.24 | 0.30 | — | (0.50) | (0.50 | ) | 9.81 | 2.93 | 2,655,399 | 1.17 | 1.17 | 1.29 | 0.64 | 11 | ||||||||||||||||||||||||||||||||||||||
2017 | 10.31 | (0.01 | ) | 0.39 | 0.38 | (0.07) | (0.61) | (0.68 | ) | 10.01 | 4.33 | 2,468,847 | 1.17 | 1.17 | 1.31 | (0.12) | 28 | |||||||||||||||||||||||||||||||||||||
2016 | 9.53 | (0.05 | ) | 1.10 | 1.05 | — | (0.27) | (0.27 | ) | 10.31 | 11.36 | 2,076,240 | 1.19(8) | 1.19(8) | 1.35(8) | (0.50) | 55 | |||||||||||||||||||||||||||||||||||||
Class Y |
| |||||||||||||||||||||||||||||||||||||||||||||||||||||
2021@ | $ | 9.62 | $ | (0.04 | ) | $ | 0.65 | $ | 0.61 | $ — | $ (0.51) | $ | (0.51 | ) | $ | 9.72 | 6.40 | % | $ | 196,184 | 0.92% | 0.92% | 1.05% | (0.75)% | 14% | |||||||||||||||||||||||||||||
2020 | 10.70 | (0.03 | ) | 0.21 | 0.18 | (0.15) | (1.11) | (1.26 | ) | 9.62 | 1.74 | 190,469 | 0.92 | 0.92 | 1.05 | (0.26) | 61 | |||||||||||||||||||||||||||||||||||||
2019 | 9.88 | 0.07 | 1.06 | 1.13 | (0.29) | (0.02) | (0.31 | ) | 10.70 | 12.16 | 220,654 | 0.92 | 0.92 | 1.05 | 0.66 | 63 | ||||||||||||||||||||||||||||||||||||||
2018 | 10.06 | 0.05 | 0.27 | 0.32 | — | (0.50) | (0.50 | ) | 9.88 | 3.13 | 228,037 | 0.92 | 0.92 | 1.04 | 0.52 | 11 | ||||||||||||||||||||||||||||||||||||||
2017 | 10.36 | — | 0.41 | 0.41 | (0.10) | (0.61) | (0.71 | ) | 10.06 | 4.55 | 237,569 | 0.92 | 0.92 | 1.06 | (0.03) | 28 | ||||||||||||||||||||||||||||||||||||||
2016 | 9.55 | (0.03 | ) | 1.11 | 1.08 | — | (0.27) | (0.27 | ) | 10.36 | 11.66 | 202,865 | 0.94(8) | 0.94(8) | 1.10(8) | (0.33) | 55 | |||||||||||||||||||||||||||||||||||||
| † | Returns and portfolio turnover rates are for the period indicated and have not been annualized. Returns do not reflect the deduction of taxes the shareholder would pay on fund distributions or redemption of fund shares. |
| @ | For the six-month period ended March 31, 2021. All ratios for the period have been annualized. |
| (1) | Per share net investment income and net realized and unrealized gains (losses) calculated using average shares. |
| (2) | The expense ratio includes dividend and interest expense, and other expenses outside the cap. Had this expense been excluded the ratios would have been 1.35%, 1.35%, and 2.10%. |
| (3) | The expense ratio includes dividend and interest expense, and other expenses outside the cap. Had this expense been excluded the ratios would have been 1.27%, 1.27%, and 2.10% |
| (4) | The expense ratio includes dividend and interest expense, and other expenses outside the cap. Had this expense been excluded the ratios would have been 1.20%, 1.20%, and 2.14%. |
| (5) | The expense ratio includes dividend and interest expense, and other expenses outside the cap. Had this expense been excluded the ratios would have been 1.09%, 1.09%, and 2.09%. |
| (6) | The portfolio turnover rate in 2017 and 2018 have been changed from 37% to 215% and 373% to 266%, respectively. |
| (7) | The expense ratio includes dividend and interest expense, and other expenses outside the cap. Had this expense been excluded the ratios would have been 1.06%, 1.06%, and 2.09%. |
| (8) | The expense ratio includes proxy expenses outside of the cap. |
| (9) | The expense ratio includes dividend and interest expense, and other expenses outside the cap. Had this expense been excluded the ratios would have been 0.85%, 0.85%, and 2.12%. |
| (10) | The expense ratio includes dividend and interest expense, and other expenses outside the cap. Had this expense been excluded the ratios would have been 1.10%, 1.10%, and 1.85%. |
| (11) | The expense ratio includes dividend and interest expense, and other expenses outside the cap. Had this expense been excluded the ratios would have been 1.02%, 1.02% and 1.85%. |
| (12) | The expense ratio includes dividend and interest expense, and other expenses outside the cap. Had this expense been excluded the ratios would have been 0.96%, 0.96%, and 1.91%. |
| (13) | The expense ratio includes dividend and interest expense, and other expenses outside the cap. Had this expense been excluded the ratios would have been 0.84%, 0.84% and 1.84%. |
| (14) | The expense ratio includes dividend and interest expense, and other expenses outside the cap. Had this expense been excluded the ratios would have been 0.79%, 0.79%, and 1.98%. |
| (15) | The expense ratio includes dividend and interest expense, and other expenses outside the cap. Had this expense been excluded the ratios would have been 0.69%, 0.69%, and 1.91%. |
Amounts designated as “—“are either $0 or have been rounded to $0.
The accompanying notes are an integral part of the financial statements.
| SEI Institutional Managed Trust / Semi-Annual Report / March 31, 2021 | 311 |
FINANCIAL HIGHLIGHTS/CONSOLIDATED FINANCIAL HIGHLIGHTS
For the period ended March 31, 2021 (Unaudited) and the years or periods ended September 30, (unless otherwise For a share outstanding throughout each period
| Net Asset Value, Beginning of Period | Net Investment (Loss)(1) | Net Realized and Unrealized Gains (Losses) on Investments(1) | Total from | Dividends from Net Investment Income | Distributions from Net Realized Capital Gains | Total Dividends and Distributions | Net Asset Value, End of Period | Total Return† | Net Assets End of | Ratio of Net Expenses to Average Net Assets | Ratio of Expenses to Average Net Assets (Excluding Fees Paid Indirectly and Including Waivers) | Ratio of Expenses Net Assets | Ratio of Net Investment Income (Loss) to Average Net Assets | Portfolio Turnover Rate† | ||||||||||||||||||||||||||||||||||||||||||||||
Multi-Asset Income Fund |
| |||||||||||||||||||||||||||||||||||||||||||||||||||||||||||
Class F | ||||||||||||||||||||||||||||||||||||||||||||||||||||||||||||
2021@ | $ | 10.85 | $ | 0.20 | $ 0.37 | $ | 0.57 | $ | (0.17 | ) | $ | — | $ | (0.17 | ) | $ | 11.25 | 5.28 | % | $ | 753,206 | 0.80 | % | 0.80 | % | 1.20 | % | 3.56 | % | 74 | % | |||||||||||||||||||||||||||||
2020 | 11.07 | 0.40 | (0.20 | ) | 0.20 | (0.39 | ) | (0.03 | ) | (0.42 | ) | 10.85 | 1.86 | 770,599 | 0.80 | 0.80 | 1.21 | 3.69 | 137 | |||||||||||||||||||||||||||||||||||||||||
2019 | 10.61 | 0.45 | 0.41 | 0.86 | (0.40 | ) | — | (0.40 | ) | 11.07 | 8.29 | 816,056 | 0.80 | 0.80 | 1.20 | 4.15 | 76 | |||||||||||||||||||||||||||||||||||||||||||
2018 | 10.88 | 0.40 | (0.24 | ) | 0.16 | (0.34 | )(2) | (0.09 | ) | (0.43 | ) | 10.61 | 1.56 | 815,020 | 0.80 | 0.80 | 1.21 | 3.78 | 119 | |||||||||||||||||||||||||||||||||||||||||
2017 | 10.56 | 0.48 | 0.24 | 0.72 | (0.40 | ) | — | (0.40 | ) | 10.88 | 6.90 | 813,767 | 0.80 | 0.80 | 1.21 | 4.47 | 77 | |||||||||||||||||||||||||||||||||||||||||||
2016 | 10.46 | 0.50 | 0.23 | 0.73 | (0.53 | ) | (0.10 | ) | (0.63 | ) | 10.56 | 7.38 | 643,477 | 0.82 | (3)(4) | 0.82 | (3)(4) | 1.23 | (3)(4) | 4.85 | 72 | |||||||||||||||||||||||||||||||||||||||
Class Y | ||||||||||||||||||||||||||||||||||||||||||||||||||||||||||||
2021@ | $ | 10.85 | $ | 0.20 | $ 0.38 | $ | 0.58 | $ | (0.18 | ) | $ | — | $ | (0.18 | ) | $ | 11.25 | 5.34 | % | $ | 177,106 | 0.70 | % | 0.70 | % | 0.95 | % | 3.65 | % | 74 | % | |||||||||||||||||||||||||||||
2020 | 11.07 | 0.41 | (0.20 | ) | 0.21 | (0.40 | ) | (0.03 | ) | (0.43 | ) | 10.85 | 1.96 | 161,672 | 0.70 | 0.70 | 0.96 | 3.79 | 137 | |||||||||||||||||||||||||||||||||||||||||
2019 | 10.61 | 0.46 | 0.41 | 0.87 | (0.41 | ) | — | (0.41 | ) | 11.07 | 8.39 | 161,776 | 0.70 | 0.70 | 0.95 | 4.25 | 76 | |||||||||||||||||||||||||||||||||||||||||||
2018 | 10.88 | 0.41 | (0.24 | ) | 0.17 | (0.35 | )(2) | (0.09 | ) | (0.44 | ) | 10.61 | 1.66 | 175,431 | 0.70 | 0.70 | 0.96 | 3.88 | 119 | |||||||||||||||||||||||||||||||||||||||||
2017 | 10.56 | 0.49 | 0.24 | 0.73 | (0.41 | ) | — | (0.41 | ) | 10.88 | 7.00 | 166,980 | 0.70 | 0.70 | 0.96 | 4.60 | 77 | |||||||||||||||||||||||||||||||||||||||||||
2016 | 10.46 | 0.52 | 0.22 | 0.74 | (0.54 | ) | (0.10 | ) | (0.64 | ) | 10.56 | 7.49 | 97,943 | 0.72 | (3)(5) | 0.72 | (3)(5) | 0.98 | (3)(5) | 5.08 | 72 | |||||||||||||||||||||||||||||||||||||||
Multi-Asset Inflation Managed Fund |
| |||||||||||||||||||||||||||||||||||||||||||||||||||||||||||
Class F | ||||||||||||||||||||||||||||||||||||||||||||||||||||||||||||
2021@ | $ | 7.88 | $ | 0.07 | $ 0.54 | $ | 0.61 | $ | (0.12 | ) | $ | — | $ | (0.12 | ) | $ | 8.37 | 7.76 | % | $ | 765,762 | 1.17 | %(6) | 1.17 | %(6) | 1.41 | %(6) | 1.68 | % | 33 | % | |||||||||||||||||||||||||||||
2020 | 8.28 | 0.10 | (0.38 | ) | (0.28 | ) | (0.12 | ) | — | (0.12 | ) | 7.88 | (3.41 | ) | 735,962 | 1.38 | (6) | 1.38 | (6) | 1.62 | (6) | 1.28 | 63 | |||||||||||||||||||||||||||||||||||||
2019 | 8.49 | 0.14 | (0.20 | ) | (0.06 | ) | (0.15 | ) | — | (0.15 | ) | 8.28 | (0.62 | ) | 798,451 | 1.52 | (6) | 1.52 | (6) | 1.76 | (6) | 1.68 | 30 | |||||||||||||||||||||||||||||||||||||
2018 | 8.52 | 0.17 | (0.08 | ) | 0.09 | (0.12 | ) | — | (0.12 | ) | 8.49 | 1.04 | 860,457 | 1.52 | (6) | 1.52 | (6) | 1.76 | (6) | 1.97 | 32 | |||||||||||||||||||||||||||||||||||||||
2017 | 8.80 | 0.09 | (0.27 | ) | (0.18 | ) | (0.10 | ) | — | (0.10 | ) | 8.52 | (2.07 | ) | 821,191 | 1.33 | (6) | 1.33 | (6) | 1.56 | (6) | 1.01 | 68 | |||||||||||||||||||||||||||||||||||||
2016 | 8.75 | 0.05 | 0.04 | 0.09 | (0.04 | ) | — | (0.04 | ) | 8.80 | 1.06 | 990,931 | 1.23 | (3)(6) | 1.23 | (3)(6) | 1.46 | (3)(6) | 0.59 | 73 | ||||||||||||||||||||||||||||||||||||||||
Class Y | ||||||||||||||||||||||||||||||||||||||||||||||||||||||||||||
2021@ | $ | 7.89 | $ | 0.08 | $ 0.54 | $ | 0.62 | $ | (0.14 | ) | $ | — | $ | (0.14 | ) | $ | 8.37 | 7.90 | % | $ | 45,113 | 0.92 | %(7) | 0.92 | %(7) | 1.16 | %(7) | 1.92 | % | 33 | % | |||||||||||||||||||||||||||||
2020 | 8.29 | 0.11 | (0.37 | ) | (0.26 | ) | (0.14 | ) | — | (0.14 | ) | 7.89 | (3.17 | ) | 45,173 | 1.13 | (8) | 1.13 | (8) | 1.37 | (8) | 1.35 | 63 | |||||||||||||||||||||||||||||||||||||
2019 | 8.50 | 0.13 | (0.17 | ) | (0.04 | ) | (0.17 | ) | — | (0.17 | ) | 8.29 | (0.35 | ) | 55,857 | 1.27 | (7) | 1.27 | (7) | 1.51 | (7) | 1.56 | 30 | |||||||||||||||||||||||||||||||||||||
2018 | 8.53 | 0.16 | (0.05 | ) | 0.11 | (0.14 | ) | — | (0.14 | ) | 8.50 | 1.29 | 63,546 | 1.27 | (7) | 1.27 | (7) | 1.50 | (7) | 1.90 | 32 | |||||||||||||||||||||||||||||||||||||||
2017 | 8.82 | 0.10 | (0.26 | ) | (0.16 | ) | (0.13 | ) | — | (0.13 | ) | 8.53 | (1.90 | ) | 68,506 | 1.08 | (7) | 1.08 | (7) | 1.32 | (7) | 1.13 | 68 | |||||||||||||||||||||||||||||||||||||
2016 | 8.77 | 0.07 | 0.04 | 0.11 | (0.06 | ) | — | (0.06 | ) | 8.82 | 1.30 | 89,261 | 0.98 | (3) | 0.98 | (3) | 1.21 | (3) | 0.79 | 73 | ||||||||||||||||||||||||||||||||||||||||
| † | Returns and portfolio turnover rates are for the period indicated and have not been annualized. Returns do not reflect the deduction of taxes the shareholder would pay on fund distributions or redemption of fund shares. |
| @ | For the six-month period ended March 31, 2021. All ratios for the period have been annualized. |
| (1) | Per share net investment income and net realized and unrealized gains (losses) calculated using average shares. |
| (2) | Includes return of capital of $0.02. |
| (3) | The expense ratio includes proxy expenses outside of the cap. |
| (4) | The expense ratio includes interest expense. Had this expense been excluded the ratios would have been 0.80%, 0.80%, and 1.21%. |
| (5) | The expense ratio includes interest expense. Had this expense been excluded the ratios would have been 0.70%, 0.70%, and 0.96%. |
| (6) | The expense ratio includes dividend and interest expense, and other expenses outside the cap. Had this expense been excluded the ratios would have been 0.90%, 0.90%, and 1.14%. |
| (7) | The expense ratio includes dividend and interest expense, and other expenses outside the cap. Had this expense been excluded the ratios would have been 0.65%, 0.65%, and 0.89% |
| (8) | The expense ratio includes dividend and interest expense, and other expenses outside the cap. Had this expense been excluded the ratios would have been 0.66%, 0.66%, and 0.90% |
Amounts designated as “—“are either $0 or have been rounded to $0.
The accompanying notes are an integral part of the financial statements.
| 312 | SEI Institutional Managed Trust / Semi-Annual Report / March 31, 2021 |
FINANCIAL HIGHLIGHTS/CONSOLIDATED FINANCIAL HIGHLIGHTS
For the period ended March 31, 2021 (Unaudited) and the years or periods ended September 30, (unless otherwise For a share outstanding throughout each period
| Net Asset Value, Beginning of Period | Net Investment Income (Loss)(1) | Net Realized and Unrealized Gains (Losses) on Investments(1) | Total from | Dividends from Net Investment Income | Distributions from Net Realized Capital Gains | Total Dividends and Distributions | Net Asset Value, End of Period | Total Return† | Net Assets End of Period ($ Thousands) | Ratio of Net Expenses to Average Net Assets | Ratio of Expenses to Average Net Assets (Excluding Fees Paid Indirectly and Including Waivers) | Ratio of Expenses to Average Net Assets (Excluding Fees Paid Indirectly and Waivers) | Ratio of Net Investment Income (Loss) to Average Net Assets | Portfolio Turnover Rate† | ||||||||||||||||||||||||||||||||||||||||||||||
Multi-Asset Capital Stability Fund |
| |||||||||||||||||||||||||||||||||||||||||||||||||||||||||||
Class F | ||||||||||||||||||||||||||||||||||||||||||||||||||||||||||||
2021@ | $ | 10.28 | $ | (0.01 | ) | $ | 0.25 | $ | 0.24 | $ | (0.02) | $ | (0.09 | ) | $ | (0.11 | ) | $ | 10.41 | 2.29 | % | $ | 707,572 | 0.62% | 0.62% | 0.98% | (0.24 | )% | 55 | % | ||||||||||||||||||||||||||||||
2020 | 10.39 | 0.04 | 0.22 | 0.26 | (0.18) | (0.19 | ) | (0.37 | ) | 10.28 | 2.55 | 732,425 | 0.62 | 0.62 | 0.98 | 0.37 | 124 | |||||||||||||||||||||||||||||||||||||||||||
2019 | 10.05 | 0.15 | 0.24 | 0.39 | (0.05) | — | (0.05 | ) | 10.39 | 3.94 | 684,753 | 0.62 | 0.62 | 0.98 | 1.45 | 128 | ||||||||||||||||||||||||||||||||||||||||||||
2018 | 10.25 | 0.09 | 0.09 | 0.18 | (0.20) | (0.18 | ) | (0.38 | ) | 10.05 | 1.75 | 682,982 | 0.62 | 0.62 | 0.98 | 0.88 | 228 | |||||||||||||||||||||||||||||||||||||||||||
2017 | 10.14 | — | 0.18 | 0.18 | (0.02) | (0.05 | ) | (0.07 | ) | 10.25 | 1.78 | 694,247 | 0.62 | 0.62 | 0.98 | 0.02 | 159 | |||||||||||||||||||||||||||||||||||||||||||
2016 | 10.11 | (0.01 | ) | 0.16 | 0.15 | — | (0.12 | ) | (0.12 | ) | 10.14 | 1.47 | 658,185 | 0.64(2) | 0.64(2) | 1.00(2) | (0.07 | ) | 234 | |||||||||||||||||||||||||||||||||||||||||
Class Y | ||||||||||||||||||||||||||||||||||||||||||||||||||||||||||||
2021@ | $ | 10.30 | $ | (0.01 | ) | $ | 0.26 | $ | 0.25 | $ | (0.03) | $ | (0.09 | ) | $ | (0.12 | ) | $ | 10.43 | 2.39 | % | $ | 41,354 | 0.52% | 0.52% | 0.73% | (0.15 | )% | 55 | % | ||||||||||||||||||||||||||||||
2020 | 10.41 | 0.05 | 0.22 | 0.27 | (0.19) | (0.19 | ) | (0.38 | ) | 10.30 | 2.64 | 48,307 | 0.52 | 0.52 | 0.73 | 0.48 | 124 | |||||||||||||||||||||||||||||||||||||||||||
2019 | 10.07 | 0.16 | 0.24 | 0.40 | (0.06) | — | (0.06 | ) | 10.41 | 4.04 | 47,957 | 0.52 | 0.52 | 0.73 | 1.55 | 128 | ||||||||||||||||||||||||||||||||||||||||||||
2018 | 10.27 | 0.10 | 0.09 | 0.19 | (0.21) | (0.18 | ) | (0.39 | ) | 10.07 | 1.84 | 44,681 | 0.52 | 0.52 | 0.73 | 0.97 | 228 | |||||||||||||||||||||||||||||||||||||||||||
2017 | 10.16 | 0.01 | 0.17 | 0.18 | (0.02) | (0.05 | ) | (0.07 | ) | 10.27 | 1.88 | 50,346 | 0.52 | 0.52 | 0.73 | 0.11 | 159 | |||||||||||||||||||||||||||||||||||||||||||
2016 | 10.12 | — | 0.16 | 0.16 | — | (0.12 | ) | (0.12 | ) | 10.16 | 1.57 | 51,496 | 0.54(2) | 0.54(2) | 0.75(2) | 0.02 | 234 | |||||||||||||||||||||||||||||||||||||||||||
| † | Returns and portfolio turnover rates are for the period indicated and have not been annualized. Returns do not reflect the deduction of taxes the shareholder would pay on fund distributions or redemption of fund shares. |
| @ | For the six-month period ended March 31, 2021. All ratios for the period have been annualized. |
| (1) | Per share net investment income and net realized and unrealized gains (losses) calculated using average shares. |
| (2) | The expense ratio includes proxy expenses outside of the cap. |
Amounts designated as “—“ are either $0 or have been rounded to $0.
The accompanying notes are an integral part of the financial statements.
| SEI Institutional Managed Trust / Semi-Annual Report / March 31, 2021 | 313 |
Notes to Financial Statements/Consolidated Notes to Financial Statements
March 31, 2021 (Unaudited)
1. ORGANIZATION
SEI Institutional Managed Trust (the “Trust”) is organized as a Massachusetts business trust under a Declaration of Trust dated October 20, 1986.
The Trust is registered under the Investment Company Act of 1940, as amended, as an open-end investment company with 27 funds: Large Cap, Large Cap Value, Large Cap Growth, Large Cap Index, Tax-Managed Large Cap, S&P 500 Index, Small Cap, Small Cap Value, Small Cap Growth, Tax-Managed Small/Mid Cap, Mid-Cap, U.S. Managed Volatility, Global Managed Volatility, Tax-Managed Managed Volatility, Tax-Managed International Managed Volatility, Real Estate, Core Fixed Income, High Yield Bond, Conservative Income, Tax-Free Conservative Income, Real Return, Dynamic Asset Allocation, Multi-Strategy Alternative, Multi-Asset Accumulation, Multi-Asset Income, Multi-Asset Inflation Managed, and Multi-Asset Capital Stability (each a “Fund,” collectively the “Funds”) each of which are diversified Funds, with the exception of the Multi-Asset Accumulation and Multi-Asset Inflation Managed Funds.
The Dynamic Commodity Strategy Subsidiary, Ltd., the Accumulation Commodity Strategy Subsidiary, Ltd. and the Inflation Commodity Strategy Subsidiary, Ltd. are wholly-owned subsidiaries of the Dynamic Asset Allocation, Multi-Asset Accumulation and Multi-Asset Inflation Managed Funds, respectively, (each a “Subsidiary”, collectively the “Subsidiaries”). Each Subsidiary is organized under the laws of the Cayman Islands as an exempt limited company. Information regarding the Dynamic Asset Allocation, Multi-Asset Accumulation and Multi-Asset Inflation Managed Funds and their respective subsidiaries have been consolidated in the Consolidated Schedules of Investments, Consolidated Statements of Assets and Liabilities, Consolidated Statements of Operations, Consolidated Statements of Changes in Net Assets and Consolidated Statement of Cash Flows of the Multi-Asset Inflation Managed Fund.
The Trust is registered to offer: Class F shares of the Funds and Class Y shares of the Funds except for the Large Cap Index and S&P 500 Index Funds; Class I shares of the Large Cap, Large Cap Value, Large Cap Growth, S&P 500 Index, Small Cap, Small Cap Value, Small Cap Growth, Mid-Cap, U.S. Managed Volatility, Global Managed Volatility, Real Estate, Core Fixed Income, High Yield Bond and Real Return Funds. The assets of each Fund are segregated, and a shareholder’s interest is limited to the Fund in which shares are held. Each Fund’s prospectus provides a description of its investment goal and its principal investment strategies and risks.
2. SIGNIFICANT ACCOUNTING POLICIES
The following are significant accounting policies, which are consistently followed in the preparation of its financial statements by the Funds. The Funds are investment companies that apply the accounting and reporting guidance issued in Topic 946 by the U.S. Financial Accounting Standards Board (“FASB”).
Use of Estimates — The preparation of financial statements, in conformity with accounting principles generally accepted in the United States of America (“U.S. GAAP”), requires management to make estimates and assumptions that affect the reported amounts of assets and liabilities and disclosure of contingent assets and liabilities as of the date of the financial statements and the reported amounts of increases and decreases in net assets from operations during the reporting period. Actual results could differ from those estimates.
Security Valuation — When valuing portfolio securities, a Fund values securities listed on a securities exchange, market or automated quotation system for which quotations are readily available (other than securities traded on National Association of Securities Dealers Automated Quotations (NASDAQ) or as otherwise noted below) at the last quoted sale price on an exchange or market (foreign or domestic) on which the securities are traded, or, if there is no such reported sale, at the most recent quoted bid price. A Fund values securities traded on NASDAQ at the NASDAQ Official Closing Price. If available, debt securities, swaps (which are not centrally cleared), bank loans or collateralized debt obligations (including collateralized loan obligations), such as those held by the Funds, are priced based upon valuations provided by independent, third-party pricing agents. Such values generally reflect the last reported sales price if the security is actively traded. The third-party pricing agents may also value debt securities at an evaluated bid price by employing methodologies that utilize actual market transactions, broker-supplied valuations or other methodologies designed to identify the market value for such securities. Redeemable securities issued by open-end investment companies are valued at the investment company’s applicable NAV per share, with the exception of exchange-traded funds, which are priced as equity securities. These open-end investment companies’ shares are offered in separate prospectuses, each of which describes the process by which the applicable investment company’s NAV is determined. The prices of foreign securities are reported in local currency and converted to U.S. dollars using currency exchange rates. If a security’s price cannot be obtained, as noted above, a Fund will
| 314 | SEI Institutional Managed Trust / Semi-Annual Report / March 31, 2021 |
value the securities using a bid price from at least one independent broker.
On the first day a new debt security purchase is recorded, if a price is not available from a third-party pricing agent or an independent broker, the security may be valued at its purchase price. Each day thereafter, the debt security will be valued according to the Funds’ Fair Value Pricing Policies and Procedures (Fair Value Procedures) until an independent source can be secured. Debt securities held by a Fund with remaining maturities of 60 days or less will be valued by the amortized cost method, which involves valuing a security at its cost on the date of purchase and thereafter (absent unusual circumstances) assuming a constant amortization to maturity of any discount or premium, regardless of the impact of fluctuations in general market rates of interest on the value of the instrument. While this method provides certainty in valuation, it may result in periods during which value, as determined by this method, is higher or lower than the price a Fund would receive if it sold the instrument, and the value of securities in the Fund can be expected to vary inversely with changes in prevailing interest rates. Should existing credit, liquidity or interest rate conditions in the relevant markets and issuer-specific circumstances suggest that amortized cost does not approximate fair value, then the amortized cost method may not be used.
Options are valued at the last quoted sales price. If there is no such reported sale on the valuation date, long positions are valued at the most recent bid price, and short positions are valued at the most recent ask price.
Futures and swaps cleared through a central clearing house (centrally cleared swaps) are valued at the settlement price established each day by the board of exchange on which they are traded. The daily settlement prices for financial futures and centrally cleared swaps are provided by an independent source. On days when there is excessive volume, market volatility or the future or centrally cleared swap does not end trading by the time a fund calculates its NAV, the settlement price may not be available at the time at which a fund calculates its NAV. On such days, the best available price (which is typically the last sales price) may be used to value a fund’s futures or centrally cleared swaps position.
Foreign currency forward contracts are valued at the current day’s interpolated foreign exchange rate, as calculated using forward rates provided by an independent source.
Prices for most securities held by a Fund are provided daily by third-party independent pricing agents. SIMC or a Sub-Adviser, as applicable, reasonably believes that prices provided by independent pricing agents
are reliable. However, there can be no assurance that such pricing service’s prices will be reliable. SIMC or a Sub-Adviser, as applicable, will continuously monitor the reliability of prices obtained from any pricing service and shall promptly notify the Funds’ administrator if it believes that a particular pricing service is no longer a reliable source of prices. The Funds’ administrator, in turn, will notify the Fair Value Pricing Committee (the Committee) if it receives such notification from SIMC or a Sub-Adviser, as applicable, or if the Funds’ administrator reasonably believes that a particular pricing service is no longer a reliable source for prices.
The Funds’ Fair Value Procedures provide that any change in a primary pricing agent or a pricing methodology requires prior approval by the Board or its designated committee. However, when the change would not materially affect the valuation of a Fund’s net assets or involve a material departure in pricing methodology from that of the Fund’s existing pricing agent or pricing methodology, ratification may be obtained at the next regularly scheduled meeting of the Board.
Securities for which market prices are not “readily available” are determined to be unreliable or cannot be valued using the methodologies described above are valued in accordance with Fair Value Procedures established by the Board. The Funds’ Fair Value Procedures are implemented through the Committee designated by the Board. The Committee is currently composed of one member of the Board, as well as representatives from SIMC and its affiliates. Some of the more common reasons that may necessitate that a security be valued using Fair Value Procedures include: (i) the security’s trading has been halted or suspended, (ii) the security has been delisted from a national exchange, (iii) the security’s primary trading market is temporarily closed at a time when under normal conditions it would be open, or (iv) the security’s primary pricing source is not able or willing to provide a price. When a security is valued in accordance with the Fair Value Procedures, the Committee will determine the value after taking into consideration relevant information reasonably available to the Committee. Examples of factors the Committee may consider include: (i) the facts giving rise to the need to fair value, (ii) the last trade price, (iii) the performance of the market or the issuer’s industry, (iv) the liquidity of the security, (v) the size of the holding in a Fund, or (vi) any other appropriate information.
The determination of a security’s fair value price often involves the consideration of a number of subjective factors and is therefore subject to the unavoidable risk that the value assigned to a security may be higher or
| SEI Institutional Managed Trust / Semi-Annual Report / March 31, 2021 | 315 |
Notes to Financial Statements/Consolidated Notes to Financial Statements (Continued)
March 31, 2021 (Unaudited)
lower than the security’s value would be if a reliable market quotation for the security was readily available.
Certain of the Funds use a use a third-party fair valuation vendor. The vendor provides a fair value for foreign securities held by the Fund based on certain factors and methodologies (involving, generally, tracking valuation correlations between the U.S. market and each non-U.S. security). Values from the fair value vendor are applied in the event that there is a movement in the U.S. market that exceeds a specific threshold that has been established by the Committee. The Committee has also established a “confidence interval” which is used to determine the level of historical correlation between the value of a specific foreign security and movements in the U.S. market before a particular security will be fair valued when the threshold is exceeded. In the event that the threshold established by the Committee is exceeded on a specific day, the Global Managed Volatility Fund will value the non-U.S. securities in its portfolio that exceed the applicable “confidence interval” based upon the adjusted prices provided by the fair valuation vendor.
For securities that principally trade on a foreign market or exchange, a significant gap in time can exist between the time of a particular security’s last trade and the time at which a Fund calculates its NAV. The closing prices of such securities may no longer reflect their market value at the time a Fund calculates NAV if an event that could materially affect the value of those securities (a Significant Event), including substantial fluctuations in domestic or foreign markets or occurrences not tied directly to the securities markets, such as natural disasters, armed conflicts or significant governmental actions, has occurred between the time of the security’s last close and the time that the Fund calculates NAV. A Fund may invest in securities that are primarily listed on foreign exchanges that trade on weekends or other days when the Fund does not price its shares. As a result, the NAV of the Fund’s shares may change on days when shareholders will not be able to purchase or redeem Fund shares.
A Significant Event may relate to a single issuer or to an entire market sector. If SIMC or a Sub-Adviser becomes aware of a Significant Event that has occurred with respect to a security or group of securities after the closing of the exchange or market on which the security or securities principally trade, but before the time at which a Fund calculate NAV, it may request that a Committee meeting be called. In addition, with respect to certain securities, the Funds’ administrator performs price comparisons and price movement review (among other processes), to monitor the pricing data supplied by various sources. Any identified discrepancies are
researched and subject to the procedures described above.
In accordance with U.S. GAAP, fair value is defined as the price that a Fund would receive upon selling an investment in an orderly transaction to an independent buyer in the principal or most advantageous market of the investment. A three-tier hierarchy has been established to maximize the use of observable and minimize the use of unobservable inputs and to establish classification of fair value measurements for disclosure purposes. Inputs refer broadly to the assumptions that market participants would use in pricing an asset. Inputs may be observable or unobservable. Observable inputs are inputs that reflect the assumptions market participants would use in pricing the asset or liability based on market data obtained from sources independent of the reporting entity. Unobservable inputs are inputs that reflect the reporting entity’s own assumptions about the assumptions market participants would use in pricing the asset or liability based on the best information available in the circumstances.
The three-tier hierarchy of inputs is summarized in the three broad Levels listed below:
Level 1 — quoted prices in active markets for identical investments
Level 2 — other significant observable inputs (including quoted prices for similar investments, interest rates, prepayment speeds, credit risks, etc.)
Level 3 — significant unobservable inputs (including the Fund’s own assumptions in determining the fair value of investments)
Investments are classified within the level of the lowest significant input considered in determining fair value. Investments classified within Level 3 whose fair value measurement considers several inputs may include Level 1 or Level 2 inputs as components of the overall fair value measurement.
Debt securities are valued in accordance with the evaluated bid price supplied by the pricing service and generally categorized as Level 2 in the hierarchy. Other securities that are categorized as Level 2 in the hierarchy include, but are not limited to, preferred stocks, bank loans, warrants, swaps and forward contracts. The Fund may use a systematic fair valuation model provided by an independent pricing service to value foreign equity securities in order to adjust for stale pricing, which may occur between the close of certain foreign exchanges and the NYSE. These are generally categorized as Level 2 in the hierarchy.
When independent prices are unavailable or unreliable, debt securities and swaps may be valued utilizing
| 316 | SEI Institutional Managed Trust / Semi-Annual Report / March 31, 2021 |
pricing matrices which consider similar factors that would be used by independent pricing services. These are generally categorized as Level 2 in the hierarchy but may be Level 3 depending on the circumstances. For certain collateralized debt obligations, corporate obligations, mortgage backed securities, auction rate preferred securities and loan participations where observable inputs are limited, assumptions about market activity and risk are used and are categorized as Level 3 in the hierarchy.
The valuation techniques used by the Funds to measure fair value during the six month period ended March 31, 2021, maximized the use of observable inputs and minimized the use of unobservable inputs. For details of the investment classification, reference the Summary Schedules of Investments/Schedules of Investments.
For the six month period ended March 31, 2021, there have been no significant changes to the Trust’s fair valuation methodologies.
The unobservable inputs used to determine fair value of reoccurring Level 3 assets may have similar or diverging impacts on valuation. Significant increases and decreases in these inputs in isolation and interrelationships between those inputs could result in significantly higher or lower fair value measurement.
Security Transactions and Investment Income — Security transactions are recorded on the trade date. Costs used in determining net realized capital gains and losses on the sale of securities are on the basis of specific identification. Dividend income is recognized on the ex-dividend date, and interest income is recognized using the accrual basis of accounting. Income from payment-in-kind securities is recorded daily based on the effective interest method of accrual.
Distributions received on securities that represent a return of capital or capital gains are recorded as a reduction of cost of investments and/or as a realized gain. The Trust estimates the components of distributions received that may be considered nontaxable distributions or capital gain distributions.
Amortization and accretion is calculated using the scientific interest method, which is not materially different from the effective interest method. Amortization of premiums and discounts is included in interest income.
For Treasury Inflation-Protected Securities, the principal amount is adjusted daily to keep pace with inflation. Interest is accrued based on the adjusted principal amount. The adjustments to principal due to inflation are reflected as increases or decreases to interest in the accompanying Statements of Operations. Such
adjustments may have a significant impact on a Fund’s distributions.
Cash and Cash Equivalents — Idle cash and currency balances may be swept into various overnight sweep accounts and are classified as cash and cash equivalents on the Statement of Assets and Liabilities/ Consolidated Statement of Assets and Liabilities and Consolidated Statement of Cash Flows. These amounts, at times, may exceed United States federally insured limits. Amounts swept are available on the next business day.
Repurchase Agreements — Securities pledged as collateral for repurchase agreements are held by each Fund’s custodian bank until the repurchase date of the repurchase agreement. The Funds may also invest in tri-party repurchase agreements. Securities held as collateral for tri-party repurchase agreements are maintained by the broker’s custodian bank in a segregated account until the repurchase date of the repurchase agreement. Provisions of the repurchase agreements and the Trust’s policies require that the market value of the collateral, including accrued interest thereon, is sufficient in the event of default by the counterparty. If the counterparty defaults and the value of the collateral declines, or if the counterparty enters into an insolvency proceeding, realization of the collateral by the Funds may be delayed or limited.
Reverse Repurchase Agreements — To the extent consistent with its Investment Objective and Strategies, a Fund may issue reverse repurchase agreements. A reverse repurchase agreement involves the sale of portfolio assets together with an agreement to repurchase the same assets later at a fixed price. The segregated assets may consist of cash, U.S. Government securities, or other liquid securities at least equal in value to the obligations under the reverse repurchase agreements. In the event the buyer of securities under a reverse repurchase agreement files for bankruptcy or becomes insolvent, a Fund’s use of the proceeds under the agreement may be restricted pending a determination by the other party, or its trustee or receiver, whether to enforce the obligation to repurchase the securities.
Classes — Class-specific expenses are borne by that class of shares. Income, realized and unrealized gains/ losses and non class-specific expenses are allocated to the respective class on the basis of relative daily net assets.
Expenses — Expenses that are directly related to a Fund are charged directly to that Fund. Other operating
| SEI Institutional Managed Trust / Semi-Annual Report / March 31, 2021 | 317 |
Notes to Financial Statements/Consolidated Notes to Financial Statements (Continued)
March 31, 2021 (Unaudited)
expenses of the Funds are prorated to the Funds on the basis of relative daily net assets.
Commodity-Linked Investments — To the extent consistent with its Investment Objective and Strategies, the Multi-Asset Accumulation Fund, Multi-Asset Inflation Managed and Dynamic Asset Allocation Fund may invest in commodity investments to provide exposure to the investment returns of the commodities markets. Commodity investments include notes with interest payments that are tied to an underlying commodity or commodity index, ETFs or other exchange-traded products that are tied to the performance of a commodity or commodity index or other types of investment vehicles or instruments that provide returns that are tied to commodities or commodity indices. The Multi-Asset Accumulation, Multi-Asset Inflation Managed and Dynamic Asset Allocation Funds may also invest in equity securities of issuers in commodity-related industries.
The Multi-Asset Accumulation, Multi-Asset Inflation Managed and Dynamic Asset Allocation Funds may also seek to gain exposure to the commodity markets, in whole or in part, through investments in a wholly owned Subsidiary. A Subsidiary, unlike the Fund, may invest to a significant extent directly in commodities and in equity-linked securities and commodity-linked derivative instruments, including options, futures contracts, swaps, options on futures contracts and commodity-linked structured notes. A Subsidiary may also invest in other instruments in which the Fund is permitted to invest, either as investments or to serve as margin or collateral for its derivative positions. A Fund may invest up to 25% of its total assets in its Subsidiary.
In order for a Fund to qualify as a regulated investment company under Subchapter M of the Code, the Fund must derive at least 90% of its gross income each taxable year from qualifying income. The status of certain commodity-linked derivative instruments as qualifying income has been addressed in Revenue Ruling 2006-1 and Revenue Ruling 2006-31 which provide that income from certain commodity-linked derivative instruments in which the Fund invests will not be considered qualifying income. To the extent the Multi-Asset Accumulation, Multi-Asset Inflation Managed, and Dynamic Asset Allocation Funds invest in such instruments directly, each Fund will seek to restrict its income from commodity-linked derivative instruments that do not generate qualifying income, such as commodity-linked swaps, to a maximum of 10% of its gross income (when combined with its other investments that produce non-qualifying income).
Foreign Currency Translation — The books and records of the Funds are maintained in U.S. dollars on the following basis:
(I) market value of investment securities, assets and liabilities at the current rate of exchange; and
(II) purchases and sales of investment securities, income and expenses at the relevant rates of exchange prevailing on the respective dates of such transactions.
The Funds do not isolate that portion of gains and losses on investments in investment securities that is due to changes in the foreign exchange rates from that which is due to changes in market prices of investment securities.
The Funds report certain foreign-currency-related transactions as components of realized gains for financial reporting purposes, whereas such components are treated as ordinary income for Federal income tax purposes.
Forward Foreign Currency Contracts — To the extent consistent with its Investment Objective and Strategies, a Fund may enter into forward foreign currency contracts as hedges against either specific transactions, fund positions or anticipated fund positions. A Fund may also engage in currency transactions to enhance that Fund’s returns. All commitments are “marked-to-market” daily at the applicable foreign exchange rate, and any resulting unrealized gains or losses are recorded currently. The Funds realize gains and losses at the time forward contracts are extinguished. Unrealized gains or losses on outstanding positions in forward foreign currency contracts held at the close of the period are recognized as ordinary income or loss for Federal income tax purposes.
The Funds could be exposed to risk if the counterparties to the contracts are unable to meet the terms of the contract and from unanticipated movements in the value of a foreign currency relative to the U.S. dollar.
Finally, the risk exists that losses could exceed amounts disclosed on the Statements of Assets and Liabilities or Consolidated Statements of Assets and Liabilities. Refer to each Fund’s Schedule of Investments, Summary Schedule of Investments or Consolidated Schedule of Investments for details regarding open forward foreign currency contracts as of March 31, 2021, if applicable.
Futures Contracts — To the extent consistent with its Investment Objective and Strategies, a Fund may use futures contracts for tactical hedging purposes as well as to enhance the Fund’s returns. In addition, fixed income funds will utilize futures contracts to help manage duration and yield curve exposure. Initial margin deposits of cash or securities are made upon entering
| 318 | SEI Institutional Managed Trust / Semi-Annual Report / March 31, 2021 |
into futures contracts. The contracts are marked to market daily and the resulting changes in value are accounted for as unrealized gains and losses. Variation margin payments are paid or received, depending upon whether unrealized gains or losses are incurred. When the contract is closed, the Funds record a realized gain or loss equal to the difference between the proceeds from (or cost of) the closing transaction and the amount invested in the contract.
Risks of entering into futures contracts include the possibility that there will be an imperfect price correlation between the futures and the underlying securities. Second, it is possible that a lack of liquidity for futures contracts could exist in the secondary market, resulting in an inability to close a position prior to its maturity date. Third, the futures contract involves the risk that the Fund could lose more than the original margin deposit required to initiate a futures transaction.
Finally, the risk exists that losses could exceed amounts disclosed on the Statements of Assets and Liabilities or Consolidated Statements of Assets and Liabilities. Refer to each Fund’s Schedule of Investments, Summary Schedule of Investments or Consolidated Schedule of Investments for details regarding open futures contracts as of March 31, 2021, if applicable.
Inflation-Indexed Bonds — Inflation-indexed bonds are fixed income securities whose principal value is periodically adjusted according to the rate of inflation. If the index measuring inflation rises or falls, the principal value of inflation-indexed bonds will be adjusted upward or downward, and consequently the interest payable on these securities calculated with respect to a larger or smaller principal amount) will be increased or reduced, respectively. Any upward or downward adjustment in the principal amount of an inflation-indexed bond will be included in interest income in the Statement of Operations, even though investors do not receive their principal until maturity. Repayment of the original bond principal upon maturity (as adjusted for inflation) is guaranteed in the case of U.S. Treasury inflation-indexed bonds. For bonds that do not provide a similar guarantee, the adjusted principal value of the bond repaid at maturity may be less than the original principal.
Master Limited Partnerships — Investments in units of master limited partnerships (“MLPs”) involve risks that differ from an investment in common stock. Holders of the units of master limited partnerships have more limited control and limited rights to vote on matters affecting the partnership. There are also certain tax risks associated with an investment in units of master limited partnerships. In addition, conflicts of interest may exist between common unit holders, subordinated unit holders and the general partner of a master
limited partnership, including a conflict arising as a result of incentive distribution payments. The benefit a Fund derives from investment in MLP units is largely dependent on the MLPs being treated as partnerships and not as corporations for federal income tax purposes. If an MLP were classified as a corporation for federal income tax purposes, there would be reduction in the after-tax return to a Fund of distributions from the MLP, likely causing a reduction in the value of a Fund’s shares. MLP entities are typically focused in the energy, natural resources and real estate sectors of the economy. A downturn in the energy, natural resources or real estate sectors of the economy could have an adverse impact on a Fund. At times, the performance of securities of companies in the energy, natural resources and real estate sectors of the economy may lag the performance of other sectors or the broader market as a whole.
Options/Swaptions Writing/Purchasing —To the extent consistent with its Investment Objective and Strategies, a Fund may invest in financial options/ swaptions contracts for the purpose of hedging its existing fund securities or to enhance the Fund’s returns. When a Fund writes or purchases an option/swaption, an amount equal to the premium received or paid by the Fund is recorded as a liability or an asset and is subsequently adjusted to the current market value of the option/swaption written or purchased. Premiums received or paid from writing or purchasing options/ swaptions which expire unexercised are treated by the Fund on the expiration date as realized gains or losses. The difference between the premium and the amount paid or received on effecting a closing purchase or sale transaction, including brokerage commissions, is also treated as a realized gain or loss. If an option/swaption is exercised, the premium paid or received is added to the cost of the purchase or proceeds from the sale in determining whether the Fund has realized a gain or a loss on investment transactions.
The risk in writing a call option/swaption is that the Funds give up the opportunity for profit if the market price of the security increases. The risk in writing a put option/swaption is that the Funds may incur a loss if the market price of the security decreases and the option/swaption is exercised. The risk in purchasing an option/swaption is that the Funds pay a premium whether or not the option/swaption is exercised. The Funds also have the additional risk of being unable to enter into a closing transaction at an acceptable price if a liquid secondary market does not exist. Option/swaption contracts also involve the risk that they may not work as intended due to unanticipated developments in market conditions or other causes.
Finally, the risk exists that losses on written options could exceed amounts disclosed on the Statements of
| SEI Institutional Managed Trust / Semi-Annual Report / March 31, 2021 | 319 |
Notes to Financial Statements/Consolidated Notes to Financial Statements (Continued)
March 31, 2021 (Unaudited)
Assets and Liabilities. Refer to each Fund’s Schedule of Investments, Summary Schedule of Investments or Consolidated Schedule of Investments for details regarding open option/swaption contracts as of March 31, 2021, if applicable.
Securities Sold Short — To the extent consistent with its Investment Objective and Strategies, a Fund may engage in short sales. Short sales are transactions under which a Fund sells a security it does not own. To complete such a transaction, the Fund must borrow the security to make delivery to the buyer. A Fund then is obligated to replace the security borrowed by purchasing the security at the market price at the time of the replacement. The price at such time may be more or less than the price at which the security was sold by a Fund. Until the security is replaced, a Fund is required to pay the lender amounts equal to any dividends or interest that accrue during the period of the loan. Dividends and interest are shown as an expense for financial reporting purposes. To borrow the security, a Fund also may be required to pay a premium, which would decrease proceeds of the security sold. The proceeds of the short sale are retained by the broker, to the extent necessary to meet margin requirements, until the short position is closed out. A gain, limited to the price at which a Fund sold the security short, or a loss, potentially unlimited in size, will be recognized upon the close of a short sale.
Refer to each Fund’s Schedule of Investments, Summary Schedule of Investments or Consolidated Schedule of Investments for details regarding securities sold short as of March 31, 2021, if applicable.
Swap Agreements — To the extent consistent with its Investment Objective and Strategies, a Fund may invest in swap contracts as an efficient means to synthetically obtain exposure to securities or baskets of securities and to manage a Fund’s interest rate duration and yield curve exposure. Swap contracts may also be used to mitigate a Fund’s overall level of risk and/or a Fund’s risk to particular types of securities, currencies or market segments. Interest rate swaps may further be used to manage a Fund’s yield spread sensitivity. A Fund may buy credit default swaps in an attempt to manage credit risk where a Fund has credit exposure to an issuer, and a Fund may sell credit default swaps to more efficiently gain credit exposure to a security or basket of securities. A swap agreement is a two-party contract under which an agreement is made to exchange returns from predetermined investments or instruments, including a particular interest rate, foreign currency, or “basket” of securities representing a particular index. Swap agreements are privately negotiated in the over-the-counter market (“OTC swaps”) or may be executed in
a multilateral or other trade facility platform, such as a registered commodities exchange (“Centrally Cleared swaps”). Interest rate swaps involve the exchange by a Fund with another party of their respective commitments to pay or receive interest (e.g., an exchange of floating rate payments for fixed rate payments) with respect to a notional amount of principal. Credit-default swaps involve periodic payments by a Fund or counterparty based on a specified rate multiplied by a notional amount assigned to an underlying debt instrument or group of debt instruments in exchange for the assumption of credit risk on the same instruments. In the event of a credit event, usually in the form of a credit rating downgrade, the party receiving periodic payments (i.e. floating rate payer) must pay the other party (i.e. fixed rate payer) an amount equal to the recovery rate used to settle the contracts. The recovery rate is a function of how many credit default swap investors wish to deliver the security or receive the security. The recovery rate is determined through an auction process. Total return swaps allow an investor to benefit from the cash flow without ever actually owning the underlying security. The receiver must pay any decline in value to the payer at the end of the total return swap. However, the investor does not need to make a payment if there is no decline in price. Payments can be made on various indices, bonds (i.e. mortgage backed securities, bank debt and corporate), loans or commodities. The value of a total return swap is equal to the change in value of the underlying asset versus the accrued income payment based on LIBOR or some other form of indices on the notional amount. Payments received or made are recorded as realized gains or loss. A Fund could be exposed to credit or market risk due to unfavorable changes in the fluctuation of interest rates or if the counterparty defaults on its obligation to perform. Risk of loss may exceed amounts recognized on the statement of assets and liabilities. Interest rate swap contracts outstanding at year end, if any, are listed after a Fund’s portfolio. In connection with swap agreements securities may be set aside as collateral by a Fund’s custodian.
Swaps are marked-to-market daily based upon quotations from market makers and the resulting changes in market values, if any, are recorded as an unrealized gain or loss in the Statement of Operations or Consolidated Statement of Operations. Centrally cleared swaps are valued at the settlement price established each day by the board of exchange on which they are traded. The daily settlement prices for centrally cleared swaps are provided by an independent source. Net payments of interest are recorded as realized gains or losses. Daily changes in valuation of Centrally Cleared swaps, if any, are recorded as a receivable or payable for the change in value as appropriate (“variation
| 320 | SEI Institutional Managed Trust / Semi-Annual Report / March 31, 2021 |
margin”) on the Statements of Assets and Liabilities or Consolidated Statement of Assets and Liabilities.
Entering into swap agreements involves, to varying degrees, elements of credit and market risk in excess of the amounts recognized on the Statement of Assets and Liabilities or Consolidated Statement of Assets and Liabilities. Such risks involve the possibility that there will be no liquid market for these agreements, that the counterparty to the agreement may default on its obligation to perform and that there may be unfavorable changes in the fluctuation of interest rates. Risks also arise from potential losses from adverse market movements.
This risk is mitigated by having a master netting arrangement between a Fund and the counterparty and by having the counterparty post collateral to cover a Fund’s exposure to the counterparty. See Note 3 for further details. Refer to each Fund’s Schedule of Investments, Summary Schedule of Investments or Consolidated Schedule of Investments for details regarding open swap agreements as of March 31, 2021, if applicable.
Delayed Delivery Transactions — To the extent consistent with its Investment Objective and Strategies, a Fund may purchase or sell securities on a when-issued or delayed delivery basis. These transactions involve a commitment by the Fund to purchase or sell securities for a predetermined price or yield, with payment and delivery taking place beyond the customary settlement period. When delayed delivery purchases are outstanding, the Fund will set aside liquid assets in an amount sufficient to meet the purchase price. When purchasing a security on a delayed delivery basis, the Fund assumes the rights and risks of ownership of the security, including the risk of price and yield fluctuations, and takes such fluctuations into account when determining its net asset value. The Fund may dispose of or renegotiate a delayed delivery transaction after it is entered into, and may sell when-issued securities before they are delivered, which may result in a capital gain or loss. When the Fund has sold a security on delayed delivery basis, the Fund does not participate in future gains and losses with respect to the security.
Participation Notes (P-Notes) — To the extent consistent with its Investment Objective and Strategies, a Fund may acquire P-Notes issued by participating banks or broker-dealers. P-Notes are participation interest notes that are designed to offer a return linked to a particular underlying equity, debt, currency or market. The P-Notes in which the Fund may invest will typically have a maturity of one year. When purchasing a P-Note, the posting of margin is not required because the full cost of the P-Note (plus commission) is paid at the time
of purchase. When the P-Note matures, the issuer will pay to, or receive from, the purchaser the difference between the minimal value of the underlying instrument at the time of purchase and that instrument’s value at maturity. Investments in P-Notes involve the same risks associated with a direct investment in the underlying foreign companies of foreign securities markets that they seek to replicate.
In addition, there can be no assurance that the trading price of P-Notes will equal the underlying value of the foreign companies or foreign securities markets that they seek to replicate. The holder of a participation note that is linked to a particular underlying security is entitled to receive any dividends paid in connection with an underlying security or instrument. However, the holder of a participation note does not receive voting rights as it would if it directly owned the underlying security or instrument. P-Notes are generally traded over-the- counter. P-Notes constitute general unsecured contractual obligations of the banks or broker-dealers that issue them and the counterparty. There is also counterparty risk associated with these investments because the Fund is relying on the creditworthiness of such counterparty and has no rights under a participation note against the issuer of the underlying security. In addition, the Fund will incur transaction costs as a result of investments in P-Notes.
Loan Participations and Brady Bonds — To the extent consistent with its Investment Objective and Strategies, a Fund may invest in Loan Participations. Loan Participations include fixed and floating rate loans that are privately negotiated between a corporate borrower and one or more financial institutions, including, but not limited to, term loans, revolvers, and other instruments issued in the bank loan market. Each Fund may acquire interests in loans directly (by way of assignment from the selling institution) or indirectly (by way of the purchase of a participation interest from the selling institution). Under a bank loan assignment, a Fund generally will succeed to all the rights and obligations of an assigning lending institution and becomes a lender under the loan agreement with the relevant borrower in connection with that loan. Under bank loan participation, the Fund generally will have a contractual relationship only with the lender, not with the relevant borrower. As a result, a Fund generally will have the right to receive payments of principal, interest, and any fees to which it is entitled only from the lender selling the participation and only upon receipt by the lender of the payments from the relevant borrower. The Fund may not directly benefit from the collateral supporting the debt obligation in which it has purchased the participation. As a result, a Fund will assume the credit risk of both the borrower and the institution selling the participation to the Fund.
| SEI Institutional Managed Trust / Semi-Annual Report / March 31, 2021 | 321 |
Notes to Financial Statements/Consolidated Notes to Financial Statements (Continued)
March 31, 2021 (Unaudited)
The interest rate indicated in the Fund’s Schedule of Investments is the rate in effect at March 31, 2021. Pursuant to the terms of certain loan agreements, the Funds may hold unfunded commitments in loan participations which are disclosed on the Statement of Assets and Liabilities. Unfunded commitments represent the remaining obligation of the Fund to the borrower. At any point in time, up to the maturity date of the issue, the borrower may demand the unfunded portion. Unfunded amounts, if any, are marked to market and any unrealized gains or losses are recorded in the Statement of Assets and Liabilities. The Funds disclosed consent fees and amendment income in the Statement of Operations as “Interest income”.
Certain debt obligations, customarily referred to as “Brady Bonds,” are created through the exchange of existing commercial bank loans to foreign entities for new obligations in connection with debt restructuring under a plan introduced by former U.S. Secretary of the Treasury Nicholas F. Brady. Brady Bonds have only been issued since 1989, and, accordingly, do not have a long payment history. They are issued by governments that may have previously defaulted on the loans being restructured by the Brady Bonds, so they are subject to the risk of default by the issuer. They may be fully or partially collateralized or uncollateralized and issued in various currencies.
Collateralized Debt Obligations — To the extent consistent with its Investment Objective and Strategies, a Fund may invest in collateralized debt obligations (“CDOs”), which include collateralized loan obligations (“CLOs”) and other similarly structured securities. CLOs are a type of asset-backed securities. A CLO is a trust typically collateralized by a pool of loans, which may include, among others, domestic and foreign senior secured loans, senior unsecured loans, and subordinate corporate loans, including loans that may be rated below investment grade or equivalent unrated loans. CDOs may charge management fees and administrative expenses.
For CDOs, the cash flows from the trust are split into two or more portions, called tranches, varying in risk and yield. The riskiest portion is the “equity” tranche which bears the bulk of defaults from the bonds or loans in the trust and serves to protect the other, more senior tranches from default in all but the most severe circumstances. Since it is partially protected from defaults, a senior tranche from a CDO trust typically has a higher rating and lower yield than its underlying securities, and can be rated investment grade. Despite the protection from the equity tranche, CDO tranches can experience substantial losses due to actual defaults, increased sensitivity to defaults due to collateral default and disappearance of protecting tranches, market
anticipation of defaults, as well as aversion to CDO securities as a class.
The risks of an investment in a CDO depend largely on its Class and its collateral securities. Normally, CLOs and other CDOs are privately offered and sold, and thus, are not registered under the securities laws. As a result, investments in CDOs may be characterized by the Funds as illiquid securities; however, an active dealer market may exist for CDOs, allowing a CDO to qualify for Rule 144A transactions. In addition to the normal risks associated with fixed income securities (e.g., interest rate risk and default risk), CDOs carry additional risks including, but not limited to: (i) the possibility that distributions from collateral securities will not be adequate to make interest or other payments; (ii) the quality of the collateral may decline in value or default; (iii) the Funds may invest in CDOs that are subordinate to other classes; and (iv) the complex structure of the security may not be fully understood at the time of investment and may produce disputes with the issuer or unexpected investment results.
Dividends and Distributions to Shareholders — Dividends from net investment income are declared and paid to shareholders quarterly for the Large Cap, Large Cap Value, Large Cap Growth, Large Cap Index, Tax-Managed Large Cap, S&P 500 Index, Small Cap, Small Cap Value, Small Cap Growth, Tax-Managed Small/Mid Cap, Mid-Cap, U.S. Managed Volatility, Tax-Managed Managed Volatility, Real Estate and Real Return Funds; are declared and paid annually for the Global Managed Volatility, Tax-Managed International Managed Volatility, Multi-Strategy Alternative, Multi-Asset Accumulation, Multi-Asset Inflation Managed, Multi-Asset Capital Stability and Dynamic Asset Allocation; are declared daily and paid monthly for the Core Fixed Income, High Yield Bond, Conservative Income, Tax-Free Conservative Income and Multi-Asset Income. Any net realized capital gains on sales of securities are distributed to shareholders at least annually. Dividends and distributions are recorded on the ex-dividend date.
Restricted Securities — At March 31, 2021, the following Funds owned private placement investments that were purchased through private offerings or acquired through initial public offerings and cannot be sold without prior registration under the Securities Act of 1933 or pursuant to an exemption therefrom. In addition, the Funds have generally agreed to further restrictions on the disposition of certain holdings as set forth in various agreements entered into in connection with the purchase of these investments. These investments are valued at fair value as determined in accordance with the procedures approved by the Board.
| 322 | SEI Institutional Managed Trust / Semi-Annual Report / March 31, 2021 |
The acquisition dates of these investments, the enforceable right to acquire these securities, along with their cost
and values at March 31, 2021, were as follows:
| Number of Shares/Face Amount ($ Thousands) | Acquisition Date | Right to Acquire Date | Cost ($ Thousands) | Market Value ($ Thousands) | % of Net Assets | |||||||||||||||||||
Small Cap Growth Fund | ||||||||||||||||||||||||
Value Creation | $ | 145,600 | 8/10/06 | 8/10/06 | $ | 1,491 | $ | 61 | 0.02% | |||||||||||||||
|
|
|
|
|
| |||||||||||||||||||
High Yield Bond Fund | ||||||||||||||||||||||||
Aventine (Escrow Security) | $ 2,750 | 11/30/10 | 11/30/10 | $ | — | $ | — | 0.00% | ||||||||||||||||
Neiman Marcus | 620 | 9/25/20 | 9/25/20 | — | 39 | 0.00% | ||||||||||||||||||
|
|
|
|
|
| |||||||||||||||||||
Investments in Real Estate Investment Trust — With respect to the Real Estate Fund, dividend income is recorded based on the income included in distributions received from the Real Estate Investment Trust (“REIT”) investments using published REIT reclassifications including some management estimates when actual amounts are not available. Distributions received in excess of this estimated amount are recorded as a reduction of the cost of investments or reclassified to capital gains. The actual amounts of income, return of capital, and capital gains are only determined by each REIT after its fiscal year end, and may differ from the estimated amounts.
Investment in Subsidiary — Each of the Multi-Asset Accumulation, Multi-Asset Inflation Managed and Dynamic Asset Allocation Funds may invest in its own Subsidiary. By investing in a Subsidiary, each Fund is indirectly exposed to the risks associated with such Subsidiary’s investments. The commodity-related instruments held by a Subsidiary are generally similar to those that are permitted to be held by the applicable Fund and are subject to the same risks that apply to similar investments if held directly by the Fund. A Subsidiary, however, is not registered under the 1940 Act and will not be subject to all of the investor protections of the 1940 Act. Thus, the Multi-Asset Accumulation, Multi-Asset Inflation Managed and Dynamic Asset Allocation Funds, as investors in their respective Subsidiary, will not have all of the protections offered to investors in registered investment companies.
However, each Fund wholly owns and controls its respective Subsidiary, and the Funds and the
Subsidiaries are all managed by SIMC, making it unlikely that a Subsidiary will take action contrary to the interests of the applicable Fund or its shareholders. While a Subsidiary has its own Board of Directors (“Directors”) that is responsible for overseeing the operations of such Subsidiary, the respective Fund’s Directors have oversight responsibility for the investment activities of the Fund, including its investment in the respective Subsidiary, and the Fund’s role as the sole shareholder of such Subsidiary. It is not currently expected that shares of any Subsidiary will be sold or offered to investors other than the respective Fund.
Changes in the laws of the United States and/or the Cayman Islands or governmental interpretation of such laws, under which the Funds and the Subsidiaries, respectively, are organized, could result in the inability of a Fund and/or its respective Subsidiary to operate as intended and could negatively affect the Funds and their shareholders. For example, Cayman Islands law does not currently impose any income, corporate or capital gains tax, estate duty, inheritance tax, gift tax or withholding tax on the Subsidiaries. If Cayman Islands law changes such that the Subsidiaries must pay Cayman Islands governmental authority taxes, Fund shareholders would likely suffer decreased investment return.
3. CREDIT DERIVATIVES
A Fund may use credit default swaps to reduce risk where a Fund has exposure to the issuer, or to take an active long or short position with respect to the likelihood of an event of default. The reference obligation of the swap can be a single issuer, a “basket” of issuers, or an index. The underlying referenced assets are corporate debt, sovereign debt and asset backed securities.
The buyer of a credit default swap is generally obligated to pay the seller a periodic stream of payments over the term of the contract in return for a contingent payment upon the occurrence of a credit event with respect to an underlying reference obligation. Generally, a credit event for corporate or sovereign reference obligations means bankruptcy, failure to pay, obligation acceleration, repudiation/moratorium or restructuring. For credit default swaps on asset-backed securities, a credit event may be triggered by events such as failure to pay principal, maturity extension, rating downgrade or write-down.
If a Fund is a seller of protection, and a credit event occurs, as defined under the terms of that particular swap agreement, a Fund will generally either (i) pay to the buyer an amount equal to the notional amount of the swap and take delivery of the referenced obligation, other deliverable obligations, or underlying securities comprising a referenced index or (ii) pay a net
| SEI Institutional Managed Trust / Semi-Annual Report / March 31, 2021 | 323 |
Notes to Financial Statements/Consolidated Notes to Financial Statements (Continued)
March 31, 2021 (Unaudited)
settlement amount in the form of cash or securities equal to the notional amount of the swap less the recovery value of the referenced obligation or underlying securities comprising a referenced index.
If a Fund is a buyer of protection and a credit event occurs, as defined under the terms of that particular swap agreement, a Fund will either (i) receive from the seller of protection an amount equal to the notional amount of the swap and deliver the referenced obligation, other deliverable obligations or underlying securities comprising the referenced index or (ii) receive a net settlement amount in the form of cash or securities equal to the notional amount of the swap less the recovery value of the referenced obligation or underlying securities comprising the referenced index. Recovery values are calculated by market makers considering either industry standard recovery rates or entity specific factors and considerations until a credit event occurs. If a credit event has occurred, the recovery value is determined by a facilitated auction whereby a minimum number of allowable broker bids, together with a specified valuation method, are used to calculate the settlement value.
Certain Funds are party to International Swap Dealers Association, Inc. Master Agreements (“ISDA Master Agreements”). These agreements are with select counterparties and they govern transactions, including certain over-the counter derivative and foreign exchange contracts, entered into by the Funds and the counterparty.
As of March 31, 2021, the Multi-Strategy Alternative Fund, Multi-Asset Income Fund and the Multi-Asset Inflation Managed Fund are the buyers (“receiving protection”) on a total notional amount of $13.6 million, $5.4 million and $297.6 million, respectively. As of March 31, 2021, the Core Fixed Income Fund, Multi-Strategy Alternative Fund, Multi-Asset Income Fund, Multi-Asset Inflation Managed Fund and Multi-Asset Capital Stability Fund are the sellers (“providing protection”) on a total notional amount of $140.0 million, $0.7 million, $82.1 million, $151.9 million, and $24.8 million, respectively. The notional amounts of the swaps are not recorded in the financial statements. The notional amounts approximate the maximum potential amount of future payments that the Fund could be required to make if the Fund was the seller of protection and a credit event was to occur.
Those credit default swaps (“CDS”) for which the Fund is providing protection at the balance sheet date are summarized as follows:
CORE FIXED INCOME FUND
WRITTEN CREDIT DERIVATIVE CONTRACTS |
| SINGLE NAME CDS | CDS ON AN INDEX | ||||||||||||||||||||||
REFERENCE ASSET | | CORP US$ | | SOVEREIGN US$ | | ABS US$ | | CORP US$ | Total | ||||||||||||||||
Fair value of written credit derivatives | $- | $- | $- | $4,843,583 | $4,843,583 | ||||||||||||||||||||
Maximum potential amount of future payments | - | - | - | 140,017,000 | �� 140,017,000 | ||||||||||||||||||||
Recourse provisions with third parties to recover any amounts paid under the credit derivative (including any purchased credit protection)1 | - | - | - | - | - | ||||||||||||||||||||
Collateral held by the Fund can obtain upon occurrence of triggering event | - | - | - | - | - | ||||||||||||||||||||
MULTI-STRATEGY ALTERNATIVE FUND
WRITTEN CREDIT DERIVATIVE CONTRACTS |
| SINGLE NAME CDS | CDS ON AN INDEX | ||||||||||||||||||||||
REFERENCE ASSET | | CORP US$ | | SOVEREIGN US$ | | ABS US$ | | CORP US$ | Total | ||||||||||||||||
Fair value of written credit derivatives | $- | $(39,448) | $- | $- | $(39,448) | ||||||||||||||||||||
Maximum potential amount of future payments | - | 654,000 | - | - | 654,000 | ||||||||||||||||||||
Recourse provisions with third parties to recover any amounts paid under the credit derivative (including any purchased credit protection) 1 | - | - | - | - | - | ||||||||||||||||||||
Collateral held by the Fund can obtain upon occurrence of triggering event | - | - | - | - | - | ||||||||||||||||||||
MULTI-ASSET INCOME FUND
WRITTEN CREDIT DERIVATIVE CONTRACTS | SINGLE NAME CDS | CDS ON AN INDEX | |||||||||||||||||||||||
REFERENCE ASSET | | CORP US$ | | SOVEREIGN US$ | | ABS US$ | | CORP US$ | Total | ||||||||||||||||
Fair value of written credit derivatives | $22,328 | $46,989 | $- | $2,292,409 | $2,361,725 | ||||||||||||||||||||
Maximum potential amount of future payments | 1,750,000 | 21,130,000 | - | 59,172,500 | 82,052,500 | ||||||||||||||||||||
Recourse provisions with third parties to recover any amounts paid under the credit derivative (including any purchased credit protection) 1 | - | - | - | - | - | ||||||||||||||||||||
Collateral held by the Fund can obtain upon occurrence of triggering event | - | - | - | - | - | ||||||||||||||||||||
| 324 | SEI Institutional Managed Trust / Semi-Annual Report / March 31, 2021 |
MULTI-ASSET INFLATION MANAGED FUND
WRITTEN CREDIT DERIVATIVE CONTRACTS | SINGLE NAME CDS | CDS ON AN INDEX | ||||||||||||||||||
REFERENCE ASSET | | CORP US$ | | | SOVEREIGN US$ |
| | ABS US$ | | | CORP US$ |
| Total | |||||||
Fair value of written credit derivatives | $- | $1,752,344 | $- | $(349,264) | $1,403,080 | |||||||||||||||
Maximum potential amount of future payments | - | 60,400,000 | - | 91,510,000 | 151,910,000 | |||||||||||||||
Recourse provisions with third parties to recover any amounts paid under the credit derivative (including any purchased credit protection) 1 | - | - | - | - | - | |||||||||||||||
Collateral held by the Fund can obtain upon occurrence of triggering event | - | - | - | - | - | |||||||||||||||
MULTI-ASSET CAPITAL STABILITY FUND WRITTEN CREDIT DERIVATIVE CONTRACTS |
| SINGLE NAME CDS |
| CDS ON AN INDEX | ||||||||||||||||
REFERENCE ASSET | | CORP US$ | | | SOVEREIGN US$ |
| | ABS US$ |
| | CORP US$ |
| Total | |||||||
Fair value of written credit derivatives | $- | $- | $- | $1,099,469 | $1,099,469 | |||||||||||||||
Maximum potential amount of future payments | - | - | - | 24,784,367 | 24,784,367 | |||||||||||||||
Recourse provisions with third parties to recover any amounts paid under the credit derivative (including any purchased credit protection) 1 | - | - | - | - | - | |||||||||||||||
Collateral held by the Fund can obtain upon occurrence of triggering event | - | - | - | - | - | |||||||||||||||
| 1 | Potential recoveries would include purchased credit derivatives to the extent they offset written credit derivatives which have an identical underlying, or a netting arrangement or credit support annex with the counterparty. There may be other potential recoveries from recourse provisions where agreements cover multiple derivative arrangements but those amounts have not been included. |
MAXIMUM POTENTIAL AMOUNT OF FUTURE PAYMENTS BY CONTRACT TERM |
| |||||||||||||||||||||||
CORE FIXED INCOME FUND | 0-6 MONTHS | 6-12 MONTHS | 1-5 YEARS | 5-10 YEARS | > 10 YEARS | Total | ||||||||||||||||||
Current credit spread* on underlying (in basis points) |
| |||||||||||||||||||||||
0-100 | $- | $- | $13,261,000 | $101,726,000 | $- | $114,987,000 | ||||||||||||||||||
101-200 | - | - | - | - | - | - | ||||||||||||||||||
201-300 | - | - | - | - | - | - | ||||||||||||||||||
301-400 | - | - | - | 25,030,000 | - | 25,030,000 | ||||||||||||||||||
> than 400 | - | - | - | - | - | - | ||||||||||||||||||
Total | $- | $- | $13,261,000 | $126,756,000 | $- | $140,017,000 | ||||||||||||||||||
MAXIMUM POTENTIAL AMOUNT OF FUTURE PAYMENTS BY CONTRACT TERM |
| |||||||||||||||||||||||
MULTI-STRATEGY ALTERNATIVE FUND | 0-6 MONTHS | 6-12 MONTHS | 1-5 YEARS | 5-10 YEARS | > 10 YEARS | Total | ||||||||||||||||||
Current credit spread* on underlying (in basis points) |
| |||||||||||||||||||||||
0-100 | $- | $- | $- | $- | $- | $- | ||||||||||||||||||
101-200 | - | - | - | - | - | - | ||||||||||||||||||
201-300 | - | - | - | - | - | - | ||||||||||||||||||
301-400 | - | - | - | - | - | - | ||||||||||||||||||
> than 400 | - | - | 654,000 | - | - | 654,000 | ||||||||||||||||||
Total | $- | $- | $654,000 | $- | $- | $654,000 | ||||||||||||||||||
| �� | ||||||||||||||||||||||||
MAXIMUM POTENTIAL AMOUNT OF FUTURE PAYMENTS BY CONTRACT TERM |
| |||||||||||||||||||||||
MULTI-ASSET INCOME FUND | 0-6 MONTHS | 6-12 MONTHS | 1-5 YEARS | 5-10 YEARS | > 10 YEARS | Total | ||||||||||||||||||
Current credit spread* on underlying (in basis points) |
| |||||||||||||||||||||||
0-100 | $- | $- | $58,645,000 | $- | $- | $58,645,000 | ||||||||||||||||||
101-200 | - | - | 15,916,000 | - | - | 15,916,000 | ||||||||||||||||||
201-300 | - | - | 6,091,500 | - | - | 6,091,500 | ||||||||||||||||||
301-400 | - | - | - | - | - | - | ||||||||||||||||||
> than 400 | - | - | - | 1,400,000 | - | 1,400,000 | ||||||||||||||||||
Total | $- | $- | $80,652,500 | $1,400,000 | $- | $82,052,500 | ||||||||||||||||||
| SEI Institutional Managed Trust / Semi-Annual Report / March 31, 2021 | 325 |
Notes to Financial Statements/Consolidated Notes to Financial Statements (Continued)
March 31, 2021 (Unaudited)
MAXIMUM POTENTIAL AMOUNT OF FUTURE PAYMENTS BY CONTRACT TERM |
| |||||||||||||||||||||||
MULTI-ASSET INFLATION MANAGED FUND | 0-6 MONTHS | 6-12 MONTHS | 1-5 YEARS | 5-10 YEARS | > 10 YEARS | Total | ||||||||||||||||||
Current credit spread* on underlying (in basis points) |
| |||||||||||||||||||||||
0-100 | $- | $- | $144,110,000 | $- | $- | $144,110,000 | ||||||||||||||||||
101-200 | - | - | - | - | - | - | ||||||||||||||||||
201-300 | - | - | - | - | - | - | ||||||||||||||||||
301-400 | - | - | - | - | - | - | ||||||||||||||||||
> than 400 | - | - | - | - | 7,800,000 | 7,800,000 | ||||||||||||||||||
Total | $- | $- | $144,110,000 | $- | $7,800,000 | $151,910,000 | ||||||||||||||||||
MAXIMUM POTENTIAL AMOUNT OF FUTURE PAYMENTS BY CONTRACT TERM |
| |||||||||||||||||||||||
MULTI-ASSET CAPITAL STABILITY FUND | 0-6 MONTHS | 6-12 MONTHS | 1-5 YEARS | 5-10 YEARS | > 10 YEARS | Total | ||||||||||||||||||
Current credit spread* on underlying (in basis points) |
| |||||||||||||||||||||||
0-100 | $- | $- | $16,804,000 | $- | $- | $16,804,000 | ||||||||||||||||||
101-200 | - | - | - | - | - | - | ||||||||||||||||||
201-300 | - | - | - | - | - | - | ||||||||||||||||||
301-400 | - | - | 7,980,367 | - | - | 7,980,367 | ||||||||||||||||||
> than 400 | - | - | - | - | - | - | ||||||||||||||||||
Total | $- | $- | $24,784,367 | $- | $- | $24,784,367 | ||||||||||||||||||
| * | The credit spread on the underlying asset is generally indicative of the current status of the underlying risk of the Fund having to perform. The spread also reflects the cost of buying/selling protection and may include upfront payments required to be made to enter into a contract. Higher credit spreads with a shorter contract term is indicative of a higher likelihood of performance by the Fund. |
The credit spread disclosed above for each reference obligation where the Fund is the seller of protection is a representation of the current payment/performance risk of the swap.
4. DERIVATIVE TRANSACTIONS
The following tables include only Funds that had exposure to more than one type of risk on derivatives held throughout the year. For Funds that held derivatives throughout the year with only one type of risk exposure, additional information can be found on the Summary Schedule of Investments, Schedule of Investments or Consolidated Schedule of Investments and the Statement of Operations or Consolidated Statement of Operations.
The fair value of derivative instruments as of March 31, 2021 was as follows ($ Thousands):
| Asset Derivatives | Liability Derivatives | |||||||||||
| Statement of Assets and Liabilities/ Consolidated Statement of Assets and Liabilities Location | Fair Value | Statement of Assets and Liabilities/ Consolidated Statement of Assets and Liabilities Location | Fair Value | |||||||||
Derivatives not accounted for as hedging instruments: | ||||||||||||
Global Managed Volatility Fund | ||||||||||||
Equity contracts | Net Assets — Unrealized appreciation on futures contracts | $31* | Net Assets — Unrealized depreciation on futures contracts | $0* | ||||||||
Foreign exchange contracts | Unrealized gain on forward foreign currency contracts | 4,802 | Unrealized loss on forward foreign currency contracts | 167 | ||||||||
|
|
|
| |||||||||
Total Derivatives not accounted for as hedging instruments | 4,833 | $167 | ||||||||||
|
|
|
| |||||||||
Core Fixed Income Fund | ||||||||||||
Interest rate contracts | Net Assets — Unrealized appreciation on futures contracts | $6,355* | Net Assets — Unrealized depreciation on futures contracts | $17,307* | ||||||||
Net Assets — Unrealized appreciation on swap contracts | 12,684† | Net Assets — Unrealized depreciation on swap contracts | 580† | |||||||||
Swaptions purchased, at value | 365 | Swaptions written, at value | 115 | |||||||||
Options purchased, at value | 271 | Options written, at value | 383 | |||||||||
Foreign exchange contracts | Unrealized gain on forward foreign currency contracts | 2,054 | Unrealized loss on forward foreign currency contracts | 2,358 | ||||||||
Credit contracts | Net Assets — Unrealized appreciation on swap contracts | 383† | Net Assets — Unrealized depreciation on swap contracts | -† | ||||||||
|
|
|
| |||||||||
Total Derivatives not accounted for as hedging instruments | $22,112 | $20,743 | ||||||||||
|
|
|
| |||||||||
| 326 | SEI Institutional Managed Trust / Semi-Annual Report / March 31, 2021 |
| Asset Derivatives | Liability Derivatives | |||||||||||
| Statement of Assets and Liabilities/ Consolidated Statement of Assets and Liabilities Location | Fair Value | Statement of Assets and Liabilities/ Consolidated Statement of Assets and Liabilities Location | Fair Value | |||||||||
Derivatives not accounted for as hedging instruments: | ||||||||||||
Dynamic Asset Allocation Fund | ||||||||||||
Interest rate contracts | Swaptions purchased, at value | $19,052 | Swaptions written, at value | $– | ||||||||
Options purchased, at value | 3,393 | Options written, at value | – | |||||||||
Net Assets — Unrealized appreciation on swap contracts | 1,265† | Net Assets — Unrealized depreciation on swap contracts | –† | |||||||||
Equity contracts | Net Assets — Unrealized appreciation on futures contracts | 910* | Net Assets — Unrealized depreciation on futures contracts | 8* | ||||||||
Foreign exchange contracts | Unrealized gain on forward foreign currency contracts | – | Unrealized loss on forward foreign currency contracts | 50 | ||||||||
Commodity contracts | Net Assets — Unrealized appreciation on swap contracts | –† | Net Assets — Unrealized depreciation on swap contracts | 2,293† | ||||||||
|
|
|
| |||||||||
Total Derivatives not accounted for as hedging instruments | $24,620 | $2,351 | ||||||||||
|
|
|
| |||||||||
Multi-Strategy Alternative Fund | ||||||||||||
Interest rate contracts | Net Assets — Unrealized appreciation on swap contracts | $1* | Net Assets — Unrealized depreciation on swap contracts | $56* | ||||||||
Net Assets — Unrealized appreciation on futures contracts | 85* | Net Assets — Unrealized depreciation on futures contracts | –* | |||||||||
Equity contracts | Options purchased, at value | 781 | Options written, at value | 570 | ||||||||
Net Assets — Unrealized appreciation on futures contracts | –* | Net Assets — Unrealized depreciation on futures contracts | 15* | |||||||||
Net Assets — Unrealized appreciation on swap contracts | 707† | Net Assets — Unrealized depreciation on swap contracts | 311† | |||||||||
Foreign exchange contracts | Unrealized gain on forward foreign currency contracts | 868 | Unrealized loss on forward foreign currency contracts | 920 | ||||||||
Credit contracts | Net Assets — Unrealized appreciation on swap contracts | 257† | Net Assets — Unrealized depreciation on swap contracts | 238† | ||||||||
|
|
|
| |||||||||
Total Derivatives not accounted for as hedging instruments | $2,699 | $2,110 | ||||||||||
|
|
|
| |||||||||
Multi-Asset Accumulation Fund | ||||||||||||
Interest rate contracts | Net Assets — Unrealized appreciation on futures contracts | $557* | Net Assets — Unrealized depreciation on futures contracts | $41,709* | ||||||||
Net Assets — Unrealized appreciation on swap contracts | –† | Net Assets — Unrealized depreciation on swap contracts | 5,711† | |||||||||
Equity contracts | Net Assets — Unrealized appreciation on futures contracts | 7,091* | Net Assets — Unrealized depreciation on futures contracts | 14,216* | ||||||||
Net Assets — Unrealized appreciation on swap contracts | 3,623† | Net Assets — Unrealized depreciation on swap contracts | 146† | |||||||||
Foreign exchange contracts | Unrealized gain on forward foreign currency contracts | 11,307 | Unrealized loss on forward foreign currency contracts | 3,736 | ||||||||
Commodity contracts | Net Assets — Unrealized appreciation on futures contracts | 6,384* | Net Assets — Unrealized depreciation on futures contracts | 10,937* | ||||||||
|
|
|
| |||||||||
Total Derivatives not accounted for as hedging instruments | $28,962 | $76,455 | ||||||||||
|
|
|
| |||||||||
| SEI Institutional Managed Trust / Semi-Annual Report / March 31, 2021 | 327 |
Notes to Financial Statements/Consolidated Notes to Financial Statements (Continued)
March 31, 2021 (Unaudited)
| Asset Derivatives | Liability Derivatives | |||||||||||
| Statement of Assets and Liabilities/ Consolidated Statement of Assets and Liabilities Location | Fair Value | Statement of Assets and Liabilities/ Consolidated Statement of Assets and Liabilities Location | Fair Value | |||||||||
Derivatives not accounted for as hedging instruments: | ||||||||||||
Multi-Asset Income Fund | ||||||||||||
Interest rate contracts | Net Assets — Unrealized appreciation on futures contracts | $710* | Net Assets — Unrealized depreciation on futures contracts | $4,598* | ||||||||
Net Assets — Unrealized appreciation on swap contracts | 3,542† | Net Assets — Unrealized depreciation on swap contracts | 334† | |||||||||
Options purchased, at value | 214 | Options written, at value | 2,144 | |||||||||
Equity contracts | Net Assets — Unrealized appreciation on futures contracts | 429* | Net Assets — Unrealized depreciation on futures contracts | –* | ||||||||
Foreign exchange contracts | Unrealized gain on forward foreign currency contracts | 2,459 | Unrealized loss on forward foreign currency contracts | 782 | ||||||||
Options purchased, at value | 88 | Options written, at value | 74 | |||||||||
Credit contracts | Net Assets — Unrealized appreciation on swap contracts | 1,721† | Net Assets — Unrealized depreciation on swap contracts | 42† | ||||||||
|
|
|
| |||||||||
Total Derivatives not accounted for as hedging instruments | $9,163 | $7,974 | ||||||||||
|
|
|
| |||||||||
Multi-Asset Inflation Managed Fund | ||||||||||||
Interest rate contracts | Net Assets — Unrealized appreciation on futures contracts | $2,050* | Net Assets — Unrealized depreciation on futures contracts | $104* | ||||||||
Net Assets — Unrealized appreciation on swap contracts | 1,286† | Net Assets — Unrealized depreciation on swap contracts | 2,841† | |||||||||
Options purchased, at value | 1,500 | Options written, at value | 631 | |||||||||
Equity contracts | Net Assets — Unrealized appreciation on futures contracts | –* | Net Assets — Unrealized depreciation on futures contracts | 97* | ||||||||
Net Assets — Unrealized appreciation on swap contracts | –† | Net Assets — Unrealized depreciation on swap contracts | 1,014† | |||||||||
Foreign exchange contracts | Unrealized gain on forward foreign currency contracts | 1,436 | Unrealized loss on forward foreign currency contracts | 944 | ||||||||
Commodity contracts | Net Assets — Unrealized appreciation on futures contracts | 6,113* | Net Assets — Unrealized depreciation on future contracts | 2,859* | ||||||||
Credit contracts | Net Assets — Unrealized appreciation on swaps contracts | 407† | Net Assets — Unrealized depreciation on swaps contracts | 3,515† | ||||||||
|
|
|
| |||||||||
Total Derivatives not accounted for as hedging instruments | $12,792 | $12,005 | ||||||||||
|
|
|
| |||||||||
Multi-Asset Capital Stability Fund | ||||||||||||
Interest rate contracts | Net Assets — Unrealized appreciation on futures contracts | $141* | Net Assets — Unrealized depreciation on futures contracts | $880* | ||||||||
Net Assets — Unrealized appreciation on swap contracts | –† | Net Assets — Unrealized depreciation on swap contracts | 908† | |||||||||
Equity contracts | Options purchased, at value | 22 | Options written, at value | 4 | ||||||||
Net Assets — Unrealized appreciation on futures contracts | 151* | Net Assets — Unrealized depreciation on futures contracts | 386* | |||||||||
Net Assets — Unrealized appreciation on swap contracts | 2† | Net Assets — Unrealized depreciation on swap contracts | 4† | |||||||||
Foreign exchange contracts | Unrealized gain on forward foreign currency contracts | 4,907 | Unrealized loss on forward foreign currency contracts | 476 | ||||||||
Credit contracts | Net Assets — Unrealized appreciation on swap contracts | 579† | Net Assets — Unrealized depreciation on swap contracts | –† | ||||||||
|
|
|
| |||||||||
Total Derivatives not accounted for as hedging instruments | $5,802 | $2,658 | ||||||||||
|
|
|
| |||||||||
| * | Includes cumulative appreciation/depreciation of futures contracts as reported in the Schedules of Investments. Only current day’s variation margin is reported within the Statements of Assets & Liabilities or Consolidated Statements of Assets & Liabilities. |
| † | Includes cumulative appreciation/depreciation of swap contracts as reported in the Schedules of Investments. Market Value is reported within the Statements of |
| 328 | SEI Institutional Managed Trust / Semi-Annual Report / March 31, 2021 |
Assets & Liabilities or Consolidated Statements of Assets & Liabilities for swap contracts that have paid premiums.
The effect of derivative instruments on the Statements of Operations/Consolidated Statements of Operations for the six month period ended March 31, 2021:
Amount of realized gain or (loss) on derivatives recognized in income ($ Thousands):
| Derivatives Not Accounted for as Hedging Instruments | Options | Swaptions | Futures | Forward Foreign Currency Contracts | Swaps | Total | ||||||||||||||||||
Global Managed Volatility Fund |
| |||||||||||||||||||||||
Equity contracts | $ | – | $ | – | $ | 1,460 | $ | – | $ | – | $ | 1,460 | ||||||||||||
Foreign exchange contracts | – | – | – | (2,782 | ) | – | (2,782) | |||||||||||||||||
Total | $ | – | $ | – | $ | 1,460 | $ | (2,782 | ) | $ | – | $ | (1,322) | |||||||||||
Core Fixed Income Fund |
| |||||||||||||||||||||||
Interest rate contracts | $ | (282 | ) | $ | – | $ | (10,638 | ) | $ | – | $ | 504 | $ | (10,416) | ||||||||||
Equity contracts | – | – | – | – | – | – | ||||||||||||||||||
Foreign exchange contracts | – | – | – | 429 | – | 429 | ||||||||||||||||||
Credit contracts | – | – | – | – | 4,432 | 4,432 | ||||||||||||||||||
Total | $ | (282 | ) | $ | – | $ | (10,638 | ) | $ | 429 | $ | 4,936 | $ | (5,555) | ||||||||||
Dynamic Asset Allocation Fund |
| |||||||||||||||||||||||
Interest rate contracts | $ | – | $ | 2,956 | $ | – | $ | – | $ | – | $ | 2,956 | ||||||||||||
Credit contracts | – | – | – | – | (16 | ) | (16) | |||||||||||||||||
Equity contracts | – | – | 12,727 | – | 1,487 | 14,214 | ||||||||||||||||||
Commodity contracts | – | – | – | – | (2,261 | ) | (2,261) | |||||||||||||||||
Foreign exchange contracts | – | – | – | (20 | ) | – | (20) | |||||||||||||||||
Total | $ | – | $ | 2,956 | $ | 12,727 | $ | (20 | ) | $ | (790 | ) | $ | 14,873 | ||||||||||
Multi-Strategy Alternative Fund |
| |||||||||||||||||||||||
Credit contracts | $ | – | $ | – | $ | – | $ | – | $ | (93 | ) | $ | (93) | |||||||||||
Equity contracts | (308 | ) | – | (305 | ) | – | (1,037 | ) | (1,650) | |||||||||||||||
Interest rate contracts | – | 10 | 77 | – | 179 | 266 | ||||||||||||||||||
Foreign exchange contracts | – | – | – | (796 | ) | – | (796) | |||||||||||||||||
Total | $ | (308 | ) | $ | 10 | $ | (228 | ) | $ | (796 | ) | $ | (951 | ) | $ | (2,273) | ||||||||
Multi-Asset Accumulation Fund |
| |||||||||||||||||||||||
Equity contracts | $ | – | $ | – | $ | (107,323 | ) | $ | – | $ | – | $ | (107,323) | |||||||||||
Interest rate contracts | – | – | 224,766 | – | (2,548 | ) | 222,218 | |||||||||||||||||
Foreign exchange contracts | – | – | – | 5,080 | – | 5,080 | ||||||||||||||||||
Commodity contracts | – | – | 76,091 | – | 30,684 | 106,775 | ||||||||||||||||||
Total | $ | – | $ | – | $ | 193,534 | $ | 5,080 | $ | 28,136 | $ | 226,750 | ||||||||||||
Multi-Asset Income Fund |
| |||||||||||||||||||||||
Equity contracts | $ | (4,415 | ) | $ | – | $ | 7,275 | $ | – | $ | – | $ | 2,860 | |||||||||||
Credit contracts | – | – | – | – | 868 | 868 | ||||||||||||||||||
Interest rate contracts | (713 | ) | – | (9,040 | ) | – | 699 | (9,054) | ||||||||||||||||
Foreign exchange contracts | (34 | ) | – | – | (2,045 | ) | – | (2,079) | ||||||||||||||||
Total | $ | (5,162 | ) | $ | – | $ | (1,765 | ) | $ | (2,045 | ) | $ | 1,567 | $ | (7,405) | |||||||||
Multi-Asset Inflation Managed Fund |
| |||||||||||||||||||||||
Credit contracts | $ | – | $ | – | $ | – | $ | – | $ | (2,917 | ) | $ | (2,917) | |||||||||||
Equity contracts | – | – | (3,664 | ) | – | 7,380 | 3,716 | |||||||||||||||||
Interest rate contracts | – | 1,106 | 3,582 | – | (1,639 | ) | 3,049 | |||||||||||||||||
Foreign exchange contracts | – | – | – | (1,901 | ) | – | (1,901) �� | |||||||||||||||||
Commodity contracts | (2,056 | ) | – | 19,926 | – | – | 17,870 | |||||||||||||||||
| SEI Institutional Managed Trust / Semi-Annual Report / March 31, 2021 | 329 |
Notes to Financial Statements/Consolidated Notes to Financial Statements (Continued)
March 31, 2021 (Unaudited)
| Derivatives Not Accounted for as Hedging Instruments | Options | Swaptions | Futures | Forward Foreign Currency Contracts | Swaps | Total | ||||||||||||||||||
Total | $ | (2,056 | ) | $ | 1,106 | $ | 19,844 | $ | (1,901 | ) | $ | 2,824 | $ | 19,817 | ||||||||||
Multi-Asset Capital Stability Fund | ||||||||||||||||||||||||
Credit contracts | $ | – | $ | – | $ | – | $ | – | $ | 545 | $ | 545 | ||||||||||||
Equity contracts | 614 | – | 9,082 | – | – | 9,696 | ||||||||||||||||||
Interest rate contracts | – | – | (3,288 | ) | – | (1,115 | ) | (4,403) | ||||||||||||||||
Foreign exchange contracts | – | – | – | 1,104 | – | 1,104 | ||||||||||||||||||
Total | $ | 614 | $ | – | $ | 5,794 | $ | 1,104 | $ | (570 | ) | $ | 6,942 | |||||||||||
Change in unrealized appreciation or (depreciation) on derivatives recognized in income ($ Thousands):
| Derivatives Not Accounted for as Hedging Instruments | Options | Swaptions | Futures | Forward Foreign Currency Contracts | Swaps | Total | ||||||||||||||||||
Global Managed Volatility Fund |
| |||||||||||||||||||||||
Equity contracts | $ | – | $ | – | $ | 39 | $ | – | $ | – | $ | 39 | ||||||||||||
Foreign exchange contracts | – | – | – | 2,416 | – | 2,416 | ||||||||||||||||||
Total | $ | – | $ | – | $ | 39 | $ | 2,416 | $ | – | $ | 2,455 | ||||||||||||
Core Fixed Income Fund |
| |||||||||||||||||||||||
Credit contracts | $ | – | $ | – | $ | – | $ | – | $ | (929 | ) | $ | (929) | |||||||||||
Interest rate contracts | 200 | 201 | (9,130 | ) | – | 10,314 | 1,585 | |||||||||||||||||
Foreign exchange contracts | – | – | – | 1,160 | – | 1,160 | ||||||||||||||||||
Total | $ | 200 | $ | 201 | $ | (9,130 | ) | $ | 1,160 | $ | 9,385 | $ | 1,816 | |||||||||||
Dynamic Asset Allocation Fund |
| |||||||||||||||||||||||
Equity contracts | $ | – | $ | – | $ | 551 | $ | – | $ | – | $ | 551 | ||||||||||||
Interest rate contracts | 2,570 | 12,022 | – | – | 1,265 | 15,857 | ||||||||||||||||||
Foreign exchange contracts | – | – | – | (38 | ) | – | (38) | |||||||||||||||||
Commodity contracts | – | – | – | – | (2,181 | ) | (2,181) | |||||||||||||||||
Total | $ | 2,570 | $ | 12,022 | $ | 551 | $ | (38 | ) | $ | (916 | ) | $ | 14,189 | ||||||||||
Multi-Strategy Alternative Fund |
| |||||||||||||||||||||||
Credit contracts | $ | – | $ | – | $ | – | $ | – | $ | (198 | ) | $ | (198) | |||||||||||
Equity contracts | (237 | ) | – | (1 | ) | – | 401 | 163 | ||||||||||||||||
Interest rate contracts | – | 3 | 85 | – | (22 | ) | 66 | |||||||||||||||||
Foreign exchange contracts | – | – | – | (69 | ) | – | (69) | |||||||||||||||||
Total | $ | (237 | ) | $ | 3 | $ | 84 | $ | (69 | ) | $ | 181 | $ | (38) | ||||||||||
Multi-Asset Accumulation Fund |
| |||||||||||||||||||||||
Equity contracts | $ | – | $ | – | $ | (9,362 | ) | $ | – | $ | 1,592 | $ | (7,770) | |||||||||||
Interest rate contracts | – | – | (47,831 | ) | – | (6,553 | ) | (54,384) | ||||||||||||||||
Foreign exchange contracts | – | – | – | 7,285 | – | 7.285 | ||||||||||||||||||
Commodity contracts | – | – | (10,806 | ) | – | – | (10,806) | |||||||||||||||||
Total | $ | – | $ | – | $ | (67,999 | ) | $ | 7,285 | $ | (4,961 | ) | $ | (65,675) | ||||||||||
Multi-Asset Income Fund |
| |||||||||||||||||||||||
Credit contracts | $ | – | $ | – | $ | – | $ | – | $ | 1,444 | $ | 1,444 | ||||||||||||
Equity contracts | 224 | – | 378 | – | – | 602 | ||||||||||||||||||
Interest rate contracts | (1,177 | ) | – | (3,742 | ) | – | 1,429 | (3,490) | ||||||||||||||||
Foreign exchange contracts | (22 | ) | – | – | 1,635 | – | 1,613 | |||||||||||||||||
Total | $ | (975 | ) | $ | – | $ | (3,364 | ) | $ | 1,635 | $ | 2,873 | $ | 169 | ||||||||||
| 330 | SEI Institutional Managed Trust / Semi-Annual Report / March 31, 2021 |
| Derivatives Not Accounted for as Hedging Instruments | Options | Swaptions | Futures | Forward Foreign Currency Contracts | Swaps | Total | ||||||||||||||||||
Multi-Asset Inflation Managed Fund |
| |||||||||||||||||||||||
Credit contracts | $ | — | $ | — | $ | — | $ | — | $ | 357 | $ | 357 | ||||||||||||
Equity contracts | — | — | (213 | ) | — | (1,014 | ) | (1,227) | ||||||||||||||||
Interest rate contracts | — | (306 | ) | 1,935 | — | 3,714 | 5,343 | |||||||||||||||||
Foreign exchange contracts | — | — | — | 102 | — | 102 | ||||||||||||||||||
Commodity contracts | (419 | ) | — | (148 | ) | — | 259 | (308) | ||||||||||||||||
Total | $ | (419 | ) | $ | (306 | ) | $ | 1,574 | $ | 102 | $ | 3,316 | $ | 4,267 | ||||||||||
Multi-Asset Capital Stability Fund |
| |||||||||||||||||||||||
Credit contracts | $ | — | $ | — | $ | — | $ | — | $ | 323 | $ | 323 | ||||||||||||
Equity contracts | (137 | ) | — | 340 | — | (1 | ) | 202 | ||||||||||||||||
Interest rate contracts | — | — | (835 | ) | — | (1,702 | ) | (2,537) | ||||||||||||||||
Foreign exchange contracts | — | — | — | 4,291 | — | 4,291 | ||||||||||||||||||
Total | $ | (137 | ) | $ | — | $ | (495 | ) | $ | 4,291 | $ | (1,380 | ) | $ | 2,279 | |||||||||
The following table discloses the volume of the Fund’s futures contracts, option contracts, forward foreign currency contracts, swap contracts and swaption contracts activity during the year ended March 31, 2021 ($ Thousands):
| Large Cap Fund | Large Cap Value Fund | Large Cap Growth Fund | Large Cap Index Fund | Tax-Managed Large Cap Fund | ||||||||||||||||||
Futures Contracts: | ||||||||||||||||||||||
Equity Contracts | ||||||||||||||||||||||
Average Notional Balance Long | $ | 10,841 | $ | 7,504 | $ | 16,907 | $ | 10,821 | $ | 8,194 | ||||||||||||
Ending Notional Balance Long | 10,672 | 7,039 | 13,846 | 7,773 | 8,261 | |||||||||||||||||
| S&P 500 Index Fund | Small Cap Fund | Small Cap Value Fund | Small Cap Growth Fund | Tax-Managed Small/ Mid Cap Fund | ||||||||||||||||||
Futures Contracts: | ||||||||||||||||||||||
Equity Contracts | ||||||||||||||||||||||
Average Notional Balance Long | $ | 7,498 | $ | 2,995 | $ | 5,990 | $ | 3,438 | $ | 1,301 | ||||||||||||
Ending Notional Balance Long | 10,871 | 5,991 | 2,995 | 6,875 | 2,061 | |||||||||||||||||
| Mid-Cap Fund | U.S. Managed Volatility Fund | Global Managed Volatility Fund | Tax-Managed Managed Volatility Fund | Tax-Managed Managed Volatility Fund | ||||||||||||||||||
Futures Contracts: | ||||||||||||||||||||||
Equity Contracts | ||||||||||||||||||||||
Average Notional Balance Long | $ | 45 | $ | 4,557 | $ | 13,486 | $ | 11,400 | $ | 2,513 | ||||||||||||
Ending Notional Balance Long | 181 | 6,542 | 12,840 | 9,913 | 4,090 | |||||||||||||||||
| | Core Fixed Income Fund |
| High Yield Bond Fund | | Dynamic Asset Allocation Fund | | | Multi-Strategy Alternative Fund | | |||||||||||||
Futures Contracts: | ||||||||||||||||||||||
Equity Contracts | ||||||||||||||||||||||
Average Notional Balance Long | $ | – | $ | – | $ | 81,274 | $ | – | ||||||||||||||
Average Notional Balance Short | – | – | – | 1,798 | ||||||||||||||||||
Ending Notional Balance Long | – | – | 83,799 | – | ||||||||||||||||||
Ending Notional Balance Short | – | – | – | 1,770 | ||||||||||||||||||
Interest Contracts | ||||||||||||||||||||||
Average Notional Balance Long | 956,050 | – | – | – | ||||||||||||||||||
Average Notional Balance Short | 1,202,205 | – | – | 1,553 | ||||||||||||||||||
Ending Notional Balance Long | 1,184,833 | – | – | – | ||||||||||||||||||
Ending Notional Balance Short | 1,268,139 | – | – | 3,106 | ||||||||||||||||||
Forward Foreign Currency Contracts: |
| |||||||||||||||||||||
Average Notional Balance Long | 148,637 | – | 94,075 | 84,977 | ||||||||||||||||||
| SEI Institutional Managed Trust / Semi-Annual Report / March 31, 2021 | 331 |
Notes to Financial Statements/Consolidated Notes to Financial Statements (Continued)
March 31, 2021 (Unaudited)
Core Fixed Income Fund | High Yield Bond Fund | Dynamic Asset Allocation Fund | Multi-Strategy Alternative Fund | |||||||||||||||||||
Forward Foreign Currency Contracts: (continued) |
| |||||||||||||||||||||
Average Notional Balance Short | 148,080 | – | 94,131 | 85,097 | ||||||||||||||||||
Ending Notional Balance Long | 148,765 | – | 42,134 | 87,495 | ||||||||||||||||||
Ending Notional Balance Short | 149,069 | – | 42,184 | 87,547 | ||||||||||||||||||
Swaps: |
| |||||||||||||||||||||
Total Return Contracts |
| |||||||||||||||||||||
Average Notional Balance Long | – | – | – | 2,153 | ||||||||||||||||||
Ending Notional Balance Long | – | – | – | 1,987 | ||||||||||||||||||
Credit Contracts |
| |||||||||||||||||||||
Average Notional Balance Long | – | – | – | 15,099 | ||||||||||||||||||
Average Notional Balance Short | 143,137 | 500 | – | 654 | ||||||||||||||||||
Ending Notional Balance Long | – | – | – | 13,629 | ||||||||||||||||||
Ending Notional Balance Short | 140,017 | 1,000 | – | 654 | ||||||||||||||||||
Interest Contracts |
| |||||||||||||||||||||
Average Notional Balance | 215,812 | – | – | – | ||||||||||||||||||
Ending Notional Balance | 230,596 | – | – | – | ||||||||||||||||||
Equity Contracts |
| |||||||||||||||||||||
Average Notional Balance Long | – | – | 12,685 | 7,651 | ||||||||||||||||||
Average Notional Balance Short | – | – | – | 8,956 | ||||||||||||||||||
Ending Notional Balance Long | – | – | 13,566 | 11,350 | ||||||||||||||||||
Ending Notional Balance Short | – | – | – | 12,572 | ||||||||||||||||||
Commodity Contracts |
| |||||||||||||||||||||
Average Notional Balance Long | – | – | 118,146 | – | ||||||||||||||||||
Average Notional Balance Short | – | – | – | – | ||||||||||||||||||
Ending Notional Balance Long | – | – | 118,300 | – | ||||||||||||||||||
Ending Notional Balance Short | – | – | – | – | ||||||||||||||||||
Options/Swaptions: |
| |||||||||||||||||||||
Equity |
| |||||||||||||||||||||
Average Notional Balance Long† | – | – | – | 1,081 | ||||||||||||||||||
Average Notional Balance Short† | – | – | – | 795 | ||||||||||||||||||
Ending Notional Balance Long† | – | – | – | 1,332 | ||||||||||||||||||
Ending Notional Balance Short† | – | – | – | 1,004 | ||||||||||||||||||
Interest |
| |||||||||||||||||||||
Average Notional Balance Long† | 373 | – | 5,492 | – | ||||||||||||||||||
Average Notional Balance Short† | 553 | – | – | – | ||||||||||||||||||
Ending Notional Balance Long† | 664 | – | 5,038 | – | ||||||||||||||||||
Ending Notional Balance Short† | 874 | – | – | – | ||||||||||||||||||
Currency |
| |||||||||||||||||||||
Average Notional Balance Long† | 78 | – | 411 | – | ||||||||||||||||||
Ending Notional Balance Long† | – | – | 823 | – | ||||||||||||||||||
| Multi-Asset Accumulation Fund | Multi-Asset Income Fund | Multi-Asset Inflation Managed Fund | Multi-Asset Capital Stability Fund | |||||||||||||||||||
Futures Contracts: |
| |||||||||||||||||||||
Commodity Contracts |
| |||||||||||||||||||||
Average Notional Balance Long | $ | – | $ | – | $ | 127,528 | $ | – | ||||||||||||||
Average Notional Balance Short | – | – | 29,083 | – | ||||||||||||||||||
Ending Notional Balance Long | – | – | 123,478 | – | ||||||||||||||||||
Ending Notional Balance Short | – | – | 29,579 | – | ||||||||||||||||||
Equity Contracts |
| |||||||||||||||||||||
Average Notional Balance Long | 941,728 | 40,583 | – | 72,263 | ||||||||||||||||||
Average Notional Balance Short | – | – | 36,483 | 13,038 | ||||||||||||||||||
Ending Notional Balance Long | 947,188 | 35,675 | – | 58,991 | ||||||||||||||||||
Ending Notional Balance Short | – | – | 37,946 | 19,164 | ||||||||||||||||||
Interest Contracts |
| |||||||||||||||||||||
| 332 | SEI Institutional Managed Trust / Semi-Annual Report / March 31, 2021 |
| | Multi-Asset Accumulation Fund | | | Multi-Asset Income Fund | | | Multi-Asset Inflation Managed Fund | | | Multi-Asset Capital Stability Fund | | |||||||||||
Futures Contracts: (continued) |
| |||||||||||||||||||||
Average Notional Balance Long | 2,598,673 | 297,928 | 4,884 | 95,379 | ||||||||||||||||||
Average Notional Balance Short | – | 93,998 | 173,709 | 22,873 | ||||||||||||||||||
Ending Notional Balance Long | 2,841,192 | 326,010 | 9,768 | 50,011 | ||||||||||||||||||
Ending Notional Balance Short | – | 58,926 | 271,312 | 29,698 | ||||||||||||||||||
Forward Foreign Currency Contracts: |
| |||||||||||||||||||||
Average Notional Balance Long | 836,577 | 151,150 | 146,236 | 186,179 | ||||||||||||||||||
Average Notional Balance Short | 835,173 | 151,185 | 146,552 | 184,535 | ||||||||||||||||||
Ending Notional Balance Long | 919,472 | 150,494 | 148,862 | 182,028 | ||||||||||||||||||
Ending Notional Balance Short | 911,901 | 148,817 | 148,365 | 177,597 | ||||||||||||||||||
Swaps: |
| |||||||||||||||||||||
Total Return Contracts |
| |||||||||||||||||||||
Average Notional Balance Short | – | – | 16,070 | – | ||||||||||||||||||
Ending Notional Balance Short | – | – | 16,070 | – | ||||||||||||||||||
Credit Contracts |
| |||||||||||||||||||||
Average Notional Balance Long | – | 3,786 | 226,184 | – | ||||||||||||||||||
Average Notional Balance Short | – | 82,171 | 79,949 | 28,550 | ||||||||||||||||||
Ending Notional Balance Long | – | 5,378 | 297,585 | – | ||||||||||||||||||
Ending Notional Balance Short | – | 82,053 | 151,910 | 24,784 | ||||||||||||||||||
Interest Contracts |
| |||||||||||||||||||||
Average Notional Balance | 639,363 | 113,212 | 155,305 | – | ||||||||||||||||||
Ending Notional Balance | 812,411 | 108,991 | 81,761 | – | ||||||||||||||||||
Equity Contracts |
| |||||||||||||||||||||
Average Notional Balance Long | 112,868 | – | – | – | ||||||||||||||||||
Ending Notional Balance Long | 104,517 | – | – | – | ||||||||||||||||||
Commodity Contracts |
| |||||||||||||||||||||
Average Notional Balance Long | – | – | 45,174 | – | ||||||||||||||||||
Average Notional Balance Short | – | – | – | – | ||||||||||||||||||
Ending Notional Balance Long | – | – | 46,407 | – | ||||||||||||||||||
Ending Notional Balance Short | – | – | – | – | ||||||||||||||||||
Options/Swaptions: |
| |||||||||||||||||||||
Commodity |
| |||||||||||||||||||||
Average Notional Balance Long† | – | – | 1,228 | – | ||||||||||||||||||
Average Notional Balance Short† | – | – | 411 | – | ||||||||||||||||||
Ending Notional Balance Long† | – | – | 1,435 | – | ||||||||||||||||||
Ending Notional Balance Short† | – | – | 400 | – | ||||||||||||||||||
Equity |
| |||||||||||||||||||||
Average Notional Balance Long† | – | 443 | – | 336 | ||||||||||||||||||
Average Notional Balance Short† | – | 3,159 | – | 266 | ||||||||||||||||||
Ending Notional Balance Long† | – | 472 | – | 233 | ||||||||||||||||||
Ending Notional Balance Short† | – | 2,815 | – | 134 | ||||||||||||||||||
Interest |
| |||||||||||||||||||||
Average Notional Balance Long† | – | 21 | – | – | ||||||||||||||||||
Average Notional Balance Short† | – | 17 | – | – | ||||||||||||||||||
Ending Notional Balance Long† | – | 42 | – | – | ||||||||||||||||||
Ending Notional Balance Short† | – | 34 | – | – | ||||||||||||||||||
Currency |
| |||||||||||||||||||||
Average Notional Balance Long† | – | 158 | – | – | ||||||||||||||||||
Average Notional Balance Short† | – | 137 | – | – | ||||||||||||||||||
Ending Notional Balance Long† | – | 163 | – | – | ||||||||||||||||||
Ending Notional Balance Short† | – | 95 | – | – | ||||||||||||||||||
† Represents cost.
A Fund is subject to various netting arrangements with select counterparties (“Master Agreements”). Master Agreements govern the terms of certain transactions, and reduce the counterparty risk associated with relevant transactions by specifying credit protection mechanisms and providing standardization that improves legal certainty. Since different types of transactions have
different mechanics and are sometimes traded out of different legal entities of a particular counterparty organization, each type of transaction may be covered by a different Master Agreement, resulting in the need for multiple agreements with a single counterparty. As the Master Agreements are specific to unique operations of
| SEI Institutional Managed Trust / Semi-Annual Report / March 31, 2021 | 333 |
Notes to Financial Statements/Consolidated Notes to Financial Statements (Continued)
March 31, 2021 (Unaudited)
different asset types, they allow a Fund to close out and net its total exposure to a specific counterparty entity in the event of a default with respect to all the transactions governed under a single agreement with a specific counterparty entity.
Master Agreements can also help limit counterparty risk by specifying collateral posting arrangements at pre-arranged exposure levels. Under the Master Agreements, collateral is routinely transferred if the total net exposure to certain transactions (net of existing collateral already in place) governed under the relevant Master Agreement with a counterparty in a given account exceeds a specified threshold, which typically ranges from zero to $250,000 depending on the counterparty and the type of Master Agreement. United States Treasury Securities and U.S. dollar cash are generally the preferred forms of collateral. Securities and cash pledged as collateral are reflected as assets on the Statements of Assets and Liabilities or Consolidated Statements of Assets and Liabilities as either a component of investments at value (securities) or deposits due from counterparties (cash). Cash collateral received is not typically held in a segregated account and as such is reflected as a liability on the Statements of Assets and Liabilities or Consolidated Statements of Assets and Liabilities as deposits due to counterparties. The market value of any securities received as collateral is not reflected as a component of net asset value. A Fund’s overall exposure to counterparty risk can change substantially within a short period, as it is affected by each transaction subject to the relevant Master Agreement.
Customer Account Agreements and related addendums govern exchange traded derivatives transactions such as futures, options on futures, and centrally cleared swaps. Exchange traded derivative transactions require posting of initial margin as determined by each relevant clearing agency which is segregated at a broker account registered with the Commodities Futures Trading Commission (“CFTC”), or the applicable regulator. In the U.S., counterparty risk is reduced as placement due to the Fund assets in the segregated account. Additionally, portability of exposure in the event of default further reduces risk to the Funds. Variation margin, or changes in market value, are exchanged daily, but may not be netted between futures and cleared OTC derivatives. Refer to each Funds Statement of Assets and Liabilities or Consolidated Statement of Assets and Liabilities for market value and variation margin of exchange-traded or centrally cleared financial derivative instruments.
Securities with an aggregate market value of $0 ($ Thousands) have been pledged and $163,983 ($ Thousands) in cash has been pledged as collateral
for exchange-traded and centrally cleared derivative instruments as of March 31, 2021.
The table below summarizes the collateral pledged by Fund:
Securities at | Cash ($ Thousands) | Total ($ Thousands) | ||||||||||
Large Cap Fund | $ | – | $ | 690 | $ | 690 | ||||||
Large Cap Value Fund | – | 385 | 385 | |||||||||
Large Cap Growth Fund | – | 948 | 948 | |||||||||
Large Cap Index Fund | – | 434 | 434 | |||||||||
S&P 500 Index Fund | – | 418 | 418 | |||||||||
Small Cap Fund | – | 273 | 273 | |||||||||
Small Cap Value Fund | – | 306 | 306 | |||||||||
Small Cap Growth Fund | – | 397 | 397 | |||||||||
Tax-Managed Small/Mid Cap Fund | – | 145 | 145 | |||||||||
Mid-Cap Fund | – | 27 | 27 | |||||||||
U.S. Managed Volatility Fund | – | 396 | 396 | |||||||||
Global Managed Volatility Fund | – | 244 | 244 | |||||||||
Tax-Managed Managed Volatility Fund | – | 572 | 572 | |||||||||
Tax-Managed International Managed Volatility Fund | – | 335 | 335 | |||||||||
Core Fixed Income Fund | – | 14,868 | 14,868 | |||||||||
Dynamic Asset Allocation Fund | – | 2,502 | 2,502 | |||||||||
Multi-Strategy Alternative Fund | – | 277 | 277 | |||||||||
Multi-Asset Accumulation Fund | – | 71,106 | 71,106 | |||||||||
Multi-Asset Income Fund | – | 49,942 | 49,942 | |||||||||
Multi-Asset Inflation Managed Fund | – | 14,212 | 14,212 | |||||||||
Multi-Asset Capital Stability Fund | – | 5,506 | 5,506 | |||||||||
International Swaps and Derivatives Association, Inc. Master Agreements and Credit Support Annexes (“ISDA Master Agreements”) govern OTC financial derivative transactions entered into by a Fund and select counterparties. ISDA Master Agreements maintain provisions for general obligations, representations, agreements, collateral and events of default or termination. Events of termination include conditions that may entitle counterparties to elect to terminate early and cause settlement of all outstanding transactions under the applicable ISDA Master Agreement. Any election to terminate early could be material to the financial statements. In limited circumstances, the ISDA Master Agreement may contain additional provisions that add additional counterparty protection beyond coverage of existing daily exposure if the counterparty has a decline in credit quality below a predefined level. These amounts, if any, may be segregated with a third party custodian.
| 334 | SEI Institutional Managed Trust / Semi-Annual Report / March 31, 2021 |
The following is a summary by counterparty of the market value of OTC financial derivative instruments and collateral (received)/pledged as of March 31, 2021 ($ Thousands):
| Financial Derivative Assets | Financial Derivative Liabilities | |||||||||||||||||||||||||||||||||||||||||||||||||||||||
| Global Managed Volatility Fund | Forward Foreign Currency Contracts | Purchased Options and Swaptions | Swap Agreements | Total Over the Counter | Forward Foreign Currency Contracts | Written Options and Swaptions | Swap Agreements | Reverse Repurchase Agreements | Total Over the Counter | Net Market Value of OTC Derivatives | Collateral (Received) Pledged | Net Exposures(1) | ||||||||||||||||||||||||||||||||||||||||||||
Brown Brothers Harriman | $ 4,802 | $ — | $ — | $ 4,802 | $ | (167) | $ — | $ — | $ — | $ | (167) | $ 4,635 | $ — | $ 4,635 | ||||||||||||||||||||||||||||||||||||||||||
|
|
|
| |||||||||||||||||||||||||||||||||||||||||||||||||||||
Total Over the Counter | $ 4,802 | $ — | $ — | $ 4,802 | $ | (167) | $ — | $ — | $ — | $ | (167) | |||||||||||||||||||||||||||||||||||||||||||||
| Financial Derivative Assets | Financial Derivative Liabilities | |||||||||||||||||||||||||||||||||||||||||||||||||||||||
| Core Fixed Income Fund | Forward Foreign Currency Contracts | Purchased Options and Swaptions | Swap Agreements | Total Over the Counter | Forward Foreign Currency Contracts | Written Options and Swaptions | Swap Agreements | Reverse Repurchase Agreements | Total Over the Counter | Net Market Value of OTC Derivatives | Collateral (Received) Pledged | Net Exposures(1) | ||||||||||||||||||||||||||||||||||||||||||||
BNP Paribas | $ 832 | $ — | $ — | $ 832 | $ | — | $ — | $ — | $ — | $ | — | $ 832 | $ — | $ 832 | ||||||||||||||||||||||||||||||||||||||||||
Citigroup | 368 | — | — | 368 | (2,270) | — | — | — | (2,270) | (1,902 | ) | 1,902 | — | |||||||||||||||||||||||||||||||||||||||||||
Goldman Sachs | 854 | — | — | 854 | (88) | — | — | — | (88) | 766 | — | 766 | ||||||||||||||||||||||||||||||||||||||||||||
|
|
|
| |||||||||||||||||||||||||||||||||||||||||||||||||||||
Total Over the Counter | $ 2,054 | $ — | $ — | $ 2,054 | $ | (2,358) | $ — | $ — | $ — | $ | (2,358) | |||||||||||||||||||||||||||||||||||||||||||||
| Financial Derivative Assets | Financial Derivative Liabilities | |||||||||||||||||||||||||||||||||||||||||||||||||||||||
| Dynamic Asset Allocation Fund | Forward Foreign Currency Contracts | Purchased Options and Swaptions | Swap Agreements | Total Over the Counter | Forward Foreign Currency Contracts | Written Options and Swaptions | Swap Agreements | Reverse Repurchase Agreements | Total Over the Counter | Net Market Value of OTC Derivatives | Collateral (Received) Pledged | Net Exposures(1) | ||||||||||||||||||||||||||||||||||||||||||||
Bank of America | $ — | $ 19,052 | $ — | $ 19,052 | $ | (50) | $ — | $ — | $ — | $ | (50) | $ 19,002 | $ — | $ 19,002 | ||||||||||||||||||||||||||||||||||||||||||
BNP Paribas | — | — | — | — | — | — | (2,293 | ) | — | (2,293) | (2,293 | ) | — | (2,293 | ) | |||||||||||||||||||||||||||||||||||||||||
|
|
|
| |||||||||||||||||||||||||||||||||||||||||||||||||||||
Total Over the Counter | $ — | $ 19,052 | $ — | $ 19,052 | $ | (50) | $ — | $ (2,293) | $ — | $ | (2,343) | |||||||||||||||||||||||||||||||||||||||||||||
| Financial Derivative Assets | Financial Derivative Liabilities | |||||||||||||||||||||||||||||||||||||||||||||||||||||||
| Multi-Strategy Alternative Fund | Forward Foreign Currency Contracts | Purchased Options and Swaptions | Swap Agreements | Total Over the Counter | Forward Foreign Currency Contracts | Written Options and Swaptions | Swap Agreements | Reverse Repurchase Agreements | Total Over the Counter | Net Market Value of OTC Derivatives | Collateral (Received) Pledged | Net Exposures(1) | ||||||||||||||||||||||||||||||||||||||||||||
Bank of America | $ — | $ — | $ 92 | $ 92 | $ | (2) | $ — | $ — | $ — | $ | (2) | $ 90 | $ — | $ 90 | ||||||||||||||||||||||||||||||||||||||||||
Barclays PLC | 33 | — | — | 33 | (205) | — | — | — | (205) | (172 | ) | — | (172 | ) | ||||||||||||||||||||||||||||||||||||||||||
BNYMellon | 23 | — | — | 23 | (5) | — | — | — | (5) | 18 | — | 18 | ||||||||||||||||||||||||||||||||||||||||||||
Citi | 18 | — | — | 18 | (18) | — | — | — | (18) | — | — | — | ||||||||||||||||||||||||||||||||||||||||||||
Credit Suisse | 11 | — | — | 11 | — | — | — | — | — | 11 | — | 11 | ||||||||||||||||||||||||||||||||||||||||||||
Deutsche Bank | 39 | — | 20 | 59 | (17) | — | — | — | (17) | 42 | — | 42 | ||||||||||||||||||||||||||||||||||||||||||||
Goldman Sachs | 136 | — | 634 | 770 | (147) | — | (161 | ) | — | (308) | 462 | — | 462 | |||||||||||||||||||||||||||||||||||||||||||
HSBC | 31 | — | — | 31 | (105) | — | — | — | (105) | (74 | ) | — | (74 | ) | ||||||||||||||||||||||||||||||||||||||||||
JPMorgan Chase Bank | 62 | — | — | 62 | (88) | — | — | — | (88) | (26 | ) | 26 | — | |||||||||||||||||||||||||||||||||||||||||||
Montgomery/Bank of America | 40 | — | — | 40 | (18) | — | — | — | (18) | 22 | — | 22 | ||||||||||||||||||||||||||||||||||||||||||||
Morgan Stanley | 130 | — | 73 | 203 | (110) | — | (95 | ) | — | (205) | (2 | ) | — | (2 | ) | |||||||||||||||||||||||||||||||||||||||||
Natwest Markets | 1 | — | — | 1 | (3) | — | — | — | (3) | (2 | ) | — | (2 | ) | ||||||||||||||||||||||||||||||||||||||||||
State Street | 228 | — | — | 228 | (41) | — | — | — | (41) | 187 | — | 187 | ||||||||||||||||||||||||||||||||||||||||||||
TD Bank | 25 | — | — | 25 | (5) | — | — | — | (5) | 20 | — | 20 | ||||||||||||||||||||||||||||||||||||||||||||
UBS | 57 | — | — | 57 | (140) | — | — | — | (140) | (83 | ) | — | (83 | ) | ||||||||||||||||||||||||||||||||||||||||||
Westpac Banking | 34 | — | — | 34 | (16) | — | — | — | (16) | 18 | — | 18 | ||||||||||||||||||||||||||||||||||||||||||||
|
|
|
| |||||||||||||||||||||||||||||||||||||||||||||||||||||
Total Over the Counter | $ 868 | $ — | $ 819 | $ 1,687 | $ | (920) | $ — | $ (256 | ) | $ — | $ | (1,176) | ||||||||||||||||||||||||||||||||||||||||||||
| Financial Derivative Assets | Financial Derivative Liabilities | |||||||||||||||||||||||||||||||||||||||||||||||||||||||
| Multi-Asset Accumulation Fund | Forward Foreign Currency Contracts | Purchased Options and Swaptions | Swap Agreements | Total Over the Counter | Forward Foreign Currency Contracts | Written Options and Swaptions | Swap Agreements | Reverse Repurchase Agreements | Total Over the Counter | Net Market Value of OTC Derivatives | Collateral (Received) Pledged | Net Exposures(1) | ||||||||||||||||||||||||||||||||||||||||||||
Bank of America | $ — | $ — | $ 694 | $ 694 | $ | — | $ — | $ (127) | $ — | $ | (127) | $ 567 | $ — | $ 567 | ||||||||||||||||||||||||||||||||||||||||||
Bank of New York | — | — | — | — | (7) | — | — | — | (7) | (7 | ) | — | (7 | ) | ||||||||||||||||||||||||||||||||||||||||||
| SEI Institutional Managed Trust / Semi-Annual Report / March 31, 2021 | 335 |
Notes to Financial Statements/Consolidated Notes to Financial Statements (Continued)
March 31, 2021 (Unaudited)
| Financial Derivative Assets | Financial Derivative Liabilities | |||||||||||||||||||||||||||||||||||||||||||||||||||||||
| Multi-Asset Accumulation Fund | Forward Foreign Currency Contracts | Purchased Options and Swaptions | Swap Agreements | Total Over the Counter | Forward Foreign Currency Contracts | Written Options and Swaptions | Swap Agreements | Reverse Repurchase Agreements | Total Over Counter | Net Market Value of OTC Derivatives | Collateral (Received) Pledged | Net Exposures(1) | ||||||||||||||||||||||||||||||||||||||||||||
Barclays PLC | 18 | — | — | 18 | — | — | — | — | — | 18 | — | 18 | ||||||||||||||||||||||||||||||||||||||||||||
Citibank | — | — | 829 | 829 | — | — | — | — | — | 829 | — | 829 | ||||||||||||||||||||||||||||||||||||||||||||
Citigroup | 4,800 | — | — | 4,800 | (1,942) | — | — | — | (1,942) | 2,858 | — | 2,858 | ||||||||||||||||||||||||||||||||||||||||||||
JPMorgan Chase Bank | 4,783 | — | 579 | 5,362 | (1,775) | — | — | — | (1,775) | 3,587 | — | 3,587 | ||||||||||||||||||||||||||||||||||||||||||||
Merrill Lynch | — | — | 1,521 | 1,521 | — | — | (19 | ) | — | (19) | 1,502 | — | 1,502 | |||||||||||||||||||||||||||||||||||||||||||
State Street | 1,706 | — | — | 1,706 | (12) | — | — | — | (12) | 1,694 | — | 1,694 | ||||||||||||||||||||||||||||||||||||||||||||
|
|
|
| |||||||||||||||||||||||||||||||||||||||||||||||||||||
Total Over the Counter | $ 11,307 | $ — | $ 3,623 | $ 14,930 | $ | (3,736) | $ — | $ (146 | ) | $ — | $ | (3,882) | $11,048 | $11,048 | ||||||||||||||||||||||||||||||||||||||||||
| Financial Derivative Assets | Financial Derivative Liabilities | |||||||||||||||||||||||||||||||||||||||||||||||||||||||
| Multi-Asset Income Fund | Forward Foreign Currency Contracts | Purchased Options and Swaptions | Swap Agreements | Total Over the Counter | Forward Foreign Currency Contracts | Written Options and Swaptions | Swap Agreements | Reverse Repurchase Agreements | Total Over Counter | Net Market Value of OTC Derivatives | Collateral (Received) Pledged | Net Exposures(1) | ||||||||||||||||||||||||||||||||||||||||||||
ANZ | $ 69 | $ — | $ — | $ 69 | $ | — | $ — | $ — | $ — | $ | — | $ 69 | $ — | $ 69 | ||||||||||||||||||||||||||||||||||||||||||
BNP Paribas | 37 | — | — | 37 | (21) | — | — | — | (21) | 16 | — | 16 | ||||||||||||||||||||||||||||||||||||||||||||
Citibank | — | — | 187 | 187 | — | — | — | — | — | 187 | — | 187 | ||||||||||||||||||||||||||||||||||||||||||||
Citigroup | 483 | — | — | 483 | (310) | — | — | — | (310) | 173 | — | 173 | ||||||||||||||||||||||||||||||||||||||||||||
Goldman Sachs | 443 | — | — | 443 | (109) | — | — | — | (109) | 334 | — | 334 | ||||||||||||||||||||||||||||||||||||||||||||
HSBC | 685 | — | — | 685 | (1) | — | — | — | (1) | 684 | — | 684 | ||||||||||||||||||||||||||||||||||||||||||||
JPMorgan Chase Bank | 563 | — | 17 | 580 | (233) | — | — | — | (233) | 347 | — | 347 | ||||||||||||||||||||||||||||||||||||||||||||
Morgan Stanley | 129 | — | — | 129 | (46) | — | — | — | (46) | 83 | — | 83 | ||||||||||||||||||||||||||||||||||||||||||||
Standard Bank | 126 | — | — | 126 | — | — | — | — | — | 126 | — | 126 | ||||||||||||||||||||||||||||||||||||||||||||
State Street | — | — | — | — | (62) | — | — | — | (62) | (62 | ) | — | (62 | ) | ||||||||||||||||||||||||||||||||||||||||||
UBS | 24 | — | — | 24 | — | — | — | — | — | 24 | — | 24 | ||||||||||||||||||||||||||||||||||||||||||||
|
|
|
| |||||||||||||||||||||||||||||||||||||||||||||||||||||
Total Over the Counter | $ 2,559 | $ — | $ 204 | $ 2,763 | $ | (782) | $ — | $ — | $ — | $ | (782) | |||||||||||||||||||||||||||||||||||||||||||||
| Financial Derivative Assets | Financial Derivative Liabilities | |||||||||||||||||||||||||||||||||||||||||||||||||||||||
| Multi-Asset Inflation Managed Fund | Forward Foreign Currency Contracts | Purchased Options and Swaptions | Swap Agreements | Total Over the Counter | Forward Foreign Currency Contracts | Written Options and Swaptions | Swap Agreements | Reverse Repurchase Agreements | Total Over Counter | Net Market Value of OTC Derivatives | Collateral (Received) Pledged | Net Exposures(1) | ||||||||||||||||||||||||||||||||||||||||||||
Bank of America | $ — | $ — | $ — | $ — | $ | (25) | $ — | $ — | $ — | $ | (25) | $ (25) | — | $ (25) | ||||||||||||||||||||||||||||||||||||||||||
Barclays PLC | 10 | — | — | 10 | — | — | (173 | ) | — | (173) | (163 | ) | — | (163 | ) | |||||||||||||||||||||||||||||||||||||||||
BNP Paribas | 149 | — | — | 149 | (248) | — | — | — | (248) | (99 | ) | — | (99 | ) | ||||||||||||||||||||||||||||||||||||||||||
Brown Brothers Harriman | 5 | — | — | 5 | (14) | — | — | — | (14) | (9 | ) | — | (9 | ) | ||||||||||||||||||||||||||||||||||||||||||
CGG | — | — | — | — | — | — | (9 | ) | — | (9) | (9 | ) | — | (9 | ) | |||||||||||||||||||||||||||||||||||||||||
Chase Securities | — | — | — | — | — | — | — | (263,138 | ) | (263,138) | (263,138 | ) | — | (263,138 | ) | |||||||||||||||||||||||||||||||||||||||||
Citibank | — | — | 1,004 | 1,004 | — | — | (185 | ) | — | (185) | 819 | — | | 819 | | |||||||||||||||||||||||||||||||||||||||||
Citigroup | 491 | — | — | 491 | (1) | — | — | — | (1) | 490 | — | 490 | ||||||||||||||||||||||||||||||||||||||||||||
Credit Suisse | — | — | — | — | — | — | (413 | ) | — | (413) | (413 | ) | — | (413 | ) | |||||||||||||||||||||||||||||||||||||||||
Deutsche Bank | — | — | — | — | — | — | (429 | ) | — | (429) | (429 | ) | — | (429 | ) | |||||||||||||||||||||||||||||||||||||||||
Goldman Sachs | — | — | 57 | 57 | (73) | — | (555 | ) | — | (628) | (571 | ) | — | (571 | ) | |||||||||||||||||||||||||||||||||||||||||
HSBC | 7 | — | — | 7 | (392) | — | — | — | (392) | (385 | ) | — | (385 | ) | ||||||||||||||||||||||||||||||||||||||||||
JPMorgan Chase | — | — | 20 | 20 | (27) | — | (261 | ) | — | (288) | (268 | ) | — | (268 | ) | |||||||||||||||||||||||||||||||||||||||||
Macquarie Bank Limited | — | — | — | — | — | — | (269 | ) | — | (269) | (269 | ) | — | (269 | ) | |||||||||||||||||||||||||||||||||||||||||
Merrill Lynch | — | — | — | — | — | — | (354 | ) | — | (354) | (354 | ) | — | (354 | ) | |||||||||||||||||||||||||||||||||||||||||
Morgan Stanley | 573 | — | 91 | 664 | (5) | — | — | — | (5) | 659 | — | 659 | ||||||||||||||||||||||||||||||||||||||||||||
RBS | 14 | — | — | 14 | — | — | — | — | — | 14 | — | 14 | ||||||||||||||||||||||||||||||||||||||||||||
Societe Generale | — | — | — | — | — | — | (210 | ) | — | (210) | (210 | ) | — | (210 | ) | |||||||||||||||||||||||||||||||||||||||||
Standard Bank | 5 | — | — | 5 | — | — | — | — | — | 5 | — | 5 | ||||||||||||||||||||||||||||||||||||||||||||
UBS | 182 | — | — | 182 | (159) | — | — | — | (159) | 23 | — | 23 | ||||||||||||||||||||||||||||||||||||||||||||
|
|
|
| |||||||||||||||||||||||||||||||||||||||||||||||||||||
Total Over the Counter | $ 1,436 | $ — | $ 1,172 | $ 2,608 | $ | (944) | $ — | $ (2,858 | ) | $ (263,138 | ) | $ | (266,940) | |||||||||||||||||||||||||||||||||||||||||||
| 336 | SEI Institutional Managed Trust / Semi-Annual Report / March 31, 2021 |
| Financial Derivative Assets | Financial Derivative Liabilities | |||||||||||||||||||||||||||||||||||||||||||||||||||||||
| Multi-Asset Capital Stability Fund | Forward Foreign Currency Contracts | Purchased Options and Swaptions | Swap Agreements | Total Over the Counter | Forward Foreign Currency Contracts | Written Options and Swaptions | Swap Agreements | Reverse Repurchase Agreements | Total Over the Counter | Net Market Value of OTC Derivatives | Collateral (Received) Pledged | Net Exposures(1) | ||||||||||||||||||||||||||||||||||||||||||||
ANZ | $ 24 | $ — | $ — | $ 24 | $ | — | $ | — | $ | — | $ | — | $ | — | $ | 24 | $ | — | �� | $ | 24 | |||||||||||||||||||||||||||||||||||
Bank of America | 10 | — | — | 10 | (13 | ) | — | — | — | (13) | (3 | ) | — | (3) | ||||||||||||||||||||||||||||||||||||||||||
Barclays PLC | 6 | — | — | 6 | (46 | ) | — | — | — | (46) | (40 | ) | — | (40) | ||||||||||||||||||||||||||||||||||||||||||
BNP Paribas | 1 | — | — | 1 | (6 | ) | — | — | — | (6) | (5 | ) | — | (5) | ||||||||||||||||||||||||||||||||||||||||||
Brown Brothers Harriman | 462 | — | — | 462 | (207 | ) | — | — | — | (207) | 255 | — | 255 | |||||||||||||||||||||||||||||||||||||||||||
Citigroup | 1 | — | — | 1 | (13 | ) | — | — | — | (13) | (12 | ) | — | (12) | ||||||||||||||||||||||||||||||||||||||||||
Credit Suisse | 2 | — | — | 2 | — | — | — | — | — | 2 | — | 2 | ||||||||||||||||||||||||||||||||||||||||||||
Deutsche Bank | 3 | — | — | 3 | (1 | ) | — | — | — | (1) | 2 | — | 2 | |||||||||||||||||||||||||||||||||||||||||||
Goldman Sachs | 58 | — | — | 58 | (18 | ) | — | — | — | (18) | 40 | — | 40 | |||||||||||||||||||||||||||||||||||||||||||
HSBC | 29 | — | — | 29 | (11 | ) | — | — | — | (11) | 18 | — | 18 | |||||||||||||||||||||||||||||||||||||||||||
JPMorgan Chase Bank | 38 | — | — | 38 | (30 | ) | — | — | — | (30) | 8 | — | 8 | |||||||||||||||||||||||||||||||||||||||||||
Morgan Stanley | — | — | — | — | (24 | ) | — | — | — | (24) | (24 | ) | 24 | — | ||||||||||||||||||||||||||||||||||||||||||
RBS | 3 | — | — | 3 | (23 | ) | — | — | — | (23) | (20 | ) | — | (20) | ||||||||||||||||||||||||||||||||||||||||||
Standard Bank | 4,225 | — | — | 4,225 | (21 | ) | — | — | — | (21) | 4,204 | — | 4,204 | |||||||||||||||||||||||||||||||||||||||||||
UBS | 25 | — | — | 25 | (43 | ) | — | — | — | (43) | (18 | ) | — | (18) | ||||||||||||||||||||||||||||||||||||||||||
|
|
|
| |||||||||||||||||||||||||||||||||||||||||||||||||||||
Total Over the Counter | $ 4,887 | $— | $ — | $ | 4,887 | $ | (456 | ) | $ | — | $ — | $ — | $ | (456) | ||||||||||||||||||||||||||||||||||||||||||
| (1) | Net Exposures represents the net receivable/(payable) that would be due from /to the counterparty in the event of default. Exposure from OTC financial derivative instruments can only be netted across transactions governed under the same master agreement with the same legal entity. |
Securities with an aggregate market value of $156,227 ($ Thousands) have been pledged, and $0 ($ Thousands) in cash as collateral for financial derivative instruments. Securities with an aggregate market value of $5,972 ($ Thousands) have been received as governed by International Swaps and Derivatives Association, Inc. master agreements as of March 31, 2021.
5. BASIS FOR CONSOLIDATION FOR THE MULTI-ASSET ACCUMULATION FUND AND MULTI-ASSET INFLATION MANAGED FUND
The Consolidated Schedules of Investments, Consolidated Statements of Assets and Liabilities, Consolidated Statements of Operations, Consolidated Statements of Changes in Net Assets, Consolidated Statement of Cash Flows, and the Consolidated Financial Highlights of the Dynamic Asset Allocation Fund, Multi-Asset Accumulation Fund and Multi-Asset Inflation Managed Fund include the accounts of their respective Subsidiaries. All intercompany accounts and transactions have been eliminated in consolidation for the Funds. Each of the Subsidiaries has a fiscal year end
of September 30th for financial statement consolidation purposes and a nonconforming tax year end of August 31.
The Subsidiaries are classified as controlled foreign corporations under the Internal Revenue Code of 1986 (“IRC”). Each Subsidiary’s taxable income is included in the calculation of the relevant Fund’s taxable income. Net losses of the Subsidiaries are not deductible by the Funds either in the current period or carried forward to future periods.
The Dynamic Asset Allocation Fund, Multi-Asset Accumulation Fund, and Multi-Asset Inflation Managed Fund may each invest up to 25% of their total assets in its respective Subsidiary.
A summary of the Funds’ investments in the Subsidiaries are as follows:
| Inception Date of Subsidiary | Subsidiary Net Assets at March 31, 2021 ($ Thousands) | % of Total Net Assets at March 31, 2021 | ||||||||||||||
Dynamic Commodity Strategy Subsidiary, Ltd. | March 28, 2018 | $ 66,076 | 7.9 | % | ||||||||||||
Accumulation Commodity Strategy Subsidiary, Ltd. | April 9, 2012 | 465,754 | 17.8 | % | ||||||||||||
Inflation Commodity Strategy Subsidiary Ltd. | April 9, 2012 | 157,335 | 19.4 | % | ||||||||||||
| SEI Institutional Managed Trust / Semi-Annual Report / March 31, 2021 | 337 |
Notes to Financial Statements/Consolidated Notes to Financial Statements (Continued)
March 31, 2021 (Unaudited)
Gains and losses attributed to the Funds’ investments in Subsidiaries are as follows:
| Dynamic Commodity Strategy Subsidiary, Ltd. ($Thousands) | Accumulation ($Thousands) | Inflation Commodity Strategy Subsidiary, Ltd. ($Thousands) | ||||||||||
Net Investment Income: | ||||||||||||
Investment Income | $ | 3 | $ | 1,162 | $ | 169 | ||||||
Net Realized Gain (Loss) on: | ||||||||||||
Investments | (3) | (26) | (42) | |||||||||
Futures Contracts | 11,370 | 97,534 | 19,926 | |||||||||
Swap Contracts | (2,536) | 15,081 | (2,056) | |||||||||
Options | — | — | 7,353 | |||||||||
Net Change in Unrealized Appreciation (Depreciation) on: | ||||||||||||
Investments | — | (1,827) | (105) | |||||||||
Futures Contracts | 525 | (14,281) | 149 | |||||||||
Swap Contracts | (745) | (372) | (849) | |||||||||
Options | — | — | (419) | |||||||||
|
|
|
|
|
| |||||||
Total gains and losses attributed to the Funds’ investment in Subsidiaries | $ | 8,614 | $ | 97,271 | $ | 24,126 | ||||||
|
|
|
|
|
| |||||||
6. INVESTMENT ADVISORY, ADMINISTRATION AND DISTRIBUTION AGREEMENTS, INVESTMENT SUBADVISORY AGREEMENTS AND OTHER TRANSACTIONS WITH AFFILIATES
Investment Advisory, Administration and Distribution Agreements — SIMC serves as investment adviser (the “Adviser”) to each Fund. In connection with serving as Adviser, SIMC is entitled to a fee, which is calculated daily and paid monthly, based on the average daily net assets of each Fund.
SEI Investments Global Funds Services (the “Administrator”) provides administrative and transfer agency services to the Funds for annual fees, based on the average daily net assets of each Fund.
SEI Investments Distribution Co. (“the Distributor”) is the Distributor of the shares of the Funds. The Funds have adopted a shareholder services plan and agreement (the “Service Plan”) with respect to Class F and Class I Shares that allows such shares to pay service providers a fee, based on average daily net assets of each respective Class of Shares, in connection with the ongoing servicing of shareholder accounts owning such shares. The Funds have also adopted an, administrative services plan and agreement (the “Administrative Service Plan”) with respect to Class I Shares that allows such Shares to pay service providers a fee, based on average daily net assets of the Class I Shares, in connection with ongoing
administrative services for shareholder accounts owning such Shares.
The Service Plan and Administrative Service Plan provide that shareholder service fees and administrative service fees, respectively, on Class F and Class I Shares will be paid to the Distributor, which may then be used by the Distributor to compensate financial intermediaries for providing shareholder services and administrative services, as applicable, with respect to the Shares.
Prior to January 31, 2021, the Funds’ administrator and/ or its affiliates had contractually agreed to waive fees or reimburse expenses for the S&P 500 Index Fund and the Core Fixed Income Fund in order to keep total fund operating expenses (exclusive of interest from borrowings, brokerage commissions, taxes, Trustee fees and extraordinary expenses not incurred in the ordinary course of each Fund’s business) from exceeding the levels specified in the table below. These contractual waivers and reimbursements only applied if a Fund’s total operating costs exceeded the applicable thresholds and would not affect the Fund’s total operating expenses if they were less than the applicable thresholds. In other words, shareholders would pay the lower of a Fund’s actual total fund operating expenses or total fund operating expenses after contractual waivers and expense reimbursements. The contractual waiver and expense reimbursement were limited to the Fund’s direct operating expenses and, therefore, did not apply to indirect expenses incurred by the Fund, such as AFFE. The agreements may be amended or terminated only with the consent of the Board of Trustees.
The Adviser, Administrator and/or Distributor have voluntarily agreed to waive a portion of their fees in order to keep total direct operating expenses (exclusive of interest from borrowings, brokerage commissions, taxes, Trustee fees, proxy fees, prime broker fees, interest and dividend expenses related to short sales and extraordinary expenses not incurred in the ordinary course of the Funds’ business) at a specified level. The voluntary waivers by the Funds’ Adviser, Administrator and/or Distributor are limited to the Funds’ direct operating expenses and, therefore, do not apply to indirect expenses incurred by the Funds, such as acquired fund fees and expenses. The waivers are voluntarily and the Funds’ Adviser, Administrator and/or Distributor may discontinue all or part of any of these waivers at any time. In addition, some Funds may participate in a commission recapture program where the Funds’ trades may be executed through the Funds’ distributor, and a portion of the commissions paid on those trades are then used to pay the Funds’ expenses.
| 338 | SEI Institutional Managed Trust / Semi-Annual Report / March 31, 2021 |
The following is a summary of annual fees payable to the Adviser and Distributor and the contractual and voluntary expense limitations for each fund:
| Advisory Fees | Shareholder Servicing Fee | Administrative Servicing Fee | Voluntary Expense Limitation | |||||||||||||
Large Cap Fund | ||||||||||||||||
Class F | 0.3900% | 0.25% | — | 0.89% | ||||||||||||
Class Y | 0.3900% | — | — | 0.64% | ||||||||||||
Large Cap Value Fund | ||||||||||||||||
Class F | 0.3500% | 0.25% | — | 0.89% | ||||||||||||
Class I | 0.3500% | 0.25% | 0.25% | 1.11% | ||||||||||||
Class Y | 0.3500% | — | — | 0.64% | ||||||||||||
Large Cap Growth Fund | ||||||||||||||||
Class F | 0.4000% | 0.25% | — | 0.89% | ||||||||||||
Class I | 0.4000% | 0.25% | 0.25% | 1.11% | ||||||||||||
Class Y | 0.4000% | — | — | 0.64% | ||||||||||||
Large Cap Index Fund | ||||||||||||||||
Class F | 0.0500% | 0.25% | — | 0.25% | ||||||||||||
Tax-Managed Large Cap Fund | ||||||||||||||||
Class F | 0.4000% | 0.25% | — | 0.89% | ||||||||||||
Class Y | 0.4000% | — | — | 0.64% | ||||||||||||
S&P 500 Index Fund | ||||||||||||||||
Class F | 0.0300% | 0.25% | — | 0.25% | (1) | |||||||||||
Class I | 0.0300% | 0.25% | 0.25% | 0.65% | ||||||||||||
Small Cap Fund | ||||||||||||||||
Class F | 0.6500% | 0.25% | — | 1.14% | ||||||||||||
Class Y | 0.6500% | — | — | 0.89% | ||||||||||||
Small Cap Value Fund | ||||||||||||||||
Class F | 0.6500% | 0.25% | — | 1.14% | ||||||||||||
Class I | 0.6500% | 0.25% | 0.25% | 1.36% | ||||||||||||
Class Y | 0.6500% | — | — | 0.89% | ||||||||||||
Small Cap Growth Fund | ||||||||||||||||
Class F | 0.6500% | 0.25% | — | 1.11% | ||||||||||||
Class I | 0.6500% | 0.25% | 0.25% | 1.36% | ||||||||||||
Class Y | 0.6500% | — | — | 0.86% | ||||||||||||
Tax-Managed Small/Mid Cap Fund | ||||||||||||||||
Class F | 0.6500% | 0.25% | — | 1.11% | ||||||||||||
Class Y | 0.6500% | — | — | 0.89% | ||||||||||||
Mid-Cap Fund | ||||||||||||||||
Class F | 0.4000% | 0.25% | — | 0.98% | ||||||||||||
Class I | 0.4000% | 0.25% | 0.25% | 1.20% | ||||||||||||
Class Y | 0.4000% | — | — | 0.73% | ||||||||||||
U.S. Managed Volatility Fund | ||||||||||||||||
Class F | 0.6500% | 0.25% | — | 0.90% | ||||||||||||
Class I | 0.6500% | 0.25% | 0.25% | 1.15% | ||||||||||||
Class Y | 0.6500% | — | — | 0.65% | ||||||||||||
Global Managed Volatility Fund | ||||||||||||||||
Class F | 0.6500% | 0.25% | — | 1.11% | ||||||||||||
Class I | 0.6500% | 0.25% | 0.25% | 1.36% | ||||||||||||
Class Y | 0.6500% | — | — | 0.86% | ||||||||||||
Tax-Managed Managed Volatility Fund | ||||||||||||||||
Class F | 0.6500% | 0.25% | — | 1.00% | ||||||||||||
Class Y | 0.6500% | — | — | 0.75% | ||||||||||||
Tax-Managed International Managed Volatility Fund | ||||||||||||||||
Class F | 0.6500% | 0.25% | — | 1.11% | ||||||||||||
Class Y | 0.6500% | — | — | 0.86% | ||||||||||||
Real Estate Fund | ||||||||||||||||
Class F | 0.6500% | 0.25% | — | 1.14% | ||||||||||||
Class I | 0.6500% | 0.25% | 0.25% | 1.36% | ||||||||||||
Class Y | 0.6500% | — | — | 0.89% | ||||||||||||
| SEI Institutional Managed Trust / Semi-Annual Report / March 31, 2021 | 339 |
Notes to Financial Statements/Consolidated Notes to Financial Statements (Continued)
March 31, 2021 (Unaudited)
| Advisory Fees | Shareholder Servicing Fee | Administrative Servicing Fee | Voluntary Expense Limitation | |||||||||||||
Core Fixed Income Fund | ||||||||||||||||
Class F | 0.2750% | 0.25% | — | 0.66% | (2) | |||||||||||
Class I | 0.2750% | 0.25% | 0.25% | 0.88% | ||||||||||||
Class Y | 0.2750% | — | — | 0.41% | (2) | |||||||||||
High Yield Bond Fund | ||||||||||||||||
Class F | 0.4875% | 0.25% | — | 0.89% | ||||||||||||
Class I | 0.4875% | 0.25% | 0.25% | 1.11% | ||||||||||||
Class Y | 0.4875% | — | — | 0.64% | ||||||||||||
Conservative Income Fund | ||||||||||||||||
Class F | 0.1000% | 0.25% | — | 0.30% | ||||||||||||
Class Y | 0.1000% | — | — | 0.20% | ||||||||||||
Tax-Free Conservative Income Fund | ||||||||||||||||
Class F | 0.1000% | 0.25% | — | 0.30% | ||||||||||||
Class Y | 0.1000% | — | — | 0.20% | ||||||||||||
Real Return Fund | ||||||||||||||||
Class F | 0.2200% | 0.25% | — | 0.45% | ||||||||||||
Class Y | 0.2200% | — | — | 0.35% | ||||||||||||
Dynamic Asset Allocation Fund | ||||||||||||||||
Class F | 0.6000% | 0.25% | — | 0.75% | ||||||||||||
Class Y | 0.6000% | — | — | 0.50% | ||||||||||||
Multi-Strategy Alternative Fund (3)(4) | ||||||||||||||||
Class F | 1.5000% | 0.25% | — | 1.35% | ||||||||||||
Class Y | 1.5000% | — | — | 1.20% | ||||||||||||
Multi-Asset Accumulation Fund | ||||||||||||||||
Class F | 0.7500% | 0.25% | — | 1.17% | ||||||||||||
Class Y | 0.7500% | — | — | 0.92% | ||||||||||||
Multi-Asset Income Fund | ||||||||||||||||
Class F | 0.6000% | 0.25% | — | 0.80% | ||||||||||||
Class Y | 0.6000% | — | — | 0.70% | ||||||||||||
Multi-Asset Inflation Managed Fund | ||||||||||||||||
Class F | 0.5500% | 0.25% | — | 0.90% | ||||||||||||
Class Y | 0.5500% | — | — | 0.65% | ||||||||||||
Multi-Asset Capital Stability Fund | ||||||||||||||||
Class F | 0.4000% | 0.25% | — | 0.62% | ||||||||||||
Class Y | 0.4000% | — | — | 0.52% | ||||||||||||
| (1) | From January 31, 2018, until January 31, 2021, the following agreement was in effect. The Fund’s adviser, the Fund’s administrator and/or the Fund’s distributor had contractually agreed to waive fees and/or reimburse expenses in order to keep total ordinary operating expenses (exclusive of interest from borrowing, brokerage commissions, taxes, Trustee fees, acquired fund fees and expenses and other extraordinary expenses not incurred in the ordinary course of the Fund’s business) from exceeding 0.29% for Class F. The agreement may be amended or terminated only with the consent of the Board of Trustees. |
| (2) | From August 10, 2018, until January 31, 2021, the following agreement was in effect. The Fund’s adviser, the Fund’s administrator and/or the Fund’s distributor had contractually agreed to waive fees and/or reimburse expenses in order to keep total ordinary operating expenses (exclusive of interest from borrowing, brokerage commissions, taxes, Trustee fees, acquired fund fees and expenses and other extraordinary expenses not incurred in the ordinary course of the Fund’s business) from exceeding 0.66% for Class F and 0.41% for Class Y. The agreement may be amended or terminated only with the consent of the Board of Trustees. |
| (3) | Prior to January 31, 2020, the expense limitation was 1.21% and 0.96% for Class F and Class Y, respectively. |
| (4) | Prior to March 31, 2020, the expense limitation was 1.26% and 1.01% for Class F and Class Y, respectively. |
| 340 | SEI Institutional Managed Trust / Semi-Annual Report / March 31, 2021 |
The following is a summary of annual fees payable to the Administrator:
| First $1.5 Billion | Next $ 500 Million | Next $ 500 Million | Next $500 Million | Over $3 Billion | ||||||||||||||||
Large Cap Fund | 0.300 | % | 0.2550 | % | 0.2100 | % | 0.1650 | % | 0.120% | |||||||||||
Large Cap Value Fund | 0.300 | % | 0.2550 | % | 0.2100 | % | 0.1650 | % | 0.120% | |||||||||||
Large Cap Growth Fund | 0.300 | % | 0.2550 | % | 0.2100 | % | 0.1650 | % | 0.120% | |||||||||||
Large Cap Index Fund | 0.300 | % | 0.2550 | % | 0.2100 | % | 0.1650 | % | 0.120% | |||||||||||
Tax-Managed Large Cap Fund | 0.300 | % | 0.2550 | % | 0.2100 | % | 0.1650 | % | 0.120% | |||||||||||
Small Cap Fund | 0.300 | % | 0.2550 | % | 0.2100 | % | 0.1650 | % | 0.120% | |||||||||||
Small Cap Value Fund | 0.300 | % | 0.2550 | % | 0.2100 | % | 0.1650 | % | 0.120% | |||||||||||
Small Cap Growth Fund | 0.300 | % | 0.2550 | % | 0.2100 | % | 0.1650 | % | 0.120% | |||||||||||
Tax-Managed Small/Mid Cap Fund | 0.300 | % | 0.2550 | % | 0.2100 | % | 0.1650 | % | 0.120% | |||||||||||
Mid-Cap Fund | 0.300 | % | 0.2550 | % | 0.2100 | % | 0.1650 | % | 0.120% | |||||||||||
U.S. Managed Volatility Fund | 0.300 | % | 0.2550 | % | 0.2100 | % | 0.1650 | % | 0.120% | |||||||||||
Global Managed Volatility Fund | 0.300 | % | 0.2550 | % | 0.2100 | % | 0.1650 | % | 0.120% | |||||||||||
Tax-Managed Managed Volatility Fund | 0.300 | % | 0.2550 | % | 0.2100 | % | 0.1650 | % | 0.120% | |||||||||||
Tax-Managed International Managed Volatility Fund | 0.450 | % | 0.3700 | % | 0.2900 | % | 0.2100 | % | 0.130% | |||||||||||
Real Estate Fund | 0.300 | % | 0.2550 | % | 0.2100 | % | 0.1650 | % | 0.120% | |||||||||||
Core Fixed Income Fund | 0.200 | % | 0.1775 | % | 0.1550 | % | 0.1325 | % | 0.110% | |||||||||||
High Yield Bond Fund | 0.200 | % | 0.1775 | % | 0.1550 | % | 0.1325 | % | 0.110% | |||||||||||
Conservative Income Fund | 0.200 | % | 0.1775 | % | 0.1550 | % | 0.1325 | % | 0.110% | |||||||||||
Tax-Free Conservative Income Fund | 0.200 | % | 0.1775 | % | 0.1550 | % | 0.1325 | % | 0.110% | |||||||||||
Real Return Fund | 0.200 | % | 0.1775 | % | 0.1550 | % | 0.1325 | % | 0.110% | |||||||||||
Dynamic Asset Allocation Fund | 0.300 | % | 0.2550 | % | 0.2100 | % | 0.1650 | % | 0.120% | |||||||||||
Multi-Strategy Alternative Fund | 0.300 | % | 0.2550 | % | 0.2100 | % | 0.1650 | % | 0.120% | |||||||||||
Multi-Asset Accumulation Fund | 0.300 | % | 0.2550 | % | 0.2100 | % | 0.1650 | % | 0.120% | |||||||||||
Multi-Asset Income Fund | 0.300 | % | 0.2550 | % | 0.2100 | % | 0.1650 | % | 0.120% | |||||||||||
Multi-Asset Inflation Managed Fund | 0.300 | % | 0.2550 | % | 0.2100 | % | 0.1650 | % | 0.120% | |||||||||||
Multi-Asset Capital Stability Fund | 0.300 | % | 0.2550 | % | 0.2100 | % | 0.1650 | % | 0.120% | |||||||||||
| First $2 Billion | Next $ 500 Million | Next $ 500 Million | Over $3 Billion | |||||||||||||||||
S&P 500 Index Fund | 0.220 | % | 0.2100 | % | 0.1650 | % | 0.120 | % | ||||||||||||
As of March 31, 2021, SIMC has entered into investment sub-advisory agreements with the following affiliated and unaffiliated parties:
| Investment Sub-Adviser |
Large Cap Fund
Brandywine Global Investment Management, LLC
Ceredex Value Advisors, LLC
Coho Partners, Ltd.
Fred Alger Management, Inc.
LSV Asset Management*
MarVista Investment Partners, LLC
Parametric Portfolio Associates LLC
Large Cap Value Fund
Brandywine Global Investment Management, LLC
LSV Asset Management*
Parametric Portfolio Associates LLC
Schafer Cullen Capital Management Inc.
Large Cap Growth Fund
Fiera Capital Inc.
Fred Alger Management, Inc.
McKinley Capital Management, LLC
Parametric Portfolio Associates LLC
Large Cap Index Fund
SSGA Funds Management, Inc.
Tax-Managed Large Cap Fund
Brandywine Global Investment Management, LLC
Coho Partners, Ltd.
Fiera Capital Inc.
LSV Asset Management*
MarVista Investment Partners, LLC
Parametric Portfolio Associates LLC
Schafer Cullen Capital Management
S&P 500 Index Fund
SSGA Funds Management, Inc.
Small Cap Fund
Copeland Capital Management, LLC
EAM Investors, LLC
Hillsdale Investment Management Inc
Los Angeles Capital Management
LMCG Investments, LLC
Parametric Portfolio Associates LLC
Snow Capital Management L.P.
Small Cap Value Fund
Cardinal Capital Management, LLC
LSV Asset Management*
Parametric Portfolio Associates LLC
Snow Capital Management, L.P.
Small Cap Growth Fund
ArrowMark Colorado Holdings LLC
| SEI Institutional Managed Trust / Semi-Annual Report / March 31, 2021 | 341 |
Notes to Financial Statements/Consolidated Notes to Financial Statements (Continued)
March 31, 2021 (Unaudited)
EAM Investors LLC
Jackson Creek Investment Advisory, LLC
Parametric Portfolio Associates LLC
Tax-Managed Small/Mid Cap Fund
Cardinal Capital Management, LLC
Hillsdale Investment Management Inc.
Martingale Asset Management, LLC
Parametric Portfolio Associates LLC
Rice Hall James & Associates LLC
Snow Capital Management L.P.
Mid-Cap Fund
Quantitative Management Associates LLC
U.S. Managed Volatility Fund
LSV Asset Management*
Wells Capital Management, Inc.
Global Managed Volatility Fund
Acadian Asset Management LLC
Wells Capital Management, Inc.
Tax-Managed Managed Volatility Fund
LSV Asset Management*
Parametric Portfolio Associates LLC
Wells Capital Management, Inc.
Tax-Managed International Managed Volatility Fund
Acadian Asset Management LLC
LSV Asset Management*
Parametric Portfolio Associates LLC
Wells Capital Management, Inc.
Real Estate Fund
CenterSquare Investment Management LLC
Core Fixed Income Fund
Jennison Associates LLC
MetLife Investment Management, LLC
Metropolitan West Asset Management, LLC
Wells Capital Management Incorporated
Western Asset Management Company
Western Asset Management Company Limited
High Yield Bond Fund
Ares Management LLC
Benefit Street Partners, LLC
Brigade Capital Management, LLC
J.P. Morgan Investment Management, Inc.
T. Rowe Price Associates, Inc.
Conservative Income Fund
BlackRock Advisors, LLC
Tax-Free Conservative Income Fund
BlackRock Advisors, LLC
Dynamic Asset Allocation Fund
SSGA Funds Management, Inc.
Multi-Strategy Alternative Fund
Brigade Capital Management, LLC
EMSO Partners Limited Management, LLC
Global Credit Advisers, LLC
Kettle Hill Capital Management LLC
Mountaineer Partners Management, LLC
Putnam Investment Management LLC
Ramius Advisors, LLC
Multi-Asset Accumulation Fund
AQR Capital Management, LLC
PanAgora Asset Management Inc.
Multi-Asset Income Fund
Goldman Sachs Asset Management, LP
SSGA Funds Management Inc.
Western Asset Management Company
Western Asset Management Company Limited
Multi-Asset Inflation Managed Fund
AllianceBernstein, L.P.
Columbia Management Investments
Credit Suisse Asset Management, LLC
QS Investors, LLC
Multi-Asset Capital Stability Fund
AllianceBernstein, L.P.
Janus Capital Management, LLC
* Affiliated
Under the investment sub-advisory agreements, each sub-adviser receives a fee paid by SIMC.
Brokerage Commissions Paid to Affiliates — The Distribution Agreement between the Distributor and the Trust provides that the Distributor may receive compensation on fund transactions effected for the Trust in accordance with the rules of the Securities and Exchange Commission (“SEC”). Accordingly, it is expected that fund transactions may result in brokerage commissions being paid to the Distributor. SEC rules require that such commissions not exceed usual and customary commissions.
Such commissions for the year ended March 31, 2021 were as follows ($ Thousands):
Real Estate Fund | $ | 1 | ||
|
|
Payments to/from Affiliates — Certain officers and/or trustees of the Trust are also officers and/or Directors of the Administrator, Adviser and/or Distributor. The Trust pays each unaffiliated Trustee an annual fee for attendance at quarterly, interim and committee meetings. Compensation of officers and affiliated Trustees of the Trust is paid by the Administrator or Distributor.
A portion of the services provided by the Chief Compliance Officer (“CCO”) and his staff, whom are employees of the Administrator, are paid for by the Trust as incurred.
LSV Asset Management (a partially owned indirect subsidiary of SEI Investment Co.) serves as the sub-adviser to the Large Cap, Large Cap Value, Tax-Managed Large Cap, Small Cap Value, U.S. Managed Volatility, Tax-Managed Managed Volatility and Tax-Managed International Managed Volatility Funds. For this service
| 342 | SEI Institutional Managed Trust / Semi-Annual Report / March 31, 2021 |
LSV Asset Management is entitled to receive a fee from SIMC. Such fees for the six month period ended March 31, 2021 were as follows ($ Thousands):
Large Cap Fund | $ | 192 | ||
Large Cap Value Fund | 252 | |||
Tax-Managed Large Cap Fund | 348 | |||
Small Cap Value Fund | 369 | |||
U.S. Managed Volatility Fund | 1,021 | |||
Tax-Managed Managed Volatility Fund | 824 | |||
Tax-Managed International Managed Volatility Fund | 235 | |||
|
| |||
| $ | 3,241 | |||
|
|
On April 20, 2018, SIMC made a capital contribution to the Large Cap Index Fund in the amount of $330,025. The capital contribution offset the Fund’s performance deviation from its benchmark that resulted from an unusually large unanticipated cash flow that came into the Fund shortly after launch.
On May 29, 2020, SIMC made a capital contribution to the S&P 500 Index Fund in the amount of $221,168. The capital contribution offset the Fund’s performance deviation from its benchmark that resulted from losses incurred by the Fund as a result of an operational error.
Fees Paid Indirectly — The Funds may direct certain fund trades to the Distributor who pays a portion of the Funds’ expenses. Accordingly, the expenses reduced, which were used to pay third party expenses, and the effect on the Funds’ expense ratio, as a percentage of the Funds’ average daily net assets for the six month period ended March 31, 2021, can be found on the Statements of Operations or Consolidated Statements of Operations and Financial Highlights or Consolidated Financial Highlights, respectively.
Investment in Affiliated Security — The Funds may invest in the SEI Daily Income Trust Government Fund an affiliated money market fund to manage excess cash or to serve as margin or collateral for derivative positions. Additionally, the Funds may invest the cash collateral from the securities lending program in the SEI Liquidity Fund, L.P.
Each of the Large Cap Index and S&P 500 Index Funds may purchase companies with which it is affiliated to the extent these companies are represented in its benchmark index.
Interfund Lending — The SEC has granted an exemption that permits the Trust to participate in an interfund lending program (“the Program”) with existing or future investment companies registered under the 1940 Act that are advised by SIMC (the “SEI Funds”). The Program allows the SEI Funds to lend money to and borrow money from each other for temporary or emergency purposes. Participation in the Program is voluntary for both borrowing and lending funds.
Interfund loans may be made only when the rate of interest to be charged is more favorable to the lending fund than an investment in overnight repurchase agreements (“Repo Rate”), and more favorable to the borrowing fund than the rate of interest that would be charged by a bank for short-term borrowings (“Bank Loan Rate”). The Bank Loan Rate will be determined using a formula annually reviewed by the Board. The interest rate imposed on interfund loans is the average of the Repo Rate and the Bank Loan Rate.
During the six month period ended March 31, 2021, the following Funds borrowed funds from the SEI Multi-Asset Accumulation Fund. The amount borrowed, interest paid on the borrowing and the corresponding interest rate were as follows ($ Thousands):
| Borrowing Date | Maturity Date | Amount Borrowed | Interest Paid | Interest Rate | ||||||||||||||||
Large Cap Fund | 03/30/21 | 03/31/21 | 18,250 | – | 1.06 | % | ||||||||||||||
Tax Managed Large Cap Fund | 03/30/21 | 03/31/21 | 23,770 | – | 1.06 | % | ||||||||||||||
Mid-Cap Fund | 11/10/20 | 11/12/20 | 7,900 | – | 1.10 | % | ||||||||||||||
U.S. Managed Volatility Fund | 02/19/21 | 02/23/21 | 9,810 | – | 1.08 | % | ||||||||||||||
U.S. Managed Volatility Fund | 02/22/21 | 02/23/21 | 14,040 | – | 1.07 | % | ||||||||||||||
| (1) | Loan outstanding as of March 31, 2021. Refer to each Fund’s Statement of Assets and Liabilities or Consolidated Statement of Assets and liabilities for details. |
| SEI Institutional Managed Trust / Semi-Annual Report / March 31, 2021 | 343 |
Notes to Financial Statements/Consolidated Notes to Financial Statements (Continued)
March 31, 2021 (Unaudited)
7. CAPITAL SHARE TRANSACTIONS
Capital share transactions for the Funds were as follows (Thousands):
For the six month period ended March 31, 2021 and the year ended September 30, 2020.
| Large Cap Fund | Large Cap Value Fund | Large Cap Growth Fund | Large Cap Index Fund | |||||||||||||||||||||||||||||
10/1/2020 to
3/31/2021 | 2020 | 10/1/2020 to
3/31/2021 (Unaudited) | 2020 | 10/1/2020 to
3/31/2021 | 2020 | 10/1/2020 to
3/31/2021 | 2020 | |||||||||||||||||||||||||
Class F: | ||||||||||||||||||||||||||||||||
Shares Issued | 7,882 | 19,770 | 3,776 | 13,171 | 2,414 | 5,520 | 16,097 | 36,737 | ||||||||||||||||||||||||
Shares Issued in Lieu of Dividends and Distributions | 3,909 | 10,606 | 527 | 1,936 | 2,689 | 1,962 | 355 | 847 | ||||||||||||||||||||||||
Shares Redeemed | (26,157 | ) | (45,866 | ) | (9,877 | ) | (11,749 | ) | (4,570 | ) | (13,378 | ) | (11,570 | ) | (21,854 | ) | ||||||||||||||||
Total Increase (Decrease) in Net Assets Derived from Class F Transactions | (14,366 | ) | (15,490 | ) | (5,574 | ) | 3,358 | 533 | (5,896 | ) | 4,882 | 15,730 | ||||||||||||||||||||
Class I: | ||||||||||||||||||||||||||||||||
Shares Issued | – | – | 7 | 30 | 12 | 15 | – | – | ||||||||||||||||||||||||
Shares Issued in Lieu of Dividends and Distributions | – | – | 1 | 4 | 7 | 3 | – | – | ||||||||||||||||||||||||
Shares Redeemed | – | – | (19 | ) | (43 | ) | (15 | ) | (20 | ) | – | – | ||||||||||||||||||||
Total Increase (Decrease) in Net Assets Derived from Class I Transactions | – | – | (11 | ) | (9 | ) | 4 | (2 | ) | – | – | |||||||||||||||||||||
Class Y: | ||||||||||||||||||||||||||||||||
Shares Issued | 401 | 2,522 | 504 | 1,770 | 384 | 574 | – | – | ||||||||||||||||||||||||
Shares Issued in Lieu of Dividends and Distributions | 228 | 676 | 81 | 266 | 349 | 249 | – | – | ||||||||||||||||||||||||
Shares Redeemed | (1,095 | ) | (5,250 | ) | (948 | ) | (1,140 | ) | (265 | ) | (1,444 | ) | – | – | ||||||||||||||||||
Total Increase (Decrease) in Net Assets Derived from Class Y Transactions | (466 | ) | (2,052 | ) | (363 | ) | 896 | 468 | (621 | ) | – | – | ||||||||||||||||||||
Increase (Decrease) in Capital Shares | (14,832 | ) | (17,542 | ) | (5,948 | ) | 4,245 | 1,005 | (6,519 | ) | 4,882 | 15,730 | ||||||||||||||||||||
| Tax-Managed Large Cap Fund | S&P 500 Index Fund | Small Cap Fund | Small Cap Value Fund | |||||||||||||||||||||||||||||
10/1/2020 to
3/31/2021 | 2020 | 10/1/2020 to
3/31/2021 (Unaudited) | 2020 | 10/1/2020 to
3/31/2021 | 2020 | 10/1/2020 to
3/31/2021 | 2020 | |||||||||||||||||||||||||
Class F: | ||||||||||||||||||||||||||||||||
Shares Issued | 4,780 | 12,957 | 541 | 3,570 | 2,411 | 9,106 | 1,629 | 4,242 | ||||||||||||||||||||||||
Shares Issued in Lieu of Dividends and Distributions | 2,042 | 9,970 | 549 | 507 | 44 | 97 | 56 | 164 | ||||||||||||||||||||||||
Shares Redeemed | (12,465 | ) | (28,052 | ) | (1,271 | ) | (4,894 | ) | (8,169 | ) | (12,475 | ) | (2,756 | ) | (3,058 | ) | ||||||||||||||||
Total Increase (Decrease) in Net Assets Derived from Class F Transactions | (5,643 | ) | (5,125 | ) | (181 | ) | (817 | ) | (5,714 | ) | (3,272 | ) | (1,071 | ) | 1,348 | |||||||||||||||||
Class I: | ||||||||||||||||||||||||||||||||
Shares Issued | – | – | 7 | 23 | – | – | 6 | 32 | ||||||||||||||||||||||||
Shares Issued in Lieu of Dividends and Distributions | – | – | 3 | 2 | – | – | — | 1 | ||||||||||||||||||||||||
Shares Redeemed | – | – | (13 | ) | (33 | ) | – | – | (10 | ) | (46 | ) | ||||||||||||||||||||
Total Decrease in Net Assets Derived from Class I Transactions | – | – | (3 | ) | (8 | ) | – | – | (4 | ) | (13 | ) | ||||||||||||||||||||
Class Y: | ||||||||||||||||||||||||||||||||
Shares Issued | 459 | 2,302 | – | – | 129 | 1,112 | 141 | 1,385 | ||||||||||||||||||||||||
Shares Issued in Lieu of Dividends and Distributions | 278 | 1,341 | – | – | 4 | 13 | 13 | 32 | ||||||||||||||||||||||||
Shares Redeemed | (1,216 | ) | (4,914 | ) | – | – | (596 | ) | (1,723 | ) | (459 | ) | (888 | ) | ||||||||||||||||||
Total Increase (Decrease) in Net Assets Derived from Class Y Transactions | (479 | ) | (1,271 | ) | – | – | (463 | ) | (598 | ) | (305 | ) | 529 | |||||||||||||||||||
Increase (Decrease) in Capital Shares | (6,122 | ) | (6,396 | ) | (184 | ) | (825 | ) | (6,177 | ) | (3,870 | ) | (1,380 | ) | 1,864 | |||||||||||||||||
| Small Cap Growth Fund | Tax-Managed Small/Mid Cap Fund | Mid-Cap Fund | U.S. Managed Volatility Fund | |||||||||||||||||||||||||||||
10/1/2020 to
3/31/2021 | 2020 | 10/1/2020 to
3/31/2021 (Unaudited) | 2020 | 10/1/2020 to
3/31/2021 | 2020 | 10/1/2020 to 3/31/2021 | 2020 | |||||||||||||||||||||||||
Class F: | ||||||||||||||||||||||||||||||||
Shares Issued | 1,155 | 1,601 | 2,339 | 5,442 | 331 | 1,161 | 3,887 | 11,619 | ||||||||||||||||||||||||
Shares Issued in Lieu of Dividends and Distributions | — | 280 | 23 | 781 | 13 | 84 | 3,513 | 2,083 | ||||||||||||||||||||||||
Shares Redeemed | (1,206 | ) | (2,173 | ) | (3,093 | ) | (8,643 | ) | (703 | ) | (2,512 | ) | (9,053 | ) | (17,758 | ) | ||||||||||||||||
Total Decrease in Net Assets Derived from Class F Transactions | (51 | ) | (292 | ) | (731 | ) | (2,420 | ) | (359 | ) | (1,267 | ) | (1,653 | ) | (4,056 | ) | ||||||||||||||||
Class I: | ||||||||||||||||||||||||||||||||
| 344 | SEI Institutional Managed Trust / Semi-Annual Report / March 31, 2021 |
| Small Cap Growth Fund | Tax-Managed Small/Mid Cap Fund | Mid-Cap Fund | U.S. Managed Volatility Fund | |||||||||||||||||||||||||||||
10/1/2020 to
3/31/2021 (Unaudited) | 2020 | 10/1/2020 to
3/31/2021 | 2020 | 10/1/2020 to
3/31/2021 | 2020 | 10/1/2020 to
3/31/2021 | 2020 | |||||||||||||||||||||||||
Shares Issued | 8 | 9 | – | – | 1 | 2 | 1 | 4 | ||||||||||||||||||||||||
Shares Issued in Lieu of Dividends and Distributions | — | 1 | – | – | — | 1 | 7 | 3 | ||||||||||||||||||||||||
Shares Redeemed | (4 | ) | (16 | ) | – | – | (2 | ) | (7 | ) | (5 | ) | (4 | ) | ||||||||||||||||||
Total Increase (Decrease) in Net Assets Derived from Class I Transactions | 4 | (6 | ) | – | – | (1 | ) | (4 | ) | 3 | 3 | |||||||||||||||||||||
Class Y: | ||||||||||||||||||||||||||||||||
Shares Issued | 52 | 140 | 102 | 1,237 | 39 | 61 | 4,074 | 21,608 | ||||||||||||||||||||||||
Shares Issued in Lieu of Dividends and Distributions | — | 31 | 8 | 114 | 1 | 3 | 4,654 | 2,561 | ||||||||||||||||||||||||
Shares Redeemed | (109 | ) | (219 | ) | (500 | ) | (1,676 | ) | (27 | ) | (59 | ) | (50,431 | ) | (22,059 | ) | ||||||||||||||||
Total Increase (Decrease) in Net Assets Derived from Class Y Transactions | (57 | ) | (48 | ) | (390 | ) | (325 | ) | 13 | 5 | (41,703 | ) | 2,110 | |||||||||||||||||||
(Decrease) in Capital Shares | (104 | ) | (346 | ) | (1,121 | ) | (2,745 | ) | (347 | ) | (1,266 | ) | (43,353 | ) | (1,943 | ) | ||||||||||||||||
| Global Managed Volatility Fund | Tax-Managed Managed Volatility Fund | Tax-Managed International Managed Volatility Fund | Real Estate Fund | |||||||||||||||||||||||||||||
10/1/2020 to
3/31/2021 (Unaudited) | 2020 | 10/1/2020 to
3/31/2021 | 2020 | 10/1/2020 to
3/31/2021 | 2020 | 10/1/2020 to
3/31/2021 | 2020 | |||||||||||||||||||||||||
Class F: | ||||||||||||||||||||||||||||||||
Shares Issued | 7,328 | 21,044 | 2,531 | 8,885 | 2,593 | 9,224 | 288 | 1,151 | ||||||||||||||||||||||||
Shares Issued in Lieu of Dividends and Distributions | 725 | 4,305 | 566 | 1,934 | 447 | 754 | 258 | 478 | ||||||||||||||||||||||||
Shares Redeemed | (15,786 | ) | (30,049 | ) | (6,374 | ) | (16,483 | ) | (4,129 | ) | (9,742 | ) | (625 | ) | (2,210 | ) | ||||||||||||||||
Total Increase (Decrease) in Net Assets Derived from Class F Transactions | (7,733 | ) | (4,700 | ) | (3,277 | ) | (5,664 | ) | (1,089 | ) | 236 | (79 | ) | (581 | ) | |||||||||||||||||
Class I: | ||||||||||||||||||||||||||||||||
Shares Issued | 2 | 4 | – | – | – | – | — | 1 | ||||||||||||||||||||||||
Shares Issued in Lieu of Dividends and Distributions | 1 | 5 | – | – | – | – | 1 | 2 | ||||||||||||||||||||||||
Shares Redeemed | (5 | ) | (10 | ) | – | – | – | – | — | (4 | ) | |||||||||||||||||||||
Total Increase (Decrease) in Net Assets Derived from Class I Transactions | (2 | ) | (1 | ) | – | – | – | – | 1 | (1 | ) | |||||||||||||||||||||
Class Y: | ||||||||||||||||||||||||||||||||
Shares Issued | 1,219 | 5,982 | 242 | 1,091 | 223 | 4,049 | 56 | 436 | ||||||||||||||||||||||||
Shares Issued in Lieu of Dividends and Distributions | 147 | 1,116 | 55 | 183 | 86 | 104 | 64 | 190 | ||||||||||||||||||||||||
Shares Redeemed | (3,399 | ) | (12,549 | ) | (492 | ) | (1,685 | ) | (264 | ) | (2,880 | ) | (257 | ) | (1,487 | ) | ||||||||||||||||
Total Increase (Decrease) in Net Assets Derived from Class Y Transactions | (2,033 | ) | (5,451 | ) | (195 | ) | (411 | ) | 45 | 1,273 | (137 | ) | (861 | ) | ||||||||||||||||||
Increase (Decrease) in Capital Shares | (9,768 | ) | (10,152 | ) | (3,472 | ) | (6,075 | ) | (1,044 | ) | 1,509 | (215 | ) | (1,443 | ) | |||||||||||||||||
| Core Fixed Income Fund | High Yield Bond Fund | Conservative Income Fund | Tax-Free Conservative Income Fund | |||||||||||||||||||||||||||||
10/1/2020 to
3/31/2021 (Unaudited) | 2020 | 10/1/2020 to
3/31/2021 | 2020 | 10/1/2020 to
3/31/2021 | 2020 | 10/1/2020 to
3/31/2021 | 2020 | |||||||||||||||||||||||||
Class F: | ||||||||||||||||||||||||||||||||
Shares Issued | 57,044 | 65,128 | 19,653 | 57,145 | 9,881 | 28,549 | 4,518 | 13,025 | ||||||||||||||||||||||||
Shares Issued in Lieu of Dividends and Distributions | 13,690 | 9,644 | 8,215 | 11,798 | 1 | 180 | 1 | 89 | ||||||||||||||||||||||||
Shares Redeemed | (38,435 | ) | (79,515 | ) | (25,430 | ) | (83,344 | ) | (10,468 | ) | (19,744 | ) | (5,807 | ) | (8,070 | ) | ||||||||||||||||
Total Increase (Decrease) in Net Assets Derived from Class F Transactions | 32,299 | (4,743 | ) | 2,438 | (14,401 | ) | (586 | ) | 8,985 | (1,288 | ) | 5,044 | ||||||||||||||||||||
Class I: | ||||||||||||||||||||||||||||||||
Shares Issued | 78 | 45 | 9 | 14 | – | – | – | – | ||||||||||||||||||||||||
Shares Issued in Lieu of Dividends and Distributions | 14 | 9 | 3 | 4 | – | – | – | – | ||||||||||||||||||||||||
Shares Redeemed | (25 | ) | (104 | ) | (3 | ) | (1,745 | ) | – | – | – | – | ||||||||||||||||||||
Total Increase (Decrease) in Net Assets Derived from Class I Transactions | 67 | (50 | ) | 9 | (1,727 | ) | – | – | – | – | ||||||||||||||||||||||
Class Y: | ||||||||||||||||||||||||||||||||
Shares Issued | 8,148 | 8,946 | 1,844 | 8,535 | 492 | 1,577 | 460 | 103 | ||||||||||||||||||||||||
Shares Issued in Lieu of Dividends and Distributions | 1,752 | 1,252 | 1,235 | 1,725 | — | 22 | — | 8 | ||||||||||||||||||||||||
Shares Redeemed | (3,331 | ) | (10,485 | ) | (3,019 | ) | (10,104 | ) | (925 | ) | (1,686 | ) | (295 | ) | (1,207 | ) | ||||||||||||||||
| SEI Institutional Managed Trust / Semi-Annual Report / March 31, 2021 | 345 |
Notes to Financial Statements/Consolidated Notes to Financial Statements (Continued)
March 31, 2021 (Unaudited)
| Core Fixed Income Fund | High Yield Bond Fund | Conservative Income Fund | Tax-Free Conservative Income Fund | |||||||||||||||||||||||||||||
10/1/2020 to
3/31/2021 | 2020 | 10/1/2020 to
3/31/2021 | 2020 | 10/1/2020 to
3/31/2021 | 2020 | 10/1/2020 to
3/31/2021 | 2020 | |||||||||||||||||||||||||
Total Increase (Decrease) in Net Assets Derived from Class Y Transactions | 6,569 | (287 | ) | 60 | 156 | (433 | ) | (87 | ) | 165 | (1,096 | ) | ||||||||||||||||||||
Increase (Decrease) in Capital Shares | 38,935 | (5,080 | ) | 2,507 | (15,972 | ) | (1,019 | ) | 8,898 | (1,123 | ) | 3,948 | ||||||||||||||||||||
| Real Return Fund | Dynamic Asset Allocation Fund | Multi-Strategy Alternative Fund | Multi-Asset Accumulation Fund | |||||||||||||||||||||||||||||
10/1/2020 to
3/31/2021 | 2020 | 10/1/2020 to
3/31/2021 | 2020 | 10/1/2020 to
3/31/2021 | 2020 | 10/1/2020 to
3/31/2021 | 2020 | |||||||||||||||||||||||||
Class F: | ||||||||||||||||||||||||||||||||
Shares Issued | 2,843 | 7,010 | 3,496 | 7,757 | 2,886 | 8,091 | 19,737 | 37,978 | ||||||||||||||||||||||||
Shares Issued in Lieu of Dividends and Distributions | 68 | 102 | 3,159 | 824 | 1,143 | 447 | 12,023 | 29,563 | ||||||||||||||||||||||||
Shares Redeemed | (3,842 | ) | (6,958 | ) | (8,088 | ) | (15,116 | ) | (6,335 | ) | (11,232 | ) | (34,494 | ) | (64,513 | ) | ||||||||||||||||
Total Increase (Decrease) in Net Assets Derived from Class F Transactions | (931 | ) | 154 | (1,433 | ) | (6,535 | ) | (2,306 | ) | (2,694 | ) | (2,734 | ) | 3,028 | ||||||||||||||||||
Class Y: | ||||||||||||||||||||||||||||||||
Shares Issued | 359 | 830 | 138 | 783 | 38 | 115 | 1,937 | 4,493 | ||||||||||||||||||||||||
Shares Issued in Lieu of Dividends and Distributions | 8 | 13 | 205 | 65 | 24 | 11 | 989 | 2,615 | ||||||||||||||||||||||||
Shares Redeemed | (500 | ) | (1,226 | ) | (335 | ) | (3,380 | ) | (87 | ) | (300 | ) | (2,538 | ) | (7,942 | ) | ||||||||||||||||
Total Increase (Decrease) in Net Assets Derived from Class Y Transactions | (133 | ) | (383 | ) | 8 | (2,532 | ) | (25 | ) | (174 | ) | 388 | (834 | ) | ||||||||||||||||||
Increase (Decrease) in Capital Shares | (1,064 | ) | (229 | ) | (1,425 | ) | (9,067 | ) | (2,331 | ) | (2,868 | ) | (2,346 | ) | 2,194 | |||||||||||||||||
| Multi-Asset Income Fund | Multi-Asset Inflation Managed Fund | Multi-Asset Capital Stability Fund | ||||||||||||||||||||||||||||||
10/1/2020 to
3/31/2021 | 2020 |
10/1/2020 to
3/31/2021 | 2020 |
10/1/2020 to
3/31/2021 | 2020 | |||||||||||||||||||||||||||
Class F: | ||||||||||||||||||||||||||||||||
Shares Issued | 5,510 | 16,977 | 9,041 | 17,607 | 9,266 | 24,067 | ||||||||||||||||||||||||||
Shares Issued in Lieu of Dividends and Distributions | 924 | 2,444 | 1,205 | 1,325 | 579 | 1,895 | ||||||||||||||||||||||||||
Shares Redeemed | (10,519 | ) | (22,124 | ) | (12,122 | ) | (21,968 | ) | (13,156 | ) | (20,628 | ) | ||||||||||||||||||||
Total Increase (Decrease) in Net Assets Derived from Class F Transactions | (4,085 | ) | (2,703 | ) | (1,876 | ) | (3,036 | ) | (3,311 | ) | 5,334 | |||||||||||||||||||||
Class Y: | ||||||||||||||||||||||||||||||||
Shares Issued | 2,414 | 3,925 | 506 | 1,308 | 630 | 1,457 | ||||||||||||||||||||||||||
Shares Issued in Lieu of Dividends and Distributions | 219 | 568 | 95 | 108 | 50 | 166 | ||||||||||||||||||||||||||
Shares Redeemed | (1,793 | ) | (4,207 | ) | (933 | ) | (2,427 | ) | (1,406 | ) | (1,540 | ) | ||||||||||||||||||||
Total Increase (Decrease) in Net Assets Derived from Class Y Transactions | 840 | 286 | (332 | ) | (1,011 | ) | (726 | ) | 83 | |||||||||||||||||||||||
Increase (Decrease) in Capital Shares | (3,245 | ) | (2,417 | ) | (2,208 | ) | (4,047 | ) | (4,037 | ) | 5,417 | |||||||||||||||||||||
| 346 | SEI Institutional Managed Trust / Semi-Annual Report / March 31, 2021 |
8. INVESTMENT TRANSACTIONS
The cost of security purchases and proceeds from the sale of securities, other than temporary cash investments, during the six month period ended March 31, 2021, were as follows:
| U.S. Gov’t ($ Thousands) | Other ($ Thousands) | Total ($ Thousands) | ||||||||||
Large Cap Fund |
| |||||||||||
Purchases | $ | – | $ | 335,135 | $ | 335,135 | ||||||
Sales | – | 626,200 | 626,200 | |||||||||
Large Cap Value Fund |
| |||||||||||
Purchases | – | 195,667 | 195,667 | |||||||||
Sales | – | 341,472 | 341,472 | |||||||||
Large Cap Growth Fund |
| |||||||||||
Purchases | – | 331,092 | 331,092 | |||||||||
Sales | – | 442,385 | 442,385 | |||||||||
Large Cap Index Fund |
| |||||||||||
Purchases | – | 112,286 | 112,286 | |||||||||
Sales | – | 36,248 | 36,248 | |||||||||
Tax-Managed Large Cap Fund |
| |||||||||||
Purchases | – | 377,307 | 377,307 | |||||||||
Sales | – | 662,644 | 662,644 | |||||||||
S&P 500 Index Fund |
| |||||||||||
Purchases | – | 31,679 | 31,679 | |||||||||
Sales | – | 80,934 | 80,934 | |||||||||
Small Cap Fund |
| |||||||||||
Purchases | – | 430,356 | 430,356 | |||||||||
Sales | – | 541,825 | 541,825 | |||||||||
Small Cap Value Fund |
| |||||||||||
Purchases | – | 174,744 | 174,744 | |||||||||
Sales | – | 199,111 | 199,111 | |||||||||
Small Cap Growth Fund |
| |||||||||||
Purchases | – | 534,412 | 534,412 | |||||||||
Sales | – | 498,118 | 498,118 | |||||||||
Tax-Managed Small/Mid Cap Fund |
| |||||||||||
Purchases | – | 389,753 | 389,753 | |||||||||
Sales | – | 342,470 | 342,470 | |||||||||
Mid-Cap Fund |
| |||||||||||
Purchases | – | 38,838 | 38,838 | |||||||||
Sales | – | 46,890 | 46,890 | |||||||||
U.S. Managed Volatility Fund |
| |||||||||||
Purchases | – | 423,582 | 423,582 | |||||||||
Sales | – | 1,250,249 | 1,250,249 | |||||||||
Global Managed Volatility Fund |
| |||||||||||
Purchases | – | 439,079 | 439,079 | |||||||||
Sales | – | 530,809 | 530,809 | |||||||||
Tax-Managed Managed Volatility Fund |
| |||||||||||
Purchases | – | 102,581 | 102,581 | |||||||||
Sales | – | 165,556 | 165,556 | |||||||||
Tax-Managed International Managed Volatility Fund |
| |||||||||||
Purchases | – | 151,144 | 151,144 | |||||||||
Sales | – | 164,678 | 164,678 | |||||||||
Real Estate Fund |
| |||||||||||
Purchases | – | 40,409 | 40,409 | |||||||||
Sales | – | 48,916 | 48,916 | |||||||||
Core Fixed Income Fund |
| |||||||||||
Purchases | 7,440,658 | 1,169,119 | 8,609,777 | |||||||||
Sales | 6,986,834 | 1,234,826 | 8,221,660 | |||||||||
| U.S. Gov’t ($ Thousands) | Other ($ Thousands) | Total ($ Thousands) | ||||||||||
High Yield Bond Fund |
| |||||||||||
Purchases | – | 521,826 | 521,826 | |||||||||
Sales | – | 545,398 | 545,398 | |||||||||
Conservative Income Fund |
| |||||||||||
Purchases | – | – | – | |||||||||
Sales | – | – | – | |||||||||
Tax-Free Conservative Income Fund |
| |||||||||||
Purchases | – | – | – | |||||||||
Sales | – | – | – | |||||||||
Real Return Fund |
| |||||||||||
Purchases | 42,157 | – | 42,157 | |||||||||
Sales | 54,882 | – | 54,882 | |||||||||
Dynamic Asset Allocation Fund |
| |||||||||||
Purchases | – | 28,332 | 28,332 | |||||||||
Sales | – | 129,296 | 129,296 | |||||||||
Multi-Strategy Alternative Fund |
| |||||||||||
Purchases | – | 939,065 | 939,065 | |||||||||
Sales | – | 997,090 | 997,090 | |||||||||
Multi-Asset Accumulation Fund |
| |||||||||||
Purchases | 121,806 | 195,358 | 317,164 | |||||||||
Sales | 195,260 | 239,436 | 434,696 | |||||||||
Multi-Asset Income Fund |
| |||||||||||
Purchases | 8,735 | 277,619 | 286,354 | |||||||||
Sales | 10,311 | 294,599 | 304,910 | |||||||||
Multi-Asset Inflation Managed Fund |
| |||||||||||
Purchases | 123,967 | 110,454 | 234,421 | |||||||||
Sales | 152,237 | 108,139 | 260,376 | |||||||||
Multi-Asset Capital Stability Fund |
| |||||||||||
Purchases | 79,483 | 43,464 | 122,947 | |||||||||
Sales | 148,707 | 30,342 | 179,049 | |||||||||
9. FEDERAL TAX INFORMATION
It is each Fund’s intention to continue to qualify as a regulated investment company under Subchapter M of The Internal Revenue Code and distribute all of its taxable income (including net capital gains). Accordingly, no provision for Federal income taxes is required.
The Multi-Asset Accumulation and Multi-Asset Inflation Managed Funds have each requested private letter rulings from the Internal Revenue Service (“IRS”) concluding that the income generated from their investment in their respective Subsidiaries, each of which invests in commodity-linked derivatives, will be “qualifying income” for regulated investment company (“RIC”) qualification purposes, regardless of whether actual distributions are made to the Funds by the respective Subsidiary.
In July 2011, the IRS suspended the issuance of private letter rulings regarding the investment by RICs into controlled foreign corporations which principally invest in commodities, such as the Subsidiaries, indicating that it was reconsidering its policies surrounding the issuance of these rulings. The Dynamic Commodity Strategy, Multi-Asset Accumulation and Multi-Asset Inflation Managed Funds have secured an opinion
| SEI Institutional Managed Trust / Semi-Annual Report / March 31, 2021 | 347 |
Notes to Financial Statements/Consolidated Notes to Financial Statements (Continued)
March 31, 2021 (Unaudited)
of counsel based on customary representations that actual distributions made to the Funds should be treated as “qualifying income”. The Treasury released a proposed regulation in October 2016 stating that income inclusion from a controlled foreign corporation is treated as dividends i.e. qualifying income only to the extent that the Funds received cash distributions from the subsidiary. The Treasury released a final regulation in March 2019 reversing its position on the proposed regulation by removing the cash distribution requirement. As a conservative measure, the Funds will continue to follow their existing distribution policy.
The Real Estate Fund has a tax year that ends on December 31. The following tax disclosures are representative as of September 30, 2020, except
for the permanent reclassification and tax character of distributions, which are as of December 31, 2019. Accordingly, the disclosures are for informational use by shareholders and are subject to change attributable to activity through the end of the tax year-ending December 31, 2020.
Dividends from net investment income and distributions from net realized capital gains are determined in accordance with U.S. Federal income tax regulations, which may differ from those amounts determined under U.S. GAAP. These book/tax differences are either temporary or permanent in nature.
These reclassifications had no impact on net assets or net asset value per share.
The tax character of dividends and distributions paid during the fiscal years or periods ended September 30, 2020 or September 30, 2019 (unless otherwise indicated) was as follows:
| Ordinary Income ($ Thousands) | Long-term Capital Gain ($ Thousands) | Return of Capital ($ Thousands) | Tax Exempt Income ($ Thousands) | Total ($ Thousands) | ||||||||||||||||||||
Large Cap Fund | ||||||||||||||||||||||||
| 2020 | $ | 30,110 | $ | 138,016 | $ | – | $ | – | $ | 168,126 | ||||||||||||||
| 2019 | 63,187 | 249,425 | – | – | 312,612 | |||||||||||||||||||
Large Cap Value Fund | ||||||||||||||||||||||||
| 2020 | 27,594 | 24,141 | – | – | 51,735 | |||||||||||||||||||
| 2019 | 38,436 | 101,919 | – | – | 140,355 | |||||||||||||||||||
Large Cap Growth Fund | ||||||||||||||||||||||||
| 2020 | 3,649 | 82,982 | – | – | 86,631 | |||||||||||||||||||
| 2019 | 26,844 | 148,720 | – | – | 175,564 | |||||||||||||||||||
Large Cap Index Fund | ||||||||||||||||||||||||
| 2020 | 8,948 | 351 | – | – | 9,299 | |||||||||||||||||||
| 2019 | 5,225 | 226 | – | – | 5,451 | |||||||||||||||||||
Tax-Managed Large Cap Fund | ||||||||||||||||||||||||
| 2020 | 50,899 | 294,034 | – | – | 344,933 | |||||||||||||||||||
| 2019 | 45,630 | 27,405 | – | – | 73,035 | |||||||||||||||||||
S&P 500 Index Fund | ||||||||||||||||||||||||
| 2020 | 14,528 | 24,598 | – | – | 39,126 | |||||||||||||||||||
| 2019 | 17,279 | 14,403 | – | – | 31,682 | |||||||||||||||||||
Small Cap Fund | ||||||||||||||||||||||||
| 2020 | 1,132 | – | 35 | – | 1,167 | |||||||||||||||||||
| 2019 | 27,739 | 51,099 | – | – | 78,838 | |||||||||||||||||||
Small Cap Value Fund | ||||||||||||||||||||||||
| 2020 | 3,780 | – | – | – | 3,780 | |||||||||||||||||||
| 2019 | 9,854 | 24,382 | – | – | 34,236 | |||||||||||||||||||
Small Cap Growth Fund | ||||||||||||||||||||||||
| 2020 | – | 11,363 | – | – | 11,363 | |||||||||||||||||||
| 2019 | 9,428 | 36,322 | – | – | 45,750 | |||||||||||||||||||
Tax-Managed Small/Mid Cap Fund | ||||||||||||||||||||||||
| 2020 | 3,010 | 18,580 | – | – | 21,590 | |||||||||||||||||||
| 2019 | 4,292 | 66,298 | – | – | 70,590 | |||||||||||||||||||
Mid-Cap Fund | ||||||||||||||||||||||||
| 2020 | 1,139 | 1,401 | – | – | 2,540 | |||||||||||||||||||
| 2019 | 4,906 | 8,115 | – | – | 13,021 | |||||||||||||||||||
U.S. Managed Volatility Fund | ||||||||||||||||||||||||
| 2020 | 33,108 | 53,884 | – | – | 86,992 | |||||||||||||||||||
| 2019 | 46,210 | 140,953 | – | – | 187,163 | |||||||||||||||||||
| 348 | SEI Institutional Managed Trust / Semi-Annual Report / March 31, 2021 |
| Ordinary Income ($ Thousands) | Long-term Capital Gain ($ Thousands) | Return of Capital ($ Thousands) | Tax Exempt Income ($ Thousands) | Total ($ Thousands) | ||||||||||||||||||||
Global Managed Volatility Fund | ||||||||||||||||||||||||
| 2020 | $ | 32,195 | $ | 36,904 | $ | – | $ | – | $ | 69,099 | ||||||||||||||
| 2019 | 35,198 | 86,795 | – | – | 121,993 | |||||||||||||||||||
Tax-Managed Managed Volatility Fund | ||||||||||||||||||||||||
| 2020 | 16,585 | 25,458 | – | – | 42,043 | |||||||||||||||||||
| 2019 | 17,492 | 30,837 | – | – | 48,329 | |||||||||||||||||||
Tax-Managed International Managed Volatility Fund | ||||||||||||||||||||||||
| 2020 | 11,126 | – | – | – | 11,126 | |||||||||||||||||||
| 2019 | 8,922 | – | – | – | 8,922 | |||||||||||||||||||
Real Estate Fund | ||||||||||||||||||||||||
| 2020 | 4,524 | 6,547 | – | – | 11,071 | |||||||||||||||||||
| 2019 | 1,882 | 9,180 | – | – | 11,062 | |||||||||||||||||||
Core Fixed Income Fund | ||||||||||||||||||||||||
| 2020 | 139,848 | – | – | – | 139,848 | |||||||||||||||||||
| 2019 | 118,680 | – | – | – | 118,680 | |||||||||||||||||||
High Yield Bond Fund | ||||||||||||||||||||||||
| 2020 | 98,605 | – | – | – | 98,605 | |||||||||||||||||||
| 2019 | 115,162 | – | – | – | 115,162 | |||||||||||||||||||
Conservative Income Fund | ||||||||||||||||||||||||
| 2020 | 2,635 | – | – | – | 2,635 | |||||||||||||||||||
| 2019 | 6,029 | – | – | – | 6,029 | |||||||||||||||||||
Tax-Free Conservative Income Fund | ||||||||||||||||||||||||
| 2020 | – | – | 7 | 1,199 | 1,206 | |||||||||||||||||||
| 2019 | – | 5 | – | 2,440 | 2,445 | |||||||||||||||||||
Real Return Fund | ||||||||||||||||||||||||
| 2020 | 1,379 | – | – | – | 1,379 | |||||||||||||||||||
| 2019 | 6,427 | – | – | – | 6,427 | |||||||||||||||||||
Dynamic Asset Allocation Fund | ||||||||||||||||||||||||
| 2020 | 13,342 | – | – | – | 13,342 | |||||||||||||||||||
| 2019 | 14,835 | – | – | – | 14,835 | |||||||||||||||||||
Multi-Strategy Alternative Fund | ||||||||||||||||||||||||
| 2020 | 4,831 | – | – | – | 4,831 | |||||||||||||||||||
| 2019 | 8,425 | 14,279 | – | – | 22,704 | |||||||||||||||||||
Multi-Asset Accumulation Fund | ||||||||||||||||||||||||
| 2020 | 207,206 | 128,753 | – | – | 335,959 | |||||||||||||||||||
| 2019 | 77,546 | 7,028 | – | – | 84,574 | |||||||||||||||||||
Multi-Asset Income Fund | ||||||||||||||||||||||||
| 2020 | 37,096 | – | – | – | 37,096 | |||||||||||||||||||
| 2019 | 35,715 | – | – | – | 35,715 | |||||||||||||||||||
Multi-Asset Inflation Managed Fund | ||||||||||||||||||||||||
| 2020 | 12,952 | – | – | – | 12,952 | |||||||||||||||||||
| 2019 | 16,073 | – | – | – | 16,073 | |||||||||||||||||||
Multi-Asset Capital Stability Fund | ||||||||||||||||||||||||
| 2020 | 24,566 | 1,679 | – | – | 26,245 | |||||||||||||||||||
| 2019 | 3,823 | – | – | – | 3,823 | |||||||||||||||||||
As of September 30, 2020, the components of Distributable Earnings/(Accumulated Losses) were as follows:
| Undistributed Ordinary Income ($ Thousands) | Undistributed Long-Term Capital Gain ($ Thousands) | Undistributed Tax-Exempt Income ($ Thousands) | Capital Loss Carryforwards ($ Thousands) | Post- October Losses ($ Thousands) | Late Year Ordinary Losses ($ Thousands) | Unrealized Appreciation (Depreciation) ($ Thousands) | Other Temporary Differences ($ Thousands) | Total Distributable Earnings (Accumulated Losses) ($ Thousands) | ||||||||||||||||||||||||||||
Large Cap Fund | $ | 4,091 | $ | 41,245 | $ | – | $ | – | $ | – | $ | – | $ | 539,556 | $ | (7 | ) | $ | 584,885 | |||||||||||||||||
Large Cap Value Fund | 11,826 | – | – | – | (50,305 | ) | – | 111,577 | (4 | ) | 73,094 | |||||||||||||||||||||||||
Large Cap Growth Fund | 5,554 | 128,928 | – | – | – | – | 767,396 | (2 | ) | 901,876 | ||||||||||||||||||||||||||
| SEI Institutional Managed Trust / Semi-Annual Report / March 31, 2021 | 349 |
Notes to Financial Statements/Consolidated Notes to Financial Statements (Continued)
March 31, 2021 (Unaudited)
| Undistributed Ordinary Income ($ Thousands) | Undistributed Long-Term Capital Gain ($ Thousands) | Undistributed Tax-Exempt Income ($ Thousands) | Capital Loss Carryforwards ($ Thousands) | Post- October Losses ($ Thousands) | Late Year Ordinary Losses ($ Thousands) | Unrealized Appreciation (Depreciation) ($ Thousands) | Other Temporary Differences ($ Thousands) | Total Distributable Earnings (Accumulated Losses) ($ Thousands) | ||||||||||||||||||||||||||||
Large Cap Index Fund | $ | 2,069 | $ | – | $ | – | $ | – | $ | (2,936 | ) | $ | – | $ | 106,169 | $ | – | $ | 105,302 | |||||||||||||||||
Tax-Managed Large Cap Fund | 8,901 | 55,586 | – | – | – | – | 1,965,007 | 4 | 2,029,498 | |||||||||||||||||||||||||||
S&P 500 Index Fund | 2,465 | 37,716 | – | – | – | – | 556,649 | 14 | 596,844 | |||||||||||||||||||||||||||
Small Cap Fund | – | – | – | (18,476 | ) | (15,828 | ) | – | 32,534 | (2 | ) | (1,772 | ) | |||||||||||||||||||||||
Small Cap Value Fund | 933 | – | – | (9,305 | ) | (15,219 | ) | – | (17,206 | ) | (3 | ) | (40,800 | ) | ||||||||||||||||||||||
Small Cap Growth Fund | – | – | – | (795 | ) | (4,483 | ) | (1,178 | ) | 35,257 | 2 | 28,803 | ||||||||||||||||||||||||
Tax-Managed Small/Mid Cap Fund | 120 | – | – | (7,116 | ) | (16,115 | ) | – | 216,246 | 3 | 193,138 | |||||||||||||||||||||||||
Mid-Cap Fund | 202 | – | – | (978 | ) | (5,296 | ) | – | 5,460 | (2 | ) | (614 | ) | |||||||||||||||||||||||
U.S. Managed Volatility Fund | 4,767 | 688 | – | – | (7,243 | ) | – | 178,619 | 2 | 176,833 | ||||||||||||||||||||||||||
Global Managed Volatility Fund | 2,371 | – | – | – | (3,346 | ) | – | 91,908 | 1 | 90,934 | ||||||||||||||||||||||||||
Tax-Managed Managed Volatility Fund | 2,402 | 7,103 | – | – | – | – | 374,143 | (1 | ) | 383,647 | ||||||||||||||||||||||||||
Tax-Managed International Managed | ||||||||||||||||||||||||||||||||||||
Volatility Fund | 5,007 | – | – | (28,140 | ) | (20,772 | ) | – | 40,997 | 1 | (2,907 | ) | ||||||||||||||||||||||||
Real Estate Fund | – | – | – | – | – | – | 5,812 | (4 | ) | 5,808 | ||||||||||||||||||||||||||
Core Fixed Income Fund | 127,154 | 41,756 | – | – | – | – | 145,110 | (28,981 | ) | 285,039 | ||||||||||||||||||||||||||
High Yield Bond Fund | 21,474 | – | – | (66,464 | ) | (25,248 | ) | – | (205,441 | ) | (8,301 | ) | (283,980 | ) | ||||||||||||||||||||||
Conservative Income Fund | 11 | – | – | – | – | – | 69 | (9 | ) | 71 | ||||||||||||||||||||||||||
Tax-Free Conservative Income Fund | – | – | – | (14 | ) | – | – | 34 | (4 | ) | 16 | |||||||||||||||||||||||||
Real Return Fund | 958 | – | – | (4,814 | ) | – | – | 10,087 | (988 | ) | 5,243 | |||||||||||||||||||||||||
Dynamic Asset Allocation Fund | 41,597 | – | – | (487 | ) | – | – | 268,157 | – | 309,267 | ||||||||||||||||||||||||||
Multi-Strategy Alternative Fund | 8,035 | – | – | – | – | – | (3,898 | ) | (2,197 | ) | 1,940 | |||||||||||||||||||||||||
Multi-Asset Accumulation Fund | 35,063 | 107,280 | – | – | – | (44,442 | ) | (240,536 | ) | (15,304 | ) | (157,939 | ) | |||||||||||||||||||||||
Multi-Asset Income Fund | 2,967 | – | – | (2,206 | ) | (19,726 | ) | – | 36,827 | (2,964 | ) | 14,898 | ||||||||||||||||||||||||
Multi-Asset Inflation Managed Fund | 7,595 | – | – | (44,688 | ) | (10,457 | ) | – | (133,319 | ) | (5,146 | ) | (186,015 | ) | ||||||||||||||||||||||
Multi-Asset Capital Stability Fund | 84 | 8,366 | – | – | – | – | 14,591 | (6,778 | ) | 16,263 | ||||||||||||||||||||||||||
Post October losses represent losses realized on investment transactions from November 1, 2019 through September 30, 2020 that, in accordance with Federal income tax regulations, the Funds may defer and treat as having arisen in the following fiscal year. Deferred Late-Year Losses represent ordinary losses realized on investment transactions from January 1, 2020 through September 30, 2020 and specified losses realized on investment transactions from November 1, 2019 through September 30, 2020, that, in accordance with Federal income tax regulations, the Fund defers and treats as having arisen in the following fiscal year.
For Federal income tax purposes, capital loss carryforwards may be carried forward and applied against future capital gains. Under the Regulated Investment Company Modernization Act of 2010, Funds will be permitted to carry forward capital losses incurred in taxable years beginning after December 22, 2011 for an unlimited period. However, any losses incurred during those future taxable years are required to be utilized prior to the losses incurred in pre-enactment taxable years. As a result of this ordering rule, pre-enactment capital loss carryforwards are more likely to expire
unused. Additionally, post-enactment capital losses that are carried forward will retain their character as either short-term or long-term capital losses rather than being considered all short-term as under previous law. Losses carried forward under these new provisions are as follows:
| ||||||||||||
| Short-Term Loss ($ Thousands) | Long-Term Loss ($ Thousands) | Total* ($ Thousands) | ||||||||||
| ||||||||||||
Small Cap Fund | $ | 18,476 | $ | – | $ | 18,476 | ||||||
Small Cap Value Fund | 9,305 | – | 9,305 | |||||||||
Small Cap Growth Fund | 795 | – | 795 | |||||||||
Tax-Managed Small/Mid Cap Fund | 6,584 | 532 | 7,116 | |||||||||
Mid-Cap Fund | 569 | 409 | 978 | |||||||||
Tax-Free Conservative Fund | 14 | – | 14 | |||||||||
Tax-Managed International Managed Volatility Fund | 28,004 | 136 | 28,140 | |||||||||
High Yield Bond Fund | 1,519 | 64,945 | 66,464 | |||||||||
Real Return Fund | – | 4,814 | 4,814 | |||||||||
Dynamic Asset Allocation Fund | 487 | – | 487 | |||||||||
Multi-Asset Income Fund | 1,926 | 280 | 2,206 | |||||||||
Multi-Asset Inflation Managed Fund | 41,871 | 2,817 | 44,688 | |||||||||
| * | This table should be used in conjunction with the capital loss carryforwards table. |
| 350 | SEI Institutional Managed Trust / Semi-Annual Report / March 31, 2021 |
| (1) | The Utilization is subject to a limitation. |
During the fiscal year ended September 30, 2020, the following Funds utilized capital loss carryforward to offset capital gains:
| Amount Utilized ($ Thousands) | ||||
Real Return | $ | 453 | ||
Core Fixed Income Fund | 1,763 | |||
Dynamic Asset Allocation | 19,297 | |||
Multi-Asset Income Fund | – | |||
For Federal income tax purposes, the cost of investments owned at September 30, 2020, and the net realized gains or losses on investments sold for the period, were different from amounts reported for financial reporting purposes primarily due to investments in partnerships that captures losses from other securities, and wash sales which cannot be used for Federal income tax purposes in the current year and have been deferred for use in future years. The Federal tax cost and aggregate gross unrealized appreciation and depreciation on total investments held by the Funds at March 31, 2021, were as follows:
| Federal Tax Cost ($ Thousands) | Appreciated Securities ($ Thousands) | Depreciated Securities ($ Thousands) | Net Unrealized Appreciation (Depreciation) ($ Thousands) | |||||||||||||
Large Cap Fund | $ | 1,306,357 | $ | 900,668 | $ | (6,535 | ) | $ | 894,133 | |||||||
Large Cap Value Fund | 1,011,272 | 480,434 | (5,510 | ) | 474,924 | |||||||||||
Large Cap Growth Fund | 792,335 | 890,285 | (3,196 | ) | 887,089 | |||||||||||
Large Cap Index Fund | 662,590 | 263,508 | (10,897 | ) | 252,611 | |||||||||||
Tax-Managed Large Cap Fund | 1,785,255 | 2,649,171 | – | 2,649,171 | ||||||||||||
S&P 500 Index Fund | 273,728 | 673,417 | (6,970 | ) | 666,447 | |||||||||||
Small Cap Fund | 497,883 | 201,978 | (34,333 | ) | 167,645 | |||||||||||
Small Cap Value Fund | 326,612 | 132,869 | (2,678 | ) | 130,191 | |||||||||||
Small Cap Growth Fund | 421,337 | 100,699 | (8,034 | ) | 92,665 | |||||||||||
Tax-Managed Small/Mid Cap Fund | 693,268 | 446,773 | (2,460 | ) | 444,313 | |||||||||||
Mid-Cap Fund | 64,388 | 17,795 | (1,147 | ) | 16,648 | |||||||||||
U.S. Managed Volatility Fund | 777,598 | 240,604 | (8,029 | ) | 232,575 | |||||||||||
Global Managed Volatility Fund | 919,245 | 136,433 | (16,348 | ) | 120,085 | |||||||||||
Tax-Managed Managed Volatility Fund | 513,803 | 476,789 | (454 | ) | 476,335 | |||||||||||
Tax-Managed International Managed Volatility Fund | 321,308 | 75,452 | (2,391 | ) | 73,061 | |||||||||||
Real Estate Fund | 76,269 | 24,606 | (289 | ) | 24,317 | |||||||||||
Core Fixed Income Fund | 5,120,032 | 117,544 | (95,753 | ) | 21,791 | |||||||||||
High Yield Bond Fund | 1,487,636 | 112,490 | (45,674 | ) | 66,816 | |||||||||||
Conservative Income Fund | 331,686 | 43 | (3 | ) | 40 | |||||||||||
Tax-Free Conservative Income Fund | 207,127 | 8 | – | 8 | ||||||||||||
| Federal Tax Cost ($ Thousands) | Appreciated Securities ($ Thousands) | Depreciated Securities ($ Thousands) | Net Unrealized Appreciation (Depreciation) ($ Thousands) | |||||||||||||
Real Return Fund | $ | 241,694 | $ | 12,787 | $ | (193 | ) | $ | 12,594 | |||||||
Dynamic Asset Allocation Fund | 373,238 | 387,377 | (14,197 | ) | 373,180 | |||||||||||
Multi-Strategy Alternative Fund | 449,172 | 23,211 | (7,163 | ) | 16,048 | |||||||||||
Multi-Asset Accumulation Fund | 1,498,885 | 91,768 | (5,502 | ) | 86,266 | |||||||||||
Multi-Asset Income Fund | 818,704 | 90,092 | (28,445 | ) | 61,647 | |||||||||||
Multi-Asset Inflation Managed Fund | 953,811 | 106,807 | (7,430 | ) | 99,377 | |||||||||||
Multi-Asset Capital Stability Fund | 476,309 | 24,374 | (1,496 | ) | 22,878 | |||||||||||
Management has analyzed the Funds’ tax positions taken on federal income tax returns for all open tax years and has concluded that as of March 31, 2021, no provision for income tax would be required in the Funds’ financial statements. The Funds’ federal and state income and federal excise tax returns for tax years for which the applicable statutes of limitations have not expired are subject to examination by the Internal Revenue Service and state departments of revenue.
10. SECURITIES LENDING
Each Fund may lend portfolio securities to brokers, dealers and other financial organizations that meet capital and other credit requirements or other criteria established by the Board. These loans may not exceed 33 1/3% of the total asset value of the Fund (including the loan collateral). No Fund will lend portfolio securities to its Adviser, sub-adviser or their affiliates unless it has applied for and received specific authority to do so from the SEC. Loans of portfolio securities will be fully collateralized by cash, letters of credit or U.S. Government securities. Collateral will be maintained in an amount equal to at least 100% of the current market value of the loaned securities by marking to market daily, although the borrower will be required to deliver collateral between 102% and 105% of the market value of borrowed securities for domestic and foreign securities, respectively. However, due to market fluctuations during the day, the value of securities loaned on a particular day may, during the course of the day, exceed the value of collateral. On each business day, the amount of collateral is adjusted based on the prior day’s market fluctuations and the current day’s lending activity. Income from lending activity is determined by the amount of interest earned on collateral, less any amounts payable to the borrowers of the securities and the lending agent. Lending securities involves certain risks, including the risk that the Fund may be delayed or restricted from recovering the loomed securities or disposing of the collateral for the loan, which could give rise to loss because at adverse market actions expenses
| SEI Institutional Managed Trust / Semi-Annual Report / March 31, 2021 | 351 |
Notes to Financial Statements/Consolidated Notes to Financial Statements (Continued)
March 31, 2021 (Unaudited)
and/ or delays in connection with the disposition of the underlying securities.
Cash collateral received in connection with securities lending is invested in eligible securities by the lending agent. These investments may include the SEI Liquidity Fund L.P. (“Liquidity Fund”), and the Fund bears its pro rata portion of the Liquidity Fund’s expenses and is subject to the risk of loss in the underlying investments of the Liquidity Fund. There is no guarantee that these investments will not lose value.
The following is a summary of securities lending agreements held by certain Funds which would be subject to offset as of March 31, 2021 ($ Thousands):
| ||||||||||||
| Securities Loaned at Value | Cash Collateral Received (1) | Net Amount | ||||||||||
| ||||||||||||
Large Cap Fund | $12,142 | $12,142 | $– | |||||||||
Large Cap Value Fund | 3,564 | 3,564 | – | |||||||||
Large Cap Growth Fund | 6,907 | 6,907 | – | |||||||||
Large Cap Index Fund | 69 | 69 | – | |||||||||
Tax-Managed Large Cap Fund | 1,141 | 1,141 | – | |||||||||
Small Cap Fund | 6,203 | 6,203 | – | |||||||||
Small Cap Value Fund | 28,779 | 28,779 | – | |||||||||
Small Cap Growth Fund | 69,599 | 69,599 | – | |||||||||
Tax-Managed Small/Mid Cap Fund | 112,616 | 112,616 | – | |||||||||
Mid-Cap Fund | 564 | 564 | – | |||||||||
U.S. Managed Volatility Fund | 11,216 | 11,216 | – | |||||||||
Global Managed Volatility Fund | 16,081 | 16,081 | – | |||||||||
Tax-Managed Managed Volatility Fund | 10,374 | 10,374 | – | |||||||||
Tax-Managed International Managed Volatility Fund | 11,208 | 11,208 | – | |||||||||
Core Fixed Income Fund | 86,550 | 86,550 | – | |||||||||
| (1) | Excess collateral received in connection with the above securities lending transactions is not shown for financial reporting purposes. See each Fund’s Summary Schedule of Investments or Schedule of Investments for the total collateral received. |
11. CONCENTRATION/RISKS
In the normal course of business, the Trust enters into contracts that provide general indemnifications by the Trust to the counterparty to the contract. The Trust’s maximum exposure under these arrangements is dependent on future claims that may be made against the Trust and, therefore, cannot be estimated; however, Management believes that, based on experience, the risk of loss from such claims is considered remote.
To the extent consistent with its investment strategy a Fund may have one or more of the following principle risks:
Arbitrage Strategies Risk — Arbitrage strategies involve engaging in transactions that attempt to exploit price differences of identical, related or similar securities on different markets or in different forms. The Fund may
realize losses or a reduced rate of return if underlying relationships among securities in which it takes investment positions change in an adverse manner or if a transaction is unexpectedly terminated or delayed. Trading to seek short-term capital appreciation can be expected to cause the Fund’s portfolio turnover rate to be substantially higher than that of the average equity-oriented investment company.
Asset-Backed Securities Risk — Payment of principal and interest on asset-backed securities is dependent largely on the cash flows generated by the assets backing the securities. Securitization trusts generally do not have any assets or sources of funds other than the receivables and related property they own, and asset-backed securities are generally not insured or guaranteed by the related sponsor or any other entity. Asset-backed securities may be more illiquid than more conventional types of fixed income securities that the Fund may acquire.
Bank Loans Risk — With respect to bank loans, the Fund will assume the credit risk of both the borrower and the lender that is selling the participation in the loan. The Fund may also have difficulty disposing of bank loans because, in certain cases, the market for such instruments is not highly liquid.
Below Investment Grade Securities (Junk Bonds) Risk — Fixed income securities rated below investment grade ( junk bonds) involve greater risks of default or downgrade and are generally more volatile than investment grade securities because the prospect for repayment of principal and interest of many of these securities is speculative. Because these securities typically offer a higher rate of return to compensate investors for these risks, they are sometimes referred to as “high yield bonds,” but there is no guarantee that an investment in these securities will result in a high rate of return.
Call Risk — Issuers of callable bonds may call (redeem) securities with higher coupons or interest rates before their maturity dates. The Fund may be forced to reinvest the unanticipated proceeds at lower interest rates, resulting in a decline in the Fund’s income. Bonds may be called due to falling interest rates or non-economical circumstances.
Collateralized Debt Obligations (CDOs) and
Collateralized Loan Obligations (CLOs) Risk — CDOs and CLOs are securities backed by an underlying portfolio of debt and loan obligations, respectively. CDOs and CLOs issue classes or “tranches” that vary in risk and yield and may experience substantial losses due to actual defaults, decrease in market value due to collateral defaults and removal of subordinate tranches, market anticipation of defaults and investor aversion to
| 352 | SEI Institutional Managed Trust / Semi-Annual Report / March 31, 2021 |
CDO and CLO securities as a class. The risks of investing in CDOs and CLOs depend largely on the tranche invested in and the type of the underlying debts and loans in the tranche of the CDO or CLO, respectively, in which the Fund invests. CDOs and CLOs also carry risks including, but not limited to, interest rate risk and credit risk, which are described below. For example, a liquidity crisis in the global credit markets could cause substantial fluctuations in prices for leveraged loans and high-yield debt securities and limited liquidity for such instruments. When the Fund invests in CDOs or CLOs, in addition to directly bearing the expenses associated with its own operations, it may bear a pro rata portion of the CDO’s or CLO’s expenses.
Commercial Paper Risk — Commercial paper is a short-term obligation with a maturity generally ranging from one to 270 days and is issued by U.S. or foreign companies or other entities in order to finance their current operations. Such investments are unsecured and usually discounted from their value at maturity. The value of commercial paper may be affected by changes in the credit rating or financial condition of the issuing entities and will tend to fall when interest rates rise and rise when interest rates fall. Asset-backed commercial paper may be issued by structured investment vehicles or other conduits that are organized to issue the commercial paper and to purchase trade receivables or other financial assets. The repayment of asset-backed commercial paper depends primarily on the cash collections received from such issuer’s underlying asset portfolio and the issuer’s ability to issue new asset-backed commercial paper.
Commodity Investments and Derivatives Risk — Commodity investments and derivatives may be more volatile and less liquid than direct investments in the underlying commodities themselves. Commodity related equity returns can also be affected by the issuer’s financial structure or the performance of unrelated businesses. The value of a commodity investment or a derivative investment in commodities is typically based upon the price movements of a physical commodity, a commodity futures contract or commodity index or some other readily measurable economic variable that is dependent upon changes in the value of commodities or the commodities markets. The value of these securities will rise or fall in response to changes in the underlying commodity or related benchmark or investment, changes in interest rates or factors affecting a particular industry or commodity, such as natural disasters, weather and U.S. and international economic, political and regulatory developments.
Commodity-Linked Securities Risk — Investments in commodity-linked securities may be more volatile and less liquid than direct investments in the underlying
commodities themselves. Commodity-related equity returns can also be affected by the issuer’s financial structure or the performance of unrelated businesses.
Concentration Risk — A downturn in the financial services industry would impact the Fund more than a portfolio that does not concentrate in securities issued by companies in the financial services industry.
Convertible and Preferred Securities Risk — Convertible and preferred securities have many of the same characteristics as stocks, including many of the same risks. In addition, convertible securities may be more sensitive to changes in interest rates than stocks. Convertible securities may also have credit ratings below investment grade, meaning that they carry a higher risk of failure by the issuer to pay principal and/or interest when due.
Corporate Fixed Income Securities Risk — Corporate fixed income securities respond to economic developments, especially changes in interest rates, as well as perceptions of the creditworthiness and business prospects of individual issuers.
Credit Risk — The risk that the issuer of a security or the counterparty to a contract will default or otherwise become unable to honor a financial obligation.
Currency Risk — As a result of the Fund’s investments in securities or other investments denominated in, and/ or receiving revenues in, foreign currencies, the Fund will be subject to currency risk. Currency risk is the risk that foreign currencies will decline in value relative to the U.S. dollar or, in the case of hedging positions, that the U.S. dollar will decline in value relative to the currency hedged. In either event, the dollar value of an investment in the Fund would be adversely affected. Due to the Fund’s investments in securities denominated in foreign currencies, it will be subject to the risk that currency exchange rates may fluctuate in response to, among other things, changes in interest rates, intervention (or failure to intervene) by U.S. or foreign governments, central banks or supranational entities, or by the imposition of currency controls or other political developments in the United States or abroad.
Depositary Receipts Risk — Depositary receipts, such as ADRs, are certificates evidencing ownership of shares of a foreign issuer that are issued by depositary banks and generally trade on an established market. Depositary receipts are subject to many of the risks associated with investing directly in foreign securities, including, among other things, political, social and economic developments abroad, currency movements and different legal, regulatory, tax, accounting and audit environments.
Derivatives Risk — The Funds’ use of futures contracts and forward contracts is subject to market risk, leverage
| SEI Institutional Managed Trust / Semi-Annual Report / March 31, 2021 | 353 |
Notes to Financial Statements/Consolidated Notes to Financial Statements (Continued)
March 31, 2021 (Unaudited)
risk, correlation risk and liquidity risk. Market risk is described above, and leverage risk and liquidity risk are described below. Many over-the-counter (OTC) derivative instruments will not have liquidity beyond the counterparty to the instrument. Correlation risk is the risk that changes in the value of the derivative may not correlate perfectly with the underlying asset, rate or index. The Fund’s use of forward contracts is also subject to credit risk and valuation risk. Credit risk is described below. Valuation risk is the risk that the derivative may be difficult to value and/or valued incorrectly. Each of these risks could cause the Fund to lose more than the principal amount invested in a derivative instrument. Some derivatives have the potential for unlimited loss, regardless of the size of the Fund’s initial investment. The other parties to certain derivative contracts present the same type of credit risk as issuers of fixed income securities. The Fund’s use of derivatives may also increase the amount of taxes payable by shareholders. Both U.S. and non-U.S. regulators have adopted and are in the process of implementing regulations governing derivatives markets, the ultimate impact of which remains unclear.
Directional or Tactical Strategies Risk — Directional or tactical strategies usually use long and short positions, which entail predicting the direction that particular securities or sectors or the overall market might move. Directional or tactical strategies may utilize leverage and hedging. There may be a significant risk of loss if the Fund’s judgment is incorrect as to the direction, timing or extent of expected movements of particular securities or sectors or the market as a whole.
Distressed Securities Risk — Distressed securities frequently do not produce income while they are outstanding and may require the Fund to bear certain extraordinary expenses in order to protect and recover its investment. Distressed securities are at high risk for default.
Duration Risk — The longer-term securities in which the Fund may invest tend to be more volatile than shorter-term securities. A portfolio with a longer average portfolio duration is more sensitive to changes in interest rates than a portfolio with a shorter average portfolio duration.
Economic Risks of Global Health Events — Global health events and pandemics, such as COVID-19, have the ability to affect—quickly, drastically and substantially the economies of many nations, states, individual companies and the markets in general and can cause disruptions that cannot necessarily be foreseen. The spread of COVID-19 around the world in 2020 resulted in a substantial number of nations implementing social distancing measures, quarantines, and the shutdown of
non-essential businesses and governmental services. Further, it has caused significant volatility in U.S. and international markets. The impact of the outbreak may be short term or may last for an extended period of time.
Event-Driven Strategies Risk — Event-driven strategies involve making evaluations and predictions about both the likelihood that a particular event in the life of a company will occur and the impact such an event will have on the value of the company’s securities. The transaction in which such a company is involved may be unsuccessful, take considerable time (or longer than anticipated) or may result in a distribution of cash or a new security, the value of which may be less than the purchase price of the company’s security. If an anticipated transaction does not occur, the Fund may be required to sell its securities at a loss.
Exchange-Traded Funds (ETFs) Risk — The risks of owning shares of an ETF generally reflect the risks of owning the underlying securities the ETF is designed to track, although lack of liquidity in an ETF could result in its value being more volatile than the underlying portfolio securities. When the Fund invests in an ETF, in addition to directly bearing the expenses associated with its own operations, it will bear a pro rata portion of the ETF’s expenses.
Exchange-Traded Notes (ETNs) Risk — The value of an ETN is subject to the credit risk of the issuer.
There may not be an active trading market available for some ETNs. Additionally, trading of ETNs may be halted or the ETN may be delisted by the listing exchange.
Extension Risk — The risk that rising interest rates may extend the duration of a fixed income security, typically reducing the security’s value.
Financial Services Industry Risk — The Conservative Income Fund’s portfolio is concentrated in investments in securities issued by companies in the financial services industry. The financial services industry is subject to extensive government regulation. Profitability is largely dependent on the availability and cost of capital, and can fluctuate significantly when interest rates change. Financial services companies are highly dependent on short-term interest rates and typically will be adversely affected by economic downturns or changes in banking regulations.
Foreign Investment/Emerging Markets Risk — The risk that non-U.S. securities may be subject to additional risks due to, among other things, political, social and economic developments abroad, currency movements and different legal, regulatory, tax, accounting and audit environments. These additional risks may be heightened with respect to emerging market countries
| 354 | SEI Institutional Managed Trust / Semi-Annual Report / March 31, 2021 |
because political turmoil and rapid changes in economic conditions are more likely to occur in these countries. In addition, periodic U.S. Government restrictions on investments in issuers from certain foreign countries may require the Fund to sell such investments at inopportune times, which could result in losses to the Fund.
Foreign Sovereign Debt Securities Risk — The risks that: (i) the governmental entity that controls the repayment of sovereign debt may not be willing or able to repay the principal and/or interest when it becomes due because of factors such as debt service burden, political constraints, cash flow problems and other national economic factors; (ii) governments may default on their debt securities, which may require holders of such securities to participate in debt rescheduling or additional lending to defaulting governments; and (iii) there is no bankruptcy proceeding by which defaulted sovereign debt may be collected in whole or in part.
Income Risk — An investment in the Fund is subject to income risk, which is the possibility that the Fund’s yield will decline due to falling interest rates.
Inflation Protected Securities Risk — The value of inflation protected securities, including TIPS, generally will fluctuate in response to changes in “real” interest rates, generally decreasing when real interest rates rise and increasing when real interest rates fall. Real interest rates represent nominal (or stated) interest rates reduced by the expected impact of inflation. In addition, interest payments on inflation indexed securities will generally vary up or down along with the rate of inflation.
Interest Rate Risk — The risk that a rise in interest rates will cause a fall in the value of fixed income securities, including U.S. Government securities, in which the Fund invests. A low interest rate environment may present greater interest rate risk because there may be a greater likelihood of rates increasing and rates may increase more rapidly.
Investment Company and Exchange-Traded Funds (ETFs) Risk — When the Fund invests in an investment company, in addition to directly bearing the expenses associated with its own operations, it will bear a pro rata portion of the investment company’s expenses. In addition, while the risks of owning shares of an investment company generally reflect the risks of owning the underlying investments of the investment company, the Fund may be subject to additional or different risks than if the Fund had invested directly in the underlying investments. For example, the lack of liquidity in an ETF could result in its value being more volatile than the underlying portfolio securities. Closed-end investment companies issue a fixed number of shares that trade on a stock exchange or over-the-counter at a premium or a discount to their net asset
value. As a result, a closed-end fund’s share price fluctuates based on what another investor is willing to pay rather than on the market value of the securities in the fund.
Investment in the Subsidiary Risk — A Subsidiary is not registered under the Investment Company Act of 1940 (the 1940 Act) and, unless otherwise noted in this prospectus, is not subject to all of the investor protections of the 1940 Act. Thus, the Fund, as an investor in a Subsidiary, will not have all of the protections offered to investors in registered investment companies. In addition, changes in the laws of the United States and/or the Cayman Islands, under which the Fund and a Subsidiary, respectively, are organized, could result in the inability of the Fund and/or a Subsidiary to operate as intended and could negatively affect the Fund and its shareholders.
Investment Style Risk — The risk that large capitalization securities may underperform other segments of the equity markets or the equity markets as a whole.
Large Capitalization Risk — The risk that larger, more established companies may be unable to respond quickly to new competitive challenges such as changes in technology and consumer tastes. Larger companies also may not be able to attain the high growth rates of successful smaller companies.
Leverage Risk — The Fund’s use of derivatives may result in the Fund’s total investment exposure substantially exceeding the value of its portfolio securities and the Fund’s investment returns depending substantially on the performance of securities that the Fund may not directly own. The use of leverage can amplify the effects of market volatility on the Fund’s share price and may also cause the Fund to liquidate portfolio positions when it would not be advantageous to do so in order to satisfy its obligations. The Fund’s use of leverage may result in a heightened risk of investment loss.
Liquidity Risk — The risk that certain securities may be difficult or impossible to sell at the time and the price that the Fund would like. The Fund may have to lower the price of the security, sell other securities instead or forego an investment opportunity, any of which could have a negative effect on Fund management or performance.
Market Risk — The risk that the market value of a security may move up and down, sometimes rapidly and unpredictably. Market risk may affect a single issuer, an industry, a sector or the equity or bond market as a whole. Equity markets may decline significantly in response to adverse issuer, political, regulatory, market, economic or other developments that may cause broad
| SEI Institutional Managed Trust / Semi-Annual Report / March 31, 2021 | 355 |
Notes to Financial Statements/Consolidated Notes to Financial Statements (Continued)
March 31, 2021 (Unaudited)
changes in market value, public perceptions concerning these developments, and adverse investor sentiment or publicity. Similarly, environmental and public health risks, such as natural disasters, epidemics, pandemics or widespread fear that such events may occur, may impact markets adversely and cause market volatility in both the short- and long-term. The prices of the Fund’s fixed income securities respond to economic developments, particularly interest rate changes, as well as to perceptions about the creditworthiness of individual issuers, including governments and their agencies. Generally, the Fund’s fixed income securities will decrease in value if interest rates rise and vice versa. In a low interest rate environment, risks associated with rising rates are heightened. Declines in dealer market-making capacity as a result of structural or regulatory changes could decrease liquidity and/or increase volatility in the fixed income markets. Markets for fixed income securities may decline significantly in response to adverse issuer, political, regulatory, market, economic or other developments that may cause broad changes in market value, public perceptions concerning these developments, and adverse investor sentiment or publicity. Similarly, environmental and public health risks, such as natural disasters, epidemics, pandemics or widespread fear that such events may occur, may impact markets adversely and cause market volatility in both the short- and long-term. In response to these events, the Fund’s value may fluctuate and/or the Fund may experience increased redemptions from shareholders, which may impact the Fund’s liquidity or force the Fund to sell securities into a declining or illiquid market.
Master Limited Partnership (MLP) Risk — Investments in units of MLPs involve risks that differ from an investment in common stock. Holders of the units of MLPs have more limited control and limited rights to vote on matters affecting the partnership. There are also certain tax risks associated with an investment in units of MLPs. In addition, conflicts of interest may exist between common unit holders, subordinated unit holders and the general partner of an MLP, including a conflict arising as a result of incentive distribution payments. The benefit the Fund derives from investment in MLP units is largely dependent on the MLPs being treated as partnerships and not as corporations for federal income tax purposes. If an MLP were classified as a corporation for federal income tax purposes, there would be a reduction in the after-tax return to the Fund of distributions from the MLP, likely causing a reduction in the value of the Fund’s shares. MLP entities are typically focused in the energy, natural resources and real estate sectors of the economy. A downturn in the energy, natural resources or real estate sectors of the economy could have an adverse impact on the Fund. At times, the performance
of securities of companies in the energy, natural resources and real estate sectors of the economy may lag the performance of other sectors or the broader market as a whole. The Internal Revenue Code of 1986, as amended, provides that the Fund is permitted to invest up to 25% of its assets in one or more qualified publicly traded partnerships (QPTPs), which will include certain MLPs, and treat the income allocated by such QPTPs as qualifying income for purposes of the regulated investment company annual qualifying income requirements described in “Taxes” below.
Mortgage Dollar Rolls Risk — Mortgage dollar rolls are transactions in which the Fund sells securities (usually mortgage-backed securities) and simultaneously contracts to repurchase substantially similar, but not identical, securities on a specified future date. If the broker-dealer to whom the Fund sells the security becomes insolvent, the Fund’s right to repurchase the security may be restricted. Other risks involved in entering into mortgage dollar rolls include the risk that the value of the security may change adversely over the term of the mortgage dollar roll and that the security the Fund is required to repurchase may be worth less than the security that the Fund originally held.
Mortgage-Backed Securities Risk — Mortgage-backed securities are affected significantly by the rate of prepayments and modifications of the mortgage loans backing those securities, as well as by other factors such as borrower defaults, delinquencies, realized or liquidation losses and other shortfalls. Mortgage backed securities are particularly sensitive to prepayment risk, which is described below, given that the term to maturity for mortgage loans is generally substantially longer than the expected lives of those securities; however, the timing and amount of prepayments cannot be accurately predicted. The timing of changes in the rate of prepayments of the mortgage loans may significantly affect the Fund’s actual yield to maturity on any mortgage-backed securities, even if the average rate of principal payments is consistent with the Fund’s expectation. Along with prepayment risk, mortgage-backed securities are significantly affected by interest rate risk, which is described above. In a low interest rate environment, mortgage loan prepayments would generally be expected to increase due to factors such as refinancings and loan modifications at lower interest rates. In contrast, if prevailing interest rates rise, prepayments of mortgage loans would generally be expected to decline and therefore extend the weighted average lives of mortgage-backed securities held or acquired by the Fund.
Municipal Securities Risk — Municipal securities, like other fixed income securities, rise and fall in value in response to economic and market factors, primarily
| 356 | SEI Institutional Managed Trust / Semi-Annual Report / March 31, 2021 |
changes in interest rates, and actual or perceived credit quality. Rising interest rates will generally cause municipal securities to decline in value. Longer term securities usually respond more sharply to interest rate changes than do shorter-term securities. A municipal security will also lose value if, due to rating downgrades or other factors, there are concerns about the issuer’s current or future ability to make principal or interest payments. State and local governments rely on taxes and, to some extent, revenues from private projects financed by municipal securities, to pay interest and principal on municipal debt. Poor statewide or local economic results or changing political sentiments may reduce tax revenues and increase the expenses of municipal issuers, making it more difficult for them to meet their obligations. Actual or perceived erosion of the creditworthiness of municipal issuers may reduce the value of the Fund’s holdings. As a result, the Fund will be more susceptible to factors that adversely affect issuers of municipal obligations than a mutual fund that does not have as great a concentration in municipal obligations. Municipal obligations may be underwritten or guaranteed by a relatively small number of financial services firms, so changes in the municipal securities market that affect those firms may decrease the availability of municipal instruments in the market, thereby making it difficult for the Sub-Adviser to identify and obtain appropriate investments for the Fund’s portfolio. Also, there may be economic or political changes that impact the ability of issuers of municipal securities to repay principal and to make interest payments on securities owned by the Fund. Any changes in the financial condition of municipal issuers may also adversely affect the value of the Fund’s securities.
Non-Diversified Risk — The Multi-Asset Accumulation and Multi-Asset Inflation Managed Funds are non-diversified, which means that they may invest in the securities of relatively few issuers. As a result, these Funds may be more susceptible to a single adverse economic or political occurrence affecting one or more of these issuers and may experience increased volatility due to its investments in those securities.
Opportunity Risk — The risk of missing out on an investment opportunity because the assets necessary to take advantage of it are tied up in other investments.
Portfolio Turnover Risk — Due to its investment strategy, the Fund may buy and sell securities frequently. This may result in higher transaction costs and additional capital gains tax liabilities, which may affect the Fund’s performance.
Prepayment Risk — The risk that, in a declining interest rate environment, fixed income securities with stated
interest rates may have the principal paid earlier than expected, requiring the Fund to invest the proceeds at generally lower interest rates.
Private Placements Risk — Investment in privately placed securities may be less liquid than in publicly traded securities. Although these securities may be resold in privately negotiated transactions, the prices realized from these sales could be less than those originally paid by the Fund or less than what may be considered the fair value of such securities. Further, companies whose securities are not publicly traded may not be subject to the disclosure and other investor protection requirements that might be applicable if their securities were publicly traded.
Real Estate Industry Risk — Securities of companies principally engaged in the real estate industry may be subject to the risks associated with the direct ownership of real estate. Risks commonly associated with the direct ownership of real estate include fluctuations in the value of underlying properties, defaults by borrowers or tenants, changes in interest rates and risks related to general or local economic conditions. The Fund’s investments are concentrated in issuers conducting business in the real estate industry, and therefore the Fund is subject to risks associated with legislative or regulatory changes, adverse market conditions and/or increased competition affecting that industry.
Real Estate Investment Trusts (REITs) Risk — REITs are trusts that invest primarily in commercial real estate or real estate-related loans. The Fund’s investments in REITs will be subject to the risks associated with the direct ownership of real estate. Risks commonly associated with the direct ownership of real estate include fluctuations in the value of underlying properties, defaults by borrowers or tenants, changes in interest rates and risks related to general or local economic conditions. Some REITs may have limited diversification and may be subject to risks inherent in financing a limited number of properties.
Repurchase Agreement Risk — Although repurchase agreement transactions must be fully collateralized at all times, they generally create leverage and involve some counterparty risk to the Fund whereby a defaulting counterparty could delay or prevent the Fund’s recovery of collateral.
Short Sales Risk — A short sale involves the sale of a security that the Fund does not own in the expectation of purchasing the same security (or a security exchangeable therefore) at a later date at a lower price. Short sales expose the Fund to the risk that it will be required to buy the security sold short (also known as “covering” the short position) at a time when the security has appreciated in value, thus resulting in a loss to the
| SEI Institutional Managed Trust / Semi-Annual Report / March 31, 2021 | 357 |
Notes to Financial Statements/Consolidated Notes to Financial Statements (Continued)
March 31, 2021 (Unaudited)
Fund. Investment in short sales may also cause the Fund to incur expenses related to borrowing securities. Reinvesting proceeds received from short selling may create leverage, which can amplify the effects of market volatility on the Fund’s share price. In addition, shorting a future contract may require posting only a margin that may amount to less than the notional exposure of the contract. Such a practice may exacerbate the loss in a case of adverse price action.
Small and Medium Capitalization Companies Risk — The risk that small and medium capitalization companies in which the Fund may invest may be more vulnerable to adverse business or economic events than larger, more established companies. In particular, small and medium capitalization companies may have limited product lines, markets and financial resources and may depend upon a relatively small management group. Therefore, small capitalization and medium capitalization stocks may be more volatile than those of larger companies. Small capitalization and medium capitalization stocks may be traded over-the-counter or listed on an exchange.
Tax Risk — The Fund may gain most of its exposure to the commodities markets through its investment in a Subsidiary, which invests in commodity investments and derivative instruments. To the extent the Fund invests in such instruments directly, it will seek to restrict its income from commodity-linked derivative instruments that do not generate qualifying income, such as commodity-linked swaps, to a maximum of 10% of its gross income (when combined with its other investments that produce nonqualifying income) to comply with certain qualifying income tests necessary for the Fund to qualify as a regulated investment company (RIC) under Subchapter M of the Internal Revenue Code of 1986, as amended. The tax treatment of certain commodity-linked derivative instruments may be affected by future regulatory or legislative changes that could affect the character, timing and/or amount of the Fund’s taxable income or gains and distributions. The Fund intends to hold certain commodity-related investments indirectly through a Subsidiary. The Fund believes that income from the Subsidiary will be qualifying income because it expects that the Subsidiary will make annual distributions of its earnings and profits. The Fund intends to secure an opinion of counsel based on customary representations that actual distributions made to the Fund from its Subsidiary should be treated as “qualifying income.” If the Fund did not qualify as a RIC for any taxable year and certain relief provisions were not available, the Fund’s taxable income would be subject to tax at the Fund level and to a further tax at the shareholder level when such income is distributed. Failure to comply with the requirements for
qualification as a RIC would have significant negative tax consequences to Fund shareholders.
Taxation Risk — The Fund is managed to seek to minimize tax consequences to shareholders, but there is no guarantee that the Fund will be able to operate without incurring taxable income and gains to shareholders.
Tracking Error Risk — The risk that the Fund’s performance may vary substantially from the performance of the benchmark index it tracks as a result of cash flows, Fund expenses, imperfect correlation between the Fund’s investments and the index’s components and other factors.
U.S. Government Securities Risk — Although U.S. Government securities are considered to be among the safest investments, they are still subject to the credit risk of the U.S. Government and are not guaranteed against price movements due to changing interest rates. Obligations issued by some U.S. Government agencies are backed by the U.S. Treasury, while others are backed solely by the ability of the agency to borrow from the U.S. Treasury or by the agency’s own resources. No assurance can be given that the U.S. Government will provide financial support to its agencies and instrumentalities if it is not obligated by law to do so.
Warrants Risk — Warrants are instruments that entitle the holder to buy an equity security at a specific price for a specific period of time. Warrants may be more speculative than other types of investments. The price of a warrant may be more volatile than the price of its underlying security, and a warrant may offer greater potential for capital appreciation as well as capital loss. A warrant ceases to have value if it is not exercised prior to its expiration date.
The foregoing is not intended to be a complete discussion of the risks associated with investing in a Fund. Please review each Fund’s current prospectus for additional disclosures regarding the principal risks associated with investing in a Fund.
12. CONCENTRATION OF SHAREHOLDERS
SEI Private Trust Company (“SPTC”) and SIMC are subsidiaries of SEI Investments Company. As of March 31, 2021, SPTC held of record the following percentage of outstanding shares of each Fund:
| Fund | % Held | |||||||
Large Cap Fund | ||||||||
Class F | 97.67 | % | ||||||
Class Y | 17.95 | |||||||
Large Cap Value Fund | ||||||||
Class��F | 93.11 | % | ||||||
Class I | 12.94 | |||||||
| 358 | SEI Institutional Managed Trust / Semi-Annual Report / March 31, 2021 |
| Fund | % Held | |||||||
Class Y | 99.55 | |||||||
Large Cap Growth Fund | ||||||||
Class F | 90.96 | % | ||||||
Class I | 11.94 | |||||||
Class Y | 98.94 | |||||||
Large Cap Index Fund | ||||||||
Class F | 99.70 | % | ||||||
Tax-Managed Large Cap Fund | ||||||||
Class F | 85.41 | % | ||||||
Class Y | 55.22 | |||||||
S&P 500 Index Fund | ||||||||
Class F | 48.21 | % | ||||||
Class I | 22.46 | |||||||
Small Cap Fund | ||||||||
Class F | 98.13 | % | ||||||
Class Y | 28.58 | |||||||
Small Cap Value Fund | ||||||||
Class F | 93.94 | % | ||||||
Class I | 7.22 | |||||||
Class Y | 99.45 | |||||||
Small Cap Growth Fund | ||||||||
Class F | 91.92 | % | ||||||
Class I | 7.62 | |||||||
Class Y | 97.60 | |||||||
Tax-Managed Small/Mid Cap Fund | ||||||||
Class F | 91.73 | % | ||||||
Class Y | 53.97 | |||||||
Mid-Cap Fund | ||||||||
Class F | 83.98 | % | ||||||
Class I | 0.00 | |||||||
Class Y | 26.48 | |||||||
U.S. Managed Volatility Fund | ||||||||
Class F | 91.88 | % | ||||||
Class I | 0.00 | |||||||
Class Y | 34.05 | |||||||
Global Managed Volatility Fund | ||||||||
Class F | 96.11 | % | ||||||
Class I | 0.00 | |||||||
Class Y | 45.91 | |||||||
Tax-Managed Managed Volatility Fund | ||||||||
Class F | 88.69 | % | ||||||
Class Y | 63.37 | |||||||
Tax-Managed International Managed Volatility Fund | ||||||||
Class F | 97.07 | % | ||||||
Class Y | 86.63 | |||||||
Real Estate Fund | ||||||||
Class F | 75.13 | % | ||||||
Class I | 0.00 | |||||||
Class Y | 53.28 | |||||||
Core Fixed Income Fund | ||||||||
Class F | 96.38 | % | ||||||
Class I | 29.72 | |||||||
| Fund | % Held | |||||||
Class Y | 56.67 | |||||||
High Yield Bond Fund | ||||||||
Class F | 96.90 | % | ||||||
Class I | 0.00 | |||||||
Class Y | 56.19 | |||||||
Conservative Income Fund | ||||||||
Class F | 98.95 | % | ||||||
Class Y | 29.13 | |||||||
Tax-Free Conservative Income Fund | ||||||||
Class F | 98.29 | % | ||||||
Class Y | 71.11 | |||||||
Real Return Fund | ||||||||
Class F | 98.67 | % | ||||||
Class Y | 35.58 | |||||||
Dynamic Asset Allocation Fund | ||||||||
Class F | 97.43 | % | ||||||
Class Y | 15.40 | |||||||
Multi-Strategy Alternative Fund | ||||||||
Class F | 98.14 | % | ||||||
Class Y | 72.67 | |||||||
Multi-Asset Accumulation Fund | ||||||||
Class F | 98.44 | % | ||||||
Class Y | 15.57 | |||||||
Multi-Asset Income Fund | ||||||||
Class F | 97.03 | % | ||||||
Class Y | 59.85 | |||||||
Multi-Asset Inflation Managed Fund | ||||||||
Class F | 98.61 | % | ||||||
Class Y | 20.16 | |||||||
Multi-Asset Capital Stability Fund | ||||||||
Class F | 98.81 | % | ||||||
Class Y | 21.00 | |||||||
SPTC is not a direct service provider to the SEI Funds. However, SPTC performs a role in the comprehensive investment solution that SEI provides to investors. SPTC holds shares in the Funds as custodian for shareholders that are clients of independent registered investment advisers, financial planners, bank trust departments and other financial advisers. SPTC maintains omnibus accounts at the Fund’s transfer agent.
13. REGULATORY MATTERS
On July 27, 2017, the U.K. Financial Conduct Authority announced that it intends to stop compelling or inducing banks to submit London Inter-Bank Offered Rate (LIBOR) rates after 2021. On March 5, 2021, the ICE Benchmark Administration clarified that the publication of LIBOR on a representative basis will cease for the one-week and two-month U.S. dollar LIBOR settings immediately after December 31, 2021, and for the remaining U.S. dollar LIBOR settings immediately after June 30, 2023. The elimination of the LIBOR may adversely affect the
| SEI Institutional Managed Trust / Semi-Annual Report / March 31, 2021 | 359 |
Notes to Financial Statements/Consolidated Notes to Financial Statements (Concluded)
March 31, 2021 (Unaudited)
interest rates on, and value of, certain Fund investments for which the value is tied to LIBOR. Such investments may include bank loans, derivatives, floating rate securities, and other assets or liabilities tied to LIBOR. Actions by regulators have resulted in the establishment of alternative reference rates to LIBOR in most major currencies. The U.S. Federal Reserve, based on the recommendations of the New York Federal Reserve’s Alternative Reference Rate Committee (comprised of major derivative market participants and their regulators), has begun publishing a Secured Overnight Financing Rate (SOFR), which is intended to replace U.S. dollar LIBOR. Alternative reference rates for other currencies have also been announced or have already begun publication. Markets are slowly developing in response to these new rates. Questions around liquidity impacted by these rates, and how to appropriately adjust these rates at the time of transition, remain a concern for a Fund. The effect of any changes to, or discontinuation of, LIBOR on a Fund will vary depending on, among other things, (1) existing fallback or termination provisions in individual contracts and (2) whether, how, and when industry participants develop and adopt new reference rates and fallbacks for both legacy and new products and instruments. Accordingly, it is difficult to predict the full impact of the transition away from LIBOR on a Fund until new reference rates and fallbacks for both legacy and new products, instruments and contracts are commercially accepted.
14. SUBSEQUENT EVENTS
Management has evaluated the need for disclosures and/or adjustments resulting from subsequent events through the date the financial statements were issued. Based on this evaluation, no disclosures and/or adjustments were required to the financial statements as of March 31, 2021.
| 360 | SEI Institutional Managed Trust / Semi-Annual Report / March 31, 2021 |
Disclosure of Fund Expenses (Unaudited)
March 31, 2021
All mutual funds have operating expenses. As a shareholder of a fund, your investment is affected by these ongoing costs, which include (among others) costs for portfolio management, administrative services, and shareholder reports like this one. It is important for you to understand the impact of these costs on your investment returns.
Operating expenses such as these are deducted from the fund’s gross income and directly reduce your final investment return. These expenses are expressed as a percentage of the fund’s average net assets; this percentage is known as the fund’s expense ratio.
The following examples use the expense ratio and are intended to help you understand the ongoing costs (in dollars) of investing in your fund and to compare these costs with those of other mutual funds. The examples are based on an investment of $1,000 made at the beginning of the period shown and held for the entire period.
The table on this page illustrates your fund’s costs in two ways:
• Actual fund return. This section helps you to estimate the actual expenses after fee waivers that your Fund incurred over the period. The “Expenses Paid During Period” column shows the actual dollar expense cost incurred by a $1,000 investment in the Fund, and the “Ending Account Value” number is derived from deducting that expense cost from the Fund’s gross investment return.
You can use this information, together with the actual amount you invested in the Fund, to estimate the expenses you paid over that period. Simply divide your actual account value by $1,000 to arrive at a ratio (for example, an $8,600 account value divided by $1,000 = 8.6), then multiply that ratio by the number shown for your Fund under “Expenses Paid During Period.”
• Hypothetical 5% return. This section helps you compare your Fund’s costs with those of other mutual funds. It assumes that the Fund had an annual 5% return before expenses during the year, but that the expense ratio (Column 3) for the period is unchanged. This example is useful in making comparisons because the Securities and Exchange Commission requires all mutual funds to make this 5% calculation. You can assess your Fund’s comparative cost by comparing the hypothetical result for your Fund in the “Expenses Paid During Period” column with those that appear in the same charts in the shareholder reports for other funds.
NOTE: Because the return is set at 5% for comparison purposes — NOT your Fund’s actual return — the account values shown may not apply to your specific investment.
| Beginning Account Value 10/1/20 | Ending Account Value 3/31/21 | Annualized Expense Ratios | Expenses Paid During Period* | |||||||||||||
Large Cap Fund |
| |||||||||||||||
Actual Fund Return |
| |||||||||||||||
Class F Shares | $ | 1,000.00 | $ | 1,227.20 | 0.89 | % | $ | 4.92 | ||||||||
Class Y Shares | 1,000.00 | 1,228.60 | 0.64 | 3.55 | ||||||||||||
Hypothetical 5% Return |
| |||||||||||||||
Class F Shares | $ | 1,000.00 | $ | 1,020.51 | 0.89 | % | $ | 4.46 | ||||||||
Class Y Shares | 1,000.00 | 1,021.74 | 0.64 | 3.22 | ||||||||||||
Large Cap Value Fund |
| |||||||||||||||
Actual Fund Return |
| |||||||||||||||
Class F Shares | $ | 1,000.00 | $ | 1,329.50 | 0.89 | % | $ | 5.14 | ||||||||
Class I Shares | 1,000.00 | 1,328.20 | 1.11 | 6.42 | ||||||||||||
Class Y Shares | 1,000.00 | 1,331.10 | 0.64 | 3.72 | ||||||||||||
Hypothetical 5% Return |
| |||||||||||||||
Class F Shares | $ | 1,000.00 | $ | 1,020.52 | 0.89 | % | $ | 4.46 | ||||||||
Class I Shares | 1,000.00 | 1,019.42 | 1.11 | 5.57 | ||||||||||||
Class Y Shares | 1,000.00 | 1,021.74 | 0.64 | 3.22 | ||||||||||||
| Beginning Account Value 10/1/20 | Ending Account Value 3/31/21 | Annualized Expense Ratios | Expenses Paid During Period* | |||||||||||||
Large Cap Growth Fund |
| |||||||||||||||
Actual Fund Return |
| |||||||||||||||
Class F Shares | $ | 1,000.00 | $ | 1,135.50 | 0.89 | % | $ | 4.72 | ||||||||
Class I Shares | 1,000.00 | 1,134.20 | 1.11 | 5.89 | ||||||||||||
Class Y Shares | 1,000.00 | 1,136.60 | 0.64 | 3.41 | ||||||||||||
Hypothetical 5% Return |
| |||||||||||||||
Class F Shares | $ | 1,000.00 | $ | 1,020.52 | 0.89 | % | $ | 4.46 | ||||||||
Class I Shares | 1,000.00 | 1,019.42 | 1.11 | 5.57 | ||||||||||||
Class Y Shares | 1,000.00 | 1,021.74 | 0.64 | 3.22 | ||||||||||||
Large Cap Index Fund |
| |||||||||||||||
Actual Fund Return |
| |||||||||||||||
Class F Shares | $ | 1,000.00 | $ | 1,202.70 | 0.25 | % | $ | 1.37 | ||||||||
Hypothetical 5% Return |
| |||||||||||||||
Class F Shares | $ | 1,000.00 | $ | 1,023.69 | 0.25 | % | $ | 1.26 | ||||||||
| SEI Institutional Managed Trust / Semi-Annual Report / March 31, 2021 | 361 |
Disclosure of Fund Expenses (Unaudited) (Concluded)
March 31, 2021
| Beginning Account Value 10/1/20 | Ending Account Value 3/31/21 | Annualized Expense Ratios | Expenses Paid During Period* | |||||||||||||
Tax-Managed Large Cap Fund |
| |||||||||||||||
Actual Fund Return |
| |||||||||||||||
Class F Shares | $ | 1,000.00 | $ | 1,226.90 | 0.89 | % | $ | 4.92 | ||||||||
Class Y Shares | 1,000.00 | 1,228.60 | 0.64 | 3.55 | ||||||||||||
Hypothetical 5% Return |
| |||||||||||||||
Class F Shares | $ | 1,000.00 | $ | 1,020.52 | 0.89 | % | $ | 4.46 | ||||||||
Class Y Shares | 1,000.00 | 1,021.74 | 0.64 | 3.22 | ||||||||||||
S&P 500 Index Fund |
| |||||||||||||||
Actual Fund Return |
| |||||||||||||||
Class F Shares | $ | 1,000.00 | $ | 1,189.70 | 0.25 | % | $ | 1.35 | ||||||||
Class I Shares | 1,000.00 | 1,187.30 | 0.65 | 3.53 | ||||||||||||
Hypothetical 5% Return |
| |||||||||||||||
Class F Shares | $ | 1,000.00 | $ | 1,023.70 | 0.25 | % | $ | 1.25 | ||||||||
Class I Shares | 1,000.00 | 1,021.70 | 0.65 | 3.27 | ||||||||||||
Small Cap Fund |
| |||||||||||||||
Actual Fund Return |
| |||||||||||||||
Class F Shares | $ | 1,000.00 | $ | 1,483.00 | 1.14 | % | $ | 7.08 | ||||||||
Class Y Shares | 1,000.00 | 1,484.30 | 0.89 | 5.50 | ||||||||||||
Hypothetical 5% Return |
| |||||||||||||||
Class F Shares | $ | 1,000.00 | $ | 1,019.23 | 1.14 | % | $ | 5.76 | ||||||||
Class Y Shares | 1,000.00 | 1,020.51 | 0.89 | 4.47 | ||||||||||||
Small Cap Value Fund |
| |||||||||||||||
Actual Fund Return |
| |||||||||||||||
Class F Shares | $ | 1,000.00 | $ | 1,567.10 | 1.14 | % | $ | 7.25 | ||||||||
Class I Shares | 1,000.00 | 1,565.20 | 1.36 | 8.65 | ||||||||||||
Class Y Shares | 1,000.00 | 1,569.10 | 0.89 | 5.68 | ||||||||||||
Hypothetical 5% Return |
| |||||||||||||||
Class F Shares | $ | 1,000.00 | $ | 1,019.29 | 1.14 | % | $ | 5.70 | ||||||||
Class I Shares | 1,000.00 | 1,018.19 | 1.36 | 6.80 | ||||||||||||
Class Y Shares | 1,000.00 | 1,020.51 | 0.89 | 4.47 | ||||||||||||
Small Cap Growth Fund |
| |||||||||||||||
Actual Fund Return |
| |||||||||||||||
Class F Shares | $ | 1,000.00 | $ | 1,382.80 | 1.11 | % | $ | 6.56 | ||||||||
Class I Shares | 1,000.00 | 1,380.90 | 1.36 | 8.04 | ||||||||||||
Class Y Shares | 1,000.00 | 1,384.50 | 0.86 | 5.10 | ||||||||||||
Hypothetical 5% Return |
| |||||||||||||||
Class F Shares | $ | 1,000.00 | $ | 1,019.43 | 1.11 | % | $ | 5.56 | ||||||||
Class I Shares | 1,000.00 | 1,018.18 | 1.36 | 6.81 | ||||||||||||
Class Y Shares | 1,000.00 | 1,020.66 | 0.86 | 4.32 | ||||||||||||
Tax-Managed Small/Mid Cap Fund |
| |||||||||||||||
Actual Fund Return |
| |||||||||||||||
Class F Shares | $ | 1,000.00 | $ | 1,407.60 | 1.11 | % | $ | 6.63 | ||||||||
Class Y Shares | 1,000.00 | 1,408.20 | 0.89 | 5.32 | ||||||||||||
Hypothetical 5% Return |
| |||||||||||||||
Class F Shares | $ | 1,000.00 | $ | 1,019.43 | 1.11 | % | $ | 5.56 | ||||||||
Class Y Shares | 1,000.00 | 1,020.52 | 0.89 | 4.46 | ||||||||||||
| Beginning Account Value 10/1/20 | Ending Account Value 3/31/21 | Annualized Expense Ratios | Expenses Paid During Period* | |||||||||||||
Mid-Cap Fund |
| |||||||||||||||
Actual Fund Return |
| |||||||||||||||
Class F Shares | $ | 1,000.00 | $ | 1,314.00 | 0.98 | % | $ | 5.65 | ||||||||
Class I Shares | 1,000.00 | 1,312.30 | 1.20 | 6.92 | ||||||||||||
Class Y Shares | 1,000.00 | 1,314.90 | 0.73 | 4.21 | ||||||||||||
Hypothetical 5% Return |
| |||||||||||||||
Class F Shares | $ | 1,000.00 | $ | 1,020.05 | 0.98 | % | $ | 4.94 | ||||||||
Class I Shares | 1,000.00 | 1,018.95 | 1.20 | 6.04 | ||||||||||||
Class Y Shares | 1,000.00 | 1,021.24 | 0.73 | 3.68 | ||||||||||||
U.S. Managed Volatility Fund |
| |||||||||||||||
Actual Fund Return |
| |||||||||||||||
Class F Shares | $ | 1,000.00 | $ | 1,164.80 | 0.90 | % | $ | 4.86 | ||||||||
Class I Shares | 1,000.00 | 1,163.40 | 1.15 | 6.20 | ||||||||||||
Class Y Shares | 1,000.00 | 1,165.50 | 0.65 | 3.51 | ||||||||||||
Hypothetical 5% Return |
| |||||||||||||||
Class F Shares | $ | 1,000.00 | $ | 1,020.44 | 0.90 | % | $ | 4.53 | ||||||||
Class I Shares | 1,000.00 | 1,019.20 | 1.15 | 5.79 | ||||||||||||
Class Y Shares | 1,000.00 | 1,021.69 | 0.65 | 3.28 | ||||||||||||
Global Managed Volatility Fund |
| |||||||||||||||
Actual Fund Return |
| |||||||||||||||
Class F Shares | $ | 1,000.00 | $ | 1,092.60 | 1.11 | % | $ | 5.79 | ||||||||
Class I Shares | 1,000.00 | 1,090.40 | 1.36 | 7.09 | ||||||||||||
Class Y Shares | 1,000.00 | 1,094.10 | 0.86 | 4.49 | ||||||||||||
Hypothetical 5% Return |
| |||||||||||||||
Class F Shares | $ | 1,000.00 | $ | 1,019.40 | 1.11 | % | $ | 5.59 | ||||||||
Class I Shares | 1,000.00 | 1,018.15 | 1.36 | 6.84 | ||||||||||||
Class Y Shares | 1,000.00 | 1,020.64 | 0.86 | 4.33 | ||||||||||||
Tax-Managed Managed Volatility Fund |
| |||||||||||||||
Actual Fund Return |
| |||||||||||||||
Class F Shares | $ | 1,000.00 | $ | 1,136.10 | 1.00 | % | $ | 5.33 | ||||||||
Class Y Shares | 1,000.00 | 1,137.50 | 0.75 | 4.00 | ||||||||||||
Hypothetical 5% Return |
| |||||||||||||||
Class F Shares | $ | 1,000.00 | $ | 1,019.95 | 1.00 | % | $ | 5.04 | ||||||||
Class Y Shares | 1,000.00 | 1,021.19 | 0.75 | 3.78 | ||||||||||||
Tax-Managed International Managed Volatility Fund |
| |||||||||||||||
Actual Fund Return |
| |||||||||||||||
Class F Shares | $ | 1,000.00 | $ | 1,103.30 | 1.11 | % | $ | 5.84 | ||||||||
Class Y Shares | 1,000.00 | 1,104.70 | 0.86 | 4.50 | ||||||||||||
Hypothetical 5% Return |
| |||||||||||||||
Class F Shares | $ | 1,000.00 | $ | 1,019.38 | 1.11 | % | $ | 5.61 | ||||||||
Class Y Shares | 1,000.00 | 1,020.65 | 0.86 | 4.32 | ||||||||||||
Real Estate Fund |
| |||||||||||||||
Actual Fund Return |
| |||||||||||||||
Class F Shares | $ | 1,000.00 | $ | 1,210.30 | 1.14 | % | $ | 6.30 | ||||||||
Class I Shares | 1,000.00 | 1,209.50 | 1.36 | 7.51 | ||||||||||||
Class Y Shares | 1,000.00 | 1,212.40 | 0.89 | 4.89 | ||||||||||||
Hypothetical 5% Return |
| |||||||||||||||
Class F Shares | $ | 1,000.00 | $ | 1,019.23 | 1.14 | % | $ | 5.76 | ||||||||
Class I Shares | 1,000.00 | 1,018.13 | 1.36 | 6.86 | ||||||||||||
Class Y Shares | 1,000.00 | 1,020.51 | 0.89 | 4.47 | ||||||||||||
| 362 | SEI Institutional Managed Trust / Semi-Annual Report / March 31, 2021 |
| Beginning Account Value 10/1/20 | Ending Account Value 3/31/21 | Annualized Expense Ratios | Expenses Paid During Period* | |||||||||||||
Core Fixed Income Fund |
| |||||||||||||||
Actual Fund Return |
| |||||||||||||||
Class F Shares | $ | 1,000.00 | $ | 978.30 | 0.66 | % | $ | 3.24 | ||||||||
Class I Shares | 1,000.00 | 976.40 | 0.88 | 4.32 | ||||||||||||
Class Y Shares | 1,000.00 | 979.60 | 0.41 | 2.03 | ||||||||||||
Hypothetical 5% Return |
| |||||||||||||||
Class F Shares | $ | 1,000.00 | $ | 1,021.66 | 0.66 | % | $ | 3.31 | ||||||||
Class I Shares | 1,000.00 | 1,020.56 | 0.88 | 4.42 | ||||||||||||
Class Y Shares | 1,000.00 | 1,022.88 | 0.41 | 2.07 | ||||||||||||
High Yield Bond Fund |
| |||||||||||||||
Actual Fund Return |
| |||||||||||||||
Class F Shares | $ | 1,000.00 | $ | 1,120.20 | 0.89 | % | $ | 4.70 | ||||||||
Class I Shares | 1,000.00 | 1,120.90 | 1.11 | 5.87 | ||||||||||||
Class Y Shares | 1,000.00 | 1,121.60 | 0.64 | 3.39 | ||||||||||||
Hypothetical 5% Return |
| |||||||||||||||
Class F Shares | $ | 1,000.00 | $ | 1,020.49 | 0.89 | % | $ | 4.48 | ||||||||
Class I Shares | 1,000.00 | 1,019.40 | 1.11 | 5.59 | ||||||||||||
Class Y Shares | 1,000.00 | 1,021.74 | 0.64 | 3.23 | ||||||||||||
Conservative Income Fund |
| |||||||||||||||
Actual Fund Return |
| |||||||||||||||
Class F Shares | $ | 1,000.00 | $ | 1,000.00 | 0.21 | % | $ | 1.05 | ||||||||
Class Y Shares | 1,000.00 | 1,001.00 | 0.11 | 0.55 | ||||||||||||
Hypothetical 5% Return |
| |||||||||||||||
Class F Shares | $ | 1,000.00 | $ | 1,023.88 | 0.21 | % | $ | 1.06 | ||||||||
Class Y Shares | 1,000.00 | 1,024.38 | 0.11 | 0.56 | ||||||||||||
Tax-Free Conservative Income Fund |
| |||||||||||||||
Actual Fund Return |
| |||||||||||||||
Class F Shares | $ | 1,000.00 | $ | 1,000.00 | 0.15 | % | $ | 0.75 | ||||||||
Class Y Shares | 1,000.00 | 1,001.00 | 0.05 | 0.25 | ||||||||||||
Hypothetical 5% Return |
| |||||||||||||||
Class F Shares | $ | 1,000.00 | $ | 1,024.18 | 0.15 | % | $ | 0.76 | ||||||||
Class Y Shares | 1,000.00 | 1,024.68 | 0.05 | 0.25 | ||||||||||||
Real Return Fund |
| |||||||||||||||
Actual Fund Return |
| |||||||||||||||
Class F Shares | $ | 1,000.00 | $ | 1,022.90 | 0.45 | % | $ | 2.27 | ||||||||
Class Y Shares | 1,000.00 | 1,024.50 | 0.35 | 1.77 | ||||||||||||
Hypothetical 5% Return |
| |||||||||||||||
Class F Shares | $ | 1,000.00 | $ | 1,022.69 | 0.45 | % | $ | 2.27 | ||||||||
Class Y Shares | 1,000.00 | 1,023.19 | 0.35 | 1.77 | ||||||||||||
| Beginning Account Value 10/1/20 | Ending Account Value 3/31/21 | Annualized Expense Ratios | Expenses Paid During Period* | |||||||||||||
Dynamic Asset Allocation Fund |
| |||||||||||||||
Actual Fund Return |
| |||||||||||||||
Class F Shares | $ | 1,000.00 | $ | 1,208.10 | 0.75 | % | $ | 4.13 | ||||||||
Class Y Shares | 1,000.00 | 1,209.20 | 0.50 | 2.75 | ||||||||||||
Hypothetical 5% Return |
| |||||||||||||||
Class F Shares | $ | 1,000.00 | $ | 1,021.19 | 0.75 | % | $ | 3.78 | ||||||||
Class Y Shares | 1,000.00 | 1,022.44 | 0.50 | 2.52 | ||||||||||||
Multi-Strategy Alternative Fund |
| |||||||||||||||
Actual Fund Return |
| |||||||||||||||
Class F Shares | $ | 1,000.00 | $ | 1,083.70 | 2.03 | % | $ | 10.56 | ||||||||
Class Y Shares | 1,000.00 | 1,086.30 | 1.78 | 9.24 | ||||||||||||
Hypothetical 5% Return |
| |||||||||||||||
Class F Shares | $ | 1,000.00 | $ | 1,014.79 | 2.03 | % | $ | 10.21 | ||||||||
Class Y Shares | 1,000.00 | 1,016.08 | 1.78 | 8.92 | ||||||||||||
Multi-Asset Accumulation Fund |
| |||||||||||||||
Actual Fund Return |
| |||||||||||||||
Class F Shares | $ | 1,000.00 | $ | 1,063.40 | 1.17 | % | $ | 6.02 | ||||||||
Class Y Shares | 1,000.00 | 1,064.00 | 0.92 | 4.73 | ||||||||||||
Hypothetical 5% Return |
| |||||||||||||||
Class F Shares | $ | 1,000.00 | $ | 1,019.10 | 1.17 | % | $ | 5.89 | ||||||||
Class Y Shares | 1,000.00 | 1,020.34 | 0.92 | 4.63 | ||||||||||||
Multi-Asset Income Fund |
| |||||||||||||||
Actual Fund Return |
| |||||||||||||||
Class F Shares | $ | 1,000.00 | $ | 1,052.80 | 0.80 | % | $ | 4.09 | ||||||||
Class Y Shares | 1,000.00 | 1,053.40 | 0.70 | 3.58 | ||||||||||||
Hypothetical 5% Return |
| |||||||||||||||
Class F Shares | $ | 1,000.00 | $ | 1,020.94 | 0.80 | % | $ | 4.03 | ||||||||
Class Y Shares | 1,000.00 | 1,021.44 | 0.70 | 3.53 | ||||||||||||
Multi-Asset Inflation Managed Fund |
| |||||||||||||||
Actual Fund Return |
| |||||||||||||||
Class F Shares | $ | 1,000.00 | $ | 1,077.60 | 1.17 | % | $ | 6.05 | ||||||||
Class Y Shares | 1,000.00 | 1,079.00 | 0.92 | 4.77 | ||||||||||||
Hypothetical 5% Return |
| |||||||||||||||
Class F Shares | $ | 1,000.00 | $ | 1,019.11 | 1.17 | % | $ | 5.88 | ||||||||
Class Y Shares | 1,000.00 | 1,020.34 | 0.92 | 4.63 | ||||||||||||
Multi-Asset Capital Stability Fund |
| |||||||||||||||
Actual Fund Return |
| |||||||||||||||
Class F Shares | $ | 1,000.00 | $ | 1,022.90 | 0.62 | % | $ | 3.12 | ||||||||
Class Y Shares | 1,000.00 | 1,023.90 | 0.52 | 2.62 | ||||||||||||
Hypothetical 5% Return |
| |||||||||||||||
Class F Shares | $ | 1,000.00 | $ | 1,021.85 | 0.62 | % | $ | 3.12 | ||||||||
Class Y Shares | 1,000.00 | 1,022.34 | 0.52 | 2.62 | ||||||||||||
| * | Expenses are equal to the Fund’s annualized expense ratio multiplied by the average account value over the period, multiplied by 182/365 (to reflect the one-half year period shown). |
| SEI Institutional Managed Trust / Semi-Annual Report / March 31, 2021 | 363 |
Review of the Liquidity Risk Management Program (Unaudited)
March 31, 2021
Pursuant to Rule 22e-4 under the 1940 Act, the Trust, on behalf of the Funds, has adopted a liquidity risk management program (the “Program”) to govern the Trust’s approach to managing liquidity risk. The Program is overseen by the SIMC Liquidity Risk Oversight Committee, and the Program’s principal objectives include assessing, managing and periodically reviewing each Fund’s liquidity risk, based on factors specific to the circumstances of the Fund.
At a meeting of the Board held on March 23, 2021, the Trustees received a report from the SIMC Liquidity Risk Oversight Committee addressing the operations of the Program and assessing its adequacy and effectiveness of implementation. The SIMC Liquidity Risk Oversight Committee determined, and reported to the Board, that the Program is reasonably designed to assess and manage each Fund’s liquidity risk and has operated adequately and effectively to manage each Fund’s liquidity risk since the Program was implemented on December 1, 2018. The SIMC Liquidity Risk Oversight Committee reported that during the period covered by the report, there were no liquidity events that impacted the Funds or their ability to timely meet redemptions without dilution to existing shareholders. The SIMC Liquidity Risk Oversight Committee further noted that no material changes have been made to the Program since its implementation.
There can be no assurance that the Program will achieve its objectives in the future. Please refer to the prospectus for more information regarding a Fund’s exposure to liquidity risk and other principal risks to which an investment in the Funds may be subject.
| 364 | SEI Institutional Managed Trust / Semi-Annual Report / March 31, 2021 |
Board of Trustees Considerations in Approving the Advisory and Sub-Advisory Agreements (Unaudited)
SEI Institutional Managed Trust (the “Trust”) and SEI Investments Management Corporation (“SIMC”) have entered into an investment advisory agreement (the “Advisory Agreement”), pursuant to which SIMC provides investment advisory services to the series of the Trust (the “Funds”). Pursuant to separate sub-advisory agreements with SIMC (the “Sub-Advisory Agreements” and, together with the Advisory Agreement, the “Investment Advisory Agreements”), and under the supervision of SIMC and the Trust’s Board of Trustees (each member, a “Trustee” and, collectively, the “Trustees” or the “Board”), the sub-advisers (each, a “Sub-Adviser” and collectively, the “Sub-Advisers”) provide security selection and certain other advisory services with respect to all, or a discrete portion, of the assets of the Funds. The Sub-Advisers are also responsible for managing their employees who provide services to the Funds. The Sub-Advisers are selected based primarily upon the research and recommendations of SIMC, which evaluates quantitatively and qualitatively the Sub-Advisers’ skills and investment results in managing assets for specific asset classes, investment styles and strategies.
The Investment Company Act of 1940, as amended (the “1940 Act”), requires that the initial approval of a Fund’s Investment Advisory Agreements be specifically approved by the vote of a majority of the outstanding shareholders of the Funds and the vote of a majority of the Trustees who are not parties to the Investment Advisory Agreements or “interested persons” of any party (the “Independent Trustees”) cast in person (or otherwise, as consistent with applicable laws, regulations and related guidance and relief) at a meeting called for such purpose. In addition, the 1940 Act requires that the continuation or renewal of any Investment Advisory Agreement be approved at least annually (after an initial period of up to two years), which also requires the vote of a majority of the Board, including a majority of the Independent Trustees. In the case of the initial approval of a Sub-Advisory Agreement, only the approval of a majority of the Board, including a majority of the Independent Trustees, is required, pursuant to an exemptive order that has been granted to the Trust by the Securities and Exchange Commission. In connection with their consideration of such initial approvals and renewals, the Funds’ Trustees must request and evaluate, and SIMC and the Sub-Advisers are required to furnish, such information as may be reasonably necessary to evaluate the terms of the Investment Advisory Agreements. In addition, the Securities and Exchange Commission takes the position that, as part of their fiduciary duties with respect to a mutual fund’s fees, mutual fund boards are required to evaluate the material factors applicable to a decision to approve an investment advisory agreement.
Consistent with these responsibilities, the Board calls and holds meetings each year to consider whether to approve new and/or renew existing Investment Advisory Agreements between the Trust and SIMC and SIMC and the Sub-Advisers with respect to the Funds of the Trust. In preparation for these meetings, the Board requests and reviews a wide variety of materials provided by SIMC and the Sub-Advisers, including information about SIMC’s and the Sub-Advisers’ affiliates, personnel and operations and the services provided pursuant to the Investment Advisory Agreements. The Board also receives data from third parties. This information is provided in addition to the detailed information about the Funds that the Board reviews during the course of each year, including information that relates to Fund operations and Fund performance. The Trustees also receive a memorandum from counsel regarding the responsibilities of Trustees in connection with their consideration of whether to approve the Trust’s Investment Advisory Agreements. Finally, the Independent Trustees receive advice from independent counsel to the Independent Trustees, meet in executive sessions outside the presence of Fund management and participate in question and answer sessions with representatives of SIMC and the Sub-Advisers.
Specifically, during the first half of the Trust’s fiscal year, the Board requested and received written materials from SIMC and certain Sub-Advisers regarding: (i) the quality of SIMC’s and the Sub-Advisers’ investment management and other services; (ii) SIMC’s and the Sub-Advisers’ investment management personnel; (iii) SIMC’s and the Sub-Advisers’ operations and financial condition; (iv) SIMC’s and the Sub-Advisers’ brokerage practices (including any soft dollar arrangements) and investment strategies; (v) the level of the advisory fees that SIMC charges the Funds and the level of the sub-advisory fees that SIMC pays the Sub-Advisers, compared with fees each charge to comparable accounts; (vi) the advisory fees charged by SIMC and the Funds’ overall fees and operating expenses compared with peer groups of mutual funds prepared by Broadridge, an independent provider of investment company data; (vii) the level of SIMC’s and the Sub-Advisers’ profitability from their Fund-related operations; (viii) SIMC’s and the Sub-Advisers’ compliance program, including a description of material compliance matters and material compliance violations; (ix) SIMC’s potential economies of scale; (x) SIMC’s and the Sub-Advisers’ policies on and compliance procedures for personal securities transactions; (xi) SIMC’s and the Sub-Advisers’ expertise and resources in domestic and/or international financial markets; and (xii) the Funds’ performance over various periods of time compared with peer groups of mutual funds prepared by Broadridge and the Funds’ benchmark indexes.
| SEI Institutional Managed Trust / Semi-Annual Report / March 31, 2021 | 365 |
Board of Trustees Considerations in Approving the Advisory and Sub-Advisory Agreements (Unaudited) (Concluded)
At the March 22-24, 2021 meeting of the Board, the Trustees, including a majority of the Independent Trustees, approved the renewal of the Advisory Agreement. Also, certain Sub-Advisory Agreements were either initially approved or, if a Sub-Advisory Agreement was already in effect (unless operating under an initial two-year term), renewed at meetings of the Board held during the first half of the Trust’s fiscal year on December 7-9, 2020, February 17, 2021 and March 22-24, 2021. In each case, the Board’s approval (or renewal) was based on its consideration and evaluation of the factors described above, as discussed at the meetings and at prior meetings. The following discusses some, but not all, of the factors that were considered by the Board in connection with its assessment of the Investment Advisory Agreements.
Nature, Extent and Quality of Services. The Board considered the nature, extent and quality of the services provided by SIMC and the Sub-Advisers to the Funds and the resources of SIMC and the Sub-Advisers and their affiliates dedicated to the Funds. In this regard, the Trustees evaluated, among other things, SIMC’s and each Sub-Adviser’s personnel, experience, track record and compliance program. Following evaluation, the Board concluded that, within the context of its full deliberations, the nature, extent and quality of services provided by SIMC and the Sub-Advisers to the Funds and the resources of SIMC and the Sub-Advisers and their affiliates dedicated to the Funds were sufficient to support the renewal of the Investment Advisory Agreements. In addition to advisory services, the Board considered the nature and quality of certain administrative, transfer agency and other non-investment advisory services provided to the Funds by SIMC and/or its affiliates.
Performance. In determining whether to renew SIMC’s Advisory Agreement, the Trustees considered the Funds’ performance relative to their peer groups and appropriate indexes/benchmarks. The Trustees reviewed performance information for each Fund, noting that they receive performance reports that permit them to monitor each Fund’s performance at board meetings throughout the year. As part of this review, the Trustees considered the composition of each peer group and selection criteria. In assessing Fund performance, the Trustees considered a report compiled by Broadridge, an independent third-party that was engaged to prepare an assessment of the Funds in connection with the renewal of the Advisory Agreement (the “Broadridge Report”). The Broadridge Report included metrics on risk analysis, volatility versus total return, net total return and performance consistency for the Funds (except when such metric was not available due to a limited operating history) and a universe of comparable funds. Based on the materials considered and discussed at the meetings, the Trustees found Fund performance satisfactory, or, where performance was materially below the benchmark and/or peer group, the Trustees were satisfied with the reasons provided to explain such performance. In connection with the approval or renewal of Sub-Advisory Agreements, the Board considered the performance of the Sub-Adviser relative to appropriate indexes/benchmarks. Following evaluation, the Board concluded that, within the context of its full deliberations, the performance of the Funds was sufficient to support renewal of SIMC’s Advisory Agreement, and the performance of each Sub-Adviser was sufficient to support approval or renewal of the Sub-Advisory Agreement.
Fees. With respect to the Funds’ expenses under the Investment Advisory Agreements, the Trustees considered the rate of compensation called for by the Investment Advisory Agreements and the Funds’ net operating expense ratios in comparison to those of the Funds’ respective peer groups. In assessing Fund expenses, the Trustees considered the information in the Broadridge Report, which included various metrics related to fund expenses, including, but not limited to, contractual management fees at various asset levels, actual management fees (including transfer agent expenses), and actual total expenses (including, solely with respect to the Multi-Strategy Alternative Fund, underlying fund expenses) for the Funds and a universe of comparable funds. Based on the materials considered and discussion at the meetings, the Trustees further determined that fees were either shown to be below the peer average in the comparative fee analysis, or that there was a reasonable basis for the fee level. The Trustees also considered the effects of SIMC’s and its affiliates’ voluntary waivers of management and other fees to prevent total Fund operating expenses from exceeding any applicable cap, and concluded that SIMC, through waivers, has maintained the Funds’ net operating expenses at competitive levels for its distribution channels. In determining the appropriateness of fees, the Board also took into consideration the impact of fees incurred indirectly by the Funds as a result of investments into underlying funds, including funds from which SIMC or its affiliates earn fees. The Board also took into consideration compensation earned from the Funds by SIMC or its affiliates for non-advisory services, such as administration, transfer agency, shareholder services or brokerage, and considered whether SIMC and its affiliates may have realized other benefits from their relationship with the Funds, such as any research and brokerage services received under soft dollar arrangements. When considering fees paid to Sub-Advisers, the Board took into account the fact that the Sub-Advisers are compensated by SIMC and not by the Funds directly, and that such compensation with respect to any unaffiliated Sub-Adviser reflects an arms-length negotiation between the
| 366 | SEI Institutional Managed Trust / Semi-Annual Report / March 31, 2021 |
Sub-Adviser and SIMC. Following evaluation, the Board concluded that, within the context of its full deliberations, the expenses of the Funds are reasonable and supported renewal of the Investment Advisory Agreements. The Board also considered whether the Sub-Advisers and their affiliates may have realized other benefits from their relationship with the Funds, such as any research and brokerage services received under soft dollar arrangements.
Profitability. With regard to profitability, the Trustees considered compensation flowing to SIMC and the Sub-Advisers and their affiliates, directly or indirectly. The Trustees considered whether the levels of compensation and profitability were reasonable. As with the fee levels, when considering the profitability of the Sub-Advisers, the Board took into account the fact that compensation with respect to any unaffiliated Sub-Adviser reflects an arms-length negotiation between the Sub-Adviser and SIMC. In connection with the approval or renewal of each Sub-Advisory Agreement, the Board also took into consideration the impact that the fees paid to the Sub-Adviser have on SIMC’s advisory fee margin and profitability. Based on this evaluation, the Board concluded that, within the context of its full deliberations, the profitability of each of SIMC and the Sub-Advisers is reasonable and supported renewal of the Investment Advisory Agreements.
Economies of Scale. With respect to the Advisory Agreement, the Trustees considered whether any economies of scale were being realized by SIMC and its affiliates and, if so, whether the benefits of such economies of scale were passed along to the Funds’ shareholders through a graduated investment advisory fee schedule or other means, including any fee waivers by SIMC and its affiliates. The Trustees recognized that economies of scale are difficult to identify and quantify and are rarely identifiable on a fund-by-fund basis. Based on this evaluation, the Board determined that the fees were reasonable in light of the information that was provided by SIMC with respect to economies of scale.
Based on the Trustees’ deliberation and their evaluation of the information described above, the Board, including all of the Independent Trustees, with the assistance of Fund counsel and Independent Trustees’ counsel, unanimously approved the approval or renewal, as applicable, of the Investment Advisory Agreements and concluded that the compensation under the Investment Advisory Agreements is fair and reasonable in light of such services and expenses and such other matters as the Trustees considered to be relevant in the exercise of their reasonable judgment. In the course of its deliberations, the Board did not identify any particular factor (or conclusion with respect thereto) or single piece of information that was all-important, controlling or determinative of its decision, but considered all of the factors together, and each Trustee may have attributed different weights to the various factors (and conclusions with respect thereto) and information.
| SEI Institutional Managed Trust / Semi-Annual Report / March 31, 2021 | 367 |
(This page intentionally left blank)
SEI Institutional Managed Trust / Semi-Annual Report / March 31, 2021
Robert A. Nesher, Chairman
Trustees
William M. Doran
George J. Sullivan, Jr.
Nina Lesavoy
James M. Williams
Mitchell A. Johnson
Hubert L. Harris, Jr.
Susan C. Cote
James B. Taylor
Christine Reynolds
Officers
Robert A. Nesher
President and Chief Executive Officer
Peter Rodriguez
Controller and Chief Financial Officer
Glenn Kurdziel
Assistant Controller
Russell Emery
Chief Compliance Officer
Timothy D. Barto
Vice President, Secretary
Aaron Buser
Vice President, Assistant Secretary
David F. McCann
Vice President, Assistant Secretary
Stephen G. MacRae
Vice President
Bridget E. Sudall
Anti-Money Laundering Compliance Officer
Privacy Officer
Investment Adviser
SEI Investments Management Corporation
Administrator
SEI Investments Global Funds Services
Distributor
SEI Investments Distribution Co.
Legal Counsel
Morgan, Lewis & Bockius LLP
Independent Registered Public Accounting Firm
KPMG LLP
This report and the financial statements contained herein are submitted for the general information of the shareholders of the Trust and must be preceded or accompanied by a current prospectus. Shares of the Funds are not deposits or obligations of, or guaranteed or endorsed by, any bank. The shares are not federally insured by the Federal Deposit Insurance Corporation (“FDIC”), the Federal Reserve Board, or any other government agency. Investment in the shares involves risk, including the possible loss of principal.
For more information call
1 800 DIAL SEI
(1 800 342 5734)

SEI-F-092 (3/21)
Item 2. Code of Ethics.
Not applicable for semi-annual report.
Item 3. Audit Committee Financial Expert.
Not applicable for semi-annual report.
Item 4. Principal Accountant Fees and Services.
Not applicable for semi-annual report.
Item 5. Audit Committee of Listed Registrants.
Not applicable.
Item 6. Schedule of Investments.
The Schedules of Investments in securities of unaffiliated issuers as of the close of the reporting period for the Large Cap Fund, Large Cap Value Fund, Large Cap Growth Fund, Large Cap Index Fund, Tax-Managed Large Cap Fund, S&P 500 Index Fund, Small Cap Fund, Small Cap Value Fund, Small Cap Growth Fund, Tax-Managed Small/Mid Cap Fund, Mid-Cap Fund, U.S. Managed Volatility Fund, Global Managed Volatility Fund, Tax-Managed Managed Volatility Fund, Tax-Managed International Managed Volatility Fund, and Dynamic Asset Allocation Fund are listed below. The Schedule of Investments in securities of unaffiliated issuers as of the close of the reporting period for the Real Estate Fund, Core Fixed Income Fund, High Yield Bond Fund, Conservative Income Fund, Tax-Free Conservative Income Fund, Real Return Fund, Multi-Strategy Alternative Fund, Multi-Asset Accumulation Fund, Multi-Asset Income Fund, Multi-Asset Inflation Managed Fund and Multi-Asset Capital Stability Fund is included as part of the report to shareholders filed under Item 1 of this form.
SCHEDULE OF INVESTMENTS (Unaudited)
March 31, 2021
Large Cap Fund (Continued)
| Description | Shares | Market Value ($ Thousands) | ||||||
COMMON STOCK — 99.2% |
| |||||||
Communication Services — 6.3% |
| |||||||
Alphabet Inc, Cl A * | 7,256 | $ | 14,966 | |||||
Alphabet Inc, Cl C * | 10,346 | 21,402 | ||||||
AT&T Inc | 171,500 | 5,191 | ||||||
Comcast Corp, Cl A | 311,982 | 16,881 | ||||||
Facebook Inc, Cl A * | 111,416 | 32,815 | ||||||
Fox Corp | 14,250 | 515 | ||||||
Live Nation Entertainment Inc * | 5,261 | 445 | ||||||
Netflix Inc * | 6,810 | 3,553 | ||||||
Omnicom Group Inc | 20,792 | 1,542 | ||||||
Pinterest Inc, Cl A * | 125,262 | 9,273 | ||||||
Snap Inc, Cl A * | 19,064 | 997 | ||||||
TEGNA Inc | 131,810 | 2,482 | ||||||
T-Mobile US Inc * | 52,721 | 6,605 | ||||||
Verizon Communications Inc | 348,594 | 20,271 | ||||||
ViacomCBS Inc, Cl B | 8,440 | 381 | ||||||
| 137,319 | ||||||||
Consumer Discretionary — 11.6% |
| |||||||
Advance Auto Parts Inc | 31,738 | 5,824 | ||||||
Amazon.com Inc, Cl A * | 16,137 | 49,929 | ||||||
Best Buy Co Inc | 38,681 | 4,441 | ||||||
BorgWarner Inc | 247,827 | 11,489 | ||||||
Carnival Corp * | 59,440 | 1,578 | ||||||
Carvana Co, Cl A * | 8,860 | 2,325 | ||||||
Dick’s Sporting Goods Inc | 68,497 | 5,216 | ||||||
Dillard’s Inc, Cl A (A) | 14,199 | 1,371 | ||||||
Dollar General Corp | 55,742 | 11,294 | ||||||
DR Horton Inc | 43,190 | 3,849 | ||||||
DraftKings Inc, Cl A * | 78,940 | 4,841 | ||||||
eBay Inc | 165,695 | 10,147 | ||||||
Foot Locker Inc, Cl A | 34,571 | 1,945 | ||||||
Ford Motor Co * | 152,816 | 1,872 | ||||||
General Motors Co | 275,790 | 15,847 | ||||||
Goodyear Tire & Rubber Co/The | 38,367 | 674 | ||||||
Harley-Davidson Inc, Cl A | 49,267 | 1,976 | ||||||
Kohl’s Corp | 42,557 | 2,537 | ||||||
Las Vegas Sands Corp | 15,049 | 914 | ||||||
Lear Corp | 26,627 | 4,826 | ||||||
Lennar Corp, Cl A | 6,546 | 663 | ||||||
Lithia Motors Inc, Cl A | 6,011 | 2,345 | ||||||
Lowe’s Cos Inc | 94,558 | 17,983 | ||||||
Lululemon Athletica Inc * | 1,420 | 436 | ||||||
Magna International Inc, Cl A | 63,868 | 5,623 | ||||||
MercadoLibre Inc * | 2,290 | 3,371 | ||||||
MGM Resorts International | 11,557 | 439 | ||||||
NIKE Inc, Cl B | 89,870 | 11,943 | ||||||
O’Reilly Automotive Inc * | 17,020 | 8,633 | ||||||
PulteGroup Inc | 229,169 | 12,018 | ||||||
Ross Stores Inc | 132,001 | 15,828 | ||||||
Royal Caribbean Cruises Ltd | 18,460 | 1,580 | ||||||
Starbucks Corp | 75,737 | 8,276 | ||||||
| Description | Shares | Market Value ($ Thousands) | ||||||
COMMON STOCK (continued) |
| |||||||
Target Corp, Cl A | 47,814 | $ | 9,470 | |||||
Thor Industries Inc | 14,319 | 1,929 | ||||||
Travel + Leisure Co | 43,982 | 2,690 | ||||||
Ulta Beauty Inc * | 7,485 | 2,314 | ||||||
Whirlpool Corp | 27,260 | 6,007 | ||||||
| 254,443 | ||||||||
Consumer Staples — 6.9% |
| |||||||
Altria Group Inc | 157,178 | 8,041 | ||||||
Coca-Cola Co/The | 128,168 | 6,756 | ||||||
Coca-Cola European Partners PLC | 139,258 | 7,264 | ||||||
Conagra Brands Inc | 268,905 | 10,111 | ||||||
Ingredion Inc | 89,406 | 8,039 | ||||||
J M Smucker Co/The | 94,533 | 11,961 | ||||||
Kraft Heinz Co/The | 32,618 | 1,305 | ||||||
Kroger Co/The | 523,188 | 18,829 | ||||||
Molson Coors Beverage Co, Cl B | 106,032 | 5,423 | ||||||
Monster Beverage Corp * | 7,235 | 659 | ||||||
PepsiCo Inc | 69,802 | 9,873 | ||||||
Philip Morris International Inc | 152,724 | 13,553 | ||||||
Pilgrim’s Pride Corp * | 84,795 | 2,018 | ||||||
Procter & Gamble Co/The | 2,809 | 380 | ||||||
Sysco Corp, Cl A | 108,606 | 8,552 | ||||||
TreeHouse Foods Inc * | 35,339 | 1,846 | ||||||
Tyson Foods Inc, Cl A | 115,368 | 8,572 | ||||||
Unilever PLC ADR | 358,044 | 19,990 | ||||||
US Foods Holding Corp * | 96,057 | 3,662 | ||||||
Walgreens Boots Alliance Inc | 64,874 | 3,562 | ||||||
| 150,396 | ||||||||
Energy — 2.4% |
| |||||||
BP PLC ADR | 129,247 | 3,147 | ||||||
Canadian Natural Resources Ltd | 160,470 | 4,954 | ||||||
Chevron Corp | 110,924 | 11,624 | ||||||
Cimarex Energy Co | 7,165 | 426 | ||||||
ConocoPhillips | 93,287 | 4,941 | ||||||
Devon Energy Corp | 136,912 | 2,991 | ||||||
EOG Resources Inc | 51,795 | 3,757 | ||||||
Halliburton Co | 17,892 | 384 | ||||||
HollyFrontier Corp | 73,709 | 2,637 | ||||||
Marathon Petroleum Corp | 192,123 | 10,277 | ||||||
Phillips 66 | 47,907 | 3,906 | ||||||
Valero Energy Corp | 54,263 | 3,885 | ||||||
| 52,929 | ||||||||
Financials — 15.7% |
| |||||||
Aflac Inc | 117,508 | 6,014 | ||||||
Allstate Corp/The | 3,784 | 435 | ||||||
American Express Co | 70,464 | 9,966 | ||||||
Ameriprise Financial Inc | 25,172 | 5,851 | ||||||
Annaly Capital Management Inc ‡ | 312,315 | 2,686 | ||||||
Banco Santander SA ADR | 455,630 | 1,563 | ||||||
Bank of America Corp | 833,093 | 32,232 | ||||||
Bank of New York Mellon Corp/The | 19,244 | 910 | ||||||
SEI Institutional Managed Trust / Semi-Annual Report / March 31, 2021 | 1 |
SCHEDULE OF INVESTMENTS (Unaudited)
March 31, 2021
Large Cap Fund (Continued)
| Description | Shares | Market Value ($ Thousands) | ||||||
COMMON STOCK (continued) | ||||||||
Berkshire Hathaway Inc, Cl B * | 107,429 | $ | 27,445 | |||||
Capital One Financial Corp | 185,240 | 23,568 | ||||||
Charles Schwab Corp/The | 219,118 | 14,282 | ||||||
CIT Group Inc | 9,288 | 478 | ||||||
Citigroup Inc | 226,874 | 16,505 | ||||||
Citizens Financial Group Inc | 118,947 | 5,251 | ||||||
CME Group Inc | 12,109 | 2,473 | ||||||
Comerica Inc | 64,368 | 4,618 | ||||||
Discover Financial Services | 40,853 | 3,881 | ||||||
Essent Group Ltd | 25,116 | 1,193 | ||||||
Everest Re Group Ltd | 1,843 | 457 | ||||||
Fifth Third Bancorp | 162,339 | 6,080 | ||||||
First Republic Bank/CA | 120,561 | 20,104 | ||||||
Goldman Sachs Group Inc/The | 3,354 | 1,097 | ||||||
Hartford Financial Services Group Inc/The | 89,538 | 5,980 | ||||||
JPMorgan Chase & Co | 63,451 | 9,659 | ||||||
KeyCorp | 134,532 | 2,688 | ||||||
KKR & Co Inc | 55,247 | 2,699 | ||||||
Lincoln National Corp | 13,729 | 855 | ||||||
Markel Corp * | 12,806 | 14,594 | ||||||
Marsh & McLennan Cos Inc | 95,694 | 11,655 | ||||||
Moody’s Corp | 39,148 | 11,690 | ||||||
Morgan Stanley | 87,931 | 6,829 | ||||||
PNC Financial Services Group Inc/The | 13,677 | �� | 2,399 | |||||
Popular Inc | 60,934 | 4,285 | ||||||
Progressive Corp/The | 40,145 | 3,838 | ||||||
Radian Group Inc | 51,568 | 1,199 | ||||||
Regions Financial Corp | 247,865 | 5,121 | ||||||
S&P Global Inc | 36,924 | 13,029 | ||||||
Signature Bank/New York NY, Cl B | 4,325 | 978 | ||||||
SLM Corp | 302,734 | 5,440 | ||||||
State Street Corp | 145,548 | 12,227 | ||||||
SVB Financial Group, Cl B * | 868 | 428 | ||||||
Two Harbors Investment Corp ‡ | 337,596 | 2,475 | ||||||
US Bancorp | 323,806 | 17,910 | ||||||
Voya Financial Inc | 62,675 | 3,989 | ||||||
Wells Fargo & Co | 177,012 | 6,916 | ||||||
Willis Towers Watson PLC | 22,727 | 5,202 | ||||||
Zions Bancorp NA | 87,658 | 4,818 | ||||||
| 343,992 | ||||||||
Health Care — 14.4% | ||||||||
AbbVie Inc | 51,700 | 5,595 | ||||||
Alexion Pharmaceuticals Inc * | 48,114 | 7,357 | ||||||
Align Technology Inc * | 5,401 | 2,925 | ||||||
AmerisourceBergen Corp, Cl A | 102,530 | 12,106 | ||||||
Amgen Inc, Cl A | 75,930 | 18,892 | ||||||
AstraZeneca PLC ADR (A) | 32,144 | 1,598 | ||||||
Becton Dickinson and Co | 63,430 | 15,423 | ||||||
Biogen Inc * | 12,098 | 3,384 | ||||||
Bristol-Myers Squibb Co | 155,447 | 9,813 | ||||||
Cardinal Health Inc | 41,579 | 2,526 | ||||||
CVS Health Corp | 227,837 | 17,140 | ||||||
| Description | Shares | Market Value ($ Thousands) | ||||||
COMMON STOCK (continued) | ||||||||
Danaher Corp, Cl A | 49,288 | $ | 11,094 | |||||
DaVita Inc * | 25,364 | 2,733 | ||||||
Dexcom Inc * | 5,669 | 2,037 | ||||||
Five Star Senior Living Inc * | 56,119 | 343 | ||||||
Gilead Sciences Inc | 34,934 | 2,258 | ||||||
Guardant Health Inc * | 16,601 | 2,534 | ||||||
HCA Healthcare Inc | 39,144 | 7,372 | ||||||
Hill-Rom Holdings Inc | 9,975 | 1,102 | ||||||
Humana Inc | 31,106 | 13,041 | ||||||
Jazz Pharmaceuticals PLC * | 41,757 | 6,864 | ||||||
Johnson & Johnson | 233,252 | 38,335 | ||||||
McKesson Corp | 27,209 | 5,307 | ||||||
Medtronic PLC | 115,198 | 13,608 | ||||||
Merck & Co Inc | 231,072 | 17,813 | ||||||
Mettler-Toledo International Inc * | 9,566 | 11,055 | ||||||
PerkinElmer Inc | 36,641 | 4,701 | ||||||
Pfizer Inc | 235,486 | 8,532 | ||||||
Regeneron Pharmaceuticals Inc * | 11,069 | 5,237 | ||||||
Teleflex Inc | 37,086 | 15,408 | ||||||
Thermo Fisher Scientific Inc | 5,131 | 2,342 | ||||||
UnitedHealth Group Inc | 60,733 | 22,597 | ||||||
Vertex Pharmaceuticals Inc * | 33,550 | 7,210 | ||||||
Viatris Inc, Cl W * | 133,392 | 1,864 | ||||||
Zimmer Biomet Holdings Inc | 97,355 | 15,585 | ||||||
| 315,731 | ||||||||
Industrials — 9.7% | ||||||||
AerCap Holdings NV * | 31,817 | 1,869 | ||||||
AGCO Corp | 49,960 | 7,177 | ||||||
Allison Transmission Holdings Inc | 48,690 | 1,988 | ||||||
American Airlines Group Inc | 27,189 | 650 | ||||||
AMETEK Inc | 81,342 | 10,390 | ||||||
Chart Industries Inc * | 26,071 | 3,711 | ||||||
Cintas Corp | 13,785 | 4,705 | ||||||
CSX Corp | 73,509 | 7,088 | ||||||
Cummins Inc | 40,695 | 10,544 | ||||||
Deere & Co | 1,486 | 556 | ||||||
Delta Air Lines Inc, Cl A * | 36,240 | 1,750 | ||||||
Emerson Electric Co | 106,027 | 9,566 | ||||||
FedEx Corp | 30,116 | 8,554 | ||||||
Fortive Corp | 149,524 | 10,562 | ||||||
General Electric Co | 33,500 | 440 | ||||||
Honeywell International Inc | 132,550 | 28,773 | ||||||
Huntington Ingalls Industries Inc, Cl A | 16,114 | 3,317 | ||||||
L3Harris Technologies Inc | 38,611 | 7,826 | ||||||
ManpowerGroup Inc | 29,203 | 2,888 | ||||||
MasTec Inc * | 31,740 | 2,974 | ||||||
Nordson Corp | 18,339 | 3,644 | ||||||
Oshkosh Corp | 8,732 | 1,036 | ||||||
Owens Corning | 15,863 | 1,461 | ||||||
Parker-Hannifin Corp, Cl A | 5,026 | 1,585 | ||||||
Rockwell Automation Inc | 45,057 | 11,960 | ||||||
Roper Technologies Inc | 21,548 | 8,691 | ||||||
| 2 | SEI Institutional Managed Trust / Semi-Annual Report / March 31, 2021 |
SCHEDULE OF INVESTMENTS (Unaudited)
March 31, 2021
Large Cap Fund (Continued)
| Description | Shares | Market Value ($ Thousands) | ||||||
COMMON STOCK (continued) |
| |||||||
Spirit AeroSystems Holdings Inc, Cl A | 29,906 | $ | 1,455 | |||||
Stanley Black & Decker Inc | 85,552 | 17,082 | ||||||
Textron Inc | 87,866 | 4,927 | ||||||
Timken Co/The | 90,317 | 7,331 | ||||||
TransDigm Group Inc * | 14,130 | 8,307 | ||||||
Uber Technologies Inc * | 59,601 | 3,249 | ||||||
Union Pacific Corp | 11,599 | 2,557 | ||||||
United Airlines Holdings Inc * | 18,153 | 1,044 | ||||||
WW Grainger Inc | 33,540 | 13,447 | ||||||
| 213,104 | ||||||||
Information Technology — 23.0% |
| |||||||
Adobe Inc * | 62,259 | 29,596 | ||||||
Advanced Micro Devices Inc * | 60,073 | 4,716 | ||||||
Amdocs Ltd | 9,111 | 639 | ||||||
Amphenol Corp, Cl A | 57,830 | 3,815 | ||||||
Apple Inc | 504,454 | 61,619 | ||||||
Applied Materials Inc | 146,722 | 19,602 | ||||||
Arista Networks Inc * | 22,693 | 6,851 | ||||||
Arrow Electronics Inc, Cl A * | 5,863 | 650 | ||||||
Automatic Data Processing Inc | 26,457 | 4,986 | ||||||
Cadence Design Systems Inc * | 8,033 | 1,100 | ||||||
Ceridian HCM Holding Inc * | 14,780 | 1,246 | ||||||
Cisco Systems Inc/Delaware | 151,519 | 7,835 | ||||||
Cognizant Technology Solutions Corp, Cl A | 7,457 | 583 | ||||||
DXC Technology Co | 23,705 | 741 | ||||||
Fiserv Inc, Cl A * | 53,932 | 6,420 | ||||||
Five9 Inc * | 17,860 | 2,792 | ||||||
Global Payments Inc | 103,225 | 20,808 | ||||||
Hewlett Packard Enterprise Co | 262,573 | 4,133 | ||||||
HP Inc | 130,088 | 4,130 | ||||||
Intel Corp | 196,333 | 12,565 | ||||||
International Business Machines Corp | 24,273 | 3,235 | ||||||
Intuit Inc | 79,125 | 30,310 | ||||||
Jabil Inc | 9,951 | 519 | ||||||
KLA Corp | 43,998 | 14,537 | ||||||
Lam Research Corp | 17,285 | 10,289 | ||||||
Marvell Technology Group Ltd | 114,440 | 5,605 | ||||||
Microchip Technology Inc | 194,568 | 30,201 | ||||||
Micron Technology Inc * | 43,534 | 3,840 | ||||||
Microsoft Corp | 242,452 | 57,163 | ||||||
Motorola Solutions Inc | 67,599 | 12,712 | ||||||
NVIDIA Corp | 12,174 | 6,500 | ||||||
NXP Semiconductors NV | 41,595 | 8,375 | ||||||
Oracle Corp, Cl B | 102,994 | 7,227 | ||||||
PayPal Holdings Inc * | 80,558 | 19,563 | ||||||
QUALCOMM Inc | 143,364 | 19,009 | ||||||
RingCentral Inc, Cl A * | 8,890 | 2,648 | ||||||
salesforce.com * | 86,371 | 18,299 | ||||||
SAP SE ADR (A) | 74,822 | 9,187 | ||||||
Seagate Technology PLC | 77,003 | 5,910 | ||||||
Taiwan Semiconductor Manufacturing Co Ltd ADR | 42,493 | 5,026 | ||||||
| Description | Shares | Market Value ($ Thousands) | ||||||
COMMON STOCK (continued) |
| |||||||
Visa Inc, Cl A | 139,382 | $ | 29,511 | |||||
Vishay Intertechnology Inc | 103,407 | 2,490 | ||||||
Vontier * | 149,101 | 4,513 | ||||||
Xerox Holdings Corp | 45,344 | 1,101 | ||||||
| 502,597 | ||||||||
Materials — 5.1% |
| |||||||
Air Products and Chemicals Inc | 83,457 | 23,480 | ||||||
Alcoa Corp * | 73,185 | 2,378 | ||||||
AptarGroup Inc | 27,402 | 3,882 | ||||||
Arconic Corp * | 40,024 | 1,016 | ||||||
Avery Dennison Corp | 51,029 | 9,371 | ||||||
Berry Global Group Inc * | 7,848 | 482 | ||||||
Cabot Corp | 16,587 | 870 | ||||||
Celanese Corp, Cl A | 13,460 | 2,016 | ||||||
Corteva Inc | 103,970 | 4,847 | ||||||
Crown Holdings Inc | 30,432 | 2,953 | ||||||
DuPont de Nemours Inc | 38,689 | 2,990 | ||||||
Eastman Chemical Co | 64,275 | 7,078 | ||||||
Ecolab Inc | 15,955 | 3,415 | ||||||
FMC Corp | 20,475 | 2,265 | ||||||
Freeport-McMoRan Inc, Cl B | 331,595 | 10,919 | ||||||
Huntsman Corp | 207,685 | 5,988 | ||||||
International Flavors & Fragrances Inc | 41,492 | 5,793 | ||||||
Linde PLC | 25,078 | 7,025 | ||||||
LyondellBasell Industries NV, Cl A | 14,567 | 1,516 | ||||||
Newmont Corp | 35,191 | 2,121 | ||||||
O-I Glass Inc, Cl I | 33,499 | 494 | ||||||
Reliance Steel & Aluminum Co | 17,345 | 2,641 | ||||||
Sherwin-Williams Co/The, Cl A | 6,519 | 4,811 | ||||||
Steel Dynamics Inc | 16,498 | 837 | ||||||
Valvoline Inc | 17,799 | 464 | ||||||
Westrock Co | 24,453 | 1,273 | ||||||
| 110,925 | ||||||||
Real Estate — 1.6% |
| |||||||
American Tower Corp, Cl A ‡ | 43,396 | 10,374 | ||||||
Crown Castle International Corp ‡ | 74,706 | 12,859 | ||||||
Diversified Healthcare Trust ‡ | 99,612 | 476 | ||||||
Gaming and Leisure Properties Inc ‡ | 54,974 | 2,333 | ||||||
Host Hotels & Resorts Inc ‡ | 160,809 | 2,710 | ||||||
Omega Healthcare Investors Inc ‡ | 42,759 | 1,566 | ||||||
Ryman Hospitality Properties Inc *‡ | 37,035 | 2,871 | ||||||
Service Properties Trust ‡ | 41,010 | 486 | ||||||
VEREIT Inc ‡ | 45,971 | 1,775 | ||||||
| 35,450 | ||||||||
Utilities — 2.5% |
| |||||||
DTE Energy Co | 3,221 | 429 | ||||||
Exelon Corp | 121,388 | 5,310 | ||||||
FirstEnergy Corp | 121,131 | 4,202 | ||||||
MDU Resources Group Inc | 97,537 | 3,083 | ||||||
NextEra Energy Inc | 242,617 | 18,344 | ||||||
NiSource Inc | 262,936 | 6,340 | ||||||
SEI Institutional Managed Trust / Semi-Annual Report / March 31, 2021 | 3 |
SCHEDULE OF INVESTMENTS (Unaudited)
March 31, 2021
Large Cap Fund (Continued)
| Description | Shares | Market Value ($ Thousands) | ||||||
COMMON STOCK (continued) |
| |||||||
NRG Energy Inc | 98,598 | $ | 3,720 | |||||
PPL Corp | 205,378 | 5,923 | ||||||
UGI Corp | 157,161 | 6,445 | ||||||
Vistra Corp | 68,276 | 1,207 | ||||||
|
|
| ||||||
| 55,003 | ||||||||
|
|
| ||||||
Total Common Stock |
| 2,171,889 | ||||||
|
|
| ||||||
AFFILIATED PARTNERSHIP — 0.6% |
| |||||||
SEI Liquidity Fund, L.P. | ||||||||
0.020% **†(B) | 12,248,552 | 12,257 | ||||||
|
|
| ||||||
Total Affiliated Partnership |
| 12,257 | ||||||
|
|
| ||||||
| Description | Shares | Market Value ($ Thousands) | ||||||
CASH EQUIVALENT — 0.7% |
| |||||||
SEI Daily Income Trust, Government Fund, Cl F | ||||||||
0.010%**† | 16,343,657 | $ | 16,344 | |||||
|
|
| ||||||
Total Cash Equivalent |
| 16,344 | ||||||
|
|
| ||||||
Total Investments in Securities — 100.5% |
| $ | 2,200,490 | |||||
|
|
| ||||||
A list of the open futures contracts held at March 31, 2021 is as follows:
Type of Contract | Number of Contracts Long/(Short) | Expiration Date | Notional Amount (Thousands) | Value (Thousands) | Unrealized Appreciation (Depreciation) (Thousands) | |||||||||||||||
S&P 500 Index E-MINI | 52 | Jun-2021 | $ | 10,088 | $ | 10,315 | $ | 227 | ||||||||||||
S&P Mid Cap 400 Index E-MINI | 3 | Jun-2021 | 753 | 782 | 29 | |||||||||||||||
|
| |||||||||||||||||||
| $ | 10,841 | $ | 11,097 | $ | 256 | |||||||||||||||
|
| |||||||||||||||||||
Percentages are based on Net Assets of $2,188,929 ($ Thousands). |
| * | Non-income producing security. |
| ** | Rate shown is the 7-day effective yield as of March 31, 2021. |
| † | Investment in Affiliated Security (see Note 6). |
| ‡ | Real Estate Investment Trust. |
| (A) | Certain securities or partial positions of certain securities are on loan at March 31, 2021 (see Note 10). The total market value of securities on loan at March 31, 2021 was $12,142 ($ Thousands). |
| (B) | This security was purchased with cash collateral held from securities on loan (see Note 10). The total market value of such securities as of March 31, 2021 was $12,257 ($ Thousands). |
ADR — American Depositary Receipt
Cl — Class
L.P. — Limited Partnership
Ltd. — Limited
PLC — Public Limited Company
S&P— Standard & Poor’s
The following is a list of the level of inputs used as of March 31, 2021, in valuing the Fund’s investments carried at value ($ Thousands):
| Investments in Securities | Level 1 ($) | Level 2 ($) | Level 3 ($) | Total ($) | ||||||||||||
Common Stock | 2,171,889 | – | – | 2,171,889 | ||||||||||||
Affiliated Partnership | – | 12,257 | – | 12,257 | ||||||||||||
Cash Equivalent | 16,344 | – | – | 16,344 | ||||||||||||
|
|
|
|
|
|
|
| |||||||||
Total Investments in Securities | 2,188,233 | 12,257 | – | 2,200,490 | ||||||||||||
|
|
|
|
|
|
|
| |||||||||
| Other Financial Instruments | Level 1 ($) | Level 2 ($) | Level 3 ($) | Total ($) | ||||||||||||
Futures Contracts* | ||||||||||||||||
Unrealized Appreciation | 256 | – | – | 256 | ||||||||||||
|
|
|
|
|
|
|
| |||||||||
Total Other Financial Instruments | 256 | – | – | 256 | ||||||||||||
|
|
|
|
|
|
|
| |||||||||
* Futures contracts are valued at the unrealized appreciation on the instrument.
For the period ended March 31, 2021, there were no transfers in or out of Level 3.
For more information on valuation inputs, see Note 2 – Significant Accounting Policies in Notes to
Financial Statements.
| 4 | SEI Institutional Managed Trust / Semi-Annual Report / March 31, 2021 |
SCHEDULE OF INVESTMENTS (Unaudited)
March 31, 2021
Large Cap Fund (Continued)
The following is a summary of the Fund’s transactions with affiliates for the year ended September 30, 2020 ($ Thousands):
| Security Description | Value 9/30/2020 | Purchases at Cost | Proceeds from Sales | Realized Gain (Loss) | Change in Unrealized Appreciation (Depreciation) | Value 3/31/2021 | Shares | Income | Capital Gains | |||||||||
SEI Liquidity Fund, L.P. | $ 14,838 | $ 63,598 | $ (66,179) | $ 1 | $(1) | $ 12,257 | 12,248,552 | $ 119 | $— | |||||||||
SEI Daily Income Trust, Government Fund, | 15,549 | 291,087 | (290,292) | — | — | 16,344 | 16,343,657 | 1 | — | |||||||||
|
|
|
|
|
|
|
| |||||||||||
Totals | $ 30,387 | $ 354,685 | $ (356,471) | $ 1 | $(1) | $ 28,601 | $ 120 | $— | ||||||||||
|
|
|
|
|
|
|
|
Amounts designated as “—” are either $0 or have been rounded to $0.
The accompanying notes are an integral part of the financial statements.
SEI Institutional Managed Trust / Semi-Annual Report / March 31, 2021 | 5 |
SCHEDULE OF INVESTMENTS (Unaudited)
March 31, 2021
Large Cap Value Fund (Continued)
| Description | Shares | Market Value ($ Thousands) | ||||||
COMMON STOCK — 99.1% | ||||||||
Communication Services — 6.3% |
| |||||||
AT&T Inc | 1,031,235 | $ | 31,215 | |||||
BCE Inc | 309,291 | 13,962 | ||||||
Comcast Corp, Cl A | 189,923 | 10,277 | ||||||
Facebook Inc, Cl A * | 12,932 | 3,809 | ||||||
Fox Corp | 114,572 | 4,137 | ||||||
Omnicom Group Inc | 123,622 | 9,167 | ||||||
TEGNA Inc | 136,100 | 2,563 | ||||||
T-Mobile US Inc * | 8,767 | 1,098 | ||||||
Verizon Communications Inc | 272,309 | 15,835 | ||||||
ViacomCBS Inc, Cl B | 30,558 | 1,378 | ||||||
| 93,441 | ||||||||
Consumer Discretionary — 9.4% |
| |||||||
Best Buy Co Inc | 69,596 | 7,990 | ||||||
BorgWarner Inc | 58,394 | 2,707 | ||||||
Carnival Corp * | 89,490 | 2,375 | ||||||
Dick’s Sporting Goods Inc | 37,284 | 2,839 | ||||||
Dillard’s Inc, Cl A (A) | 13,889 | 1,341 | ||||||
DR Horton Inc | 13,719 | 1,223 | ||||||
eBay Inc | 129,985 | 7,960 | ||||||
Foot Locker Inc, Cl A | 43,157 | 2,428 | ||||||
Ford Motor Co * | 192,027 | 2,352 | ||||||
General Motors Co | 332,988 | 19,133 | ||||||
Genuine Parts Co | 148,224 | 17,133 | ||||||
Goodyear Tire & Rubber Co/The | 72,101 | 1,267 | ||||||
Kohl’s Corp | 14,871 | 887 | ||||||
Lear Corp | 22,934 | 4,157 | ||||||
Lowe’s Cos Inc | 64,249 | 12,219 | ||||||
Magna International Inc, Cl A | 28,988 | 2,552 | ||||||
PulteGroup Inc | 218,605 | 11,464 | ||||||
Target Corp, Cl A | 155,139 | 30,728 | ||||||
Thor Industries Inc | 16,327 | 2,200 | ||||||
Ulta Beauty Inc * | 7,594 | 2,348 | ||||||
Whirlpool Corp | 15,655 | 3,450 | ||||||
Williams-Sonoma Inc | 1,709 | 306 | ||||||
| 139,059 | ||||||||
Consumer Staples — 8.3% |
| |||||||
Altria Group Inc | 174,494 | 8,927 | ||||||
Conagra Brands Inc | 42,670 | 1,604 | ||||||
Diageo PLC ADR | 37,203 | 6,109 | ||||||
General Mills Inc | 12,302 | 754 | ||||||
Ingredion Inc | 76,832 | 6,909 | ||||||
J M Smucker Co/The | 17,876 | 2,262 | ||||||
Kimberly-Clark Corp | 86,011 | 11,960 | ||||||
Kraft Heinz Co/The | 56,221 | 2,249 | ||||||
Kroger Co/The | 465,551 | 16,755 | ||||||
Molson Coors Beverage Co, Cl B | 119,484 | 6,112 | ||||||
Philip Morris International Inc | 184,254 | 16,351 | ||||||
Pilgrim’s Pride Corp * | 28,357 | 675 | ||||||
Procter & Gamble Co/The | 32,433 | 4,392 | ||||||
TreeHouse Foods Inc * | 51,000 | 2,664 | ||||||
| Description | Shares | Market Value ($ Thousands) | ||||||
COMMON STOCK (continued) | ||||||||
Tyson Foods Inc, Cl A | 147,236 | $ | 10,940 | |||||
Unilever PLC ADR | 172,247 | 9,616 | ||||||
Walgreens Boots Alliance Inc | 222,619 | 12,222 | ||||||
Walmart Inc | 24,817 | 3,371 | ||||||
| 123,872 | ||||||||
Energy — 4.9% | ||||||||
BP PLC ADR | 124,070 | 3,021 | ||||||
Canadian Natural Resources Ltd | 133,180 | 4,111 | ||||||
Chevron Corp | 193,503 | 20,277 | ||||||
ConocoPhillips | 304,568 | 16,133 | ||||||
Devon Energy Corp | 91,094 | 1,990 | ||||||
Exxon Mobil Corp | 220,170 | 12,292 | ||||||
HollyFrontier Corp | 71,368 | 2,554 | ||||||
Marathon Petroleum Corp | 82,495 | 4,413 | ||||||
Phillips 66 | 48,225 | 3,932 | ||||||
Valero Energy Corp | 60,065 | 4,301 | ||||||
| 73,024 | ||||||||
Financials — 21.1% | ||||||||
Aflac Inc | 88,114 | 4,510 | ||||||
Allstate Corp/The | 34,766 | 3,995 | ||||||
Ameriprise Financial Inc | 29,427 | 6,840 | ||||||
Annaly Capital Management Inc ‡ | 586,787 | 5,046 | ||||||
Assured Guaranty Ltd | 17,298 | 731 | ||||||
Banco Santander SA ADR (A) | 752,254 | 2,580 | ||||||
Bank of America Corp | 893,848 | 34,583 | ||||||
Bank of New York Mellon Corp/The | 201,580 | 9,533 | ||||||
Berkshire Hathaway Inc, Cl B * | 47,122 | 12,038 | ||||||
Capital One Financial Corp | 28,002 | 3,563 | ||||||
Chubb Ltd | 94,141 | 14,871 | ||||||
Citigroup Inc | 538,848 | 39,201 | ||||||
Citizens Financial Group Inc | 108,391 | 4,786 | ||||||
Comerica Inc | 47,951 | 3,440 | ||||||
Discover Financial Services | 41,455 | 3,938 | ||||||
Essent Group Ltd | 27,172 | 1,290 | ||||||
Everest Re Group Ltd | 4,347 | 1,077 | ||||||
Fifth Third Bancorp | 113,014 | 4,232 | ||||||
Goldman Sachs Group Inc/The | 7,938 | 2,596 | ||||||
Hartford Financial Services Group Inc/The | 38,984 | 2,604 | ||||||
JPMorgan Chase & Co | 201,397 | 30,659 | ||||||
KeyCorp | 125,944 | 2,516 | ||||||
KKR & Co Inc | 13,032 | 637 | ||||||
Lincoln National Corp | 28,550 | 1,778 | ||||||
MetLife Inc | 83,296 | 5,064 | ||||||
Morgan Stanley | 308,898 | 23,989 | ||||||
PNC Financial Services Group Inc/The | 12,343 | 2,165 | ||||||
Popular Inc | 58,412 | 4,108 | ||||||
Principal Financial Group Inc, Cl A | 11,962 | 717 | ||||||
Prudential Financial Inc | 60,510 | 5,513 | ||||||
Radian Group Inc | 35,327 | 821 | ||||||
Regions Financial Corp | 201,984 | 4,173 | ||||||
SLM Corp | 315,938 | 5,677 | ||||||
SEI Institutional Managed Trust / Semi-Annual Report / March 31, 2021 | 1 |
SCHEDULE OF INVESTMENTS (Unaudited)
March 31, 2021
Large Cap Value Fund (Continued)
| Description | Shares | Market Value ($ Thousands) | ||||||
COMMON STOCK (continued) | ||||||||
State Street Corp | 47,517 | $ | 3,992 | |||||
Synchrony Financial | 70,757 | 2,877 | ||||||
T Rowe Price Group Inc | 19,842 | 3,405 | ||||||
Travelers Cos Inc/The | 50,275 | 7,561 | ||||||
Truist Financial Corp | 211,571 | 12,339 | ||||||
Two Harbors Investment Corp ‡ | 367,148 | 2,691 | ||||||
Unum Group | 45,942 | 1,279 | ||||||
Voya Financial Inc | 105,231 | 6,697 | ||||||
Wells Fargo & Co | 468,761 | 18,314 | ||||||
Zions Bancorp NA | 94,921 | 5,217 | ||||||
| 313,643 | ||||||||
Health Care — 12.7% | ||||||||
AbbVie Inc | 26,186 | 2,834 | ||||||
Alexion Pharmaceuticals Inc * | 44,947 | 6,873 | ||||||
AmerisourceBergen Corp, Cl A | 8,939 | 1,055 | ||||||
Amgen Inc, Cl A | 12,386 | 3,082 | ||||||
AstraZeneca PLC ADR (A) | 36,355 | 1,807 | ||||||
Biogen Inc * | 8,893 | 2,488 | ||||||
Bristol-Myers Squibb Co | 115,806 | 7,311 | ||||||
Cardinal Health Inc | 93,629 | 5,688 | ||||||
CVS Health Corp | 142,061 | 10,687 | ||||||
DaVita Inc * | 16,172 | 1,743 | ||||||
Eli Lilly and Co | 45,192 | 8,443 | ||||||
Gilead Sciences Inc | 75,142 | 4,856 | ||||||
GlaxoSmithKline PLC ADR | 7,695 | 275 | ||||||
HCA Healthcare Inc | 32,455 | 6,112 | ||||||
Hill-Rom Holdings Inc | 16,736 | 1,849 | ||||||
Jazz Pharmaceuticals PLC * | 40,356 | 6,633 | ||||||
Johnson & Johnson | 182,385 | 29,975 | ||||||
McKesson Corp | 40,482 | 7,896 | ||||||
Medtronic PLC | 131,252 | 15,505 | ||||||
Merck & Co Inc | 251,611 | 19,397 | ||||||
Novartis AG ADR | 152,220 | 13,012 | ||||||
Pfizer Inc | 736,707 | 26,691 | ||||||
Regeneron Pharmaceuticals Inc * | 4,169 | 1,972 | ||||||
Viatris Inc, Cl W * | 153,211 | 2,140 | ||||||
| 188,324 | ||||||||
Industrials — 10.9% | ||||||||
3M Co | 61,376 | 11,826 | ||||||
AerCap Holdings NV * | 59,010 | 3,466 | ||||||
AGCO Corp | 40,664 | 5,841 | ||||||
Allison Transmission Holdings Inc | 68,559 | 2,799 | ||||||
American Airlines Group Inc | 41,207 | 985 | ||||||
Chart Industries Inc * | 16,579 | 2,360 | ||||||
Cummins Inc | 48,600 | 12,593 | ||||||
Delta Air Lines Inc, Cl A * | 55,046 | 2,658 | ||||||
FedEx Corp | 27,070 | 7,689 | ||||||
General Dynamics Corp | 72,384 | 13,142 | ||||||
Huntington Ingalls Industries Inc, Cl A | 15,906 | 3,274 | ||||||
Johnson Controls International PLC | 410,921 | 24,520 | ||||||
ManpowerGroup Inc | 49,980 | 4,943 | ||||||
| Description | Shares | Market Value ($ Thousands) | ||||||
COMMON STOCK (continued) |
| |||||||
MasTec Inc * | 25,526 | $ | 2,392 | |||||
Oshkosh Corp | 17,457 | 2,072 | ||||||
Owens Corning | 23,991 | 2,209 | ||||||
PACCAR Inc | 26,231 | 2,438 | ||||||
Raytheon Technologies Corp | 209,293 | 16,172 | ||||||
Siemens AG ADR | 197,944 | 16,290 | ||||||
Snap-on Inc | 7,270 | 1,677 | ||||||
Spirit AeroSystems Holdings Inc, Cl A | 29,657 | 1,443 | ||||||
Textron Inc | 90,821 | 5,093 | ||||||
Timken Co/The | 50,058 | 4,063 | ||||||
United Airlines Holdings Inc * | 38,723 | 2,228 | ||||||
United Parcel Service Inc, Cl B | 52,185 | 8,871 | ||||||
| 161,044 | ||||||||
Information Technology — 10.8% |
| |||||||
Amdocs Ltd | 68,616 | 4,813 | ||||||
Applied Materials Inc | 59,039 | 7,888 | ||||||
Arista Networks Inc * | 18,061 | 5,452 | ||||||
Arrow Electronics Inc, Cl A * | 43,920 | 4,867 | ||||||
Broadcom Inc | 20,633 | 9,567 | ||||||
Cisco Systems Inc/Delaware | 395,800 | 20,467 | ||||||
Cognizant Technology Solutions Corp, Cl A | 96,344 | 7,526 | ||||||
Corning Inc, Cl B | 34,418 | 1,498 | ||||||
DXC Technology Co | 12,557 | 393 | ||||||
Hewlett Packard Enterprise Co | 260,289 | 4,097 | ||||||
HP Inc | 417,991 | 13,271 | ||||||
Intel Corp | 547,523 | 35,041 | ||||||
International Business Machines Corp | 35,900 | 4,784 | ||||||
Jabil Inc | 51,212 | 2,671 | ||||||
Juniper Networks Inc | 68,862 | 1,744 | ||||||
Lam Research Corp | 6,409 | 3,815 | ||||||
Marvell Technology Group Ltd | 69,040 | 3,382 | ||||||
Micron Technology Inc * | 60,094 | 5,301 | ||||||
Microsoft Corp | 40,412 | 9,528 | ||||||
Oracle Corp, Cl B | 94,361 | 6,621 | ||||||
Seagate Technology PLC | 48,818 | 3,747 | ||||||
Vishay Intertechnology Inc | 27,120 | 653 | ||||||
Vontier * | 34,338 | 1,039 | ||||||
Xerox Holdings Corp | 98,464 | 2,390 | ||||||
| 160,555 | ||||||||
Materials — 5.7% |
| |||||||
Alcoa Corp * | 56,337 | 1,830 | ||||||
Berry Global Group Inc * | 21,032 | 1,291 | ||||||
Cabot Corp | 38,287 | 2,008 | ||||||
Celanese Corp, Cl A | 41,523 | 6,221 | ||||||
Corteva Inc | 111,617 | 5,204 | ||||||
Crown Holdings Inc | 50,076 | 4,859 | ||||||
Dow Inc | 153,907 | 9,841 | ||||||
DuPont de Nemours Inc | 42,979 | 3,321 | ||||||
Eastman Chemical Co | 89,995 | 9,910 | ||||||
Huntsman Corp | 239,010 | 6,891 | ||||||
International Paper Co | 111,708 | 6,040 | ||||||
| 2 | SEI Institutional Managed Trust / Semi-Annual Report / March 31, 2021 |
SCHEDULE OF INVESTMENTS (Unaudited)
March 31, 2021
Large Cap Value Fund (Continued)
| Description | Shares | Market Value ($ Thousands) | ||||||
COMMON STOCK (continued) | ||||||||
LyondellBasell Industries NV, Cl A | 37,839 | $ | 3,937 | |||||
Newmont Corp | 65,781 | 3,965 | ||||||
O-I Glass Inc, Cl I | 82,301 | 1,213 | ||||||
PPG Industries Inc | 18,929 | 2,844 | ||||||
Reliance Steel & Aluminum Co | 38,172 | 5,813 | ||||||
Steel Dynamics Inc | 124,165 | 6,303 | ||||||
Westrock Co | 60,481 | 3,148 | ||||||
| 84,639 | ||||||||
Real Estate — 3.9% | ||||||||
Equity Commonwealth ‡ | 209,586 | 5,826 | ||||||
Gaming and Leisure Properties Inc ‡ | 118,762 | 5,039 | ||||||
Healthpeak Properties Inc ‡ | 444,186 | 14,098 | ||||||
Host Hotels & Resorts Inc ‡ | 244,702 | 4,123 | ||||||
Omega Healthcare Investors Inc ‡ | 131,477 | 4,816 | ||||||
Ryman Hospitality Properties Inc *‡ | 47,407 | 3,675 | ||||||
VEREIT Inc ‡ | 142,676 | 5,510 | ||||||
Welltower Inc ‡ | 203,902 | 14,606 | ||||||
| 57,693 | ||||||||
Utilities — 5.1% | ||||||||
Duke Energy Corp | 105,867 | 10,219 | ||||||
Exelon Corp | 235,793 | 10,314 | ||||||
FirstEnergy Corp | 75,184 | 2,608 | ||||||
MDU Resources Group Inc | 174,542 | 5,517 | ||||||
NextEra Energy Inc | 282,830 | 21,385 | ||||||
NiSource Inc | 260,251 | 6,275 | ||||||
NRG Energy Inc | 67,689 | 2,554 | ||||||
| Description | Shares | Market Value ($ Thousands) | ||||||
COMMON STOCK (continued) |
| |||||||
PPL Corp | 248,841 | $ | 7,176 | |||||
UGI Corp | 123,838 | 5,079 | ||||||
Vistra Corp | 261,235 | 4,619 | ||||||
|
| |||||||
| 75,746 | ||||||||
|
| |||||||
Total Common Stock |
| 1,471,040 | ||||||
|
| |||||||
AFFILIATED PARTNERSHIP — 0.2% |
| |||||||
SEI Liquidity Fund, L.P. | ||||||||
0.020% **†(B) | 3,609,859 | 3,608 | ||||||
|
| |||||||
Total Affiliated Partnership |
| 3,608 | ||||||
|
| |||||||
CASH EQUIVALENT — 0.8% |
| |||||||
SEI Daily Income Trust, Government Fund, Cl F | ||||||||
0.010%**† | 11,548,070 | 11,548 | ||||||
|
| |||||||
Total Cash Equivalent |
| 11,548 | ||||||
|
| |||||||
Total Investments in Securities — 100.1% |
| $ | 1,486,196 | |||||
|
| |||||||
A list of the open futures contracts held at March 31, 2021 is as follows:
| ||||||||||||||||||||
Type of Contract | Number of Contracts Long | Expiration Date | Notional Amount (Thousands) | Value (Thousands) | Unrealized Appreciation (Depreciation) (Thousands) | |||||||||||||||
| ||||||||||||||||||||
S&P 500 Index E-MINI | 17 | Jun-2021 | $ | 3,370 | $ | 3,372 | $ | 2 | ||||||||||||
S&P Mid Cap 400 Index E-MINI | 24 | Jun-2021 | 3,669 | 3,647 | (22) | |||||||||||||||
|
| |||||||||||||||||||
| $ | 7,039 | $ | 7,019 | $ | (20) | |||||||||||||||
|
| |||||||||||||||||||
Percentages are based on Net Assets of $1,484,847 ($ Thousands). |
| * | Non-income producing security. |
| ** | The rate reported is the 7-day effective yield as of March 31, 2021. |
| ‡ | Real Estate Investment Trust. |
| † | Investment in Affiliated Security (see Note 6). |
| (A) | Certain securities or partial positions of certain securities are on loan at March 31, 2021 (See Note 10). The total market value of securities on loan at March 31, 2021 was $3,564 ($ Thousands). |
| (B) | This security was purchased with cash collateral held from securities on loan. The total market value of such securities as of March 31, 2021 was $3,608 ($ Thousands). |
ADR — American Depositary Receipt
Cl — Class
L.P. — Limited Partnership
PLC — Public Limited Company
S&P— Standard & Poor’s
SEI Institutional Managed Trust / Semi-Annual Report / March 31, 2021 | 3 |
SCHEDULE OF INVESTMENTS (Unaudited)
March 31, 2021
Large Cap Value Fund (Continued)
The following is a list of the level of inputs used as of March 31, 2021, in valuing the Fund’s investments and other financial instruments carried at value ($ Thousands):
| Investments in Securities | Level 1 ($) | Level 2 ($) | Level 3 ($) | Total ($) | ||||||||||||
Common Stock | 1,471,040 | – | – | 1,471,040 | ||||||||||||
Affiliated Partnership | – | 3,608 | – | 3,608 | ||||||||||||
Cash Equivalent | 11,548 | – | – | 11,548 | ||||||||||||
|
|
|
|
|
|
|
| |||||||||
Total Investments in Securities | 1,482,588 | 3,608 | – | 1,486,196 | ||||||||||||
|
|
|
|
|
|
|
| |||||||||
| Other Financial Instruments | Level 1 ($) | Level 2 ($) | Level 3 ($) | Total ($) | ||||||||||||
Futures Contracts* | ||||||||||||||||
Unrealized Appreciation | 2 | – | – | 2 | ||||||||||||
Unrealized Depreciation | (22 | ) | – | – | (22) | |||||||||||
|
|
|
|
|
|
|
| |||||||||
Total Other Financial Instruments | (20 | ) | – | – | (20) | |||||||||||
|
|
|
|
|
|
|
| |||||||||
* Futures contracts are valued at the unrealized appreciation/(depreciation) on the instrument.
For the period ended March 31, 2021, there were no transfers in or out of Level 3.
For more information on valuation inputs, see Note 2 — Significant Accounting Policies in Notes to
Financial Statements.
The following is a summary of the Fund’s transactions with affiliates for the period ended March 31, 2021 ($ Thousands):
| ||||||||||||||||||
| Security Description | Value 9/30/2020 | Purchases at Cost | Proceeds from Sales | Realized Gain (Loss) | Change in Unrealized Appreciation (Depreciation) | Value 3/31/2021 | Shares | Income | Capital Gains | |||||||||
| ||||||||||||||||||
SEI Liquidity Fund, L.P. | $ 2,813 | $ 71,639 | $(70,842) | $(3) | $ 1 | $ 3,608 | 3,609,859 | $ 64 | $— | |||||||||
SEI Daily Income Trust, Government Fund, Cl F | 13,611 | 156,481 | (158,544) | — | — | 11,548 | 11,548,070 | 1 | — | |||||||||
|
|
|
|
|
|
|
| |||||||||||
Totals | $ 16,424 | $ 228,120 | $(229,386) | $(3) | $ 1 | $ 15,156 | $ 65 | $— | ||||||||||
|
|
|
|
|
|
|
| |||||||||||
Amounts designated as “—” are either $0 or have been rounded to $0.
The accompanying notes are an integral part of the financial statements.
| 4 | SEI Institutional Managed Trust / Semi-Annual Report / March 31, 2021 |
SCHEDULE OF INVESTMENTS (Unaudited)
March 31, 2021
Large Cap Growth Fund (Continued)
| Description | Shares | Market Value ($ Thousands) | ||||||
COMMON STOCK — 98.7% |
| |||||||
Communication Services — 10.6% |
| |||||||
Alphabet Inc, Cl A * | 17,794 | $ | 36,700 | |||||
Alphabet Inc, Cl C * | 20,104 | 41,588 | ||||||
Facebook Inc, Cl A * | 164,387 | 48,417 | ||||||
IAC/InterActiveCorp * | 961 | 208 | ||||||
Live Nation Entertainment Inc * | 17,230 | 1,459 | ||||||
Netflix Inc * | 18,476 | 9,638 | ||||||
Pinterest Inc, Cl A * | 215,363 | 15,943 | ||||||
Sea Ltd ADR * | 40,280 | 8,992 | ||||||
Snap Inc, Cl A * | 13,094 | 685 | ||||||
T-Mobile US Inc * | 112,916 | 14,147 | ||||||
|
|
| ||||||
| 177,777 | ||||||||
|
|
| ||||||
Consumer Discretionary — 16.0% |
| |||||||
Amazon.com Inc, Cl A * | 32,535 | 100,666 | ||||||
AutoZone Inc * | 13,698 | 19,236 | ||||||
Best Buy Co Inc | 2,740 | 315 | ||||||
Booking Holdings Inc * | 780 | 1,817 | ||||||
BRP Inc | 3,975 | 345 | ||||||
Carvana Co, Cl A * | 16,875 | 4,428 | ||||||
DraftKings Inc, Cl A * | 161,450 | 9,902 | ||||||
eBay Inc | 15,358 | 940 | ||||||
Etsy Inc * | 39,429 | 7,952 | ||||||
Home Depot Inc/The | 19,439 | 5,934 | ||||||
L Brands Inc * | 30,675 | 1,898 | ||||||
Las Vegas Sands Corp | 64,528 | 3,921 | ||||||
Lennar Corp, Cl A | 111,324 | 11,269 | ||||||
Lithia Motors Inc, Cl A | 24,824 | 9,684 | ||||||
Lowe’s Cos Inc | 92,133 | 17,522 | ||||||
Lululemon Athletica Inc * | 26,188 | 8,032 | ||||||
MercadoLibre Inc * | 3,054 | 4,496 | ||||||
MGM Resorts International | 108,340 | 4,116 | ||||||
NIKE Inc, Cl B | 120,711 | 16,041 | ||||||
Qurate Retail Inc | 27,626 | 325 | ||||||
Starbucks Corp | 107,298 | 11,724 | ||||||
Target Corp, Cl A | 1,780 | 352 | ||||||
Tesla Inc * | 21,380 | 14,280 | ||||||
TJX Cos Inc/The | 201,293 | 13,316 | ||||||
|
|
| ||||||
| 268,511 | ||||||||
|
|
| ||||||
Consumer Staples — 4.4% |
| |||||||
Altria Group Inc | 6,255 | 320 | ||||||
Casey’s General Stores Inc | 15,234 | 3,293 | ||||||
Colgate-Palmolive Co | 149,613 | 11,794 | ||||||
Estee Lauder Cos Inc/The, Cl A | 2,523 | 734 | ||||||
Herbalife Nutrition Ltd * | 15,577 | 691 | ||||||
Kroger Co/The | 73,169 | 2,633 | ||||||
Monster Beverage Corp * | 43,268 | 3,941 | ||||||
Nu Skin Enterprises Inc, Cl A | 38,652 | 2,044 | ||||||
PepsiCo Inc | 141,079 | 19,956 | ||||||
Philip Morris International Inc | 3,946 | 350 | ||||||
Procter & Gamble Co/The | 76,352 | 10,340 | ||||||
Spectrum Brands Holdings Inc | 3,902 | 332 | ||||||
| Description | Shares | Market Value ($ Thousands) | ||||||
COMMON STOCK (continued) |
| |||||||
Sprouts Farmers Market Inc * | 119,965 | $ | 3,194 | |||||
US Foods Holding Corp * | 359,174 | 13,692 | ||||||
|
|
| ||||||
| 73,314 | ||||||||
|
|
| ||||||
Financials — 4.8% |
| |||||||
BlackRock Inc | 1,854 | 1,398 | ||||||
CME Group Inc | 73,886 | 15,090 | ||||||
FactSet Research Systems Inc | 19,720 | 6,085 | ||||||
Moody’s Corp | 62,893 | 18,780 | ||||||
Morgan Stanley | 35,523 | 2,759 | ||||||
MSCI Inc, Cl A | 34,458 | 14,448 | ||||||
S&P Global Inc | 34,598 | 12,209 | ||||||
Signature Bank/New York NY, Cl B | 13,775 | 3,114 | ||||||
T Rowe Price Group Inc | 10,621 | 1,823 | ||||||
US Bancorp | 74,835 | 4,139 | ||||||
|
|
| ||||||
| 79,845 | ||||||||
|
|
| ||||||
Health Care — 13.6% |
| |||||||
Abbott Laboratories | 77,879 | 9,333 | ||||||
ABIOMED Inc * | 963 | 307 | ||||||
Alexion Pharmaceuticals Inc * | 2,061 | 315 | ||||||
Align Technology Inc * | 28,573 | 15,473 | ||||||
Becton Dickinson and Co | 54,004 | 13,131 | ||||||
Biogen Inc * | 1,684 | 471 | ||||||
Catalent Inc * | 128,727 | 13,556 | ||||||
Cerner Corp | 4,215 | 303 | ||||||
Danaher Corp, Cl A | 99,177 | 22,323 | ||||||
DaVita Inc * | 33,651 | 3,627 | ||||||
Dexcom Inc * | 20,881 | 7,504 | ||||||
Edwards Lifesciences Corp, Cl A * | 3,737 | 313 | ||||||
Guardant Health Inc * | 43,934 | 6,707 | ||||||
Horizon Therapeutics PLC * | 41,225 | 3,794 | ||||||
Humana Inc | 744 | 312 | ||||||
IDEXX Laboratories Inc * | 2,852 | 1,396 | ||||||
Jazz Pharmaceuticals PLC * | 16,065 | 2,641 | ||||||
Johnson & Johnson | 88,580 | 14,558 | ||||||
McKesson Corp | 6,620 | 1,291 | ||||||
Medtronic PLC | 97,677 | 11,539 | ||||||
Mettler-Toledo International Inc * | 11,817 | 13,657 | ||||||
Moderna Inc * | 6,674 | 874 | ||||||
Neurocrine Biosciences Inc * | 18,964 | 1,844 | ||||||
Regeneron Pharmaceuticals Inc * | 683 | 323 | ||||||
Stryker Corp | 46,129 | 11,236 | ||||||
Teladoc Health Inc *(A) | 38,423 | 6,983 | ||||||
Teleflex Inc | 23,534 | 9,777 | ||||||
UnitedHealth Group Inc | 117,712 | 43,797 | ||||||
Veeva Systems Inc, Cl A * | 7,738 | 2,021 | ||||||
Vertex Pharmaceuticals Inc * | 32,954 | 7,082 | ||||||
Waters Corp * | 1,346 | 383 | ||||||
|
|
| ||||||
| 226,871 | ||||||||
|
|
| ||||||
Industrials — 6.2% |
| |||||||
AMETEK Inc | 2,713 | 346 | ||||||
Boeing Co/The * | 10,439 | 2,659 | ||||||
SEI Institutional Managed Trust / Semi-Annual Report / March 31, 2021 | 1 |
SCHEDULE OF INVESTMENTS (Unaudited)
March 31, 2021
Large Cap Growth Fund (Continued)
| Description | Shares | Market Value ($ Thousands) | ||||||
COMMON STOCK (continued) | ||||||||
Carrier Global Corp | 325,100 | $ | 13,726 | |||||
Cintas Corp | 17,860 | 6,096 | ||||||
CoStar Group Inc * | 1,960 | 1,611 | ||||||
Deere & Co | 7,483 | 2,800 | ||||||
Eaton Corp PLC | 19,552 | 2,704 | ||||||
Graco Inc | 135,851 | 9,730 | ||||||
GrafTech International Ltd | 49,249 | 602 | ||||||
Lockheed Martin Corp | 21,360 | 7,892 | ||||||
Middleby Corp/The * | 73,090 | 12,115 | ||||||
Nordson Corp | 1,545 | 307 | ||||||
Otis Worldwide Corp | 102,317 | 7,004 | ||||||
Rockwell Automation Inc | 1,392 | 369 | ||||||
Tetra Tech Inc | 4,705 | 639 | ||||||
Trane Technologies PLC | 45,424 | 7,520 | ||||||
TransDigm Group Inc * | 18,030 | 10,600 | ||||||
Uber Technologies Inc * | 91,587 | 4,992 | ||||||
Union Pacific Corp | 54,750 | 12,067 | ||||||
|
|
| ||||||
| 103,779 | ||||||||
|
|
| ||||||
Information Technology — 40.4% |
| |||||||
Adobe Inc * | 81,146 | 38,574 | ||||||
Advanced Micro Devices Inc * | 120,554 | 9,463 | ||||||
Analog Devices Inc | 90,226 | 13,992 | ||||||
Apple Inc | 978,177 | 119,484 | ||||||
Applied Materials Inc | 341,024 | 45,561 | ||||||
Autodesk Inc, Cl A * | 1,172 | 325 | ||||||
Broadcom Inc | 31,941 | 14,810 | ||||||
Cadence Design Systems Inc * | 23,763 | 3,255 | ||||||
Ceridian HCM Holding Inc * | 40,625 | 3,423 | ||||||
Cloudflare Inc, Cl A * | 4,382 | 308 | ||||||
Crowdstrike Holdings Inc, Cl A * | 23,830 | 4,349 | ||||||
Dropbox Inc, Cl A * | 17,033 | 454 | ||||||
EPAM Systems Inc * | 18,381 | 7,292 | ||||||
Fiserv Inc, Cl A * | 95,993 | 11,427 | ||||||
Five9 Inc * | 20,059 | 3,136 | ||||||
Fortinet Inc * | 11,266 | 2,078 | ||||||
HP Inc | 77,023 | 2,446 | ||||||
Intuit Inc | 51,247 | 19,631 | ||||||
KLA Corp | 7,571 | 2,501 | ||||||
Lam Research Corp | 3,874 | 2,306 | ||||||
Manhattan Associates Inc * | 3,132 | 368 | ||||||
Mastercard Inc, Cl A | 93,573 | 33,317 | ||||||
Microsoft Corp | 625,099 | 147,380 | ||||||
Monolithic Power Systems Inc | 3,297 | 1,164 | ||||||
NetApp Inc | 5,151 | 374 | ||||||
NVIDIA Corp | 36,311 | 19,387 | ||||||
NXP Semiconductors NV | 56,823 | 11,441 | ||||||
ON Semiconductor Corp * | 11,870 | 494 | ||||||
| Description | Shares | Market Value ($ Thousands) | ||||||
COMMON STOCK (continued) | ||||||||
Oracle Corp, Cl B | 206,020 | $ | 14,456 | |||||
Paycom Software Inc * | 17,434 | 6,452 | ||||||
PayPal Holdings Inc * | 148,411 | 36,040 | ||||||
Qorvo Inc * | 26,941 | 4,922 | ||||||
QUALCOMM Inc | 85,084 | 11,281 | ||||||
RingCentral Inc, Cl A * | 13,839 | 4,122 | ||||||
salesforce.com * | 80,307 | 17,015 | ||||||
ServiceNow Inc * | 22,029 | 11,017 | ||||||
Skyworks Solutions Inc | 1,786 | 328 | ||||||
Taiwan Semiconductor Manufacturing Co Ltd ADR | 61,462 | 7,270 | ||||||
Trade Desk Inc/The, Cl A * | 3,945 | 2,571 | ||||||
Ubiquiti Inc | 1,203 | 359 | ||||||
VeriSign Inc * | 2,134 | 424 | ||||||
Visa Inc, Cl A | 191,735 | 40,596 | ||||||
|
|
| ||||||
| 675,593 | ||||||||
|
|
| ||||||
Materials — 2.7% |
| |||||||
Ecolab Inc | 12,684 | 2,716 | ||||||
Freeport-McMoRan Inc, Cl B | 267,879 | 8,821 | ||||||
Linde PLC | 29,987 | 8,400 | ||||||
Mosaic Co/The | 76,656 | 2,423 | ||||||
Sherwin-Williams Co/The, Cl A | 30,486 | 22,499 | ||||||
|
|
| ||||||
| 44,859 | ||||||||
|
|
| ||||||
Total Common Stock | 1,650,549 | |||||||
|
|
| ||||||
AFFILIATED PARTNERSHIP — 0.4% |
| |||||||
SEI Liquidity Fund, L.P. | ||||||||
0.020% **†(B) | 6,774,096 | 6,775 | ||||||
|
|
| ||||||
Total Affiliated Partnership | 6,775 | |||||||
|
|
| ||||||
CASH EQUIVALENT — 1.3% |
| |||||||
SEI Daily Income Trust, Government Fund, Cl F | ||||||||
0.010%**† | 22,100,043 | 22,100 | ||||||
|
|
| ||||||
Total Cash Equivalent (Cost $22,100) ($ Thousands) | 22,100 | |||||||
|
|
| ||||||
Total Investments in Securities — 100.4% |
| |||||||
(Cost $792,335) ($ Thousands) |
| $ | 1,679,424 | |||||
|
|
| ||||||
| 2 | SEI Institutional Managed Trust / Semi-Annual Report / March 31, 2021 |
SCHEDULE OF INVESTMENTS (Unaudited)
March 31, 2021
Large Cap Growth Fund (Continued)
A list of the open futures contracts held by the Fund at March 31, 2021, is as follows:
Type of Contract | Number of Contracts Long | Expiration Date | Notional Amount (Thousands) | Value (Thousands) | Unrealized Appreciation (Thousands) | |||||||||||||||
S&P 500 Index E-MINI | 50 | Jun-2021 | $ | 16,907 | $ | 17,060 | $ | 153 | ||||||||||||
|
| |||||||||||||||||||
Percentages are based on Net Assets of $1,673,016 ($ Thousands). |
| * | Non-income producing security. |
| ** | Rate shown is the 7-day effective yield as of March 31, 2021. |
| † | Investment in Affiliated Security (see Note 6). |
| (A) | Certain securities or partial positions of certain securities are on loan at March 31, 2021 (see Note 10). The total market value of securities on loan at March 31, 2021 was $6,907 ($ Thousands). |
| (B) | This security was purchased with cash collateral held from securities on loan (see Note 10). The total market value of such securities as of March 31, 2021 was $6,775 ($ Thousands). |
ADR — American Depositary Receipt
Cl — Class
L.P. — Limited Partnership
PLC — Public Limited Company
S&P — Standard & Poor’s
The following is a list of the level of inputs used as of March 31, 2021, in valuing the Fund’s investments and other financial instruments carried at value ($ Thousands):
| Investments in Securities | Level 1 ($) | Level 2 ($) | Level 3 ($) | Total ($) | ||||||||||||
Common Stock | 1,650,549 | – | – | 1,650,549 | ||||||||||||
Affiliated Partnership | – | 6,775 | – | 6,775 | ||||||||||||
Cash Equivalent | 22,100 | – | – | 22,100 | ||||||||||||
|
|
|
|
|
|
|
|
|
|
|
| |||||
Total Investments in Securities | 1,672,649 | 6,775 | – | 1,679,424 | ||||||||||||
|
|
|
|
|
|
|
|
|
|
|
| |||||
| Other Financial Instruments | Level 1 ($) | Level 2 ($) | Level 3 ($) | Total ($) | ||||||||||||
Futures Contracts* | ||||||||||||||||
Unrealized Appreciation | 153 | – | – | 153 | ||||||||||||
|
|
|
|
|
|
|
|
|
|
|
| |||||
Total Other Financial Instruments | 153 | – | – | 153 | ||||||||||||
|
|
|
|
|
|
|
|
|
|
|
| |||||
* Futures contracts are valued at the unrealized appreciation on the instrument.
For the period ended March 31, 2021, there were no transfers in or out of Level 3.
For more information on valuation inputs, see Note 2 — Significant Accounting Policies in Notes to Financial Statements.
The following is a summary of the Fund’s transactions with affiliates for the period ended March 31, 2021 ($ Thousands):
| Security Description | Value 9/30/2020 | Purchases at Cost | Proceeds from Sales | Realized Gain (Loss) | Change in Unrealized Appreciation (Depreciation) | Value 3/31/2021 | Shares | Income | Capital Gains | |||||||||
SEI Liquidity Fund, L.P. | $ 9,033 | $41,187 | $(43,448) | $1 | $2 | $ 6,775 | 6,774,096 | $4 | $— | |||||||||
SEI Daily Income Trust, Government Fund, Cl F | 15,424 | 140,368 | (133,692) | — | — | 22,100 | 22,100,043 | 1 | — | |||||||||
|
|
|
|
|
|
|
| |||||||||||
Totals | $ 24,457 | $181,555 | $(177,140) | $1 | $2 | $ 28,875 | $5 | $— | ||||||||||
|
|
|
|
|
|
|
|
Amounts designated as “—” are either $0 or have been rounded to $0.
The accompanying notes are an integral part of the financial statements.
SEI Institutional Managed Trust / Semi-Annual Report / March 31, 2021 | 3 |
SCHEDULE OF INVESTMENTS (Unaudited)
March 31, 2021
Large Cap Index Fund (Continued)
| Description | Shares | Market Value ($ Thousands) | ||||||
COMMON STOCK — 99.2% |
| |||||||
Communication Services — 10.4% |
| |||||||
Activision Blizzard Inc | 18,408 | $ | 1,712 | |||||
Alphabet Inc, Cl A * | 7,220 | 14,891 | ||||||
Alphabet Inc, Cl C * | 6,994 | 14,468 | ||||||
Altice USA Inc, Cl A * | 5,400 | 176 | ||||||
AT&T Inc | 172,090 | 5,209 | ||||||
Cable One Inc | 123 | 225 | ||||||
Charter Communications Inc, Cl A * | 3,410 | 2,104 | ||||||
Comcast Corp, Cl A | 109,467 | 5,923 | ||||||
Discovery Inc, Cl A * | 3,600 | 157 | ||||||
Discovery Inc, Cl C * | 7,517 | 277 | ||||||
DISH Network Corp, Cl A * | 6,011 | 218 | ||||||
Electronic Arts Inc | 6,869 | 930 | ||||||
Facebook Inc, Cl A * | 58,043 | 17,095 | ||||||
Fox Corp | 12,031 | 430 | ||||||
IAC/InterActiveCorp * | 1,820 | 394 | ||||||
Interpublic Group of Cos Inc/The | 9,500 | 277 | ||||||
John Wiley & Sons Inc, Cl A | 900 | 49 | ||||||
Liberty Broadband Corp, Cl A * | 600 | 87 | ||||||
Liberty Broadband Corp, Cl C * | 3,863 | 580 | ||||||
Liberty Media Corp-Liberty Formula One, Cl A * | 500 | 19 | ||||||
Liberty Media Corp-Liberty Formula One, Cl C * | 4,900 | 212 | ||||||
Liberty Media Corp-Liberty SiriusXM * | 5,998 | 264 | ||||||
Lions Gate Entertainment Corp, Cl A * | 1,300 | 19 | ||||||
Lions Gate Entertainment Corp, Cl B * | 3,000 | 39 | ||||||
Live Nation Entertainment Inc * | 3,490 | 295 | ||||||
Lumen Technologies Inc | 26,195 | 350 | ||||||
Madison Square Garden Entertainment Corp * | 407 | 33 | ||||||
Madison Square Garden Sports Corp * | 407 | 73 | ||||||
Match Group Inc * | 5,337 | 733 | ||||||
Netflix Inc * | 10,235 | 5,339 | ||||||
New York Times Co/The, Cl A | 3,900 | 197 | ||||||
News Corp, Cl A | 9,500 | 242 | ||||||
News Corp, Cl B | 3,200 | 75 | ||||||
Nexstar Media Group Inc, Cl A | 1,000 | 140 | ||||||
Omnicom Group Inc | 5,026 | 373 | ||||||
Pinterest Inc, Cl A * | 9,600 | 711 | ||||||
Playtika Holding Corp * | 1,800 | 49 | ||||||
Roku Inc, Cl A * | 2,600 | 847 | ||||||
Sirius XM Holdings Inc | 27,818 | 169 | ||||||
Spotify Technology SA * | 3,260 | 874 | ||||||
Take-Two Interactive Software Inc, Cl A * | 2,787 | 493 | ||||||
Telephone and Data Systems Inc | 2,700 | 62 | ||||||
T-Mobile US Inc * | 13,259 | 1,661 | ||||||
TripAdvisor Inc * | 2,400 | 129 | ||||||
Twitter Inc * | 18,680 | 1,189 | ||||||
United States Cellular Corp * | 345 | 13 | ||||||
Verizon Communications Inc | 99,949 | 5,812 | ||||||
ViacomCBS Inc | 219 | 10 | ||||||
| Description | Shares | Market Value ($ Thousands) | ||||||
COMMON STOCK (continued) | ||||||||
ViacomCBS Inc, Cl B | 13,592 | $ | 613 | |||||
Walt Disney Co/The | 43,632 | 8,051 | ||||||
World Wrestling Entertainment Inc, Cl A | 1,200 | 65 | ||||||
Zillow Group Inc, Cl A * | 1,400 | 184 | ||||||
Zillow Group Inc, Cl C * | 3,500 | 454 | ||||||
Zynga Inc, Cl A * | 21,500 | 220 | ||||||
| 95,211 | ||||||||
Consumer Discretionary — 12.0% |
| |||||||
Advance Auto Parts Inc | 1,575 | 289 | ||||||
Amazon.com Inc, Cl A * | 10,233 | 31,662 | ||||||
Aptiv PLC * | 6,414 | 884 | ||||||
Aramark | 5,291 | 200 | ||||||
AutoNation Inc * | 1,300 | 121 | ||||||
AutoZone Inc * | 574 | 806 | ||||||
Best Buy Co Inc | 5,480 | 629 | ||||||
Booking Holdings Inc * | 980 | 2,283 | ||||||
BorgWarner Inc | 5,900 | 274 | ||||||
Bright Horizons Family Solutions Inc * | 1,400 | 240 | ||||||
Brunswick Corp/DE | 1,900 | 181 | ||||||
Burlington Stores Inc * | 1,553 | 464 | ||||||
Capri Holdings Ltd * | 3,500 | 179 | ||||||
CarMax Inc * | 3,900 | 517 | ||||||
Carnival Corp * | 14,527 | 386 | ||||||
Carter’s Inc | 1,000 | 89 | ||||||
Carvana Co, Cl A * | 1,400 | 367 | ||||||
Chegg Inc * | 3,200 | 274 | ||||||
Chipotle Mexican Grill Inc, Cl A * | 662 | 941 | ||||||
Choice Hotels International Inc | 828 | 89 | ||||||
Columbia Sportswear Co | 700 | 74 | ||||||
Darden Restaurants Inc | 3,133 | 445 | ||||||
Dick’s Sporting Goods Inc | 1,592 | 121 | ||||||
Dollar General Corp | 5,996 | 1,215 | ||||||
Dollar Tree Inc * | 5,618 | 643 | ||||||
Domino’s Pizza Inc | 971 | 357 | ||||||
DR Horton Inc | 7,974 | 711 | ||||||
eBay Inc | 15,706 | 962 | ||||||
Etsy Inc * | 2,900 | 585 | ||||||
Expedia Group Inc | 3,343 | 575 | ||||||
Extended Stay America Inc | 4,400 | 87 | ||||||
Five Below Inc * | 1,283 | 245 | ||||||
Floor & Decor Holdings Inc, Cl A * | 2,200 | 210 | ||||||
Foot Locker Inc, Cl A | 2,500 | 141 | ||||||
Ford Motor Co * | 94,085 | 1,153 | ||||||
frontdoor Inc * | 2,094 | 113 | ||||||
Gap Inc/The | 4,400 | 131 | ||||||
Garmin Ltd | 3,600 | 475 | ||||||
General Motors Co | 30,191 | 1,735 | ||||||
Gentex Corp | 6,035 | 215 | ||||||
Genuine Parts Co | 3,376 | 390 | ||||||
Graham Holdings Co, Cl B | 78 | 44 | ||||||
Grand Canyon Education Inc * | 1,100 | 118 | ||||||
Grubhub Inc * | 2,100 | 126 | ||||||
SEI Institutional Managed Trust / Semi-Annual Report / March 31, 2021 | 1 |
SCHEDULE OF INVESTMENTS (Unaudited)
March 31, 2021
Large Cap Index Fund (Continued)
| Description | Shares | Market Value ($ Thousands) | ||||||
COMMON STOCK (continued) |
| |||||||
H&R Block Inc | 4,500 | $ | 98 | |||||
Hanesbrands Inc | 8,600 | 169 | ||||||
Harley-Davidson Inc, Cl A | 3,800 | 152 | ||||||
Hasbro Inc | 3,002 | 289 | ||||||
Hilton Worldwide Holdings Inc * | 6,537 | 790 | ||||||
Home Depot Inc/The | 25,982 | 7,931 | ||||||
Hyatt Hotels Corp, Cl A | 894 | 74 | ||||||
Kohl’s Corp | 3,825 | 228 | ||||||
L Brands Inc * | 5,600 | 346 | ||||||
Las Vegas Sands Corp | 7,946 | 483 | ||||||
Lear Corp | 1,450 | 263 | ||||||
Leggett & Platt Inc | 3,100 | 142 | ||||||
Lennar Corp, Cl A | 6,528 | 661 | ||||||
Lennar Corp, Cl B | 450 | 37 | ||||||
Leslie’s Inc * | 2,000 | 49 | ||||||
LKQ Corp * | 7,289 | 309 | ||||||
Lowe’s Cos Inc | 17,759 | 3,377 | ||||||
Lululemon Athletica Inc * | 2,730 | 837 | ||||||
Marriott International Inc/MD, Cl A | 6,455 | 956 | ||||||
Mattel Inc * | 8,100 | 161 | ||||||
McDonald’s Corp | 17,942 | 4,022 | ||||||
MGM Resorts International | 11,353 | 431 | ||||||
Mohawk Industries Inc * | 1,359 | 261 | ||||||
Newell Brands Inc, Cl B | 8,970 | 240 | ||||||
NIKE Inc, Cl B | 29,943 | 3,979 | ||||||
Nordstrom Inc * | 2,700 | 102 | ||||||
Norwegian Cruise Line Holdings Ltd * | 8,677 | 239 | ||||||
NVR Inc * | 84 | 396 | ||||||
Ollie’s Bargain Outlet Holdings Inc * | 1,400 | 122 | ||||||
O’Reilly Automotive Inc * | 1,685 | 855 | ||||||
Peloton Interactive Inc, Cl A * | 6,100 | 686 | ||||||
Penske Automotive Group Inc, Cl A | 800 | 64 | ||||||
Petco Health & Wellness Co Inc, Cl A * | 1,300 | 29 | ||||||
Planet Fitness Inc, Cl A * | 2,000 | 155 | ||||||
Polaris Inc | 1,431 | 191 | ||||||
Pool Corp | 896 | 309 | ||||||
PulteGroup Inc | 6,300 | 330 | ||||||
PVH Corp | 1,649 | 174 | ||||||
Qurate Retail Inc | 9,165 | 108 | ||||||
Ralph Lauren Corp, Cl A | 1,136 | 140 | ||||||
Ross Stores Inc | 8,444 | 1,013 | ||||||
Royal Caribbean Cruises Ltd | 4,723 | 404 | ||||||
Service Corp International/US | 4,100 | 209 | ||||||
Six Flags Entertainment Corp | 1,900 | 88 | ||||||
Skechers USA Inc, Cl A * | 3,032 | 126 | ||||||
Starbucks Corp | 28,162 | 3,077 | ||||||
Tapestry Inc * | 6,708 | 276 | ||||||
Target Corp, Cl A | 12,069 | 2,390 | ||||||
Tempur Sealy International Inc | 4,700 | 172 | ||||||
Terminix Global Holdings Inc * | 3,200 | 153 | ||||||
Tesla Inc * | 18,475 | 12,340 | ||||||
Thor Industries Inc | 1,300 | 175 | ||||||
| Description | Shares | Market Value ($ Thousands) | ||||||
COMMON STOCK (continued) |
| |||||||
TJX Cos Inc/The | 28,944 | $ | 1,915 | |||||
Toll Brothers Inc | 2,800 | 159 | ||||||
Tractor Supply Co | 2,800 | 496 | ||||||
Travel + Leisure Co | 2,063 | 126 | ||||||
Ulta Beauty Inc * | 1,281 | 396 | ||||||
Under Armour Inc, Cl A * | 4,715 | 105 | ||||||
Under Armour Inc, Cl C * | 5,100 | 94 | ||||||
Vail Resorts Inc | 970 | 283 | ||||||
VF Corp | 7,757 | 620 | ||||||
Vroom Inc * | 2,500 | 97 | ||||||
Wayfair Inc, Cl A * | 1,675 | 527 | ||||||
Wendy’s Co/The | 4,300 | 87 | ||||||
Whirlpool Corp | 1,538 | 339 | ||||||
Williams-Sonoma Inc | 1,900 | 340 | ||||||
Wyndham Hotels & Resorts Inc | 2,163 | 151 | ||||||
Wynn Resorts Ltd | 2,515 | 315 | ||||||
Yum China Holdings Inc | 9,585 | 568 | ||||||
Yum! Brands Inc | 7,209 | 780 | ||||||
| 109,752 | ||||||||
Consumer Staples — 5.8% | ||||||||
Albertsons Cos Inc (A) | 3,700 | 70 | ||||||
Altria Group Inc | 44,850 | 2,295 | ||||||
Archer-Daniels-Midland Co | 13,271 | 756 | ||||||
Beyond Meat Inc * | 1,200 | 156 | ||||||
Boston Beer Co Inc/The, Cl A * | 210 | 253 | ||||||
Brown-Forman Corp, Cl A | 1,040 | 66 | ||||||
Brown-Forman Corp, Cl B | 4,422 | 305 | ||||||
Bunge Ltd | 3,300 | 262 | ||||||
Campbell Soup Co | 4,600 | 231 | ||||||
Casey’s General Stores Inc | 896 | 194 | ||||||
Church & Dwight Co Inc | 5,910 | 516 | ||||||
Clorox Co/The | 3,071 | 592 | ||||||
Coca-Cola Co/The | 93,238 | 4,915 | ||||||
Colgate-Palmolive Co | 20,279 | 1,599 | ||||||
Conagra Brands Inc | 11,749 | 442 | ||||||
Constellation Brands Inc, Cl A | 3,920 | 894 | ||||||
Costco Wholesale Corp | 10,675 | 3,763 | ||||||
Coty Inc, Cl A | 7,739 | 70 | ||||||
Energizer Holdings Inc | 1,600 | 76 | ||||||
Estee Lauder Cos Inc/The, Cl A | 5,475 | 1,592 | ||||||
Flowers Foods Inc | 4,900 | 117 | ||||||
General Mills Inc | 14,543 | 892 | ||||||
Grocery Outlet Holding Corp * | 1,700 | 63 | ||||||
Hain Celestial Group Inc/The * | 2,100 | 92 | ||||||
Herbalife Nutrition Ltd * | 2,274 | 101 | ||||||
Hershey Co/The | 3,510 | 555 | ||||||
Hormel Foods Corp | 6,737 | 322 | ||||||
Ingredion Inc | 1,610 | 145 | ||||||
J M Smucker Co/The | 2,654 | 336 | ||||||
Kellogg Co | 6,085 | 385 | ||||||
Keurig Dr Pepper Inc | 16,685 | 573 | ||||||
Kimberly-Clark Corp | 8,226 | 1,144 | ||||||
| 2 | SEI Institutional Managed Trust / Semi-Annual Report / March 31, 2021 |
SCHEDULE OF INVESTMENTS (Unaudited)
March 31, 2021
Large Cap Index Fund (Continued)
| Description | Shares | Market Value ($ Thousands) | ||||||
COMMON STOCK (continued) | ||||||||
Kraft Heinz Co/The | 15,649 | $ | 626 | |||||
Kroger Co/The | 18,388 | 662 | ||||||
Lamb Weston Holdings Inc | 3,500 | 271 | ||||||
McCormick & Co Inc/MD | 5,982 | 533 | ||||||
Molson Coors Beverage Co, Cl B | 4,395 | 225 | ||||||
Mondelez International Inc, Cl A | 33,825 | 1,980 | ||||||
Monster Beverage Corp * | 8,877 | 809 | ||||||
Nu Skin Enterprises Inc, Cl A | 1,200 | 63 | ||||||
PepsiCo Inc | 33,514 | 4,740 | ||||||
Philip Morris International Inc | 37,537 | 3,331 | ||||||
Pilgrim’s Pride Corp * | 1,300 | 31 | ||||||
Post Holdings Inc * | 1,507 | 159 | ||||||
Procter & Gamble Co/The | 58,808 | 7,964 | ||||||
Reynolds Consumer Products Inc | 1,200 | 36 | ||||||
Seaboard Corp | 4 | 15 | ||||||
Spectrum Brands Holdings Inc | 957 | 81 | ||||||
Sprouts Farmers Market Inc * | 3,100 | 82 | ||||||
Sysco Corp, Cl A | 11,663 | 918 | ||||||
TreeHouse Foods Inc * | 1,400 | 73 | ||||||
Tyson Foods Inc, Cl A | 6,971 | 518 | ||||||
US Foods Holding Corp * | 5,197 | 198 | ||||||
Walgreens Boots Alliance Inc | 17,341 | 952 | ||||||
Walmart Inc | 33,664 | 4,573 | ||||||
| 52,612 | ||||||||
Energy — 2.6% | ||||||||
Antero Midstream Corp | 6,300 | 57 | ||||||
APA | 9,200 | 165 | ||||||
Baker Hughes Co, Cl A | 15,602 | 337 | ||||||
Cabot Oil & Gas Corp | 9,200 | 173 | ||||||
Cheniere Energy Inc * | 5,573 | 401 | ||||||
Chevron Corp | 46,503 | 4,873 | ||||||
Cimarex Energy Co | 2,544 | 151 | ||||||
ConocoPhillips | 32,806 | 1,738 | ||||||
Continental Resources Inc/OK, Cl A | 1,800 | 47 | ||||||
Devon Energy Corp | 14,361 | 314 | ||||||
Diamondback Energy Inc, Cl A | 4,029 | 296 | ||||||
EOG Resources Inc | 14,015 | 1,016 | ||||||
EQT Corp * | 6,967 | 129 | ||||||
Equitrans Midstream Corp | 9,660 | 79 | ||||||
Exxon Mobil Corp | 102,066 | 5,698 | ||||||
Halliburton Co | 21,145 | 454 | ||||||
Helmerich & Payne Inc | 2,623 | 71 | ||||||
Hess Corp | 6,600 | 467 | ||||||
HollyFrontier Corp | 3,400 | 122 | ||||||
Kinder Morgan Inc | 46,534 | 775 | ||||||
Marathon Oil Corp | 19,492 | 208 | ||||||
Marathon Petroleum Corp | 15,512 | 830 | ||||||
Murphy Oil Corp | 3,600 | 59 | ||||||
NOV Inc | 9,100 | 125 | ||||||
Occidental Petroleum Corp | 20,223 | 538 | ||||||
ONEOK Inc | 10,761 | 545 | ||||||
Phillips 66 | 10,462 | 853 | ||||||
| Description | Shares | Market Value ($ Thousands) | ||||||
COMMON STOCK (continued) | ||||||||
Pioneer Natural Resources Co | 4,875 | $ | 774 | |||||
Schlumberger NV, Cl A | 33,273 | 905 | ||||||
Targa Resources Corp | 5,300 | 168 | ||||||
Valero Energy Corp | 9,722 | 696 | ||||||
Williams Cos Inc/The | 28,973 | 686 | ||||||
| 23,750 | ||||||||
Financials — 11.3% | ||||||||
Affiliated Managers Group Inc | 1,033 | 154 | ||||||
Aflac Inc | 16,633 | 851 | ||||||
AGNC Investment Corp ‡ | 13,328 | 223 | ||||||
Alleghany Corp * | 326 | 204 | ||||||
Allstate Corp/The | 7,323 | 841 | ||||||
Ally Financial Inc | 9,058 | 409 | ||||||
American Express Co | 15,781 | 2,232 | ||||||
American Financial Group Inc/OH | 1,743 | 199 | ||||||
American International Group Inc | 20,803 | 961 | ||||||
American National Group Inc | 124 | 13 | ||||||
Ameriprise Financial Inc | 2,832 | 658 | ||||||
Annaly Capital Management Inc ‡ | 33,974 | 292 | ||||||
Aon PLC, Cl A | 5,525 | 1,271 | ||||||
Apollo Global Management Inc, Cl A | 4,100 | 193 | ||||||
Arch Capital Group Ltd * | 9,589 | 368 | ||||||
Ares Management Corp, Cl A | 2,400 | 134 | ||||||
Arthur J Gallagher & Co | 4,566 | 570 | ||||||
Associated Banc-Corp | 3,500 | 75 | ||||||
Assurant Inc | 1,400 | 198 | ||||||
Assured Guaranty Ltd | 1,700 | 72 | ||||||
Athene Holding Ltd, Cl A * | 2,800 | 141 | ||||||
Axis Capital Holdings Ltd | 2,023 | 100 | ||||||
Bank of America Corp | 186,741 | 7,225 | ||||||
Bank of Hawaii Corp | 948 | 85 | ||||||
Bank of New York Mellon Corp/The | 19,385 | 917 | ||||||
Bank OZK | 3,000 | 123 | ||||||
Berkshire Hathaway Inc, Cl B * | 45,472 | 11,617 | ||||||
BlackRock Inc | 3,571 | 2,692 | ||||||
BOK Financial Corp | 800 | 71 | ||||||
Brighthouse Financial Inc * | 2,100 | 93 | ||||||
Brown & Brown Inc | 5,700 | 261 | ||||||
Capital One Financial Corp | 10,878 | 1,384 | ||||||
Carlyle Group Inc/The | 2,900 | 107 | ||||||
Cboe Global Markets Inc | 2,600 | 257 | ||||||
Charles Schwab Corp/The | 33,216 | 2,165 | ||||||
Chubb Ltd | 10,957 | 1,731 | ||||||
Cincinnati Financial Corp | 3,600 | 371 | ||||||
Citigroup Inc | 50,185 | 3,651 | ||||||
Citizens Financial Group Inc | 10,259 | 453 | ||||||
CME Group Inc | 8,556 | 1,747 | ||||||
CNA Financial Corp | 852 | 38 | ||||||
Comerica Inc | 3,353 | 241 | ||||||
Commerce Bancshares Inc/MO | 2,443 | 187 | ||||||
Credit Acceptance Corp, Cl A * | 217 | 78 | ||||||
Cullen/Frost Bankers Inc | 1,414 | 154 | ||||||
SEI Institutional Managed Trust / Semi-Annual Report / March 31, 2021 | 3 |
SCHEDULE OF INVESTMENTS (Unaudited)
March 31, 2021
Large Cap Index Fund (Continued)
| Description | Shares | Market Value ($ Thousands) | ||||||
COMMON STOCK (continued) | ||||||||
Discover Financial Services | 7,320 | $ | 695 | |||||
East West Bancorp Inc | 3,400 | 251 | ||||||
Equitable Holdings Inc | 9,800 | 320 | ||||||
Erie Indemnity Co, Cl A | 600 | 133 | ||||||
Evercore Inc, Cl A | 983 | 129 | ||||||
Everest Re Group Ltd | 1,009 | 250 | ||||||
FactSet Research Systems Inc | 898 | 277 | ||||||
Fidelity National Financial Inc | 6,710 | 273 | ||||||
Fifth Third Bancorp | 17,000 | 637 | ||||||
First American Financial Corp | 2,700 | 153 | ||||||
First Citizens BancShares Inc/NC, Cl A | 149 | 124 | ||||||
First Hawaiian Inc | 3,200 | 88 | ||||||
First Horizon Corp | 13,400 | 227 | ||||||
First Republic Bank/CA | 4,153 | 692 | ||||||
FNB Corp/PA | 8,200 | 104 | ||||||
Franklin Resources Inc | 6,700 | 198 | ||||||
Globe Life Inc | 2,501 | 242 | ||||||
GoHealth Inc, Cl A * | 900 | 10 | ||||||
Goldman Sachs Group Inc/The | 7,965 | 2,605 | ||||||
Hanover Insurance Group Inc/The, Cl A | 889 | 115 | ||||||
Hartford Financial Services Group Inc/The | 8,559 | 572 | ||||||
Huntington Bancshares Inc/OH | 24,377 | 383 | ||||||
Interactive Brokers Group Inc, Cl A | 1,821 | 133 | ||||||
Intercontinental Exchange Inc | 13,412 | 1,498 | ||||||
Invesco Ltd | 8,857 | 223 | ||||||
Jefferies Financial Group Inc | 5,400 | 162 | ||||||
JPMorgan Chase & Co | 73,100 | 11,128 | ||||||
Kemper Corp, Cl A | 1,555 | 124 | ||||||
KeyCorp | 23,488 | 469 | ||||||
KKR & Co Inc | 13,000 | 635 | ||||||
Lazard Ltd, Cl A (B) | 2,500 | 109 | ||||||
Lemonade Inc * | 800 | 74 | ||||||
LendingTree Inc * | 300 | 64 | ||||||
Lincoln National Corp | 4,577 | 285 | ||||||
Loews Corp | 5,489 | 281 | ||||||
LPL Financial Holdings Inc | 1,900 | 270 | ||||||
M&T Bank Corp | 3,078 | 467 | ||||||
Markel Corp * | 320 | 365 | ||||||
MarketAxess Holdings Inc | 911 | 454 | ||||||
Marsh & McLennan Cos Inc | 12,195 | 1,485 | ||||||
Mercury General Corp | 800 | 49 | ||||||
MetLife Inc | 18,315 | 1,113 | ||||||
MGIC Investment Corp | 8,400 | 116 | ||||||
Moody’s Corp | 3,886 | 1,160 | ||||||
Morgan Stanley | 33,783 | 2,624 | ||||||
Morningstar Inc, Cl A | 500 | 112 | ||||||
MSCI Inc, Cl A | 1,927 | 808 | ||||||
Nasdaq Inc, Cl A | 2,800 | 413 | ||||||
New Residential Investment Corp ‡ | 10,040 | 113 | ||||||
New York Community Bancorp Inc | 11,300 | 143 | ||||||
Northern Trust Corp | 4,650 | 489 | ||||||
Old Republic International Corp | 7,000 | 153 | ||||||
| Description | Shares | Market Value ($ Thousands) | ||||||
COMMON STOCK (continued) | ||||||||
OneMain Holdings Inc, Cl A | 1,681 | $ | 90 | |||||
PacWest Bancorp | 3,000 | 114 | ||||||
People’s United Financial Inc | 10,124 | 181 | ||||||
Pinnacle Financial Partners Inc | 1,800 | 160 | ||||||
PNC Financial Services Group Inc/The | 10,254 | 1,799 | ||||||
Popular Inc | 1,900 | 134 | ||||||
Primerica Inc | 981 | 145 | ||||||
Principal Financial Group Inc, Cl A | 6,434 | 386 | ||||||
Progressive Corp/The | 14,107 | 1,349 | ||||||
Prosperity Bancshares Inc | 2,200 | 165 | ||||||
Prudential Financial Inc | 9,469 | 863 | ||||||
Raymond James Financial Inc | 2,970 | 364 | ||||||
Regions Financial Corp | 23,212 | 480 | ||||||
Reinsurance Group of America Inc, Cl A | 1,624 | 205 | ||||||
RenaissanceRe Holdings Ltd | 1,175 | 188 | ||||||
Rocket Cos Inc, Cl A | 2,900 | 67 | ||||||
S&P Global Inc | 5,799 | 2,046 | ||||||
Santander Consumer USA Holdings Inc | 1,800 | 49 | ||||||
SEI Investments Co † | 2,800 | 171 | ||||||
Signature Bank/New York NY, Cl B | 1,378 | 312 | ||||||
SLM Corp | 9,140 | 164 | ||||||
Starwood Property Trust Inc ‡ | 6,800 | 168 | ||||||
State Street Corp | 8,409 | 706 | ||||||
Sterling Bancorp/DE | 4,900 | 113 | ||||||
SVB Financial Group, Cl B * | 1,264 | 624 | ||||||
Synchrony Financial | 14,156 | 576 | ||||||
Synovus Financial Corp | 3,600 | 165 | ||||||
T Rowe Price Group Inc | 5,471 | 939 | ||||||
TCF Financial Corp | 3,717 | 173 | ||||||
TFS Financial Corp | 1,417 | 29 | ||||||
Tradeweb Markets Inc, Cl A | 2,100 | 155 | ||||||
Travelers Cos Inc/The | 6,108 | 919 | ||||||
Truist Financial Corp | 32,384 | 1,889 | ||||||
Umpqua Holdings Corp | 5,419 | 95 | ||||||
Unum Group | 4,875 | 136 | ||||||
Upstart Holdings Inc * | 300 | 39 | ||||||
US Bancorp | 32,680 | 1,807 | ||||||
Virtu Financial Inc, Cl A | 1,400 | 43 | ||||||
Voya Financial Inc | 2,900 | 185 | ||||||
W R Berkley Corp | 3,300 | 249 | ||||||
Webster Financial Corp | 2,200 | 121 | ||||||
Wells Fargo & Co | 91,491 | 3,574 | ||||||
Western Alliance Bancorp | 2,300 | 217 | ||||||
White Mountains Insurance Group Ltd | 95 | 106 | ||||||
Willis Towers Watson PLC | 3,086 | 706 | ||||||
Wintrust Financial Corp | 1,300 | 99 | ||||||
Zions Bancorp NA | 3,900 | 214 | ||||||
| 103,283 | ||||||||
Health Care — 13.0% | ||||||||
10X Genomics Inc, Cl A * | 1,400 | 253 | ||||||
Abbott Laboratories | 41,740 | 5,002 | ||||||
AbbVie Inc | 42,561 | 4,606 | ||||||
| 4 | SEI Institutional Managed Trust / Semi-Annual Report / March 31, 2021 |
SCHEDULE OF INVESTMENTS (Unaudited)
March 31, 2021
Large Cap Index Fund (Continued)
| Description | Shares | Market Value ($ Thousands) | ||||||
COMMON STOCK (continued) | ||||||||
ABIOMED Inc * | 1,048 | $ | 334 | |||||
Acadia Healthcare Co Inc, Cl A * | 2,100 | 120 | ||||||
ACADIA Pharmaceuticals Inc * | 2,800 | 72 | ||||||
Acceleron Pharma Inc * | 1,200 | 163 | ||||||
Adaptive Biotechnologies Corp * | 1,800 | 73 | ||||||
Agilent Technologies Inc | 7,379 | 938 | ||||||
Agios Pharmaceuticals Inc * | 1,400 | 72 | ||||||
Alexion Pharmaceuticals Inc * | 5,101 | 780 | ||||||
Align Technology Inc * | 1,858 | 1,006 | ||||||
Alkermes PLC * | 3,700 | 69 | ||||||
Alnylam Pharmaceuticals Inc * | 2,774 | 392 | ||||||
Amedisys Inc * | 800 | 212 | ||||||
American Well Corp, Cl A * | 1,500 | 26 | ||||||
AmerisourceBergen Corp, Cl A | 3,495 | 413 | ||||||
Amgen Inc, Cl A | 14,096 | 3,507 | ||||||
Anthem Inc | 6,007 | 2,156 | ||||||
Avantor Inc * | 12,020 | 348 | ||||||
Baxter International Inc | 12,228 | 1,031 | ||||||
Becton Dickinson and Co | 6,953 | 1,691 | ||||||
Berkeley Lights Inc * | 700 | 35 | ||||||
Biogen Inc * | 3,663 | 1,025 | ||||||
BioMarin Pharmaceutical Inc * | 4,337 | 328 | ||||||
Bio-Rad Laboratories Inc, Cl A * | 500 | 286 | ||||||
Bio-Techne Corp | 918 | 351 | ||||||
Bluebird Bio Inc * | 1,500 | 45 | ||||||
Boston Scientific Corp * | 34,496 | 1,333 | ||||||
Bristol-Myers Squibb Co | 54,642 | 3,450 | ||||||
Bruker Corp | 2,400 | 154 | ||||||
Cardinal Health Inc | 7,100 | 431 | ||||||
Catalent Inc * | 3,923 | 413 | ||||||
Centene Corp * | 13,795 | 882 | ||||||
Cerner Corp | 7,300 | 525 | ||||||
Certara Inc * | 800 | 22 | ||||||
Change Healthcare Inc * | 6,035 | 133 | ||||||
Charles River Laboratories International Inc * | 1,200 | 348 | ||||||
Chemed Corp | 415 | 191 | ||||||
Cigna Corp | 8,344 | 2,017 | ||||||
Cooper Cos Inc/The, Cl A | 1,158 | 445 | ||||||
CVS Health Corp | 31,494 | 2,369 | ||||||
Danaher Corp, Cl A | 15,151 | 3,410 | ||||||
DaVita Inc * | 1,900 | 205 | ||||||
DENTSPLY SIRONA Inc | 5,200 | 332 | ||||||
Dexcom Inc * | 2,196 | 789 | ||||||
Edwards Lifesciences Corp, Cl A * | 14,890 | 1,245 | ||||||
Elanco Animal Health Inc * | 11,077 | 326 | ||||||
Eli Lilly and Co | 20,353 | 3,802 | ||||||
Encompass Health Corp | 2,300 | 188 | ||||||
Envista Holdings Corp * | 3,900 | 159 | ||||||
Exact Sciences Corp * | 3,600 | 474 | ||||||
Exelixis Inc * | 7,500 | 169 | ||||||
Gilead Sciences Inc | 30,300 | 1,958 | ||||||
| Description | Shares | Market Value ($ Thousands) | ||||||
COMMON STOCK (continued) | ||||||||
Global Blood Therapeutics Inc * | 1,300 | $ | 53 | |||||
Globus Medical Inc, Cl A * | 1,900 | 117 | ||||||
Guardant Health Inc * | 2,000 | 305 | ||||||
Haemonetics Corp * | 1,200 | 133 | ||||||
HCA Healthcare Inc | 6,412 | 1,208 | ||||||
Henry Schein Inc * | 3,447 | 239 | ||||||
Hill-Rom Holdings Inc | 1,650 | 182 | ||||||
Hologic Inc * | 6,200 | 461 | ||||||
Horizon Therapeutics PLC * | 4,700 | 433 | ||||||
Humana Inc | 3,107 | 1,303 | ||||||
ICU Medical Inc * | 459 | 94 | ||||||
IDEXX Laboratories Inc * | 2,005 | 981 | ||||||
Illumina Inc * | 3,585 | 1,377 | ||||||
Incyte Corp * | 4,343 | 353 | ||||||
Insulet Corp * | 1,619 | 422 | ||||||
Integra LifeSciences Holdings Corp * | 1,600 | 111 | ||||||
Intuitive Surgical Inc * | 2,816 | 2,081 | ||||||
Ionis Pharmaceuticals Inc * | 3,200 | 144 | ||||||
Iovance Biotherapeutics Inc * | 3,400 | 108 | ||||||
IQVIA Holdings Inc * | 4,616 | 892 | ||||||
Jazz Pharmaceuticals PLC * | 1,321 | 217 | ||||||
Johnson & Johnson | 63,675 | 10,465 | ||||||
Laboratory Corp of America Holdings * | 2,400 | 612 | ||||||
Maravai LifeSciences Holdings Inc, Cl A * | 1,600 | 57 | ||||||
Masimo Corp * | 1,200 | 276 | ||||||
McKesson Corp | 3,840 | 749 | ||||||
Medtronic PLC | 32,435 | 3,831 | ||||||
Merck & Co Inc | 61,002 | 4,703 | ||||||
Mettler-Toledo International Inc * | 579 | 669 | ||||||
Moderna Inc * | 6,900 | 904 | ||||||
Molina Healthcare Inc * | 1,395 | 326 | ||||||
Nektar Therapeutics, Cl A * | 4,500 | 90 | ||||||
Neurocrine Biosciences Inc * | 2,184 | 212 | ||||||
Novocure Ltd * | 2,400 | 317 | ||||||
Oak Street Health Inc * | 2,200 | 119 | ||||||
Penumbra Inc * | 800 | 217 | ||||||
PerkinElmer Inc | 2,700 | 346 | ||||||
Perrigo Co PLC | 3,383 | 137 | ||||||
Pfizer Inc | 134,350 | 4,867 | ||||||
PPD Inc * | 3,700 | 140 | ||||||
PRA Health Sciences Inc * | 1,500 | 230 | ||||||
Premier Inc, Cl A | 2,800 | 95 | ||||||
QIAGEN NV * | 5,400 | 263 | ||||||
Quest Diagnostics Inc | 3,200 | 411 | ||||||
Quidel Corp * | 900 | 115 | ||||||
Reata Pharmaceuticals Inc, Cl A * | 600 | 60 | ||||||
Regeneron Pharmaceuticals Inc * | 2,348 | 1,111 | ||||||
Repligen Corp * | 1,350 | 263 | ||||||
ResMed Inc | 3,453 | 670 | ||||||
Royalty Pharma PLC, Cl A | 7,700 | 336 | ||||||
Sage Therapeutics Inc * | 1,300 | 97 | ||||||
Sana Biotechnology Inc * | 600 | 20 | ||||||
SEI Institutional Managed Trust / Semi-Annual Report / March 31, 2021 | 5 |
SCHEDULE OF INVESTMENTS (Unaudited)
March 31, 2021
Large Cap Index Fund (Continued)
| Description | Shares | Market Value ($ Thousands) | ||||||
COMMON STOCK (continued) |
| |||||||
Sarepta Therapeutics Inc * | 1,800 | $ | 134 | |||||
Seagen Inc * | 3,061 | 425 | ||||||
Signify Health Inc, Cl A * | 500 | 15 | ||||||
Sotera Health Co * | 2,000 | 50 | ||||||
STERIS PLC | 2,000 | 381 | ||||||
Stryker Corp | 8,358 | 2,036 | ||||||
Syneos Health Inc, Cl A * | 2,000 | 152 | ||||||
Tandem Diabetes Care Inc * | 1,500 | 132 | ||||||
Teladoc Health Inc * | 2,610 | 474 | ||||||
Teleflex Inc | 1,152 | 479 | ||||||
Thermo Fisher Scientific Inc | 9,531 | 4,350 | ||||||
United Therapeutics Corp * | 1,032 | 172 | ||||||
UnitedHealth Group Inc | 22,837 | 8,497 | ||||||
Universal Health Services Inc, Cl B | 1,775 | 237 | ||||||
Varian Medical Systems Inc * | 2,236 | 395 | ||||||
Veeva Systems Inc, Cl A * | 3,318 | 867 | ||||||
Vertex Pharmaceuticals Inc * | 6,311 | 1,356 | ||||||
Viatris Inc, Cl W * | 28,930 | 404 | ||||||
Waters Corp * | 1,454 | 413 | ||||||
West Pharmaceutical Services Inc | 1,744 | 491 | ||||||
Zimmer Biomet Holdings Inc | 5,022 | 804 | ||||||
Zoetis Inc, Cl A | 11,506 | 1,812 | ||||||
| 119,102 | ||||||||
Industrials — 9.2% | ||||||||
3M Co | 13,542 | 2,609 | ||||||
A O Smith Corp | 3,100 | 210 | ||||||
Acuity Brands Inc | 878 | 145 | ||||||
ADT Inc | 3,100 | 26 | ||||||
AECOM * | 3,600 | 231 | ||||||
AGCO Corp | 1,500 | 215 | ||||||
Air Lease Corp, Cl A | 2,600 | 127 | ||||||
Alaska Air Group Inc | 2,900 | 201 | ||||||
Allegion PLC | 2,250 | 283 | ||||||
Allison Transmission Holdings Inc | 2,800 | 114 | ||||||
AMERCO | 210 | 129 | ||||||
American Airlines Group Inc | 14,772 | 353 | ||||||
AMETEK Inc | 5,483 | 700 | ||||||
Armstrong World Industries Inc | 1,200 | 108 | ||||||
Array Technologies Inc * | 3,000 | 89 | ||||||
Axon Enterprise Inc * | 1,500 | 214 | ||||||
AZEK Co Inc/The, Cl A * | 2,300 | 97 | ||||||
Boeing Co/The * | 12,926 | 3,293 | ||||||
BWX Technologies Inc, Cl W | 2,300 | 152 | ||||||
Carlisle Cos Inc | 1,224 | 201 | ||||||
Carrier Global Corp | 20,852 | 880 | ||||||
Caterpillar Inc, Cl A | 13,091 | 3,035 | ||||||
CH Robinson Worldwide Inc | 3,155 | 301 | ||||||
Cintas Corp | 2,165 | 739 | ||||||
Clean Harbors Inc * | 1,300 | 109 | ||||||
Colfax Corp * | 2,700 | 118 | ||||||
Copa Holdings SA, Cl A | 833 | 67 | ||||||
Copart Inc * | 4,960 | 539 | ||||||
| Description | Shares | Market Value ($ Thousands) | ||||||
COMMON STOCK (continued) |
| |||||||
CoreLogic Inc/United States | 1,900 | $ | 151 | |||||
CoStar Group Inc * | 921 | 757 | ||||||
Crane Co, Cl A | 1,200 | 113 | ||||||
CSX Corp | 18,410 | 1,775 | ||||||
Cummins Inc | 3,574 | 926 | ||||||
Curtiss-Wright Corp | 1,000 | 119 | ||||||
Deere & Co | 6,842 | 2,560 | ||||||
Delta Air Lines Inc, Cl A * | 15,321 | 740 | ||||||
Donaldson Co Inc, Cl A | 3,000 | 175 | ||||||
Dover Corp | 3,487 | 478 | ||||||
Driven Brands Holdings Inc * | 900 | 23 | ||||||
Dun & Bradstreet Holdings Inc * | 3,500 | 83 | ||||||
Eaton Corp PLC | 9,595 | 1,327 | ||||||
Emerson Electric Co | 14,343 | 1,294 | ||||||
Equifax Inc | 2,935 | 532 | ||||||
Expeditors International of Washington Inc | 4,100 | 442 | ||||||
Fastenal Co, Cl A | 13,887 | 698 | ||||||
FedEx Corp | 5,955 | 1,691 | ||||||
Flowserve Corp | 3,000 | 116 | ||||||
Fortive Corp | 7,159 | 506 | ||||||
Fortune Brands Home & Security Inc | 3,361 | 322 | ||||||
FTI Consulting Inc * | 800 | 112 | ||||||
Gates Industrial Corp PLC * | 1,600 | 26 | ||||||
Generac Holdings Inc * | 1,500 | 491 | ||||||
General Dynamics Corp | 6,110 | 1,109 | ||||||
General Electric Co | 209,861 | 2,755 | ||||||
Graco Inc | 4,000 | 287 | ||||||
GrafTech International Ltd | 4,361 | 53 | ||||||
HEICO Corp | 1,050 | 132 | ||||||
HEICO Corp, Cl A | 1,900 | 216 | ||||||
Hexcel Corp, Cl A | 2,000 | 112 | ||||||
Honeywell International Inc | 16,948 | 3,679 | ||||||
Howmet Aerospace Inc | 9,400 | 302 | ||||||
Hubbell Inc, Cl B | 1,305 | 244 | ||||||
Huntington Ingalls Industries Inc, Cl A | 927 | 191 | ||||||
IAA Inc * | 3,300 | 182 | ||||||
IDEX Corp | 1,803 | 377 | ||||||
IHS Markit Ltd | 9,507 | 920 | ||||||
Illinois Tool Works Inc | 7,626 | 1,689 | ||||||
Ingersoll Rand Inc * | 8,349 | 411 | ||||||
ITT Inc | 2,048 | 186 | ||||||
Jacobs Engineering Group Inc | 3,095 | 400 | ||||||
JB Hunt Transport Services Inc | 2,069 | 348 | ||||||
JetBlue Airways Corp * | 7,397 | 150 | ||||||
Johnson Controls International PLC | 17,590 | 1,050 | ||||||
Kansas City Southern | 2,180 | 575 | ||||||
Kirby Corp * | 1,500 | 90 | ||||||
Knight-Swift Transportation Holdings Inc, Cl A | 3,100 | 149 | ||||||
L3Harris Technologies Inc | 5,045 | 1,023 | ||||||
Landstar System Inc | 946 | 156 | ||||||
Lennox International Inc | 796 | 248 | ||||||
| 6 | SEI Institutional Managed Trust / Semi-Annual Report / March 31, 2021 |
SCHEDULE OF INVESTMENTS (Unaudited)
March 31, 2021
Large Cap Index Fund (Continued)
| Description | Shares | Market Value ($ Thousands) | ||||||
COMMON STOCK (continued) |
| |||||||
Lincoln Electric Holdings Inc | 1,400 | $ | 172 | |||||
Lockheed Martin Corp | 6,035 | 2,230 | ||||||
Lyft Inc, Cl A * | 6,100 | 385 | ||||||
Macquarie Infrastructure Corp | 1,800 | 57 | ||||||
ManpowerGroup Inc | 1,388 | 137 | ||||||
Masco Corp | 6,400 | 383 | ||||||
Mercury Systems Inc * | 1,200 | 85 | ||||||
Middleby Corp/The * | 1,283 | 213 | ||||||
MSA Safety Inc | 900 | 135 | ||||||
MSC Industrial Direct Co Inc, Cl A | 1,079 | 97 | ||||||
Nielsen Holdings PLC | 8,700 | 219 | ||||||
Nordson Corp | 1,443 | 287 | ||||||
Norfolk Southern Corp | 6,134 | 1,647 | ||||||
Northrop Grumman Corp | 3,789 | 1,226 | ||||||
nVent Electric PLC | 3,800 | 106 | ||||||
Old Dominion Freight Line Inc, Cl A | 2,326 | 559 | ||||||
Oshkosh Corp | 1,600 | 190 | ||||||
Otis Worldwide Corp | 9,726 | 666 | ||||||
Owens Corning | 2,500 | 230 | ||||||
PACCAR Inc | 8,155 | 758 | ||||||
Parker-Hannifin Corp, Cl A | 3,068 | 968 | ||||||
Pentair PLC | 3,900 | 243 | ||||||
Quanta Services Inc | 3,300 | 290 | ||||||
Raytheon Technologies Corp | 34,340 | 2,653 | ||||||
Regal Beloit Corp | 1,000 | 143 | ||||||
Republic Services Inc | 5,000 | 497 | ||||||
Robert Half International Inc | 2,600 | 203 | ||||||
Rockwell Automation Inc | 2,803 | 744 | ||||||
Rollins Inc | 5,300 | 182 | ||||||
Roper Technologies Inc | 2,531 | 1,021 | ||||||
Ryder System Inc | 1,200 | 91 | ||||||
Schneider National Inc, Cl B | 1,200 | 30 | ||||||
Sensata Technologies Holding PLC * | 3,700 | 214 | ||||||
Shoals Technologies Group Inc, Cl A * | 2,100 | 73 | ||||||
Snap-on Inc | 1,319 | 304 | ||||||
Southwest Airlines Co, Cl A | 14,144 | 864 | ||||||
Spirit AeroSystems Holdings Inc, Cl A | 2,600 | 127 | ||||||
Stanley Black & Decker Inc | 3,679 | 735 | ||||||
Stericycle Inc, Cl A * | 2,200 | 149 | ||||||
Teledyne Technologies Inc * | 921 | 381 | ||||||
Textron Inc | 5,538 | 311 | ||||||
Timken Co/The | 1,500 | 122 | ||||||
Toro Co/The | 2,500 | 258 | ||||||
Trane Technologies PLC | 5,796 | 960 | ||||||
TransDigm Group Inc * | 1,242 | 730 | ||||||
TransUnion | 4,500 | 405 | ||||||
Trex Co Inc * | 2,800 | 256 | ||||||
Trinity Industries Inc | 2,200 | 63 | ||||||
Uber Technologies Inc * | 33,229 | 1,811 | ||||||
Union Pacific Corp | 16,172 | 3,564 | ||||||
United Airlines Holdings | 7,473 | 430 | ||||||
United Parcel Service Inc, Cl B | 17,324 | 2,945 | ||||||
| Description | Shares | Market Value ($ Thousands) | ||||||
COMMON STOCK (continued) |
| |||||||
United Rentals Inc * | 1,703 | $ | 561 | |||||
Univar Solutions Inc * | 4,300 | 93 | ||||||
Valmont Industries Inc | 500 | 119 | ||||||
Verisk Analytics Inc, Cl A | 3,795 | 671 | ||||||
Vertiv Holdings Co, Cl A | 5,400 | 108 | ||||||
Virgin Galactic Holdings | 1,728 | 53 | ||||||
Waste Management Inc | 10,205 | 1,317 | ||||||
Watsco Inc | 776 | 202 | ||||||
Westinghouse Air Brake Technologies Corp | 4,266 | 338 | ||||||
Woodward Inc | 1,297 | 156 | ||||||
WW Grainger Inc | 1,111 | 445 | ||||||
XPO Logistics Inc * | 2,133 | 263 | ||||||
Xylem Inc/NY | 4,238 | 446 | ||||||
| 84,097 | ||||||||
Information Technology — 26.5% |
| |||||||
2U Inc * | 1,800 | 69 | ||||||
Accenture PLC, Cl A | 15,407 | 4,256 | ||||||
Adobe Inc * | 11,665 | 5,545 | ||||||
Advanced Micro Devices Inc * | 28,852 | 2,265 | ||||||
Akamai Technologies Inc * | 3,900 | 397 | ||||||
Allegro MicroSystems Inc * | 1,300 | 33 | ||||||
Alliance Data Systems Corp | 1,176 | 132 | ||||||
Alteryx Inc, Cl A * | 1,200 | 100 | ||||||
Amdocs Ltd | 3,200 | 224 | ||||||
Amphenol Corp, Cl A | 14,032 | 926 | ||||||
Analog Devices Inc | 8,895 | 1,379 | ||||||
Anaplan Inc * | 3,200 | 172 | ||||||
ANSYS Inc * | 2,048 | 695 | ||||||
Apple Inc | 382,604 | 46,735 | ||||||
Applied Materials Inc | 22,097 | 2,952 | ||||||
Arista Networks Inc * | 1,383 | 418 | ||||||
Arrow Electronics Inc, Cl A * | 1,731 | 192 | ||||||
Aspen Technology Inc * | 1,600 | 231 | ||||||
Atlassian Corp PLC, Cl A * | 3,143 | 662 | ||||||
Autodesk Inc, Cl A * | 5,282 | 1,464 | ||||||
Automatic Data Processing Inc | 10,379 | 1,956 | ||||||
Avalara Inc * | 1,943 | 259 | ||||||
Avnet Inc | 2,300 | 95 | ||||||
BigCommerce Holdings | 1,000 | 58 | ||||||
Bill.com Holdings Inc * | 1,800 | 262 | ||||||
Black Knight Inc * | 3,700 | 274 | ||||||
Booz Allen Hamilton Holding Corp, Cl A | 3,240 | 261 | ||||||
Broadcom Inc | 9,531 | 4,419 | ||||||
Broadridge Financial Solutions Inc | 2,738 | 419 | ||||||
C3.ai Inc, Cl A * | 400 | 26 | ||||||
CACI International Inc, Cl A * | 592 | 146 | ||||||
Cadence Design Systems Inc * | 6,664 | 913 | ||||||
CDK Global Inc | 2,976 | 161 | ||||||
CDW Corp/DE | 3,400 | 564 | ||||||
Ceridian HCM Holding Inc * | 2,755 | 232 | ||||||
Ciena Corp * | 3,700 | 202 | ||||||
Cirrus Logic Inc * | 1,300 | 110 | ||||||
SEI Institutional Managed Trust / Semi-Annual Report / March 31, 2021 | 7 |
SCHEDULE OF INVESTMENTS (Unaudited)
March 31, 2021
Large Cap Index Fund (Continued)
| Description | Shares | Market Value ($ Thousands) | ||||||
COMMON STOCK (continued) |
| |||||||
Cisco Systems Inc/Delaware | 102,482 | $ | 5,299 | |||||
Citrix Systems Inc | 3,002 | 421 | ||||||
Cloudflare Inc, Cl A * | 2,800 | 197 | ||||||
Cognex Corp | 4,100 | 340 | ||||||
Cognizant Technology Solutions Corp, Cl A | 12,861 | 1,005 | ||||||
Coherent Inc * | 643 | 163 | ||||||
CommScope Holding Co Inc * | 5,100 | 78 | ||||||
Concentrix Corp * | 1,000 | 150 | ||||||
Corning Inc, Cl B | 18,014 | 784 | ||||||
Coupa Software Inc * | 1,666 | 424 | ||||||
Cree Inc * | 2,630 | 284 | ||||||
Crowdstrike Holdings Inc, Cl A * | 3,700 | 675 | ||||||
Datadog Inc, Cl A * | 3,700 | 308 | ||||||
Datto Holding Corp * | 500 | 11 | ||||||
Dell Technologies Inc, Cl C * | 6,327 | 558 | ||||||
DocuSign Inc, Cl A * | 4,420 | 895 | ||||||
Dolby Laboratories Inc, Cl A | 1,500 | 148 | ||||||
Dropbox Inc, Cl A * | 6,100 | 163 | ||||||
Duck Creek Technologies Inc * | 1,700 | 77 | ||||||
DXC Technology Co | 6,081 | 190 | ||||||
Dynatrace Inc * | 4,300 | 207 | ||||||
EchoStar Corp, Cl A * | 900 | 22 | ||||||
Elastic NV * | 1,600 | 178 | ||||||
Enphase Energy Inc * | 2,500 | 405 | ||||||
Entegris Inc | 3,200 | 358 | ||||||
EPAM Systems Inc * | 1,253 | 497 | ||||||
Euronet Worldwide Inc * | 1,200 | 166 | ||||||
Everbridge Inc * | 800 | 97 | ||||||
F5 Networks Inc, Cl A * | 1,541 | 322 | ||||||
Fair Isaac Corp * | 719 | 349 | ||||||
Fastly Inc, Cl A * | 1,800 | 121 | ||||||
Fidelity National Information Services Inc, Cl B | 14,868 | 2,091 | ||||||
FireEye Inc * | 5,600 | 110 | ||||||
First Solar Inc * | 2,200 | 192 | ||||||
Fiserv Inc, Cl A * | 13,828 | 1,646 | ||||||
Five9 Inc * | 1,500 | 235 | ||||||
FleetCor Technologies Inc * | 2,020 | 543 | ||||||
FLIR Systems Inc | 3,000 | 169 | ||||||
Fortinet Inc * | 3,200 | 590 | ||||||
Gartner Inc * | 2,066 | 377 | ||||||
Genpact Ltd | 4,500 | 193 | ||||||
Global Payments Inc | 7,234 | 1,458 | ||||||
Globant SA * | 900 | 187 | ||||||
GoDaddy Inc, Cl A * | 4,125 | 320 | ||||||
Guidewire Software Inc, Cl Z * | 1,982 | 201 | ||||||
Hewlett Packard Enterprise Co | 31,107 | 490 | ||||||
HP Inc | 31,265 | 993 | ||||||
HubSpot Inc * | 1,000 | 454 | ||||||
Inphi Corp * | 1,200 | 214 | ||||||
Intel Corp | 99,076 | 6,341 | ||||||
International Business Machines Corp | 21,533 | 2,870 | ||||||
| Description | Shares | Market Value ($ Thousands) | ||||||
COMMON STOCK (continued) |
| |||||||
Intuit Inc | 6,119 | $ | 2,344 | |||||
IPG Photonics Corp * | 833 | 176 | ||||||
Jabil Inc | 3,700 | 193 | ||||||
Jack Henry & Associates Inc | 1,854 | 281 | ||||||
Jamf Holding Corp * | 1,000 | 35 | ||||||
JFrog Ltd * | 300 | 13 | ||||||
Juniper Networks Inc | 8,100 | 205 | ||||||
Keysight Technologies Inc * | 4,500 | 645 | ||||||
KLA Corp | 3,799 | 1,255 | ||||||
Lam Research Corp | 3,443 | 2,049 | ||||||
Leidos Holdings Inc | 3,300 | 318 | ||||||
Littelfuse Inc | 600 | 159 | ||||||
Lumentum Holdings Inc * | 1,800 | 164 | ||||||
Manhattan Associates Inc * | 1,505 | 177 | ||||||
Marvell Technology Group Ltd | 15,972 | 782 | ||||||
Mastercard Inc, Cl A | 21,351 | 7,602 | ||||||
Maxim Integrated Products Inc | 6,400 | 585 | ||||||
McAfee Corp, Cl A | 800 | 18 | ||||||
Medallia Inc * | 2,200 | 61 | ||||||
Microchip Technology Inc | 6,061 | 941 | ||||||
Micron Technology Inc * | 26,809 | 2,365 | ||||||
Microsoft Corp | 180,900 | 42,651 | ||||||
MKS Instruments Inc | 1,300 | 241 | ||||||
MongoDB Inc, Cl A * | 1,268 | 339 | ||||||
Monolithic Power Systems Inc | 1,035 | 366 | ||||||
Motorola Solutions Inc | 4,136 | 778 | ||||||
National Instruments Corp | 3,000 | 130 | ||||||
nCino Inc * | 1,100 | 73 | ||||||
NCR Corp * | 3,223 | 122 | ||||||
NetApp Inc | 5,300 | 385 | ||||||
New Relic Inc * | 1,200 | 74 | ||||||
NortonLifeLock Inc | 13,301 | 283 | ||||||
Nuance Communications Inc * | 6,900 | 301 | ||||||
Nutanix Inc, Cl A * | 4,659 | 124 | ||||||
NVIDIA Corp | 14,224 | 7,595 | ||||||
Okta Inc, Cl A * | 2,800 | 617 | ||||||
ON Semiconductor Corp * | 9,800 | 408 | ||||||
Oracle Corp, Cl B | 44,405 | 3,116 | ||||||
PagerDuty Inc * | 1,800 | 72 | ||||||
Palo Alto Networks Inc * | 2,261 | 728 | ||||||
Paychex Inc | 7,736 | 758 | ||||||
Paycom Software Inc * | 1,136 | 420 | ||||||
Paylocity Holding Corp * | 900 | 162 | ||||||
PayPal Holdings Inc * | 28,388 | 6,894 | ||||||
Pegasystems Inc | 900 | 103 | ||||||
Pluralsight Inc, Cl A * | 3,100 | 69 | ||||||
Proofpoint Inc * | 1,300 | 164 | ||||||
PTC Inc * | 2,465 | 339 | ||||||
Pure Storage Inc, Cl A * | 5,800 | 125 | ||||||
Qorvo Inc * | 2,768 | 506 | ||||||
QUALCOMM Inc | 27,214 | 3,608 | ||||||
RealPage Inc * | 2,100 | 183 | ||||||
| 8 | SEI Institutional Managed Trust / Semi-Annual Report / March 31, 2021 |
SCHEDULE OF INVESTMENTS (Unaudited)
March 31, 2021
Large Cap Index Fund (Continued)
| Description | Shares | Market Value ($ Thousands) | ||||||
COMMON STOCK (continued) | ||||||||
RingCentral Inc, Cl A * | 1,878 | $ | 559 | |||||
Sabre Corp * | 7,900 | 117 | ||||||
salesforce.com Inc * | 21,203 | 4,492 | ||||||
Science Applications International Corp | 1,300 | 109 | ||||||
ServiceNow Inc * | 4,723 | 2,362 | ||||||
Skyworks Solutions Inc | 3,978 | 730 | ||||||
Slack Technologies Inc, Cl A * | 11,800 | 479 | ||||||
Smartsheet Inc, Cl A * | 2,700 | 173 | ||||||
SolarEdge Technologies Inc * | 1,200 | 345 | ||||||
SolarWinds Corp * | 1,100 | 19 | ||||||
Splunk Inc * | 3,933 | 533 | ||||||
Square Inc, Cl A * | 8,953 | 2,033 | ||||||
SS&C Technologies Holdings Inc | 5,400 | 377 | ||||||
StoneCo Ltd, Cl A * | 4,900 | 300 | ||||||
Switch Inc, Cl A | 2,200 | 36 | ||||||
SYNNEX Corp | 1,000 | 115 | ||||||
Synopsys Inc * | 3,703 | 918 | ||||||
Teradata Corp * | 2,697 | 104 | ||||||
Teradyne Inc | 3,954 | 481 | ||||||
Texas Instruments Inc | 22,173 | 4,190 | ||||||
Trade Desk Inc/The, Cl A * | 983 | 641 | ||||||
Trimble Inc * | 6,100 | 475 | ||||||
Twilio Inc, Cl A * | 3,462 | 1,180 | ||||||
Tyler Technologies Inc * | 960 | 408 | ||||||
Ubiquiti Inc | 169 | 50 | ||||||
Unity Software Inc * | 700 | 70 | ||||||
Universal Display Corp | 1,042 | 247 | ||||||
VeriSign Inc * | 2,408 | 479 | ||||||
Viasat Inc * | 1,400 | 67 | ||||||
Visa Inc, Cl A | 40,765 | 8,631 | ||||||
VMware Inc, Cl A * | 1,894 | 285 | ||||||
Vontier * | 3,763 | 114 | ||||||
Western Digital Corp | 7,292 | 487 | ||||||
Western Union Co/The | 10,000 | 247 | ||||||
WEX Inc * | 1,095 | 229 | ||||||
Workday Inc, Cl A * | 4,363 | 1,084 | ||||||
Xerox Holdings Corp | 4,000 | 97 | ||||||
Xilinx Inc | 5,886 | 729 | ||||||
Zebra Technologies Corp, Cl A * | 1,251 | 607 | ||||||
Zendesk Inc * | 2,814 | 373 | ||||||
Zoom Video Communications Inc, Cl A * | 4,200 | 1,349 | ||||||
Zscaler Inc * | 1,700 | 292 | ||||||
|
|
| ||||||
| 242,485 | ||||||||
|
|
| ||||||
Materials — 2.8% | ||||||||
Air Products and Chemicals Inc | 5,325 | 1,498 | ||||||
Albemarle Corp | 2,756 | 403 | ||||||
Amcor PLC | 38,000 | 444 | ||||||
AptarGroup Inc | 1,500 | 213 | ||||||
Ardagh Group SA, Cl A | 500 | 13 | ||||||
Ashland Global Holdings Inc | 1,300 | 115 | ||||||
Avery Dennison Corp | 2,023 | 372 | ||||||
Axalta Coating Systems Ltd * | 5,000 | 148 | ||||||
| Description | Shares | Market Value ($ Thousands) | ||||||
COMMON STOCK (continued) | ||||||||
Ball Corp | 7,635 | $ | 647 | |||||
Berry Global Group Inc * | 3,177 | 195 | ||||||
Cabot Corp | 1,400 | 73 | ||||||
Celanese Corp, Cl A | 2,800 | 419 | ||||||
CF Industries Holdings Inc | 5,237 | 238 | ||||||
Chemours Co/The | 3,700 | 103 | ||||||
Corteva Inc | 18,139 | 846 | ||||||
Crown Holdings Inc | 3,100 | 301 | ||||||
Dow Inc | 17,875 | 1,143 | ||||||
DuPont de Nemours Inc | 12,938 | 1,000 | ||||||
Eagle Materials Inc | 959 | 129 | ||||||
Eastman Chemical Co | 3,232 | 356 | ||||||
Ecolab Inc | 6,046 | 1,294 | ||||||
Element Solutions Inc | 5,000 | 91 | ||||||
FMC Corp | 3,110 | 344 | ||||||
Freeport-McMoRan Inc, Cl B | 35,002 | 1,153 | ||||||
Graphic Packaging Holding Co | 6,800 | 123 | ||||||
Huntsman Corp | 4,805 | 139 | ||||||
International Flavors & Fragrances Inc | 5,991 | 836 | ||||||
International Paper Co | 9,391 | 508 | ||||||
Linde PLC | 12,675 | 3,551 | ||||||
LyondellBasell Industries NV, Cl A | 6,115 | 636 | ||||||
Martin Marietta Materials Inc, Cl A | 1,475 | 495 | ||||||
Mosaic Co/The | 8,400 | 266 | ||||||
NewMarket Corp | 138 | 52 | ||||||
Newmont Corp | 19,270 | 1,161 | ||||||
Nucor Corp | 7,241 | 581 | ||||||
Olin Corp | 3,700 | 141 | ||||||
Packaging Corp of America | 2,227 | 299 | ||||||
PPG Industries Inc | 5,679 | 853 | ||||||
Reliance Steel & Aluminum Co | 1,550 | 236 | ||||||
Royal Gold Inc, Cl A | 1,647 | 177 | ||||||
RPM International Inc | 3,000 | 276 | ||||||
Scotts Miracle-Gro Co/The, Cl A | 977 | 239 | ||||||
Sealed Air Corp | 3,600 | 165 | ||||||
Sherwin-Williams Co/The, Cl A | 2,014 | 1,486 | ||||||
Silgan Holdings Inc | 1,900 | 80 | ||||||
Sonoco Products Co | 2,300 | 146 | ||||||
Southern Copper Corp | 2,000 | 136 | ||||||
Steel Dynamics Inc | 4,849 | 246 | ||||||
Valvoline Inc | 4,400 | 115 | ||||||
Vulcan Materials Co | 3,139 | 530 | ||||||
W R Grace & Co | 1,300 | 78 | ||||||
Westlake Chemical Corp | 832 | 74 | ||||||
Westrock Co | 6,300 | 328 | ||||||
|
|
| ||||||
| 25,491 | ||||||||
|
|
| ||||||
Real Estate — 3.0% | ||||||||
Alexandria Real Estate Equities Inc ‡ | 3,289 | 540 | ||||||
American Campus Communities Inc ‡ | 3,200 | 138 | ||||||
American Homes 4 Rent, Cl A ‡ | 6,600 | 220 | ||||||
American Tower Corp, Cl A ‡ | 10,653 | 2,547 | ||||||
Americold Realty Trust ‡ | 5,800 | 223 | ||||||
SEI Institutional Managed Trust / Semi-Annual Report / March 31, 2021 | 9 |
SCHEDULE OF INVESTMENTS (Unaudited)
March 31, 2021
Large Cap Index Fund (Continued)
| Description | Shares | Market Value ($ Thousands) | ||||||
COMMON STOCK (continued) | ||||||||
Apartment Income Corp ‡ | 3,665 | $ | 157 | |||||
Apartment Investment and Management Co, Cl A ‡ | 3,165 | 19 | ||||||
Apple Hospitality Inc ‡ | 5,100 | 74 | ||||||
AvalonBay Communities Inc ‡ | 3,428 | 632 | ||||||
Boston Properties Inc ‡ | 3,762 | 381 | ||||||
Brandywine Realty Trust ‡ | 4,500 | 58 | ||||||
Brixmor Property Group Inc ‡ | 6,900 | 140 | ||||||
Brookfield Property Inc, Cl A ‡ | 827 | 15 | ||||||
Camden Property Trust ‡ | 2,200 | 242 | ||||||
CBRE Group Inc, Cl A *‡ | 8,100 | 641 | ||||||
CoreSite Realty Corp ‡ | 1,000 | 120 | ||||||
Corporate Office Properties Trust ‡ | 2,500 | 66 | ||||||
Cousins Properties Inc ‡ | 3,600 | 127 | ||||||
Crown Castle International Corp ‡ | 10,021 | 1,725 | ||||||
CubeSmart ‡ | 4,800 | 182 | ||||||
CyrusOne Inc ‡ | 2,854 | 193 | ||||||
Digital Realty Trust Inc, Cl A ‡ | 6,764 | 953 | ||||||
Douglas Emmett Inc ‡ | 4,100 | 129 | ||||||
Duke Realty Corp ‡ | 8,900 | 373 | ||||||
Empire State Realty Trust Inc, Cl A ‡ | 4,200 | 47 | ||||||
EPR Properties, Cl A ‡ | 1,900 | 88 | ||||||
Equinix Inc ‡ | 2,135 | 1,451 | ||||||
Equity Commonwealth ‡ | 2,800 | 78 | ||||||
Equity LifeStyle Properties Inc ‡ | 4,200 | 267 | ||||||
Equity Residential ‡ | 8,783 | 629 | ||||||
Essex Property Trust Inc ‡ | 1,617 | 440 | ||||||
Extra Space Storage Inc ‡ | 3,100 | 411 | ||||||
Federal Realty Investment Trust ‡ | 1,846 | 187 | ||||||
First Industrial Realty Trust Inc ‡ | 3,200 | 147 | ||||||
Gaming and Leisure Properties Inc ‡ | 5,210 | 221 | ||||||
Healthcare Trust of America Inc, Cl A ‡ | 5,400 | 149 | ||||||
Healthpeak Properties Inc ‡ | 12,870 | 408 | ||||||
Highwoods Properties Inc ‡ | 2,378 | 102 | ||||||
Host Hotels & Resorts Inc ‡ | 17,002 | 286 | ||||||
Howard Hughes Corp/The *‡ | 963 | 92 | ||||||
Hudson Pacific Properties Inc ‡ | 3,800 | 103 | ||||||
Invitation Homes Inc ‡ | 13,500 | 432 | ||||||
Iron Mountain Inc ‡ | 6,900 | 255 | ||||||
JBG SMITH Properties ‡ | 3,100 | 99 | ||||||
Jones Lang LaSalle Inc ‡ | 1,203 | 215 | ||||||
Kilroy Realty Corp ‡ | 2,800 | 184 | ||||||
Kimco Realty Corp ‡ | 10,100 | 189 | ||||||
Lamar Advertising Co, Cl A ‡ | 2,100 | 197 | ||||||
Life Storage Inc ‡ | 1,800 | 155 | ||||||
Medical Properties Trust Inc ‡ | 13,435 | 286 | ||||||
Mid-America Apartment Communities Inc ‡ | 2,700 | 390 | ||||||
National Retail Properties Inc ‡ | 4,100 | 181 | ||||||
Omega Healthcare Investors Inc ‡ | 5,545 | 203 | ||||||
Outfront Media Inc ‡ | 3,711 | 81 | ||||||
Paramount Group Inc ‡ | 5,300 | 54 | ||||||
Park Hotels & Resorts Inc ‡ | 6,000 | 130 | ||||||
| Description | Shares | Market Value ($ Thousands) | ||||||
COMMON STOCK (continued) | ||||||||
Prologis Inc ‡ | 17,920 | $ | 1,899 | |||||
Public Storage ‡ | 3,610 | 891 | ||||||
Rayonier Inc ‡ | 3,200 | 103 | ||||||
Realty Income Corp ‡ | 8,969 | 570 | ||||||
Regency Centers Corp ‡ | 4,100 | 232 | ||||||
Rexford Industrial Realty Inc ‡ | 3,200 | 161 | ||||||
SBA Communications Corp, Cl A ‡ | 2,637 | 732 | ||||||
Simon Property Group Inc ‡ | 7,835 | 891 | ||||||
SL Green Realty ‡ | 1,732 | 121 | ||||||
Spirit Realty Capital Inc ‡ | 2,878 | 122 | ||||||
STORE Capital Corp ‡ | 5,900 | 198 | ||||||
Sun Communities Inc ‡ | 2,500 | 375 | ||||||
UDR Inc ‡ | 6,900 | 303 | ||||||
Ventas Inc ‡ | 8,990 | 480 | ||||||
VEREIT Inc ‡ | 5,340 | 206 | ||||||
VICI Properties Inc ‡ | 12,594 | 356 | ||||||
Vornado Realty Trust ‡ | 4,200 | 191 | ||||||
Weingarten Realty Investors ‡ | 2,900 | 78 | ||||||
Welltower Inc ‡ | 10,000 | 716 | ||||||
Weyerhaeuser Co ‡ | 17,997 | 641 | ||||||
WP Carey Inc ‡ | 4,190 | 296 | ||||||
|
|
| ||||||
| 27,614 | ||||||||
|
|
| ||||||
Utilities — 2.6% | ||||||||
AES Corp/The | 15,900 | 426 | ||||||
Alliant Energy Corp | 5,921 | 321 | ||||||
Ameren Corp | 5,925 | 482 | ||||||
American Electric Power Co Inc | 12,029 | 1,019 | ||||||
American Water Works Co Inc | 4,327 | 649 | ||||||
Atmos Energy Corp | 3,066 | 303 | ||||||
Avangrid Inc | 1,200 | 60 | ||||||
CenterPoint Energy Inc | 12,055 | 273 | ||||||
CMS Energy Corp | 6,910 | 423 | ||||||
Consolidated Edison Inc | 8,239 | 616 | ||||||
Dominion Energy Inc | 19,702 | 1,496 | ||||||
DTE Energy Co | 4,613 | 614 | ||||||
Duke Energy Corp | 17,752 | 1,714 | ||||||
Edison International | 8,493 | 498 | ||||||
Entergy Corp | 4,835 | 481 | ||||||
Essential Utilities Inc | 5,400 | 242 | ||||||
Evergy Inc | 5,417 | 322 | ||||||
Eversource Energy | 8,198 | 710 | ||||||
Exelon Corp | 23,539 | 1,030 | ||||||
FirstEnergy Corp | 13,100 | 454 | ||||||
Hawaiian Electric Industries Inc | 2,600 | 115 | ||||||
IDACORP Inc, Cl A | 1,200 | 120 | ||||||
MDU Resources Group Inc | 4,700 | 149 | ||||||
National Fuel Gas Co | 2,200 | 110 | ||||||
NextEra Energy Inc | 47,235 | 3,571 | ||||||
NiSource Inc | 9,400 | 227 | ||||||
NRG Energy Inc | 5,900 | 223 | ||||||
OGE Energy Corp | 4,900 | 158 | ||||||
PG&E Corp * | 32,106 | 376 | ||||||
| 10 | SEI Institutional Managed Trust / Semi-Annual Report / March 31, 2021 |
SCHEDULE OF INVESTMENTS (Unaudited)
March 31, 2021
Large Cap Index Fund (Continued)
| Description | Shares | Market Value ($ Thousands) | ||||||
COMMON STOCK (continued) |
| |||||||
Pinnacle West Capital Corp | 2,800 | $ | 228 | |||||
PPL Corp | 18,403 | 531 | ||||||
Public Service Enterprise Group Inc | 12,180 | 733 | ||||||
Sempra Energy | 7,014 | 930 | ||||||
Southern Co/The | 25,362 | 1,576 | ||||||
UGI Corp | 4,830 | 198 | ||||||
Vistra Corp | 11,869 | 210 | ||||||
WEC Energy Group Inc | 7,584 | 710 | ||||||
Xcel Energy Inc | 12,690 | 844 | ||||||
| 23,142 | ||||||||
Total Common Stock | 906,539 | |||||||
| Description | Shares | Market Value ($ Thousands) | ||||||
AFFILIATED PARTNERSHIP — 0.0% |
| |||||||
SEI Liquidity Fund, L.P. | ||||||||
0.020% **†(C) | 72,526 | $ | 73 | |||||
Total Affiliated Partnership | 73 | |||||||
CASH EQUIVALENT — 0.9% |
| |||||||
SEI Daily Income Trust, Government Fund, Cl F | ||||||||
0.010%**† | 8,589,418 | 8,589 | ||||||
Total Cash Equivalent |
| 8,589 | ||||||
Total Investments in Securities — 100.1% |
| $ | 915,201 | |||||
A list of the open futures contracts held by the Fund at March 31, 2021 is as follows:
| Type of Contract | Number of Contracts Long | Expiration Date | Notional Amount (Thousands) | Value (Thousands) | Unrealized Appreciation/ (Depreciation) (Thousands) | |||||||||||||||
S&P 500 Index E-MINI | 37 | Jun-2021 | $ | 7,247 | $ | 7,340 | $ | 93 | ||||||||||||
S&P Mid Cap 400 Index E-MINI | 2 | Jun-2021 | 526 | 521 | (5) | |||||||||||||||
|
| |||||||||||||||||||
| $ | 7,773 | $ | 7,861 | $ | 88 | |||||||||||||||
|
| |||||||||||||||||||
Percentages are based on Net Assets of $914,257 ($ Thousands). |
| * | Non-income producing security. |
| ** | Rate shown is the 7-day effective yield as of March 31, 2021. |
| † | Investment in Affiliated Security (see Note 6). |
| ‡ | Real Estate Investment Trust. |
| (A) | Certain securities or partial positions of certain securities are on loan at March 31, 2021 (see Note 10). The total market value of securities on loan at March 31, 2021 was $69 ($ Thousands). |
| (B) | Security is a Master Limited Partnership. At March 31, 2021, such securities amounted to $109 ($ Thousands), or 0.0% of Net Assets (See Note 2). |
| (C) | This security was purchased with cash collateral held from securities on loan (see Note 10). The total market value of such securities as of March 31, 2021 was $73 ($ Thousands). |
Cl — Class
L.P. — Limited Partnership
MSCI — Morgan Stanley Capital International
NASDAQ – National Association of Securities Dealers and Automated Quotations
PLC — Public Limited Company
S&P— Standard & Poor’s
The following is a list of the level of inputs used as of March 31, 2021, in valuing the Fund’s investments and other financial instruments carried at value ($ Thousands):
Investments in Securities | Level 1 ($) | Level 2 ($) | Level 3 ($) | Total ($) | ||||||||||||
Common Stock | 906,539 | – | – | 906,539 | ||||||||||||
Affiliated Partnership | – | 73 | – | 73 | ||||||||||||
Cash Equivalent | 8,589 | – | – | 8,589 | ||||||||||||
|
|
|
|
|
|
|
| |||||||||
Total Investments in Securities | 915,128 | 73 | – | 915,201 | ||||||||||||
|
|
|
|
|
|
|
| |||||||||
Other Financial Instruments | Level 1 ($) | Level 2 ($) | Level 3 ($) | Total ($) | ||||||||||||
Futures Contracts* | ||||||||||||||||
Unrealized Appreciation | 93 | – | – | 93 | ||||||||||||
Unrealized Depreciation | (5) | – | – | (5) | ||||||||||||
|
|
|
|
|
|
|
| |||||||||
Total Other Financial Instruments | 88 | – | – | 88 | ||||||||||||
|
|
|
|
|
|
|
| |||||||||
* Futures contracts are valued at the unrealized appreciation/(depreciation) on the instrument.
For the period ended March 31, 2021, there were no transfers in or out of Level 3.
For more information on valuation inputs, see Note 2 – Significant Accounting Policies in Notes to Financial Statements.
SEI Institutional Managed Trust / Semi-Annual Report / March 31, 2021 | 11 |
SCHEDULE OF INVESTMENTS (Unaudited)
March 31, 2021
Large Cap Index Fund (Continued)
The following is a summary of the Fund’s transactions with affiliates for the period ended March 31, 2021 ($ Thousands):
| Security Description | Value 9/30/2020 | Purchases at Cost | Proceeds from Sales | Realized Gain/ (Loss) | Change in Unrealized Appreciation/ (Depreciation) | Value 3/31/2021 | Shares | Income | Capital Gains | |||||||||
SEI Investment Co | $ 127 | $ 17 | $ — | $— | $27 | $ 171 | 2,800 | $ 1 | $— | |||||||||
SEI Liquidity Fund, L.P. | 924 | 2,794 | (3,645) | — | — | 73 | 72,526 | 6 | — | |||||||||
SEI Daily Income Trust, Government Fund, Cl F | 14,553 | 90,322 | (96,286) | — | — | 8,589 | 8,589,418 | 1 | — | |||||||||
|
|
|
|
|
|
|
| |||||||||||
Totals | $ 15,604 | $ 93,133 | $(99,931) | $— | $27 | $ 8,833 | $ 8 | $— | ||||||||||
|
|
|
|
|
|
|
|
Amounts designated as “—” are either $0 or have been rounded to $0.
The accompanying notes are an integral part of the financial statements.
| 12 | SEI Institutional Managed Trust / Semi-Annual Report / March 31, 2021 |
SCHEDULE OF INVESTMENTS (Unaudited)
March 31, 2021
Tax-Managed Large Cap Fund (Continued)
| Description | Shares | Market Value ($ Thousands) | ||||||
COMMON STOCK — 99.6% |
| |||||||
Communication Services — 5.7% |
| |||||||
Alphabet Inc, Cl A * | 26,214 | $ | 54,067 | |||||
Alphabet Inc, Cl C * | 22,848 | 47,264 | ||||||
AT&T Inc | 769,494 | 23,293 | ||||||
BCE Inc | 440,518 | 19,885 | ||||||
Charter Communications Inc, Cl A * | 14,857 | 9,167 | ||||||
Comcast Corp, Cl A | 121,805 | 6,591 | ||||||
Electronic Arts Inc | 48,975 | 6,630 | ||||||
Facebook Inc, Cl A * | 135,757 | 39,984 | ||||||
Lumen Technologies Inc | 162,240 | 2,166 | ||||||
Omnicom Group Inc | 97,998 | 7,267 | ||||||
TEGNA Inc | 153,973 | 2,899 | ||||||
Verizon Communications Inc | 144,030 | 8,375 | ||||||
ViacomCBS Inc, Cl B | 300,000 | 13,530 | ||||||
Walt Disney Co/The * | 22,000 | 4,059 | ||||||
|
|
| ||||||
| 245,177 | ||||||||
|
|
| ||||||
Consumer Discretionary — 11.9% |
| |||||||
Amazon.com Inc, Cl A * | 18,448 | 57,080 | ||||||
AutoZone Inc * | 16,513 | 23,189 | ||||||
Best Buy Co Inc | 186,465 | 21,408 | ||||||
Booking Holdings Inc * | 2,537 | 5,911 | ||||||
BorgWarner Inc | 196,841 | 9,125 | ||||||
Brinker International Inc * | 179,017 | 12,721 | ||||||
Carnival Corp * | 357,842 | 9,497 | ||||||
Darden Restaurants Inc | 3,127 | 444 | ||||||
Dick’s Sporting Goods Inc | 133,982 | 10,203 | ||||||
Dollar General Corp | 222,711 | 45,126 | ||||||
Domino’s Pizza Inc | 16,892 | 6,213 | ||||||
DR Horton Inc | 16,198 | 1,444 | ||||||
eBay Inc | 127,055 | 7,781 | ||||||
Foot Locker Inc, Cl A | 65,687 | 3,695 | ||||||
General Motors Co * | 72,158 | 4,146 | ||||||
Genuine Parts Co | 98,621 | 11,400 | ||||||
Goodyear Tire & Rubber Co/The * | 406,438 | 7,141 | ||||||
Harley-Davidson Inc, Cl A | 88,020 | 3,530 | ||||||
Home Depot Inc/The | 28,380 | 8,663 | ||||||
L Brands Inc * | 16,235 | 1,004 | ||||||
Lear Corp | 89,362 | 16,197 | ||||||
Lowe’s Cos Inc | 328,236 | 62,424 | ||||||
Magna International Inc, Cl A | 19,822 | 1,745 | ||||||
NIKE Inc, Cl B | 357,743 | 47,540 | ||||||
O’Reilly Automotive Inc * | 1,906 | 967 | ||||||
PulteGroup Inc | 251,522 | 13,190 | ||||||
Ross Stores Inc | 218,925 | 26,251 | ||||||
Royal Caribbean Cruises Ltd * | 71,822 | 6,149 | ||||||
Starbucks Corp | 68,046 | 7,435 | ||||||
Target Corp, Cl A | 185,748 | 36,791 | ||||||
TJX Cos Inc/The | 374,562 | 24,777 | ||||||
TopBuild Corp * | 51,115 | 10,705 | ||||||
Whirlpool Corp | 59,551 | 13,122 | ||||||
| Description | Shares | Market Value ($ Thousands) | ||||||
COMMON STOCK (continued) |
| |||||||
Yum China Holdings Inc | 52,847 | $ | 3,129 | |||||
|
|
| ||||||
| 520,143 | ||||||||
|
|
| ||||||
Consumer Staples — 8.8% |
| |||||||
Altria Group Inc | 561,690 | 28,736 | ||||||
Archer-Daniels-Midland Co | 50,878 | 2,900 | ||||||
Coca-Cola Co/The | 123,765 | 6,524 | ||||||
Colgate-Palmolive Co | 28,059 | 2,212 | ||||||
Conagra Brands Inc | 429,158 | 16,136 | ||||||
Constellation Brands Inc, Cl A | 10,975 | 2,502 | ||||||
Costco Wholesale Corp | 20,685 | 7,291 | ||||||
Diageo PLC ADR | 73,341 | 12,043 | ||||||
Estee Lauder Cos Inc/The, Cl A | 35,000 | 10,180 | ||||||
Hershey Co/The | 26,426 | 4,180 | ||||||
Ingredion Inc | 45,605 | 4,101 | ||||||
J M Smucker Co/The | 115,422 | 14,604 | ||||||
Kimberly-Clark Corp | 101,362 | 14,095 | ||||||
Kraft Heinz Co/The | 115,076 | 4,603 | ||||||
Kroger Co/The | 924,655 | 33,278 | ||||||
Lamb Weston Holdings Inc | 16,377 | 1,269 | ||||||
Molson Coors Beverage Co, Cl B * | 248,427 | 12,707 | ||||||
Mondelez International Inc, Cl A | 24,475 | 1,433 | ||||||
Monster Beverage Corp * | 55,061 | 5,015 | ||||||
PepsiCo Inc | 209,241 | 29,597 | ||||||
Philip Morris International Inc | 469,703 | 41,682 | ||||||
Procter & Gamble Co/The | 233,806 | 31,664 | ||||||
Sysco Corp, Cl A | 34,252 | 2,697 | ||||||
TreeHouse Foods Inc * | 82,410 | 4,305 | ||||||
Tyson Foods Inc, Cl A | 253,116 | 18,806 | ||||||
Unilever PLC ADR | 731,480 | 40,839 | ||||||
Walgreens Boots Alliance Inc | 303,967 | 16,688 | ||||||
Walmart Inc | 80,528 | 10,938 | ||||||
|
|
| ||||||
| 381,025 | ||||||||
|
|
| ||||||
Energy — 2.5% |
| |||||||
BP PLC ADR | 82,387 | 2,006 | ||||||
Cabot Oil & Gas Corp | 114,860 | 2,157 | ||||||
Canadian Natural Resources Ltd | 293,668 | 9,066 | ||||||
Chevron Corp | 264,554 | 27,723 | ||||||
ConocoPhillips | 244,083 | 12,929 | ||||||
Devon Energy Corp | 743,505 | 16,246 | ||||||
Exxon Mobil Corp | 129,439 | 7,226 | ||||||
HollyFrontier Corp | 40,846 | 1,461 | ||||||
Marathon Petroleum Corp | 154,884 | 8,285 | ||||||
Phillips 66 | 134,090 | 10,934 | ||||||
Valero Energy Corp | 173,346 | 12,411 | ||||||
|
|
| ||||||
| 110,444 | ||||||||
|
|
| ||||||
Financials — 17.5% |
| |||||||
Aflac Inc | 136,144 | 6,968 | ||||||
Allstate Corp/The | 59,438 | 6,829 | ||||||
American Financial Group Inc/OH | 11,100 | 1,266 | ||||||
Ameriprise Financial Inc | 82,444 | 19,164 | ||||||
Assurant Inc | 36,000 | 5,104 | ||||||
SEI Institutional Managed Trust / Semi-Annual Report / March 31, 2021 | 1 |
SCHEDULE OF INVESTMENTS (Unaudited)
March 31, 2021
Tax-Managed Large Cap Fund (Continued)
| Description | Shares | Market Value ($ Thousands) | ||||||
COMMON STOCK (continued) |
| |||||||
Assured Guaranty Ltd | 31,872 | $ | 1,348 | |||||
Bank of America Corp | 1,550,747 | 59,998 | ||||||
Berkshire Hathaway Inc, Cl B * | 93,247 | 23,822 | ||||||
Capital One Financial Corp | 43,778 | 5,570 | ||||||
Charles Schwab Corp/The | 175,722 | 11,454 | ||||||
Chubb Ltd | 5,473 | 865 | ||||||
CIT Group Inc | 20,961 | 1,080 | ||||||
Citigroup Inc | 379,987 | 27,644 | ||||||
Citizens Financial Group Inc | 326,590 | 14,419 | ||||||
CME Group Inc | 77,815 | 15,892 | ||||||
Comerica Inc | 244,889 | 17,568 | ||||||
Discover Financial Services | 126,480 | 12,014 | ||||||
Everest Re Group Ltd | 38,172 | 9,459 | ||||||
FactSet Research Systems Inc | 11,209 | 3,459 | ||||||
Fifth Third Bancorp | 589,594 | 22,080 | ||||||
First Hawaiian Inc | 217,387 | 5,950 | ||||||
First Republic Bank/CA | 78,000 | 13,006 | ||||||
Goldman Sachs Group Inc/The | 21,644 | 7,078 | ||||||
Hartford Financial Services Group Inc/The | 66,936 | 4,471 | ||||||
Intercontinental Exchange Inc | 58,438 | 6,526 | ||||||
JPMorgan Chase & Co | 474,451 | 72,226 | ||||||
KeyCorp | 778,006 | 15,545 | ||||||
KKR & Co Inc | 193,080 | 9,432 | ||||||
Lincoln National Corp | 253,378 | 15,778 | ||||||
Markel Corp * | 9,172 | 10,453 | ||||||
Marsh & McLennan Cos Inc | 138,328 | 16,848 | ||||||
Moody’s Corp | 263,689 | 78,740 | ||||||
Morgan Stanley | 311,935 | 24,225 | ||||||
MSCI Inc, Cl A | 91,938 | 38,548 | ||||||
Navient Corp | 263,511 | 3,771 | ||||||
PNC Financial Services Group Inc/The | 46,966 | 8,238 | ||||||
Popular Inc | 125,661 | 8,836 | ||||||
Progressive Corp/The | 44,272 | 4,233 | ||||||
Prudential Financial Inc | 17,700 | 1,612 | ||||||
Regions Financial Corp | 599,114 | 12,378 | ||||||
S&P Global Inc | 18,482 | 6,522 | ||||||
SLM Corp | 230,135 | 4,135 | ||||||
State Street Corp | 149,070 | 12,523 | ||||||
T Rowe Price Group Inc | 24,474 | 4,200 | ||||||
Travelers Cos Inc/The | 119,703 | 18,003 | ||||||
Truist Financial Corp | 231,092 | 13,477 | ||||||
Two Harbors Investment Corp ‡ | 687,049 | 5,036 | ||||||
Unum Group | 271,856 | 7,566 | ||||||
US Bancorp | 573,724 | 31,733 | ||||||
Voya Financial Inc | 156,840 | 9,981 | ||||||
Wells Fargo & Co | 92,870 | 3,628 | ||||||
Zions Bancorp NA | 374,800 | 20,599 | ||||||
|
|
| ||||||
| 761,300 | ||||||||
|
|
| ||||||
Health Care — 14.6% |
| |||||||
Abbott Laboratories | 84,496 | 10,126 | ||||||
AbbVie Inc | 92,048 | 9,962 | ||||||
Alexion Pharmaceuticals Inc * | 57,862 | 8,848 | ||||||
| Description | Shares | Market Value ($ Thousands) | ||||||
COMMON STOCK (continued) |
| |||||||
AmerisourceBergen Corp, Cl A | 137,635 | $ | 16,251 | |||||
Amgen Inc, Cl A | 145,948 | 36,313 | ||||||
Anthem Inc | 10,844 | 3,892 | ||||||
Baxter International Inc | 63,282 | 5,337 | ||||||
Becton Dickinson and Co | 113,758 | 27,660 | ||||||
Biogen Inc * | 35,657 | 9,975 | ||||||
Bristol-Myers Squibb Co | 212,508 | 13,416 | ||||||
Cardinal Health Inc | 72,515 | 4,405 | ||||||
Centene Corp * | 30,902 | 1,975 | ||||||
Cigna Corp | 27,340 | 6,609 | ||||||
CVS Health Corp | 379,134 | 28,522 | ||||||
DaVita Inc * | 31,137 | 3,356 | ||||||
Edwards Lifesciences Corp, Cl A * | 61,914 | 5,178 | ||||||
Eli Lilly and Co | 110,545 | 20,652 | ||||||
Gilead Sciences Inc | 120,443 | 7,784 | ||||||
HCA Healthcare Inc | 109,165 | 20,560 | ||||||
Horizon Therapeutics PLC * | 73,523 | 6,767 | ||||||
Humana Inc | 22,738 | 9,533 | ||||||
IDEXX Laboratories Inc * | 41,683 | 20,396 | ||||||
Intuitive Surgical Inc * | 7,669 | 5,667 | ||||||
Jazz Pharmaceuticals PLC * | 7,310 | 1,202 | ||||||
Johnson & Johnson | 633,113 | 104,052 | ||||||
McKesson Corp | 12,923 | 2,521 | ||||||
Medtronic PLC | 127,025 | 15,006 | ||||||
Merck & Co Inc | 605,640 | 46,689 | ||||||
Mettler-Toledo International Inc * | 28,371 | 32,788 | ||||||
Novartis AG ADR | 159,076 | 13,598 | ||||||
Novo Nordisk A/S ADR (A) | 86,039 | 5,801 | ||||||
Pfizer Inc | 815,680 | 29,552 | ||||||
Teleflex Inc | 36,000 | 14,956 | ||||||
United Therapeutics Corp * | 38,304 | 6,407 | ||||||
UnitedHealth Group Inc | 167,008 | 62,139 | ||||||
Veeva Systems Inc, Cl A * | 18,537 | 4,843 | ||||||
Vertex Pharmaceuticals Inc * | 4,067 | 874 | ||||||
Viatris Inc, Cl W * | 87,616 | 1,224 | ||||||
Zoetis Inc, Cl A | 63,768 | 10,042 | ||||||
|
|
| ||||||
| 634,878 | ||||||||
|
|
| ||||||
Industrials — 9.6% |
| |||||||
3M Co | 131,281 | 25,295 | ||||||
A O Smith Corp | 43,114 | 2,915 | ||||||
AGCO Corp | 52,600 | 7,556 | ||||||
Allison Transmission Holdings Inc | 28,724 | 1,173 | ||||||
AMERCO * | 4,493 | 2,752 | ||||||
Carlisle Cos Inc | 6,137 | 1,010 | ||||||
Carrier Global Corp | 357,041 | 15,074 | ||||||
Caterpillar Inc, Cl A | 32,511 | 7,538 | ||||||
Chart Industries Inc * | 84,647 | 12,050 | ||||||
Cummins Inc | 8,214 | 2,128 | ||||||
Deere & Co | 27,326 | 10,224 | ||||||
Delta Air Lines Inc, Cl A * | 128,832 | 6,220 | ||||||
Eaton Corp PLC | 80,365 | 11,113 | ||||||
FedEx Corp | 22,692 | 6,445 | ||||||
| 2 | SEI Institutional Managed Trust / Semi-Annual Report / March 31, 2021 |
SCHEDULE OF INVESTMENTS (Unaudited)
March 31, 2021
Tax-Managed Large Cap Fund (Continued)
| Description | Shares | Market Value ($ Thousands) | ||||||
COMMON STOCK (continued) |
| |||||||
Fortive Corp | 96,601 | $ | 6,824 | |||||
Graco Inc | 542,313 | 38,840 | ||||||
Honeywell International Inc | 61,532 | 13,357 | ||||||
Huntington Ingalls Industries Inc, Cl A | 41,706 | 8,585 | ||||||
Illinois Tool Works Inc | 47,481 | 10,518 | ||||||
Johnson Controls International PLC | 494,338 | 29,497 | ||||||
L3Harris Technologies Inc | 25,220 | 5,112 | ||||||
Lockheed Martin Corp | 15,688 | 5,797 | ||||||
ManpowerGroup Inc | 18,167 | 1,797 | ||||||
Middleby Corp/The * | 100,000 | 16,575 | ||||||
Northrop Grumman Corp | 16,563 | 5,360 | ||||||
Oshkosh Corp | 61,954 | 7,352 | ||||||
Otis Worldwide Corp | 149,373 | 10,225 | ||||||
PACCAR Inc | 43,000 | 3,996 | ||||||
Raytheon Technologies Corp | 247,761 | 19,145 | ||||||
Robert Half International Inc | 25,692 | 2,006 | ||||||
Roper Technologies Inc | 56,426 | 22,759 | ||||||
Siemens AG ADR | 311,780 | 25,658 | ||||||
Southwest Airlines Co, Cl A * | 86,460 | 5,279 | ||||||
SPX Corp * | 148,826 | 8,672 | ||||||
Stanley Black & Decker Inc | 20,000 | 3,993 | ||||||
Textron Inc | 190,528 | 10,685 | ||||||
Timken Co/The | 112,333 | 9,118 | ||||||
TransDigm Group Inc * | 3,103 | 1,824 | ||||||
United Parcel Service Inc, Cl B | 10,520 | 1,788 | ||||||
Waste Management Inc | 18,232 | 2,352 | ||||||
WW Grainger Inc | 64,211 | 25,744 | ||||||
|
|
| ||||||
| 414,351 | ||||||||
|
|
| ||||||
Information Technology — 20.2% |
| |||||||
Adobe Inc * | 132,912 | 63,182 | ||||||
Amphenol Corp, Cl A | 104,624 | 6,902 | ||||||
Analog Devices Inc | 99,044 | 15,360 | ||||||
Apple Inc | 932,824 | 113,944 | ||||||
Applied Materials Inc | 183,527 | 24,519 | ||||||
Arista Networks Inc * | 26,270 | 7,931 | ||||||
ASML Holding NV, Cl G | 12,522 | 7,731 | ||||||
Broadcom Inc | 17,131 | 7,943 | ||||||
Cisco Systems Inc/Delaware | 498,298 | 25,767 | ||||||
Citrix Systems Inc | 44,716 | 6,276 | ||||||
Cognizant Technology Solutions Corp, Cl A | 8,912 | 696 | ||||||
Corning Inc, Cl B | 234,159 | 10,188 | ||||||
Crowdstrike Holdings Inc, Cl A * | 16,348 | 2,984 | ||||||
Dropbox Inc, Cl A * | 83,470 | 2,225 | ||||||
F5 Networks Inc, Cl A * | 53,596 | 11,181 | ||||||
Hewlett Packard Enterprise Co | 307,307 | 4,837 | ||||||
HP Inc | 480,394 | 15,252 | ||||||
Intel Corp | 571,741 | 36,591 | ||||||
International Business Machines Corp | 6,932 | 924 | ||||||
Intuit Inc | 156,005 | 59,759 | ||||||
Juniper Networks Inc | 7,046 | 178 | ||||||
Keysight Technologies Inc * | 96,705 | 13,868 | ||||||
Lam Research Corp | 22,006 | 13,099 | ||||||
| Description | Shares | Market Value ($ Thousands) | ||||||
COMMON STOCK (continued) |
| |||||||
Marvell Technology Group Ltd | 208,440 | $ | 10,209 | |||||
Mastercard Inc, Cl A | 175,853 | 62,612 | ||||||
Microchip Technology Inc | 289,399 | 44,921 | ||||||
Micron Technology Inc * | 156,515 | 13,806 | ||||||
Microsoft Corp | 486,353 | 114,667 | ||||||
Motorola Solutions Inc | 22,111 | 4,158 | ||||||
NetApp Inc | 45,929 | 3,338 | ||||||
Oracle Corp, Cl B | 512,747 | 35,979 | ||||||
Qorvo Inc * | 23,736 | 4,337 | ||||||
QUALCOMM Inc | 67,431 | 8,941 | ||||||
salesforce.com Inc * | 15,984 | 3,387 | ||||||
SAP SE ADR *(A) | 7,111 | 873 | ||||||
Seagate Technology PLC | 112,151 | 8,608 | ||||||
ServiceNow Inc * | 12,689 | 6,346 | ||||||
Texas Instruments Inc | 44,297 | �� | 8,372 | |||||
VeriSign Inc * | 91,384 | 18,164 | ||||||
Visa Inc, Cl A | 275,684 | 58,371 | ||||||
Vishay Intertechnology Inc | 240,771 | 5,798 | ||||||
Vontier * | 27,948 | 846 | ||||||
Western Digital Corp * | 33,750 | 2,253 | ||||||
Xerox Holdings Corp | 253,986 | 6,164 | ||||||
Zendesk Inc * | 29,165 | 3,868 | ||||||
|
|
| ||||||
| 877,355 | ||||||||
|
|
| ||||||
Materials — 5.4% |
| |||||||
Air Products and Chemicals Inc | 46,985 | 13,219 | ||||||
Cabot Corp | 119,095 | 6,245 | ||||||
Celanese Corp, Cl A | 28,298 | 4,239 | ||||||
Corteva Inc | 64,004 | 2,984 | ||||||
Domtar Corp * | 35,648 | 1,317 | ||||||
Dow Inc | 247,495 | 15,825 | ||||||
DuPont de Nemours Inc | 43,599 | 3,369 | ||||||
Eastman Chemical Co | 165,233 | 18,196 | ||||||
Ecolab Inc | 83,739 | 17,926 | ||||||
Freeport-McMoRan Inc, Cl B | 92,059 | 3,032 | ||||||
Huntsman Corp | 531,983 | 15,337 | ||||||
Ingevity Corp * | 14,131 | 1,067 | ||||||
International Paper Co | 135,045 | 7,302 | ||||||
Linde PLC | 123,959 | 34,726 | ||||||
LyondellBasell Industries NV, Cl A | 74,826 | 7,786 | ||||||
Newmont Corp | 98,126 | 5,914 | ||||||
O-I Glass Inc, Cl I * | 451,358 | 6,653 | ||||||
Reliance Steel & Aluminum Co | 18,766 | 2,858 | ||||||
Sherwin-Williams Co/The, Cl A | 66,555 | 49,118 | ||||||
Steel Dynamics Inc | 349,887 | 17,760 | ||||||
Westrock Co | 27,405 | 1,426 | ||||||
|
|
| ||||||
| 236,299 | ||||||||
|
|
| ||||||
Real Estate — 2.0% |
| |||||||
American Tower Corp, Cl A ‡ | 101,757 | 24,326 | ||||||
Brandywine Realty Trust ‡ | 24,300 | 314 | ||||||
CBRE Group Inc, Cl A *‡ | 41,173 | 3,257 | ||||||
Crown Castle International Corp ‡ | 40,644 | 6,996 | ||||||
SEI Institutional Managed Trust / Semi-Annual Report / March 31, 2021 | 3 |
SCHEDULE OF INVESTMENTS (Unaudited)
March 31, 2021
Tax-Managed Large Cap Fund (Continued)
| Description | Shares | Market Value ($ Thousands) | ||||||
COMMON STOCK (continued) |
| |||||||
Diversified Healthcare Trust ‡ | 636,083 | $ | 3,040 | |||||
Equinix Inc ‡ | 1,986 | 1,350 | ||||||
Equity Commonwealth *‡ | 207,840 | 5,778 | ||||||
Healthpeak Properties Inc ‡ | 502,660 | 15,954 | ||||||
Invitation Homes Inc ‡ | 28,203 | 902 | ||||||
Public Storage ‡ | 4,106 | 1,013 | ||||||
SBA Communications Corp, Cl A ‡ | 25,216 | 6,999 | ||||||
Service Properties Trust ‡ | 461,799 | 5,477 | ||||||
Welltower Inc ‡ | 146,710 | 10,509 | ||||||
|
|
| ||||||
| 85,915 | ||||||||
|
|
| ||||||
Utilities — 1.4% |
| |||||||
Ameren Corp | 65,226 | 5,307 | ||||||
American Electric Power Co Inc | 57,553 | 4,875 | ||||||
Duke Energy Corp | 92,514 | 8,930 | ||||||
Edison International | 40,300 | 2,362 | ||||||
Exelon Corp | 317,795 | 13,900 | ||||||
NextEra Energy Inc | 221,528 | 16,750 | ||||||
PPL Corp | 241,001 | 6,951 | ||||||
UGI Corp | 29,973 | 1,229 | ||||||
| Description | Shares | Market Value ($ Thousands) | ||||||
COMMON STOCK (continued) |
| |||||||
Vistra Corp | 40,284 | $ | 712 | |||||
|
|
| ||||||
| 61,016 | ||||||||
|
|
| ||||||
Total Common Stock | 4,327,903 | |||||||
|
|
| ||||||
AFFILIATED PARTNERSHIP — 0.0% | ||||||||
SEI Liquidity Fund, L.P. | ||||||||
0.020% **†(B) | 1,154,929 | 1,157 | ||||||
|
|
| ||||||
Total Affiliated Partnership | 1,157 | |||||||
|
|
| ||||||
CASH EQUIVALENT — 2.4% | ||||||||
SEI Daily Income Trust, Government Fund, Cl F | ||||||||
0.010%**† | 105,365,872 | 105,366 | ||||||
|
|
| ||||||
Total Cash Equivalent | 105,366 | |||||||
|
|
| ||||||
Total Investments in Securities — 102.0% |
| $ | 4,434,426 | |||||
|
|
| ||||||
A list of the open futures contracts held by the Fund at March 31, 2021 is as follows:
| ||||||||||||||||||||
Type of Contract | Number of Contracts Long/(Short) | Expiration Date | Notional Amount (Thousands) | Value (Thousands) | Unrealized Appreciation (Depreciation) (Thousands) | |||||||||||||||
| ||||||||||||||||||||
S&P 500 Index E-MINI | 39 | Jun-2021 | $ | 7,739 | $ | 7,736 | $ | (3 | ) | |||||||||||
S&P Mid Cap 400 Index E-MINI | 2 | Jun-2021 | 522 | 521 | (1 | ) | ||||||||||||||
| $ | 8,261 | $ | 8,257 | $ | (4 | ) | ||||||||||||||
Percentages are based on Net Assets of $4,348,154 ($ Thousands). |
| * | Non-income producing security. |
| ** | Rate shown is the 7-day effective yield as of March 31, 2021. |
| † | Investment in Affiliated Security (see Note 6). |
| ‡ | Real Estate Investment Trust. |
| (A) | Certain securities or partial positions of certain securities are on loan at March 31, 2021 (see Note 10). The total market value of securities on loan at March 31, 2021 was $1,141 ($ Thousands). |
| (B) | This security was purchased with cash collateral held from securities on loan (see Note 10). The total market value of such securities as of March 31, 2021 was $1,157 ($ Thousands). |
ADR — American Depositary Receipt
Cl — Class
L.P. — Limited Partnership
Ltd. — Limited
PLC — Public Limited Company
S&P— Standard & Poor’s
| 4 | SEI Institutional Managed Trust / Semi-Annual Report / March 31, 2021 |
SCHEDULE OF INVESTMENTS (Unaudited)
March 31, 2021
Tax-Managed Large Cap Fund (Continued)
The following is a list of the level of inputs used as of March 31, 2021, in valuing the Fund’s investments carried and other financial instruments at value ($ Thousands):
| Investments in Securities | Level 1 ($) | Level 2 ($) | Level 3 ($) | Total ($) | ||||||||||||
Common Stock | 4,327,903 | – | – | 4,327,903 | ||||||||||||
Affiliated Partnership | – | 1,157 | – | 1,157 | ||||||||||||
Cash Equivalent | 105,366 | – | – | 105,366 | ||||||||||||
|
|
|
|
|
|
|
|
|
|
|
| |||||
Total Investments in Securities | 4,433,269 | 1,157 | – | 4,434,426 | ||||||||||||
|
|
|
|
|
|
|
|
|
|
|
| |||||
| Other Financial Instruments | Level 1 ($) | Level 2 ($) | Level 3 ($) | Total ($) | ||||||||||||
Futures Contracts* | ||||||||||||||||
Unrealized Depreciation | (4 | ) | – | – | (4 | ) | ||||||||||
|
|
|
|
|
|
|
| |||||||||
Total Other Financial Instruments | (4 | ) | – | – | (4 | ) | ||||||||||
|
|
|
|
|
|
|
| |||||||||
* Futures contracts are valued at the unrealized depreciation on the instrument.
For the period ended March 31, 2021, there were no transfers in or out of Level 3.
For more information on valuation inputs, see Note 2 – Significant Accounting Policies in Notes to Financial Statements.
The following is a summary of the Fund’s transactions with affiliates for the period ended March 31, 2021 ($ Thousands):
| Security Description | Value 9/30/2020 | Purchases at Cost | Proceeds from Sales | Realized Gain/ (Loss) | Change in Unrealized Appreciation/ (Depreciation) | Value 3/31/2021 | Shares | Income | Capital Gains | |||||||||
SEI Liquidity Fund, L.P. | $48,578 | $159,168 | $ (206,600) | $ 8 | $ 3 | $ 1,157 | 1,154,929 | $ 45 | $— | |||||||||
SEI Daily Income Trust, Government Fund, Cl F | 21,668 | 317,706 | (234,008) | — | — | 105,366 | 105,365,872 | 1 | — | |||||||||
|
|
|
|
|
|
|
| |||||||||||
Totals | $70,246 | $476,874 | $ (440,608) | $ 8 | $ 3 | $ 106,523 | $ 46 | $— | ||||||||||
|
|
|
|
|
|
|
|
Amounts designated as “—” are either $0 or have been rounded to $0.
The accompanying notes are an integral part of the financial statements.
SEI Institutional Managed Trust / Semi-Annual Report / March 31, 2021 | 5 |
SCHEDULE OF INVESTMENTS (Unaudited)
March 31, 2021
S&P 500 Index Fund (Continued)
| Description | Shares | Market Value ($ Thousands) | ||||||
COMMON STOCK — 99.0% | ||||||||
Communication Services — 10.8% | ||||||||
Activision Blizzard Inc | 21,500 | $ | 2,000 | |||||
Alphabet Inc, Cl A * | 8,351 | 17,224 | ||||||
Alphabet Inc, Cl C * | 8,004 | 16,557 | ||||||
AT&T Inc | 197,993 | 5,993 | ||||||
Charter Communications Inc, Cl A * | 3,914 | 2,415 | ||||||
Comcast Corp, Cl A | 126,896 | 6,866 | ||||||
Discovery Inc, Cl A * | 4,500 | 196 | ||||||
Discovery Inc, Cl C * | 8,096 | 299 | ||||||
DISH Network Corp, Cl A * | 6,938 | 251 | ||||||
Electronic Arts Inc | 7,978 | 1,080 | ||||||
Facebook Inc, Cl A * | 66,813 | 19,678 | ||||||
Fox Corp | 13,719 | 490 | ||||||
Interpublic Group of Cos Inc/The | 10,601 | 310 | ||||||
Live Nation Entertainment Inc * | 4,000 | 339 | ||||||
Lumen Technologies Inc | 27,570 | 368 | ||||||
Netflix Inc * | 12,269 | 6,400 | ||||||
News Corp, Cl A | 10,675 | 271 | ||||||
News Corp, Cl B | 3,400 | 80 | ||||||
Omnicom Group Inc | 6,004 | 445 | ||||||
Take-Two Interactive Software Inc, Cl A * | 3,200 | 565 | ||||||
T-Mobile US Inc * | 16,200 | 2,030 | ||||||
Twitter Inc * | 22,300 | 1,419 | ||||||
Verizon Communications Inc | 114,896 | 6,681 | ||||||
ViacomCBS Inc, Cl B | 15,721 | 709 | ||||||
Walt Disney Co/The | 50,393 | 9,299 | ||||||
| 101,965 | ||||||||
Consumer Discretionary — 12.3% | ||||||||
Advance Auto Parts Inc | 1,800 | 330 | ||||||
Amazon.com Inc, Cl A * | 11,885 | 36,773 | ||||||
Aptiv PLC * | 7,521 | 1,037 | ||||||
AutoZone Inc * | 581 | 816 | ||||||
Best Buy Co Inc | 6,454 | 741 | ||||||
Booking Holdings Inc * | 1,156 | 2,693 | ||||||
BorgWarner Inc | 6,700 | 311 | ||||||
Caesars Entertainment Inc * | 5,800 | 507 | ||||||
CarMax Inc * | 4,500 | 597 | ||||||
Carnival Corp * | 22,284 | 591 | ||||||
Chipotle Mexican Grill Inc, Cl A * | 781 | 1,110 | ||||||
Darden Restaurants Inc | 3,618 | 514 | ||||||
Dollar General Corp | 6,781 | 1,374 | ||||||
Dollar Tree Inc * | 6,554 | 750 | ||||||
Domino’s Pizza Inc | 1,064 | 391 | ||||||
DR Horton Inc | 9,258 | 825 | ||||||
eBay Inc | 18,049 | 1,105 | ||||||
Etsy Inc * | 3,500 | 706 | ||||||
Expedia Group Inc | 3,855 | 664 | ||||||
Ford Motor Co * | 108,870 | 1,334 | ||||||
Gap Inc/The | 5,731 | 171 | ||||||
Garmin Ltd | 4,205 | 554 | ||||||
General Motors Co | 35,313 | 2,029 | ||||||
| Description | Shares | Market Value ($ Thousands) | ||||||
COMMON STOCK (continued) | ||||||||
Genuine Parts Co | 4,036 | $ | 467 | |||||
Hanesbrands Inc | 9,800 | 193 | ||||||
Hasbro Inc | 3,596 | 346 | ||||||
Hilton Worldwide Holdings Inc * | 7,700 | 931 | ||||||
Home Depot Inc/The | 29,895 | 9,125 | ||||||
L Brands Inc * | 6,527 | 404 | ||||||
Las Vegas Sands Corp | 9,100 | 553 | ||||||
Leggett & Platt Inc | 3,559 | 162 | ||||||
Lennar Corp, Cl A | 7,616 | 771 | ||||||
LKQ Corp * | 7,800 | 330 | ||||||
Lowe’s Cos Inc | 20,349 | 3,870 | ||||||
Marriott International Inc/MD, Cl A | 7,424 | 1,100 | ||||||
McDonald’s Corp | 20,738 | 4,648 | ||||||
MGM Resorts International | 11,500 | 437 | ||||||
Mohawk Industries Inc * | 1,600 | 308 | ||||||
Newell Brands Inc, Cl B | 10,555 | 283 | ||||||
NIKE Inc, Cl B | 35,323 | 4,694 | ||||||
Norwegian Cruise Line Holdings Ltd * | 10,200 | 281 | ||||||
NVR Inc * | 100 | 471 | ||||||
O’Reilly Automotive Inc * | 1,918 | 973 | ||||||
Penn National Gaming Inc * | 4,200 | 440 | ||||||
Pool Corp | 1,100 | 380 | ||||||
PulteGroup Inc | 7,399 | 388 | ||||||
PVH Corp | 1,959 | 207 | ||||||
Ralph Lauren Corp, Cl A | 1,405 | 173 | ||||||
Ross Stores Inc | 9,936 | 1,191 | ||||||
Royal Caribbean Cruises Ltd | 6,100 | 522 | ||||||
Starbucks Corp | 32,687 | 3,572 | ||||||
Tapestry Inc * | 7,519 | 310 | ||||||
Target Corp, Cl A | 13,928 | 2,759 | ||||||
Tesla Inc * | 21,334 | 14,250 | ||||||
TJX Cos Inc/The | 33,286 | 2,202 | ||||||
Tractor Supply Co | 3,280 | 581 | ||||||
Ulta Beauty Inc * | 1,547 | 478 | ||||||
Under Armour Inc, Cl A * | 5,305 | 118 | ||||||
Under Armour Inc, Cl C * | 5,149 | 95 | ||||||
VF Corp | 8,865 | 708 | ||||||
Whirlpool Corp | 1,751 | 386 | ||||||
Wynn Resorts Ltd | 2,700 | 338 | ||||||
Yum! Brands Inc | 8,370 | 905 | ||||||
| 116,273 | ||||||||
Consumer Staples — 6.1% | ||||||||
Altria Group Inc | 51,573 | 2,638 | ||||||
Archer-Daniels-Midland Co | 15,575 | 888 | ||||||
Brown-Forman Corp, Cl B | 5,165 | 356 | ||||||
Campbell Soup Co | 5,784 | 291 | ||||||
Church & Dwight Co Inc | 6,900 | 603 | ||||||
Clorox Co/The | 3,542 | 683 | ||||||
Coca-Cola Co/The | 107,649 | 5,674 | ||||||
Colgate-Palmolive Co | 23,495 | 1,852 | ||||||
Conagra Brands Inc | 13,565 | 510 | ||||||
Constellation Brands Inc, Cl A | 4,753 | 1,084 | ||||||
SEI Institutional Managed Trust / Semi-Annual Report / March 31, 2021 | 1 |
SCHEDULE OF INVESTMENTS (Unaudited)
March 31, 2021
S&P 500 Index Fund (Continued)
| Description | Shares | Market Value ($ Thousands) | ||||||
COMMON STOCK (continued) | ||||||||
Costco Wholesale Corp | 12,336 | $ | 4,348 | |||||
Estee Lauder Cos Inc/The, Cl A | 6,343 | 1,845 | ||||||
General Mills Inc | 17,086 | 1,048 | ||||||
Hershey Co/The | 4,112 | 650 | ||||||
Hormel Foods Corp | 7,908 | 378 | ||||||
J M Smucker Co/The | 3,053 | 386 | ||||||
Kellogg Co | 7,167 | 454 | ||||||
Kimberly-Clark Corp | 9,403 | 1,307 | ||||||
Kraft Heinz Co/The | 18,108 | 724 | ||||||
Kroger Co/The | 21,236 | 764 | ||||||
Lamb Weston Holdings Inc | 4,000 | 310 | ||||||
McCormick & Co Inc/MD | 6,932 | 618 | ||||||
Molson Coors Beverage Co, Cl B | 5,251 | 269 | ||||||
Mondelez International Inc, Cl A | 39,220 | 2,296 | ||||||
Monster Beverage Corp * | 10,354 | 943 | ||||||
PepsiCo Inc | 38,259 | 5,412 | ||||||
Philip Morris International Inc | 43,187 | 3,832 | ||||||
Procter & Gamble Co/The | 68,345 | 9,256 | ||||||
Sysco Corp, Cl A | 14,220 | 1,120 | ||||||
Tyson Foods Inc, Cl A | 8,203 | 610 | ||||||
Walgreens Boots Alliance Inc | 20,057 | 1,101 | ||||||
Walmart Inc | 38,456 | 5,223 | ||||||
| 57,473 | ||||||||
Energy — 2.8% | ||||||||
APA | 10,900 | 195 | ||||||
Baker Hughes Co, Cl A | 19,449 | 420 | ||||||
Cabot Oil & Gas Corp | 11,113 | 209 | ||||||
Chevron Corp | 53,478 | 5,604 | ||||||
ConocoPhillips | 37,790 | 2,002 | ||||||
Devon Energy Corp | 16,713 | 365 | ||||||
Diamondback Energy Inc, Cl A | 5,100 | 375 | ||||||
EOG Resources Inc | 16,146 | 1,171 | ||||||
Exxon Mobil Corp | 117,546 | 6,563 | ||||||
Halliburton Co | 24,742 | 531 | ||||||
Hess Corp | 7,575 | 536 | ||||||
HollyFrontier Corp | 4,300 | 154 | ||||||
Kinder Morgan Inc | 54,282 | 904 | ||||||
Marathon Oil Corp | 22,556 | 241 | ||||||
Marathon Petroleum Corp | 18,160 | 971 | ||||||
NOV Inc | 11,268 | 155 | ||||||
Occidental Petroleum Corp | 23,162 | 616 | ||||||
ONEOK Inc | 12,309 | 623 | ||||||
Phillips 66 | 12,175 | 993 | ||||||
Pioneer Natural Resources Co | 5,704 | 906 | ||||||
Schlumberger NV, Cl A | 38,900 | 1,058 | ||||||
Valero Energy Corp | 11,421 | 818 | ||||||
Williams Cos Inc/The | 33,869 | 802 | ||||||
| 26,212 | ||||||||
Financials — 11.2% | ||||||||
Aflac Inc | 17,934 | 918 | ||||||
Allstate Corp/The | 8,459 | 972 | ||||||
| Description | Shares | Market Value ($ Thousands) | ||||||
COMMON STOCK (continued) | ||||||||
American Express Co | 18,132 | $ | 2,565 | |||||
American International Group Inc | 24,035 | 1,111 | ||||||
Ameriprise Financial Inc | 3,284 | 763 | ||||||
Aon PLC, Cl A | 6,229 | 1,433 | ||||||
Arthur J Gallagher & Co | 5,400 | 674 | ||||||
Assurant Inc | 1,605 | 227 | ||||||
Bank of America Corp | 210,945 | 8,161 | ||||||
Bank of New York Mellon Corp/The | 22,599 | 1,069 | ||||||
Berkshire Hathaway Inc, Cl B * | 52,893 | 13,513 | ||||||
BlackRock Inc | 3,903 | 2,943 | ||||||
Capital One Financial Corp | 12,755 | 1,623 | ||||||
Cboe Global Markets Inc | 3,000 | 296 | ||||||
Charles Schwab Corp/The | 41,536 | 2,707 | ||||||
Chubb Ltd | 12,539 | 1,981 | ||||||
Cincinnati Financial Corp | 4,183 | 431 | ||||||
Citigroup Inc | 57,951 | 4,216 | ||||||
Citizens Financial Group Inc | 11,800 | 521 | ||||||
CME Group Inc | 9,967 | 2,035 | ||||||
Comerica Inc | 3,792 | 272 | ||||||
Discover Financial Services | 8,530 | 810 | ||||||
Everest Re Group Ltd | 1,137 | 282 | ||||||
Fifth Third Bancorp | 19,811 | 742 | ||||||
First Republic Bank/CA | 4,900 | 817 | ||||||
Franklin Resources Inc | 7,550 | 223 | ||||||
Globe Life Inc | 2,639 | 255 | ||||||
Goldman Sachs Group Inc/The | 9,565 | 3,128 | ||||||
Hartford Financial Services Group Inc/The | 9,886 | 660 | ||||||
Huntington Bancshares Inc/OH | 28,414 | 447 | ||||||
Intercontinental Exchange Inc | 15,605 | 1,743 | ||||||
Invesco Ltd | 10,500 | 265 | ||||||
JPMorgan Chase & Co | 84,676 | 12,890 | ||||||
KeyCorp | 26,783 | 535 | ||||||
Lincoln National Corp | 4,998 | 311 | ||||||
Loews Corp | 6,462 | 331 | ||||||
M&T Bank Corp | 3,625 | 550 | ||||||
MarketAxess Holdings Inc | 1,000 | 498 | ||||||
Marsh & McLennan Cos Inc | 14,159 | 1,725 | ||||||
MetLife Inc | 20,839 | 1,267 | ||||||
Moody’s Corp | 4,463 | 1,333 | ||||||
Morgan Stanley | 41,604 | 3,231 | ||||||
MSCI Inc, Cl A | 2,300 | 964 | ||||||
Nasdaq Inc, Cl A | 3,200 | 472 | ||||||
Northern Trust Corp | 5,809 | 611 | ||||||
People’s United Financial Inc | 11,400 | 204 | ||||||
PNC Financial Services Group Inc/The | 11,784 | 2,067 | ||||||
Principal Financial Group Inc, Cl A | 7,157 | 429 | ||||||
Progressive Corp/The | 16,285 | 1,557 | ||||||
Prudential Financial Inc | 11,066 | 1,008 | ||||||
Raymond James Financial Inc | 3,439 | 421 | ||||||
Regions Financial Corp | 26,763 | 553 | ||||||
S&P Global Inc | 6,651 | 2,347 | ||||||
State Street Corp | 9,845 | 827 | ||||||
| 2 | SEI Institutional Managed Trust / Semi-Annual Report / March 31, 2021 |
SCHEDULE OF INVESTMENTS (Unaudited)
March 31, 2021
S&P 500 Index Fund (Continued)
| Description | Shares | Market Value ($ Thousands) | ||||||
COMMON STOCK (continued) | ||||||||
SVB Financial Group, Cl B * | 1,400 | $ | 691 | |||||
Synchrony Financial | 15,263 | 621 | ||||||
T Rowe Price Group Inc | 6,340 | 1,088 | ||||||
Travelers Cos Inc/The | 7,056 | 1,061 | ||||||
Truist Financial Corp | 37,396 | 2,181 | ||||||
Unum Group | 5,661 | 157 | ||||||
US Bancorp | 37,923 | 2,097 | ||||||
W R Berkley Corp | 3,800 | 286 | ||||||
Wells Fargo & Co | 114,715 | 4,482 | ||||||
Willis Towers Watson PLC | 3,621 | 829 | ||||||
Zions Bancorp NA | 4,560 | 251 | ||||||
| 105,678 | ||||||||
Health Care — 12.9% | ||||||||
Abbott Laboratories | 49,199 | 5,896 | ||||||
AbbVie Inc | 49,050 | 5,308 | ||||||
ABIOMED Inc * | 1,200 | 382 | ||||||
Agilent Technologies Inc | 8,515 | 1,083 | ||||||
Alexion Pharmaceuticals Inc * | 6,100 | 933 | ||||||
Align Technology Inc * | 2,031 | 1,100 | ||||||
AmerisourceBergen Corp, Cl A | 4,096 | 484 | ||||||
Amgen Inc, Cl A | 16,022 | 3,986 | ||||||
Anthem Inc | 6,827 | 2,451 | ||||||
Baxter International Inc | 14,135 | 1,192 | ||||||
Becton Dickinson and Co | 8,021 | 1,950 | ||||||
Biogen Inc * | 4,249 | 1,189 | ||||||
Bio-Rad Laboratories Inc, Cl A * | 600 | 343 | ||||||
Boston Scientific Corp * | 39,312 | 1,519 | ||||||
Bristol-Myers Squibb Co | 62,197 | 3,927 | ||||||
Cardinal Health Inc | 8,159 | 496 | ||||||
Catalent Inc * | 4,600 | 484 | ||||||
Centene Corp * | 16,108 | 1,029 | ||||||
Cerner Corp | 8,500 | 611 | ||||||
Cigna Corp | 9,731 | 2,352 | ||||||
Cooper Cos Inc/The, Cl A | 1,400 | 538 | ||||||
CVS Health Corp | 36,376 | 2,736 | ||||||
Danaher Corp, Cl A | 17,630 | 3,968 | ||||||
DaVita Inc * | 2,005 | 216 | ||||||
DENTSPLY SIRONA Inc | 6,209 | 396 | ||||||
Dexcom Inc * | 2,648 | 952 | ||||||
Edwards Lifesciences Corp, Cl A * | 17,449 | 1,459 | ||||||
Eli Lilly and Co | 22,108 | 4,130 | ||||||
Gilead Sciences Inc | 34,884 | 2,254 | ||||||
HCA Healthcare Inc | 7,405 | 1,395 | ||||||
Henry Schein Inc * | 3,900 | 270 | ||||||
Hologic Inc * | 7,100 | 528 | ||||||
Humana Inc | 3,558 | 1,492 | ||||||
IDEXX Laboratories Inc * | 2,400 | 1,174 | ||||||
Illumina Inc * | 4,000 | 1,536 | ||||||
Incyte Corp * | 5,200 | 423 | ||||||
Intuitive Surgical Inc * | 3,255 | 2,405 | ||||||
IQVIA Holdings Inc * | 5,300 | 1,024 | ||||||
Johnson & Johnson | 73,025 | 12,002 | ||||||
| Description | Shares | Market Value ($ Thousands) | ||||||
COMMON STOCK (continued) | ||||||||
Laboratory Corp of America Holdings * | 2,663 | $ | 679 | |||||
McKesson Corp | 4,429 | 864 | ||||||
Medtronic PLC | 37,372 | 4,415 | ||||||
Merck & Co Inc | 70,276 | 5,418 | ||||||
Mettler-Toledo International Inc * | 650 | 751 | ||||||
PerkinElmer Inc | 3,140 | 403 | ||||||
Perrigo Co PLC | 3,704 | 150 | ||||||
Pfizer Inc | 154,856 | 5,610 | ||||||
Quest Diagnostics Inc | 3,724 | 478 | ||||||
Regeneron Pharmaceuticals Inc * | 2,959 | 1,400 | ||||||
ResMed Inc | 4,090 | 794 | ||||||
STERIS PLC | 2,389 | 455 | ||||||
Stryker Corp | 9,068 | 2,209 | ||||||
Teleflex Inc | 1,273 | 529 | ||||||
Thermo Fisher Scientific Inc | 10,969 | 5,006 | ||||||
UnitedHealth Group Inc | 26,208 | 9,751 | ||||||
Universal Health Services Inc, Cl B | 2,100 | 280 | ||||||
Varian Medical Systems Inc * | 2,605 | 460 | ||||||
Vertex Pharmaceuticals Inc * | 7,181 | 1,543 | ||||||
Viatris Inc, Cl W * | 33,557 | 469 | ||||||
Waters Corp * | 1,747 | 496 | ||||||
West Pharmaceutical Services Inc | 2,100 | 592 | ||||||
Zimmer Biomet Holdings Inc | 5,822 | 932 | ||||||
Zoetis Inc, Cl A | 13,246 | 2,086 | ||||||
| 121,383 | ||||||||
Industrials — 8.8% | ||||||||
3M Co | 16,076 | 3,098 | ||||||
A O Smith Corp | 3,700 | 250 | ||||||
Alaska Air Group Inc | 3,500 | 242 | ||||||
Allegion | 2,570 | 323 | ||||||
American Airlines Group Inc | 17,909 | 428 | ||||||
AMETEK Inc | 6,400 | 817 | ||||||
Boeing Co/The * | 15,177 | 3,866 | ||||||
Carrier Global Corp | 22,744 | 960 | ||||||
Caterpillar Inc, Cl A | 15,134 | 3,509 | ||||||
CH Robinson Worldwide Inc | 3,705 | 354 | ||||||
Cintas Corp | 2,468 | 842 | ||||||
Copart Inc * | 5,800 | 630 | ||||||
CSX Corp | 21,272 | 2,051 | ||||||
Cummins Inc | 4,144 | 1,074 | ||||||
Deere & Co | 8,742 | 3,271 | ||||||
Delta Air Lines Inc, Cl A * | 17,813 | 860 | ||||||
Dover Corp | 4,037 | 554 | ||||||
Eaton Corp PLC | 11,108 | 1,536 | ||||||
Emerson Electric Co | 16,715 | 1,508 | ||||||
Equifax Inc | 3,430 | 621 | ||||||
Expeditors International of Washington Inc | 4,761 | 513 | ||||||
Fastenal Co, Cl A | 16,018 | 805 | ||||||
FedEx Corp | 6,765 | 1,922 | ||||||
Fortive Corp | 9,387 | 663 | ||||||
Fortune Brands Home & Security Inc | 3,900 | 374 | ||||||
Generac Holdings Inc * | 1,700 | 557 | ||||||
SEI Institutional Managed Trust / Semi-Annual Report / March 31, 2021 | 3 |
SCHEDULE OF INVESTMENTS (Unaudited)
March 31, 2021
S&P 500 Index Fund (Continued)
| Description | Shares | Market Value ($ Thousands) | ||||||
COMMON STOCK (continued) | ||||||||
General Dynamics Corp | 6,459 | $ | 1,173 | |||||
General Electric Co | 243,309 | 3,195 | ||||||
Honeywell International Inc | 19,277 | 4,184 | ||||||
Howmet Aerospace Inc | 10,878 | 349 | ||||||
Huntington Ingalls Industries Inc, Cl A | 1,134 | 233 | ||||||
IDEX Corp | 2,100 | 440 | ||||||
IHS Markit Ltd | 10,400 | 1,006 | ||||||
Illinois Tool Works Inc | 7,965 | 1,764 | ||||||
Ingersoll Rand Inc * | 10,433 | 513 | ||||||
Jacobs Engineering Group Inc | 3,604 | 466 | ||||||
JB Hunt Transport Services Inc | 2,251 | 378 | ||||||
Johnson Controls International PLC | 19,999 | 1,193 | ||||||
Kansas City Southern | 2,500 | 660 | ||||||
L3Harris Technologies Inc | 5,709 | 1,157 | ||||||
Lockheed Martin Corp | 6,876 | 2,541 | ||||||
Masco Corp | 7,184 | 430 | ||||||
Nielsen Holdings PLC | 9,700 | 244 | ||||||
Norfolk Southern Corp | 7,030 | 1,888 | ||||||
Northrop Grumman Corp | 4,341 | 1,405 | ||||||
Old Dominion Freight Line Inc, Cl A | 2,700 | 649 | ||||||
Otis Worldwide Corp | 11,322 | 775 | ||||||
PACCAR Inc | 9,667 | 898 | ||||||
Parker-Hannifin Corp, Cl A | 3,571 | 1,126 | ||||||
Pentair PLC | 4,566 | 285 | ||||||
Quanta Services Inc | 3,800 | 334 | ||||||
Raytheon Technologies Corp | 42,160 | 3,258 | ||||||
Republic Services Inc | 5,783 | 575 | ||||||
Robert Half International Inc | 3,132 | 245 | ||||||
Rockwell Automation Inc | 3,230 | 857 | ||||||
Rollins Inc | 6,300 | 217 | ||||||
Roper Technologies Inc | 2,865 | 1,156 | ||||||
Snap-on Inc | 1,453 | 335 | ||||||
Southwest Airlines Co, Cl A | 16,462 | 1,005 | ||||||
Stanley Black & Decker Inc | 4,422 | 883 | ||||||
Teledyne Technologies Inc * | 1,000 | 414 | ||||||
Textron Inc | 6,407 | 359 | ||||||
Trane Technologies PLC | 6,604 | 1,093 | ||||||
TransDigm Group Inc * | 1,500 | 882 | ||||||
Union Pacific Corp | 18,574 | 4,094 | ||||||
United Airlines Holdings Inc * | 8,900 | 512 | ||||||
United Parcel Service Inc, Cl B | 19,972 | 3,395 | ||||||
United Rentals Inc * | 2,000 | 659 | ||||||
Verisk Analytics Inc, Cl A | 4,489 | 793 | ||||||
Waste Management Inc | 10,828 | 1,397 | ||||||
Westinghouse Air Brake Technologies Corp | 4,990 | 395 | ||||||
WW Grainger Inc | 1,231 | 494 | ||||||
Xylem Inc/NY | 5,000 | 526 | ||||||
| 82,458 | ||||||||
Information Technology — 26.4% | ||||||||
Accenture PLC, Cl A | 17,581 | 4,857 | ||||||
Adobe Inc * | 13,269 | 6,308 | ||||||
Advanced Micro Devices Inc * | 33,600 | 2,638 | ||||||
| Description | Shares | Market Value ($ Thousands) | ||||||
COMMON STOCK (continued) | ||||||||
Akamai Technologies Inc * | 4,504 | $ | 459 | |||||
Amphenol Corp, Cl A | 16,618 | 1,096 | ||||||
Analog Devices Inc | 10,271 | 1,593 | ||||||
ANSYS Inc * | 2,400 | 815 | ||||||
Apple Inc | 438,162 | 53,522 | ||||||
Applied Materials Inc | 25,450 | 3,400 | ||||||
Arista Networks Inc * | 1,500 | 453 | ||||||
Autodesk Inc, Cl A * | 6,066 | 1,681 | ||||||
Automatic Data Processing Inc | 11,859 | 2,235 | ||||||
Broadcom Inc | 11,316 | 5,247 | ||||||
Broadridge Financial Solutions Inc | 3,244 | 497 | ||||||
Cadence Design Systems Inc * | 7,800 | 1,068 | ||||||
CDW Corp/DE | 3,900 | 646 | ||||||
Cisco Systems Inc/Delaware | 117,161 | 6,058 | ||||||
Citrix Systems Inc | 3,442 | 483 | ||||||
Cognizant Technology Solutions Corp, Cl A | 14,705 | 1,149 | ||||||
Corning Inc, Cl B | 21,308 | 927 | ||||||
DXC Technology Co | 6,830 | 213 | ||||||
Enphase Energy Inc * | 3,600 | 584 | ||||||
F5 Networks Inc, Cl A * | 1,728 | 360 | ||||||
Fidelity National Information Services Inc, Cl B | 17,265 | 2,428 | ||||||
Fiserv Inc, Cl A * | 15,920 | 1,895 | ||||||
FleetCor Technologies Inc * | 2,269 | 609 | ||||||
FLIR Systems Inc | 3,500 | 198 | ||||||
Fortinet Inc * | 3,812 | 703 | ||||||
Gartner Inc * | 2,500 | 456 | ||||||
Global Payments Inc | 8,227 | 1,658 | ||||||
Hewlett Packard Enterprise Co | 36,091 | 568 | ||||||
HP Inc | 34,991 | 1,111 | ||||||
Intel Corp | 112,797 | 7,219 | ||||||
International Business Machines Corp | 24,848 | 3,311 | ||||||
Intuit Inc | 7,643 | 2,928 | ||||||
IPG Photonics Corp * | 1,000 | 211 | ||||||
Jack Henry & Associates Inc | 2,100 | 319 | ||||||
Juniper Networks Inc | 9,000 | 228 | ||||||
Keysight Technologies Inc * | 5,200 | 746 | ||||||
KLA Corp | 4,225 | 1,396 | ||||||
Lam Research Corp | 3,964 | 2,360 | ||||||
Leidos Holdings Inc | 3,800 | 366 | ||||||
Mastercard Inc, Cl A | 24,346 | 8,668 | ||||||
Maxim Integrated Products Inc | 7,500 | 685 | ||||||
Microchip Technology Inc | 7,304 | 1,134 | ||||||
Micron Technology Inc * | 31,069 | 2,741 | ||||||
Microsoft Corp | 209,415 | 49,374 | ||||||
Monolithic Power Systems Inc | 1,200 | 424 | ||||||
Motorola Solutions Inc | 4,689 | 882 | ||||||
NetApp Inc | 6,285 | 457 | ||||||
NortonLifeLock Inc | 16,247 | 345 | ||||||
NVIDIA Corp | 17,229 | 9,199 | ||||||
NXP Semiconductors NV | 7,700 | 1,550 | ||||||
Oracle Corp, Cl B | 51,523 | 3,615 | ||||||
| 4 | SEI Institutional Managed Trust / Semi-Annual Report / March 31, 2021 |
SCHEDULE OF INVESTMENTS (Unaudited)
March 31, 2021
S&P 500 Index Fund (Continued)
| Description | Shares | Market Value ($ Thousands) | ||||||
COMMON STOCK (continued) | ||||||||
Paychex Inc | 8,969 | $ | 879 | |||||
Paycom Software Inc * | 1,400 | 518 | ||||||
PayPal Holdings Inc * | 32,492 | 7,890 | ||||||
Qorvo Inc * | 3,100 | 566 | ||||||
QUALCOMM Inc | 31,554 | 4,184 | ||||||
salesforce.com Inc * | 25,521 | 5,407 | ||||||
Seagate Technology PLC | 5,600 | 430 | ||||||
ServiceNow Inc * | 5,406 | 2,704 | ||||||
Skyworks Solutions Inc | 4,604 | 845 | ||||||
Synopsys Inc * | 4,250 | 1,053 | ||||||
TE Connectivity Ltd | 9,209 | 1,189 | ||||||
Teradyne Inc | 4,600 | 560 | ||||||
Texas Instruments Inc | 25,503 | 4,820 | ||||||
Trimble Inc * | 7,000 | 545 | ||||||
Tyler Technologies Inc * | 1,100 | 467 | ||||||
VeriSign Inc * | 2,800 | 557 | ||||||
Visa Inc, Cl A | 47,061 | 9,964 | ||||||
Western Digital Corp | 8,574 | 572 | ||||||
Western Union Co/The | 11,334 | 279 | ||||||
Xilinx Inc | 6,853 | 849 | ||||||
Zebra Technologies Corp, Cl A * | 1,500 | 728 | ||||||
| 249,079 | ||||||||
Materials — 2.7% | ||||||||
Air Products and Chemicals Inc | 6,166 | 1,735 | ||||||
Albemarle Corp | 3,300 | 482 | ||||||
Amcor PLC | 43,532 | 509 | ||||||
Avery Dennison Corp | 2,315 | 425 | ||||||
Ball Corp | 9,172 | 777 | ||||||
Celanese Corp, Cl A | 3,200 | 479 | ||||||
CF Industries Holdings Inc | 5,850 | 265 | ||||||
Corteva Inc | 20,573 | 959 | ||||||
Dow Inc | 20,706 | 1,324 | ||||||
DuPont de Nemours Inc | 14,970 | 1,157 | ||||||
Eastman Chemical Co | 3,820 | 421 | ||||||
Ecolab Inc | 6,875 | 1,472 | ||||||
FMC Corp | 3,600 | 398 | ||||||
Freeport-McMoRan Inc, Cl B | 40,409 | 1,331 | ||||||
International Flavors & Fragrances Inc | 6,873 | 960 | ||||||
International Paper Co | 10,874 | 588 | ||||||
Linde PLC | 14,518 | 4,067 | ||||||
LyondellBasell Industries NV, Cl A | 7,074 | 736 | ||||||
Martin Marietta Materials Inc, Cl A | 1,719 | 577 | ||||||
Mosaic Co/The | 9,709 | 307 | ||||||
Newmont Corp | 22,325 | 1,346 | ||||||
Nucor Corp | 8,395 | 674 | ||||||
Packaging Corp of America | 2,700 | 363 | ||||||
PPG Industries Inc | 6,590 | 990 | ||||||
Sealed Air Corp | 4,328 | 198 | ||||||
Sherwin-Williams Co/The, Cl A | 2,195 | 1,620 | ||||||
Vulcan Materials Co | 3,649 | 616 | ||||||
| Description | Shares | Market Value ($ Thousands) | ||||||
COMMON STOCK (continued) | ||||||||
Westrock Co | 7,384 | $ | 384 | |||||
| 25,160 | ||||||||
Real Estate — 2.4% | ||||||||
Alexandria Real Estate Equities Inc ‡ | 3,400 | 559 | ||||||
American Tower Corp, Cl A ‡ | 12,295 | 2,939 | ||||||
AvalonBay Communities Inc ‡ | 3,915 | 722 | ||||||
Boston Properties Inc ‡ | 4,000 | 405 | ||||||
CBRE Group Inc, Cl A *‡ | 9,409 | 744 | ||||||
Crown Castle International Corp ‡ | 12,004 | 2,066 | ||||||
Digital Realty Trust Inc, Cl A ‡ | 7,769 | 1,094 | ||||||
Duke Realty Corp ‡ | 10,400 | 436 | ||||||
Equinix Inc ‡ | 2,439 | 1,658 | ||||||
Equity Residential ‡ | 9,544 | 684 | ||||||
Essex Property Trust Inc ‡ | 1,800 | 489 | ||||||
Extra Space Storage Inc ‡ | 3,700 | 490 | ||||||
Federal Realty Investment Trust ‡ | 1,800 | 183 | ||||||
Healthpeak Properties Inc ‡ | 15,200 | 482 | ||||||
Host Hotels & Resorts Inc ‡ | 19,674 | 332 | ||||||
Iron Mountain Inc ‡ | 8,038 | 298 | ||||||
Kimco Realty Corp ‡ | 11,613 | 218 | ||||||
Mid-America Apartment Communities Inc ‡ | 3,200 | 462 | ||||||
Prologis Inc ‡ | 20,620 | 2,186 | ||||||
Public Storage ‡ | 4,166 | 1,028 | ||||||
Realty Income Corp ‡ | 10,400 | 660 | ||||||
Regency Centers Corp ‡ | 4,399 | 250 | ||||||
SBA Communications Corp, Cl A ‡ | 3,049 | 846 | ||||||
Simon Property Group Inc ‡ | 8,906 | 1,013 | ||||||
UDR Inc ‡ | 8,200 | 360 | ||||||
Ventas Inc ‡ | 10,432 | 556 | ||||||
Vornado Realty Trust ‡ | 4,377 | 199 | ||||||
Welltower Inc ‡ | 11,600 | 831 | ||||||
Weyerhaeuser Co ‡ | 20,761 | 739 | ||||||
| 22,929 | ||||||||
Utilities — 2.6% | ||||||||
AES Corp/The | 18,690 | 501 | ||||||
Alliant Energy Corp | 6,900 | 374 | ||||||
Ameren Corp | 6,953 | 566 | ||||||
American Electric Power Co Inc | 13,815 | 1,170 | ||||||
American Water Works Co Inc | 5,000 | 749 | ||||||
Atmos Energy Corp | 3,400 | 336 | ||||||
CenterPoint Energy Inc | 15,485 | 351 | ||||||
CMS Energy Corp | 8,001 | 490 | ||||||
Consolidated Edison Inc | 9,533 | 713 | ||||||
Dominion Energy Inc | 22,487 | 1,708 | ||||||
DTE Energy Co | 5,445 | 725 | ||||||
Duke Energy Corp | 21,316 | 2,058 | ||||||
Edison International | 10,657 | 624 | ||||||
Entergy Corp | 5,526 | 550 | ||||||
Evergy Inc | 6,299 | 375 | ||||||
Eversource Energy | 9,535 | 826 | ||||||
Exelon Corp | 27,055 | 1,183 | ||||||
SEI Institutional Managed Trust / Semi-Annual Report / March 31, 2021 | 5 |
SCHEDULE OF INVESTMENTS (Unaudited)
March 31, 2021
S&P 500 Index Fund (Continued)
| Description | Shares | Market Value ($ Thousands) | ||||||
COMMON STOCK (continued) | ||||||||
FirstEnergy Corp | 15,023 | $ | 521 | |||||
NextEra Energy Inc | 54,380 | 4,112 | ||||||
NiSource Inc | 10,444 | 252 | ||||||
NRG Energy Inc | 6,613 | 249 | ||||||
Pinnacle West Capital Corp | 3,149 | 256 | ||||||
PPL Corp | 21,571 | 622 | ||||||
Public Service Enterprise Group Inc | 14,130 | 851 | ||||||
Sempra Energy | 8,445 | 1,120 | ||||||
Southern Co/The | 29,435 | 1,830 | ||||||
WEC Energy Group Inc | 8,819 | 825 | ||||||
| Description | Shares | Market Value ($ Thousands) | ||||||
COMMON STOCK (continued) |
| |||||||
Xcel Energy Inc | 14,736 | $ | 980 | |||||
| 24,917 | ||||||||
Total Common Stock (Cost $267,301) ($ Thousands) | 933,527 | |||||||
CASH EQUIVALENT — 0.7% | ||||||||
SEI Daily Income Trust, Government Fund, Cl F | ||||||||
0.010%**† | 6,427,474 | 6,427 | ||||||
Total Cash Equivalent | 6,427 | |||||||
Total Investments in Securities — 99.7% |
| $ | 939,954 | |||||
A list of the open futures contracts held by the Fund at March 31, 2021, is as follows:
Type of Contract | Number of Contracts Long | Expiration Date | Notional Amount (Thousands) | Value (Thousands) | Unrealized Appreciation (Thousands) | |||||||||||||
S&P 500 Index E-MINI | 38 | Jun-2021 | $ | 7,498 | $ | 7,538 | $ 40 | |||||||||||
Percentages are based on Net Assets of $942,319 ($ Thousands).
| * | Non-income producing security. |
| ** | The rate reported is the 7-day effective yield as of March 31, 2021. |
| † | Investment in Affiliated Security (see Note 6). |
| ‡ | Real Estate Investment Trust. |
Cl — Class
L.P. — Limited Partnership
Ltd. — Limited
PLC — Public Limited Company
S&P — Standard & Poor’s
The following is a list of the level of inputs used as of March 31, 2021, in valuing the Fund’s investments and other financial instruments carried at value ($ Thousands):
As of March 31, 2021, all of the Fund’s investments were considered Level 1, in accordance with the authoritative guidance on fair value measurements and disclosure under U.S. GAAP.
| Other Financial Instruments | Level 1 ($) | Level 2 ($) | Level 3 ($) | Total ($) | ||||||||||||
Futures Contracts* | ||||||||||||||||
Unrealized Appreciation | 40 | – | – | 40 | ||||||||||||
|
|
|
|
|
|
|
|
|
|
|
| |||||
Total Other Financial Instruments | 60 | – | – | 40 | ||||||||||||
|
|
|
|
|
|
|
|
|
|
|
| |||||
* Futures contracts are valued at the unrealized appreciation on the instrument.
For the period ended March 31, 2021, there were no transfers in or out of Level 3.
For more information on valuation inputs, see Note 2 – Significant Accounting Policies in Notes to
Financial Statements.
| 6 | SEI Institutional Managed Trust / Semi-Annual Report / March 31, 2021 |
SCHEDULE OF INVESTMENTS (Unaudited)
March 31, 2021
S&P 500 Index Fund (Continued)
The following is a summary of the Fund’s transactions with affiliates for the year ended September 30, 2020 ($ Thousands):
| Security Description | Value 9/30/2020 | Purchases at Cost | Proceeds from Sales | Realized Gain (Loss) | Change in Unrealized Appreciation (Depreciation) | Value 3/31/2021 | Shares | Income | Capital Gains | |||||||||
SEI Liquidity Fund, L.P. | $ 349 | $ 1,842 | $ (2,191) | $— | $— | $ — | — | $3 | $ — | |||||||||
SEI Daily Income Trust, Government Fund, Cl F | 12,428 | 45,940 | (51,941) | — | — | 6,427 | 6,427,474 | 1 | — | |||||||||
|
|
|
|
|
|
|
| |||||||||||
Totals | $12,777 | $47,782 | $(54,132) | $— | $— | $6,427 | $4 | $— | ||||||||||
|
|
|
|
|
|
|
|
Amounts designated as “—” are either $0 or have been rounded to $0.
The accompanying notes are an integral part of the financial statements.
SEI Institutional Managed Trust / Semi-Annual Report / March 31, 2021 | 7 |
SCHEDULE OF INVESTMENTS (Unaudited)
March 31, 2021
Small Cap Fund (Continued)
| Description | Shares | Market Value ($ Thousands) | ||||||
COMMON STOCK — 96.1% | ||||||||
Communication Services — 3.1% |
| |||||||
Boingo Wireless Inc * | 18,460 | $ | 260 | |||||
Boston Omaha Corp, Cl A * | 6,651 | 197 | ||||||
Cable One Inc | 709 | 1,296 | ||||||
Cars.com Inc * | 31,960 | 414 | ||||||
Cinemark Holdings Inc | 109,386 | 2,233 | ||||||
Cogent Communications Holdings Inc | 33,336 | 2,292 | ||||||
comScore Inc * | 61,033 | 223 | ||||||
Consolidated Communications Holdings Inc * | 99,586 | 717 | ||||||
EW Scripps Co/The, Cl A | 30,926 | 596 | ||||||
Iridium Communications Inc * | 16,191 | 668 | ||||||
Liberty Latin America Ltd, Cl A * | 13,280 | 170 | ||||||
Lions Gate Entertainment Corp, Cl A *(A) | 272,867 | 4,079 | ||||||
MediaAlpha Inc, Cl A * | 8,100 | 287 | ||||||
MSG Networks Inc * | 41,543 | 625 | ||||||
Nexstar Media Group Inc, Cl A | 13,784 | 1,936 | ||||||
Ooma Inc * | 30,733 | 487 | ||||||
QuinStreet Inc * | 54,671 | 1,110 | ||||||
TechTarget Inc * | 4,768 | 331 | ||||||
TEGNA Inc | 122,513 | 2,307 | ||||||
TripAdvisor Inc * | 9,393 | 505 | ||||||
TrueCar Inc * | 122,527 | 586 | ||||||
|
| |||||||
| 21,319 | ||||||||
|
| |||||||
Consumer Discretionary — 15.9% |
| |||||||
1-800-Flowers.com Inc, Cl A * | 22,280 | 615 | ||||||
Aaron’s Co Inc/The | 66,029 | 1,696 | ||||||
Abercrombie & Fitch Co, | 26,277 | 902 | ||||||
Academy Sports & Outdoors | 51,800 | 1,398 | ||||||
Advance Auto Parts Inc | 8,299 | 1,523 | ||||||
American Axle & Manufacturing Holdings Inc * | 22,340 | 216 | ||||||
American Eagle Outfitters Inc | 104,368 | 3,052 | ||||||
American Outdoor Brands | 30,348 | 765 | ||||||
American Public Education Inc * | 36,088 | 1,286 | ||||||
America’s Car-Mart Inc/TX * | 4,918 | 749 | ||||||
At Home Group Inc * | 28,437 | 816 | ||||||
Bally’s Corp | 12,515 | 813 | ||||||
Beazer Homes USA Inc, | 13,247 | 277 | ||||||
Biglari Holdings Inc, Cl B * | 1,426 | 189 | ||||||
Bloomin’ Brands Inc | 49,985 | 1,352 | ||||||
Boyd Gaming Corp * | 9,881 | 583 | ||||||
Brinker International Inc | 16,985 | 1,207 | ||||||
Brunswick Corp/DE | 28,098 | 2,680 | ||||||
Buckle Inc/The | 16,590 | 652 | ||||||
Caleres Inc | 29,580 | 645 | ||||||
Callaway Golf Co | 37,460 | 1,002 | ||||||
Carriage Services Inc | 35,589 | 1,252 | ||||||
Carter’s Inc | 12,683 | 1,128 | ||||||
Cato Corp/The, Cl A | 38,430 | 461 | ||||||
Century Communities Inc * | 22,258 | 1,343 | ||||||
| Description | Shares | Market Value ($ Thousands) | ||||||
COMMON STOCK (continued) | ||||||||
Churchill Downs Inc | 2,459 | $ | 559 | |||||
Chuy’s Holdings Inc * | 16,925 | 750 | ||||||
Citi Trends Inc | 8,845 | 741 | ||||||
Cooper-Standard Holdings | 44,867 | 1,630 | ||||||
Core-Mark Holding Co Inc, Cl A | 48,316 | 1,869 | ||||||
Crocs Inc * | 9,396 | 756 | ||||||
Dave & Buster’s Entertainment Inc | 14,589 | 699 | ||||||
Deckers Outdoor Corp * | 3,963 | 1,309 | ||||||
Del Taco Restaurants Inc | 15,540 | 149 | ||||||
Dick’s Sporting Goods Inc | 7,018 | 534 | ||||||
Domino’s Pizza Inc | 3,609 | 1,327 | ||||||
Dorman Products Inc * | 6,476 | 665 | ||||||
El Pollo Loco Holdings Inc * | 48,231 | 777 | ||||||
Ethan Allen Interiors Inc | 50,330 | 1,390 | ||||||
Fiesta Restaurant Group Inc * | 20,350 | 256 | ||||||
Fisker Inc *(A) | 21,284 | 366 | ||||||
Five Below Inc * | 3,150 | 601 | ||||||
Funko Inc, Cl A * | 25,500 | 502 | ||||||
Genesco Inc * | 3,350 | 159 | ||||||
Goodyear Tire & Rubber Co/The | 44,916 | 789 | ||||||
Green Brick Partners Inc * | 47,568 | 1,079 | ||||||
GrowGeneration Corp * | 13,145 | 653 | ||||||
Hamilton Beach Brands Holding Co, Cl A | 20,555 | 373 | ||||||
Haverty Furniture Cos Inc | 36,326 | 1,351 | ||||||
Hibbett Sports Inc * | 10,063 | 693 | ||||||
Hooker Furniture Corp | 31,656 | 1,154 | ||||||
Inspired Entertainment Inc * | 72,100 | 670 | ||||||
Installed Building Products Inc | 6,222 | 690 | ||||||
Johnson Outdoors Inc, Cl A | 10,311 | 1,472 | ||||||
KB Home | 33,971 | 1,581 | ||||||
Kontoor Brands Inc | 10,964 | 532 | ||||||
Lands’ End Inc * | 5,740 | 142 | ||||||
Lifetime Brands Inc | 38,080 | 559 | ||||||
Lithia Motors Inc, Cl A | 3,270 | 1,276 | ||||||
Lovesac Co/The * | 18,560 | 1,050 | ||||||
Lumber Liquidators Holdings Inc * | 6,060 | 152 | ||||||
M/I Homes Inc * | 13,521 | 799 | ||||||
Magnite Inc * | 8,746 | 364 | ||||||
Marine Products Corp | 9,863 | 160 | ||||||
MarineMax Inc * | 6,850 | 338 | ||||||
Marriott Vacations Worldwide Corp | 3,111 | 542 | ||||||
Mattel Inc * | 29,778 | 593 | ||||||
MDC Holdings Inc | 9,506 | 565 | ||||||
Modine Manufacturing Co * | 308,036 | 4,550 | ||||||
Monro Inc | 29,327 | 1,930 | ||||||
Motorcar Parts of America * | 8,030 | 181 | ||||||
Movado Group Inc | 18,066 | 514 | ||||||
Murphy USA Inc | 13,183 | 1,906 | ||||||
Nautilus Inc * | 10,130 | 158 | ||||||
Noodles & Co, Cl A * | 23,355 | 242 | ||||||
Norwegian Cruise Line Holdings Ltd *(A) | 72,423 | 1,998 | ||||||
Oxford Industries Inc, Cl A | 9,971 | 872 | ||||||
SEI Institutional Managed Trust / Semi-Annual Report / March 31, 2021 | 1 |
SCHEDULE OF INVESTMENTS (Unaudited)
March 31, 2021
Small Cap Fund (Continued)
| Description | Shares | Market Value ($ Thousands) | ||||||
COMMON STOCK (continued) |
| |||||||
Papa John’s International Inc, Cl A | 5,843 | $ | 518 | |||||
Penn National Gaming Inc * | 6,074 | 637 | ||||||
Penske Automotive Group Inc, Cl A | 7,137 | 573 | ||||||
Pool Corp | 4,404 | 1,520 | ||||||
Purple Innovation Inc, Cl A * | 7,102 | 225 | ||||||
Rent-A-Center Inc/TX | 28,068 | 1,618 | ||||||
Revolve Group Inc, Cl A * | 11,009 | 495 | ||||||
Rocky Brands Inc | 8,591 | 464 | ||||||
SeaWorld Entertainment Inc * | 10,903 | 542 | ||||||
Shake Shack Inc, Cl A * | 6,054 | 683 | ||||||
Shoe Carnival Inc | 14,989 | 928 | ||||||
Shutterstock Inc | 33,810 | 3,010 | ||||||
Skechers USA Inc, Cl A * | 12,955 | 540 | ||||||
Skyline Champion Corp * | 14,530 | 658 | ||||||
Sleep Number Corp * | 5,206 | 747 | ||||||
Smith & Wesson Brands Inc | 8,251 | 144 | ||||||
Sonos Inc * | 41,100 | 1,540 | ||||||
Sportsman’s Warehouse Holdings Inc * | 29,999 | 517 | ||||||
Steven Madden Ltd | 20,869 | 778 | ||||||
Superior Group of Cos Inc | 13,017 | 331 | ||||||
Taylor Morrison Home Corp, Cl A * | 78,818 | 2,428 | ||||||
Tempur Sealy International Inc | 15,781 | 577 | ||||||
Tenneco Inc, Cl A * | 17,500 | 188 | ||||||
Texas Roadhouse Inc, Cl A * | 6,035 | 579 | ||||||
Thor Industries Inc | 3,980 | 536 | ||||||
Tilly’s Inc, Cl A * | 104,470 | 1,183 | ||||||
Tractor Supply Co | 11,393 | 2,017 | ||||||
Travel + Leisure Co | 8,175 | 500 | ||||||
Turtle Beach Corp * | 27,150 | 724 | ||||||
Unifi Inc * | 56,178 | 1,548 | ||||||
Urban Outfitters Inc * | 79,389 | 2,952 | ||||||
Vera Bradley Inc * | 68,425 | 691 | ||||||
Vista Outdoor Inc * | 45,060 | 1,445 | ||||||
VOXX International Corp, Cl A * | 19,307 | 368 | ||||||
Waitr Holdings Inc * | 229,950 | 674 | ||||||
Weyco Group Inc | 8,886 | 192 | ||||||
Wingstop Inc, Cl A | 7,185 | 914 | ||||||
Winmark Corp | 4,492 | 837 | ||||||
XPEL Inc * | 25,952 | 1,348 | ||||||
YETI Holdings Inc * | 10,348 | 747 | ||||||
Zumiez Inc * | 14,742 | 632 | ||||||
|
| |||||||
| 109,117 | ||||||||
|
| |||||||
Consumer Staples — 4.9% |
| |||||||
Calavo Growers Inc | 19,399 | 1,506 | ||||||
Cal-Maine Foods Inc | 16,361 | 629 | ||||||
Casey’s General Stores Inc | 7,755 | 1,677 | ||||||
Celsius Holdings Inc * | 12,066 | 580 | ||||||
Central Garden & Pet Co, Cl A * | 31,515 | 1,746 | ||||||
Darling Ingredients Inc * | 16,218 | 1,193 | ||||||
elf Beauty Inc * | 24,595 | 660 | ||||||
Energizer Holdings Inc | 12,825 | 609 | ||||||
Freshpet Inc * | 4,507 | 716 | ||||||
| Description | Shares | Market Value ($ Thousands) | ||||||
COMMON STOCK (continued) |
| |||||||
Hain Celestial Group Inc/The * | 12,352 | $ | 539 | |||||
Hostess Brands Inc, Cl A * | 70,063 | 1,005 | ||||||
Ingles Markets Inc, Cl A | 12,340 | 761 | ||||||
Ingredion Inc | 19,702 | 1,772 | ||||||
Inter Parfums Inc | 10,100 | 716 | ||||||
Lamb Weston Holdings Inc | 17,609 | 1,364 | ||||||
Landec Corp * | 19,377 | 205 | ||||||
Lifevantage Corp * | 74,613 | 698 | ||||||
Medifast Inc | 5,271 | 1,116 | ||||||
MGP Ingredients Inc | 15,354 | 908 | ||||||
Natural Grocers by Vitamin Cottage Inc | 51,454 | 903 | ||||||
Pilgrim’s Pride Corp * | 155,282 | 3,694 | ||||||
Sanderson Farms Inc | 10,536 | 1,641 | ||||||
SpartanNash Co | 30,485 | 598 | ||||||
Spectrum Brands Holdings Inc | 7,747 | 658 | ||||||
Tootsie Roll Industries Inc | 34,702 | 1,150 | ||||||
TreeHouse Foods Inc * | 40,874 | 2,135 | ||||||
Turning Point Brands Inc | 24,577 | 1,282 | ||||||
United Natural Foods Inc * | 13,080 | 431 | ||||||
Utz Brands Inc | 22,247 | 551 | ||||||
Village Super Market Inc, Cl A | 22,923 | 540 | ||||||
WD-40 Co | 2,159 | 661 | ||||||
Weis Markets Inc | 19,991 | 1,130 | ||||||
|
| |||||||
| 33,774 | ||||||||
|
| |||||||
Energy — 3.0% |
| |||||||
Berry Corp | 32,860 | 181 | ||||||
Bonanza Creek Energy Inc * | 24,965 | 892 | ||||||
Cabot Oil & Gas Corp | 112,230 | 2,108 | ||||||
Cactus Inc, Cl A | 37,500 | 1,148 | ||||||
ChampionX Corp * | 33,646 | 731 | ||||||
Cimarex Energy Co | 60,973 | 3,621 | ||||||
Clean Energy Fuels Corp * | 30,422 | 418 | ||||||
Delek US Holdings Inc | 193,244 | 4,209 | ||||||
DHT Holdings Inc | 29,980 | 178 | ||||||
Diamondback Energy Inc, Cl A | 28,141 | 2,068 | ||||||
DMC Global Inc | 8,913 | 484 | ||||||
Helmerich & Payne Inc | 25,612 | 690 | ||||||
HollyFrontier Corp | 18,320 | 655 | ||||||
National Energy Services Reunited Corp * | 20,990 | 260 | ||||||
PDC Energy Inc, Cl A * | 26,422 | 909 | ||||||
Peabody Energy Corp * | 35,170 | 108 | ||||||
ProPetro Holding Corp * | 36,655 | 391 | ||||||
RPC Inc * | 34,660 | 187 | ||||||
Scorpio Tankers Inc | 17,160 | 317 | ||||||
Select Energy Services Inc, Cl A * | 34,427 | 171 | ||||||
Solaris Oilfield Infrastructure Inc, Cl A | 17,980 | 220 | ||||||
Talos Energy Inc * | 17,434 | 210 | ||||||
Texas Pacific Land Corp | 356 | 566 | ||||||
|
| |||||||
| 20,722 | ||||||||
|
| |||||||
Financials — 18.9% |
| |||||||
Affiliated Managers Group Inc | 6,554 | 977 | ||||||
| 2 | SEI Institutional Managed Trust / Semi-Annual Report / March 31, 2021 |
SCHEDULE OF INVESTMENTS (Unaudited)
March 31, 2021
Small Cap Fund (Continued)
| Description | Shares | Market Value ($ Thousands) | ||||||
COMMON STOCK (continued) |
| |||||||
Amalgamated Financial Corp | 21,600 | $ | 358 | |||||
Amerant Bancorp Inc, Cl A * | 7,966 | 148 | ||||||
American Equity Investment Life Holding Co | 88,923 | 2,804 | ||||||
Argo Group International Holdings Ltd | 28,204 | 1,419 | ||||||
Artisan Partners Asset Management Inc, Cl A | 16,185 | 844 | ||||||
Atlantic Capital Bancshares Inc * | 16,935 | 408 | ||||||
B Riley Financial Inc | 6,551 | 369 | ||||||
Banc of California Inc | 36,251 | 655 | ||||||
Banco Latinoamericano de Comercio Exterior SA, Cl E | 12,680 | 192 | ||||||
Bancorp Inc/The * | 14,058 | 291 | ||||||
Bank of Marin Bancorp | 10,419 | 408 | ||||||
Bank of NT Butterfield & Son Ltd/The | 50,867 | 1,944 | ||||||
Bank OZK | 51,428 | 2,101 | ||||||
BankUnited Inc | 183,162 | 8,050 | ||||||
Blackstone Mortgage Trust Inc, Cl A ‡ | 15,390 | 477 | ||||||
Bridgewater Bancshares Inc * | 14,250 | 230 | ||||||
BRP Group Inc, Cl A * | 11,981 | 326 | ||||||
Cadence BanCorp, Cl A | 36,563 | 758 | ||||||
Capital Bancorp Inc * | 11,076 | 214 | ||||||
Caretrust ‡ | 29,839 | 695 | ||||||
Carter Bankshares Inc * | 22,130 | 309 | ||||||
Central Pacific Financial Corp | 42,964 | 1,146 | ||||||
Chimera Investment Corp ‡ | 19,000 | 241 | ||||||
CNO Financial Group Inc | 207,866 | 5,049 | ||||||
Cohen & Steers Inc | 28,023 | 1,831 | ||||||
Community Bankers Trust Corp | 17,670 | 156 | ||||||
Community Financial Corp/The | 6,538 | 224 | ||||||
Cowen Inc, Cl A | 15,014 | 528 | ||||||
Crawford & Co, Cl A | 36,940 | 393 | ||||||
Curo Group Holdings Corp | 12,663 | 185 | ||||||
Customers Bancorp Inc * | 41,864 | 1,332 | ||||||
Donnelley Financial Solutions Inc * | 32,751 | 911 | ||||||
Dynex Capital Inc ‡ | 34,852 | 660 | ||||||
Enova International Inc * | 9,740 | 346 | ||||||
ESSA Bancorp Inc | 10,706 | 171 | ||||||
EZCORP Inc, Cl A * | 68,000 | 338 | ||||||
FactSet Research Systems Inc | 4,168 | 1,286 | ||||||
Farmers National Banc Corp | 21,760 | 363 | ||||||
Federated Hermes Inc, Cl B | 19,937 | 624 | ||||||
First Bancshares Inc/The | 5,573 | 204 | ||||||
First Citizens BancShares Inc/NC, Cl A | 716 | 598 | ||||||
First Commonwealth Financial Corp | 188,987 | 2,716 | ||||||
First Community Bankshares Inc | 45,619 | 1,368 | ||||||
First Financial Bankshares Inc, Cl A | 16,757 | 783 | ||||||
First Financial Corp/IN | 6,440 | 290 | ||||||
First Horizon Corp | 285,435 | 4,827 | ||||||
First Midwest Bancorp Inc/IL | 111,360 | 2,440 | ||||||
First of Long Island Corp/The | 13,501 | 287 | ||||||
Flagstar Bancorp Inc | 19,168 | 864 | ||||||
Flushing Financial Corp | 26,923 | 572 | ||||||
| Description | Shares | Market Value ($ Thousands) | ||||||
COMMON STOCK (continued) |
| |||||||
FNB Corp/PA | 524,247 | $ | 6,658 | |||||
Glacier Bancorp Inc, Cl A | 9,736 | 556 | ||||||
Globe Life Inc | 12,562 | 1,214 | ||||||
Granite Point Mortgage Trust Inc ‡ | 43,007 | 515 | ||||||
Greenhill & Co Inc | 25,637 | 423 | ||||||
Greenlight Capital Re Ltd, Cl A * | 19,430 | 169 | ||||||
Hanmi Financial Corp | 17,010 | 336 | ||||||
Hanover Insurance Group Inc/The, Cl A | 13,320 | 1,724 | ||||||
HarborOne Bancorp Inc | 74,190 | 999 | ||||||
HBT Financial Inc | 23,580 | 404 | ||||||
HCI Group Inc | 10,970 | 843 | ||||||
Hercules Capital Inc, Cl A | 99,630 | 1,597 | ||||||
Heritage Commerce Corp | 15,911 | 194 | ||||||
Heritage Insurance Holdings Inc | �� | 18,210 | 202 | |||||
Hilltop Holdings Inc | 23,298 | 795 | ||||||
Home BancShares Inc/AR | 79,031 | 2,138 | ||||||
HomeTrust Bancshares Inc | 13,650 | 332 | ||||||
Independent Bank Corp/MI | 8,850 | 209 | ||||||
Interactive Brokers Group Inc, Cl A | 6,984 | 510 | ||||||
Kemper Corp, Cl A | 11,820 | 942 | ||||||
LPL Financial Holdings Inc | 5,069 | 721 | ||||||
Macatawa Bank Corp | 36,993 | 368 | ||||||
MarketAxess Holdings Inc | 1,998 | 995 | ||||||
Mercantile Bank Corp | 7,970 | 259 | ||||||
Merchants Bancorp/IN | 21,737 | 912 | ||||||
Metropolitan Bank Holding | 7,379 | 372 | ||||||
MGIC Investment Corp | 143,739 | 1,991 | ||||||
Moelis & Co, Cl A | 13,522 | 742 | ||||||
Morningstar Inc, Cl A | 5,407 | 1,217 | ||||||
Mr Cooper Group Inc * | 13,086 | 455 | ||||||
Nelnet Inc, Cl A | 3,791 | 276 | ||||||
Northeast Bank | 8,680 | 229 | ||||||
OFG Bancorp | 90,969 | 2,058 | ||||||
OneMain Holdings Inc, Cl A | 11,016 | 592 | ||||||
OP Bancorp | 15,158 | 159 | ||||||
Oportun Financial Corp * | 11,720 | 243 | ||||||
Origin Bancorp Inc | 25,937 | 1,100 | ||||||
Pacific Premier Bancorp Inc | 18,725 | 813 | ||||||
PacWest Bancorp | 128,068 | 4,886 | ||||||
PCSB Financial Corp | 19,520 | 324 | ||||||
Peapack-Gladstone Financial Corp | 10,530 | 325 | ||||||
Peoples Bancorp Inc/OH | 30,640 | 1,016 | ||||||
Pinnacle Financial Partners Inc | 38,272 | 3,393 | ||||||
Piper Sandler Cos | 7,046 | 773 | ||||||
Popular Inc | 7,598 | 534 | ||||||
Premier Financial Corp | 24,568 | 817 | ||||||
Professional Holding Corp, | 10,139 | 186 | ||||||
Prosperity Bancshares Inc | 21,474 | 1,608 | ||||||
Provident Bancorp Inc | 14,136 | 204 | ||||||
Provident Financial Services Inc | 31,934 | 711 | ||||||
Pzena Investment Management Inc, Cl A | 33,840 | 356 | ||||||
RBB Bancorp | 22,380 | 454 | ||||||
SEI Institutional Managed Trust / Semi-Annual Report / March 31, 2021 | 3 |
SCHEDULE OF INVESTMENTS (Unaudited)
March 31, 2021
Small Cap Fund (Continued)
| Description | Shares | Market Value ($ Thousands) | ||||||
COMMON STOCK (continued) |
| |||||||
Ready Capital Corp ‡ | 10,327 | $ | 139 | |||||
Regional Management Corp | 6,593 | 229 | ||||||
Reliant Bancorp Inc | 27,679 | 795 | ||||||
Richmond Mutual BanCorp Inc | 12,940 | 175 | ||||||
Safeguard Scientifics Inc * | 55,761 | 380 | ||||||
Selectquote Inc * | 44,662 | 1,318 | ||||||
ServisFirst Bancshares Inc | 13,963 | 856 | ||||||
Signature Bank/New York NY, Cl B | 3,295 | 745 | ||||||
Silvercrest Asset Management Group Inc, Cl A | 10,380 | 149 | ||||||
StepStone Group Inc, Cl A | 42,675 | 1,505 | ||||||
Sterling Bancorp/DE | 103,926 | 2,392 | ||||||
Stewart Information Services Corp | 13,714 | 714 | ||||||
Towne Bank/Portsmouth VA | 25,025 | 761 | ||||||
Trean Insurance Group Inc * | 17,210 | 278 | ||||||
TriState Capital Holdings Inc * | 15,768 | 364 | ||||||
UMB Financial Corp | 7,610 | 703 | ||||||
Umpqua Holdings Corp | 324,780 | 5,700 | ||||||
United Community Banks Inc/GA | 22,597 | 771 | ||||||
Unity Bancorp Inc | 8,980 | 198 | ||||||
Universal Insurance Holdings Inc | 11,230 | 161 | ||||||
Univest Financial Corp | 65,422 | 1,870 | ||||||
Virtus Investment Partners Inc | 3,364 | 792 | ||||||
Waterstone Financial Inc | 58,405 | 1,193 | ||||||
Western Alliance Bancorp | 25,941 | 2,450 | ||||||
WisdomTree Investments Inc | 47,480 | 297 | ||||||
|
| |||||||
| 129,494 | ||||||||
|
| |||||||
Health Care — 10.3% |
| |||||||
Abeona Therapeutics Inc * | 186,340 | 350 | ||||||
Acadia Healthcare Co Inc, Cl A * | 10,749 | 614 | ||||||
Accuray Inc * | 67,774 | 336 | ||||||
Aclaris Therapeutics Inc * | 28,765 | 725 | ||||||
AdaptHealth Corp, Cl A * | 18,285 | 672 | ||||||
Affimed NV * | 151,129 | 1,195 | ||||||
Agenus Inc * | 219,838 | 598 | ||||||
Albireo Pharma Inc * | 6,240 | 220 | ||||||
Alphatec Holdings Inc * | 39,162 | 618 | ||||||
AMN Healthcare Services | 25,875 | 1,907 | ||||||
AnaptysBio Inc * | 37,990 | 819 | ||||||
Anika Therapeutics Inc * | 13,093 | 534 | ||||||
Apyx Medical Corp * | 28,295 | 273 | ||||||
Ardelyx Inc * | 25,938 | 172 | ||||||
Atreca Inc, Cl A * | 10,931 | 168 | ||||||
Avid Bioservices Inc * | 25,216 | 460 | ||||||
Avidity Biosciences Inc * | 31,920 | 696 | ||||||
BioDelivery Sciences International Inc * | 251,230 | 982 | ||||||
Blueprint Medicines Corp * | 5,716 | 556 | ||||||
Cassava Sciences Inc *(A) | 7,746 | 348 | ||||||
Castle Biosciences Inc * | 7,652 | 524 | ||||||
Chemed Corp | 3,172 | 1,459 | ||||||
Chiasma Inc * | 49,387 | 155 | ||||||
Co-Diagnostics Inc *(A) | 47,707 | 455 | ||||||
| Description | Shares | Market Value ($ Thousands) | ||||||
COMMON STOCK (continued) |
| |||||||
Computer Programs and Systems Inc | 8,980 | $ | 275 | |||||
Covetrus Inc * | 21,335 | 639 | ||||||
Cross Country Healthcare Inc * | 32,537 | 406 | ||||||
Cutera Inc * | 26,305 | 790 | ||||||
CytomX Therapeutics Inc * | 20,240 | 156 | ||||||
CytoSorbents Corp * | 29,819 | 259 | ||||||
Denali Therapeutics Inc * | 11,554 | 660 | ||||||
Dynavax Technologies Corp * | 47,290 | 465 | ||||||
Eagle Pharmaceuticals | 7,648 | 319 | ||||||
Eargo Inc * | 18,715 | 935 | ||||||
Electromed Inc * | 26,216 | 276 | ||||||
Encompass Health Corp | 18,110 | 1,483 | ||||||
Ensign Group Inc/The | 43,286 | 4,062 | ||||||
Envista Holdings Corp * | 38,404 | 1,567 | ||||||
Enzo Biochem Inc * | 115,676 | 398 | ||||||
Evolent Health Inc, Cl A * | 33,829 | 683 | ||||||
Five Prime Therapeutics Inc * | 7,490 | 282 | ||||||
Fluidigm Corp * | 35,140 | 159 | ||||||
Forma Therapeutics Holdings Inc * | 10,220 | 286 | ||||||
G1 Therapeutics Inc * | 9,327 | 224 | ||||||
Generation Bio Co * | 15,751 | 448 | ||||||
Glaukos Corp * | 6,491 | 545 | ||||||
Halozyme Therapeutics Inc * | 8,796 | 367 | ||||||
Harpoon Therapeutics Inc * | 8,046 | 168 | ||||||
HealthStream Inc * | 17,680 | 395 | ||||||
Heska Corp * | 7,827 | 1,319 | ||||||
Inari Medical Inc * | 7,206 | 771 | ||||||
Innoviva Inc * | 45,950 | 549 | ||||||
Inovalon Holdings Inc, Cl A * | 26,661 | 767 | ||||||
Inspire Medical Systems Inc * | 5,196 | 1,076 | ||||||
Integra LifeSciences Holdings Corp * | 28,724 | 1,985 | ||||||
Intersect ENT Inc * | 15,000 | 313 | ||||||
Invacare Corp | 25,330 | 203 | ||||||
iRadimed Corp * | 8,441 | 218 | ||||||
KalVista Pharmaceuticals Inc * | 14,317 | 368 | ||||||
Kindred Biosciences Inc * | 34,426 | 171 | ||||||
Kiniksa Pharmaceuticals Ltd, Cl A * | 7,285 | 135 | ||||||
LeMaitre Vascular Inc | 16,483 | 804 | ||||||
Luminex Corp | 59,658 | 1,903 | ||||||
Marinus Pharmaceuticals Inc * | 19,086 | 295 | ||||||
Medpace Holdings Inc * | 5,015 | 823 | ||||||
MeiraGTx Holdings plc * | 24,050 | 347 | ||||||
Meridian Bioscience Inc * | 12,984 | 341 | ||||||
Minerva Neurosciences Inc * | 70,990 | 207 | ||||||
Mirum Pharmaceuticals Inc * | 8,836 | 175 | ||||||
Mustang Bio Inc * | 52,838 | 175 | ||||||
Neoleukin Therapeutics Inc * | 13,200 | 163 | ||||||
NuVasive Inc * | 13,539 | 888 | ||||||
Omnicell Inc * | 4,586 | 596 | ||||||
OptimizeRx Corp * | 15,368 | 749 | ||||||
Organogenesis Holdings Inc, Cl A * | 69,249 | 1,262 | ||||||
Outset Medical Inc * | 23,430 | 1,274 | ||||||
| 4 | SEI Institutional Managed Trust / Semi-Annual Report / March 31, 2021 |
SCHEDULE OF INVESTMENTS (Unaudited)
March 31, 2021
Small Cap Fund (Continued)
| Description | Shares | Market Value ($ Thousands) | ||||||
COMMON STOCK (continued) |
| |||||||
Owens & Minor Inc | 40,686 | $ | 1,529 | |||||
Pacific Biosciences of California Inc * | 16,766 | 558 | ||||||
Pennant Group Inc/The * | 13,207 | 605 | ||||||
Pieris Pharmaceuticals Inc * | 62,273 | 160 | ||||||
PMV Pharmaceuticals Inc * | 3,050 | 100 | ||||||
Praxis Precision Medicines | 9,170 | 300 | ||||||
Precision BioSciences Inc * | 21,160 | 219 | ||||||
Prestige Consumer Healthcare Inc, Cl A * | 30,049 | 1,325 | ||||||
Protagonist Therapeutics Inc * | 23,029 | 596 | ||||||
Prothena Corp PLC * | 19,080 | 479 | ||||||
Pulmonx Corp * | 9,529 | 436 | ||||||
Quanterix Corp * | 10,796 | 631 | ||||||
Quest Diagnostics Inc | 11,336 | 1,455 | ||||||
Quotient Ltd * | 40,424 | 149 | ||||||
R1 RCM Inc * | 45,324 | 1,119 | ||||||
RAPT Therapeutics Inc * | 9,436 | 210 | ||||||
Rigel Pharmaceuticals Inc * | 142,406 | 487 | ||||||
Rocket Pharmaceuticals Inc * | 7,773 | 345 | ||||||
Rubius Therapeutics Inc * | 17,600 | 466 | ||||||
Scholar Rock Holding Corp * | 8,091 | 410 | ||||||
Select Medical Holdings Corp * | 46,469 | 1,585 | ||||||
Sharps Compliance Corp * | 11,950 | 172 | ||||||
SIGA Technologies Inc * | 57,085 | 371 | ||||||
Spectrum Pharmaceuticals | 100,256 | 327 | ||||||
Spero Therapeutics Inc * | 10,209 | 150 | ||||||
STERIS PLC | 9,294 | 1,770 | ||||||
Surgery Partners Inc * | 13,606 | 602 | ||||||
Surmodics Inc * | 6,790 | 381 | ||||||
Syros Pharmaceuticals Inc * | 34,962 | 262 | ||||||
Tenet Healthcare Corp * | 27,206 | 1,415 | ||||||
TG Therapeutics Inc * | 9,188 | 443 | ||||||
Ultragenyx Pharmaceutical | 4,890 | 557 | ||||||
Utah Medical Products Inc | 1,976 | 171 | ||||||
Vapotherm Inc * | 7,004 | 168 | ||||||
Vericel Corp * | 8,424 | 468 | ||||||
Viemed Healthcare Inc * | 106,934 | 1,082 | ||||||
Voyager Therapeutics Inc * | 30,880 | 145 | ||||||
|
| |||||||
| 70,608 | ||||||||
|
| |||||||
Industrials — 17.2% |
| |||||||
ABM Industries Inc | 36,159 | 1,845 | ||||||
ACCO Brands Corp | 521,799 | 4,404 | ||||||
Advanced Drainage Systems Inc | 14,784 | 1,529 | ||||||
AeroVironment Inc * | 3,548 | 412 | ||||||
AGCO Corp | 4,998 | 718 | ||||||
Air Lease Corp, Cl A | 22,289 | 1,092 | ||||||
Allegiant Travel Co, Cl A * | 2,293 | 560 | ||||||
Allied Motion Technologies Inc | 3,590 | 184 | ||||||
Altra Industrial Motion Corp | 37,870 | 2,095 | ||||||
ArcBest Corp | 12,124 | 853 | ||||||
Atkore Inc * | 23,948 | 1,722 | ||||||
Atlas Air Worldwide Holdings Inc * | 14,959 | 904 | ||||||
Avis Budget Group Inc * | 8,300 | 602 | ||||||
| Description | Shares | Market Value ($ Thousands) | ||||||
COMMON STOCK (continued) |
| |||||||
Badger Meter Inc | 15,324 | $ | 1,426 | |||||
Beacon Roofing Supply Inc * | 15,932 | 834 | ||||||
Builders FirstSource Inc * | 31,768 | 1,473 | ||||||
BWX Technologies Inc, Cl W | 44,679 | 2,946 | ||||||
CAI International Inc | 40,313 | 1,835 | ||||||
Carlisle Cos Inc | 8,953 | 1,474 | ||||||
CECO Environmental Corp * | 34,573 | 274 | ||||||
Chart Industries Inc * | 3,880 | 552 | ||||||
CIRCOR International Inc * | 19,621 | 683 | ||||||
Clean Harbors Inc * | 19,441 | 1,634 | ||||||
Cornerstone Building Brands | 108,403 | 1,521 | ||||||
Covenant Logistics Group Inc, Cl A * | 26,918 | 554 | ||||||
CRA International Inc | 15,976 | 1,192 | ||||||
Daseke Inc * | 29,320 | 249 | ||||||
Ducommun Inc * | 13,275 | 797 | ||||||
DXP Enterprises Inc/TX * | 22,615 | 682 | ||||||
EMCOR Group Inc | 11,896 | 1,334 | ||||||
Energy Recovery Inc * | 77,498 | 1,421 | ||||||
Enerpac Tool Group Corp, Cl A | 28,723 | 750 | ||||||
Ennis Inc | 32,768 | 700 | ||||||
EnPro Industries Inc | 12,784 | 1,090 | ||||||
Evoqua Water Technologies Corp * | 28,000 | 736 | ||||||
Franklin Covey Co * | 15,530 | 439 | ||||||
Franklin Electric Co Inc | 8,889 | 702 | ||||||
Great Lakes Dredge & Dock Corp * | 24,150 | 352 | ||||||
Griffon Corp | 24,889 | 676 | ||||||
Harsco Corp * | 44,916 | 770 | ||||||
HC2 Holdings Inc * | 63,610 | 251 | ||||||
Heidrick & Struggles International Inc | 10,869 | 388 | ||||||
Helios Technologies Inc | 9,459 | 689 | ||||||
Herc Holdings Inc * | 5,713 | 579 | ||||||
Hexcel Corp, Cl A | 18,726 | 1,049 | ||||||
Hillenbrand Inc | 29,506 | 1,408 | ||||||
Huntington Ingalls Industries Inc, Cl A | 8,750 | 1,801 | ||||||
Huron Consulting Group Inc * | 20,495 | 1,033 | ||||||
Insteel Industries Inc | 5,891 | 182 | ||||||
ITT Inc | 21,240 | 1,931 | ||||||
JetBlue Airways Corp * | 191,611 | 3,897 | ||||||
John Bean Technologies Corp, Cl A | 4,997 | 666 | ||||||
KBR Inc | 15,000 | 576 | ||||||
Kelly Services Inc, Cl A | 23,053 | 513 | ||||||
Kforce Inc | 13,965 | 749 | ||||||
Korn Ferry | 28,181 | 1,758 | ||||||
Landstar System Inc | 8,150 | 1,345 | ||||||
Limbach Holdings Inc * | 29,636 | 313 | ||||||
Manitowoc Co Inc/The * | 12,260 | 253 | ||||||
ManTech International Corp/VA, Cl A | 16,854 | 1,466 | ||||||
Masonite International Corp * | 20,579 | 2,372 | ||||||
MasTec Inc * | 7,060 | 662 | ||||||
Matson Inc | 19,919 | 1,329 | ||||||
Mesa Air Group Inc * | 10,668 | 144 | ||||||
Middleby Corp/The * | 3,263 | 541 | ||||||
SEI Institutional Managed Trust / Semi-Annual Report / March 31, 2021 | 5 |
SCHEDULE OF INVESTMENTS (Unaudited)
March 31, 2021
Small Cap Fund (Continued)
| Description | Shares | Market Value ($ Thousands) | ||||||
COMMON STOCK (continued) |
| |||||||
Miller Industries Inc/TN | 5,529 | $ | 255 | |||||
Montrose Environmental Group Inc * | 14,553 | 730 | ||||||
MRC Global Inc * | 63,240 | 571 | ||||||
MSC Industrial Direct Co Inc, Cl A | 22,028 | 1,987 | ||||||
MYR Group Inc * | 10,411 | 746 | ||||||
Nordson Corp | 5,909 | 1,174 | ||||||
Northwest Pipe Co * | 15,641 | 523 | ||||||
nVent Electric PLC | 35,260 | 984 | ||||||
Oshkosh Corp | 5,110 | 606 | ||||||
Park Aerospace Corp | 43,210 | 571 | ||||||
Powell Industries Inc | 23,359 | 791 | ||||||
Primoris Services Corp | 38,577 | 1,278 | ||||||
Quanex Building Products Corp | 52,713 | 1,383 | ||||||
Quanta Services Inc | 6,436 | 566 | ||||||
Regal Beloit | 18,370 | 2,621 | ||||||
Resideo Technologies Inc * | 31,353 | 886 | ||||||
Resources Connection Inc | 25,631 | 347 | ||||||
REV Group Inc | 38,174 | 731 | ||||||
Rexnord Corp | 33,391 | 1,572 | ||||||
Robert Half International Inc | 6,954 | 543 | ||||||
Rush Enterprises Inc, Cl A | 15,489 | 772 | ||||||
Saia Inc * | 3,555 | 820 | ||||||
Shyft Group Inc/The | 27,864 | 1,037 | ||||||
Simpson Manufacturing Co Inc | 6,412 | 665 | ||||||
SiteOne Landscape Supply | 4,697 | 802 | ||||||
Snap-on Inc | 9,060 | 2,090 | ||||||
SP Plus Corp * | 6,803 | 223 | ||||||
SPX FLOW Inc | 22,153 | 1,403 | ||||||
Standex International Corp | 22,100 | 2,112 | ||||||
Sterling Construction Co Inc * | 16,440 | 381 | ||||||
Systemax Inc | 26,848 | 1,104 | ||||||
Team Inc * | 68,178 | 786 | ||||||
Terex Corp | 18,598 | 857 | ||||||
Tetra Tech Inc | 12,868 | 1,746 | ||||||
Textainer Group Holdings Ltd * | 60,148 | 1,723 | ||||||
Triton International Ltd | 20,817 | 1,145 | ||||||
Tutor Perini Corp * | 34,800 | 660 | ||||||
UFP Industries Inc | 11,171 | 847 | ||||||
UniFirst Corp/MA | 6,638 | 1,485 | ||||||
Universal Logistics Holdings Inc | 7,080 | 186 | ||||||
Upwork Inc * | 24,044 | 1,077 | ||||||
US Xpress Enterprises Inc, Cl A * | 16,512 | 194 | ||||||
Valmont Industries Inc | 2,947 | 700 | ||||||
Vectrus Inc * | 5,700 | 305 | ||||||
Veritiv Corp * | 11,420 | 486 | ||||||
Vicor Corp * | 7,429 | 632 | ||||||
Vidler Water Resouces Inc * | 17,824 | 159 | ||||||
Wabash National Corp | 32,734 | 615 | ||||||
WESCO International Inc * | 45,087 | 3,901 | ||||||
| Description | Shares | Market Value ($ Thousands) | ||||||
COMMON STOCK (continued) |
| |||||||
Willdan Group Inc * | 7,290 | $ | 299 | |||||
|
| |||||||
| 117,988 | ||||||||
|
| |||||||
Information Technology — 12.6% |
| |||||||
A10 Networks Inc * | 126,823 | 1,219 | ||||||
Agilysys Inc * | 3,537 | 170 | ||||||
Alliance Data Systems Corp | 33,369 | 3,740 | ||||||
Alpha & Omega Semiconductor Ltd * | 25,899 | 847 | ||||||
Ambarella Inc * | 5,694 | 572 | ||||||
American Software Inc/GA, Cl A | 20,197 | 418 | ||||||
AudioCodes Ltd | 49,947 | 1,348 | ||||||
Avaya Holdings Corp * | 21,546 | 604 | ||||||
Avid Technology Inc * | 41,362 | 873 | ||||||
Belden Inc | 8,624 | 383 | ||||||
Blackline Inc * | 5,398 | 585 | ||||||
BM Technologies Inc * | 2,934 | 34 | ||||||
Brightcove Inc * | 87,088 | 1,752 | ||||||
Broadridge Financial Solutions Inc | 8,816 | 1,350 | ||||||
Brooks Automation Inc | 8,887 | 726 | ||||||
CACI International Inc, Cl A * | 4,841 | 1,194 | ||||||
Calix Inc * | 31,550 | 1,094 | ||||||
Cambium Networks Corp * | 16,442 | 768 | ||||||
Casa Systems Inc * | 83,836 | 799 | ||||||
ChannelAdvisor Corp * | 34,631 | 816 | ||||||
CMC Materials Inc | 9,724 | 1,719 | ||||||
Cognex Corp | 12,034 | 999 | �� | |||||
Cohu Inc | 9,550 | 400 | ||||||
CommVault Systems Inc * | 12,949 | 835 | ||||||
Comtech Telecommunications Corp | 14,910 | 370 | ||||||
Cornerstone OnDemand Inc * | 13,399 | 584 | ||||||
Cree Inc * | 3,818 | 413 | ||||||
CyberOptics Corp * | 12,876 | 334 | ||||||
Digi International Inc * | 18,272 | 347 | ||||||
Digital Turbine Inc * | 15,247 | 1,225 | ||||||
Diodes Inc * | 6,330 | 505 | ||||||
DSP Group Inc * | 48,070 | 685 | ||||||
Echo Global Logistics Inc * | 20,255 | 636 | ||||||
eGain Corp * | 24,397 | 232 | ||||||
ExlService Holdings Inc * | 11,001 | 992 | ||||||
Extreme Networks Inc * | 77,713 | 680 | ||||||
FARO Technologies Inc * | 6,541 | 566 | ||||||
FormFactor Inc * | 17,521 | 790 | ||||||
Genasys Inc * | 44,101 | 295 | ||||||
GSI Technology Inc * | 32,018 | 214 | ||||||
Hackett Group Inc/The | 50,097 | 821 | ||||||
Harmonic Inc, Cl A * | 175,569 | 1,376 | ||||||
Ichor Holdings Ltd * | 15,770 | 848 | ||||||
II-VI Inc * | 8,446 | 577 | ||||||
International Money Express Inc * | 59,077 | 887 | ||||||
J2 Global Inc * | 31,467 | 3,772 | ||||||
Jabil Inc | 10,700 | 558 | ||||||
Jack Henry & Associates Inc | 7,579 | 1,150 | ||||||
Kimball Electronics Inc * | 8,329 | 215 | ||||||
| 6 | SEI Institutional Managed Trust / Semi-Annual Report / March 31, 2021 |
SCHEDULE OF INVESTMENTS (Unaudited)
March 31, 2021
Small Cap Fund (Continued)
| Description | Shares | Market Value ($ Thousands) | ||||||
COMMON STOCK (continued) |
| |||||||
Lattice Semiconductor Corp * | 17,266 | $ | 777 | |||||
Littelfuse Inc | 7,820 | 2,068 | ||||||
LiveRamp Holdings Inc * | 10,162 | 527 | ||||||
MACOM Technology Solutions Holdings Inc * | 27,777 | 1,612 | ||||||
Manhattan Associates Inc * | 4,024 | 472 | ||||||
MAXIMUS Inc | 16,291 | 1,451 | ||||||
Mitek Systems Inc * | 38,226 | 557 | ||||||
Napco Security Technologies Inc * | 15,801 | 550 | ||||||
NCR Corp * | 74,140 | 2,813 | ||||||
NeoPhotonics Corp * | 102,414 | 1,224 | ||||||
nLight Inc * | 28,636 | 928 | ||||||
PDF Solutions Inc * | 8,739 | 155 | ||||||
Photronics Inc * | 79,355 | 1,021 | ||||||
Power Integrations Inc | 21,554 | 1,756 | ||||||
QAD Inc, Cl A | 2,509 | 167 | ||||||
Rackspace Technology Inc * | 79,148 | 1,882 | ||||||
Ribbon Communications Inc * | 51,660 | 424 | ||||||
Rimini Street Inc * | 91,024 | 817 | ||||||
Rogers Corp * | 11,979 | 2,255 | ||||||
Sabre Corp * | 34,992 | 518 | ||||||
Sailpoint Technologies Holdings Inc * | 8,594 | 435 | ||||||
Sanmina Corp * | 13,793 | 571 | ||||||
Sapiens International Corp NV | 19,939 | 634 | ||||||
ScanSource Inc * | 6,070 | 182 | ||||||
SecureWorks Corp, Cl A * | 64,428 | 862 | ||||||
Semtech Corp * | 9,651 | 666 | ||||||
Silicon Motion Technology Corp ADR | 46,397 | 2,756 | ||||||
SMART Global Holdings Inc * | 28,814 | 1,326 | ||||||
Sprout Social Inc, Cl A * | 11,948 | 690 | ||||||
SPS Commerce Inc * | 6,032 | 599 | ||||||
StarTek Inc * | 32,064 | 255 | ||||||
Super Micro Computer Inc * | 71,106 | 2,777 | ||||||
Sykes Enterprises Inc * | 16,125 | 711 | ||||||
Synaptics Inc * | 6,231 | 844 | ||||||
SYNNEX Corp | 5,333 | 612 | ||||||
Tenable Holdings Inc * | 14,988 | 542 | ||||||
Teradata Corp * | 11,896 | 459 | ||||||
TTEC Holdings Inc | 15,710 | 1,578 | ||||||
Ultra Clean Holdings Inc * | 10,759 | 624 | ||||||
Universal Display Corp | 7,483 | 1,772 | ||||||
Veeco Instruments Inc * | 17,574 | 365 | ||||||
Viavi Solutions Inc * | 104,095 | 1,634 | ||||||
Vishay Intertechnology Inc | 34,023 | 819 | ||||||
Workiva Inc, Cl A * | 4,471 | 395 | ||||||
|
|
| ||||||
| 86,399 | ||||||||
|
|
| ||||||
Materials — 6.0% |
| |||||||
Alamos Gold Inc, Cl A | 77,709 | 607 | ||||||
Alcoa Corp * | 17,137 | 557 | ||||||
American Vanguard Corp, Cl B | 14,600 | 298 | ||||||
Amyris Inc *(A) | 28,120 | 537 | ||||||
Avient Corp | 16,884 | 798 | ||||||
| Description | Shares | Market Value ($ Thousands) | ||||||
COMMON STOCK (continued) |
| |||||||
B2Gold Corp | 447,146 | $ | 1,927 | |||||
Balchem Corp | 5,396 | 677 | ||||||
Boise Cascade Co | 24,764 | 1,482 | ||||||
Cabot Corp | 14,345 | 752 | ||||||
Century Aluminum Co * | 103,814 | 1,833 | ||||||
Clearwater Paper Corp * | 6,950 | 262 | ||||||
Commercial Metals Co, Cl A | 204,819 | 6,317 | ||||||
Domtar Corp | 63,503 | 2,346 | ||||||
Element Solutions Inc | 28,202 | 516 | ||||||
Forterra Inc * | 53,049 | 1,233 | ||||||
Gold Resource Corp | 72,971 | 193 | ||||||
Hawkins Inc | 5,804 | 195 | ||||||
Ingevity Corp * | 9,776 | 738 | ||||||
Innospec Inc | 8,301 | 852 | ||||||
Koppers Holdings Inc * | 18,557 | 645 | ||||||
Livent Corp * | 60,732 | 1,052 | ||||||
Louisiana-Pacific Corp | 32,858 | 1,822 | ||||||
MP Materials Corp *(A) | 11,635 | 418 | ||||||
Myers Industries Inc | 12,449 | 246 | ||||||
O-I Glass Inc, Cl I | 70,560 | 1,040 | ||||||
Olin Corp | 24,002 | 911 | ||||||
Quaker Chemical Corp | 5,518 | 1,345 | ||||||
Ranpak Holdings Corp, Cl A * | 18,180 | 365 | ||||||
Reliance Steel & Aluminum Co | 13,781 | 2,099 | ||||||
Resolute Forest Products Inc * | 66,854 | 732 | ||||||
Ryerson Holding Corp * | 49,426 | 842 | ||||||
Schnitzer Steel Industries Inc, Cl A | 32,335 | 1,351 | ||||||
Silgan Holdings Inc | 17,946 | 754 | ||||||
Stepan Co | 5,333 | 678 | ||||||
TimkenSteel Corp * | 25,640 | 301 | ||||||
Tredegar Corp | 15,620 | 234 | ||||||
Trinseo SA | 12,949 | 825 | ||||||
US Concrete Inc * | 7,799 | 572 | ||||||
Valvoline Inc | 42,869 | 1,118 | ||||||
W R Grace & Co | 22,079 | 1,322 | ||||||
|
|
| ||||||
| 40,792 | ||||||||
|
|
| ||||||
Real Estate — 2.3% |
| |||||||
Alexandria Real Estate Equities Inc ‡ | 9,166 | 1,506 | ||||||
American Campus Communities Inc ‡ | 23,164 | 1,000 | ||||||
Americold Realty Trust ‡ | 35,870 | 1,380 | ||||||
Broadstone Net Lease Inc, Cl A ‡ | 15,630 | 286 | ||||||
Columbia Property Trust Inc ‡ | 59,552 | 1,018 | ||||||
Corporate Office Properties Trust ‡ | 26,921 | 709 | ||||||
Global Medical REIT Inc ‡ | 24,160 | 317 | ||||||
Innovative Industrial Properties Inc, Cl A ‡ | 9,075 | 1,635 | ||||||
Kennedy-Wilson Holdings Inc ‡ | 70,836 | 1,432 | ||||||
Lexington Realty Trust, Cl B ‡ | 58,109 | 646 | ||||||
NETSTREIT Corp ‡ | 13,055 | 241 | ||||||
Newmark Group Inc, Cl A ‡ | 205,565 | 2,057 | ||||||
NexPoint Residential Trust Inc ‡ | 29,433 | 1,356 | ||||||
PotlatchDeltic Corp ‡ | 12,255 | 648 | ||||||
QTS Realty Trust Inc, Cl A ‡ | 20,690 | 1,284 | ||||||
SEI Institutional Managed Trust / Semi-Annual Report / March 31, 2021 | 7 |
SCHEDULE OF INVESTMENTS (Unaudited)
March 31, 2021
Small Cap Fund (Continued)
| Description | Shares | Market Value ($ Thousands) | ||||||
COMMON STOCK (continued) |
| |||||||
Retail Value Inc ‡ | 16,662 | $ | 312 | |||||
Tejon Ranch Co *‡ | 12,089 | 202 | ||||||
|
|
| ||||||
| 16,029 | ||||||||
|
|
| ||||||
Utilities — 1.9% |
| |||||||
Algonquin Power & Utilities Corp | 93,528 | 1,482 | ||||||
American States Water Co | 13,531 | 1,023 | ||||||
Artesian Resources Corp, Cl A | 6,596 | 260 | ||||||
Atlantic Power Corp * | 185,190 | 535 | ||||||
Black Hills Corp, Cl A | 16,242 | 1,085 | ||||||
Consolidated Water Co Ltd | 27,004 | 363 | ||||||
Genie Energy Ltd, Cl B | 60,030 | 381 | ||||||
IDACORP Inc, Cl A | 13,077 | 1,307 | ||||||
Portland General Electric Co | 63,870 | 3,032 | ||||||
Pure Cycle Corp * | 63,875 | 857 | ||||||
Spark Energy Inc, Cl A | 42,648 | 456 | ||||||
Spire Inc | 11,821 | 873 | ||||||
UGI Corp | 37,221 | 1,526 | ||||||
| 13,180 | ||||||||
|
|
| ||||||
Total Common Stock |
| 659,422 | ||||||
|
|
| ||||||
| Description | Shares | Market Value ($ Thousands) | ||||||
AFFILIATED PARTNERSHIP — 1.2% |
| |||||||
SEI Liquidity Fund, L.P. | ||||||||
0.020% **†(B) | 8,117,859 | $ | 8,119 | |||||
|
|
| ||||||
Total Affiliated Partnership |
| 8,119 | ||||||
|
|
| ||||||
CASH EQUIVALENT — 3.8% |
| |||||||
SEI Daily Income Trust, Government Fund, Cl F | ||||||||
0.010%**† | 25,893,125 | 25,893 | ||||||
|
|
| ||||||
Total Cash Equivalent |
| 25,893 | ||||||
|
|
| ||||||
Total Investments in Securities — 101.1% |
| $ | 693,434 | |||||
|
|
| ||||||
A list of the open futures contracts held at March 31, 2021 is as follows:
| Number of | Unrealized | |||||||||||||||||||
| Type of | Contracts | Expiration | Notional Amount | Value | Appreciation | |||||||||||||||
| Contract | Long | Date | (Thousands) | (Thousands) | (Thousands) | |||||||||||||||
Russell 2000 Index E-MINI | 41 | Jun-2021 | $ | 4,541 | $ | 4,556 | $ | 15 | ||||||||||||
|
|
| ||||||||||||||||||
Percentages are based on Net Assets of $685,895 ($ Thousands). |
| * | Non-income producing security. |
| ** | Rate shown is the 7-day effective yield as of March 31, 2021. |
| † | Investment in Affiliated Security (see Note 6). |
| ‡ | Real Estate Investment Trust. |
| (A) | Certain securities or partial positions of certain securities are on loan at March 31, 2021 (see Note 10). The total market value of securities on loan at March 31, 2021 was $6,203 ($ Thousands). |
| (B) | This security was purchased with cash collateral held from securities on loan (see Note 10). The total market value of such securities as of March 31, 2021 was $8,119 ($ Thousands). |
Cl — Class
L.P. — Limited Partnership
Ltd. — Limited
PLC — Public Limited Company
REIT — Real Estate investment Trust
SPX — Standard & Poor’s 500 Index
The following is a list of the level of inputs used as of March 31, 2021, in valuing the Fund’s investments and other financial instruments carried at value ($ Thousands):
| Level 1 | Level 2 | Level 3 | Total | |||||||||||||
| Investments in Securities | ($) | ($) | ($) | ($) | ||||||||||||
Common Stock | 659,422 | – | – | 659,422 | ||||||||||||
Affiliated Partnership | – | 8,119 | – | 8,119 | ||||||||||||
Cash Equivalent | 25,893 | – | – | 25,893 | ||||||||||||
|
|
|
|
|
|
|
|
|
|
|
| |||||
Total Investments in Securities | 685,315 | 8,119 | – | 693,434 | ||||||||||||
|
|
|
|
|
|
|
|
|
|
|
| |||||
| Level 1 | Level 2 | Level 3 | Total | |||||||||||||
| Other Financial Instruments | ($) | ($) | ($) | ($) | ||||||||||||
Futures Contracts* | ||||||||||||||||
Unrealized Appreciation | 15 | – | – | 15 | ||||||||||||
|
|
|
|
|
|
|
|
|
|
|
| |||||
Total Other Financial Instruments | 15 | – | – | 15 | ||||||||||||
|
|
|
|
|
|
|
|
|
|
|
| |||||
* Futures contracts are valued at the unrealized appreciation on the instrument.
For the period March 31, 2021, there were no transfers in or out of Level 3.
For more information on valuation inputs, see Note 2 – Significant Accounting Policies in Notes to
Financial Statements.
| 8 | SEI Institutional Managed Trust / Semi-Annual Report / March 31, 2021 |
SCHEDULE OF INVESTMENTS (Unaudited)
March 31, 2021
Small Cap Fund (Continued)
The following is a summary of the Fund’s transactions with affiliates for the period ended March 31, 2021 ($ Thousands):
| Change in | ||||||||||||||||||
| Unrealized | ||||||||||||||||||
| Proceeds from | Realized Gain/ | Appreciation/ | ||||||||||||||||
| Security Description | Value 9/30/2020 | Purchases at Cost | Sales | (Loss) | (Depreciation) | Value 3/31/2021 | Shares | Income | Capital Gains | |||||||||
SEI Liquidity Fund, L.P. | $14,415 | $ 49,219 | $(55,515) | $1 | $(1) | $ 8,119 | 8,117,859 | $84 | $— | |||||||||
SEI Daily Income Trust, Government Fund, Cl F | 9,347 | 145,852 | (129,306) | — | — | 25,893 | 25,893,125 | 1 | — | |||||||||
|
|
|
|
|
|
|
| |||||||||||
Totals | $23,762 | $195,071 | $(184,821) | $1 | $(1) | $34,012 | $85 | $— | ||||||||||
|
|
|
|
|
|
|
|
Amounts designated as “—” are either $0 or have been rounded to $0.
The accompanying notes are an integral part of the financial statements.
SEI Institutional Managed Trust / Semi-Annual Report / March 31, 2021 | 9 |
SCHEDULE OF INVESTMENTS (Unaudited)
March 31, 2021
Small Cap Value Fund (Continued)
| Description | Shares | Market Value ($ Thousands) | ||||||
COMMON STOCK — 94.5% | ||||||||
Communication Services — 3.9% | ||||||||
Alaska Communications Systems Group Inc | 11,754 | $ | 38 | |||||
AMC Networks Inc, Cl A *(A) | 19,895 | 1,058 | ||||||
Cars.com Inc * | 39,390 | 510 | ||||||
Cinemark Holdings Inc | 60,668 | 1,238 | ||||||
Entercom Communications Corp | 75,889 | 398 | ||||||
Entravision Communications Corp, Cl A | 12,376 | 50 | ||||||
EW Scripps Co/The, Cl A | 4,877 | 94 | ||||||
Gray Television Inc | 63,378 | 1,166 | ||||||
IDT Corp, Cl B * | 4,485 | 102 | ||||||
John Wiley & Sons Inc, Cl A | 44,260 | 2,399 | ||||||
Lions Gate Entertainment Corp, Cl A * | 151,338 | 2,262 | ||||||
MSG Networks Inc *(A) | 36,416 | 548 | ||||||
Nexstar Media Group Inc, Cl A | 38,144 | 5,357 | ||||||
Saga Communications Inc, Cl A | 482 | 11 | ||||||
TEGNA Inc | 61,761 | 1,163 | ||||||
Tribune Publishing Co | 3,954 | 71 | ||||||
Yelp Inc, Cl A * | 5,944 | 232 | ||||||
|
|
| ||||||
| 16,697 | ||||||||
|
|
| ||||||
Consumer Discretionary — 11.7% | ||||||||
Aaron’s Co Inc/The | 11,196 | 287 | ||||||
American Axle & Manufacturing Holdings Inc * | 77,014 | 744 | ||||||
American Eagle Outfitters Inc | 25,215 | 737 | ||||||
American Public Education Inc * | 3,640 | 130 | ||||||
Big Lots Inc (A) | 18,766 | 1,282 | ||||||
Biglari Holdings Inc, Cl A * | 20 | 13 | ||||||
Biglari Holdings Inc, Cl B * | 222 | 29 | ||||||
Bloomin’ Brands Inc | 27,706 | 749 | ||||||
Bluegreen Vacations Corp | 1,844 | 20 | ||||||
Brinker International Inc | 4,743 | 337 | ||||||
Carter’s Inc | 3,774 | 336 | ||||||
Citi Trends Inc | 2,480 | 208 | ||||||
Cooper Tire & Rubber Co | 24,989 | 1,399 | ||||||
Cooper-Standard Holdings Inc * | 24,870 | 903 | ||||||
Dana Inc | 61,414 | 1,494 | ||||||
Dave & Buster’s Entertainment Inc | 8,135 | 390 | ||||||
Deckers Outdoor Corp * | 1,643 | 543 | ||||||
Dick’s Sporting Goods Inc (A) | 19,196 | 1,462 | ||||||
Ethan Allen Interiors Inc | 15,889 | 439 | ||||||
Genesco Inc * | 9,950 | 473 | ||||||
G-III Apparel Group Ltd * | 28,133 | 848 | ||||||
Goodyear Tire & Rubber Co/The | 65,415 | 1,149 | ||||||
Group 1 Automotive Inc | 11,879 | 1,874 | ||||||
H&R Block Inc | 44,631 | 973 | ||||||
Haverty Furniture Cos Inc | 28,260 | 1,051 | ||||||
Helen of Troy Ltd *(A) | 6,099 | 1,285 | ||||||
Hibbett Sports Inc *(A) | 7,308 | 503 | ||||||
Johnson Outdoors Inc, Cl A | 1,135 | 162 | ||||||
KB Home | 27,608 | 1,285 | ||||||
Laureate Education Inc, Cl A * | 3,524 | 48 | ||||||
| Description | Shares | Market Value ($ Thousands) | ||||||
COMMON STOCK (continued) | ||||||||
La-Z-Boy Inc, Cl Z (A) | 25,380 | $ | 1,078 | |||||
Lithia Motors Inc, Cl A | 12,637 | 4,930 | ||||||
MarineMax Inc * | 4,173 | 206 | ||||||
MDC Holdings Inc | 27,129 | 1,611 | ||||||
Meritage Homes Corp * | 23,595 | 2,169 | ||||||
Modine Manufacturing Co * | 185,572 | 2,741 | ||||||
Movado Group Inc | 1,776 | 50 | ||||||
Murphy USA Inc | 5,939 | 859 | ||||||
Norwegian Cruise Line Holdings Ltd *(A) | 30,132 | 831 | ||||||
Office Depot Inc | 37,614 | 1,628 | ||||||
Perdoceo Education Corp * | 13,300 | 159 | ||||||
Rent-A-Center Inc/TX | 24,005 | 1,384 | ||||||
Sally Beauty Holdings Inc *(A) | 56,310 | 1,133 | ||||||
Shutterstock Inc | 484 | 43 | ||||||
Signet Jewelers Ltd * | 289 | 17 | ||||||
Skechers USA Inc, Cl A * | 7,236 | 302 | ||||||
Sleep Number Corp *(A) | 8,804 | 1,263 | ||||||
Smith & Wesson Brands Inc | 7,451 | 130 | ||||||
Sonic Automotive Inc, Cl A | 25,135 | 1,246 | ||||||
Taylor Morrison Home Corp, Cl A * | 50,018 | 1,541 | ||||||
Travel + Leisure Co | 7,858 | 481 | ||||||
Tri Pointe Homes Inc * | 83,048 | 1,691 | ||||||
Tupperware Brands Corp * | 34,251 | 905 | ||||||
Urban Outfitters Inc * | 27,235 | 1,013 | ||||||
Vera Bradley Inc * | 32,848 | 332 | ||||||
Williams-Sonoma Inc (A) | 4,652 | 834 | ||||||
Zumiez Inc * | 4,268 | 183 | ||||||
|
|
| ||||||
| 49,913 | ||||||||
|
|
| ||||||
Consumer Staples — 3.2% | ||||||||
Edgewell Personal Care Co | 27,811 | 1,101 | ||||||
Hostess Brands Inc, Cl A * | 240,489 | 3,449 | ||||||
Ingles Markets Inc, Cl A | 16,622 | 1,025 | ||||||
Lifevantage Corp * | 3,389 | 32 | ||||||
Medifast Inc | 59 | 12 | ||||||
Nature’s Sunshine Products Inc | 2,120 | 42 | ||||||
Nu Skin Enterprises Inc, Cl A | 8,664 | 458 | ||||||
Oil-Dri Corp of America | 373 | 13 | ||||||
Pilgrim’s Pride Corp * | 86,123 | 2,049 | ||||||
Seneca Foods Corp, Cl A * | 1,541 | 72 | ||||||
SpartanNash Co | 49,919 | 980 | ||||||
Spectrum Brands Holdings Inc | 25,349 | 2,155 | ||||||
Sprouts Farmers Market Inc *(A) | 25,245 | 672 | ||||||
Universal Corp/VA | 19,915 | 1,175 | ||||||
USANA Health Sciences Inc * | 2,115 | 206 | ||||||
Village Super Market Inc, Cl A (A) | 14,807 | 349 | ||||||
Weis Markets Inc | 2,209 | 125 | ||||||
|
|
| ||||||
| 13,915 | ||||||||
|
|
| ||||||
Energy — 3.1% | ||||||||
Arch Resources Inc | 4,173 | 174 | ||||||
Berry Corp | 15,384 | 85 | ||||||
Cabot Oil & Gas Corp | 19,892 | 374 | ||||||
SEI Institutional Managed Trust / Semi-Annual Report / March 31, 2021 | 1 |
SCHEDULE OF INVESTMENTS (Unaudited)
March 31, 2021
Small Cap Value Fund (Continued)
| Description | Shares | Market Value ($ Thousands) | ||||||
COMMON STOCK (continued) | ||||||||
Cimarex Energy Co | 29,157 | $ | 1,732 | |||||
CONSOL Energy Inc * | 6,437 | 62 | ||||||
Delek US Holdings Inc | 107,177 | 2,334 | ||||||
DHT Holdings Inc | 65,663 | 389 | ||||||
Diamond S Shipping Inc * | 6,054 | 61 | ||||||
Dorian LPG Ltd * | 8,509 | 112 | ||||||
HollyFrontier Corp | 10,218 | 366 | ||||||
International Seaways Inc | 4,358 | 84 | ||||||
Nabors Industries Ltd (A) | 951 | 89 | ||||||
National Energy Services Reunited Corp * | 50,880 | 629 | ||||||
Newpark Resources Inc, Cl A * | 19,600 | 61 | ||||||
NexTier Oilfield Solutions Inc * | 34,861 | 130 | ||||||
Overseas Shipholding Group Inc, Cl A * | 14,901 | 31 | ||||||
PDC Energy Inc, Cl A * | 11,307 | 389 | ||||||
Pioneer Natural Resources Co | 12,442 | 1,976 | ||||||
Rattler Midstream LP (B) | 99,832 | 1,061 | ||||||
Renewable Energy Group Inc *(A) | 3,024 | 200 | ||||||
SEACOR Holdings Inc, Cl A * | 2,380 | 97 | ||||||
Southwestern Energy Co *(A) | 160,945 | 748 | ||||||
Viper Energy Partners LP (B) | 63,825 | 929 | ||||||
World Fuel Services Corp | 36,733 | 1,293 | ||||||
|
|
| ||||||
| 13,406 | ||||||||
|
|
| ||||||
Financials — 24.3% | ||||||||
Affiliated Managers Group Inc | 3,632 | 541 | ||||||
Amalgamated Financial Corp | 3,178 | 53 | ||||||
American Equity Investment Life Holding Co | 52,694 | 1,662 | ||||||
Apollo Commercial Real Estate Finance Inc ‡ | 27,802 | 388 | ||||||
Arbor Realty Trust Inc ‡(A) | 71,563 | 1,138 | ||||||
Argo Group International Holdings Ltd | 15,643 | 787 | ||||||
Artisan Partners Asset Management Inc, Cl A | 9,581 | 500 | ||||||
Associated Banc-Corp | 78,192 | 1,669 | ||||||
Assured Guaranty Ltd | 17,319 | 732 | ||||||
Axis Capital Holdings Ltd | 16,331 | 810 | ||||||
Banco Latinoamericano de Comercio Exterior SA, Cl E | 41,177 | 623 | ||||||
Bancorp Inc/The * | 11,142 | 231 | ||||||
Bank of Princeton/The | 1,346 | 39 | ||||||
Bank7 Corp | 752 | 13 | ||||||
BankFinancial Corp | 3,403 | 35 | ||||||
BankUnited Inc | 90,582 | 3,981 | ||||||
BayCom Corp * | 2,606 | 47 | ||||||
BCB Bancorp Inc | 3,348 | 46 | ||||||
Berkshire Hills Bancorp Inc | 9,763 | 218 | ||||||
BGC Partners Inc, Cl A | 616,304 | 2,977 | ||||||
BlackRock Capital Investment Corp | 83,289 | 279 | ||||||
Brightsphere Investment Group Inc | 37,514 | 765 | ||||||
C&F Financial Corp | 1,326 | 59 | ||||||
Camden National Corp | 22,006 | 1,053 | ||||||
Capital Bancorp Inc * | 1,831 | 35 | ||||||
| Description | Shares | Market Value ($ Thousands) | ||||||
COMMON STOCK (continued) | ||||||||
Capstar Financial Holdings Inc | 3,460 | $ | 60 | |||||
Cathay General Bancorp | 28,110 | 1,146 | ||||||
Central Pacific Financial Corp | 18,447 | 492 | ||||||
Chemung Financial Corp | 767 | 32 | ||||||
CIT Group Inc | 44,492 | 2,292 | ||||||
CNO Financial Group Inc | 230,071 | 5,588 | ||||||
Codorus Valley Bancorp Inc | 2,321 | 43 | ||||||
Colony Bankcorp Inc | 1,734 | 27 | ||||||
Columbia Banking System Inc | 93,310 | 4,021 | ||||||
Community Trust Bancorp Inc | 10,791 | 475 | ||||||
Cowen Inc, Cl A | 6,600 | 232 | ||||||
Customers Bancorp Inc * | 9,945 | 316 | ||||||
Donegal Group Inc, Cl A | 401 | 6 | ||||||
Eagle Bancorp Montana Inc | 1,383 | 34 | ||||||
Enova International Inc * | 7,377 | 262 | ||||||
EZCORP Inc, Cl A * | 12,031 | 60 | ||||||
Federal Agricultural Mortgage Corp, Cl C | 14,644 | 1,475 | ||||||
Federated Hermes Inc, Cl B | 28,745 | 900 | ||||||
Fidelity National Financial Inc | 405 | 16 | ||||||
Financial Institutions Inc | 3,596 | 109 | ||||||
First BanCorp/Puerto Rico | 46,225 | 520 | ||||||
First Busey Corp | 13,128 | 337 | ||||||
First Business Financial Services Inc | 1,951 | 48 | ||||||
First Choice Bancorp (A) | 2,294 | 56 | ||||||
First Commonwealth Financial Corp | 175,092 | 2,516 | ||||||
First Foundation Inc | 7,854 | 184 | ||||||
First Horizon Corp | 202,315 | 3,421 | ||||||
First Internet Bancorp | 2,266 | 80 | ||||||
First Merchants Corp | 53,053 | 2,467 | ||||||
First Midwest Bancorp Inc/IL | 61,763 | 1,353 | ||||||
First Savings Financial Group Inc | 417 | 28 | ||||||
First United Corp | 959 | 17 | ||||||
Flagstar Bancorp Inc | 32,717 | 1,476 | ||||||
Flushing Financial Corp | 47,862 | 1,016 | ||||||
FNB Corp/PA | 251,885 | 3,199 | ||||||
FS Bancorp Inc | 845 | 57 | ||||||
FS KKR Capital Corp (A) | 32,541 | 645 | ||||||
Fulton Financial Corp | 66,372 | 1,130 | ||||||
GAMCO Investors Inc, Cl A | 1,342 | 25 | ||||||
Genworth Financial Inc, Cl A * | 74,253 | 246 | ||||||
Great Southern Bancorp Inc | 7,383 | 418 | ||||||
Greenlight Capital Re Ltd, Cl A * | 5,703 | 50 | ||||||
Hancock Whitney Corp, Cl A | 33,361 | 1,401 | ||||||
Hanmi Financial Corp | 29,114 | 574 | ||||||
Hanover Insurance Group Inc/The, Cl A | 6,429 | 832 | ||||||
Hercules Capital Inc, Cl A (A) | 34,439 | 552 | ||||||
Heritage Insurance Holdings Inc | 5,839 | 65 | ||||||
Hilltop Holdings Inc | 42,398 | 1,447 | ||||||
HomeStreet Inc | 22,772 | 1,004 | ||||||
Hope Bancorp Inc | 99,049 | 1,492 | ||||||
Independent Bank Corp/MI | 4,629 | 109 | ||||||
Invesco Mortgage Capital Inc ‡(A) | 223,010 | 894 | ||||||
| 2 | SEI Institutional Managed Trust / Semi-Annual Report / March 31, 2021 |
SCHEDULE OF INVESTMENTS (Unaudited)
March 31, 2021
Small Cap Value Fund (Continued)
| Description | Shares | Market Value ($ Thousands) | ||||||
COMMON STOCK (continued) | ||||||||
Investar Holding Corp | 2,270 | $ | 47 | |||||
Investors Bancorp Inc | 129,187 | 1,898 | ||||||
Landmark Bancorp Inc/Manhattan KS | 896 | 24 | ||||||
Level One Bancorp Inc (A) | 1,218 | 31 | ||||||
Luther Burbank Corp | 3,885 | 46 | ||||||
MainStreet Bancshares Inc *(A) | 1,638 | 34 | ||||||
Marlin Business Services Corp | 2,023 | 28 | ||||||
Merchants Bancorp/IN | 3,402 | 143 | ||||||
Mercury General Corp | 10,991 | 668 | ||||||
Meridian Corp | 1,238 | 32 | ||||||
Metropolitan Bank Holding Corp * | 1,552 | 78 | ||||||
MFA Financial Inc ‡ | 103,186 | 420 | ||||||
MGIC Investment Corp | 66,832 | 926 | ||||||
Midland States Bancorp Inc | 4,730 | 131 | ||||||
MidWestOne Financial Group Inc | 3,223 | 100 | ||||||
Navient Corp | 63,248 | 905 | ||||||
New Mountain Finance Corp (A) | 37,909 | 470 | ||||||
New Residential Investment Corp ‡ | 54,853 | 617 | ||||||
Northeast Bank | 582 | 15 | ||||||
Northrim BanCorp Inc | 1,283 | 55 | ||||||
OFG Bancorp | 123,495 | 2,793 | ||||||
Old National Bancorp/IN, Cl A | 42,235 | 817 | ||||||
OP Bancorp | 3,221 | 34 | ||||||
Oppenheimer Holdings Inc, Cl A | 4,435 | 178 | ||||||
Orrstown Financial Services Inc | 2,437 | 54 | ||||||
Pacific Premier Bancorp Inc | 60,330 | 2,621 | ||||||
PacWest Bancorp | 231,936 | 8,848 | ||||||
PCB Bancorp | 2,768 | 42 | ||||||
Peapack-Gladstone Financial Corp | 3,996 | 123 | ||||||
PennantPark Investment Corp | 65,424 | 370 | ||||||
PennyMac Mortgage Investment Trust ‡ | 27,811 | 545 | ||||||
Peoples Bancorp Inc/OH | 17,070 | 566 | ||||||
Peoples Bancorp of North Carolina Inc | 1,048 | 25 | ||||||
Popular Inc | 19,725 | 1,387 | ||||||
PROG Holdings Inc | 7,384 | 320 | ||||||
Radian Group Inc | 49,390 | 1,148 | ||||||
RBB Bancorp | 3,679 | 75 | ||||||
Republic Bancorp Inc/KY, Cl A | 26,740 | 1,184 | ||||||
Riverview Bancorp Inc | 5,079 | 35 | ||||||
Salisbury Bancorp Inc | 600 | 27 | ||||||
SB Financial Group Inc (A) | 569 | 10 | ||||||
Security National Financial Corp, Cl A * | 2,287 | 21 | ||||||
Silvercrest Asset Management Group Inc, Cl A | 2,144 | 31 | ||||||
Simmons First National Corp, Cl A | 41,766 | 1,239 | ||||||
SiriusPoint Ltd * | 17,010 | 173 | ||||||
South Plains Financial Inc | 2,373 | 54 | ||||||
Starwood Property Trust Inc ‡ | 200,873 | 4,970 | ||||||
Sterling Bancorp Inc/MI * | 3,961 | 22 | ||||||
Stewart Information Services Corp | 849 | 44 | ||||||
Synovus Financial Corp | 17,030 | 779 | ||||||
Tiptree Inc (A) | 6,331 | 57 | ||||||
| Description | Shares | Market Value ($ Thousands) | ||||||
COMMON STOCK (continued) | ||||||||
Two Harbors Investment Corp ‡ | 45,169 | $ | 331 | |||||
Umpqua Holdings Corp | 136,954 | 2,404 | ||||||
United Insurance Holdings Corp | 4,000 | 29 | ||||||
Universal Insurance Holdings Inc | 19,875 | 285 | ||||||
Waddell & Reed Financial Inc, Cl A | 18,176 | 455 | ||||||
Waterstone Financial Inc | 4,920 | 100 | ||||||
Watford Holdings Ltd * | 3,541 | 123 | ||||||
Western Asset Mortgage Capital Corp ‡(A) | 25,693 | 82 | ||||||
Western New England Bancorp Inc | 4,941 | 42 | ||||||
Zions Bancorp NA | 12,668 | 696 | ||||||
|
|
| ||||||
| 103,733 | ||||||||
|
|
| ||||||
Health Care — 3.8% | ||||||||
Allscripts Healthcare Solutions Inc * | 13,804 | 207 | ||||||
AMN Healthcare Services Inc * | 14,351 | 1,058 | ||||||
Catalyst Pharmaceuticals Inc *(A) | 21,220 | 98 | ||||||
Change Healthcare Inc * | 49,478 | 1,093 | ||||||
Co-Diagnostics Inc *(A) | 26,632 | 254 | ||||||
Coherus Biosciences Inc * | 13,073 | 191 | ||||||
Computer Programs and Systems Inc | 2,803 | 86 | ||||||
Eagle Pharmaceuticals Inc/DE *(A) | 2,295 | 96 | ||||||
Emergent BioSolutions * | 1,255 | 117 | ||||||
Five Star Senior Living Inc * | 4,399 | 27 | ||||||
Innoviva Inc * | 95,045 | 1,136 | ||||||
Integra LifeSciences Holdings Corp * | 6,182 | 427 | ||||||
Ironwood Pharmaceuticals Inc, Cl A * | 50,074 | 560 | ||||||
Lannett Co Inc *(A) | 19,342 | 102 | ||||||
Ligand Pharmaceuticals Inc *(A) | 243 | 37 | ||||||
Magellan Health Inc * | 5,003 | 466 | ||||||
MEDNAX Inc *(A) | 27,322 | 696 | ||||||
ModivCare Inc * | 820 | 121 | ||||||
National HealthCare Corp | 117 | 9 | ||||||
NextGen Healthcare Inc * | 10,051 | 182 | ||||||
Orthofix Medical Inc * | 2,378 | 103 | ||||||
Owens & Minor Inc | 22,271 | 837 | ||||||
Patterson Cos Inc (A) | 29,302 | 936 | ||||||
Prestige Consumer Healthcare Inc, Cl A * | 14,554 | 642 | ||||||
Select Medical Holdings Corp * | 40,478 | 1,380 | ||||||
Supernus Pharmaceuticals Inc *(A) | 23,758 | 622 | ||||||
Syneos Health Inc, Cl A * | 51,324 | 3,893 | ||||||
Triple-S Management Corp, Cl B * | 5,095 | 133 | ||||||
Vanda Pharmaceuticals Inc * | 50,326 | 756 | ||||||
|
|
| ||||||
| 16,265 | ||||||||
|
|
| ||||||
Industrials — 15.2% | ||||||||
ABM Industries Inc | 2,585 | 132 | ||||||
ACCO Brands Corp | 402,096 | 3,394 | ||||||
Aerojet Rocketdyne Holdings Inc | 532 | 25 | ||||||
American Woodmark Corp * | 6,828 | 673 | ||||||
Apogee Enterprises Inc (A) | 15,853 | 648 | ||||||
ArcBest Corp | 18,342 | 1,291 | ||||||
Atkore Inc * | 51,243 | 3,684 | ||||||
Atlas Air Worldwide Holdings Inc * | 28,835 | 1,743 | ||||||
SEI Institutional Managed Trust / Semi-Annual Report / March 31, 2021 | 3 |
SCHEDULE OF INVESTMENTS (Unaudited)
March 31, 2021
Small Cap Value Fund (Continued)
| Description | Shares | Market Value ($ Thousands) | ||||||
COMMON STOCK (continued) | ||||||||
Builders FirstSource Inc * | 18,407 | $ | 854 | |||||
BWX Technologies Inc, Cl W | 59,303 | 3,910 | ||||||
Caesarstone Ltd | 5,150 | 71 | ||||||
Colfax Corp * | 111,919 | 4,903 | ||||||
Columbus McKinnon Corp/NY | 2,020 | 107 | ||||||
Costamare Inc | 11,389 | 110 | ||||||
Crane Co, Cl A | 11,280 | 1,059 | ||||||
Deluxe Corp (A) | 21,701 | 911 | ||||||
EMCOR Group Inc | 11,311 | 1,269 | ||||||
Encore Wire Corp | 1,538 | 103 | ||||||
Ennis Inc | 13,815 | 295 | ||||||
EnPro Industries Inc | 3,433 | 293 | ||||||
Fluor Corp (A) | 13,219 | 305 | ||||||
Genco Shipping & Trading Ltd | 3,713 | 37 | ||||||
GMS Inc * | 1,577 | 66 | ||||||
Great Lakes Dredge & Dock Corp * | 13,556 | 198 | ||||||
Greenbrier Cos Inc/The | 6,857 | 324 | ||||||
Hawaiian Holdings Inc | 26,224 | 699 | ||||||
Heidrick & Struggles International Inc | 4,341 | 155 | ||||||
Herman Miller Inc | 25,386 | 1,045 | ||||||
Hillenbrand Inc | 17,519 | 836 | ||||||
Hub Group Inc, Cl A * | 775 | 52 | ||||||
Interface Inc, Cl A | 40,678 | 508 | ||||||
JetBlue Airways Corp * | 144,973 | 2,949 | ||||||
Kaman Corp, Cl A | 41,065 | 2,106 | ||||||
KAR Auction Services Inc | 192,901 | 2,894 | ||||||
Kelly Services Inc, Cl A | 34,370 | 765 | ||||||
Kforce Inc | 2,784 | 149 | ||||||
Kimball International Inc, Cl B | 8,276 | 116 | ||||||
L B Foster Co, Cl A * | 2,166 | 39 | ||||||
MasTec Inc * | 15,443 | 1,447 | ||||||
Meritor Inc * | 57,189 | 1,682 | ||||||
Mesa Air Group Inc * | 6,416 | 86 | ||||||
Miller Industries Inc/TN (A) | 1,809 | 84 | ||||||
Moog Inc, Cl A | 14,482 | 1,204 | ||||||
MRC Global Inc * | 6,822 | 62 | ||||||
Mueller Industries Inc | 6,721 | 278 | ||||||
Northwest Pipe Co * | 2,125 | 71 | ||||||
nVent Electric PLC | 19,538 | 545 | ||||||
Park-Ohio Holdings Corp | 11,022 | 347 | ||||||
Powell Industries Inc | 2,039 | 69 | ||||||
Preformed Line Products Co | 696 | 48 | ||||||
Primoris Services Corp | 39,772 | 1,318 | ||||||
Quanex Building Products Corp | 6,843 | 179 | ||||||
Resources Connection Inc | 4,056 | 55 | ||||||
RR Donnelley & Sons Co | 9,886 | 40 | ||||||
Rush Enterprises Inc, Cl A | 18,807 | 937 | ||||||
Safe Bulkers Inc * | 11,907 | 29 | ||||||
SkyWest Inc | 10,392 | 566 | ||||||
Steelcase Inc, Cl A | 67,968 | 978 | ||||||
Systemax Inc | 773 | 32 | ||||||
Teledyne Technologies Inc * | 6,001 | 2,482 | ||||||
| Description | Shares | Market Value ($ Thousands) | ||||||
COMMON STOCK (continued) | ||||||||
Timken Co/The | 16,032 | $ | 1,301 | |||||
TriNet Group Inc * | 2,183 | 170 | ||||||
Trinity Industries Inc (A) | 66,897 | 1,906 | ||||||
Triton International Ltd | 26,323 | 1,447 | ||||||
TrueBlue Inc * | 11,476 | 253 | ||||||
Tutor Perini Corp * | 8,295 | 157 | ||||||
UFP Industries Inc | 3,049 | 231 | ||||||
Vectrus Inc * | 4,133 | 221 | ||||||
Veritiv Corp * | 2,905 | 124 | ||||||
Wabash National Corp | 61,638 | 1,159 | ||||||
Werner Enterprises Inc | 14,411 | 680 | ||||||
WESCO International Inc * | 34,998 | 3,028 | ||||||
XPO Logistics Inc * | 23,824 | 2,937 | ||||||
|
|
| ||||||
| 64,871 | ||||||||
|
|
| ||||||
Information Technology — 12.5% | ||||||||
ACI Worldwide Inc * | 108,279 | 4,120 | ||||||
Alliance Data Systems Corp | 18,507 | 2,074 | ||||||
Amkor Technology Inc | 93,950 | 2,227 | ||||||
Avaya Holdings Corp * | 27,122 | 760 | ||||||
Benchmark Electronics Inc | 35,853 | 1,109 | ||||||
BM Technologies Inc * | 1,692 | 20 | ||||||
Ciena Corp * | 1,239 | 68 | ||||||
Cirrus Logic Inc * | 6,372 | 540 | ||||||
Cognyte Software Ltd * | 58,956 | 1,640 | ||||||
Concentrix Corp * | 5,642 | 845 | ||||||
CSG Systems International Inc | 16,830 | 755 | ||||||
Daktronics Inc | 7,855 | 49 | ||||||
Diodes Inc * | 5,473 | 437 | ||||||
Ebix Inc (A) | 8,987 | 288 | ||||||
Euronet Worldwide Inc * | 16,683 | 2,307 | ||||||
Information Services Group Inc * | 7,787 | 34 | ||||||
Insight Enterprises Inc * | 27,571 | 2,631 | ||||||
J2 Global Inc * | 73,879 | 8,855 | ||||||
Jabil Inc | 33,650 | 1,755 | ||||||
Methode Electronics Inc | 24,846 | 1,043 | ||||||
NCR Corp *(A) | 64,079 | 2,432 | ||||||
NETGEAR Inc * | 4,235 | 174 | ||||||
NetScout Systems Inc * | 10,867 | 306 | ||||||
PC Connection Inc | 1,960 | 91 | ||||||
Photronics Inc * | 57,910 | 745 | ||||||
Rimini Street Inc * | 4,774 | 43 | ||||||
Sanmina Corp * | 51,733 | 2,141 | ||||||
ScanSource Inc * | 16,291 | 488 | ||||||
Silicon Motion Technology Corp ADR | 115,193 | 6,841 | ||||||
SMART Global Holdings Inc * | 1,121 | 52 | ||||||
Super Micro Computer Inc * | 39,437 | 1,540 | ||||||
Sykes Enterprises Inc * | 39,338 | 1,734 | ||||||
SYNNEX Corp | 9,675 | 1,111 | ||||||
TTM Technologies Inc * | 55,991 | 812 | ||||||
Unisys Corp * | 3,987 | 101 | ||||||
Verint Systems Inc * | 67,863 | 3,087 | ||||||
VirnetX Holding Corp (A) | 13,127 | 73 | ||||||
| 4 | SEI Institutional Managed Trust / Semi-Annual Report / March 31, 2021 |
SCHEDULE OF INVESTMENTS (Unaudited)
March 31, 2021
Small Cap Value Fund (Continued)
| Description | Shares | Market Value ($ Thousands) | ||||||
COMMON STOCK (continued) | ||||||||
Vishay Intertechnology Inc | 3,968 | $ | 96 | |||||
|
|
| ||||||
| 53,424 | ||||||||
|
|
| ||||||
Materials — 9.5% | ||||||||
Alamos Gold Inc, Cl A | 43,370 | 339 | ||||||
Arconic Corp * | 20,169 | 512 | ||||||
Ashland Global Holdings Inc | 40,922 | 3,633 | ||||||
Axalta Coating Systems Ltd * | 140,362 | 4,152 | ||||||
B2Gold Corp | 247,997 | 1,069 | ||||||
Boise Cascade Co | 8,664 | 518 | ||||||
Cabot Corp | 21,173 | 1,110 | ||||||
Century Aluminum Co * | 37,289 | 659 | ||||||
Chemours Co/The (A) | 22,071 | 616 | ||||||
Commercial Metals Co, Cl A (A) | 130,327 | 4,019 | ||||||
Domtar Corp | 45,808 | 1,693 | ||||||
FMC Corp | 52,230 | 5,777 | ||||||
FutureFuel Corp | 5,854 | 85 | ||||||
Greif Inc, Cl A | 29,098 | 1,659 | ||||||
Huntsman Corp | 30,336 | 875 | ||||||
Ingevity Corp * | 7,227 | 546 | ||||||
Koppers Holdings Inc * | 16,531 | 575 | ||||||
Kraton Corp * | 18,407 | 673 | ||||||
Kronos Worldwide Inc | 597 | 9 | ||||||
Minerals Technologies Inc | 890 | 67 | ||||||
Myers Industries Inc | 2,662 | 53 | ||||||
O-I Glass Inc, Cl I | 52,257 | 770 | ||||||
Resolute Forest Products Inc * | 88,683 | 971 | ||||||
Schnitzer Steel Industries Inc, Cl A | 17,680 | 739 | ||||||
Schweitzer-Mauduit International Inc | 14,524 | 711 | ||||||
Silgan Holdings Inc | 151,154 | 6,353 | ||||||
Stepan Co | 1,136 | 144 | ||||||
Trecora Resources *(A) | 5,654 | 44 | ||||||
Tredegar Corp (A) | 6,073 | 91 | ||||||
Trinseo SA | 14,434 | 919 | ||||||
Verso Corp | 6,793 | 99 | ||||||
Warrior Met Coal Inc | 11,878 | 203 | ||||||
Worthington Industries Inc (A) | 11,779 | 790 | ||||||
|
|
| ||||||
| 40,473 | ||||||||
|
|
| ||||||
Real Estate — 6.5% | ||||||||
Alexander & Baldwin Inc ‡ | 9,963 | 167 | ||||||
Brandywine Realty Trust ‡(A) | 60,064 | 775 | ||||||
Centerspace ‡ | 207 | 14 | ||||||
Chatham Lodging Trust *‡ | 34,838 | 459 | ||||||
Columbia Property Trust Inc ‡ | 11,551 | 198 | ||||||
CoreCivic Inc ‡ | 19,325 | 175 | ||||||
CorEnergy Infrastructure Trust Inc ‡(A) | 4,996 | 35 | ||||||
DiamondRock Hospitality Co *‡ | 69,599 | 717 | ||||||
Diversified Healthcare Trust ‡ | 42,565 | 204 | ||||||
Franklin Street Properties Corp ‡ | 78,553 | 428 | ||||||
Gaming and Leisure Properties Inc ‡ | 98,262 | 4,169 | ||||||
Hersha Hospitality Trust, Cl A ‡ | 32,199 | 340 | ||||||
Howard Hughes Corp/The *‡ | 32,837 | 3,124 | ||||||
| Description | Shares | Market Value ($ Thousands) | ||||||
COMMON STOCK (continued) | ||||||||
Industrial Logistics Properties Trust ‡ | 26,397 | $ | 611 | |||||
Invitation Homes Inc ‡ | 33,351 | 1,067 | ||||||
Kite Realty Group Trust ‡ | 44,242 | 853 | ||||||
Lexington Realty Trust, Cl B ‡ | 2,231 | 25 | ||||||
Medical Properties Trust Inc ‡ | 249,343 | 5,306 | ||||||
New Senior Investment Group Inc ‡ | 84,421 | 526 | ||||||
Newmark Group Inc, Cl A ‡ | 189,142 | 1,892 | ||||||
Office Properties Income Trust ‡ | 24,021 | 661 | ||||||
Paramount Group Inc ‡ | 43,513 | 441 | ||||||
Pebblebrook Hotel Trust ‡(A) | 3,328 | 81 | ||||||
Piedmont Office Realty Trust Inc, Cl A ‡ | 38,618 | 671 | ||||||
PotlatchDeltic Corp ‡ | 2,348 | 124 | ||||||
Realogy Holdings Corp * | 20,516 | 310 | ||||||
Retail Properties of America Inc, Cl A ‡ | 54,933 | 576 | ||||||
Retail Value Inc ‡ | 3,711 | 69 | ||||||
RLJ Lodging Trust ‡ | 14,755 | 228 | ||||||
RMR Group Inc/The, Cl A ‡ | 3,504 | 143 | ||||||
Sabra Health Care Inc ‡ | 59,053 | 1,025 | ||||||
Service Properties Trust ‡ | 27,850 | 330 | ||||||
SITE Centers Corp ‡ | 35,547 | 482 | ||||||
Summit Hotel Properties Inc *‡ | 38,255 | 389 | ||||||
Sunstone Hotel Investors Inc ‡ | 6,414 | 80 | ||||||
Tanger Factory Outlet Centers Inc ‡(A) | 48,504 | 734 | ||||||
Xenia Hotels & Resorts Inc *‡ | 29,732 | 580 | ||||||
|
|
| ||||||
| 28,009 | ||||||||
|
|
| ||||||
Utilities — 0.8% | ||||||||
Consolidated Water Co Ltd (A) | 3,248 | 44 | ||||||
Genie Energy Ltd, Cl B (A) | 3,443 | 22 | ||||||
MDU Resources Group Inc | 41,367 | 1,308 | ||||||
National Fuel Gas Co | 24,247 | 1,212 | ||||||
Portland General Electric Co | 5,564 | 264 | ||||||
Southwest Gas Holdings Inc | 9,653 | 663 | ||||||
Spark Energy Inc, Cl A (A) | 2,752 | 29 | ||||||
|
|
| ||||||
| 3,542 | ||||||||
|
|
| ||||||
Total Common Stock | 404,248 | |||||||
|
|
| ||||||
AFFILIATED PARTNERSHIP — 6.9% |
| |||||||
SEI Liquidity Fund, L.P. 0.020% **†(C) | 29,632,329 | 29,641 | ||||||
|
|
| ||||||
Total Affiliated Partnership | 29,641 | |||||||
|
|
| ||||||
SEI Institutional Managed Trust / Semi-Annual Report / March 31, 2021 | 5 |
SCHEDULE OF INVESTMENTS (Unaudited)
March 31, 2021
Small Cap Value Fund (Continued)
| Description | Shares | Market Value ($ Thousands) | ||||||
CASH EQUIVALENT — 5.4% | ||||||||
SEI Daily Income Trust, Government Fund, Cl F | ||||||||
0.010%**† | 22,914,301 | $ | 22,914 | |||||
|
|
| ||||||
| Description | Shares | Market Value ($Thousands) | ||||||
CASH EQUIVALENT (continued) | ||||||||
Total Cash Equivalent | $ | 22,914 | ||||||
|
|
| ||||||
Total Investments in Securities — 106.8% |
| $ | 456,803 | |||||
|
|
| ||||||
A list of the open futures contracts held at March 31, 2021 is as follows:
| ||||||||||||||||||||
Type of Contract | Number of Contracts Long | Expiration Date | Notional Amount (Thousands) | Value (Thousands) | Unrealized Appreciation (Thousands) | |||||||||||||||
| ||||||||||||||||||||
Russell 2000 Index E-MINI | 54 | Jun-2021 | $ | 5,991 | $ | 6,001 | $ | 10 | ||||||||||||
Percentages are based on Net Assets of $427,594 ($ Thousands). |
| * | Non-income producing security. |
| ** | The rate reported is the 7-day effective yield as of March 31, 2021. |
| ‡ | Real Estate Investment Trust. |
| † | Investment in Affiliated Security (see Note 6). |
| (A) | Certain securities or partial positions of certain securities are on loan at March 31, 2021 (See Note 10). The total market value of securities on loan at March 31, 2021 was $28,779 ($ Thousands). |
| (B) | Security is a Master Limited Partnership. At March 31, 2021, such securities amounted to $1,990 ($ Thousands), or 0.5% of the Net Assets of the Fund (See Note 2). |
| (C) | This security was purchased with cash collateral held from securities on loan (see Note 10). The total market value of such securities as of March 31, 2021 was $29,641 ($ Thousands). |
ADR — American Depositary Receipt
Cl — Class
L.P. — Limited Partnership
Ltd. — Limited
PLC — Public Limited Company
The following is a list of the level of inputs used as of March 31, 2021, in valuing the Fund’s investments and other financial instruments carried at value ($ Thousands):
| Investments in Securities | Level 1 ($) | Level 2 ($) | Level 3 ($) | Total ($) | ||||||||||||
Common Stock | 404,248 | – | – | 404,248 | ||||||||||||
Affiliated Partnership | – | 29,641 | – | 29,641 | ||||||||||||
Cash Equivalent | 22,914 | – | – | 22,914 | ||||||||||||
|
|
|
|
|
|
|
|
|
|
|
| |||||
Total Investments in Securities | 427,162 | 29,641 | – | 456,803 | ||||||||||||
|
|
|
|
|
|
|
|
|
|
|
| |||||
| ||||||||||||||||
| Other Financial Instruments | Level 1 ($) | Level 2 ($) | Level 3 ($) | Total ($) | ||||||||||||
Futures Contracts* | ||||||||||||||||
Unrealized Appreciation | 10 | – | – | 10 | ||||||||||||
|
|
|
|
|
|
|
|
|
|
|
| |||||
Total Other Financial Instruments | 10 | – | – | 10 | ||||||||||||
|
|
|
|
|
|
|
|
|
|
|
| |||||
* Futures contracts are valued at the unrealized appreciation on the instrument.
For the period ended March 31, 2021, there were no transfers in or out of Level 3.
For more information on valuation inputs, see Note 2 — Significant Accounting Policies in Notes to
Financial Statements.
The following is a summary of the Fund’s transactions with affiliates for the period ended March 31, 2021 ($ Thousands):
| Security Description | Value 9/30/2020 | Purchases at Cost | Proceeds from Sales | Realized Gain (Loss) | Change in Unrealized Appreciation (Depreciation) | Value 3/31/2021 | Shares | Income | Capital Gains | |||||||||
SEI Liquidity Fund, L.P. | $ 7,690 | $68,828 | $(46,880) | $5 | $(2) | $ 29,641 | 29,632,329 | $ 67 | $— | |||||||||
SEI Daily Income Trust, Government Fund, Cl F | 13,795 | 48,172 | (39,053) | — | — | 22,914 | 22,914,301 | 1 | — | |||||||||
|
|
|
|
|
|
|
| |||||||||||
Totals | $ 21,485 | $117,000 | $(85,933) | $5 | $(2) | $ 52,555 | $ 68 | $— | ||||||||||
|
|
|
|
|
|
|
|
Amounts designated as “—” are either $0 or have been rounded to $0.
The accompanying notes are an integral part of the financial statements.
| 6 | SEI Institutional Managed Trust / Semi-Annual Report / March 31, 2021 |
SCHEDULE OF INVESTMENTS (Unaudited)
March 31, 2021
Small Cap Growth Fund (Continued)
| Description | Shares | Market Value ($ Thousands) | ||||||
COMMON STOCK — 96.0% | ||||||||
Communication Services — 0.7% | ||||||||
Entravision Communications Corp, Cl A | 56,742 | $ | 229 | |||||
Meredith Corp *(A) | 10,018 | 298 | ||||||
QuinStreet Inc * | 12,230 | 248 | ||||||
TechTarget Inc * | 27,385 | 1,902 | ||||||
TripAdvisor Inc * | 11,257 | 606 | ||||||
|
|
| ||||||
| 3,283 | ||||||||
|
|
| ||||||
Consumer Discretionary — 16.6% | ||||||||
1-800-Flowers.com Inc, Cl A *(A) | 4,551 | 126 | ||||||
Abercrombie & Fitch Co, Cl A *(A) | 19,015 | 652 | ||||||
Acushnet Holdings Corp | 1,049 | 43 | ||||||
Adtalem Global Education Inc * | 19,513 | 772 | ||||||
American Eagle Outfitters Inc | 31,092 | 909 | ||||||
Asbury Automotive Group Inc * | 7,151 | 1,405 | ||||||
Bally’s Corp *(A) | 20,978 | 1,363 | ||||||
Beazer Homes USA Inc, Cl A * | 82,311 | 1,722 | ||||||
Boyd Gaming Corp * | 15,778 | 930 | ||||||
Brinker International Inc * | 31,848 | 2,263 | ||||||
Brunswick Corp/DE | 12,338 | 1,177 | ||||||
Callaway Golf Co * | 27,330 | 731 | ||||||
Camping World Holdings Inc, Cl A | 26,098 | 949 | ||||||
Carter’s Inc * | 14,604 | 1,299 | ||||||
Century Communities Inc * | 33,697 | 2,033 | ||||||
Churchill Downs Inc | 3,025 | 688 | ||||||
Clarus Corp | 67,428 | 1,150 | ||||||
Cooper-Standard Holdings Inc * | 35,076 | 1,274 | ||||||
Crocs Inc * | 22,221 | 1,788 | ||||||
Deckers Outdoor Corp * | 4,199 | 1,387 | ||||||
Del Taco Restaurants Inc | 79,145 | 758 | ||||||
Dick’s Sporting Goods Inc (A) | 13,439 | 1,024 | ||||||
Everi Holdings Inc * | 24,789 | 350 | ||||||
Fisker Inc *(A) | 29,206 | 503 | ||||||
Five Below Inc * | 2,403 | 458 | ||||||
Fox Factory Holding Corp *(A) | 3,089 | 392 | ||||||
Funko Inc, Cl A * | 16,943 | 333 | ||||||
Grand Canyon Education Inc *(A) | 6,278 | 672 | ||||||
Green Brick Partners Inc *(A) | 22,297 | 506 | ||||||
Hanesbrands Inc | 100,771 | 1,982 | ||||||
Haverty Furniture Cos Inc | 23,839 | 887 | ||||||
Jack in the Box Inc | 7,094 | 779 | ||||||
Kontoor Brands Inc | 23,111 | 1,122 | ||||||
Lithia Motors Inc, Cl A | 2,098 | 818 | ||||||
Lumber Liquidators Holdings Inc * | 4,473 | 112 | ||||||
Magnite Inc *(A) | 13,044 | 543 | ||||||
Malibu Boats Inc, Cl A * | 15,038 | 1,198 | ||||||
MarineMax Inc * | 20,283 | 1,001 | ||||||
Marriott Vacations Worldwide Corp * | 3,715 | 647 | ||||||
Mattel Inc * | 57,359 | 1,143 | ||||||
Matthews International Corp, Cl A | 38,840 | 1,536 | ||||||
MDC Holdings Inc | 21,213 | 1,260 | ||||||
Michaels Cos Inc/The * | 10,064 | 221 | ||||||
| Description | Shares | Market Value ($ Thousands) | ||||||
COMMON STOCK (continued) | ||||||||
Modine Manufacturing Co * | 8,197 | $ | 121 | |||||
Norwegian Cruise Line Holdings Ltd *(A) | 20,452 | 564 | ||||||
Patrick Industries Inc | 13,191 | 1,121 | ||||||
Penn National Gaming Inc * | 13,121 | 1,376 | ||||||
Penske Automotive Group Inc, Cl A (A) | 18,358 | 1,473 | ||||||
PlayAGS Inc * | 176,104 | 1,423 | ||||||
Purple Innovation Inc, Cl A * | 24,044 | 761 | ||||||
Red Rock Resorts Inc, Cl A * | 24,984 | 814 | ||||||
Rent-A-Center Inc/TX | 46,539 | 2,683 | ||||||
Revolve Group Inc, Cl A *(A) | 14,747 | 663 | ||||||
RH * | 371 | 221 | ||||||
Sally Beauty Holdings Inc *(A) | 190,859 | 3,842 | ||||||
SeaWorld Entertainment Inc * | 13,653 | 678 | ||||||
Shake Shack Inc, Cl A *(A) | 7,255 | 818 | ||||||
Shift Technologies *(A) | 47,634 | 396 | ||||||
Shoe Carnival Inc (A) | 17,567 | 1,087 | ||||||
Shutterstock Inc | 21,893 | 1,949 | ||||||
Signet Jewelers Ltd * | 3,059 | 177 | ||||||
Skechers USA Inc, Cl A * | 84,219 | 3,513 | ||||||
Skyline Champion Corp * | 15,433 | 698 | ||||||
Sonic Automotive Inc, Cl A | 1,000 | 50 | ||||||
Sonos Inc * | 18,803 | 705 | ||||||
Sportsman’s Warehouse Holdings Inc * | 4,612 | 80 | ||||||
Stride * | 29,080 | 876 | ||||||
Superior Group of Cos Inc | 4,585 | 117 | ||||||
Taylor Morrison Home Corp, Cl A * | 58,258 | 1,795 | ||||||
Tempur Sealy International Inc | 16,114 | 589 | ||||||
Thor Industries Inc (A) | 5,930 | 799 | ||||||
Travel + Leisure Co | 15,531 | 950 | ||||||
Urban Outfitters Inc * | 26,211 | 975 | ||||||
Vista Outdoor Inc *(A) | 42,250 | 1,355 | ||||||
Zumiez Inc * | 7,615 | 327 | ||||||
|
|
| ||||||
| 73,902 | ||||||||
|
|
| ||||||
Consumer Staples — 0.8% | ||||||||
BJ’s Wholesale Club Holdings Inc *(A) | 11,681 | 524 | ||||||
Central Garden & Pet Co, Cl A * | 7,485 | 434 | ||||||
Darling Ingredients Inc * | 3,789 | 279 | ||||||
Medifast Inc | 1,978 | 419 | ||||||
Sanderson Farms Inc | 1,630 | 254 | ||||||
Turning Point Brands Inc | 9,227 | 481 | ||||||
United Natural Foods Inc *(A) | 8,937 | 295 | ||||||
USANA Health Sciences Inc * | 2,995 | 292 | ||||||
Utz Brands Inc (A) | 18,202 | 451 | ||||||
|
|
| ||||||
| 3,429 | ||||||||
|
|
| ||||||
Energy — 1.5% | ||||||||
Antero Resources Corp * | 51,629 | 527 | ||||||
Bonanza Creek Energy Inc * | 33,578 | 1,200 | ||||||
Cactus Inc, Cl A | 9,473 | 290 | ||||||
Cimarex Energy Co | 12,082 | 718 | ||||||
Clean Energy Fuels Corp *(A) | 14,947 | 205 | ||||||
Diamondback Energy Inc, Cl A | 7,518 | 553 | ||||||
SEI Institutional Managed Trust / Semi-Annual Report / March 31, 2021 | 1 |
SCHEDULE OF INVESTMENTS (Unaudited)
March 31, 2021
Small Cap Growth Fund (Continued)
| Description | Shares | Market Value ($ Thousands) | ||||||
COMMON STOCK (continued) | ||||||||
Evolution Petroleum Corp | 49,290 | $ | 167 | |||||
Magnolia Oil & Gas Corp, Cl A * | 44,086 | 506 | ||||||
Matador Resources Co (A) | 36,864 | 864 | ||||||
Nabors Industries Ltd * | 1,225 | 114 | ||||||
Ovintiv Inc | 24,652 | 587 | ||||||
PDC Energy Inc, Cl A * | 7,769 | 267 | ||||||
ProPetro Holding Corp * | 7,291 | 78 | ||||||
Texas Pacific Land Corp (A) | 285 | 453 | ||||||
|
|
| ||||||
| 6,529 | ||||||||
|
|
| ||||||
Financials — 10.4% | ||||||||
Ameris Bancorp | 17,000 | 893 | ||||||
Arbor Realty Trust Inc ‡(A) | 6,247 | 99 | ||||||
Artisan Partners Asset Management Inc, | ||||||||
Cl A | 27,890 | 1,455 | ||||||
Axos Financial Inc * | 2,821 | 133 | ||||||
Banc of California Inc | 10,585 | 191 | ||||||
BankUnited Inc | 19,108 | 840 | ||||||
Banner Corp | 19,298 | 1,029 | ||||||
BCB Bancorp Inc | 22,363 | 309 | ||||||
Build Acquisition * | 51,793 | 511 | ||||||
Cowen Inc, Cl A | 63,689 | 2,239 | ||||||
Customers Bancorp Inc * | 13,052 | 415 | ||||||
Enova International Inc * | 7,414 | 263 | ||||||
Federated Hermes Inc, Cl B | 30,002 | 939 | ||||||
First Bank | 21,953 | 267 | ||||||
First Business Financial Services Inc | 22,031 | 545 | ||||||
First Citizens BancShares Inc/NC, Cl A | 629 | 526 | ||||||
First Financial Bankshares Inc, Cl A (A) | 7,793 | 364 | ||||||
First Foundation Inc | 6,467 | 152 | ||||||
First Internet Bancorp | 3,185 | 112 | ||||||
First Northwest Bancorp | 3,953 | 66 | ||||||
First Savings Financial Group Inc | 1,541 | 103 | ||||||
Flagstar Bancorp Inc | 17,693 | 798 | ||||||
Foley Trasimene Acquisition Corp * | 86,034 | 921 | ||||||
Glacier Bancorp Inc, Cl A | 8,411 | 480 | ||||||
Hanmi Financial Corp | 16,217 | 320 | ||||||
Hannon Armstrong Sustainable | ||||||||
Infrastructure Capital Inc ‡(A) | 5,112 | 287 | ||||||
Heartland Financial USA Inc | 14,877 | 748 | ||||||
HomeStreet Inc | 23,557 | 1,038 | ||||||
Houlihan Lokey Inc, Cl A | 1,986 | 132 | ||||||
Independent Bank Corp/MI | 10,947 | 259 | ||||||
Interactive Brokers Group Inc, Cl A | 7,548 | 551 | ||||||
Investors Bancorp Inc | 143,634 | 2,110 | ||||||
Jaws Acquisition, Cl A *(A) | 156,788 | 2,077 | ||||||
LPL Financial Holdings Inc | 5,800 | 825 | ||||||
Mercantile Bank Corp | 11,339 | 368 | ||||||
Meta Financial Group Inc | 14,375 | 651 | ||||||
MGIC Investment Corp | 35,410 | 490 | ||||||
Moelis & Co, Cl A | 14,892 | 817 | ||||||
Mr Cooper Group Inc * | 74,408 | 2,586 | ||||||
Norwood Financial Corp | 1,326 | 35 | ||||||
| Description | Shares | Market Value ($ Thousands) | ||||||
COMMON STOCK (continued) | ||||||||
OneMain Holdings Inc, Cl A | 26,325 | $ | 1,414 | |||||
Orrstown Financial Services Inc | 23,316 | 520 | ||||||
PennantPark Investment Corp | 182,624 | 1,032 | ||||||
PennyMac Financial Services Inc | 21,260 | 1,422 | ||||||
Pinnacle Financial Partners Inc | 7,401 | 656 | ||||||
Piper Sandler Cos | 4,552 | 499 | ||||||
PJT Partners Inc | 3,277 | 222 | ||||||
Popular Inc | 14,779 | 1,040 | ||||||
Prosperity Bancshares Inc | 3,217 | 241 | ||||||
Radian Group Inc | 23,326 | 542 | ||||||
Selectquote Inc * | 18,226 | 538 | ||||||
ServisFirst Bancshares Inc (A) | 9,906 | 608 | ||||||
Shore Bancshares Inc | 7,077 | 120 | ||||||
Signature Bank/New York NY, Cl B | 4,499 | 1,017 | ||||||
Stewart Information Services Corp | 20,307 | 1,057 | ||||||
Stifel Financial Corp | 8,500 | 545 | ||||||
Tishman Speyer Innovation II * | 63,249 | 634 | ||||||
TS Innovation Acquisitions * | 82,953 | 961 | ||||||
UMB Financial Corp | 4,679 | 432 | ||||||
United Bankshares Inc/WV | 32,318 | 1,247 | ||||||
United Community Banks Inc/GA | 19,653 | 671 | ||||||
Value Creation *(B)(C) | 145,600 | 61 | ||||||
Veritex Holdings Inc | 36,693 | 1,201 | ||||||
Virtus Investment Partners Inc | 1,828 | 430 | ||||||
Warrior Technologies Acquisition * | 73,115 | 724 | ||||||
West BanCorp Inc | 10,168 | 245 | ||||||
WisdomTree Investments Inc | 241,012 | 1,506 | ||||||
|
|
| ||||||
| 46,529 | ||||||||
|
|
| ||||||
Health Care — 27.2% | ||||||||
4D Molecular Therapeutics * | 31,119 | 1,350 | ||||||
Acadia Healthcare Co Inc, Cl A *(A) | 24,000 | 1,371 | ||||||
Aclaris Therapeutics Inc * | 50,966 | 1,284 | ||||||
AdaptHealth Corp, Cl A *(A) | 8,836 | 325 | ||||||
Affimed NV * | 29,236 | 231 | ||||||
Albireo Pharma Inc * | 30,443 | 1,073 | ||||||
Alphatec Holdings Inc * | 65,963 | 1,042 | ||||||
Amedisys Inc * | 1,767 | 468 | ||||||
Amicus Therapeutics Inc * | 39,073 | 386 | ||||||
AMN Healthcare Services Inc * | 34,719 | 2,559 | ||||||
Amneal Pharmaceuticals Inc * | 210,947 | 1,420 | ||||||
Antares Pharma Inc * | 51,736 | 213 | ||||||
Apria * | 19,905 | 556 | ||||||
Argenx SE ADR * | 3,478 | 958 | ||||||
Arvinas Inc * | 7,243 | 479 | ||||||
Avid Bioservices Inc * | 37,383 | 681 | ||||||
Axogen Inc * | 60,938 | 1,235 | ||||||
Blueprint Medicines Corp * | 9,105 | 885 | ||||||
C4 Therapeutics *(A) | 15,754 | 583 | ||||||
Cardiovascular Systems Inc *(A) | 34,077 | 1,306 | ||||||
CareDx Inc *(A) | 35,867 | 2,442 | ||||||
Cassava Sciences Inc *(A) | 13,473 | 606 | ||||||
Castle Biosciences Inc * | 9,781 | 670 | ||||||
| 2 | SEI Institutional Managed Trust / Semi-Annual Report / March 31, 2021 |
SCHEDULE OF INVESTMENTS (Unaudited)
March 31, 2021
Small Cap Growth Fund (Continued)
| Description | Shares | Market Value ($ Thousands) | ||||||
COMMON STOCK (continued) | ||||||||
Catalyst Pharmaceuticals Inc *(A) | 105,325 | $ | 486 | |||||
Certara Inc *(A) | 9,435 | 258 | ||||||
Collegium Pharmaceutical Inc * | 47,246 | 1,120 | ||||||
Community Health Systems Inc * | 17,822 | 241 | ||||||
Corcept Therapeutics Inc * | 31,206 | 742 | ||||||
Covetrus Inc * | 30,928 | 927 | ||||||
CryoLife Inc *(A) | 46,721 | 1,055 | ||||||
DBV Technologies SA ADR * | 96,504 | 514 | ||||||
Deciphera Pharmaceuticals Inc * | 20,278 | 909 | ||||||
Dynavax Technologies Corp *(A) | 123,568 | 1,215 | ||||||
Emergent BioSolutions * | 16,543 | 1,537 | ||||||
Enanta Pharmaceuticals Inc * | 43,885 | 2,164 | ||||||
Ensign Group Inc/The | 31,608 | 2,966 | ||||||
Evelo Biosciences *(A) | 26,357 | 282 | ||||||
Fate Therapeutics Inc * | 10,814 | 892 | ||||||
Glaukos Corp *(A) | 14,381 | 1,207 | ||||||
Halozyme Therapeutics Inc *(A) | 71,432 | 2,978 | ||||||
HealthEquity Inc * | 27,703 | 1,884 | ||||||
Heron Therapeutics Inc *(A) | 80,462 | 1,304 | ||||||
ImmunoGen Inc * | 43,668 | 354 | ||||||
Inari Medical Inc *(A) | 5,414 | 579 | ||||||
Inhibrx Inc * | 33,689 | 676 | ||||||
Innovage Holding *(A) | 60,937 | 1,572 | ||||||
Inovalon Holdings Inc, Cl A * | 31,333 | 902 | ||||||
Inovio Pharmaceuticals Inc * | 9,552 | 89 | ||||||
Inspire Medical Systems Inc *(A) | 3,365 | 696 | ||||||
Instil Bio * | 4,803 | 120 | ||||||
Integer Holdings Corp * | 9,897 | 911 | ||||||
Invacare Corp * | 26,647 | 214 | ||||||
iRadimed Corp * | 17,790 | 458 | ||||||
Itamar Medical ADR * | 24,872 | 596 | ||||||
KalVista Pharmaceuticals Inc * | 30,756 | 790 | ||||||
Kiniksa Pharmaceuticals Ltd, Cl A * | 33,964 | 629 | ||||||
Kodiak Sciences Inc *(A) | 9,120 | 1,034 | ||||||
MacroGenics Inc * | 38,897 | 1,239 | ||||||
MannKind Corp *(A) | 153,285 | 601 | ||||||
MEDNAX Inc *(A) | 42,644 | 1,086 | ||||||
Medpace Holdings Inc * | 14,397 | 2,362 | ||||||
Meridian Bioscience Inc *(A) | 47,321 | 1,242 | ||||||
Merit Medical Systems Inc *(A) | 53,682 | 3,214 | ||||||
Metacrine Inc * | 89,696 | 556 | ||||||
ModivCare Inc * | 2,486 | 368 | ||||||
Natera Inc * | 22,791 | 2,314 | ||||||
Nevro Corp *(A) | 6,210 | 866 | ||||||
NextGen Healthcare Inc * | 62,757 | 1,136 | ||||||
Novavax Inc *(A) | 1,962 | 356 | ||||||
Olema Pharmaceuticals * | 29,826 | 990 | ||||||
Omnicell Inc * | 20,143 | 2,616 | ||||||
Option Care Health Inc * | 43,993 | 780 | ||||||
Organogenesis Holdings Inc, Cl A * | 91,335 | 1,664 | ||||||
ORIC Pharmaceuticals Inc *(A) | 28,843 | 707 | ||||||
Owens & Minor Inc | 13,278 | 499 | ||||||
| Description | Shares | Market Value ($ Thousands) | ||||||
COMMON STOCK (continued) | ||||||||
Pacira BioSciences Inc * | 16,776 | $ | 1,176 | |||||
Patterson Cos Inc (A) | 20,429 | 653 | ||||||
Pennant Group Inc/The * | 17,625 | 807 | ||||||
PMV Pharmaceuticals Inc *(A) | 16,455 | 541 | ||||||
Precision BioSciences Inc *(A) | 42,880 | 444 | ||||||
Prestige Consumer Healthcare Inc, Cl A * | 51,099 | 2,252 | ||||||
Pulmonx Corp *(A) | 8,096 | 370 | ||||||
Quidel Corp *(A) | 7,065 | 904 | ||||||
R1 RCM Inc * | 27,109 | 669 | ||||||
Radius Health Inc *(A) | 66,451 | 1,386 | ||||||
Relay Therapeutics Inc *(A) | 18,846 | 651 | ||||||
Renalytix AI PLC ADR * | 17,363 | 445 | ||||||
Repligen Corp * | 11,198 | 2,177 | ||||||
Revance Therapeutics Inc * | 30,726 | 859 | ||||||
Rigel Pharmaceuticals Inc *(A) | 97,632 | 334 | ||||||
Rocket Pharmaceuticals Inc *(A) | 16,292 | 723 | ||||||
Rubius Therapeutics Inc *(A) | 21,447 | 568 | ||||||
Scholar Rock Holding Corp *(A) | 15,074 | 764 | ||||||
Select Medical Holdings Corp * | 87,557 | 2,986 | ||||||
Simulations Plus Inc (A) | 2,928 | 185 | ||||||
SpringWorks Therapeutics Inc * | 12,964 | 954 | ||||||
STAAR Surgical Co * | 1,678 | 177 | ||||||
Surgery Partners Inc *(A) | 26,919 | 1,191 | ||||||
Syneos Health Inc, Cl A * | 45,820 | 3,475 | ||||||
Talis Biomedical *(A) | 41,036 | 527 | ||||||
TCR2 Therapeutics Inc *(A) | 43,939 | 970 | ||||||
Tenet Healthcare Corp * | 60,091 | 3,125 | ||||||
TG Therapeutics Inc * | 21,886 | 1,055 | ||||||
Translate Bio Inc *(A) | 36,246 | 598 | ||||||
Travere Therapeutics * | 45,583 | 1,138 | ||||||
Triple-S Management Corp, Cl B *(A) | 46,221 | 1,203 | ||||||
Vanda Pharmaceuticals Inc * | 110,762 | 1,664 | ||||||
Varex Imaging Corp * | 55,374 | 1,135 | ||||||
Veracyte Inc * | 54,594 | 2,934 | ||||||
Vericel Corp *(A) | 27,052 | 1,503 | ||||||
Viking Therapeutics Inc *(A) | 166,174 | 1,051 | ||||||
Vocera Communications Inc * | 24,484 | 942 | ||||||
XBiotech Inc *(A) | 27,201 | 467 | ||||||
Xeris Pharmaceuticals Inc *(A) | 85,815 | 387 | ||||||
|
|
| ||||||
| 120,410 | ||||||||
|
|
| ||||||
Industrials — 17.8% | ||||||||
ABM Industries Inc | 60,336 | 3,078 | ||||||
Advanced Drainage Systems Inc | 7,313 | 756 | ||||||
AeroVironment Inc * | 3,374 | 392 | ||||||
AGCO Corp | 8,885 | 1,276 | ||||||
Allegiant Travel Co, Cl A * | 3,969 | 969 | ||||||
American Woodmark Corp * | 6,676 | 658 | ||||||
Applied Industrial Technologies Inc, Cl A | 8,255 | 753 | ||||||
ArcBest Corp | 22,339 | 1,572 | ||||||
ASGN Inc *(A) | 9,870 | 942 | ||||||
Astec Industries Inc | 1,400 | 106 | ||||||
Atkore Inc * | 27,873 | 2,004 | ||||||
SEI Institutional Managed Trust / Semi-Annual Report / March 31, 2021 | 3 |
SCHEDULE OF INVESTMENTS (Unaudited)
March 31, 2021
Small Cap Growth Fund (Continued)
| Description | Shares | Market Value ($ Thousands) | ||||||
COMMON STOCK (continued) | ||||||||
Atlas Air Worldwide Holdings Inc * | 7,223 | $ | 436 | |||||
Avis Budget Group Inc * | 7,059 | 512 | ||||||
Beacon Roofing Supply Inc * | 24,517 | 1,283 | ||||||
Brady Corp, Cl A | 4,300 | 230 | ||||||
Builders FirstSource Inc * | 30,621 | 1,420 | ||||||
CAI International Inc | 7,128 | 324 | ||||||
Chart Industries Inc *(A) | 6,438 | 916 | ||||||
Cimpress PLC *(A) | 12,495 | 1,251 | ||||||
Clean Harbors Inc * | 28,427 | 2,390 | ||||||
Columbus McKinnon Corp/NY | 10,103 | 533 | ||||||
Cornerstone Building Brands Inc * | 11,765 | 165 | ||||||
Costamare Inc | 5,591 | 54 | ||||||
Deluxe Corp (A) | 27,381 | 1,149 | ||||||
EMCOR Group Inc | 17,006 | 1,907 | ||||||
Federal Signal Corp | 3,386 | 130 | ||||||
Forrester Research Inc * | 33,855 | 1,438 | ||||||
Forward Air Corp | 9,406 | 835 | ||||||
Franklin Electric Co Inc | 7,855 | 620 | ||||||
GMS Inc * | 11,708 | 489 | ||||||
Graham Corp, Cl A | 29,967 | 427 | ||||||
Heartland Express Inc | 2,612 | 51 | ||||||
Herc Holdings Inc * | 12,239 | 1,240 | ||||||
Heritage-Crystal Clean Inc * | 128,377 | 3,483 | ||||||
Hillenbrand Inc | 41,934 | 2,001 | ||||||
Hudson Technologies Inc * | 225,371 | 363 | ||||||
JELD-WEN Holding Inc * | 30,708 | 850 | ||||||
John Bean Technologies Corp, Cl A | 15,514 | 2,069 | ||||||
KBR Inc | 21,217 | 814 | ||||||
Kennametal Inc (A) | 16,159 | 646 | ||||||
Kforce Inc | 21,426 | 1,148 | ||||||
Kirby Corp * | 21,197 | 1,278 | ||||||
ManTech International Corp/VA, Cl A | 4,535 | 394 | ||||||
Masonite International Corp * | 8,257 | 951 | ||||||
MasTec Inc * | 13,146 | 1,232 | ||||||
Matson Inc | 70,254 | 4,686 | ||||||
Maxar Technologies Inc (A) | 2,292 | 87 | ||||||
Meritor Inc * | 23,360 | 687 | ||||||
Middleby Corp/The *(A) | 19,186 | 3,180 | ||||||
Montrose Environmental Group Inc * | 12,437 | 624 | ||||||
MYR Group Inc * | 5,701 | 409 | ||||||
NV5 Global Inc *(A) | 8,137 | 786 | ||||||
Oshkosh Corp | 8,469 | 1,005 | ||||||
Primoris Services Corp | 34,876 | 1,155 | ||||||
Quanta Services Inc | 14,600 | 1,284 | ||||||
Regal Beloit Corp (A) | 6,839 | 976 | ||||||
Ritchie Bros Auctioneers Inc | 53,961 | 3,159 | ||||||
Robert Half International Inc | 12,414 | 969 | ||||||
Shyft Group Inc/The | 26,330 | 979 | ||||||
SiteOne Landscape Supply Inc *(A) | 2,298 | 392 | ||||||
SP Plus Corp * | 24,173 | 793 | ||||||
SPX Corp * | 3,152 | 184 | ||||||
Tennant Co (A) | 29,843 | 2,384 | ||||||
| Description | Shares | Market Value ($ Thousands) | ||||||
COMMON STOCK (continued) | ||||||||
Textainer Group Holdings Ltd * | 14,533 | $ | 416 | |||||
ThredUp, Cl A * | 8,513 | 199 | ||||||
TriNet Group Inc * | 34,630 | 2,700 | ||||||
Triton International Ltd | 48,120 | 2,646 | ||||||
TrueBlue Inc * | 76,729 | 1,689 | ||||||
UFP Industries Inc | 4,521 | 343 | ||||||
Upwork Inc * | 8,352 | 374 | ||||||
Valmont Industries Inc | 4,266 | 1,014 | ||||||
Werner Enterprises Inc | 10,913 | 515 | ||||||
|
|
| ||||||
| 79,170 | ||||||||
|
|
| ||||||
Information Technology — 16.6% | ||||||||
2U Inc * | 73,156 | 2,797 | ||||||
8x8 Inc * | 42,226 | 1,370 | ||||||
A10 Networks Inc * | 10,461 | 101 | ||||||
Actua Corp *(B) | 105,055 | 5 | ||||||
Agilysys Inc * | 4,002 | 192 | ||||||
Allegro MicroSystems Inc *(A) | 24,026 | 609 | ||||||
Alpha & Omega Semiconductor Ltd * | 4,126 | 135 | ||||||
Ambarella Inc * | 9,488 | 952 | ||||||
American Software Inc/GA, Cl A | 34,395 | 712 | ||||||
Amkor Technology Inc | 49,927 | 1,184 | ||||||
Asure Software Inc *(A) | 64,719 | 494 | ||||||
Avaya Holdings Corp *(A) | 42,912 | 1,203 | ||||||
Avid Technology Inc * | 12,407 | 262 | ||||||
Benefitfocus Inc * | 103,615 | 1,431 | ||||||
BM Technologies Inc * | 460 | 5 | ||||||
Brightcove Inc * | 22,677 | 456 | ||||||
Calix Inc * | 52,555 | 1,822 | ||||||
Cerence Inc *(A) | 4,376 | 392 | ||||||
ChannelAdvisor Corp * | 69,828 | 1,644 | ||||||
Cirrus Logic Inc * | 4,592 | 389 | ||||||
Cohu Inc * | 19,522 | 817 | ||||||
CommVault Systems * | 25,790 | 1,663 | ||||||
Cornerstone OnDemand Inc * | 31,886 | 1,390 | ||||||
Cree Inc *(A) | 6,187 | 669 | ||||||
CTS Corp | 57,291 | 1,779 | ||||||
Diebold Nixdorf Inc *(A) | 10,217 | 144 | ||||||
Digital Turbine Inc * | 27,584 | 2,217 | ||||||
Diodes Inc *(A) | 21,172 | 1,690 | ||||||
Domo Inc, Cl B * | 1,994 | 112 | ||||||
Echo Global Logistics Inc * | 60,296 | 1,894 | ||||||
EVERTEC Inc | 3,673 | 137 | ||||||
ExlService Holdings Inc * | 4,012 | 362 | ||||||
Extreme Networks Inc * | 32,111 | 281 | ||||||
FARO Technologies Inc *(A) | 12,842 | 1,112 | ||||||
FormFactor Inc * | 5,709 | 258 | ||||||
Ichor Holdings Ltd *(A) | 2,794 | 150 | ||||||
Insight Enterprises Inc * | 2,108 | 201 | ||||||
International Money Express Inc * | 17,897 | 269 | ||||||
Itron Inc * | 6,583 | 584 | ||||||
J2 Global Inc * | 12,702 | 1,523 | ||||||
Jabil Inc | 8,535 | 445 | ||||||
| 4 | SEI Institutional Managed Trust / Semi-Annual Report / March 31, 2021 |
SCHEDULE OF INVESTMENTS (Unaudited)
March 31, 2021
Small Cap Growth Fund (Continued)
| Description | Shares | Market Value ($ Thousands) | ||||||
COMMON STOCK (continued) | ||||||||
Kulicke & Soffa Industries Inc | 21,758 | $ | 1,069 | |||||
Lattice Semiconductor Corp * | 8,765 | 395 | ||||||
Littelfuse Inc | 3,605 | 953 | ||||||
Lumentum Holdings Inc * | 3,896 | 356 | ||||||
MACOM Technology Solutions Holdings Inc * | 5,711 | 331 | ||||||
Manhattan Associates Inc * | 9,971 | 1,170 | ||||||
MAXIMUS Inc | 5,561 | 495 | ||||||
Mimecast Ltd * | 45,445 | 1,827 | ||||||
Model N Inc * | 33,091 | 1,166 | ||||||
NETGEAR Inc * | 33,492 | 1,376 | ||||||
Perficient Inc * | 14,770 | 867 | ||||||
Ping Identity Holding Corp *(A) | 25,068 | 550 | ||||||
Plantronics Inc * | 2,532 | 98 | ||||||
Pluralsight Inc, Cl A * | 97,335 | 2,174 | ||||||
Power Integrations Inc | 4,344 | 354 | ||||||
QAD Inc, Cl A | 15,219 | 1,013 | ||||||
Rimini Street Inc * | 63,062 | 566 | ||||||
Rogers Corp * | 6,748 | 1,270 | ||||||
Sabre Corp *(A) | 53,787 | 797 | ||||||
Sailpoint Technologies Holdings Inc * | 14,686 | 744 | ||||||
Sanmina Corp * | 47,065 | 1,948 | ||||||
Sprout Social Inc, Cl A * | 9,302 | 537 | ||||||
SPS Commerce Inc * | 3,716 | 369 | ||||||
SVMK Inc * | 103,178 | 1,890 | ||||||
Sykes Enterprises Inc * | 22,409 | 988 | ||||||
Synaptics Inc *(A) | 13,134 | 1,779 | ||||||
SYNNEX Corp | 14,158 | 1,626 | ||||||
Tenable Holdings Inc * | 18,526 | 670 | ||||||
Teradata Corp *(A) | 22,059 | 850 | ||||||
TTEC Holdings Inc | 24,039 | 2,415 | ||||||
Ultra Clean Holdings Inc * | 35,609 | 2,067 | ||||||
Upland Software Inc * | 19,518 | 921 | ||||||
Viavi Solutions Inc * | 85,977 | 1,350 | ||||||
Vishay Intertechnology Inc | 90,209 | 2,172 | ||||||
Workiva Inc, Cl A * | 18,014 | 1,590 | ||||||
Zuora Inc, Cl A * | 76,049 | 1,126 | ||||||
|
|
| ||||||
| 73,721 | ||||||||
|
|
| ||||||
Materials — 3.4% | ||||||||
Alcoa Corp * | 18,096 | 588 | ||||||
Amyris Inc *(A) | 39,697 | 758 | ||||||
Boise Cascade Co | 26,892 | 1,609 | ||||||
Commercial Metals Co, Cl A | 41,757 | 1,288 | ||||||
Element Solutions Inc | 21,367 | 391 | ||||||
Greif Inc, Cl A | 6,421 | 366 | ||||||
Louisiana-Pacific Corp | 57,054 | 3,164 | ||||||
MP Materials Corp *(A) | 7,852 | 282 | ||||||
Orion Engineered Carbons * | 44,352 | 875 | ||||||
Ranpak Holdings Corp, Cl A * | 67,796 | 1,360 | ||||||
Rayonier Advanced Materials Inc * | 68,810 | 624 | ||||||
Reliance Steel & Aluminum Co | 5,624 | 857 | ||||||
Schnitzer Steel Industries Inc, Cl A | 33,238 | 1,389 | ||||||
| Description | Shares | Market Value ($ Thousands) | ||||||
COMMON STOCK (continued) | ||||||||
Trinseo SA | 19,023 | $ | 1,211 | |||||
Worthington Industries Inc (A) | 6,557 | 440 | ||||||
|
|
| ||||||
| 15,202 | ||||||||
|
|
| ||||||
Real Estate — 0.7% | ||||||||
CareTrust Inc ‡ | 11,277 | 263 | ||||||
Community Healthcare Trust Inc ‡ | 2,155 | 99 | ||||||
Easterly Government Properties Inc ‡ | 19,409 | 402 | ||||||
EastGroup Properties Inc ‡ | 1,130 | 162 | ||||||
Indus Realty Trust *‡ | 1 | — | ||||||
National Storage Affiliates Trust ‡ | 6,635 | 265 | ||||||
PotlatchDeltic Corp ‡ | 6,306 | 334 | ||||||
RE/MAX Holdings Inc, Cl A ‡ | 8,866 | 349 | ||||||
Realogy Holdings Corp * | 47,963 | 726 | ||||||
Redfin Corp *‡(A) | 5,714 | 381 | ||||||
Tanger Factory Outlet Centers Inc ‡(A) | 19,000 | 287 | ||||||
|
|
| ||||||
| 3,268 | ||||||||
|
|
| ||||||
Telecommunication Services — 0.1% |
| |||||||
ORBCOMM * | 36,614 | 279 | ||||||
|
|
| ||||||
Utilities — 0.2% | ||||||||
Middlesex Water Co | 1,282 | 101 | ||||||
Portland General Electric Co | 3,106 | 147 | ||||||
South Jersey Industries Inc, Cl A | 4,411 | 100 | ||||||
Spire Inc | 4,163 | 308 | ||||||
|
|
| ||||||
| 656 | ||||||||
|
|
| ||||||
Total Common Stock | 426,378 | |||||||
|
|
| ||||||
AFFILIATED PARTNERSHIP — 15.7% |
| |||||||
SEI Liquidity Fund, L.P. | ||||||||
0.020% **†(D) | 69,787,629 | 69,802 | ||||||
|
|
| ||||||
Total Affiliated Partnership | 69,802 | |||||||
|
|
| ||||||
CASH EQUIVALENT — 4.0% |
| |||||||
SEI Daily Income Trust, Government Fund, Cl F | ||||||||
0.010%**† | 17,821,135 | 17,821 | ||||||
|
|
| ||||||
Total Cash Equivalent | 17,821 | |||||||
|
|
| ||||||
Total Investments in Securities — 115.7% |
| $ | 514,001 | |||||
|
|
| ||||||
SEI Institutional Managed Trust / Semi-Annual Report / March 31, 2021 | 5 |
SCHEDULE OF INVESTMENTS (Unaudited)
March 31, 2021
Small Cap Growth Fund (Continued)
A list of the open futures contracts held by the Fund at March 31, 2021 is as follows:
| ||||||||||||||||||||
Type of Contract | Number of Contracts Long/(Short) | Expiration Date | Notional Amount (Thousands) | Value (Thousands) | Unrealized Appreciation (Depreciation) (Thousands) | |||||||||||||||
| ||||||||||||||||||||
Russell 2000 Index E-MINI | 62 | Jun-2021 | $ | 6,875 | $ | 6,890 | $ | 15 | ||||||||||||
| $ | 6,875 | $ | 6,890 | $ | 15 | |||||||||||||||
Percentages are based on Net Assets of $444,444 ($ Thousands). |
| * | Non-income producing security. |
| ** | The rate reported is the 7-day effective yield as of March 31, 2021. |
| ‡ | Real Estate Investment Trust. |
| † | Investment in Affiliated Security (see Note 10). |
| (A) | Certain securities or partial positions of certain securities are on loan at March 31, 2021 (See Note 10). The total market value of securities on loan at March 31, 2021 was $69,599 ($ Thousands). |
| (B) | Level 3 security in accordance with fair value hierarchy. |
| (C) | Securities considered restricted. The total market value of such securities as of March 31, 2021 was $61 ($ Thousands) and represented 0.0% of the Net Assets of the Fund. |
| (D) | This security was purchased with cash collateral held from securities on loan. The total market value of such securities as of March 31, 2021 was $69,802 ($ Thousands). |
ADR — American Depositary Receipt
Cl — Class
L.P. — Limited Partnership
Ltd. — Limited
PLC — Public Limited Company
The following is a list of the level of inputs used as of March 31, 2021, in valuing the Fund’s investments and other financial instruments carried at value ($ Thousands):
| Investments in Securities | Level 1 ($) | Level 2 ($) | Level 3 ($)(1) | Total ($) | ||||||||||||
Common Stock | 426,312 | – | 66 | 426,378 | ||||||||||||
Affiliated Partnership | – | 69,802 | – | 69,802 | ||||||||||||
Cash Equivalent | 17,821 | – | – | 17,821 | ||||||||||||
|
|
|
|
|
|
|
|
|
|
|
| |||||
Total Investments in Securities | 444,133 | 69,802 | 66 | 514,001 | ||||||||||||
|
|
|
|
|
|
|
|
|
|
|
| |||||
| ||||||||||||||||
| Other Financial Instruments | Level 1 ($) | Level 2 ($) | Level 3 ($) | Total ($) | ||||||||||||
Futures Contracts* | ||||||||||||||||
Unrealized Appreciation | 15 | – | – | 15 | ||||||||||||
|
|
|
|
|
|
|
|
|
|
|
| |||||
Total Other Financial Instruments | 15 | – | – | 15 | ||||||||||||
|
|
|
|
|
|
|
|
|
|
|
| |||||
(1) A reconciliation of Level 3 investments is presented when the Fund has a significant amount of Level 3 investments at the beginning and/or end of the period in relation to net assets. Management has concluded that Level 3 investments are not material in relation to net assets.
For the period ended March 31, 2021, there were no transfers in or out of Level 3.
For more information on valuation inputs, see Note 2 – Significant Accounting Policies in Notes to Financial Statements.
| 6 | SEI Institutional Managed Trust / Semi-Annual Report / March 31, 2021 |
SCHEDULE OF INVESTMENTS (Unaudited)
March 31, 2021
Small Cap Growth Fund (Continued)
The following is a summary of the Fund’s transactions with affiliates for the year ended March 31, 2021 ($ Thousands):
| Security Description | Value 9/30/2020 | Purchases at Cost | Proceeds from Sales | Realized Gain/ (Loss) | Change in Unrealized Appreciation/ (Depreciation) | Value 3/31/2021 | Shares | Income | Capital Gains | |||||||||
SEI Liquidity Fund, L.P. | $14,256 | $116,878 | $(61,332) | $ 1 | $(1) | $69,802 | 69,787,629 | $ 188 | $— | |||||||||
SEI Daily Income Trust, Government Fund, Cl F | 5,613 | 64,752 | (52,544) | — | — | 17,821 | 17,821,135 | — | — | |||||||||
|
|
|
|
|
|
|
| |||||||||||
Totals | $19,869 | $181,630 | $(113,876) | $ 1 | $(1) | $87,623 | $ 188 | $— | ||||||||||
|
|
|
|
|
|
|
|
Amounts designated as “—” are either $0 or have been rounded to $0.
The accompanying notes are an integral part of the financial statements.
SEI Institutional Managed Trust / Semi-Annual Report / March 31, 2021 | 7 |
SCHEDULE OF INVESTMENTS (Unaudited)
March 31, 2021
Tax-Managed Small/Mid Cap Fund (Continued)
| Description | Shares | Market Value ($ Thousands) | ||||||
COMMON STOCK — 97.1% |
| |||||||
Communication Services — 3.8% |
| |||||||
ATN International Inc | 4,814 | $ | 236 | |||||
Bandwidth Inc, Cl A * | 1,208 | 153 | ||||||
Boston Omaha Corp, Cl A *(A) | 3,497 | 103 | ||||||
Cable One Inc | 1,150 | 2,103 | ||||||
Cinemark Holdings Inc *(A) | 204,284 | 4,169 | ||||||
Cogent Communications Holdings Inc | 18,392 | 1,265 | ||||||
Electronic Arts Inc | 2,290 | 310 | ||||||
Glu Mobile Inc * | 12,631 | 158 | ||||||
IAC/InterActiveCorp * | 3,105 | 672 | ||||||
Interpublic Group of Cos Inc/The | 24,754 | 723 | ||||||
Iridium Communications Inc *(A) | 71,000 | 2,929 | ||||||
John Wiley & Sons Inc, Cl A | 9,260 | 502 | ||||||
Lions Gate Entertainment Corp, Cl A *(A) | 480,584 | 7,185 | ||||||
Match Group Inc * | 1,449 | 199 | ||||||
New York Times Co/The, Cl A | 19,500 | 987 | ||||||
Nexstar Media Group Inc, Cl A | 68,960 | 9,684 | ||||||
Ooma Inc * | 77,719 | 1,232 | ||||||
Shenandoah Telecommunications Co | 20,536 | 1,002 | ||||||
Take-Two Interactive Software Inc, Cl A * | 3,431 | 606 | ||||||
TechTarget Inc * | 534 | 37 | ||||||
TEGNA Inc | 60,000 | 1,130 | ||||||
United States Cellular Corp * | 11,940 | 435 | ||||||
World Wrestling Entertainment Inc, Cl A (A) | 28,861 | 1,566 | ||||||
Zynga Inc, Cl A * | 100,000 | 1,021 | ||||||
|
|
| ||||||
| 38,407 | ||||||||
|
|
| ||||||
Consumer Discretionary — 9.6% |
| |||||||
1-800-Flowers.com Inc, Cl A *(A) | 42,193 | 1,165 | ||||||
Advance Auto Parts Inc | 10,274 | 1,885 | ||||||
American Eagle Outfitters Inc | 163,769 | 4,788 | ||||||
America’s Car-Mart Inc/TX * | 5,643 | 860 | ||||||
Asbury Automotive Group Inc * | 3,907 | 768 | ||||||
At Home Group Inc * | 42,323 | 1,215 | ||||||
AutoNation Inc * | 1,730 | 161 | ||||||
Bloomin’ Brands Inc * | 205,848 | 5,568 | ||||||
Bright Horizons Family Solutions Inc * | 1,538 | 264 | ||||||
Brinker International Inc * | 35,604 | 2,530 | ||||||
CarParts.com Inc *(A) | 26,372 | 377 | ||||||
Carriage Services Inc | 26,433 | 930 | ||||||
Century Communities Inc * | 15,398 | 929 | ||||||
Cooper-Standard Holdings Inc * | 41,400 | 1,504 | ||||||
Core-Mark Holding Co Inc, Cl A | 14,464 | 560 | ||||||
Dave & Buster’s Entertainment Inc * | 43,840 | 2,100 | ||||||
Deckers Outdoor Corp * | 3,400 | 1,123 | ||||||
Dorman Products Inc * | 2,086 | 214 | ||||||
Etsy Inc * | 25,967 | 5,237 | ||||||
Green Brick Partners Inc *(A) | 53,506 | 1,213 | ||||||
Group 1 Automotive Inc | 4,472 | 706 | ||||||
GrowGeneration Corp *(A) | 17,496 | 869 | ||||||
Haverty Furniture Cos Inc | 25,532 | 949 | ||||||
Helen of Troy Ltd *(A) | 11,676 | 2,460 | ||||||
| Description | Shares | Market Value ($ Thousands) | ||||||
COMMON STOCK (continued) |
| |||||||
Hibbett Sports Inc *(A) | 17,681 | $ | 1,218 | |||||
Inspired Entertainment Inc * | 70,893 | 659 | ||||||
Installed Building Products Inc | 4,861 | 539 | ||||||
LCI Industries | 24,809 | 3,282 | ||||||
Lifetime Brands Inc (A) | 22,352 | 328 | ||||||
Lithia Motors Inc, Cl A | 24,454 | 9,539 | ||||||
LKQ Corp * | 49,641 | 2,101 | ||||||
M/I Homes Inc * | 16,042 | 948 | ||||||
MDC Holdings Inc | 3,306 | 196 | ||||||
Modine Manufacturing Co * | 571,716 | 8,444 | ||||||
Murphy USA Inc | 5,255 | 760 | ||||||
Norwegian Cruise Line Holdings Ltd *(A) | 88,916 | 2,453 | ||||||
Ollie’s Bargain Outlet Holdings Inc *(A) | 3,893 | 339 | ||||||
Pool Corp | 23,829 | 8,227 | ||||||
PulteGroup Inc | 44,000 | 2,307 | ||||||
Rent-A-Center Inc/TX | 27,016 | 1,558 | ||||||
Rocky Brands Inc | 2,375 | 128 | ||||||
Skechers USA Inc, Cl A * | 37,863 | 1,579 | ||||||
Sonos Inc * | 24,186 | 906 | ||||||
Stamps.com Inc *(A) | 6,803 | 1,357 | ||||||
Strategic Education Inc | 1,445 | 133 | ||||||
Stride * | 9,813 | 295 | ||||||
Taylor Morrison Home Corp, Cl A * | 69,500 | 2,141 | ||||||
Tri Pointe Homes Inc * | 10,100 | 206 | ||||||
Tupperware Brands Corp *(A) | 34,940 | 923 | ||||||
Unifi Inc * | 35,252 | 971 | ||||||
Urban Outfitters Inc * | 72,105 | 2,682 | ||||||
Vail Resorts Inc * | 9,517 | 2,776 | ||||||
Whirlpool Corp (A) | 3,320 | 732 | ||||||
Williams-Sonoma Inc (A) | 7,799 | 1,398 | ||||||
XPEL Inc * | 10,021 | 520 | ||||||
|
|
| ||||||
| 98,020 | ||||||||
|
|
| ||||||
Consumer Staples — 4.8% |
| |||||||
BJ’s Wholesale Club Holdings Inc *(A) | 24,382 | 1,094 | ||||||
Boston Beer Co Inc/The, Cl A * | 2,028 | 2,446 | ||||||
Bunge Ltd | 10,000 | 793 | ||||||
Casey’s General Stores Inc | 6,437 | 1,392 | ||||||
Celsius Holdings Inc *(A) | 29,350 | 1,410 | ||||||
Central Garden & Pet Co, Cl A * | 39,121 | 2,030 | ||||||
Coca-Cola Consolidated Inc | 2,500 | 722 | ||||||
Darling Ingredients Inc * | 40,500 | 2,980 | ||||||
Flowers Foods Inc | 80,547 | 1,917 | ||||||
Freshpet Inc * | 8,866 | 1,408 | ||||||
Grocery Outlet Holding Corp *(A) | 19,875 | 733 | ||||||
Hostess Brands Inc, Cl A * | 468,657 | 6,721 | ||||||
Ingles Markets Inc, Cl A | 6,621 | 408 | ||||||
Ingredion Inc (A) | 9,898 | 890 | ||||||
J & J Snack Foods Corp | 7,030 | 1,104 | ||||||
John B Sanfilippo & Son Inc | 13,714 | 1,239 | ||||||
Kroger Co/The (A) | 8,102 | 292 | ||||||
Lancaster Colony Corp | 5,300 | 929 | ||||||
Landec Corp * | 14,939 | 158 | ||||||
SEI Institutional Managed Trust / Semi-Annual Report / March 31, 2021 | 1 |
SCHEDULE OF INVESTMENTS (Unaudited)
March 31, 2021
Tax-Managed Small/Mid Cap Fund (Continued)
| Description | Shares | Market Value ($ Thousands) | ||||||
COMMON STOCK (continued) |
| |||||||
Medifast Inc | 25,737 | $ | 5,452 | |||||
National Beverage Corp, Cl A *(A) | 4,024 | 197 | ||||||
Pilgrim’s Pride Corp * | 149,410 | 3,555 | ||||||
Post Holdings Inc * | 7,519 | 795 | ||||||
PriceSmart Inc | 12,923 | 1,250 | ||||||
Seaboard Corp | 144 | 531 | ||||||
Seneca Foods Corp, Cl A * | 315 | 15 | ||||||
Spectrum Brands Holdings Inc | 30,246 | 2,571 | ||||||
Sprouts Farmers Market Inc *(A) | 27,834 | 741 | ||||||
Universal Corp/VA | 18,077 | 1,066 | ||||||
US Foods Holding Corp * | 10,313 | 393 | ||||||
USANA Health Sciences Inc * | 7,864 | 768 | ||||||
Village Super Market Inc, Cl A (A) | 15,188 | 358 | ||||||
WD-40 Co (A) | 3,849 | 1,178 | ||||||
Weis Markets Inc | 27,069 | 1,530 | ||||||
|
|
| ||||||
| 49,066 | ||||||||
|
|
| ||||||
Energy — 1.9% | ||||||||
Cabot Oil & Gas Corp | 80,892 | 1,519 | ||||||
Cimarex Energy Co | 98,294 | 5,838 | ||||||
Delek US Holdings Inc *(A) | 328,319 | 7,151 | ||||||
Marathon Petroleum Corp | 7,296 | 390 | ||||||
Pioneer Natural Resources Co | 19,058 | 3,027 | ||||||
Rattler Midstream LP (B) | 162,210 | 1,724 | ||||||
|
|
| ||||||
| 19,649 | ||||||||
|
|
| ||||||
Financials — 17.5% | ||||||||
1st Source Corp | 9,904 | 471 | ||||||
Affiliated Managers Group Inc | 1,488 | 222 | ||||||
Alleghany Corp * | 1,001 | 627 | ||||||
Allstate Corp/The | 7,361 | 846 | ||||||
Altabancorp | 23,776 | 1,000 | ||||||
A-Mark Precious Metals * | 7,917 | 285 | ||||||
American Equity Investment Life Holding Co | 106,222 | 3,349 | ||||||
American Financial Group Inc/OH | 13,674 | 1,560 | ||||||
Ameriprise Financial Inc | 4,701 | 1,093 | ||||||
AMERISAFE Inc | 9,132 | 584 | ||||||
Arch Capital Group Ltd * | 10,008 | 384 | ||||||
Argo Group International Holdings Ltd | 103,605 | 5,213 | ||||||
Arrow Financial Corp | 19,966 | 665 | ||||||
Artisan Partners Asset Management Inc, Cl A | 53,084 | 2,769 | ||||||
Assurant Inc | 5,558 | 788 | ||||||
Axos Financial Inc * | 48,113 | 2,262 | ||||||
Bank First (A) | 2,745 | 206 | ||||||
Bank of Marin Bancorp | 10,864 | 425 | ||||||
Bank OZK | 55,988 | 2,287 | ||||||
BankUnited Inc | 127,615 | 5,609 | ||||||
BGC Partners Inc, Cl A | 1,099,126 | 5,309 | ||||||
Brookline Bancorp Inc, Cl A | 24,112 | 362 | ||||||
Camden National Corp | 18,864 | 903 | ||||||
Canadian Imperial Bank of Commerce | 3,321 | 325 | ||||||
Capital City Bank Group Inc | 9,652 | 251 | ||||||
| Description | Shares | Market Value ($ Thousands) | ||||||
COMMON STOCK (continued) |
| |||||||
Citizens & Northern | 6,978 | $ | 166 | |||||
CNO Financial Group Inc | 289,034 | 7,021 | ||||||
Cohen & Steers Inc | 885 | 58 | ||||||
Columbia Banking System Inc | 136,760 | 5,893 | ||||||
Columbia Financial Inc *(A) | 58,169 | 1,017 | ||||||
Community Trust Bancorp Inc | 27,038 | 1,190 | ||||||
Diamond Hill Investment Group Inc | 2,001 | 312 | ||||||
Donnelley Financial Solutions Inc * | 39,415 | 1,097 | ||||||
Dynex Capital Inc ‡ | 51,983 | 984 | ||||||
Eagle Bancorp Inc | 29,167 | 1,552 | ||||||
Employers Holdings Inc | 17,888 | 770 | ||||||
Erie Indemnity Co, Cl A (A) | 4,514 | 997 | ||||||
Everest Re Group Ltd | 6,060 | 1,502 | ||||||
Farmers National Banc Corp | 24,544 | 410 | ||||||
Federated Hermes Inc, Cl B | 15,159 | 475 | ||||||
Financial Institutions Inc | 51,330 | 1,555 | ||||||
First American Financial Corp | 23,494 | 1,331 | ||||||
First Busey Corp | 73,564 | 1,887 | ||||||
First Citizens BancShares Inc/NC, Cl A | 775 | 648 | ||||||
First Commonwealth Financial Corp | 316,920 | 4,554 | ||||||
First Community Bankshares Inc | 66,479 | 1,994 | ||||||
First Horizon Corp | 341,595 | 5,776 | ||||||
First Merchants Corp | 77,646 | 3,611 | ||||||
First Midwest Bancorp Inc/IL | 68,601 | 1,503 | ||||||
Flagstar Bancorp Inc | 32,500 | 1,466 | ||||||
FNB Corp/PA (A) | 494,669 | 6,282 | ||||||
FRP Holdings Inc *(A) | 4,575 | 225 | ||||||
Great Southern Bancorp Inc | 13,042 | 739 | ||||||
Great Western Bancorp Inc | 86,378 | 2,616 | ||||||
Hanover Insurance Group Inc/The, Cl A | 25,705 | 3,328 | ||||||
Hilltop Holdings Inc | 30,507 | 1,041 | ||||||
HomeStreet Inc | 10,400 | 458 | ||||||
HomeTrust Bancshares Inc | 4,975 | 121 | ||||||
Horace Mann Educators Corp, Cl A | 21,962 | 949 | ||||||
Houlihan Lokey Inc, Cl A | 8,726 | 580 | ||||||
Independent Bank Corp/MI | 13,095 | 310 | ||||||
Lincoln National Corp | 48,278 | 3,006 | ||||||
MarketAxess Holdings Inc | 350 | 174 | ||||||
Mercantile Bank Corp | 10,589 | 344 | ||||||
Merchants Bancorp/IN | 45,712 | 1,917 | ||||||
Mercury General Corp | 3,404 | 207 | ||||||
MidWestOne Financial Group Inc | 16,411 | 508 | ||||||
Morgan Stanley | 7,661 | 595 | ||||||
Morningstar Inc, Cl A | 5,718 | 1,287 | ||||||
Nelnet Inc, Cl A | 4,248 | 309 | ||||||
OFG Bancorp | 133,441 | 3,018 | ||||||
Origin Bancorp Inc (A) | 25,847 | 1,096 | ||||||
Pacific Premier Bancorp Inc | 114,780 | 4,986 | ||||||
PacWest Bancorp | 386,880 | 14,759 | ||||||
Palomar Holdings Inc, Cl A * | 2,595 | 174 | ||||||
Park National Corp (A) | 1,252 | 162 | ||||||
PCSB Financial Corp | 20,078 | 334 | ||||||
| 2 | SEI Institutional Managed Trust / Semi-Annual Report / March 31, 2021 |
SCHEDULE OF INVESTMENTS (Unaudited)
March 31, 2021
Tax-Managed Small/Mid Cap Fund (Continued)
| Description | Shares | Market Value ($ Thousands) | ||||||
COMMON STOCK (continued) |
| |||||||
PennyMac Financial Services Inc | 16,593 | $ | 1,110 | |||||
Peoples Bancorp Inc/OH (A) | 29,343 | 973 | ||||||
Piper Sandler Cos | 823 | 90 | ||||||
PJT Partners Inc | 20,964 | 1,418 | ||||||
Popular Inc | 11,261 | 792 | ||||||
PRA Group Inc * | 17,323 | 642 | ||||||
Premier Financial Corp | 24,116 | 802 | ||||||
Provident Financial Services Inc | 24,819 | 553 | ||||||
Reinsurance Group of America Inc, Cl A | 7,938 | 1,001 | ||||||
Reliant Bancorp Inc | 40,302 | 1,157 | ||||||
RenaissanceRe Holdings Ltd | 7,345 | 1,177 | ||||||
Republic Bancorp Inc/KY, Cl A | 10,585 | 469 | ||||||
Safety Insurance Group Inc | 7,585 | 639 | ||||||
Selective Insurance Group Inc | 19,688 | 1,428 | ||||||
ServisFirst Bancshares Inc (A) | 26,000 | 1,595 | ||||||
Sierra Bancorp | 20,570 | 551 | ||||||
Starwood Property Trust Inc ‡ | 310,592 | 7,684 | ||||||
Stewart Information Services Corp | 21,161 | 1,101 | ||||||
Stifel Financial Corp | 25,125 | 1,610 | ||||||
SVB Financial Group, Cl B * | 3,773 | 1,863 | ||||||
TCF Financial Corp | 66,592 | 3,094 | ||||||
TPG RE Finance Trust Inc ‡ | 58,414 | 654 | ||||||
TriCo Bancshares | 22,196 | 1,051 | ||||||
TrustCo Bank Corp NY | 51,485 | 379 | ||||||
UMH Properties ‡ | 42,338 | 812 | ||||||
Umpqua Holdings Corp | 229,225 | 4,023 | ||||||
United Fire Group Inc | 67,986 | 2,366 | ||||||
Univest Financial Corp | 85,554 | 2,446 | ||||||
Virtus Investment Partners Inc | 300 | 71 | ||||||
Washington Trust Bancorp Inc (A) | 13,750 | 710 | ||||||
Waterstone Financial Inc | 85,678 | 1,750 | ||||||
|
|
| ||||||
| 179,100 | ||||||||
|
|
| ||||||
Health Care — 11.9% | ||||||||
ABIOMED Inc * | 967 | 308 | ||||||
ACADIA Pharmaceuticals Inc *(A) | 33,999 | 877 | ||||||
Acceleron Pharma Inc * | 627 | 85 | ||||||
AdaptHealth Corp, Cl A *(A) | 29,089 | 1,069 | ||||||
Aerie Pharmaceuticals Inc * | 75,660 | 1,352 | ||||||
Akebia Therapeutics | 77,991 | 264 | ||||||
Akero Therapeutics Inc * | 2,796 | 81 | ||||||
Albireo Pharma Inc *(A) | 13,042 | 460 | ||||||
Amedisys Inc * | 1,346 | 356 | ||||||
AmerisourceBergen Corp, Cl A | 4,713 | 556 | ||||||
AMN Healthcare Services Inc * | 50,034 | 3,688 | ||||||
Applied Therapeutics *(A) | 5,721 | 107 | ||||||
Arcus Biosciences Inc *(A) | 8,754 | 246 | ||||||
Arcutis Biotherapeutics * | 2,129 | 62 | ||||||
Arena Pharmaceuticals Inc * | 6,000 | 416 | ||||||
Atreca Inc, Cl A * | 18,444 | 283 | ||||||
AtriCure Inc *(A) | 14,000 | 917 | ||||||
Atrion Corp | 1,363 | 874 | ||||||
BioMarin Pharmaceutical Inc * | 4,059 | 306 | ||||||
| Description | Shares | Market Value ($ Thousands) | ||||||
COMMON STOCK (continued) | ||||||||
Bio-Techne Corp | 3,600 | $ | 1,375 | |||||
Blueprint Medicines Corp * | 2,801 | 272 | ||||||
Bridgebio Pharma Inc *(A) | 2,632 | 162 | ||||||
Castle Biosciences Inc * | 4,116 | 282 | ||||||
Catalent Inc * | 16,500 | 1,738 | ||||||
Change Healthcare Inc * | 306,740 | 6,779 | ||||||
Charles River Laboratories International Inc * | 7,525 | 2,181 | ||||||
Chemed Corp | 5,900 | 2,713 | ||||||
ChromaDex Corp * | 42,607 | 398 | ||||||
Co-Diagnostics Inc *(A) | 35,942 | 343 | ||||||
Collegium Pharmaceutical Inc *(A) | 55,451 | 1,314 | ||||||
Computer Programs and Systems Inc * | 21,134 | 647 | ||||||
CorVel Corp * | 3,132 | 321 | ||||||
Covetrus Inc *(A) | 19,339 | 580 | ||||||
CryoLife Inc *(A) | 680 | 15 | ||||||
Cymabay Therapeutics Inc * | 101,706 | 462 | ||||||
CytomX Therapeutics Inc * | 38,492 | 298 | ||||||
Denali Therapeutics Inc * | 4,607 | 263 | ||||||
Durect Corp * | 26,038 | 52 | ||||||
Eagle Pharmaceuticals Inc/DE *(A) | 10,572 | 441 | ||||||
Emergent BioSolutions Inc * | 42,789 | 3,976 | ||||||
Encompass Health Corp | 19,928 | 1,632 | ||||||
Ensign Group Inc/The | 22,232 | 2,086 | ||||||
Fate Therapeutics Inc * | 11,655 | 961 | ||||||
Five Prime Therapeutics Inc * | 11,562 | 436 | ||||||
Fulgent Genetics Inc * | 1,200 | 116 | ||||||
GenMark Diagnostics Inc * | 15,493 | 370 | ||||||
Global Blood Therapeutics Inc *(A) | 5,702 | 232 | ||||||
Globus Medical Inc, Cl A * | 14,804 | 913 | ||||||
GW Pharmaceuticals PLC ADR * | 1,684 | 365 | ||||||
Haemonetics Corp * | 16,579 | 1,840 | ||||||
HealthStream Inc * | 36,679 | 819 | ||||||
Heska Corp * | 167 | 28 | ||||||
Hill-Rom Holdings Inc | 4,708 | 520 | ||||||
Homology Medicines Inc *(A) | 39,776 | 374 | ||||||
ICON PLC * | 7,886 | 1,548 | ||||||
ICU Medical Inc * | 5,669 | 1,165 | ||||||
IDEXX Laboratories Inc * | 458 | 224 | ||||||
Incyte Corp * | 3,300 | 268 | ||||||
Inovalon Holdings Inc, Cl A * | 71,259 | 2,051 | ||||||
Insmed Inc * | 31,452 | 1,071 | ||||||
Integra LifeSciences Holdings Corp * | 45,000 | 3,109 | ||||||
Iovance Biotherapeutics | 32,559 | 1,031 | ||||||
Jazz Pharmaceuticals PLC * | 15,979 | 2,627 | ||||||
Karyopharm Therapeutics Inc *(A) | 27,040 | 284 | ||||||
Kiniksa Pharmaceuticals Ltd, Cl A *(A) | 22,925 | 424 | ||||||
Krystal Biotech Inc *(A) | 1,716 | 132 | ||||||
LeMaitre Vascular Inc (A) | 467 | 23 | ||||||
LHC Group Inc * | 6,905 | 1,320 | ||||||
Ligand Pharmaceuticals | 28,582 | 4,357 | ||||||
Magellan Health Inc * | 14,229 | 1,327 | ||||||
SEI Institutional Managed Trust / Semi-Annual Report / March 31, 2021 | 3 |
SCHEDULE OF INVESTMENTS (Unaudited)
March 31, 2021
Tax-Managed Small/Mid Cap Fund (Continued)
| Description | Shares | Market Value ($ Thousands) | ||||||
COMMON STOCK (continued) | ||||||||
Masimo Corp * | 3,863 | $ | 887 | |||||
Medpace Holdings Inc * | 9,937 | 1,630 | ||||||
Meridian Bioscience Inc *(A) | 20,847 | 547 | ||||||
Mettler-Toledo International Inc * | 411 | 475 | ||||||
ModivCare Inc * | 8,591 | 1,273 | ||||||
Morphic Holding * | 4,008 | 254 | ||||||
National HealthCare Corp | 12,608 | 982 | ||||||
Natus Medical Inc * | 29,663 | 760 | ||||||
Neogen Corp, Cl B *(A) | 4,026 | 358 | ||||||
NeoGenomics Inc *(A) | 18,676 | 901 | ||||||
Neurocrine Biosciences Inc * | 10,038 | 976 | ||||||
Nevro Corp *(A) | 1,424 | 199 | ||||||
NextGen Healthcare Inc * | 8,065 | 146 | ||||||
NGM Biopharmaceuticals Inc * | 11,335 | 330 | ||||||
Novocure Ltd *(A) | 2,480 | 328 | ||||||
Omnicell Inc * | 1,763 | 229 | ||||||
OptimizeRx Corp * | 14,122 | 688 | ||||||
Organogenesis Holdings Inc, Cl A * | 68,439 | 1,247 | ||||||
Orthofix Medical Inc * | 14,375 | 623 | ||||||
Owens & Minor Inc | 39,047 | 1,468 | ||||||
Pacira BioSciences Inc * | 44,489 | 3,118 | ||||||
Pennant Group Inc/The * | 17,711 | 811 | ||||||
Penumbra Inc *(A) | 1,427 | 386 | ||||||
PerkinElmer Inc | 12,707 | 1,630 | ||||||
Phibro Animal Health Corp, Cl A (A) | 32,589 | 795 | ||||||
Premier Inc, Cl A | 80,870 | 2,737 | ||||||
Prestige Consumer Healthcare Inc, Cl A * | 46,904 | 2,068 | ||||||
Protagonist Therapeutics Inc *(A) | 26,630 | 690 | ||||||
QIAGEN NV * | 14,831 | 722 | ||||||
Quanterix Corp * | 20,327 | 1,189 | ||||||
Quidel Corp *(A) | 1,577 | 202 | ||||||
R1 RCM Inc * | 74,014 | 1,827 | ||||||
Reata Pharmaceuticals Inc, Cl A *(A) | 10,095 | 1,006 | ||||||
Repligen Corp * | 6,804 | 1,323 | ||||||
Revance Therapeutics Inc * | 82,213 | 2,298 | ||||||
Rhythm Pharmaceuticals Inc *(A) | 10,870 | 231 | ||||||
SeaSpine Holdings Corp * | 11,657 | 203 | ||||||
SIGA Technologies Inc * | 2,198 | 14 | ||||||
Simulations Plus Inc (A) | 799 | 51 | ||||||
Spero Therapeutics Inc * | 16,852 | 248 | ||||||
STERIS PLC (A) | 2,291 | 436 | ||||||
Stoke Therapeutics Inc * | 5,807 | 226 | ||||||
Supernus Pharmaceuticals Inc *(A) | 8,694 | 228 | ||||||
Syneos Health Inc, Cl A * | 96,849 | 7,346 | ||||||
Teleflex Inc | 8,291 | 3,445 | ||||||
Tenet Healthcare Corp * | 6,108 | 318 | ||||||
Translate Bio Inc * | 16,743 | 276 | ||||||
Travere Therapeutics * | 80,652 | 2,014 | ||||||
Twist Bioscience Corp *(A) | 566 | 70 | ||||||
Ultragenyx Pharmaceutical Inc *(A) | 12,000 | 1,366 | ||||||
United Therapeutics Corp * | 7,055 | 1,180 | ||||||
Utah Medical Products Inc | 6,164 | 534 | ||||||
| Description | Shares | Market Value ($ Thousands) | ||||||
COMMON STOCK (continued) | ||||||||
Vapotherm Inc * | 1,870 | $ | 45 | |||||
Vir Biotechnology *(A) | 7,158 | 367 | ||||||
West Pharmaceutical Services Inc | 1 | — | ||||||
|
|
| ||||||
| 122,273 | ||||||||
|
|
| ||||||
Industrials — 15.2% | ||||||||
A O Smith Corp | 4,400 | 297 | ||||||
AAON Inc (A) | 8,319 | 582 | ||||||
ACCO Brands Corp | 517,127 | 4,365 | ||||||
Advanced Drainage Systems Inc | 16,174 | 1,672 | ||||||
AECOM * | 13,579 | 871 | ||||||
AeroVironment Inc * | 6,958 | 808 | ||||||
Altra Industrial Motion Corp | 7,543 | 417 | ||||||
ArcBest Corp | 17,512 | 1,232 | ||||||
Armstrong World Industries Inc | 25,821 | 2,326 | ||||||
Atkore Inc * | 38,805 | 2,790 | ||||||
Atlas Air Worldwide Holdings Inc * | 60,908 | 3,681 | ||||||
Builders FirstSource Inc * | 61,574 | 2,855 | ||||||
BWX Technologies Inc, Cl W | 84,376 | 5,564 | ||||||
Casella Waste Systems Inc, Cl A * | 5,000 | 318 | ||||||
CBIZ Inc * | 2,449 | 80 | ||||||
Cintas Corp | 3,186 | 1,087 | ||||||
Clean Harbors Inc * | 7,022 | 590 | ||||||
Colfax Corp *(A) | 167,422 | 7,335 | ||||||
CoStar Group Inc * | 4,446 | 3,654 | ||||||
CRA International Inc | 11,678 | 872 | ||||||
CSW Industrials Inc | 5,365 | 724 | ||||||
Curtiss-Wright Corp | 15,306 | 1,815 | ||||||
Dycom Industries Inc * | 5,730 | 532 | ||||||
EMCOR Group Inc | 19,007 | 2,132 | ||||||
Ennis Inc | 34,657 | 740 | ||||||
Evoqua Water Technologies Corp * | 17,172 | 452 | ||||||
Exponent Inc | 30,000 | 2,923 | ||||||
Forrester Research Inc * | 9,468 | 402 | ||||||
Franklin Covey Co *(A) | 648 | 18 | ||||||
FTI Consulting Inc * | 10,890 | 1,526 | ||||||
Gibraltar Industries Inc * | 19,000 | 1,739 | ||||||
Griffon Corp | 25,360 | �� | 689 | |||||
Heartland Express Inc | 124,414 | 2,436 | ||||||
Helios Technologies Inc | 8,122 | 592 | ||||||
Heritage-Crystal Clean Inc * | 29,302 | 795 | ||||||
Hillenbrand Inc | 8,146 | 389 | ||||||
Hub Group Inc, Cl A * | 12,964 | 872 | ||||||
IAA Inc * | 85,739 | 4,728 | ||||||
ICF International Inc, Cl A | 4,655 | 407 | ||||||
IDEX Corp | 4,000 | 837 | ||||||
JetBlue Airways Corp * | 254,146 | 5,169 | ||||||
Kadant Inc (A) | 16,160 | 2,990 | ||||||
Kaman Corp, Cl A | 52,269 | 2,681 | ||||||
KAR Auction Services Inc * | 300,328 | 4,505 | ||||||
Kelly Services Inc, Cl A * | 4,601 | 102 | ||||||
Kforce Inc | 10,057 | 539 | ||||||
L3Harris Technologies Inc | 2,036 | 413 | ||||||
| 4 | SEI Institutional Managed Trust / Semi-Annual Report / March 31, 2021 |
SCHEDULE OF INVESTMENTS (Unaudited)
March 31, 2021
Tax-Managed Small/Mid Cap Fund (Continued)
| Description | Shares | Market Value ($ Thousands) | ||||||
COMMON STOCK (continued) |
| |||||||
Landstar System Inc | 8,600 | $ | 1,419 | |||||
Limbach Holdings Inc * | 113,604 | 1,200 | ||||||
Lindsay Corp (A) | 9,200 | 1,533 | ||||||
Macquarie Infrastructure Corp * | 18,400 | 585 | ||||||
ManTech International Corp/VA, Cl A | 12,947 | 1,126 | ||||||
Marten Transport Ltd | 77,299 | 1,312 | ||||||
Masonite International Corp * | 37,876 | 4,365 | ||||||
Mastech Digital Inc * | 8,853 | 156 | ||||||
Matson Inc | 4,687 | 313 | ||||||
Meritor Inc * | 39,622 | 1,166 | ||||||
MSA Safety Inc | 10,698 | 1,605 | ||||||
MSC Industrial Direct Co Inc, Cl A | 3,679 | 332 | ||||||
MYR Group Inc * | 22,025 | 1,578 | ||||||
National Presto Industries Inc | 1,385 | 141 | ||||||
Old Dominion Freight Line Inc, Cl A | 9,957 | 2,394 | ||||||
PGT Innovations Inc * | 28,530 | 720 | ||||||
Powell Industries Inc | 6,900 | 234 | ||||||
Primoris Services Corp | 31,507 | 1,044 | ||||||
Quanex Building Products Corp | 8,291 | 217 | ||||||
Radiant Logistics Inc * | 49,017 | 341 | ||||||
RBC Bearings Inc * | 4,000 | 787 | ||||||
Resideo Technologies Inc * | 36,899 | 1,042 | ||||||
Resources Connection Inc | 21,841 | 296 | ||||||
REV Group Inc * | 19,893 | 381 | ||||||
Rush Enterprises Inc, Cl A | 38,922 | 1,939 | ||||||
Saia Inc *(A) | 7,000 | 1,614 | ||||||
Schneider National Inc, Cl B | 13,231 | 330 | ||||||
Shyft Group Inc/The | 28,592 | 1,064 | ||||||
Simpson Manufacturing Co Inc | 8,867 | 920 | ||||||
SiteOne Landscape Supply Inc *(A) | 3,529 | 602 | ||||||
Standex International Corp | 5,842 | 558 | ||||||
Systemax Inc | 4,467 | 184 | ||||||
Teledyne Technologies Inc * | 18,991 | 7,856 | ||||||
Tetra Tech Inc | 27,739 | 3,765 | ||||||
Textainer Group Holdings Ltd * | 56,064 | 1,606 | ||||||
Toro Co/The | 2,800 | 289 | ||||||
TriMas Corp * | 23,190 | 703 | ||||||
Trinity Industries Inc (A) | 142,479 | 4,059 | ||||||
UFP Industries Inc | 9,396 | 713 | ||||||
United Rentals Inc * | 4,375 | 1,441 | ||||||
Upwork Inc * | 16,655 | 746 | ||||||
Vicor Corp * | 4,894 | 416 | ||||||
Werner Enterprises Inc | 29,446 | 1,389 | ||||||
WESCO International Inc * | 94,612 | 8,187 | ||||||
Westinghouse Air Brake Technologies Corp | 3,600 | 285 | ||||||
XPO Logistics Inc * | 78,605 | 9,692 | ||||||
|
|
| ||||||
| 155,188 | ||||||||
|
|
| ||||||
Information Technology — 18.5% |
| |||||||
A10 Networks Inc * | 141,358 | 1,358 | ||||||
ACI Worldwide Inc * | 374,772 | 14,260 | ||||||
Agilysys Inc * | 13,470 | 646 | ||||||
Alliance Data Systems Corp | 15,014 | 1,683 | ||||||
| Description | Shares | Market Value ($ Thousands) | ||||||
COMMON STOCK (continued) |
| |||||||
Alpha & Omega Semiconductor Ltd * | 39,527 | $ | 1,293 | |||||
Amdocs Ltd | 14,000 | 982 | ||||||
American Software Inc/GA, Cl A | 30,440 | 630 | ||||||
Amkor Technology Inc | 75,502 | 1,790 | ||||||
ANSYS Inc * | 2,600 | 883 | ||||||
Arista Networks Inc * | 2,488 | 751 | ||||||
Aspen Technology Inc * | 25,803 | 3,724 | ||||||
Axcelis Technologies Inc * | 24,597 | 1,011 | ||||||
Broadridge Financial Solutions Inc | 1,700 | 260 | ||||||
Brooks Automation Inc | 754 | 62 | ||||||
Cadence Design Systems Inc * | 12,100 | 1,658 | ||||||
Calix Inc * | 48,212 | 1,671 | ||||||
Cambium Networks Corp * | 22,490 | 1,051 | ||||||
Cardtronics PLC * | 22,468 | 872 | ||||||
Cass Information Systems Inc | 9,000 | 416 | ||||||
ChannelAdvisor Corp * | 51,607 | 1,215 | ||||||
Cloudflare Inc, Cl A *(A) | 4,553 | 320 | ||||||
Cognyte Software Ltd *(A) | 112,718 | 3,135 | ||||||
CommVault Systems Inc * | 26,733 | 1,724 | ||||||
Conduent Inc * | 113,376 | 755 | ||||||
Cornerstone OnDemand Inc * | 28,250 | 1,231 | ||||||
CSG Systems International Inc | 16,561 | 743 | ||||||
Diodes Inc *(A) | 15,000 | 1,198 | ||||||
Dolby Laboratories Inc, Cl A | 12,000 | 1,185 | ||||||
Echo Global Logistics Inc * | 8,703 | 273 | ||||||
Enphase Energy Inc * | 5,140 | 834 | ||||||
Entegris Inc | 19,770 | 2,210 | ||||||
EPAM Systems Inc * | 5,383 | 2,135 | ||||||
Euronet Worldwide Inc * | 30,399 | 4,204 | ||||||
EVERTEC Inc | 63,730 | 2,372 | ||||||
ExlService Holdings Inc *(A) | 24,383 | 2,198 | ||||||
Extreme Networks Inc * | 44,054 | 385 | ||||||
Fair Isaac Corp * | 2,500 | 1,215 | ||||||
Five9 Inc * | 5,242 | 820 | ||||||
FormFactor Inc * | 600 | 27 | ||||||
Gartner Inc * | 1,518 | 277 | ||||||
Genpact Ltd | 30,604 | 1,311 | ||||||
Global Payments Inc | 1,009 | 203 | ||||||
Globant SA * | 4,500 | 934 | ||||||
Hackett Group Inc/The | 37,239 | 610 | ||||||
Ichor Holdings Ltd *(A) | 16,589 | 893 | ||||||
II-VI Inc *(A) | 35,206 | 2,407 | ||||||
Insight Enterprises Inc * | 21,641 | 2,065 | ||||||
Intelligent Systems Corp * | 358 | 15 | ||||||
International Money Express Inc * | 1,250 | 19 | ||||||
Itron Inc * | 577 | 51 | ||||||
J2 Global Inc *(A) | 211,316 | 25,328 | ||||||
Lantronix Inc * | 42,658 | 195 | ||||||
Lattice Semiconductor Corp * | 37,782 | 1,701 | ||||||
Leidos Holdings Inc | 11,756 | 1,132 | ||||||
LiveRamp Holdings Inc * | 10,000 | 519 | ||||||
Lumentum Holdings Inc * | 2,779 | 254 | ||||||
SEI Institutional Managed Trust / Semi-Annual Report / March 31, 2021 | 5 |
SCHEDULE OF INVESTMENTS (Unaudited)
March 31, 2021
Tax-Managed Small/Mid Cap Fund (Continued)
| Description | Shares | Market Value ($ Thousands) | ||||||
COMMON STOCK (continued) |
| |||||||
MACOM Technology Solutions Holdings Inc * | 12,485 | $ | 724 | |||||
Manhattan Associates Inc * | 10,280 | 1,207 | ||||||
MAXIMUS Inc | 35,530 | 3,164 | ||||||
MicroStrategy Inc, Cl A *(A) | 726 | 493 | ||||||
Model N Inc * | 21,638 | 762 | ||||||
Monolithic Power Systems Inc | 6,335 | 2,238 | ||||||
National Instruments Corp | 370 | 16 | ||||||
NCR Corp *(A) | 132,854 | 5,042 | ||||||
NIC Inc | 72,349 | 2,455 | ||||||
nLight Inc * | 20,093 | 651 | ||||||
Nuance Communications Inc * | 53,148 | 2,319 | ||||||
NVE Corp | 9,565 | 671 | ||||||
ON Semiconductor Corp * | 108,955 | 4,534 | ||||||
OSI Systems Inc * | 184 | 18 | ||||||
Palo Alto Networks Inc * | 786 | 253 | ||||||
Perficient Inc * | 12,505 | 734 | ||||||
Photronics Inc * | 115,668 | 1,488 | ||||||
Power Integrations Inc | 20,000 | 1,630 | ||||||
Progress Software Corp | 5,788 | 255 | ||||||
PTC Inc * | 19,109 | 2,630 | ||||||
QAD Inc, Cl A | 5,106 | 340 | ||||||
Qorvo Inc * | 1 | — | ||||||
Qualys Inc *(A) | 1,225 | 128 | ||||||
Radware Ltd * | 26,112 | 681 | ||||||
Rambus Inc * | 69,493 | 1,351 | ||||||
RingCentral Inc, Cl A * | 773 | 230 | ||||||
Sapiens International Corp NV | 43,975 | 1,398 | ||||||
Science Applications International Corp | 10,962 | 916 | ||||||
Semtech Corp * | 69,289 | 4,781 | ||||||
Shutterstock Inc | 21,003 | 1,870 | ||||||
Silicon Motion Technology Corp ADR | 221,337 | 13,145 | ||||||
SiTime Corp * | 450 | 44 | ||||||
SolarWinds Corp * | 744 | 13 | ||||||
SPS Commerce Inc * | 16,563 | 1,645 | ||||||
Super Micro Computer Inc * | 182,775 | 7,139 | ||||||
SVMK Inc * | 28,358 | 520 | ||||||
Sykes Enterprises Inc * | 31,637 | 1,395 | ||||||
Synopsys Inc * | 5,999 | 1,486 | ||||||
Tenable Holdings Inc * | 29,500 | 1,067 | ||||||
Teradyne Inc | 11,312 | 1,376 | ||||||
Trade Desk Inc/The, | 1,896 | 1,236 | ||||||
TTEC Holdings Inc | 31,473 | 3,161 | ||||||
Tucows Inc, Cl A *(A) | 1,294 | 100 | ||||||
Tyler Technologies Inc * | 4,508 | 1,914 | ||||||
Verint Systems Inc * | 112,718 | 5,128 | ||||||
Wix.com Ltd * | 15,023 | 4,195 | ||||||
WNS Holdings Ltd ADR * | 26,370 | 1,910 | ||||||
|
|
| ||||||
| 189,547 | ||||||||
|
|
| ||||||
Materials — 7.0% | ||||||||
Albemarle Corp (A) | 4,500 | 657 | ||||||
Ashland Global Holdings Inc | 55,852 | 4,958 | ||||||
| Description | Shares | Market Value ($ Thousands) | ||||||
COMMON STOCK (continued) |
| |||||||
Avery Dennison Corp | 2,472 | $ | 454 | |||||
Avient Corp | 22,000 | 1,040 | ||||||
Axalta Coating Systems Ltd * | 164,272 | 4,859 | ||||||
B2Gold Corp | 501,613 | 2,162 | ||||||
Balchem Corp | 20,761 | 2,604 | ||||||
Boise Cascade Co | 23,092 | 1,382 | ||||||
Century Aluminum Co * | 231,450 | 4,087 | ||||||
Chase | 554 | 64 | ||||||
Commercial Metals Co, Cl A (A) | 270,710 | 8,349 | ||||||
Crown Holdings Inc | 4,800 | 466 | ||||||
Domtar Corp * | 101,381 | 3,746 | ||||||
FMC Corp | 102,303 | 11,316 | ||||||
Fortitude Gold Corp (C) | 40,846 | 189 | ||||||
Hawkins Inc | 12,136 | 407 | ||||||
Hecla Mining Co | 131,999 | 751 | ||||||
Ingevity Corp * | 36,000 | 2,719 | ||||||
Louisiana-Pacific Corp | 18,357 | 1,018 | ||||||
Materion Corp | 9,421 | 624 | ||||||
Myers Industries Inc | 29,683 | 586 | ||||||
NewMarket Corp | 4,076 | 1,549 | ||||||
Novagold Resources | 129,786 | 1,137 | ||||||
Packaging Corp of America (A) | 2,600 | 350 | ||||||
Resolute Forest Products Inc * | 88,838 | 973 | ||||||
Royal Gold Inc, Cl A | 8,757 | 942 | ||||||
Sensient Technologies Corp | 18,700 | 1,459 | ||||||
Silgan Holdings Inc | 270,689 | 11,377 | ||||||
Stepan Co | 9,000 | 1,144 | ||||||
|
|
| ||||||
| 71,369 | ||||||||
|
|
| ||||||
Real Estate — 4.9% | ||||||||
Camden Property Trust ‡ | 13,101 | 1,440 | ||||||
CareTrust Inc ‡ | 41,582 | 968 | ||||||
CatchMark Timber Trust Inc, Cl A ‡ | 108,771 | 1,107 | ||||||
Centerspace ‡ | 15,417 | 1,048 | ||||||
City Office REIT ‡ | 17,779 | 189 | ||||||
Community Healthcare Trust Inc ‡ | 384 | 18 | ||||||
EastGroup Properties Inc ‡ | 14,800 | 2,121 | ||||||
Equity Commonwealth *‡ | 11,988 | 333 | ||||||
Equity LifeStyle Properties ‡ | 20,564 | 1,309 | ||||||
Gaming and Leisure Properties Inc ‡ | 167,435 | 7,104 | ||||||
Getty Realty Corp ‡ | 28,351 | 803 | ||||||
Gladstone Commercial Corp ‡ | 33,797 | 661 | ||||||
Howard Hughes Corp/The *‡ | 51,451 | 4,895 | ||||||
Independence Realty Trust ‡ | 113,415 | 1,724 | ||||||
Invitation Homes Inc ‡ | 88,917 | 2,844 | ||||||
Kite Realty Group Trust ‡ | 34,895 | 673 | ||||||
Life Storage Inc ‡ | 4,650 | 400 | ||||||
Medical Properties Trust Inc ‡ | 410,854 | 8,743 | ||||||
Monmouth Real Estate Investment Corp, Cl A ‡ | 88,945 | 1,573 | ||||||
National Health Investors Inc ‡ | 265 | 19 | ||||||
National Storage Affiliates Trust ‡ | 10,689 | 427 | ||||||
New Senior Investment Group Inc ‡ | 47,637 | 297 | ||||||
| 6 | SEI Institutional Managed Trust / Semi-Annual Report / March 31, 2021 |
SCHEDULE OF INVESTMENTS (Unaudited)
March 31, 2021
Tax-Managed Small/Mid Cap Fund (Continued)
| Description | Shares | Market Value ($ Thousands) | ||||||
COMMON STOCK (continued) |
| |||||||
Newmark Group Inc, Cl A ‡ | 450,766 | $ | 4,510 | |||||
One Liberty Properties Inc ‡ | 51,891 | 1,156 | ||||||
PS Business Parks Inc ‡ | 6,125 | 947 | ||||||
RMR Group Inc/The, Cl A ‡ | 23,159 | 945 | ||||||
Sabra Health Care Inc ‡ | 42,013 | 729 | ||||||
Safehold Inc ‡(A) | 19,251 | 1,350 | ||||||
Spirit Realty Capital Inc ‡ | 387 | 16 | ||||||
Sun Communities Inc ‡ | 1,653 | 248 | ||||||
Terreno Realty Corp ‡ | 15,348 | 887 | ||||||
Universal Health Realty Income Trust ‡ | 3,689 | 250 | ||||||
|
|
| ||||||
| 49,734 | ||||||||
|
|
| ||||||
Utilities — 2.0% |
| |||||||
ALLETE Inc | 14,400 | 967 | ||||||
American States Water Co | 21,500 | 1,626 | ||||||
Artesian Resources Corp, Cl A | 40,073 | 1,578 | ||||||
Atmos Energy Corp | 10,774 | 1,065 | ||||||
Black Hills Corp, Cl A | 11,841 | 791 | ||||||
Chesapeake Utilities Corp (A) | 6,037 | 701 | ||||||
Clearway Energy Inc, Cl A | 43,089 | 1,142 | ||||||
Hawaiian Electric Industries Inc | 21,153 | 940 | ||||||
IDACORP Inc, Cl A | 10,909 | 1,091 | ||||||
MDU Resources Group Inc | 14,335 | 453 | ||||||
MGE Energy Inc | 21,134 | 1,509 | ||||||
Middlesex Water Co | 22,660 | 1,791 | ||||||
NorthWestern Corp | 5,270 | 344 | ||||||
Ormat Technologies Inc (A) | 13,800 | 1,084 | ||||||
PNM Resources Inc | 25,500 | 1,251 | ||||||
Portland General Electric Co | 43,378 | 2,059 | ||||||
| Description | Shares | Market Value ($ Thousands) | ||||||
COMMON STOCK (continued) |
| |||||||
Southwest Gas Holdings Inc | 10,221 | $ | 702 | |||||
UGI Corp | 6,450 | 264 | ||||||
Unitil Corp | 11,188 | 511 | ||||||
Vistra Corp | 710 | 12 | ||||||
York Water Co/The | 18,850 | 923 | ||||||
|
|
| ||||||
| 20,804 | ||||||||
|
|
| ||||||
Total Common Stock | 993,157 | |||||||
|
|
| ||||||
AFFILIATED PARTNERSHIP — 11.2% |
| |||||||
SEI Liquidity Fund, L.P. | 114,322,771 | 114,352 | ||||||
|
|
| ||||||
Total Affiliated Partnership | 114,352 | |||||||
|
|
| ||||||
CASH EQUIVALENT — 2.9% |
| |||||||
SEI Daily Income Trust, Government Fund, Cl F | 30,072,280 | 30,072 | ||||||
|
|
| ||||||
Total Cash Equivalent | 30,072 | |||||||
|
|
| ||||||
Total Investments in Securities — 111.2% |
| $ | 1,137,581 | |||||
|
|
| ||||||
A list of the open futures contracts held by the Fund at March 31, 2021 is as follows:
Type of Contract | Number of Contracts Long/(Short) | Expiration Date | Notional Amount (Thousands) | Value (Thousands) | Unrealized Appreciation (Depreciation) (Thousands) | |||||||||||||||
Russell 2000 Index E-MINI | 14 | Jun-2021 | $ | 1,552 | $ | 1,556 | $ | 4 | ||||||||||||
S&P Mid Cap 400 Index E-MINI | 4 | Jun-2021 | 1,049 | 1,042 | (7) | |||||||||||||||
|
| |||||||||||||||||||
| $ | 2,601 | $ | 2,598 | $ | (3) | |||||||||||||||
|
| |||||||||||||||||||
Percentages are based on Net Assets of $1,023,126 ($ Thousands). * Non-income producing security. ** Rate shown is the 7-day effective yield as of March 31, 2021. ‡ Real Estate Investment Trust. † Investment in Affiliated Security (see Note 6). (A) Certain securities or partial positions of certain securities are on loan at March 31, 2021 (see Note 10). The total market value of securities on loan at March 31, 2021 was $112,616 ($ Thousands). (B) Security is a Master Limited Partnership. At March 31, 2021, such securities amounted to $1,724 ($ Thousands), or 0.0% of the net assets of the Fund (See Note 2). (C) This security was purchased with cash collateral held from securities on loan (see Note 10). The total market value of such securities as of March 31, 2021 was $114,352 ($ Thousands). | ADR — American Depositary Receipt Cl — Class L.P. — Limited Partnership Ltd. — Limited PLC — Public Limited Company REIT — Real Estate investment Trust S&P— Standard & Poor’s Ser — Series |
SEI Institutional Managed Trust / Semi-Annual Report / March 31, 2021 | 7 |
SCHEDULE OF INVESTMENTS (Unaudited)
March 31, 2021
Tax-Managed Small/Mid Cap Fund (Continued)
The following is a list of the level of inputs used as of March 31, 2021, in valuing the Fund’s investments carried at value ($ Thousands):
| Investments in Securities | Level 1 ($) | Level 2 ($) | Level 3 ($)(1) | Total ($) | ||||||||||||
Common Stock | 992,968 | – | 189 | 993,157 | ||||||||||||
Affiliated Partnership | – | 114,352 | – | 114,352 | ||||||||||||
Cash Equivalent | 30,072 | – | – | 30,072 | ||||||||||||
|
|
|
|
|
|
|
|
|
|
|
| |||||
Total Investments in Securities | 1,023,040 | 114,352 | 189 | 1,137,581 | ||||||||||||
|
|
|
|
|
|
|
|
|
|
|
| |||||
| Other Financial Instruments | Level 1 ($) | Level 2 ($) | Level 3 ($) | Total ($) | ||||||||||||
Futures Contracts* | ||||||||||||||||
Unrealized Appreciation | 4 | – | – | 4 | ||||||||||||
Unrealized Depreciation | (7) | – | – | (7) | ||||||||||||
|
|
|
|
|
|
|
|
|
|
|
| |||||
Total Other Financial Instruments | (3) | – | – | (3) | ||||||||||||
|
|
|
|
|
|
|
|
|
|
|
| |||||
(1) A reconciliation of Level 3 instruments is presented when the Fund has a significant amount of Level 3 investments at the beginning and/or end of the period in relation to the net assets. Management has concluded that Level 3 investments are not material in relation to net assets.
For the period ended March 31, 2021, there was a transfer between Level 1 and Level 3 assets and liabilities due to the unavailability of observable inputs to determine fair value.
For more information on valuation inputs, see Note 2 – Significant Accounting Policies in Notes to Financial Statements.
The following is a summary of the Fund’s transactions with affiliates for the year ended March 31, 2021 ($ Thousands):
| Security Description | Value 9/30/2020 | Purchases at Cost | Proceeds from Sales | Realized Gain (Loss) | Change in Unrealized Appreciation (Depreciation) | Value 3/31/2021 | Shares | Income | Capital Gains | |||||||||
SEI Liquidity Fund, L.P. | $ 28,359 | $ 176,791 | $ (90,805) | $ 10 | $ (3) | $114,352 | 114,322,771 | $ 70 | $— | |||||||||
SEI Daily Income Trust, Government Fund, Cl F | 18,861 | 90,218 | (79,007) | — | — | 30,072 | 30,072,280 | 1 | — | |||||||||
|
|
|
|
|
|
|
| |||||||||||
Totals | $ 47,220 | $ 267,009 | $ (169,812) | $ 10 | $ (3) | $144,424 | $ 71 | $— | ||||||||||
|
|
|
|
|
|
|
|
Amounts designated as “—” are either $0 or have been rounded to $0.
The accompanying notes are an integral part of the financial statements.
| 8 | SEI Institutional Managed Trust / Semi-Annual Report / March 31, 2021 |
SCHEDULE OF INVESTMENTS (Unaudited)
March 31, 2021
Mid-Cap Fund (Continued)
| Description | Shares | Market Value ($ Thousands) | ||||||
COMMON STOCK — 98.2% |
| |||||||
Communication Services — 4.7% |
| |||||||
Cars.com Inc * | 15,500 | $ | 201 | |||||
Fox Corp | 4,800 | 169 | ||||||
Interpublic Group of Cos Inc/The | 6,000 | 175 | ||||||
Lumen Technologies Inc | 49,500 | 661 | ||||||
News Corp, Cl A | 12,200 | 310 | ||||||
News Corp, Cl B | 5,400 | 127 | ||||||
Nexstar Media Group Inc, Cl A | 3,300 | 464 | ||||||
Omnicom Group Inc | 7,500 | 556 | ||||||
Playtika Holding Corp * | 13,700 | 373 | ||||||
QuinStreet Inc * | 4,300 | 87 | ||||||
Sirius XM Holdings Inc (A) | 41,700 | 254 | ||||||
Take-Two Interactive Software Inc, Cl A * | 2,200 | 389 | ||||||
| 3,766 | ||||||||
Consumer Discretionary — 12.0% |
| |||||||
American Outdoor Brands Inc * | 2,200 | 56 | ||||||
AutoNation Inc * | 700 | 65 | ||||||
AutoZone Inc * | 60 | 84 | ||||||
Best Buy Co Inc | 5,700 | 654 | ||||||
Brunswick Corp/DE | 5,100 | 486 | ||||||
Crocs Inc * | 800 | 64 | ||||||
Darden Restaurants Inc | 2,900 | 412 | ||||||
Deckers Outdoor Corp * | 1,200 | 397 | ||||||
Dollar Tree Inc * | 6,100 | 698 | ||||||
DR Horton Inc | 7,900 | 704 | ||||||
Ford Motor Co * | 73,900 | 905 | ||||||
Gentherm Inc * | 700 | 52 | ||||||
Genuine Parts Co | 3,900 | 451 | ||||||
Johnson Outdoors Inc, Cl A | 200 | 29 | ||||||
L Brands Inc * | 9,000 | 557 | ||||||
Lennar Corp, Cl A | 4,600 | 466 | ||||||
Lennar Corp, Cl B | 3,800 | 313 | ||||||
Liquidity Services Inc * | 3,200 | 60 | ||||||
Nautilus Inc * | 4,100 | 64 | ||||||
O’Reilly Automotive Inc * | 1,190 | 604 | ||||||
Polaris Inc | 3,500 | 467 | ||||||
PulteGroup Inc | 9,900 | 519 | ||||||
Qurate Retail Inc | 35,100 | 413 | ||||||
Smith & Wesson Brands Inc | 16,000 | 279 | ||||||
Tapestry Inc * | 8,400 | 346 | ||||||
Tenneco Inc, Cl A * | 2,900 | 31 | ||||||
Yum China Holdings Inc | 7,100 | 420 | ||||||
Yum! Brands Inc | 400 | 43 | ||||||
| 9,639 | ||||||||
Consumer Staples — 4.9% |
| |||||||
Archer-Daniels-Midland Co | 13,500 | 770 | ||||||
Conagra Brands Inc | 14,900 | 560 | ||||||
Hershey Co/The | 200 | 32 | ||||||
J M Smucker Co/The | 1,400 | 177 | ||||||
Kellogg Co | 3,400 | 215 | ||||||
Kroger Co/The | 20,300 | 731 | ||||||
| Description | Shares | Market Value ($ Thousands) | ||||||
COMMON STOCK (continued) |
| |||||||
Medifast Inc | 200 | $ | 42 | |||||
Nu Skin Enterprises Inc, Cl A | 7,400 | 391 | ||||||
Sprouts Farmers Market Inc * | 13,600 | 362 | ||||||
Tyson Foods Inc, Cl A | 9,100 | 676 | ||||||
| 3,956 | ||||||||
Energy — 1.4% |
| |||||||
Baker Hughes Co, Cl A | 5,000 | 108 | ||||||
Cimarex Energy Co | 1,800 | 107 | ||||||
Devon Energy Corp | 2,500 | 55 | ||||||
Kinder Morgan Inc | 15,100 | 251 | ||||||
Pioneer Natural Resources Co | 3,100 | 492 | ||||||
Targa Resources Corp | 3,900 | 124 | ||||||
| 1,137 | ||||||||
Financials — 10.0% |
| |||||||
Aflac Inc | 5,300 | 271 | ||||||
Allstate Corp/The | 3,400 | 391 | ||||||
American National Group Inc | 300 | 32 | ||||||
Ameriprise Financial Inc | 3,400 | 790 | ||||||
Annaly Capital Management Inc ‡ | 69,500 | 598 | ||||||
Associated Banc-Corp | 2,400 | 51 | ||||||
Citizens Financial Group Inc | 13,400 | 592 | ||||||
CNA Financial Corp | 7,000 | 312 | ||||||
CNB Financial Corp/PA | 3,200 | 79 | ||||||
Discover Financial Services | 8,000 | 760 | ||||||
Evercore Inc, Cl A | 3,100 | 408 | ||||||
Federated Hermes Inc, Cl B | 13,500 | 423 | ||||||
Fifth Third Bancorp | 600 | 23 | ||||||
First American Financial Corp | 4,500 | 255 | ||||||
Flushing Financial Corp | 700 | 15 | ||||||
Invesco Ltd | 7,600 | 192 | ||||||
KeyCorp | 29,400 | 587 | ||||||
Old Republic International Corp | 12,200 | 266 | ||||||
OneMain Holdings Inc, Cl A | 3,000 | 161 | ||||||
Piper Sandler Cos | 700 | 77 | ||||||
Popular Inc | 8,000 | 562 | ||||||
Raymond James Financial Inc | 4,600 | 564 | ||||||
Stewart Information Services Corp | 1,600 | 83 | ||||||
Synchrony Financial | 14,700 | 598 | ||||||
| 8,090 | ||||||||
Health Care — 13.4% |
| |||||||
ABIOMED Inc * | 700 | 223 | ||||||
Agilent Technologies Inc | 2,100 | 267 | ||||||
Align Technology Inc * | 1,340 | 726 | ||||||
AmerisourceBergen Corp, Cl A | 4,900 | 579 | ||||||
Bio-Techne Corp | 1,400 | 535 | ||||||
Cerner Corp | 1,400 | 100 | ||||||
Charles River Laboratories International Inc * | 1,200 | 348 | ||||||
DENTSPLY SIRONA Inc | 8,000 | 510 | ||||||
Hologic Inc * | 8,300 | 617 | ||||||
IDEXX Laboratories Inc * | 1,340 | 656 | ||||||
SEI Institutional Managed Trust / Semi-Annual Report / March 31, 2021 | 1 |
SCHEDULE OF INVESTMENTS (Unaudited)
March 31, 2021
Mid-Cap Fund (Continued)
| Description | Shares | Market Value ($ Thousands) | ||||||
COMMON STOCK (continued) |
| |||||||
Incyte Corp * | 4,800 | $ | 390 | |||||
IQVIA Holdings Inc * | 3,900 | 753 | ||||||
Laboratory Corp of America Holdings * | 1,400 | 357 | ||||||
McKesson Corp | 2,400 | 468 | ||||||
Mettler-Toledo International Inc * | 540 | 624 | ||||||
Moderna Inc * | 3,600 | 471 | ||||||
PerkinElmer Inc | 4,300 | 552 | ||||||
Perrigo Co PLC | 2,500 | 101 | ||||||
Quest Diagnostics Inc | 3,600 | 462 | ||||||
Quidel Corp * | 2,100 | 269 | ||||||
ResMed Inc | 3,200 | 621 | ||||||
STERIS PLC | 1,100 | 210 | ||||||
Universal Health Services Inc, Cl B | 3,300 | 440 | ||||||
Viatris Inc, Cl W * | 11,700 | 163 | ||||||
Waters Corp * | 400 | 114 | ||||||
West Pharmaceutical Services Inc | 1,000 | 282 | ||||||
| 10,838 | ||||||||
Industrials — 14.3% |
| |||||||
Acuity Brands Inc | 3,900 | 643 | ||||||
AGCO Corp | 3,800 | 546 | ||||||
BWX Technologies Inc, Cl W | 6,000 | 396 | ||||||
Carrier Global Corp | 3,000 | 127 | ||||||
CoStar Group Inc * | 400 | 329 | ||||||
Cummins Inc | 3,100 | 803 | ||||||
Donaldson Co Inc, Cl A | 3,400 | 198 | ||||||
Dover Corp | 2,300 | 315 | ||||||
Fortune Brands Home & Security Inc | 2,200 | 211 | ||||||
Gates Industrial Corp PLC * | 8,900 | 142 | ||||||
Generac Holdings Inc * | 2,200 | 720 | ||||||
GMS Inc * | 200 | 8 | ||||||
GrafTech International Ltd | 3,200 | 39 | ||||||
Howmet Aerospace Inc * | 16,200 | 521 | ||||||
Huntington Ingalls Industries Inc, Cl A | 1,500 | 309 | ||||||
IDEX Corp | 400 | 84 | ||||||
Kelly Services Inc, Cl A * | 1,900 | 42 | ||||||
Kforce Inc | 500 | 27 | ||||||
Masco Corp | 10,600 | 635 | ||||||
Matson Inc | 1,200 | 80 | ||||||
MYR Group Inc * | 500 | 36 | ||||||
Nordson Corp | 1,500 | 298 | ||||||
nVent Electric PLC | 3,700 | 103 | ||||||
Old Dominion Freight Line Inc, Cl A | 2,500 | 601 | ||||||
Otis Worldwide Corp | 4,700 | 322 | ||||||
Parker-Hannifin Corp, Cl A | 2,200 | 694 | ||||||
Pentair PLC | 3,600 | 224 | ||||||
Primoris Services Corp | 1,000 | 33 | ||||||
Quanta Services Inc | 6,000 | 528 | ||||||
Schneider National Inc, Cl B | 2,200 | 55 | ||||||
Snap-on Inc | 2,000 | 462 | ||||||
Teledyne Technologies Inc * | 1,130 | 467 | ||||||
Timken Co/The | 3,400 | 276 | ||||||
UFP Industries Inc | 1,300 | 99 | ||||||
| Description | Shares | Market Value ($ Thousands) | ||||||
COMMON STOCK (continued) |
| |||||||
United Rentals Inc * | 1,300 | $ | 428 | |||||
Werner Enterprises Inc | 3,400 | 160 | ||||||
WW Grainger Inc | 1,490 | 597 | ||||||
| 11,558 | ||||||||
Information Technology — 20.2% |
| |||||||
Amdocs Ltd | 7,500 | 526 | ||||||
ANSYS Inc * | 1,010 | 343 | ||||||
Arrow Electronics Inc, Cl A * | 4,000 | 443 | ||||||
Aspen Technology Inc * | 1,500 | 217 | ||||||
BM Technologies Inc * | 523 | 6 | ||||||
CACI International Inc, Cl A * | 600 | 148 | ||||||
Cadence Design Systems Inc * | 5,900 | 808 | ||||||
Cirrus Logic Inc * | 3,100 | 263 | ||||||
Citrix Systems Inc | 500 | 70 | ||||||
Cognizant Technology Solutions Corp, Cl A | 3,900 | 305 | ||||||
Corning Inc, Cl B | 6,600 | 287 | ||||||
Dell Technologies Inc, Cl C * | 1,500 | 132 | ||||||
Dynatrace Inc * | 8,900 | 429 | ||||||
Entegris Inc | 4,700 | 525 | ||||||
EPAM Systems Inc * | 1,600 | 635 | ||||||
Fair Isaac Corp * | 1,050 | 510 | ||||||
Fortinet Inc * | 1,000 | 184 | ||||||
HP Inc | 21,800 | 692 | ||||||
IPG Photonics Corp * | 500 | 106 | ||||||
Jabil Inc | 9,400 | 490 | ||||||
KLA Corp | 2,900 | 958 | ||||||
Manhattan Associates Inc * | 3,300 | 387 | ||||||
MKS Instruments Inc | 3,500 | 649 | ||||||
NetApp Inc | 7,400 | 538 | ||||||
NETGEAR Inc * | 2,300 | 95 | ||||||
NortonLifeLock Inc | 25,700 | 546 | ||||||
Paychex Inc | 1,700 | 167 | ||||||
Paycom Software Inc * | 1,310 | 485 | ||||||
PTC Inc * | 4,800 | 661 | ||||||
Qorvo Inc * | 3,000 | 548 | ||||||
Sanmina Corp * | 7,500 | 310 | ||||||
Semtech Corp * | 1,600 | 110 | ||||||
Skyworks Solutions Inc | 3,600 | 661 | ||||||
SS&C Technologies Holdings Inc | 8,600 | 601 | ||||||
Sykes Enterprises Inc * | 1,600 | 71 | ||||||
SYNNEX Corp | 3,000 | 345 | ||||||
Synopsys Inc * | 2,800 | 694 | ||||||
Teradyne Inc | 2,300 | 280 | ||||||
Ubiquiti Inc | 1,500 | 447 | ||||||
Zebra Technologies Corp, Cl A * | 1,260 | 611 | ||||||
| 16,283 | ||||||||
Materials — 6.9% |
| |||||||
Avery Dennison Corp | 1,700 | 312 | ||||||
Boise Cascade Co | 1,800 | 108 | ||||||
Celanese Corp, Cl A | 1,500 | 225 | ||||||
Corteva Inc | 18,100 | 844 | ||||||
| 2 | SEI Institutional Managed Trust / Semi-Annual Report / March 31, 2021 |
SCHEDULE OF INVESTMENTS (Unaudited)
March 31, 2021
Mid-Cap Fund (Continued)
| Description | Shares | Market Value ($ Thousands) | ||||||
COMMON STOCK (continued) |
| |||||||
Eastman Chemical Co | 2,600 | $ | 286 | |||||
Element Solutions Inc | 6,300 | 115 | ||||||
Freeport-McMoRan Inc, Cl B | 25,200 | 830 | ||||||
Huntsman Corp | 9,300 | 268 | ||||||
International Paper Co | 1,300 | 70 | ||||||
LyondellBasell Industries NV, Cl A | 1,900 | 198 | ||||||
Mosaic Co/The | 1,300 | 41 | ||||||
Nucor Corp | 3,600 | 289 | ||||||
PPG Industries Inc | 4,200 | 631 | ||||||
RPM International Inc | 5,400 | 496 | ||||||
Steel Dynamics Inc | 11,200 | 569 | ||||||
Westlake Chemical Corp | 3,100 | 275 | ||||||
| 5,557 | ||||||||
Real Estate — 5.5% |
| |||||||
Apple Hospitality Inc ‡ | 37,600 | 548 | ||||||
CBRE Group Inc, Cl A *‡ | 3,900 | 308 | ||||||
City Office REIT | 18,300 | 194 | ||||||
Columbia Property Trust Inc ‡ | 1,800 | 31 | ||||||
CorePoint Lodging *‡ | 200 | 2 | ||||||
Extra Space Storage Inc ‡ | 1,300 | 172 | ||||||
Gaming and Leisure Properties Inc ‡ | 12,909 | 548 | ||||||
GEO Group Inc/The ‡(A) | 40,050 | 311 | ||||||
Highwoods Properties Inc ‡ | 1,200 | 51 | ||||||
Omega Healthcare Investors Inc ‡ | 2,200 | 81 | ||||||
Piedmont Office Realty Trust Inc, Cl A ‡ | 9,600 | 167 | ||||||
PotlatchDeltic Corp ‡ | 7,700 | 407 | ||||||
VEREIT Inc ‡ | 8,800 | 340 | ||||||
Weyerhaeuser Co ‡ | 20,100 | 716 | ||||||
WP Carey Inc ‡ | 7,800 | 552 | ||||||
| 4,428 | ||||||||
Utilities — 4.9% |
| |||||||
AES Corp/The | 25,400 | 681 | ||||||
MDU Resources Group Inc | 20,000 | 632 | ||||||
NRG Energy Inc | 9,000 | 340 | ||||||
PPL Corp | 15,200 | 439 | ||||||
Public Service Enterprise Group Inc | 10,600 | 638 | ||||||
Sempra Energy | 3,600 | 477 | ||||||
UGI Corp | 14,000 | 574 | ||||||
| Description | Shares | Market Value ($ Thousands) | ||||||
COMMON STOCK (continued) |
| |||||||
Vistra Corp | 11,700 | $ | 207 | |||||
| 3,988 | ||||||||
Total Common Stock | 79,240 | |||||||
PREFERRED STOCK — 0.1% |
| |||||||
Consumer Discretionary — 0.1% |
| |||||||
Qurate Retail, 8.000% | 1,050 | 107 | ||||||
Total Preferred Stock | 107 | |||||||
AFFILIATED PARTNERSHIP — 0.7% |
| |||||||
SEI Liquidity Fund, L.P. | 579,529 | 580 | ||||||
Total Affiliated Partnership | 580 | |||||||
CASH EQUIVALENT — 1.4% |
| |||||||
SEI Daily Income Trust, Government |
| 1,109,175
|
|
| 1,109
|
| ||
Total Cash Equivalent | 1,109 | |||||||
Total Investments in Securities — 100.4% | $ | 81,036 | ||||||
A list of the open futures contracts held by the Fund at March 31, 2021 is as follows:
| Number of | Expiration | Notional Amount | Value | Unrealized | ||||||||||
| Type of Contract | Contracts Long | Date | (Thousands) | (Thousands) | Appreciation (Thousands) | |||||||||
S&P Mid Cap 400 Index E-MINI | 1 | Jun-2021 | $256 | $261 | $4 | |||||||||
|
|
| ||||||||||||
SEI Institutional Managed Trust / Semi-Annual Report / March 31, 2021 | 3 |
SCHEDULE OF INVESTMENTS (Unaudited)
March 31, 2021
Mid-Cap Fund (Continued)
Percentages are based on Net Assets of $80,715 ($ Thousands).
| * | Non-income producing security. |
| ** | Rate shown is the 7-day effective yield as of March 31, 2021. |
| ‡ | Real Estate Investment Trust. |
| † | Investment in Affiliated Security (see Note 6). |
| (A) | Certain securities or partial positions of certain securities are on loan at March 31, 2021 (see Note 10). The total market value of securities on loan at March 31, 2021 was $564 ($ Thousands). |
| (B) | This security was purchased with cash collateral held from securities on loan (see Note 10). The total market value of such securities as of March 31, 2021 was $580 ($ Thousands). |
Cl — Class
L.P. — Limited Partnership
PLC — Public Limited Company
REIT — Real Estate investment Trust
The following is a list of the level of input s used as of March 31, 2021, in valuing the Fund’s investments carried at value ($ Thousands):
| Investments in Securities | Level 1 | Level 2 | Level 3 | Total | ||||||||||||
Common Stock | $79,240 | $ | – | $ | – | $79,240 | ||||||||||
Preferred Stock | 107 | – | – | 107 | ||||||||||||
Affiliated Partnership | – | 580 | – | 580 | ||||||||||||
Cash Equivalent | 1,109 | – | – | 1,109 | ||||||||||||
|
|
|
|
|
|
|
|
|
|
|
| |||||
Total Investments in Securities | $ | 80,456 | $ | 580 | $ | – | $ | 81,036 | ||||||||
|
|
|
|
|
|
|
|
|
|
|
| |||||
| Other Financial Instruments | Level 1 ($) | Level 2 ($) | Level 3 ($) | Total ($) | ||||||||||||
Futures Contracts* | ||||||||||||||||
Unrealized Appreciation | 4 | – | – | 4 | ||||||||||||
|
|
|
|
|
|
|
|
|
|
|
| |||||
Total Other Financial Instruments | 4 | – | – | 4 | ||||||||||||
|
|
|
|
|
|
|
|
|
|
|
| |||||
* Futures contracts are valued at the unrealized appreciation on the instrument.
For the period ended March 31, 2021, there were no transfers in or out of Level 3.
For more information on valuation inputs, see Note 2 – Significant Accounting Policies in Notes to Financial Statements.
The following is a summary of the Fund’s transactions with affiliates for the period ended March 31, 2021 ($ Thousands):
| Security Description | Value 9/30/2020 | Purchases at Cost | Proceeds from Sales | Realized Gain/ (Loss) | Change in Unrealized Appreciation/ (Depreciation) | Value 3/31/2021 | Shares | Income | Capital Gains | |||||||||
SEI Liquidity Fund, L.P. | $ — | $ 1,710 | $(1,130) | $— | $— | $ 580 | 579,529 | $— | $— | |||||||||
SEI Daily Income Trust, Government Fund, Cl F | 1,119 | 10,440 | (10,450) | — | — | 1,109 | 1,109,175 | — | — | |||||||||
|
|
|
|
|
|
|
| |||||||||||
Totals | $1,119 | $12,150 | $(11,580) | $— | $— | $1,689 | $— | $— | ||||||||||
|
|
|
|
|
|
|
|
Amounts designated as “—” are either $0 or have been rounded to $0.
The accompanying notes are an integral part of the financial statements.
| 4 | SEI Institutional Managed Trust / Semi-Annual Report / March 31, 2021 |
SCHEDULE OF INVESTMENTS (Unaudited)
March 31, 2021
U.S. Managed Volatility Fund (Continued)
| Description | Shares | Market Value ($ Thousands) | ||||||
COMMON STOCK — 98.7% |
| |||||||
Communication Services — 8.1% |
| |||||||
Activision Blizzard Inc | 25,372 | $ | 2,360 | |||||
Alphabet Inc, Cl A * | 505 | 1,041 | ||||||
Alphabet Inc, Cl C * | 331 | 685 | ||||||
AT&T Inc | 418,608 | 12,671 | ||||||
Comcast Corp, Cl A | 240,900 | 13,035 | ||||||
Hemisphere Media Group Inc, Cl A * | 1,396 | 16 | ||||||
John Wiley & Sons Inc, Cl A | 59,053 | 3,201 | ||||||
Lions Gate Entertainment Corp, Cl A * | 18,053 | 270 | ||||||
Lions Gate Entertainment Corp, Cl B * | 23,764 | 306 | ||||||
New York Times Co/The, Cl A | 63,468 | 3,213 | ||||||
Omnicom Group Inc | 121,800 | 9,031 | ||||||
Ooma Inc * | 19,440 | 308 | ||||||
Scholastic Corp, Cl B | 8,394 | 253 | ||||||
SK Telecom Co Ltd ADR | 138,655 | 3,776 | ||||||
Spok Holdings Inc | 9,497 | 100 | ||||||
TechTarget Inc * | 4,564 | 317 | ||||||
TELUS | 136,300 | 2,714 | ||||||
TrueCar Inc * | 19,054 | 91 | ||||||
United States Cellular Corp * | 15,966 | 582 | ||||||
Verizon Communications | 433,911 | 25,232 | ||||||
World Wrestling Entertainment Inc, Cl A | 39,857 | 2,163 | ||||||
| 81,365 | ||||||||
Consumer Discretionary — 8.1% |
| |||||||
Amazon.com Inc, Cl A * | 621 | 1,922 | ||||||
AutoZone Inc * | 3,300 | 4,634 | ||||||
Canadian Tire Corp Ltd, Cl A | 23,000 | 3,263 | ||||||
Chegg Inc * | 11,283 | 966 | ||||||
Chipotle Mexican Grill Inc, Cl A * | 2,819 | 4,005 | ||||||
Core-Mark Holding Co Inc, Cl A | 13,287 | 514 | ||||||
Dorman Products Inc * | 4,899 | 503 | ||||||
DR Horton Inc | 40,000 | 3,565 | ||||||
eBay Inc | 194,674 | 11,922 | ||||||
Garmin Ltd | 17,765 | 2,342 | ||||||
Grand Canyon Education Inc * | 20,428 | 2,188 | ||||||
Honda Motor Co Ltd ADR (A) | 145,242 | 4,386 | ||||||
Murphy USA Inc | 4,527 | 654 | ||||||
NIKE Inc, Cl B | 29,871 | 3,970 | ||||||
Papa John’s International Inc, Cl A | 3,306 | 293 | ||||||
Sonos Inc * | 7,748 | 290 | ||||||
Starbucks Corp | 3,501 | 383 | ||||||
Sturm Ruger & Co Inc | 62,054 | 4,100 | ||||||
Target Corp, Cl A | 98,529 | 19,516 | ||||||
Terminix Global Holdings Inc * | 9,979 | 476 | ||||||
Toyota Motor Corp ADR (A) | 47,464 | 7,407 | ||||||
Winmark Corp | 503 | 94 | ||||||
XPEL Inc * | 1,756 | 91 | ||||||
Yum China Holdings Inc | 52,661 | 3,118 | ||||||
| 80,602 | ||||||||
Consumer Staples — 16.8% |
| |||||||
Altria Group Inc | 92,900 | 4,753 | ||||||
| Description | Shares | Market Value ($ Thousands) | ||||||
COMMON STOCK (continued) |
| |||||||
B&G Foods Inc, Cl A (A) | 5,182 | $ | 161 | |||||
BellRing Brands, Cl A * | 15,618 | 369 | ||||||
Boston Beer Co Inc/The, Cl A * | 1,404 | 1,694 | ||||||
Bunge Ltd | 50,386 | 3,994 | ||||||
Campbell Soup Co | 46,746 | 2,350 | ||||||
Casey’s General Stores Inc | 9,235 | 1,997 | ||||||
Clorox Co/The | 13,841 | 2,670 | ||||||
Coca-Cola Co/The | 105,116 | 5,541 | ||||||
Colgate-Palmolive Co | 65,807 | 5,188 | ||||||
Conagra Brands Inc | 287,811 | 10,822 | ||||||
Costco Wholesale Corp | 8,862 | 3,124 | ||||||
Darling Ingredients Inc * | 7,145 | 526 | ||||||
Estee Lauder Cos Inc/The, Cl A | 14,647 | 4,260 | ||||||
Flowers Foods Inc | 131,520 | 3,130 | ||||||
General Mills Inc | 169,734 | 10,408 | ||||||
Hain Celestial Group Inc/The * | 8,572 | 374 | ||||||
Herbalife Nutrition Ltd * | 30,551 | 1,355 | ||||||
Hershey Co/The | 42,124 | 6,662 | ||||||
Hormel Foods Corp | 53,128 | 2,538 | ||||||
Hostess Brands Inc, Cl A * | 34,718 | 498 | ||||||
Ingredion Inc | 26,000 | 2,338 | ||||||
J M Smucker Co/The | 121,998 | 15,436 | ||||||
John B Sanfilippo & Son | 6,781 | 613 | ||||||
Kellogg Co | 148,945 | 9,428 | ||||||
Kimberly-Clark Corp | 90,908 | 12,641 | ||||||
Kraft Heinz Co/The | 219,400 | 8,776 | ||||||
Kroger Co/The | 405,027 | 14,577 | ||||||
Lancaster Colony Corp | 2,722 | 477 | ||||||
Medifast Inc | 1,318 | 279 | ||||||
MGP Ingredients Inc | 6,382 | 377 | ||||||
Mondelez International Inc, Cl A | 59,782 | 3,499 | ||||||
Monster Beverage Corp * | 44,549 | 4,058 | ||||||
Natural Grocers by Vitamin Cottage Inc | 18,579 | 326 | ||||||
PriceSmart Inc | 5,602 | 542 | ||||||
Procter & Gamble Co/The | 34,700 | 4,699 | ||||||
Sanderson Farms Inc | 2,956 | 460 | ||||||
Seaboard Corp | 64 | 236 | ||||||
Simply Good Foods Co/The * | 9,676 | 294 | ||||||
Tyson Foods Inc, Cl A | 144,449 | 10,733 | ||||||
Universal Corp/VA | 10,842 | 640 | ||||||
USANA Health Sciences Inc * | 7,167 | 699 | ||||||
Walmart Inc | 25,700 | 3,491 | ||||||
WD-40 Co | 1,114 | 341 | ||||||
Weis Markets Inc | 5,174 | 292 | ||||||
| 167,666 | ||||||||
Energy — 0.6% |
| |||||||
Antero Midstream Corp | 363,939 | 3,287 | ||||||
DMC Global Inc * | 3,575 | 194 | ||||||
Phillips 66 | 23,400 | 1,908 | ||||||
SEI Institutional Managed Trust / Semi-Annual Report / March 31, 2021 | 1 |
SCHEDULE OF INVESTMENTS (Unaudited)
March 31, 2021
U.S. Managed Volatility Fund (Continued)
| Description | Shares | Market Value ($ Thousands) | ||||||
COMMON STOCK (continued) |
| |||||||
RPC Inc * | 20,419 | $ | 110 | |||||
| 5,499 | ||||||||
Financials — 11.2% |
| |||||||
Aflac Inc | 221,967 | 11,360 | ||||||
Alerus Financial Corp | 5,930 | 177 | ||||||
Allstate Corp/The | 115,300 | 13,248 | ||||||
American Financial Group Inc/OH | 23,700 | 2,704 | ||||||
American National Group Inc | 2,079 | 224 | ||||||
Annaly Capital Management Inc ‡ | 253,100 | 2,177 | ||||||
Arbor Realty Trust Inc ‡ | 17,353 | 276 | ||||||
Bank of New York Mellon Corp/The | 198,000 | 9,363 | ||||||
Berkshire Hathaway Inc, Cl B * | 80,117 | 20,467 | ||||||
BRP Group Inc, Cl A * | 6,157 | 168 | ||||||
Cboe Global Markets Inc | 11,784 | 1,163 | ||||||
Columbia Financial Inc * | 25,349 | 443 | ||||||
Community Bank System Inc | 3,228 | 248 | ||||||
Employers Holdings Inc | 9,517 | 410 | ||||||
Erie Indemnity Co, Cl A | 3,442 | 760 | ||||||
Everest Re Group Ltd | 12,673 | 3,141 | ||||||
Hanover Insurance Group Inc/The, Cl A | 30,323 | 3,926 | ||||||
HarborOne Bancorp Inc | 33,506 | 451 | ||||||
Hartford Financial Services Group Inc/The | 69,100 | 4,615 | ||||||
HCI Group Inc | 2,470 | 190 | ||||||
Houlihan Lokey Inc, Cl A | 5,759 | 383 | ||||||
Kearny Financial Corp/MD | 38,764 | 468 | ||||||
Kinsale Capital Group Inc | 971 | 160 | ||||||
Loblaw Cos Ltd | 70,000 | 3,910 | ||||||
MarketAxess Holdings Inc | 1,623 | 808 | ||||||
Marsh & McLennan Cos Inc | 43,980 | 5,357 | ||||||
Mercury General Corp | 14,266 | 868 | ||||||
MFA Financial Inc ‡ | 54,537 | 222 | ||||||
Morningstar Inc, Cl A | 15,774 | 3,550 | ||||||
MVB Financial Corp | 3,576 | 121 | ||||||
National Bank Holdings Corp, Cl A | 12,271 | 487 | ||||||
NI Holdings Inc * | 1,708 | 32 | ||||||
Northeast Bank | 2,247 | 59 | ||||||
Orchid Island Capital Inc, Cl A ‡ | 90,979 | 547 | ||||||
PCSB Financial Corp | 20,853 | 346 | ||||||
Progressive Corp/The | 41,750 | 3,992 | ||||||
Reliant Bancorp Inc | 5,536 | 159 | ||||||
Safeguard Scientifics Inc * | 15,832 | 108 | ||||||
Safety Insurance Group Inc | 4,713 | 397 | ||||||
Sagen MI Canada | 71,000 | 2,455 | ||||||
Stewart Information Services Corp | 6,097 | 317 | ||||||
Timberland Bancorp Inc/WA | 3,605 | 100 | ||||||
Tradeweb Markets Inc, Cl A | 39,821 | 2,947 | ||||||
Trupanion Inc * | 181 | 14 | ||||||
US Bancorp | 125,400 | 6,936 | ||||||
Waterstone Financial Inc | 19,067 | 389 | ||||||
| Description | Shares | Market Value ($ Thousands) | ||||||
COMMON STOCK (continued) |
| |||||||
White Mountains Insurance Group Ltd | 1,017 | $ | 1,134 | |||||
| 111,777 | ||||||||
Health Care — 14.6% |
| |||||||
AbbVie Inc | 86,995 | 9,415 | ||||||
AdaptHealth Corp, Cl A * | 7,321 | 269 | ||||||
Agilent Technologies Inc | 1,663 | 211 | ||||||
Alkermes PLC * | 5,460 | 102 | ||||||
Amgen Inc, Cl A | 42,500 | 10,574 | ||||||
Amphastar Pharmaceuticals Inc * | 4,915 | 90 | ||||||
Bristol-Myers Squibb Co | 251,177 | 15,857 | ||||||
Cassava Sciences Inc * | 2,604 | 117 | ||||||
Cigna Corp | 1,426 | 345 | ||||||
CVS Health Corp | 126,626 | 9,526 | ||||||
Danaher Corp, Cl A | 9,853 | 2,218 | ||||||
DermTech * | 3,250 | 165 | ||||||
Eli Lilly and Co | 17,976 | 3,358 | ||||||
Gilead Sciences Inc | 141,500 | 9,145 | ||||||
Haemonetics Corp * | 8,954 | 994 | ||||||
Halozyme Therapeutics Inc * | 524 | 22 | ||||||
Harrow Health * | 13,610 | 92 | ||||||
HealthStream Inc * | 7,683 | 172 | ||||||
Henry Schein Inc * | 30,982 | 2,145 | ||||||
InfuSystem Holdings Inc * | 2,116 | 43 | ||||||
Inogen Inc * | 2,932 | 154 | ||||||
Ionis Pharmaceuticals Inc * | 21,845 | 982 | ||||||
Johnson & Johnson | 127,718 | 20,991 | ||||||
Joint Corp/The * | 9,438 | 456 | ||||||
LeMaitre Vascular Inc | 1,350 | 66 | ||||||
Masimo Corp * | 4,359 | 1,001 | ||||||
Merck & Co Inc | 315,164 | 24,296 | ||||||
Mettler-Toledo International Inc * | 1,316 | 1,521 | ||||||
Omnicell Inc * | 3,559 | 462 | ||||||
Organogenesis Holdings Inc, Cl A * | 8,843 | 161 | ||||||
Patterson Cos Inc | 8,135 | 260 | ||||||
Pfizer Inc | 444,439 | 16,102 | ||||||
Phibro Animal Health Corp, Cl A | 12,044 | 294 | ||||||
Premier Inc, Cl A | 34,658 | 1,173 | ||||||
Prestige Consumer Healthcare Inc, Cl A * | 7,289 | 321 | ||||||
QIAGEN NV * | 1,824 | 89 | ||||||
Regeneron Pharmaceuticals Inc * | 6,174 | 2,921 | ||||||
Sanofi ADR | 57,200 | 2,829 | ||||||
Sharps Compliance Corp * | 6,797 | 98 | ||||||
SIGA Technologies Inc * | 33,244 | 216 | ||||||
Stereotaxis Inc * | 41,845 | 281 | ||||||
Universal Health Services Inc, Cl B | 21,700 | 2,895 | ||||||
Viatris Inc, Cl W * | 70,563 | 986 | ||||||
Viemed Healthcare Inc * | 34,170 | 346 | ||||||
Vocera Communications Inc * | 5,331 | 205 | ||||||
West Pharmaceutical Services Inc | 7,275 | 2,050 | ||||||
| 2 | SEI Institutional Managed Trust / Semi-Annual Report / March 31, 2021 |
SCHEDULE OF INVESTMENTS (Unaudited)
March 31, 2021
U.S. Managed Volatility Fund (Continued)
| Description | Shares | Market Value ($ Thousands) | ||||||
COMMON STOCK (continued) |
| |||||||
XBiotech Inc *(A) | 10,257 | $ | 176 | |||||
| 146,192 | ||||||||
Industrials — 9.7% |
| |||||||
3M Co | 50,635 | 9,756 | ||||||
Allison Transmission Holdings Inc | 133,047 | 5,432 | ||||||
Carrier Global Corp | 66,500 | 2,808 | ||||||
CBIZ Inc * | 14,707 | 480 | ||||||
CH Robinson Worldwide Inc | 41,676 | 3,977 | ||||||
Copart Inc * | 2,090 | 227 | ||||||
Cummins Inc | 31,600 | 8,188 | ||||||
Expeditors International of Washington Inc | 44,797 | 4,824 | ||||||
Exponent Inc | 2,679 | 261 | ||||||
Fastenal Co, Cl A | 100,012 | 5,029 | ||||||
Forward Air Corp | 5,343 | 475 | ||||||
General Dynamics Corp | 19,100 | 3,468 | ||||||
Huntington Ingalls Industries Inc, Cl A | 21,662 | 4,459 | ||||||
JB Hunt Transport Services Inc | 9,190 | 1,545 | ||||||
Landstar System Inc | 8,812 | 1,455 | ||||||
Lindsay Corp | 320 | 53 | ||||||
Lockheed Martin Corp | 13,868 | 5,124 | ||||||
Miller Industries Inc/TN | 2,075 | 96 | ||||||
Northrop Grumman Corp | 29,432 | 9,525 | ||||||
Otis Worldwide Corp | 33,250 | 2,276 | ||||||
Parsons Corp * | 11,039 | 446 | ||||||
Red Violet Inc *(A) | 12,735 | 235 | ||||||
Republic Services Inc | 39,733 | 3,948 | ||||||
Rollins Inc | 46,940 | 1,616 | ||||||
Snap-on Inc | 44,000 | 10,152 | ||||||
Toro Co/The | 46,280 | 4,773 | ||||||
Upwork Inc * | 341 | 15 | ||||||
Vertiv Holdings Co, Cl A | 80,417 | 1,608 | ||||||
Waste Management Inc | 34,300 | 4,425 | ||||||
Werner Enterprises Inc | 9,053 | 427 | ||||||
WillScot Mobile Mini Holdings, Cl A * | 6,758 | 188 | ||||||
| 97,291 | ||||||||
Information Technology — 17.1% |
| |||||||
A10 Networks Inc * | 2,433 | 23 | ||||||
Agilysys Inc * | 2,381 | 114 | ||||||
Amdocs Ltd | 300,704 | 21,094 | ||||||
Amphenol Corp, Cl A | 42,206 | 2,784 | ||||||
Arista Networks Inc * | 3,934 | 1,188 | ||||||
Autodesk Inc, Cl A * | 2,416 | 670 | ||||||
Avnet Inc | 61,200 | 2,540 | ||||||
Broadridge Financial Solutions Inc | 12,427 | 1,903 | ||||||
CACI International Inc, Cl A * | 17,162 | 4,233 | ||||||
Canon Inc ADR | 130,800 | 2,978 | ||||||
Cisco Systems Inc/Delaware | 359,046 | 18,566 | ||||||
CommVault Systems Inc * | 6,354 | 410 | ||||||
CSG Systems International Inc | 7,719 | 347 | ||||||
DocuSign Inc, Cl A * | 4,017 | 813 | ||||||
Dropbox Inc, Cl A * | 62,074 | 1,655 | ||||||
| Description | Shares | Market Value ($ Thousands) | ||||||
COMMON STOCK (continued) |
| |||||||
F5 Networks Inc, Cl A * | 67,564 | $ | 14,095 | |||||
Grid Dynamics Holdings * | 6,387 | 102 | ||||||
Intel Corp | 339,000 | 21,696 | ||||||
International Business Machines Corp | 102,708 | 13,687 | ||||||
Intevac Inc * | 2,658 | 19 | ||||||
J2 Global Inc * | 50,200 | 6,017 | ||||||
Jack Henry & Associates Inc | 4,829 | 733 | ||||||
Juniper Networks Inc | 284,966 | 7,218 | ||||||
MAXIMUS Inc | 5,235 | 466 | ||||||
Napco Security Technologies Inc * | 943 | 33 | ||||||
Oracle Corp, Cl B | 344,999 | 24,209 | ||||||
Progress Software Corp | 9,611 | 424 | ||||||
QAD Inc, Cl A | 3,716 | 247 | ||||||
Sapiens International Corp NV | 13,572 | 432 | ||||||
Seagate Technology PLC | 116,500 | 8,941 | ||||||
ShotSpotter Inc * | 1,430 | 50 | ||||||
Smith Micro Software Inc * | 27,444 | 151 | ||||||
SPS Commerce Inc * | 4,568 | 454 | ||||||
Tucows Inc, Cl A * | 3,808 | 295 | ||||||
Ubiquiti Inc | 4,473 | 1,334 | ||||||
Western Union Co/The | 424,181 | 10,460 | ||||||
Zoom Video Communications Inc, Cl A * | 1,375 | 442 | ||||||
| 170,823 | ||||||||
Materials — 4.4% |
| |||||||
AptarGroup Inc | 29,801 | 4,222 | ||||||
Balchem Corp | 5,137 | 644 | ||||||
Berry Global Group Inc * | 80,975 | 4,972 | ||||||
Caledonia Mining | 1,855 | 26 | ||||||
Linde PLC | 22,103 | 6,192 | ||||||
NewMarket Corp | 9,153 | 3,480 | ||||||
Newmont Corp | 115,789 | 6,979 | ||||||
Novagold Resources Inc * | 30,230 | 265 | ||||||
Ranpak Holdings Corp, Cl A * | 22,649 | 454 | ||||||
Sealed Air Corp | 80,978 | 3,710 | ||||||
Sensient Technologies Corp | 3,863 | 301 | ||||||
Sherwin-Williams Co/The, Cl A | 7,069 | 5,217 | ||||||
Silgan Holdings Inc | 93,288 | 3,921 | ||||||
Sonoco Products Co | 58,810 | 3,723 | ||||||
| 44,106 | ||||||||
Real Estate — 2.7% |
| |||||||
Agree Realty Corp ‡ | 7,852 | 529 | ||||||
Brandywine Realty Trust ‡ | 248,750 | 3,211 | ||||||
Easterly Government Properties Inc ‡ | 8,722 | 181 | ||||||
Essential Properties Realty Trust Inc ‡ | 11,966 | 273 | ||||||
Extra Space Storage Inc ‡ | 12,467 | 1,652 | ||||||
Healthcare Realty Trust Inc ‡ | 12,086 | 366 | ||||||
Iron Mountain Inc ‡ | 146,700 | 5,429 | ||||||
Jones Lang LaSalle Inc *‡ | 181 | 32 | ||||||
Piedmont Office Realty Trust, Cl A ‡ | 226,600 | 3,936 | ||||||
PS Business Parks Inc ‡ | 2,501 | 387 | ||||||
Public Storage ‡ | 22,381 | 5,523 | ||||||
SEI Institutional Managed Trust / Semi-Annual Report / March 31, 2021 | 3 |
SCHEDULE OF INVESTMENTS (Unaudited)
March 31, 2021
U.S. Managed Volatility Fund (Continued)
| Description | Shares | Market Value ($ Thousands) | ||||||
COMMON STOCK (continued) |
| |||||||
RMR Group Inc/The, Cl A ‡ | 4,139 | $ | 169 | |||||
St Joe Co/The ‡ | 8,033 | 345 | ||||||
Terreno Realty Corp ‡ | 8,751 | 506 | ||||||
VEREIT Inc ‡ | 123,647 | 4,775 | ||||||
|
|
| ||||||
| 27,314 | ||||||||
|
|
| ||||||
Utilities — 5.4% |
| |||||||
American States Water Co | 1,765 | 134 | ||||||
Artesian Resources Corp, Cl A | 2,902 | 114 | ||||||
Atmos Energy Corp | 46,063 | 4,553 | ||||||
Cadiz Inc *(A) | 30,641 | 294 | ||||||
California Water Service Group, Cl A | 5,294 | 298 | ||||||
Chesapeake Utilities Corp | 4,276 | 496 | ||||||
DTE Energy Co | 46,699 | 6,218 | ||||||
Entergy Corp | 85,500 | 8,505 | ||||||
Evergy Inc | 204,537 | 12,176 | ||||||
Exelon Corp | 163,000 | 7,130 | ||||||
Genie Energy Ltd, Cl B | 13,918 | 88 | ||||||
Hawaiian Electric Industries Inc | 35,887 | 1,595 | ||||||
National Fuel Gas Co | 78,800 | 3,939 | ||||||
NRG Energy Inc | 2,526 | 95 | ||||||
ONE Gas Inc | 570 | 44 | ||||||
Portland General Electric Co | 134,094 | 6,365 | ||||||
Public Service Enterprise Group Inc | 12,722 | 766 | ||||||
Pure Cycle Corp * | 15,652 | 210 | ||||||
Spark Energy Inc, Cl A | 11,425 | 122 | ||||||
Spire | 5,701 | 421 | ||||||
|
|
| ||||||
| 53,563 | ||||||||
|
|
| ||||||
Total Common Stock | 986,198 | |||||||
|
|
| ||||||
AFFILIATED PARTNERSHIP — 1.1% |
| |||||||
SEI Liquidity Fund, L.P. | 11,340,643 | 11,343 | ||||||
|
|
| ||||||
Total Affiliated Partnership | 11,343 | |||||||
|
|
| ||||||
CASH EQUIVALENT — 1.3% |
| |||||||
SEI Daily Income Trust, Government Fund, Cl F | 12,632,496 | 12,632 | ||||||
|
|
| ||||||
Total Cash Equivalent | 12,632 | |||||||
|
|
| ||||||
Total Investments in Securities — 101.1% |
| $ | 1,010,173 | |||||
|
|
| ||||||
| 4 | SEI Institutional Managed Trust / Semi-Annual Report / March 31, 2021 |
SCHEDULE OF INVESTMENTS (Unaudited)
March 31, 2021
U.S. Managed Volatility Fund (Continued)
A list of the open futures contracts held by the Fund at March 31, 2021, is as follows:
| Number of | Unrealized | |||||||||||||||||||
| Type of | Contracts | Expiration | Notional Amount | Value | Appreciation | |||||||||||||||
| Contract | Long | Date | (Thousands) | (Thousands) | (Thousands) | |||||||||||||||
S&P 500 Index E-MINI | 33 | Jun-2021 | $ | 6,542 | $ | 6,546 | $ | 4 | ||||||||||||
|
|
| ||||||||||||||||||
| $ | 6,542 | $ | 6,546 | $ | 4 | |||||||||||||||
|
|
| ||||||||||||||||||
Percentages are based on Net Assets of $998,797 ($ Thousands). |
| * | Non-income producing security. |
| ** | The rate reported is the 7-day effective yield as of March 31, 2021. |
| ‡ | Real Estate Investment Trust. |
| † | Investment in Affiliated Security (see Note 6). |
| (A) | Certain securities or partial positions of certain securities are on loan at March 31, 2021 (see Note 10). The total market value of securities on loan at March 31, 2021 was $11,216 ($ Thousands). |
| (B) | This security was purchased with cash collateral held from securities on loan (see Note 10). The total market value of such securities as of March 31, 2021 was $11,343 ($ Thousands). |
ADR — American Depositary Receipt
Cl — Class
L.P. — Limited Partnership
Ltd. — Limited
PLC — Public Limited Company
S&P— Standard & Poor’s
The following is a list of the level of inputs used as of March 31, 2021, in valuing the Fund’s investments and other financial instruments carried at value ($ Thousands):
| Investments in Securities | Level 1 ($) | Level 2 ($) | Level 3 ($) | Total ($) | ||||||||||||
Common Stock | 986,198 | – | – | 986,198 | ||||||||||||
Affiliated Partnership | – | 11,343 | – | 11,343 | ||||||||||||
Cash Equivalent | 12,632 | – | – | 12,632 | ||||||||||||
|
|
|
|
|
|
|
|
|
|
|
| |||||
Total Investments in Securities | 998,830 | 11,343 | – | 1,010,173 | ||||||||||||
|
|
|
|
|
|
|
|
|
|
|
| |||||
| Other Financial Instruments | Level 1 ($) | Level 2 ($) | Level 3 ($) | Total ($) | ||||||||||||
Futures Contracts* | ||||||||||||||||
Unrealized Appreciation | 4 | – | – | 4 | ||||||||||||
|
|
|
|
|
|
|
|
|
|
|
| |||||
Total Other Financial Instruments | 4 | – | – | 4 | ||||||||||||
|
|
|
|
|
|
|
|
|
|
|
| |||||
* Futures contracts are valued at the unrealized appreciation on the instrument.
For the period ended March 31, 2021, there were no transfers in or out of Level 3.
For more information on valuation inputs, see Note 2 – Significant Accounting Policies in Notes to Financial Statements.
The following is a summary of the Fund’s transactions with affiliates for the period ended March 31, 2021 ($ Thousands):
| Security Description | Value 9/30/2020 | Purchases at Cost | Proceeds from Sales | Realized Gain/ (Loss) | Change in Unrealized Appreciation/ (Depreciation) | Value 3/31/2021 | Shares | Income | Capital Gains | |||||||||
SEI Liquidity Fund, L.P. | $13,094 | $39,459 | $(41,209) | $(1) | $— | $11,343 | 11,340,643 | $36 | $— | |||||||||
SEI Daily Income Trust, Government Fund, Cl F | 31,666 | 834,157 | (853,191) | — | — | 12,632 | 12,632,496 | 1 | — | |||||||||
|
|
|
|
|
|
|
| |||||||||||
Totals | $44,760 | $873,616 | $(894,400) | $(1) | $— | $23,975 | $37 | $— | ||||||||||
|
|
|
|
|
|
|
|
Amounts designated as “—” are either $0 or have been rounded to $0.
The accompanying notes are an integral part of the financial statements.
SEI Institutional Managed Trust / Semi-Annual Report / March 31, 2021 | 5 |
SCHEDULE OF INVESTMENTS (Unaudited)
March 31, 2021
Global Managed Volatility Fund (Continued)
| Description | Shares | Market Value ($ Thousands) | ||||||
COMMON STOCK — 97.7% | ||||||||
Australia — 2.0% | ||||||||
AusNet Services | 101,243 | $ | 142 | |||||
Coles Group Ltd | 237,342 | 2,894 | ||||||
Evolution Mining Ltd | 1,206,787 | 3,750 | ||||||
Medibank Pvt | 291,205 | 621 | ||||||
Newcrest Mining Ltd | 461,027 | 8,575 | ||||||
Regis Resources Ltd | 847,574 | 1,872 | ||||||
Telstra Corp Ltd, Cl B | 990,688 | 2,565 | ||||||
|
|
| ||||||
| 20,419 | ||||||||
|
|
| ||||||
Austria — 0.0% | ||||||||
Agrana Beteiligungs AG | 2,042 | 42 | ||||||
Oberbank AG | 81 | 8 | ||||||
Telekom Austria AG, Cl A | 44,848 | 354 | ||||||
|
|
| ||||||
| 404 | ||||||||
|
|
| ||||||
Belgium — 0.3% | ||||||||
Elia System Operator SA/NV | 2,256 | 249 | ||||||
Etablissements Franz Colruyt | 50,659 | 3,028 | ||||||
|
|
| ||||||
| 3,277 | ||||||||
|
|
| ||||||
Bermuda — 0.2% | ||||||||
RenaissanceRe Holdings Ltd | 14,365 | 2,302 | ||||||
|
|
| ||||||
Canada — 4.9% | ||||||||
Alimentation Couche-Tard Inc, Cl B | 262,600 | 8,466 | ||||||
BCE Inc | 145,249 | 6,557 | ||||||
Centerra Gold Inc | 140,302 | 1,241 | ||||||
Empire Co Ltd, Cl A | 202,512 | 6,313 | ||||||
Fairfax Financial Holdings Ltd | 1,900 | 829 | ||||||
George Weston Ltd | 104,821 | 9,281 | ||||||
Hydro One Ltd | 59,100 | 1,376 | ||||||
Loblaw Cos Ltd | 154,226 | 8,614 | ||||||
Metro Inc/CN, Cl A | 135,500 | 6,181 | ||||||
North West Co Inc/The | 53,100 | 1,543 | ||||||
Quebecor Inc, Cl B | 14,300 | 384 | ||||||
Wheaton Precious Metals Corp | 2,500 | 95 | ||||||
|
|
| ||||||
| 50,880 | ||||||||
|
|
| ||||||
Denmark — 1.0% | ||||||||
Coloplast A/S, Cl B | 29,928 | 4,511 | ||||||
Novo Nordisk A/S, Cl B | 82,245 | 5,586 | ||||||
Schouw & Co A/S | 497 | 52 | ||||||
|
|
| ||||||
| 10,149 | ||||||||
|
|
| ||||||
Finland — 0.3% | ||||||||
Kesko Oyj, Cl B | 102,239 | 3,134 | ||||||
Orion Oyj, Cl B | 1,100 | 44 | ||||||
|
|
| ||||||
| 3,178 | ||||||||
|
|
| ||||||
France — 1.2% | ||||||||
ABC arbitrage | 3,270 | 28 | ||||||
Carrefour SA | 253,887 | 4,608 | ||||||
Danone SA | 19,362 | 1,331 | ||||||
L’Oreal SA | 1,499 | 576 | ||||||
Orange SA | 6,212 | 77 | ||||||
Sanofi | 60,998 | 6,040 | ||||||
| Description | Shares | Market Value ($ Thousands) | ||||||
COMMON STOCK (continued) | ||||||||
Vivendi SA | 2,518 | $ | 83 | |||||
|
|
| ||||||
| 12,743 | ||||||||
|
|
| ||||||
Germany — 0.5% | ||||||||
Deutsche Telekom AG | 18,448 | 372 | ||||||
Henkel AG & Co KGaA | 14,619 | 1,451 | ||||||
Knorr-Bremse AG | 23,180 | 2,899 | ||||||
McKesson Europe AG | 874 | 27 | ||||||
Merck KGaA | 1,617 | 277 | ||||||
Scout24 | 7,717 | 587 | ||||||
|
|
| ||||||
| 5,613 | ||||||||
|
|
| ||||||
Hong Kong — 1.8% | ||||||||
CITIC Telecom International Holdings | 1,098,000 | 388 | ||||||
CK Hutchison Holdings Ltd | 124,000 | 988 | ||||||
CLP Holdings Ltd, Cl B | 869,156 | 8,441 | ||||||
HK Electric Investments & HK Electric | ||||||||
Investments Ltd | 1,036,500 | 1,029 | ||||||
HKT Trust & HKT Ltd | 3,509,000 | 5,001 | ||||||
Langham Hospitality Investments and | ||||||||
Langham Hospitality Investments Ltd *‡ | 425,500 | 65 | ||||||
Miramar Hotel & Investment | 49,000 | 92 | ||||||
MTR Corp Ltd | 227,000 | 1,286 | ||||||
PCCW Ltd | 1,128,000 | 636 | ||||||
Regal Hotels International Holdings Ltd * | 226,000 | 89 | ||||||
SmarTone Telecommunications Holdings | 163,760 | 96 | ||||||
VTech Holdings Ltd | 58,569 | 527 | ||||||
|
|
| ||||||
| 18,638 | ||||||||
|
|
| ||||||
Israel — 0.4% | ||||||||
Bank Hapoalim BM * | 128,574 | 1,002 | ||||||
Bank Leumi Le-Israel BM * | 230,773 | 1,522 | ||||||
Bezeq The Israeli Telecommunication Corp | ||||||||
Ltd * | 557,025 | 597 | ||||||
First International Bank of Israel * | 15,716 | 439 | ||||||
Isracard Ltd | 5 | – | ||||||
Neto ME Holdings | 982 | 48 | ||||||
Rami Levy Chain Stores Hashikma | ||||||||
Marketing 2006 Ltd | 3,823 | 249 | ||||||
Shufersal Ltd | 75,644 | 623 | ||||||
|
|
| ||||||
| 4,480 | ||||||||
|
|
| ||||||
Italy — 0.4% | ||||||||
ACEA | 22,354 | 490 | ||||||
Hera SpA | 610,015 | 2,343 | ||||||
Iren SpA | 596,683 | 1,652 | ||||||
Orsero SpA | 2,595 | 25 | ||||||
|
|
| ||||||
| 4,510 | ||||||||
|
|
| ||||||
Japan — 10.2% | ||||||||
Aeon Hokkaido Corp | 39,000 | 428 | ||||||
Ahjikan Co Ltd | 2,176 | 17 | ||||||
Araya Industrial Co Ltd | 2,600 | 41 | ||||||
Arcs Co Ltd | 34,200 | 740 | ||||||
Atsugi Co Ltd * | 11,750 | 59 | ||||||
Axial Retailing | 5,200 | 227 | ||||||
Belc Co Ltd | 4,200 | 235 | ||||||
SEI Institutional Managed Trust / Semi-Annual Report / March 31, 2021 | 1 |
SCHEDULE OF INVESTMENTS (Unaudited)
March 31, 2021
Global Managed Volatility Fund (Continued)
| Description | Shares | Market Value ($ Thousands) | ||||||
COMMON STOCK (continued) | ||||||||
Calbee Inc | 33,400 | $ | 853 | |||||
Can Do Co Ltd | 2,500 | 46 | ||||||
Cawachi Ltd | 18,000 | 469 | ||||||
C’BON COSMETICS Co Ltd * | 1,100 | 20 | ||||||
Chugoku Electric Power Co Inc/The | 14,292 | 176 | ||||||
Cosmos Pharmaceutical Corp | 18,800 | 2,938 | ||||||
Create Medic Co Ltd | 5,677 | 51 | ||||||
Daito Trust Construction Co Ltd | 11,000 | 1,277 | ||||||
DyDo Group Holdings Inc (A) | 14,690 | 707 | ||||||
Earth Chemical | 19,300 | 1,163 | ||||||
Fujicco | 12,000 | 212 | ||||||
Fujiya Co Ltd | 10,500 | 216 | ||||||
Heiwado | 9,200 | 187 | ||||||
Hitachi Ltd | 569 | 26 | ||||||
Hokkaido Gas Co Ltd | 2,400 | 35 | ||||||
Hokuto Corp | 34,900 | 659 | ||||||
House Foods Group | 2,700 | 89 | ||||||
Itochu-Shokuhin Co Ltd | 2,003 | 99 | ||||||
Itoham Yonekyu Holdings | 20,500 | 135 | ||||||
Japan Oil Transportation Co Ltd | 2,100 | 52 | ||||||
Japan Tobacco Inc | 397,100 | 7,637 | ||||||
JM Holdings | 3,600 | 74 | ||||||
Kaken Pharmaceutical Co Ltd | 21,700 | 851 | ||||||
Kakiyasu Honten Co Ltd | 4,431 | 106 | ||||||
Kamigumi Co Ltd | 54,900 | 1,042 | ||||||
Kato Sangyo Co Ltd | 29,100 | 941 | ||||||
KDDI Corp | 330,800 | 10,164 | ||||||
Kewpie Corp | 5,400 | 123 | ||||||
King Jim Co Ltd | 10,700 | 92 | ||||||
Kyokuyo Co Ltd | 5,100 | 141 | ||||||
KYORIN Holdings Inc | 104,700 | 1,827 | ||||||
Lawson Inc | 9,900 | 486 | ||||||
Lion Corp | 144,000 | 2,814 | ||||||
Marubeni Corp | 36,900 | 307 | ||||||
Maxvalu Tokai | 1,600 | 38 | ||||||
McDonald’s Holdings Co Japan Ltd | 3,300 | 152 | ||||||
MEIJI Holdings Co Ltd | 11,800 | 760 | ||||||
Ministop Co Ltd | 10,600 | 140 | ||||||
Mitsubishi Shokuhin Co Ltd | 17,000 | 476 | ||||||
Miyoshi Oil & Fat Co Ltd | 16,300 | 191 | ||||||
Mochida Pharmaceutical Co Ltd | 6,100 | 237 | ||||||
Morozoff Ltd | 600 | 32 | ||||||
Musashi Co Ltd | 2,400 | 44 | ||||||
Natori Co Ltd | 500 | 9 | ||||||
Nihon Chouzai Co Ltd | 15,600 | 252 | ||||||
Nintendo Co Ltd | 11,600 | 6,489 | ||||||
Nippn | 111,234 | 1,668 | ||||||
Nippon BS Broadcasting Corp | 1,700 | 17 | ||||||
Nippon Express Co Ltd | 18,600 | 1,387 | ||||||
Nippon Telegraph & Telephone Corp (A) | 397,200 | 10,216 | ||||||
Nisshin Oillio Group Ltd/The | 24,652 | 728 | ||||||
Nissin Foods Holdings Co Ltd | 10,500 | 780 | ||||||
| Description | Shares | Market Value ($ Thousands) | ||||||
COMMON STOCK (continued) | ||||||||
Okinawa Cellular Telephone Co | 3,500 | $ | 161 | |||||
Okinawa Electric Power Co Inc/The | 47,017 | 660 | ||||||
Okuwa | 7,100 | 78 | ||||||
Oracle Corp Japan * | 13,600 | 1,329 | ||||||
Otsuka Holdings Co Ltd | 7,000 | 297 | ||||||
OUG Holdings Inc | 2,431 | 66 | ||||||
San Holdings Inc | 3,800 | 38 | ||||||
San-A Co Ltd, Cl A | 6,400 | 267 | ||||||
Seven & i Holdings Co Ltd | 80,400 | 3,247 | ||||||
Shimamura Co Ltd | 7,400 | 855 | ||||||
Showa Sangyo Co Ltd (A) | 13,000 | 365 | ||||||
SKY Perfect JSAT Holdings Inc | 20,400 | 91 | ||||||
Softbank Corp | 1,147,600 | 14,940 | ||||||
ST Corp | 6,300 | 111 | ||||||
Sugi Holdings Co Ltd | 33,900 | 2,691 | ||||||
Sundrug Co Ltd | 112,000 | 4,105 | ||||||
Toho Holdings Co Ltd | 29,800 | 547 | ||||||
Toyo Suisan Kaisha Ltd | 25,600 | 1,077 | ||||||
Trend Micro Inc/Japan | �� | 39,000 | 1,955 | |||||
Tsuruha Holdings Inc | 38,600 | 4,988 | ||||||
Unicafe Inc * | 6,400 | 59 | ||||||
Unicharm Corp | 82,500 | 3,468 | ||||||
United Super Markets Holdings Inc | 91,700 | 968 | ||||||
Valor Holdings Co Ltd | 19,500 | 439 | ||||||
Vital KSK Holdings Inc | 72,000 | 514 | ||||||
Wowow Inc | 7,424 | 189 | ||||||
Yaoko Co Ltd | 6,100 | 375 | ||||||
Yokohama Reito | 4,800 | 40 | ||||||
ZERIA Pharmaceutical | 2,600 | 49 | ||||||
|
|
| ||||||
| 105,347 | ||||||||
|
|
| ||||||
Netherlands — 1.2% | ||||||||
Koninklijke Ahold Delhaize NV | 444,731 | 12,414 | ||||||
|
|
| ||||||
New Zealand — 0.5% | ||||||||
Argosy Property Ltd ‡ | 22,075 | 22 | ||||||
Contact Energy Ltd | 4,989 | 25 | ||||||
EBOS Group Ltd | 8,368 | 173 | ||||||
Fisher & Paykel Healthcare Corp Ltd | 78,811 | 1,772 | ||||||
Freightways Ltd | 13,183 | 104 | ||||||
Mainfreight Ltd | 8,377 | 407 | ||||||
Spark New Zealand Ltd | 722,767 | 2,268 | ||||||
Trustpower Ltd | 28,159 | 162 | ||||||
Vector Ltd | 76,253 | 216 | ||||||
Warehouse Group Ltd/The | 38,887 | 103 | ||||||
|
|
| ||||||
| 5,252 | ||||||||
|
|
| ||||||
Norway — 1.1% | ||||||||
Orkla ASA | 806,339 | 7,920 | ||||||
Telenor ASA | 202,726 | 3,574 | ||||||
|
|
| ||||||
| 11,494 | ||||||||
|
|
| ||||||
Portugal — 0.1% | ||||||||
REN - Redes Energeticas Nacionais SGPS SA | 426,813 | 1,194 | ||||||
|
|
| ||||||
Singapore — 0.4% | ||||||||
Dairy Farm International Holdings Ltd | 36,600 | 158 | ||||||
| 2 | SEI Institutional Managed Trust / Semi-Annual Report / March 31, 2021 |
SCHEDULE OF INVESTMENTS (Unaudited)
March 31, 2021
Global Managed Volatility Fund (Continued)
| Description | Shares | Market Value ($ Thousands) | ||||||
COMMON STOCK (continued) |
| |||||||
Fraser and Neave Ltd | 20,400 | $ | 22 | |||||
Genting Singapore Ltd | 575,000 | 394 | ||||||
Sheng Siong Group Ltd | 1,234,774 | 1,415 | ||||||
Singapore Exchange Ltd | 258,897 | 1,921 | ||||||
|
|
| ||||||
| 3,910 | ||||||||
|
|
| ||||||
Spain — 0.5% | ||||||||
Endesa SA | 90,221 | 2,392 | ||||||
Iberdrola SA | 25,529 | 330 | ||||||
Red Electrica Corp SA (A) | 108,910 | 1,933 | ||||||
|
|
| ||||||
| 4,655 | ||||||||
|
|
| ||||||
Sweden — 1.8% | ||||||||
Axfood AB (A) | 327,941 | 7,856 | ||||||
Evolution Gaming Group | 1,293 | 191 | ||||||
ICA Gruppen AB | 176,368 | 8,640 | ||||||
Telefonaktiebolaget LM Ericsson, Cl B | 156,607 | 2,076 | ||||||
|
|
| ||||||
| 18,763 | ||||||||
|
|
| ||||||
Switzerland — 4.9% | ||||||||
AEVIS VICTORIA SA * | 1,870 | 27 | ||||||
Allreal Holding AG, Cl A ‡ | 11,197 | 2,265 | ||||||
BKW AG | 7,977 | 871 | ||||||
Chocoladefabriken Lindt & Spruengli AG | 258 | 2,262 | ||||||
Emmi | 37 | 38 | ||||||
Logitech International SA | 32,935 | 3,470 | ||||||
Nestle SA | 68,522 | 7,670 | ||||||
Novartis AG | 102,623 | 8,807 | ||||||
Orior AG | 1,632 | 145 | ||||||
Plazza AG ‡ | 133 | 45 | ||||||
Roche Holding AG | 29,133 | 9,455 | ||||||
Schindler Holding AG | 8,925 | 2,621 | ||||||
Sonova Holding AG * | 11,434 | 3,042 | ||||||
Swisscom AG (A) | 18,237 | 9,824 | ||||||
TX Group AG * | 491 | 39 | ||||||
Varia US Properties AG ‡ | 560 | 23 | ||||||
|
|
| ||||||
| 50,604 | ||||||||
|
|
| ||||||
United Kingdom — 2.7% | ||||||||
Fresnillo | 86,305 | 1,029 | ||||||
Genus | 18,801 | 1,260 | ||||||
GlaxoSmithKline PLC | 408,444 | 7,258 | ||||||
Imperial Brands PLC | 43,098 | 887 | ||||||
J Sainsbury PLC | 1,021,632 | 3,418 | ||||||
Kingfisher PLC | 699,736 | 3,073 | ||||||
Liberty Global PLC, Cl C * | 272,459 | 6,959 | ||||||
Tate & Lyle PLC | 211,095 | 2,234 | ||||||
Unilever PLC | 23,783 | 1,331 | ||||||
|
|
| ||||||
| 27,449 | ||||||||
|
|
| ||||||
United States — 61.2% | ||||||||
Communication Services — 4.4% | ||||||||
Alphabet Inc, Cl A * | 3,623 | 7,473 | ||||||
Alphabet Inc, Cl C * | 502 | 1,039 | ||||||
AT&T Inc | 411,885 | 12,468 | ||||||
ATN International Inc | 3,022 | 148 | ||||||
Electronic Arts Inc | 4,745 | 642 | ||||||
| Description | Shares | Market Value ($ Thousands) | ||||||
COMMON STOCK (continued) | ||||||||
Fox Corp | 91,116 | $ | 3,240 | |||||
John Wiley & Sons Inc, Cl A | 30,026 | 1,627 | ||||||
News Corp, Cl A | 118,537 | 3,014 | ||||||
Omnicom Group Inc | 12,793 | 948 | ||||||
Scholastic Corp, Cl B | 53,176 | 1,601 | ||||||
Telephone and Data Systems Inc | 10,041 | 231 | ||||||
Thryv Holdings * | 6,500 | 152 | ||||||
Verizon Communications Inc | 215,541 | 12,534 | ||||||
|
|
| ||||||
| 45,117 | ||||||||
|
|
| ||||||
Consumer Discretionary — 3.0% | ||||||||
Acushnet Holdings Corp | 6,102 | 252 | ||||||
AutoZone Inc * | 3,483 | 4,891 | ||||||
Chewy, Cl A * | 3,042 | 258 | ||||||
Dollar General Corp | 51,640 | 10,463 | ||||||
Dollar Tree Inc * | 5,147 | 589 | ||||||
Domino’s Pizza Inc | 6,248 | 2,298 | ||||||
Johnson Outdoors Inc, Cl A | 2,547 | 364 | ||||||
Target Corp, Cl A | 61,414 | 12,164 | ||||||
|
|
| ||||||
| 31,279 | ||||||||
|
|
| ||||||
Consumer Staples — 16.4% | ||||||||
Bunge Ltd | 11,947 | 947 | ||||||
Campbell Soup Co | 48,710 | 2,449 | ||||||
Casey’s General Stores Inc | 42,324 | 9,150 | ||||||
Central Garden & Pet Co, Cl A * | 39,802 | 2,065 | ||||||
Church & Dwight Co Inc | 123,087 | 10,752 | ||||||
Clorox Co/The | 55,958 | 10,793 | ||||||
Colgate-Palmolive Co | 151,468 | 11,940 | ||||||
Costco Wholesale Corp | 39,816 | 14,034 | ||||||
Flowers Foods Inc | 261,214 | 6,217 | ||||||
General Mills Inc | 170,104 | 10,431 | ||||||
Herbalife Nutrition Ltd * | 13,152 | 583 | ||||||
Hershey Co/The | 45,747 | 7,235 | ||||||
Hormel Foods Corp | 64,110 | 3,063 | ||||||
Ingles Markets Inc, Cl A | 481 | 30 | ||||||
J M Smucker Co/The | 23,154 | 2,930 | ||||||
John B Sanfilippo & Son Inc | 10,031 | 907 | ||||||
Kellogg Co | 128,137 | 8,111 | ||||||
Keurig Dr Pepper Inc | 24,170 | 831 | ||||||
Kimberly-Clark Corp | 91,092 | 12,666 | ||||||
Kroger Co/The | 317,561 | 11,429 | ||||||
Lancaster Colony Corp | 20,558 | 3,605 | ||||||
McCormick & Co Inc/MD | 8,805 | 785 | ||||||
Mondelez International Inc, Cl A | 74,297 | 4,349 | ||||||
Nomad Foods * | 50,102 | 1,376 | ||||||
PriceSmart Inc | 9,803 | 948 | ||||||
Procter & Gamble Co/The | 61,172 | 8,285 | ||||||
Spectrum Brands Holdings Inc | 14,910 | 1,267 | ||||||
Sprouts Farmers Market Inc * | 18,036 | 480 | ||||||
Tyson Foods Inc, Cl A | 14,457 | 1,074 | ||||||
USANA Health Sciences Inc * | 28,753 | 2,806 | ||||||
Village Super Market Inc, Cl A | 1,246 | 29 | ||||||
SEI Institutional Managed Trust / Semi-Annual Report / March 31, 2021 | 3 |
SCHEDULE OF INVESTMENTS (Unaudited)
March 31, 2021
Global Managed Volatility Fund (Continued)
| Description | Shares | Market Value ($ Thousands) | ||||||
COMMON STOCK (continued) | ||||||||
Walmart Inc | 90,846 | $ | 12,340 | |||||
WD-40 Co | 18,925 | 5,795 | ||||||
Weis Markets Inc | 4,375 | 247 | ||||||
|
|
| ||||||
| 169,949 | ||||||||
|
|
| ||||||
Financials — 1.5% | ||||||||
American Business Bank * | 1,245 | 50 | ||||||
BankFinancial Corp | 10,739 | 111 | ||||||
Berkshire Hathaway Inc, Cl B * | 25,805 | 6,592 | ||||||
BlackRock TCP Capital Corp | 53,540 | 740 | ||||||
Cboe Global Markets Inc | 53,456 | 5,276 | ||||||
Central Pacific Financial Corp | 14,941 | 399 | ||||||
ESSA Bancorp Inc | 1,559 | 25 | ||||||
HarborOne Bancorp Inc | 9,243 | 124 | ||||||
HBT Financial Inc | 1,681 | 29 | ||||||
HomeTrust Bancshares Inc | 6,450 | 157 | ||||||
Independent Bank Corp/MI | 4,848 | 115 | ||||||
Sixth Street Specialty Lending Inc | 51 | 1 | ||||||
Territorial Bancorp Inc | 1,031 | 27 | ||||||
Trustmark Corp | 18,090 | 609 | ||||||
Waterstone Financial Inc | 33,141 | 677 | ||||||
Westamerica BanCorp | 3,138 | 197 | ||||||
|
|
| ||||||
| 15,129 | ||||||||
|
|
| ||||||
Health Care — 15.7% | ||||||||
Abbott Laboratories | 26,677 | 3,197 | ||||||
AbbVie Inc | 38,791 | 4,198 | ||||||
Agilent Technologies Inc | 61,383 | 7,804 | ||||||
Amgen Inc, Cl A | 32,320 | 8,042 | ||||||
Becton Dickinson and Co | 4,190 | 1,019 | ||||||
Biogen Inc * | 19,109 | 5,346 | ||||||
Bio-Rad Laboratories Inc, Cl A * | 7,495 | 4,281 | ||||||
Bristol-Myers Squibb Co | 6,365 | 402 | ||||||
Cerner Corp | 144,178 | 10,363 | ||||||
Chemed Corp | 21,520 | 9,895 | ||||||
Computer Programs and Systems Inc * | 8,872 | 271 | ||||||
CVS Health Corp | 61,171 | 4,602 | ||||||
DaVita Inc * | 5,607 | 604 | ||||||
Eagle Pharmaceuticals Inc/DE * | 6,585 | 275 | ||||||
Eli Lilly and Co | 13,974 | 2,611 | ||||||
Enanta Pharmaceuticals Inc * | 8,886 | 438 | ||||||
Encompass Health Corp | 56,699 | 4,644 | ||||||
Gilead Sciences Inc | 125,562 | 8,115 | ||||||
HealthStream Inc * | 3,325 | 74 | ||||||
Henry Schein Inc * | 37,159 | 2,573 | ||||||
Johnson & Johnson | 79,844 | 13,122 | ||||||
Merck & Co Inc | 115,941 | 8,938 | ||||||
Mettler-Toledo International Inc * | 6,967 | 8,052 | ||||||
National HealthCare Corp | 13,824 | 1,077 | ||||||
Orthofix Medical Inc * | 21,666 | 939 | ||||||
PerkinElmer Inc | 58,535 | 7,509 | ||||||
Pfizer Inc | 117,998 | 4,275 | ||||||
Phibro Animal Health Corp, Cl A | 9,042 | 221 | ||||||
| Description | Shares | Market Value ($ Thousands) | ||||||
COMMON STOCK (continued) | ||||||||
Prestige Consumer Healthcare Inc, Cl A * | 42,441 | $ | 1,871 | |||||
Quest Diagnostics Inc | 33,711 | 4,326 | ||||||
Regeneron Pharmaceuticals Inc * | 12,858 | 6,084 | ||||||
Thermo Fisher Scientific Inc | 16,912 | 7,718 | ||||||
United Therapeutics Corp * | 48,976 | 8,192 | ||||||
Vertex Pharmaceuticals Inc * | 6,076 | 1,306 | ||||||
Waters Corp * | 35,833 | 10,183 | ||||||
|
|
| ||||||
| 162,567 | ||||||||
|
|
| ||||||
Industrials — 3.9% | ||||||||
A O Smith Corp | 33,370 | 2,256 | ||||||
AMERCO * | 2,074 | 1,271 | ||||||
Brady Corp, Cl A | 1,597 | 85 | ||||||
CH Robinson Worldwide Inc | 42,994 | 4,103 | ||||||
Expeditors International of Washington Inc | 61,494 | 6,622 | ||||||
JB Hunt Transport Services Inc | 29,639 | 4,981 | ||||||
Lockheed Martin Corp | 13,635 | 5,038 | ||||||
Northrop Grumman Corp | 16,317 | 5,281 | ||||||
Republic Services Inc | 14,720 | 1,463 | ||||||
Robert Half International Inc | 42,300 | 3,302 | ||||||
Waste Management Inc | 42,651 | 5,503 | ||||||
|
|
| ||||||
| 39,905 | ||||||||
|
|
| ||||||
Information Technology — 10.1% |
| |||||||
ADTRAN Inc | 11,593 | 193 | ||||||
Arista Networks Inc * | 11,527 | 3,480 | ||||||
Arrow Electronics Inc, Cl A * | 17,228 | 1,909 | ||||||
Calix Inc * | 23,666 | 820 | ||||||
Check Point Software Technologies Ltd * | 92,132 | 10,316 | ||||||
Ciena Corp * | 69,355 | 3,795 | ||||||
Cisco Systems Inc/Delaware | 221,897 | 11,474 | ||||||
Citrix Systems Inc | 35,825 | 5,029 | ||||||
CommVault Systems Inc * | 38,206 | 2,464 | ||||||
F5 Networks Inc, Cl A * | 54,178 | 11,303 | ||||||
J2 Global Inc * | 5,897 | 707 | ||||||
Juniper Networks Inc | 366,962 | 9,295 | ||||||
Microsoft Corp | 39,057 | 9,209 | ||||||
Motorola Solutions Inc | 41,044 | 7,718 | ||||||
NETGEAR Inc * | 37,227 | 1,530 | ||||||
NetScout Systems Inc * | 67,876 | 1,911 | ||||||
NortonLifeLock Inc | 128,426 | 2,730 | ||||||
Oracle Corp, Cl B | 167,429 | 11,749 | ||||||
Progress Software Corp | 42,336 | 1,865 | ||||||
QAD Inc, Cl A | 9,855 | 656 | ||||||
Radware Ltd * | 31,421 | 820 | ||||||
Sykes Enterprises Inc * | 15,013 | 662 | ||||||
Texas Instruments Inc | 12,456 | 2,354 | ||||||
Ubiquiti Inc | 3,093 | 923 | ||||||
Viavi Solutions Inc * | 115,475 | 1,813 | ||||||
|
|
| ||||||
| 104,725 | ||||||||
|
|
| ||||||
Materials — 3.5% | ||||||||
AptarGroup Inc | 14,448 | 2,047 | ||||||
Kaiser Aluminum Corp | 2,079 | 230 | ||||||
| 4 | SEI Institutional Managed Trust / Semi-Annual Report / March 31, 2021 |
SCHEDULE OF INVESTMENTS (Unaudited)
March 31, 2021
Global Managed Volatility Fund (Continued)
| Description | Shares | Market Value ($ Thousands) | ||||||
COMMON STOCK (continued) |
| |||||||
Materion Corp | 31,936 | $ | 2,115 | |||||
Newmont Corp | 122,131 | 7,361 | ||||||
Nucor Corp | 30,801 | 2,472 | ||||||
Reliance Steel & Aluminum Co | 57,596 | 8,771 | ||||||
Royal Gold Inc, Cl A | 73,041 | 7,861 | ||||||
Silgan Holdings Inc | 123,075 | 5,173 | ||||||
| 36,030 | ||||||||
Real Estate — 1.0% | ||||||||
Extra Space Storage Inc ‡ | 40,968 | 5,430 | ||||||
Public Storage ‡ | 18,337 | 4,525 | ||||||
| 9,955 | ||||||||
Utilities — 1.8% | ||||||||
Alliant Energy Corp | 114,194 | 6,185 | ||||||
American Electric Power Co Inc | 32,389 | 2,743 | ||||||
Consolidated Edison Inc | 28,685 | 2,146 | ||||||
Hawaiian Electric Industries Inc | 104,116 | 4,626 | ||||||
Public Service Enterprise Group Inc | 46,951 | 2,827 | ||||||
| 18,527 | ||||||||
| 633,183 | ||||||||
Total Common Stock (Cost $891,428) ($ Thousands) | 1,010,858 | |||||||
PREFERRED STOCK — 0.8% |
| |||||||
Germany — 0.8% | ||||||||
Henkel AG & Co KGaA (B) | 73,963 | 8,333 | ||||||
Total Preferred Stock | 8,333 | |||||||
| Description | Shares | Market Value ($ Thousands) | ||||||
AFFILIATED PARTNERSHIP — 1.6% |
| |||||||
SEI Liquidity Fund, L.P. | 16,384,413 | $ | 16,389 | |||||
Total Affiliated Partnership (Cost $16,388) ($ Thousands) | 16,389 | |||||||
CASH EQUIVALENT — 0.4% |
| |||||||
SEI Daily Income Trust, Government Fund, Cl F | 3,749,889 | 3,750 | ||||||
Total Cash Equivalent (Cost $3,750) ($ Thousands) | 3,750 | |||||||
Total Investments in Securities —100.5% |
| $ | 1,039,330 | |||||
A list of the open futures contracts held by the Fund at March 31, 2021, is as follows:
| Type of Contract | Number of Contracts Long | Expiration Date | Notional Amount (Thousands) | Value (Thousands) | Unrealized Appreciation (Thousands) | |||||||||||||||
Euro STOXX 50 | 6 | Jun-2021 | $ | 270 | $ | 272 | $ | 7 | ||||||||||||
FTSE 100 Index | 1 | Jun-2021 | 92 | 92 | – | |||||||||||||||
Hang Seng Index | 1 | May-2021 | 182 | 182 | 1 | |||||||||||||||
S&P 500 Index E-MINI^ | 10 | Jun-2021 | 1,963 | 1,984 | 20 | |||||||||||||||
SPI 200 Index | 1 | Jun-2021 | 129 | 129 | 1 | |||||||||||||||
TOPIX Index | 1 | Jun-2021 | 177 | 177 | 2 | |||||||||||||||
|
|
|
|
|
|
|
|
| ||||||||||||
| $ | 2,813 | $ | 2,836 | $ | 31 | |||||||||||||||
|
|
|
|
|
|
|
|
| ||||||||||||
A list of the open forward foreign currency contracts held by the Fund at March 31, 2021, is as follows:
| Counterparty | Settlement Date | Currency to Deliver (Thousands) | Currency to Receive (Thousands) | Unrealized Appreciation (Depreciation) (Thousands) | ||||||||||||||||||||
Brown Brothers Harriman | 04/13/21 | USD | 25 | SGD | 34 | $ | — | |||||||||||||||||
Brown Brothers Harriman | 04/13/21 | USD | 73 | SGD | 98 | — | ||||||||||||||||||
SEI Institutional Managed Trust / Semi-Annual Report / March 31, 2021 | 5 |
SCHEDULE OF INVESTMENTS (Unaudited)
March 31, 2021
Global Managed Volatility Fund (Continued)
| Counterparty | Settlement Date | Currency to Deliver (Thousands) | Currency to Receive (Thousands) | Unrealized Appreciation (Depreciation) (Thousands) | ||||||||||||||||
Brown Brothers Harriman | 04/13/21 | USD | 54 | DKK | 340 | $ | — | |||||||||||||
Brown Brothers Harriman | 04/13/21 | USD | 138 | DKK | 860 | (2 | ) | |||||||||||||
Brown Brothers Harriman | 04/13/21 | USD | 267 | SEK | 2,283 | (5 | ) | |||||||||||||
Brown Brothers Harriman | 04/13/21 | USD | 20 | AUD | 27 | — | ||||||||||||||
Brown Brothers Harriman | 04/13/21 | USD | 331 | AUD | 428 | (5 | ) | |||||||||||||
Brown Brothers Harriman | 04/13/21 | USD | 372 | HKD | 2,885 | (1 | ) | |||||||||||||
Brown Brothers Harriman | 04/13/21 | USD | 94 | GBP | 69 | — | ||||||||||||||
Brown Brothers Harriman | 04/13/21 | USD | 822 | GBP | 593 | (4 | ) | |||||||||||||
Brown Brothers Harriman | 04/13/21 | USD | 640 | NOK | 5,489 | 3 | ||||||||||||||
Brown Brothers Harriman | 04/13/21 | USD | 279 | NOK | 2,367 | (2 | ) | |||||||||||||
Brown Brothers Harriman | 04/13/21 | USD | 928 | EUR | 780 | (12 | ) | |||||||||||||
Brown Brothers Harriman | 04/13/21 | USD | 25 | NZD | 36 | — | ||||||||||||||
Brown Brothers Harriman | 04/13/21 | USD | 945 | NZD | 1,324 | (18 | ) | |||||||||||||
Brown Brothers Harriman | 04/13/21 | USD | 523 | CAD | 661 | 4 | ||||||||||||||
Brown Brothers Harriman | 04/13/21 | USD | 465 | CAD | 582 | (2 | ) | |||||||||||||
Brown Brothers Harriman | 04/13/21 | USD | 225 | CHF | 211 | — | ||||||||||||||
Brown Brothers Harriman | 04/13/21 | USD | 1,047 | CHF | 972 | (13 | ) | |||||||||||||
Brown Brothers Harriman | 04/13/21 | USD | 1,428 | JPY | 155,613 | (19 | ) | |||||||||||||
Brown Brothers Harriman | 04/13/21 | SGD | 2,785 | USD | 2,093 | 21 | ||||||||||||||
Brown Brothers Harriman | 04/13/21 | SGD | 698 | USD | 519 | (1 | ) | |||||||||||||
Brown Brothers Harriman | 04/13/21 | NZD | 6,814 | USD | 4,955 | 183 | ||||||||||||||
Brown Brothers Harriman | 04/13/21 | NZD | 98 | USD | 69 | — | ||||||||||||||
Brown Brothers Harriman | 04/13/21 | GBP | 8,451 | USD | 11,790 | 131 | ||||||||||||||
Brown Brothers Harriman | 04/13/21 | GBP | 232 | USD | 319 | — | ||||||||||||||
Brown Brothers Harriman | 04/13/21 | AUD | 13,193 | USD | 10,290 | 241 | ||||||||||||||
Brown Brothers Harriman | 04/13/21 | CAD | 465 | USD | 371 | 2 | ||||||||||||||
Brown Brothers Harriman | 04/13/21 | CAD | 22,821 | USD | 18,076 | (83 | ) | |||||||||||||
Brown Brothers Harriman | 04/13/21 | CHF | 26,133 | USD | 28,540 | 763 | ||||||||||||||
Brown Brothers Harriman | 04/13/21 | CHF | 41 | USD | 43 | — | ||||||||||||||
Brown Brothers Harriman | 04/13/21 | EUR | 28,665 | USD | 34,552 | 855 | ||||||||||||||
Brown Brothers Harriman | 04/13/21 | EUR | 37 | USD | 44 | — | ||||||||||||||
Brown Brothers Harriman | 04/13/21 | DKK | 44,587 | USD | 7,222 | 174 | ||||||||||||||
Brown Brothers Harriman | 04/13/21 | DKK | 57 | USD | 9 | — | ||||||||||||||
Brown Brothers Harriman | 04/13/21 | NOK | 63,571 | USD | 7,482 | 34 | ||||||||||||||
Brown Brothers Harriman | 04/13/21 | NOK | 1,900 | USD | 222 | (1 | ) | |||||||||||||
Brown Brothers Harriman | 04/13/21 | HKD | 81,680 | USD | 10,526 | 20 | ||||||||||||||
Brown Brothers Harriman | 04/13/21 | SEK | 87,239 | USD | 10,362 | 351 | ||||||||||||||
Brown Brothers Harriman | 04/13/21 | SEK | 257 | USD | 29 | — | ||||||||||||||
Brown Brothers Harriman | 04/13/21 | JPY | 6,688,277 | USD | 62,560 | 2,021 | ||||||||||||||
|
|
| ||||||||||||||||||
| $ | 4,635 | |||||||||||||||||||
|
|
| ||||||||||||||||||
Percentages are based on Net Assets of $1,034,108 ($ Thousands). |
| * | Non-income producing security. |
| ** | Rate shown is the 7-day effective yield as of March 31, 2021. |
| ‡ | Real Estate Investment Trust. |
| † | Investment in Affiliated Security (see Note 6). |
| (A) | Certain securities or partial positions of certain securities are on loan at March 31, 2021 (see Note 10). The total market value of securities on loan at March 31, 2021 was $16,081 ($ Thousands). |
| (B) | There is currently no rate available. |
| (C) | This security was purchased with cash collateral held from securities on loan (see Note 10). The total market value of such securities as of March 31, 2021 was $16,389 ($ Thousands). |
AUD — Australian Dollar
CAD — Canadian Dollar
CHF — Swiss Franc
Cl — Class
DKK — Danish Krone
EUR — Euro
FTSE— Financial Times Stock Exchange
| 6 | SEI Institutional Managed Trust / Semi-Annual Report / March 31, 2021 |
SCHEDULE OF INVESTMENTS (Unaudited)
March 31, 2021
Global Managed Volatility Fund (Continued)
GBP — British Pound Sterling
HKD — Hong Kong Dollar
JPY — Japanese Yen
L.P. — Limited Partnership
Ltd. — Limited
NOK — Norwegian Krone
NZD — New Zealand Dollar
PLC — Public Limited Company
S&P— Standard & Poor’s
SGD — Singapore Dollar
SEK — Swedish Krona
SPI — Share Price Index
TOPIX- Tokyo Price Index
USD — U.S. Dollar
The following is a list of the level of inputs used as of March 31, 2021, in valuing the Fund’s investments and other financial instruments carried at value ($ Thousands):
| Investments in Securities | Level 1 ($) | Level 2 ($) | Level 3 ($) | Total ($) | ||||||||||||
Common Stock | 1,010,623 | 235 | – | 1,010,858 | ||||||||||||
Preferred Stock | 8,333 | – | – | 8,333 | ||||||||||||
Affiliated Partnership | – | 16,389 | – | 16,389 | ||||||||||||
Cash Equivalent | 3,750 | – | – | 3,750 | ||||||||||||
|
|
|
|
|
|
|
|
|
|
|
| |||||
Total Investments in Securities | 1,022,706 | 16,624 | – | 1,039,330 | ||||||||||||
|
|
|
|
|
|
|
|
|
|
|
| |||||
| Other Financial Instruments | Level 1 ($) | Level 2 ($) | Level 3 ($) | Total ($) | ||||||||||||
Futures Contracts* | ||||||||||||||||
Unrealized Appreciation | 31 | – | – | 31 | ||||||||||||
Forwards Contracts* | ||||||||||||||||
Unrealized Appreciation | – | 4,802 | – | 4,802 | ||||||||||||
Unrealized Depreciation | – | (167 | ) | – | (167 | ) | ||||||||||
|
|
|
|
|
|
|
|
|
|
|
| |||||
Total Other Financial Instruments | 31 | 4,635 | – | 4,666 | ||||||||||||
|
|
|
|
|
|
|
|
|
|
|
| |||||
* Futures contracts and forward contracts are valued at the unrealized appreciation (depreciation) on the instrument.
For the period ended March 31, 2021, there were no transfers in or out of Level 3.
For more information on valuation inputs, see Note 2 – Significant Accounting Policies in Notes to Financial Statements.
The following is a summary of the Fund’s transactions with affiliates for the period ended March 31, 2021 ($ Thousands):
| Security Description | Value 9/30/2020 | Purchases at Cost | Proceeds from Sales | Realized Gain/ (Loss) | Change in Unrealized Appreciation/ (Depreciation) | Value 3/31/2021 | Shares | Income | Capital Gains | |||||||||
SEI Liquidity Fund, L.P. | $11,893 | $40,490 | $(35,993) | $(2) | $1 | $16,389 | 16,384,413 | $27 | $— | |||||||||
SEI Daily Income Trust, Government Fund, Cl F | 15,236 | 92,339 | (103,825) | — | — | 3,750 | 3,749,889 | — | — | |||||||||
|
|
|
|
|
|
|
| |||||||||||
Totals | $ 27,129 | $ 132,829 | $(139,818) | $(2) | $1 | $ 20,139 | $27 | $— | ||||||||||
|
|
|
|
|
|
|
|
Amounts designated as “—” are either $0 or have been rounded to $0.
The accompanying notes are an integral part of the financial statements.
SEI Institutional Managed Trust / Semi-Annual Report / March 31, 2021 | 7 |
SCHEDULE OF INVESTMENTS (Unaudited)
March 31, 2021
Tax-Managed Managed Volatility Fund (Continued)
| Description | Shares | Market Value ($ Thousands) | ||||||
COMMON STOCK — 98.1% | ||||||||
Communication Services — 3.7% |
| |||||||
Activision Blizzard Inc | 40,408 | $ | 3,758 | |||||
Alphabet Inc, Cl A * | 520 | 1,073 | ||||||
Comcast Corp, Cl A | 15,400 | 833 | ||||||
Fox Corp | 83,711 | 3,023 | ||||||
John Wiley & Sons Inc, Cl A | 55,784 | 3,023 | ||||||
Madison Square Garden Entertainment Corp * | 15,358 | 1,256 | ||||||
Madison Square Garden Sports Corp * | 8,586 | 1,541 | ||||||
New York Times Co/The, Cl A | 79,939 | 4,047 | ||||||
Quebecor Inc, Cl B | 40,500 | 1,087 | ||||||
SK Telecom Co Ltd ADR | 129,800 | 3,534 | ||||||
Take-Two Interactive Software Inc, Cl A * | 14,286 | 2,524 | ||||||
TELUS Corp | 160,200 | 3,190 | ||||||
T-Mobile US Inc * | 37,578 | 4,708 | ||||||
Verizon Communications Inc | 25,768 | 1,498 | ||||||
Zynga Inc, Cl A * | 163,146 | 1,666 | ||||||
| 36,761 | ||||||||
Consumer Discretionary — 6.4% |
| |||||||
Amazon.com Inc, Cl A * | 258 | 798 | ||||||
AutoZone Inc * | 10,000 | 14,043 | ||||||
Darden Restaurants Inc | 15,105 | 2,145 | ||||||
Dick’s Sporting Goods Inc | 34,895 | 2,657 | ||||||
Dollar General Corp | 8,848 | 1,793 | ||||||
eBay Inc | 140,400 | 8,598 | ||||||
frontdoor Inc * | 39,623 | 2,130 | ||||||
Graham Holdings Co, Cl B | 4,037 | 2,270 | ||||||
McDonald’s Corp | 26,822 | 6,012 | ||||||
Ollie’s Bargain Outlet Holdings Inc * | 28,330 | 2,465 | ||||||
Target Corp, Cl A | 68,000 | 13,469 | ||||||
Toyota Motor Corp ADR (A) | 38,500 | 6,008 | ||||||
| 62,388 | ||||||||
Consumer Staples — 14.3% |
| |||||||
Altria Group Inc | 145,146 | 7,426 | ||||||
Bunge Ltd | 11,344 | 899 | ||||||
Church & Dwight Co Inc | 67,706 | 5,914 | ||||||
Clorox Co/The | 23,930 | 4,616 | ||||||
Coca-Cola Co/The | 63,107 | 3,326 | ||||||
Coca-Cola European Partners PLC | 49,400 | 2,576 | ||||||
Colgate-Palmolive Co | 33,005 | 2,602 | ||||||
Costco Wholesale Corp | 21,538 | 7,592 | ||||||
General Mills Inc | 5,382 | 330 | ||||||
Hershey Co/The | 33,341 | 5,273 | ||||||
Hormel Foods Corp | 87,010 | 4,157 | ||||||
J M Smucker Co/The | 26,111 | 3,304 | ||||||
Kimberly-Clark Corp | 20,683 | 2,876 | ||||||
Kraft Heinz Co/The | 129,800 | 5,192 | ||||||
Kroger Co/The | 432,009 | 15,548 | ||||||
Lamb Weston Holdings Inc | 28,333 | 2,195 | ||||||
McCormick & Co Inc/MD | 79,237 | 7,065 | ||||||
Metro Inc/CN, Cl A | 58,400 | 2,664 | ||||||
| Description | Shares | Market Value ($ Thousands) | ||||||
COMMON STOCK (continued) | ||||||||
PepsiCo Inc | 56,305 | $ | 7,964 | |||||
Procter & Gamble Co/The | 12,011 | 1,627 | ||||||
Sanderson Farms Inc | 20,200 | 3,147 | ||||||
Tyson Foods Inc, Cl A | 183,000 | 13,597 | ||||||
Walmart Inc | 224,473 | 30,490 | ||||||
| 140,380 | ||||||||
Energy — 0.3% |
| |||||||
Williams Cos Inc/The | 112,473 | 2,665 | ||||||
Financials — 11.5% |
| |||||||
Aflac Inc | 112,800 | 5,773 | ||||||
Allstate Corp/The | 65,446 | 7,520 | ||||||
American Financial Group Inc/OH | 41,500 | 4,735 | ||||||
Assurant Inc | 10,566 | 1,498 | ||||||
Bank of America Corp | 7,089 | 274 | ||||||
Bank of Hawaii Corp | 9,849 | 881 | ||||||
Bank of New York Mellon Corp/The | 72,600 | 3,433 | ||||||
Berkshire Hathaway Inc, Cl B * | 64,800 | 16,555 | ||||||
Cboe Global Markets Inc | 46,588 | 4,598 | ||||||
Chubb Ltd | 12,399 | 1,959 | ||||||
Cullen/Frost Bankers Inc | 10,482 | 1,140 | ||||||
Everest Re Group Ltd | 39,096 | 9,689 | ||||||
Hanover Insurance Group Inc/The, Cl A | 30,133 | 3,901 | ||||||
LPL Financial Holdings Inc | 7,590 | 1,079 | ||||||
MarketAxess Holdings Inc | 5,642 | 2,809 | ||||||
MGIC Investment Corp | 141,647 | 1,962 | ||||||
Morningstar Inc, Cl A | 21,864 | 4,920 | ||||||
National Bank of Canada | 54,700 | 3,716 | ||||||
Progressive Corp/The | 115,800 | 11,072 | ||||||
RenaissanceRe Holdings Ltd | 31,431 | 5,037 | ||||||
TFS Financial Corp | 146,062 | 2,975 | ||||||
Travelers Cos Inc/The | 83,472 | 12,554 | ||||||
US Bancorp | 33,210 | 1,837 | ||||||
White Mountains Insurance Group Ltd | 3,014 | 3,360 | ||||||
| 113,277 | ||||||||
Health Care — 19.7% |
| |||||||
AbbVie Inc | 53,300 | 5,768 | ||||||
ABIOMED Inc * | 9,693 | 3,089 | ||||||
Alexion Pharmaceuticals Inc * | 28,199 | 4,312 | ||||||
AmerisourceBergen Corp, Cl A | 14,727 | 1,739 | ||||||
Amgen Inc, Cl A | 16,800 | 4,180 | ||||||
Anthem Inc | 44,047 | 15,811 | ||||||
AstraZeneca PLC ADR (A) | 93,200 | 4,634 | ||||||
Baxter International Inc | 42,324 | 3,570 | ||||||
Bio-Rad Laboratories Inc, Cl A * | 4,035 | 2,305 | ||||||
Bluebird Bio Inc * | 5,620 | 169 | ||||||
Bristol-Myers Squibb Co | 140,025 | 8,840 | ||||||
Chemed Corp | 1,680 | 773 | ||||||
Covetrus Inc * | 153,890 | 4,612 | ||||||
CVS Health Corp | 31,417 | 2,364 | ||||||
Eli Lilly and Co | 95,629 | 17,865 | ||||||
SEI Institutional Managed Trust / Semi-Annual Report / March 31, 2021 | 1 |
SCHEDULE OF INVESTMENTS (Unaudited)
March 31, 2021
Tax-Managed Managed Volatility Fund (Continued)
| Description | Shares | Market Value ($ Thousands) | ||||||
COMMON STOCK (continued) |
| |||||||
Gilead Sciences Inc | 9,399 | $ | 607 | |||||
Hill-Rom Holdings Inc | 7,580 | 837 | ||||||
Humana Inc | 30,097 | 12,618 | ||||||
Johnson & Johnson | 168,900 | 27,759 | ||||||
McKesson Corp | 8,957 | 1,747 | ||||||
Merck & Co Inc | 247,609 | 19,088 | ||||||
Mettler-Toledo International Inc * | 3,168 | 3,661 | ||||||
Pfizer Inc | 597,905 | 21,662 | ||||||
Premier Inc, Cl A | 34,825 | 1,179 | ||||||
Quest Diagnostics Inc | 50,752 | 6,514 | ||||||
Reata Pharmaceuticals Inc, Cl A * | 6,680 | 666 | ||||||
UnitedHealth Group Inc | 35,650 | 13,264 | ||||||
Viatris Inc, Cl W * | 13,886 | 194 | ||||||
Zoetis Inc, Cl A | 18,364 | 2,892 | ||||||
| 192,719 | ||||||||
Industrials — 9.8% |
| |||||||
Allison Transmission Holdings Inc | 56,275 | 2,298 | ||||||
Carrier Global Corp | 50,700 | 2,140 | ||||||
CH Robinson Worldwide Inc | 33,696 | 3,216 | ||||||
Cummins Inc | 23,200 | 6,011 | ||||||
EMCOR Group Inc | 13,365 | 1,499 | ||||||
General Dynamics Corp | 30,100 | 5,465 | ||||||
L3Harris Technologies Inc | 26,704 | 5,412 | ||||||
Landstar System Inc | 11,414 | 1,884 | ||||||
Lockheed Martin Corp | 23,421 | 8,654 | ||||||
Northrop Grumman Corp | 37,681 | 12,195 | ||||||
Quanta Services Inc | 37,697 | 3,317 | ||||||
Raytheon Technologies Corp | 135,100 | 10,439 | ||||||
Republic Services Inc | 146,100 | 14,515 | ||||||
Schneider National Inc, Cl B | 120,217 | 3,002 | ||||||
Waste Management Inc | 124,467 | 16,059 | ||||||
| 96,106 | ||||||||
Information Technology — 19.5% |
| |||||||
Amdocs Ltd | 227,100 | 15,931 | ||||||
Apple Inc | 303,048 | 37,018 | ||||||
Atlassian Corp PLC, Cl A * | 15,315 | 3,228 | ||||||
Automatic Data Processing Inc | 14,065 | 2,651 | ||||||
Ciena Corp * | 25,083 | 1,373 | ||||||
Cisco Systems Inc/Delaware | 306,400 | 15,844 | ||||||
Citrix Systems Inc | 61,962 | 8,697 | ||||||
CSG Systems International Inc | 37,600 | 1,688 | ||||||
DocuSign Inc, Cl A * | 18,481 | 3,741 | ||||||
F5 Networks Inc, Cl A * | 24,793 | 5,172 | ||||||
Intel Corp | 307,300 | 19,667 | ||||||
Jack Henry & Associates Inc | 10,939 | 1,660 | ||||||
Marvell Technology Group Ltd | 24,484 | 1,199 | ||||||
Microsoft Corp | 85,745 | 20,216 | ||||||
Motorola Solutions Inc | 87,963 | 16,541 | ||||||
NetApp Inc | 46,295 | 3,364 | ||||||
Oracle Corp, Cl B | 176,000 | 12,350 | ||||||
Qorvo Inc * | 29,645 | 5,416 | ||||||
| Description | Shares | Market Value ($ Thousands) | ||||||
COMMON STOCK (continued) |
| |||||||
Seagate Technology PLC | 63,600 | $ | 4,881 | |||||
Synopsys Inc * | 41,600 | 10,308 | ||||||
| 190,945 | ||||||||
Materials — 3.5% |
| |||||||
AptarGroup Inc | 6,262 | 887 | ||||||
Avery Dennison Corp | 31,600 | 5,803 | ||||||
Axalta Coating Systems Ltd * | 79,039 | 2,338 | ||||||
Corteva Inc | 84,619 | 3,945 | ||||||
Newmont Corp | 45,279 | 2,729 | ||||||
Royal Gold Inc, Cl A | 13,377 | 1,440 | ||||||
Sealed Air Corp | 136,300 | 6,245 | ||||||
Silgan Holdings Inc | 110,800 | 4,657 | ||||||
Sonoco Products Co | 98,300 | 6,223 | ||||||
| 34,267 | ||||||||
Real Estate — 0.3% |
| |||||||
Equity LifeStyle Properties Inc ‡ | 29,390 | 1,870 | ||||||
SBA Communications Corp, Cl A ‡ | 4,204 | 1,167 | ||||||
| 3,037 | ||||||||
Utilities — 9.1% |
| |||||||
Ameren Corp | 74,283 | 6,044 | ||||||
American Electric Power Co Inc | 76,728 | 6,499 | ||||||
DTE Energy Co | 38,099 | 5,073 | ||||||
Duke Energy Corp | 41,536 | 4,009 | ||||||
Entergy Corp | 119,200 | 11,857 | ||||||
Eversource Energy | 83,105 | 7,196 | ||||||
Exelon Corp | 158,000 | 6,911 | ||||||
National Fuel Gas Co | 32,081 | 1,604 | ||||||
NextEra Energy Inc | 116,564 | 8,813 | ||||||
Pinnacle West Capital Corp | 48,930 | 3,980 | ||||||
Portland General Electric Co | 73,374 | 3,483 | ||||||
Public Service Enterprise Group Inc | 183,544 | 11,051 | ||||||
Southern Co/The | 83,686 | 5,202 | ||||||
WEC Energy Group Inc | 77,148 | 7,220 | ||||||
| 88,942 | ||||||||
Total Common Stock | 961,487 | |||||||
AFFILIATED PARTNERSHIP — 1.1% |
| |||||||
SEI Liquidity Fund, L.P. | 10,518,498 | 10,521 | ||||||
Total Affiliated Partnership (Cost $10,521) ($ Thousands) | 10,521 | |||||||
| 2 | SEI Institutional Managed Trust / Semi-Annual Report / March 31, 2021 |
SCHEDULE OF INVESTMENTS (Unaudited)
March 31, 2021
Tax-Managed Managed Volatility Fund (Continued)
| Description | Shares | Market Value ($ Thousands) | ||||||
CASH EQUIVALENT — 1.8% |
| |||||||
SEI Daily Income Trust, Government Fund, Cl F | 18,130,278 | $ | 18,130 | |||||
|
|
| ||||||
Total Cash Equivalent | 18,130 | |||||||
|
|
| ||||||
Total Investments in Securities — 101.0% |
| $ | 990,138 | |||||
|
|
| ||||||
A list of the open futures contracts held by the Fund at March 31, 2021, is as follows:
Type of Contract | Number of Contracts Long | Expiration Date | Notional Amount (Thousands) | Value (Thousands) | Unrealized Appreciation (Thousands) | |||||||||||||||
S&P 500 Index E-MINI | 50 | Jun-2021 | $ | 9,913 | $ | 9,919 | $ | 6 | ||||||||||||
|
|
| ||||||||||||||||||
| $ | 9,913 | $ | 9,919 | $ | 6 | |||||||||||||||
|
|
| ||||||||||||||||||
Percentages are based on Net Assets of $980,316 ($ Thousands). |
| * | Non-income producing security. |
| ** | Rate shown is the 7-day effective yield as of March 31, 2021. |
| † | Investment in Affiliated Security (see Note 6). |
| ‡ | Real Estate Investment Trust. |
| (A) | Certain securities or partial positions of certain securities are on loan at March 31, 2021 (see Note 10). The total market value of securities on loan at March 31, 2021 was $10,374 ($ Thousands). |
| (B) | This security was purchased with cash collateral held from securities on loan (see Note 10). The total market value of such securities as of March 31, 2021 was $10,521 ($ Thousands). |
Cl — Class
L.P. — Limited Partnership
Ltd. — Limited
S&P— Standard & Poor’s
The following is a list of the level of inputs used as of March 31, 2021, in valuing the Fund’s investments and other financial instruments carried at value ($ Thousands):
| Investments in Securities | Level 1 ($) | Level 2 ($) | Level 3 ($) | Total ($) | ||||||||||||
Common Stock | 961,487 | – | – | 961,487 | ||||||||||||
Affiliated Partnership | – | 10,521 | – | 10,521 | ||||||||||||
Cash Equivalent | 18,130 | – | – | 18,130 | ||||||||||||
|
|
|
|
|
|
|
|
|
|
|
| |||||
Total Investments in Securities | 979,617 | 10,521 | – | 990,138 | ||||||||||||
|
|
|
|
|
|
|
|
|
|
|
| |||||
| Other Financial Instruments | Level 1 ($) | Level 2 ($) | Level 3 ($) | Total ($) | ||||||||||||
Futures Contracts* | ||||||||||||||||
Unrealized Appreciation | 6 | – | – | 6 | ||||||||||||
|
|
|
|
|
|
|
|
|
|
|
| |||||
Total Other Financial Instruments | 6 | – | – | 6 | ||||||||||||
|
|
|
|
|
|
|
|
|
|
|
| |||||
* Futures contracts are valued at the unrealized appreciation on the instrument.
For the period ended March 31, 2021, there were no transfers in or out of Level 3.
For more information on valuation inputs, see Note 2 – Significant Accounting Policies in Notes to Financial Statements.
The following is a summary of the Fund’s transactions with affiliates for the period ended March 31, 2021 ($ Thousands):
| Security Description | Value 9/30/2020 | Purchases at Cost | Proceeds from Sales | Realized Gain/ (Loss) | Change in Unrealized Appreciation/ (Depreciation) | Value 3/31/2021 | Shares | Income | Capital Gains | |||||||||
SEI Liquidity Fund, L.P. | $ 3,411 | $ 16,662 | $(9,552) | $— | $— | $ 10,521 | 10,518,498 | $2 | $— | |||||||||
SEI Daily Income Trust, Government Fund, Cl F | 14,794 | 115,926 | (112,590) | — | — | 18,130 | 18,130,278 | 1 | — | |||||||||
|
|
|
|
|
|
|
| |||||||||||
Totals | $ 18,205 | $ 132,588 | $(122,142) | $— | $— | $ 28,651 | $3 | $— | ||||||||||
|
|
|
|
|
|
|
|
Amounts designated as “—” are either $0 or have been rounded to $0.
The accompanying notes are an integral part of the financial statements.
SEI Institutional Managed Trust / Semi-Annual Report / March 31, 2021 | 3 |
SCHEDULE OF INVESTMENTS (Unaudited)
March 31, 2021
Tax-Managed International Managed Volatility Fund (Continued)
| Description | Shares | Market Value ($ Thousands) | ||||||
COMMON STOCK — 96.3% |
| |||||||
Australia — 4.2% |
| |||||||
Abacus Property Group ‡ | 87,074 | $ | 186 | |||||
AGL Energy Ltd | 94,185 | 692 | ||||||
Ansell | 27,374 | 818 | ||||||
ASX Ltd | 5,643 | 305 | ||||||
Aurizon Holdings Ltd | 565,871 | 1,681 | ||||||
AusNet Services | 289,189 | 404 | ||||||
Bendigo & Adelaide Bank | 74,373 | 570 | ||||||
Chorus | 31,346 | 151 | ||||||
Coca-Cola Amatil Ltd | 17,108 | 175 | ||||||
Coles Group Ltd | 62,857 | 767 | ||||||
CSL Ltd | 5,661 | 1,141 | ||||||
Fortescue Metals Group Ltd | 12,348 | 188 | ||||||
Harvey Norman Holdings Ltd | 399,926 | 1,745 | ||||||
Inghams Group Ltd | 378,069 | 962 | ||||||
Medibank Pvt | 47,280 | 101 | ||||||
Newcrest Mining Ltd | 22,123 | 412 | ||||||
REA Group Ltd | 3,994 | 431 | ||||||
Rio Tinto Ltd | 9,772 | 824 | ||||||
Sonic Healthcare Ltd | 25,082 | 670 | ||||||
Telstra Corp Ltd, Cl B | 502,620 | 1,302 | ||||||
TPG Telecom | 77,265 | 373 | ||||||
Treasury Wine Estates Ltd | 37,848 | 298 | ||||||
Wesfarmers Ltd | 36,388 | 1,460 | ||||||
Woolworths Group Ltd | 21,286 | 663 | ||||||
| 16,319 | ||||||||
Austria — 1.0% |
| |||||||
CA Immobilien Anlagen AG | 4,737 | 201 | ||||||
Erste Group Bank AG * | 6,526 | 222 | ||||||
EVN AG | 6,728 | 145 | ||||||
Mayr Melnhof Karton | 4,772 | 984 | ||||||
Oesterreichische Post AG (A) | 37,629 | 1,649 | ||||||
S IMMO AG ‡ | 9,548 | 241 | ||||||
Telekom Austria AG, Cl A | 81,520 | 644 | ||||||
| 4,086 | ||||||||
Belgium — 1.6% |
| |||||||
Ageas | 14,061 | 852 | ||||||
Etablissements Franz Colruyt | 62,755 | 3,751 | ||||||
Proximus SADP | 28,087 | 612 | ||||||
UCB SA, Cl A | 11,564 | 1,103 | ||||||
| 6,318 | ||||||||
Canada — 2.3% |
| |||||||
Bank of Nova Scotia/The, Cl C | 8,211 | 514 | ||||||
Canadian Imperial Bank of Commerce (A) | 11,311 | 1,107 | ||||||
Canadian Tire Corp Ltd, Cl A | 16,691 | 2,368 | ||||||
Cogeco Communications | 18,559 | 1,742 | ||||||
Empire Co Ltd, Cl A | 31,361 | 978 | ||||||
Loblaw Cos Ltd | 24,108 | 1,347 | ||||||
TELUS Corp | 43,531 | 867 | ||||||
| 8,923 | ||||||||
Denmark — 2.4% |
| |||||||
Carlsberg A/S, Cl B | 10,243 | 1,577 | ||||||
| Description | Shares | Market Value ($ Thousands) | ||||||
COMMON STOCK (continued) |
| |||||||
Coloplast A/S, Cl B | 10,603 | $ | 1,598 | |||||
Danske Bank A/S | 60,283 | 1,131 | ||||||
Genmab A/S * | 1,487 | 490 | ||||||
Jyske Bank A/S | 16,645 | 796 | ||||||
Novo Nordisk A/S, Cl B | 13,953 | 948 | ||||||
Orsted A/S | 1,184 | 192 | ||||||
Royal Unibrew A/S | 2,426 | 254 | ||||||
RTX | 3,573 | 109 | ||||||
Scandinavian Tobacco Group A/S | 73,722 | 1,418 | ||||||
Solar, Cl B | 3,143 | 238 | ||||||
Sydbank A/S | 22,507 | 608 | ||||||
UIE | 564 | 149 | ||||||
| 9,508 | ||||||||
Finland — 1.4% |
| |||||||
Aspo | 3,559 | 37 | ||||||
Elisa Oyj | 6,082 | 366 | ||||||
Kemira | 47,655 | 733 | ||||||
Kesko Oyj, Cl B | 61,076 | 1,872 | ||||||
Orion Oyj, Cl B | 19,556 | 786 | ||||||
TietoEVRY | 37,802 | 1,174 | ||||||
Tokmanni Group | 12,825 | 301 | ||||||
| 5,269 | ||||||||
France — 8.3% |
| |||||||
ABC arbitrage | 14,654 | 125 | ||||||
BNP Paribas SA | 3,209 | 196 | ||||||
Bonduelle SCA | 4,156 | 105 | ||||||
Caisse Regionale de Credit Agricole Mutuel Brie Picardie | 4,916 | 132 | ||||||
Caisse Regionale de Credit Agricole Mutuel Nord de France | 3,948 | 106 | ||||||
Carrefour SA | 215,049 | 3,904 | ||||||
Cie Generale des Etablissements Michelin SCA | 17,959 | 2,694 | ||||||
Credit Agricole | 22,471 | 326 | ||||||
Danone SA | 3,206 | 220 | ||||||
Dassault Systemes SE | 1,080 | 231 | ||||||
Engie SA | 74,008 | 1,053 | ||||||
Eurofins Scientific | 1,135 | 109 | ||||||
Eutelsat Communications SA | 63,660 | 777 | ||||||
Faurecia SE | 162 | 9 | ||||||
Hermes International | 1,456 | 1,615 | ||||||
Iliad SA | 1,741 | 332 | ||||||
Lagardere SCA | 3,725 | 98 | ||||||
LNA Sante SA | 2,819 | 152 | ||||||
L’Oreal SA | 2,549 | 979 | ||||||
Metropole Television SA | 56,336 | 1,206 | ||||||
Orange SA | 385,969 | 4,765 | ||||||
Pernod Ricard SA | 6,112 | 1,150 | ||||||
Prodware | 6,476 | 46 | ||||||
PSB Industries SA | 1,729 | 61 | ||||||
Publicis Groupe SA | 1,746 | 107 | ||||||
Sanofi | 66,653 | 6,600 | ||||||
SEI Institutional Managed Trust / Semi-Annual Report / March 31, 2021 | 1 |
SCHEDULE OF INVESTMENTS (Unaudited)
March 31, 2021
Tax-Managed International Managed Volatility Fund (Continued)
| Description | Shares | Market Value ($ Thousands) | ||||||
COMMON STOCK (continued) |
| |||||||
Sartorius Stedim Biotech | 1,058 | $ | 437 | |||||
SCOR SE | 4,791 | 164 | ||||||
SEB SA | 2,409 | 426 | ||||||
Societe BIC SA | 25,656 | 1,505 | ||||||
Societe LDC | 865 | 100 | ||||||
Stellantis * | 9,533 | 169 | ||||||
Suez | 20,846 | 442 | ||||||
Veolia Environnement SA | 22,400 | 575 | ||||||
Virbac * | 506 | 131 | ||||||
Vivendi SA | 33,794 | 1,112 | ||||||
| 32,159 | ||||||||
Germany — 5.9% |
| |||||||
adidas AG | 1,047 | 328 | ||||||
Deutsche Post AG | 39,181 | 2,152 | ||||||
Deutsche Telekom AG | 184,690 | 3,727 | ||||||
Freenet AG | 69,630 | 1,670 | ||||||
Fresenius Medical Care AG & Co KGaA | 7,389 | 545 | ||||||
Hannover Rueck SE | 1,509 | 276 | ||||||
Henkel AG & Co KGaA | 8,576 | 851 | ||||||
Hornbach Holding AG & Co KGaA | 11,755 | 1,150 | ||||||
Knorr-Bremse AG | 9,277 | 1,160 | ||||||
Merck KGaA | 24,835 | 4,256 | ||||||
METRO AG | 16,068 | 170 | ||||||
Muenchener Rueckversicherungs- Gesellschaft AG in Muenchen | 5,603 | 1,729 | ||||||
SAP SE | 1,022 | 126 | ||||||
Scout24 | 8,855 | 673 | ||||||
Siemens Healthineers AG | 6,608 | 359 | ||||||
Sirius Real Estate Ltd ‡ | 87,389 | 107 | ||||||
Talanx | 3,767 | 160 | ||||||
Telefonica Deutschland Holding AG | 366,634 | 1,077 | ||||||
Uniper SE | 52,457 | 1,904 | ||||||
Vonovia SE ‡ | 5,398 | 353 | ||||||
| 22,773 | ||||||||
Hong Kong — 4.4% |
| |||||||
BOC Hong Kong Holdings Ltd | 207,500 | 725 | ||||||
China Motor Bus Co Ltd ‡ | 9,200 | 118 | ||||||
CK Hutchison Holdings Ltd | 154,500 | 1,231 | ||||||
CK Infrastructure Holdings Ltd | 94,000 | 559 | ||||||
CLP Holdings Ltd, Cl B | 240,500 | 2,336 | ||||||
Dah Sing Banking Group Ltd | 424,000 | 480 | ||||||
HK Electric Investments & HK Electric Investments Ltd | 1,615,500 | 1,604 | ||||||
HKT Trust & HKT Ltd | 1,455,000 | 2,074 | ||||||
Hutchison Telecommunications Hong Kong Holdings | 2,456,000 | 468 | ||||||
Kerry Properties Ltd ‡ | 282,500 | 910 | ||||||
Lee & Man Paper Manufacturing Ltd | 697,000 | 641 | ||||||
MTR Corp Ltd | 74,500 | 422 | ||||||
Orange Sky Golden Harvest Entertainment Holdings * | 1,240,000 | 19 | ||||||
Pacific Textiles Holdings | 822,000 | 527 | ||||||
| Description | Shares | Market Value ($ Thousands) | ||||||
COMMON STOCK (continued) |
| |||||||
Paliburg Holdings Ltd | 398,000 | $ | 108 | |||||
PCCW Ltd | 1,042,704 | 587 | ||||||
Power Assets Holdings Ltd | 186,500 | 1,101 | ||||||
SmarTone Telecommunications Holdings | 515,500 | 300 | ||||||
VTech Holdings Ltd | 289,200 | 2,604 | ||||||
WH Group Ltd | 159,500 | 129 | ||||||
| 16,943 | ||||||||
Ireland — 0.3% |
| |||||||
ICON PLC * | 3,420 | 672 | ||||||
Kerry Group PLC, Cl A | 4,704 | 590 | ||||||
Total Produce PLC | 17,637 | 41 | ||||||
| 1,303 | ||||||||
Israel — 0.6% |
| |||||||
Albaad Massuot Yitzhak | 8,411 | 186 | ||||||
Bank Leumi Le-Israel BM * | 56,853 | 375 | ||||||
Elbit Systems Ltd | 1,432 | 203 | ||||||
Isracard Ltd * | – | – | ||||||
Kerur Holdings Ltd | 4,093 | 121 | ||||||
Mizrahi Tefahot Bank Ltd * | 12,013 | 314 | ||||||
Nice Ltd * | 3,697 | 800 | ||||||
Shufersal Ltd | 26,493 | 218 | ||||||
| 2,217 | ||||||||
Italy — 2.1% |
| |||||||
A2A SpA | 695,413 | 1,268 | ||||||
ACEA | 54,526 | 1,195 | ||||||
Assicurazioni Generali SpA | 16,518 | 331 | ||||||
Enel SpA | 205,432 | 2,051 | ||||||
Hera SpA | 309,958 | 1,190 | ||||||
Iren SpA | 38,535 | 107 | ||||||
Terna Rete Elettrica Nazionale SpA | 41,284 | 312 | ||||||
UnipolSai Assicurazioni (A) | 589,309 | 1,776 | ||||||
| 8,230 | ||||||||
Japan — 27.4% |
| |||||||
Communication Services — 4.0% |
| |||||||
Kakaku.com Inc | 2,800 | 77 | ||||||
KDDI Corp | 169,900 | 5,220 | ||||||
Nexon Co Ltd | 6,400 | 208 | ||||||
Nintendo Co Ltd | 1,600 | 895 | ||||||
Nippon Telegraph & Telephone Corp | 235,200 | 6,049 | ||||||
Nippon Television Holdings | 79,100 | 1,041 | ||||||
Okinawa Cellular Telephone Co | 3,100 | 143 | ||||||
Proto Corp | 12,200 | 129 | ||||||
Softbank Corp | 162,500 | 2,115 | ||||||
| 15,877 | ||||||||
Consumer Discretionary — 3.6% |
| |||||||
Bandai Namco Holdings Inc | 3,700 | 264 | ||||||
Bridgestone | 32,900 | 1,332 | ||||||
Choushimaru Co Ltd | 10,500 | 118 | ||||||
DCM Holdings Co Ltd | 162,800 | 1,706 | ||||||
EDION Corp (A) | 85,400 | 958 | ||||||
FJ Next Co Ltd (A) | 16,100 | 163 | ||||||
Hard Off | 12,300 | 93 | ||||||
| 2 | SEI Institutional Managed Trust / Semi-Annual Report / March 31, 2021 |
SCHEDULE OF INVESTMENTS (Unaudited)
March 31, 2021
Tax-Managed International Managed Volatility Fund (Continued)
| Description | Shares | Market Value ($ Thousands) | ||||||
COMMON STOCK (continued) |
| |||||||
Honda Motor Co Ltd | 23,500 | $ | 706 | |||||
Keiyo Co Ltd | 47,600 | 316 | ||||||
Kohnan Shoji Co Ltd | 6,000 | 173 | ||||||
Komeri Co Ltd | 10,100 | 282 | ||||||
K’s Holdings Corp | 7,500 | 103 | ||||||
McDonald’s Holdings Co Japan Ltd | 32,100 | 1,482 | ||||||
Mizuno | 6,300 | 124 | ||||||
Ootoya Holdings Co Ltd | 100 | 2 | ||||||
Rinnai | 1,800 | 202 | ||||||
Sankyo Co Ltd | 19,600 | 520 | ||||||
Sekisui House | 52,600 | 1,130 | ||||||
Shimamura Co Ltd | 3,200 | 370 | ||||||
SPK Corp | 9,000 | 105 | ||||||
Takihyo | 3,000 | 51 | ||||||
Toyota Motor Corp | 29,000 | 2,261 | ||||||
Yamada Denki Co Ltd | 293,400 | 1,585 | ||||||
Yellow Hat Ltd | 11,200 | 192 | ||||||
| 14,238 | ||||||||
Consumer Staples — 5.2% |
| |||||||
Aeon Co Ltd, Cl H | 11,200 | 334 | ||||||
Ain Holdings | 1,800 | 116 | ||||||
Arcs Co Ltd | 55,300 | 1,197 | ||||||
Chuo Gyorui | 4,200 | 112 | ||||||
Cosmos Pharmaceutical Corp | 900 | 141 | ||||||
Dairei | 6,300 | 110 | ||||||
Earth | 9,300 | 561 | ||||||
Fuji Nihon Seito | 10,600 | 54 | ||||||
Heiwado | 10,900 | 221 | ||||||
Itoham Yonekyu Holdings | 15,100 | 100 | ||||||
Japan Tobacco Inc | 86,400 | 1,662 | ||||||
Kadoya Sesame Mills Inc | 2,600 | 99 | ||||||
Kato Sangyo Co Ltd | 8,700 | 281 | ||||||
Kobayashi Pharmaceutical | 2,700 | 252 | ||||||
Kyokuyo Co Ltd | 3,800 | 105 | ||||||
Lawson Inc | 11,900 | 585 | ||||||
Life Corp | 2,500 | 76 | ||||||
Lion Corp | 39,100 | 764 | ||||||
Matsumotokiyoshi Holdings Co Ltd | 2,900 | 129 | ||||||
MEIJI Holdings Co Ltd | 13,800 | 889 | ||||||
Ministop Co Ltd | 7,200 | 95 | ||||||
Mitsubishi Shokuhin Co Ltd | 37,300 | 1,045 | ||||||
Miyoshi Oil & Fat Co Ltd | 10,200 | 120 | ||||||
Morishita Jintan Co Ltd | 5,400 | 98 | ||||||
Nippn | 57,000 | 855 | ||||||
Nisshin Oillio Group Ltd/The | 34,800 | 1,028 | ||||||
Nissin Foods Holdings Co Ltd | 3,900 | 290 | ||||||
Nitto Fuji Flour Milling Co Ltd | 4,000 | 276 | ||||||
OUG Holdings Inc | 4,800 | 129 | ||||||
Pola Orbis Holdings Inc | 18,800 | 453 | ||||||
San-A Co Ltd, Cl A | 2,500 | 104 | ||||||
Seven & i Holdings Co Ltd | 59,100 | 2,387 | ||||||
Showa Sangyo Co Ltd | 5,900 | 166 | ||||||
| Description | Shares | Market Value ($ Thousands) | ||||||
COMMON STOCK (continued) |
| |||||||
Sugi Holdings Co Ltd | 7,900 | $ | 627 | |||||
Sundrug Co Ltd | 23,000 | 843 | ||||||
Toyo Suisan Kaisha Ltd | 37,500 | 1,578 | ||||||
Tsuruha Holdings Inc | 6,800 | 879 | ||||||
Unicharm Corp | 22,500 | 946 | ||||||
United Super Markets Holdings Inc | 21,600 | 228 | ||||||
Valor Holdings Co Ltd | 37,400 | 842 | ||||||
Welcia Holdings Co Ltd | 5,500 | 189 | ||||||
Yamazaki Baking Co Ltd | 6,200 | 100 | ||||||
Yaoko Co Ltd | 5,400 | 332 | ||||||
Yuasa Funashoku Co Ltd | 4,560 | 124 | ||||||
| 21,522 | ||||||||
Energy — 0.8% |
| |||||||
Itochu Enex Co Ltd | 68,900 | 681 | ||||||
Iwatani | 16,500 | 1,020 | ||||||
JXTG Holdings Inc | 251,700 | 1,143 | ||||||
| 2,844 | ||||||||
Financials — 2.9% |
| |||||||
Aozora Bank Ltd | 37,600 | 862 | ||||||
Japan Post Bank Co Ltd (A) | 69,500 | 669 | ||||||
Japan Post Holdings Co Ltd | 220,100 | 1,965 | ||||||
Mizuho Financial Group Inc | 146,980 | 2,127 | ||||||
Nomura Holdings | 256,800 | 1,351 | ||||||
ORIX | 60,100 | 1,016 | ||||||
Resona Holdings | 92,800 | 390 | ||||||
Sumitomo Mitsui Financial Group Inc | 46,500 | 1,686 | ||||||
Yamaguchi Financial Group | 99,700 | 664 | ||||||
| 10,730 | ||||||||
Health Care — 2.7% |
| |||||||
Astellas Pharma Inc | 135,200 | 2,082 | ||||||
Biofermin Pharmaceutical | 3,900 | 101 | ||||||
Chugai Pharmaceutical Co Ltd | 2,600 | 106 | ||||||
Daiichi Sankyo Co Ltd | 7,500 | 219 | ||||||
Hoya Corp | 1,500 | 177 | ||||||
Kaken Pharmaceutical Co Ltd (A) | 27,100 | 1,063 | ||||||
KYORIN Holdings Inc | 22,500 | 393 | ||||||
M3 Inc | 800 | 55 | ||||||
Medipal Holdings Corp | 53,000 | 1,019 | ||||||
Mochida Pharmaceutical Co Ltd | 5,300 | 206 | ||||||
Ono Pharmaceutical Co Ltd | 12,100 | 316 | ||||||
Otsuka Holdings Co Ltd | 17,100 | 725 | ||||||
Sawai Pharmaceutical | 6,100 | 296 | ||||||
Shionogi & Co Ltd | 11,400 | 614 | ||||||
Suzuken Co Ltd/Aichi Japan | 7,800 | 305 | ||||||
Techno Medica | 7,000 | 105 | ||||||
Toho Holdings Co Ltd | 55,000 | 1,010 | ||||||
Towa Pharmaceutical | 15,400 | 340 | ||||||
ZERIA Pharmaceutical | 11,800 | 225 | ||||||
| 9,357 | ||||||||
SEI Institutional Managed Trust / Semi-Annual Report / March 31, 2021 | 3 |
SCHEDULE OF INVESTMENTS (Unaudited)
March 31, 2021
Tax-Managed International Managed Volatility Fund (Continued)
| Description | Shares | Market Value ($ Thousands) | ||||||
COMMON STOCK (continued) |
| |||||||
Industrials — 3.7% |
| |||||||
Alps Logistics (A) | 12,400 | $ | 106 | |||||
COMSYS Holdings Corp | 6,300 | 194 | ||||||
Daiichi Kensetsu | 8,500 | 149 | ||||||
Inaba Denki Sangyo Co Ltd | 50,800 | 1,227 | ||||||
ITOCHU Corp (A) | 124,300 | 4,035 | ||||||
Kamigumi Co Ltd | 124,600 | 2,365 | ||||||
Kinden Corp | 69,800 | 1,191 | ||||||
Kyowa Exeo Corp | 8,300 | 219 | ||||||
Mitsubishi Electric | 38,900 | 594 | ||||||
Mitsui & Co Ltd | 13,000 | 271 | ||||||
Nippo Corp | 57,200 | 1,563 | ||||||
Nippon Express Co Ltd | 1,300 | 97 | ||||||
Nippon Kanzai Co Ltd | 5,500 | 109 | ||||||
Sankyu (A) | 20,000 | 880 | ||||||
Seino Holdings | 78,600 | 1,097 | ||||||
Shibusawa Warehouse Co Ltd/The | 7,200 | 147 | ||||||
Shin-Keisei Electric Railway Co Ltd | 4,800 | 97 | ||||||
Yasuda Logistics Corp | 19,800 | 174 | ||||||
Zaoh | 8,700 | 112 | ||||||
| 14,627 | ||||||||
Information Technology — 1.7% |
| |||||||
Canon Inc | 99,700 | 2,258 | ||||||
FUJIFILM Holdings Corp | 36,000 | 2,141 | ||||||
Fujitsu Ltd | 5,200 | 753 | ||||||
Kyocera Corp | 4,000 | 254 | ||||||
Oracle Corp Japan | 700 | 68 | ||||||
Otsuka Corp | 9,100 | 427 | ||||||
Trend Micro Inc/Japan | 4,000 | 201 | ||||||
| 6,102 | ||||||||
Materials — 1.9% |
| |||||||
Daicel Corp | 85,400 | 659 | ||||||
Daiki Aluminium Industry Co Ltd | 26,000 | 252 | ||||||
EMS-Chemie Holding AG | 1,134 | 1,017 | ||||||
Kaneka Corp | 20,500 | 844 | ||||||
Kurimoto Ltd | 7,200 | 114 | ||||||
Lintec | 38,200 | 866 | ||||||
Rengo | 107,600 | 936 | ||||||
Sumitomo Osaka Cement Co Ltd | 22,300 | 711 | ||||||
Teijin Ltd | 106,200 | 1,833 | ||||||
| 7,232 | ||||||||
Real Estate — 0.7% |
| |||||||
AEON REIT Investment ‡ | 755 | 1,018 | ||||||
Daito Trust Construction Co Ltd | 10,700 | 1,242 | ||||||
Keihanshin Building Co Ltd ‡ | 14,200 | 191 | ||||||
| 2,451 | ||||||||
Utilities — 0.2% |
| |||||||
Chugoku Electric Power Co Inc/The | 8,300 | 102 | ||||||
Hokkaido Gas Co Ltd | 9,800 | 142 | ||||||
Kyushu Electric Power Co Inc | 12,300 | 122 | ||||||
| Description | Shares | Market Value ($ Thousands) | ||||||
COMMON STOCK (continued) |
| |||||||
Okinawa Electric Power Co Inc/The | 11,851 | $ | 166 | |||||
Tokyo Electric Power Co Holdings Inc * | 38,800 | 130 | ||||||
Tokyo Gas Co Ltd | 36,800 | 820 | ||||||
| 1,482 | ||||||||
| 106,462 | ||||||||
Netherlands — 2.9% |
| |||||||
ABN AMRO Bank NV | 11,695 | 142 | ||||||
Amsterdam Commodities NV | 9,992 | 251 | ||||||
Heineken NV | 7,311 | 753 | ||||||
Koninklijke Ahold Delhaize NV | 203,347 | 5,676 | ||||||
Koninklijke KPN NV | 185,686 | 632 | ||||||
NN Group NV | 57,352 | 2,810 | ||||||
Signify NV | 16,444 | 849 | ||||||
| 11,113 | ||||||||
New Zealand — 0.9% |
| |||||||
Chorus Ltd | 57,800 | 287 | ||||||
Contact Energy Ltd | 77,203 | 379 | ||||||
EBOS Group Ltd | 5,627 | 116 | ||||||
Fisher & Paykel Healthcare Corp Ltd | 72,119 | 1,621 | ||||||
Goodman Property Trust ‡ | 149,541 | 237 | ||||||
Mercury NZ Ltd | 109,078 | 497 | ||||||
Meridian Energy | 35,190 | 133 | ||||||
Spark New Zealand Ltd | 98,605 | 309 | ||||||
| 3,579 | ||||||||
Norway — 1.0% |
| |||||||
Austevoll Seafood ASA | 41,885 | 508 | ||||||
DNB ASA, Cl A | 22,448 | 478 | ||||||
Norsk Hydro ASA | 88,515 | 568 | ||||||
Orkla ASA | 117,934 | 1,158 | ||||||
SpareBank 1 SR-Bank | 17,208 | 212 | ||||||
Telenet Group Holding NV | 13,557 | 551 | ||||||
Telenor ASA | 32,284 | 569 | ||||||
| 4,044 | ||||||||
Portugal — 0.6% |
| |||||||
Jeronimo Martins SGPS SA | 86,576 | 1,460 | ||||||
REN - Redes Energeticas Nacionais SGPS SA | 86,292 | 241 | ||||||
Sonae SGPS | 572,432 | 524 | ||||||
| 2,225 | ||||||||
Singapore — 2.6% |
| |||||||
Ascott Residence Trust ‡ | 174,874 | 139 | ||||||
Dairy Farm International Holdings Ltd | 28,300 | 122 | ||||||
DBS Group Holdings Ltd | 125,500 | 2,689 | ||||||
Haw Par | 32,100 | 314 | ||||||
Mapletree Industrial Trust ‡ | 57,000 | 116 | ||||||
Mapletree Logistics Trust ‡ | 154,270 | 222 | ||||||
Olam International Ltd | 102,300 | 131 | ||||||
Oversea-Chinese Banking Corp Ltd | 112,800 | 986 | ||||||
Sheng Siong Group Ltd | 332,000 | 381 | ||||||
Singapore Exchange Ltd | 116,100 | 861 | ||||||
Singapore Telecommunications Ltd | 569,700 | 1,035 | ||||||
Straits Trading | 74,500 | 157 | ||||||
United Overseas Bank Ltd | 48,300 | 929 | ||||||
| 4 | SEI Institutional Managed Trust / Semi-Annual Report / March 31, 2021 |
SCHEDULE OF INVESTMENTS (Unaudited)
March 31, 2021
Tax-Managed International Managed Volatility Fund (Continued)
| Description | Shares | Market Value ($ Thousands) | ||||||
COMMON STOCK (continued) |
| |||||||
Venture Corp Ltd | 25,600 | $ | 382 | |||||
Wilmar International Ltd | 428,200 | 1,727 | ||||||
| 10,191 | ||||||||
Spain — 3.1% |
| |||||||
Cia de Distribucion Integral Logista Holdings | 81,284 | 1,614 | ||||||
Ebro Foods SA | 81,901 | 1,692 | ||||||
Endesa SA | 126,770 | 3,361 | ||||||
Faes Farma | 147,979 | 636 | ||||||
Grifols SA | 7,375 | 194 | ||||||
Iberdrola SA | 274,135 | 3,539 | ||||||
Red Electrica Corp SA | 51,654 | 917 | ||||||
| 11,953 | ||||||||
Sweden — 2.6% |
| |||||||
Axfood AB (A) | 54,195 | 1,298 | ||||||
Epiroc AB, Cl B | 14,793 | 309 | ||||||
Essity AB, Cl B | 31,156 | 986 | ||||||
ICA Gruppen AB | 52,686 | 2,581 | ||||||
KNOW IT AB | 7,589 | 237 | ||||||
Nordea Bank Abp * | 92,155 | 909 | ||||||
Nyfosa ‡ | 18,745 | 193 | ||||||
Resurs Holding AB | 51,659 | 283 | ||||||
Samhallsbyggnadsbolaget i Norden ‡(A) | 93,792 | 292 | ||||||
Svenska Cellulosa AB SCA, Cl B | 11,438 | 203 | ||||||
Swedish Match AB | 23,377 | 1,829 | ||||||
Telefonaktiebolaget LM Ericsson, Cl B | 73,289 | 972 | ||||||
| 10,092 | ||||||||
Switzerland — 8.0% |
| |||||||
Alcon Inc | 3,374 | 237 | ||||||
Allreal Holding AG, Cl A ‡ | 1,305 | 264 | ||||||
ALSO Holding AG | 606 | 175 | ||||||
Baloise Holding AG | 6,068 | 1,037 | ||||||
Banque Cantonale Vaudoise | 1,350 | 132 | ||||||
Barry Callebaut AG | 129 | 293 | ||||||
Basellandschaftliche Kantonalbank | 306 | 300 | ||||||
Berner Kantonalbank AG | 473 | 107 | ||||||
BKW AG | 22,015 | 2,405 | ||||||
Chocoladefabriken Lindt & Spruengli AG | 80 | 951 | ||||||
dormakaba Holding | 1,518 | 1,041 | ||||||
Emmi | 493 | 500 | ||||||
Forbo Holding | 82 | 149 | ||||||
Idorsia Ltd * | 3,040 | 82 | ||||||
Intershop Holding AG ‡ | 203 | 135 | ||||||
Kuehne + Nagel International AG | 410 | 118 | ||||||
Logitech International SA | 834 | 88 | ||||||
Nestle SA | 10,269 | 1,149 | ||||||
Novartis AG | 32,351 | 2,776 | ||||||
Orior AG | 2,667 | 236 | ||||||
PSP Swiss Property AG ‡ | 3,835 | 469 | ||||||
Roche Holding AG | 25,339 | 8,224 | ||||||
Romande Energie Holding SA | 76 | 99 | ||||||
Schindler Holding AG | 2,723 | 803 | ||||||
| Description | Shares | Market Value ($ Thousands) | ||||||
COMMON STOCK (continued) |
| |||||||
Sika AG | 2,966 | $ | 851 | |||||
Sonova Holding AG | 3,097 | 824 | ||||||
Swiss Life Holding AG | �� | 4,709 | 2,325 | |||||
Swiss Prime Site AG ‡ | 7,577 | 702 | ||||||
Swisscom AG | 6,006 | 3,236 | ||||||
Thurgauer Kantonalbank | 927 | 104 | ||||||
TX Group AG | 1,296 | 104 | ||||||
Valiant Holding AG | 6,470 | 676 | ||||||
Zurich Insurance Group AG | 926 | 397 | ||||||
| 30,989 | ||||||||
United Kingdom — 11.8% |
| |||||||
3i Group | 26,140 | 416 | ||||||
Anglo American PLC | 11,596 | 455 | ||||||
Associated British Foods PLC | 28,785 | 959 | ||||||
AstraZeneca PLC | 8,511 | 851 | ||||||
Atalaya Mining * | 70,542 | 302 | ||||||
Auto Trader Group PLC | 82,006 | 627 | ||||||
B&M European Value Retail | 113,051 | 823 | ||||||
BAE Systems PLC | 342,600 | 2,387 | ||||||
Berkeley Group Holdings PLC | 7,815 | 479 | ||||||
BHP Group | 25,291 | 731 | ||||||
British American Tobacco PLC | 52,707 | 2,017 | ||||||
Britvic PLC | 17,747 | 205 | ||||||
BT Group PLC, Cl A | 789,651 | 1,686 | ||||||
Bunzl PLC | 49,731 | 1,594 | ||||||
CareTech Holdings | 22,562 | 167 | ||||||
Coca-Cola HBC AG | 3,561 | 114 | ||||||
Computacenter PLC | 3,837 | 125 | ||||||
Craneware PLC | 4,479 | 133 | ||||||
Cranswick PLC | 2,824 | 142 | ||||||
Diageo PLC | 12,148 | 501 | ||||||
Direct Line Insurance Group | 330,070 | 1,427 | ||||||
Duke Royalty | 381,565 | 201 | ||||||
Eco Animal Health Group | 32,806 | 146 | ||||||
Finsbury Food Group PLC | 134,390 | 146 | ||||||
Genus | 13,420 | 900 | ||||||
GlaxoSmithKline PLC | 256,871 | 4,565 | ||||||
Hikma Pharmaceuticals PLC | 6,241 | 196 | ||||||
Imperial Brands PLC | 127,933 | 2,633 | ||||||
Inchcape PLC | 78,299 | 813 | ||||||
Intertek Group PLC | 16,464 | 1,273 | ||||||
J Sainsbury PLC | 596,752 | 1,997 | ||||||
Kingfisher PLC | 610,073 | 2,679 | ||||||
National Grid PLC | 131,657 | 1,569 | ||||||
QinetiQ Group PLC | 414,692 | 1,808 | ||||||
Rio Tinto PLC | 6,955 | 533 | ||||||
ScS Group | 48,694 | 161 | ||||||
SSE PLC | 8,061 | 162 | ||||||
Tate & Lyle PLC | 333,398 | 3,529 | ||||||
Telecom Plus PLC | 7,893 | 138 | ||||||
Tesco | 710,347 | 2,243 | ||||||
Total Produce | 61,978 | 150 | ||||||
SEI Institutional Managed Trust / Semi-Annual Report / March 31, 2021 | 5 |
SCHEDULE OF INVESTMENTS (Unaudited)
March 31, 2021
Tax-Managed International Managed Volatility Fund (Continued)
| Description | Shares | Market Value ($ Thousands) | ||||||
COMMON STOCK (continued) |
| |||||||
Unilever PLC | 14,750 | $ | 825 | |||||
Vodafone Group PLC | 355,015 | 646 | ||||||
Warehouse Reit PLC ‡ | 84,224 | 146 | ||||||
Wm Morrison Supermarkets PLC | 792,496 | 1,995 | ||||||
YouGov | 14,322 | 198 | ||||||
| 45,793 | ||||||||
United States — 0.9% |
| |||||||
Atlantica Sustainable Infrastructure | 3,060 | 112 | ||||||
Check Point Software Technologies Ltd * | 12,229 | 1,369 | ||||||
Nomad Foods * | 36,922 | 1,014 | ||||||
QIAGEN NV * | 5,448 | 265 | ||||||
Radware Ltd * | 16,157 | 422 | ||||||
Taro Pharmaceutical Industries Ltd * | 4,059 | 299 | ||||||
| 3,481 | ||||||||
Total Common Stock | 373,970 | |||||||
PREFERRED STOCK — 0.7% |
| |||||||
Germany — 0.7% |
| |||||||
FUCHS PETROLUB SE (B) | 19,169 | 920 | ||||||
Henkel AG & Co KGaA (B) | 17,310 | 1,950 | ||||||
Total Preferred Stock | 2,870 | |||||||
AFFILIATED PARTNERSHIP — 3.1% |
| |||||||
SEI Liquidity Fund, L.P. | 11,864,892 | 11,868 | ||||||
Total Affiliated Partnership | 11,868 | |||||||
CASH EQUIVALENT — 1.5% |
| |||||||
SEI Daily Income Trust, Government Fund, Cl F | 5,660,617 | 5,661 | ||||||
Total Cash Equivalent | 5,661 | |||||||
Total Investments in Securities — 101.6% |
| $ | 394,369 | |||||
| 6 | SEI Institutional Managed Trust / Semi-Annual Report / March 31, 2021 |
SCHEDULE OF INVESTMENTS (Unaudited)
March 31, 2021
Tax-Managed International Managed Volatility Fund (Continued)
A list of the open futures contracts held by the Fund at March 31, 2021, is as follows:
| Type of Contract | Number of Contracts Long | Expiration Date | Notional Amount (Thousands) | Value (Thousands) | Unrealized Appreciation (Thousands) | |||||||||||||||
Euro STOXX 50 | 36 | Jun-2021 | $ | 1,621 | $ | 1,636 | $ | 36 | ||||||||||||
FTSE 100 Index | 5 | Jun-2021 | 463 | 461 | – | |||||||||||||||
Hang Seng Index | 3 | May-2021 | 545 | 546 | 2 | |||||||||||||||
SPI 200 Index | 3 | Jun-2021 | 388 | 386 | 3 | |||||||||||||||
TOPIX Index | 6 | Jun-2021 | 1,073 | 1,061 | 4 | |||||||||||||||
|
|
|
|
|
|
|
|
| ||||||||||||
| $ | 4,090 | $ | 4,090 | $ | 45 | |||||||||||||||
|
|
|
|
|
|
|
|
| ||||||||||||
Percentages are based on Net Assets of $388,342 ($ Thousands).
| * | Non-income producing security. |
| ** | Rate shown is the 7-day effective yield as of March 31, 2021. |
| ‡ | Real Estate Investment Trust. |
| † | Investment in Affiliated Security (see Note 6). |
| (A) | Certain securities or partial positions of certain securities are on loan at March 31, 2021 (see Note 10). The total market value of securities on loan at March 31, 2021 was $11,208 ($ Thousands). |
| (B) | There is currently no rate available. |
| (C) | This security was purchased with cash collateral held from securities on loan (see Note 10). The total market value of such securities as of March 31, 2021 was $11,868 ($ Thousands). |
Cl — Class
FTSE— Financial Times and Stock Exchange
L.P. — Limited Partnership
PLC — Public Limited Company
SPI — Share Price Index
TOPIX — Tokyo Price Index
The following is a list of the level of inputs used as of March 31, 2021, in valuing the Fund’s investments and other financial instruments carried at value ($ Thousands):
| Investments in Securities | Level 1 ($) | Level 2 ($) | Level 3 ($) | Total ($) | ||||||||||||
Common Stock | 373,970 | – | – | 373,970 | ||||||||||||
Preferred Stock | 2,870 | – | – | 2,870 | ||||||||||||
Affiliated Partnership | – | 11,868 | – | 11,868 | ||||||||||||
Cash Equivalent | 5,661 | – | – | 5,661 | ||||||||||||
|
|
|
|
|
|
|
|
|
|
|
| |||||
Total Investments in Securities | 382,501 | 11,868 | – | 394,369 | ||||||||||||
|
|
|
|
|
|
|
|
|
|
|
| |||||
| Other Financial Instruments | Level 1 ($) | Level 2 ($) | Level 3 ($) | Total ($) | ||||||||||||
Futures Contracts * | ||||||||||||||||
Unrealized Appreciation | 45 | — | — | 45 | ||||||||||||
|
|
|
|
|
|
|
|
|
|
|
| |||||
Total Other Financial Instruments | 45 | — | — | 45 | ||||||||||||
|
|
|
|
|
|
|
|
|
|
|
| |||||
* Futures contracts are valued at the unrealized appreciation on the instrument.
For the period ended March 31, 2021, there were no transfers in or out of Level 3.
For more information on valuation inputs, see Note 2 – Significant Accounting Policies in Notes to Financial Statements.
The following is a summary of the Fund’s transactions with affiliates for the period ended March 31, 2021 ($ Thousands):
| Security Description | Value 9/30/2020 | Purchases at Cost | Proceeds from Sales | Realized Gain/ (Loss) | Change in Unrealized Appreciation/ (Depreciation) | Value 3/31/2021 | Shares | Income | Capital Gains | |||||||||
SEI Liquidity Fund, L.P. | $8,302 | $35,716 | $(32,151) | $(1) | $2 | $ 11,868 | 11,864,892 | $43 | $— | |||||||||
SEI Daily Income Trust, Government Fund, Cl F | 2,764 | 22,387 | (19,490) | — | — | 5,661 | 5,660,617 | — | — | |||||||||
|
|
|
|
|
|
|
| |||||||||||
Totals | $11,066 | $58,103 | $(51,641) | $(1) | $2 | $ 17,529 | $43 | $— | ||||||||||
|
|
|
|
|
|
|
|
Amounts designated as “—” are either $0 or have been rounded to $0.
The accompanying notes are an integral part of the financial statements.
SEI Institutional Managed Trust / Semi-Annual Report / March 31, 2021 | 7 |
CONSOLIDATED SCHEDULE OF INVESTMENTS (Unaudited)
March 31, 2021
Dynamic Asset Allocation Fund (Continued)
| Description | Shares | Market Value ($ Thousands) | ||||||
COMMON STOCK — 87.0% | ||||||||
Communication Services — 9.8% | ||||||||
Activision Blizzard Inc | 17,200 | $ | 1,599 | |||||
Alphabet Inc, Cl A * | 6,710 | 13,839 | ||||||
Alphabet Inc, Cl C * | 6,383 | 13,204 | ||||||
AT&T Inc | 158,703 | 4,804 | ||||||
Charter Communications Inc, Cl A * | 3,100 | 1,913 | ||||||
Comcast Corp, Cl A | 101,680 | 5,502 | ||||||
Discovery Inc, Cl A * | 3,529 | 153 | ||||||
Discovery Inc, Cl C * | 6,485 | 239 | ||||||
DISH Network Corp, Cl A * | 5,773 | 209 | ||||||
Electronic Arts Inc | 6,328 | 857 | ||||||
Facebook Inc, Cl A * | 53,451 | 15,743 | ||||||
Fox Corp | 10,853 | 388 | ||||||
Interpublic Group of Cos Inc/The | 8,997 | 263 | ||||||
Live Nation Entertainment Inc * | 3,300 | 279 | ||||||
Lumen Technologies Inc | 22,757 | 304 | ||||||
Netflix Inc * | 9,781 | 5,102 | ||||||
News Corp, Cl A | 9,030 | 230 | ||||||
News Corp, Cl B | 2,600 | 61 | ||||||
Omnicom Group Inc | 4,669 | 346 | ||||||
Take-Two Interactive Software Inc, Cl A * | 2,600 | 459 | ||||||
T-Mobile US Inc * | 13,000 | 1,629 | ||||||
Twitter Inc * | 17,900 | 1,139 | ||||||
Verizon Communications Inc | 92,098 | 5,356 | ||||||
ViacomCBS Inc, Cl B | 12,720 | 574 | ||||||
Walt Disney Co/The | 40,250 | 7,427 | ||||||
|
|
| ||||||
| 81,619 | ||||||||
|
|
| ||||||
Consumer Discretionary — 11.0% | ||||||||
Advance Auto Parts Inc | 1,494 | 274 | ||||||
Amazon.com Inc, Cl A * | 9,463 | 29,279 | ||||||
AutoZone Inc * | 525 | 737 | ||||||
Best Buy Co Inc | 5,178 | 594 | ||||||
Booking Holdings Inc * | 923 | 2,150 | ||||||
BorgWarner Inc | 5,501 | 255 | ||||||
Caesars Entertainment Inc * | 4,700 | 411 | ||||||
CarMax Inc * | 3,556 | 472 | ||||||
Carnival Corp * | 17,480 | 464 | ||||||
Chipotle Mexican Grill Inc, Cl A * | 643 | 914 | ||||||
Darden Restaurants Inc | 2,934 | 417 | ||||||
Dollar General Corp | 5,473 | 1,109 | ||||||
Dollar Tree Inc * | 5,185 | 593 | ||||||
Domino’s Pizza Inc | 800 | 294 | ||||||
DR Horton Inc | 7,486 | 667 | ||||||
eBay Inc | 14,247 | 873 | ||||||
Etsy Inc * | 2,800 | 565 | ||||||
Expedia Group Inc | 3,115 | 536 | ||||||
Ford Motor Co * | 86,476 | 1,059 | ||||||
Gap Inc/The | 4,298 | 128 | ||||||
Garmin Ltd | 3,404 | 449 | ||||||
General Motors Co | 28,377 | 1,631 | ||||||
Genuine Parts Co | 3,304 | 382 | ||||||
| Description | Shares | Market Value ($ Thousands) | ||||||
COMMON STOCK (continued) | ||||||||
Hanesbrands Inc | 8,067 | $ | 159 | |||||
Hasbro Inc | 2,898 | 279 | ||||||
Hilton Worldwide Holdings Inc * | 6,200 | 750 | ||||||
Home Depot Inc/The | 23,882 | 7,290 | ||||||
L Brands Inc * | 5,108 | 316 | ||||||
Las Vegas Sands Corp | 7,300 | 444 | ||||||
Leggett & Platt Inc | 3,065 | 140 | ||||||
Lennar Corp, Cl A | 6,174 | 625 | ||||||
LKQ Corp * | 6,000 | 254 | ||||||
Lowe’s Cos Inc | 16,245 | 3,089 | ||||||
Marriott International Inc/MD, Cl A | 5,951 | 881 | ||||||
McDonald’s Corp | 16,607 | 3,722 | ||||||
MGM Resorts International | 9,000 | 342 | ||||||
Mohawk Industries Inc * | 1,358 | 261 | ||||||
Newell Brands Inc, Cl B | 8,713 | 233 | ||||||
NIKE Inc, Cl B | 28,238 | 3,753 | ||||||
Norwegian Cruise Line Holdings Ltd * | 7,800 | 215 | ||||||
NVR Inc * | 80 | 377 | ||||||
O’Reilly Automotive Inc * | 1,512 | 767 | ||||||
Penn National Gaming Inc * | 3,400 | 356 | ||||||
Pool Corp | 900 | 311 | ||||||
PulteGroup Inc | 5,743 | 301 | ||||||
PVH Corp | 1,620 | 171 | ||||||
Ralph Lauren Corp, Cl A | 1,160 | 143 | ||||||
Ross Stores Inc | 7,849 | 941 | ||||||
Royal Caribbean Cruises Ltd | 4,810 | 412 | ||||||
Starbucks Corp | 26,157 | 2,858 | ||||||
Tapestry Inc * | 6,434 | 265 | ||||||
Target Corp, Cl A | 11,084 | 2,195 | ||||||
Tesla Inc * | 17,081 | 11,409 | ||||||
TJX Cos Inc/The | 26,676 | 1,765 | ||||||
Tractor Supply Co | 2,646 | 469 | ||||||
Ulta Beauty Inc * | 1,200 | 371 | ||||||
Under Armour Inc, Cl A * | 4,346 | 96 | ||||||
Under Armour Inc, Cl C * | 4,081 | 75 | ||||||
VF Corp | 7,140 | 571 | ||||||
Whirlpool Corp | 1,409 | 310 | ||||||
Wynn Resorts Ltd | 2,217 | 278 | ||||||
Yum! Brands Inc | 6,597 | 714 | ||||||
|
|
| ||||||
| 92,161 | ||||||||
|
|
| ||||||
Consumer Staples — 5.5% | ||||||||
Altria Group Inc | 41,269 | 2,111 | ||||||
Archer-Daniels-Midland Co | 12,541 | 715 | ||||||
Brown-Forman Corp, Cl B | 4,185 | 289 | ||||||
Campbell Soup Co | 4,672 | 235 | ||||||
Church & Dwight Co Inc | 5,400 | 472 | ||||||
Clorox Co/The | 2,822 | 544 | ||||||
Coca-Cola Co/The | 86,282 | 4,548 | ||||||
Colgate-Palmolive Co | 18,848 | 1,486 | ||||||
Conagra Brands Inc | 10,792 | 406 | ||||||
Constellation Brands Inc, Cl A | 3,770 | 859 | ||||||
Costco Wholesale Corp | 9,776 | 3,446 | ||||||
SEI Institutional Managed Trust / Semi-Annual Report / March 31, 2021 | 1 |
CONSOLIDATED SCHEDULE OF INVESTMENTS (Unaudited)
March 31, 2021
Dynamic Asset Allocation Fund (Continued)
| Description | Shares | Market Value ($ Thousands) | ||||||
COMMON STOCK (continued) | ||||||||
Estee Lauder Cos Inc/The, Cl A | 5,044 | $ | 1,467 | |||||
General Mills Inc | 13,541 | 830 | ||||||
Hershey Co/The | 3,286 | 520 | ||||||
Hormel Foods Corp | 6,216 | 297 | ||||||
J M Smucker Co/The | 2,404 | 304 | ||||||
Kellogg Co | 5,594 | 354 | ||||||
Kimberly-Clark Corp | 7,477 | 1,040 | ||||||
Kraft Heinz Co/The | 14,600 | 584 | ||||||
Kroger Co/The | 16,748 | 603 | ||||||
Lamb Weston Holdings Inc | 3,400 | 263 | ||||||
McCormick & Co Inc/MD | 5,528 | 493 | ||||||
Molson Coors Beverage Co, Cl B | 4,324 | 221 | ||||||
Mondelez International Inc, Cl A | 31,353 | 1,835 | ||||||
Monster Beverage Corp * | 8,165 | 744 | ||||||
PepsiCo Inc | 30,640 | 4,334 | ||||||
Philip Morris International Inc | 34,637 | 3,074 | ||||||
Procter & Gamble Co/The | 54,766 | 7,417 | ||||||
Sysco Corp, Cl A | 11,243 | 885 | ||||||
Tyson Foods Inc, Cl A | 6,575 | 488 | ||||||
Walgreens Boots Alliance Inc | 15,807 | 868 | ||||||
Walmart Inc | 30,876 | 4,194 | ||||||
|
|
| ||||||
| 45,926 | ||||||||
|
|
| ||||||
Energy — 2.5% | ||||||||
APA Corp | 8,701 | 156 | ||||||
Baker Hughes Co, Cl A | 15,415 | 333 | ||||||
Cabot Oil & Gas Corp | 9,398 | 176 | ||||||
Chevron Corp | 42,823 | 4,487 | ||||||
ConocoPhillips | 30,056 | 1,592 | ||||||
Devon Energy Corp | 13,406 | 293 | ||||||
Diamondback Energy Inc, Cl A | 3,600 | 265 | ||||||
EOG Resources Inc | 12,927 | 938 | ||||||
Exxon Mobil Corp | 94,200 | 5,259 | ||||||
Halliburton Co | 19,642 | 421 | ||||||
Hess Corp | 5,974 | 423 | ||||||
HollyFrontier Corp | 3,400 | 122 | ||||||
Kinder Morgan Inc | 43,714 | 728 | ||||||
Marathon Oil Corp | 17,392 | 186 | ||||||
Marathon Petroleum Corp | 14,650 | 784 | ||||||
NOV Inc | 8,630 | 118 | ||||||
Occidental Petroleum Corp | 18,628 | 496 | ||||||
ONEOK Inc | 9,854 | 499 | ||||||
Phillips 66 | 9,599 | 783 | ||||||
Pioneer Natural Resources Co | 4,572 | 726 | ||||||
Schlumberger NV, Cl A | 30,837 | 838 | ||||||
Valero Energy Corp | 9,197 | 659 | ||||||
Williams Cos Inc/The | 27,246 | 645 | ||||||
|
|
| ||||||
| 20,927 | ||||||||
|
|
| ||||||
Financials — 9.8% | ||||||||
Aflac Inc | 14,118 | 723 | ||||||
Allstate Corp/The | 6,812 | 783 | ||||||
American Express Co | 14,513 | 2,053 | ||||||
| Description | Shares | Market Value ($ Thousands) | ||||||
COMMON STOCK (continued) | ||||||||
American International Group Inc | 19,105 | $ | 883 | |||||
Ameriprise Financial Inc | 2,617 | 608 | ||||||
Arthur J Gallagher & Co | 4,400 | 549 | ||||||
Assurant Inc | 1,282 | 182 | ||||||
Bank of America Corp | 169,073 | 6,541 | ||||||
Bank of New York Mellon Corp/The | 17,843 | 844 | ||||||
Berkshire Hathaway Inc, Cl B * | 42,330 | 10,814 | ||||||
BlackRock Inc | 3,115 | 2,349 | ||||||
Capital One Financial Corp | 10,115 | 1,287 | ||||||
Cboe Global Markets Inc | 2,500 | 247 | ||||||
Charles Schwab Corp/The | 33,235 | 2,166 | ||||||
Chubb Ltd | 9,966 | 1,574 | ||||||
Cincinnati Financial Corp | 3,293 | 339 | ||||||
Citigroup Inc | 46,445 | 3,379 | ||||||
Citizens Financial Group Inc | 9,600 | 424 | ||||||
CME Group Inc | 7,948 | 1,623 | ||||||
Comerica Inc | 3,173 | 228 | ||||||
Discover Financial Services | 6,846 | 650 | ||||||
Everest Re Group Ltd | 900 | 223 | ||||||
Fifth Third Bancorp | 15,951 | 597 | ||||||
First Republic Bank/CA | 3,900 | 650 | ||||||
Franklin Resources Inc | 6,036 | 179 | ||||||
Globe Life Inc | 2,035 | 197 | ||||||
Goldman Sachs Group Inc/The | 7,601 | 2,485 | ||||||
Hartford Financial Services Group Inc/The | 7,961 | 532 | ||||||
Huntington Bancshares Inc/OH | 22,447 | 353 | ||||||
Intercontinental Exchange Inc | 12,480 | 1,394 | ||||||
Invesco Ltd | 8,712 | 220 | ||||||
JPMorgan Chase & Co | 67,717 | 10,308 | ||||||
KeyCorp | 21,652 | 433 | ||||||
Lincoln National Corp | 4,009 | 250 | ||||||
Loews Corp | 4,889 | 251 | ||||||
M&T Bank Corp | 2,908 | 441 | ||||||
MarketAxess Holdings Inc | 860 | 428 | ||||||
Marsh & McLennan Cos Inc | 11,217 | 1,366 | ||||||
MetLife Inc | 16,612 | 1,010 | ||||||
Moody’s Corp | 3,604 | 1,076 | ||||||
Morgan Stanley | 33,336 | 2,589 | ||||||
MSCI Inc, Cl A | 1,800 | 755 | ||||||
Nasdaq Inc, Cl A | 2,587 | 381 | ||||||
Northern Trust Corp | 4,571 | 480 | ||||||
People’s United Financial Inc | 9,789 | 175 | ||||||
PNC Financial Services Group Inc/The | 9,397 | 1,648 | ||||||
Principal Financial Group Inc, Cl A | 5,633 | 338 | ||||||
Progressive Corp/The | 13,121 | 1,254 | ||||||
Prudential Financial Inc | 8,777 | 800 | ||||||
Raymond James Financial Inc | 2,800 | 343 | ||||||
Regions Financial Corp | 21,560 | 445 | ||||||
S&P Global Inc | 5,358 | 1,891 | ||||||
SVB Financial Group, Cl B * | 1,200 | 592 | ||||||
Synchrony Financial | 12,101 | 492 | ||||||
T Rowe Price Group Inc | 5,040 | 865 | ||||||
| 2 | SEI Institutional Managed Trust / Semi-Annual Report / March 31, 2021 |
CONSOLIDATED SCHEDULE OF INVESTMENTS (Unaudited)
March 31, 2021
Dynamic Asset Allocation Fund (Continued)
| Description | Shares | Market Value ($ Thousands) | ||||||
COMMON STOCK (continued) | ||||||||
Travelers Cos Inc/The | 5,552 | $ | 835 | |||||
Truist Financial Corp | 29,882 | 1,743 | ||||||
Unum Group | 4,763 | 133 | ||||||
US Bancorp | 30,302 | 1,676 | ||||||
W R Berkley Corp | 3,200 | 241 | ||||||
Wells Fargo & Co | 91,933 | 3,592 | ||||||
Zions Bancorp NA | 3,737 | 205 | ||||||
|
|
| ||||||
| 82,112 | ||||||||
|
|
| ||||||
Health Care — 11.1% | ||||||||
Abbott Laboratories | 39,424 | 4,725 | ||||||
AbbVie Inc | 39,241 | 4,247 | ||||||
ABIOMED Inc * | 966 | 308 | ||||||
Agilent Technologies Inc | 6,685 | 850 | ||||||
Alexion Pharmaceuticals Inc * | 4,908 | 750 | ||||||
Align Technology Inc * | 1,600 | 866 | ||||||
AmerisourceBergen Corp, Cl A | 3,354 | 396 | ||||||
Amgen Inc, Cl A | 12,863 | 3,200 | ||||||
Anthem Inc | 5,438 | 1,952 | ||||||
Baxter International Inc | 11,192 | 944 | ||||||
Becton Dickinson and Co | 6,467 | 1,572 | ||||||
Biogen Inc * | 3,350 | 937 | ||||||
Bio-Rad Laboratories Inc, Cl A * | 500 | 286 | ||||||
Boston Scientific Corp * | 31,392 | 1,213 | ||||||
Bristol-Myers Squibb Co | 49,832 | 3,146 | ||||||
Cardinal Health Inc | 6,503 | 395 | ||||||
Catalent Inc * | 3,700 | 390 | ||||||
Centene Corp * | 13,032 | 833 | ||||||
Cerner Corp | 6,912 | 497 | ||||||
Cigna Corp | 7,820 | 1,890 | ||||||
Cooper Cos Inc/The, Cl A | 1,100 | 422 | ||||||
CVS Health Corp | 29,160 | 2,194 | ||||||
Danaher Corp, Cl A | 14,091 | 3,172 | ||||||
DaVita Inc * | 1,657 | 179 | ||||||
DENTSPLY SIRONA Inc | 4,971 | 317 | ||||||
Dexcom Inc * | 2,100 | 755 | ||||||
Edwards Lifesciences Corp, Cl A * | 14,016 | 1,172 | ||||||
Eli Lilly and Co | 17,666 | 3,300 | ||||||
Gilead Sciences Inc | 27,913 | 1,804 | ||||||
HCA Healthcare Inc | 5,943 | 1,119 | ||||||
Henry Schein Inc * | 3,044 | 211 | ||||||
Hologic Inc * | 5,800 | 431 | ||||||
Humana Inc | 2,890 | 1,212 | ||||||
IDEXX Laboratories Inc * | 1,900 | 930 | ||||||
Illumina Inc * | 3,200 | 1,229 | ||||||
Incyte Corp * | 4,300 | 349 | ||||||
Intuitive Surgical Inc * | 2,638 | 1,949 | ||||||
IQVIA Holdings Inc * | 4,300 | 831 | ||||||
Johnson & Johnson | 58,344 | 9,589 | ||||||
Laboratory Corp of America Holdings * | 2,117 | 540 | ||||||
McKesson Corp | 3,575 | 697 | ||||||
Merck & Co Inc | 56,266 | 4,338 | ||||||
Mettler-Toledo International Inc * | 545 | 630 | ||||||
| Description | Shares | Market Value ($ Thousands) | ||||||
COMMON STOCK (continued) | ||||||||
PerkinElmer Inc | 2,569 | $ | 330 | |||||
Pfizer Inc | 124,057 | 4,495 | ||||||
Quest Diagnostics Inc | 2,878 | 369 | ||||||
Regeneron Pharmaceuticals Inc * | 2,275 | 1,076 | ||||||
ResMed Inc | 3,200 | 621 | ||||||
Stryker Corp | 7,276 | 1,772 | ||||||
Teleflex Inc | 1,060 | 440 | ||||||
Thermo Fisher Scientific Inc | 8,776 | 4,005 | ||||||
UnitedHealth Group Inc | 20,991 | 7,810 | ||||||
Universal Health Services Inc, Cl B | 1,742 | 232 | ||||||
Varian Medical Systems Inc * | 2,065 | 365 | ||||||
Vertex Pharmaceuticals Inc * | 5,758 | 1,237 | ||||||
Viatris Inc, Cl W * | 26,911 | 376 | ||||||
Waters Corp * | 1,420 | 404 | ||||||
West Pharmaceutical Services Inc | 1,600 | 451 | ||||||
Zimmer Biomet Holdings Inc | 4,653 | 745 | ||||||
Zoetis Inc, Cl A | 10,573 | 1,665 | ||||||
|
|
| ||||||
| 93,160 | ||||||||
|
|
| ||||||
Industrials — 7.4% | ||||||||
3M Co | 12,926 | 2,491 | ||||||
A O Smith Corp | 3,100 | 210 | ||||||
Alaska Air Group Inc | 2,900 | 201 | ||||||
American Airlines Group Inc | 13,525 | 323 | ||||||
AMETEK Inc | 5,164 | 660 | ||||||
Boeing Co/The * | 12,209 | 3,110 | ||||||
Carrier Global Corp | 18,407 | 777 | ||||||
Caterpillar Inc, Cl A | 12,145 | 2,816 | ||||||
CH Robinson Worldwide Inc | 3,087 | 295 | ||||||
Cintas Corp | 1,952 | 666 | ||||||
Copart Inc * | 4,600 | 500 | ||||||
CSX Corp | 16,888 | 1,628 | ||||||
Cummins Inc | 3,263 | 845 | ||||||
Deere & Co | 6,913 | 2,586 | ||||||
Delta Air Lines Inc, Cl A * | 14,322 | 691 | ||||||
Dover Corp | 3,246 | 445 | ||||||
Emerson Electric Co | 13,426 | 1,211 | ||||||
Equifax Inc | 2,676 | 485 | ||||||
Expeditors International of Washington Inc | 3,708 | 399 | ||||||
Fastenal Co, Cl A | 12,844 | 646 | ||||||
FedEx Corp | 5,369 | 1,525 | ||||||
Fortive Corp | 7,554 | 534 | ||||||
Fortune Brands Home & Security Inc | 3,200 | 307 | ||||||
Generac Holdings Inc * | 1,400 | 458 | ||||||
General Dynamics Corp | 5,165 | 938 | ||||||
General Electric Co | 194,793 | 2,558 | ||||||
Honeywell International Inc | 15,452 | 3,354 | ||||||
Howmet Aerospace Inc | 8,992 | 289 | ||||||
Huntington Ingalls Industries Inc, Cl A | 900 | 185 | ||||||
IDEX Corp | 1,700 | 356 | ||||||
IHS Markit Ltd | 8,400 | 813 | ||||||
Illinois Tool Works Inc | 6,431 | 1,425 | ||||||
Ingersoll Rand Inc * | 8,214 | 404 | ||||||
SEI Institutional Managed Trust / Semi-Annual Report / March 31, 2021 | 3 |
CONSOLIDATED SCHEDULE OF INVESTMENTS (Unaudited)
March 31, 2021
Dynamic Asset Allocation Fund (Continued)
| Description | Shares | Market Value ($ Thousands) | ||||||
COMMON STOCK (continued) | ||||||||
Jacobs Engineering Group Inc | 2,821 | $ | 365 | |||||
JB Hunt Transport Services Inc | 1,845 | 310 | ||||||
Kansas City Southern | 2,063 | 544 | ||||||
L3Harris Technologies Inc | 4,571 | 926 | ||||||
Lockheed Martin Corp | 5,493 | 2,030 | ||||||
Masco Corp | 5,623 | 337 | ||||||
Norfolk Southern Corp | 5,602 | 1,504 | ||||||
Northrop Grumman Corp | 3,421 | 1,107 | ||||||
Old Dominion Freight Line Inc, Cl A | 2,150 | 517 | ||||||
Otis Worldwide Corp | 9,053 | 620 | ||||||
PACCAR Inc | 7,819 | 726 | ||||||
Parker-Hannifin Corp, Cl A | 2,852 | 900 | ||||||
Quanta Services Inc | 3,082 | 271 | ||||||
Raytheon Technologies Corp | 33,748 | 2,608 | ||||||
Republic Services Inc | 4,662 | 463 | ||||||
Robert Half International Inc | 2,559 | 200 | ||||||
Rockwell Automation Inc | 2,535 | 673 | ||||||
Rollins Inc | 5,175 | 178 | ||||||
Roper Technologies Inc | 2,278 | 919 | ||||||
Snap-on Inc | 1,255 | 290 | ||||||
Southwest Airlines Co, Cl A | 13,233 | 808 | ||||||
Stanley Black & Decker Inc | 3,611 | 721 | ||||||
Teledyne Technologies Inc * | 800 | 331 | ||||||
Textron Inc | 5,037 | 282 | ||||||
TransDigm Group Inc * | 1,240 | 729 | ||||||
Union Pacific Corp | 14,842 | 3,271 | ||||||
United Airlines Holdings Inc * | 6,400 | 368 | ||||||
United Parcel Service Inc, Cl B | 16,011 | 2,722 | ||||||
United Rentals Inc * | 1,599 | 526 | ||||||
Verisk Analytics Inc, Cl A | 3,600 | 636 | ||||||
Waste Management Inc | 8,682 | 1,120 | ||||||
Westinghouse Air Brake Technologies Corp | 4,090 | 324 | ||||||
WW Grainger Inc | 947 | 380 | ||||||
Xylem Inc/NY | 3,948 | 415 | ||||||
|
|
| ||||||
| 62,252 | ||||||||
|
|
| ||||||
Information Technology — 23.3% | ||||||||
Adobe Inc * | 10,633 | 5,055 | ||||||
Advanced Micro Devices Inc * | 26,800 | 2,104 | ||||||
Akamai Technologies Inc * | 3,674 | 374 | ||||||
Amphenol Corp, Cl A | 13,440 | 887 | ||||||
Analog Devices Inc | 6,090 | 944 | ||||||
ANSYS Inc * | 1,900 | 645 | ||||||
Apple Inc | 350,560 | 42,821 | ||||||
Applied Materials Inc | 20,371 | 2,722 | ||||||
Arista Networks Inc * | 1,200 | 362 | ||||||
Autodesk Inc, Cl A * | 4,905 | 1,359 | ||||||
Automatic Data Processing Inc | 9,542 | 1,798 | ||||||
Broadcom Inc | 9,075 | 4,208 | ||||||
Broadridge Financial Solutions Inc | 2,600 | 398 | ||||||
Cadence Design Systems Inc * | 6,100 | 836 | ||||||
CDW Corp/DE | 3,200 | 530 | ||||||
Cisco Systems Inc/Delaware | 93,972 | 4,859 | ||||||
| Description | Shares | Market Value ($ Thousands) | ||||||
COMMON STOCK (continued) | ||||||||
Citrix Systems Inc | 2,726 | $ | 383 | |||||
Cognizant Technology Solutions Corp, Cl A | 11,677 | 912 | ||||||
Corning Inc, Cl B | 17,171 | 747 | ||||||
DXC Technology Co | 5,876 | 184 | ||||||
Enphase Energy Inc * | 2,800 | 454 | ||||||
F5 Networks Inc, Cl A * | 1,391 | 290 | ||||||
Fidelity National Information Services Inc, Cl B | 13,753 | 1,934 | ||||||
Fiserv Inc, Cl A * | 12,764 | 1,519 | ||||||
FleetCor Technologies Inc * | 1,800 | 484 | ||||||
FLIR Systems Inc | 3,092 | 175 | ||||||
Fortinet Inc * | 3,000 | 553 | ||||||
Gartner Inc * | 2,000 | 365 | ||||||
Global Payments Inc | 6,589 | 1,328 | ||||||
Hewlett Packard Enterprise Co | 28,510 | 449 | ||||||
HP Inc | 28,210 | 896 | ||||||
Intel Corp | 90,397 | 5,785 | ||||||
International Business Machines Corp | 19,868 | 2,648 | ||||||
Intuit Inc | 6,045 | 2,316 | ||||||
IPG Photonics Corp * | 800 | 169 | ||||||
Jack Henry & Associates Inc | 1,700 | 258 | ||||||
Juniper Networks Inc | 7,633 | 193 | ||||||
Keysight Technologies Inc * | 4,200 | 602 | ||||||
KLA Corp | 3,449 | 1,140 | ||||||
Lam Research Corp | 3,160 | 1,881 | ||||||
Leidos Holdings Inc | 2,900 | 279 | ||||||
Mastercard Inc, Cl A | 19,482 | 6,937 | ||||||
Maxim Integrated Products Inc | 10,429 | 953 | ||||||
Microchip Technology Inc | 5,837 | 906 | ||||||
Micron Technology Inc * | 24,871 | 2,194 | ||||||
Microsoft Corp | 167,534 | 39,499 | ||||||
Monolithic Power Systems Inc | 900 | 318 | ||||||
Motorola Solutions Inc | 3,802 | 715 | ||||||
NetApp Inc | 4,828 | 351 | ||||||
NortonLifeLock Inc | 12,608 | 268 | ||||||
NVIDIA Corp | 13,728 | 7,330 | ||||||
NXP Semiconductors NV | 6,200 | 1,248 | ||||||
Oracle Corp, Cl B | 41,233 | 2,893 | ||||||
Paychex Inc | 7,200 | 706 | ||||||
Paycom Software Inc * | 1,120 | 415 | ||||||
PayPal Holdings Inc * | 25,985 | 6,310 | ||||||
Qorvo Inc * | 2,505 | 458 | ||||||
QUALCOMM Inc | 25,268 | 3,350 | ||||||
salesforce.com Inc * | 20,372 | 4,316 | ||||||
ServiceNow Inc * | 4,300 | 2,151 | ||||||
Skyworks Solutions Inc | 3,707 | 680 | ||||||
Synopsys Inc * | 3,400 | 842 | ||||||
TE Connectivity Ltd | 7,303 | 943 | ||||||
Teradyne Inc | 3,800 | 462 | ||||||
Texas Instruments Inc | 20,511 | 3,876 | ||||||
Trimble Inc * | 5,700 | 443 | ||||||
Tyler Technologies Inc * | 918 | 390 | ||||||
| 4 | SEI Institutional Managed Trust / Semi-Annual Report / March 31, 2021 |
CONSOLIDATED SCHEDULE OF INVESTMENTS (Unaudited)
March 31, 2021
Dynamic Asset Allocation Fund (Continued)
| Description | Shares | Market Value ($ Thousands) | ||||||
COMMON STOCK (continued) | ||||||||
VeriSign Inc * | 2,178 | $ | 433 | |||||
Visa Inc, Cl A | 37,732 | 7,989 | ||||||
Western Digital Corp | 6,738 | 450 | ||||||
Western Union Co/The | 9,277 | 229 | ||||||
Xilinx Inc | 5,387 | 667 | ||||||
Zebra Technologies Corp, Cl A * | 1,200 | 582 | ||||||
|
|
| ||||||
| 195,150 | ||||||||
|
|
| ||||||
Materials — 2.0% | ||||||||
Air Products and Chemicals Inc | 4,861 | 1,368 | ||||||
Albemarle Corp | 2,620 | 383 | ||||||
Avery Dennison Corp | 1,876 | 345 | ||||||
Ball Corp | 7,312 | 620 | ||||||
Celanese Corp, Cl A | 2,500 | 375 | ||||||
CF Industries Holdings Inc | 4,837 | 219 | ||||||
Corteva Inc | 16,391 | 764 | ||||||
Dow Inc | 16,525 | 1,057 | ||||||
DuPont de Nemours Inc | 12,007 | 928 | ||||||
Eastman Chemical Co | 3,098 | 341 | ||||||
Ecolab Inc | 5,546 | 1,187 | ||||||
FMC Corp | 2,949 | 326 | ||||||
Freeport-McMoRan Inc, Cl B | 32,462 | 1,069 | ||||||
International Flavors & Fragrances Inc | 5,562 | 776 | ||||||
International Paper Co | 8,773 | 474 | ||||||
LyondellBasell Industries NV, Cl A | 5,713 | 594 | ||||||
Martin Marietta Materials Inc, Cl A | 1,365 | 458 | ||||||
Mosaic Co/The | 7,810 | 247 | ||||||
Newmont Corp | 17,704 | 1,067 | ||||||
Nucor Corp | 6,748 | 542 | ||||||
Packaging Corp of America | 2,100 | 282 | ||||||
PPG Industries Inc | 5,270 | 792 | ||||||
Sealed Air Corp | 3,658 | 168 | ||||||
Sherwin-Williams Co/The, Cl A | 1,738 | 1,283 | ||||||
Vulcan Materials Co | 2,930 | 494 | ||||||
Westrock Co | 5,692 | 296 | ||||||
|
|
| ||||||
| 16,455 | ||||||||
|
|
| ||||||
Real Estate — 2.2% | ||||||||
Alexandria Real Estate Equities Inc ‡ | 2,800 | 460 | ||||||
American Tower Corp, Cl A ‡ | 9,916 | 2,371 | ||||||
AvalonBay Communities Inc ‡ | 3,122 | 576 | ||||||
Boston Properties Inc ‡ | 3,108 | 315 | ||||||
CBRE Group Inc, Cl A *‡ | 7,325 | 579 | ||||||
Crown Castle International Corp ‡ | 9,528 | 1,640 | ||||||
Digital Realty Trust Inc, Cl A ‡ | 6,300 | 887 | ||||||
Duke Realty Corp ‡ | 8,100 | 340 | ||||||
Equinix Inc ‡ | 2,019 | 1,372 | ||||||
Equity Residential ‡ | 7,633 | 547 | ||||||
Essex Property Trust Inc ‡ | 1,460 | 397 | ||||||
Extra Space Storage Inc ‡ | 2,900 | 384 | ||||||
Federal Realty Investment Trust ‡ | 1,600 | 162 | ||||||
Healthpeak Properties Inc ‡ | 12,330 | 391 | ||||||
Host Hotels & Resorts Inc ‡ | 16,312 | 275 | ||||||
| Description | Shares | Market Value ($ Thousands) | ||||||
COMMON STOCK (continued) | ||||||||
Iron Mountain Inc ‡ | 6,676 | $ | 247 | |||||
Kimco Realty Corp ‡ | 9,796 | 184 | ||||||
Mid-America Apartment Communities Inc ‡ | 2,600 | 375 | ||||||
Prologis Inc ‡ | 16,369 | 1,735 | ||||||
Public Storage ‡ | 3,400 | 839 | ||||||
Realty Income Corp ‡ | 7,818 | 496 | ||||||
Regency Centers Corp ‡ | 3,700 | 210 | ||||||
SBA Communications Corp, Cl A ‡ | 2,463 | 684 | ||||||
Simon Property Group Inc ‡ | 7,258 | 826 | ||||||
UDR Inc ‡ | 6,800 | 298 | ||||||
Ventas Inc ‡ | 8,310 | 443 | ||||||
Vornado Realty Trust ‡ | 3,631 | 165 | ||||||
Welltower Inc ‡ | 9,307 | 667 | ||||||
Weyerhaeuser Co ‡ | 16,860 | 600 | ||||||
|
|
| ||||||
| 18,465 | ||||||||
|
|
| ||||||
Utilities — 2.4% | ||||||||
AES Corp/The | 15,212 | 408 | ||||||
Alliant Energy Corp | 5,400 | 292 | ||||||
Ameren Corp | 5,544 | 451 | ||||||
American Electric Power Co Inc | 10,929 | 926 | ||||||
American Water Works Co Inc | 4,100 | 615 | ||||||
Atmos Energy Corp | 2,900 | 287 | ||||||
CenterPoint Energy Inc | 12,017 | 272 | ||||||
CMS Energy Corp | 6,313 | 387 | ||||||
Consolidated Edison Inc | 7,478 | 559 | ||||||
Dominion Energy Inc | 17,868 | 1,357 | ||||||
DTE Energy Co | 4,341 | 578 | ||||||
Duke Energy Corp | 16,598 | 1,602 | ||||||
Edison International | 8,490 | 498 | ||||||
Entergy Corp | 4,477 | 445 | ||||||
Evergy Inc | 5,200 | 310 | ||||||
Eversource Energy | 7,744 | 671 | ||||||
Exelon Corp | 21,590 | 944 | ||||||
FirstEnergy Corp | 12,021 | 417 | ||||||
NextEra Energy Inc | 43,592 | 3,296 | ||||||
NiSource Inc | 8,913 | 215 | ||||||
NRG Energy Inc | 5,364 | 202 | ||||||
Pinnacle West Capital Corp | 2,594 | 211 | ||||||
PPL Corp | 17,139 | 494 | ||||||
Public Service Enterprise Group Inc | 11,357 | 684 | ||||||
Sempra Energy | 6,568 | 871 | ||||||
Southern Co/The | 23,382 | 1,453 | ||||||
WEC Energy Group Inc | 7,137 | 668 | ||||||
SEI Institutional Managed Trust / Semi-Annual Report / March 31, 2021 | 5 |
CONSOLIDATED SCHEDULE OF INVESTMENTS (Unaudited)
March 31, 2021
Dynamic Asset Allocation Fund (Continued)
| Description | Shares | Market Value ($ Thousands) | ||||||
COMMON STOCK (continued) | ||||||||
Xcel Energy Inc | 11,846 | $ | 788 | |||||
|
|
| ||||||
| 19,901 | ||||||||
|
|
| ||||||
Total Common Stock | 728,128 | |||||||
|
|
| ||||||
FOREIGN COMMON STOCK — 2.2% | ||||||||
Ireland — 0.6% | ||||||||
Accenture PLC, Cl A | 14,048 | 3,881 | ||||||
Eaton Corp PLC | 8,839 | 1,222 | ||||||
|
|
| ||||||
| 5,103 | ||||||||
|
|
| ||||||
United Kingdom — 1.6% | ||||||||
Allegion PLC | 2,094 | 263 | ||||||
Amcor PLC | 35,009 | 409 | ||||||
Aon PLC, Cl A | 5,009 | 1,153 | ||||||
Aptiv PLC * | 6,041 | 833 | ||||||
Johnson Controls International PLC | 15,938 | 951 | ||||||
Linde PLC | 11,582 | 3,244 | ||||||
Medtronic PLC | 29,941 | 3,537 | ||||||
Nielsen Holdings PLC | 8,180 | 206 | ||||||
Pentair PLC | 3,877 | 242 | ||||||
| Description | Shares | Market Value ($ Thousands) | ||||||
FOREIGN COMMON STOCK (continued) |
| |||||||
Perrigo Co PLC | 3,076 | $ | 124 | |||||
Seagate Technology PLC | 4,343 | 333 | ||||||
STERIS PLC | 1,900 | 362 | ||||||
Trane Technologies PLC | 5,303 | 878 | ||||||
Willis Towers Watson PLC | 2,847 | 652 | ||||||
|
|
| ||||||
| 13,187 | ||||||||
|
|
| ||||||
Total Foreign Common Stock |
| 18,290 | ||||||
|
|
| ||||||
Total Investments in Securities — 89.2% |
| $ | 746,418 | |||||
|
|
| ||||||
| Contracts | ||||||||
PURCHASED OPTION* — 0.4% | ||||||||
Total Purchased Option (A) | 185,919,788 | $ | 3,393 | |||||
|
|
| ||||||
PURCHASED SWAPTIONS* — 2.3% | ||||||||
Total Purchased Swaptions (B) | 612,455,481 | $ | 19,052 | |||||
|
|
| ||||||
A list of the open option contracts held by the Fund at March 31, 2021 is as follows:
| Description | Number of Contracts | Notional Amount (Thousands) † | Exercise Price | Expiration Date | Value (Thousands) | |||||||||||||||
PURCHASED OPTION — 0.4% |
| |||||||||||||||||||
Call Options |
| |||||||||||||||||||
EUR PUT USD CALL* | 185,919,788 | $ | 823 | $1.19 | 4/17/2021 | $ | 3,393 | |||||||||||||
|
|
|
|
| ||||||||||||||||
Total Purchased Option | $ | 823 | $ | 3,393 | ||||||||||||||||
|
|
|
|
| ||||||||||||||||
† Represents Cost
A list of the open OTC swaption contracts held by the Fund at March 31, 2021, is as follows:
| Description | Counterparty | Number of Contracts/ Notional Amount | Exercise Price | Expiration Date | Value (Thousands) | |||||||||||
PURCHASED SWAPTIONS — 2.3% | ||||||||||||||||
Call Swaptions | ||||||||||||||||
CMS One Look* | Bank of America Merill Lynch | 80,642,481 | $2.00 | 08/19/2023 | $ | 11,776 | ||||||||||
CMS One Look* | Bank of America Merill Lynch | 531,813,000 | $0.14 | 07/17/2021 | 7,276 | |||||||||||
|
|
|
|
| ||||||||||||
Total Purchased Swaptions | 612,455,481 | $ | 19,052 | |||||||||||||
|
|
|
|
| ||||||||||||
| 6 | SEI Institutional Managed Trust / Semi-Annual Report / March 31, 2021 |
CONSOLIDATED SCHEDULE OF INVESTMENTS (Unaudited)
March 31, 2021
Dynamic Asset Allocation Fund (Continued)
A list of the open futures contracts held by the Fund at March 31, 2021, is as follows:
| Type of Contract | Number of Contracts Long | Expiration Date | Notional Amount (Thousands) | Value (Thousands) | Unrealized Appreciation (Depreciation) (Thousands) | |||||||||||||||
MSCI EAFE Index | 114 | Jun-2021 | $ | 12,502 | $ | 12,494 | $ | (8 | ) | |||||||||||
S&P 500 Index E-MINI | 364 | Jun-2021 | 71,297 | 72,207 | 910 | |||||||||||||||
|
|
|
|
|
|
| ||||||||||||||
| $ | 83,799 | $ | 84,701 | $ | 902 | |||||||||||||||
|
|
|
|
|
|
| ||||||||||||||
A list of the open forward foreign currency contracts held by the Fund at March 31, 2021, is as follows:
| Counterparty | Settlement Date | Currency to Deliver (Thousands) | Currency to Receive (Thousands) | Unrealized (Depreciation) (Thousands) | ||||||||||||||||||||
Bank of America | 01/11/22 | USD | 170 | SAR | 637 | $ | — | |||||||||||||||||
Bank of America | 01/11/22 | SAR | 157,631 | USD | 41,965 | (50) | ||||||||||||||||||
|
|
| ||||||||||||||||||||||
| $ | (50) | |||||||||||||||||||||||
|
|
| ||||||||||||||||||||||
A list of the open centrally cleared swap agreements held by the Fund at March 31, 2021, is as follows:
| Interest Rate Swap | ||||||||||||||||||||||||
| Fund Pays | Fund Receives | Payment Frequency | Termination Date | Currency | Notional Amount (Thousands) | Value (Thousands) | Upfront Payments/ Receipts (Thousands) | Net Unrealized Appreciation (Thousands) | ||||||||||||||||
1Y CPI-CPURNSA | 2.1475% | Annually | 12/10/2030 | USD | 27,761 | $ | 1,265 | $ | – | $ | 1,265 | |||||||||||||
|
|
|
|
|
| |||||||||||||||||||
A list of OTC swap agreements held by the fund at March 31, 2021, is as follows:
| Total Return Swaps | ||||||||||||||||||||||||||||
| Counterparty | Reference Entity/ Obligation | Fund Pays | Fund Receives | Payment Frequency | Termination Date | Currency | Notional Amount (Thousands) | Value (Thousands) | Upfront Payments/ Receipts (Thousands) | Net Unrealized Appreciation (Depreciation) (Thousands) | ||||||||||||||||||
BNP Paribas^ | BLOOMBERG COMMODITY INDEX TOTAL RETURN | 12 BPS | BLOOMBERG COMMODITY INDEX TOTAL RETURN | Quarterly | 05/18/2021 | USD | (47,209 | ) | $ | (992 | ) | $ | – | $ | (992 | ) | ||||||||||||
BNP Paribas^ | BLOOMBERG COMMODITY INDEX TOTAL RETURN | 7 BPS | BLOOMBERG COMMODITY INDEX TOTAL RETURN | Quarterly | 06/18/2021 | USD | (33,924 | ) | (268 | ) | – | (268) | ||||||||||||||||
BNP Paribas^ | BLOOMBERG COMMODITY INDEX TOTAL RETURN | 0.10% | BLOOMBERG COMMODITY INDEX TOTAL RETURN | Quarterly | 12/09/2021 | USD | (37,166 | ) | (861 | ) | – | (861 | ) | |||||||||||||||
BNP Paribas | BLOOMBERG COMMODITY INDEX TOTAL RETURN | USD LIBOR 3-Months | BLOOMBERG COMMODITY INDEX TOTAL RETURN | Quarterly | 12/16/2021 | USD | (13,566 | ) | (172 | ) | – | (172) | ||||||||||||||||
|
| |||||||||||||||||||||||||||
| $ | (2,293 | ) | $ | – | $ | (2,293) | ||||||||||||||||||||||
|
| |||||||||||||||||||||||||||
Percentages are based on Net Assets of $836,723 ($ Thousands). |
| * | Non-income producing security. |
| ‡ | Real Estate Investment Trust. |
| ^ | Security, or a portion thereof, is held by the Dynamic Commodity Strategy Subsidiary Ltd. as of March 31, 2021. |
| (A) | Refer to table below for details on Options Contracts. |
| (B) | Refer to table below for details on Swaption Contracts. |
BPs— Basis Points
Cl — Class
EAFE — Europe, Australasia and Far East
Ltd. — Limited
MSCI — Morgan Stanley Capital International
NASDAQ – National Association of Securities Dealers and Automated Quotations
OTC — Over The Counter
PLC — Public Limited Company
S&P— Standard & Poor’s
SAR— Saudi Riyal
USD — U.S. Dollar
SEI Institutional Managed Trust / Semi-Annual Report / March 31, 2021 | 7 |
CONSOLIDATED SCHEDULE OF INVESTMENTS (Unaudited)
March 31, 2021
Dynamic Asset Allocation Fund (Continued)
The following is a list of the level of inputs used as of March 31, 2021, in valuing the Fund’s investments and other financial instruments carried at value ($ Thousands):
| Investments in Securities | Level 1 ($) | Level 2 ($) | Level 3 ($) | Total ($) | ||||||||||||
Common Stock | 728,128 | — | — | 728,128 | ||||||||||||
Foreign Common Stock | 18,290 | — | — | 18,290 | ||||||||||||
|
|
|
|
|
|
|
|
|
|
|
| |||||
Total Investments in Securities | 746,418 | — | — | 746,418 | ||||||||||||
|
|
|
|
|
|
|
|
|
|
|
| |||||
| Other Financial Instruments | Level 1 ($) | Level 2 ($) | Level 3 ($) | Total ($) | ||||||||||||
Purchased Option | 3,393 | — | — | 3,393 | ||||||||||||
Purchased Swaptions | — | 19,052 | — | 19,052 | ||||||||||||
Futures Contracts* | ||||||||||||||||
Unrealized Appreciation | 910 | — | — | 910 | ||||||||||||
Unrealized Depreciation | (8) | — | — | (8) | ||||||||||||
Forwards Contracts* | ||||||||||||||||
Unrealized Depreciation | — | (50) | — | (50) | ||||||||||||
Centrally Cleared Swaps | ||||||||||||||||
Interest Rate Swaps* | ||||||||||||||||
Unrealized Appreciation | — | 1,265 | — | 1,265 | ||||||||||||
OTC Swaps | ||||||||||||||||
Total Return Swaps* | ||||||||||||||||
Unrealized Depreciation | — | (2,293) | — | (2,293) | ||||||||||||
|
|
|
|
|
|
|
|
|
|
|
| |||||
Total Other Financial Instruments | 4,295 | 17,974 | — | 22,269 | ||||||||||||
|
|
|
|
|
|
|
|
|
|
|
| |||||
* Futures contracts, forward contracts, and swap contracts are valued at the unrealized appreciation/ (depreciation) on the instruments.
For the period ended March 31, 2021, there were no transfers in or out of Level 3.
Amounts designated as “—” are either $0 or have been rounded to $0.
For more information on valuation inputs, see Note 2 – Significant Accounting Policies in Notes to Financial Statements.
The accompanying notes are an integral part of the financial statements.
| 8 | SEI Institutional Managed Trust / Semi-Annual Report / March 31, 2021 |
Item 7. Disclosure of Proxy Voting Policies and Procedures for Closed-End Management Investment Companies.
Not applicable.
Item 8. Portfolio Managers of Closed-End Management Investment Companies.
Not applicable.
Item 9. Purchases of Equity Securities by Closed-End Management Company and Affiliated Purchasers.
Not applicable.
Item 10. Submission of Matters to a Vote of Security Holders.
There have been no material changes to the procedures by which shareholders may recommend nominees to the Registrant’s Board of Trustees (the “Board”). The Registrant has a standing Governance Committee (the “Committee”) currently consisting of the Independent Trustees. The Committee is responsible for evaluating and recommending nominees for election to the Board. Pursuant to the Committee’s Charter, adopted on June 18th 2004, as amended, the Committee will review all shareholder recommendations for nominations to fill vacancies on the Board if such recommendations are submitted in writing and addressed to the Committee at the Registrant’s office.
Item 11. Controls and Procedures.
(a) The Registrant’s principal executive and principal financial officers, or persons performing similar functions, have concluded that the Registrant’s disclosure controls and procedures (as defined in Rule 30a-3(c) under the Investment Company Act of 1940 (the “1940 Act”)) are effective, based on the evaluation of these controls and procedures required by Rule 30a-3(b) under the 1940 Act and Rules 13a-15(b) or 15d-15(b) under the Securities Exchange Act of 1934 as of a date within 90 days of the filing date of this report. (b) There were no changes in the Registrant’s internal control over financial reporting (as defined in Rule 30a-3(d) under the 1940 Act) that occurred during the period covered by this report that have materially affected, or are reasonably likely to materially affect, the Registrant’s internal control over financial reporting.
Item 12. Disclosure of Securities Lending Activities for Closed-End Management Investment Companies.
Not applicable.
Item 13. Exhibits.
SIGNATURES
Pursuant to the requirements of the Securities Exchange Act of 1934 and the Investment Company Act of 1940, the Registrant has duly caused this report to be signed on its behalf by the undersigned, thereunto duly authorized.
| SEI Institutional Managed Trust | ||||
| By | /s/ Robert A. Nesher | |||
| Robert A. Nesher, President & CEO | ||||
Date: June 8, 2021
Pursuant to the requirements of the Securities Exchange Act of 1934 and the Investment Company Act of 1940, this report has been signed below by the following persons on behalf of the Registrant and in the capacities and on the dates indicated.
| By | /s/ Robert A. Nesher | |||
| Robert A. Nesher, President & CEO | ||||
| Date: June 8, 2021 | ||||
| By | /s/ Peter A. Rodriguez | |||
| Peter A. Rodriguez, Controller & CFO | ||||
Date: June 8, 2021